Targeted search for actinomycetes from nearshore and deep-sea marine sediments
ClickHere
for
FullArticle
Effect of surficial disturbance on exchange between groundwaterand surface water in nearshore margins
Donald O. Rosenberry,1 Laura Toran,2 and Jonathan E. Nyquist2
Received 6 October 2009; revised 1 February 2010; accepted 15 February 2010; published 23 June 2010.
[1] Low‐permeability sediments situated at or near the sediment‐water interface caninfluence seepage in nearshore margins, particularly where wave energy or currents areminimal. Seepage meters were used to quantify flow across the sediment‐water interfaceat two lakes where flow was from surface water to groundwater. Disturbance of thesediment bed substantially increased seepage through the sandy sediments of both lakes.Seepage increased by factors of 2.6 to 7.7 following bed disturbance at seven of eightmeasurement locations at Mirror Lake, New Hampshire, where the sediment representingthe greatest restriction to flow was situated at the sediment‐water interface. Although theveneer of low‐permeability sediment was very thin and easily disturbed, accumulationon the bed surface was aided by a physical setting that minimized wind‐generated wavesand current. At Lake Belle Taine, Minnesota, where pre‐disturbance downward seepagewas smaller than at Mirror Lake, but hydraulic gradients were very large, disturbance ofa 20 to 30 cm thick medium sand layer resulted in increases in seepage of 2 to 3 ordersof magnitude. Exceptionally large seepage rates, some exceeding 25,000 cm/d, wererecorded following bed disturbance. Since it is common practice to walk on the bed whileinstalling or making seepage measurements, disruption of natural seepage rates may bea common occurrence in nearshore seepage studies. Disturbance of the bed should beavoided or minimized when utilizing seepage meters in shallow, nearshore settings,particularly where waves or currents are infrequent or minimal.
Citation: Rosenberry, D. O., L. Toran, and J. E. Nyquist (2010), Effect of surficial disturbance on exchange betweengroundwater and surface water in nearshore margins, Water Resour. Res., 46, W06518, doi:10.1029/2009WR008755.
1. Introduction
[2] Heterogeneity in the distribution of seepage fluxacross the bed of a lake, stream, wetland, or estuary is one ofthe more vexing problems associated with quantifyingexchanges between groundwater and surface water [Keery etal., 2007; Malcolm et al., 2003; Rosenberry, 2005;Schneider et al., 2005]. Seepage meters are particularlyuseful for quantifying this exchange because they provide adirect measurement of flow across the sediment‐waterinterface over a discrete area. Although simple in concept,results can be confusing or erroneous unless several com-mon sources of error, including use of small‐diameterbaggie‐connection hardware or thick‐walled seepage bags,are addressed and reduced [Belanger and Montgomery,1992; Cable et al., 1997; Fellows and Brezonik, 1980;Murdoch and Kelly, 2003; Rosenberry et al., 2008]. Someof the confusion and uncertainty historically associated withseepage‐meter measurements may stem from inadvertentlydisrupting the sediment bed prior to measurement. In low‐energy settings, particularly where flow is downward (fromsurface water to groundwater), an accumulation of a lower‐permeability layer of fine‐grained sediment can reduce the
rate of flow across the sediment‐water interface [Rosenberryand Pitlick, 2009a]. Disturbance of this veneer, whether bywaves, currents, fish [Baxter and Hauer, 2000; Soulsby etal., 2001], or scientists, can substantially alter the seepagerate. Physical manipulation of the sediment‐water interface(furrowing the bed with a garden rake) approximatelydoubled seepage rates along the nearshore margins of a lakein New Hampshire [Rosenberry and Morin, 2004]. Testsconducted in a laboratory test tank indicated that seepageflow can be restricted by a layer of silt deposited at thesediment‐water interface only 1 mm thick, especially duringdownward seepage (from surface water to groundwater)[Rosenberry and Pitlick, 2009a].[3] Seepage commonly is focused in these shallow,
nearshore margins of lakes, wetlands, and estuaries becauseof (1) the concentration of flow paths at the break in sloperepresented by the shoreline [McBride and Pfannkuch,1975; Pfannkuch and Winter, 1984], (2) the frequent dis-turbance of the sediment caused by breaking waves andnearshore currents, and (3) the migration of the wave‐washedlittoral zone associated with changes in surface‐water stage[Rosenberry, 2000]. Primarily because of convenience, mostnearshore seepage measurement locations are accessed byfoot; meters are installed and serviced while standing on thebed adjacent to the seepage cylinder. Unless care is taken tomark locations where investigators have stepped on thesediment bed, it is likely that subsequent seepage‐meterinstallations will be made on portions of the bed that haverecently been disturbed by accessing previously installed
1U.S. Geological Survey, Lakewood, Colorado, USA.2Department of Geology, Temple University, Philadelphia,
Pennsylvania, USA.
Copyright 2010 by the American Geophysical Union.0043‐1397/10/2009WR008755
WATER RESOURCES RESEARCH, VOL. 46, W06518, doi:10.1029/2009WR008755, 2010
W06518 1 of 10
seepage meters. This disturbance can dislodge and suspendfine‐grained particles situated on or near the bed surface(in the interstitial spaces between larger‐grained sedimentsituated on the bed), locally increasing vertical hydraulicconductivity. We hypothesize that subsequent seepage rates,measured where the bed was inadvertently disturbed, will beartificially fast. The intent of this paper is to describe set-tings and processes that lead to reduced exchange of water atthe sediment‐water interface, document the effect of beddisturbances on measured seepage rates in nearshorelacustrine settings, determine the significance of sedimentdisturbance on seepage rates, and provide guidance forminimizing this occurrence.
2. Settings Conducive to Substantial Alteration ofSeepage Rates Following Bed Disturbance
[4] Seepage is controlled to a large extent by the lowest‐permeability sediment along a groundwater flow path. If thelowest‐permeability layer is at the sediment‐water interface,substantial changes in seepage rate can occur in response todisturbance of the bed surface and disruption of the fine‐grained sediments that are situated on the bed surface. If thegoverning sediment layer is located some distance beneaththe sediment‐water interface, disturbances at the sediment‐water interface may not affect seepage rates. Several otherfactors also determine whether bed disturbance might alterseepage.[5] 1. Seepage direction (upward or downward). Down-
ward seepage can result in a greater degree of clogging ofthe bed by fine particles (colmation) because the seepage‐force (FS) is in the same direction as, and therefore addedto, the gravity‐force (g) [e.g., Brunke, 1999; Rosenberryand Pitlick, 2009a; Schalchli, 1992; Veličković, 2005].Upward seepage, if sufficiently fast, can reduce cloggingand help to maintain a larger hydraulic conductivity [Brunkeand Gonser, 1997] because FS is in the opposite directionof g.[6] 2. Seepage velocity. Seepage velocity (q) varies in
response to hydraulic conductivity and porosity of the sed-iment, and hydraulic gradient:
q ¼ Ki
n; ð1Þ
where K is hydraulic conductivity, i is hydraulic gradient,and n is porosity. Seepage force on a sediment‐grain scale isproportional to hydraulic‐head difference [Freeze andCherry, 1979]:
FS ¼ �gDhA; ð2Þ
where r is density of water, g is acceleration of gravity,Dh is hydraulic‐head difference across a sediment grain,and A is the cross‐sectional area of the sediment grain on theaxis perpendicular to the mean groundwater‐flow vector.Assuming i is distributed across a spherical particle ofdiameter D, substituting iD for Dh, and assuming density ofwater is 1000 kg m−3, seepage force is proportional to
hydraulic gradient and the cube of the grain diameter[Rosenberry and Pitlick, 2009a]:
FS ¼ �giDA ¼ 1000giD�D2
4¼ 250gi�D3: ð3Þ
[7] Once FS approaches the weight of individual sedimentparticles resting on the bed, sediment can be mobilized andeither pulled into the porous matrix given a downward forceor even suspended with upward seepage if FS exceeds theweight force (FW):
FW ¼ �s � �ð Þg�D3
6: ð4Þ
[8] Assuming sediment grain density (rs) is 2650 kg m−3,weight force can be expressed as
FW ¼ 275g�D3: ð5Þ
Comparing (5) and (3), FS exceeds FW when i exceeds 1.1.Although i is rarely so large in most hydrogeologic settings,i can easily exceed 1.1 when distributed across nearshoresediment beds where sharp contrasts in K commonly occur[Rosenberry, 2000; Rosenberry and Pitlick, 2009a, 2009b].[9] 3. Size of fine‐grained clogging particles relative to a
bulk porous medium matrix. Fine‐grained sediments eitheraccumulate at the bed surface or infiltrate the pore spacesbetween larger grains, depending on the size of the cloggingsediments relative to the grain diameter of the bulk matrix. Ifthe diameter of clogging particles is within an order ofmagnitude of that of the bulk matrix, clogging will usuallyoccur at the sediment‐water interface in the form of a “filtercake” (surface colmation) [Baveye et al., 1998; McDowell‐Boyer et al., 1986; Ray et al., 2002]. If clogging particlesare more than an order of magnitude smaller than the bulkmatrix, particles more commonly will infiltrate the porousmatrix and clog pore spaces some distance below the sedi-ment‐water interface (straining) [Bradford et al., 2005;Brunke, 1999]. Sediment mobility also influences the depthand degree of clogging. An immobile bed is more likely toclog at the surface, whereas a mobile bed can result inclogging particles extending deeper into the bed, potentiallyreducing the degree of clogging [Rehg et al., 2005].[10] 4. Thickness of a fine‐grained sediment veneer. A
thicker layer of fine‐grained particles can provide a moresubstantial and resistant barrier to exchange at the sediment‐water interface.[11] 5. Degree and orientation of sediment packing (i.e.,
hardness of the sediment bed). A sediment bed that is moreresistant to erosion is more stable and less likely to bemobilized by shear forces, therefore, allowing colmation toreach its ultimate extent and create a maximum reduction inbed sediment hydraulic conductivity [Schalchli, 1992;Schubert, 2002].[12] 6. Presence and density of biological organisms on and
near the sediment bed. Bacteria, algae, and invertebratesliving in the pore spaces of bed sediments can either reduce[Brugger et al., 2001;Goldschneider et al., 2007;McDowell‐
ROSENBERRY ET AL.: NEARSHORE SEDIMENT DISTURBANCE W06518W06518
2 of 10
Boyer et al., 1986; Schubert, 2002] or increase [Danielopol,1984; Volkenborn et al., 2007] bulk porosity and hydraulicconductivity depending on the type and density of organismsand the amount of organic material present in the sedimentson which the organisms feed. Organisms also can generateseepage as a byproduct of living at or near the sediment‐waterinterface (bioirrigation) [Martin et al., 2006].[13] Many of these factors and processes can act in con-
cert or in opposition to either increase or reduce seepage,depending on the mix of variables.
3. Sediment Disturbance at Mirror Lake,New Hampshire
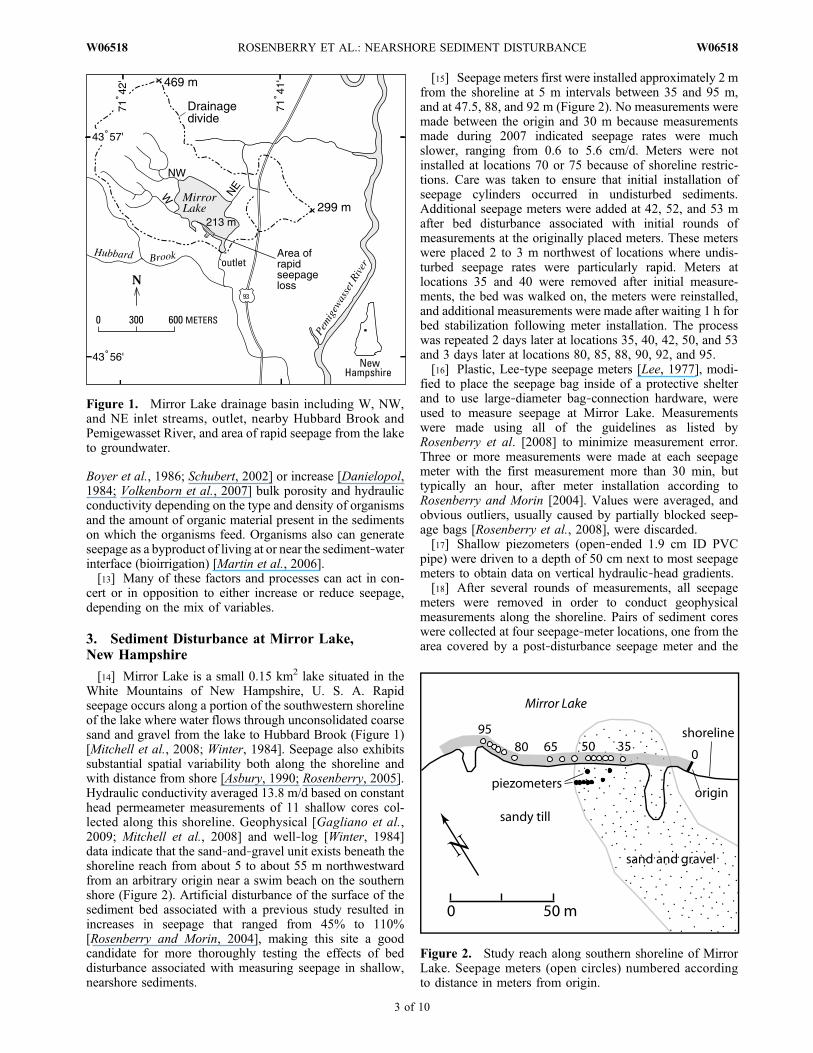
[14] Mirror Lake is a small 0.15 km2 lake situated in theWhite Mountains of New Hampshire, U. S. A. Rapidseepage occurs along a portion of the southwestern shorelineof the lake where water flows through unconsolidated coarsesand and gravel from the lake to Hubbard Brook (Figure 1)[Mitchell et al., 2008; Winter, 1984]. Seepage also exhibitssubstantial spatial variability both along the shoreline andwith distance from shore [Asbury, 1990; Rosenberry, 2005].Hydraulic conductivity averaged 13.8 m/d based on constanthead permeameter measurements of 11 shallow cores col-lected along this shoreline. Geophysical [Gagliano et al.,2009; Mitchell et al., 2008] and well‐log [Winter, 1984]data indicate that the sand‐and‐gravel unit exists beneath theshoreline reach from about 5 to about 55 m northwestwardfrom an arbitrary origin near a swim beach on the southernshore (Figure 2). Artificial disturbance of the surface of thesediment bed associated with a previous study resulted inincreases in seepage that ranged from 45% to 110%[Rosenberry and Morin, 2004], making this site a goodcandidate for more thoroughly testing the effects of beddisturbance associated with measuring seepage in shallow,nearshore sediments.
[15] Seepage meters first were installed approximately 2 mfrom the shoreline at 5 m intervals between 35 and 95 m,and at 47.5, 88, and 92 m (Figure 2). No measurements weremade between the origin and 30 m because measurementsmade during 2007 indicated seepage rates were muchslower, ranging from 0.6 to 5.6 cm/d. Meters were notinstalled at locations 70 or 75 because of shoreline restric-tions. Care was taken to ensure that initial installation ofseepage cylinders occurred in undisturbed sediments.Additional seepage meters were added at 42, 52, and 53 mafter bed disturbance associated with initial rounds ofmeasurements at the originally placed meters. These meterswere placed 2 to 3 m northwest of locations where undis-turbed seepage rates were particularly rapid. Meters atlocations 35 and 40 were removed after initial measure-ments, the bed was walked on, the meters were reinstalled,and additional measurements were made after waiting 1 h forbed stabilization following meter installation. The processwas repeated 2 days later at locations 35, 40, 42, 50, and 53and 3 days later at locations 80, 85, 88, 90, 92, and 95.[16] Plastic, Lee‐type seepage meters [Lee, 1977], modi-
fied to place the seepage bag inside of a protective shelterand to use large‐diameter bag‐connection hardware, wereused to measure seepage at Mirror Lake. Measurementswere made using all of the guidelines as listed byRosenberry et al. [2008] to minimize measurement error.Three or more measurements were made at each seepagemeter with the first measurement more than 30 min, buttypically an hour, after meter installation according toRosenberry and Morin [2004]. Values were averaged, andobvious outliers, usually caused by partially blocked seep-age bags [Rosenberry et al., 2008], were discarded.[17] Shallow piezometers (open‐ended 1.9 cm ID PVC
pipe) were driven to a depth of 50 cm next to most seepagemeters to obtain data on vertical hydraulic‐head gradients.[18] After several rounds of measurements, all seepage
meters were removed in order to conduct geophysicalmeasurements along the shoreline. Pairs of sediment coreswere collected at four seepage‐meter locations, one from thearea covered by a post‐disturbance seepage meter and the
Figure 1. Mirror Lake drainage basin including W, NW,and NE inlet streams, outlet, nearby Hubbard Brook andPemigewasset River, and area of rapid seepage from the laketo groundwater.
Figure 2. Study reach along southern shoreline of MirrorLake. Seepage meters (open circles) numbered accordingto distance in meters from origin.
ROSENBERRY ET AL.: NEARSHORE SEDIMENT DISTURBANCE W06518W06518
3 of 10

other from an adjacent area where the bed had not beendisturbed. Cores were segmented into 1 or 2 cm increments,and grain size distributions were determined by dry sievingin a sediment lab.[19] Pre‐disturbance seepage measured 2 m from the
shoreline along the study reach averaged −22.8 cm/d (neg-ative indicating downward seepage). Seepage was consid-erably faster through the portion of the lakebed overlying thecoarser sand‐and‐gravel unit (35 to 55 m from the origin)with an average flux of −51.7 cm/d compared to −17.4 cm/dalong the shoreline interval 60 to 95 m (Figure 3a). Hydraulicgradients also were much larger along the shoreline interval35 to 55 m (Figure 3b) indicating that the sand‐and‐gravelunit was acting as a substantial drain.[20] Post‐disturbance seepage rates were nearly always
faster (Figure 3a). Ratios of after and before disturbanceseepage rates ranged from 0.5 to 7.7 and averaged 2.7(Table 1). The ratio at location 92 was 23.9, but the verysmall pre‐disturbance values may have been altered by aleak in the seepage‐cylinder seal with the sediment bed andwere not included in the analysis. Largest changes inseepage associated with bed disturbance occurred over thesand‐and‐gravel unit where hydraulic gradients were larg-est. Only one instance of post‐disturbance seepagedecreasing relative to pre‐disturbance seepage was recorded.Post‐disturbance seepage at the 88 m location (−16 cm/d)was about half the pre‐disturbance seepage rate (−31 cm/d).[21] Once the bed was initially disturbed, subsequent
disturbances both increased and decreased seepage butusually to a smaller extent compared to pre‐disturbanceseepage. At location 35, seepage following second distur-bance increased from −76 to −166 cm/d. At location 40,seepage following second disturbance decreased from −200to −166 cm/d. The median of nine measurements at locations35, 40, and 42 following first disturbance was −201 cm/d
Figure 3. (a) Distribution of seepage along a portion of the southwest shore of Mirror Lake. Thin, blackbars indicate pre‐disturbance rates; thick, gray bars indicate post‐disturbance rates. (b) Distribution ofhydraulic gradient across the shallowest 50 cm of sediment along the same shoreline segment of MirrorLake.
Table 1. Seepage Rates 2 m From the Shoreline at LocationsAlong Mirror Lake Shorelinea
MeterLocation
BedCondition
Average(cm/d)
StandardDeviation(cm/d) n
DisturbanceRatio
35 Und −29.3 1.1 335 Dist −75.5 2.9 3 2.635 Distb −166.1 2.0 2 5.740 Und −25.9 3.1 340 Dist −199.5 2.5 2 7.740 Distb −165.9 36.7 3 6.442 Dist −252.0 4.9 442 Distb −84.3 18.0 3 0.3c
45 Und −137.0 4.1 347.5 Und −51.9 0.8 350 Und −54.0 0.2 350 Dist −60.5 2.1 4 1.152 Dist −181.5 1.6 353 Dist −105.5 11.5 455 Und −21.8 0.5 460 Und −16.5 0.4 365 Und −8.7 2.9 380 Und −2.6 1.0 380 Dist −15.4 1.8 5 5.985 Und −18.3 0.1 385 Dist −26.9 2.7 4 1.588 Und −31.2 1.4 388 Dist −15.7 3.0 9 0.590 Und −35.9 1.7 690 Dist −36.4 2.1 4 1.092 Und −1.9 0.7 392 Dist −45.4 0.4 3 23.995 Und −5.8 0.2 395 Dist −6.8 0.2 3 1.2
aUnd indicates undisturbed bed; Dist, disturbed bed. Disturbance ratio isthe seepage rate through the disturbed bed divided by the seepage ratethrough the undisturbed bed.
bSediment bed disturbed a second time.cRatio is relative to a previously disturbed bed.
ROSENBERRY ET AL.: NEARSHORE SEDIMENT DISTURBANCE W06518W06518
4 of 10
compared to a median of eight measurements followingsecond disturbance of −147 cm/d. For comparison, themedian of six pre‐disturbance measurements made in thesand‐and‐gravel unit at locations 35 and 40 was −29 cm/d.
4. Sediment Disturbance at Lake Belle Taine,Minnesota
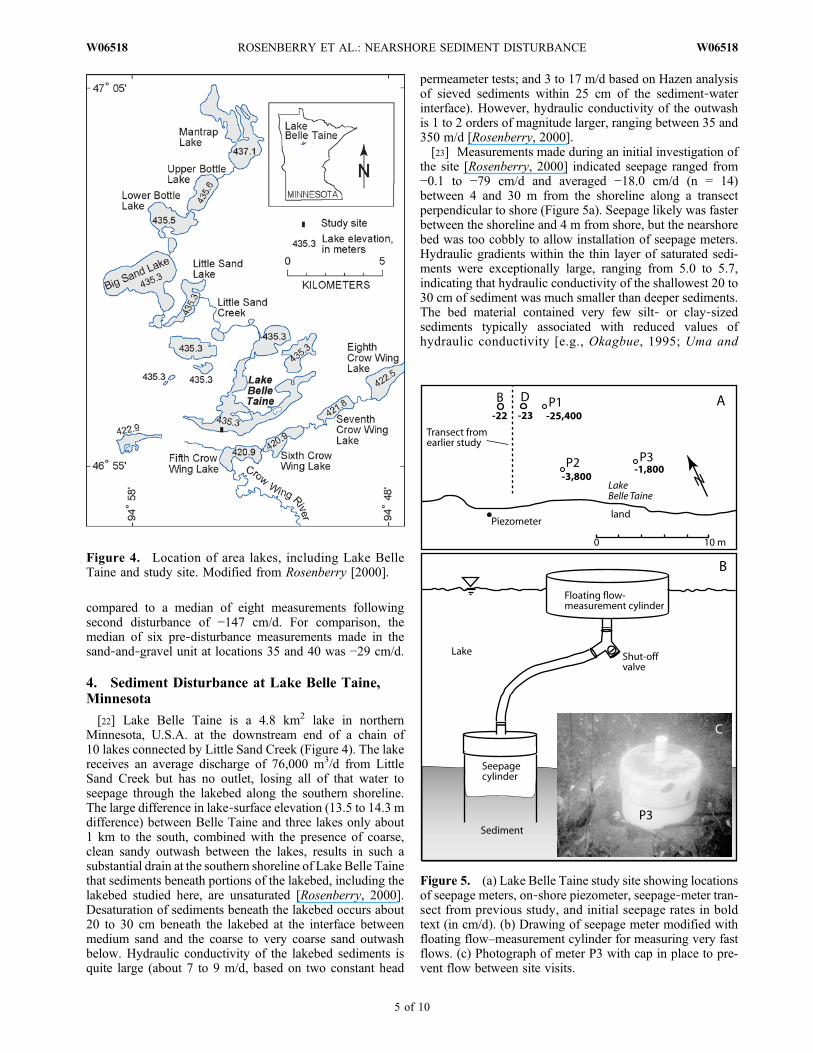
[22] Lake Belle Taine is a 4.8 km2 lake in northernMinnesota, U.S.A. at the downstream end of a chain of10 lakes connected by Little Sand Creek (Figure 4). The lakereceives an average discharge of 76,000 m3/d from LittleSand Creek but has no outlet, losing all of that water toseepage through the lakebed along the southern shoreline.The large difference in lake‐surface elevation (13.5 to 14.3 mdifference) between Belle Taine and three lakes only about1 km to the south, combined with the presence of coarse,clean sandy outwash between the lakes, results in such asubstantial drain at the southern shoreline of Lake Belle Tainethat sediments beneath portions of the lakebed, including thelakebed studied here, are unsaturated [Rosenberry, 2000].Desaturation of sediments beneath the lakebed occurs about20 to 30 cm beneath the lakebed at the interface betweenmedium sand and the coarse to very coarse sand outwashbelow. Hydraulic conductivity of the lakebed sediments isquite large (about 7 to 9 m/d, based on two constant head
permeameter tests; and 3 to 17 m/d based on Hazen analysisof sieved sediments within 25 cm of the sediment‐waterinterface). However, hydraulic conductivity of the outwashis 1 to 2 orders of magnitude larger, ranging between 35 and350 m/d [Rosenberry, 2000].[23] Measurements made during an initial investigation of
the site [Rosenberry, 2000] indicated seepage ranged from−0.1 to −79 cm/d and averaged −18.0 cm/d (n = 14)between 4 and 30 m from the shoreline along a transectperpendicular to shore (Figure 5a). Seepage likely was fasterbetween the shoreline and 4 m from shore, but the nearshorebed was too cobbly to allow installation of seepage meters.Hydraulic gradients within the thin layer of saturated sedi-ments were exceptionally large, ranging from 5.0 to 5.7,indicating that hydraulic conductivity of the shallowest 20 to30 cm of sediment was much smaller than deeper sediments.The bed material contained very few silt‐ or clay‐sizedsediments typically associated with reduced values ofhydraulic conductivity [e.g., Okagbue, 1995; Uma and
Figure 4. Location of area lakes, including Lake BelleTaine and study site. Modified from Rosenberry [2000].
Figure 5. (a) Lake Belle Taine study site showing locationsof seepage meters, on‐shore piezometer, seepage‐meter tran-sect from previous study, and initial seepage rates in boldtext (in cm/d). (b) Drawing of seepage meter modified withfloating flow–measurement cylinder for measuring very fastflows. (c) Photograph of meter P3 with cap in place to pre-vent flow between site visits.
ROSENBERRY ET AL.: NEARSHORE SEDIMENT DISTURBANCE W06518W06518
5 of 10
Loehnert, 1994]. The sediment size for which 5% of thesediments were finer ranged from 0.07 to 0.17 mm, in thevery fine‐ to fine‐sand range.[24] The top 30 cm of sediment was removed from dis-
crete locations and seepage measured to determine theincrease in seepage that would occur if the layer of smallerhydraulic conductivity was not present. Three 38 cmdiameter, 50 cm lengths of PVC pipe were jetted approxi-mately 30 cm into the sediment bed at locations shown inFigure 5a (P1–P3); the jetting process removed virtually allof the finest fraction, leaving some of the gravel and cobblegrains on the bed. A 3.8 cm diameter pipe was extendedthrough a PVC cap that was fitted over the upper end of thelarge‐diameter PVC pipe, providing a means to attach aseepage bag (Figures 5b and 5c). Air bubbled out of the topof all three seepage cylinders for several to 20 min followinginstallation, indicating that the meters had breached thesaturated sediments and extended into the unsaturated se-diments below. Seepage could not be measured with astandard seepage bag because seepage rates were too fast.Flow was so strong at P1 that a hand placed palm down overthe opening was forcibly sucked onto the opening. There-fore, an inverted 0.56 m diameter plastic seepage cylinderwas floated on the lake surface and connected to the seepagecylinder with a length of flexible 5.1 cm diameter pipe(Figure 5b). The floating cylinder was weighted to be as
close to neutrally buoyant as possible. Change in volume ofwater contained inside of the floating water‐measurementchamber was recorded along with the duration of flow toobtain a volume‐per‐time seepage measurement. Multiplemeasurements were made at each location to determinechange in seepage in response to changing hydraulic con-ditions beneath the bed as well as the potential clogging ofthe sediment bed by particles entrained in the flow. Duringtimes when a seepage measurement was not being made, asubmerged valve was opened to allow seepage flow to bemaintained and prevent air from being sucked into theseepage cylinder.[25] Initial seepage rates were measured within 2 h of
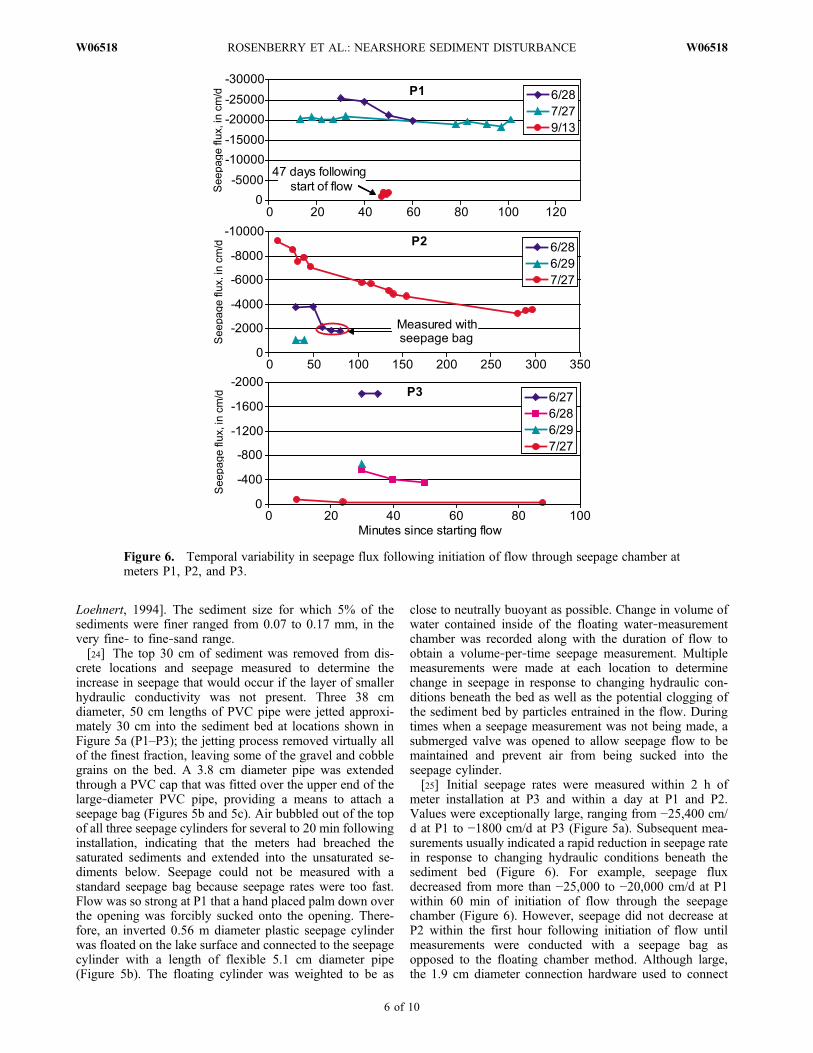
meter installation at P3 and within a day at P1 and P2.Values were exceptionally large, ranging from −25,400 cm/d at P1 to −1800 cm/d at P3 (Figure 5a). Subsequent mea-surements usually indicated a rapid reduction in seepage ratein response to changing hydraulic conditions beneath thesediment bed (Figure 6). For example, seepage fluxdecreased from more than −25,000 to −20,000 cm/d at P1within 60 min of initiation of flow through the seepagechamber (Figure 6). However, seepage did not decrease atP2 within the first hour following initiation of flow untilmeasurements were conducted with a seepage bag asopposed to the floating chamber method. Although large,the 1.9 cm diameter connection hardware used to connect
Figure 6. Temporal variability in seepage flux following initiation of flow through seepage chamber atmeters P1, P2, and P3.
ROSENBERRY ET AL.: NEARSHORE SEDIMENT DISTURBANCE W06518W06518
6 of 10
the seepage bag to the seepage cylinder still resulted inresistance to flow and a decrease of measured seepage ratefrom about −4000 to about −2000 cm/d (Figure 6).[26] Seepage stabilized within about a day of meter
installation at P3, even though flow through the meter washalted overnight between measurement periods. Repeat mea-surements indicated a reduction in seepage rate of 200 cm/dover a 20 min duration on 28 June, but that reduction wasmuch smaller than the 1200 cm/d reduction that occurredduring the previous 24 h period. Seepage rate was approxi-mately the same the following day, on 29 June, at −660 cm/d.[27] Seepage cylinders were capped after several days and
reopened a month later. Measurements indicate that flowhad stabilized at about −20,000 cm/d at P1. Seepage initiallywas much faster at P2 than during the June measurements amonth earlier, starting at −9200 cm/d 10 min after flow wasinitiated and stabilizing at about −3500 cm/d 4.5 h later.Seepage at P3 had decreased to −38 cm/d, about the same asseepage rates measured where the bed was undisturbed. Theseepage meter at P1 was left open to flow until the next sitevisit about 6 weeks later. Even after flowing for 47 days,seepage still was much faster than through the undisturbedbed, ranging from −1100 to −1900 cm/d.[28] Disturbance ratios were orders of magnitude larger at
the Belle Taine site than at the Mirror Lake site. For thepost‐disturbance measurements made soon after water wasallowed to flow through the seepage chambers, disturbanceratios ranged from 104 at P3 to 1112 at P1 (Table 2). Dis-turbance ratios eventually decreased to 2.6 at P3, 52 at P2,and 72 at P1.
5. Discussion
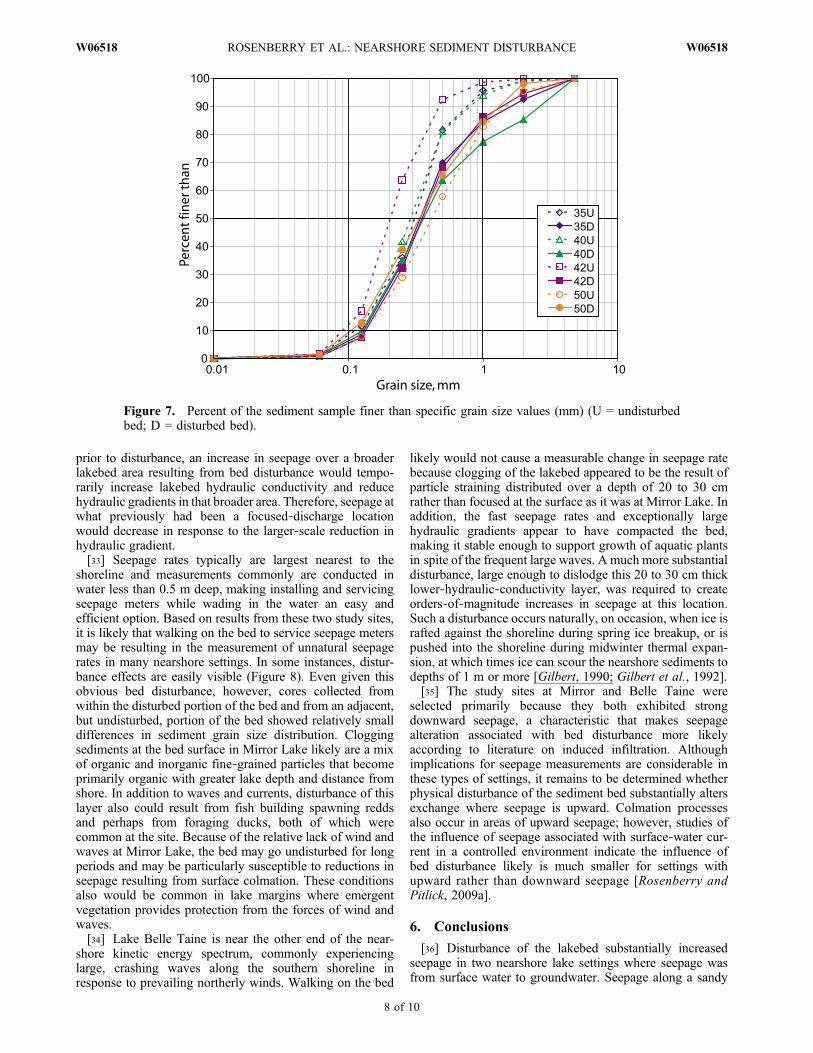
[29] Conditions were favorable for substantial changes inseepage in response to sediment disturbance at both MirrorLake and Lake Belle Taine but for different reasons. AtMirror Lake, the likely cause of substantial seepage increasewas disturbance of a thin layer of lower‐permeabilitymaterial deposited at the sediment‐water interface. Analysesof grain size distributions of shallow cores collected fromdisturbed and undisturbed portions of the bed at locations35, 40, 42, and 50 showed an increase in median grain sizeof the top 5 cm of the disturbed sediment relative to the
undisturbed sediment at three of the four sampling locations(Figure 7). Median grain size of the top 5 cm of disturbedsediment increased by 10%, 27%, and 75% relative toundisturbed sediment at locations 35, 40, and 42, respec-tively, and decreased by 15% at location 50. Median grainsize of only the top 1 cm of disturbed sediment increased by71%, 7%, and 61% relative to undisturbed sediment at loca-tions 35, 40, and 42, and decreased by 18% at location 50.Neither seepage rate nor grain size distribution changedsubstantially in response to disturbing sediment at location 50.It is possible that the bed at that location had recently beendisturbed, either inadvertently by investigators or by fish oranimal, prior to collection of the sediment core intended torepresent undisturbed sediment.[30] As mentioned earlier, seepage flow can be restricted
by a thin veneer of fine‐grained sediment [Rosenberry andPitlick, 2009a]. Such a thin silt layer would not be stable inmany lakes andwould frequently be dislodged and suspendedin the water column in response to waves and currents.However, Mirror Lake is a relatively small lake situated in asteeply sloping basin that shelters the lake surface fromatmospheric circulation, leading to long periods of calm tolight winds and providing relatively few opportunities forthe generation of waves or currents large enough to dislodgesilt‐sized sediments on the bed.[31] The significance of sediment disturbance depends to
some extent on the duration of the altered bed conditionsand the time it takes for sediments to settle back to the bedand resume their clogging role. Once sediment is dislodged,duration of suspension in the water column is related tograin diameter and water depth. Time of suspension can beestimated by dividing settling distance by Stokes settlingvelocities (vs):
vs ¼ �s � �ð ÞgD2
18�; ð6Þ
where m is dynamic viscosity. Assuming a water depth of0.5 m and laminar flow associated with the settling particles,the finest sand‐sized particles would settle to the bed within2 min. Silt‐sized particles would remain in suspensionbetween 2 min and 10 h, and clay‐sized particles wouldremain in suspension between 10 h and well over 1000 days.These durations do not consider the flocculating tendenciesof silt‐ and clay‐sized particles, which would result in fastersettling rates and shorter suspension times. Waves or cur-rents would increase these estimated settling times. Althoughsediment settling to the lakebed eventually restores the dis-turbance caused by walking on the bed, sediment would notbe able to settle onto the portion of the bed covered by apreviously installed seepage cylinder and would settle ontop of the cylinder instead. Therefore, the portion of the bedcovered by the seepage cylinder is essentially frozen in timeand cannot evolve as the rest of the sediment bed does.[32] Seepage decrease following initial disturbance at
location 88 and following a second disturbance at locations40 and 42 atMirror Lake (Table 1) was unexpected. Althoughseepage decreased following disturbance at these three lo-cations, post‐disturbance seepage increased at adjacentseepage meters. One possible explanation for post‐distur-bance seepage decrease at some locations is that the distri-bution of seepage changed following widespread bed dis-turbance. If seepage was focused in a few specific locations
Table 2. Seepage Rates at 3 Locations Along the Southern Shoreof Lake Belle Tainea
Meter LocationBed
ConditionAverage(cm/d)
StandardDeviation(cm/d) n
DisturbanceRatio
Early measurementsP1 Und −22.5 0.7 2P1 Dist −25,025 570 2 1112P2 Und −20.6 2.9 2P2 Dist −8849 495 2 430P3 Und −17.4 20.4 5P3 Dist −1813 0 2 104
Late measurementsb
P1 Dist −1615 413 4 72P2 Dist −1063 7.6 2 52P3 Dist −45.4 26.3 3 2.6
aUnd indicates undisturbed bed; Dist, disturbed bed. Disturbance ratio isthe seepage rate through the disturbed bed divided by the seepage ratethrough the undisturbed bed.
bUndisturbed values from early measurements repeated here.
ROSENBERRY ET AL.: NEARSHORE SEDIMENT DISTURBANCE W06518W06518
7 of 10
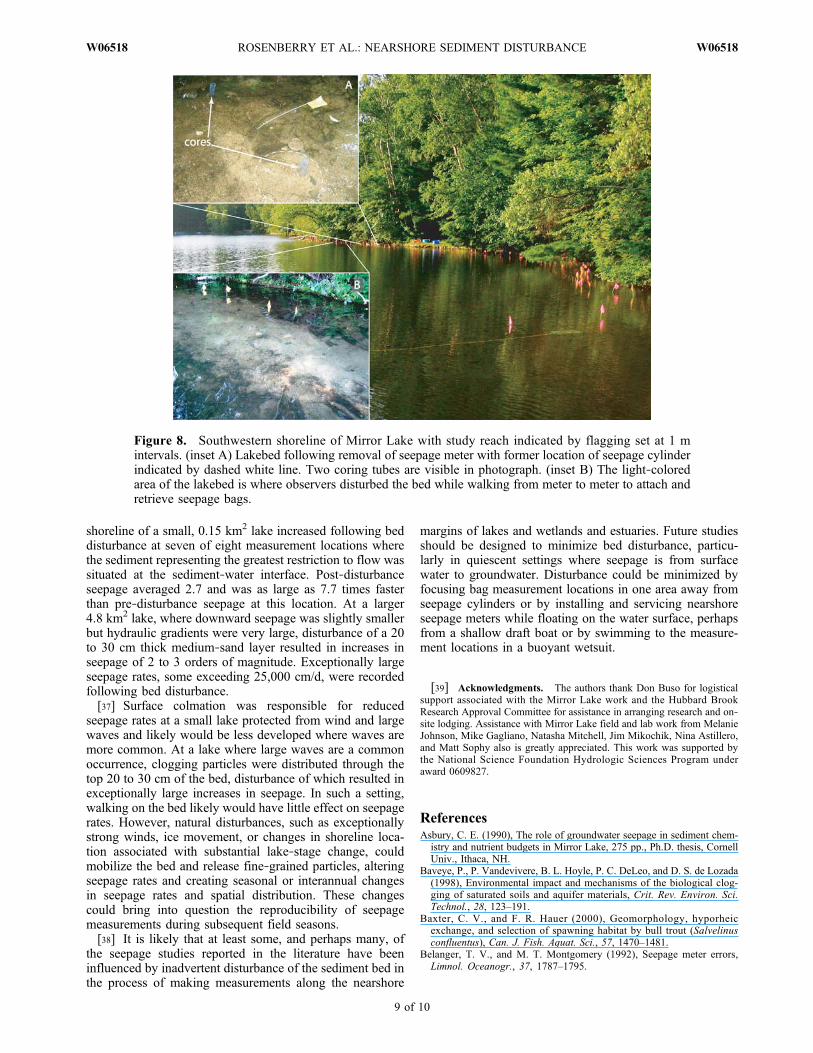
prior to disturbance, an increase in seepage over a broaderlakebed area resulting from bed disturbance would tempo-rarily increase lakebed hydraulic conductivity and reducehydraulic gradients in that broader area. Therefore, seepage atwhat previously had been a focused‐discharge locationwould decrease in response to the larger‐scale reduction inhydraulic gradient.[33] Seepage rates typically are largest nearest to the
shoreline and measurements commonly are conducted inwater less than 0.5 m deep, making installing and servicingseepage meters while wading in the water an easy andefficient option. Based on results from these two study sites,it is likely that walking on the bed to service seepage metersmay be resulting in the measurement of unnatural seepagerates in many nearshore settings. In some instances, distur-bance effects are easily visible (Figure 8). Even given thisobvious bed disturbance, however, cores collected fromwithin the disturbed portion of the bed and from an adjacent,but undisturbed, portion of the bed showed relatively smalldifferences in sediment grain size distribution. Cloggingsediments at the bed surface in Mirror Lake likely are a mixof organic and inorganic fine‐grained particles that becomeprimarily organic with greater lake depth and distance fromshore. In addition to waves and currents, disturbance of thislayer also could result from fish building spawning reddsand perhaps from foraging ducks, both of which werecommon at the site. Because of the relative lack of wind andwaves at Mirror Lake, the bed may go undisturbed for longperiods and may be particularly susceptible to reductions inseepage resulting from surface colmation. These conditionsalso would be common in lake margins where emergentvegetation provides protection from the forces of wind andwaves.[34] Lake Belle Taine is near the other end of the near-
shore kinetic energy spectrum, commonly experiencinglarge, crashing waves along the southern shoreline inresponse to prevailing northerly winds. Walking on the bed
likely would not cause a measurable change in seepage ratebecause clogging of the lakebed appeared to be the result ofparticle straining distributed over a depth of 20 to 30 cmrather than focused at the surface as it was at Mirror Lake. Inaddition, the fast seepage rates and exceptionally largehydraulic gradients appear to have compacted the bed,making it stable enough to support growth of aquatic plantsin spite of the frequent large waves. A much more substantialdisturbance, large enough to dislodge this 20 to 30 cm thicklower‐hydraulic‐conductivity layer, was required to createorders‐of‐magnitude increases in seepage at this location.Such a disturbance occurs naturally, on occasion, when ice israfted against the shoreline during spring ice breakup, or ispushed into the shoreline during midwinter thermal expan-sion, at which times ice can scour the nearshore sediments todepths of 1 m or more [Gilbert, 1990; Gilbert et al., 1992].[35] The study sites at Mirror and Belle Taine were
selected primarily because they both exhibited strongdownward seepage, a characteristic that makes seepagealteration associated with bed disturbance more likelyaccording to literature on induced infiltration. Althoughimplications for seepage measurements are considerable inthese types of settings, it remains to be determined whetherphysical disturbance of the sediment bed substantially altersexchange where seepage is upward. Colmation processesalso occur in areas of upward seepage; however, studies ofthe influence of seepage associated with surface‐water cur-rent in a controlled environment indicate the influence ofbed disturbance likely is much smaller for settings withupward rather than downward seepage [Rosenberry andPitlick, 2009a].
6. Conclusions
[36] Disturbance of the lakebed substantially increasedseepage in two nearshore lake settings where seepage wasfrom surface water to groundwater. Seepage along a sandy
Figure 7. Percent of the sediment sample finer than specific grain size values (mm) (U = undisturbedbed; D = disturbed bed).
ROSENBERRY ET AL.: NEARSHORE SEDIMENT DISTURBANCE W06518W06518
8 of 10
shoreline of a small, 0.15 km2 lake increased following beddisturbance at seven of eight measurement locations wherethe sediment representing the greatest restriction to flow wassituated at the sediment‐water interface. Post‐disturbanceseepage averaged 2.7 and was as large as 7.7 times fasterthan pre‐disturbance seepage at this location. At a larger4.8 km2 lake, where downward seepage was slightly smallerbut hydraulic gradients were very large, disturbance of a 20to 30 cm thick medium‐sand layer resulted in increases inseepage of 2 to 3 orders of magnitude. Exceptionally largeseepage rates, some exceeding 25,000 cm/d, were recordedfollowing bed disturbance.[37] Surface colmation was responsible for reduced
seepage rates at a small lake protected from wind and largewaves and likely would be less developed where waves aremore common. At a lake where large waves are a commonoccurrence, clogging particles were distributed through thetop 20 to 30 cm of the bed, disturbance of which resulted inexceptionally large increases in seepage. In such a setting,walking on the bed likely would have little effect on seepagerates. However, natural disturbances, such as exceptionallystrong winds, ice movement, or changes in shoreline loca-tion associated with substantial lake‐stage change, couldmobilize the bed and release fine‐grained particles, alteringseepage rates and creating seasonal or interannual changesin seepage rates and spatial distribution. These changescould bring into question the reproducibility of seepagemeasurements during subsequent field seasons.[38] It is likely that at least some, and perhaps many, of
the seepage studies reported in the literature have beeninfluenced by inadvertent disturbance of the sediment bed inthe process of making measurements along the nearshore
margins of lakes and wetlands and estuaries. Future studiesshould be designed to minimize bed disturbance, particu-larly in quiescent settings where seepage is from surfacewater to groundwater. Disturbance could be minimized byfocusing bag measurement locations in one area away fromseepage cylinders or by installing and servicing nearshoreseepage meters while floating on the water surface, perhapsfrom a shallow draft boat or by swimming to the measure-ment locations in a buoyant wetsuit.
[39] Acknowledgments. The authors thank Don Buso for logisticalsupport associated with the Mirror Lake work and the Hubbard BrookResearch Approval Committee for assistance in arranging research and on‐site lodging. Assistance with Mirror Lake field and lab work from MelanieJohnson, Mike Gagliano, Natasha Mitchell, Jim Mikochik, Nina Astillero,and Matt Sophy also is greatly appreciated. This work was supported bythe National Science Foundation Hydrologic Sciences Program underaward 0609827.
ReferencesAsbury, C. E. (1990), The role of groundwater seepage in sediment chem-
istry and nutrient budgets in Mirror Lake, 275 pp., Ph.D. thesis, CornellUniv., Ithaca, NH.
Baveye, P., P. Vandevivere, B. L. Hoyle, P. C. DeLeo, and D. S. de Lozada(1998), Environmental impact and mechanisms of the biological clog-ging of saturated soils and aquifer materials, Crit. Rev. Environ. Sci.Technol., 28, 123–191.
Baxter, C. V., and F. R. Hauer (2000), Geomorphology, hyporheicexchange, and selection of spawning habitat by bull trout (Salvelinusconfluentus), Can. J. Fish. Aquat. Sci., 57, 1470–1481.
Belanger, T. V., and M. T. Montgomery (1992), Seepage meter errors,Limnol. Oceanogr., 37, 1787–1795.
Figure 8. Southwestern shoreline of Mirror Lake with study reach indicated by flagging set at 1 mintervals. (inset A) Lakebed following removal of seepage meter with former location of seepage cylinderindicated by dashed white line. Two coring tubes are visible in photograph. (inset B) The light‐coloredarea of the lakebed is where observers disturbed the bed while walking from meter to meter to attach andretrieve seepage bags.
ROSENBERRY ET AL.: NEARSHORE SEDIMENT DISTURBANCE W06518W06518
9 of 10
Bradford, S.A., J. Simunek,M.Bettahar, Y. F. Tadassa,M. T. vanGenuchten,and S. R. Yates (2005), Straining of colloids at textural interfaces, WaterResour. Res., 41, W10404, doi:10.1029/2004WR003675.
Brugger, A., B. Reitner, I. Kolar, N. Queric, and G. J. Herndl (2001), Sea-sonal and spatial distribution of dissolved and particulate organic carbonand bacteria in the bank of an impounding reservoir on the Enns River,Austria, Freshwater Biol., 46, 997–1016.
Brunke, M. (1999), Colmation and depth filtration within streambeds:Retention of particles in hyporheic interstices, Int. Rev. Hydrobiol., 84,99–117.
Brunke, M., and T. Gonser (1997), The ecological significance of exchangeprocesses between rivers and groundwater, Freshwater Biol., 37, 1–33.
Cable, J. E., W. C. Burnett, J. P. Chanton, D. R. Corbett, and P. H. Cable(1997), Field evaluation of seepage meters in the coastal marine environ-ment, Estuarine, Coastal Shelf Sci., 45, 367–375.
Danielopol, D. L. (1984), Ecological investigations on the alluvial sedi-ments of the Danube in the Vienna area: A phreatobiological project,Verh. Int. Ver. Theor. Angew. Limnol., 22, 1755–1761.
Fellows, C. R., and P. L. Brezonik (1980), Seepage flow into Florida lakes,Water Resour. Bull., 16, 635–641.
Freeze, R. A., and J. A. Cherry (1979), Groundwater, 604 pp., PrenticeHall, Englewood Cliffs.
Gagliano, M. P., J. E. Nyquist, L. Toran, and D. O. Rosenberry (2009),Assessment of electrical resistivity method to map groundwater seepagezones in heterogeneous sediments, paper presented at Symposium on theApplication of Geophysics to Environmental and Engineering Problems,Environ. Eng. Geophys. Soc., Fort Worth, Tex., 29 March to 2 April2009.
Gilbert, R. (1990), A distinction between ice‐pushed and ice‐lifted land-forms on lacustrine and marine coasts, Earth Surf. Processes Landforms,15, 15–24.
Gilbert, R., K. J. Handford, and J. Shaw (1992), Ice scours in the sediments ofGlacial Lake Iroquois, Prince Edward County, Eastern Ontario,GeographiePhysique et Quaternaire, 46, 189–194.
Goldschneider, A. A., K. A. Haralampides, and K. T. B. MacQuarrie(2007), River sediment and flow characteristics near a bank filtrationwater supply: Implications for riverbed clogging, J. Hydrol., 344, 55–69.
Keery, J., A. Binley, N. Crook, and J. W. N. Smith (2007), Temporal and spa-tial variability of groundwater‐surface water fluxes: Development and appli-cation of an analyticalmethod using temperature time series, J.Hydrol., 336,1–16.
Lee, D. R. (1977), A device for measuring seepage flux in lakes and estu-aries, Limnol. Oceanogr., 22, 140–147.
Malcolm, I. A., C. Soulsby, A. F. Youngson, and J. Petry (2003), Hetero-geneity in ground water‐surface water interactions in the hyporheic zoneof a salmonid spawning stream, Hydrol. Processes, 17(3), 601–617.
Martin, J. B., J. E. Cable, J. Jaeger, K. Hartl, and C. G. Smith (2006), Thermaland chemical evidence for rapidwater exchange across the sediment‐waterinterface by bioirrigation in the Indian River Lagoon, Florida, Limnol.Oceanogr., 51, 1332–1341.
McBride, M. S., and H. O. Pfannkuch (1975), The distribution of seepagewithin lakebeds, U.S. Geol. Sur. J. Res., 3, 505–512.
McDowell‐Boyer, L. M., J. R. Hunt, and N. Sitar (1986), Particle transportthrough porous media, Water Resour. Res., 22, 1901–1921.
Mitchell, N., J. E. Nyquist, L. Toran, D. O. Rosenberry, and J. S. Mikochik(2008), Electrical resistivity as a tool for identifying geologic heteroge-neities which control seepage at Mirror Lake, NH, paper presented atSymposium on the Application of Geophysics to Engineering andEnvironmental Problems, Environ. Eng. Geophys. Soc., Philadelphia,Pa., 6–10 April 2008.
Murdoch, L. C., and S. E. Kelly (2003), Factors affecting the performanceof conventional seepage meters, Water Resour. Res., 39(6), 1163,doi:10.1029/2002WR001347.
Okagbue, C. O. (1995), Permeability of stratified sands, Geotech. Geol.Eng., 13, 157–168.
Pfannkuch, H. O., and T. C. Winter (1984), Effect of anisotropy andgroundwater system geometry on seepage through lakebeds, 1. Analogand dimensional analysis, J. Hydrol., 75, 213–237.
Ray, C., T. W. Soong, Y. Q. Lian, and G. S. Roadcap (2002), Effect offlood‐induced chemical load on filtrate quality at bank filtration sites,J. Hydrol., 266, 235–258.
Rehg, K. J., A. I. Packman, and J. Ren (2005), Effects of suspended sedi-ment characteristics and bed sediment transport on streambed clogging,Hydrol. Processes, 19, 413–427.
Rosenberry, D. O. (2000), Unsaturated‐zone wedge beneath a large, naturallake, Water Resour. Res., 36, 3401–3409.
Rosenberry, D. O. (2005), Integrating seepage heterogeneity with the use ofganged seepage meters, Limnol. Oceanogr., 3, 131–142.
Rosenberry, D. O., and R. H. Morin (2004), Use of an electromagneticseepage meter to investigate temporal variability in lake seepage, GroundWater, 42, 68–77.
Rosenberry, D. O., and J. Pitlick (2009a), Effects of sediment transport andseepage direction on hydraulic properties at the sediment‐water interfaceof hyporheic settings, J. Hydrol., 373, 377–391.
Rosenberry, D. O., and J. Pitlick (2009b), Local‐scale spatial and temporalvariability of seepage in a shallow gravel‐bed river, Hydrol. Processes,23, 3306–3318.
Rosenberry, D. O., J. W. LaBaugh, and R. J. Hunt (2008), Use of monitor-ing wells, portable piezometers, and seepage meters to quantify flowbetween surface water and ground water, in Field Techniques for Esti-mating Water Fluxes Between Surface Water and Groundwater, editedby D. O. Rosenberry and J. W. LaBaugh, pp. 39–70, U.S. Geol. Surv.,Denver, Colo.
Schalchli, U. (1992), The clogging of coarse gravel river beds by fine sed-iment, Hydrobiologia, 235/236, 189–197.
Schneider, R. L., T. L. Negley, and C. Wafer (2005), Factors influencinggroundwater seepage in a large, mesotrophic lake in NewYork, J. Hydrol.,310, 1–16.
Schubert, J. (2002), Hydraulic aspects of riverbank filtration: Field studies,J. Hydrol., 266(3–4), 145–161.
Soulsby, C., A. F. Youngson, H. J. Moir, and I. A. Malcolm (2001), Finesediment influence on salmonid spawning habitat in a lowland agricul-tural stream: a preliminary assessment, Sci. Total Environ., 265, 295–307.
Uma, K. O., and E. P. Loehnert (1994), Hydraulic conductivity of shallowsandy aquifers: Effects of sedimentologic and diagenetic differences,Environ. Geol., 23, 171–181.
Veličković, B. (2005), Colmation as one of the processes in interactionbetween the groundwater and surface water, Facta Universitatis Ser.:Architecture and Civil Eng., 2, 165–172.
Volkenborn, N., L. Polerecky, S. I. C. Hedtkamp, J. E. E. Beusekom, andD. de Beer (2007), Bioturbation and bioirrigation extend the openexchange regions in permeable sediments, Limnol. Oceanogr., 52,1898–1909.
Winter, T. C. (1984), Geohydrologic setting of Mirror Lake, West Thornton,NH, Water‐Resources Investigations Rep. 84–4266, 61 pp., U.S. Geol.Surv.
J. E. Nyquist and L. Toran, Department of Geology, Temple University,1901 N. 13th St., Philadelphia, PA 19122, USA.D. O. Rosenberry, U.S. Geological Survey, MS 413, Bldg. 53, DFC,
Lakewood, CO 80225, USA. ([email protected])
ROSENBERRY ET AL.: NEARSHORE SEDIMENT DISTURBANCE W06518W06518
10 of 10
Copyright © 2022 FDOKUMEN