A nearshore long-term infragravity wave analysis for open harbours
13
A nearshore long-term infragravity wave analysis for open harbours Gabriel Diaz-Hernandez ⁎, Fernando J. Mendez, Inigo J. Losada, Paula Camus, Raul Medina Environmental Hydraulics Institute “IH Cantabria” Universidad de Cantabria, c/ Isabel Torres 15, Parque Científico y Tecnológico de Cantabria, Santander, 39011 Cantabria, Spain abstract article info Article history: Received 23 April 2014 Received in revised form 22 December 2014 Accepted 23 December 2014 Available online 20 January 2015 Keywords: Hybrid downscaling Reanalysis database Wave climate Infragravity waves Harbour resonance Harbour disturbance This study presents a comprehensive methodology for the reanalysis, characterization and propagation of wave bound infragravity waves (1/300 Hz to 1/30 Hz) in the nearshore. A deep water short wave reanalysis has been modified analytically to include the energy input associated with infragravity waves (full spectrum), through the decomposition and energy balance of the radiation stress of waves in deep water. A hybrid clustering-numerical wave propagation downscaling technique was used, forced by the modified full wave spectra previously obtain- ed, resulting in hourly series of high spatial resolution nearshore ocean waves, including short and bound long waves. The methodology has been applied to the northern coast of Spain and validated by comparing buoy and pressure gauge records in the coast, for short wave (agitation) and infragravity wave (resonance) responses in open harbours, with very satisfactory results. © 2015 Elsevier B.V. All rights reserved. 1. Introduction Theoretical knowledge of the generation, propagation, dissipation and interaction of infragravity waves with coastlines and port structures has been highly developed since the early 50s. Munk (1949) and Tucker (1950) carried out the first observations of this type of oscillatory flow (with frequency ranges between 1/300 Hz and 1/30 Hz), associated with wave groups. Longuet-Higgins and Stewart (1962) determined analytical relations to explain the propagation of infragravity waves at wave group celerity, the genesis of bound long wave energy and its relationship with non-linear, spatial and temporal changes of the momentum flux of the wave trains traveling towards the shore. According to field observations conducted by Hasselmann (1962), Elgar and Guza (1985) and Elgar et al. (1992), non-linear interactions of peak period-adjacent energy components of the wave spectrum (sea and swell), generate energy transfer to lower frequencies. Such interactions between the nearly collinear waves result in a depression of the mean sea level in the same spatial position as the most energetic wave groups (Sand, 1982a,b). It has been estimated that this modifica- tion of the mean sea level (bound long wave height), has a general magnitude equivalent to 10% of the short wave train height (depending on the local water depth), according to (Okihiro et al. 1992, 1993), (Okihiro and Guza, 1996). These mathematical deductions are a theoretical evaluation of the transformation of short wave groups, the subsequent formation of bound long waves and their propagation towards the coast not taking into account processes such as the generation and dissipation of the edge waves, free long waves and leaky waves initially observed by Gallagher et al. (1998), Huntley et al. (1981), Symonds et al. (1982) and Oltman-Shay and Guza (1987). Hasselmann (1962) applied these theories for the prediction of bound waves, considering the direct modification of measured wave spectra. This work enable the validation of the Longuet-Higgins and Stewart (1962) theory. Sand (1982b) extended the physical interpreta- tion of the possible combinations of different frequency components and directional wave spectra defining a transfer function in order to obtain the elevations of second-order low-frequency waves for both deep and shallow water. An analytical solution for the infragravity wave spectrum related to waves was obtained. Okihiro et al. (1992) utilized these equations to determine the elevation and length of the long wave groups linked to swell data. They successfully compared their results with 2-year instrumental measurements at different locations. This technique was utilized by Costa and Rita (1992), achieving a good quantitative long wave prediction, through the use of the analyti- cal technique of Hasselmann (1962) and Okihiro et al. (1992), and validated with measured data from the vicinity of the Port of Sines in Portugal. A similar analysis was carried out by Aoki and Yamamura (2001) for the implementation of a practical estimation method of bound long waves, taking into account the directional information for each frequency component of the spectra and the calculation of second-order interactions. These authors obtained a good agreement be- tween their analytical predictions and field data measurements in Japan. The importance of knowing bound long wave characteristics in the coast (wave height H LW and period T LW ) is evident for: (a) the correct assessment of coastal morphodynamics influenced by long-period Coastal Engineering 97 (2015) 78–90 ⁎ Corresponding author. Tel.: +34 942201616x1255; fax: +34 942201616. E-mail addresses: [email protected] (G. Diaz-Hernandez), [email protected] (F.J. Mendez), [email protected] (I.J. Losada), [email protected] (P. Camus), [email protected] (R. Medina). http://dx.doi.org/10.1016/j.coastaleng.2014.12.009 0378-3839/© 2015 Elsevier B.V. All rights reserved. Contents lists available at ScienceDirect Coastal Engineering journal homepage: www.elsevier.com/locate/coastaleng
-
Upload
independent -
Category
Documents
-
view
2 -
download
0
Transcript of A nearshore long-term infragravity wave analysis for open harbours

Coastal Engineering 97 (2015) 78–90
Contents lists available at ScienceDirect
Coastal Engineering
j ourna l homepage: www.e lsev ie r .com/ locate /coasta leng
A nearshore long-term infragravity wave analysis for open harbours
Gabriel Diaz-Hernandez ⁎, Fernando J. Mendez, Inigo J. Losada, Paula Camus, Raul MedinaEnvironmental Hydraulics Institute “IH Cantabria” Universidad de Cantabria, c/ Isabel Torres 15, Parque Científico y Tecnológico de Cantabria, Santander, 39011 Cantabria, Spain
⁎ Corresponding author. Tel.: +34 942201616x1255; fE-mail addresses: [email protected] (G. Diaz-Hernande
(F.J. Mendez), [email protected] (I.J. Losada), camusp@[email protected] (R. Medina).
http://dx.doi.org/10.1016/j.coastaleng.2014.12.0090378-3839/© 2015 Elsevier B.V. All rights reserved.
a b s t r a c t
a r t i c l e i n f oArticle history:Received 23 April 2014Received in revised form 22 December 2014Accepted 23 December 2014Available online 20 January 2015
Keywords:Hybrid downscalingReanalysis databaseWave climateInfragravity wavesHarbour resonanceHarbour disturbance
This study presents a comprehensive methodology for the reanalysis, characterization and propagation of wavebound infragravity waves (1/300 Hz to 1/30 Hz) in the nearshore. A deep water short wave reanalysis has beenmodified analytically to include the energy input associatedwith infragravity waves (full spectrum), through thedecomposition and energy balance of the radiation stress of waves in deep water. A hybrid clustering-numericalwave propagation downscaling technique was used, forced by the modified full wave spectra previously obtain-ed, resulting in hourly series of high spatial resolution nearshore ocean waves, including short and bound longwaves. The methodology has been applied to the northern coast of Spain and validated by comparing buoyand pressure gauge records in the coast, for short wave (agitation) and infragravity wave (resonance) responsesin open harbours, with very satisfactory results.
© 2015 Elsevier B.V. All rights reserved.
1. Introduction
Theoretical knowledge of the generation, propagation, dissipationand interaction of infragravitywaveswith coastlines and port structureshas been highly developed since the early 50s. Munk (1949) and Tucker(1950) carried out the first observations of this type of oscillatory flow(with frequency ranges between 1/300 Hz and 1/30 Hz), associatedwith wave groups. Longuet-Higgins and Stewart (1962) determinedanalytical relations to explain the propagation of infragravity waves atwave group celerity, the genesis of bound long wave energy and itsrelationship with non-linear, spatial and temporal changes of themomentum flux of the wave trains traveling towards the shore.
According to field observations conducted by Hasselmann (1962),Elgar and Guza (1985) and Elgar et al. (1992), non-linear interactionsof peak period-adjacent energy components of the wave spectrum(sea and swell), generate energy transfer to lower frequencies. Suchinteractions between the nearly collinear waves result in a depressionof the mean sea level in the same spatial position as the most energeticwave groups (Sand, 1982a,b). It has been estimated that this modifica-tion of the mean sea level (bound long wave height), has a generalmagnitude equivalent to 10% of the short wave train height (dependingon the local water depth), according to (Okihiro et al. 1992, 1993),(Okihiro and Guza, 1996).
These mathematical deductions are a theoretical evaluation of thetransformation of short wave groups, the subsequent formation of
ax: +34 942201616.z), [email protected] (P. Camus),
bound long waves and their propagation towards the coast not takinginto account processes such as the generation and dissipation of theedge waves, free long waves and leaky waves initially observed byGallagher et al. (1998), Huntley et al. (1981), Symonds et al. (1982)and Oltman-Shay and Guza (1987).
Hasselmann (1962) applied these theories for the prediction ofbound waves, considering the direct modification of measured wavespectra. This work enable the validation of the Longuet-Higgins andStewart (1962) theory. Sand (1982b) extended the physical interpreta-tion of the possible combinations of different frequency componentsand directional wave spectra defining a transfer function in order toobtain the elevations of second-order low-frequency waves for bothdeep and shallow water. An analytical solution for the infragravitywave spectrum related to waves was obtained. Okihiro et al. (1992)utilized these equations to determine the elevation and length of thelong wave groups linked to swell data. They successfully compared theirresults with 2-year instrumental measurements at different locations.
This technique was utilized by Costa and Rita (1992), achieving agood quantitative long wave prediction, through the use of the analyti-cal technique of Hasselmann (1962) and Okihiro et al. (1992), andvalidated with measured data from the vicinity of the Port of Sines inPortugal. A similar analysis was carried out by Aoki and Yamamura(2001) for the implementation of a practical estimation method ofbound long waves, taking into account the directional information foreach frequency component of the spectra and the calculation ofsecond-order interactions. These authors obtained a good agreement be-tween their analytical predictions and field datameasurements in Japan.
The importance of knowing bound long wave characteristics in thecoast (wave height HLW and period TLW) is evident for: (a) the correctassessment of coastal morphodynamics influenced by long-period

Table 1Name, position and size for SWANmeshes (all dimensions in geographic degrees).
ID Lonmin° W Lonmax
° W Latmin° N Latmax
° N Width Height ΔLon ΔLat
G01 5.5 1.2 43.1 43.9 4.3 0.8 0.01 0.008M011 2.83 1.43 43.252 43.54 1.4 0.288 0.005 0.004M012 3.66 2.66 43.316 43.588 1 0.272 0.005 0.004M013 4.72 3.49 43.356 43.66 1.23 0.304 0.005 0.004D0111 2.04 1.885 43.28 43.404 0.155 0.124 0.001 0.0008D0121 3.205 2.94 43.316 43.488 0.265 0.172 0.001 0.0008D0131 3.85 3.68 43.376 43.548 0.17 0.172 0.001 0.0008G02 8.4 3.8 43.2 44.2 4.6 1 0.01 0.008M021 5.37 4.29 43.376 43.752 1.08 0.376 0.005 0.004M022 6.52 5.29 43.512 43.896 1.23 0.384 0.005 0.004M023 7.73 6.43 43.536 44 1.3 0.464 0.005 0.004D0221 5.805 5.595 43.52 43.676 0.21 0.156 0.001 0.0008D0222 6.025 5.905 43.56 43.636 0.12 0.076 0.001 0.0008G03 9.6 7.1 42.3 44.1 2.5 1.8 0.01 0.008M031 8.21 7.65 43.532 43.916 0.56 0.384 0.005 0.004M032 8.88 8.13 43.268 43.748 0.75 0.48 0.005 0.004M033 9.42 8.79 42.828 43.452 0.63 0.624 0.005 0.004D0321 8.705 8.28 43.284 43.604 0.425 0.32 0.001 0.0008G04 9.6 8.5 41.1 43.3 1.1 2.2 0.01 0.008M041 9.42 8.72 42.292 43.02 0.7 0.728 0.005 0.004M042 9.3 8.72 41.748 42.532 0.58 0.784 0.005 0.004D0411 9.12 8.785 42.336 42.704 0.335 0.368 0.001 0.0008D0422 9.05 8.72 42.064 42.464 0.33 0.4 0.001 0.0008
Fig. 1.Methodological framework to assess and reconstruct time series for wave+ boundlong wave spectrum.
79G. Diaz-Hernandez et al. / Coastal Engineering 97 (2015) 78–90
oscillations (Roelvink and Stive, 1989; Baldock et al., 2007, 2011);(b) harbour agitation (Bowers, 1977; Lee and Xing, 2007; Bellotti,2007; Kofoed-Hansen et al., 2005); (c) the performance diagnosis ofcarrier moorings (van der Molen, 2006; Naciri et al., 2006; Clausset al., 2010) and (d) the adequate design of Wave Energy Converters(WEC) (Muliawan et al., 2013).
Fig. 2.Modified GOW amplitude (a) spectra for 20/1/1965 cluster number 1 of 500 at
To conduct these studies it is therefore necessary to reconstruct theenergy infragravity spectra in the coast, taking into account the non-linear transformation processes, shoaling, reflection, bottom frictiondissipation and wave breaking, and considering as well the full spec-trum interaction with natural and artificial topography/bathymetryshapes. In this study these issues are solved through the use of a spectralwave propagation model (SWAN) (Booij et al., 1999), forced with ana-lytically modified full spectra following the Hasselmann (1962) tech-nique, and compared to real spectra records as presented in Okihiroet al. (1992).
Therefore, this study aims to develop a methodology for inferringthe infragravity contribution to the wave spectrum in deep water,
[5.805°W, 43.64°W]. Bound long wave energy indicated by a dashed-line circle.

Fig. 3.Regularmeshes and bathymetry for the SWANmodel: low-resolution (black box),mid-resolution (red box) and high-resolution (magenta box). Position of the forcing spectra fromthe database GOW (blue circles) and spectra record points for G meshes (black points).
80 G. Diaz-Hernandez et al. / Coastal Engineering 97 (2015) 78–90
propagating it towards the coast and, finally, to transferring this energyinto any open harbour. The specific objectives of thiswork are: a) to cre-ate a new long (60 years) hourly database for parameters related to thebound long waves propagating from deep water to the nearshore, b) toimprove the knowledge of the incoming bound long wave forcing forport engineering applications (i.e. full wave and long wave harbourresonance analysis) and c) to develop an infragravity wave Atlas forthe north of Spain in deep water. This work can be repeated at anygeographic site by following the methodology presented.
This study is organized as follows: Section 2 presents an overview ofthe methodology for the reconstruction of the statistics of infragravitywaves, in and out of port facilities. Section 3 includes a brief descriptionof the analytical approaches to infer infragravity wave spectra following
Fig. 4. Detail of the high-resolution bathymetry and finit
the study of Okihiro et al. (1992). Section 4 presents the setup of themodels used to propagate waves from deep to harbour areas providingsome recommendations for the proper coupling between both numeri-cal tools. Section 5 describes the validation for deep water and harbourareas in three different ports located in the north of Spain, and a briefdescription of the measured data used. Finally, Section 6 presents thegeneral discussion of the results and some conclusions.
2. Overview of the methodology
The present methodology provides the way to modify, propagateand reconstruct series of wave spectra in harbours—considering anyavailable wave numerical reanalysis in deep water—including both the
e element mesh designed for the Port of La Coruña.

Fig. 5. Location of the harbours analyzed, location of the measurement points, depths and boundaries of the computational domains used.
81G. Diaz-Hernandez et al. / Coastal Engineering 97 (2015) 78–90
short and infragravity wave energy bands (1/300 Hz and 1/30 Hz).In the present work this approach is applied to the northern coastof Spain using the GOW (Global Ocean Waves) hindcast database
Fig. 6. Comparison of DOW+ LW series obtained for Hs, Tp, HLW and TLW, for the outer pressurJanuary and February 1995. Predicted DOW-LW (blue line), measured (black points), and pred
(Reguero et al., 2012) as the main source of information. Results arevalidated against instrumental wave buoy data and several sets oftime series from gauges deployed in different field experiments in
e gauge of the Gijón field experiment (Gi− 1; [Lon = 5.68 ° W, Lat = 43.57 ° N]), duringicted using (Lara et al., 2002) formulation (red line).

Fig. 8. Comparison of DOW+ LW series obtained for a) Hs, b) Tp, c) HLW and d) TLW, for the inner gauge of the Coruña field experiment (Co− 2; [Lon= 8.393 ° W, Lat= 43.361 ° N]), of2003. Predicted (blue line), measured (black points).
Fig. 7. Comparison of DOW + LW series obtained for Hs for the inner AWAC® of the Gijón field experiment (Gi − 2; [Lon = 5.688 ° W, Lat = 43.55 ° N]), in February 2009. Predicted(blue line), measured (black points).
82 G. Diaz-Hernandez et al. / Coastal Engineering 97 (2015) 78–90
83G. Diaz-Hernandez et al. / Coastal Engineering 97 (2015) 78–90
selected harbours. Conceptually, the new methodology, outlined inFig. 1, takes advantage of the downscaling approach proposed byCamus et al. (2013) for short waves. The steps to be followed aredescribed next:
a) select a limited number,N, of hourly events (sea states clustering)in deep water from any global or regional ocean wave hindcast timeseries (several years); b) modify the energy of each one of the wavespectra to include infragravity energy (obtaining the full spectra);c) numerically propagate the modified full spectra to harbour areas;d.1) reconstruct the hourly time series of short and bound long wavesnearshore, or d.2) use the N full spectral data to force numerical models(i.e. coastal morphodynamics, harbour agitation, or fluid and structureinteraction models (CFD), and then reconstruct the complete timeseries; and e) validate against instrumental observations.
The method, as presented, is accurate for open deep water harbourswhere directionality and shoaling of incoming infragravity waves arelimited. This restriction is due to the fact that the SWAN modeldoes not account for the sub-harmonic generation of infragravitywaves by short ocean waves, resulting in a potential ill prediction of
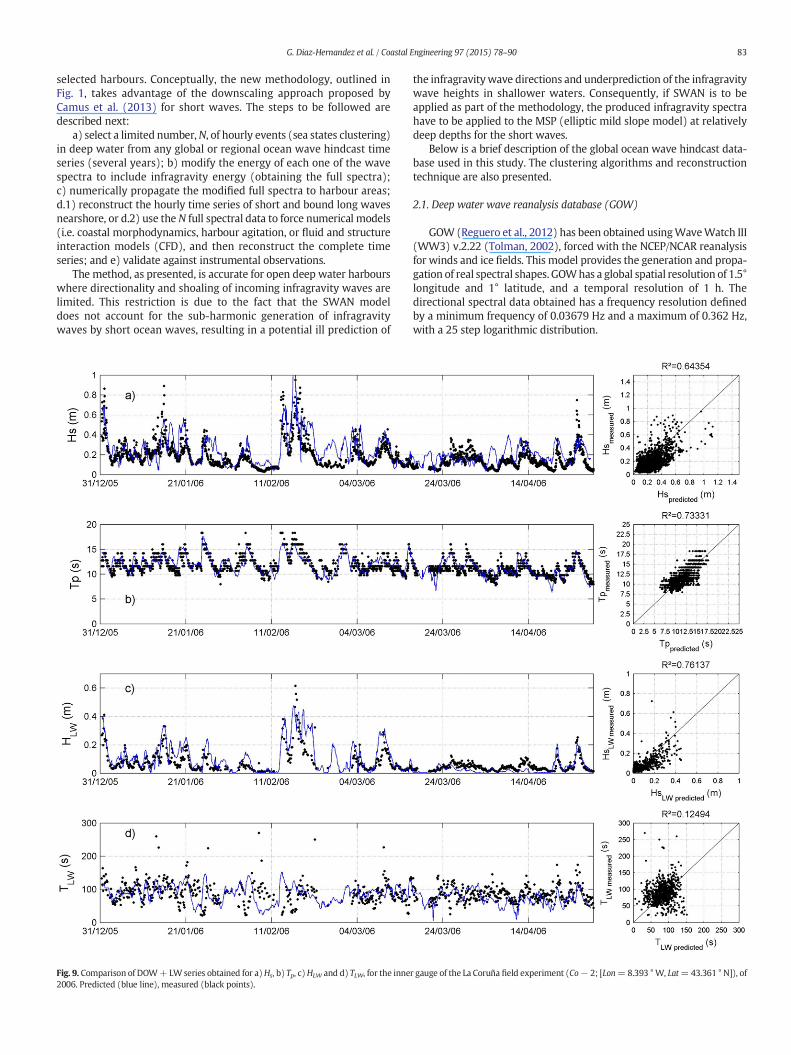
Fig. 9. Comparison of DOW+LWseries obtained for a)Hs, b) Tp, c)HLW and d) TLW, for the inne2006. Predicted (blue line), measured (black points).
the infragravitywave directions and underprediction of the infragravitywave heights in shallower waters. Consequently, if SWAN is to beapplied as part of the methodology, the produced infragravity spectrahave to be applied to the MSP (elliptic mild slope model) at relativelydeep depths for the short waves.
Below is a brief description of the global ocean wave hindcast data-base used in this study. The clustering algorithms and reconstructiontechnique are also presented.
2.1. Deep water wave reanalysis database (GOW)
GOW (Reguero et al., 2012) has been obtained usingWaveWatch III(WW3) v.2.22 (Tolman, 2002), forced with the NCEP/NCAR reanalysisfor winds and ice fields. This model provides the generation and propa-gation of real spectral shapes. GOWhas a global spatial resolution of 1.5°longitude and 1° latitude, and a temporal resolution of 1 h. Thedirectional spectral data obtained has a frequency resolution definedby a minimum frequency of 0.03679 Hz and a maximum of 0.362 Hz,with a 25 step logarithmic distribution.
r gauge of the La Coruña field experiment (Co− 2; [Lon=8.393 °W, Lat=43.361 ° N]), of

84 G. Diaz-Hernandez et al. / Coastal Engineering 97 (2015) 78–90
GOW makes use of bathymetric information from the ETOPO(NOAA, 2006) project, and includes algorithms for the correction of sig-nificantwave height (Minguez et al., 2011), by identifying outliers relat-ed to extreme events such as tropical cyclones (Minguez et al., 2013),accounting for the fact that the NCEP / NCAR wind forcing does nothave enough resolution to model these extremes properly. This data-base has been extensively validated and calibratedwith 1992–2005 sat-ellite data (missions Jason-1, Jason-2, TOPEX, ERS-2, Envisat and GFO)and Buoy Observations (Minguez et al., 2011). Spatial and temporalconsistency, as well as accuracy and global and historical extension ofthe wave spectra of GOW database facilitate a reliable starting point toaddress the present investigation.
2.2. Clustering and time series reconstruction
(Camus et al., 2011a,b) propose the selection of a small number(500) of representative sea states, through the application of amaximum dissimilarity algorithm (MDA) (Kennard and Stone, 1969).Once the N clusters (sea states) are propagated to the shore, the radialbasis function (RBF) interpolation technique (Franke, 1982) enablesthe reconstruction of the time series of waves (Camus et al., 2011b),
Fig. 10. DOW + LW 60-year database at the inner gauge of the La Coruña field experiment (b) probability of non-exceedance as a function of HLW and TLW.
with a reduction of the total amount of CPU simulations (1000×). Thishybrid downscaling methodology has been applied to obtain thedatabase called Downscaled OceanWaves (DOW) (Camus et al., 2013).
3. Bound long wave prediction
Oneof themain steps of thismethodology is to analytically obtain anestimate of the low-frequency energy fraction in the deepwater spectraand its dependency on the spectral shape characteristics. OriginallyLonguet-Higgins and Stewart (1962) showed that low-frequencywaves associated with the short wave field are forced by the radiationstress gradient. They found that the generated low-frequency periodsadopt celerities and dimensions directly related to wave grouping.
With the aim of being able to analytically evaluate infragravity waveheights and periods as second-order oscillations, early proposed formu-las were derived through the application of the Laplace equation(Sharma and Dean, 1979). Low-frequency energy is obtained as a resultof the combinations between different frequencies andmean directionsof propagation of each energy component of thewave spectrum, and foreach possible pair of frequencies fn–fm and directions θq–θr respectively.
Co − 2; [Lon = 8.393 ° W, Lat = 43.361 ° N]), a) probability histogram for HLW vs. TLW,

85G. Diaz-Hernandez et al. / Coastal Engineering 97 (2015) 78–90
According to Okihiro et al. (1992), the second-order free surfacebound long wave linked to a wave spectrum can be evaluated with thefollowing analytical summation of deep water components, as follows.
η ω j
� �¼X∞n¼1
X∞m¼1
Xnθq¼1
Xnθr¼1
Ce � An;q � Am;r ð1Þ
For all possible combinations of frequency components n andm, andwith their respective directions q and r, A represents each individual am-plitude of the discrete spectral shape and Ce is the coupling coefficient forbounding the energy of a long wave to the wave spectra, given by:
Ce ¼ − gknkmcosΔθ2ωnωm
−ωnωm
2gþω2
n þω2m
2g−
qω j
gΔktanh Δkhð Þ−ω2j
� �ωnωm
�
ω jωnωm
g
� �2þ knkmcosΔθ
� �−1
2ωnk
2m
cosh2 kmhð Þ− ωmk
2n
cosh2 knhð Þ
" # !
ð2Þ
Fig. 11. Resonance amplification in the “San Diego Basin” of La Coruña harbour (point Co − 2(red line) (point Co− 1; [Lon = 8.368oW, Lat = 43.368oN]), for 2003; b) probability of non-ex
and for shallow water.
Ce ¼ −32
1h3knkm
ð3Þ
where, g is the gravity acceleration constant, inm/s2; kn is thewavenum-ber for spectral component n, in 1/m. km is the wavenumber for spectralcomponentm, in 1/m;Δθ= θn,r− θm,q is the angular difference betweeneach individual energy component;Δk=|kn,r− km,q| is thewavenumbervector associatedwith thebound longwave, in 1/m;ωj=ωn−ωm is theangular frequency difference for each individual energy component; andh is the bathymetry depth at each wave spectrum location, inm.
Fig. 2 shows an example of the application of the equationsdescribed above, combining short wave energy components for aspectrum selected randomly from the GOW data base. Initial spectralcharacteristics are: significant wave height Hs = 4.7 m, peak periodTp = 16.3 s, mean period Tz = 13.2 s and mean propagation directionθ = 352° (in nautical degrees). After applying Eqs. (1) and (2) the ob-tained long wave height and mean period are: HLW = 0.54 m andTLW = 141 s. Values of approximately 5 to 10 times the Tp and 1/10 ofHs are obtained, as described in Ottesen-Hansen (1978).
); a) example for HLW inside the basin (blue line) and HLW at the mouth of the harbourceedance as a function of the amplifications for the 60-year numerical predictions.

86 G. Diaz-Hernandez et al. / Coastal Engineering 97 (2015) 78–90

87G. Diaz-Hernandez et al. / Coastal Engineering 97 (2015) 78–90
4. Propagation from deep to shallow water and inside harbours
The numerical model SWAN (Booij et al., 1999) is adopted in thismethodology to propagate the spectra from deepwater to the harbours.This model has been forced with full spectra, previously modified toinclude infragravity energy (see Section 3).
In order to numerically characterize the energy response of the fullspectrum within any harbour, the methodology requires propagatingthe new spectra from deep water to the harbour entrance and thereconstruction of the hourly time series of short and long wavescorresponding to the deep water reanalysis time series used.
The harbour agitation analysis is handled by the use of the MSPmodel (Mild Slope for Ports model, developed by IH Cantabria)(Berkhoff, 1972; GIOC, 2000), based on the elliptic mild slope equation.Thismodel is coupledwith the SWANmodel and forced by the full spec-trumdata transferred to themouth of the harbour. In order to clarify themethodology the approach will be applied to the north coast of Spainusing the GOW database in deep water and the DOW data base(Camus et al., 2013) including downscaled waves.
4.1. Full spectrum propagation from deep water
As the full wave spectrum approaches and propagates towards thecoast, it undergoes a transformation mainly due to the influence of thebathymetric contours, i.e. the simultaneous effects of refraction, diffrac-tion, shoaling and energy dissipation due to bottom friction and wavebreaking.
The DOW database (Camus et al., 2013) provides a selection of N =500 sea states (from GOW database), discretized into 187 geographicalpoints along the deepwater limit in the north coast of Spain. These N=500 sea states are propagated through a set of nested meshes using theSWAN model.
The original propagations of Camus et al. (2013) must be re-run inorder to transform the modified full spectra accounting for theinfragravity wave energy obtained as explained in the previous section.This implies running 500 cases in 187 locations in deepwater. An exten-sion of the frequency domain of the original GOW spectrum needs to becarried out. A new discretization for the SWAN input of 111 frequencycomponents from 0.0016 to 0.3752 Hz, and 72 directional componentsbetween 0 and 360° is proposed.
Table 1 shows the dimensions and coordinates of mesh resolutionsand Fig. 3 shows the map location of these numerical domains: low-resolution (G),mid-resolution (M) and high-resolution (D). Additional-ly, 3 tidal ranges have been considered for the high-resolution meshesto take the low, mean and high tidal levels into account, namely, 0, 2.5and 5 m.
It is known that the SWAN model is unable to properly manage theenergy transfer towards sub-harmonic waves but does successfully ac-count for the non-linear triad interaction to super-harmonics. Accordingto Klopman and Dingemeans (2001), a perturbation-series approachwould be needed to further improve the near-resonant triad interac-tions of waves in a spectral model for nearshore regions. However, ifsuch transfer is evaluated analytically a priori, the SWAN model isquite reliable to propagate and transform the complete energyspectrum (waves + bound long waves) properly.
In this way, by forcing the SWAN model with the full spectrum andafter the RBF algorithm has been applied (Camus et al., 2011b), the60-year hourly wave reconstruction can be obtained at the harbourentrance. It is noteworthy that for each of the meshes, full spectrumdata has been calculated and stored every 0.1° for the G meshes, 0.05°for the M meshes and 0.02° for the D meshes.
Fig. 12. Comparison of DOW+LWseries obtained for a)Hs at point La− 1, b) Tp at point La− 1,the Langosteira field experiment of 2012. Predicted (blue line), measured (black points).
4.2. Evaluation of bound long waves in harbours
Whenwavesmeet coastal protection structures and harbour facilities,wave diffraction and reflection are the main wave–structure interactionprocesses that must be taken into account for an appropriate agitationstudy.
At present, models that are based on the elliptic mild slope equationare themost commonly used for this type of study. Thesemodels offer apractical and effective way to assess harbour agitation, considering realirregular waves forcing interaction with complex bathymetric andstructure contours. In this study, the MSP model (Berkhoff, 1972;GIOC, 2000) is used, considering a finite element scheme, solved overa 2DH triangular-element and unstructured depth-adaptative mesh.This model enables considering the aforementioned linear wave propa-gation effects and partial reflection at harbour contours. To run thismodel it is necessary to define a numerical domain with a resolutionof at least 15 nodes per wavelength, define the geometry of the portproviding appropriate boundary conditions including the outer wavespectral forcing and inner limits of the port and set the spectral forcingcontour.
Fig. 4 shows an example of oneof the numericalmeshes designed forthis study, using a high-resolution bathymetry at the Port of La Coruña,(83,965 nodes and 166,193 elements).
MSP spectral simulations are highly demanding on CPU (i.e. 1 to2 days per spectral run on a standard PC). For that reason a monochro-matic component energy reconstruction approach is proposed in thismethodology. The N spectra at the mouth of the harbours aredecomposed into the linear sum of the 111 × 72 components (mono-chromatic waves) proposed for their discretization. Hence, a range ofmonochromatic waves for different wave periods T and directions θmust be pre-established for each spectral dataset at the mouth of theharbour, considering always an unitary wave height (H= 1m). There-fore, the calculation time is dramatically optimized (i.e. the 111 × 72monochromatic components defining each spectrum can be trans-formed within 1 week to 1 standard CPU, including the 60-yearpost-reconstruction statistics process for each harbour). As will beshown, according to the quality of the validation presented next, itseems that the necessary hypothesis of linearity to address thisapproach is suitable to achieve the results expected, as can be seen inthe validation presented in Section 5.
It is noteworthy that for each execution of the MSP model, thetheoretical partial reflection coefficients of Goda and Suzuki (1976)are considered, based on different berthing, breakwater and mooringtypologies for each harbour (for monochromatic frequencies above1/30 Hz). Reflection coefficients of 100% are considered for monochro-matic runs with frequencies below 1/30 Hz.
Finally, after applying the RBF reconstruction algorithm for the NMSP propagated spectra, the 60-year hourly wave reconstruction canbe carried out at any location inside the harbour.
5. Comparison with measured data
5.1. Short and bound long waves in harbour basins
Validation within harbour facilities has been carried out usinginstrumental data from three different field experiments (see Fig. 5):
1 Field experiment in the Port of Gijón. From January to February 1995.Infragravitywavesweremeasured using aMiniWave® (Coastal Lasing)pressure gauge (22m) in front of themain breakwater (Gi− 1; [Lon=5.68°W, Lat = 43.57°N]). Short waves were measured by a AWAC®
system (Nortek USA) at the same location and inside the inner marina
c)Hs at point La− 2, d)HLW at point La− 2, e)Hs at point La− 3, f)HLW at point La− 3, for

88 G. Diaz-Hernandez et al. / Coastal Engineering 97 (2015) 78–90
basin (5 m) (Gi − 2; [Lon = 5.688°W, Lat = 43.55°N]) (1 month,February 2009). Bursts of 512 points were recorded with a samplingfrequency of 0.5 Hz (17-minute continuous measurement).
2 Field experiments in the Port of La Coruña. Two different experimentswere carried out by CEDEX in 2003 (12 months) and 2006 (4 months:January to April). Short and infragravity waves were measured atthe mouth (25 m) of the harbour (Co − 1; [Lon = 8.368°W, Lat =43.368°N]) and in the inner “San Diego Basin” (7 m) (Co −2; [Lon=8.393°W, Lat=43.361°N]).WaveRider® buoys and Triaxis®
pressure gaugeswere used for short and infragravitywave oscillationsrespectively with a sampling frequency of 1 Hz.
3 Field experiment in Port of Langosteira. Measurements were takenby ALATEC from February to May 2012. Short waves were measuredat the mouth of the harbour (38 m) with a Wave Rider buoy(La − 1; [Lon = 8.537°W, Lat = 43.348°N]). Infragravity waveswere recordedwithin themain basin, at two points adjacent to differ-ent berthing zones in the northern mooring zone (La − 2; [Lon =8.517°W, Lat = 43.353°N]), and southern mooring zones (La −3; [Lon = 8.507°W, Lat = 43.350°N]). TWR-2050HT tide and waverecorders were used at four measurements points, with a samplingfrequency of 1 Hz.
Consequently, two sets of data are available for the validation of thismethodology, namely short (Hs and Tp) and infragravity (HLW and TLW)wave data.
After filtering out the astronomical tide signal, infragravity waveinformation has been obtained from pressure gauge records filteringthe energy below 1/30 Hz. Available long wave records were post-processed taking into account the whole long wave frequency range.Therefore, no isolation of frequency bands within the spectra isanalyzed, as recommended by Belloti and Franco (2011).
HLW and TLW are defined as follows.
HLW ¼ 4ffiffiffiffiffiffiffiffiffiffiffim0LW
pTLW ¼ m1LW
m0LW
m0LW ¼Z 360
0
Z 1=250
1=25S f ; θð Þdfdθ
m1LW¼Z 360
0
Z 1=250
1=25f � S f ; θð Þdfdθ
ð4Þ
Comparisons between the predicted and reconstructed time seriesof short and infragravity wave data are provided below.
Fig. 6 shows the comparison between time series for the two-monthperiod measurements in 1995 at point Gi − 1[Lon = 5.68°W, Lat =43.57°N]. It can be seen that the oceanwave parameter predictions pro-vide appropriate values and similar time evolution for Hs and Tp. It isnoted that there are some discrepancies between the predicted andmeasured Hs, probably because of an inappropriate estimation of thereflection coefficients in the numerical model setup; a situation that isconsistent in the rest of the validations (see Figs. 8 and 9). Better estima-tions of Tp than for Hs are found in the comparisons.
For infragravity waves,HLW is well predicted along thewhole instru-mental record. As for TLW it can be observed that the predicted valuespresent a smoother trend in time, not picking up the high temporalvariability shown in the records. This is possible due to the lack ofnon-linear short wave propagation effects which occur from theharbour mouth towards the basin, not taken into account by the linearmodel. Still, TLW predicted results can be considered to be a goodapproximation with the advantage of having long-term time series ofinfragravity waves inside the harbours.
As an additional validation for the Gijon measurements, followingBelloti and Franco (2011), an adaptation for the Bowers (1992) formulais applied to the Gijon short wave measurements (Lara et al., 2002),which is calculated and included in Fig. 6, for HLW, achieving goodpredictions.
Fig. 7 shows predicted time series of Hs at the inner marina basin ofthe port of Gijón (AWAC® gauge at pointGi− 2; [Lon=5.688°W, Lat=43.55°N]). It can be seen that waves reaching this sheltered area havelow wave height, below 0.4 m. Measured and predicted values of Hs
present long-period oscillations directly related to astronomical tidefluctuations. The quality of the predicted data is good, but showingsome underestimation due to local generated waves from NE windsapproaching this area, which is not included in the MSP modelling.
Figs. 8 and 9 present a direct comparison between short waves andinfragravity wave reconstructed time series at point Co − 2, the fieldexperiments in 2003 and 2006, respectively. An overall good agreementof the predicted and measured values is observed. Hs and Tp time seriesare properly reconstructed, including energetic conditions withHs=1m.
The same occurs with the predicted values associated withinfragravity waves, showing a good agreement. Special attention mustbe paid to the moments when HLW reaches values close to 0.8 m, dueto resonant amplification episodes which can be reproduced and pre-dicted successfully through the numerical approach. It is observedagain that the general behavior of predicted TLW is less variable,compared to those measured, finding that the average trends andgeneral envelope of this variable over time is well predicted by theproposed methodology.
Generally, infragravity waves with TLW between 100 and 150 s arerelated to resonant episodes at the “San Diego Basin” (point Co − 2).A white noise forcing analysis made with the MSP model yielded thatone of the natural modes of resonant oscillation at this location is relat-ed to periods close to 120 s. By observing the lower panels (e) of Figs. 8and 9, it is evident that at the mouth of the harbour (at point Co − 1),HLW does not exceed 0.1 m, while at the “San Diego Basin” (pointCo − 2) some resonant events were recorded with large amplificationvalues (Kp = 8).
Fig. 10 shows the probability histogram and probability of non-exceedance as a function of HLW and TLW, using the complete 60-yearDOW + LW database reconstructed at point Co − 2 within the LaCoruña harbour. The “San Diego Basin” experiences resonant oscilla-tions above HLW = 0.36 with a probability of occurrence around 5% ofthe annual hours. These numerical records—therefore—provides veryuseful information which can improve the insight into the historicaland long-term statistic at any harbour basin, for both the ocean wavesand infragravity waves (resonance).
Fig. 11a shows an example of how the infragravity energy is ampli-fied inside the “SanDiego Basin” comparedwith theHLW time series nu-merically reconstructed at the mouth of the harbour (Co − 1; [Lon =8.368°W, Lat=43.368°N]). Additionally, Fig. 11b presents the probabil-ity of non-exceedance of the numerically reconstructed amplifications(HLW − basin/HLW − mouth) for the 60-year hourly data, at the “San DiegoBasin” location. This innovative statistical information is the outmostimportance for the management of resonant oscillations in harbours,e.g. for the computer simulation of moored ship motion induced byharbour resonance (Kwak et al., 2012).
Finally, Fig. 12 shows the comparison of Hs, Tp, and HLW for theLangosteira field experiment of 2012. It can be seen that the qualityof the predictions for both Hs and Tp, at the mouth of the harbourlocation (point La − 1), is good. Values related to HLW at the innerzones of the harbour (points La − 2 and La − 3) are generally wellreproduced by the numerical approximation. Some interesting resonanteventswith values ofHLW values around 0.4m arewell predicted. It is im-portant to point out that records at point La − 1 were only available fortwo months (from March to May 2012), and for the gauge at La − 3(between July andNovember 2012) therewere failures and inconstancieswere recorded.
6. Conclusions
A comprehensive methodology for the generation and propagationof infragravity waves related to wave grouping is presented. The

89G. Diaz-Hernandez et al. / Coastal Engineering 97 (2015) 78–90
implementation, modelling, coupling and validation of differentanalytical, statistical and numerical tools is described and fixed tohindcast ocean wave and infragravity wave characteristics from waterto harbours.
This newmethodology is based on the hybrid approach for transfer-ring wave climate from deep water to nearshore as originally proposedby Camus et al. (2013). Thismethod has been extended by using the fullspectrum inferred from the ocean wave data following the analyticalapproach of Okihiro et al. (1992) as forcing. After the numerical propa-gation fromdeepwater to the harbour entrance has been completed thefull spectral statistics can be reconstructed at any point inside theharbour basin.
The methodology has been tested by forcing a harbour agitationmodel with the full spectra obtained at the mouth of three differentharbours in the north coast of Spain.
It has been verified that the predictions of wave parameters Hs andTP, and the parameters of HLW and TLW infragravity waves are reliableand resemble instrumental records available in the three differentharbours.
These predictions are accurate due to the (generally) direct linearrelation between wave energy and infragravity energy associated withit. As expected, long wave oscillations linked to ocean wave groups arewell predicted by the proposed method. However, this technique hasshortcomings with respect to non-linear processes which occur duringthe ocean wave propagation: grouping, dispersion, coupling betweenspectral frequencies and directions, non-linear effects due to dissipationprocesses such as breaking, setup, surf-beat, run-up, etc. These effectsare also present in the infragravity band of the full spectrum: free longwaves (incident and reflected), edge waves, breaking point generatedlong waves. Additionally, a well known drawback of wave disturbancenumerical models is the limited knowledge on wave reflection coeffi-cients for different types of harbour structural sections and contoursas well as on the local non-linearities among short wave frequenciesand local generation of wind waves within the basins. These issuesmay introduce non-negligible deviations in the final predictions withinany harbour.
Also, it is important to mention that the resonant amplificationobtained by this technique does not take into account an accuratebound longwavepropagation, shoaling and refraction, since thepresentmethodology assumes that these effects are applied to a free long wavepropagation from deep towards the coast. Because of this, some inaccu-rate shoalingwould be predicted, aswell as some expected ill-predictedlong wave directions are expected. Furthermore, the present techniqueis based only on linear and stationary propagations and therefore,may fail to reproduce a realistic behavior of the resonant oscillations,especially those induced by transient non-linear effects (Losada et al.,2008).
However, the predictions obtained are reasonably good, because thethree harbour locations have water depths of around 40 to 60 m (inter-mediate to deep water), with no presence of any determinant reflectivebeach or natural contour that reflects the long wave towards theharbour. Long wave direction could be crucial if a beach or a reef is themain release mechanism for the bound long wave, but for an open-seaharbour this is not the case. Consequently using SWAN to propagatethe free long wave is accepted to be reasonable.
Validation has shown that information provided by this method canbe very useful for the diagnosis and evaluation of resonant effects andfor the design of mitigation solutions in harbours.
The full spectrum statistical methodology brings with it additionalknowledge, which provides a state-of-the-art improvement to the tra-ditional approach of conducting harbour agitation studies. Additionally,this information can be directly assimilated to force transient and non-linear numerical models as the Boussinesq-type and/or based on theNon-linear Shallow Water Equations, and advanced ComputationalFluid Dynamics models, which require the knowledge of the completespectral forms.
The improved understanding of infragravity wave statistics is usefulto cover some specific and important engineering challenges such as:harbour pre-design, taking into account short wave agitation and longwave resonance simultaneously; obtaining a better knowledge of theperformance and operation of any real harbour; and helping to managethe navigation of vessels in berthing zones and harbour basins.
Supplementary data to this article can be found online at http://dx.doi.org/10.1016/j.coastaleng.2014.12.009.
Acknowledgements
The authors would like to thank Puertos del Estado (SpanishMinistry of Public Works), CEDEX and ALATEC company for providingthe buoy information and data. The work was partially funded byproject “iMAR21” (CTM2010-15009) from the Spanish Government.
References
Aoki, S., Yamamura, Y., 2001. A practical method for estimating bound long waves and itsapplication to the analysis for free long waves. 27th International Conference onCoastal Engineering (ICCE), pp. 3941–3953.
Baldock, T.E., Alsina, J.A., Caceres, I., Manoonvoravong, P., Pham, K.S., 2011. Influence ofsurf-beat on beach morphology and sediment transport. Proceedings of the 34thIAHR World Congress 33rd Hydrology and Water Resources Symposium and 10th,pp. 973–980.
Baldock, T.E., Manoonvoravong, P., Pham, K.S., 2007. Beach face morphology and surf beatsediment transport in laboratory scale surf and swash zones. Journal of CoastalResearch: Proceedings of the 9th International Coastal Symposium, pp. 631–635.
Bellotti, G., 2007. Transient response of harbours to long waves under resonanceconditions. Coast. Eng. 54, 680–693.
Belloti, G., Franco, L., 2011. Measurement of longwaves at the harbor of Marina di Carrara,Italy. Ocean Dyn. 61, 2051–2059.
Berkhoff, J.C.W., 1972. Computation of combined diffraction–refraction. Coast. Eng.Proc. 1.
Booij, N., Ris, R.C., Holthuijsen, L.H., 1999. A third-generation wave model for coastalregions: 1. model description and validation. J. Geophys. Res. 104, 7649–7666.
Bowers, E.C., 1977. Harbour resonance due to set-down beneath wave groups. J. FluidMech. 79, 71–92.
Bowers, E.C., 1992. Low frequency waves in intermediate depths. 23rd lnternationalConference of Coastal Engineering-ASCE, pp. 832–845.
Camus, P., Mendez, F.J., Medina, R., 2011a. A hybrid efficient method to downscale waveclimate to coastal areas. Coast. Eng. 58, 851–862.
Camus, P., Mendez, F.J., Medina, R., A.S.C., 2011 bb. Analysis of clustering and selectionalgorithms for the study of multivariate wave climate. Coast. Eng. 58, 453–462.
Camus, P., Mendez, F.J., Medina, R., Tomas, A., Izaguirre, C., 2013. High resolutiondownscaled ocean waves (dow) reanalysis in coastal areas. Coast. Eng. 72, 56–68.
Clauss, F., Testa, D., Sprenger, F., 2010. Coupling effects between tank sloshing and mo-tions of a lng carrier. 29th International Conference on Offshore Mechanics and ArcticEngineering, pp. 1–8.
Costa, C.N.L., Rita, M.M., 1992. Wave climatology of the Portuguese coast/clima de agitacomarítima na costa portuguesa. Instituto Hidrográfico Laboratório Nacional deEngenharia Civil, p. 108.
Elgar, S., Guza, R.T., 1985. Observations of bispectra of shoaling surface gravity waves.J. Fluid Mech. 161, 425–448.
Elgar, S., Herbers, T.H.C., Okihiro, M., Oltman-Shay, J., Guza, R.T., 1992. Observations ofinfragravity waves. J. Geophys. Res. 97, 15573–15577.
Franke, R., 1982. Scattered data interpolation: test of some methods. Math. Comp. 38,181–200.
Gallagher, E.L., Elgar, S., Guza, R.T., 1998. Observations of sand bar evolution on a naturalbeach. J. Geophys. Res. 103, 3203–3215.
GIOC, 2000. Manual del programa en elementos finitos msp para el estudio de agitaciónportuaria. grupo de ingeniería oceanográfica y de costas. Documento técnico ymanual de usuario. Universidad de Cantabria.
Goda, Y., Suzuki, T., 1976. Estimation of incident and reflected waves in random waveexperiments. Coast. Eng. Proc. 1.
Hasselmann, K., 1962. On the non-linear energy transfer in a gravity-wave spectrum part1. general theory. J. Fluid Mech. 12, 481–500.
Huntley, D.A., Guza, R.T., Thornton, E.B., 1981. Field observations of surf beat: 1. progres-sive edge waves. J. Geophys. Res. 86, 6451–6466.
Kennard, R.W., Stone, L.A., 1969. Computer aided design of experiments, americanstatistical association and american society for quality. Technometrics 11, 137–148.
Klopman, G., Dingemeans, M.W., 2001.Wave interactions in the coastal zone. Internation-al Workshop on Water Waves and Floating Bodies (IWWWFB), p. 1.
Kofoed-Hansen, H., Kerper, D.R., Sorensen, O.R., Kirkegaard, J., 2005. Simulation of longwave agitation in ports and harbours using a time-domain Boussinesq model. Pro-ceeding of the Fifth COPRI International Conference on Ocean Wave Measurementand Analysis, WAVES, paper n. 077.
Kwak, M., Moon, Y., Pyun, C., 2012. Computer simulation of moored ship motion inducedby harbor resonance in Pohang New Harbor. Coast. Eng. Proc. 1.
Lara, J.L., Martin, F.L., Losada, I.J., 2002. Analisis experimental de ondas largas en la bocanadel puerto de Gijon. Ingenieria del Agua (In Spanish) 9, 437–451.
90 G. Diaz-Hernandez et al. / Coastal Engineering 97 (2015) 78–90
Lee, J., Xing, X., 2007. Computer modeling for harbor planning and design. Handbook ofCoastal and Ocean Engineering. Scientific Publishing Company.
Longuet-Higgins, M.S., Stewart, R.W., 1962. Radiation stress and mass transport in gravitywaves, with application to ‘surf beats’. J. Fluid Mech. 13, 481–504.
Losada, I.J., Gonzalez-Ondina, J.M., Diaz-Hernandez, G., Gonzalez, E.M., 2008. Numericalmodeling of nonlinear resonance of semi-enclosed water bodies: description andexperimental validation. Coast. Eng. 55, 21–34.
Minguez, R., Espejo, A., Tomas, A., Mendez, F.J., Losada, I.J., 2011. Directional calibration ofwave reanalysis databases using instrumental data. J. Atmos. Ocean. Technol. 28,1466–1485.
Minguez, R., Reguero, B.G., Luceño, A., Mendez, F.J., 2013. Regression models for outlieridentification (hurricanes and typhoons) in wave hindcast databases. J. Atmos.Ocean. Technol. 29, 267–285.
van der Molen, W., 2006. Behaviour of moored ships in harbours. (PhD thesis). Delft,p. 140.
Muliawan,M.J., G., Z., M., T., 2013. Application of the contour linemethod for estimating ex-treme responses in the mooring lines of a two-body floating wave energy converter.J. Offshore Mech. Arct. Eng. 135, 0892–7219.
Munk, W.H., 1949. Surf beats. AGU 30, 849–854.Naciri, M., Buchner, B., Bunnik, T., Huijsmans, R., Andrews, J., 2006. Low frequency
motions of lng carriers moored in shallow water. 23rd International Conference onOffshore Mechanics and Arctic Engineering 3, pp. 995–1006.
NOAA, 2006. Etopo2v2 global gridded 2-minute database. National Geophysical DataCenter.
Okihiro, M., Guza, R.T., Seymour, R.J., 1992. Bound infragravity waves. J. Geophys. Res. 97,11453–11469.
Okihiro, M., Guza, R.T., Seymour, R.J., 1993. Excitation of seiche observed in a small harbor.J. Geophys. Res. 98, 18201–18211.
Okihiro, M., Guza, R.T., 1996. Observations of seiche forcing and amplification in threesmall harbors. J. Waterw. Port Coast. Ocean Eng. 122, 232–238.
Oltman-Shay, J., Guza, R.T., 1987. Infragravity edge wave observations on two Californiabeaches. J. Phys. Oceanogr. 17, 644–663.
Ottesen-Hansen, N.W., 1978. Long period waves in natural wave trains. Hydrodynamicand Hydraulic Engineering, Technical Univ. of Denmark. 46, pp. 13–24.
Reguero, B.G., Menéndez, M., Méndez, F.J., Mínguez, R., Losada, I.J., 2012. A global oceanwave (GOW) calibrated reanalysis from 1948 onwards. Coast. Eng. 65, 38–55.
Roelvink, J.A., Stive, M.J.F., 1989. Bar-generating cross-shore flowmechanisms on a beach.J. Geophys. Res. 94, 4785–4800.
Sand, S.E., 1982a. Long waves in directional seas. Coast. Eng. 6, 195–208.Sand, S.E., 1982b. Wave grouping described by bounded long waves. Ocean Eng. 9,
567–580.Sharma, J., Dean, R., 1979. Development and evaluation of a procedure for simulating a
random directional second order sea surface and associated wave forces. Oceanengineering report. University of Delaware.
Symonds, G., Huntley, D.A., Bowen, A.J., 1982. Two-dimensional surf beat: long wavegeneration by a time-varying breakpoint. J. Geophys. Res. 87, 492–498.
Tolman, H., 2002. User manual and system documentation of wavewatch-iii version 2.22.September NOAA/NWS/NCEP Technical Note.
Tucker, M., 1950. Surf beats: sea waves of 1 to 5 min. period. Proc. R. Soc. Lond. 202,565–573.
Further Reading
Funke, E.R., Mansard, E.P.D., 1979. On the synthesis of realistic sea states in a laboratoryflume. Report LTR-HY-66 of the Division of Mechanical Engineering. NationalResearch Council, Canada.
Mase, H., Iwagaki, Y., 1986. Wave group property of wind waves from modulationalinstability. Coast. Eng. Proc. 1.