Air quality in Italian small harbours: a proposed assessment methodology
12
1 23 Rendiconti Lincei SCIENZE FISICHE E NATURALI ISSN 2037-4631 Volume 24 Number 4 Rend. Fis. Acc. Lincei (2013) 24:309-318 DOI 10.1007/s12210-013-0254-0 Air quality in Italian small harbours: a proposed assessment methodology Davide Astiaso Garcia, Federico Cinquepalmi & Fabrizio Cumo
Transcript of Air quality in Italian small harbours: a proposed assessment methodology
1 23
Rendiconti LinceiSCIENZE FISICHE E NATURALI ISSN 2037-4631Volume 24Number 4 Rend. Fis. Acc. Lincei (2013) 24:309-318DOI 10.1007/s12210-013-0254-0
Air quality in Italian small harbours: aproposed assessment methodology
Davide Astiaso Garcia, FedericoCinquepalmi & Fabrizio Cumo
1 23
Your article is protected by copyright and
all rights are held exclusively by Accademia
Nazionale dei Lincei. This e-offprint is for
personal use only and shall not be self-
archived in electronic repositories. If you wish
to self-archive your article, please use the
accepted manuscript version for posting on
your own website. You may further deposit
the accepted manuscript version in any
repository, provided it is only made publicly
available 12 months after official publication
or later and provided acknowledgement is
given to the original source of publication
and a link is inserted to the published article
on Springer's website. The link must be
accompanied by the following text: "The final
publication is available at link.springer.com”.
Air quality in Italian small harbours: a proposed assessmentmethodology
Davide Astiaso Garcia • Federico Cinquepalmi •
Fabrizio Cumo
Received: 4 July 2013 / Accepted: 11 August 2013 / Published online: 31 August 2013
� Accademia Nazionale dei Lincei 2013
Abstract The main objective of this paper is to present
an analytical and easy-to-use method for evaluating the
presence of air pollutants in small harbour areas along the
Italian shores, and the potential exposure of workers to that
risk. The research aims to highlight the possible differences
in air quality characterization among different areas and
periods of any analysed harbour. Therefore, the proposed
method foresees a seasonal monitoring of some atmo-
spheric pollutants within examined ports, identifying
wherever possible the main source of air pollution for each
zone. In particular, to pinpoint the most critical areas, the
methodology foresees the monitoring of concentrations for
some selected pollutants such as volatile organic com-
pounds, particular matter and benzene. The methodology,
developed within the framework of a research project
supported by the Regional Authority of Lazio, has been
tested in four pilot port areas. The acquired results point
out that air pollutant concentrations could significantly
diverge among different areas and periods of a single
harbour and, consequentially, the evaluation of the results
allows a spatial and temporal comparison of pollutants
concentrations in each portal zone. Thus, the described
method represents a useful tool for local administrations to
plan best practices and the use of the best available tech-
nologies for impact mitigation, with the final goal of
reducing air pollution in the most critical portal zones.
Keywords Outdoor maritime air pollution
monitoring � Volatile organic compounds � Particular
matter � Air quality in harbours � Emissions � GIS
database
1 Introduction
Air quality in portal areas is seriously compromised by
many atmospheric pollutants coming from different sour-
ces, such as ground vehicles, fishing boats, recreational
boats, ferries, hydrofoils and merchant ships. More spe-
cifically, emissions of ships have been shown to contribute
significantly to air pollution in harbours (Saxe and Larsen
2004; Schrooten et al. 2009), causing for harbour workers a
generally high exposition to poor air quality (Georgieva
et al. 2007; Marr et al. 2007).
The International Maritime Organization (IMO) has
developed guidelines for the prevention of air pollution
coming from shipping activities, establishing a monitoring
programme for reducing emissions in atmosphere, finalized
to the improvement of air quality in portal areas (IMO
2008).
Some pollutants, such as CO2, NOx, SO2, CO, particu-
late matter, metals and a wide range of volatile organic
compounds (VOCs), are generated by the engine combus-
tions; moreover there are many other typologies of
D. Astiaso Garcia (&)
DIAEE (Dipartimento di Ingegneria. Astronautica, Elettrica ed
Energetica, Department of Astronautical, Electrical and Energy
Engineering), Universita ‘‘La Sapienza’’, Roma, Corso Vittorio
Emanuele II 244, 00186 Rome, Italy
e-mail: [email protected]
F. Cinquepalmi
Ministero dell’Istruzione, dell’Universita e della Ricerca-
Direzione Generale per l’Internazionalizzazione della Ricerca,
Piazza J.F. Kennedy 20, 00144 Rome, Italy
F. Cumo
CITERA (Centro Interdipartimentale Territorio Edilizia,
Restauro, Ambiente - Interdepartmental Centre for Territory,
Housing, Heritage and Environment), Universita ‘‘La Sapienza’’,
Roma, Corso Vittorio Emanuele II 244, 00186 Rome, Italy
123
Rend. Fis. Acc. Lincei (2013) 24:309–318
DOI 10.1007/s12210-013-0254-0
Author's personal copy
pollutants, such as radicals, ozone (O3), peroxy radicals
and aldehydes, indirectly generated due to photochemical
reactions in gaseous phase which are usually produced
under conditions of strong solar radiation, low humidity
and high temperatures.
All these pollutants emitted by ships impact human
health (Corbett et al. 2007) and influence acidification and
eutrofization of water and soil in coastal regions (Derwent
et al. 2005).
Among atmospheric particulate matter, particles smaller
than 10 lm, called PM10, are the most dangerous for
human health, since these suspended particles can deeply
penetrate into the gas exchange regions of the lung, pro-
voking asthma, lung cancer, and other cardiovascular and
respiratory diseases (MacNee and Donaldson 2003; Med-
ina-Ramon et al. 2006). Considering PM10 pollution in
harbours, the particulate matters can be trapped in land–sea
breeze circulations (Bouchlaghem et al. 2007; Rimetz-
Planchon et al. 2008).
VOCs include both hydrocarbons containing carbon and
hydrogen as the only elements (alkenes and aromatic
compounds) and compounds containing also oxygen,
chlorine or other elements, such as aldehydes, ethers,
alcohols, esters, chlorofluorocarbons (CFCs) and hydro-
chlorofluorocarbons (HCFCs). VOCs seem to play a key
role in climate changes (Murrells and Derwent 2007)
contributing to ozone formation in the troposphere (Hu
et al. 2012).
Among VOCs, benzene increases the risk of cancer and
other acute and chronic health effects (Jamall and Willhite
2008); indeed, it has been identified as a Class A carcin-
ogenic by the US Environmental Protection Agency.
In the light of this, the aim of the present research was to
elaborate a simple method for identifying areas and periods
where the concentration of air pollutions was higher.
The elaboration of analytical methods for air quality
monitoring in portal areas is included in the strategy
recommended by the European Sea Port Organisation to
increase environmental awareness and to improve
environmental monitoring in European harbours (ESPO
2003).
2 Methods
Almost all the atmospheric pollutants in harbour zones
come from combustion processes in vehicles and boat
engines (Schrooten et al. 2008). In portal areas, usually
there are many different engines with different fuel typol-
ogies: cars, camions, forklifts, ferryboats, hydrofoils, big
and small fishing boats and recreational boats (pleasure
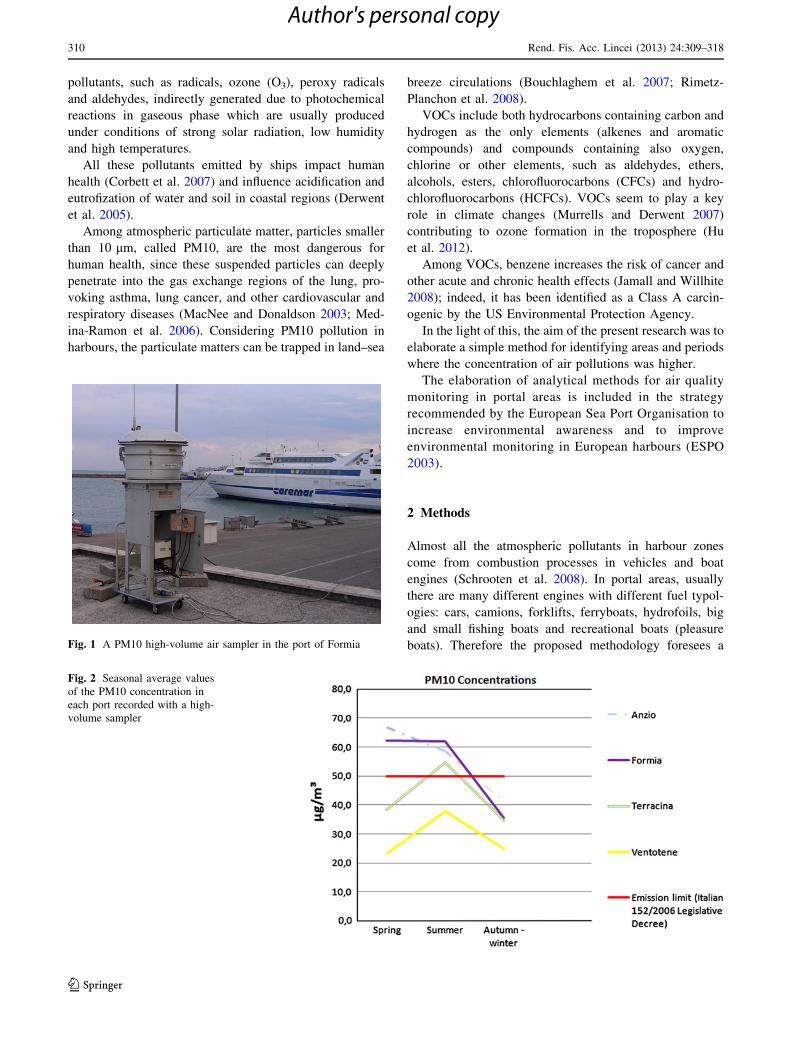
boats). Therefore the proposed methodology foresees aFig. 1 A PM10 high-volume air sampler in the port of Formia
Fig. 2 Seasonal average values
of the PM10 concentration in
each port recorded with a high-
volume sampler
310 Rend. Fis. Acc. Lincei (2013) 24:309–318
123
Author's personal copy
primary subdivision within portal areas in different zones
according to the main source of air pollutants.
Considering a typical portal area, the methodology
proposes the identification of the following different zones:
pleasure boats for leisure, fishing boats and passenger ships
such as ferry boats and hydrofoils.
Furthermore, the seasonality of some harbour activities
is another parameter to be considered for the assessment of
air quality in portal areas. Indeed, in the same portal zones,
the concentrations of air pollutants may change signifi-
cantly depending on the intensity of portal activities in a
given season. Since in autumn and winter the intensity of
portal activities is almost the same, to simplify the data
gathering work, autumn and winter can be analysed jointly.
Considering these spatial and temporal partitions, the
application of the proposed methodology will allow com-
parative analysis of air quality inside each examined port,
identifying zones and seasons where the pollutant con-
centration is higher. Therefore, it will be possible to pin-
point the most critical zones of each port in each different
season and consequentially to plan specific actions for
improving air quality in those areas.
To elaborate an easy-to-use method, we propose the
monitoring of few selected pollutants: PM10, the total
amount of VOCs concentrations and benzene. This method
does not consider SO2 analysis because these concentra-
tions were found to decrease significantly (average
decrease of 66 %) from 2009 to 2010 in three out of the
four EU harbours (Schembari et al. 2012), since from
January 1, 2010, a European Union directive requires that
all ships at berth or anchorage in European harbours use
fuels with a sulphur content of less than 0.1 % by weight,
while previously, outside of sulphur emission control areas,
up to 4.5 % was allowed. In fact, the monitoring of these
contaminants is adequate to obtain an air quality index
(Odabasi et al. 2005) as well as to compare air pollution
data of different areas.
Considering the VOCs monitoring, the total VOC con-
centration derives from the sum of all the following VOC
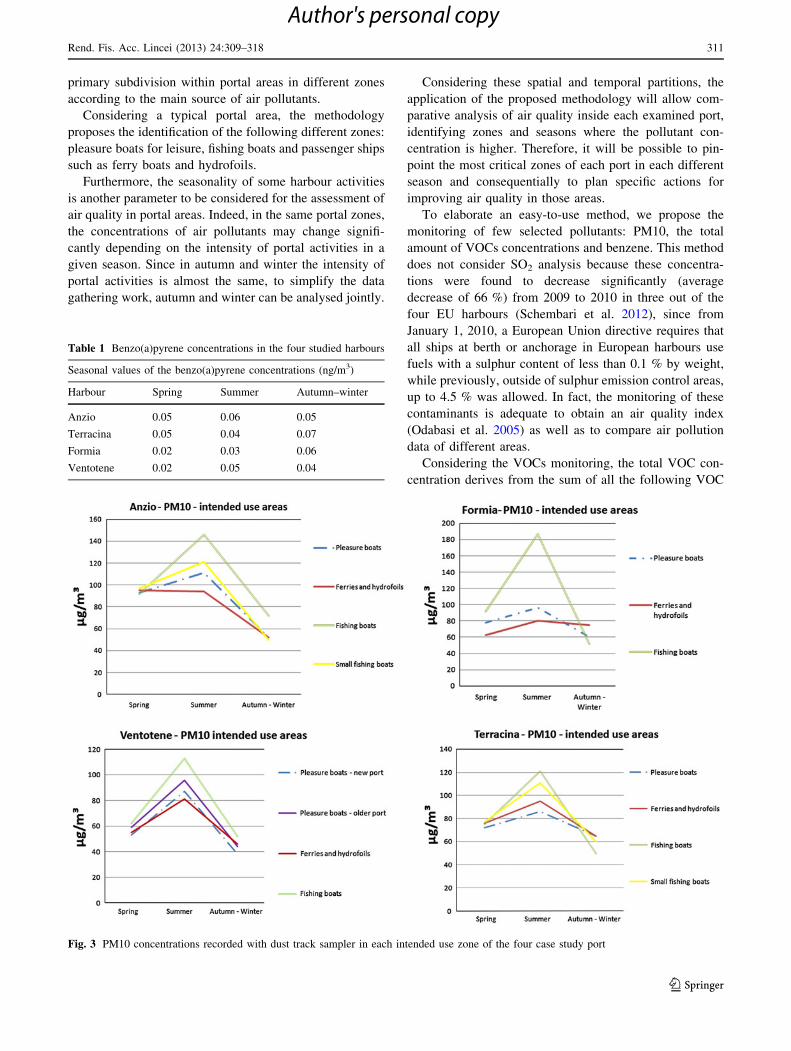
Table 1 Benzo(a)pyrene concentrations in the four studied harbours
Seasonal values of the benzo(a)pyrene concentrations (ng/m3)
Harbour Spring Summer Autumn–winter
Anzio 0.05 0.06 0.05
Terracina 0.05 0.04 0.07
Formia 0.02 0.03 0.06
Ventotene 0.02 0.05 0.04
Fig. 3 PM10 concentrations recorded with dust track sampler in each intended use zone of the four case study port
Rend. Fis. Acc. Lincei (2013) 24:309–318 311
123
Author's personal copy
sources: dichloromethane; 2-methylpentane; hexane;
methylcyclopentane; chloroform; 2-methylhexane; cyclo-
hexane; benzene; heptane; trichloroethylene; methylcy-
clohexane; toluene; tetrachloroethylene; ethylbenzene;
m- p- xylene; o-xylene; 1,2,4-trimethylbenzene; 1,2-
dichlorobenzene.
The concentrations of these substances should be sam-
pled leaving many radial diffusive samplers called ‘‘Radi-
ello �’’ (Bruno et al. 2008) for a period ranging between 7
and 10 days per season.
To have a reference value to define the ‘‘minimum’’
VOCs and benzene pollution of each port, a Radiello
should be placed in the farthest zone from every detectable
sources of pollutant emissions, which usually is the end of
the breakwater, during the season with lower portal activity
(usually winter).
On the other hand, considering PM10 concentrations,
the reference value should be assessed for each port in each
season using a PM10 high-volume (HV) air sampler
(Fig. 1), giving an average value of daily PM concentra-
tions. Samples were taken on random days for 24 consec-
utive hours (Contini et al. 2012).
The use of HV samplers allows the elaboration of
chemical analysis measuring also polycyclic aromatic
hydrocarbon (PAH) concentrations. In particular, ben-
zo(a)pyrene pollution was analysed.
Moreover, PM10 concentrations in any intended use
area of an analysed port should be gathered using optical
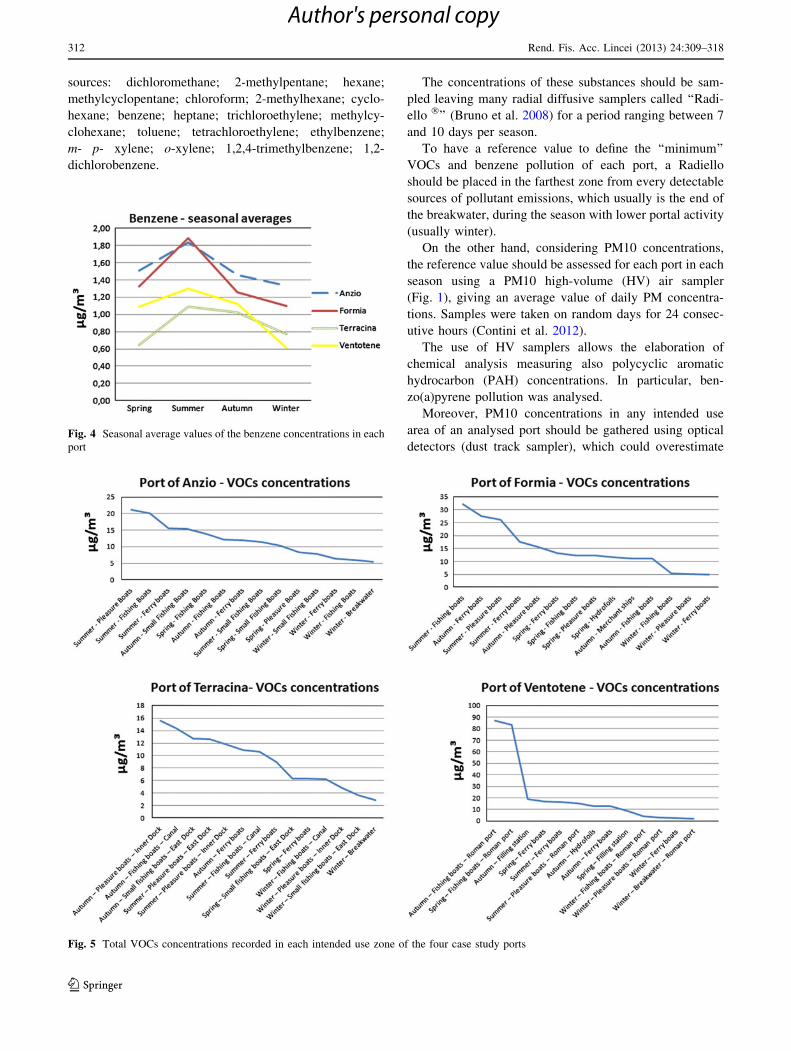
detectors (dust track sampler), which could overestimateFig. 4 Seasonal average values of the benzene concentrations in each
port
Fig. 5 Total VOCs concentrations recorded in each intended use zone of the four case study ports
312 Rend. Fis. Acc. Lincei (2013) 24:309–318
123
Author's personal copy
PM10 concentrations but represents a useful instrument for
a spatial and temporal comparison of particulate matter
pollution without great sampling efforts (Contini et al.
2011; Stein et al. 2011; Kinghama et al. 2006). In fact, a
dust track sampler is highly portable (handheld) and allows
a real-time monitoring of PM10 concentrations.
Each dust sampling lasted five consecutive hours and
was realized by means of mobile platforms in fixed posi-
tions. The collected data were averaged using dust track
monitors which run at 1 s resolution.
3 Results
To validate this simple methodology, four ports of the
Lazio region were selected as case studies: Anzio, Formia,
Terracina and Ventotene harbours located in the centre of
Italy, where annual field data were gathered for detecting
VOCs, benzene and PM10 concentrations during the years
2010 and 2011.
As foreseen, each port was divided into subareas according
to its different intended use zones; then in each zone a data
gathering campaign was carried out in all seasons for VOCs
and benzene, while for PM10 pollution a single data collec-
tion was done during autumn and winter. The overall sam-
pling campaign was done by employing one instrumental
setup for each harbour, to have synchronous measurements of
the four study areas. All the obtained pollutant concentrations
were compared spatially and seasonally to pinpoint intended
use areas and seasons where air pollution was higher.
Figure 2 shows the reference values of each port in each
season obtained with the HV air sampler. The results show
that the temporal trend of PM concentration is the same in
the ports of Terracina and Ventotene, with the highest air
pollution in summer, while during spring and summer
months PM10 concentrations were similar in the ports of
Anzio and Formia; furthermore, in each port the lower
concentration data were recorded during autumn and win-
ter. Lastly, these results evidence that Anzio and Formia
are the ports with higher PM10 concentrations.
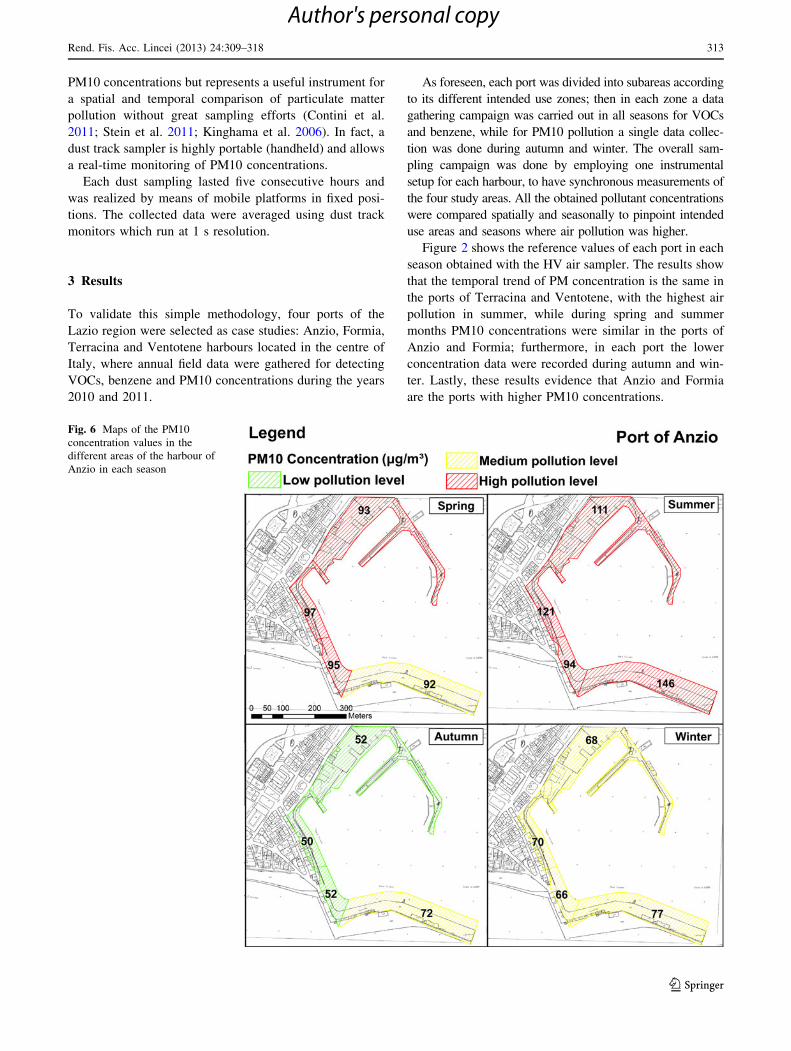
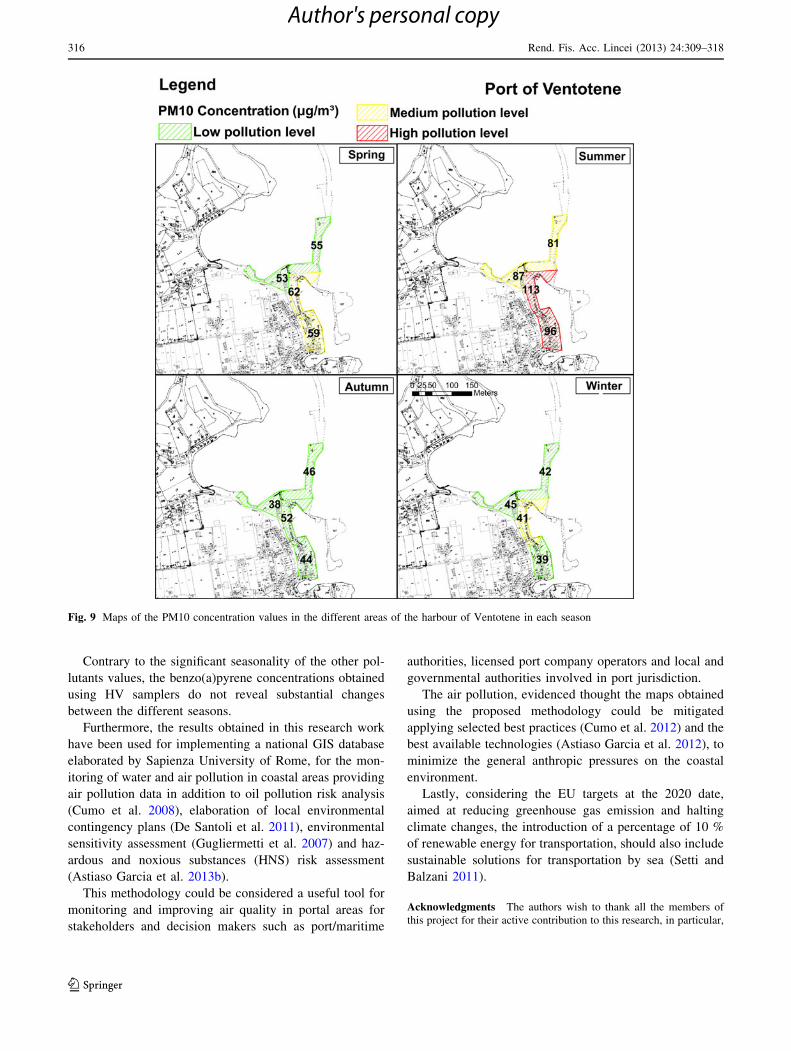
Fig. 6 Maps of the PM10
concentration values in the
different areas of the harbour of
Anzio in each season
Rend. Fis. Acc. Lincei (2013) 24:309–318 313
123
Author's personal copy
Considering the PAHs concentrations, Table 1 shows
the values of benzo(a)pyrene in the four studied harbours.
Figure 3 summarizes the PM10 concentration monitor-
ing results recorded seasonally in each intended use zone of
the four examined ports with a dust track instrument. These
results confirm the same temporal trends obtained with the
high-volume air sampler, with the highest pollution levels
during summer. Moreover, with regard to the spatial
comparison of the different intended use areas inside each
port, the fishing boat zone is the area with lower air quality
of all the examined ports. The ports of Anzio and Formia
(Fig. 3) show a different seasonality from that reported in
Fig. 4 These differences could be attributed to some par-
ticular ongoing activities during dust track sampling.
With regard to benzene concentrations, Fig. 4 shows the
seasonal averages for each port, corroborating the same
comparison of PM10 monitoring.
Moreover, the sum of all the 18 VOC concentrations
recorded during each data gathering campaign was com-
pared to rank in each port the intended use areas and the
seasons according to their VOCs pollution (Fig. 5). These
results provide a comparative analysis of VOC concen-
trations in each port between any intended use zone and
the area with lower VOCs pollution (the end of the
breakwater) during the winter, when portal activities are
reduced. In particular, Fig. 5 shows that VOC concen-
trations vary significantly inside each analysed port. In
Anzio and Formia harbours, the highest concentrations are
four to six times greater than the lower ones in the
same ports; this is even more evident in the port of
Ventotene where VOCs concentrations range between 2
and 88 lg/m3.
The use of a geographic information system (GIS) was
considered the best tool, not only for geo-referencing the
recovered environmental data, but also for producing maps
for informing local stakeholders and decision makers about
the environmental monitoring and the potential risk (Gi-
ordano et al. 2013; Astiaso Garcia et al. 2013a; Testi et al.
2007). All results were recorded in a GIS database, con-
taining a comparative spatial analysis of pollutant
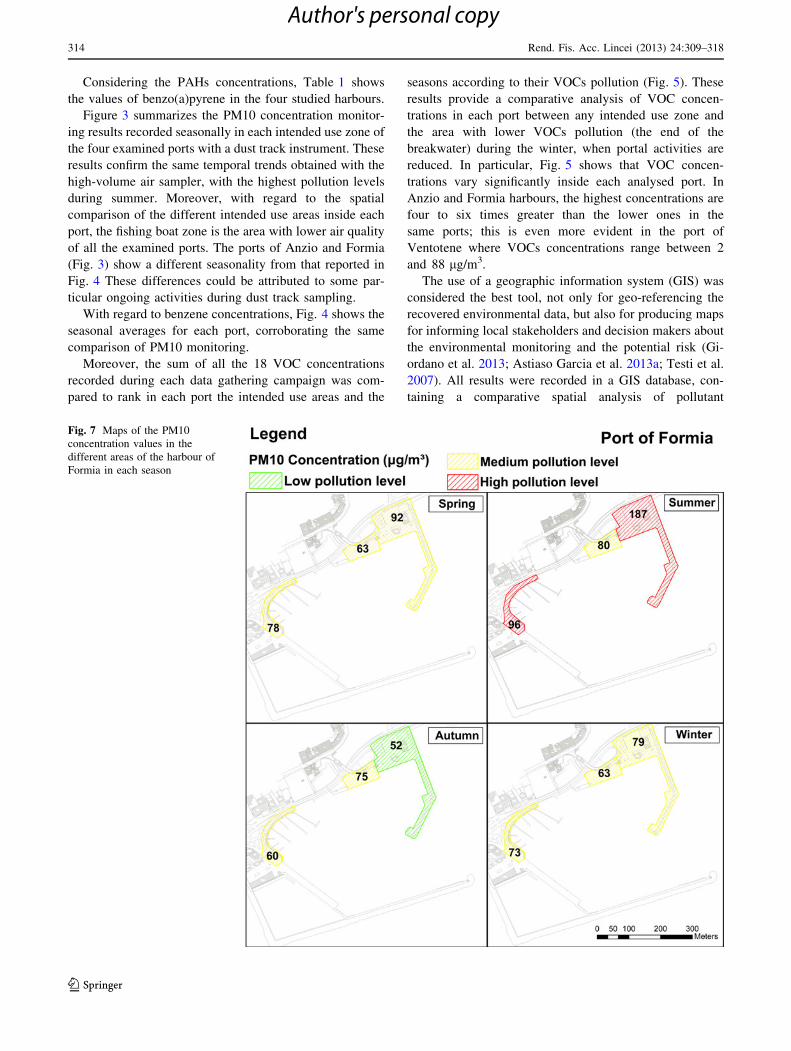
Fig. 7 Maps of the PM10
concentration values in the
different areas of the harbour of
Formia in each season
314 Rend. Fis. Acc. Lincei (2013) 24:309–318
123
Author's personal copy
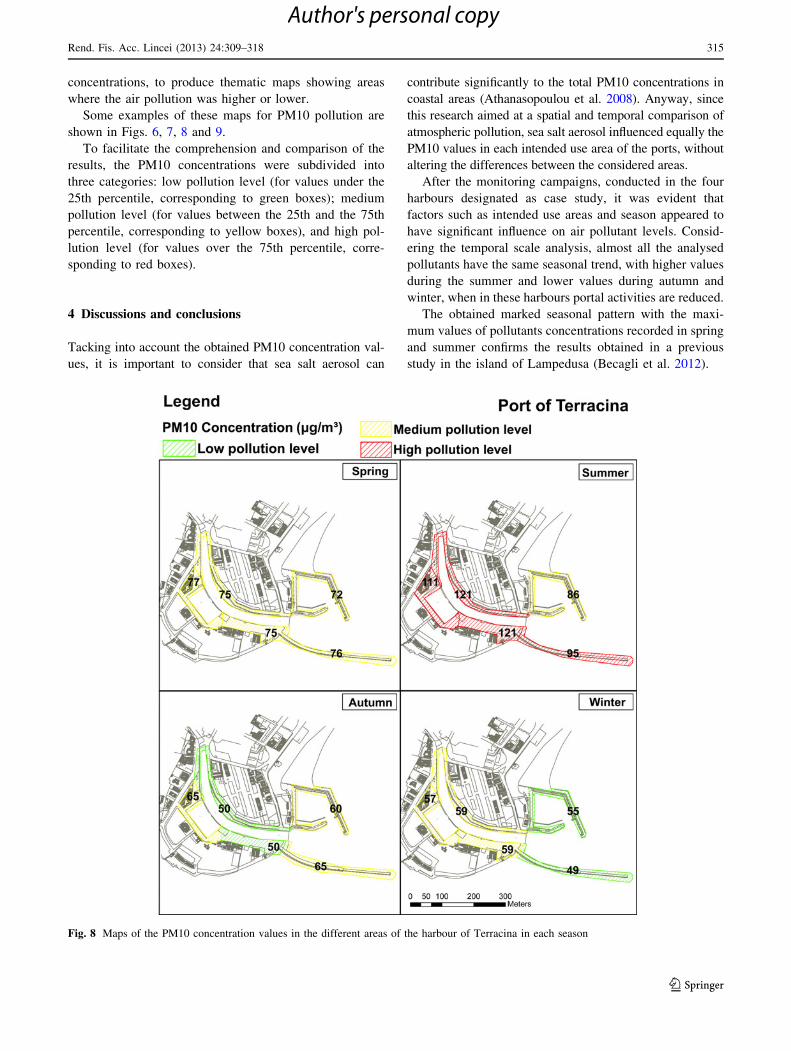
concentrations, to produce thematic maps showing areas
where the air pollution was higher or lower.
Some examples of these maps for PM10 pollution are
shown in Figs. 6, 7, 8 and 9.
To facilitate the comprehension and comparison of the
results, the PM10 concentrations were subdivided into
three categories: low pollution level (for values under the
25th percentile, corresponding to green boxes); medium
pollution level (for values between the 25th and the 75th
percentile, corresponding to yellow boxes), and high pol-
lution level (for values over the 75th percentile, corre-
sponding to red boxes).
4 Discussions and conclusions
Tacking into account the obtained PM10 concentration val-
ues, it is important to consider that sea salt aerosol can
contribute significantly to the total PM10 concentrations in
coastal areas (Athanasopoulou et al. 2008). Anyway, since
this research aimed at a spatial and temporal comparison of
atmospheric pollution, sea salt aerosol influenced equally the
PM10 values in each intended use area of the ports, without
altering the differences between the considered areas.
After the monitoring campaigns, conducted in the four
harbours designated as case study, it was evident that
factors such as intended use areas and season appeared to
have significant influence on air pollutant levels. Consid-
ering the temporal scale analysis, almost all the analysed
pollutants have the same seasonal trend, with higher values
during the summer and lower values during autumn and
winter, when in these harbours portal activities are reduced.
The obtained marked seasonal pattern with the maxi-
mum values of pollutants concentrations recorded in spring
and summer confirms the results obtained in a previous
study in the island of Lampedusa (Becagli et al. 2012).
Fig. 8 Maps of the PM10 concentration values in the different areas of the harbour of Terracina in each season
Rend. Fis. Acc. Lincei (2013) 24:309–318 315
123
Author's personal copy
Contrary to the significant seasonality of the other pol-
lutants values, the benzo(a)pyrene concentrations obtained
using HV samplers do not reveal substantial changes
between the different seasons.
Furthermore, the results obtained in this research work
have been used for implementing a national GIS database
elaborated by Sapienza University of Rome, for the mon-
itoring of water and air pollution in coastal areas providing
air pollution data in addition to oil pollution risk analysis
(Cumo et al. 2008), elaboration of local environmental
contingency plans (De Santoli et al. 2011), environmental
sensitivity assessment (Gugliermetti et al. 2007) and haz-
ardous and noxious substances (HNS) risk assessment
(Astiaso Garcia et al. 2013b).
This methodology could be considered a useful tool for
monitoring and improving air quality in portal areas for
stakeholders and decision makers such as port/maritime
authorities, licensed port company operators and local and
governmental authorities involved in port jurisdiction.
The air pollution, evidenced thought the maps obtained
using the proposed methodology could be mitigated
applying selected best practices (Cumo et al. 2012) and the
best available technologies (Astiaso Garcia et al. 2012), to
minimize the general anthropic pressures on the coastal
environment.
Lastly, considering the EU targets at the 2020 date,
aimed at reducing greenhouse gas emission and halting
climate changes, the introduction of a percentage of 10 %
of renewable energy for transportation, should also include
sustainable solutions for transportation by sea (Setti and
Balzani 2011).
Acknowledgments The authors wish to thank all the members of
this project for their active contribution to this research, in particular,
Fig. 9 Maps of the PM10 concentration values in the different areas of the harbour of Ventotene in each season
316 Rend. Fis. Acc. Lincei (2013) 24:309–318
123
Author's personal copy
Dr. Federica Barbanera, Dr. Daniele Bruschi and Dr. Teresita Gra-
vina. We also wish to thank Dr. Sergio Fuselli, Dr. Marco De Felice
and Dr. Roberta Morlino of the Istituto Superiore di Sanita (ISS)
(Superior Health Institute) for their major contribution in providing
tools and analysis for VOC concentration monitoring. We specially
thank the whole staff of Anzio, Formia and Terracina Coast Guards
for supporting out team during the data gathering works in their portal
areas. Finally, the whole research group wishes to thank the Regione
Lazio, Dipartimento Istituzionale e Territorio, Direzione Regionale
Trasporti–Area Porti for the financial contribution to this project.
References
Astiaso Garcia D, Cumo F, Sforzini V (2012) Eco friendly service
buildings for sustainable tourism and environmental awareness
in protected areas. WIT Transactions on Ecology and the
Environ 161:323–330. doi:10.2495/ST120261
Astiaso Garcia D, Cumo F, Gugliermetti F, Rosa F (2013a)
Hazardous and Noxious Substances (HNS) Risk Assessment
along the Italian Coastline. Chem Eng Trans 32:115–120. doi:10.
3303/CET1332020
Astiaso Garcia D, Bruschi D, Cinquepalmi F, Cumo F (2013b) An
estimation of urban fragmentation of natural habitats: case
studies of the 24 Italian national parks. Chem Eng Trans
32:49–54. doi:10.3303/CET1332009
Athanasopoulou E, Tombrou M, Pandis SN, Russell AG (2008) The
role of sea-salt emissions and heterogeneous chemistry in the air
quality of polluted coastal areas. Atmos Chem Phys
8:5755–5769
Becagli S, Sferlazzo DM, Pace G, Di Sarra A, Bommarito C, Calzolai
G, Ghedini C, Lucarelli F, Meloni D, Monteleone F, Severi M,
Traversi R, Udisti R (2012) Evidence for heavy fuel oil
combustion aerosols from chemical analyses at the Island of
Lampedusa: a possible large role of ships emissions in the
Mediterranean. Atmos Chem Phys 12:3479–3492. doi:10.5194/
acp-12-3479-2012
Bouchlaghem K, Mansour FB, Elouragini S (2007) Impact of a sea
breeze event on air pollution at the Eastern Tunisian Coast.
Atmos Res 86:162–172. doi:10.1016/j.atmosres.2007.03.010
Bruno P, Caselli M, De Gennaro G, Scolletta L, Trizio L, Tutino M
(2008) Assessment of the Impact Produced by the Traffic Source
on VOC Level in the Urban Area of Canosa di Puglia (Italy).
Water, Air, and Soil Pollut 193:37–50. doi:10.1007/s11270-008-
9666-3
Contini D, Gambaro A, Belosi F, De Pieri S, Cairns WR, Donateo A,
Zanotto E, Citron M (2011) The direct influence of ship traffic on
atmospheric PM2.5, PM10 and PAH in Venice. J Environ
Manage 92:2119–2129. doi:10.1016/j.jenvman.2011.01.016
Contini D, Belosi F, Gambaro A, Cesari D, Stortini AM, Bove MC
(2012) Comparison of PM10 concentrations and metal content in
three different sites of the Venice Lagoon: an analysis of
possible aerosol sources. J Environ Sci 24:1954–1965
Corbett JJ, Winebrake JJ, Green EH, Kasibhatla P, Eyring V, Lauer A
(2007) Mortality from Ship Emissions: a Global Assessment.
Environ. Sci. Technol. 41:8512–8518. doi:10.1021/es071686z
Cumo F, Cinquepalmi F, Astiaso Garcia D (2008) Data gathering
guidelines for the mapping of environmental sensitivity to oil
spill of the Italian coastlines. WIT Transaction on the Built
Environ 99:119–125. doi:10.2495/CENV080111
Cumo F, Astiaso Garcia D, Calcagnini L, Rosa F, Sferra AS (2012)
Urban policies and sustainable energy management. Sustainable
Cities and Society 4(2012):29–34. doi:10.1016/j.scs.2012.03.003
De Santoli L, Cumo F, Astiaso Garcia D, Bruschi D (2011) Coastal
and marine impact assessment for the development of an oil spill
contingency plan: the case study of the east coast of Sicily. WIT
Transaction on Ecology and the Environ 149:285–296. doi:10.
2495/CP110241
Derwent R, Stevenson DS, Doherty RM, Collins WJ, Sanderson MG,
Amann M, Dentener F (2005) The contribution from ship
emissions to air quality and acid deposition in Europe. Ambio
34:54–59
ESPO European Sea Port Organisation (2003) Environmental code of
practice. http://www.danskehavne.dk/menu/politik%e2%80%93lov/
Love%2c%2bbekendtg%25C3%25B8relser%2c%2bvejledninger/
Milj%25C3%25B8omr%25C3%25A5det/environm_code_of_
practice.pdf. Accessed 11 June 2013
Georgieva E, Canepa E, Builtjes P (2007) Harbours and air quality.
Atmos Environ 41:6319–6321. doi:10.1016/j.atmosenv.2007.06.
041
Giordano L, Alberico I, Ferraro L, Marsella E, Lirer F, Di Fiore V
(2013) A new tool to promote sustainability of coastal zones.
The case of Sele plain, southern Italy. Rendiconti Lincei
24:113–126. doi:10.1007/s12210-013-0236-2
Gugliermetti F, Cinquepalmi F, Astiaso Garcia D (2007) The use of
environmental sensitivity indices (ESI) maps for the evaluation
of oil spill risk in Mediterranean coastlines and coastal waters.
WIT Transaction on Ecology and the Environ 102:593–600.
doi:10.2495/SDP070572
Hu J, Howard CJ, Mitloehner F, Green PG, Kleeman MJ (2012)
Mobile source and livestock feed contributions to regional ozone
formation in central California. Environ Sci Technol 46:2781–
2789. doi:10.1021/es203369p
IMO International Maritime Organisation (2008). Amendment MAR-
POL Annex IV; Reduction emissions from ships. Marine
Environment Protection Committee (MEPC), 57� Session
Jamall IJ, Willhite CC (2008) Is benzene exposure from gasoline
carcinogenic? J Environ Monit 10:176–187. doi:10.1039/
B712987D
Kinghama S, Duranda M, Aberkaneb T, Harrisona J, Wilsona J,
Eptonc M (2006) Winter comparison of TEOM, MiniVol and
DustTrak PM10 monitors in a woodsmoke environment. Atmos
Environ 40:338–347. doi:10.1016/j.atmosenv.2005.09.042
MacNee W, Donaldson K (2003) Mechanism of lung injury caused by
PM10 and ultrafine particles with special reference to COPD.
Eur Respir J Suppl 40:47–51
Marr IL, Rosser DP, Meneses CA (2007) An air quality survey and
emissions inventory at Aberdeen Harbour. Atmos Environ
41:6379–6395. doi:10.1016/j.atmosenv.2007.04.049
Medina-Ramon M, Zanobetti A, Schwartz J (2006) The Effect ofOzone and PM10 on Hospital Admissions for Pneumonia and
Chronic Obstructive Pulmonary Disease: a National Multicity
Study. Am J Epidemiol 163:579–588. doi:10.1093/aje/kwj078
Murrells T, Derwent R G (2007) Climate Change Consequences of
VOC Emission Controls. AEA Energy & Environment Report.
http://uk-air.defra.gov.uk/reports/cat07/0710011214_ED48749_
VOC_Incineration_-_CC_Report_v3.pdf. Accessed 11 June
2013
Odabasi M, Ongan O, Cetin E (2005) Quantitative analysis of volatile
organic compounds (VOCs) in atmospheric particles. Atmos
Environ 39:3763–3770. doi:10.1016/j.atmosenv.2005.02.48
Rimetz-Planchon J, Perdrix E, Sobanska S, Bremard C (2008) PM10
air quality variations in an urbanized and industrialized harbor.
Atmos Environ 42:7274–7283. doi:10.1016/j.atmosenv.2008.07.
005
Saxe H, Larsen T (2004) Air pollution from ships in three Danish
ports. Atmos Environ 38:4057–4067. doi:10.1016/j.scitotenv.
2004.03.055
Schembari C, Cavalli F, Cuccia E, Hjorth J, Calzolai G, Perez N, Pey
J, Prati P, Raes F (2012) Impact of a European directive on ship
emissions on air quality in Mediterranean harbours. Atmos
Rend. Fis. Acc. Lincei (2013) 24:309–318 317
123
Author's personal copy

Environ 61: 661–669. doi: http://dx.doi.org/10.1016/j.atmosenv.
2012.06.047
Schrooten L, De Vlieger I, Panis IL, Styns K, Torfs R (2008)
Inventory and forecasting of maritime emissions in the Belgian
sea territory, an activity-based emission model. Atmos Environ
42:667–676. doi:10.1016/j.atmosenv.2007.09.071
Schrooten L, De Vlieger I, Panis IL, Chiffi C, Pastori E (2009)
Emissions of maritime transport: a European reference system.
Sci Total Environ 408:318–323. doi:10.1016/j.scitotenv.2009.07.
037
Setti L, Balzani V (2011) Road Map towards an integrated energy
management system in Italy. Rendiconti Lincei 22:55–64.
doi:10.1007/s12210-010-0110-4
Stein AF, Wang Y, De La Rosa JD, Sanchez de la Campa AM, Castell
N, Draxler RR (2011) Modeling PM10 Originating from Dust
Intrusions in the Southern Iberian Peninsula Using HYSPLIT.
Wea Forecasting 26:236–242. doi:10.1175/WAF-D-10-05044.1
Testi A, Cara E, Fanelli G (2007) An example of realization of Gis
ecological maps derived from Ellenberg indicators in the
Biological Reserve of Donana National Park (Spain). Rendiconti
Lincei 18:49–66. doi:10.1007/BF02967144
318 Rend. Fis. Acc. Lincei (2013) 24:309–318
123
Author's personal copy
![#FacebookPA 2012 [Italian Version]](https://static.fdokumen.com/doc/165x107/6312f715fc260b71020ee117/facebookpa-2012-italian-version.jpg)