Proposed Strategic KPIs of KSU
83
“Developing Strategic KPIs of King Saud University”, King Saud University Research Report – Deanship of Quality DoQ # 1/2014, January – April 2014 G Deanship of Quality King Saud University Kingdom of Saudi Arabia Copyright © Teay Shawyun, Consultant to KSU – QMS, King Saud University, April 2014. Any reference to usage and citations can be stated as “Teay, Shawyun, (2014), Developing Strategic KPIs of King Saud University, King Saud University Research Report – Deanship of Quality DoQ # 1/2014, April 2014”
Transcript of Proposed Strategic KPIs of KSU
“Developing Strategic KPIs of King Saud
University”, King Saud University Research Report – Deanship of Quality DoQ # 1/2014, January –
April 2014 G
Deanship of Quality King Saud University
Kingdom of Saudi Arabia
Copyright © Teay Shawyun, Consultant to KSU – QMS, King Saud University, April 2014. Any reference to usage and citations can be stated as “Teay, Shawyun, (2014), Developing Strategic KPIs of King Saud University, King Saud University Research Report – Deanship of Quality DoQ # 1/2014, April 2014”

Research Report of KSU Key Performance Indicators Page 1 of 4
Proposed Strategic KPIs of KSU
This research study is aimed at identifying a set of strategic KPIs for KSU and is
supported by key secondary research as follows:
KSU 2030 Strategic Plan analysis (Appendix 3 and 4) that identified KSU
has 9 strategic objectives with no indication of any strategic or operational KPIs
being specified. This is also looked at within the incorporation of the comparative
performance of the colleges and in their “ranking” which identified 14 KPIs which
was also used as the basis to arrive at the KSU Strategic KPIs (Appendix 2 and 8).
Benchmarked universities in the KSU 2030 (Appendix 6) which identified
10 top tier benchmarked universities like Oxford, Cambridge, MIT, Stanford,
Harvard, UC Berkeley, U of Southern California, Tokyo University, NUS and
Tsinghua University. Of these only UC Berkeley has a strategic plan with 10
strategic KPIs and 60 specific KPIs. 3 universities like Oxford, Tokyo and USC
have strategic plans but no indications of KPIs specified. The rest like Harvard,
Stanford, MIT, Cambridge, NUS and Tsinghua do not have strategic plans posted
on their institutions’ webpage, but do have some that have schools’ or
administrative units’ strategic plans.
CUC (Committee of University Chairman, 2006) research reports that
recommended strategic KPIs that comprehensively addresses the HEI’s in key
areas of 1) Academic Character, 2) Financial health, assets and resources, 3) Staff,
Management and Governance, and 4) Governance. (Appendix 1 and 4) that
resulted in 10 key areas where KPIs are developed
The KPIs areas are also supported by the IES (Institute for
Employment Studies) and NatCen (National Center for Social and
Economic Research) report in November 2013 which listed 29 most cited or
widely used in order of 1) Value-added; 2) Employability and destinations
(employment rates / starting salary); 3) Quality of Research (research outputs /
funding); 4) Finance (financial performance / sustainability / efficiency); 5)
Widening participation / access; 6) Fair access; 7) Non-continuation /
Continuation; 8) Entry qualifications; 9) Admissions; 10) Demand; 11) Student
Satisfaction / experience; 12) Achievement / attainment (average awards); 13)
Learning and development in key areas; 14) Return on student loan investment /
value for money; 15) Course / Teaching quality; 16) Class size; 17) Contact and
study hours; 18) Postgraduate activity; 19) Estates, facilities and student services;
20) Entrepreneurship support; 21) Employment creation; 22) Industry
engagement; 23) Commercial activities; 24) Contribution to economic growth
and development regionally and nationally; 25) Public engagement and social /
community impact; 26) Knowledge Transfer; 27) Sustainability (environment
impact); 28) Administrative efficiency; and 29) Staffing.
Research Report of KSU Key Performance Indicators Page 2 of 4
Study of 11 universities strategic plans and their frequently cited or
listed KPIs that identified about 988 types of KPIs categorized into 18 areas
(Appendix 5 that were later consolidated into Appendix 4 with a list of illustrative
KPIs that were listed by the research and the universities studied) as follows:
o # 1 Student Focus / Student Experience and Teaching and Learning (216);
o # 2 Estates and Infrastructure (6) / Infrastructure and Technology (103
each = 206 in total) and Technology (34);
o # 3 Academic Profile and Market Position (7) and Education (Teaching
and Learning) (87);
o #4 Financial Health (86) and Institutional Stability (6);
o # 5 Research (90);
o # 6 Stakeholders/ Social / Society Engagement and Responsibilities (59);
o # 7 Faculty / Staff and HRD (51);
o # 8 Community and University Environment (48); and
o # 9 Others (Innovation – 12; Access / Affordability – 6; Diversity – 18)
totaling 36;
o # 10 Partnerships / Collaborations / Knowledge Transfer (19) and lastly
Governance, Leadership, Management, Planning (12)
Based on the above key research findings and the direction of KSU in its key areas as
identified in its KSU 2030, with the exception of Strategic objectives # 8 and 9, the key
areas where strategic KPIs can be identified and is proposed as an initial list with a total
of 32 potential KPIs. The details of the step-wise determination of the strategic KPIs of
KSU are reported in Appendix 3, 4 and 7. The detailed research report of the research
aim, research methodology and research findings and how these proposed 32 KPIs are
explained in Appendix 1.
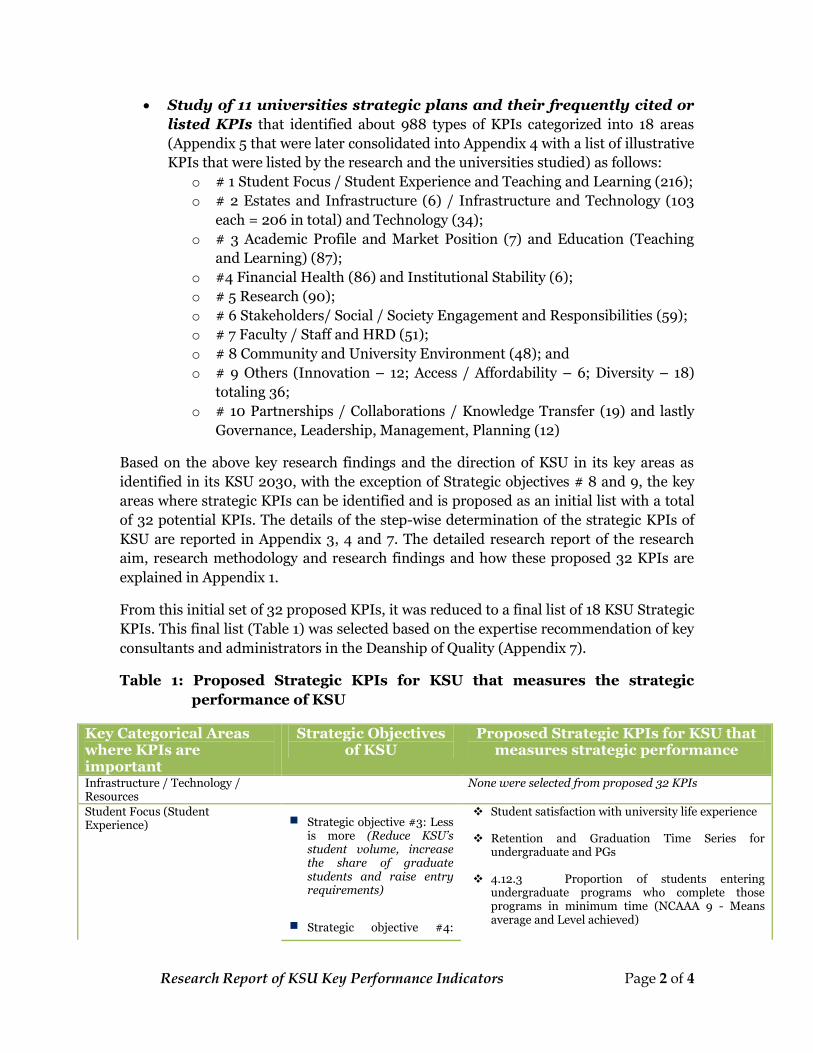
From this initial set of 32 proposed KPIs, it was reduced to a final list of 18 KSU Strategic
KPIs. This final list (Table 1) was selected based on the expertise recommendation of key
consultants and administrators in the Deanship of Quality (Appendix 7).
Table 1: Proposed Strategic KPIs for KSU that measures the strategic
performance of KSU
Key Categorical Areas where KPIs are important
Strategic Objectives of KSU
Proposed Strategic KPIs for KSU that measures strategic performance
Infrastructure / Technology / Resources
None were selected from proposed 32 KPIs
Student Focus (Student Experience) Strategic objective #3: Less
is more (Reduce KSU’s student volume, increase the share of graduate students and raise entry requirements)
Strategic objective #4:
Student satisfaction with university life experience
Retention and Graduation Time Series for undergraduate and PGs
4.12.3 Proportion of students entering undergraduate programs who complete those programs in minimum time (NCAAA 9 - Means average and Level achieved)
Research Report of KSU Key Performance Indicators Page 3 of 4
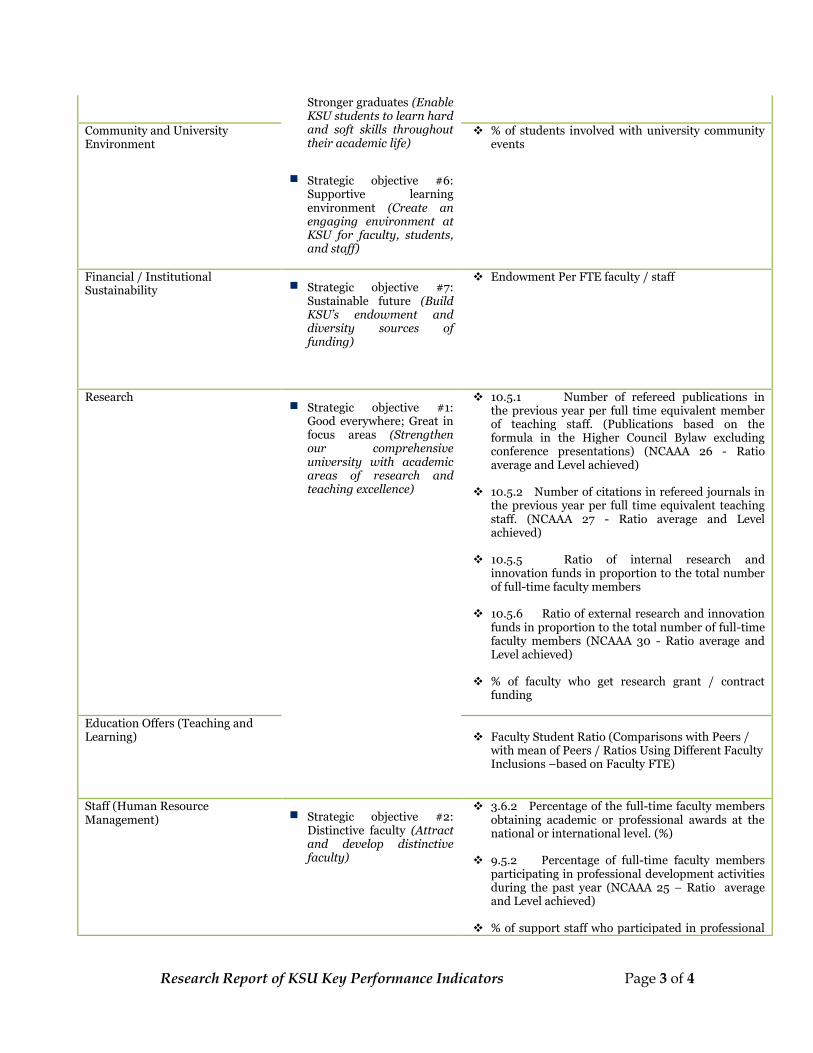
Stronger graduates (Enable KSU students to learn hard and soft skills throughout their academic life)
Strategic objective #6: Supportive learning environment (Create an engaging environment at KSU for faculty, students, and staff)
Community and University Environment
% of students involved with university community events
Financial / Institutional Sustainability Strategic objective #7:
Sustainable future (Build KSU’s endowment and diversity sources of funding)
Endowment Per FTE faculty / staff
Research Strategic objective #1:
Good everywhere; Great in focus areas (Strengthen our comprehensive university with academic areas of research and teaching excellence)
10.5.1 Number of refereed publications in the previous year per full time equivalent member of teaching staff. (Publications based on the formula in the Higher Council Bylaw excluding conference presentations) (NCAAA 26 - Ratio average and Level achieved)
10.5.2 Number of citations in refereed journals in the previous year per full time equivalent teaching staff. (NCAAA 27 - Ratio average and Level achieved)
10.5.5 Ratio of internal research and innovation funds in proportion to the total number of full-time faculty members
10.5.6 Ratio of external research and innovation funds in proportion to the total number of full-time faculty members (NCAAA 30 - Ratio average and Level achieved)
% of faculty who get research grant / contract funding
Education Offers (Teaching and Learning)
Faculty Student Ratio (Comparisons with Peers /
with mean of Peers / Ratios Using Different Faculty Inclusions –based on Faculty FTE)
Staff (Human Resource Management) Strategic objective #2:
Distinctive faculty (Attract and develop distinctive faculty)
3.6.2 Percentage of the full-time faculty members obtaining academic or professional awards at the national or international level. (%)
9.5.2 Percentage of full-time faculty members participating in professional development activities during the past year (NCAAA 25 – Ratio average and Level achieved)
% of support staff who participated in professional

Research Report of KSU Key Performance Indicators Page 4 of 4
developmental activities related to their work area
Internationalization Strategic objective #5:
Building bridges (Build bridges among KSU constituencies and externally with local and international groups)
Number of international visiting faculty scholar
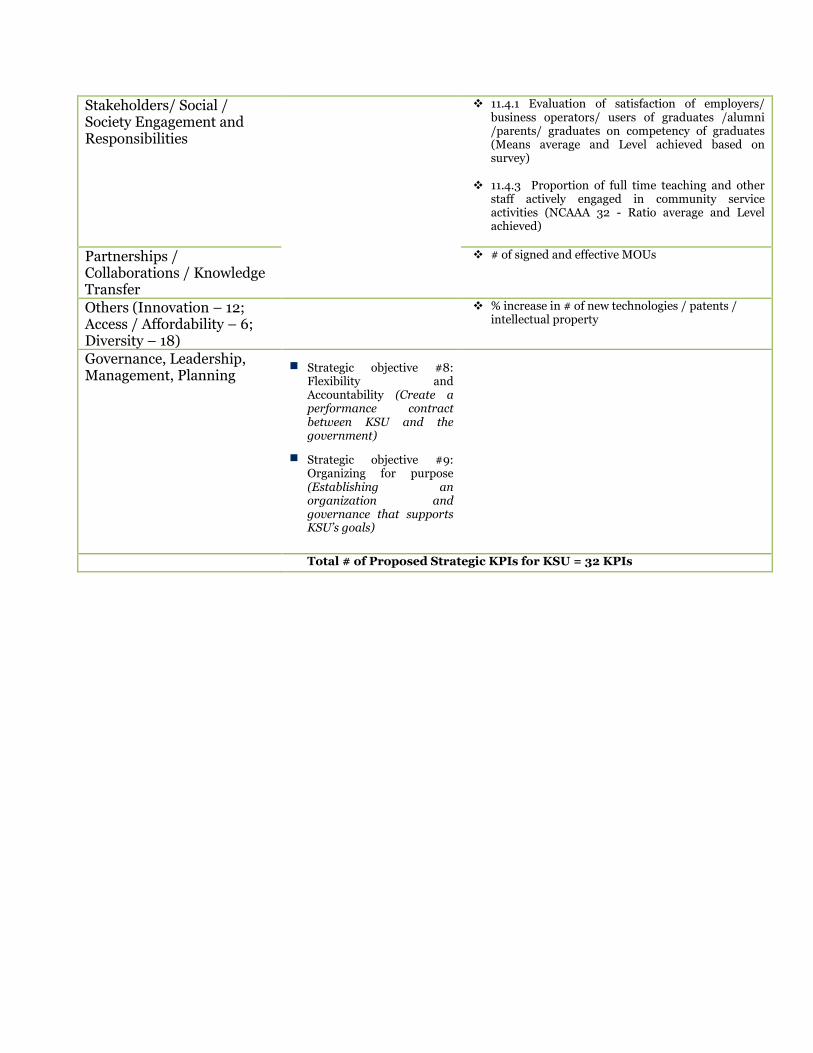
Stakeholders/ Social / Society Engagement and Responsibilities
11.4.1 Evaluation of satisfaction of employers/ business operators/ users of graduates /alumni /parents/ graduates on competency of graduates (Means average and Level achieved based on survey)
11.4.3 Proportion of full time teaching and other
staff actively engaged in community service activities (NCAAA 32 - Ratio average and Level achieved)
Partnerships / Collaborations / Knowledge Transfer
# of signed and effective MOUs
Others (Innovation – 12; Access / Affordability – 6; Diversity – 18)
None were selected from proposed 32 KPIs
Governance, Leadership, Management, Planning Strategic objective #8:
Flexibility and Accountability (Create a performance contract between KSU and the government)
Strategic objective #9: Organizing for purpose (Establishing an organization and governance that supports KSU’s goals)
No KPIs were identified from the whole research as detailed in the research report appendixes that they are not typical in other HEIs
Total # of Proposed Strategic KPIs for KSU = 18 KPIs
Appendix 1 Research Report of Strategic KPIs
Introduction
Most HEIs have strategic and operational plans and these contain strategic objectives which usually relate to the performance outputs or outcomes that are measured at a relatively high level and mainly medium term in nature. A key aspect of performance management deals with performance measurement which is to “measure and monitor” progress or achievement against these pre-defined objectives which are normally SMART (Specific, Measurable, Achievable, Realistic and Time-framed). A key way to monitor academic progress is to “measure progress or trends” (e.g. retention rate has increased by 5% over the previous year”) or compare across different units (e.g. graduation rate of the Engineering doctorate is 10% higher than the Arts doctorate over the previous year). To determine and support these performances, normally a HEI will need to develop a set of strategic KPIs to ensure that they know their performance in areas of importance to the HEI. Though strategic KPIs are important, there are specific issues of:
Purpose and intent of KPIs – Basically, the intent of strategic KPIs (what is distinctive and important to the institution) is to ensure that the strategic direction (long term policies and goals rather than short term priorities) and its strategic measures provide information of strategic performance which is the primary intent of the Governing Board or Executive Management. The tactical implementations which are normally delegated to the President of the HEI and its team would mean that the Governing Board will ultimately be responsible for its delegation of “strategic performance management” to the executing board.
Relationships to Strategic Planning – Institutional KPIs are strategic rather than operational as it should “focus on what makes it distinctive” that reflects the mission of the HEI as opposed to being operational at the college or program levels. This dictates that strategic KPIs should flow from a well-constructed Institutional Strategic Plan and should be part of the HEI’s strategic planning process in key areas of importance.
Number of KPIs and its value – CUC (2006) identified 10 areas that the HEIs should focus on as the main areas of performance management for all HEIs and suggested a range of 10 – 20 high level indicators supported with more detailed performance indicators at the lower levels of operations for more in-depth, analytical and informed decisions making. These lower levels indicators in key operational areas are the direct owners of these PIs (Performance Indicators) that informs on and support the higher level PIs which is the strategic KPIs.
While KSU has a strategic plan, the KSU 2030 “Towards Excellence” Strategic Plan, it appears that no strategic KPIs were identified. Based on this ambiguity, ABC University would need to identify a set of strategic KPIs that helps the top management measure, monitor and manage its accomplishment and achievement of its longer term goals. As such, the research aim of this paper is, “To determine a set of Strategic KPIs for KSU”.
This research report will contain 5 parts as follows:
Appendix 1 – This will report on the research aim, research methodology and
research findings of the entire appending appendix 2 to 5. It will also report on
how the KSU KPIs are determined based on the analysis in the appendix 2 to 5,
and come up with a proposed set of KSU KPIs.
Appendix 2 – This will report on the mapping of the KSU 2030 Strategic
Objectives onto the related KPIs categories as discussed in Appendix 3 to 5 which
shows the main KPIs and PIs categories and illustrative KPIs from the overall
988 KPIs from two main research reports and 11 sampled HEI Strategic Plans
with the strategic goals, strategic objectives strategic initiatives and KPIs.
Appendix 3 – This will report on the KSU 2030 Strategic Plan to determine the
existence of strategic KPIs as related to its 9 Strategic Objectives in order to map
its similarities in the determination and utilization of KPIs based on widely
accepted and good practices in the development of KPIs. Basically, no strategic
KPis were identified in this report, so only the Strategic Objectives were used as
the main mapping parameter. With those in Appendix 4, 5, 6 and 7.
Appendix 4 – This report discuss in-depth the comparative analysis of KPIs to
identify 10 key and common areas of strategic and operational focus of a typical
HEI. It also reports on the categorical KPIs that are used in each of these key
areas of focus and provide a set of illustrative KPIs for each of them.
Appendix 5 – This report on the tabulation of the main KPIs of typical HEIs
and it came up with 19 main areas where KPIs were developed as performance
measures or performance indicators totaling 988, where similarity or
commonalities exists in its fundamental principles but were expressed using
different terminologies or methods of description in its computational
formulation.
Appendix 6 – This report is focused on the strategic plans and strategic KPIs of
the 10 benchmarked universities on KSU as noted in the KSU 2030. Only 1 of
them has a strategic plan with specific strategic KPIs, with 3 having only a
strategic with no definition of its strategic KPIs, while the remaining 6 has no
institutional strategic plans but do have strategic plans at the schools’ or
administrative units’ areas.
Appendix 7 – This report is focused on the reduction of the original proposed
set of 32 KSU Strategic KPIs by an expert opinion group consisting of 3 Saudi
administrators and 3 consultants in the quality management area. This arrived at
a final set of 18 Strategic KSU as shown in Table 1 in the main report.
Appendix 8 – This reports on the identification of KPIs that can be used to
compare and potentially “rank” the performance of the colleges in KSU, or for the
performance comparison of programs within a college, or for comparison of
programs within as similar category (like all the health science programs in the
Health Science Group. The basis of the KPIs were that they were: 1) Student
Focused; 2) Faculty focused; 3) Research Focused and 4) Stakeholder
Satisfaction / Community Service

Research Methodology
As the development approaches of strategic KPIs used by most HEIs is very diverse and multifarious, this research will use a secondary research approach that reviews two main sources of: 1) literature of research conducted on the development and design of strategic KPIs of a HEI and 2) those KPIs defined in the strategic plans of a typical HEI. The use of the research reports on strategic KPIs of HEI was to identify typical common issues and widely accepted practices in the issues and challenges, development and design, scope and utilization of strategic and operational KPIs. The initial literature review identified 5 research reports as follows:
1. Pollard, E., Williams, M., Williams, Joy., Bertram, C. and Buzzeo, J., of IES (Institute for Employment Studies) and Drever, E., Griggs, J. and Coutinho, S., of NatCen (National Center for Social and Economic Research, entitled:
a. How should we measure higher education? A fundamental review of the Performance Indicators Part One: The Synthesis Report (November 2013)
b. How should we measure higher education? A fundamental review of the Performance Indicators Part Two: The Evidence Report (November 2013)
2. CUC (Committee of University Chairs) titled: a. CUC Report on the Monitoring of Institutional Performance and the Use
of Key Performance Indicators (November 2006) b. CUC Report on the Implementation of Key Performance Indicators: Case
Study Experiences (June 2008) 3. HR (Hanover Research) on Non-academic Key Performance Indicators for
Administrative Support Units (used by a variety of U.S. universities to measure the performance of non-academic, administrative support units that cover the metrics for Finance, human Resources, student Administration/Student Services and Facilities units).
In the second main source of secondary data of identifying strategic KPIs in Strategic Plans, the key terms of: 1) “strategic plans with strategic KPIs" which resulted in 6,030,000 hits in 0.47 sec”, 2) “strategic KPIs with 3,820,000 hits in 0.22 sec”, 3) “Strategic KPIs for education with 9,510,000 hits in 0.22 sec”, 4) “Strategic KPIs for academic or education with 9,940,000 hits in 0.26 sec” were randomly goggled. The top 30 documents were selected and reviewed to identify whether the two main aspects of “strategic objectives” and “KPIs” exist in the same strategic plan or just "strategic KPIs" in any document, and this resulted in the following set of documents:
1. Strategic Plans with KPIs of: a. The Penn State Strategic Plan 2009 – 2014 (USA) b. The Pennsylvania State University (May 2008), Strategic Indicators:
Measuring and Improving University Performance (USA) c. University of Toronto Performance Indicators 2012 Comprehensive
Inventory (Canada) d. Manchester State University ASPIRE 2010 – 2014 Metrics and Key
Performance Indicators and ASPIRE III (2014 – 2018) (UK) e. NEIU (Northern Illinois University) KPI Progress Report for the Strategic
Plan (USA) f. University of Greenwich Strategic Plan 2012 – 2017: Summary (UK)
g. Manchester Metropolitan University Corporate Strategy 2012 – 2017 (UK)
h. Ball State University Strategic Plan 2012 – 2017, Education Redefined 2.0: Advancing Indiana (USA)
i. Lancaster University Strategic Plan 2009 – 2015 (UK) j. University of Wollongong Strategic Plan 2008 – 2010 (Australia) k. Binghamton University 2010 – 2015 Strategic Plan Key Performance
Indicators (USA) l. Qatar University Strategic Plan 2010 – 2013 (Middle East)
2. The 75 KPIs every Manager needs to know (September 05, 2013). 3. The Pennsylvania State University (2008) Innovation Insights, “Developing
Strategic Performance Indicators”, Office of Planning and Institutional Assessment (USA).
4. Georgiadou, E. of Middlesex University London (UK), power point presentation of “Role of Key Performance Indicators in Higher education Quality Enhancement”.
5. NASPA International Assessment & Retention Conference, Baltimore, Maryland (USA) (June 2010) power point presentation of “The Assessment movement toward key performance indicators”.
6. Seybert, J. A., of National Higher Education Benchmarking Institute, Johnson County Community College (USA), power point presentation of “Identifying Key Performance Indicators: The Foundation of an Institutional Dashboard”.
Research Findings
A stringent research methodology is not applied due to the diversity in the
understanding and application leading to the development of strategic plans and KPIs,
and the diversity in the use of terminology or the grouping of the focus areas which are
dependent on the institution’s context and aspirations and unique focus. Though a
stringent methodology is not used, a systematic approach based on the basic mission and
functioning of a typical HEI with stated strategic goals and strategic objectives and
related KPIs or PIs in each of the focus areas of operation is the main criteria used for the
first level basis of analysis.
A second level of analysis is the criteria used to determine the KPIs. This is based on the CUC (2006) reports of which the top 10 KPIs recommended were chosen as a set of coherent KPIs with the following criteria:
a. Critical to the success of the institution; b. Strategic – i.e. high-level and of interest to governance c. Relevant to all types of institution; d. Able to cover all the main areas of strategic activity and risk which governors or
executive management need to monitor on a continuing basis for a HEI.
In the description of KPIs (CUC, 2006), performance measures is defined as “where the numerical indicator is a precise or robust measure of the factor of interest (e.g. student number, building condition, financial outcomes) and performance indicators as “which are not necessarily a numerical indicator” (e.g. teaching quality, student satisfaction, or sustainability index) are included in this research. Normally for performance indicators which cannot be measured directly, a proxy measure is developed (e.g. absenteeism can be used as a proxy for staff commitment).

Based on this methodology, some of the key findings:
1. Analysis of KSU 2030 Strategic Plan and its KPIs – The KSU 2030 which
was officially published in May 2009 and revised in December 2012 (in its
revised but unpublished form) showed that there were 9 Strategic Objectives and
49 recommendations. In the revised unofficial version as of January 2014, 4 main
types of modifications were identified as: 1) No changes = 22; 2) Changes in
terminologies = 19; 3) Original recommendation removed = 3; and 4) New
recommendations added = 6 resulting in a set of 47 recommendations. Basically,
the KSU 2030 is more structured as an issue/recommendation framework which
is not typical of the structuring of a typical HEI Strategic Plan. As such, no
strategic or operational KPIs were identified in its KSU 2030. Details of the
changes and modifications are reported in Table 2.2 Appendix 3.
2. Mapping of KSU 2030 onto the widely accepted focus areas of KPIs –
While KSU do not specify its KPIs in the KSU 2030, the longer meaning of the
strategic objectives of the KSU 2030 are mapped onto the 12 generic areas where
KPIs are typically specified in their focus areas in their strategic plans. The next
to best and appropriate mapping and its results and its details (Table 2.1 in
Appendix 2) are:
a. Strategic objective #3: Less is more; Strategic objective #4: Stronger graduates and Strategic objective #6: Supportive learning environment are mapped into two key areas of Student Focus (Student Experience) and Community and University Environment
b. Strategic objective #7: Sustainable future is mapped onto Financial and Institutional Sustainability
c. Strategic objective #1: Good everywhere can be mapped onto Research and Educational Offers (Teaching and Learning)
d. Strategic objective #2: Distinctive faculty can be mapped onto Staff (Human Resource Management)
e. Strategic objective #5: Building bridges can be mapped onto Internationalization, Stakeholders/ Social / Society Engagement and Responsibilities and Partnerships / Collaborations / Knowledge Transfer
Though it is not related to Governance, Leadership, Management, Planning, Strategic objective #8: Flexibility and Accountability Strategic objective #9: Organizing for purpose were put in this category as this is not typical of what a HEI will put in a strategic plan or define any KPIs in these areas. Other areas that were not clearly or explicitly covered by KSU in the 12 generic areas were Infrastructure / Technology / Resources and Innovation /Access / Affordability / Diversity). This resulted in a set of 32 KPIs that have relevance to KSU based on the KSU 2030 nine Strategic Objectives.
3. KSU – QMS main KPIs used to determine and compare performance
– in its strive to provide a comparative and “ranking” of performance of the
colleges in KSU (Appendix 8), or the programs within a college, or to compare the
programs and colleges with a similar grouping like all the health science /
medical science / dentistry / pharmacy were group into a category called the

Health Science Group. A set of 14 selected KPIs from key groups of Student focus,
Faculty focus, and Research focus and the Stakeholder Satisfaction /Community
Service focus were selected from the KSU – QMS Internal Benchmarking System.
This was used in the mapping and identification of the KPIs in addition to the
KPIs as selected from (4) above.
4. Number of KPIs used – The number of KPIs identified from this secondary
research process ranged from a low end number of KPIs of North Illinois
University (12) and Manchester Metropolitan University (16) and University of
Wollongong (23) to the high end of Qatar University (138), Ball State (113),
University of Toronto (99) and Binghamton University (92) and Manchester
State University (63) with two in the middle end of University of Greenwich (32)
and Lancaster University (30). This can allude to the fact that there is a range of
KPIs which the HEI can set up based on their institution’s context and
requirements, noting that some of the higher end numbers could be re-classified
as operational KPIs due to the specific and more detailed focus areas of
measurement of performance. Details of the categorization of KPIs and strategic
objectives of each HEI and the diversity of the KPIs used are shown in detail in
Appendix 5.
5. Focus areas of coverage – The overall research from the main research in (1)
came up with 19 focus areas (Appendix 5) whereby these typical HEIs and later
reduced into 12 main focus areas (Appendix 4) would set their KPIs in:
a. # 1 Student Focus / Student Experience and Teaching and Learning (216);
b. # 2 Estates and Infrastructure (6) / Infrastructure and Technology (103
each = 206 in total) and Technology (34);
c. # 3 Academic Profile and Market Position (7) and Education (Teaching
and Learning) (87);
d. #4 Financial Health (86) and Institutional Stability (6);
e. # 5 Research (90);
f. # 6 Stakeholders/ Social / Society Engagement and Responsibilities (59);
g. # 7 Faculty / Staff and HRD (51);
h. # 8 Community and University Environment (48); and
i. # 9 Others (Innovation – 12; Access / Affordability – 6; Diversity – 18)
totaling 36;
j. # 10 Partnerships / Collaborations / Knowledge Transfer (19) and lastly
Governance, Leadership, Management, Planning (12) (Appendix 4).
This is only an approximate determination of the key focus areas where KPIs are
developed ranked in grouping of similar terminologies from the original 19 in Appendix
5. Most of the most frequently used KPIs as used by the HEIs are shown in Table 4.3 in
Appendix 4.
The overall selection of the proposed set of 32 KSU strategic KPIs was selected based on
the following criteria that the selected KPIs (Table 2.2 of Appendix 2):
Are within the requirements of the 9 Strategic Objectives of KSU
Comprehensively address the requirements of the main areas important and
critical to the key focus areas of a typical HEI.
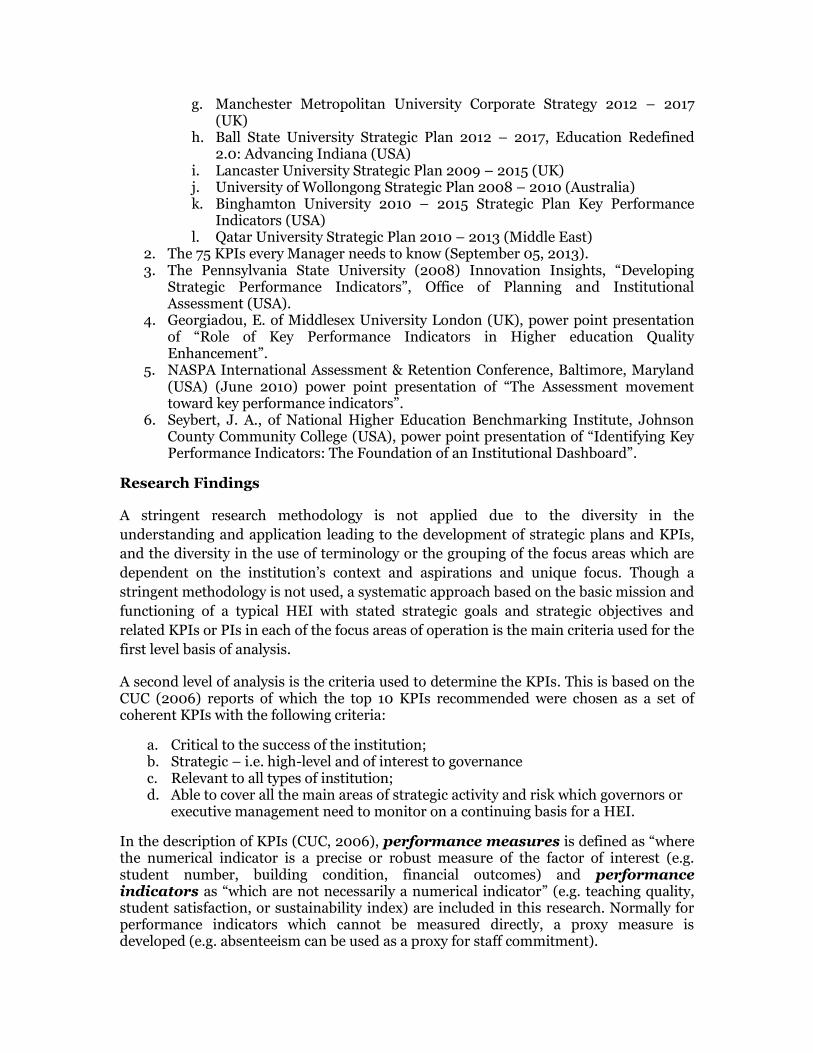
From the original 32 sets, it underwent a further round of expert opinion of 3 Saudi
administrators and 3 consultants in quality management. This approach came up with a
final set of proposed 18 KSU Strategic KPIs as shown in Table 1.1 (Appendix 7). The
whole research yielded a total of 18 Strategic KPIs that are deemed relevant and critical
to provide an overall picture of performance of KSU comprehensively and holistically as
shown below:
Table 1.1 Proposed Strategic KPIs of KSU
Key Categorical Areas where KPIs are important
Strategic Objectives of KSU
Proposed Strategic KPIs for KSU that measures strategic performance
Infrastructure / Technology / Resources
% of internal / external clients “satisfied” or “strongly satisfied” with services by all functional units (finance, IT, HR, procurement, Business operation, Housing, Student services, Library, External relations, Institutional research)
Teaching and Research Space as a proportion of
Total Space
Student Focus (Student Experience) Strategic objective #3: Less
is more (Reduce KSU’s student volume, increase the share of graduate students and raise entry requirements)
Strategic objective #4: Stronger graduates (Enable KSU students to learn hard and soft skills throughout their academic life)
Strategic objective #6: Supportive learning environment (Create an engaging environment at KSU for faculty, students, and staff)
Student satisfaction with university life experience
Retention and Graduation Time Series for undergraduate and PGs
3.6.1 Percentage of students graduated in the last 3 years who are recognized in the areas of academics, or profession, or contribution to society at the national or international level (%)
4.12.3 Proportion of students entering undergraduate programs who complete those programs in minimum time (NCAAA 9 - Means average and Level achieved)
4.12.5 Students overall rating on the quality of their courses (Average rating of students on a 5 point scale overall evaluation of courses) (NCAAA 6 - Means average and Level achieved based on survey)
Community and University Environment
% of students involved with university community events
% of faculty / staff involved with university community events
Financial / Institutional Sustainability Strategic objective #7:
Endowment Per FTE faculty / staff
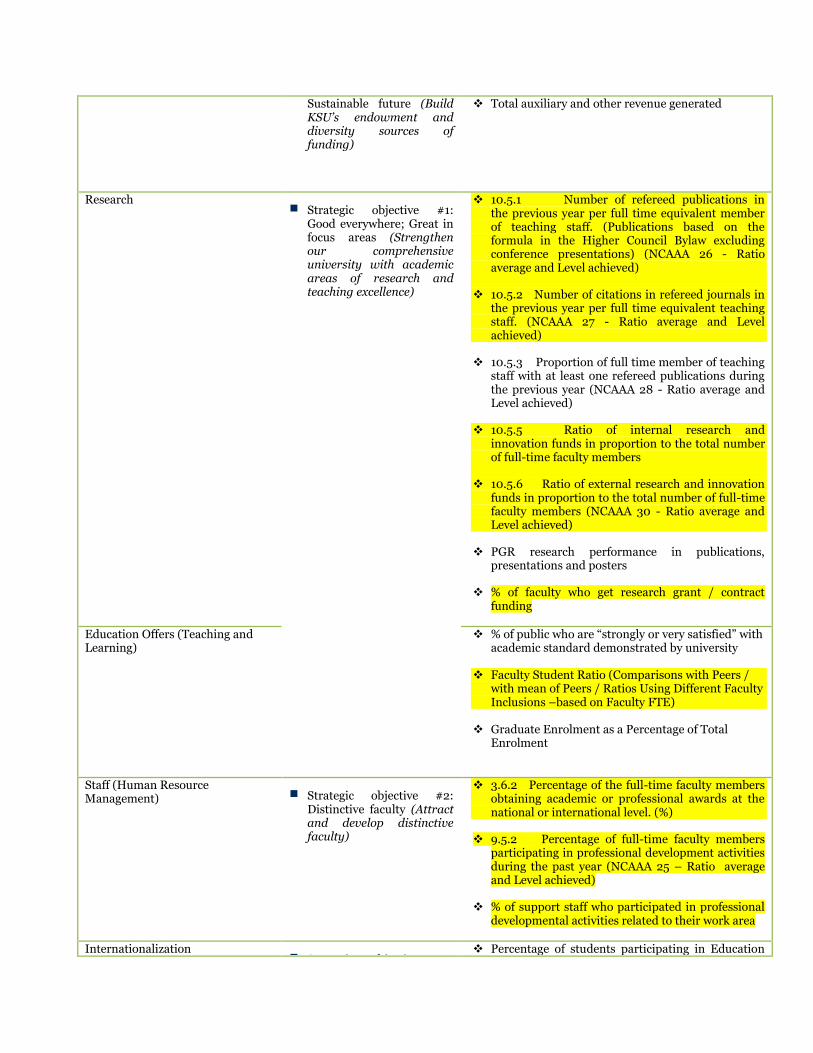
Sustainable future (Build KSU’s endowment and diversity sources of funding)
Total auxiliary and other revenue generated
Research Strategic objective #1:
Good everywhere; Great in focus areas (Strengthen our comprehensive university with academic areas of research and teaching excellence)
10.5.1 Number of refereed publications in the previous year per full time equivalent member of teaching staff. (Publications based on the formula in the Higher Council Bylaw excluding conference presentations) (NCAAA 26 - Ratio average and Level achieved)
10.5.2 Number of citations in refereed journals in the previous year per full time equivalent teaching staff. (NCAAA 27 - Ratio average and Level achieved)
10.5.3 Proportion of full time member of teaching staff with at least one refereed publications during the previous year (NCAAA 28 - Ratio average and Level achieved)
10.5.5 Ratio of internal research and innovation funds in proportion to the total number of full-time faculty members
10.5.6 Ratio of external research and innovation funds in proportion to the total number of full-time faculty members (NCAAA 30 - Ratio average and Level achieved)
PGR research performance in publications, presentations and posters
% of faculty who get research grant / contract funding
Education Offers (Teaching and Learning)
% of public who are “strongly or very satisfied” with academic standard demonstrated by university
Faculty Student Ratio (Comparisons with Peers /
with mean of Peers / Ratios Using Different Faculty Inclusions –based on Faculty FTE)
Graduate Enrolment as a Percentage of Total
Enrolment
Staff (Human Resource Management) Strategic objective #2:
Distinctive faculty (Attract and develop distinctive faculty)
3.6.2 Percentage of the full-time faculty members obtaining academic or professional awards at the national or international level. (%)
9.5.2 Percentage of full-time faculty members participating in professional development activities during the past year (NCAAA 25 – Ratio average and Level achieved)
% of support staff who participated in professional developmental activities related to their work area
Internationalization Strategic objective #5:
Percentage of students participating in Education
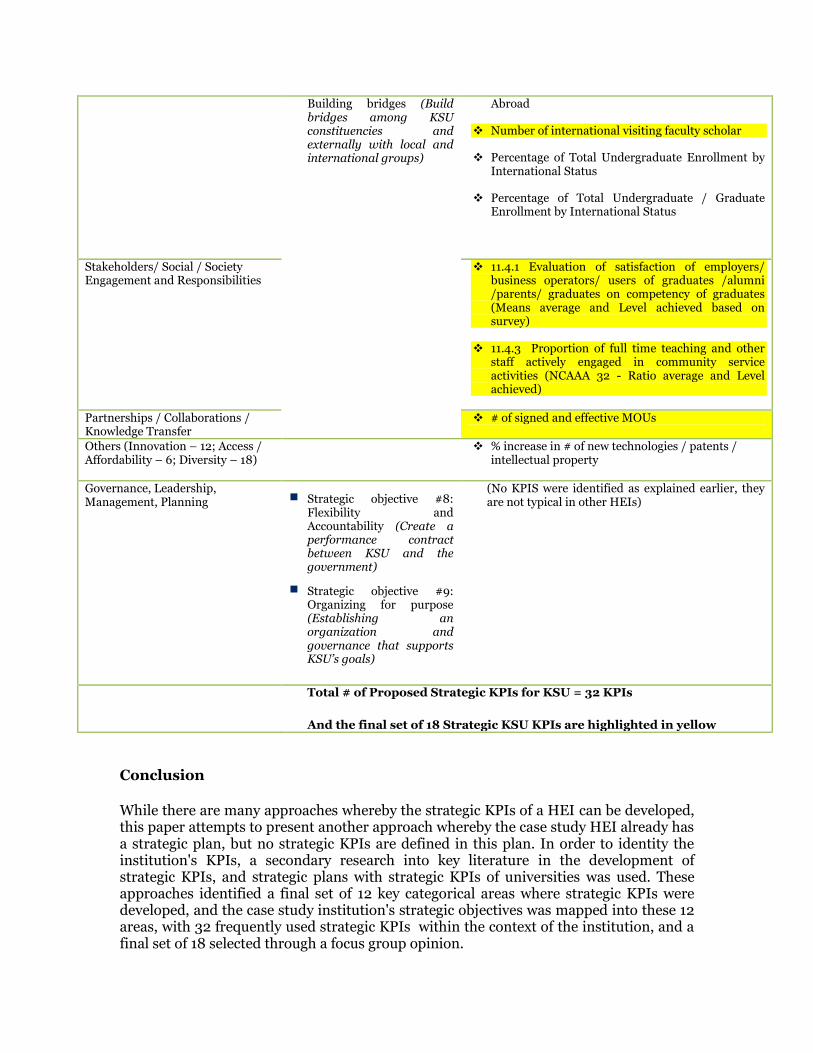
Building bridges (Build bridges among KSU constituencies and externally with local and international groups)
Abroad
Number of international visiting faculty scholar
Percentage of Total Undergraduate Enrollment by International Status
Percentage of Total Undergraduate / Graduate Enrollment by International Status
Stakeholders/ Social / Society Engagement and Responsibilities
11.4.1 Evaluation of satisfaction of employers/ business operators/ users of graduates /alumni /parents/ graduates on competency of graduates (Means average and Level achieved based on survey)
11.4.3 Proportion of full time teaching and other
staff actively engaged in community service activities (NCAAA 32 - Ratio average and Level achieved)
Partnerships / Collaborations / Knowledge Transfer
# of signed and effective MOUs
Others (Innovation – 12; Access / Affordability – 6; Diversity – 18)
% increase in # of new technologies / patents / intellectual property
Governance, Leadership, Management, Planning Strategic objective #8:
Flexibility and Accountability (Create a performance contract between KSU and the government)
Strategic objective #9: Organizing for purpose (Establishing an organization and governance that supports KSU’s goals)
(No KPIS were identified as explained earlier, they are not typical in other HEIs)
Total # of Proposed Strategic KPIs for KSU = 32 KPIs
And the final set of 18 Strategic KSU KPIs are highlighted in yellow
Conclusion
While there are many approaches whereby the strategic KPIs of a HEI can be developed, this paper attempts to present another approach whereby the case study HEI already has a strategic plan, but no strategic KPIs are defined in this plan. In order to identity the institution's KPIs, a secondary research into key literature in the development of strategic KPIs, and strategic plans with strategic KPIs of universities was used. These approaches identified a final set of 12 key categorical areas where strategic KPIs were developed, and the case study institution's strategic objectives was mapped into these 12 areas, with 32 frequently used strategic KPIs within the context of the institution, and a final set of 18 selected through a focus group opinion.
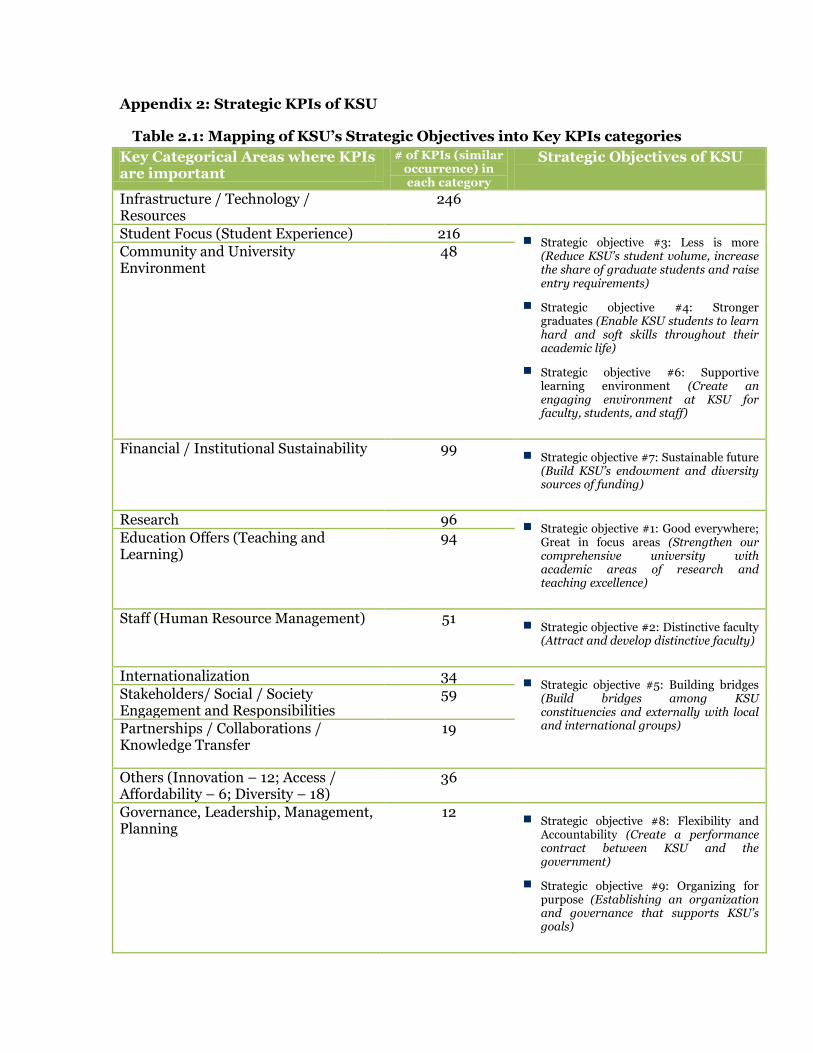
Appendix 2: Strategic KPIs of KSU
Table 2.1: Mapping of KSU’s Strategic Objectives into Key KPIs categories
Key Categorical Areas where KPIs are important
# of KPIs (similar occurrence) in each category
Strategic Objectives of KSU
Infrastructure / Technology / Resources
246
Student Focus (Student Experience) 216 Strategic objective #3: Less is more
(Reduce KSU’s student volume, increase the share of graduate students and raise entry requirements)
Strategic objective #4: Stronger graduates (Enable KSU students to learn hard and soft skills throughout their academic life)
Strategic objective #6: Supportive learning environment (Create an engaging environment at KSU for faculty, students, and staff)
Community and University Environment
48
Financial / Institutional Sustainability 99 Strategic objective #7: Sustainable future
(Build KSU’s endowment and diversity sources of funding)
Research 96 Strategic objective #1: Good everywhere;
Great in focus areas (Strengthen our comprehensive university with academic areas of research and teaching excellence)
Education Offers (Teaching and Learning)
94
Staff (Human Resource Management) 51 Strategic objective #2: Distinctive faculty
(Attract and develop distinctive faculty)
Internationalization 34 Strategic objective #5: Building bridges
(Build bridges among KSU constituencies and externally with local and international groups)
Stakeholders/ Social / Society Engagement and Responsibilities
59
Partnerships / Collaborations / Knowledge Transfer
19
Others (Innovation – 12; Access / Affordability – 6; Diversity – 18)
36
Governance, Leadership, Management, Planning
12 Strategic objective #8: Flexibility and
Accountability (Create a performance contract between KSU and the government)
Strategic objective #9: Organizing for purpose (Establishing an organization and governance that supports KSU’s goals)
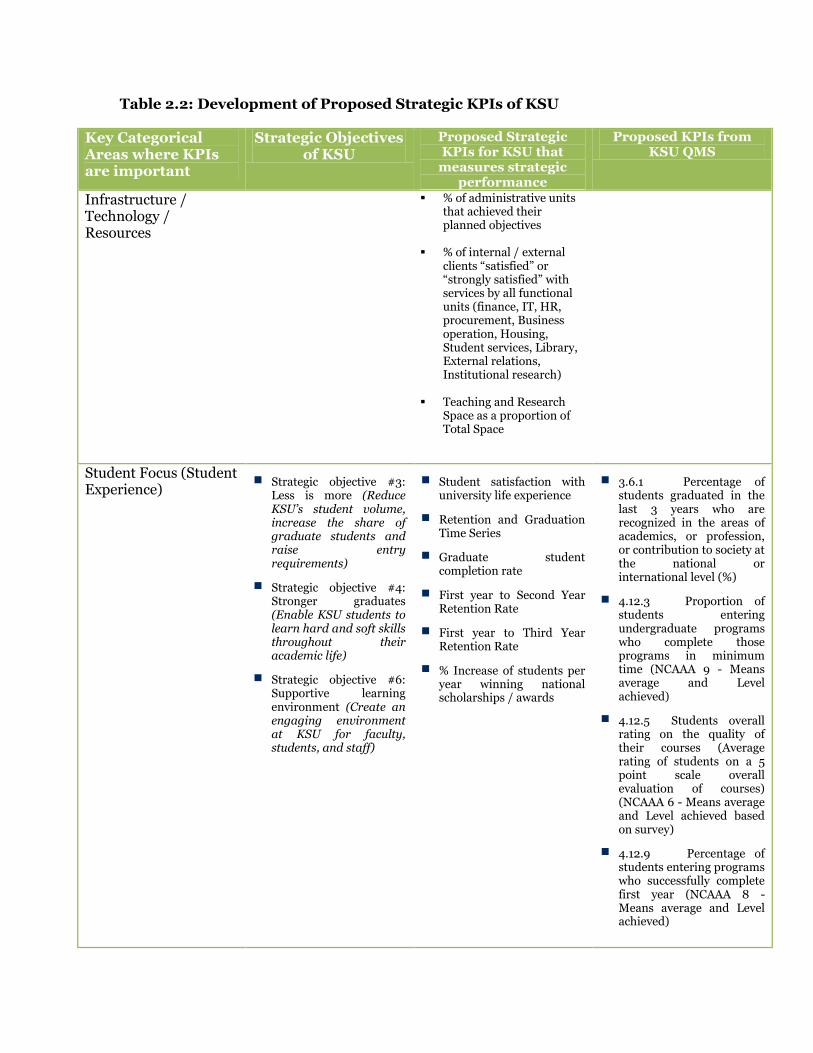
Table 2.2: Development of Proposed Strategic KPIs of KSU
Key Categorical Areas where KPIs are important
Strategic Objectives of KSU
Proposed Strategic KPIs for KSU that
measures strategic performance
Proposed KPIs from KSU QMS
Infrastructure / Technology / Resources
% of administrative units that achieved their planned objectives
% of internal / external
clients “satisfied” or “strongly satisfied” with services by all functional units (finance, IT, HR, procurement, Business operation, Housing, Student services, Library, External relations, Institutional research)
Teaching and Research
Space as a proportion of Total Space
Student Focus (Student Experience) Strategic objective #3:
Less is more (Reduce KSU’s student volume, increase the share of graduate students and raise entry requirements)
Strategic objective #4: Stronger graduates (Enable KSU students to learn hard and soft skills throughout their academic life)
Strategic objective #6: Supportive learning environment (Create an engaging environment at KSU for faculty, students, and staff)
Student satisfaction with university life experience
Retention and Graduation Time Series
Graduate student completion rate
First year to Second Year Retention Rate
First year to Third Year Retention Rate
% Increase of students per year winning national scholarships / awards
3.6.1 Percentage of students graduated in the last 3 years who are recognized in the areas of academics, or profession, or contribution to society at the national or international level (%)
4.12.3 Proportion of students entering undergraduate programs who complete those programs in minimum time (NCAAA 9 - Means average and Level achieved)
4.12.5 Students overall rating on the quality of their courses (Average rating of students on a 5 point scale overall evaluation of courses) (NCAAA 6 - Means average and Level achieved based on survey)
4.12.9 Percentage of students entering programs who successfully complete first year (NCAAA 8 - Means average and Level achieved)
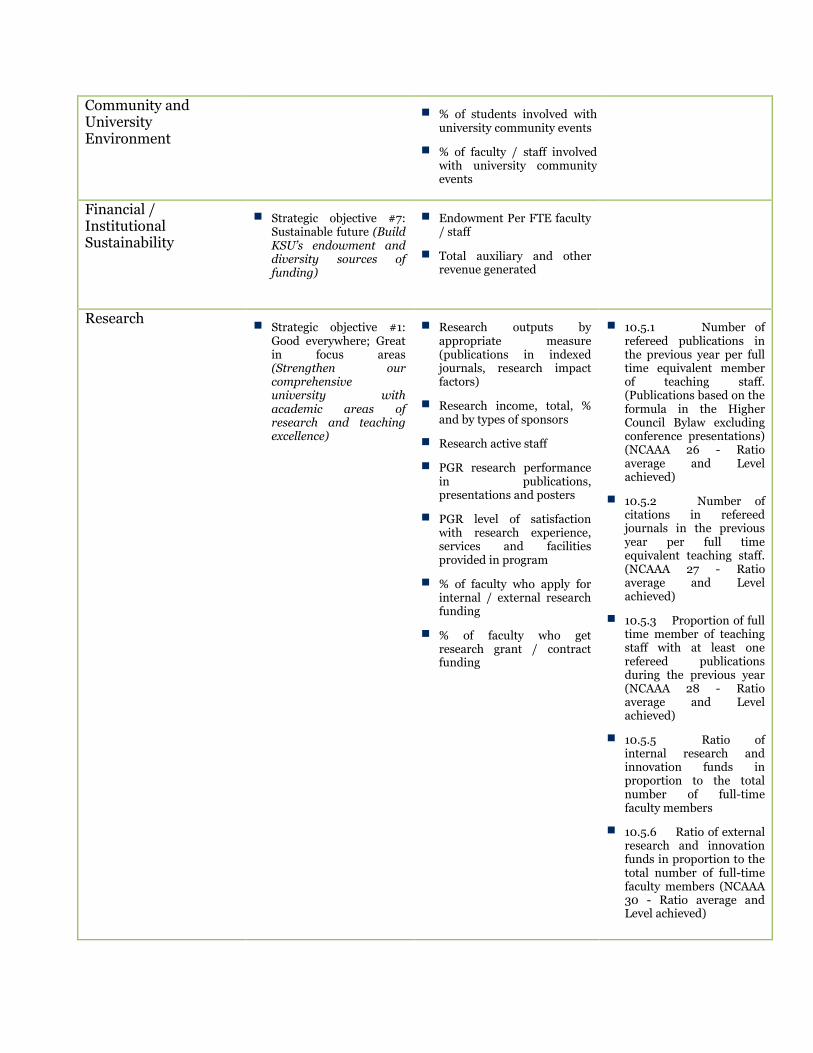
Community and University Environment
% of students involved with university community events
% of faculty / staff involved with university community events
Financial / Institutional Sustainability
Strategic objective #7: Sustainable future (Build KSU’s endowment and diversity sources of funding)
Endowment Per FTE faculty / staff
Total auxiliary and other revenue generated
Research Strategic objective #1:
Good everywhere; Great in focus areas (Strengthen our comprehensive university with academic areas of research and teaching excellence)
Research outputs by appropriate measure (publications in indexed journals, research impact factors)
Research income, total, % and by types of sponsors
Research active staff
PGR research performance in publications, presentations and posters
PGR level of satisfaction with research experience, services and facilities provided in program
% of faculty who apply for internal / external research funding
% of faculty who get research grant / contract funding
10.5.1 Number of refereed publications in the previous year per full time equivalent member of teaching staff. (Publications based on the formula in the Higher Council Bylaw excluding conference presentations) (NCAAA 26 - Ratio average and Level achieved)
10.5.2 Number of citations in refereed journals in the previous year per full time equivalent teaching staff. (NCAAA 27 - Ratio average and Level achieved)
10.5.3 Proportion of full time member of teaching staff with at least one refereed publications during the previous year (NCAAA 28 - Ratio average and Level achieved)
10.5.5 Ratio of internal research and innovation funds in proportion to the total number of full-time faculty members
10.5.6 Ratio of external research and innovation funds in proportion to the total number of full-time faculty members (NCAAA 30 - Ratio average and Level achieved)
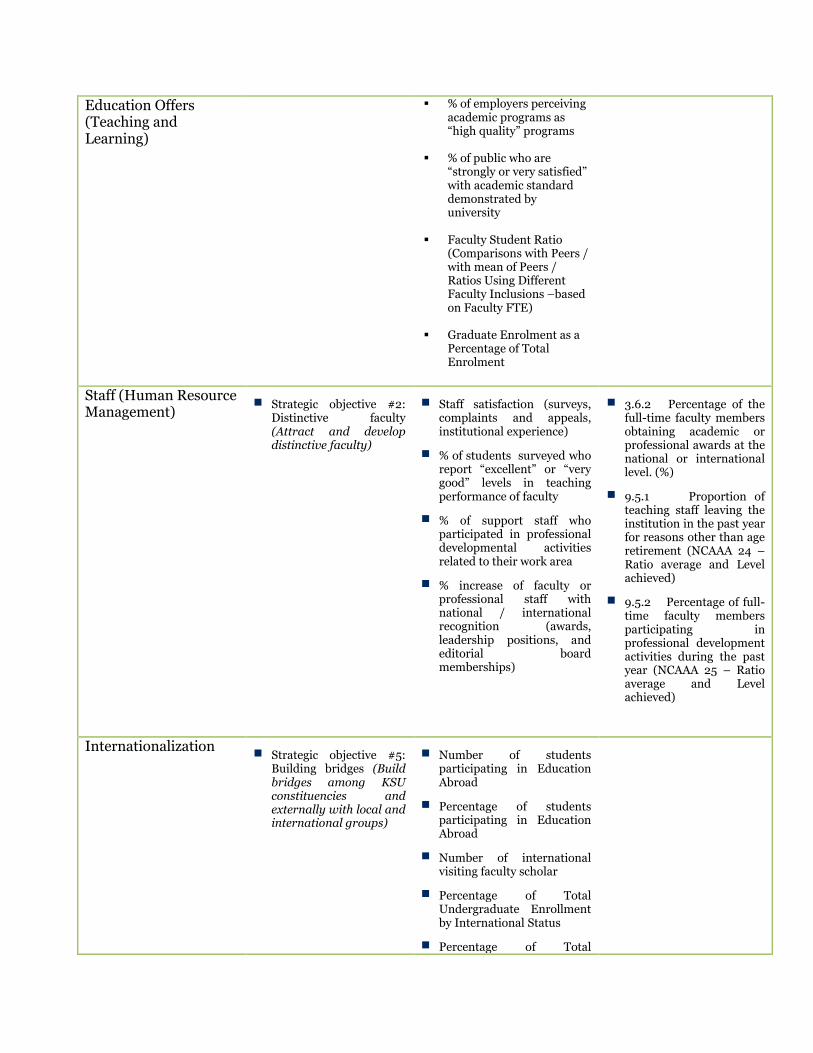
Education Offers (Teaching and Learning)
% of employers perceiving academic programs as “high quality” programs
% of public who are “strongly or very satisfied” with academic standard demonstrated by university
Faculty Student Ratio
(Comparisons with Peers / with mean of Peers / Ratios Using Different Faculty Inclusions –based on Faculty FTE)
Graduate Enrolment as a
Percentage of Total Enrolment
Staff (Human Resource Management) Strategic objective #2:
Distinctive faculty (Attract and develop distinctive faculty)
Staff satisfaction (surveys, complaints and appeals, institutional experience)
% of students surveyed who report “excellent” or “very good” levels in teaching performance of faculty
% of support staff who participated in professional developmental activities related to their work area
% increase of faculty or professional staff with national / international recognition (awards, leadership positions, and editorial board memberships)
3.6.2 Percentage of the full-time faculty members obtaining academic or professional awards at the national or international level. (%)
9.5.1 Proportion of teaching staff leaving the institution in the past year for reasons other than age retirement (NCAAA 24 – Ratio average and Level achieved)
9.5.2 Percentage of full-time faculty members participating in professional development activities during the past year (NCAAA 25 – Ratio average and Level achieved)
Internationalization Strategic objective #5:
Building bridges (Build bridges among KSU constituencies and externally with local and international groups)
Number of students participating in Education Abroad
Percentage of students participating in Education Abroad
Number of international visiting faculty scholar
Percentage of Total Undergraduate Enrollment by International Status
Percentage of Total
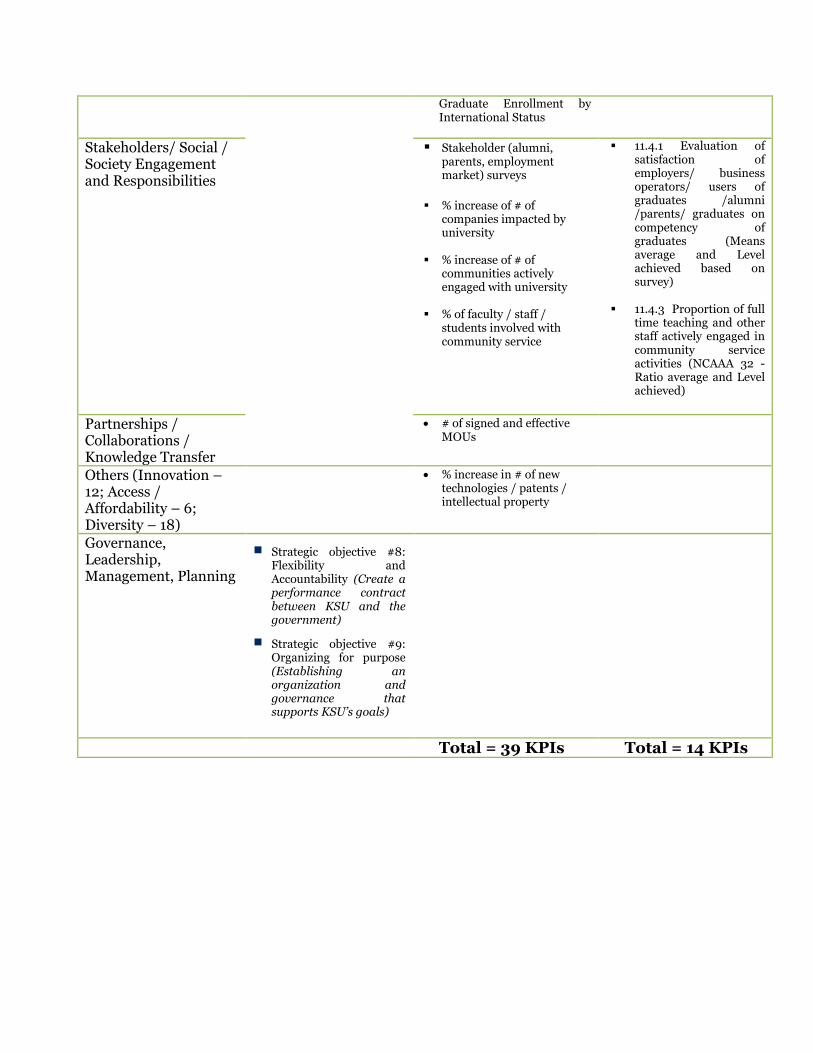
Graduate Enrollment by International Status
Stakeholders/ Social / Society Engagement and Responsibilities
Stakeholder (alumni, parents, employment market) surveys
% increase of # of
companies impacted by university
% increase of # of
communities actively engaged with university
% of faculty / staff /
students involved with community service
11.4.1 Evaluation of satisfaction of employers/ business operators/ users of graduates /alumni /parents/ graduates on competency of graduates (Means average and Level achieved based on survey)
11.4.3 Proportion of full time teaching and other staff actively engaged in community service activities (NCAAA 32 - Ratio average and Level achieved)
Partnerships / Collaborations / Knowledge Transfer
# of signed and effective MOUs
Others (Innovation – 12; Access / Affordability – 6; Diversity – 18)
% increase in # of new technologies / patents / intellectual property
Governance, Leadership, Management, Planning
Strategic objective #8: Flexibility and Accountability (Create a performance contract between KSU and the government)
Strategic objective #9: Organizing for purpose (Establishing an organization and governance that supports KSU’s goals)
Total = 39 KPIs Total = 14 KPIs

Table 3.2: Proposed Strategic KPIs of KSU
(Using only the mapping from Table 3.1 of the frequently used KPIs and mapping with
that of the KSU – QMS KPIs, this is the resulting table that is similar to that of Table
1.1)
Key Categorical Areas where KPIs are important
Strategic Objectives of KSU
Proposed Strategic KPIs for KSU that measures strategic performance
Infrastructure / Technology / Resources
% of internal / external clients “satisfied” or “strongly satisfied” with services by all functional units (finance, IT, HR, procurement, Business operation, Housing, Student services, Library, External relations, Institutional research)
Teaching and Research Space as a proportion of
Total Space
Student Focus (Student Experience) Strategic objective #3: Less
is more (Reduce KSU’s student volume, increase the share of graduate students and raise entry requirements)
Strategic objective #4: Stronger graduates (Enable KSU students to learn hard and soft skills throughout their academic life)
Strategic objective #6: Supportive learning environment (Create an engaging environment at KSU for faculty, students, and staff)
Student satisfaction with university life experience
Retention and Graduation Time Series for undergraduate and PGs
3.6.1 Percentage of students graduated in the last 3 years who are recognized in the areas of academics, or profession, or contribution to society at the national or international level (%)
4.12.3 Proportion of students entering undergraduate programs who complete those programs in minimum time (NCAAA 9 - Means average and Level achieved)
4.12.5 Students overall rating on the quality of their courses (Average rating of students on a 5 point scale overall evaluation of courses) (NCAAA 6 - Means average and Level achieved based on survey)
Community and University Environment
% of students involved with university community events
% of faculty / staff involved with university community events
Financial / Institutional Sustainability Strategic objective #7:
Sustainable future (Build KSU’s endowment and diversity sources of funding)
Endowment Per FTE faculty / staff
Total auxiliary and other revenue generated
Research Strategic objective #1:
Good everywhere; Great in focus areas (Strengthen our comprehensive
10.5.1 Number of refereed publications in the previous year per full time equivalent member of teaching staff. (Publications based on the formula in the Higher Council Bylaw excluding conference presentations) (NCAAA 26 - Ratio
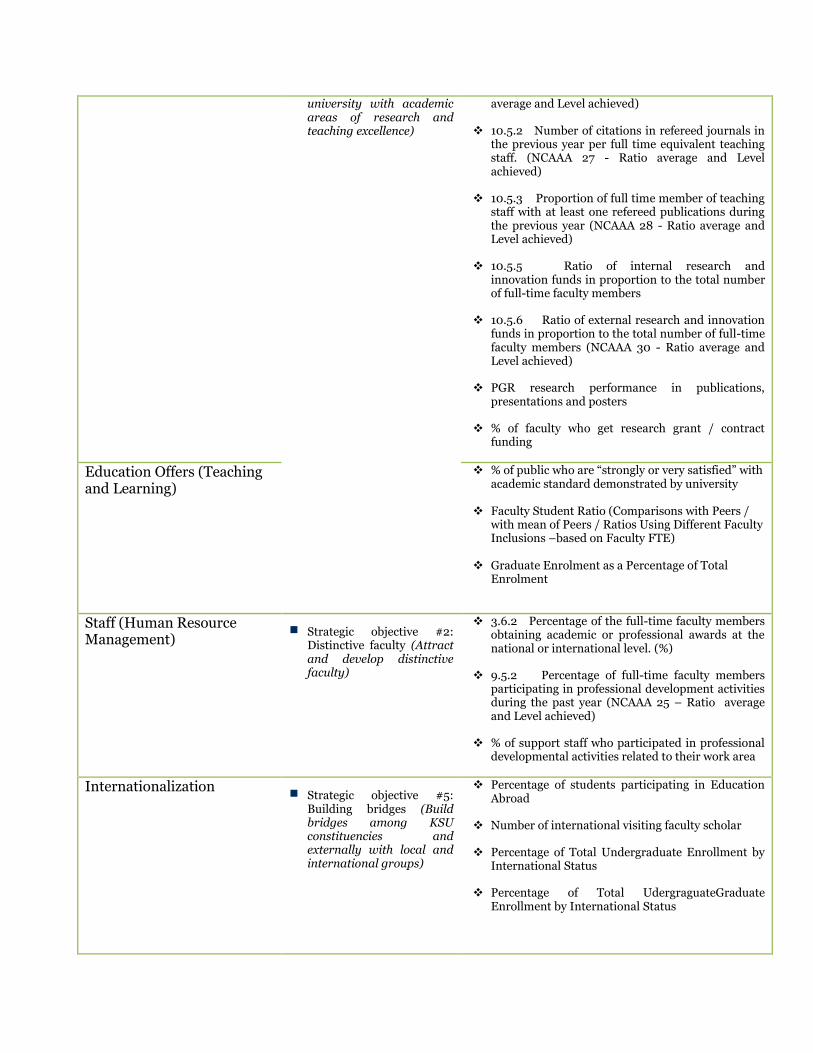
university with academic areas of research and teaching excellence)
average and Level achieved)
10.5.2 Number of citations in refereed journals in the previous year per full time equivalent teaching staff. (NCAAA 27 - Ratio average and Level achieved)
10.5.3 Proportion of full time member of teaching staff with at least one refereed publications during the previous year (NCAAA 28 - Ratio average and Level achieved)
10.5.5 Ratio of internal research and innovation funds in proportion to the total number of full-time faculty members
10.5.6 Ratio of external research and innovation funds in proportion to the total number of full-time faculty members (NCAAA 30 - Ratio average and Level achieved)
PGR research performance in publications, presentations and posters
% of faculty who get research grant / contract funding
Education Offers (Teaching and Learning)
% of public who are “strongly or very satisfied” with academic standard demonstrated by university
Faculty Student Ratio (Comparisons with Peers /
with mean of Peers / Ratios Using Different Faculty Inclusions –based on Faculty FTE)
Graduate Enrolment as a Percentage of Total
Enrolment
Staff (Human Resource Management) Strategic objective #2:
Distinctive faculty (Attract and develop distinctive faculty)
3.6.2 Percentage of the full-time faculty members obtaining academic or professional awards at the national or international level. (%)
9.5.2 Percentage of full-time faculty members participating in professional development activities during the past year (NCAAA 25 – Ratio average and Level achieved)
% of support staff who participated in professional developmental activities related to their work area
Internationalization Strategic objective #5:
Building bridges (Build bridges among KSU constituencies and externally with local and international groups)
Percentage of students participating in Education Abroad
Number of international visiting faculty scholar
Percentage of Total Undergraduate Enrollment by International Status
Percentage of Total UdergraguateGraduate Enrollment by International Status
Stakeholders/ Social / Society Engagement and Responsibilities
11.4.1 Evaluation of satisfaction of employers/ business operators/ users of graduates /alumni /parents/ graduates on competency of graduates (Means average and Level achieved based on survey)
11.4.3 Proportion of full time teaching and other
staff actively engaged in community service activities (NCAAA 32 - Ratio average and Level achieved)
Partnerships / Collaborations / Knowledge Transfer
# of signed and effective MOUs
Others (Innovation – 12; Access / Affordability – 6; Diversity – 18)
% increase in # of new technologies / patents / intellectual property
Governance, Leadership, Management, Planning Strategic objective #8:
Flexibility and Accountability (Create a performance contract between KSU and the government)
Strategic objective #9: Organizing for purpose (Establishing an organization and governance that supports KSU’s goals)
Total # of Proposed Strategic KPIs for KSU = 32 KPIs
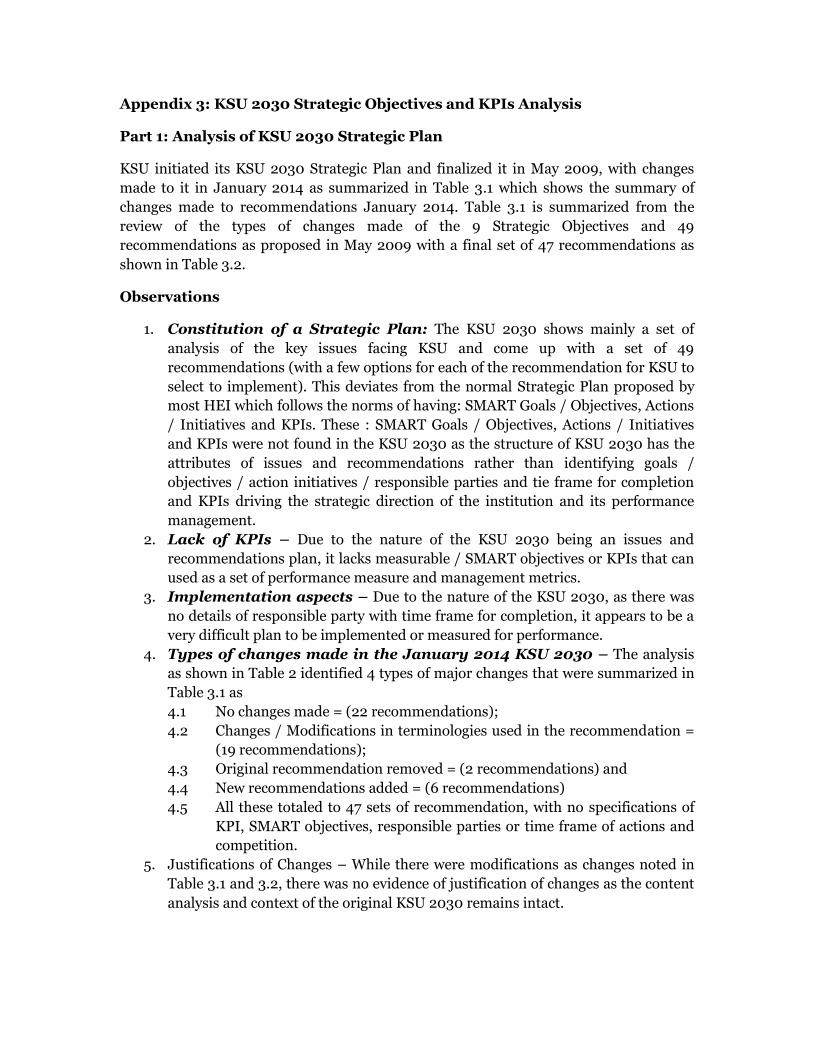
Appendix 3: KSU 2030 Strategic Objectives and KPIs Analysis
Part 1: Analysis of KSU 2030 Strategic Plan
KSU initiated its KSU 2030 Strategic Plan and finalized it in May 2009, with changes
made to it in January 2014 as summarized in Table 3.1 which shows the summary of
changes made to recommendations January 2014. Table 3.1 is summarized from the
review of the types of changes made of the 9 Strategic Objectives and 49
recommendations as proposed in May 2009 with a final set of 47 recommendations as
shown in Table 3.2.
Observations
1. Constitution of a Strategic Plan: The KSU 2030 shows mainly a set of
analysis of the key issues facing KSU and come up with a set of 49
recommendations (with a few options for each of the recommendation for KSU to
select to implement). This deviates from the normal Strategic Plan proposed by
most HEI which follows the norms of having: SMART Goals / Objectives, Actions
/ Initiatives and KPIs. These : SMART Goals / Objectives, Actions / Initiatives
and KPIs were not found in the KSU 2030 as the structure of KSU 2030 has the
attributes of issues and recommendations rather than identifying goals /
objectives / action initiatives / responsible parties and tie frame for completion
and KPIs driving the strategic direction of the institution and its performance
management.
2. Lack of KPIs – Due to the nature of the KSU 2030 being an issues and
recommendations plan, it lacks measurable / SMART objectives or KPIs that can
used as a set of performance measure and management metrics.
3. Implementation aspects – Due to the nature of the KSU 2030, as there was
no details of responsible party with time frame for completion, it appears to be a
very difficult plan to be implemented or measured for performance.
4. Types of changes made in the January 2014 KSU 2030 – The analysis
as shown in Table 2 identified 4 types of major changes that were summarized in
Table 3.1 as
4.1 No changes made = (22 recommendations);
4.2 Changes / Modifications in terminologies used in the recommendation =
(19 recommendations);
4.3 Original recommendation removed = (2 recommendations) and
4.4 New recommendations added = (6 recommendations)
4.5 All these totaled to 47 sets of recommendation, with no specifications of
KPI, SMART objectives, responsible parties or time frame of actions and
competition.
5. Justifications of Changes – While there were modifications as changes noted in
Table 3.1 and 3.2, there was no evidence of justification of changes as the content
analysis and context of the original KSU 2030 remains intact.
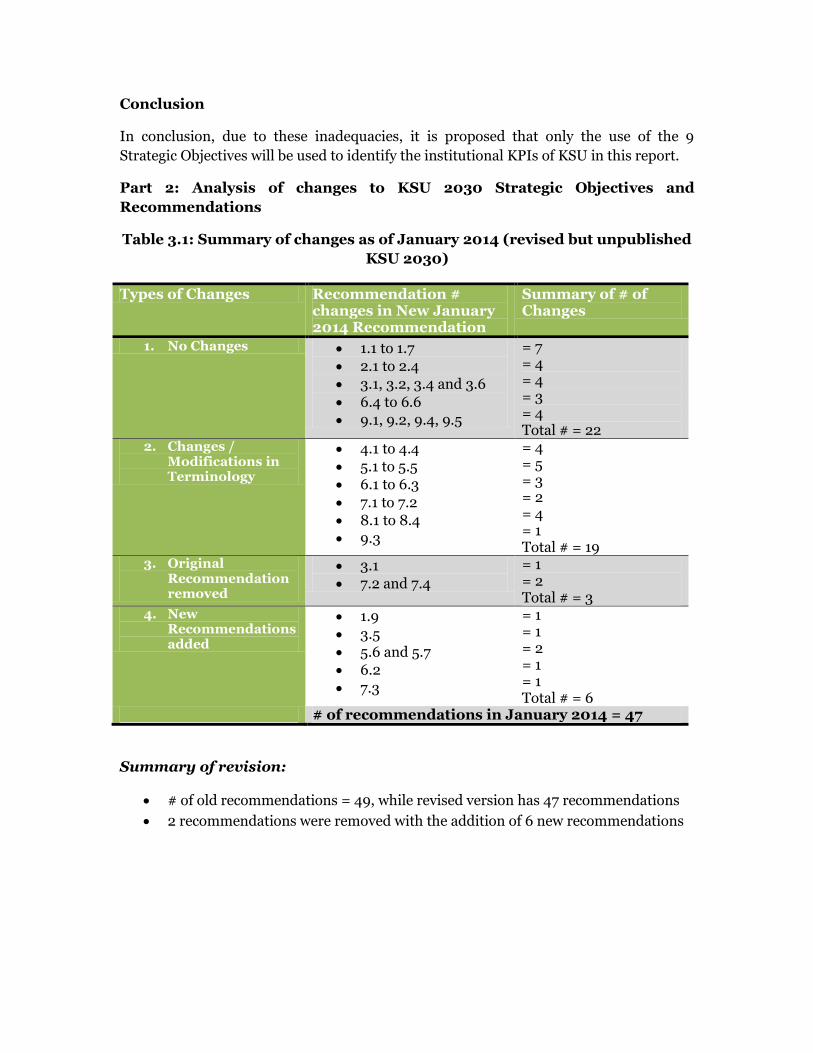
Conclusion
In conclusion, due to these inadequacies, it is proposed that only the use of the 9
Strategic Objectives will be used to identify the institutional KPIs of KSU in this report.
Part 2: Analysis of changes to KSU 2030 Strategic Objectives and
Recommendations
Table 3.1: Summary of changes as of January 2014 (revised but unpublished
KSU 2030)
Types of Changes Recommendation # changes in New January 2014 Recommendation
Summary of # of Changes
1. No Changes 1.1 to 1.7
2.1 to 2.4
3.1, 3.2, 3.4 and 3.6
6.4 to 6.6
9.1, 9.2, 9.4, 9.5
= 7 = 4 = 4 = 3 = 4 Total # = 22
2. Changes / Modifications in Terminology
4.1 to 4.4
5.1 to 5.5
6.1 to 6.3
7.1 to 7.2
8.1 to 8.4
9.3
= 4 = 5 = 3 = 2 = 4 = 1 Total # = 19
3. Original Recommendation removed
3.1
7.2 and 7.4
= 1 = 2 Total # = 3
4. New Recommendations added
1.9
3.5
5.6 and 5.7
6.2
7.3
= 1 = 1 = 2 = 1 = 1 Total # = 6
# of recommendations in January 2014 = 47
Summary of revision:
# of old recommendations = 49, while revised version has 47 recommendations
2 recommendations were removed with the addition of 6 new recommendations
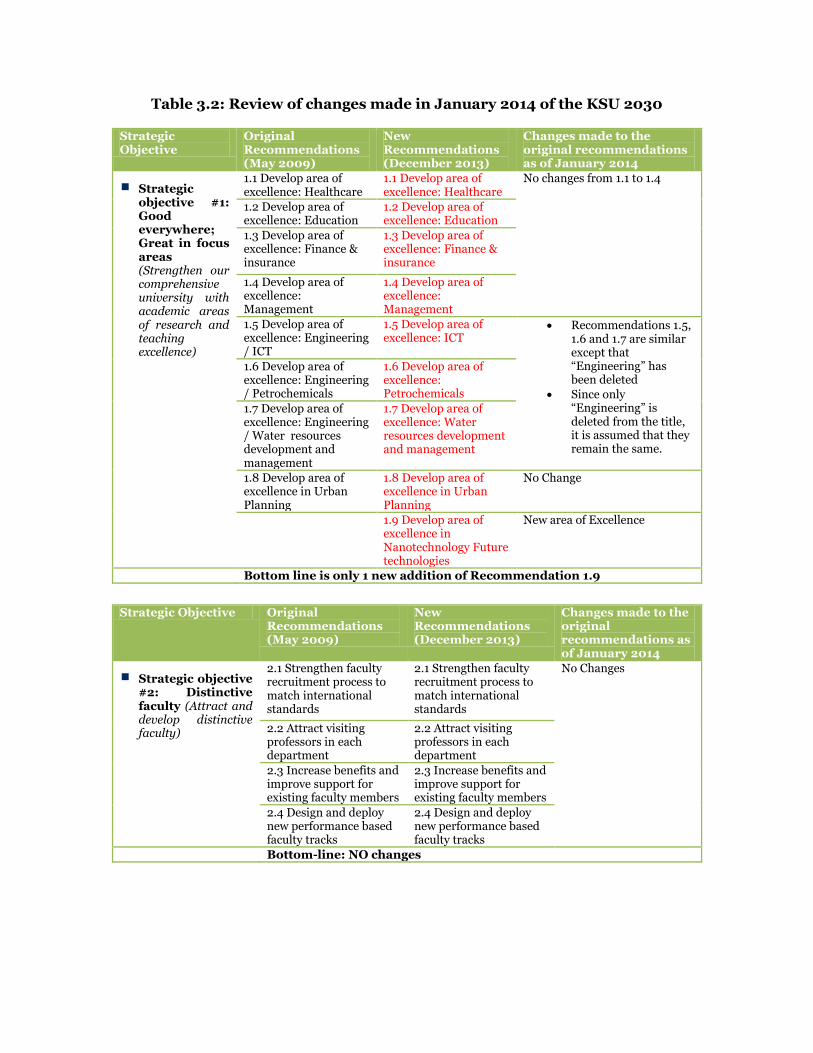
Table 3.2: Review of changes made in January 2014 of the KSU 2030
Strategic Objective
Original Recommendations (May 2009)
New Recommendations (December 2013)
Changes made to the original recommendations as of January 2014
Strategic objective #1: Good everywhere; Great in focus areas (Strengthen our comprehensive university with academic areas of research and teaching excellence)
1.1 Develop area of excellence: Healthcare
1.1 Develop area of excellence: Healthcare
No changes from 1.1 to 1.4
1.2 Develop area of excellence: Education
1.2 Develop area of excellence: Education
1.3 Develop area of excellence: Finance & insurance
1.3 Develop area of excellence: Finance & insurance
1.4 Develop area of excellence: Management
1.4 Develop area of excellence: Management
1.5 Develop area of excellence: Engineering / ICT
1.5 Develop area of excellence: ICT
Recommendations 1.5, 1.6 and 1.7 are similar except that “Engineering” has been deleted
Since only “Engineering” is deleted from the title, it is assumed that they remain the same.
1.6 Develop area of excellence: Engineering / Petrochemicals
1.6 Develop area of excellence: Petrochemicals
1.7 Develop area of excellence: Engineering / Water resources development and management
1.7 Develop area of excellence: Water resources development and management
1.8 Develop area of excellence in Urban Planning
1.8 Develop area of excellence in Urban Planning
No Change
1.9 Develop area of excellence in Nanotechnology Future technologies
New area of Excellence
Bottom line is only 1 new addition of Recommendation 1.9
Strategic Objective Original Recommendations (May 2009)
New Recommendations (December 2013)
Changes made to the original recommendations as of January 2014
Strategic objective #2: Distinctive faculty (Attract and develop distinctive faculty)
2.1 Strengthen faculty recruitment process to match international standards
2.1 Strengthen faculty recruitment process to match international standards
No Changes
2.2 Attract visiting professors in each department
2.2 Attract visiting professors in each department
2.3 Increase benefits and improve support for existing faculty members
2.3 Increase benefits and improve support for existing faculty members
2.4 Design and deploy new performance based faculty tracks
2.4 Design and deploy new performance based faculty tracks
Bottom-line: NO changes
Strategic Objective Original Recommendations (May 2009)
New Recommendations (December 2013)
Changes made to the original recommendations as of January 2014
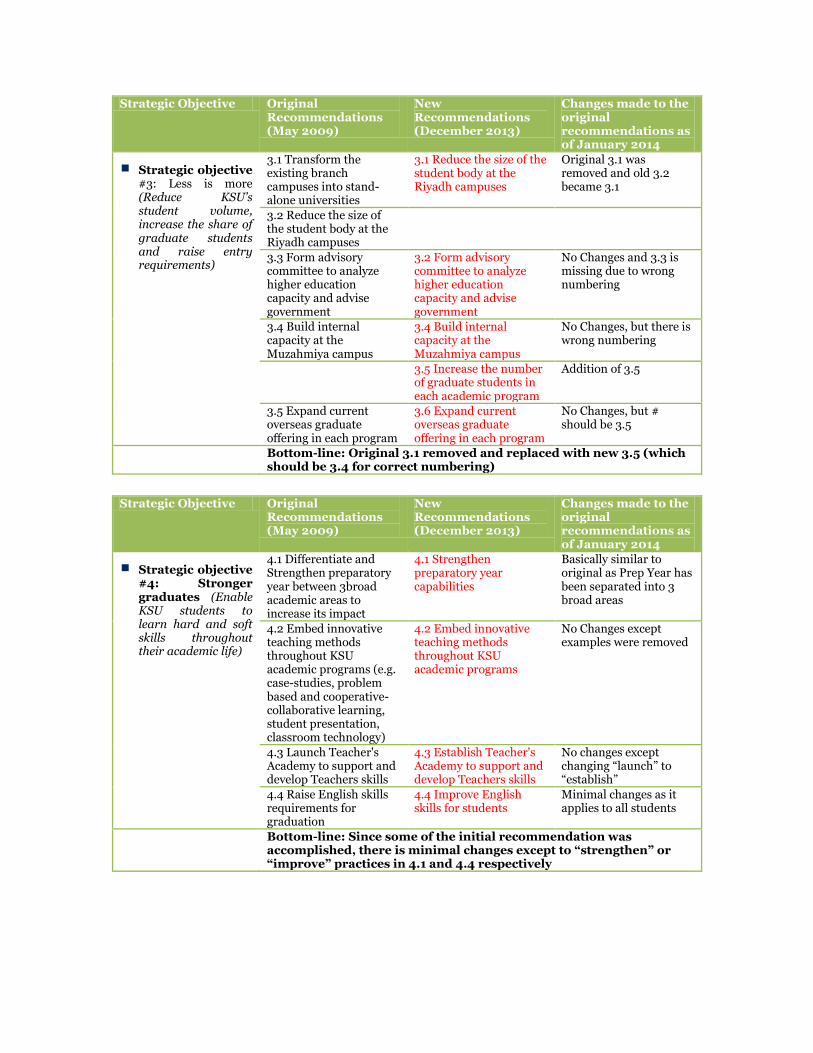
Strategic objective #3: Less is more (Reduce KSU’s student volume, increase the share of graduate students and raise entry requirements)
3.1 Transform the existing branch campuses into stand-alone universities
3.1 Reduce the size of the student body at the Riyadh campuses
Original 3.1 was removed and old 3.2 became 3.1
3.2 Reduce the size of the student body at the Riyadh campuses
3.3 Form advisory committee to analyze higher education capacity and advise government
3.2 Form advisory committee to analyze higher education capacity and advise government
No Changes and 3.3 is missing due to wrong numbering
3.4 Build internal capacity at the Muzahmiya campus
3.4 Build internal capacity at the Muzahmiya campus
No Changes, but there is wrong numbering
3.5 Increase the number of graduate students in each academic program
Addition of 3.5
3.5 Expand current overseas graduate offering in each program
3.6 Expand current overseas graduate offering in each program
No Changes, but # should be 3.5
Bottom-line: Original 3.1 removed and replaced with new 3.5 (which should be 3.4 for correct numbering)
Strategic Objective Original Recommendations (May 2009)
New Recommendations (December 2013)
Changes made to the original recommendations as of January 2014
Strategic objective #4: Stronger graduates (Enable KSU students to learn hard and soft skills throughout their academic life)
4.1 Differentiate and Strengthen preparatory year between 3broad academic areas to increase its impact
4.1 Strengthen preparatory year capabilities
Basically similar to original as Prep Year has been separated into 3 broad areas
4.2 Embed innovative teaching methods throughout KSU academic programs (e.g. case-studies, problem based and cooperative-collaborative learning, student presentation, classroom technology)
4.2 Embed innovative teaching methods throughout KSU academic programs
No Changes except examples were removed
4.3 Launch Teacher's Academy to support and develop Teachers skills
4.3 Establish Teacher's Academy to support and develop Teachers skills
No changes except changing “launch” to “establish”
4.4 Raise English skills requirements for graduation
4.4 Improve English skills for students
Minimal changes as it applies to all students
Bottom-line: Since some of the initial recommendation was accomplished, there is minimal changes except to “strengthen” or “improve” practices in 4.1 and 4.4 respectively
Strategic Objective Original Recommendations (May 2009)
New Recommendations (December 2013)
Changes made to the original recommendations as of January 2014
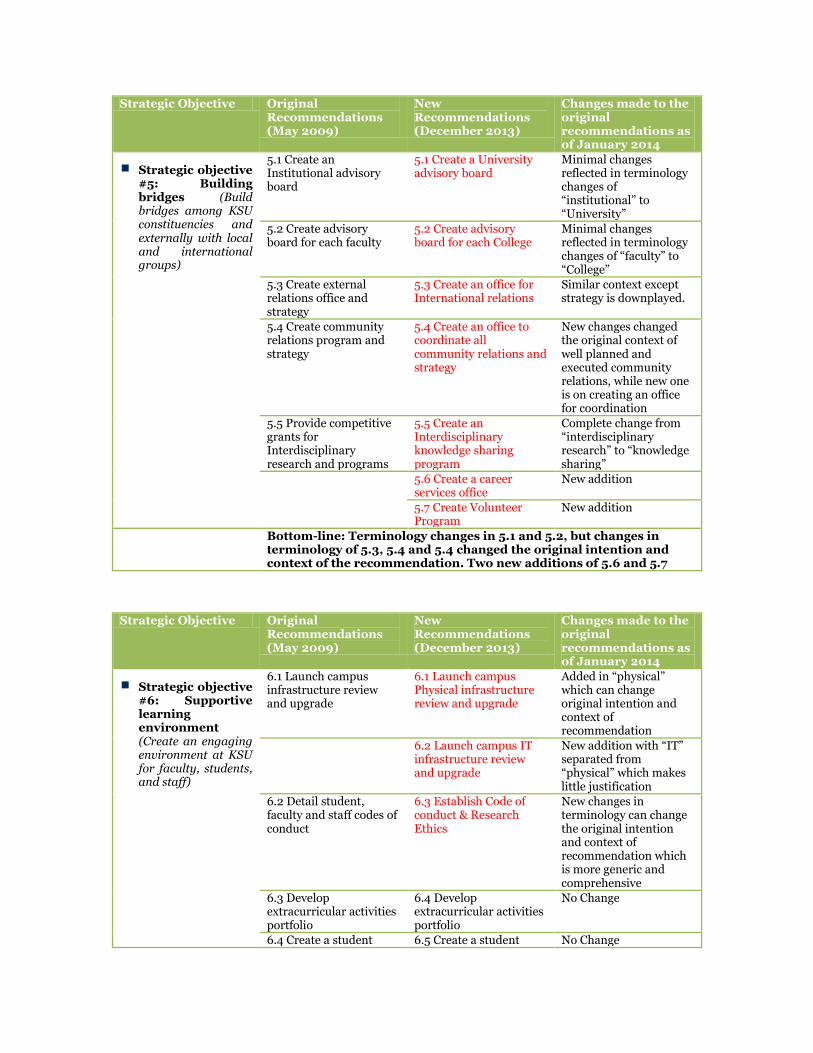
Strategic objective #5: Building bridges (Build bridges among KSU constituencies and externally with local and international groups)
5.1 Create an Institutional advisory board
5.1 Create a University advisory board
Minimal changes reflected in terminology changes of “institutional” to “University”
5.2 Create advisory board for each faculty
5.2 Create advisory board for each College
Minimal changes reflected in terminology changes of “faculty” to “College”
5.3 Create external relations office and strategy
5.3 Create an office for International relations
Similar context except strategy is downplayed.
5.4 Create community relations program and strategy
5.4 Create an office to coordinate all community relations and strategy
New changes changed the original context of well planned and executed community relations, while new one is on creating an office for coordination
5.5 Provide competitive grants for Interdisciplinary research and programs
5.5 Create an Interdisciplinary knowledge sharing program
Complete change from “interdisciplinary research” to “knowledge sharing”
5.6 Create a career services office
New addition
5.7 Create Volunteer Program
New addition
Bottom-line: Terminology changes in 5.1 and 5.2, but changes in terminology of 5.3, 5.4 and 5.4 changed the original intention and context of the recommendation. Two new additions of 5.6 and 5.7
Strategic Objective Original Recommendations (May 2009)
New Recommendations (December 2013)
Changes made to the original recommendations as of January 2014
Strategic objective #6: Supportive learning environment (Create an engaging environment at KSU for faculty, students, and staff)
6.1 Launch campus infrastructure review and upgrade
6.1 Launch campus Physical infrastructure review and upgrade
Added in “physical” which can change original intention and context of recommendation
6.2 Launch campus IT infrastructure review and upgrade
New addition with “IT” separated from “physical” which makes little justification
6.2 Detail student, faculty and staff codes of conduct
6.3 Establish Code of conduct & Research Ethics
New changes in terminology can change the original intention and context of recommendation which is more generic and comprehensive
6.3 Develop extracurricular activities portfolio
6.4 Develop extracurricular activities portfolio
No Change
6.4 Create a student 6.5 Create a student No Change
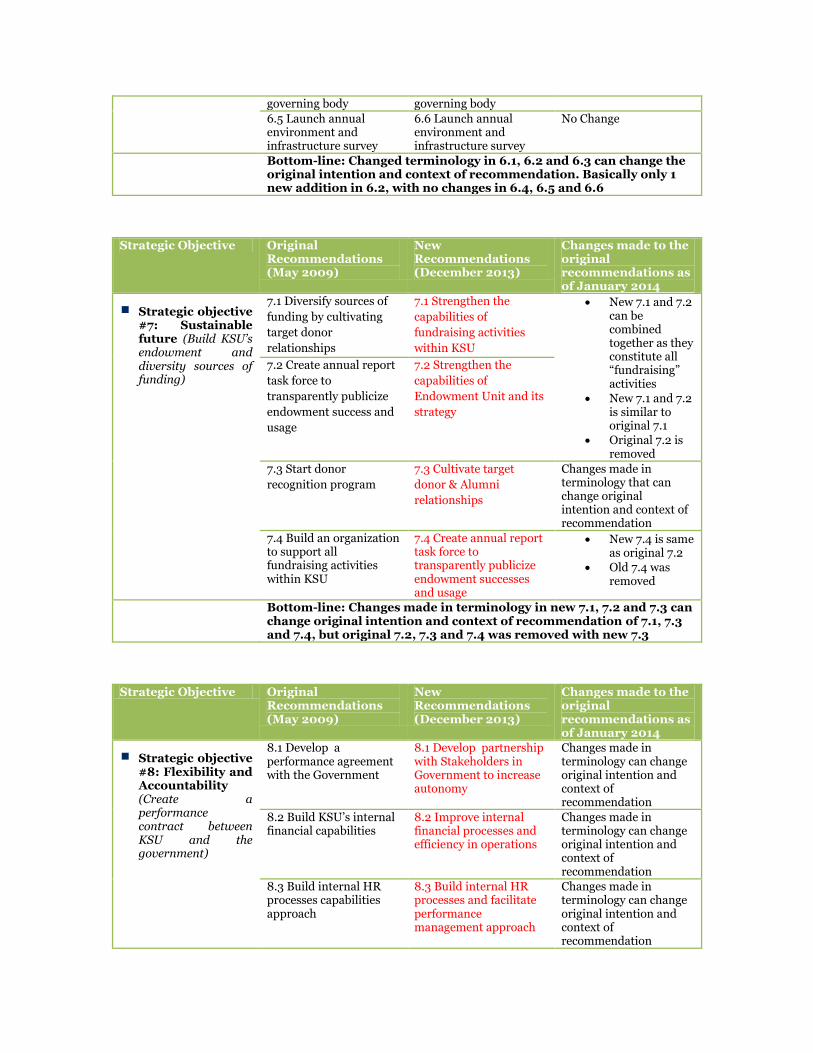
governing body governing body
6.5 Launch annual environment and infrastructure survey
6.6 Launch annual environment and infrastructure survey
No Change
Bottom-line: Changed terminology in 6.1, 6.2 and 6.3 can change the original intention and context of recommendation. Basically only 1 new addition in 6.2, with no changes in 6.4, 6.5 and 6.6
Strategic Objective Original Recommendations (May 2009)
New Recommendations (December 2013)
Changes made to the original recommendations as of January 2014
Strategic objective #7: Sustainable future (Build KSU’s endowment and diversity sources of funding)
7.1 Diversify sources of
funding by cultivating
target donor
relationships
7.1 Strengthen the
capabilities of
fundraising activities
within KSU
New 7.1 and 7.2 can be combined together as they constitute all “fundraising” activities
New 7.1 and 7.2 is similar to original 7.1
Original 7.2 is removed
7.2 Create annual report
task force to
transparently publicize
endowment success and
usage
7.2 Strengthen the
capabilities of
Endowment Unit and its
strategy
7.3 Start donor
recognition program
7.3 Cultivate target
donor & Alumni
relationships
Changes made in terminology that can change original intention and context of recommendation
7.4 Build an organization to support all fundraising activities within KSU
7.4 Create annual report task force to transparently publicize endowment successes and usage
New 7.4 is same as original 7.2
Old 7.4 was removed
Bottom-line: Changes made in terminology in new 7.1, 7.2 and 7.3 can change original intention and context of recommendation of 7.1, 7.3 and 7.4, but original 7.2, 7.3 and 7.4 was removed with new 7.3
Strategic Objective Original Recommendations (May 2009)
New Recommendations (December 2013)
Changes made to the original recommendations as of January 2014
Strategic objective #8: Flexibility and Accountability (Create a performance contract between KSU and the government)
8.1 Develop a performance agreement with the Government
8.1 Develop partnership with Stakeholders in Government to increase autonomy
Changes made in terminology can change original intention and context of recommendation
8.2 Build KSU’s internal financial capabilities
8.2 Improve internal financial processes and efficiency in operations
Changes made in terminology can change original intention and context of recommendation
8.3 Build internal HR processes capabilities approach
8.3 Build internal HR processes and facilitate performance management approach
Changes made in terminology can change original intention and context of recommendation
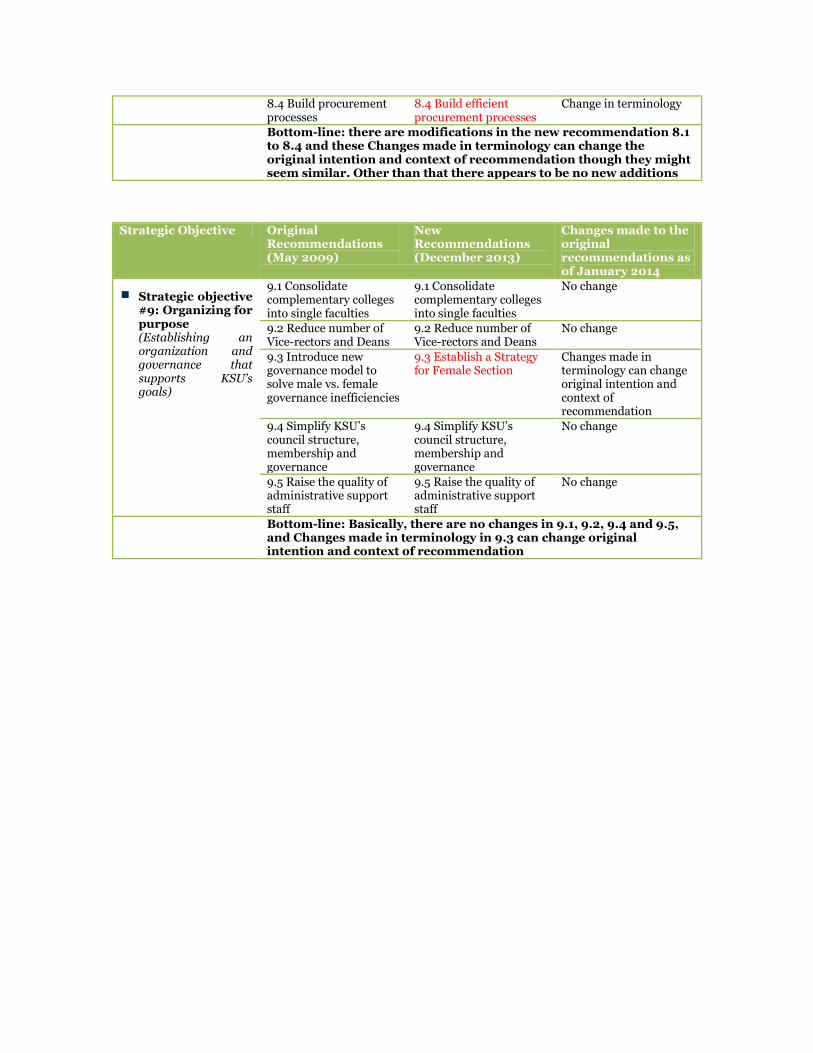
8.4 Build procurement processes
8.4 Build efficient procurement processes
Change in terminology
Bottom-line: there are modifications in the new recommendation 8.1 to 8.4 and these Changes made in terminology can change the original intention and context of recommendation though they might seem similar. Other than that there appears to be no new additions
Strategic Objective Original Recommendations (May 2009)
New Recommendations (December 2013)
Changes made to the original recommendations as of January 2014
Strategic objective #9: Organizing for purpose (Establishing an organization and governance that supports KSU’s goals)
9.1 Consolidate complementary colleges into single faculties
9.1 Consolidate complementary colleges into single faculties
No change
9.2 Reduce number of Vice-rectors and Deans
9.2 Reduce number of Vice-rectors and Deans
No change
9.3 Introduce new governance model to solve male vs. female governance inefficiencies
9.3 Establish a Strategy for Female Section
Changes made in terminology can change original intention and context of recommendation
9.4 Simplify KSU’s council structure, membership and governance
9.4 Simplify KSU’s council structure, membership and governance
No change
9.5 Raise the quality of administrative support staff
9.5 Raise the quality of administrative support staff
No change
Bottom-line: Basically, there are no changes in 9.1, 9.2, 9.4 and 9.5, and Changes made in terminology in 9.3 can change original intention and context of recommendation

Appendix 4: Comparative Analysis of Institutional KPIs
Table 4.1: Comparative Analysis of most frequently used Institutional KPIs
CUC (Committee of University Chairman) Report 2006
# of KPIs
Most common indicators used in Dashboard of US Universities
# of KPIs
Research (2014) of 11 randomly selected universities
# of KPIs
Institutional Sustainability
7 Institutional Sustainability
6
Academic Profile and Market Position
7 Admissions
Enrolment
Academic Information
External Rating
Education (Teaching and Learning)
87
Student Experience and Teaching and Learning
8 Student Outcomes
Student Engagement
Satisfaction
Student Focus 208
Research 8 Research Research 82
Knowledge Transfer and Relationships
7 Partnership / Collaborations
12
Financial Health 8 Financial Indicators
Financial 78
Estates and Infrastructure
6 Physical Plant Infrastructure
Technology
Resources
103 34 103
Staff and HRD 6 Faculty
Satisfaction
Faculty
Staff
20 25
Community and University Environment
48
Governance, Leadership & Management
5 Planning / Governance
7
Internationalization 34
Stakeholders Engagement
11
Social / Society 33
Environmental 15
Innovation 12
Access / Affordability 6
Diversity 18
TOTAL 61 TOTAL 927
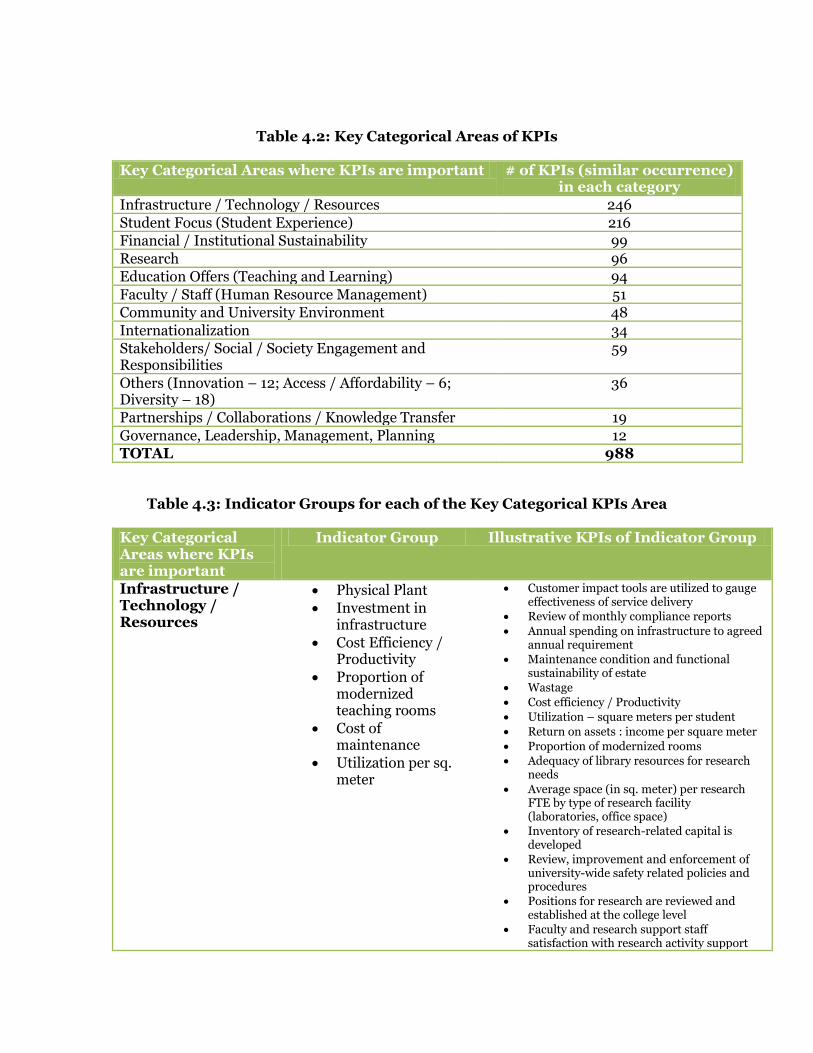
Table 4.2: Key Categorical Areas of KPIs
Key Categorical Areas where KPIs are important # of KPIs (similar occurrence) in each category
Infrastructure / Technology / Resources 246
Student Focus (Student Experience) 216
Financial / Institutional Sustainability 99
Research 96
Education Offers (Teaching and Learning) 94
Faculty / Staff (Human Resource Management) 51
Community and University Environment 48
Internationalization 34
Stakeholders/ Social / Society Engagement and Responsibilities
59
Others (Innovation – 12; Access / Affordability – 6; Diversity – 18)
36
Partnerships / Collaborations / Knowledge Transfer 19
Governance, Leadership, Management, Planning 12
TOTAL 988
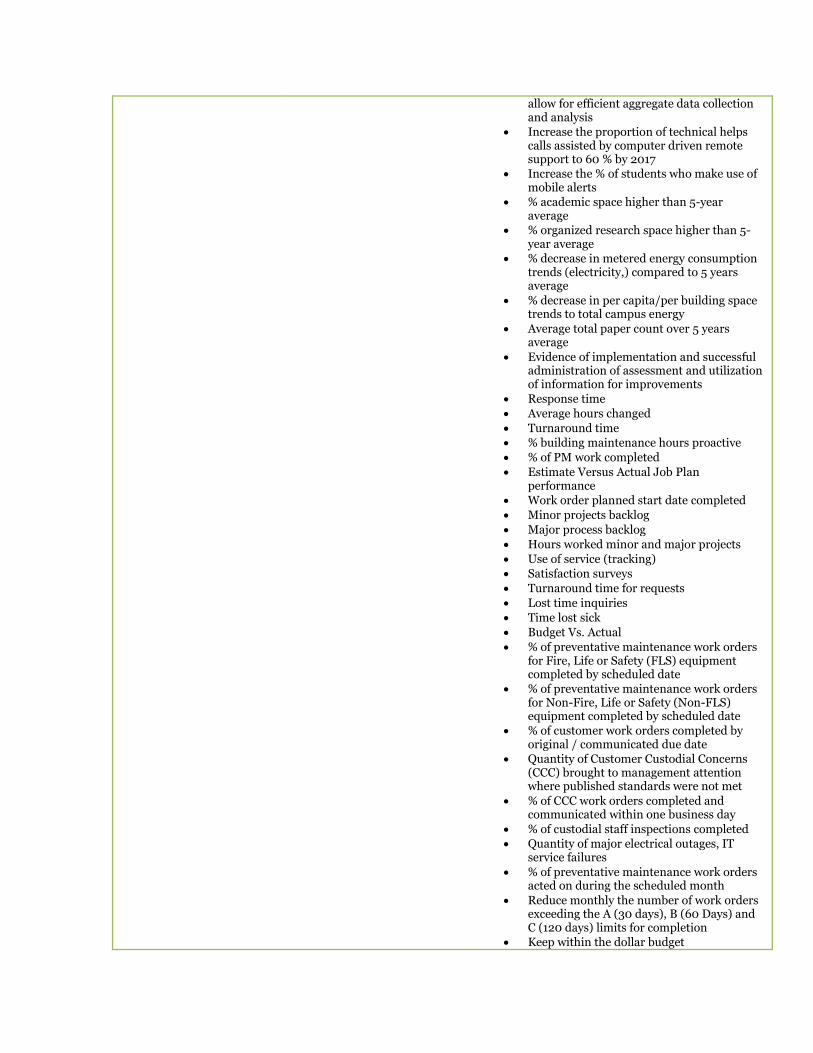
Table 4.3: Indicator Groups for each of the Key Categorical KPIs Area
Key Categorical Areas where KPIs are important
Indicator Group Illustrative KPIs of Indicator Group
Infrastructure / Technology / Resources
Physical Plant
Investment in infrastructure
Cost Efficiency / Productivity
Proportion of modernized teaching rooms
Cost of maintenance
Utilization per sq. meter
Customer impact tools are utilized to gauge effectiveness of service delivery
Review of monthly compliance reports
Annual spending on infrastructure to agreed annual requirement
Maintenance condition and functional sustainability of estate
Wastage
Cost efficiency / Productivity
Utilization – square meters per student
Return on assets : income per square meter
Proportion of modernized rooms Adequacy of library resources for research
needs
Average space (in sq. meter) per research FTE by type of research facility (laboratories, office space)
Inventory of research-related capital is developed
Review, improvement and enforcement of university-wide safety related policies and procedures
Positions for research are reviewed and established at the college level
Faculty and research support staff satisfaction with research activity support

(protected time, funding, facilities, staff, equipment, etc.)
% of administrative units that achieved their planned objectives
% of internal / external clients “satisfied” or “strongly satisfied” with services by all functional units (finance, IT, HR, procurement, Business operation, Housing, Student services, Library, External relations, Institutional research)
% of staff (by functional units) attending customer-oriented training programs annually
Number of complaints / service failure about service provisions relating to time, quality, attitude / mind sets / capabilities
Teaching and Research Space as a proportion of Total Space
Room Utilization
Deferred Maintenance Backlog
Library Resources: LibQUAL Survey Results
Information Technology Costs
Central Administrative Costs
Usage and growth of digital repositories Percentage of faculty reporting use of Open
Educational Resources (OER) materials
Cost for "commodity" information technology services
Percentage of faculty and staff computers with anti-virus software, spyware detection software, and adware detection software installed
Percentage of faculty and staff laptops with full disk-drive encryption
Percentage of University’s merchants who are Payment Card Industry (PCI) compliant
Percentage of University units meeting current security standards
Utilization rate of classroom space
Utilization rate of research space
Housing Occupancy – percentage of available beds rented.
Percentage of faculty compensated at or above the average salary by rank and discipline.
Percentage of staff compensated at the average market salary based on employment category.
Percentage of total classroom renovations completed.
Percentage of total residence hall rooms renovated.
User satisfaction with learning resources
Strategic development funds as percentage of turnover
100% of faculty and students will use campus LMS
All departments will establish and implement an appropriate assessment process that utilizes available technology to
allow for efficient aggregate data collection and analysis
Increase the proportion of technical helps calls assisted by computer driven remote support to 60 % by 2017
Increase the % of students who make use of mobile alerts
% academic space higher than 5-year average
% organized research space higher than 5-year average
% decrease in metered energy consumption trends (electricity,) compared to 5 years average
% decrease in per capita/per building space trends to total campus energy
Average total paper count over 5 years average
Evidence of implementation and successful administration of assessment and utilization of information for improvements
Response time
Average hours changed
Turnaround time % building maintenance hours proactive
% of PM work completed
Estimate Versus Actual Job Plan performance
Work order planned start date completed
Minor projects backlog
Major process backlog
Hours worked minor and major projects
Use of service (tracking) Satisfaction surveys
Turnaround time for requests
Lost time inquiries
Time lost sick
Budget Vs. Actual
% of preventative maintenance work orders for Fire, Life or Safety (FLS) equipment completed by scheduled date
% of preventative maintenance work orders for Non-Fire, Life or Safety (Non-FLS) equipment completed by scheduled date
% of customer work orders completed by original / communicated due date
Quantity of Customer Custodial Concerns (CCC) brought to management attention where published standards were not met
% of CCC work orders completed and communicated within one business day
% of custodial staff inspections completed Quantity of major electrical outages, IT
service failures
% of preventative maintenance work orders acted on during the scheduled month
Reduce monthly the number of work orders exceeding the A (30 days), B (60 Days) and C (120 days) limits for completion
Keep within the dollar budget
Keep the running 12 moth average at 5% for labor overtime hours
Attain Level 1 Custodial Care
Reduce energy density as compared to previous years
Keep energy density below System Median
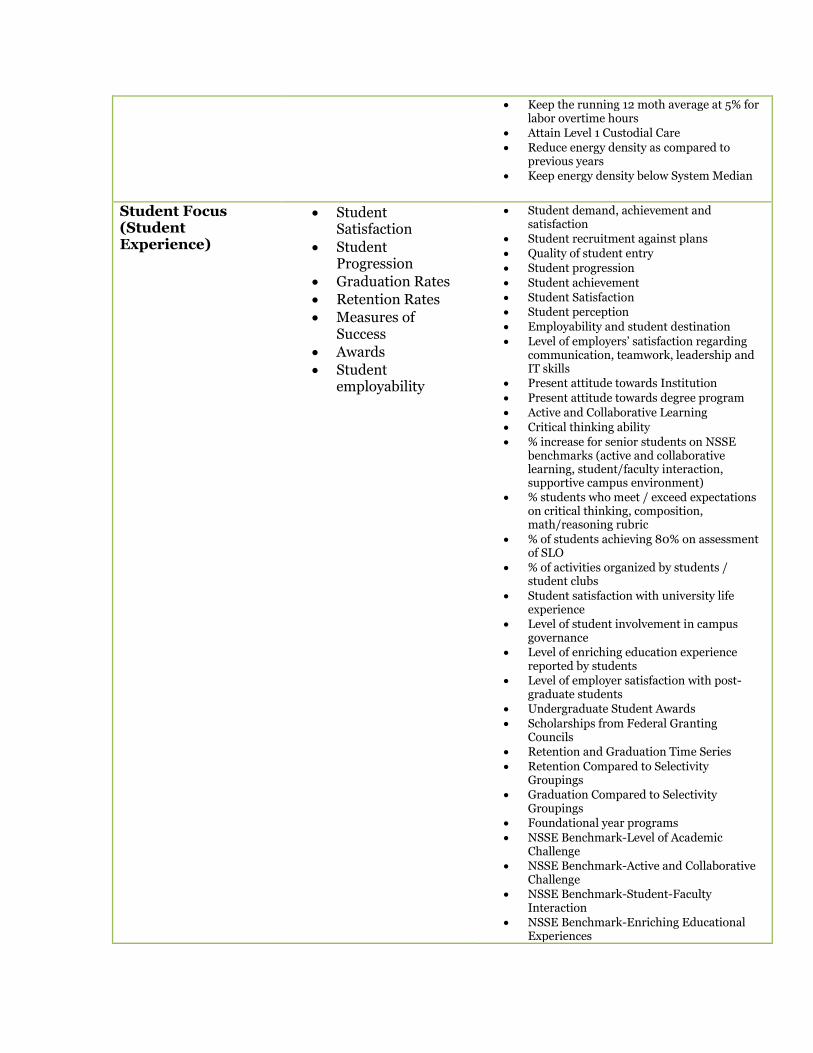
Student Focus (Student Experience)
Student Satisfaction
Student Progression
Graduation Rates
Retention Rates
Measures of Success
Awards
Student employability
Student demand, achievement and satisfaction
Student recruitment against plans
Quality of student entry
Student progression
Student achievement
Student Satisfaction Student perception
Employability and student destination
Level of employers’ satisfaction regarding communication, teamwork, leadership and IT skills
Present attitude towards Institution
Present attitude towards degree program
Active and Collaborative Learning
Critical thinking ability
% increase for senior students on NSSE benchmarks (active and collaborative learning, student/faculty interaction, supportive campus environment)
% students who meet / exceed expectations on critical thinking, composition, math/reasoning rubric
% of students achieving 80% on assessment of SLO
% of activities organized by students / student clubs
Student satisfaction with university life experience
Level of student involvement in campus governance
Level of enriching education experience reported by students
Level of employer satisfaction with post-graduate students
Undergraduate Student Awards
Scholarships from Federal Granting Councils
Retention and Graduation Time Series
Retention Compared to Selectivity Groupings
Graduation Compared to Selectivity Groupings
Foundational year programs
NSSE Benchmark-Level of Academic Challenge
NSSE Benchmark-Active and Collaborative Challenge
NSSE Benchmark-Student-Faculty Interaction
NSSE Benchmark-Enriching Educational Experiences

NSSE Benchmark-Supportive Campus Environment
Percentage of academic programs with specified learning objectives
Percentage of academic programs with a formal assessment plan
Percentage of undergraduates who have participated in academic research with faculty outside of class, written a thesis, or completed a capstone project
First-year and third-year undergraduate retention rates
Four-year and six-year undergraduate graduation rates
Graduate student completion rate
Average graduate student time-to-degree
Selected measures from the National Survey of Student Engagement (NSSE) such as "Level of Academic Challenge", "Active and Collaborative Learning", "Student-Faculty Interaction", "Enriching Educational Experiences", "Supportive Campus Environment" and "Percent of students reporting having completed a practicum, internship, field experience, co-op experience, or clinical assignment"
Percentage of students reporting that university contributed to their "developing a personal code of values and ethics"
Number of graduate assistantships and fellowships
Total funds available for graduate assistantships and fellowships
First year to Second Year Retention Rate
First year to Third Year Retention Rate
Six Year Graduation Rate
New Freshmen Enrolment Undergraduates with declared majors
Average ACT score of incoming freshmen.
Percentage of FTFTFR fully college ready.
Amount of funding applied to institution Scholarships awarded to students to which academic criteria is attached.
Number of students who receive scholarship first year and return with scholarship second year
A comparison of the success rate of students who took a developmental course in English, Math and/or Reading in their next course in that discipline compared to students who did not take a developmental course, what percentage pass the following course taken for credit.
Percentage of students participating in the Celebration of Student Scholarship. (% change from previous year.)
# of graduate assistantships
# of internships completed for credit as part of a course
# of undergraduate research fellowships awarded
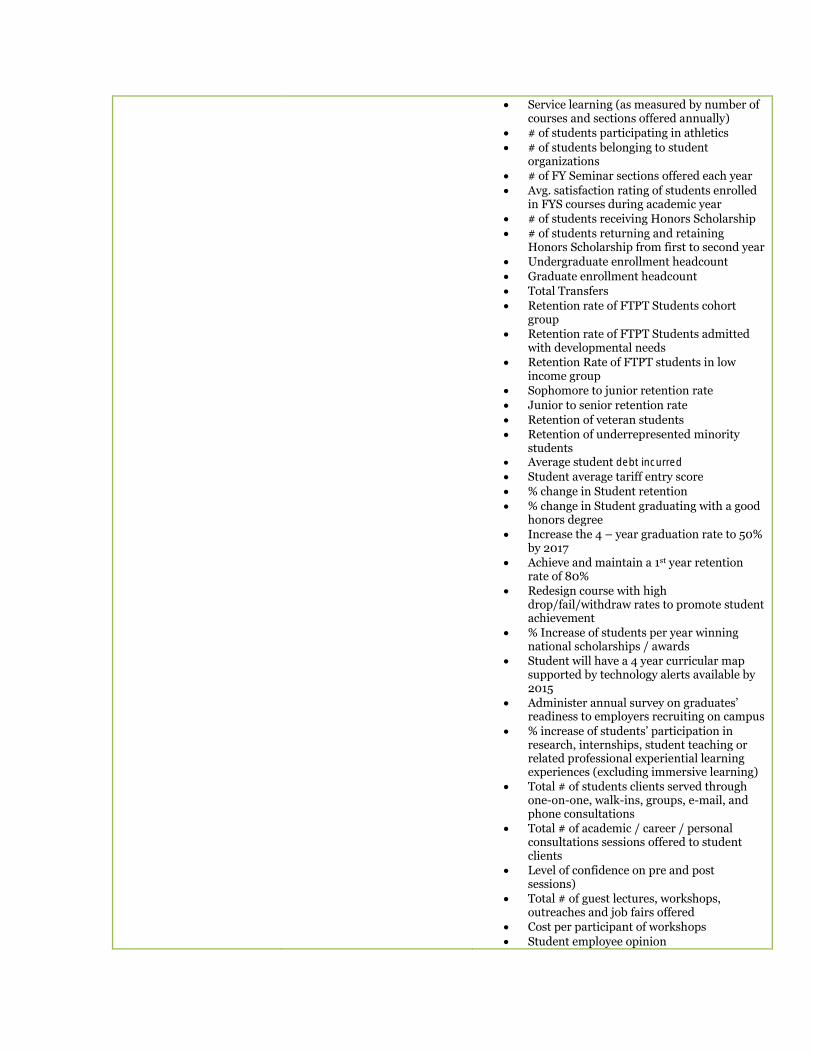
Service learning (as measured by number of courses and sections offered annually)
# of students participating in athletics
# of students belonging to student organizations
# of FY Seminar sections offered each year
Avg. satisfaction rating of students enrolled in FYS courses during academic year
# of students receiving Honors Scholarship
# of students returning and retaining Honors Scholarship from first to second year
Undergraduate enrollment headcount
Graduate enrollment headcount
Total Transfers
Retention rate of FTPT Students cohort group
Retention rate of FTPT Students admitted with developmental needs
Retention Rate of FTPT students in low income group
Sophomore to junior retention rate
Junior to senior retention rate
Retention of veteran students Retention of underrepresented minority
students Average student debt incurred
Student average tariff entry score
% change in Student retention
% change in Student graduating with a good honors degree
Increase the 4 – year graduation rate to 50% by 2017
Achieve and maintain a 1st year retention rate of 80%
Redesign course with high drop/fail/withdraw rates to promote student achievement
% Increase of students per year winning national scholarships / awards
Student will have a 4 year curricular map supported by technology alerts available by 2015
Administer annual survey on graduates’ readiness to employers recruiting on campus
% increase of students’ participation in research, internships, student teaching or related professional experiential learning experiences (excluding immersive learning)
Total # of students clients served through one-on-one, walk-ins, groups, e-mail, and phone consultations
Total # of academic / career / personal consultations sessions offered to student clients
Level of confidence on pre and post sessions)
Total # of guest lectures, workshops, outreaches and job fairs offered
Cost per participant of workshops
Student employee opinion
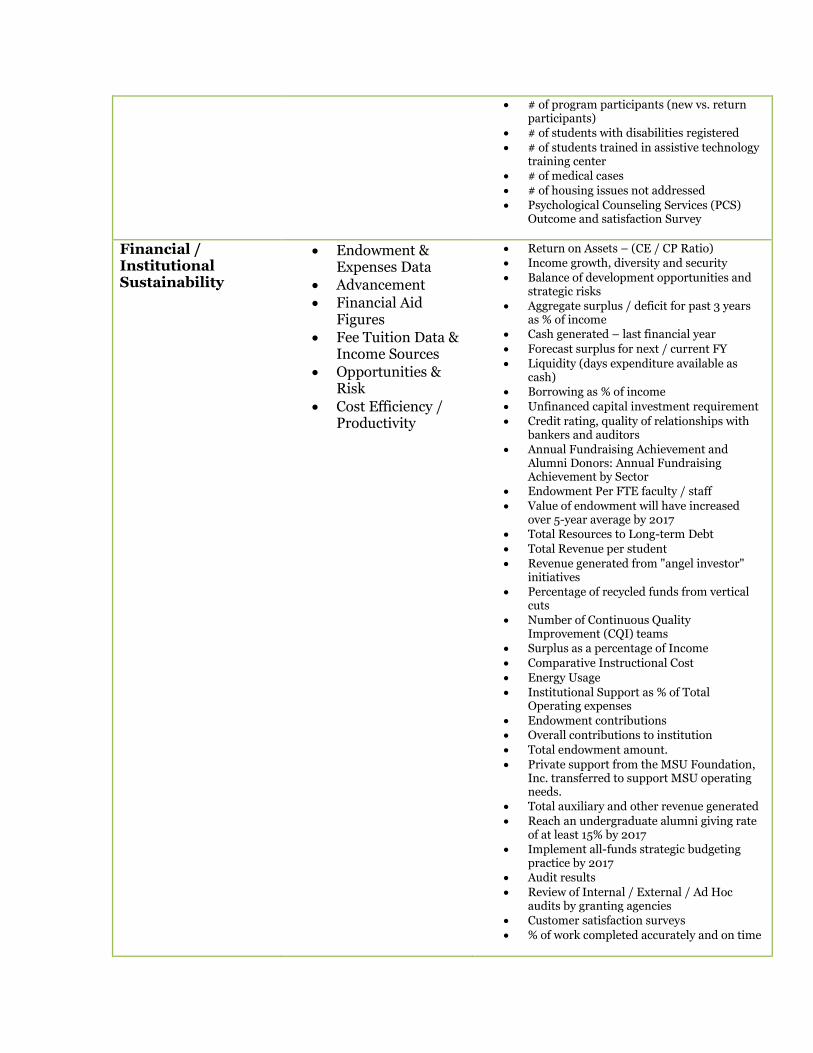
# of program participants (new vs. return participants)
# of students with disabilities registered
# of students trained in assistive technology training center
# of medical cases
# of housing issues not addressed
Psychological Counseling Services (PCS) Outcome and satisfaction Survey
Financial / Institutional Sustainability
Endowment & Expenses Data
Advancement
Financial Aid Figures
Fee Tuition Data & Income Sources
Opportunities & Risk
Cost Efficiency / Productivity
Return on Assets – (CE / CP Ratio) Income growth, diversity and security
Balance of development opportunities and strategic risks
Aggregate surplus / deficit for past 3 years as % of income
Cash generated – last financial year
Forecast surplus for next / current FY
Liquidity (days expenditure available as cash)
Borrowing as % of income
Unfinanced capital investment requirement
Credit rating, quality of relationships with bankers and auditors
Annual Fundraising Achievement and Alumni Donors: Annual Fundraising Achievement by Sector
Endowment Per FTE faculty / staff
Value of endowment will have increased over 5-year average by 2017
Total Resources to Long-term Debt
Total Revenue per student
Revenue generated from "angel investor" initiatives
Percentage of recycled funds from vertical cuts
Number of Continuous Quality Improvement (CQI) teams
Surplus as a percentage of Income
Comparative Instructional Cost
Energy Usage
Institutional Support as % of Total Operating expenses
Endowment contributions Overall contributions to institution
Total endowment amount.
Private support from the MSU Foundation, Inc. transferred to support MSU operating needs.
Total auxiliary and other revenue generated
Reach an undergraduate alumni giving rate of at least 15% by 2017
Implement all-funds strategic budgeting practice by 2017
Audit results
Review of Internal / External / Ad Hoc audits by granting agencies
Customer satisfaction surveys
% of work completed accurately and on time
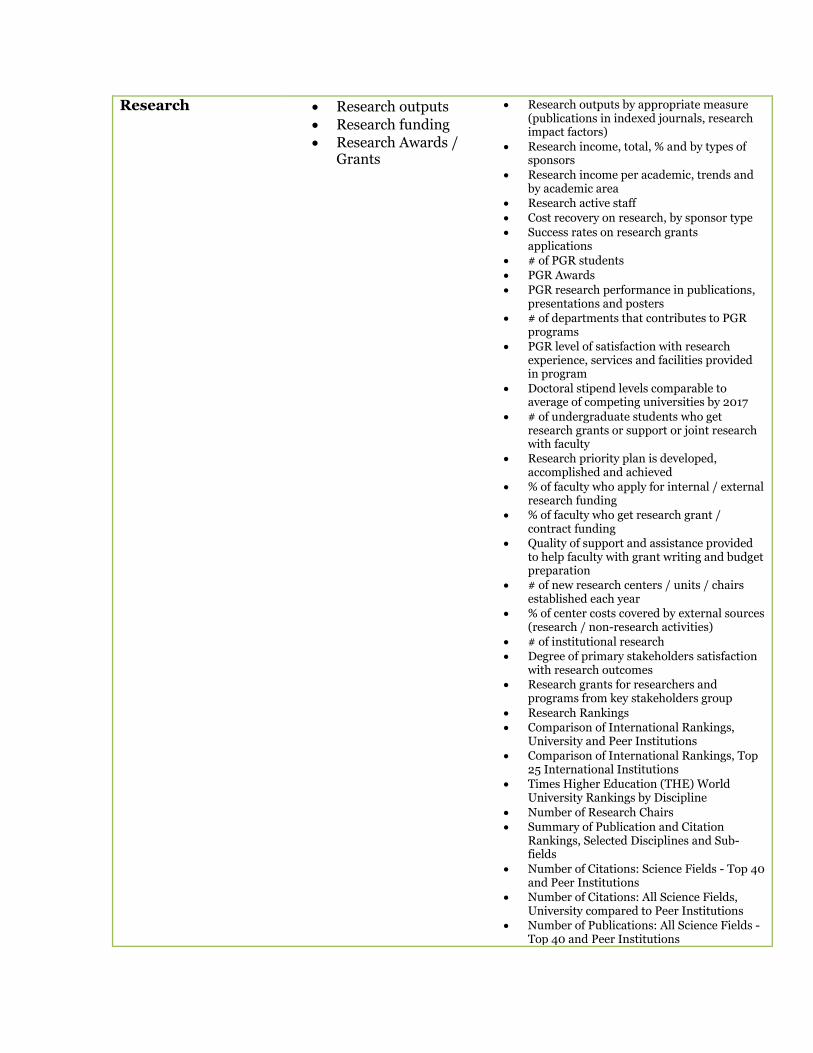
Research Research outputs
Research funding
Research Awards / Grants
Research outputs by appropriate measure (publications in indexed journals, research impact factors)
Research income, total, % and by types of sponsors
Research income per academic, trends and by academic area
Research active staff
Cost recovery on research, by sponsor type Success rates on research grants
applications # of PGR students
PGR Awards
PGR research performance in publications, presentations and posters
# of departments that contributes to PGR programs
PGR level of satisfaction with research experience, services and facilities provided in program
Doctoral stipend levels comparable to average of competing universities by 2017
# of undergraduate students who get research grants or support or joint research with faculty
Research priority plan is developed, accomplished and achieved
% of faculty who apply for internal / external research funding
% of faculty who get research grant / contract funding
Quality of support and assistance provided to help faculty with grant writing and budget preparation
# of new research centers / units / chairs established each year
% of center costs covered by external sources (research / non-research activities)
# of institutional research Degree of primary stakeholders satisfaction
with research outcomes Research grants for researchers and
programs from key stakeholders group
Research Rankings Comparison of International Rankings,
University and Peer Institutions Comparison of International Rankings, Top
25 International Institutions Times Higher Education (THE) World
University Rankings by Discipline
Number of Research Chairs Summary of Publication and Citation
Rankings, Selected Disciplines and Sub-fields
Number of Citations: Science Fields - Top 40 and Peer Institutions
Number of Citations: All Science Fields, University compared to Peer Institutions
Number of Publications: All Science Fields - Top 40 and Peer Institutions

Number of Publications: Science Fields, University compared to Peer Institutions
Research Funding from Industrial Sources
total Research funding awarded by sector
Graduate Publications and Presentations
Total research expenditures
Number of extramural research awards
Average amount of research awards Number of endowed chairs, professorships,
and faculty fellowships
Percentage of tenured faculty holding endowed chairs, professorships, and faculty fellowships
Total funds available for endowed chairs, professorships, and faculty fellowships
Total external research and development funding.
Percentage of external research and grant proposals funded.
Total F & A funds earned from external research and development awards.
% academic staff who are research active
% academic staff with internationally excellent research
By 2017, 10 articles will be published or papers presented at professional conferences reporting on immersive learning projects
Recognize immersive learning in promotion and tenure and salary documents at the department and college levels by 2017
Provide every undergraduate students with an immersive learning opportunity by maintaining a minimum of 4,200 students annually in immersive learning projects
All undergraduate programs will offer at least one immersive learning opportunity each year
Establish four annual university wide immersive learning awards
Appoint eight college-based immersive learning Presidential Fellows to support faculty by 2017
% increase of students’ presentation at national / regional disciplinary conferences
% increase in research expenditures
Education Offers (Teaching and Learning)
Peer Assessment Data
Admission Scores
Quality of Student entry
General Admission Tests
Graduate Admissions
Enrolment Figures
Academic
Teaching / Research Balance
Learning and Teaching performance
Evidence of academic distinctiveness
Position in peer group and league tables
Contribution of strategic academic relationships
Medium term academic ambitions
Results of external assessment % of academic programs accredited by
accreditation agencies
% of academic degree programs and core curriculum completing peer reviews according to university academic review
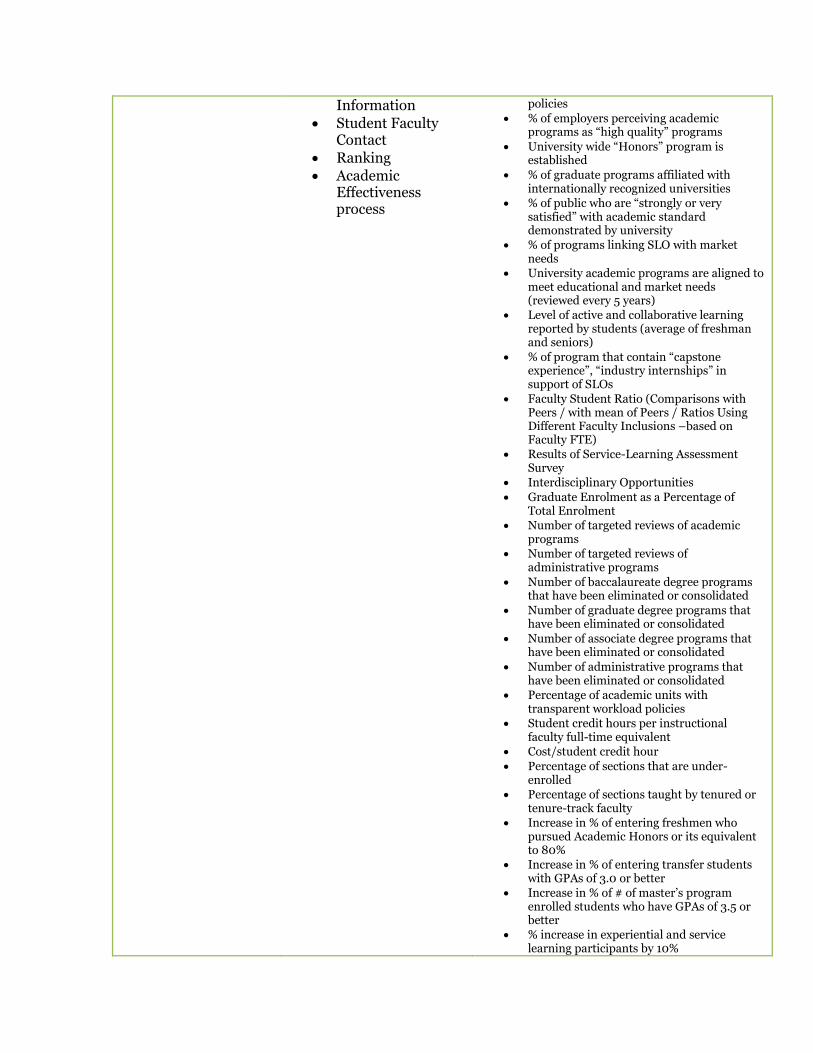
Information
Student Faculty Contact
Ranking
Academic Effectiveness process
policies
% of employers perceiving academic programs as “high quality” programs
University wide “Honors” program is established
% of graduate programs affiliated with internationally recognized universities
% of public who are “strongly or very satisfied” with academic standard demonstrated by university
% of programs linking SLO with market needs
University academic programs are aligned to meet educational and market needs (reviewed every 5 years)
Level of active and collaborative learning reported by students (average of freshman and seniors)
% of program that contain “capstone experience”, “industry internships” in support of SLOs
Faculty Student Ratio (Comparisons with Peers / with mean of Peers / Ratios Using Different Faculty Inclusions –based on Faculty FTE)
Results of Service-Learning Assessment Survey
Interdisciplinary Opportunities
Graduate Enrolment as a Percentage of Total Enrolment
Number of targeted reviews of academic programs
Number of targeted reviews of administrative programs
Number of baccalaureate degree programs that have been eliminated or consolidated
Number of graduate degree programs that have been eliminated or consolidated
Number of associate degree programs that have been eliminated or consolidated
Number of administrative programs that have been eliminated or consolidated
Percentage of academic units with transparent workload policies
Student credit hours per instructional faculty full-time equivalent
Cost/student credit hour
Percentage of sections that are under-enrolled
Percentage of sections taught by tenured or tenure-track faculty
Increase in % of entering freshmen who pursued Academic Honors or its equivalent to 80%
Increase in % of entering transfer students with GPAs of 3.0 or better
Increase in % of # of master’s program enrolled students who have GPAs of 3.5 or better
% increase in experiential and service learning participants by 10%
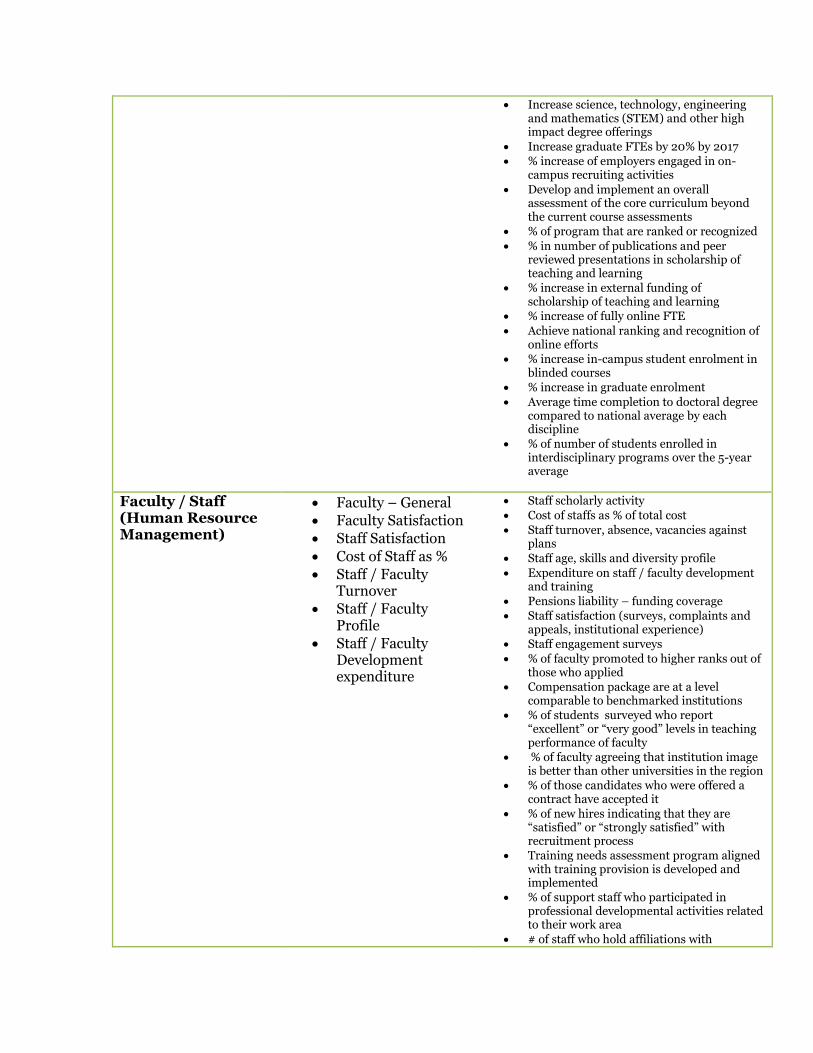
Increase science, technology, engineering and mathematics (STEM) and other high impact degree offerings
Increase graduate FTEs by 20% by 2017 % increase of employers engaged in on-
campus recruiting activities
Develop and implement an overall assessment of the core curriculum beyond the current course assessments
% of program that are ranked or recognized
% in number of publications and peer reviewed presentations in scholarship of teaching and learning
% increase in external funding of scholarship of teaching and learning
% increase of fully online FTE
Achieve national ranking and recognition of online efforts
% increase in-campus student enrolment in blinded courses
% increase in graduate enrolment
Average time completion to doctoral degree compared to national average by each discipline
% of number of students enrolled in interdisciplinary programs over the 5-year average
Faculty / Staff (Human Resource Management)
Faculty – General
Faculty Satisfaction
Staff Satisfaction
Cost of Staff as %
Staff / Faculty Turnover
Staff / Faculty Profile
Staff / Faculty Development expenditure
Staff scholarly activity
Cost of staffs as % of total cost
Staff turnover, absence, vacancies against plans
Staff age, skills and diversity profile
Expenditure on staff / faculty development and training
Pensions liability – funding coverage Staff satisfaction (surveys, complaints and
appeals, institutional experience) Staff engagement surveys
% of faculty promoted to higher ranks out of those who applied
Compensation package are at a level comparable to benchmarked institutions
% of students surveyed who report “excellent” or “very good” levels in teaching performance of faculty
% of faculty agreeing that institution image is better than other universities in the region
% of those candidates who were offered a contract have accepted it
% of new hires indicating that they are “satisfied” or “strongly satisfied” with recruitment process
Training needs assessment program aligned with training provision is developed and implemented
% of support staff who participated in professional developmental activities related to their work area
# of staff who hold affiliations with
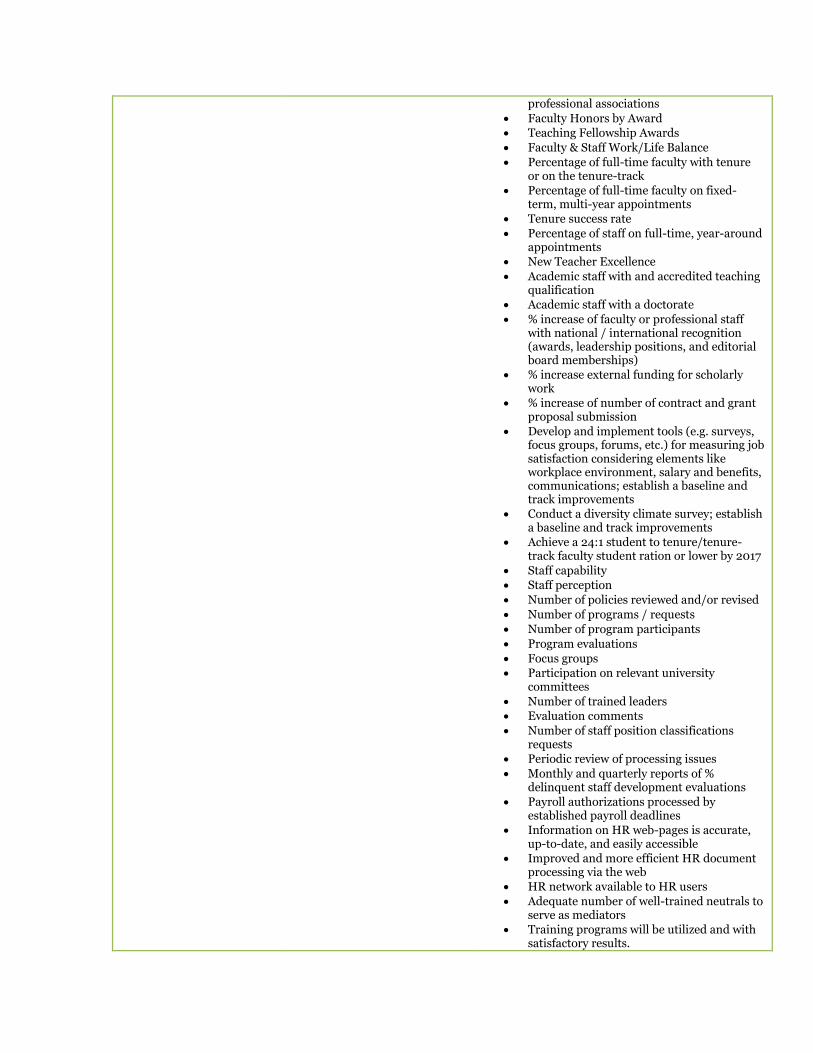
professional associations
Faculty Honors by Award Teaching Fellowship Awards
Faculty & Staff Work/Life Balance
Percentage of full-time faculty with tenure or on the tenure-track
Percentage of full-time faculty on fixed-term, multi-year appointments
Tenure success rate
Percentage of staff on full-time, year-around appointments
New Teacher Excellence
Academic staff with and accredited teaching qualification
Academic staff with a doctorate
% increase of faculty or professional staff with national / international recognition (awards, leadership positions, and editorial board memberships)
% increase external funding for scholarly work
% increase of number of contract and grant proposal submission
Develop and implement tools (e.g. surveys, focus groups, forums, etc.) for measuring job satisfaction considering elements like workplace environment, salary and benefits, communications; establish a baseline and track improvements
Conduct a diversity climate survey; establish a baseline and track improvements
Achieve a 24:1 student to tenure/tenure-track faculty student ration or lower by 2017
Staff capability Staff perception
Number of policies reviewed and/or revised
Number of programs / requests
Number of program participants
Program evaluations
Focus groups Participation on relevant university
committees
Number of trained leaders Evaluation comments
Number of staff position classifications requests
Periodic review of processing issues
Monthly and quarterly reports of % delinquent staff development evaluations
Payroll authorizations processed by established payroll deadlines
Information on HR web-pages is accurate, up-to-date, and easily accessible
Improved and more efficient HR document processing via the web
HR network available to HR users
Adequate number of well-trained neutrals to serve as mediators
Training programs will be utilized and with satisfactory results.
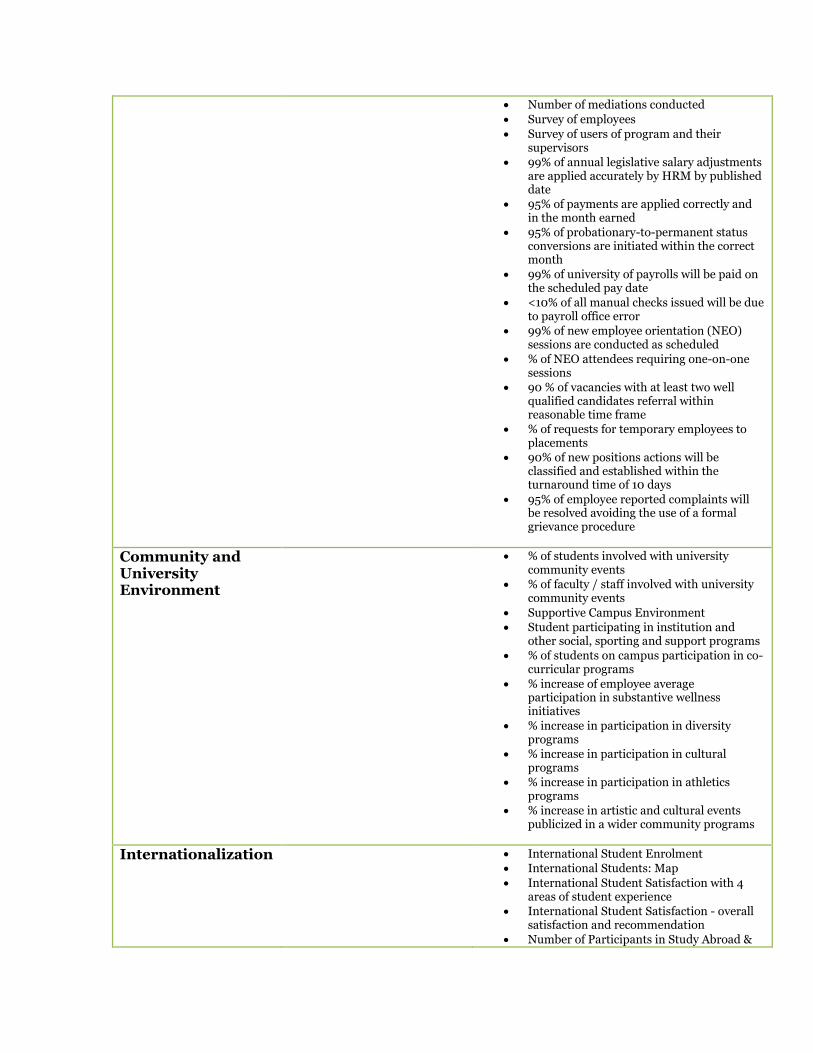
Number of mediations conducted
Survey of employees
Survey of users of program and their supervisors
99% of annual legislative salary adjustments are applied accurately by HRM by published date
95% of payments are applied correctly and in the month earned
95% of probationary-to-permanent status conversions are initiated within the correct month
99% of university of payrolls will be paid on the scheduled pay date
<10% of all manual checks issued will be due to payroll office error
99% of new employee orientation (NEO) sessions are conducted as scheduled
% of NEO attendees requiring one-on-one sessions
90 % of vacancies with at least two well qualified candidates referral within reasonable time frame
% of requests for temporary employees to placements
90% of new positions actions will be classified and established within the turnaround time of 10 days
95% of employee reported complaints will be resolved avoiding the use of a formal grievance procedure
Community and University Environment
% of students involved with university community events
% of faculty / staff involved with university community events
Supportive Campus Environment Student participating in institution and
other social, sporting and support programs % of students on campus participation in co-
curricular programs
% increase of employee average participation in substantive wellness initiatives
% increase in participation in diversity programs
% increase in participation in cultural programs
% increase in participation in athletics programs
% increase in artistic and cultural events publicized in a wider community programs
Internationalization
International Student Enrolment International Students: Map
International Student Satisfaction with 4 areas of student experience
International Student Satisfaction - overall satisfaction and recommendation
Number of Participants in Study Abroad &
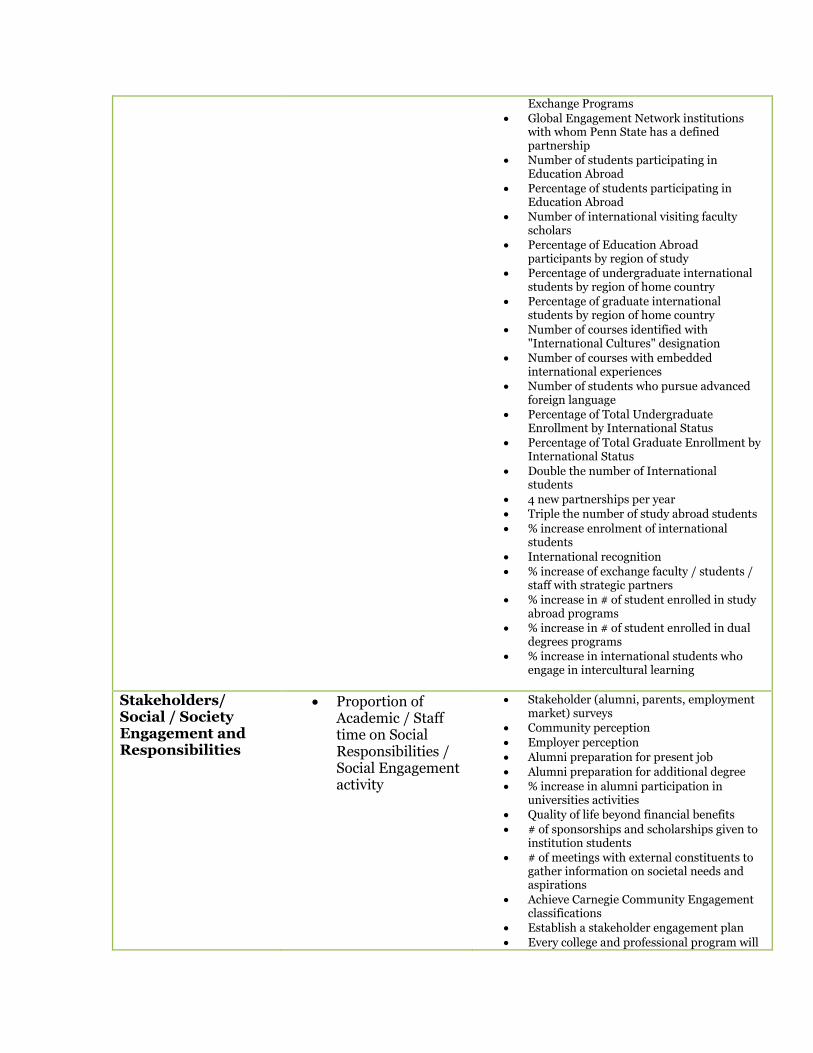
Exchange Programs
Global Engagement Network institutions with whom Penn State has a defined partnership
Number of students participating in Education Abroad
Percentage of students participating in Education Abroad
Number of international visiting faculty scholars
Percentage of Education Abroad participants by region of study
Percentage of undergraduate international students by region of home country
Percentage of graduate international students by region of home country
Number of courses identified with "International Cultures" designation
Number of courses with embedded international experiences
Number of students who pursue advanced foreign language
Percentage of Total Undergraduate Enrollment by International Status
Percentage of Total Graduate Enrollment by International Status
Double the number of International students
4 new partnerships per year Triple the number of study abroad students
% increase enrolment of international students
International recognition
% increase of exchange faculty / students / staff with strategic partners
% increase in # of student enrolled in study abroad programs
% increase in # of student enrolled in dual degrees programs
% increase in international students who engage in intercultural learning
Stakeholders/ Social / Society Engagement and Responsibilities
Proportion of Academic / Staff time on Social Responsibilities / Social Engagement activity
Stakeholder (alumni, parents, employment market) surveys
Community perception
Employer perception
Alumni preparation for present job
Alumni preparation for additional degree % increase in alumni participation in
universities activities
Quality of life beyond financial benefits
# of sponsorships and scholarships given to institution students
# of meetings with external constituents to gather information on societal needs and aspirations
Achieve Carnegie Community Engagement classifications
Establish a stakeholder engagement plan
Every college and professional program will
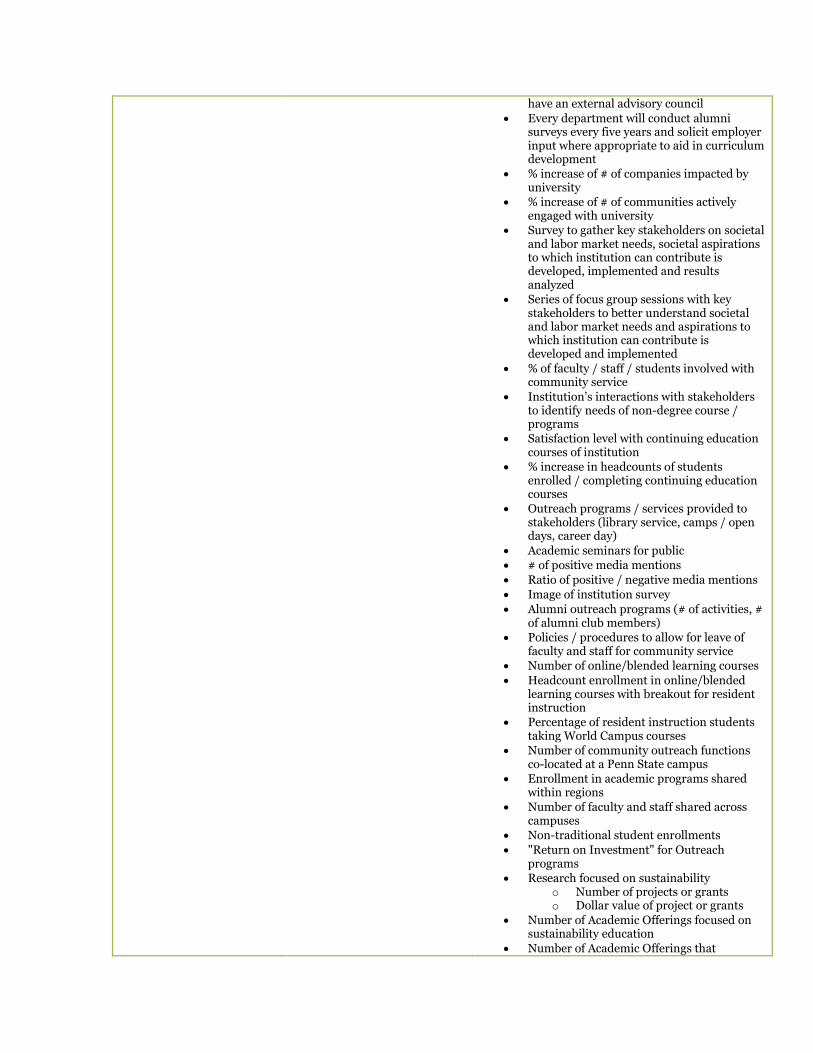
have an external advisory council
Every department will conduct alumni surveys every five years and solicit employer input where appropriate to aid in curriculum development
% increase of # of companies impacted by university
% increase of # of communities actively engaged with university
Survey to gather key stakeholders on societal and labor market needs, societal aspirations to which institution can contribute is developed, implemented and results analyzed
Series of focus group sessions with key stakeholders to better understand societal and labor market needs and aspirations to which institution can contribute is developed and implemented
% of faculty / staff / students involved with community service
Institution’s interactions with stakeholders to identify needs of non-degree course / programs
Satisfaction level with continuing education courses of institution
% increase in headcounts of students enrolled / completing continuing education courses
Outreach programs / services provided to stakeholders (library service, camps / open days, career day)
Academic seminars for public # of positive media mentions
Ratio of positive / negative media mentions
Image of institution survey
Alumni outreach programs (# of activities, # of alumni club members)
Policies / procedures to allow for leave of faculty and staff for community service
Number of online/blended learning courses
Headcount enrollment in online/blended learning courses with breakout for resident instruction
Percentage of resident instruction students taking World Campus courses
Number of community outreach functions co-located at a Penn State campus
Enrollment in academic programs shared within regions
Number of faculty and staff shared across campuses
Non-traditional student enrollments
"Return on Investment" for Outreach programs
Research focused on sustainability o Number of projects or grants o Dollar value of project or grants
Number of Academic Offerings focused on sustainability education
Number of Academic Offerings that
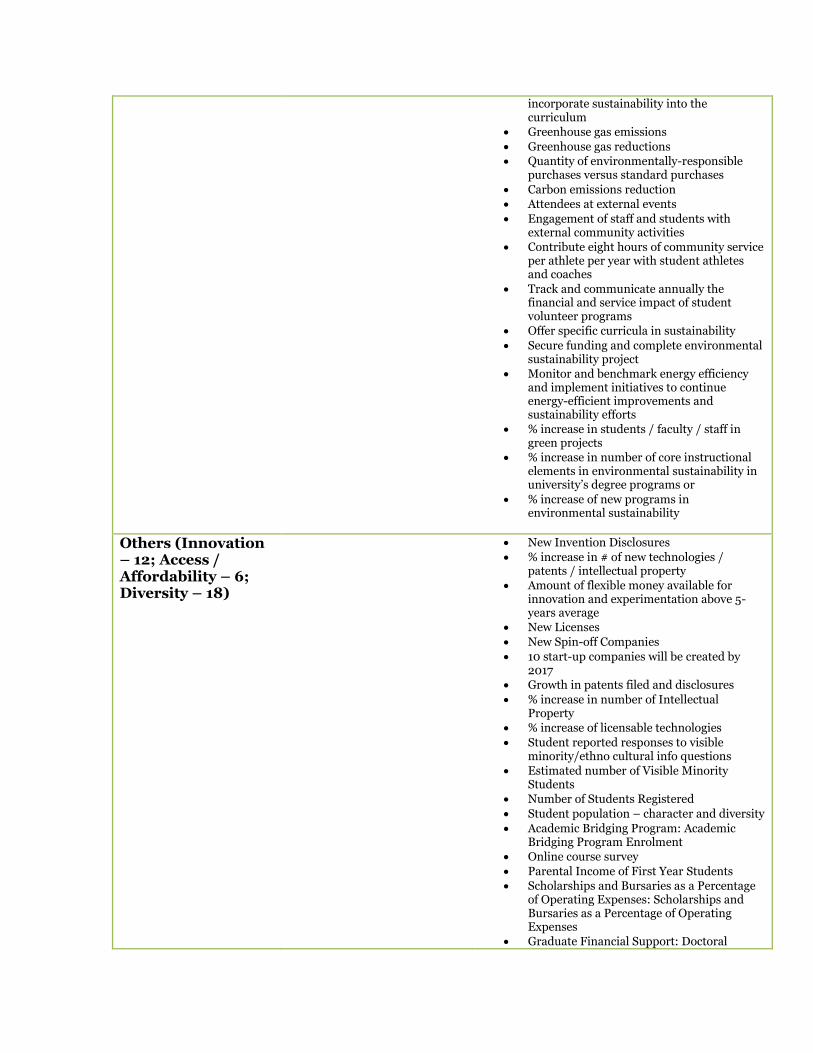
incorporate sustainability into the curriculum
Greenhouse gas emissions
Greenhouse gas reductions Quantity of environmentally-responsible
purchases versus standard purchases
Carbon emissions reduction Attendees at external events
Engagement of staff and students with external community activities
Contribute eight hours of community service per athlete per year with student athletes and coaches
Track and communicate annually the financial and service impact of student volunteer programs
Offer specific curricula in sustainability
Secure funding and complete environmental sustainability project
Monitor and benchmark energy efficiency and implement initiatives to continue energy-efficient improvements and sustainability efforts
% increase in students / faculty / staff in green projects
% increase in number of core instructional elements in environmental sustainability in university’s degree programs or
% increase of new programs in environmental sustainability
Others (Innovation – 12; Access / Affordability – 6; Diversity – 18)
New Invention Disclosures
% increase in # of new technologies / patents / intellectual property
Amount of flexible money available for innovation and experimentation above 5-years average
New Licenses
New Spin-off Companies
10 start-up companies will be created by 2017
Growth in patents filed and disclosures
% increase in number of Intellectual Property
% increase of licensable technologies
Student reported responses to visible minority/ethno cultural info questions
Estimated number of Visible Minority Students
Number of Students Registered
Student population – character and diversity
Academic Bridging Program: Academic Bridging Program Enrolment
Online course survey
Parental Income of First Year Students Scholarships and Bursaries as a Percentage
of Operating Expenses: Scholarships and Bursaries as a Percentage of Operating Expenses
Graduate Financial Support: Doctoral

Student Support: Average Financial Support
Percentage of students receiving need-based institutional scholarships
General Funds available for need-based aid Total funds available for need-based aid
Total unmet need
Progress in meeting the "Ensuring Student Opportunity" goal of the "For the Future" capital campaign
Percentage of full-time faculty by demographic group
Percentage of full-time staff by demographic group
Percentage of undergraduate enrollment by demographic group
Six-year baccalaureate degree graduation rates by demographic group
First-year and third-year retention rates by demographic group
Percentage of graduate enrollment by demographic group
Completion rates for graduate students by demographic group
Average time-to-degree for graduate students by demographic group
Tenure success rate of faculty by demographic group
Undergraduate enrollment of underrepresented minority students headcount
Graduate enrollment of underrepresented minority students headcount
Bachelor’s degrees awarded to underrepresented minorities
Bachelor's degrees awarded to low income students
Master’s degrees awarded to underrepresented minorities
Doctoral degrees awarded to underrepresented minorities
Bachelor’s graduation rate gap- Low income Bachelor’s graduation rate gap-
Underprepared
Bachelor’s graduation rate gap- Underrepresented Minority
Bachelor’s graduation rate gap- veterans/dependents
Every five years, complete an audit of campus services aimed at welcoming a diverse student body, faculty and staff and adjust as necessary
% increase enrolment of at-risk students
% increase graduation of at-risk students
Create / revise unit level diversity plans with faculty, professional personnel, classified staff, and service personnel recruitment targets
% increase enrolment of underrepresented students
% increase of entering students comes from
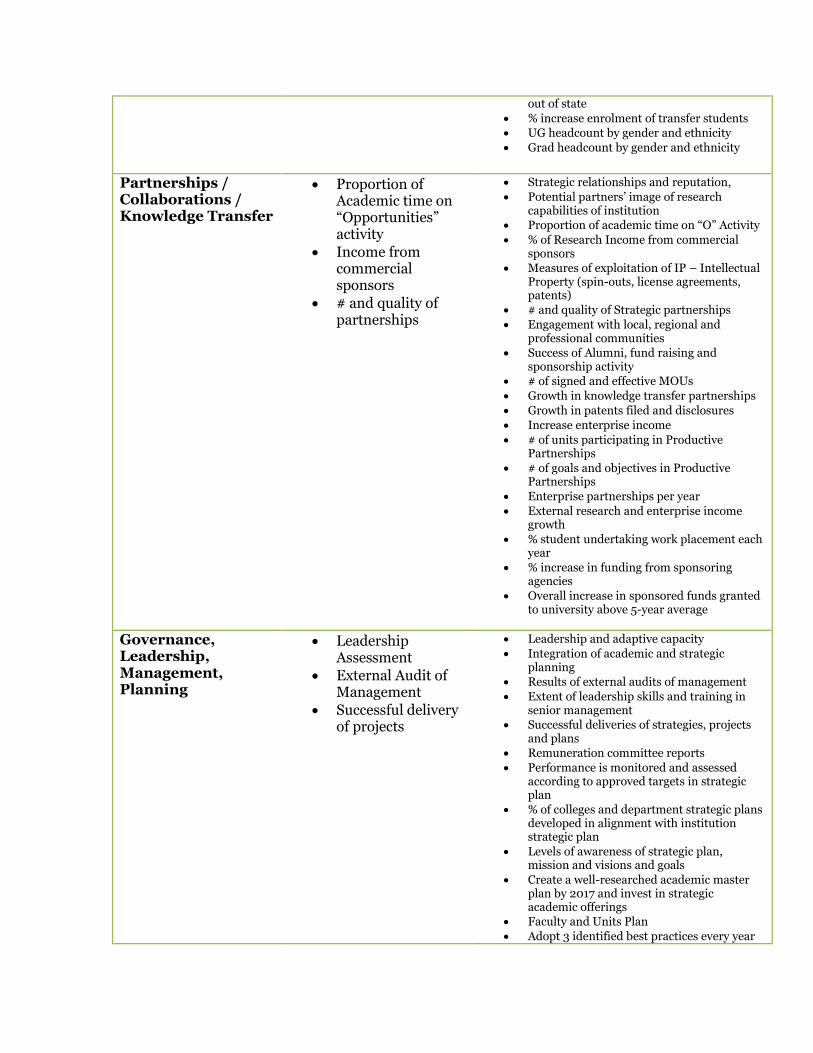
out of state
% increase enrolment of transfer students UG headcount by gender and ethnicity
Grad headcount by gender and ethnicity
Partnerships / Collaborations / Knowledge Transfer
Proportion of Academic time on “Opportunities” activity
Income from commercial sponsors
# and quality of partnerships
Strategic relationships and reputation,
Potential partners’ image of research capabilities of institution
Proportion of academic time on “O” Activity
% of Research Income from commercial sponsors
Measures of exploitation of IP – Intellectual Property (spin-outs, license agreements, patents)
# and quality of Strategic partnerships
Engagement with local, regional and professional communities
Success of Alumni, fund raising and sponsorship activity
# of signed and effective MOUs
Growth in knowledge transfer partnerships
Growth in patents filed and disclosures
Increase enterprise income
# of units participating in Productive Partnerships
# of goals and objectives in Productive Partnerships
Enterprise partnerships per year
External research and enterprise income growth
% student undertaking work placement each year
% increase in funding from sponsoring agencies
Overall increase in sponsored funds granted to university above 5-year average
Governance, Leadership, Management, Planning
Leadership Assessment
External Audit of Management
Successful delivery of projects
Leadership and adaptive capacity
Integration of academic and strategic planning
Results of external audits of management
Extent of leadership skills and training in senior management
Successful deliveries of strategies, projects and plans
Remuneration committee reports
Performance is monitored and assessed according to approved targets in strategic plan
% of colleges and department strategic plans developed in alignment with institution strategic plan
Levels of awareness of strategic plan, mission and visions and goals
Create a well-researched academic master plan by 2017 and invest in strategic academic offerings
Faculty and Units Plan
Adopt 3 identified best practices every year
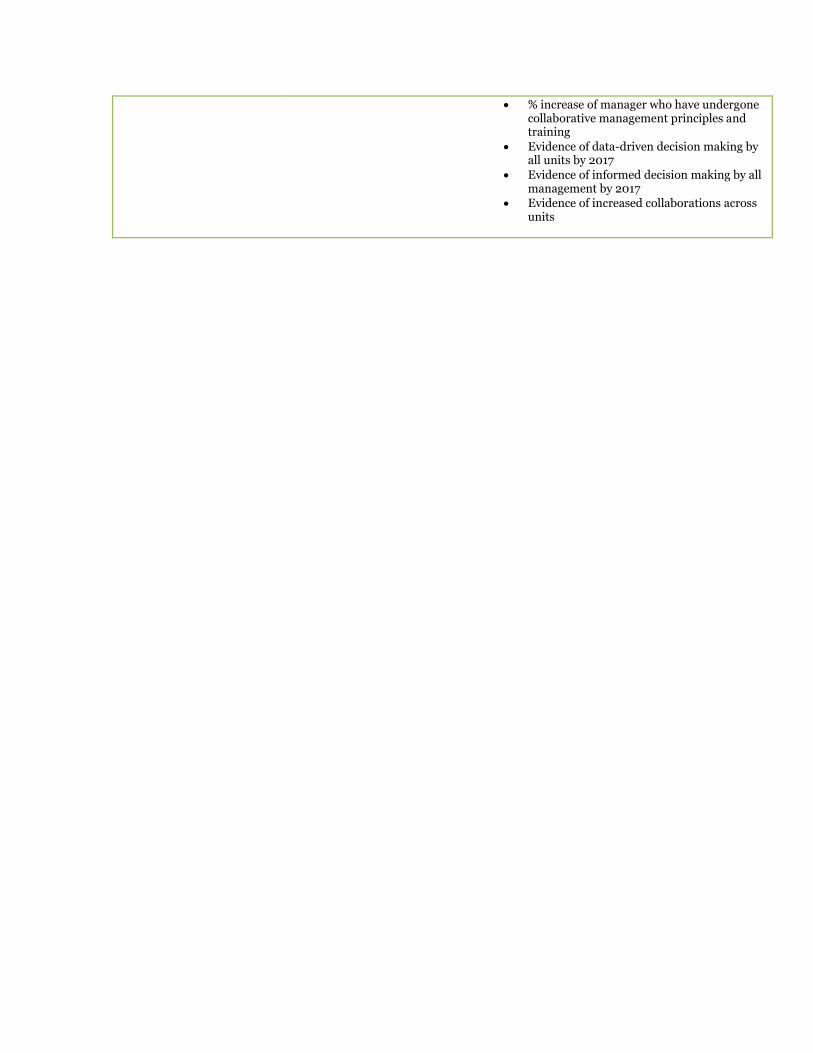
% increase of manager who have undergone collaborative management principles and training
Evidence of data-driven decision making by all units by 2017
Evidence of informed decision making by all management by 2017
Evidence of increased collaborations across units
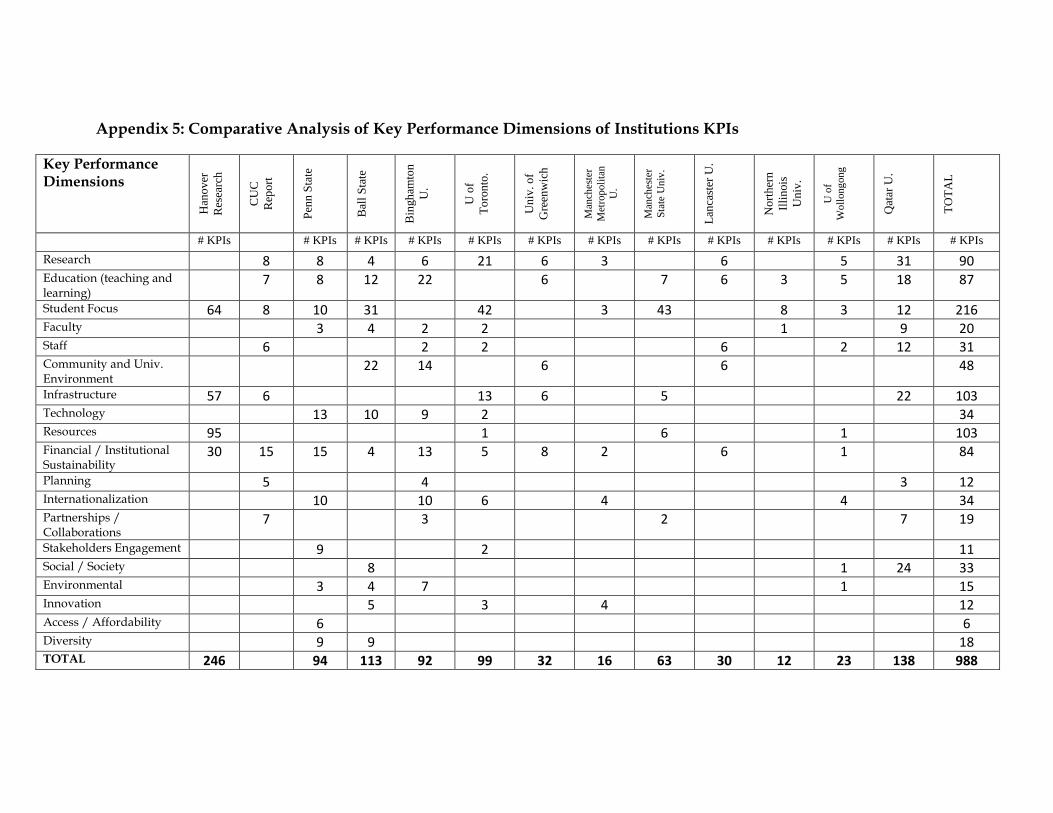
Appendix 5: Comparative Analysis of Key Performance Dimensions of Institutions KPIs
Key Performance Dimensions
Han
ov
er
Res
earc
h
CU
C
Rep
ort
Pen
n S
tate
Bal
l S
tate
Bin
gh
amto
n
U.
U o
f
To
ron
to.
Un
iv. o
f
Gre
enw
ich
Man
ches
ter
Met
rop
oli
tan
U.
Man
ches
ter
Sta
te U
niv
.
Lan
cast
er U
.
No
rth
ern
Illi
nois
Un
iv.
U o
f
Wo
llong
ong
Qat
ar U
.
TO
TA
L
# KPIs # KPIs # KPIs # KPIs # KPIs # KPIs # KPIs # KPIs # KPIs # KPIs # KPIs # KPIs # KPIs
Research 8 8 4 6 21 6 3 6 5 31 90 Education (teaching and learning)
7 8 12 22 6 7 6 3 5 18 87
Student Focus 64 8 10 31 42 3 43 8 3 12 216 Faculty 3 4 2 2 1 9 20 Staff 6 2 2 6 2 12 31 Community and Univ. Environment
22 14 6 6 48
Infrastructure 57 6 13 6 5 22 103 Technology 13 10 9 2 34 Resources 95 1 6 1 103 Financial / Institutional Sustainability
30 15 15 4 13 5 8 2 6 1 84
Planning 5 4 3 12 Internationalization 10 10 6 4 4 34 Partnerships / Collaborations
7 3 2 7 19
Stakeholders Engagement 9 2 11 Social / Society 8 1 24 33 Environmental 3 4 7 1 15 Innovation 5 3 4 12 Access / Affordability 6 6 Diversity 9 9 18 TOTAL 246 94 113 92 99 32 16 63 30 12 23 138 988
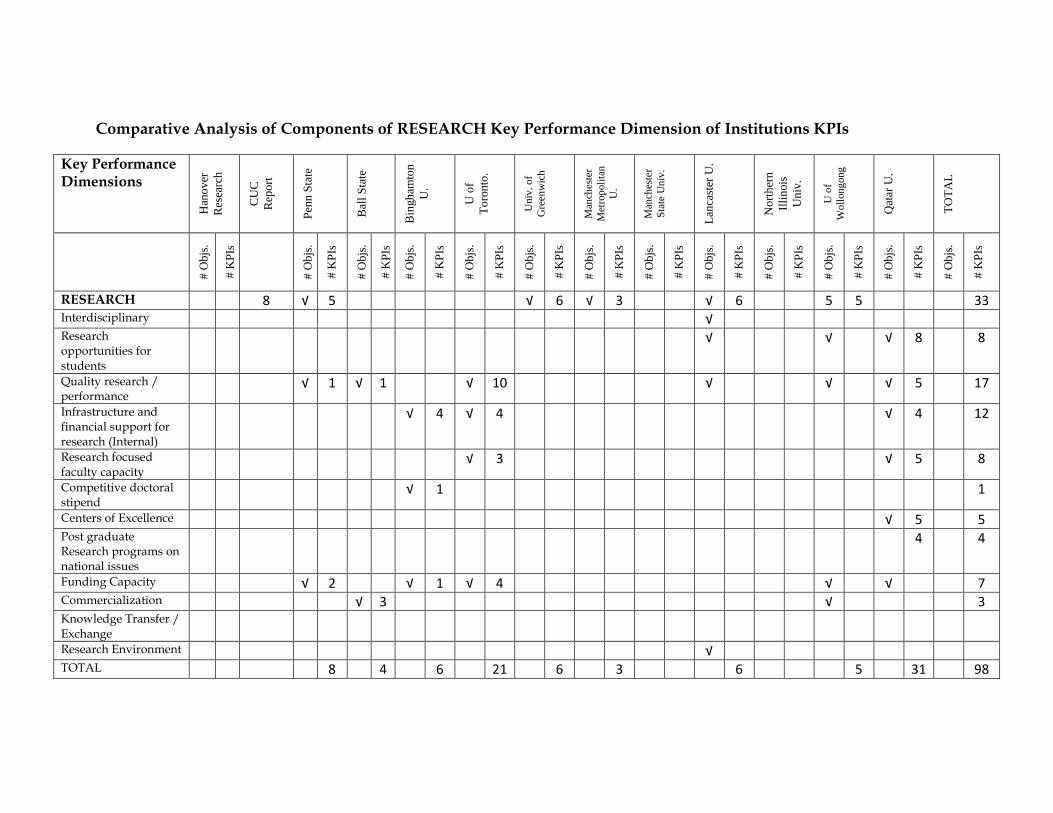
Comparative Analysis of Components of RESEARCH Key Performance Dimension of Institutions KPIs
Key Performance Dimensions
Han
ov
er
Res
earc
h
CU
C
Rep
ort
Pen
n S
tate
Bal
l S
tate
Bin
gh
amto
n
U.
U o
f
To
ron
to.
Un
iv. o
f
Gre
enw
ich
Man
ches
ter
Met
rop
oli
tan
U.
Man
ches
ter
Sta
te U
niv
.
Lan
cast
er U
.
No
rth
ern
Illi
nois
Un
iv.
U o
f
Wo
llong
ong
Qat
ar U
.
TO
TA
L
# O
bjs
.
# K
PIs
# O
bjs
.
# K
PIs
# O
bjs
.
# K
PIs
# O
bjs
.
# K
PIs
# O
bjs
.
# K
PIs
# O
bjs
.
# K
PIs
# O
bjs
.
# K
PIs
# O
bjs
.
# K
PIs
# O
bjs
.
# K
PIs
# O
bjs
.
# K
PIs
# O
bjs
.
# K
PIs
# O
bjs
.
# K
PIs
# O
bjs
.
# K
PIs
RESEARCH 8 √ 5 √ 6 √ 3 √ 6 5 5 33 Interdisciplinary √ Research opportunities for students
√ √ √ 8 8
Quality research / performance
√ 1 √ 1 √ 10 √ √ √ 5 17
Infrastructure and financial support for research (Internal)
√ 4 √ 4 √ 4 12
Research focused faculty capacity
√ 3 √ 5 8
Competitive doctoral stipend
√ 1 1
Centers of Excellence √ 5 5 Post graduate Research programs on national issues
4 4
Funding Capacity √ 2 √ 1 √ 4 √ √ 7 Commercialization √ 3 √ 3 Knowledge Transfer / Exchange
Research Environment √ TOTAL 8 4 6 21 6 3 6 5 31 98
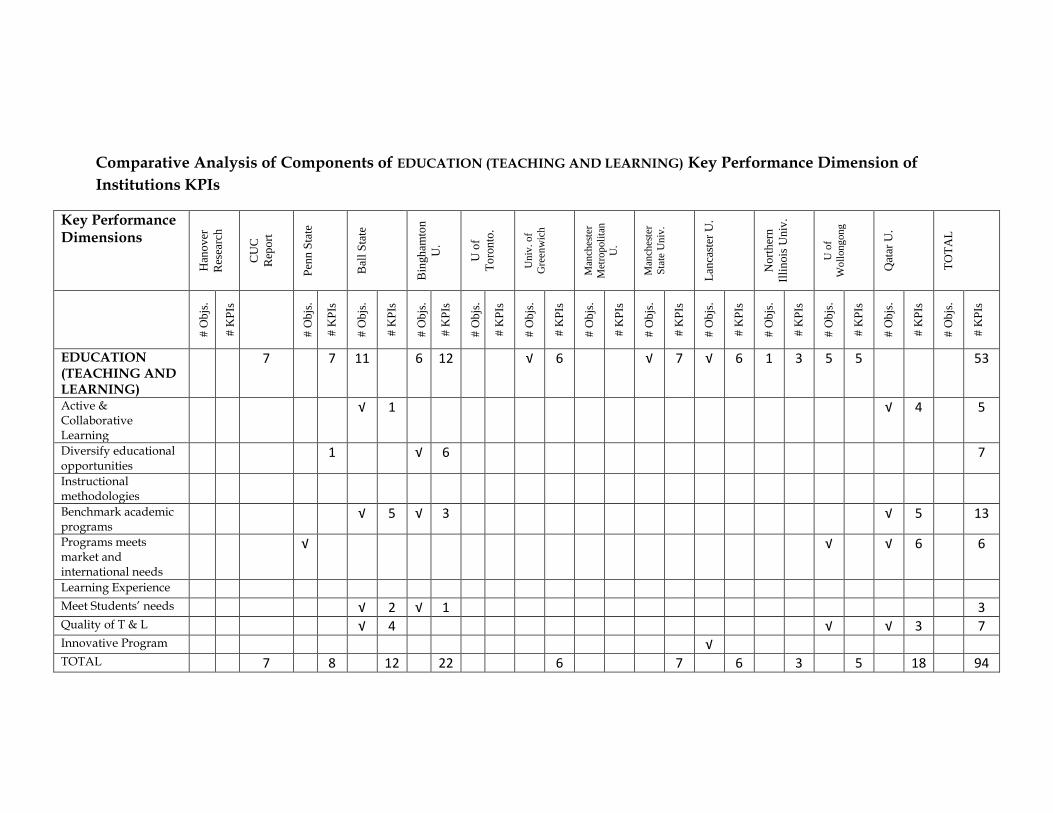
Comparative Analysis of Components of EDUCATION (TEACHING AND LEARNING) Key Performance Dimension of
Institutions KPIs
Key Performance Dimensions
Han
ov
er
Res
earc
h
CU
C
Rep
ort
Pen
n S
tate
Bal
l S
tate
Bin
gh
amto
n
U.
U o
f
To
ron
to.
Un
iv. o
f
Gre
enw
ich
Man
ches
ter
Met
rop
oli
tan
U.
Man
ches
ter
Sta
te U
niv
.
Lan
cast
er U
.
No
rth
ern
Illi
nois
Un
iv.
U o
f
Wo
llong
ong
Qat
ar U
.
TO
TA
L
# O
bjs
.
# K
PIs
# O
bjs
.
# K
PIs
# O
bjs
.
# K
PIs
# O
bjs
.
# K
PIs
# O
bjs
.
# K
PIs
# O
bjs
.
# K
PIs
# O
bjs
.
# K
PIs
# O
bjs
.
# K
PIs
# O
bjs
.
# K
PIs
# O
bjs
.
# K
PIs
# O
bjs
.
# K
PIs
# O
bjs
.
# K
PIs
# O
bjs
.
# K
PIs
EDUCATION (TEACHING AND LEARNING)
7 7 11 6 12 √ 6 √ 7 √ 6 1 3 5 5 53
Active & Collaborative Learning
√ 1 √ 4 5
Diversify educational opportunities
1 √ 6 7
Instructional methodologies
Benchmark academic programs
√ 5 √ 3 √ 5 13
Programs meets market and international needs
√ √ √ 6 6
Learning Experience Meet Students’ needs √ 2 √ 1 3 Quality of T & L √ 4 √ √ 3 7 Innovative Program √ TOTAL 7 8 12 22 6 7 6 3 5 18 94
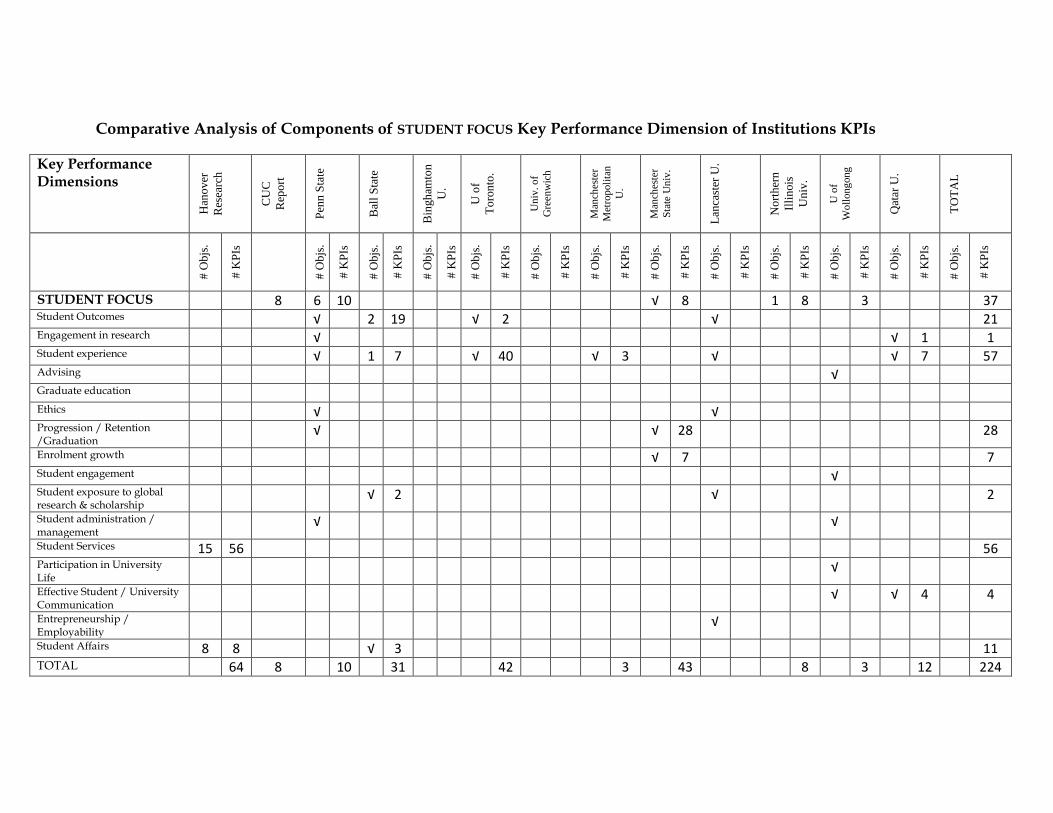
Comparative Analysis of Components of STUDENT FOCUS Key Performance Dimension of Institutions KPIs
Key Performance Dimensions
Han
ov
er
Res
earc
h
CU
C
Rep
ort
Pen
n S
tate
Bal
l S
tate
Bin
gh
amto
n
U.
U o
f
To
ron
to.
Un
iv. o
f
Gre
enw
ich
Man
ches
ter
Met
rop
oli
tan
U.
Man
ches
ter
Sta
te U
niv
.
Lan
cast
er U
.
No
rth
ern
Illi
nois
Un
iv.
U o
f
Wo
llong
ong
Qat
ar U
.
TO
TA
L
# O
bjs
.
# K
PIs
# O
bjs
.
# K
PIs
# O
bjs
.
# K
PIs
# O
bjs
.
# K
PIs
# O
bjs
.
# K
PIs
# O
bjs
.
# K
PIs
# O
bjs
.
# K
PIs
# O
bjs
.
# K
PIs
# O
bjs
.
# K
PIs
# O
bjs
.
# K
PIs
# O
bjs
.
# K
PIs
# O
bjs
.
# K
PIs
# O
bjs
.
# K
PIs
STUDENT FOCUS 8 6 10 √ 8 1 8 3 37 Student Outcomes √ 2 19 √ 2 √ 21 Engagement in research √ √ 1 1 Student experience √ 1 7 √ 40 √ 3 √ √ 7 57 Advising √ Graduate education Ethics √ √ Progression / Retention /Graduation
√ √ 28 28
Enrolment growth √ 7 7 Student engagement √ Student exposure to global research & scholarship
√ 2 √ 2
Student administration / management
√ √
Student Services 15 56 56 Participation in University Life
√
Effective Student / University Communication
√ √ 4 4
Entrepreneurship / Employability
√
Student Affairs 8 8 √ 3 11 TOTAL 64 8 10 31 42 3 43 8 3 12 224
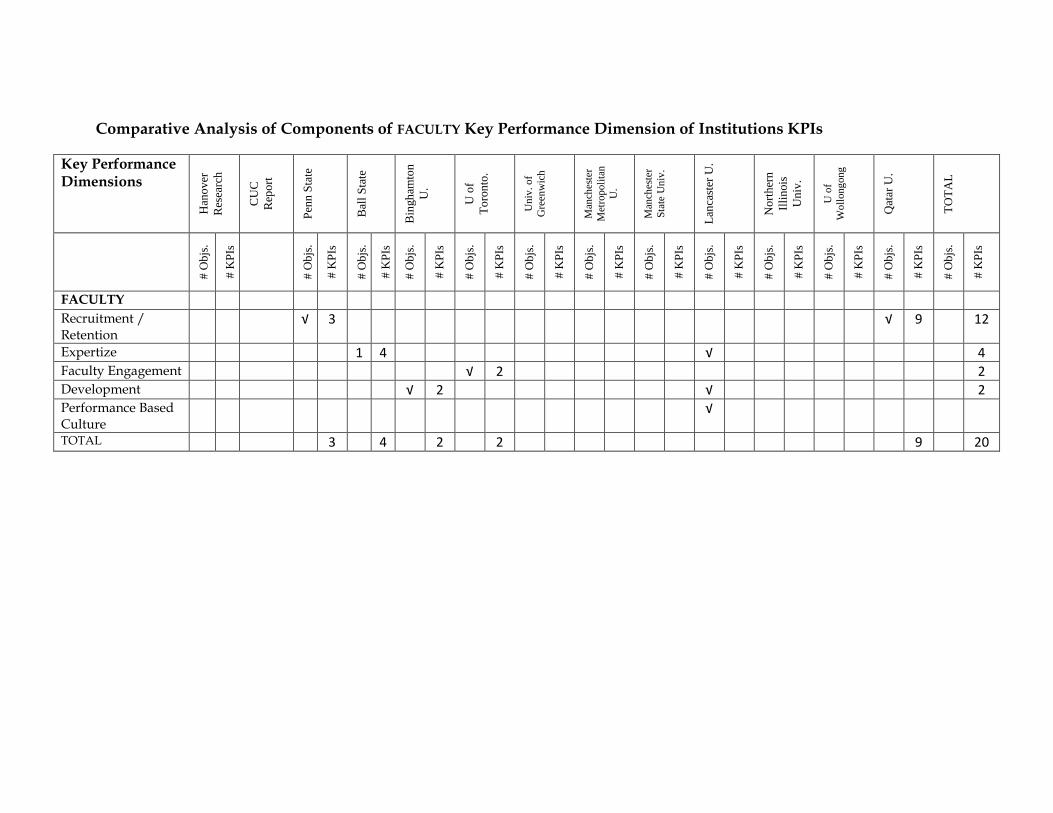
Comparative Analysis of Components of FACULTY Key Performance Dimension of Institutions KPIs
Key Performance Dimensions
Han
ov
er
Res
earc
h
CU
C
Rep
ort
Pen
n S
tate
Bal
l S
tate
Bin
gh
amto
n
U.
U o
f
To
ron
to.
Un
iv. o
f
Gre
enw
ich
Man
ches
ter
Met
rop
oli
tan
U.
Man
ches
ter
Sta
te U
niv
.
Lan
cast
er U
.
No
rth
ern
Illi
nois
Un
iv.
U o
f
Wo
llong
ong
Qat
ar U
.
TO
TA
L
# O
bjs
.
# K
PIs
# O
bjs
.
# K
PIs
# O
bjs
.
# K
PIs
# O
bjs
.
# K
PIs
# O
bjs
.
# K
PIs
# O
bjs
.
# K
PIs
# O
bjs
.
# K
PIs
# O
bjs
.
# K
PIs
# O
bjs
.
# K
PIs
# O
bjs
.
# K
PIs
# O
bjs
.
# K
PIs
# O
bjs
.
# K
PIs
# O
bjs
.
# K
PIs
FACULTY Recruitment / Retention
√ 3 √ 9 12
Expertize 1 4 √ 4 Faculty Engagement √ 2 2 Development √ 2 √ 2 Performance Based Culture
√
TOTAL 3 4 2 2 9 20
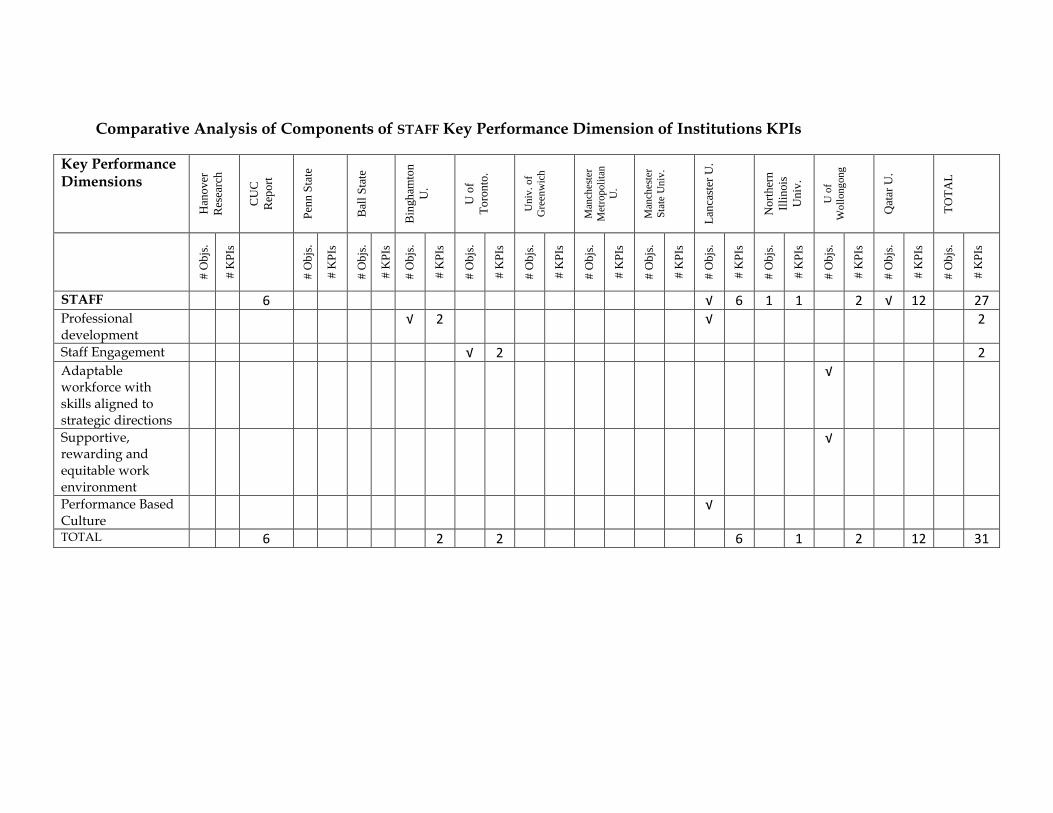
Comparative Analysis of Components of STAFF Key Performance Dimension of Institutions KPIs
Key Performance Dimensions
Han
ov
er
Res
earc
h
CU
C
Rep
ort
Pen
n S
tate
Bal
l S
tate
Bin
gh
amto
n
U.
U o
f
To
ron
to.
Un
iv. o
f
Gre
enw
ich
Man
ches
ter
Met
rop
oli
tan
U.
Man
ches
ter
Sta
te U
niv
.
Lan
cast
er U
.
No
rth
ern
Illi
nois
Un
iv.
U o
f
Wo
llong
ong
Qat
ar U
.
TO
TA
L
# O
bjs
.
# K
PIs
# O
bjs
.
# K
PIs
# O
bjs
.
# K
PIs
# O
bjs
.
# K
PIs
# O
bjs
.
# K
PIs
# O
bjs
.
# K
PIs
# O
bjs
.
# K
PIs
# O
bjs
.
# K
PIs
# O
bjs
.
# K
PIs
# O
bjs
.
# K
PIs
# O
bjs
.
# K
PIs
# O
bjs
.
# K
PIs
# O
bjs
.
# K
PIs
STAFF 6 √ 6 1 1 2 √ 12 27 Professional development
√ 2 √ 2
Staff Engagement √ 2 2 Adaptable workforce with skills aligned to strategic directions
√
Supportive, rewarding and equitable work environment
√
Performance Based Culture
√
TOTAL 6 2 2 6 1 2 12 31

Comparative Analysis of Components of COMMUNITY AND UNIV. ENVIRONMENT Key Performance Dimension of
Institutions KPIs
Key Performance Dimensions
Han
ov
er
Res
earc
h
CU
C
Rep
ort
Pen
n S
tate
Bal
l S
tate
Bin
gh
amto
n
U.
U o
f
To
ron
to.
Un
iv. o
f
Gre
enw
ich
Man
ches
ter
Met
rop
oli
tan
U.
Man
ches
ter
Sta
te U
niv
.
Lan
cast
er U
.
No
rth
ern
Illi
nois
Un
iv.
U o
f
Wo
llong
ong
Qat
ar U
.
TO
TA
L
# O
bjs
.
# K
PIs
# O
bjs
.
# K
PIs
# O
bjs
.
# K
PIs
# O
bjs
.
# K
PIs
# O
bjs
.
# K
PIs
# O
bjs
.
# K
PIs
# O
bjs
.
# K
PIs
# O
bjs
.
# K
PIs
# O
bjs
.
# K
PIs
# O
bjs
.
# K
PIs
# O
bjs
.
# K
PIs
# O
bjs
.
# K
PIs
# O
bjs
.
# K
PIs
COMMUNITY AND UNIV. ENVIRONMENT
4 √ 6 √ 6 12
Supportive Campus Environment
√ 7 √ 3 √ 10
Vibrant and integrated University community
√ 12 √ 9 21
“State of Art” environment for research & education
√ 1 √ 1
Campus Culture √ 1 √ 1 Community engagement
√ 3 √ 3
TOTAL 22 14 6 6 48

Comparative Analysis of Components of INFRASTRUCTURE and FACILITIES Key Performance Dimension of
Institutions KPIs
Key Performance Dimensions
Han
ov
er
Res
earc
h
CU
C
Rep
ort
Pen
n S
tate
Bal
l S
tate
Bin
gh
amto
n
U.
U o
f
To
ron
to.
Un
iv. o
f
Gre
enw
ich
Man
ches
ter
Met
rop
oli
tan
U.
Man
ches
ter
Sta
te U
niv
.
Lan
cast
er U
.
No
rth
ern
Illi
nois
Un
iv.
U o
f
Wo
llong
ong
Qat
ar U
.
TO
TA
L
# O
bjs
.
# K
PIs
# O
bjs
.
# K
PIs
# O
bjs
.
# K
PIs
# O
bjs
.
# K
PIs
# O
bjs
.
# K
PIs
# O
bjs
.
# K
PIs
# O
bjs
.
# K
PIs
# O
bjs
.
# K
PIs
# O
bjs
.
# K
PIs
# O
bjs
.
# K
PIs
# O
bjs
.
# K
PIs
# O
bjs
.
# K
PIs
# O
bjs
.
# K
PIs
INFRASTRUCTURE and FACILITIES
6 √ 6 √ 10 22
Improved infrastructure
√ 5 √ 5
Physical Plant 6 18 18 Administrative Outcomes
√ √ 2 2
Facilities Management
29 29
Service oriented culture
10 √ √ 7 17
Planned and development
√ √ 3 3
Registration / Admission
√ 13 √ 13
TOTAL 57 6 13 6 5 22 109
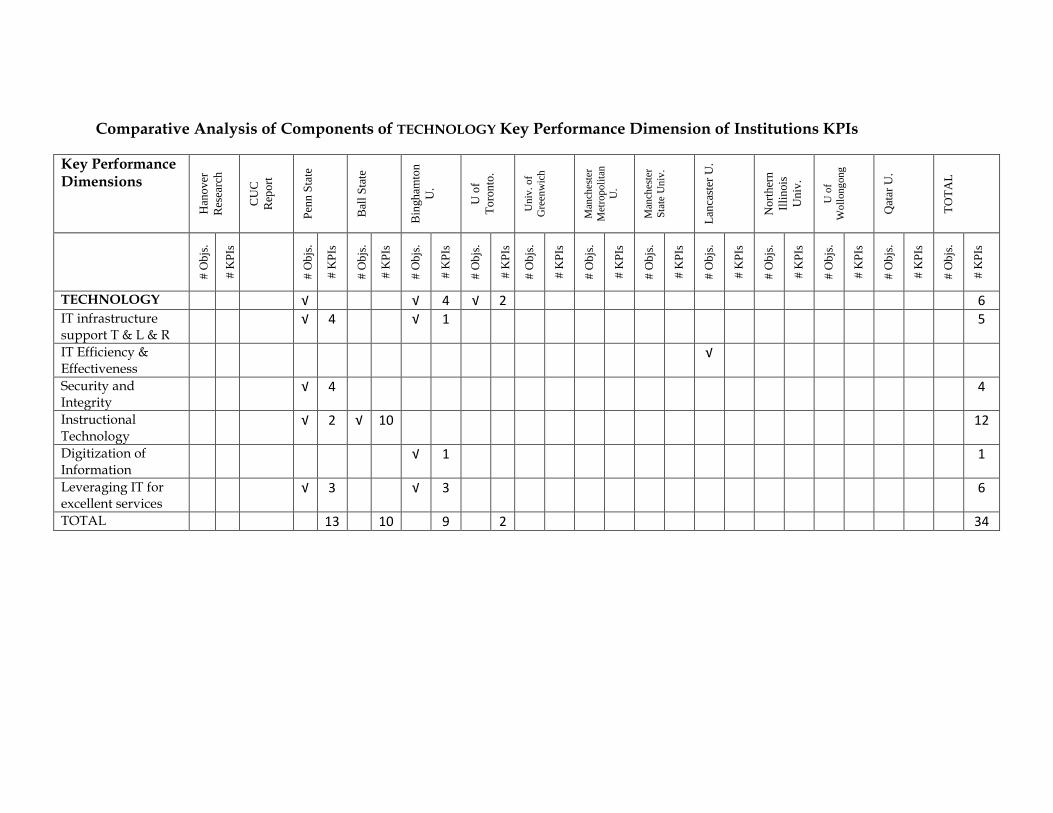
Comparative Analysis of Components of TECHNOLOGY Key Performance Dimension of Institutions KPIs
Key Performance Dimensions
Han
ov
er
Res
earc
h
CU
C
Rep
ort
Pen
n S
tate
Bal
l S
tate
Bin
gh
amto
n
U.
U o
f
To
ron
to.
Un
iv. o
f
Gre
enw
ich
Man
ches
ter
Met
rop
oli
tan
U.
Man
ches
ter
Sta
te U
niv
.
Lan
cast
er U
.
No
rth
ern
Illi
nois
Un
iv.
U o
f
Wo
llong
ong
Qat
ar U
.
TO
TA
L
# O
bjs
.
# K
PIs
# O
bjs
.
# K
PIs
# O
bjs
.
# K
PIs
# O
bjs
.
# K
PIs
# O
bjs
.
# K
PIs
# O
bjs
.
# K
PIs
# O
bjs
.
# K
PIs
# O
bjs
.
# K
PIs
# O
bjs
.
# K
PIs
# O
bjs
.
# K
PIs
# O
bjs
.
# K
PIs
# O
bjs
.
# K
PIs
# O
bjs
.
# K
PIs
TECHNOLOGY √ √ 4 √ 2 6 IT infrastructure support T & L & R
√ 4 √ 1 5
IT Efficiency & Effectiveness
√
Security and Integrity
√ 4 4
Instructional Technology
√ 2 √ 10 12
Digitization of Information
√ 1 1
Leveraging IT for excellent services
√ 3 √ 3 6
TOTAL 13 10 9 2 34

Comparative Analysis of Components of RESOURCES Key Performance Dimension of Institutions KPIs
Key Performance Dimensions
Han
ov
er
Res
earc
h
CU
C
Rep
ort
Pen
n S
tate
Bal
l S
tate
Bin
gh
amto
n
U.
U o
f
To
ron
to.
Un
iv. o
f
Gre
enw
ich
Man
ches
ter
Met
rop
oli
tan
U.
Man
ches
ter
Sta
te U
niv
.
Lan
cast
er U
.
No
rth
ern
Illi
nois
Un
iv.
U o
f
Wo
llong
ong
Qat
ar U
.
TO
TA
L
# O
bjs
.
# K
PIs
# O
bjs
.
# K
PIs
# O
bjs
.
# K
PIs
# O
bjs
.
# K
PIs
# O
bjs
.
# K
PIs
# O
bjs
.
# K
PIs
# O
bjs
.
# K
PIs
# O
bjs
.
# K
PIs
# O
bjs
.
# K
PIs
# O
bjs
.
# K
PIs
# O
bjs
.
# K
PIs
# O
bjs
.
# K
PIs
# O
bjs
.
# K
PIs
RESOURCES √ 1 1 Resource enhancement
√ 6 6
Human Resources 21 95 95 Library √ 1 1 TOTAL 95 1 6 1 103
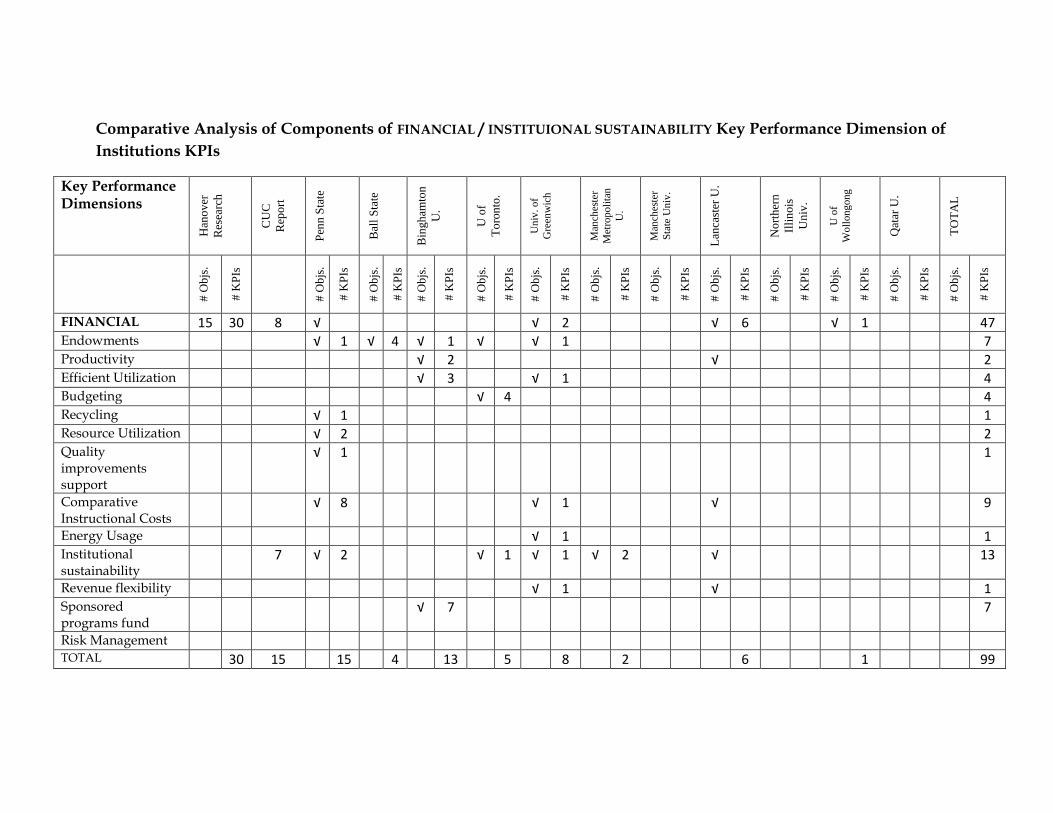
Comparative Analysis of Components of FINANCIAL / INSTITUIONAL SUSTAINABILITY Key Performance Dimension of
Institutions KPIs
Key Performance Dimensions
Han
ov
er
Res
earc
h
CU
C
Rep
ort
Pen
n S
tate
Bal
l S
tate
Bin
gh
amto
n
U.
U o
f
To
ron
to.
Un
iv. o
f
Gre
enw
ich
Man
ches
ter
Met
rop
oli
tan
U.
Man
ches
ter
Sta
te U
niv
.
Lan
cast
er U
.
No
rth
ern
Illi
nois
Un
iv.
U o
f
Wo
llong
ong
Qat
ar U
.
TO
TA
L
# O
bjs
.
# K
PIs
# O
bjs
.
# K
PIs
# O
bjs
.
# K
PIs
# O
bjs
.
# K
PIs
# O
bjs
.
# K
PIs
# O
bjs
.
# K
PIs
# O
bjs
.
# K
PIs
# O
bjs
.
# K
PIs
# O
bjs
.
# K
PIs
# O
bjs
.
# K
PIs
# O
bjs
.
# K
PIs
# O
bjs
.
# K
PIs
# O
bjs
.
# K
PIs
FINANCIAL 15 30 8 √ √ 2 √ 6 √ 1 47 Endowments √ 1 √ 4 √ 1 √ √ 1 7 Productivity √ 2 √ 2 Efficient Utilization √ 3 √ 1 4 Budgeting √ 4 4 Recycling √ 1 1 Resource Utilization √ 2 2 Quality improvements support
√ 1 1
Comparative Instructional Costs
√ 8 √ 1 √ 9
Energy Usage √ 1 1 Institutional sustainability
7 √ 2 √ 1 √ 1 √ 2 √ 13
Revenue flexibility √ 1 √ 1 Sponsored programs fund
√ 7 7
Risk Management TOTAL 30 15 15 4 13 5 8 2 6 1 99
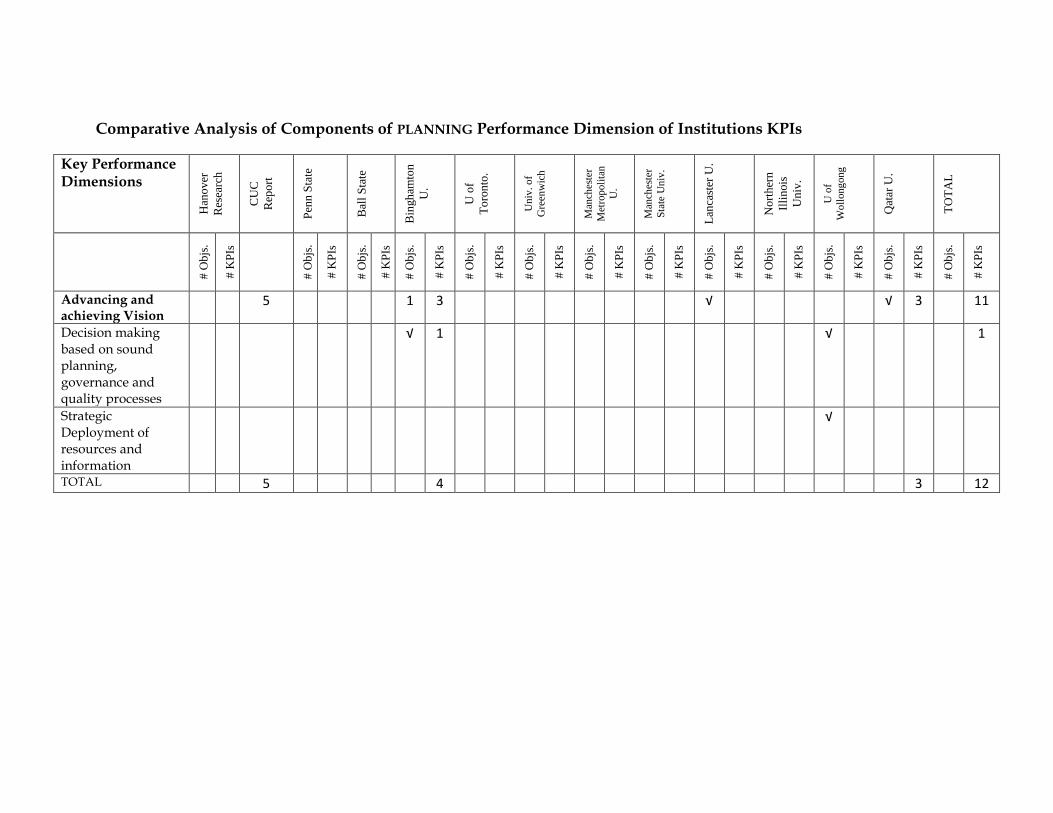
Comparative Analysis of Components of PLANNING Performance Dimension of Institutions KPIs
Key Performance Dimensions
Han
ov
er
Res
earc
h
CU
C
Rep
ort
Pen
n S
tate
Bal
l S
tate
Bin
gh
amto
n
U.
U o
f
To
ron
to.
Un
iv. o
f
Gre
enw
ich
Man
ches
ter
Met
rop
oli
tan
U.
Man
ches
ter
Sta
te U
niv
.
Lan
cast
er U
.
No
rth
ern
Illi
nois
Un
iv.
U o
f
Wo
llong
ong
Qat
ar U
.
TO
TA
L
# O
bjs
.
# K
PIs
# O
bjs
.
# K
PIs
# O
bjs
.
# K
PIs
# O
bjs
.
# K
PIs
# O
bjs
.
# K
PIs
# O
bjs
.
# K
PIs
# O
bjs
.
# K
PIs
# O
bjs
.
# K
PIs
# O
bjs
.
# K
PIs
# O
bjs
.
# K
PIs
# O
bjs
.
# K
PIs
# O
bjs
.
# K
PIs
# O
bjs
.
# K
PIs
Advancing and achieving Vision
5 1 3 √ √ 3 11
Decision making based on sound planning, governance and quality processes
√ 1 √ 1
Strategic Deployment of resources and information
√
TOTAL 5 4 3 12
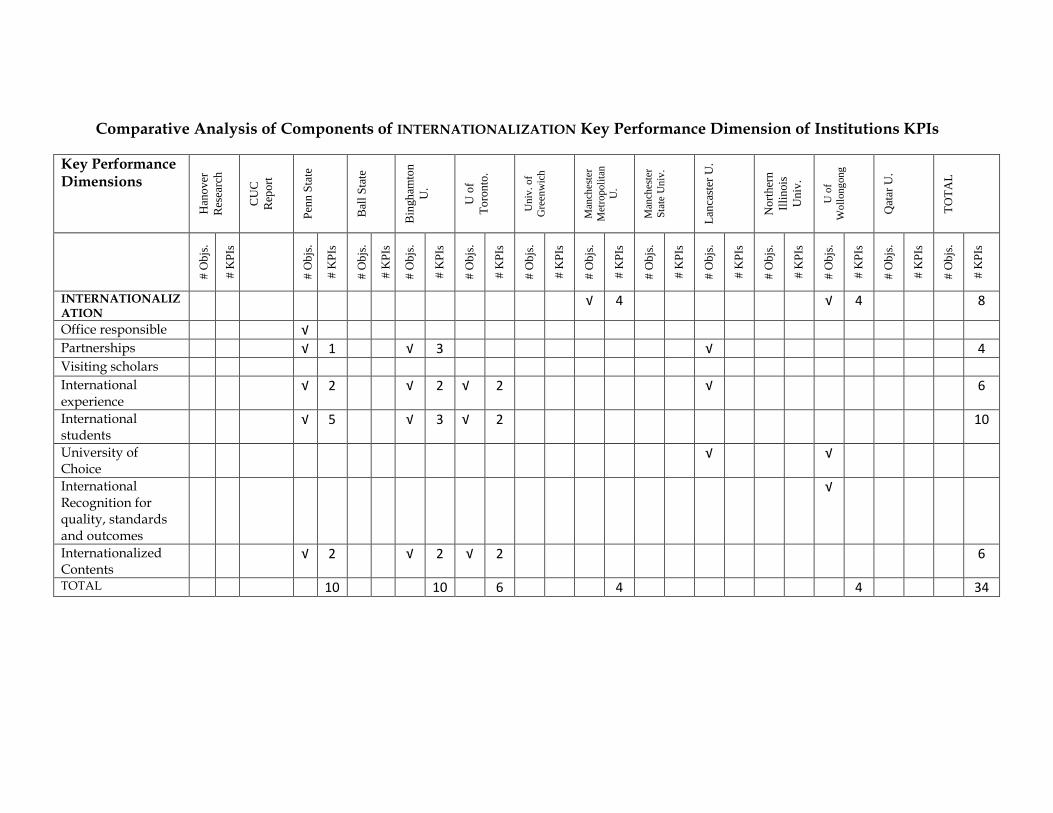
Comparative Analysis of Components of INTERNATIONALIZATION Key Performance Dimension of Institutions KPIs
Key Performance Dimensions
Han
ov
er
Res
earc
h
CU
C
Rep
ort
Pen
n S
tate
Bal
l S
tate
Bin
gh
amto
n
U.
U o
f
To
ron
to.
Un
iv. o
f
Gre
enw
ich
Man
ches
ter
Met
rop
oli
tan
U.
Man
ches
ter
Sta
te U
niv
.
Lan
cast
er U
.
No
rth
ern
Illi
nois
Un
iv.
U o
f
Wo
llong
ong
Qat
ar U
.
TO
TA
L
# O
bjs
.
# K
PIs
# O
bjs
.
# K
PIs
# O
bjs
.
# K
PIs
# O
bjs
.
# K
PIs
# O
bjs
.
# K
PIs
# O
bjs
.
# K
PIs
# O
bjs
.
# K
PIs
# O
bjs
.
# K
PIs
# O
bjs
.
# K
PIs
# O
bjs
.
# K
PIs
# O
bjs
.
# K
PIs
# O
bjs
.
# K
PIs
# O
bjs
.
# K
PIs
INTERNATIONALIZATION
√ 4 √ 4 8
Office responsible √ Partnerships √ 1 √ 3 √ 4 Visiting scholars International experience
√ 2 √ 2 √ 2 √ 6
International students
√ 5 √ 3 √ 2 10
University of Choice
√ √
International Recognition for quality, standards and outcomes
√
Internationalized Contents
√ 2 √ 2 √ 2 6
TOTAL 10 10 6 4 4 34
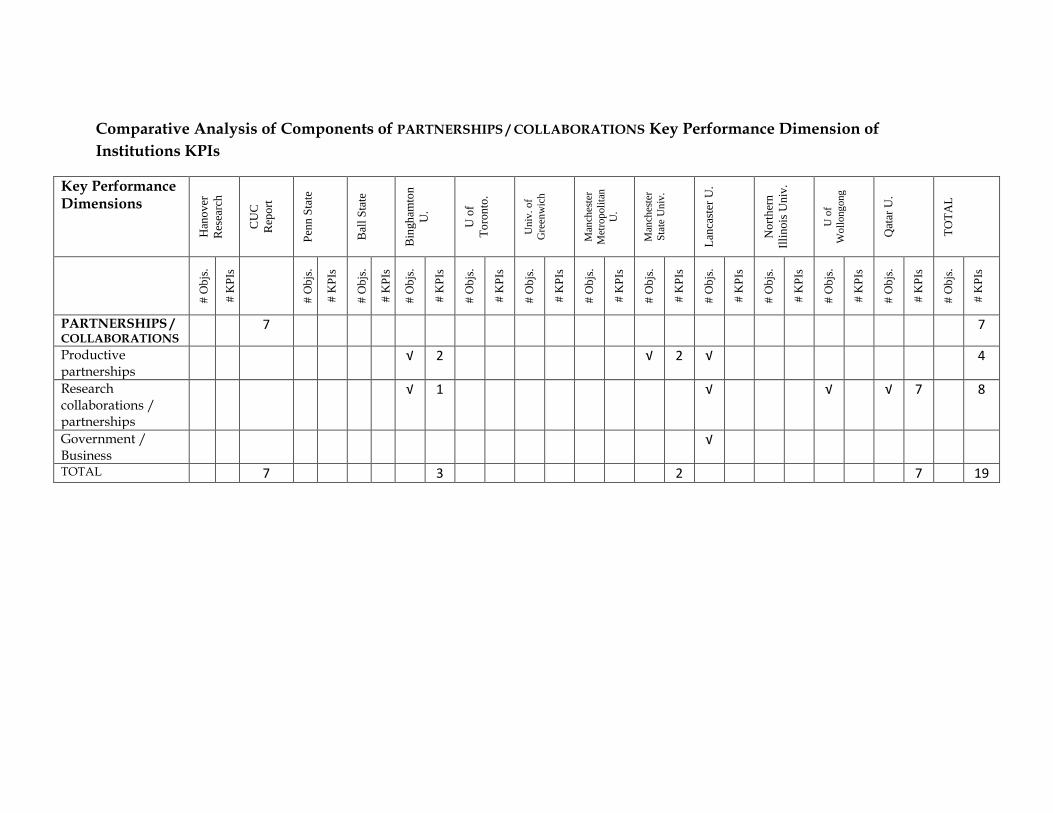
Comparative Analysis of Components of PARTNERSHIPS / COLLABORATIONS Key Performance Dimension of
Institutions KPIs
Key Performance Dimensions
Han
ov
er
Res
earc
h
CU
C
Rep
ort
Pen
n S
tate
Bal
l S
tate
Bin
gh
amto
n
U.
U o
f
To
ron
to.
Un
iv. o
f
Gre
enw
ich
Man
ches
ter
Met
rop
oli
tan
U.
Man
ches
ter
Sta
te U
niv
.
Lan
cast
er U
.
No
rth
ern
Illi
nois
Un
iv.
U o
f
Wo
llong
ong
Qat
ar U
.
TO
TA
L
# O
bjs
.
# K
PIs
# O
bjs
.
# K
PIs
# O
bjs
.
# K
PIs
# O
bjs
.
# K
PIs
# O
bjs
.
# K
PIs
# O
bjs
.
# K
PIs
# O
bjs
.
# K
PIs
# O
bjs
.
# K
PIs
# O
bjs
.
# K
PIs
# O
bjs
.
# K
PIs
# O
bjs
.
# K
PIs
# O
bjs
.
# K
PIs
# O
bjs
.
# K
PIs
PARTNERSHIPS / COLLABORATIONS
7 7
Productive partnerships
√ 2 √ 2 √ 4
Research collaborations / partnerships
√ 1 √ √ √ 7 8
Government / Business
√
TOTAL 7 3 2 7 19
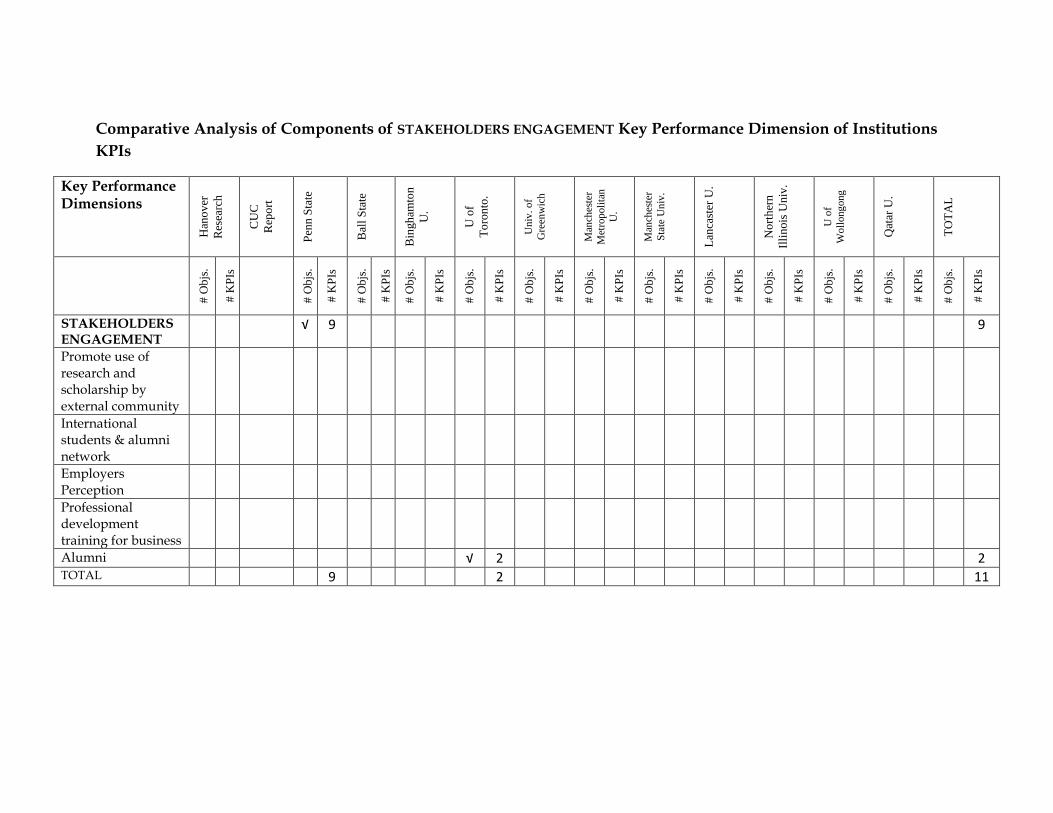
Comparative Analysis of Components of STAKEHOLDERS ENGAGEMENT Key Performance Dimension of Institutions
KPIs
Key Performance Dimensions
Han
ov
er
Res
earc
h
CU
C
Rep
ort
Pen
n S
tate
Bal
l S
tate
Bin
gh
amto
n
U.
U o
f
To
ron
to.
Un
iv. o
f
Gre
enw
ich
Man
ches
ter
Met
rop
oli
tan
U.
Man
ches
ter
Sta
te U
niv
.
Lan
cast
er U
.
No
rth
ern
Illi
nois
Un
iv.
U o
f
Wo
llong
ong
Qat
ar U
.
TO
TA
L
# O
bjs
.
# K
PIs
# O
bjs
.
# K
PIs
# O
bjs
.
# K
PIs
# O
bjs
.
# K
PIs
# O
bjs
.
# K
PIs
# O
bjs
.
# K
PIs
# O
bjs
.
# K
PIs
# O
bjs
.
# K
PIs
# O
bjs
.
# K
PIs
# O
bjs
.
# K
PIs
# O
bjs
.
# K
PIs
# O
bjs
.
# K
PIs
# O
bjs
.
# K
PIs
STAKEHOLDERS ENGAGEMENT
√ 9 9
Promote use of research and scholarship by external community
International students & alumni network
Employers Perception
Professional development training for business
Alumni √ 2 2 TOTAL 9 2 11

Comparative Analysis of Components of SOCIAL / SOCIETY Key Performance Dimension of Institutions KPIs
Key Performance Dimensions
Han
ov
er
Res
earc
h
CU
C
Rep
ort
Pen
n S
tate
Bal
l S
tate
Bin
gh
amto
n
U.
U o
f
To
ron
to.
Un
iv. o
f
Gre
enw
ich
Man
ches
ter
Met
rop
oli
tan
U.
Man
ches
ter
Sta
te U
niv
.
Lan
cast
er U
.
No
rth
ern
Illi
nois
Un
iv.
U o
f
Wo
llong
ong
Qat
ar U
.
TO
TA
L
# O
bjs
.
# K
PIs
# O
bjs
.
# K
PIs
# O
bjs
.
# K
PIs
# O
bjs
.
# K
PIs
# O
bjs
.
# K
PIs
# O
bjs
.
# K
PIs
# O
bjs
.
# K
PIs
# O
bjs
.
# K
PIs
# O
bjs
.
# K
PIs
# O
bjs
.
# K
PIs
# O
bjs
.
# K
PIs
# O
bjs
.
# K
PIs
# O
bjs
.
# K
PIs
SOCIAL / SOCIETY
4 1 1
Societal needs √ 2 √ √ 6 8 Community needs √ 2 √ √ 6 8 Non degree courses and programs for society
√ √ 5 5
University image √ 2 √ 7 9 Graduates equipped to contribute
√ 2 2
TOTAL 8 1 24 33
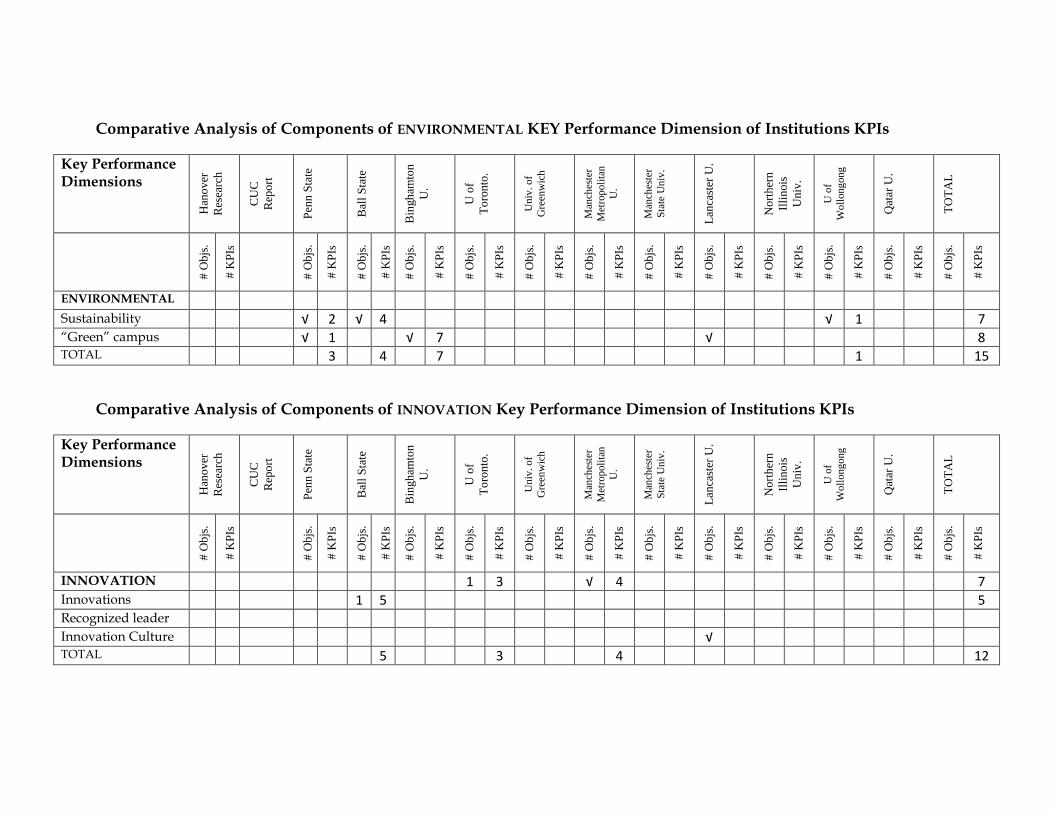
Comparative Analysis of Components of ENVIRONMENTAL KEY Performance Dimension of Institutions KPIs
Key Performance Dimensions
Han
ov
er
Res
earc
h
CU
C
Rep
ort
Pen
n S
tate
Bal
l S
tate
Bin
gh
amto
n
U.
U o
f
To
ron
to.
Un
iv. o
f
Gre
enw
ich
Man
ches
ter
Met
rop
oli
tan
U.
Man
ches
ter
Sta
te U
niv
.
Lan
cast
er U
.
No
rth
ern
Illi
nois
Un
iv.
U o
f
Wo
llong
ong
Qat
ar U
.
TO
TA
L
# O
bjs
.
# K
PIs
# O
bjs
.
# K
PIs
# O
bjs
.
# K
PIs
# O
bjs
.
# K
PIs
# O
bjs
.
# K
PIs
# O
bjs
.
# K
PIs
# O
bjs
.
# K
PIs
# O
bjs
.
# K
PIs
# O
bjs
.
# K
PIs
# O
bjs
.
# K
PIs
# O
bjs
.
# K
PIs
# O
bjs
.
# K
PIs
# O
bjs
.
# K
PIs
ENVIRONMENTAL Sustainability √ 2 √ 4 √ 1 7 “Green” campus √ 1 √ 7 √ 8 TOTAL 3 4 7 1 15
Comparative Analysis of Components of INNOVATION Key Performance Dimension of Institutions KPIs
Key Performance Dimensions
Han
ov
er
Res
earc
h
CU
C
Rep
ort
Pen
n S
tate
Bal
l S
tate
Bin
gh
amto
n
U.
U o
f
To
ron
to.
Un
iv. o
f
Gre
enw
ich
Man
ches
ter
Met
rop
oli
tan
U.
Man
ches
ter
Sta
te U
niv
.
Lan
cast
er U
.
No
rth
ern
Illi
nois
Un
iv.
U o
f
Wo
llong
ong
Qat
ar U
.
TO
TA
L
# O
bjs
.
# K
PIs
# O
bjs
.
# K
PIs
# O
bjs
.
# K
PIs
# O
bjs
.
# K
PIs
# O
bjs
.
# K
PIs
# O
bjs
.
# K
PIs
# O
bjs
.
# K
PIs
# O
bjs
.
# K
PIs
# O
bjs
.
# K
PIs
# O
bjs
.
# K
PIs
# O
bjs
.
# K
PIs
# O
bjs
.
# K
PIs
# O
bjs
.
# K
PIs
INNOVATION 1 3 √ 4 7 Innovations 1 5 5 Recognized leader Innovation Culture √ TOTAL 5 3 4 12
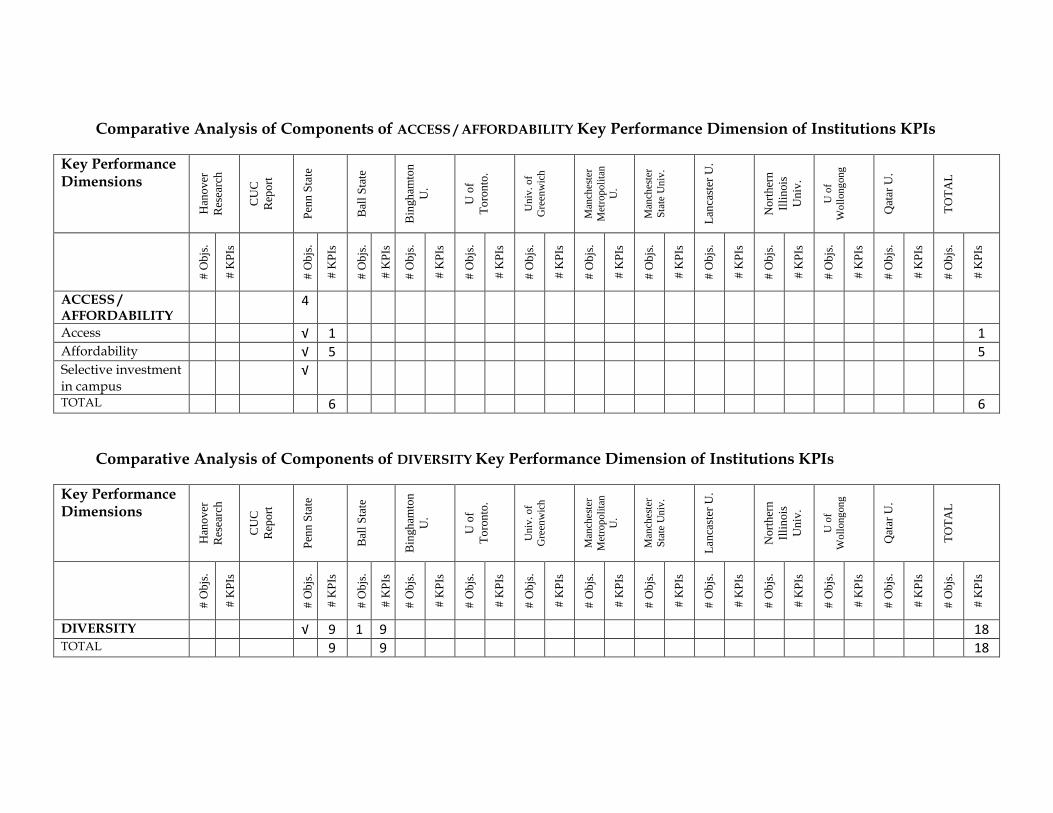
Comparative Analysis of Components of ACCESS / AFFORDABILITY Key Performance Dimension of Institutions KPIs
Key Performance Dimensions
Han
ov
er
Res
earc
h
CU
C
Rep
ort
Pen
n S
tate
Bal
l S
tate
Bin
gh
amto
n
U.
U o
f
To
ron
to.
Un
iv. o
f
Gre
enw
ich
Man
ches
ter
Met
rop
oli
tan
U.
Man
ches
ter
Sta
te U
niv
.
Lan
cast
er U
.
No
rth
ern
Illi
nois
Un
iv.
U o
f
Wo
llong
ong
Qat
ar U
.
TO
TA
L
# O
bjs
.
# K
PIs
# O
bjs
.
# K
PIs
# O
bjs
.
# K
PIs
# O
bjs
.
# K
PIs
# O
bjs
.
# K
PIs
# O
bjs
.
# K
PIs
# O
bjs
.
# K
PIs
# O
bjs
.
# K
PIs
# O
bjs
.
# K
PIs
# O
bjs
.
# K
PIs
# O
bjs
.
# K
PIs
# O
bjs
.
# K
PIs
# O
bjs
.
# K
PIs
ACCESS / AFFORDABILITY
4
Access √ 1 1 Affordability √ 5 5 Selective investment in campus
√
TOTAL 6 6
Comparative Analysis of Components of DIVERSITY Key Performance Dimension of Institutions KPIs
Key Performance Dimensions
Han
ov
er
Res
earc
h
CU
C
Rep
ort
Pen
n S
tate
Bal
l S
tate
Bin
gh
amto
n
U.
U o
f
To
ron
to.
Un
iv. o
f
Gre
enw
ich
Man
ches
ter
Met
rop
oli
tan
U.
Man
ches
ter
Sta
te U
niv
.
Lan
cast
er U
.
No
rth
ern
Illi
nois
Un
iv.
U o
f
Wo
llong
ong
Qat
ar U
.
TO
TA
L
# O
bjs
.
# K
PIs
# O
bjs
.
# K
PIs
# O
bjs
.
# K
PIs
# O
bjs
.
# K
PIs
# O
bjs
.
# K
PIs
# O
bjs
.
# K
PIs
# O
bjs
.
# K
PIs
# O
bjs
.
# K
PIs
# O
bjs
.
# K
PIs
# O
bjs
.
# K
PIs
# O
bjs
.
# K
PIs
# O
bjs
.
# K
PIs
# O
bjs
.
# K
PIs
DIVERSITY √ 9 1 9 18 TOTAL 9 9 18

Appendix 6 Comparative Analysis of KSU’s Benchmarked Universities
In the KSU 2030 “Towards Excellence” Strategic Plan, 10 universities were selected as
benchmarks for the development of the KSU 2030. This part of the qualitative research
will try to identify the “Strategic Plan and strategic KPIs” of these benchmarked
universities.
Research aim: Identify the strategic KPIs of these 10 benchmarked universities
Research Methodology: The main page website of the universities was accessed to
determine the existence of any “strategic plan” or “strategic KPIs” of the institution.
Research Findings: (Tables 6.1 and 6.2)
1. Of the benchmarked universities, only University of California has a longer term strategic plan in 3 focused areas of Responsive Research, Teaching and Public Services, Expanded Pathways for Access and Success and Engaging and Healthy Campus Climate with (10 Strategic KPIs and 60 Specific KPIs)
2. 4 universities namely Oxford, Tokyo and University of Southern California has Strategic Plan but with no KPIs
3. The 5 remaining universities of Stanford, MIT, Harvard, Cambridge and NUS has no evidence of an institutional strategic plan, but do have strategic plans for by schools or administrative units. Only Tsinghua has no evidence of any type of strategic plan at all.
4. For the universities that have strategic plans, their focus areas are typical of those as shown in Appendix 4 Table 4.2 in the 12 key categorical areas.
5. Most of them do have facts sheets or statistical data to provide an overall view of the institution profile of its key statistics like those shown in Table 6.2 for Stanford, Oxford, UC Berkeley and U of Southern California.
Due to the limitations of the availability of the strategic plans and strategic KPIs of these
benchmarked universities, the basis of the determination of the strategic KPIs would be
based on the 2 major research reports and 11 selected universities for further study
(Appendix 4)
Table 6.1 Overall findings of benchmarked universities’ strategic plan and KPIs
Universities with no Institutional Strategic Plan or KPI but has some schools / administrative units plans
Universities with Strategic Plan only with NO KPIs
Universities with Strategic Plan and KPIs
Stanford University but has strategic plan by some schools
Oxford University University of California Berkeley
Massachusetts Institute of Technology but has strategic plan by some schools
University of Tokyo
Harvard University but has strategic plan by some schools
University of Southern California (old 2004 strategic plan)
Cambridge University but has strategic plan by some schools

Tsinghua University National University of Singapore but has strategic plan for administrative units
Table 6.2 Detailed findings of benchmarked universities’ strategic plan and KPIs
Benchmarked Universities
Strategic Plan Strategic KPIs
Stanford University No result on Strategic Plan but has one on Stanford University School of Medicine (2002 – 2004)
Stanford University School of Medicine has on Prioritized initiatives (with no specifications of KPIs but scheduled projects / programs in:
Medical Education with 5 sub-priorities
Graduate Education with 7 sub-priorities
Postdoctoral Training with 7 sub-priorities
Research with 8 sub-priorities
Clinical Care with 3 sub-priorities
Professoriate with 3 sub-priorities
Finance and Administration with 2 sub-priorities
Information Resources and Technology with 3 sub-priorities
Advocacy, Public Policy and Philanthropy with 8 sub-priorities
Stanford University at a glance
Student enrollment – undergraduate and graduate
Campus
Endowment
Research – external and total
leadership
Established 1885; opened 1891
Faculty: faculty student ratio Seven schools
Massachusetts Institute of Technology
No result on MIT Strategic Plan shows but show Results of MIT DUE (Undergraduate Program) and others mainly administrative units
MIT DUE Catalyze the Undergraduate Commons to define the
next generation of MIT student – 6 Objectives and 18 KPIs
Champion Information Technology (IT) for the provision of information to the students and faculty – 2 (+ 5 in Phase 2) Objectives and 3 (8 in Phase 2) KPIs
Develop a holistic student experience to produce leaders for the future – 4 Objectives and 6 KPIs
Transforming Learning through Research, Best Practices and Innovations in Pedagogy, Curricular Materials and Assessment – 3 Objectives and 6 KPIs
Harvard University No result on Strategic Plan shows but show Results of Strategic Plan by schools and admin units e.g. Harvard Medical School, Harvard Library and Harvard IT
HMS and HMDS Strategic Plan (Joint Committee on Status of Women) 2012 – 2016
Organizational Efficiency and Institutional Memory – 8 Objectives and 13 KPIs including 5 on Partnerships / Outreach / Collaborations
Career Satisfaction and Advocacy – 4 Objectives and 4 KPIs
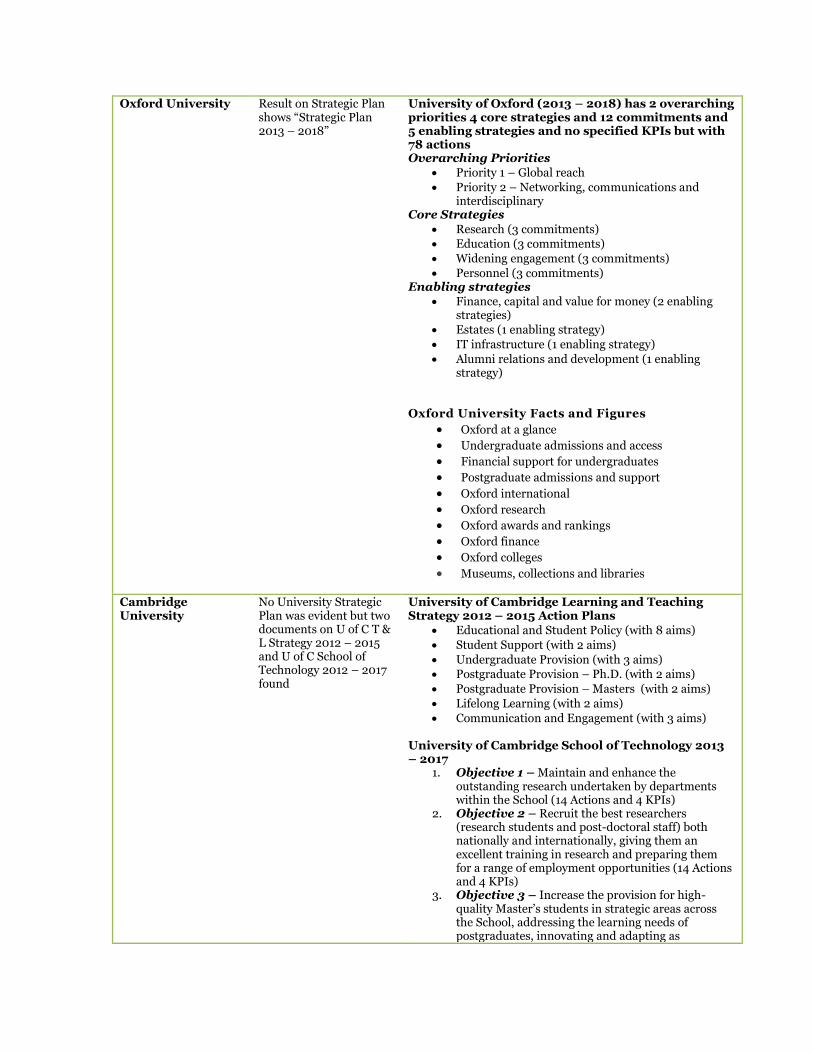
Oxford University Result on Strategic Plan shows “Strategic Plan 2013 – 2018”
University of Oxford (2013 – 2018) has 2 overarching priorities 4 core strategies and 12 commitments and 5 enabling strategies and no specified KPIs but with 78 actions Overarching Priorities
Priority 1 – Global reach
Priority 2 – Networking, communications and interdisciplinary
Core Strategies
Research (3 commitments) Education (3 commitments)
Widening engagement (3 commitments)
Personnel (3 commitments) Enabling strategies
Finance, capital and value for money (2 enabling strategies)
Estates (1 enabling strategy)
IT infrastructure (1 enabling strategy)
Alumni relations and development (1 enabling strategy)
Oxford University Facts and Figures
Oxford at a glance
Undergraduate admissions and access
Financial support for undergraduates
Postgraduate admissions and support
Oxford international
Oxford research
Oxford awards and rankings
Oxford finance
Oxford colleges
Museums, collections and libraries
Cambridge University
No University Strategic Plan was evident but two documents on U of C T & L Strategy 2012 – 2015 and U of C School of Technology 2012 – 2017 found
University of Cambridge Learning and Teaching Strategy 2012 – 2015 Action Plans
Educational and Student Policy (with 8 aims)
Student Support (with 2 aims)
Undergraduate Provision (with 3 aims) Postgraduate Provision – Ph.D. (with 2 aims)
Postgraduate Provision – Masters (with 2 aims)
Lifelong Learning (with 2 aims)
Communication and Engagement (with 3 aims) University of Cambridge School of Technology 2013 – 2017
1. Objective 1 – Maintain and enhance the outstanding research undertaken by departments within the School (14 Actions and 4 KPIs)
2. Objective 2 – Recruit the best researchers (research students and post-doctoral staff) both nationally and internationally, giving them an excellent training in research and preparing them for a range of employment opportunities (14 Actions and 4 KPIs)
3. Objective 3 – Increase the provision for high-quality Master’s students in strategic areas across the School, addressing the learning needs of postgraduates, innovating and adapting as
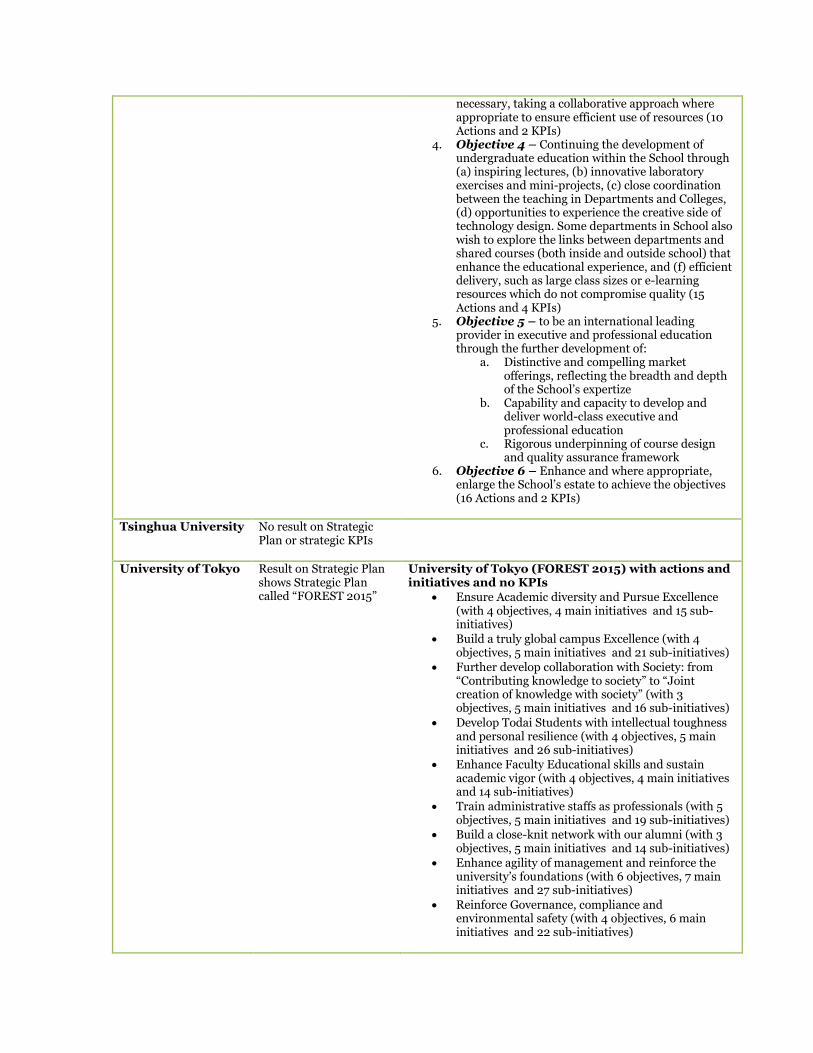
necessary, taking a collaborative approach where appropriate to ensure efficient use of resources (10 Actions and 2 KPIs)
4. Objective 4 – Continuing the development of undergraduate education within the School through (a) inspiring lectures, (b) innovative laboratory exercises and mini-projects, (c) close coordination between the teaching in Departments and Colleges, (d) opportunities to experience the creative side of technology design. Some departments in School also wish to explore the links between departments and shared courses (both inside and outside school) that enhance the educational experience, and (f) efficient delivery, such as large class sizes or e-learning resources which do not compromise quality (15 Actions and 4 KPIs)
5. Objective 5 – to be an international leading provider in executive and professional education through the further development of:
a. Distinctive and compelling market offerings, reflecting the breadth and depth of the School’s expertize
b. Capability and capacity to develop and deliver world-class executive and professional education
c. Rigorous underpinning of course design and quality assurance framework
6. Objective 6 – Enhance and where appropriate, enlarge the School’s estate to achieve the objectives (16 Actions and 2 KPIs)
Tsinghua University No result on Strategic Plan or strategic KPIs
University of Tokyo Result on Strategic Plan shows Strategic Plan called “FOREST 2015”
University of Tokyo (FOREST 2015) with actions and initiatives and no KPIs
Ensure Academic diversity and Pursue Excellence (with 4 objectives, 4 main initiatives and 15 sub-initiatives)
Build a truly global campus Excellence (with 4 objectives, 5 main initiatives and 21 sub-initiatives)
Further develop collaboration with Society: from “Contributing knowledge to society” to “Joint creation of knowledge with society” (with 3 objectives, 5 main initiatives and 16 sub-initiatives)
Develop Todai Students with intellectual toughness and personal resilience (with 4 objectives, 5 main initiatives and 26 sub-initiatives)
Enhance Faculty Educational skills and sustain academic vigor (with 4 objectives, 4 main initiatives and 14 sub-initiatives)
Train administrative staffs as professionals (with 5 objectives, 5 main initiatives and 19 sub-initiatives)
Build a close-knit network with our alumni (with 3 objectives, 5 main initiatives and 14 sub-initiatives)
Enhance agility of management and reinforce the university’s foundations (with 6 objectives, 7 main initiatives and 27 sub-initiatives)
Reinforce Governance, compliance and environmental safety (with 4 objectives, 6 main initiatives and 22 sub-initiatives)

National University of Singapore
No result on Strategic Plan but shows Vision, Mission and Strategy with no KPIs
Have Corporate Information
Student body Class of 2013
Faculty and Staff Has Service Commitment KPIs on: NUS Service, Admission, Academic Administration, Student Learning Support, IT Support, Student Development and Non-Academic Services
University of California Berkeley
Result on Strategic Plan shows Strategic plan with KPIs
UC Berkeley Pathway to Excellence 2020 Responsive Research, Teaching and Public Services
(3 Strategic KPIs and 11 Specific KPIs) Expanded Pathways for Access and Success (3
Strategic KPIs and 40 Specific KPIs including Community College [6KPIs] /Undergraduate [8 KPIs] / PGR [7 KPIs] / Faculty [7 KPIs] / Staff [12 KPIs])
Engaging and Healthy Campus Climate (4 Strategic KPIs and 9 Specific KPIs)
Have UC Berkeley “Facts at a Glance” on:
Student body Number of students Undergraduate gender Graduate gender Degrees granted in 2012-13 Enrollment by ethnicity (Fall 2011) Student profiles: Undergraduate Graduate
Faculty Student-to-faculty ratio: 17 to 1 Undergraduate classes with fewer than 30 students: 77%
Profile of admitted freshmen
Fields of study Most popular majors Courses offered:
Measures of excellence Rankings:
Public service by students
Tuition, fees & financial aid Average undergraduate student budget Average graduate student budget
Campus budget & finances Market value of endowment
Research
Libraries and museums
Athletics Alumni
University of Southern California
Has old Strategic Plan of 2004 and new Strategic Vision: Matching Deeds to Ambitions with no strategic KPIs
Have USC Fact and Figures sheet on: Students Student Demographics
International Students
Freshman Class Freshman Profile and Admission Information 2012-13
Degrees Awarded Faculty and Alumni Academic Units
Undergraduate Tuition and Mandatory Fees
Financial Aid Expenditures Endowment University Budget Sponsored Research
University Annual Financial Reports

Appendix 7: Expert opinion on the determination of final 20 KSU Strategic KPIs
Once the proposed 32 Strategic KPIs were identified through the secondary research
review in the context of leading research reports, the KSU 2030 Strategic Plan and the
university benchmarked universities, and the 11 universities that have strategic plans and
strategic KPIs, it also underwent another reduction process through expert opinions.
These expert opinions represented 3 Saudi administrators and 3 consultants in the
quality assurance areas. They were asked to select 20 main strategic KPIs that they
opinioned are to be used as the strategic KPIs for KSU and the result are shown in Table
7.1. These 20 selected strategic KSU KPIs are then mapped back into Table 3.2. The final
proposed 20 Strategic KSU KI as shown in Table 1 in the main research report. The
frequencies of occurrences and its numbers of KPIs are:
2 KPIs with 6 frequencies showed unanimous opinion of importance and
inclusion that should be included as the final 20 KSU strategic KPIs;
7 KPIs with 5 frequencies showed opinion of high level of importance and
inclusion that should be included as the final 20 KSU strategic KPIs;
9 KPIs with 4 frequencies showed opinion of moderately high level of
importance and inclusion that should be included as the final 20 KSU strategic
KPIs; and
8 KPIs with 3 frequencies showed opinion of neutrality in level of importance
and inclusion that should be included as the final 20 KSU strategic KPIs;
As the intention was to select 20 KSU Strategic KPIs, the expert opinion group
shortlisted a final set of 18 Strategic KPIs based on frequencies of occurrences that are of
a high to moderately high level of importance and inclusion, it is recommended that
these will be the final set of 18 KSU Strategic KPIs. Those 8 KPIS with 3 frequencies of
occurrences would not be included in this final set. Basically the key results were ranked
in terms of their frequencies as follows:
Table 7.1: KPIs with the 6 frequencies of occurrences
Proposed Strategic KPIs for KSU that measures strategic
performance
EO 1 EO 2 EO 3 EO 4 EO 5 EO 6 Total
10.5.1 Number of refereed publications in the previous year per full time equivalent member of teaching staff. (Publications based on the formula in the Higher Council Bylaw excluding conference presentations) (NCAAA 26 - Ratio average and Level achieved)
√ √ √ √ √ 6
3.6.2 Percentage of the full-time faculty members obtaining academic or professional awards at the national or international level. (%)
√ √ √ √ √ √ 6
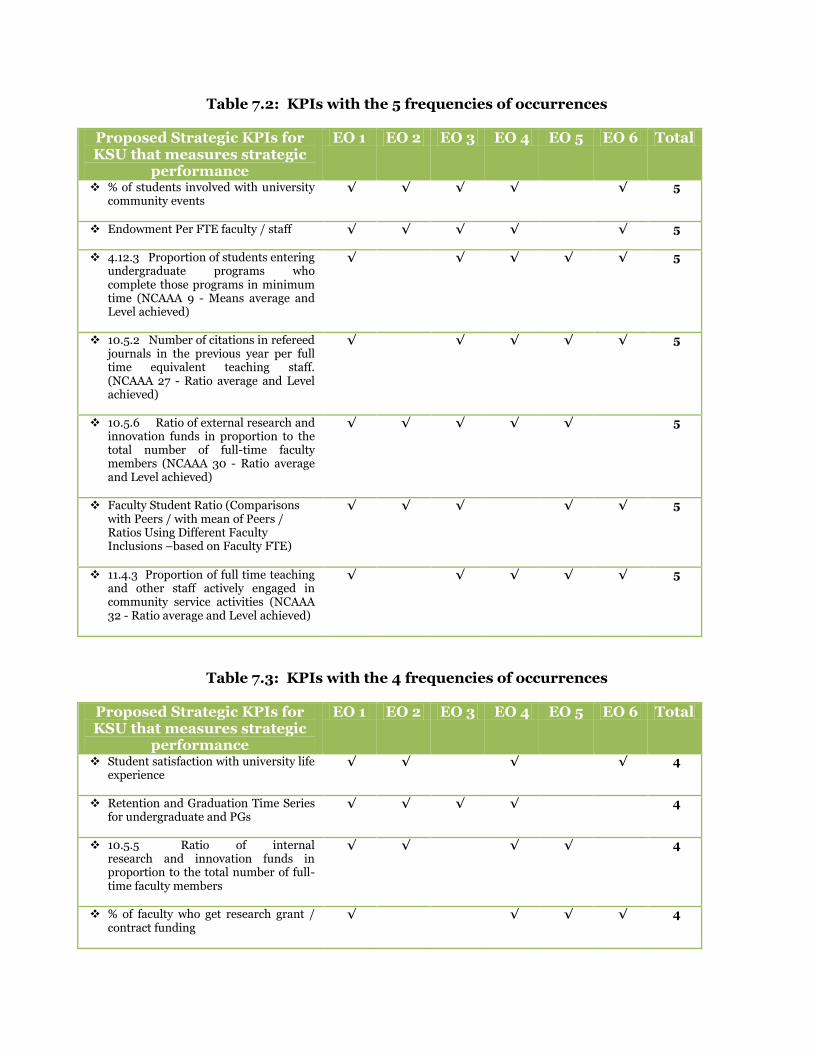
Table 7.2: KPIs with the 5 frequencies of occurrences
Proposed Strategic KPIs for KSU that measures strategic
performance
EO 1 EO 2 EO 3 EO 4 EO 5 EO 6 Total
% of students involved with university community events
√ √ √ √ √ 5
Endowment Per FTE faculty / staff √ √ √ √ √ 5
4.12.3 Proportion of students entering undergraduate programs who complete those programs in minimum time (NCAAA 9 - Means average and Level achieved)
√ √ √ √ √ 5
10.5.2 Number of citations in refereed journals in the previous year per full time equivalent teaching staff. (NCAAA 27 - Ratio average and Level achieved)
√ √ √ √ √ 5
10.5.6 Ratio of external research and innovation funds in proportion to the total number of full-time faculty members (NCAAA 30 - Ratio average and Level achieved)
√ √ √ √ √ 5
Faculty Student Ratio (Comparisons with Peers / with mean of Peers / Ratios Using Different Faculty Inclusions –based on Faculty FTE)
√ √ √ √ √ 5
11.4.3 Proportion of full time teaching and other staff actively engaged in community service activities (NCAAA 32 - Ratio average and Level achieved)
√ √ √ √ √ 5
Table 7.3: KPIs with the 4 frequencies of occurrences
Proposed Strategic KPIs for KSU that measures strategic
performance
EO 1 EO 2 EO 3 EO 4 EO 5 EO 6 Total
Student satisfaction with university life experience
√ √ √ √ 4
Retention and Graduation Time Series for undergraduate and PGs
√ √ √ √ 4
10.5.5 Ratio of internal research and innovation funds in proportion to the total number of full-time faculty members
√ √ √ √ 4
% of faculty who get research grant / contract funding
√ √ √ √ 4
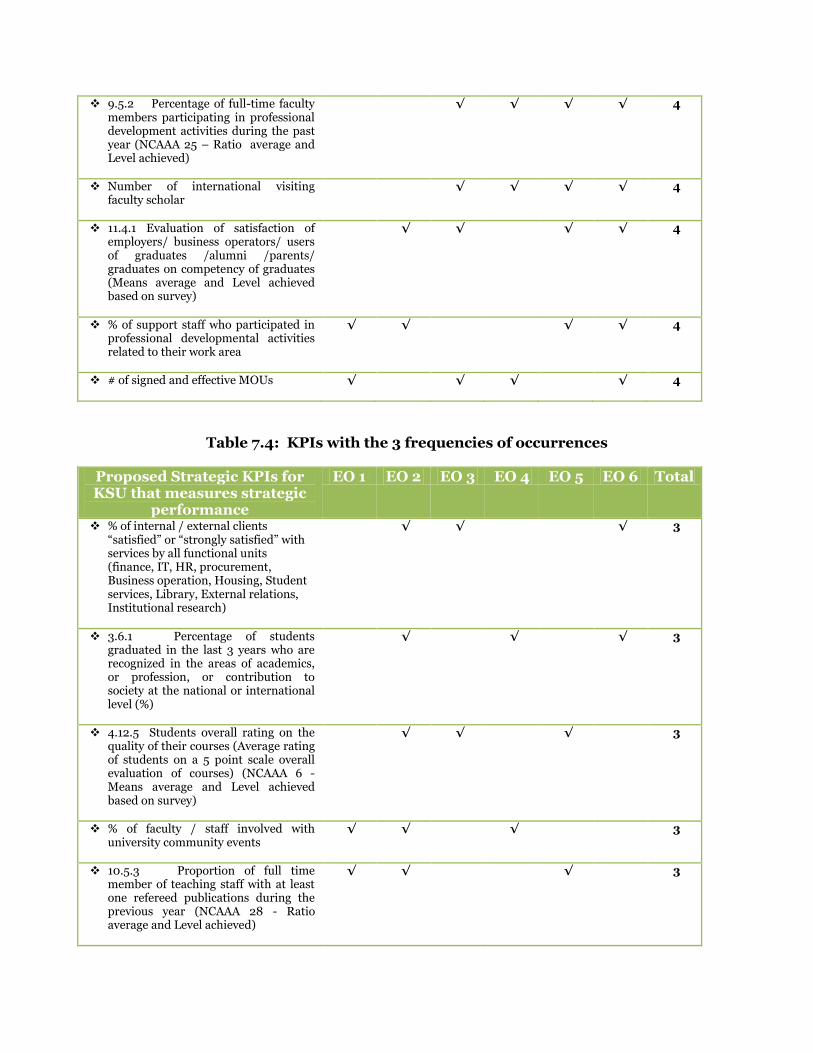
9.5.2 Percentage of full-time faculty members participating in professional development activities during the past year (NCAAA 25 – Ratio average and Level achieved)
√ √ √ √ 4
Number of international visiting faculty scholar
√ √ √ √ 4
11.4.1 Evaluation of satisfaction of employers/ business operators/ users of graduates /alumni /parents/ graduates on competency of graduates (Means average and Level achieved based on survey)
√ √ √ √ 4
% of support staff who participated in professional developmental activities related to their work area
√ √ √ √ 4
# of signed and effective MOUs
√ √ √ √ 4
Table 7.4: KPIs with the 3 frequencies of occurrences
Proposed Strategic KPIs for KSU that measures strategic
performance
EO 1 EO 2 EO 3 EO 4 EO 5 EO 6 Total
% of internal / external clients “satisfied” or “strongly satisfied” with services by all functional units (finance, IT, HR, procurement, Business operation, Housing, Student services, Library, External relations, Institutional research)
√ √ √ 3
3.6.1 Percentage of students graduated in the last 3 years who are recognized in the areas of academics, or profession, or contribution to society at the national or international level (%)
√ √ √ 3
4.12.5 Students overall rating on the quality of their courses (Average rating of students on a 5 point scale overall evaluation of courses) (NCAAA 6 - Means average and Level achieved based on survey)
√ √ √ 3
% of faculty / staff involved with university community events
√ √ √ 3
10.5.3 Proportion of full time member of teaching staff with at least one refereed publications during the previous year (NCAAA 28 - Ratio average and Level achieved)
√ √ √ 3
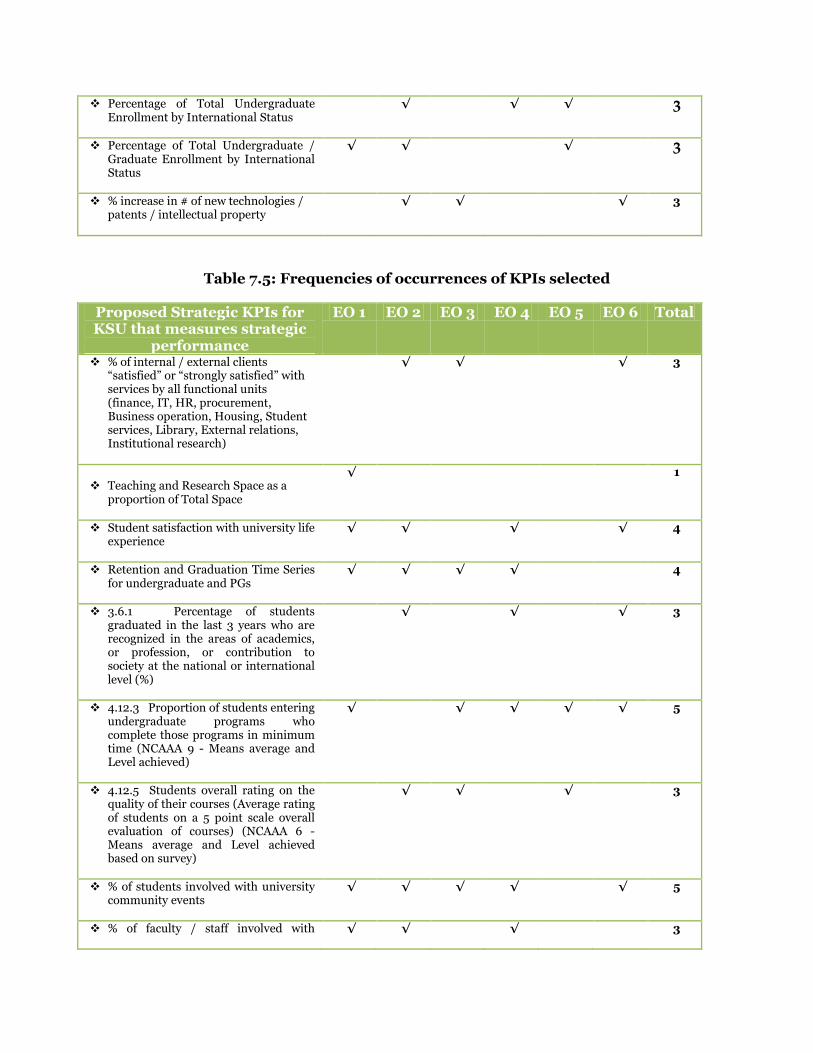
Percentage of Total Undergraduate Enrollment by International Status
√ √ √ 3
Percentage of Total Undergraduate / Graduate Enrollment by International Status
√ √ √ 3
% increase in # of new technologies / patents / intellectual property
√ √ √ 3
Table 7.5: Frequencies of occurrences of KPIs selected
Proposed Strategic KPIs for KSU that measures strategic
performance
EO 1 EO 2 EO 3 EO 4 EO 5 EO 6 Total
% of internal / external clients “satisfied” or “strongly satisfied” with services by all functional units (finance, IT, HR, procurement, Business operation, Housing, Student services, Library, External relations, Institutional research)
√ √ √ 3
Teaching and Research Space as a
proportion of Total Space
√ 1
Student satisfaction with university life experience
√ √ √ √ 4
Retention and Graduation Time Series for undergraduate and PGs
√ √ √ √ 4
3.6.1 Percentage of students graduated in the last 3 years who are recognized in the areas of academics, or profession, or contribution to society at the national or international level (%)
√ √ √ 3
4.12.3 Proportion of students entering undergraduate programs who complete those programs in minimum time (NCAAA 9 - Means average and Level achieved)
√ √ √ √ √ 5
4.12.5 Students overall rating on the quality of their courses (Average rating of students on a 5 point scale overall evaluation of courses) (NCAAA 6 - Means average and Level achieved based on survey)
√ √ √ 3
% of students involved with university community events
√ √ √ √ √ 5
% of faculty / staff involved with √ √ √ 3
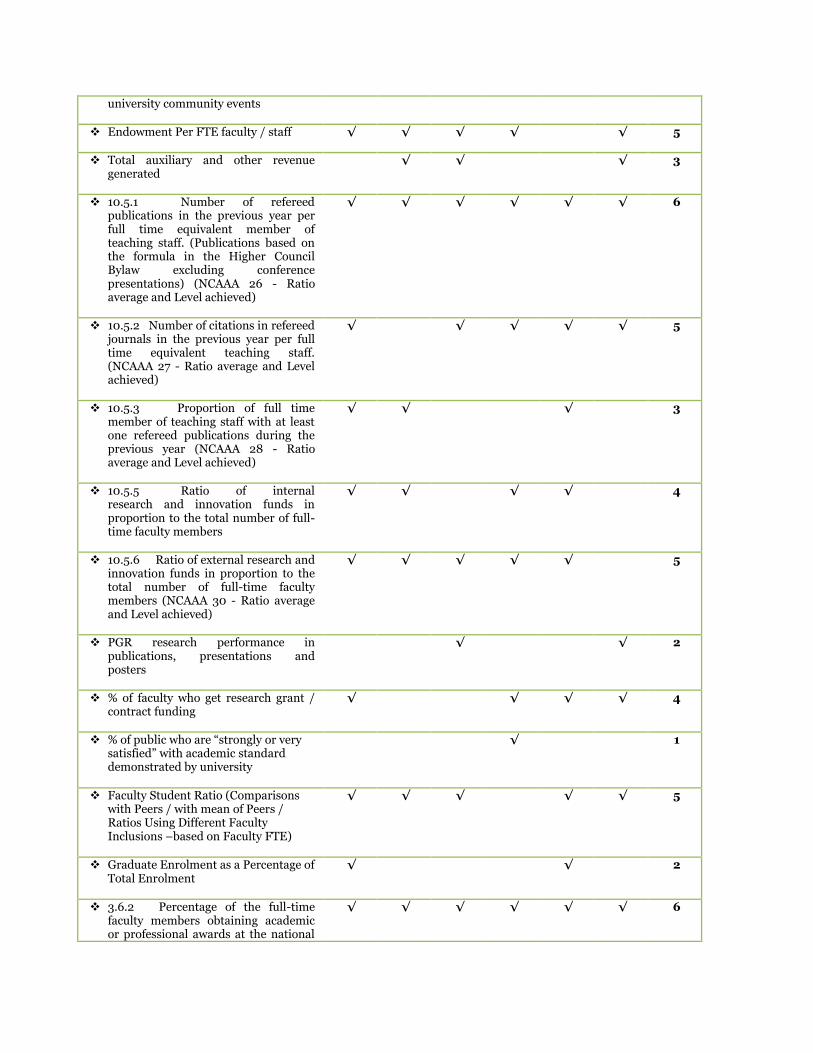
university community events
Endowment Per FTE faculty / staff √ √ √ √ √ 5
Total auxiliary and other revenue generated
√ √ √ 3
10.5.1 Number of refereed publications in the previous year per full time equivalent member of teaching staff. (Publications based on the formula in the Higher Council Bylaw excluding conference presentations) (NCAAA 26 - Ratio average and Level achieved)
√ √ √ √ √ √ 6
10.5.2 Number of citations in refereed journals in the previous year per full time equivalent teaching staff. (NCAAA 27 - Ratio average and Level achieved)
√ √ √ √ √ 5
10.5.3 Proportion of full time member of teaching staff with at least one refereed publications during the previous year (NCAAA 28 - Ratio average and Level achieved)
√ √ √ 3
10.5.5 Ratio of internal research and innovation funds in proportion to the total number of full-time faculty members
√ √ √ √ 4
10.5.6 Ratio of external research and innovation funds in proportion to the total number of full-time faculty members (NCAAA 30 - Ratio average and Level achieved)
√ √ √ √ √ 5
PGR research performance in publications, presentations and posters
√ √ 2
% of faculty who get research grant / contract funding
√ √ √ √ 4
% of public who are “strongly or very satisfied” with academic standard demonstrated by university
√ 1
Faculty Student Ratio (Comparisons with Peers / with mean of Peers / Ratios Using Different Faculty Inclusions –based on Faculty FTE)
√ √ √ √ √ 5
Graduate Enrolment as a Percentage of Total Enrolment
√ √ 2
3.6.2 Percentage of the full-time faculty members obtaining academic or professional awards at the national
√ √ √ √ √ √ 6

or international level. (%)
9.5.2 Percentage of full-time faculty members participating in professional development activities during the past year (NCAAA 25 – Ratio average and Level achieved)
√ √ √ √ 4
% of support staff who participated in professional developmental activities related to their work area
√ √ √ √ 4
Percentage of students participating in Education Abroad
√ √ 2
Number of international visiting faculty scholar
√ √ √ √ 4
Percentage of Total Undergraduate Enrollment by International Status
√ √ √ 3
Percentage of Total Undergraduate / Graduate Enrollment by International Status
√ √ √ 3
11.4.1 Evaluation of satisfaction of employers/ business operators/ users of graduates /alumni /parents/ graduates on competency of graduates (Means average and Level achieved based on survey)
√ √ √ √ 4
11.4.3 Proportion of full time teaching and other staff actively engaged in community service activities (NCAAA 32 - Ratio average and Level achieved)
√ √ √ √ √ 5
# of signed and effective MOUs
√ √ √ √ 4
% increase in # of new technologies / patents / intellectual property
√ √ √ 3
Total # of Proposed Strategic KPIs for KSU = 32 KPIs
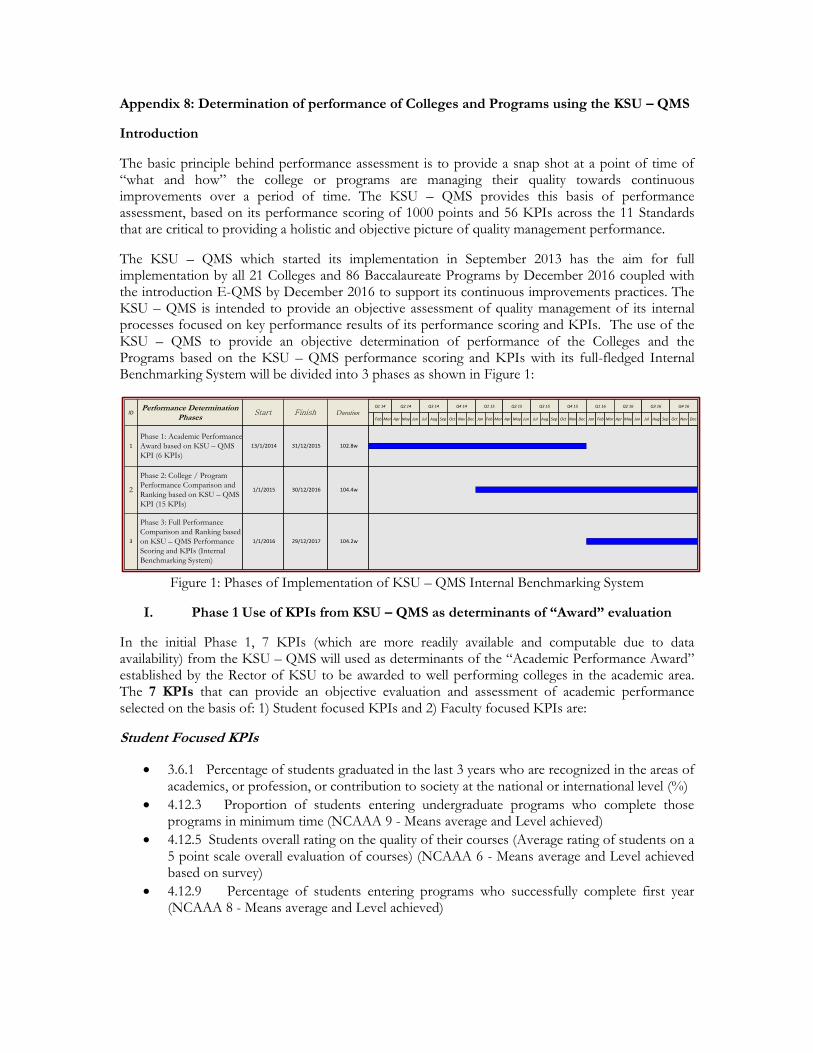
Appendix 8: Determination of performance of Colleges and Programs using the KSU – QMS
Introduction
The basic principle behind performance assessment is to provide a snap shot at a point of time of “what and how” the college or programs are managing their quality towards continuous improvements over a period of time. The KSU – QMS provides this basis of performance assessment, based on its performance scoring of 1000 points and 56 KPIs across the 11 Standards that are critical to providing a holistic and objective picture of quality management performance.
The KSU – QMS which started its implementation in September 2013 has the aim for full implementation by all 21 Colleges and 86 Baccalaureate Programs by December 2016 coupled with the introduction E-QMS by December 2016 to support its continuous improvements practices. The KSU – QMS is intended to provide an objective assessment of quality management of its internal processes focused on key performance results of its performance scoring and KPIs. The use of the KSU – QMS to provide an objective determination of performance of the Colleges and the Programs based on the KSU – QMS performance scoring and KPIs with its full-fledged Internal Benchmarking System will be divided into 3 phases as shown in Figure 1:
IDPerformance Determination
PhasesStart Finish Duration
Q1 14 Q2 14 Q3 14 Q4 14 Q1 15 Q2 15 Q3 15 Q4 15 Q1 16 Q2 16 Q3 16 Q4 16
Feb Mar Apr May Jun Jul Aug Sep Oct Nov Dec Jan Feb Mar Apr May Jun Jul Aug Sep Oct Nov Dec Jan Feb Mar Apr May Jun Jul Aug Sep Oct Nov Dec
1 102.8w31/12/201513/1/2014
Phase 1: Academic Performance
Award based on KSU – QMS
KPI (6 KPIs)
2 104.4w30/12/20161/1/2015
Phase 2: College / Program
Performance Comparison and
Ranking based on KSU – QMS
KPI (15 KPIs)
3 104.2w29/12/20171/1/2016
Phase 3: Full Performance
Comparison and Ranking based
on KSU – QMS Performance
Scoring and KPIs (Internal
Benchmarking System)
Figure 1: Phases of Implementation of KSU – QMS Internal Benchmarking System
I. Phase 1 Use of KPIs from KSU – QMS as determinants of “Award” evaluation
In the initial Phase 1, 7 KPIs (which are more readily available and computable due to data availability) from the KSU – QMS will used as determinants of the “Academic Performance Award” established by the Rector of KSU to be awarded to well performing colleges in the academic area. The 7 KPIs that can provide an objective evaluation and assessment of academic performance selected on the basis of: 1) Student focused KPIs and 2) Faculty focused KPIs are:
Student Focused KPIs
3.6.1 Percentage of students graduated in the last 3 years who are recognized in the areas of academics, or profession, or contribution to society at the national or international level (%)
4.12.3 Proportion of students entering undergraduate programs who complete those programs in minimum time (NCAAA 9 - Means average and Level achieved)
4.12.5 Students overall rating on the quality of their courses (Average rating of students on a 5 point scale overall evaluation of courses) (NCAAA 6 - Means average and Level achieved based on survey)
4.12.9 Percentage of students entering programs who successfully complete first year (NCAAA 8 - Means average and Level achieved)

Faculty Focused KPIs
3.6.2 Percentage of the full-time faculty members obtaining academic or professional awards at the national or international level. (%)
9.5.1 Proportion of teaching staff leaving the institution in the past year for reasons other than age retirement (NCAAA 24 – Ratio average and Level achieved)
9.5.2 Percentage of full-time faculty members participating in professional development activities during the past year (NCAAA 25 – Ratio average and Level achieved)
While the Proposal for the “Academic Performance Award” has 8 criteria used as the basis to select the College for the Award, there are some key issues faced with these Criteria as follows:
Criteria Potential Issues
1. Readiness of College at beginning of Academic Year
This criterion tends to be rather subjective as there are many uncontrollable factors beyond the control of the College. These factors are like size of the College, number of students, external readiness of other support units, etc., etc.
2. Student Satisfaction of College Rather than determining the overall College, the determination of satisfaction of the course evaluation specific to the course would be better scoped as compared to the multifarious factors that affects the College and needs another new survey instrument. It is better to scope it to the course evaluation of the faculty.
3. Evaluation of Faculty Performance by Student
A lot of variables like workload, expertise and experience, learning resources that affect Faculty Performance might not be known to the students. It is better scoped to the course evaluation of the faculty as in Criterion 2.
4. Workshops, seminars and activities in the college
Too diverse and too complicated to measures due to the different nature, size and needs of these workshops, seminars and activities which varies across the colleges.
5. % of electronic course Having a great number of electronic courses does not mean better performance. The % only shows the use of IT to facilitate course instructions rather than evaluate college / faculty performance.
6. % of faculty who finalize Course Reports
The performance is in the use of the Course Reports to bring about continuous improvements or informed decision making, rather than evaluation of college / faculty performance.
7. % of faculty who finalize Course Specifications
Course Specifications of the course in itself as they do not show performance unless the courses are delivered and measured for performance as per the specifications in terms of teaching pedagogy, teaching assessment, feedbacks and course management.
8. % of academic programs that acquired accreditation (national and international)
About 78 of the 86programs have attained international accreditation, and the use of this would be biased towards a college with 1 program as opposed to another college with 8 programs which is inequitable.
Conclusion for Phase 1
The Deanship of Quality would recommend the use of the 7 selected KSU – QMS KPIs as the basis for the objective evaluation of performance for the selection of the College for the Rector’s “Academic Performance Award”. (Appendix 1)

II. Phase 2 Use of KPIs from KSU – QMS as determinants of College Ranking and Performance
In determining the performance of the Colleges / Programs for 1) ranking purposes, or as the basis for 2) allocation of resources, or 3) informed decision making on critical actions to be made, the KSU – QMS also present the same rational of the use of the KPIs to justify the performance determinants and informed decision making. While the KSU – QMS is implemented by 50 % of the colleges / programs by December 2015, the potential to use these KSU – QMS KPIs for comparative performance assessment leading to informed decision making is very high. These selected KPIs can be computed as they are supported by the performance metrics system in its computation of the KPIs. The key areas inclusive of the 7 KPIs in Phase 1, can include the 1) Research Focus and the 2) Community Service, all of these 4 areas underscore the key mission of the College in Teaching, Learning, research and Services to Society. The 14 KPIs in these 4 key performance areas that subscribe to the College performance and achievements of its mission are:
Student Focused KPIs
3.6.1 Percentage of students graduated in the last 3 years who are recognized in the areas of academics, or profession, or contribution to society at the national or international level (%)
4.12.3 Proportion of students entering undergraduate programs who complete those programs in minimum time (NCAAA 9 - Means average and Level achieved)
4.12.5 Students overall rating on the quality of their courses (Average rating of students on a 5 point scale overall evaluation of courses) (NCAAA 6 - Means average and Level achieved based on survey)
4.12.9 Percentage of students entering programs who successfully complete first year (NCAAA 8 - Means average and Level achieved)
Faculty Focused KPIs
3.6.2 Percentage of the full-time faculty members obtaining academic or professional awards at the national or international level. (%)
9.5.1 Proportion of teaching staff leaving the institution in the past year for reasons other than age retirement (NCAAA 24 – Ratio average and Level achieved)
9.5.2 Percentage of full-time faculty members participating in professional development activities during the past year (NCAAA 25 – Ratio average and Level achieved)
Research Focused KPIs
10.5.1 Number of refereed publications in the previous year per full time equivalent member of teaching staff. (Publications based on the formula in the Higher Council Bylaw excluding conference presentations) (NCAAA 26 - Ratio average and Level achieved)
10.5.2 Number of citations in refereed journals in the previous year per full time equivalent teaching staff. (NCAAA 27 - Ratio average and Level achieved)
10.5.3 Proportion of full time member of teaching staff with at least one refereed publications during the previous year (NCAAA 28 - Ratio average and Level achieved)
10.5.5 Ratio of internal research and innovation funds in proportion to the total number of full-time faculty members
10.5.6 Ratio of external research and innovation funds in proportion to the total number of full-time faculty members (NCAAA 30 - Ratio average and Level achieved)
Stakeholders Satisfaction and Community Service KPIs
11.4.1 Evaluation of satisfaction of employers/ business operators/ users of graduates /alumni /parents/ graduates on competency of graduates (Means average and Level achieved based on survey)
11.4.3 Proportion of full time teaching and other staff actively engaged in community service activities (NCAAA 32 - Ratio average and Level achieved)
Conclusion for Phase 2
The Deanship of Quality would recommend the use of these 14 KSU – QMS KPIs for comparative and evaluative performance assessment of the Colleges or Programs for informed decision making leading to “ranking” of colleges or programs and allocation of resources. (Appendix 2)
III. Phase 3 Use of KSU – QMS for holistic Internal Benchmarking
With the full input of the data from the support systems via the E-QMS for KPI computation by December 2016, and with 100% of the Colleges and Programs having implemented the KSU – QMS, KSU is ready to apply the KSU – QMS for Internal Benchmarking for comparative and evaluative performance. These internal benchmarks is based on the internal audit and assessment of the overall evaluation and assessments of the KSU – QMS 11 Standards and 58 core processes on 1000 points and the 56 KPIs.
The full mechanisms on the different types of performance analysis are described and illustrated in the attached KSU – QMS Internal Benchmarking System (December 2013) which will be used as of December 2016 for comparative and evaluation quality and performance management.
Conclusion for Phase 3
The Deanship of Quality would recommend the use of the full KSU – QMS Internal benchmarking System for comparative and evaluative performance assessment of the Colleges or Programs for informed decision making leading to “ranking” of colleges or programs and allocation of resources, or as needs dictates. (Appendix on KSU – QMS Internal Benchmarking System)