HYDRAULIC EFFICIENCY OF POROUS STRUCTURES USED FOR NEARSHORE DAMPING OF WAVES
17
HYDRAULIC EFFICIENCY OF POROUS STRUCTURES USED FOR NEARSHORE DAMPING OF WAVES Selim M. Sayah 1 ; Jean-Louis Boillat 2 ; and Anton J. Schleiss 3 ABSTRACT Adequate basis for the design of soft and porous shore protection measures for shallow coastal zones are still lacking. By means of experiments, the interaction of brushwood fences with incident waves was investigated and their damping effect, quantified by the transmission coefficient, was analyzed. The analysis used five dimensionless variables based on the freeboard of the structure, its height and porosity, the wave number and the wave steepness. It was first proven that the response of the structure changes in relation to its immersion condition: its efficiency decreases rapidly when it is totally submerged. While the freeboard, the porosity and the wave steepness play a major role regarding the structure’s wave damping efficiency, the effect of its height and the wave number is shown to be insignificant. Using a parametric approach this experimental study provides a better understanding of the behaviour of the brushwood fences and, as a result, helps to establish technical recommendations for their dimensioning. 1 Ph.D., Chief Engineer, e-mail: [email protected], Laboratory of Hydraulic Constructions, now at Lombardi Engineering Ltd., Via R. Simen 19, 6648 Minusio, Switzerland. 2 Ph.D., Senior Research Associate, e-mail: [email protected], Laboratory of Hydraulic Constructions, Ecole polytechnique fédérale de Lausanne, 1015 Lausanne, Switzerland. 3 Professor, Director, e-mail: [email protected], Laboratory of Hydraulic Constructions, Ecole polytechnique fédérale de Lausanne, 1015 Lausanne, Switzerland.
-
Upload
independent -
Category
Documents
-
view
3 -
download
0
Transcript of HYDRAULIC EFFICIENCY OF POROUS STRUCTURES USED FOR NEARSHORE DAMPING OF WAVES

HYDRAULIC EFFICIENCY OF POROUS STRUCTURES USED FOR NEARSHORE
DAMPING OF WAVES
Selim M. Sayah1; Jean-Louis Boillat2; and Anton J. Schleiss3
ABSTRACT
Adequate basis for the design of soft and porous shore protection measures for
shallow coastal zones are still lacking. By means of experiments, the interaction of
brushwood fences with incident waves was investigated and their damping effect,
quantified by the transmission coefficient, was analyzed. The analysis used five
dimensionless variables based on the freeboard of the structure, its height and
porosity, the wave number and the wave steepness. It was first proven that the
response of the structure changes in relation to its immersion condition: its efficiency
decreases rapidly when it is totally submerged. While the freeboard, the porosity and
the wave steepness play a major role regarding the structure’s wave damping
efficiency, the effect of its height and the wave number is shown to be insignificant.
Using a parametric approach this experimental study provides a better understanding
of the behaviour of the brushwood fences and, as a result, helps to establish
technical recommendations for their dimensioning.
1 Ph.D., Chief Engineer, e-mail: [email protected], Laboratory of Hydraulic
Constructions, now at Lombardi Engineering Ltd., Via R. Simen 19, 6648 Minusio,
Switzerland.
2 Ph.D., Senior Research Associate, e-mail: [email protected], Laboratory of
Hydraulic Constructions, Ecole polytechnique fédérale de Lausanne, 1015 Lausanne,
Switzerland.
3 Professor, Director, e-mail: [email protected], Laboratory of Hydraulic
Constructions, Ecole polytechnique fédérale de Lausanne, 1015 Lausanne,
Switzerland.
CE Database keywords: Porous media; Wave attenuation; Protective structures;
Breakwaters; Damping
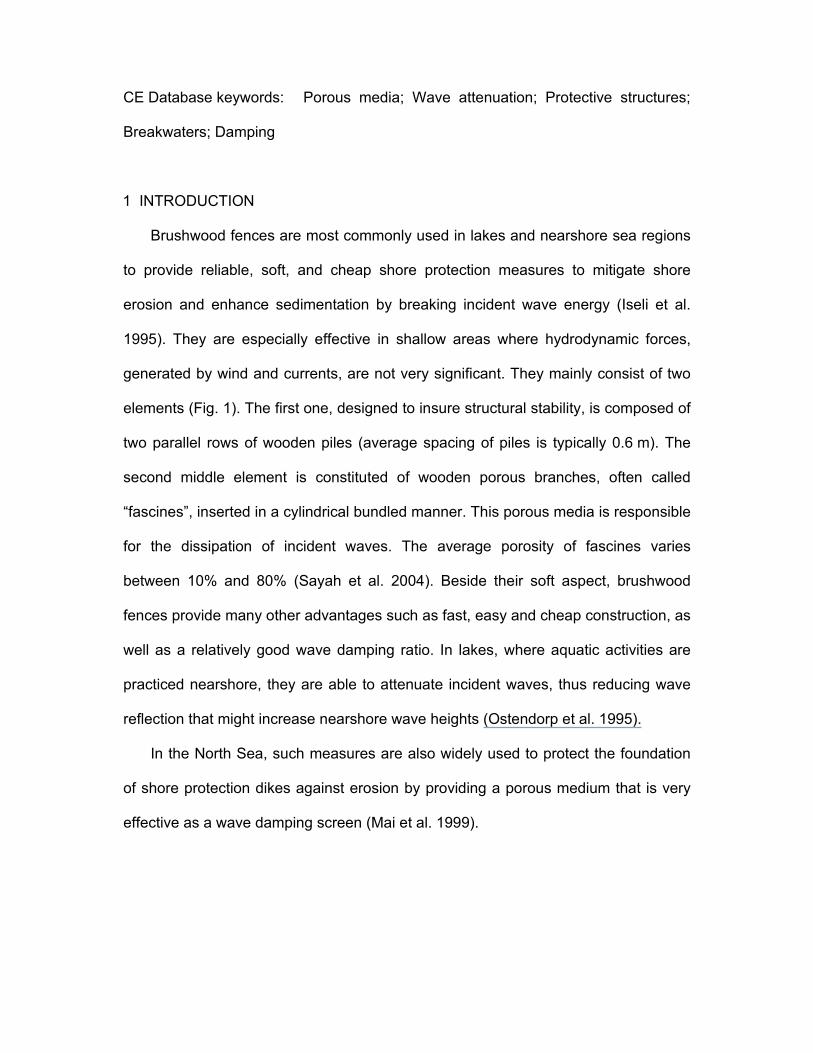
1 INTRODUCTION
Brushwood fences are most commonly used in lakes and nearshore sea regions
to provide reliable, soft, and cheap shore protection measures to mitigate shore
erosion and enhance sedimentation by breaking incident wave energy (Iseli et al.
1995). They are especially effective in shallow areas where hydrodynamic forces,
generated by wind and currents, are not very significant. They mainly consist of two
elements (Fig. 1). The first one, designed to insure structural stability, is composed of
two parallel rows of wooden piles (average spacing of piles is typically 0.6 m). The
second middle element is constituted of wooden porous branches, often called
“fascines”, inserted in a cylindrical bundled manner. This porous media is responsible
for the dissipation of incident waves. The average porosity of fascines varies
between 10% and 80% (Sayah et al. 2004). Beside their soft aspect, brushwood
fences provide many other advantages such as fast, easy and cheap construction, as
well as a relatively good wave damping ratio. In lakes, where aquatic activities are
practiced nearshore, they are able to attenuate incident waves, thus reducing wave
reflection that might increase nearshore wave heights (Ostendorp et al. 1995).
In the North Sea, such measures are also widely used to protect the foundation
of shore protection dikes against erosion by providing a porous medium that is very
effective as a wave damping screen (Mai et al. 1999).
(a) (b)
Fig. 1: Brushwood fences (or Christmas trees) used as soft shore protection agent
against wave impact and sediment loss: (a) in Swiss lakes; (b) in Louisiana’s wetland
Moreover, in the late eighties the Louisiana Department of Natural
Resources/Coastal Engineering Division (LDNR/CED 1998) established a program
called Louisiana Christmas Tree that intends to maintain Louisiana's coastal
wetlands and fight against its erosion by building similar structures. Real Christmas
trees are collected from private houses and used instead of fascine as brushwood
fences mainly to reduce wave energy while allowing the movement of water and
sediments. This program is ongoing and Christmas trees are used every year to
rebuild new fences or nourish old ones.
Although widely used, appropriate design criteria for such shore protection structures
are still lacking. Experience has shown that many implementations in lakes have not
provided the expected results due to the lack of sound scientific knowledge related to
their efficiency in wave damping as a function of local hydrodynamic conditions
(Sayah and Mai 2007). This paper aims to provide comprehensive framework for the
dimensioning of brushwood fences by means of experimental tests carried out on a
downscaled physical model.
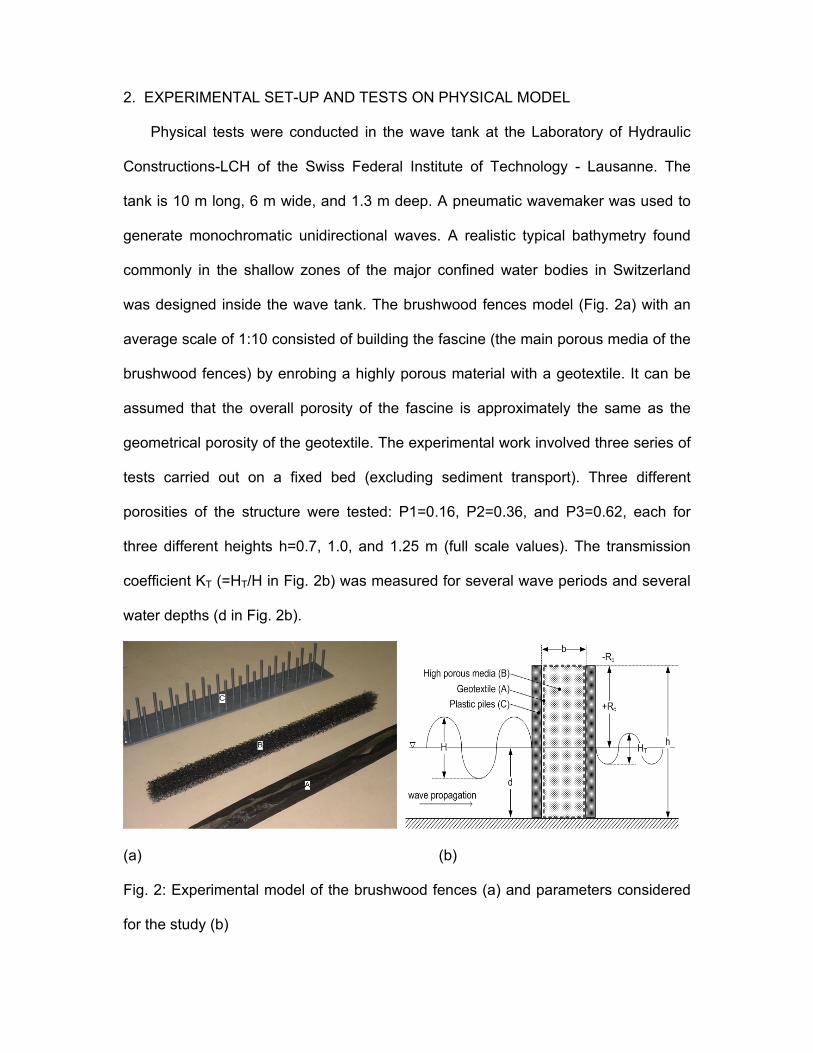
2. EXPERIMENTAL SET-UP AND TESTS ON PHYSICAL MODEL
Physical tests were conducted in the wave tank at the Laboratory of Hydraulic
Constructions-LCH of the Swiss Federal Institute of Technology - Lausanne. The
tank is 10 m long, 6 m wide, and 1.3 m deep. A pneumatic wavemaker was used to
generate monochromatic unidirectional waves. A realistic typical bathymetry found
commonly in the shallow zones of the major confined water bodies in Switzerland
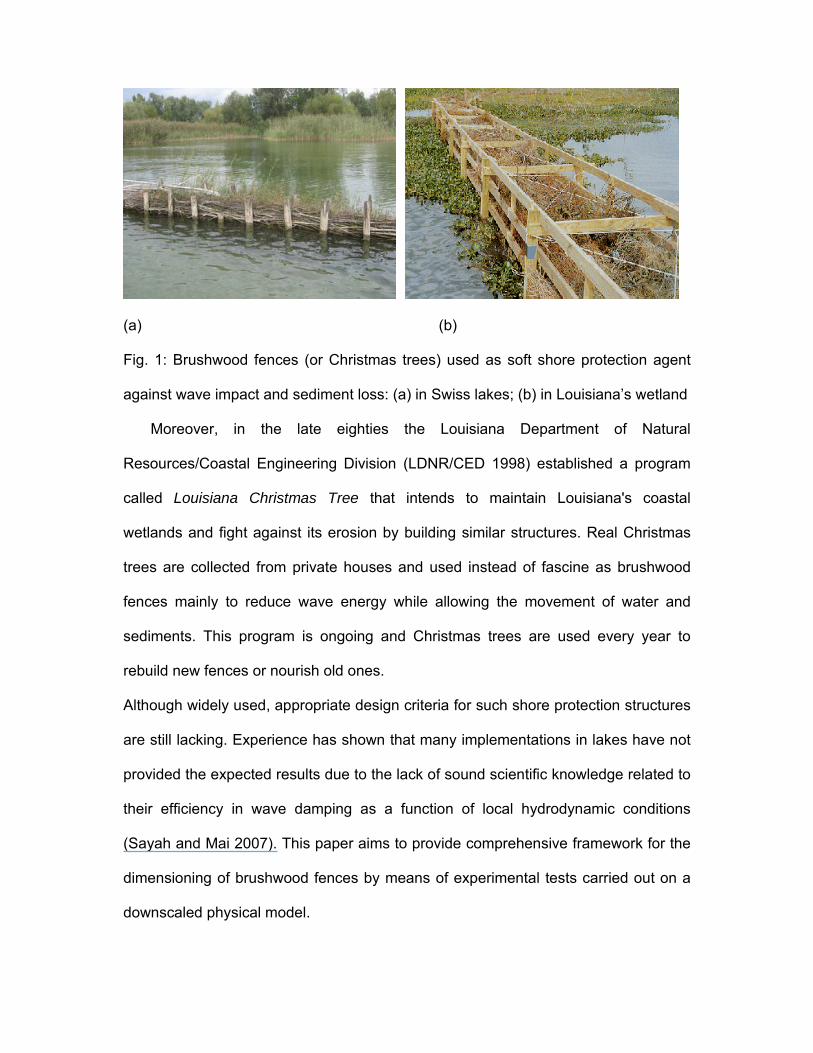
was designed inside the wave tank. The brushwood fences model (Fig. 2a) with an
average scale of 1:10 consisted of building the fascine (the main porous media of the
brushwood fences) by enrobing a highly porous material with a geotextile. It can be
assumed that the overall porosity of the fascine is approximately the same as the
geometrical porosity of the geotextile. The experimental work involved three series of
tests carried out on a fixed bed (excluding sediment transport). Three different
porosities of the structure were tested: P1=0.16, P2=0.36, and P3=0.62, each for
three different heights h=0.7, 1.0, and 1.25 m (full scale values). The transmission
coefficient KT (=HT/H in Fig. 2b) was measured for several wave periods and several
water depths (d in Fig. 2b).
(a) (b)
Fig. 2: Experimental model of the brushwood fences (a) and parameters considered
for the study (b)

Before carrying out the main test, primary analysis was done in order to compare the
different elements used for the construction of the physical model of brushwood
fences and check their hydraulic response with regards to the hydraulic behaviour of
real scale brushwood fences. This initial analysis is based on the calculation of the
minor head-loss coefficient due to the presence of the structure in a straight pipe. For
this purpose, a specific installation was built. The physical model was mounted in a
fixed cylindrical instrument installed within the pipe. For each water flow value, the
pressure upstream and downstream of the model was measured using twin tube
hydraulic piezometers. The flow in the pipe was measured simultaneously by an
electromagnetic flowmeter and an ultrasonic water level gauge fixed over an elevated
water recuperation tank at the end of the pipe where a triangular weir served to
calculate the flow. The flow values during tests varied between 4 and 12 l/s. For each
configuration, local head-losses generated by the presence of the model were
measured for four different flow values.
Fig. 3a compares the effect of the three selected geotextile porosities (P1 to P3) and
the effect of the model width (b in Fig. 2b) using the dimensionless Reynolds head-
loss coefficient as follows (Idelcik, 1960):
g
vhs
2
2Re
(1)
where is the density of water, v the measured flow velocity, g the acceleration
due to gravity, and sh the measured local head-losses. The influence of the
presence of the geotextile could be clearly seen. Although the width of the structure
does not seem to have a significant effect, the measured head-loss values are not
proportional to the porosity of the structure. This could be explained by the increase
of the drag coefficient due to the very small grid of the geotextile P1.
The hydraulic response of the above-described materials was compared to some
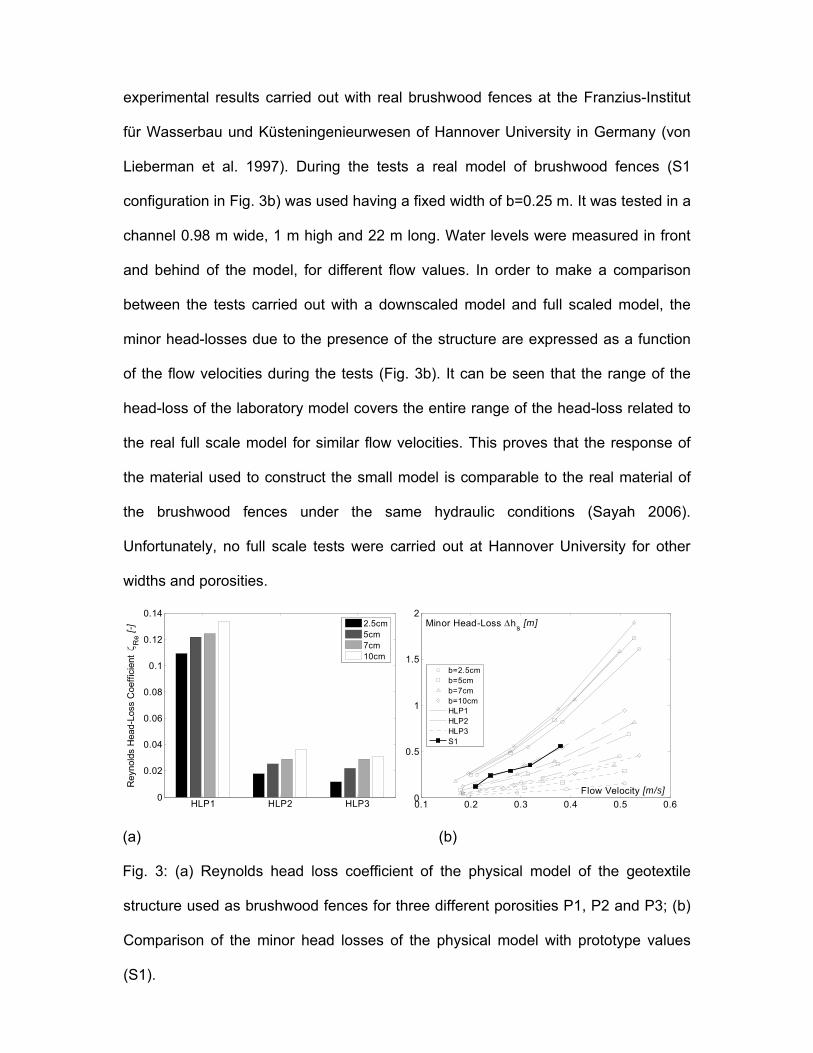
experimental results carried out with real brushwood fences at the Franzius-Institut
für Wasserbau und Küsteningenieurwesen of Hannover University in Germany (von
Lieberman et al. 1997). During the tests a real model of brushwood fences (S1
configuration in Fig. 3b) was used having a fixed width of b=0.25 m. It was tested in a
channel 0.98 m wide, 1 m high and 22 m long. Water levels were measured in front
and behind of the model, for different flow values. In order to make a comparison
between the tests carried out with a downscaled model and full scaled model, the
minor head-losses due to the presence of the structure are expressed as a function
of the flow velocities during the tests (Fig. 3b). It can be seen that the range of the
head-loss of the laboratory model covers the entire range of the head-loss related to
the real full scale model for similar flow velocities. This proves that the response of
the material used to construct the small model is comparable to the real material of
the brushwood fences under the same hydraulic conditions (Sayah 2006).
Unfortunately, no full scale tests were carried out at Hannover University for other
widths and porosities.
HLP1 HLP2 HLP30
0.02
0.04
0.06
0.08
0.1
0.12
0.14
Rey
nold
s H
ead-
Loss
Coe
ffic
ient
R
e [
-] 2.5cm5cm7cm10cm
0.1 0.2 0.3 0.4 0.5 0.60
0.5
1
1.5
2
Flow Velocity [m/s]
Minor Head-Loss hs [m]
b=2.5cmb=5cmb=7cmb=10cmHLP1HLP2HLP3S1
(a) (b)
Fig. 3: (a) Reynolds head loss coefficient of the physical model of the geotextile
structure used as brushwood fences for three different porosities P1, P2 and P3; (b)
Comparison of the minor head losses of the physical model with prototype values
(S1).
3 INTERACTION OF THE BRUSHWOOD FENCES WITH REGULAR WAVES
In the following, the results of the physical experiments focus on the transmission
coefficient of a brushwood fence; a sensitivity analysis for the effect of different
variables on this coefficient is performed. The results are based on regular wave
measurements before and after the obstacle. The wave heights are measured by two
couples of ultrasonic wave gauges situated at the seeward and leeward sides of the
fence. Concerning the investigation of the selected dimensionless variables, several
points should be noted:
The main goal of this investigation is to define the general trends linking the
analysed dimensionless variables to the transmission coefficient. These trends
used only to understand the effect of the selected variable on the transmission
coefficient, are not to be considered as final results.
The investigation for each variable is performed while keeping the other variables
constant; therefore, the possible interaction of different variables is not included.
Hence, these results should be considered as an intermediate step aimed at
identifying the trends of the transmission coefficient in relation to the various
variables adopted in the analysis.
A multivariate analysis investigating the relationship of the transmission
coefficient to all the variables, simultaneously, is the only way to obtain more
accurate and relevant results. However, since the basic trends for each variable
are still unknown, it is important to identify these trends separately first. The
second stage would be to group all the variables together and to take into
consideration the effects of simultaneous variations of several variables.
3.1 EFFECT OF THE FREEBOARD OF THE STRUCTURE Rc/Hi
The relative freeboard is an important dimensionless variable that relates incident
wave heights (Hi) with the structure height and water depth (d). The freeboard Rc is
the difference of these last two variables. It has been used by many researchers in
several applications related to breakwater efficiency in damping incoming waves,
such as Mai et al. (1999), Daemrich et al. (2001) and Calabrese et al. (2003).
Additionally, these studies included the relative freeboard in the calculation of the
transmission coefficient.
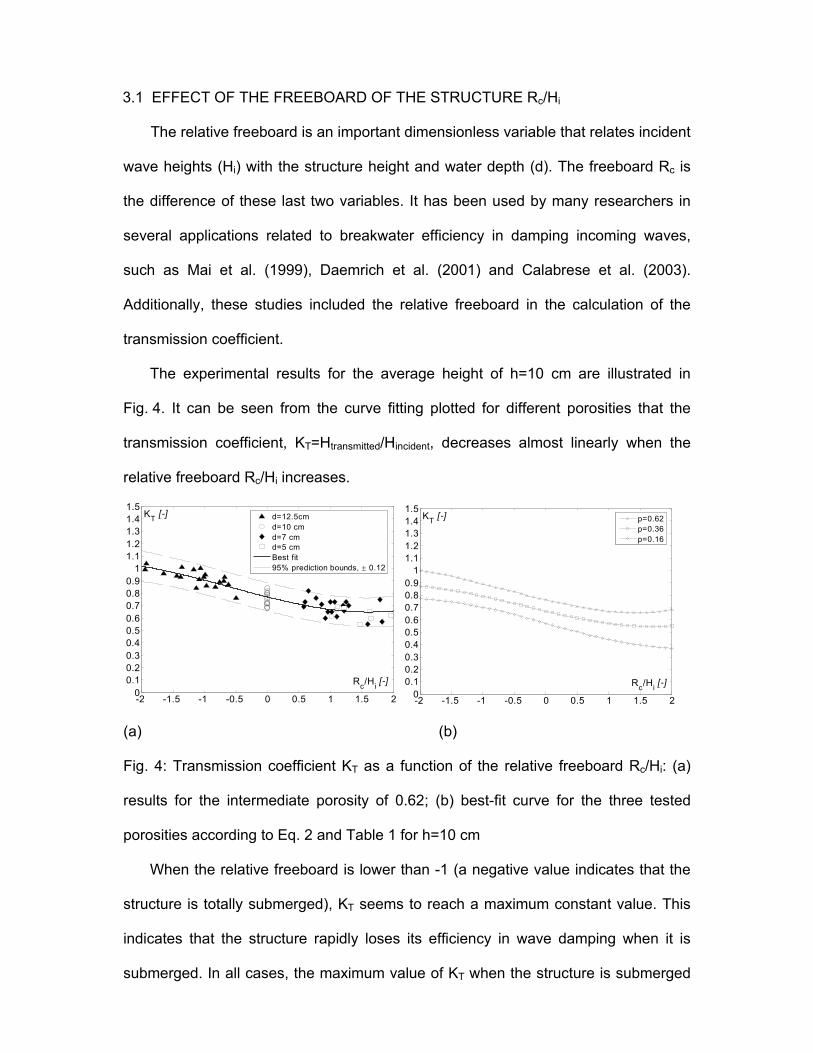
The experimental results for the average height of h=10 cm are illustrated in
Fig. 4. It can be seen from the curve fitting plotted for different porosities that the
transmission coefficient, KT=Htransmitted/Hincident, decreases almost linearly when the
relative freeboard Rc/Hi increases.
-2 -1.5 -1 -0.5 0 0.5 1 1.5 20
0.10.20.30.40.50.60.70.80.9
11.11.21.31.41.5
Rc/H
i [-]
KT [-] d=12.5cm
d=10 cmd=7 cmd=5 cmBest fit95% prediction bounds, 0.12
-2 -1.5 -1 -0.5 0 0.5 1 1.5 20
0.10.20.30.40.50.60.70.80.9
11.11.21.31.41.5
Rc/Hi [-]
KT [-] p=0.62p=0.36p=0.16
(a) (b)
Fig. 4: Transmission coefficient KT as a function of the relative freeboard Rc/Hi: (a)
results for the intermediate porosity of 0.62; (b) best-fit curve for the three tested
porosities according to Eq. 2 and Table 1 for h=10 cm
When the relative freeboard is lower than -1 (a negative value indicates that the
structure is totally submerged), KT seems to reach a maximum constant value. This
indicates that the structure rapidly loses its efficiency in wave damping when it is
submerged. In all cases, the maximum value of KT when the structure is submerged
seems to be comprised between 0.7 and 1.1 (with respect to the prediction bounds).
For Rc/Hi higher than 1, KT reaches an almost constant value.
Fig. 4 reveals that a low porosity of brushwood fences increases wave damping.
Nevertheless, wave damping does not seem to increase proportionally when the
porosity decreases, indicating a nonlinear relation between porosity and KT.
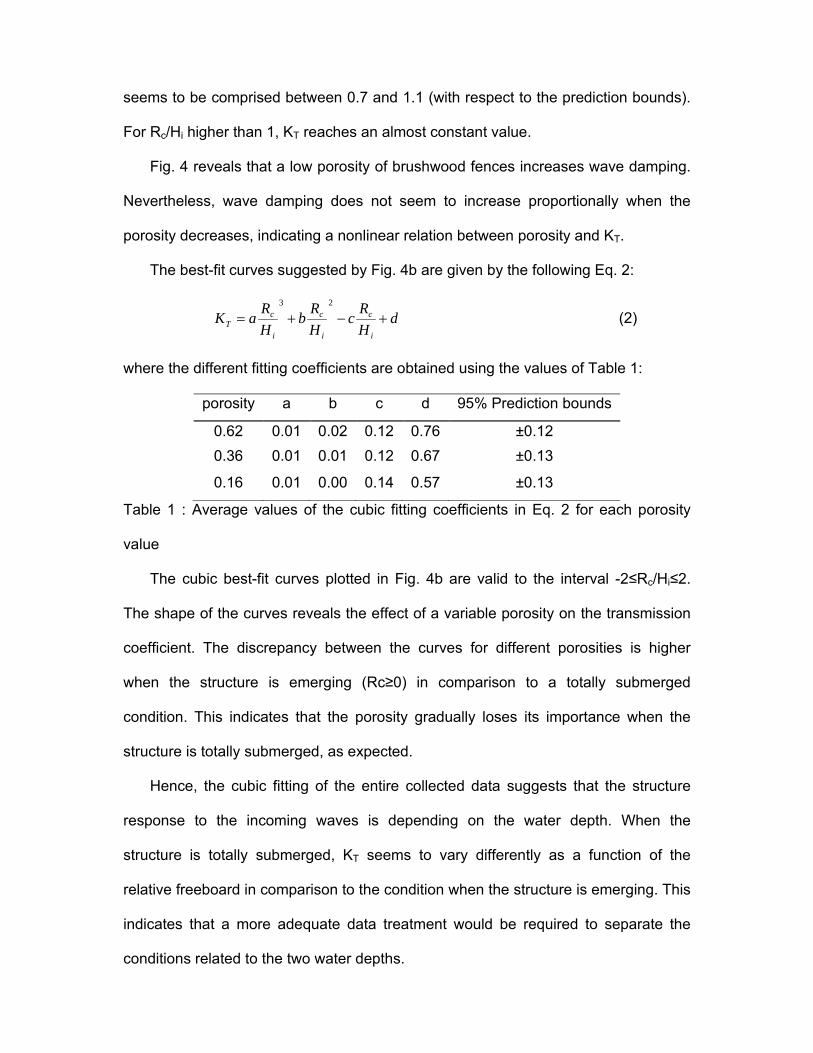
The best-fit curves suggested by Fig. 4b are given by the following Eq. 2:
dH
Rc
H
Rb
H
RaK
i
c
i
c
i
cT
23
(2)
where the different fitting coefficients are obtained using the values of Table 1:
porosity a b c d 95% Prediction bounds
0.62 0.01 0.02 0.12 0.76 ±0.12
0.36 0.01 0.01 0.12 0.67 ±0.13
0.16 0.01 0.00 0.14 0.57 ±0.13
Table 1 : Average values of the cubic fitting coefficients in Eq. 2 for each porosity
value
The cubic best-fit curves plotted in Fig. 4b are valid to the interval -2≤Rc/Hi≤2.
The shape of the curves reveals the effect of a variable porosity on the transmission
coefficient. The discrepancy between the curves for different porosities is higher
when the structure is emerging (Rc≥0) in comparison to a totally submerged
condition. This indicates that the porosity gradually loses its importance when the
structure is totally submerged, as expected.
Hence, the cubic fitting of the entire collected data suggests that the structure
response to the incoming waves is depending on the water depth. When the
structure is totally submerged, KT seems to vary differently as a function of the
relative freeboard in comparison to the condition when the structure is emerging. This
indicates that a more adequate data treatment would be required to separate the
conditions related to the two water depths.

In reference to the first observation, a separate analysis is suggested in the next
sections where two series of data are considered. The first series is the ‘s’ series,
when the structure is completely submerged, and the second is the ‘e’ series related
to an emerging structure.
3.2 EFFECT OF THE WAVE PERIOD Hi/gT2
The variation of KT with the wave steepness Hi/gT2 for different structure heights
and porosities is investigated in this section. This normalized wave steepness has
been used by many researchers, for instance Herbich (1990) and Rao et al. (1999).
In fact, it is a direct expression of the wave steepness since it does not use the water
depth in order to calculate the wave length.
0 1 2 3 4 5 6 7 8
x 10-3
00.10.20.30.40.50.60.70.80.9
11.11.21.31.41.5
Hi/gT2 [-]
KT [-] p=0.62p=0.36p=0.16
0 1 2 3 4 5 6 7 8
x 10-3
00.10.20.30.40.50.60.70.80.9
11.11.21.31.41.5
Hi/gT2 [-]
KT [-] p=0.62p=0.36p=0.16
(a) (b)
Fig. 5: Transmission coefficient KT calculated as a function of the relative wave
steepness Hi/gT2 for the three tested porosities according to Eq. 3 and Table 2 for
h=10 cm (a) emerged structure ‘e’ series (b) submerged structure ‘s’ series.
The best-fit curves are given in Fig. 5. They show that KT decreases linearly
when Hi/gT2 increases. This is in agreement with the findings in the papers
mentioned above. The decreasing trend of KT when Hi/gT2 increases can be
explained by considering the velocity of wave generated currents. As the wave
steepness increases, the wave frequency increases as well, resulting in an increase

in currents velocity and acceleration. When a wave reaches the porous structure, the
currents velocity and acceleration suddenly change, causing reduction in energy due
to the turbulence produced by the sudden change in the water motion and by the
interaction with the structure. Hence, the steeper the wave, the more intense is the
turbulence, and the greater the loss, resulting in lower KT.
The results of the evolution of KT as a function of the wave steepness for the
lowest porosity of 0.16 confirm the above mentioned behaviour. In fact, when the
porosity is very low, the energy reduction increases rapidly with wave frequency due
to the increased drag coefficient. The best-fit curves illustrated in Fig. 5 can be
reproduced using Eq. 3.
bgT
HaK i
T 2
2 (3)
The values of the coefficients a and b depend mostly on the porosity of the structure.
They are given in Table 2 for the application range 0<Hi/gT2<0.008.
Porosity
Series ‘e’
(emerging structure)
Series ‘s’
(submerged structure)
a b a b
0.62 3.59 0.73 -12.53 0.89
0.36 -12.05 0.67 -15.83 0.83
0.16 -25.55 0.51 -24.21 0.70
Table 2: Average values of the linear fitting coefficients in Eq. 3 for each experimental
configuration.
3.3 EFFECT OF THE POROSITY OF THE STRUCTURE
As mentioned previously, the porosity of the brushwood fences seems to have a

significant influence on its efficiency regarding the transmission coefficient. Although
the effects of the other dimensionless variables were analyzed for different porosities,
the separate influence of the porosity has not yet been addressed. Therefore, the aim
of this section is to understand the influence of the porosity on wave transmission
using the three different porosities considered during the experimental tests.
A direct relationship between KT and p is depicted in Fig. 6 for the two domains, Rc≥0
(emerging structure) in Fig. 6a and Rc≤0 (submerged structure) in Fig. 6b. In each
domain, the values of KT are plotted for each porosity and each structure height.
Each point plotted in Fig. 6 corresponds to a single test run. Two straightforward
conclusions can be given:
The average values of KT for each porosity are different for each domain.
The increase of KT is not proportional to the increase of the porosity of the
structure. Fig. 6a suggests that when p is multiplied by about 4 (p=0.16/p=0.62)
the transmission coefficient is multiplied only by about 2.
0.1 0.2 0.3 0.4 0.5 0.6 0.7 0.80
0.10.20.30.40.50.60.70.80.9
11.11.21.31.41.5
p [-]
KT [-] h=0.7mh=1.0mh=1.25mPower Fitting95% prediction bounds, 0.22
0.1 0.2 0.3 0.4 0.5 0.6 0.7 0.80
0.10.20.30.40.50.60.70.80.9
11.11.21.31.41.5
p [-]
KT [-]
h=0.7mh=1.0mh=1.25mPower Fitting95% prediction bounds, 0.32
(a) (b)
Fig. 6: Transmission coefficient KT calculated as a function of the porosity of the
brushwood fences for different structure heights (a) Rc≥0 (emerging structure); (b)
Rc≤0 (submerged structure)
In order to evaluate the best trends describing the relationship between KT and p,
several fitting curves are tested. The power fitting corresponds to the highest
correlation factor and lowest 95% prediction bounds as shown in Fig. 6 according to
Eq. 4:
bT paK )( (4)
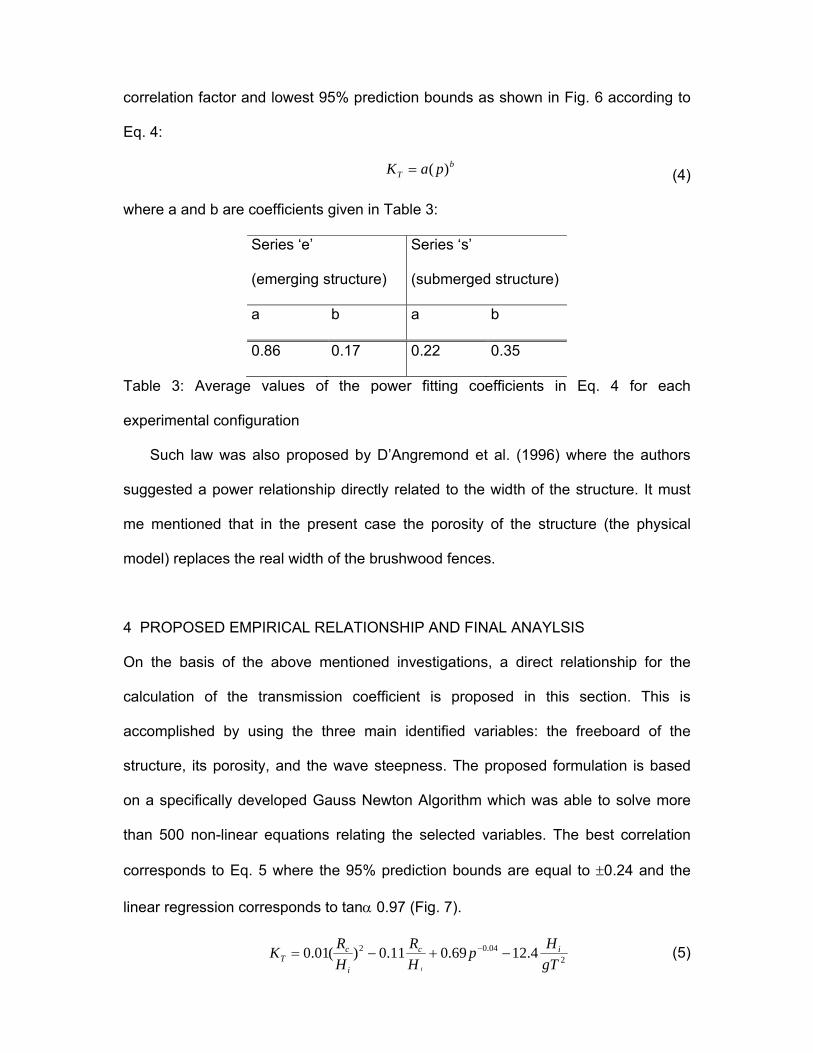
where a and b are coefficients given in Table 3:
Series ‘e’
(emerging structure)
Series ‘s’
(submerged structure)
a b a b
0.86 0.17 0.22 0.35
Table 3: Average values of the power fitting coefficients in Eq. 4 for each
experimental configuration
Such law was also proposed by D’Angremond et al. (1996) where the authors
suggested a power relationship directly related to the width of the structure. It must
me mentioned that in the present case the porosity of the structure (the physical
model) replaces the real width of the brushwood fences.
4 PROPOSED EMPIRICAL RELATIONSHIP AND FINAL ANAYLSIS
On the basis of the above mentioned investigations, a direct relationship for the
calculation of the transmission coefficient is proposed in this section. This is
accomplished by using the three main identified variables: the freeboard of the
structure, its porosity, and the wave steepness. The proposed formulation is based
on a specifically developed Gauss Newton Algorithm which was able to solve more
than 500 non-linear equations relating the selected variables. The best correlation
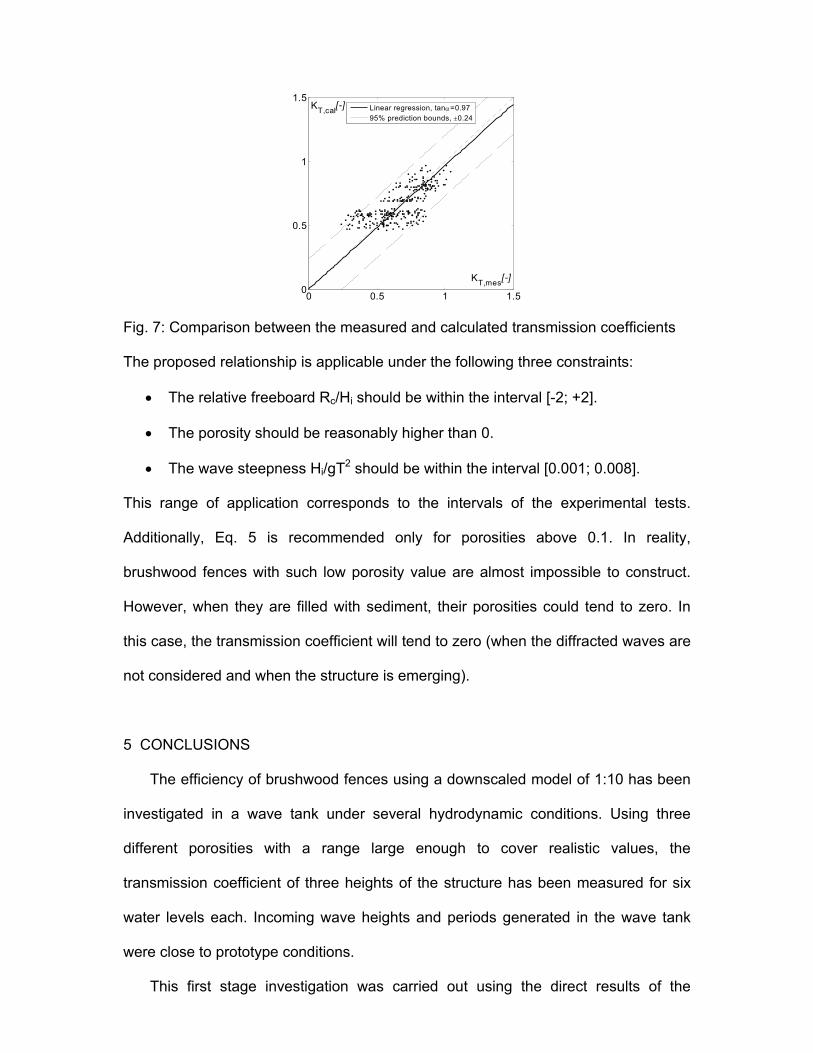
corresponds to Eq. 5 where the 95% prediction bounds are equal to 0.24 and the
linear regression corresponds to tan 0.97 (Fig. 7).
204.02 4.1269.011.0)(01.0
gT
Hp
H
R
H
RK ic
i
cT
i
(5)
0 0.5 1 1.50
0.5
1
1.5
KT,mes[-]
KT,cal[-] Linear regression, tan=0.97
95% prediction bounds, 0.24
Fig. 7: Comparison between the measured and calculated transmission coefficients
The proposed relationship is applicable under the following three constraints:
The relative freeboard Rc/Hi should be within the interval [-2; +2].
The porosity should be reasonably higher than 0.
The wave steepness Hi/gT2 should be within the interval [0.001; 0.008].
This range of application corresponds to the intervals of the experimental tests.
Additionally, Eq. 5 is recommended only for porosities above 0.1. In reality,
brushwood fences with such low porosity value are almost impossible to construct.
However, when they are filled with sediment, their porosities could tend to zero. In
this case, the transmission coefficient will tend to zero (when the diffracted waves are
not considered and when the structure is emerging).
5 CONCLUSIONS
The efficiency of brushwood fences using a downscaled model of 1:10 has been
investigated in a wave tank under several hydrodynamic conditions. Using three
different porosities with a range large enough to cover realistic values, the
transmission coefficient of three heights of the structure has been measured for six
water levels each. Incoming wave heights and periods generated in the wave tank
were close to prototype conditions.
This first stage investigation was carried out using the direct results of the

experimental tests in order to understand and evaluate qualitatively and semi-
quantitatively the effect of each selected dimensionless variable on wave
transmission. This analysis revealed the following:
The response of the structure is different with regards to its immersion condition.
When the structure is submerged, every dimensionless variable had a different
effect on the transmission coefficient in comparison to the condition when the
structure emerges.
The relative freeboard, wave steepness, and porosity played a major role in the
response of the structure regarding wave damping. The direct effect of the
relative height and wave number was not significant and could be neglected.
A non-linear relationship has to be considered when the effect of the relative
freeboard and the porosity of the structure on the transmission coefficient is
evaluated. Nevertheless, the wave steepness seems to have a linear influence on
wave transmission.
6 ACKNOWLEDGMENT
The authors are grateful to the Swiss Innovation Promotion Agency (CTI) for the
financial support of the present research under the grant N° KTI 5670.1, together with
other research partners.
REFERENCES
Calabrese, M., Vicinanza, D., and Buccino, M. (2003). "Low-crested and submerged
breakwaters in presence of broken waves." Towards a balanced methodology in
european hydraulic research, Budapest.
Daemrich, K.-F., Mai, S., and Ohle, N. (2001). "Wave transmission at submerged
breakwaters." Proc., 4th International conference on ocean wave measurement and
analysis, San Francisco, USA.
D'Angremond, K., Meer, J. W. v. d., and Jong, R. J. d. (1996). "Wave Transmission at
Low-crested Structures." Proc., 25th International Conference on Coastal
Engineering, Kobe, Japan.
Herbich, J. B. (1990). Handbook of coastal and ocean engineering, Gulf publishing
company, McGraw-Hill, New York.
Idelcik, I. E. (1960). Memento des pertes de charges, Eyrolles, Paris.
Iseli, C., and Wehrli, M. (1995). "Zehn Jahre Schilf- und Uferschutzmassnahmen am
Bielersee." VBS Schriftenreihe, 4.
Lieberman, N. v., Matheja, A., Schwarze, H., and Zimmermann, C. (1997).
"Optimierung von Küstensicherungsarbeiten im Küstenvorfeld der Nordseeküste."
Franzius-Institut für Wasserbau und Küsteningenieurwesen, Universität Hannover,
Hannover.
LDNR/CED. (1998). "Parish Coastal Wetlands Restoration Program (PCWRP)."
Louisiana Department of Natural Resources Coastal Engineering Division.
Mai, S., Lieberman, N. v., and Zimmermann, C. (1999) "Interaction of Foreland
Structures with Waves." Proc., XXVIII-IHAR Conference, Graz.
Ostendorp, W., Iseli, C., Krauss, M., Krumscheid-Plankert, P., Moret, J.-L., Rollier,
M., and Schanz, F. (1995). "Lake shore deterioration, reed management and bank
restoration in some Central European lakes." Ecological Engineering, 5, 51-75.
Rao, S., Rao, N. B. S., and Sathyanarayana, V. S. (1999). "Laboratory investigation
on wave transmission through two rows of perforated hollow piles." Ocean
Engineering, 26, 675-699.
Sayah, S. M., Boillat, J.-L., and Schleiss, A. (2004). "The Use of Soft Shore
Protection Measures in Shallow Lakes: Research Methodology and Case Study."
Limnologica, 34(1-2), 65-74.

Sayah, S. (2006). "Efficiency of brushwood fences in shore protection against wind-
wave induced erosion," Ph.D. thesis N°3424, Laboratory of Hydraulic Constructions,
Ecole polytechnique fédérale de Lausanne.
Sayah, S. M., and Mai, S. (2007). "Coastal protection against wind-wave induced
erosion using soft and porous structures: A case study at Lake Biel, Switzerland."
Proc., Coastal Sediments '07, ASCE, New Orelans, Louisiana-USA, 2321-2330.