The Elliott Wave Navigator
54
WaveTrack International GmbH Kanalstr. 14 80538 Munich Germany Phone: +49-89-21020711 Fax: +49-89-92185245 E-Mail: [email protected] www.wavetrack.com WaveTrack International and its related publications apply R.N.Elliott’s ‘The Wave Principle’ to historical market price activity which categorises and interprets the progress of future price patterns according to this methodology. Whilst it may be reasonable to deduce a course of action regarding investments as a result of such application, at no time or on any occasion will specific securities, futures, options or commodities of any kind be recommended for purchase or sale. Publications containing forecasts are therefore intended for information purposes only. Any opinion contained in these reports is only a statement of our views and are based on information we believe to be reliable but no guarantee is given as to its accuracy or completeness. Markets are volatile and therefore subject to rapid an unexpected price changes. Any person relying on information contained in these reports does so at their own risk entirely and no liability is accepted by WaveTrack in respect thereof. © All rights are copyrights to WaveTrack. Reproduction and / or dissemination without WaveTrack’s prior consent is strictly forbidden. We encourage reviews, quotation and reference but request that full credit is given. 1 OUTLOOK & FORECASTS FOR 2015 STOCK INDICES | INTEREST RATES | CURRENCIES | COMMODITIES December 2014/January2015 (data through 21 st December 2014) » TABLE OF CONTENTS {click on TOC text!} HIGHLIGHTS I. STOCK INDICES - » Last year’s report forecast a generational high forming for the S&P index into late 2014 with targets towards min. 2139.37-44.79. These levels are now being approached and basis the original concept, represents the near- completion of the U.S. stock index ‘inflation-pop’, a three-wave a zig zag upswing that began from the March ’09 lows. Despite this however, the final phase of the ‘inflation-pop’ for commodity prices has yet to develop. This has caused a major dislocation in timing a synchronised top for these positively correlated asset classes – one has satisfied its upside objectives, the other not. A re- evaluation is now necessary to determine whether a secular-bear stock market decline is about to begin regardless of whether the integrity and assignment of probability maintains that commodities will still undergo a price upsurge during the next few years. All things being equal, it seems highly unlikely that these asset classes ‘trend’ in opposite directions during the next decade. This latest annual report for 2015 explores the possibility that U.S. stock indices will extend the gains beyond original upside targets, changing a three wave upswing from the March ’09 lows into a five wave ‘impulse’ sequence. This would translate the S&P continuing much higher during the next few years, matching the up- coming gains of commodities. We expect to begin 2015 with some significant global stock index counter-trend declines but ending into the start of Q2, but then resuming uptrends thereafter. COMMODITIES - » This asset class has continued to underperform during 2014 as counter-trend declines already in progress from the 2011 highs stretch both the Elliott Wave pattern/s and time-cycle/s. Despite this, the dislocation of price activity between (DM) stock markets and commodities is expected to realign during the next year. Key economic indicators such as Copper and related Mining Stocks are close to completing major price lows. Crude Oil has recently accelerated sharply lower but prices remain within levels that simply represent the counter-trend action that balances the preceding uptrend that began from the Dec.’08 lows. {continued} “ There is a fundamental error in separating the parts from the whole, the mistake of atomizing what should not be atomized. Unity and complementarity constitute reality. ” - WERNER HEISENBERG (1901-1976) “ The harmony of the world is made manifest in form and number, and the heart and soul and all the poetry of natural philosophy are embodied in the concept of mathematical beauty. ” - SIR D’ ARCY WENTWORTH THOMPSON (1860-1948) Highlights I. » ................................... page 1 Prologue » ........................................... page 2 Overview – ‘Themes & Aspects’ » page 3 STOCK INDICIES - » .............. page 4 COMMODITIES » – .............. page 20 METALS – » ............................... page 22 BULLION » – .............................. page 24 CURRENCIES » – ................... page 26 INTEREST RATES » - ......... page 28 AppenDix fig’S # 1- » 50 .............. page 30
-
Upload
khangminh22 -
Category
Documents
-
view
0 -
download
0
Transcript of The Elliott Wave Navigator

WaveTrack International GmbH Kanalstr. 14 80538 Munich Germany Phone: +49-89-21020711 Fax: +49-89-92185245 E-Mail: [email protected] www.wavetrack.com
WaveTrack International and its related publications apply R.N.Elliott’s ‘The Wave Principle’ to historical market price activity which categorises and interprets the progress of future price patterns according to this methodology. Whilst it may be reasonable to deduce a course of action regarding investments as a result of such application, at no time or on any occasion will specific securities, futures, options or commodities of any kind be recommended for purchase or sale. Publications containing forecasts are therefore intended for information purposes only. Any opinion contained in these reports is only a statement of our views and are based on information we believe to be reliable but no guarantee is given as to its accuracy or completeness. Markets are volatile and therefore subject to rapid an unexpected price changes. Any person relying on information contained in these reports does so at their own risk entirely and no liability is accepted by WaveTrack in respect thereof. © All rights are copyrights to WaveTrack. Reproduction and / or dissemination without WaveTrack’s prior consent is strictly forbidden. We encourage reviews, quotation and reference but request that full credit is given.
1
OUTLOOK & FORECASTS FOR 2015Stock IndIceS | IntereSt rateS | currencIeS | commodItIeS
December 2014/January2015(data through 21st December 2014)
»
TAbLE OF COnTEnTS {click on TOC text!}
HIGHLIGHTS I.
STOCK InDICES - » Last year’s report forecast a generational high forming for the S&P index into late 2014 with targets towards min. 2139.37-44.79. These levels are now being approached and basis the original concept, represents the near-completion of the U.S. stock index ‘inflation-pop’, a three-wave a zig zag upswing that began from the March ’09 lows. Despite this however, the final phase of the
‘inflation-pop’ for commodity prices has yet to develop. This has caused a major dislocation in timing a synchronised top for these positively correlated asset classes – one has satisfied its upside objectives, the other not. A re-evaluation is now necessary to determine whether a secular-bear stock market decline is about to begin regardless of whether the integrity and assignment of probability maintains that commodities will still undergo a price upsurge during the next few years. All things being equal, it seems highly unlikely that these asset classes ‘trend’ in opposite directions during the next decade. This latest annual report for 2015 explores the possibility that U.S. stock indices will extend the gains beyond original upside targets, changing a three wave upswing from the March
’09 lows into a five wave ‘impulse’ sequence. This would translate the S&P continuing much higher during the next few years, matching the up-coming gains of commodities. We expect to begin 2015 with some significant global stock index counter-trend declines but ending into the start of Q2, but then resuming uptrends thereafter.
COMMODITIES - » This asset class has continued to underperform during 2014 as counter-trend declines already in progress from the 2011 highs stretch both the Elliott Wave pattern/s and time-cycle/s. Despite this, the dislocation of price activity between (DM) stock markets and commodities is expected to realign during the next year. Key economic indicators such as Copper and related Mining Stocks are close to completing major price lows. Crude Oil has recently accelerated sharply lower but prices remain within levels that simply represent the counter-trend action that balances the preceding uptrend that began from the Dec.’08 lows. {continued}
“There is a fundamental error in separating the parts from the whole, the mistake of atomizing what should not be atomized. Unity and
complementarity constitute reality.”
- werner heisenberg (1901-1976)
“The harmony of the world is made manifest in form and number, and the heart and soul and all the poetry of natural philosophy are embodied in
the concept of mathematical beauty.”
- sir d’arcy wentworth thompson (1860-1948)
Highlights I. » ................................... page 1Prologue » ........................................... page 2Overview – ‘Themes & Aspects’ » page 3
STOCK InDICIES - » .............. page 4
COMMODITIES » – .............. page 20
METALS – » ............................... page 22
bULLIOn » – .............................. page 24
CURREnCIES » – ................... page 26
InTEREST RATES » - ......... page 28
AppenDix fig’S # 1- » 50 .............. page 30

2
WaveTrack International GmbH Kanalstr. 14 80538 Munich Germany Phone: +49-89-21020711 Fax: +49-89-92185245 E-Mail: [email protected] www.wavetrack.com
»
PROLOGUE
Three deterministic disciplines are used to compile this year’s price forecasts for 2015 – first and foremost, trends and counter-trends, their interdependent path of price development is governed by the Elliott Wave Principle (EWP) – second, price amplitude basis numerology, specifically, the geometric ratio and proportion qualities of the Fibonacci Summation series – and third, time as in cycle theory, derived from the use of repeating periodicities. This report not only compiles the product of these attributes, but also attempts to explain the basis of its results in a logical, understandable manner. Information is only useful if it can be ‘actioned’ upon and that can only be attempted if there is a belief that price-forecasting is possible in the first place.
This report again includes many cycles covering different time spans. To get the most out of this analysis, remember two things – the red cycle line measures time, not necessarily price amplitude and so be careful not to interpret this in terms of price expectancy – that dimension is attained using the Elliott Wave Principle (EWP) and our proprietary application for using Fibonacci Price Ratios (FPR). Some cycles overlay the price in order to visually accentuate the timing of peaks and troughs, whereas others appear in non-overlay format and appear at the bottom of the chart and simply portray longer-term effects in progress.
Two time-periods are described in this report and these must be singularly interpreted with corresponding time-periods of Elliott Wave analysis. Inter-mediate term composite cycles that combine various time-interval components offer guidance to how we can expect 2015 to develop whilst medium-term cycles project further into the future, towards the end of the current decade and into the next.
«
» HIGHLIGHTS II. - contInued
COMMODITIES » {cont.} -Five wave patterns evident in the initial upswing from the financial-crisis lows into the 2011 highs maintains the ongoing development of the ‘inflation-pop’. precious metals such as gold and Silver are already at levels that approach the completion of counter-trend declines that began in April-September 2011 whilst platinum has already ended its equivalent pattern. Some of the largest advances for 2015 and beyond are expected from Gold and Silver mining stocks where upside objectives indicate multiple gains of between 5-9 times value.
CURREnCIES – » The benchmark US$ dollar index lost some of its standard negative correlation with developed stock markets (DM’s) including the S&p during the second-half of 2014. its overall advance from the May’ 14 low is now approaching the upside completion as the fourth sequence within a multi-year triangle pattern - this indicates an overall decline is forecast for 2015, perhaps extending into 2016. This seems to be critical in providing underlying support for the next phase of the commodity ‘inflation-pop’ upsurge set to begin in Q1 2015. Even if the US$ dollar is delayed in turning around its overall gains of 2014 as the new year begins, it seems unlikely that it would be prolonged at this stage of development. The Euro/US$ remains the inverse image of the US$ dollar index with support for the Euro as it approaches levels above the previous lows of 1.2042 (July ’12) and 1.1876 (June ’10). its overall decline during 2014 from 1.3993 is approaching downside completion and we expect it to trend upwards during the coming year, 2015. Even a break below these support levels would not trigger a prolonged decline as the 1.3993 five wave impulse pattern would first require a balancing counter-trend upswing to develop. The US$/Yen is approaching a major high towards 126.18+/- as it ends a five wave impulse pattern that began from the nov.’11 low. This also suggests a weakening US$ dollar for the next year as a counter-trend decline gets underway.
InTEREST RATES – » This time last year, the federal Reserve began to unwind its quantitative easing and bond-buying programme, paving the way for a gradual rise in interest rates. Despite this, long-dated yields declined throughout 2014 from 3.043% to a low at 1.912% with an interim rally to 2.655%. The outlook for direction is now mixed and finely balanced between a break above resistance at 2.655 that would confirm an uptrend and a break below 1.912 that would otherwise confirm a downtrend and projections to new record lows. With the US$ dollar expected to weaken in 2015, there is an ominous indication that yields could also fall as currency devaluation wars continue. But this is not certain. in europe, long-dated yields in germany have declined to new record lows in 2014 to 0.618% but are now approaching downside target levels towards 0.517%. The long-term downtrend could complete at this level and trigger the beginning of a new uptrend. This could be initiated with dissent in the eCB’s implementation of quantitative easing. The De10yr yield has certain downside limits – namely zero!

3
WaveTrack International GmbH Kanalstr. 14 80538 Munich Germany Phone: +49-89-21020711 Fax: +49-89-92185245 E-Mail: [email protected] www.wavetrack.com
»
The first sequence begins with an upswing from those lows that takes the form of a smaller five wave pattern – this is crucial to the ongoing forecasts for the future because a five wave impulse pattern defines the ongoing trend development as directionally ‘upwards’. Once a balancing second sequence pulling prices lower into a corrective pattern ends, a third sequence, equal to the first must begin another price advance. This is the definition of a zig zag pattern.
When the S&P index began its advance in March ’09 from 666.79, it unfolded into a five wave impulse pattern that ended into the Feb.’11 high at 1344.07 (113 weeks). This was followed by a second sequence of counter-trend declines that ended into the Oct.’11 low at 1074.77. The next advance began the final third sequence of the zig zag and by extending the first upswing by a fib. 61.8% ratio (using the May ’11 high of 1370.58), upside targets for the third are measured to 2139.37. This target level is only now being approached! (167 weeks, so far). This would naturally lead us to conclude that the
‘inflation-pop’ rally for U.S. stock markets is closing in on completion!
But there is a problem with this assumption.
Asian stock markets (ex Japan) and commodities like Copper also traded higher from the Oct.’08/Dec.’08 lows by unfolding into similar five wave impulse patterns that ended in early 2011, the same time the S&P completed its first upward sequence of its zig zag. When the S&P began its subsequent counter-trend decline into the Oct.’11 low, Asian markets and Copper followed too – they even began to rally higher from the Oct.’11 lows in synchronisation with the S&P. Only later, beginning in November 2012 through to January ‘13 did the positive correlation begin to break down. As the S&P accelerated higher, Asian markets and commodities fell abruptly lasting 6 months. These declines were so severe that when they recovered from the June ’13 lows, there was too much ground to make up - the S&P had by that time, traded into a new record high.
Commodity performance was the component drag for many of these Asian stock markets. Copper prices continued lower whilst Crude oil, at this stage, oscillated within its initial sell-off trading-range that unfolded between May-October ’11.
OvERvIEW – ‘THEMES & ASPECTS’
Last year’s introduction made this assertion:
“The coming year, 2014, is expected to be the most important year in a generation. The final stock index advances unfolding from the financial-crisis lows of 2008/2009 are forecast ending in 2014, forming an historical peak that will not be surpassed for several decades into the future”.
Also:
“Asian markets require ‘catching-up’, so as to synchronise with the S&P peak that is scheduled to complete later in 2014, and so there should be a noticeable change of emphasis by fund managers once we get into the end of the first quarter of 2014. This change in the weighting of portfolios is expected to be triggered by the set-up in commodities where we forecast huge gains during the next 12-18 months”.
The first part of last year’s annual forecast are now being realised with the S&P and other U.S. indices like the Nasdaq 100 approaching upside targets first calculated over four years ago. But the ‘catching-up’ of Asian stock markets and Commodities never materialised. Asian indices (ex Japan) have lagged behind the upside progress of their U.S. stock index counterparts with markets like Hong Kong’s Hang Seng, Korea’s Kospi and Singapore’s Straits Times index failing to break above the old 2007/11 highs. Key industrial commodities that provide an excellent indicator of how the ‘boiler-house’ of global economies are working, like Copper and other base metals are also trailing. Something’s out of whack!
This dislocation between major indices and commodities that are commonly ‘positively correlated’ must be reconciled and factored into price forecasts for the future.
THE ‘InFLATIOn-POP’
The post financial-crisis recovery period that began from the October ‘08/March ’09 lows is termed the ‘Inflation-Pop’ scenario, the second sequence within the larger ‘Shock-Pop-Drop’ 18+/- year U.S. stock market cycle. The inflation-pop is generally taking the form of an Elliott Wave zig zag pattern, a three price-swing event lasting six years so far.
«
»

4
WaveTrack International GmbH Kanalstr. 14 80538 Munich Germany Phone: +49-89-21020711 Fax: +49-89-92185245 E-Mail: [email protected] www.wavetrack.com
»
This leads to the logical statements, one is true, the others false:
U.S. stock markets are now preparing to »begin a secular-bear market decline – the Asian stock market/commodity ‘inflation-pop’ scenario is incorrect
U.S. stock markets will begin a secular-bear »market decline whilst commodities disengage and move into the next phase of the ‘inflation-pop’ upsurge – this would mean a negative-correlation – something we believe to be a low probability event.
The Asian stock market/commodity ‘inflation- »pop’ is correct, and this will ultimately translate into changing the U.S. stock market upswing from the March ’09 lows from a zig zag to an evolving 5-wave impulse pattern that will propel U.S. stocks much, much higher during the next few years
The first proposition seems unlikely given the aspects listed earlier that underline an Asian stock market and commodity ‘inflation-pop’ upsurge. Next, these different asset classes diverge, trend in opposite directions - that seems unlikely because mining stocks that have a huge ‘equity’ (non-commodity) element built into their price-patterns that follows the same model of the ‘inflation-pop’ zig zag (example, see BHP-Billiton in fig #33). And finally, Sir Arthur Conan Doyle wrote: “Once you eliminate the impossible, whatever remains, no matter how improbable, must be the truth”. In this case, the last statement that translates into U.S. stock markets trading much, much higher during the next few years seems at first improbable, but does hold credibility.
The mind is sometimes a strange machine – it clings to what it thinks it ‘knows’ and is reluctant to change. It holds on to familiar ground and seeks constancy. When it ‘intellectually’ understands change, it attempts to seek only small-step movements over gradual periods of time. These are the blockers for investment and trading – tunnel vision is restrictive – no wonder mainstream financial analytics produces mediocre results with economist forecasts oscillating around the mean-average of the last few months – and no wonder investors’ trade emotionally when markets accelerate outside of those standard deviation comfort zones.
Only recently is it declining sharply and giving back more of the preceding upswing that began the decennial advance from the Dec.’08 low of 33.20. The fact that commodities have underperformed the stock markets, especially those like the S&P tells us something about what is happening across the different asset classes as a result of Central Bank’s quantitative easing and loose monetary policy programmes of recent years.
With key commodities like Copper underperforming, this reflects badly on the state of a global post financial-crisis recovery, and echoed by Central Banks when they remark that funds allocated to small/medium sized businesses is not getting through. But what we do know is this: Asian stock markets, Copper and even Crude oil each unfolded higher from those Oct.’08/Dec.’08 lows whilst unfolding into Elliott Wave (five-wave) impulse patterns and even though subsequent corrective declines are only now attempting completion levels, there is a high probability that once completed, another five wave impulse pattern will begin the next price surge into record highs.
This forecast is corroborated by several other aspects. First, the patterns of subsequent declines from the 2011 highs are taking the form of characteristic counter-trend structures – second, price declines are holding well above the 2008/09 lows – and third, some commodity-related currencies like the Aussie $ dollar and Canadian $ dollar have also unfolded into counter-trend patterns since July 2011. As soon as these synchronise with the completion of their counter-trend declines, a new uptrend for commodity currencies will begin, pulling the US$ dollar lower against them.
And so, this bullish evaluation of Asian stock indices and commodities, that they too must undergo another upward price surge to continue the evolving zig zag pattern that began from the Oct.’08/Dec.’08 lows opens the ‘Pandora’s Box’ on how U.S. stock markets will perform during the same period.
If Asian stock markets and key industrial commodities are set to begin upward prices surges in early 2015, lasting the next 2-3 years, how can original multi-year zig zag upside targets for the S&P and other U.S. indices signal their completion and the possibility of beginning a secular-bear market?
«
»

5
WaveTrack International GmbH Kanalstr. 14 80538 Munich Germany Phone: +49-89-21020711 Fax: +49-89-92185245 E-Mail: [email protected] www.wavetrack.com
»
The expanding flat pattern performed perfectly, both in Elliott Wave structure and geometric ratio and proportion. But how did the expanding flat fit into the larger picture?
At this juncture, in March ’09, it was not certain whether the expanding flat ended a 4th wave within an ongoing five wave impulse pattern that began from the year-1974 low or if this began the second sequence within an even larger expanding flat pattern, as super-cycle wave 🄱. The difference between these two wave classifications would ultimately determine how high the next advance would unfold.
Cycle analysis indicated a major cycle-peak was forming into the years 2013/15 onwards, and so this suggested labelling the March ’09 low as ending super-cycle wave 🄰 and the subsequent multi-year advance as a zig zag for super-cycle wave 🄱. For the S&P index, fib-price-ratio measurements of this zig zag projected an upside conclusion towards the 2139.37-2144.79 level (max. 2239.02) – see fig #1. Once completed, super-cycle wave 🄲 would then begin a multi-year decline of secular-bear proportions and time, and in this chart, downside targets are measured to a staggering level towards 322.00+/- representing a deprecation of -85% per cent!
The 42-year cycle that connects the two major lows of 1932 and 1974 pointed towards another major low in 2016/17. That would mean a cycle-high reaching completion beforehand. The archetypal pattern for the ‘Shock-Pop-Drop’ is the multi-decennial expanding flat pattern – see fig #2. This highlights the idealised cycle peak for super-cycle wave 🄱 into the 2014/15 time zone with wave 🄲 into a later date beginning in 2018 derived from the next 18-year cycle low.
But in order to delve into the laws that govern price-determination, the mind must let go of these outdated notions and hold true to the universal principles that guide the action/reaction process.
This is going to be crucial in order to determine under what conditions U.S. stock markets are capable of extending much higher during the next few years so that they synchronise their actions with the final stages of long-term uptrend for Asian stock markets, and the ‘inflation-pop’ zig zag patterns for commodities.
This report now continues to explore the theme that U.S. stock markets will continue much higher during the next few years, synchronising percentage gains with equivalent upside target levels already published in last year’s EW-Navigator report.
THE U.S. STOCK InDEx ‘InFLATIOn-POP’
A fast rewind back to January 2004 – this is the origin of the multi-year expanding flat pattern that later became termed as the ‘Shock’ phase, the first of three phases of the ‘Shock-Pop-Drop’ scenario. Our Elliott Wave price forecasts projected the Dow Jones (DJiA) into new record highs to 14169.80 when prices were still trading at 10582.70. This became wave ‘B’ of the expanding flat pattern with wave ‘C’ set to decline thereafter to a final low at 6411.30 – we now know the high was 14198.10 and the low 6470.00.
«
»
fig. #1 S&p 500 index - Quarterly
fig. #2 Shock - pop - Drop - flat expanding pattern ©WaveSearch

6
WaveTrack International GmbH Kanalstr. 14 80538 Munich Germany Phone: +49-89-21020711 Fax: +49-89-92185245 E-Mail: [email protected] www.wavetrack.com
As you can now see from this next chart, super-cycle wave 🄱’s ‘inflation-pop’ upswing for the S&P beginning from the March ’09 low of 666.79 has performed perfectly – see comparative in fig #3. And so, viewed in isolation, there would be every reason to believe this advance is now approaching upside completion and soon ushering in a new secular-bear market – see close-up in fig #4.
The Elliott Wave A-B-C 5-3-5 structure of the zig zag has been fulfilled together with geometric fib-price-ratios where wave A (666.79-1344.07 [1370.58]) is extended by a fib. 61.8% ratio to project the 2139.37 level that converges with the fib. 38.2% extension of super-cycle wave 🄰 (1552.87-666.79) to 2144.79.
The annual composite cycle that combines the 36-year and 42-year cycles is updated and shown in fig #5. The cycle-peaks have been accurate with the year-1929 high forming into the exact date, also into the next in year-1968. The subsequent cycle-peak also formed in late 2007 prior to the financial-crisis sell-off even though prices have since traded higher.
When prices generally diverge with the cycle projection, this normally indicates a bearish divergence even though an annual chart like this would create the divergence over several years. Nevertheless, this cycle would corroborate the idea that a secular-bear market decline is a viable concept.
WaveTrack’s proprietary monthly composite cycle that includes Edward Dewey’s (1895–1978) famed 40.68 month periodicity also points towards a cycle-peak into the period ending in 2015, beginning of 2015 – see fig #6.
There has to be a very good reason to abandon this warning of an imminent top forming for the S&P and other major U.S. indices.
»
« »
fig. #3 S&p 500 index - Weekly - Track Record
fig. #4 S&p 500 index - Weekly
fig. #5 S&p 500 index - Yearly - Composite Cycle

7
WaveTrack International GmbH Kanalstr. 14 80538 Munich Germany Phone: +49-89-21020711 Fax: +49-89-92185245 E-Mail: [email protected] www.wavetrack.com
Even the Nasdaq 100 has now approached its near-maximum upside target levels based upon two important aspects – first, its original decline from the all-time high of 4816.35 traded in March ’00 unfolded into a five wave impulse pattern that ended in Oct.’02 at 795.25 – see fig #7.
If this pattern is correct, it should be impossible for the subsequent upswing to break above this all-time high as its function is a counter-trend sequence, labelled as a double zig zag pattern A-B-C-X-A-B-C and ending at current levels of 4350.00+/-. This index is almost maxed-out!...it has so little room to squeeze out any more upside to extend the corrective rally from 795.25.
The five wave impulse decline between 4816.35-795.25 is convincing, and if correct, would corroborate a secular-bear market beginning into early 2015. But then how can this be correct when Asian stock markets and key Commodities are indicating a second phase of an ‘inflation-pop’ upsurge is just around the corner?
DISLOCATIOn & RECOnCILIATIOn
The dislocation between U.S. stock markets, specifically the S&P and commodities can be seen in this analogue comparative chart – see fig #8.
This began from the end of 2012 into the beginning of 2013 when the S&P accelerated higher whilst Crude oil inched modestly higher and Copper trading lower.
Both Crude oil and Copper remained below the 2011 peaks traded in May and February respectively, and so this has resulted in these commodities prolonging counter-trend patterns that began from these dates.
More importantly though, each unfolded higher from the financial-crisis lows into five wave impulse patterns. The Elliott Wave Principle states that a five wave pattern at this location must be repeated once the corrective balancing period has ended.
This is the cornerstone of the ‘inflation-pop’ scenario. Once the corrective declines that began in 2011 are out of the way, a new five wave impulse upswing can then begin.
»
« »
fig. #6 S&p 500 index - Monthly - Composite Cycle
fig. #7 nasdaq 100 - Weekly
fig. #8 S&p 500-Crude Oil-Copper - positive Correlation - Weekly

8
WaveTrack International GmbH Kanalstr. 14 80538 Munich Germany Phone: +49-89-21020711 Fax: +49-89-92185245 E-Mail: [email protected] www.wavetrack.com
This can be seen in the Copper chart in fig #9. The five wave upswing from Dec.’08 at 2815 resulted in completion into Feb.’11 at 10190 and labelled primary wave Ⓐ within the development of an ongoing zig zag pattern, Ⓐ-Ⓑ-Ⓒ.
Wave Ⓑ has since taken almost 4 years to develop and is closing in on downside targets between 6040-5700. Wave Ⓒ is then forecast to begin another five wave impulse upswing with minimum targets to 13920.
Crude oil has the same pattern structure as Copper – see fig #10. Its upswing from the end-Dec.’08 low of 33.20 can be seen unfolding into a five wave impulse pattern that ends into the May ’11 high at 114.83.
This can be ‘proofed’ using geometric fib-price-ratio measurements – taking a fib. 61.8% ratio of waves (1)-(3) = wave (5) ending primary wave Ⓐ within an ongoing zig zag pattern labelled Ⓐ-Ⓑ-Ⓒ. Although crude oil has recently exaggerated its counter-trend decline within primary wave Ⓑ, this is unlikely to break below the 33.20 low because of the preceding five wave structure in primary wave Ⓐ. This suggests Crude oil is close to completing the corrective sell-off as wave Ⓑ but more importantly, beginning wave Ⓒ with upside targets to new record highs sometime during the next few years.
Whilst Copper and Crude oil wave counts suggest the commodity ‘inflation-pop’ is still valid, could this evolve as an isolated case allowing U.S. stock markets to begin a secular-bear campaign as the second of the three scenarios outlined earlier?
To answer this, we go back in time, 85 years ago – see fig #11. This is an analogue of the Dow Jones (DJIA) and Homestake Mining, at the time, the largest gold mining company in the world (this has since been bought out by American Barrick). During the Great Depression crash when the Dow Jones declined from its 1929 high of 380.33 to a low in 1932 at 41.22, a depreciation of -89.16% per cent, Homestake Mining almost doubled in price from $0.34 cents to $0.66 cents. Whilst this undoubtedly illustrates a negative correlation performance, you will notice that there are no similarities with this interaction and the current set-up for U.S. stock indices and gold mining stocks.
« »
»
fig. #9 Copper - Weekly
fig. #10 Crude Oil - Weekly
fig. #11 Homestake Mining vs. Dow Jones industrial Average - Weekly

9
WaveTrack International GmbH Kanalstr. 14 80538 Munich Germany Phone: +49-89-21020711 Fax: +49-89-92185245 E-Mail: [email protected] www.wavetrack.com
Homestake Mining actually began a bull market uptrend much earlier in June 1924 and was already positively correlated to the Dow Jones (DJIA) leading up to the DJIA peak in 1929. That condition is not replicated in today’s comparison – the gold mining stocks of today have been declining form the dual highs of 2008 and 2011 (see fig’s #36-39). For a direct comparison to be made, mining stocks must bottom into our current downside targets forecast sometime during the next couple of months (early year-2015), then begin a bull market uptrend – so far, so good. Then, U.S. stock markets would be required to align in a positive correlation, also extending its current run higher that began the S&P’s advance from the March ’09 low from 666.79. That alignment would last 5 years to duplicate the advance that started in year-1924 ending in year-1929 to project the next U.S. stock index cycle-peak five years from now into the year/s-2019/2020. A 90-year Gann cycle added to the peak in 1929 also projects to the next cycle-peak in 2019. At that time, stock markets begin a secular-bear market whilst gold mining stocks continue to extend its bull market advance for another several years.
Homestake Mining’s bull market lasted 12 years from 1924-1936 – this would project its next cycle-peak in the year 2027+/-.
There is little in this comparison to persuade us that a secular bear market for U.S. stock indices could begin now whilst commodities undergo the next phase of significant price advances of the ‘inflation-pop’. If this scenario can be deleted from consideration, then the next logical step is to explore the possibility that U.S. stock markets could evolve beyond our original forecast of several years ago that defined the entire advance from the March ’09 lows as a three wave zig zag.
TRAnSMUTATIOn - 3 WAvES InTO 5
The next phase of the commodity ‘inflation-pop’ retains its integrity through its wave pattern progress that began from the post financial-crisis lows of end-Dec.’08. If this points the way higher during the next few years and we exclude the possibility that U.S. stock markets will not dislocate and begin a secular-bear campaign, then we must re-examine the original three wave zig zag structure that so far, has defined the benchmark S&P’s upside progress from the March ’09 lows during the last several years.
If the S&P’s zig zag upswing currently labelled A-B-C in cycle degree mutates into a five wave impulse pattern, then we find it aligning with the upside forecasts for the next phase of the commodity ‘inflation-pop’ – see fig #12. To the left we see the original zig zag forecast from 666.79 to current levels towards 2166.45-2209.18. These upside targets are derived where cycle waves A and C measure equally – the orthodox high for wave A was at 1344.07 and its subsequent high (part of wave B) was at 1370.58 – both can be used (log scale). To the right, the chart illustrates the transmutation from a three wave zig zag pattern into a five wave impulse. To maintain the integrity of fib-price-ratio equality of the 1st and the 3rd waves, a 5th wave would later evolve as an ‘extension’, the longest of the three impulse waves of the pattern. This represents a GIANT leap of faith because such a forecast means the S&P would head significantly higher during the next few years. But logic dictates this possibility must be investigated!
90-YEAR CYCLE
Where composite cycles have previously indicated a major U.S. stock market into 2013-15, an extension of the S&P pattern from a zig zag into a full-blown five wave impulse pattern would certainly create another dislocation in the overall assessment of timing a major high.
Cycle theorists are still signalling a generational high at this time, and our own studies have provided credibility to this forecast.
But in reality, the first of those cycle peaks scheduled for April/May 2013 came and went without any cohesion, the next into the same months of 2014 also came and went without any reaction.
« »
»
fig. #12 Zig Zag Single compared to impulse 5 Waves

10
WaveTrack International GmbH Kanalstr. 14 80538 Munich Germany Phone: +49-89-21020711 Fax: +49-89-92185245 E-Mail: [email protected] www.wavetrack.com
The common rationalisation for this non-reaction is that the Federal Reserve are artificially lengthening the upward phase of the cycle. This could be true, but we would like to believe there is another ‘hidden’ cycle that has so far gone unnoticed, or at least paid little attention to that is providing the underlying support in prolonging this upward phase from the March ’09 lows.
The most significant cycle periodicity so far uncovered to explain a prolongation of this upward trend is a W.D. Gann 90-year phase – see fig #13. Connecting the two cycle-peaks of year/s-1835 and 1929 produce 94-years although from the historical reference of the Dow Jones (DJIA) peaks, this is clearly adhering to the 90+/- year Gann periodicity. The DJIA began trading in the year-1896 so the data shown is dated to the peak in British stock prices but the run-up into the peak of 1835 was the result of low interest rates and a real-estate speculative bubble forming in the United States. This 90-year period can be extrapolated from year-1929 to the next cycle-peak due in 2019 and so this forms the base for the potential date where the next peak forms.
The two lows of year/s-1842 and 1932 are also separated by 90+/- years – extending the year-1932 date projects the next major low to the year-2022. There is only 3 years in-between, probably too little in time to complete a secular-bear market from a proposed high in year-2019 but then the two previous crashes, between the years 1835-1842 (seven years) and 1929-32 (three years) both unfolded into a very short time frame.
For the moment at least, the 2019-2022 period represents the dates for completing any upside prolongation of the S&P’s transformed five wave advance that is now being proposed in the attempt to reconcile the positive correlation between U.S. stock markets and the next phase of the commodity ‘inflation-pop’.
UPSIDE TARGETS 2015 & bEYOnD
To discern what upside targets a transformative five-wave impulse pattern would derive, a disciplined approach to fib-price-ratios must be used. This means, excluding those measurements that would produce a five wave pattern that are too fantastical, but large enough to convey a realistic five wave impulse pattern for the completion of the pattern from the March ’09 lows. In this study, we begin by using the Dow Jones (DJIA) – see fig #14.
Non-linearly extrapolating a five wave impulse pattern in upside progress from the March ’09 low of 6470.00 first begs the question of what to label the expanding flat pattern that preceded it, unfolding from the January 2000 high?
For this, we adopt an original forecast explored way back in year-2004 when publishing the expanding flat for the first time as a fourth wave, primary wave ④ within an ongoing five wave impulse pattern that began cycle wave 5 from the year-1974 low of 570.00.
« »
»
fig. #14 Dow Jones 30 index - Quarterly
fig. #13 foundation Long-Term Stock index - Yearly Averages

11
WaveTrack International GmbH Kanalstr. 14 80538 Munich Germany Phone: +49-89-21020711 Fax: +49-89-92185245 E-Mail: [email protected] www.wavetrack.com
Adding this to the origin of the cycle degree impulse pattern that began from the Great Depression low of 40.50 in year-1932 shows cycle wave 5 developing as a fifth wave ‘extension’. This is interesting because there are certain fib-price-ratios that are specifically identified as consistently unfolding for extended waves.
The most common include extending waves »1-4 by a fib. 161.8% ratio. In this case of the DJIA, extending wave 1 (40.50) to 4 (570.00) by a fib. 161.8% ratio projects wave 5 to 41116.70.
Subdividing cycle wave 5 into five smaller »waves of primary degree, ①‑②‑③‑④‑⑤, a fib. 61.8% correlative ratio of waves 1-3 = 5 at 41982.10.
Subdividing primary wave » ⑤ into five smaller waves of intermediate degree, (1)-(2)-(3)-(4)-(5), a fib. 161.8% extension ratio of wave (1) projects wave (5) to 39207.00.
As you can see, there is a startling convergence of geometric harmonics into the 40k level.
When convergences occur in this manner, there is a high probability that prices are attracted towards it, like quantum particles that continuously interact will eventually move closer and closer together. Measured over great distances, this convergence at 40k is quite phenomenal. This would mean ‘doubling’ the Dow Jones over the next few years.
And why not? – this would be consistent with what we expect to see in percentage terms in Commodities, Asian stock markets, even Emerging Markets. The doubling in the DJIA is consistent with everything else.
The equivalent fib-price-ratio levels applied to the S&P are not yielding quite the same accuracy but are still within equitable parameters – see fig #15.
Extending cycle waves 1-4 » (4.40-60.96) by a fib. 161.8% ratio projects a terminal high for cycle wave 5 to 4286.88.
Subdividing cycle wave 5 into five smaller »waves of primary degree, ①‑②‑③‑④‑⑤, a fib. 61.8% correlative ratio of waves 1-3 = 5 at 4931.20.
Extending primary wave » ① by a fib. 161.8% ratio projects the highest level for wave 5 to 5396.73. This is considered too high corresponding to the DJIA upside targets.
Also, subdividing primary wave » ⑤ into five smaller waves of intermediate degree, (1)-(2)-(3)-(4)-(5), a fib. 161.8% extension ratio of wave (1) projects wave (5) to 4397.45.
The DJIA/S&P ratio is currently trading at 8.640 – a 40k Dow Jones would equate by current ratio levels to an S&P upside target towards 4628.00+/-. An historical spread chart shows a zig zag pattern completing between Jan.’85 from 6.960 to the July ’11 high at 9.715. This spread is now resuming a larger downtrend, reflecting the S&P outperformance over the next several years. This corresponds to the S&P upside calculations varying from a minimum 4628.00+/- and makes the 4931.20 level seem quite conservative!
S&P COMPOSITE CYCLE – 42/44 & 36 YEARS
The Dow Jones (DJIA) and S&P oscillate with two major long-term cycle periodicities. The 18-year cycle is actually the alternating 36-year periodicity whilst the 42/44-year cycles depict low-low. The 42/44 years is represented by 44-years, or more specifically, 43.50yrs when plotting the frequency in the long-term data history that begins in year-1695 (refer, fig #13). The 42-years connects the Great Depression lows of year-1932 and the recession of year-1974.
« »
»
fig. #15 S&p 500 index - Quarterly

12
WaveTrack International GmbH Kanalstr. 14 80538 Munich Germany Phone: +49-89-21020711 Fax: +49-89-92185245 E-Mail: [email protected] www.wavetrack.com
Safe to say that there is a recurring cycle periodicity of approx. 42/44 years. When combined with the 18-year cycle, a composite is produced – see fig #16.
The cycle-peaks are very accurate, forewarning of a terminal high in year-1929 and in year-1966. The next is scheduled for years-2018/19+/-. This corroborates the 90-year Gann cycle observed earlier, projecting a time-line into the year-2019. This becomes our ‘preferred’ time-schedule to complete a transformative five wave impulse upswing as primary wave ⑤.
S&P – PRIMARY WAvE ⑤
This next chart zooms into the progress of the S&P’s advance from the March ’09 low of 666.79. The original interpretation of a zig zag upswing is annotated in red as cycle waves A-B-C with wave C earmarked as ending anywhere towards current levels, or a little higher. This is possible because a five wave impulse structure can be counted as nearing completion from the 1074.77 low of Oct.’11.
If the upswing transmutates into a five wave impulse pattern as primary wave ⑤, then subdividing in intermediate degree labels the pattern as (1)-(2)-(3)-(4)-(5). As a five wave subdivision is nearing upside completion from the 1074.77 low as wave (3), then it becomes clear that a later advance as wave (5) will require the pattern to evolve with a fifth wave ‘extension’ so that upside targets measured in primary degree between 4286.88-4931.20 are achieved – see fig #17.
That automatically imposes another Elliott Wave condition into the mix – third waves cannot be the shortest in any five wave expanding-impulse pattern – so this means that wave (3)’s advance from 1074.77 must at least equal wave (1)’s equivalent upswing (666.79-1370.58) to prevent wave (3) from becoming the shortest wave. A fib. 100% equality ratio of wave (1) = (3) at 2166.45 or to 2209.18. These upside targets are derived where intermediate waves (1) and (3) measure equally
– the orthodox high for wave (1) was at 1344.07 and its subsequent high [part of wave (2)] was at 1370.58 – both can be used (log scale).
So it seems that the next significant event for the S&P is to produce an attempt to 2166.45-2209.18 to qualify a 3rd wave. Should prices collapse before attempting the lower level, then a modification would be required to the evolving wave count illustrated in these pages. Without making this too complex, there are variations to this five wave impulse pattern as primary wave ⑤ that could change the current labelling. For example, intermediate wave (3) could be prolonged way above the 2166.45-2209.18 level by revising its subdivision – or if a deep sell-off occurs beforehand, without first the attempt to 2166.45, then the wave count would be amended to develop into a 1-2-1-2 sequence. That seems unlikely though because it would require a very deep second wave correction from current levels
– something in the order of retracing back towards the 2011 highs of 1370.00+/-, too much when comparing to other corresponding indices.
« »
»
fig. #17 S&p 500 index - Weekly
fig. #16 S&p 500 index - Yearly - Composite Cycle

13
WaveTrack International GmbH Kanalstr. 14 80538 Munich Germany Phone: +49-89-21020711 Fax: +49-89-92185245 E-Mail: [email protected] www.wavetrack.com
That said, this chart does suggest an intermediate wave (4) retracement unfolding into the first half of 2015 towards a fib. 38.2% retracement level of 1690.00+/-. This corresponds to similar upside limitations in the current advances examined from the mid-October ’14 lows for European indices such as the Eurostoxx 50 and Xetra Dax – also, in Asia such as Singapore’s Straits Times index, even Japan’s Nikkei.
nASDAq 100 – ALL-TIME-HIGH TEST
Original wave counts for the Nasdaq 100 dt. March ’03 described the decline from the all-time high of 4816.35 as unfolding into a five wave impulse pattern, ending into the Oct.’02 low of 795.25. A deep counter-trend rally was forecast when prices were still trading at 970.54, targeting the fib. 76.4% retracement levels at 3110.68+/-, an amazing forecast for a +220% gain given the extreme bearish sentiment of the time.
Rolling the clock forward, prices have since exceeded those levels but have generally kept the structure of a counter-trend pattern, holding the original forecast as valid. But as we delve into the more contemporary dislocation between U.S. stock markets and commodities and their weighted indices, the question is whether the Nasdaq 100 will ultimately break above to a new record high to eliminate the five wave pattern that unfolded in the year-2000-02 period?
A five wave declining pattern and a subsequent corrective upswing would naturally translate into a secular-bear market that begins anytime now. But if the S&P follows the next commodity ‘inflation-pop’ higher during the next few years, then the Nasdaq 100 must ultimately break above the old record highs of 4816.35. Only now does this now seems possible.
To break above the 4816.35 high, the decline into the Oct.’02 low at 795.25 must be re-labelled as a corrective zig zag – that would necessitate wave (C) being much shorter than wave (A), creating a disharmonic ratio – as we know from our geometric Fibonacci Ratio studies, this is possible even though these formations unfold considerably less frequently than their harmonic counterparts – see fig #18. The low at 795.25 ends primary wave ④ within an ongoing five wave impulse pattern that began from the 1970’s low [extrapolated] - (historical data only begins from Jan.’83).
The following upswing can be counted two ways. First, as a developing five wave impulse pattern as primary wave ⑤ or second, as an ongoing triple zig zag labelled super-cycle wave 🄱 representing the second sequence within a decennial expanding flat pattern. Either way, the March ’00-Oct.’02 decline would be re-counted as a corrective zig zag. The five wave expanding-impulse count would project higher terminal levels than the triple zig zag with ultimate upside targets to 11946.27 derived by extending intermediate wave (1) to 2239.23 by a fib. 161.8% ratio. Unfortunately, this cannot be verified/cross-referenced because we do not have historical data back to the mid-1970’s. Upside targets to these levels would mean percentage gains of +182% per cent – quite a bit more than the doubling for the S&P.
The triple zig zag count would otherwise pitch a lower upside target towards 9583.50 – this is derived by simply extending super-cycle wave 🄰 (4816.35-795.25) by a fib. 38.2% ratio. This ratio is used rather than lower options of fib. 14.58% or fib. 23.6% to allow room for a third zig zag sequence to unfold, bearing in mind that the second sequence is only now approaching completion.
This index must be watched because it offers an earlier validation of these ongoing bullish scenarios than any other U.S. stock index because it is only now approaching record highs
– just about everything else is trading above those January/March 2000 peaks.
« »
»
fig. #18 nasdaq 100 index - Monthly

14
WaveTrack International GmbH Kanalstr. 14 80538 Munich Germany Phone: +49-89-21020711 Fax: +49-89-92185245 E-Mail: [email protected] www.wavetrack.com
‘InFLATIOn-POP’ TRIGGERS/CATALYSTS
Commodities and especially precious metals will play an important role in how Central Banks balance the effects of unwinding its low-interest rate, quantitative easing programmes that have been in place since the financial-crisis of 2008/09. Ironically, they may fail and instead be forced to adopt another round of QE so as to stimulate the world economies – hypothetically, this may develop two ways, perhaps CB’s club together in some form of accord rather than operating in a unilateral way as they have done in the past, or maybe governments announce a 21st century equivalent of the ‘New Deal’, legislation that creates infrastructure spending on a grand scale, similar to that implemented in its second phase by President Roosevelt in 1935, almost exactly 80 years ago.
Summing Up
Whilst the commodity and related stock index ‘inflation-pop’ remains at the core of the next upward price surge, the dislocation between U.S. stock markets must ultimately be reconciled. The most logical explanation is that U.S. stock markets will transform their original, post financial-crisis three wave zig zag advances into five wave expanding-impulse patterns. This translates into the Dow Jones (DJIA) and the S&P doubling in price, +100% over the next few years with tech indices like the Nasdaq 100 doing even more. It’s often hard to image, but that is the nature of prognostic forecasting.
The only way such an event will break down is if commodities transform current counter-trend declines that began from the 2011 highs from three wave patterns into five wave sequences – they are then required to break below the end-Dec.’08 lows. Base metals are nowhere near such levels and the Elliott Wave pattern of mining stocks are contradicting such a bearish event.
EUROPE – Eurostoxx 50 - xEtra Dax
Basis the bullish scenarios described for U.S. indices, you might come to think that European indices would match these changes. But in fact, little needs to be changed. Our European benchmark index, the Eurostoxx 50 upside targets from last year towards 4263.20-4299.62 remain unchanged. Almost exactly 1-year ago, this index was just pushing into a high at 3106.64
– today, levels are close by at 3133.70 – see fig #19.
The post financial-crisis recovery is described as unfolding into a double zig zag pattern from the March ’09 low of 1765.49. Extending the first zig zag to its high at 3044.37 by a fib. 61.8% ratio projects a terminal high for the secondary sequence to 4263.20. Cutting this upswing by a fib. 38.2% ratio would project an interim high towards 3430.00+/-.
If the New Year, 2015 begins with an attempt to higher highs, then watch for this resistance level to determine a reversal (sell) signature. This would be labelled the second sequence, primary wave Ⓑ, within an ongoing expanding flat corrective decline as cycle wave B with ultimate downside targets into H1-2015 towards 2676.32+/-.
From such a base, the Eurostoxx 50 would then begin cycle wave C’s final advance towards the 4300.00+/- level. That would represent a +60% per cent gain – smaller than those numbers forecast for the S&P and Asian indices, but realistically underperforming.
The Xetra Dax upside targets from last year towards 11151.69-11670.53 have been raised to 13366.42-13435.20+/- in this new update – see fig #20. Original wave counts had synchronised the Dax’s post financial-crisis recovery from 3588.89 with the S&P’s low at 666.79 matching a multi-year zig zag upswing in progress.
« »
»
fig. #19 euroStoxx 50 - Weekly

15
WaveTrack International GmbH Kanalstr. 14 80538 Munich Germany Phone: +49-89-21020711 Fax: +49-89-92185245 E-Mail: [email protected] www.wavetrack.com
The Dax has outperformed in Europe and matched the gains of the S&P – furthermore, its Elliott Wave pattern structure is similar. If the S&P retains the potential to change a three wave zig zag post March ’09 into a five wave impulse pattern, then do does the Xetra Dax.
Changing the March ’09 upswing from 3588.89 into a progressive five wave impulse sequence does become compelling when placed within the larger/aggregate pattern. This becomes cycle wave C within a much larger zig zag that began from the March ’03 lows of 2188.70 and this zig zag as the second sequence of an even larger, decennial expanding flat pattern. That would mean ending its long-term uptrend into the March ’00 high at 8136.10 with the following corrective decline taking this form of the decennial expanding flat and labelled 🄰‑🄱‑🄲 in super-cycle degree.
Extending super-cycle wave » 🄰 (8136.10-2188.70) by a fib. 38.2% ratio projects a super-cycle wave 🄱 high towards 13435.20
Using a fib. 100% equality ratio of cycle waves »A & C (2188.70-8151.57 & 3588.89-upwards) projects an upside targets for super-cycle wave 🄱 towards 13366.42
This close proximity of converging upside targets provides a fascinating and realistic forecast for the next few years.
The shorter-term forecasts for the first half of 2015 suggests a corrective retracement decline will unfold sometime into H1-2015 with downside targets towards 8000.00+/-, the uptrend will then resume.
From levels of 8000.00+/-, the Xetra Dax would lift higher by +68% per cent into the final upside targets towards 13400.00+/-. Like the Eurostoxx 50, this too means underperformance relative to U.S. and Asian indices.
ASIA – Hang sEng | Kospi | singaporE | sHangHai CompositE | niKKEi | all orDinariEs
Asian markets are expected to outperform during the next few years but the next stage of upward prices surges defining the second phase of the ‘inflation-pop’ is yet to begin. It is obvious that a huge commodity price-element is built into many of the Asian indices and this explains their underperformance during the last few years.
This is all so visible in the way that the Hang Seng has been struggling to break above its pre-financial-crisis highs of 31958.41 – see fig #21. Even its 2011 high at 24988.57 was difficult to be overcome with the index finally breaking this momentarily last September ’14 at 25362.98 before quickly falling down again. This is not strong action, quite the contrary, and it seems inevitable that the Hang Seng will continue to struggle until commodities have finally bottomed.
But looking further ahead though, the outlook for the next few years remain brighter! The long-term ending expanding-diagonal pattern that began a five wave upswing from the Asian-crisis lows of August ’98 at 6544.79 remains in upward progress.
« »
»
fig. #21 Hang Seng index - Monthly
fig. #20 xetra Dax 30 - Monthly

16
WaveTrack International GmbH Kanalstr. 14 80538 Munich Germany Phone: +49-89-21020711 Fax: +49-89-92185245 E-Mail: [email protected] www.wavetrack.com
Labelled in intermediate degree, (1)-(2)-(3)-(4)-(5), wave (5) began a zig zag upswing from the Oct.’08 low of 10676.29. This fits perfectly to the same zig zag ‘inflation-pop’ concept for commodities.
Upside targets remain unchanged for the last few years, projecting up to the 42265.09+/- level. That translates into percentage gains of more than +100% per cent!
S. Korea’s Kospi index is similarly unfolding higher from the Asian-crisis lows of year-1998 into an ending diagonal pattern but in this case, it is a contracting-type formation with narrowing boundary lines – see fig #22. There is a risk that 2015 begins with a thump to the downside as the counter-trend decline from the April ’11 high of 2231.47 unwinds towards downside targets at 1550.00+/-.
But after that, its sky bound to record highs with targets remaining unchanged towards 3104.16+/-. This is also a 100% gain or a doubling effect.
In Singapore, the Straits Times index looks familiar – see fig #23. The same ending expanding diagonal as the Hang Seng is taking form from the Sep.’98 low of 800. Labelled (1)-(2)-(3)-(4)-(5), wave (5) began a zig zag upswing from the March ‘09 low of 1455 with unchanged upside targets to 4537-4698+/-.
The next 4-5 months shows a downside risk to 2500+/- but from this base, the final advance to 4600+/- represents a gain of +84% per cent.
The Shanghai Composite has surprised us because of its recent accelerative upswing. Last year’s update forecast this beginning from lower levels, but it is now apparent that its next advance has begun already from the June ’13 low of 1849.65 – see fig #24.
The corresponding China Enterprises index that we track is expected to decline sharply during the first half of 2015 towards 7000.00+/- (currently 11677.00) before launching itself to record higher much later. And so our wave count for the Shanghai Composite could be flawed or at least indicate a severe corrective decline unfolding during the same period. Ultimate upside targets towards 4616.58 would remain unaffected by a 4-5 month correction.
»
« »
fig. #22 Seoul Composite index (Kospi) - Monthly
fig. #23 Singapore Straits Times index - Monthly
fig. #24 Shanghai Composite index - Weekly

17
WaveTrack International GmbH Kanalstr. 14 80538 Munich Germany Phone: +49-89-21020711 Fax: +49-89-92185245 E-Mail: [email protected] www.wavetrack.com
The Nikkei 225 index upside targets from last year’s report towards 20800.47 have been raised to 31490.92+/-, see fig #25. This is necessary to accommodate more room for the continuation of its five wave impulse advance that began from the Oct.’08 low of 6994.90. The pattern remains the same though with a larger, developing expanding flat pattern taking form from the earlier low of 7603.76 that traded in April ’03. Labelled A-B-C in cycle degree, wave A unfolded into a zig zag ending at 18297.00 – wave B declines as another zig zag to the 6994.90 low, and then wave C that continues unfolding into a five wave impulse.
Cycle wave C’s five wave pattern is labelled in primary degree, ①‑②‑③‑④‑⑤ with primary wave ③ in progress. This is subdivided into intermediate degree, (1)-(2)-(3)-(4)-(5) with wave (3) approaching upside completion due in January/February ’15. The same theme of a deep but a corrective pullback for other Asian stock markets is therefore consistent for the Nikkei as 2015 gets underway. But later, the direction of this uptrend dominates successive higher highs.
Australia’s All-Ordinaries index featured in last year’s annual report with ultimate upside targets during the next few years towards 6882 remains unaltered – see fig #26. Like commodities, the post financial-crisis recovery is described for this index as taking the form of a zig zag pattern, labelled A-B-C in cycle degree and representing the second sequence within a decennial 3-3-5 flat pattern.
Cycle wave C’s advance from the Aug.’11 low of 3829 can be seen unfolding into a progressive five wave impulse pattern and labelled in primary degree, ①‑②‑③‑④‑⑤. Intermediate wave (4) within primary wave ③ is currently pulling prices lower into an expanding flat corrective pattern but once completed, the uptrend is expected to resume. Extending cycle wave A by a fib. 61.8% ratio projects to 6882.
EMERGInG MARKETS – msCi Em | BovEspa | russia rts | sEnsEx
The MSCI Emerging Market index pattern has unfolded into an almost carbon-copy structure to Copper prices when compared from the pre-financial-crisis highs – see fig #27. The response from the Oct.’08 low of 446 began a multi-year zig zag upswing that represents the second sequence within a decennial expanding flat corrective pattern. The zig zag is labelled in primary degree, Ⓐ‑Ⓑ‑Ⓒ and subdividing 5-3-5. Five waves are clearly visible in the initial advance as primary wave Ⓐ ending into the April ’11 high at 1212 – this synchronised with many Asian stock markets and commodities like Copper and Crude oil. It ‘guarantees’ another five wave upward sequence as primary wave Ⓒ once the intervening correction has completed.
The intervening correction is primary wave Ⓑ and this has been unfolding lower for almost four years now.
« »
»
fig. #25 nikkei 225 - Monthly
fig. #26 All Ordinaries Australia - Weekly

18
WaveTrack International GmbH Kanalstr. 14 80538 Munich Germany Phone: +49-89-21020711 Fax: +49-89-92185245 E-Mail: [email protected] www.wavetrack.com
Last year’s forecast projected wave Ⓑ down to 753 and this has not changed. Prices have more recently begun to accelerate lower and this is set to continue as 2015 begins. This process may still take several months but the indication of ending the decline is sometime into the May-June period, latest.
Thereafter, primary wave Ⓒ is expected to begin an upward surge to record highs. Upside targets converge towards 2047-51 where wave Ⓒ unfolds by a fib. 100% equality ratio of wave A and where cycle wave A (1345-446) is extended by a fib. 38.2% ratio.
What are the chances of these two geometric measurements forming a close-proximity convergence when they are derived from different levels? Is this coincidence, or is this another example of the markets harmonic beauty?
This template of five waves up from the post-financial crisis lows ending in early 2011 and a subsequent corrective decline can been seen almost everywhere – some markets have accelerated the process ahead of others – a good example is Russia’s RTS index and even Crude oil...but even on occasions of distress where prices declines are ‘exaggerated’, the integrity of the pattern remains unchangeable.
Brazil’s Bovespa also has these same pattern ingredients in its post financial-crisis recovery from the Oct.’08 low of 29435.11 – see fig #28.
The following advance unfolded into a five wave impulse pattern that ended into the Nov.’10 high oat 73103.20 with the correction that followed nearing downside completion.
But placed within the longer-term pattern, these movements are simply the first and second waves within a much larger 5th wave of an impulse pattern that began from the Asian-crisis lows of 4575.60 in Sep.’98.
In this respect, it is directly comparable to the Hang Seng, the Kospi and the Straits Times index – all are reaching higher into five wave patterns, whether these are five wave diagonals or expanding-impulses is irrelevant.
The Bovespa may still draw lower during the first half of 2015, prolonging its second wave correction that began from the Oct.’10 high - if so, downside targets are towards 36772.00+/-.
But the purpose of this chart is to focus on the ultimate upside targets for intermediate wave (5) – these are towards 164288.00+/- and derived by taking a fib. 61.8% correlative ratio of waves (1)-(3).
Waves (1)-(3) x 61.8% + (4) = 164288.00 as wave (5) »
Such an advance from a base around the 37000.00+/- level would represent a gain during the next few years of +343% per cent, or a multiple gain of 4.4 x value!
« »
»
fig. #27 MSCi emerging Markets - Weekly
fig. #28 Bovespa Brazil - Monthly

19
WaveTrack International GmbH Kanalstr. 14 80538 Munich Germany Phone: +49-89-21020711 Fax: +49-89-92185245 E-Mail: [email protected] www.wavetrack.com
The Russia RTS index has collapsed during the final stages of 2014 and far exceeding even our bearish downside targets of last year when we forecast levels from 1391 to 1025, a depreciation of -26% per cent - see fig #29.
The same template exists in this index as is does for the MSCI EM and Copper, Crude oil etc. The only difference is that its corrective decline from the April ’11 high of 2134 as primary wave Ⓑ has now been totally exaggerated due to continued eco-nomic sanctions and a run on the Rouble. According to the Elliott Wave Principle (EWP), its preceding five wave upswing from 493 to 2134 as primary wave Ⓐ should make it impossible for wave Ⓑ to break below the 493 low. But it would take an iron will to buy it right now even though the EWP tells us this corrective decline is done at 578.40.
Are there occasions when the very fabric of the EWP is unthreaded as its seam? Is the recent collapse in the Russia RTS one of those occasions when an external force overwhelms the natural growth order? This is a question that must be answered and is high on our ‘wish’ list for New Year! There does remain an equal probability that a low has already formed at 578.40 and if the case, then the next phase of the ‘inflation-pop’ zig zag has already begun. Looking ahead the next few years, upside targets for primary wave Ⓒ remain unchanged towards min. 3737, max. 4240-4645+/-.
India’s Sensex has outperformed on the Asian continent and has mostly kept to the same rhythm as the U.S. stock market – see fig #30. Its overall upward progress is entirely different to the post Asian-crisis template of Aug./Sep.’98.
The last formative low ended primary wave ④ in Oct.’01 at 2594.87 with wave ⑤ ending its long-term uptrend in Jan.’08 at 21206.77. A decennial counter-trend corrective pattern has since begun and this is expected to ultimately take the form of an expanding flat, labelled A-B-C in cycle degree. Wave A ended at the Oct.’08 low of 7697.39 with wave B trading into a new record high whilst unfolding into a 5-3-5 zig zag pattern.
Extending cycle wave A by a fib. 61.8% ratio projects an upside target for wave B towards the 39671.00+/- level. A corrective decline is forecast into the first half of 2015 towards 25000+/-, maybe lower to 24000+/- in which case, the base before a final upward thrust would represent a gain of +62% per cent during the next few years.
Conclusion
The reconciliation between divergent price activity of the S&p and Commodities and their related Asian stock indices has been addressed. if the integrity of the next phase of the commodity/Asian stock market
‘inflation-pop’ remains valid, as it does, then the common denominator that binds all together results in this re-examination of the S&P upward structure of its advance from the March ’09 low. The conclusion that is produced logically points towards transforming the S&p advance from its original three wave zig zag pattern into a developing five wave pattern with much higher target levels during the next few years, doubling the index. This would certainly be consistent with the percentage gains forecast for key economic commodities, and the carry-over upside targets for Asian stock markets that have remained unchanged for the last few years.
« »
fig. #29 Russia RTS index - Weekly
»
fig. #30 Sensex - Weekly

20
WaveTrack International GmbH Kanalstr. 14 80538 Munich Germany Phone: +49-89-21020711 Fax: +49-89-92185245 E-Mail: [email protected] www.wavetrack.com
COMMODITIES – CRB | XME M&M | CoppER | CRudE oil
Commodities remain at the epicentre for the continuation of the ‘inflation-pop’ upsurge in prices during the next few years. Industrial commodities, base metals in particular but also Crude oil and Platinum hold the Elliott Wave zig zag template pattern in the recovery from the financial crisis lows. There are some permutations to this however, but the important aspect of differentiation is not of contradiction but the conformity to synchronous and complimentary price action.
The benchmark CRB-Cash (CCI) index has a slight permutation to the way in which the inflation-pop upswing is unfolding – instead of an ongoing zig zag, the pattern is taking the form of a double zig zag – see fig #31. This begins from the Dec.’08 lows of 322.53 and is actually the second sequence within a much larger decennial expanding flat pattern. The double zig zag is labelled Ⓐ‑Ⓑ‑Ⓒ‑Ⓧ‑Ⓐ‑Ⓑ‑Ⓒ in primary degree with the first zig zag ending into the April ’11 high at 691.09. Ordinarily, this could have ended the entirety of the second sequence of the larger expanding flat but we know this is unlikely if some of the major component commodities have unfolded into five wave patterns during the same period.
The following decline from 691.09 is labelled primary wave Ⓧ and original downside targets forecast last year towards 472.51+/- are only now being tested. Wave Ⓧ is unfolding into a smaller zig zag pattern but a lack of price-rejection into this area suggests prices are searching for lower levels and so the next major support is at the fib. 61.8% retracement zone at 431.52+/-.
This converges with a fib. 100% equality ratio between waves (A) and (C) of the zig zag therefore retaining a high probability of staging the next reversal.
Energy/Crude oil is one of its major components and this is the reason why it has accelerated lower into the late stages of 2014. Crude oil has almost certainly accomplished the majority of its counter-trend declines since last June and the same can be said for the CRB-Cash (CCI) index. Once completed, wave X gives way to the secondary zig zag advance as the inflation-pop enters its finals stage.
Two converging upside targets form above the 900.00+/- level as this pattern looks ahead during the next few years – as follows:
Extending cycle wave A by a fib. 61.8% ratio - »615.04-322.53 x 61.8% = 915.38
Extending the first primary degree upswing »by a fib. 38.2% ratio – 322.53-691.09 x 38.2% = 924.62
This is expected to attract prices towards these numbers to finalise the inflation-pop several years from now.
The XME Metals & Mining ETF illustrates the more common Elliott Wave pattern template observed unfolding for many major global stock markets – see fig #32. The post financial-crisis recovery from 17.15 unfolded higher into a five wave impulse pattern ending into the April ’11 high at 77.44 and is the beginning of a three wave zig zag upswing that will eventually result in levels trading to new record highs.
« »fig. #31 CRB Cash index - Weekly
»
fig. #32 xMe - Metals & Mining - Weekly

21
WaveTrack International GmbH Kanalstr. 14 80538 Munich Germany Phone: +49-89-21020711 Fax: +49-89-92185245 E-Mail: [email protected] www.wavetrack.com
This zig zag is labelled Ⓐ‑Ⓑ‑Ⓒ in primary degree with wave Ⓑ only now approaching downside targets quoted last year towards 26.78+/-. Once completed, another five wave advance is forecast unfolding during the next few years as primary wave Ⓒ with upside targets towards 120.97, max. 137.74+/-.
Mining stocks are also providing a lot of information that contributes to the inflation-pop pattern template. BHP-Billiton has been updated into the monthly Base Metals report for the whole of 2014 with downside projections towards minimum 1378.50, max. 1204.50 – see fig #33.
For most of the year, such downside target levels looked just too far away, but eventually, the ongoing zig zag corrective decline that began from the April ’11 high of 2653.50 began to accelerate as intermediate wave (C). The minimum target has since been surpassed, the next to 1201.50 is being approached. But evidence of a triangle in the (B) wave location is comforting because this excludes the possibility of a downtrend in progress because 2nd waves cannot unfold into triangle patterns – this is more consistent with ‘B’ or ‘X’ waves within zig zag corrective patterns.
Once the lows have tested, there is a high probability that this leading mining stock will turn around and begin a multi-year advance that will see new record highs down the road.
A reminder of how Copper prices are unfolding can be seen again in fig #34. A five wave impulse upswing from the post financial-crisis lows of 2815 (LME 3mths US$ tonne) ending into the Feb.’11 high at 10190 fits the overall inflation-pop scenario continuing for another few years. The only difference with Copper as opposed to many other stocks and commodities that have the same Elliott Wave pattern template is the fact that Copper traded into a new record high when it ended this initial five wave pattern from 2815-10190.
This could signal a terminal end to the long-term uptrend, but only when viewed within the long-term data-set that began from the Great Depression lows of year-1932 does it become obvious that an earlier end to the long-term uptrend ended in year-2006 at 8875.
The balancing counter-trend pattern is taking the form of another decennial expanding flat pattern, labelled A-B-C. The inflation-pop upswing from 2815 represents the second sequence and unfolding into a primary degree zig zag, Ⓐ‑Ⓑ‑Ⓒ. Wave Ⓑ of this zig zag has yet to trade down to idealised levels towards 6040-5700 but we expect this attempt soon followed by an explosive upswing as primary wave Ⓒ that projects to new all-time-highs, towards minimum targets at 13920.
Crude oil remains in the headline news almost every day as commentary surrounds its changing nature and place when compared to alternative energy forms.
« »
»
fig. #33 BHp Billiton -LSe - Weekly
fig. #34 Copper - Weekly

22
WaveTrack International GmbH Kanalstr. 14 80538 Munich Germany Phone: +49-89-21020711 Fax: +49-89-92185245 E-Mail: [email protected] www.wavetrack.com
That said, its recovery from the Dec.’08 lows of 33.20 is again modelling around the inflation-pop template of an evolving zig zag pattern – see fig #35.
The zig zag is labelled Ⓐ‑Ⓑ‑Ⓒ in primary degree and forms the second sequence within a decennial expanding flat pattern. Primary wave Ⓐ can be clearly seen unfolding higher from 33.20 into a five wave expanding-impulse pattern, (1)-(2)-(3)-(4)-(5) ending into the May ’11 high at 114.83.
Taking a fib. 61.8% correlative ratio of waves »(1)-(3) x 61.8% + (4) = 115.70
This was less than a dollar from the actual high for wave (5) at 114.83.
Primary wave Ⓑ declines have unfolded since and although prices have accelerated lower during the latter stages of 2014, the overall decline from 114.83 maintains the characteristics of a corrective sequence, either a double-three or a slanting-flat with downside targets being stretched beyond ‘normalised’ levels to 57.58+/-.
The pattern can be extended to slightly lower levels towards 53.60-48.92+/- but as a correction, this should be the maximum. A subsequent advance is then forecast to begin primary wave Ⓒ – upside targets of the last few years remain unchanged towards 183.00+/-.
METALS – GdX | XAu | Gold | SilvER | plAtinuM
If industrial commodities are at the epicentre or the atom of the inflation-pop upsurge, then precious metals are its protons, neutrons and electrons. Gold/Silver mining stocks are unfolding into entirely different patterns than the bullion charts whilst Platinum is taking the same model that compares to Copper. But they all complement each other in synchronous harmonic pattern development.
The GDX Gold Miners Index is updated in fig #36. Its decline from the year-2008 peak of 56.87 is taking the form of an expanding flat, labelled Ⓐ‑Ⓑ‑Ⓒ in primary degree, subdividing 3-3-5. The financial-crisis sell-off pulled prices into the Oct.’08 low of 15.83 whilst unfolding into a zig zag pattern. The following recovery unfolded into another three wave zig zag ending into the Sep.’11 high at 66.98. Important to note is that this zig zag measures perfectly into the 66.98 high as follows:
Wave (A) x fib. 61.8% extension ratio + 37.80 = »wave (C) to 66.98
The following decline began primary wave Ⓒ – now this must unfold into a five wave impulse pattern, and this is exactly what has transpired, (1)-(2)-(3)-(4)-(5). Wave (5) is now in the final phase of its decline with downside targets to 14.17-14.11+/-. The integrity of the entire expanding flat, at each wave sequence together with conforming to geometric and harmonic measurement means that this forecast retains a high probability of realisation.
« »
fig. #35 Crude Oil - Weekly
»
fig. #36 gDx - gold Miners index - Weekly

23
WaveTrack International GmbH Kanalstr. 14 80538 Munich Germany Phone: +49-89-21020711 Fax: +49-89-92185245 E-Mail: [email protected] www.wavetrack.com
From levels approaching 14.00+/- and with subsequent upside targets to new record highs, at least above 66.98, the multiples are huge – over 4.5:1
The XAU Gold/Silver index shows the same pattern unfolding from its year-2008 high of 209.27 – see fig #37. This expanding flat is also subdividing into a three price-swing event labelled Ⓐ‑Ⓑ‑Ⓒ in primary degree, 3-3-5. Prefect fib-price-ratio measurements in wave Ⓑ’s advance from 63.54 ended at the 232.72 high:
Wave (A) x fib. 61.8% extension ratio + 142.14 = »wave (C) to 232.72
Primary wave Ⓒ’s decline is now approaching idealised downside targets towards 56.49 derived by taking a fib. 61.8% correlative ratio of waves (1)-(3) for wave (5). Also, a convergence is formed at 57.08 where primary wave Ⓐ is extended by a fib. 9.015 ratio.
So this index is now finalising a major low – the upside potential during the next few years is enormous with forecasts to new record highs, above 232.72, another 4:1 x multiple gain.
American Barrick Resources, the acquirer of Homestake (Gold) Mining is also unfolding to the same expanding flat model but as you can see from its chart, has underperformed basis a comparison on how far it is now trading below its financial-crisis low of 17.27 – see fig #38. The expanding flat retains its pattern integrity though and fib-price-ratios project a downside target on the road to completion towards 8.88+/-.
Newmont Mining Corp., another of the largest gold miners is also unfolding into the same expanding flat pattern that began from the year-2008 high of 62.72 but in this example, we can view how this expanding flat fits into the larger picture and from this, obtain some upside targets – see fig #39.
The expanding flat is labelled as cycle wave B and current price levels are approaching downside targets to 18.07-16.24+/-.
The expanding flat is part of a larger zig zag upswing that began from the Oct.’00 low of 12.75 that is labelled A-B-C in cycle degree. If wave A is extended by a fib. 61.8% ratio, then the following upside target is derived:
Wave A x fib. 61.8% extension ratio + 62.72 = »wave C to 167.14
Furthermore, this cycle degree zig zag is part of an even larger expanding flat pattern – that means an upside target measuring this pattern can be cross-referenced as follows:
« »
»
fig. #37 xAU gold/Silver index - Weekly
fig. #38 Amer Barrick Res. Corp. - Weekly
fig. #39 newmont Mining Corp. - Monthly

24
WaveTrack International GmbH Kanalstr. 14 80538 Munich Germany Phone: +49-89-21020711 Fax: +49-89-92185245 E-Mail: [email protected] www.wavetrack.com
Extending super-cycle wave » 🄰 (81.88-12.75) x fib. 38.2% = wave 🄱 to 166.61
A convergence forms within less than a dollar measuring in log-scale – that’s either an amazing coincidence or geometric ratio harmonics! With upside targets to 166.00+/- during the next several years, that would equate to a multiple gain of x 9:1.
bULLIOn – Gold | SilvER | plAtinuM
Mining stocks are all unfolding to the same expanding flat signature, but for bullion prices of gold, silver and platinum, it’s a different story. But one aspect that can be taken from the extent of upside potential for mining stocks is this: bullion prices will almost certainly soar during the next few years!
As prices have declined for over 3-years, almost four, sentiment is rock bottom and the only thing missing that would normally signal an end to this decline are those typical behavioral characteristics that appear when a market is set to change direction on a grand scale. This refers to analyst warnings and forecasts that mark down the price expectancy so exaggeratively and yet it seems to be ‘realistic’ or ‘rational’. This is not only a common function of the mind to linearly extrapolate to extremes but it is induced by one frailty – overconfidence! When an analyst has had every opportunity to mark down a price during the term of the trend, as in gold, for over three years but then suddenly jumps the forecast lower by a huge amount, then it is time to pay attention! This is a contrarian (bullish) warning sign.
So far, only a couple of forecasts have been aired into the media projecting gold down to US$800.00 an ounce, but these type of forecasts would become more prevalent in the approach to a major price low.
The Elliott Wave pattern for gold basically prolongs its five wave uptrend that began from the August 1999 low of 251.70 – see fig #40. The decline of the last few years is labeled cycle wave 4 with downside targets towards 1096.48.00+/-. This is derived from subdividing the internal structure of the pattern and emphasis has been given to its correspondence to the gold mining stocks.
The upside targets for cycle wave 5 remain unchanged from last year, towards 2472.11. This is derived as follows:
Extend the point of completion of ‘price-expansion’ »251.70-1033.00 x 61.8% + 1033.00 = 2472.11
This also converges with another fib-price-ratio:
Super-cycle waves » 1 – 3 (17.06-850.00) x 61.8% + wave 4 at 251.70 = 2475.00
The convergence of two fib-price-ratio measurements derived from different degrees of trend increases the probability of being realised.
Silver is unfolding into an entirely different pattern than gold but its movements are naturally synchronous with only amplitudes creating those differences. Unlike gold, silver’s long-term uptrend ended its multi-decennial five wave advance into the January 1980 high of US$50.00. Since that time, a counter-balancing corrective pattern has begun to unfold that is taking the form of an expanding flat, labelled 🄰‑🄱‑🄲 in super-cycle degree – see fig #41.
« »
fig. #40 gold - Monthly
fig. #41 Silver - Monthly
»

25
WaveTrack International GmbH Kanalstr. 14 80538 Munich Germany Phone: +49-89-21020711 Fax: +49-89-92185245 E-Mail: [email protected] www.wavetrack.com
Super-cycle wave 🄰 ended its decline into the Feb.’93 low at 3.48 and wave 🄱 has since unfolded higher. It is possible that wave 🄱 ended already at the horizontal resistance just below US$50.00 when it traded to 49.91 in April ’11 but the upside potential of mining stocks shown earlier is huge. It seems unrealistic to think that silver bullion would not perform with meaningful intent to surpass the old highs. This wave count prolongs super-cycle wave 🄱 by extending a double zig zag pattern ending between 3.48-49.91 into a triple pattern.
Interestingly, the first two zig zag patterns »measure approximately equally, by a fib. 100% ratio, 3.48-21.40 = 8.39-49.91.
The secondary ‘X’ wave decline that has unfolded lower from the 49.91 high has overreached idealised fib. 61.8% retracement targets at 16.58 last September, but the more recent low at 14.51 does seem adequate to complete the decline in its entirety. A third zig zag sequence is now forecast developing during the next several years.
Ultimate upside targets remain unchanged from last year, towards 65.75+/- derived by extending the first zig zag (includes extremity to March ’08 high at 21.40) by a fib. 61.8% ratio. Actually, 65.75+/- is a minimum target as this moves close to the fib. 14.58% extension of super-cycle wave 🄰 – but this could do more:
Extend super-cycle wave » 🄰 (50.00-3.48) x 23.6% = 89.17
This is at the upper reach of upside targets for the next several years.
Platinum is unfolding into an entirely different pattern to both gold and silver. In fact, it is unfolding into the archetype pattern of the ‘inflation-pop’, a zig zag upswing that began from the Oct.’08 low of 732.50 – see fig #42. It holds the identical pattern that unfolds for many of the industrial metals, like Copper – five waves up into the August ’11 high at 1921.00, then a three wave correction that is only now approaching downside completion to 1151.43+/-.
This decline of the last few years retains the typical characteristics of a counter-trend pattern. A series of overlapping price action developing into several sequences describes a double zig zag. Labelled cycle wave B, it has now tested the fib. 50% retracement level of wave A, and so the downside is now very limited.
The upside potential is huge over the next several years. A fib. 100% equality of cycle waves A & C would project wave C upside targets to 3064.11 – that converges with a fib. 23.6% extension ratio of super-cycle wave 🄰 (2304.00-732.50) at 3024.42.
Platinum could do more though and eventually »test even higher levels towards the fib. 38.2% extension level at 3569.39 where it converges with 3485.75 derived by extending cycle wave A (732.50-1921.00) by a fib. 61.8% ratio.
Conclusion
The most convincing aspect of the bullish outlook for precious metals for the next several years is the way in which the differing Elliott Wave patterns of mining stocks and the underlying bullion price action of gold, silver and platinum synchronise together in one unified forecast. This sector is preparing for some amazing gains during the latter stages of this decade – but what exactly triggers this multiple rise remains a point of conjecture.
« »
»
fig. #42 platinum Bullion - Weekly

26
WaveTrack International GmbH Kanalstr. 14 80538 Munich Germany Phone: +49-89-21020711 Fax: +49-89-92185245 E-Mail: [email protected] www.wavetrack.com
CURREnCIES – uS$ dollAR indEX | EuRo/uS$ | uS$/YEn | AuSSiE/ uS$
It is difficult to imagine the next stage of the ‘inflation-pop’ beginning an upward price surge for commodities unless the US$ dollar begins to weaken off. Last year’s forecast when the US$ dollar index was trading at 80.11 described a bullish dollar for 2014 with upside objectives towards 88.91 – those targets are only now being realised – see fig #43.
Despite the overwhelming bullish sentiment for the US$ dollar being maintained as the 2014 year comes to a close, there is now a heightened risk for a change of direction. The US$ dollar index has reattempted the horizontal resistance at 88.91 and if it should fail to penetrate this level, then a gradual decline back inside the trading range will be its natural course for 2015. Downside targets measure towards 78.60+/- but an attempt could extend into 2016.
ALTERnATE COUnT
There is another possibility, and this features in our ‘alternate’ counts uploaded into the EW-Forecast database as count #2. This describes a break above the 88.91+/- barrier with the dollar accelerating higher towards primary wave ② ultimate upside targets at 98.12+/-. This would necessitate a fairly rapid advance to this level so as to synchronise with the up-coming trend change for commodities.
EURO vS. US$
The Euro/US$ is the inverted pattern of the US$ dollar index although it is not identical – see fig #44. A multi-year counter-trend pattern has been engaged since forming the high in July ’08 at 1.6040. This has taken the form of a double zig zag pattern and is labeled in primary degree, Ⓐ-Ⓑ-Ⓒ-Ⓧ-Ⓐ-Ⓑ-Ⓒ. The first zig zag sequence ended at 1.2329 in Oct.’08 at the low of Asian stock markets and the near-lows in commodities. This correlation is important because it offers clues in how the Euro will evolve when commodities begin the next and final stage of the ‘inflation-pop’.
The following trading range pattern represents primary wave Ⓧ as a triangle pattern composed of five main price-swings. Its recovery from the 1.2329 low synchronised with a commodity advance that led to the year-2011 interim highs – the Euro/US$ formed a dual reaction high at the time in May ’11 at 1.4944. If commodities form a major low in early 2015 as our analysis shows, then the Euro/US$ should also form an important low.
Primary wave Ⓧ is shown as incomplete, but to ensure the Euro/US$ is bottoming now towards 1.2184+/- and to maintain the next upswing back inside the existing trading-range has begun, the Euro/US$ must hold above the two preceding lows of 1.2042 and 1.1876. If this can be done, then the next sequence will begin a 1-2 year upswing towards 1.4408+/-. Only much later, once wave Ⓧ has ended, does the Euro/US$ begin a decline as the secondary zig zag sequence with downside targets to 1.0479+/-.
« »
»
fig. #44 eUR vs. USD - Weekly
fig. #43 US$-index - Weekly

27
WaveTrack International GmbH Kanalstr. 14 80538 Munich Germany Phone: +49-89-21020711 Fax: +49-89-92185245 E-Mail: [email protected] www.wavetrack.com
ALTERnATE COUnT
Should the Euro/US$ immediately break below the 1.2042 and 1.1876 lows, then the alternate count otherwise describes primary wave Ⓧ ending earlier, at the May ’14 high of 1.3993 with the secondary zig zag towards 1.0479 already underway. In this case, primary wave Ⓐ will project downside targets into early 2015 towards 1.1709+/-. This forecast can be viewed as count #2 in the EW-Forecasts database.
US$ vS. YEn
Matching the concept of a US$ dollar weakening phase for the coming year, 2015 and perhaps extending throughout 2016 is the US$/Yen forecast – see fig #45. This chart depicts a multi-decennial expanding flat pattern unfolding as a corrective upswing that began from the April ’95 low of 79.92. This is labelled A-B-C in cycle degree, subdividing 3-3-5.
The three wave sequence as cycle wave B that declined from the 147.62 high is actually a seven wave sequence, a double zig zag permutation with completion into the Nov.’11 low at 75.56.
Cycle wave C’s advance is labelled as a developing five wave expanding-impulse pattern and labelled ①‑②‑③‑④‑⑤ in primary degree. This maintains the overall upward progress of the US$ dollar during the next decade, but there is an imminent completion of primary wave ① at current levels, towards 126.18+/-.
A major high is being formed and this is expected to signal a change in direction anytime into the early part of January/February 2015. Primary wave ② has no limits other than 75.56 to begin a hefty reaction decline although in this chart, a fib. 61.8% retracement is illustrated towards 91.87+/-. This could take 18-24 months to unfold, and mimic a period of US$/Yen weakness. This would certainly rhyme with a commodity upsurge.
AUD vS. US$
The Aussie/US$ is another currency pair that reflects the next stage of the commodity ‘inflation-pop’ beginning in early 2015 – see fig #46. In last year’s forecast, the Aussie/US$ was forecast forming a base around the 0.8848 level but more recent updates have now adjusted this lower to 0.7528. This also means an adjustment of the wave count replacing the counter-trend decline that began from the July ’11 high from 1.1083 from primary wave ④ to cycle wave B.
The consistency in this revision maintains the 1.1083 decline as a counter-trend pattern but with an explosive upswing beginning as we cross into the early part of year-2015. Cycle wave B is the correction within a secondary zig zag that began from the Oct.’08 low and part of the double zig zag advance that began from the April ’01 low of 0.4776. Ultimate upside targets from last year towards 1.2915 remain largely unchanged though, with cycle wave C ultimately forecast towards 1.2959+/-. This could take until late 2016 to develop and provide the perfect backdrop to a stronger Aussie$ dollar during a commodity revival.
« »
»
fig. #45 USD vs. Yen - Monthly
fig. #46 AUD vs. USD - Weekly

28
WaveTrack International GmbH Kanalstr. 14 80538 Munich Germany Phone: +49-89-21020711 Fax: +49-89-92185245 E-Mail: [email protected] www.wavetrack.com
Conclusion
The US$ dollar has seen impressive gains during the last seven/eight months but with a commodity upsurge expected to begin in early 2015, there is a feeling the dollar has now limited upside potential. A US$ dollar decline would be a gradual weakening phase rather than something accelerative but has the potential of drifting lower over a period of two-years, giving the support to the commodity
‘ inf lation-pop’. The eW-forecast database currently updates the following pairs/crosses:
uS$ indEX - EuRo/uS$ - uS$/StlG - uS$/CHF - uS$/YEn - uS$/CAd - EuRo/StlG - EuRo/YEn - Aud/uS$ - Aud/nZd - Aud/YEn – nZ$/uS$
InTEREST RATES - uS 30YR YiEld | uS10YR | GERMAn 10YR
The dislocation between Central Bank policies of the Federal Reserve and the European Central Bank has remained the dominant theme for much of year-2014 and this doesn’t look like changing in the coming year, 2015. The overall Elliott Wave pattern progression for U.S. interest rates hangs in the balance and this is reflected between the current robust economy and our upcoming expectancy for a weakening US$ dollar. Both cannot exist but the analysis suggests a weakening US$ dollar combined with the next upward phase of a commodity boom will probably translate into a declining long-dated yield forecast for the US10yr yield with downside targets to a new record low, towards 1.306% – see fig #47.
Supporting this forecast is the fact that the preceding upswing from the July ’12 low of 1.377% was only able to unfold higher into a three wave corrective pattern that ended into the end-Dec’13 high at 3.043% - see fig #48. Despite this however, the following decline to the mid-Oct.’14 low at 1.912% has also taken the form of a three wave corrective pattern – this keeps the door open to the possibility of a continuation higher during the coming year. The only way to know for sure which direction yields will take is to await a break out of the recent range between the Sep.’14 high of 2.655% and the mid-Oct.’14 low of 1.912%. A break above 2.655% would confirm an uptrend whilst a break below 1.912% a downtrend.
In Europe, the benchmark DE10yr yield is fast approaching downside targets towards 0.517% - see fig #49.
« »
»
fig. #47 US 10yr Yield - Monthly
fig. #48 US 10 yr Yield - Daily
fig. #49 De 10yr Yield - Monthly

WaveTrack International GmbHKanalstr. 14 Phone: +49 (0)89 21 02 07 1180538 Munich Fax: +49 (0)89 92 18 52 45Germany E-Mail: [email protected] www.wavetrack.com
This chart describes the entire decline unfolding from the all-time-high of 11.50% per cent as a single zig zag pattern labelled A-B-C in cycle degree. Wave C is exaggerated in terms of harmonic amplitude as it is much larger than wave A and so the latter is extended by a fib. 100% ratio to project a final downside target towards 0.517%.
Cycle wave C’s decline must unfold into a five wave impulse pattern and this is labelled developing in primary degree, ①‑②‑③‑④‑⑤ – see fig #50. Primary wave ⑤ alerts us to the fact that this downtrend is now approaching the final stages of its completion. This is identified as an ‘extended’ fifth wave because it is now larger than waves ① and ③. There are two fib-price-ratios that are used for measuring extended 5th waves, as follows:
Extend waves 1-4 » (4.705-2.051) by a fib. 161.8% ratio = 0.536%
Extend waves 1-3 ( » 4.704-1.120) by a fib. 61.8% ratio = 0.461%
These two levels will be important to watch for price-rejection and a reversal-signature as levels trade into the beginning of 2015. The 52 and 56 week cycles provide an indication of potential reversal into the New Year but it will be interesting to see what catalyst would change the direction of Europe’s benchmark when the ECB are still discussing a full scale quantitative easing programme that includes buying long-dated sovereign bonds. Could this chart indicate U-turn in policy is due?
End | Fin | EndE
« »
»
fig. #50 De - 10yr Yield - Weekly

30
WaveTrack International GmbH Kanalstr. 14 80538 Munich Germany Phone: +49-89-21020711 Fax: +49-89-92185245 E-Mail: [email protected] www.wavetrack.com
fig. #1 S&p 500 index - Quarterly
fig. #2 Shock - pop - Drop - flat expanding pattern ©WaveSearch
APPEnDIx
« »
»

31
WaveTrack International GmbH Kanalstr. 14 80538 Munich Germany Phone: +49-89-21020711 Fax: +49-89-92185245 E-Mail: [email protected] www.wavetrack.com
fig. #3 S&p 500 index - Track Record - forecast 2012 & Result 2014!
fig. #4 S&p 500 index - Weekly
« »
»

32
WaveTrack International GmbH Kanalstr. 14 80538 Munich Germany Phone: +49-89-21020711 Fax: +49-89-92185245 E-Mail: [email protected] www.wavetrack.com
fig. #5 S&p 500 index - Yearly - Composite Cycle
fig. #6 S&p 500 index - Monthly - Composite Cycle
« »
»

33
WaveTrack International GmbH Kanalstr. 14 80538 Munich Germany Phone: +49-89-21020711 Fax: +49-89-92185245 E-Mail: [email protected] www.wavetrack.com
fig. #7 nasdaq 100 - Weekly
fig. #8 S&p 500-Crude Oil-Copper - positive Correlation - Weekly
« »
»

34
WaveTrack International GmbH Kanalstr. 14 80538 Munich Germany Phone: +49-89-21020711 Fax: +49-89-92185245 E-Mail: [email protected] www.wavetrack.com
fig. #9 Copper - Weekly
fig. #10 Crude Oil - Weekly
« »
»

35
WaveTrack International GmbH Kanalstr. 14 80538 Munich Germany Phone: +49-89-21020711 Fax: +49-89-92185245 E-Mail: [email protected] www.wavetrack.com
fig. #11 Homestake Mining vs. Dow Jones industrial Average - Weekly
fig. #12 Zig Zag Single comparision to impulse 5 Waves - elliott Wave patterns ©WaveSearch
« »
»

36
WaveTrack International GmbH Kanalstr. 14 80538 Munich Germany Phone: +49-89-21020711 Fax: +49-89-92185245 E-Mail: [email protected] www.wavetrack.com
fig. #13 foundation Long-Term Stock indes - Yearly Averages
fig. #14 Dow Jones 30 - Quarterly
« »
»

37
WaveTrack International GmbH Kanalstr. 14 80538 Munich Germany Phone: +49-89-21020711 Fax: +49-89-92185245 E-Mail: [email protected] www.wavetrack.com
fig. #15 S&p 500 index - Quarterly
fig. #16 S&p 500 index - Yearly - Composite Cycle
« »
»

38
WaveTrack International GmbH Kanalstr. 14 80538 Munich Germany Phone: +49-89-21020711 Fax: +49-89-92185245 E-Mail: [email protected] www.wavetrack.com
fig. #17 S&p 500 index - Weekly
fig. #18 nadaq 100 - Monthly
« »
»

39
WaveTrack International GmbH Kanalstr. 14 80538 Munich Germany Phone: +49-89-21020711 Fax: +49-89-92185245 E-Mail: [email protected] www.wavetrack.com
fig. #19 euroStoxx 50 - Weekly
fig. #20 xetra Dax 30 - Monthly
« »
»

40
WaveTrack International GmbH Kanalstr. 14 80538 Munich Germany Phone: +49-89-21020711 Fax: +49-89-92185245 E-Mail: [email protected] www.wavetrack.com
fig. #21 Hang Seng - Monthly
fig. #22 Seoul Composite index (KOSpi) - Monthly
«
»
»

41
WaveTrack International GmbH Kanalstr. 14 80538 Munich Germany Phone: +49-89-21020711 Fax: +49-89-92185245 E-Mail: [email protected] www.wavetrack.com
fig. #23 Singapore Straits Times index - Monthly
fig. #24 Shanghai Composite index - Weekly
«
»
»

42
WaveTrack International GmbH Kanalstr. 14 80538 Munich Germany Phone: +49-89-21020711 Fax: +49-89-92185245 E-Mail: [email protected] www.wavetrack.com
fig. #25 nikkei 225 - Weekly
fig. #26 All Ordinaries Australia - Weekly
«
»
»

43
WaveTrack International GmbH Kanalstr. 14 80538 Munich Germany Phone: +49-89-21020711 Fax: +49-89-92185245 E-Mail: [email protected] www.wavetrack.com
fig. #27 MSCi emerging Markets - Weekly
fig. #28 Bovespa Brazil - Monthly
«
»
»

44
WaveTrack International GmbH Kanalstr. 14 80538 Munich Germany Phone: +49-89-21020711 Fax: +49-89-92185245 E-Mail: [email protected] www.wavetrack.com
fig. #29 Russia RTS index - Weekly
fig. #30 Sensex - Weekly
«
»
»

45
WaveTrack International GmbH Kanalstr. 14 80538 Munich Germany Phone: +49-89-21020711 Fax: +49-89-92185245 E-Mail: [email protected] www.wavetrack.com
fig. #31 CRB Cash index - Weekly
fig. #32 xMe - Metals & Mining - Weekly
«
»
»

46
WaveTrack International GmbH Kanalstr. 14 80538 Munich Germany Phone: +49-89-21020711 Fax: +49-89-92185245 E-Mail: [email protected] www.wavetrack.com
fig. #33 BHP Billiton - Weekly
fig. #34 Copper - Weekly
«
»
»

47
WaveTrack International GmbH Kanalstr. 14 80538 Munich Germany Phone: +49-89-21020711 Fax: +49-89-92185245 E-Mail: [email protected] www.wavetrack.com
fig. #35 Crude Oil - Weekly
fig. #36 gDx - gold Miners index - Weekly
«
»
»
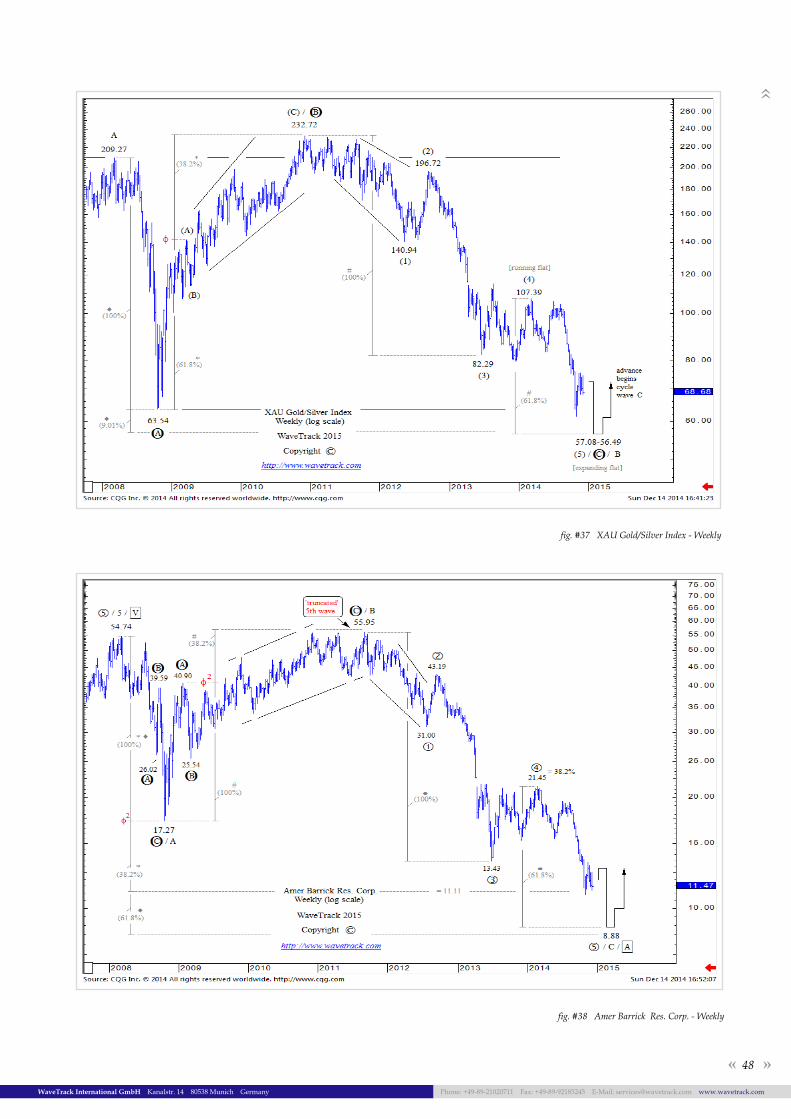
48
WaveTrack International GmbH Kanalstr. 14 80538 Munich Germany Phone: +49-89-21020711 Fax: +49-89-92185245 E-Mail: [email protected] www.wavetrack.com
fig. #37 xAU gold/Silver index - Weekly
«
»
fig. #38 Amer Barrick Res. Corp. - Weekly
»

49
WaveTrack International GmbH Kanalstr. 14 80538 Munich Germany Phone: +49-89-21020711 Fax: +49-89-92185245 E-Mail: [email protected] www.wavetrack.com
fig. #39 newmont Mining Corp. - Monthly
fig. #40 gold - Monthly
«
»
»

50
WaveTrack International GmbH Kanalstr. 14 80538 Munich Germany Phone: +49-89-21020711 Fax: +49-89-92185245 E-Mail: [email protected] www.wavetrack.com
fig. #41 Silver - Monthly
«
»
fig. #42 platinum - Weekly
»

51
WaveTrack International GmbH Kanalstr. 14 80538 Munich Germany Phone: +49-89-21020711 Fax: +49-89-92185245 E-Mail: [email protected] www.wavetrack.com
fig. #43 US Dollar index - Weekly
fig. #44 eUR vs. USD - Weekly
«
»
»

52
WaveTrack International GmbH Kanalstr. 14 80538 Munich Germany Phone: +49-89-21020711 Fax: +49-89-92185245 E-Mail: [email protected] www.wavetrack.com
fig. #45 USD vs. Yen - Monthly
«
»
fig. #46 AUD vs. USD - Weekly
»
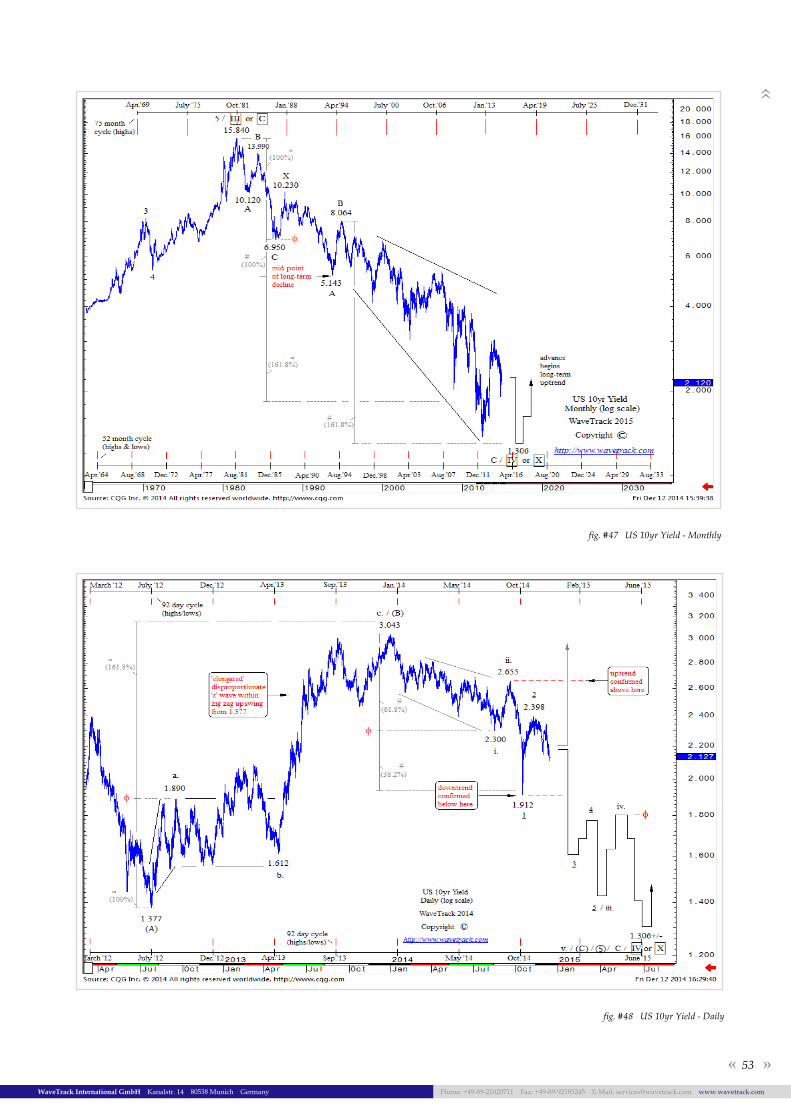
53
WaveTrack International GmbH Kanalstr. 14 80538 Munich Germany Phone: +49-89-21020711 Fax: +49-89-92185245 E-Mail: [email protected] www.wavetrack.com
fig. #47 US 10yr Yield - Monthly
fig. #48 US 10yr Yield - Daily
«
»
»

WaveTrack International GmbHKanalstr. 14 Phone: +49 (0)89 21 02 07 1180538 Munich Fax: +49 (0)89 92 18 52 45Germany E-Mail: [email protected] www.wavetrack.com
fig. #49 DE 10yr Yield - Monthly
«
»
fig. #50 DE 10yr Yield - Weekly