Response of an aridland ecosystem to interannual climate variability and prolonged drought
14
RESEARCH ARTICLE Response of an aridland ecosystem to interannual climate variability and prolonged drought Deana D. Pennington Scott L. Collins Received: 30 June 2006 / Accepted: 1 December 2006 / Published online: 15 March 2007 Ó Springer Science+Business Media B.V. 2007 Abstract Water is a key driver of ecosystem processes in aridland ecosystems. Thus, changes in climate could have significant impacts on ecosystem structure and function. In the south- western US, interactions among regional climate drivers (e.g., El Nin ˜ o Southern Oscillation) and topographically controlled convective storms cre- ate a spatially and temporally variable precipita- tion regime that governs the rate and magnitude of ecosystem processes. We quantified the spatial and temporal distribution of reduced grassland greenness in response to seasonal and annual variation in precipitation at two scales at the Sevilleta Long Term Ecological Research site in central New Mexico, using Normalized Differ- ence Vegetation Index (NDVI) values from bi- weekly AVHRR data and seasonal ETM data from 1989 to 2005. We used spatially explicit NDVI Z-scores to identify times and places of significantly reduced greenness and related those to interactions between plant functional type, seasonal climate variation, and topography. Sea- sonal greenness was bimodal with a small peak in spring and a stronger peak following the summer monsoon. Greenness was generally spatially homogeneous in spring and more spatially variable in summer. From 2001 through spring 2002, drought effects were evidenced by a 4-fold increase in the number of pixels showing signif- icantly low greenness. Spatial distribution of low greenness was initially modulated by topographic position, but as the drought intensified spread throughout the study area. Vegetation green up occurred rapidly when drought conditions ceased. We conclude that drought effects vary spatially over time, pervasive drought reduces broad-scale spatial heterogeneity, and greenness patterns recover rapidly when drought conditions end. Keywords Aridland ecosystems Drought Grasslands New Mexico NDVI Introduction Local and regional climate drivers strongly affect the distribution and composition of ecosystems worldwide. Indeed, potential evapotranspiration, an integrative measure of radiation and temper- ature, is frequently correlated with measures of ecosystem structure and function (Rosenzweig 1968; Meentemeyer 1978; Frank and Inouye 1994). Global change models predict that climate variability and extreme events are likely to increase in response to elevated concentrations of atmospheric CO 2 (Easterling et al. 2000; IPCC 2001). Climate variability has been implicated in D. D. Pennington (&) S. L. Collins Department of Biology, MSC03 2020, University of New Mexico, Albuquerque, NM 87131-0001, USA e-mail: [email protected] 123 Landscape Ecol (2007) 22:897–910 DOI 10.1007/s10980-006-9071-5
-
Upload
independent -
Category
Documents
-
view
1 -
download
0
Transcript of Response of an aridland ecosystem to interannual climate variability and prolonged drought

RESEARCH ARTICLE
Response of an aridland ecosystem to interannual climatevariability and prolonged drought
Deana D. Pennington Æ Scott L. Collins
Received: 30 June 2006 / Accepted: 1 December 2006 / Published online: 15 March 2007� Springer Science+Business Media B.V. 2007
Abstract Water is a key driver of ecosystem
processes in aridland ecosystems. Thus, changes
in climate could have significant impacts on
ecosystem structure and function. In the south-
western US, interactions among regional climate
drivers (e.g., El Nino Southern Oscillation) and
topographically controlled convective storms cre-
ate a spatially and temporally variable precipita-
tion regime that governs the rate and magnitude
of ecosystem processes. We quantified the spatial
and temporal distribution of reduced grassland
greenness in response to seasonal and annual
variation in precipitation at two scales at the
Sevilleta Long Term Ecological Research site in
central New Mexico, using Normalized Differ-
ence Vegetation Index (NDVI) values from bi-
weekly AVHRR data and seasonal ETM data
from 1989 to 2005. We used spatially explicit
NDVI Z-scores to identify times and places of
significantly reduced greenness and related those
to interactions between plant functional type,
seasonal climate variation, and topography. Sea-
sonal greenness was bimodal with a small peak in
spring and a stronger peak following the summer
monsoon. Greenness was generally spatially
homogeneous in spring and more spatially
variable in summer. From 2001 through spring
2002, drought effects were evidenced by a 4-fold
increase in the number of pixels showing signif-
icantly low greenness. Spatial distribution of low
greenness was initially modulated by topographic
position, but as the drought intensified spread
throughout the study area. Vegetation green up
occurred rapidly when drought conditions ceased.
We conclude that drought effects vary spatially
over time, pervasive drought reduces broad-scale
spatial heterogeneity, and greenness patterns
recover rapidly when drought conditions end.
Keywords Aridland ecosystems � Drought �Grasslands � New Mexico � NDVI
Introduction
Local and regional climate drivers strongly affect
the distribution and composition of ecosystems
worldwide. Indeed, potential evapotranspiration,
an integrative measure of radiation and temper-
ature, is frequently correlated with measures of
ecosystem structure and function (Rosenzweig
1968; Meentemeyer 1978; Frank and Inouye
1994). Global change models predict that climate
variability and extreme events are likely to
increase in response to elevated concentrations
of atmospheric CO2 (Easterling et al. 2000; IPCC
2001). Climate variability has been implicated in
D. D. Pennington (&) � S. L. CollinsDepartment of Biology, MSC03 2020, University ofNew Mexico, Albuquerque, NM 87131-0001, USAe-mail: [email protected]
123
Landscape Ecol (2007) 22:897–910
DOI 10.1007/s10980-006-9071-5
the transition from grass- to shrub-dominated
ecosystems in many arid regions (Giannini et al.
2003; Kerr 2003; Weldeab et al. 2005; Williams
and Albertson 2006). Determining the degree to
which increased climate variability will affect
ecosystem processes requires long-term analysis
of ecosystem response to past and current climate
variability and climate extremes. Such under-
standing is essential to predict the future conse-
quences of increased climate variability on
ecosystem structure and function.
In the southwestern US, highly non-linear
interactions among the Pacific Decadal Oscilla-
tion (PDO), the El Nino Southern Oscillation
(ENSO), the annual summer monsoon and topo-
graphically controlled convective storms create a
spatially and temporally variable regional climate
(White et al. 2005). Ecosystem processes in arid
landscapes, such as net primary production, vary
accordingly in response to these precipitation-
driven ‘‘hot spots’’ and ‘‘hot moments’’ (McClain
et al. 2003), which has important implications for
community dynamics and trophic interactions
(Friggens 2003; Baez et al. 2006). Since 1998 the
southwestern US has experienced pervasive
drought which has caused rapid landscape
change, including shrub encroachment (Van
Auken 2000), widespread tree mortality (Ogle
et al. 2000; Breshears et al. 2005; Romme et al.
2006), increased probability of wildfires (Carter
2003; Lenart 2004b), and intensified regional
water shortages (Lenart 2004a). Thus, changes
in seasonal and annual rainfall patterns influenced
by large-scale climate drivers have dramatically
and rapidly altered structure and function in
aridland ecosystems. Extensive drought has the
potential to cause rapid and persistent landscape
change (Allen and Breshears 1998) that, coupled
with anthropogenic impacts (e.g., N deposition),
could have substantial implications for the eco-
system.
All ecosystems persist within some range of
climate variability (Huxman et al. 2004). Grass-
and shrub-dominated ecosystems in the south-
western US experience high interannual variation
in precipitation and periodic extreme climatic
events, especially prolonged droughts (Borchert
1950; Sheppard et al. 2002). Aboveground net
primary production in grasslands exhibits greater
sensitivity to interannual climate fluctuations than
other ecosystem types in North America (Knapp
and Smith 2001). Moreover, under drought con-
ditions, maximum ecosystem rain use efficiency in
deserts, grasslands, and forests converge on val-
ues typical of aridland ecosystems (Huxman et al.
2004). As a consequence, aridland ecosystems
may show high temporal sensitivity to climate
variation as well as high resilience following
extreme climatic events. Given that water is the
key limiting resource in arid ecosystems (Noy-
Meir 1973; Schwinning and Sala 2004), we
hypothesize that short-term, low severity interan-
nual climate fluctuations will result in large
changes in grassland productivity from year to
year, but that grassland production will recover
rapidly when drought conditions end.
In this paper, we used a 17-year time series of
satellite data to quantify, at the landscape scale,
the response of desert grass- and shrub-domi-
nated communities to interannual climate vari-
ability and pervasive drought. Specifically, we
used the Normalized Difference Vegetation In-
dex (NDVI) as a surrogate for vegetation pro-
ductivity and measured (1) interannual
fluctuations in NDVI by season in response to
precipitation variability, and (2) spatio-temporal
patterns of low NDVI in relation to interactions
between drought conditions and the heteroge-
neous landscape, at two spatial scales. We used
these spatio-temporal patterns to infer linkages
between multiple processes and responses in this
aridland ecosystem due to rainfall and drought.
Methods
Study area
Our study was conducted at the Sevilleta Long
Term Ecological Research (LTER) site located in
and around the Sevilleta National Wildlife Refuge
(SNWR) in central New Mexico, USA (Fig. 1).
The SNWR is bisected by the Rio Grande and
occurs at the ecotone between three major grass-
land biomes, two of which are the focus of this
study: Great Plains grassland to the north, and
Chihuahuan Desert grassland and shrubland to
the south (Fig. 1a). Our focal landscape was a
898 Landscape Ecol (2007) 22:897–910
123

64,000 ha area on the east half of the refuge,
extending from the low elevation riparian forest
dominated by Populus fremontii east to the base
of the Los Pinos Mountains (Fig. 1b). The study
area was subdivided into northern and southern
zones roughly corresponding to the ecotone
between the Great Plains and Chihuahuan Desert
biomes. The northern zone contains an intensively
studied grassland area, McKenzie Flats, which
consists of a mixture of long-lived C4 grasses from
both biomes (e.g., Bouteloua gracilis, B. eriopoda,
Muhlenbergia arenicola, Hilaria jamesii and
Sporobolus spp). The southern zone contains
primarily Chihuahuan Desert shrubland domi-
nated by creosotebush (Larrea tridentata) and
irregularly distributed patches of B. eriopoda
grassland (Hochstrasser et al. 2002). McKenzie
Flats, within the northern zone, was the focus of
our more detailed analyses within the larger
eastern portion of the study area.
Climatic variables
Lower elevations in the SNWR receive an
average of 255 mm precipitation per year of
which 60% occurs during the summer monsoon
from July through September and the remainder
primarily from winter frontal systems (Gosz
et al. 1995). The relative contribution of summer
monsoon and winter rains varies considerably
from one year to the next. Based on meteoro-
logical data from the Sevilleta LTER (http://
www.sev.lternet.edu/), the lower elevations in
this region are in moisture deficit most of the
year, with potential surpluses only during Au-
gust, December, and January. Mean annual
temperature from 1989 to 2005 at the Deep
Well meteorological station (Fig. 1b) on McKen-
zie Flats was 13.2�C, with a January low of 1.6�C
and a July high of 25.1�C.
Local precipitation was measured throughout
the study period at two weather stations on
McKenzie Flats (Deep Well and Five Points,
Fig. 1b). We used the Palmer Drought Severity
Index (PDSI; Palmer 1965) for New Mexico
Division 5 (http://www1.ncdc.noaa.gov/pub/data/
cirs/) to quantify drought conditions. PDSI is an
integrative measure of both precipitation and soil
moisture and reflects long-term conditions.
Vegetation variables
Aboveground net primary production (ANPP), a
key process that integrates ecosystem structure
and function, has been shown to vary in response
to climate in many ecosystems; yet the relative
importance of particular climate variables
changes among ecosystems (McNaughton et al.
Fig. 1 (A) Location of the Sevilleta National WildlifeRefuge (SNWR) in central New Mexico at the transitionbetween Central Plains grassland and Chihuahuan Desertgrassland and shrubland vegetation. (B) Grass- and shrub-dominated vegetation in the eastern portion of the studyarea, with the Rio Grande riparian forest to the west and
pinon-juniper woodlands in the Los Pinos Mountains tothe east. Percent grass at 1-km resolution was calculatedfrom a 30-m resolution vegetation map. McKenzie Flats isan area of desert grassland into which native creosotebushis invading from the south
Landscape Ecol (2007) 22:897–910 899
123

1989; Knapp and Smith 2001). Given the exten-
sive area of observation necessary to understand
spatial variability in productivity related to
drought, we used satellite-derived Normalized
Difference Vegetation Index (NDVI, Tucker
1979) ‘‘greenness’’ as a surrogate for productivity
(Justice et al. 1985; Sellers 1985; Prince 1991;
Myneni et al. 1997; Chen et al. 2001; Moody and
Johnson 2001; Tucker et al. 2001; Shabanov et al.
2002; Lu et al. 2003). NDVI has been shown to
effectively measure absorbed photosynthetically
active radiation, which is directly and linearly
related to carbon flux through an ecosystem
(Sellers et al. 1992; Law and Waring 1994). For
example, Paruelo and Lauenroth (1995) and
Jobbagy et al. (2002) found a positive correlation
between NDVI and mean annual precipitation
across rainfall gradients in grasslands of North
and South America. Although the Soil-Adjusted
NDVI (SAVI) has been shown to be a better
surrogate for productivity in some arid systems
(Huete 1988), NDVI has been shown to be more
highly correlated with productivity than SAVI at
the SNWR (Shore 2000, unpublished data).
At SNWR, ground-based measures of produc-
tivity are available for two sites near the Five
Points meteorological station (Fig. 1b) where
non-destructive measurements of productivity
began in 1999 (for methods see Huenneke et al.
2001). The measurements incorporate all above-
ground living biomass, both green and woody. We
found a weak but significant positive correlation
between 30-m resolution Enhanced Thematic
Mapper (ETM) satellite-derived NDVI values
and ground-based productivity measures at the
SNWR (R2 = 0.29, N = 320). The relationship is
stronger for grasses (R2 = 0.42) than for shrubs
(R2 = 0.10), reflecting the high percentage of
woody biomass in shrubs, non-detectable by
NDVI. To some extent, the relationship is weak-
ened by differences in sampling scale (1-m2 vs.
30-m2 grain size). Nevertheless, changes in NDVI
values do co-vary with changes in productivity at
our study site.
Since productivity is related to NDVI and
climate is related to productivity, we would
expect a relationship between climate and
NDVI, and that NDVI can successfully be used
to monitor vegetation response to drought. (Di
et al. 1994; Myneni et al. 1997; Richard and
Poccard 1998; Kawabata et al. 2001; Potter and
Brooks 2001; Foody 2003; Ji and Peters 2003;
Potter et al. 2003; Dunham et al. 2005). Indeed,
Weiss et al. (2004) demonstrated that NDVI
values near six weather stations located on the
SNWR were correlated with key climate vari-
ables, including temperature, precipitation and
wind speed.
Variation in NDVI was assessed at two scales.
We analyzed NDVI values from Advanced Very
High Resolution Radiometer (AVHRR) data
from 1989 to 2005 for the eastern portion of the
SNWR (broader scale) and ETM data from 1989
to 2003 for McKenzie Flats (local scale) using
both average and spatially explicit values.
AVHRR measurements are 14-day composites
(Appendix 1; 26 periods per year) at 1-km
resolution. Composites record the maximum
NDVI value measured for a given pixel over the
14-day period. The AVHRR images used atmo-
spheric correction algorithms developed by the
USGS in 2001 and applied retrospectively to
earlier NDVI values (http://www.edc.usgs.gov/
greenness/whatnew.html) to generate a consistent
time series across measurements made by differ-
ent AVHRR sensors. We calculated average
AVHRR NDVI values by period and, based on
those results, grouped the 26 AVHRR periods
into three seasons: spring/summer, summer/fall
and winter (Appendix 1).
For the fine-scale analyses, we used two ETM
scenes per year (Appendix 1; spring/early summer
and late summer/fall seasons) at 30-m resolution.
Scenes were radiometrically calibrated for sun
angle and atmospheric conditions. For analyses at
both scales, we used a 30-m vegetation map of the
SNWR (Muldavin et al. 1998) to mask out pinon-
juniper woodland areas in the Los Pinos Moun-
tains on the eastern portion of the study area and
the riparian corridor to the west. The 30-m
vegetation map was then used to estimate the
percent cover of grasses for each remaining 1-km
AVHRR pixel (Fig. 1B). The McKenzie Flats
study area was limited to a square area consisting
of greater than 90% grass cover. Burned areas on
McKenzie Flats in 1995, 2001 and 2003 were
masked in the periods immediately following the
fires.
900 Landscape Ecol (2007) 22:897–910
123

Data analyses
We calculated mean NDVI values for each
AVHRR and ETM image:
NDVlkl ¼XN;M
i¼1; j¼1
NDVlij
!,N �M
for pixels in N rows (i) and M columns (j) in
period (k) and year (l), and plotted them in
consecutive order. Mean AVHRR NDVI values
deviating more than 0.05 from values for both the
previous and following period were considered to
be statistical outliers and removed from the
analysis. Although these values could reflect
actual period to period variation in NDVI as a
function of climate variation, the likelihood of
such large changes in greenness over such a broad
area lasting less than 2 weeks is small.
Residual NDVI for a given image in period or
season (k) and year (l) (aNDVIkl) is the differ-
ence between mean NDVI for that image
(NDVIkl) and mean NDVI for all images from
that period (NDVIk):
aNDVlkl ¼ NDVlkl �NDVlk:
We used spatially explicit Z-scores to identify
significantly low NDVI values for each pixel,
comparing its NDVI value with the distribution of
values for that pixel in the same period in other
years (Peters et al. 2002). Since Z-scores are a
parametric statistic, we took random samples and
tested for normality of data from all spring and
fall periods using Shapiro–Wilks W test. Normal-
ity was found for 96% of spring samples and 86%
of fall samples (342 samples per season, N = 14
for each sample, threshold P = 0.05). The Z-score
for a given pixel (ij) for a specific period or season
(k), for all years, was calculated as:
Zijkl ¼NDVI ijkl �NDVI ijk
rNDVl ijk:
Z-scores less than –1.96 represent pixels with
significantly low NDVI values, having less than
5% probability of random occurrence compared
with the historical distribution of values for that
pixel. This approach is conceptually similar to
data quality algorithms designed to identify sta-
tistically significant ‘‘outliers’’ in spatially coher-
ent time series data (L. Larkey et al. submitted,
Collins et al. in press).
Results
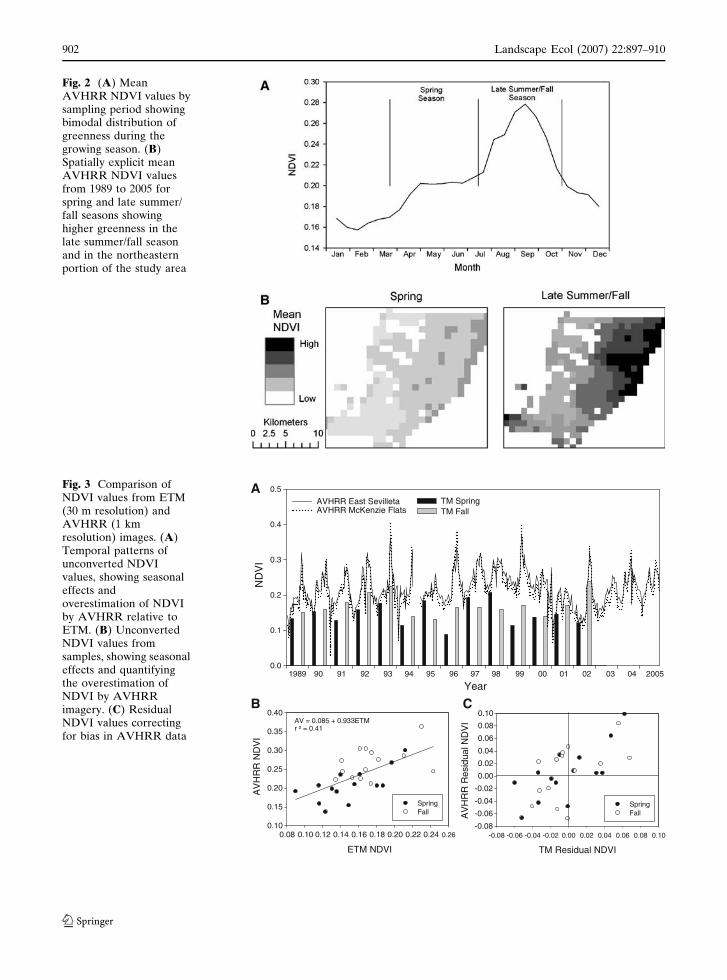
NDVI-based greenness values vary seasonally
and spatially across the study area (Fig. 2). We
found a bimodal pattern of greenness with a
moderate peak in spring following winter rains
and a much strong peak in late summer in
response to monsoon precipitation (Fig. 2a).
Spatially explicit average NDVI values show that
the relatively low spring greenness values are
widely distributed across the landscape (Fig. 2b).
In contrast, late summer greenness values are
spatially variable concentrated primarily in the
grass-dominated vegetation in the northeastern
portion of the study area (Fig. 2b). Thus, seasonal
greenness patterns reflect seasonal patterns in
annual precipitation, but peak greenness varies
spatially in response to local distribution of
rainfall and dominance by C4 grasses.
NDVI values from AVHRR imagery consis-
tently overestimated productivity relative to
ETM images (Fig. 3a, b). Overestimation was
more severe for fall ETM images (Fig. 3b). To
compensate for differences between sensors, we
converted raw NDVI values to residual values
(Fig. 3c) allowing comparison between image
types and seasons. Residual NDVI values indicate
an interval of sustained higher than normal
greenness from 1996 through mid-2000 followed
by lower than normal NDVI values until mid-
2003 following 2 years of low summer rainfall
(Fig. 4). Monthly precipitation averaged 22%
higher from 1997 through early 2000 compared
with monthly amounts from 2000 through
mid-2003 (Fig. 4).
Drought effects are evident in the AVHRR
data over more than 20% of the landscape in
1989, 1990, 1994, and throughout the interval
from 2000 through 2004 (Fig. 5a). Widespread
drought occurred from April 2001 through
August 2002 and briefly again in spring of 2003
Landscape Ecol (2007) 22:897–910 901
123
Year
ND
VI
0.0
0.1
0.2
0.3
0.4
0.5
TM SpringTM Fall
1989 90 91 92 93 94 95 96 97 98 99 00 01 02 03 04 2005
ETM NDVI
0.08 0.10 0.12 0.14 0.16 0.18 0.20 0.22 0.24 0.26
AV
HR
R N
DV
I
0.10
0.15
0.20
0.25
0.30
0.35
0.40
SpringFall
AV = 0.085 + 0.933ETMr ² = 0.41
TM Residual NDVI
-0.08 -0.06 -0.04 -0.02 0.00 0.02 0.04 0.06 0.08 0.10
AV
HR
R R
esid
ual N
DV
I
-0.08
-0.06
-0.04
-0.02
0.00
0.02
0.04
0.06
0.08
0.10
AVHRR East Sevilleta AVHRR McKenzie Flats
SpringFall
A
B C
Fig. 3 Comparison ofNDVI values from ETM(30 m resolution) andAVHRR (1 kmresolution) images. (A)Temporal patterns ofunconverted NDVIvalues, showing seasonaleffects andoverestimation of NDVIby AVHRR relative toETM. (B) UnconvertedNDVI values fromsamples, showing seasonaleffects and quantifyingthe overestimation ofNDVI by AVHRRimagery. (C) ResidualNDVI values correctingfor bias in AVHRR data
Fig. 2 (A) MeanAVHRR NDVI values bysampling period showingbimodal distribution ofgreenness during thegrowing season. (B)Spatially explicit meanAVHRR NDVI valuesfrom 1989 to 2005 forspring and late summer/fall seasons showinghigher greenness in thelate summer/fall seasonand in the northeasternportion of the study area
902 Landscape Ecol (2007) 22:897–910
123

(Fig. 5a). Drought effects were stronger in the
southern versus northern parts of the study area
(Fig. 5b). A spatially explicit analysis of drought
response from 2001 through 2002 showed that
drought effects were scattered throughout the
region in April 2001, but were widespread by
early June 2001 and remained so through August
2002 (Fig. 5b). Widespread drought effects disap-
peared after a large precipitation event in Sep-
tember 2002, showing the capacity of these
aridland ecosystems to recover rapidly from
prolonged drought.
High spatial resolution ETM imagery provide
a more detailed understanding of drought effects
in the grass-dominated northeastern portion of
the study area (Fig. 6) compared to the coarser
resolution AVHRR data. At McKenzie Flats,
significantly low greenness values were uncom-
mon in summer of 2000 (<1% of the landscape
at the 0.05 significance level; 12% of the land-
scape at the 0.10 significance level) and absent in
the scenes for 2001 and 2002. The Deep Well
precipitation record indicates that extremely low
precipitation (less than 50% of average) at
McKenzie Flats occurred only sporadically in
2001 and 2002 (Table 1), and that ETM images
were selected during or shortly after those
months (Appendix 1). In both years there were
Year
Res
idua
l ND
VI
-0.10
-0.05
0.00
0.05
0.10
1989 90 91 92 93 94 95 96 97 98 99 00 01 02 03 04 2005
-0.08
0.00
0.08
Res
idua
l mm
-30
-20
-10
0
10
20
30
PD
SI
-6
-4-2024
68
10
AVHRR
ETM
A
B
C
Fig. 4 Precipitation, drought, and vegetation responseindicators. (A) Palmer Drought Severity Index, (B) Localprecipitation at the Deep Well meteorological station, and
(C) Temporal patterns of residual NDVI from ETM andAVHRR data
Landscape Ecol (2007) 22:897–910 903
123

months during the productive seasons with closer
to normal precipitation. The NDVI residual
analysis (Fig. 4c) is also consistent with this
interpretation, showing that the spring 2002
image does in fact have an average NDVI value
that is much lower than the long-term mean,
even if it does not show pixels with significantly
low NDVI. Both 2002 images show considerable
NDVI variability that is spatially relatively
homogenous in the spring and heterogeneous
during the fall.
Discussion
Although climatic variability and extreme cli-
matic events characterize desert ecosystems, the
effects of seasonal and annual climate patterns on
Fig. 5 (A) Times series from 1989 to 2005, showingproportion of landscape with significantly low NDVIvalues (AVHRR Z-scores P £ 0.05). The drought periodfrom 2000 to 2004 is expanded to show proportions fromnorthern and southern halves of the study area. (B)
Response of vegetation greenness (NDVI) during thedrought period from April 2001 to September 2002. Noterapid vegetation recovery following precipitation in Sep-tember 2002
904 Landscape Ecol (2007) 22:897–910
123

spatial variability of productivity in these ecosys-
tems have rarely been quantified. We found that
for desert grass- and shrub-dominated vegetation
in central New Mexico (1) landscape-scale
drought effects varied seasonally and spatially
from one year to the next, (2) pervasive drought
reduced large-scale spatial heterogeneity in
aboveground greenness (NDVI), and (3) green-
ness recovered rapidly when drought conditions
ended. These results demonstrate both the high
degree of spatial and temporal coupling between
variation in rainfall patterns and ecosystem pro-
cesses and the resilience of aridland ecosystems to
short-term climatic fluctuations.
The landscape-scale patterns of drought effects
and recovery resulted from a combination of
factors, including spatial differences in local
precipitation events, year-to-year differences in
amount of winter vs. summer precipitation, and
differences in functional types among dominant
species (Reynolds et al. 2004). The north–south
transition represents the ecotone between the C4-
dominated grassland in the north and
C3-dominated shrubland to the south. Physiolog-
ical differences in functional types of dominant
Table 1 Selected precipitation amounts at the Deep Wellmeteorological station at McKenzie Flats as a percentageof 1989–2005 mean precipitation
1995 1996 2000 2001 2002
Jan 0.89 0.73 0 1.31 0.38Feb 1.47 0.33 0.13 0.63 0.49Mar 0.31 0.11 2.86 1.41 0Apr 0.37 0 0.89 0.60 0.09May 0.13 0 0 0.64 0.68June 0.15 0.37 0.10 0.08 0.02July 0.14 0.82 1.76 0.89 1.27August 0.90 1.87 0.78 1.42 0.71September 0.50 1.42 0.02 0.18 2.61October 0.06 1.56 2.46 0.24 0.07November 0.61 0.89 2.25 1.89 1.20December 0.28 0 1.24 0.94 1.03
Shaded cells indicate months when precipitation was lessthan 50% of the 1989–2005 average
Fig. 6 Spatially explicitmean ETM NDVI valuesfrom 2000 to 2002 forspring and late summer/fall seasons on McKenzieFlats showing the smallnumber of significantlylow NDVI values(Z-scores P £ 0.05) ingrassland vegetationduring this period
Landscape Ecol (2007) 22:897–910 905
123

species could be responsible, in part, for the
observed landscape-scale patterns in overall pro-
ductivity and drought response. Peak production
of creosotebush, a C3 shrub, occurred in late
spring as a function of winter and spring rainfall,
whereas production in the C4-dominated grass-
land was more dependent on summer rains,
consistent with findings elsewhere in Chihuahuan
desert ecosystems (Huenneke et al. 2002). Thus,
differences in productivity response between
northern and southern areas may result from
distinct functional type responses to differences in
the amount of seasonal rather than annual
patterns in rainfall.
Total precipitation was also higher in the
northern compared to the southern half of the
study area and may explain the small number of
significantly low ETM NDVI values on McKenzie
Flats during the 2001–2002 drought period. The
northeastern grasslands experienced orographic
rescue from drought through an increase in the
number and intensity of topographically con-
trolled convective storms particularly during the
summer monsoon (Gosz et al. 1995). Increased
precipitation from these events, along with runoff
from adjacent areas during storm events, may
increase water availability locally (Ludwig et al.
2005), creating a topographically induced refu-
gium from drought. Drought effects at McKenzie
Flats were observed in 1995–1996 when low
summer precipitation followed low winter precip-
itation. During the summer months residual
NDVI values were strongly correlated with num-
ber of monsoon days (q = 0.430, N = 39,
P = 0.007). Thus, orographic rescue increases
precipitation locally except during extended
rain-free periods.
In central New Mexico, two seasonal climatic
forces, winter frontal systems and summer mon-
soons, each of which is controlled by distinct
large-scale climate drivers, interact to create
seasonal and annual differences in the size,
frequency, intensity, and duration of precipitation
(Gutzler et al. 2002). Winter and spring precipi-
tation events are relatively uniformly distributed
spatially, reflecting the dominant ENSO frontal
systems that are primarily responsible for winter
and spring precipitation across southwestern
North America. These ENSO-driven, spatially
homogeneous precipitation events may last for
days replenishing shallow and deep soil moisture
and generating a more or less uniform springtime
pattern of productivity by C3 plants over
relatively broad areas (Loik et al. 2004). Drought
effects related to low winter and spring precipi-
tation would also be widespread and uniformly
distributed, as well. Together, these patterns
explain the relatively homogeneous spatial distri-
bution of early season productivity at the SNWR
from 1 year to the next.
In contrast, summer rainfall patterns are
patchy in space and time, reflecting the nature
of summer monsoonal precipitation. Monsoon
rains may be locally intense over a limited spatial
extent. Such events occur when evapotranspira-
tion rates are high, thus the effects of each
precipitation event on plant production may be
transient (Huxman et al. 2004; Belnap et al.
2006). As noted above, summer weather events
interact with topography generating higher pre-
cipitation near the mountains (Gosz et al. 1995).
Nevertheless, at the local scale, within-season
precipitation events remain unpredictable and
may fall at any particular location, increasing
within- and between-season spatial patchiness in
productivity.
Differences between AVHRR and ETM
NDVI may most likely be attributed to an
interaction between vegetation characteristics in
semi-arid grasslands and AVHRR compositing
methods. Interpretation of NDVI in sparse veg-
etation is problematic for multiple reasons (Mo-
ran et al. 1997; Richard and Poccard 1998;
Leprieur et al. 2000; Ji and Peters 2003; Fensholt
et al. 2004, Detar et al. 2006). In this case,
interpretation is complicated by the rapid re-
sponse of semi-arid vegetation to changes in
water availability, which results in patchy green-
ness in space and time. On any given day, there is
likely to be a percentage of the landscape that is
green, but the location of greenness can change
over the course of several days. Daily data from
AVHRR capture the location of greenness on
each day. These are converted to 14-day compos-
906 Landscape Ecol (2007) 22:897–910
123

ites that record the maximum NDVI value for
each pixel during that period. The composite
captures all green patches throughout the 14-day
period and accumulates them into a single scene,
resulting in an overestimation of greenness in
comparison with a point-in-time ETM image.
This cannot be empirically demonstrated because
ETM imagery is only captured on 18-day cycles.
However, overestimation by AVHRR is most
pronounced in the late summer/fall when rainfall
is heterogeneous and the landscape is most
patchy, lending evidence to support this explana-
tion. Other differences in sensor characteristics
could also be contributing to this problem. Xiao
and Moody (2005) showed that high resolution
NDVI overestimated fractional green vegetation
cover in New Mexico. Differences in spatial
resolution are not likely to be responsible-local
measures from ETM should be more heteroge-
neous with greater variability than broader scale
measures (Turner et al. 1989). Averaging contig-
uous ETM pixels to construct a 1-km block for
comparison with AVHRR data would result in an
NDVI that is closer to average, especially in the
spring when low and high NDVI values are
dispersed across the landscape.
Historically, it was thought that dynamics of
woody plant encroachment into grasslands in the
southwestern US was a function of ENSO
events, yet analysis of long-term vegetation data
at the SNWR showed little directional change in
the grass–shrub boundary following several
ENSO events (Li 2002). Instead, shrub encroach-
ment may result from prolonged changes in
precipitation seasonality in addition to interan-
nual fluctuations in total precipitation. Given
that winter rains recharge deep soil moisture and
that shrubs, such as creosotebush, can use deeper
soil moisture when surface soils are dry, a
regime shift to more winter precipitation, as
has been predicted by climate change models for
this region (Houghton et al. 2001), would favor
deep-rooted C3 shrubs over shallowly rooted C4
grasses that rely on soil moisture primarily from
summer rainfall events (Hamerlynck et al. 2002;
Schwinning et al. 2003). Thus, a change in
seasonal precipitation regime could lead to shrub
encroachment resulting in altered surface and
subsurface hydrology (Bhark and Small 2003),
reduced biodiversity (Briggs et al. 2005), lower
nutrient retention (Schlesinger et al. 1990),
altered carbon storage capacity (Jackson et al.
2002), and altered soil resource heterogeneity
(Schlesinger et al. 1990).
Arid landscapes are characterized by precipi-
tation events that vary in size, frequency, inten-
sity, duration, and seasonality (Noy-Meir 1973;
Porporato et al. 2004; Reynolds et al. 2004; Sch-
winning and Sala 2004). Community dynamics
(Baez et al. 2006) and ecosystem processes
(McClain et al. 2003) in arid landscapes are
strongly tied to seasonal and annual variation in
precipitation. We found that NDVI greenness in
this aridland ecosystem was highly variable across
space within a given year and over seasonal and
annual time frames. Much of this variation was
determined by regional climate drivers, such as
the North American Monsoon (Gutzler et al.
2002). At the local scale, these regional climate
drivers interacted with topography, soils and
vegetation to affect patch dynamics and ecosys-
tem processes (Peters et al. 2006). A period of
widespread and prolonged drought resulted in a
homogeneous distribution of low greenness
across the landscape. Although such large, infre-
quent climatic events may enhance shrub
encroachment into grasslands (Peters 2002), the
rapid response of both grass and shrub-dominated
areas to precipitation following prolonged
drought suggests that aridland ecosystems are
highly resilient to multi-year drought events.
Thus, seasonal shifts in precipitation, in addition
to climatic pulses, may be needed for landscape-
scale changes, such as shrub encroachment into
grassland.
Acknowledgements The Sevilleta Long-term EcologicalResearch Program is funded by National ScienceFoundation grant DEB-0217774, to the University ofNew Mexico. Data and supporting materials areavailable at http://www.sev.lternet.edu. Special thanks toBruce Milne, Julio Betancourt, Jim Gosz, and DaveGutzler for commenting on early drafts of the manuscript.
Landscape Ecol (2007) 22:897–910 907
123

References
Allen CD, Breshears DD (1998) Drought-induced shift ofa forest-woodland ecotone: rapid landscape responseto climate variation. Proc Natl Acad Sci USA95(25):14839–14842
Baez S, Collins SL, Lightfoot D, Koontz TL (2006)Bottom-up regulation of plant community structurein an aridland ecosystem. Ecology 87:2746–2754
Belnap J, Phillips SL, Troxler TT (2006) Soil lichen andmoss cover and species richness can be highlydynamic: the effects of invasion by the annual exoticgrass Bromus tectorum and the effects of climate onbiological soil crusts. Appl Soil Ecol 32:63–76
Bhark EW, Small EE (2003) The relationship betweenplant canopies and the spatial patterns of infiltrationin shrubland and grassland of the Chihuahuan Desert,New Mexico. Ecosystems 6:185–196
Borchert JR (1950) The climate of central North Americagrassland. Ann Assoc Am Geogr 40:1–39
Breshears DD, Cobb NS, Rich PM, Price KP, Allen CD,Balice RG, Romme WH, Kastens JH, Floyd ML,Belnap J, Anderson JJ, Myers OB, Meyer CW (2005)Regional vegetation die-off in response to global-change-type drought. Proc Natl Acad Sci 102:15144–15148
Briggs JM, Knapp AK, Blair JM, Heisler JL, Hoch GA,Lett MS, McCarron JK (2005) An ecosystem intransition: causes and consequences of the conversionof mesic grassland to shrubland. BioScience55(3):243–254
Carter R (2003) Climate, forest management stokeWestern wildfires. CLIMAS Southwest Climate Out-look, University of Arizona, p 4
Chen X, Xu C, Tan Z (2001) An analysis of relationshipsamong plant community phenology and seasonalmetrics of Normalized Difference Vegetation Indexin the northern part of the monsoon region of China.Int J Biometeorol 45:170–177
Collins SL, Betencourt LMA, Hagberg A, Brown RF,Moore DI, Bonito G, Delin KA, Jackson SP, JohnsonDW, Burleigh SC, Woodrow RR, McAuley JM (2006)New opportunities in ecological sensing using wirelesssensor networks. Front Ecol Environ 4(8):402–407
Detar WR, Penner JV, Funk HA (2006) Airborne remotesensing to detect plant water stress in full canopycotton. Trans Am Soc Agric Biol Eng 49(3):655–665
Di L, Rundquist DC, Han L (1994) Modeling relationshipsbetween NDVI and precipitation during vegetativegrowth cycles. Int J Remote Sens 15:2121–2136
Dunham S, Fonstad MA, Anderson S, Czajkowski KP(2005) Using multi-temporal satellite imagery tomonitor the response of vegetation to drought in theGreat Lakes region. GISci Remote Sens 42(3):183–199
Easterling DR, Evans JL, Groisman P, Karl TR, KunkelKE, Ambenje P (2000) Observed variability andtrends in extreme climate events: a brief review. BullAm Meteorol Soc 81:417–425
Fensholt R, Sandholt I, Rasmussen MS (2004) Evaluationof MODIS LAI, fAPAR and the relation betweenfAPAR and NDVI in a semi-arid environment usingin situ measurements. Remote Sens Environ 91(3–4):490–507
Foody GM (2003) Geographical weighting as a furtherrefinement to regression modeling: an examplefocused on the NDVI-rainfall relationship. RemoteSens Environ 88:283–293
Appendix 1
Seasonal grouping of imagery for analysis.
AVHRR images are 14-day composites repre-
senting 26 periods per year from 1989 to 2005.
ETM images are single scenes representing peak
productivity in the spring/early summer and late
summer/fall seasons over the same time period.
Season Correspondingdates
AVHRRperiods
AVHRR data not includedPeriod: year
ETM images
Spring/earlysummer
March 12–July15
6–14 Missing: 13: 1998 May 15, 1989; May 6, 1990; April 23, 1991; April8, 1992; May 30, 1993; May 17, 1994; May 20,1995; June 7, 1996; June 1, 1997; May 3, 1998;May 15, 1999; May 9 2000; June 13 2001; May15 2002
Latesummer/fall
July 16–November 4
15–22 Missing: 19–22: 1994Outliers: 15: 1992 15: 2000
Oct 10, 1989; Sep 11, 1990; Sep 30, 1991; Oct 2,1992; Sep 19, 1993; Aug 21, 1994; Aug 24,1995; Oct 13, 1996; Sep 14, 1997; Oct 3, 1998;Sep 28, 1999; Sep 14, 2000; Sep 1, 2001; Sep 20,2002
Winter November 5–March 11
23–26;1–5
Missing: 1: 1995 4: 1994 25:1994 26: 2001 Outliers: 2:1994 2: 2001 26: 1990
N/A
908 Landscape Ecol (2007) 22:897–910
123

Frank DA, Inouye RS (1994) Temporal variation in actualevapotranspiration of terrestrial ecosystems: patternsand ecological implications. J Biogeogr 21(4):401–411
Friggens MT (2003) Relating small mammal dynamics toprecipitation and vegetation on the Sevilleta NationalWildlife Refuge, New Mexico. Master’s Thesis, Uni-versity of New Mexico
Giannini A, Saravanan R, Chang P (2003) Oceanic forcingof Sahel rainfall on interannual to interdecadal timescales. Science 302(5647):1027–1030
Gosz JR, Moore DI, Shore GA, Grover HD (1995).Lightning estimates of precipitation location andquantity on the Sevilleta LTER, New Mexico. EcolAppl 5(4):1141–1150
Gutzler DS, Kann DM, Thornbrugh C (2002) Modulationof ENSO-based long-lead outlooks of southwesternU.S. winter precipitation by the Pacific DecadalOscillation. Weather Forecast 17(6):1163–1172
Hamerlynck EP, McAuliffe JR, McDonald EV, Smith SD(2002) Ecological responses of two Mojave Desertshrubs to soil horizon development and soil waterdynamics. Ecology 83:768–779
Hochstrasser T, Kroel-Dulay G, Peters DPC, Gosz JR(2002) Vegetation and climate characteristics of aridand semi-arid grasslands in North America and theirbiome transition zone. J Arid Environ 51:55–78
Houghton JT, Ding Y, Griggs DJ, Noguer M, van derLinden PJ, Xiaosu D (eds) (2001) Climate change2001: the scientific basis. Contribution of WorkingGroup I to the Third Assessment Report of theIntergovernmental Panel on Climate Change. Cam-bridge University, UK
Huenneke LF, Clason D, Muldavin E (2001) Spatialheterogeneity in Chihuahuan Desert vegetation:implications for sampling methods in semi-arid eco-systems. J Arid Environ 47:257–270
Huenneke LF, Anderson JP, Remmenga M, SchlesingerWH (2002) Desertification alters patterns of above-ground net primary production in Chihuahuan eco-systems. Glob Change Biol 8:247–264
Huete AR (1988) A Soil-Adjusted Vegetation Index(SAVI). Remote Sens Environ 25:295–309
Huxman TE, Cable JM, Ignace DD, Eilts AJ, English NB,Weltzin J, Williams DG (2004) Response of netecosystem gas exchange to a simulated precipitationpulse in a semi-arid grassland: the role of native versusnon-native grasses and soil texture. Oceanography4(2):317–324
IPCC (2001) Climate change 2001: the scientific basis.Cambridge Univ. Press, Cambridge UK
Jackson RB, Banner JL, Jobbagy EG, Pockman WT, WallDH (2002) Ecosystem carbon loss with woody plantinvasion of grasslands. Nature 418(6898):623–626
Ji L, Peters AJ (2003) Assessing vegetation response todrought in the northern Great Plains using vegetationand drought indices. Remote Sens Environ 87:85–98
Jobbagy EG, Sala OE, Paruelo JM (2002) Patterns andcontrols of primary production in the Patagoniansteppe: a remote sensing approach. Ecology 83:307–319
Justice CO, Townshend JRG, Holben BN, Tucker CJ(1985) Analysis of the phenology of global vegetation
using meteorological satellite data. Int J Remote Sens6:1271–1318
Kawabata A, Ichii K, Yamaguchci Y (2001) Global mon-itoring of interannual changes in vegetation activitiesusing NDVI and its relationships to temperature andprecipitation. Int J Remote Sens 22:1377–1382
Kerr RA (2003) Warming Indian Ocean wringing moisturefrom the Sahel. Science 302(5643):210
Knapp AK, Smith MD (2001) Variation among biomes intemporal dynamics of aboveground primary produc-tion. Science 291:481–484
Law BE, Waring RH (1994) Remote sensing of leaf areaindex and radiation intercepted by understorey veg-etation. Ecol Appl 4(2):272–279
Lenart M (2004a) Low flow in the Colorado River Basinspurs water shortage discussion among seven states.CLIMAS Southwest Climate Outlook. University ofArizona, pp 2–4
Lenart M (2004b) Southwest faces high fire risk despiterecent rains. CLIMAS Southwest Climate Outlook.University of Arizona
Leprieur C, Kerr YH, Mastorchio S, Meunier JC (2000)Monitoring vegetation cover across semi-arid regions:comparison of remote observations from variousscales. Int J Remote Sens 21(2):281–300
Li B (2002) A theoretical framework of ecological phasetransitions for characterizing tree-grass dynamics.Acta Biotheor 50:141–154
Loik ME, Breshears DD, Lauenroth WK, Belnap J (2004)A multi-scale perspective of water pulses in drylandecosystems: climatology and ecohydrology of thewestern USA. Oecologia 4(2):269–281
Lu H, Raupach MR, McVicar TR, Barrett DJ (2003)Decomposition of vegetation cover into woody andherbaceous components using AVHRR NDVI timeseries. Remote Sens Environ 86:1–18
Ludwig JA, Wilcox BP, Breshears DD, Tongway DJ,Imeson AC (2005) Vegetation patches and runoff-erosion as interacting ecohydrological processes insemiarid landscapes. Ecology 86:308–319
McClain ME, Boyer EW, Dent CL, Gergel SE, GrimmNB, Groffman PM, Hart SC, Harvey JW, JohnstonCA, Myorga E, McDowell WH, Pinay G (2003)Biogeochemical hot spots and hot moments at theinterface of terrestrial and aquatic ecosystems. Eco-systems 6:301–312
McNaughton SJ, Oesterheld M, Frank DA, Williams KJ(1989) Ecosystem-level patterns of primary produc-tivity and herbivory in terrestrial habitats. Nature341:142–144
Meentemeyer V (1978) Macroclimate and lignin control oflitter decomposition rates. Ecology 59:465–472
Moody A, Johnson DM (2001) Land-surface phenologiesfrom AVHRR using the discrete Fourier transform.Remote Sens Environ 75:305–323
Moran MS, Inoue Y, Barnes EM (1997) Opportunities andlimitations for image-based remote sensing in preci-sion crop management. Remote Sens Environ 61:319–346
Muldavin E, Shore GA, Taugher K, Milne BT (1998) Avegetation classification and map for the Sevilleta
Landscape Ecol (2007) 22:897–910 909
123

National Wildlife Refuge, New Mexico. A final reportto The Nature Conservancy (New Mexico Chapter),the Mary Flagler Cary Charitable Trust, the SevilletaNational Wildlife Refuge, the New Mexico NaturalHeritage Program, and the Sevilleta Long TermEcological Research Program. Albuquerque, NewMexico, New Mexico Natural Heritage Program andthe Sevilleta LTER Program, Biology Department,University of New Mexico, p 45
Myneni RB, Keeling CD, Tucker CJ, Asrar G, NemaniRR (1997) Increased plant growth in the northernhigh latitudes from 1981 to 1991. Nature 386:698–702
Noy-Meir I (1973) Desert ecosystems: environment andproducers. Annu Rev Ecol Syst 4:23–51
Ogle K, Whitham TG, Cobb NS (2000) Tree-ring variationin pinyon predicts likelihood of death following severedrought. Ecology 81(11):3237–3243
Palmer WC (1965) Meteorological drought. US WeatherBureau, Research Paper 45, Washington DC
Paruelo JM, Lauenroth WK (1995) Regional patterns ofNDVI in North American shrublands and grasslands.Ecology 76:1888–1898
Peters D (2002) Recruitment potential of two perennialgrasses with different growth forms at a semiarid-aridtransition zone. Am J Bot 89:1616–1623
Peters AJ, Walter-Shea EA, Ji L, Vina A, Hayes M,Svoboda MD (2002) Drought monitoring with NDVI-based standardized vegetation index. PhotogrammetrEng Remote Sens 68(1):71–75
Peters DPC, Gosz JR, Pockman WT, Small EE, ParmenterRR, Collins SL, Muldavin E (2006) Integrating patchand boundary dynamics to understand and predictbiotic transitions at multiple scales. Landsc Ecol21:19–33
Porporato A, Laio F, Ridolfi L, Caylor K, Rodriguez-Iterbe I (2004) Soil moisture and plant stress dynamicsalong the Kalahari precipitation gradient. J GeophysRes 108(D3):4127–4134
Potter CS, Brooks V (2001) Global analysis of empiricalrelations between annual climate and seasonality ofNDVI. Int J Remote Sens 19:2921–2948
Potter C, Tan P, Steinbach M, Klooster S, Kumar V,Myneni RB, Genovese V (2003) Major disturbanceevents in terrestrial ecosystems detected using globalsatellite data sets. Glob Change Biol 9:1005–1021
Prince SD (1991) Satellite remote sensing of primaryproduction: comparison of results from Saheliangrasslands 1981–1988. Int J Remote Sens 12:1313–1330
Reynolds JF, Kemp PR, Ogle K, Fernandez RJ (2004)Modifying the ‘pulse-reserve’ paradigm for deserts ofNorth America: precipitation pulses, soil water andplant responses. Oecologia 141(2):194–210
Richard Y, Poccard I (1998) A statistical study of NDVIsensitivity to seasonal and interannual rainfall varia-tions in Southern Africa. Int J Remote Sens 19:2907–2920
Romme WH, Clement J, Hicke J, Kulakowski D, Mac-Donald LH, Shoennagel TL, Velben TT (2006)Recent forest insect outbreaks and fire risk in Colo-rado forests: a brief synthesis of relevant research.
Colorado Forest Research Institute, Report (refer-eed), 24 pp
Rosenzweig ML (1968) Net primary productivity ofterrestrial communities: prediction from climatologi-cal data. Am Nat 102:67–74
Schlesinger WH, Reynolds JF, Cunningham GL, Hu-enneke LF, Jarrell WM, Virginia RA, Whitford WG(1990) Biological feedbacks in global desertification.Science 247:1043–1048
Schwinning S, Sala OE (2004) Hierarchy of responses toresource pulses in arid and semi-arid ecosystems.Oecologia 4(2):211–220
Schwinning S, Starr BI, Ehleringer JR (2003) Dominantcold desert shrubs do not partition warm seasonprecipitation by event size. Oecologia 136:252–260
Sellers PJ (1985) Canopy reflectance, photosynthesis andtranspiration. Int J Remote Sens 6:1335–1372
Sellers PJ, Berry JA, Collatz GJ, Fields CB, Hall FG(1992) Canopy reflectance, photosynthesis and tran-spiration. III. A reanalysis using improved leaf modelsand a new canopy integration scheme. Remote SensEnviron 42:187–216
Shabanov NV, Zhou L, Knyazikhin Y, Myneni RB,Tucker CJ (2002) Analysis of interannual changes innorthern vegetation activity observed in AVHRRdata from 1981 to 1994. IEEE Trans Geosci RemoteSens 40:115–130
Sheppard PR, Comrie AC, Packin GD, Angersbach K,Hughes MK (2002) The climate of the US Southwest.Climate Res 21:219–238
Tucker CJ (1979) Red and photographic infrared linearcombinations for monitoring vegetation. Remote SensEnviron 8:127–150
Tucker CJ, Slayback DA, Pinzon JE, Los SO, Myneni RB,Taylor MG (2001) Higher northern latitude Normal-ized Difference Vegetation Index and growing seasontrends from 1982 to 1999. Int J Biometeorol 45:184–190
Turner MG, O’Neill RV, Gardner RH, Milne BT (1989)Effects of changing spatial scale on the analysis oflandscape pattern. Landsc Ecol 3:153–162
Van Auken OW (2000) Shrub invasions of North Americansemiarid grasslands. Annu Rev Ecol Syst 31:197–215
Weiss JL, Gutzler DS, Coonrod JEA, Dahm CN (2004)Seasonal and interannual relationships between veg-etation and climate in Central New Mexico, USA. JArid Environ 57:507–534
Weldeab SR, Schneider R, Kolling M, Wefer G (2005)Holocene African droughts relate to eastern equato-rial Atlantic cooling. Geology 33:981–984
Williams CA, Albertson JD (2006) Dynamical effects ofthe statistical structure of annual rainfall in aridlandecosystems. Glob Change Biol 12:777–792
White AB, Kumar P, Tcheng D (2005) A data miningapproach for understanding topographic control onclimate-induced inter-annual vegetation variabilityover the United States. Remote Sens Environ 98:1–20
Xiao JF, Moodey A (2005) A comparison of methods forestimating fractional green vegetation cover within adesert-to-upland transition zone in central New Mex-ico, USA. Remote Sens Environ 98(2–3):237–250
910 Landscape Ecol (2007) 22:897–910
123