notions of captivity in arab, malay and persian travel narratives
1
Post-release wide-ranging movements of sea turtles after prolonged 1
captivity 2
3
Mestre, Frederico1, 2
; Bragança, Marco P.1, 3
; Nunes, Antonieta1; dos 4
Santos, Manuel E.4
5
1 Zoomarine - Mundo Aquático S.A., E.N. 125, km 65, Guia, 8201-864 Albufeira, 6
Portugal. 7
2Current affiliation: CIBIO-UE - Centro de Investigação em Biodiversidade e Recursos 8
Genéticos/Universidade de Évora, Departamento de Biologia, Núcleo da Mitra, 7002-9
554-Évora, Portugal. 10
3Corresponding author. Email: [email protected], Telf.: +351289560300.
11
4Eco-Ethology Research Unit, ISPA - Instituto Universitário, Rua Jardim do Tabaco, 12
nº34, 1149-041 Lisboa, Portugal. 13
This is a preprint version of the following paper: 14
Mestre, F., Bragança, M. P., Nunes, A., & dos Santos, M. E. (2014). Satellite 15
tracking of sea turtles released after prolonged captivity periods. Marine Biology 16
Research, 10(10), 996-1006. URL: http://dx.doi.org/10.1080/17451000.2013.872801. 17
18
19
20
21
22
2
Post-release wide-ranging movements of sea turtles after 23
prolonged captivity 24
Rehabilitation is an important part of sea turtle conservation efforts, and tracking 25
the animals is both a way of obtaining information on their movements and 26
behaviour, and to monitor, at least temporarily, the success of the rehabilitation 27
process. Two green turtles, Chelonia mydas (Linnaeus, 1758), and one 28
loggerhead turtle, Caretta caretta (Linnaeus, 1758), were rehabilitated after long 29
periods in captivity, and their movements were followed by satellite tracking 30
after their release near the South of Portugal. Location data were obtained for an 31
average of 688 days after release. All three animals showed a directional 32
movement and the last observed locations coincided with known feeding areas 33
for both species, near the coasts of Mauritania and the state of Ceará, Brazil, for 34
the green turtles, and near Cuba, for the loggerhead. Bathymetry, surface 35
currents, wind, sea surface temperature, chlorophyll-a concentration and 36
geomagnetic field were analysed as spatial and environmental variables 37
potentially affecting movement. Only bathymetry, sea surface temperature and 38
geomagnetic variables showed significant association with the path choice. This 39
project supports the notion that sea turtles have the ability to survive in the wild 40
after long periods in captivity and to return to known feeding areas of the species, 41
justifying the effort in their rehabilitation and post-release tracking. 42
Keywords: Sea turtle rehabilitation, satellite tracking, Chelonia mydas, Caretta 43
caretta. 44
45
Introduction 46
Sea turtles are threatened throughout their life cycle by several anthropogenic factors 47
such as bycatch, poaching, modification of nesting beaches, pollution and marine debris 48
(Bolten et al. 2010; Donlan et al. 2010). Although not every sea turtle that is ill, injured 49
or entangled strands ashore (Epperly et al. 1996), beached individuals of such 50
charismatic fauna normally attract more public attention (Feck & Hamann 2013), which 51
may lead to a rehabilitation response. The reasons listed by Moore et al. (2007) for the 52
rehabilitation of marine mammals can also be used to justify sea turtle rehabilitation 53
attempts: conservation of endangered species; care of animals harmed by human 54
3
activities; mitigation of human use of sea turtle nesting beaches; research focused on 55
rehabilitation or wildlife medicine; post-release tracking, as a way to improve 56
knowledge on wild populations and migration; public education campaigns about 57
marine ecosystem health and its importance to sea turtle conservation. Considering the 58
low survival probability of each turtle (from egg to adulthood, e.g. Frazer 1986) but also 59
its potential reproductive output (Broderick et al. 2003), the rehabilitation of a single, or 60
a small number, of individuals becomes demographically relevant. 61
Studies on the post release behaviour of rehabilitated sea turtles are limited and have 62
mostly been restricted to sea turtles accidentally captured by long-liners and released 63
after hook removal on-board the fishing boats (Swimmer et al. 2006 and Sasso & 64
Epperly 2007) or to individuals entangled in trammel nets and released after a short 65
period of time (e.g. Snoddy & Southwood 2010). 66
Some sea turtles have been released carrying satellite transmitters, which allowed the 67
study of their subsequent movements and to monitor their rehabilitation success (see 68
Godley et al. 2008). 69
Post-release adaptation to the wild is critical to the rehabilitation process. With a few 70
exceptions (e.g. Bentivegna 2001; Cardona et al. 2012) this has not been studied in 71
depth, particularly for sea turtles that experienced long captivity periods. 72
This study provides new data on sea turtles’ post-release movements after long periods 73
in captivity, through the satellite tracking of two green turtles (Chelonia mydas) and one 74
loggerhead turtle (Caretta caretta). A comprehensive set of potential variables was 75
analysed, building on other studies that assessed only one or a low number of 76
parameters, such as sea surface temperature (Hays et al. 2001 and Hawkes et al. 2007), 77
geomagnetic variables (Benhamou et al. 2011), surface currents (Luschi et al. 2003; 78
Bentivegna et al. 2007 and Hawkes et al. 2007) or chlorophyll-a concentration 79
(Polovina et al. 2001). 80
The main objective of this paper is to obtain information on sea turtle movement and 81
behaviour, assessing the success of the rehabilitation process after prolonged periods of 82
captivity. 83
84
85
86

4
Materials and Methods 87
Specimen handling and release 88
Two female green turtles and one female loggerhead turtle were released in the Atlantic 89
Ocean, about 20 miles south of Portimão, Portugal (approximately 36°46'48.57"N; 90
8°32'16.54"W) on 30 September 2009, after being rehabilitated at Zoomarine’s 91
Rehabilitation Centre, Porto d’Abrigo (PdAZ). The three turtles tracked in this study 92
came from the following backgrounds: 93
CM1 (green turtle, nicknamed Tartaruga) was transferred from the Funchal Municipal 94
Museum (Madeira, Portugal) on the 22nd
of April 2004, where it was kept for about 30 95
years. On arrival at the rehabilitation center: weight = 32.0 kg, straight carapace length 96
(SCL) = 60.6 cm; On release: weight = 80.4 kg, SCL = 78 cm. 97
CM2 (green turtle, nicknamed Cat) was seized by the Portuguese airport customs on the 98
27th
of August 2001 (on arrival at the rehabilitation center: weight = 4.8 kg, SCL = 33.9 99
cm). It was sent to the PdAZ by the national authority for nature conservation (ICNF – 100
Institute for Nature and Forest Conservation). On March of 2006 the left fore flipper 101
was surgically amputated due to a severe infection but its subsequent swimming ability 102
was apparently not affected. On release: weight = 60.5 kg, SCL = 77.5 cm. 103
CC (loggerhead turtle, nicknamed Calantha) was transferred from the Vasco da Gama 104
Aquarium (Oeiras, Portugal) on the 13th
of October 2005, where it was exhibited for 105
about 25 years (on arrival at the rehabilitation center: weight = 115 kg, SCL = 84 cm; 106
on release: weighted = 125.8 kg, SCL = 84 cm). 107
All specimens had a long history of captivity. During the rehabilitation time at PdAZ, 108
human interaction with these individuals was minimized. 109
Each turtle was considered fit for release when it met certain predefined criteria 110
(Bluvias 2008): 1) no medication for at least two weeks; 2) the ability to capture live 111
prey; 3) good body condition; 4) no diseases or lesions (wounds, tumours, skin 112
irritation, epibionts or endoparasites); 5) normal digestive function; 6) the ability for 113
active movement; 7) the capacity to lift its head and breathe normally; 8) attempts to 114
move when on dry substrate; 9) normal blood parameters for 2 to 4 weeks. 115
The three turtles were fitted with Argos System satellite tags on top of the carapace 116
following the procedure described by Coyne et al. (2008). The KiwiSat 101 117
transmitters (Sirtrack Limited, New Zealand) operated with a 40-second repetition rate 118

5
and a salt water switch (transmitting only when the animal surfaced). The location data 119
time span was from September 2009 to September 2011. 120
121
Environmental data 122
General Bathymetric Chart of the Oceans (GEBCO) bathymetry (in meters) was 123
retrieved through the British Oceanographic Data Centre website (BODC 2012). This 124
dataset has a resolution of 30 arc-seconds, and was generated by combining quality-125
controlled ship depth soundings with interpolation between sounding points, which is 126
estimated by satellite-derived gravity data (GEBCO 2012). Bathymetric data might be 127
an important variable to understand the movement of sea turtles, since these species 128
have continental (nesting) and neritic (feeding) stages in their life history (Kobayashi et 129
al. 2008). 130
Data on surface currents (in ms-1
) were downloaded from the Ocean Surface Current 131
Analysis (OSCAR) website (Bonjean & Lagerloef 2002; OSCAR 2012). These data 132
consisted of information about the East-West (u) and North-South (v) components of 133
the surface currents which were transformed to speed ( 22 vuS , in ms-1
) and water 134
flow direction (D = arctan(u/v); in degrees). 135
Chlorophyll-a data (in mg m-3
) and Sea Surface Temperature (SST), (in ºC) were 136
downloaded from the NASA Earth Observations website (http://neo.sci.gsfc.nasa.gov) 137
and were obtained by the Moderate Resolution Imaging Spectroradiometer (MODIS) 138
instrument in the NASA's satellite Aqua, with a resolution of 1 km. The chlorophyll-a 139
data provide information on the concentration of surface phytoplankton, and the SST is 140
the temperature of the top millimetre of the ocean, accurate to a half a degree Celsius. 141
Both chlorophyll-a and SST were considered by previous studies (e.g., Kobayashi et al. 142
2008) as important variables in loggerhead movement. 143
Geomagnetic variables were based on the World Magnetic Model for 2010/2015 and 144
were downloaded from NOAA’s National Geophysical Data Center website 145
(ftp://ftp.ngdc.noaa.gov/geomag/wmm/wmm2010/shapefiles/). Three geomagnetic 146
variables were considered for analysis: declination (in degrees), inclination (in degrees) 147
and intensity (in nanoTeslas). The spatial representation of the geomagnetic isolines 148
will depend on the orientation strategy followed by the turtles in relation to these 149
variables, as discussed by Lohmann et al. (2007). Here, we interpolated the isolines in 150
6
order to obtain continuous surfaces, as these gradients might be the best way to identify 151
any influence of the magnetic field. Geomagnetic variables are important navigation 152
cues at intermediate scales to green turtles (Benhamou et al. 2011) and also to the 153
movements of loggerheads (Lohmann et al. 2004 and Kobayashi et al. 2008). 154
Surface winds were also considered as a relevant variable. East-West (u) and North-155
South (v) components were obtained from NOAA’s Multiple-Satellite Blended Sea 156
Surface Winds, downloaded from the NOAA-NOMADS Live Access Server 157
(http://nomads.ncdc.noaa.gov/las/), and speed (in ms-1
) and direction (in degrees) were 158
subsequently computed. Collard & Ogren (1990) found that surface winds are important 159
to dispersal patterns of post-hatching Kemp’s ridley turtles (Lepidochelys kempii); 160
Hochscheid et al. (2010), on the other hand, reported that loggerheads may remain at the 161
surface for extended periods to absorb solar radiation or to recover from anaerobic 162
activity, and therefore may be significantly affected by winds; the effect of the drag 163
caused by the satellite transmitter on the movements of the sea turtles has been noted by 164
Watson & Granger (1998). All these factors highlight the potential influence of surface 165
winds on sea turtle paths. 166
Shoreline data were downloaded from the GSHHS (Global Self-consistent Hierarchical 167
High-resolution Shoreline) website (GSHHS 2012) (Wessel & Smith 1996). The highest 168
resolution data available were used. 169
All the ecogeographical variables (with the exception of bathymetry geomagnetic 170
variables) were averaged monthly in the considered time period. The wind direction and 171
current flow values follow the oceanographic convention (angles are measured 172
clockwise from North). 173
All GIS analysis and plotting was carried out using Quantum GIS, version “Lisboa” 174
1.8.0 (Quantum GIS Development Team, 2013) and two R packages: “raster” (Hijmans 175
& van Etten 2012) and “maptools” (Lewin-Koh et al. 2012). The software R version 176
was x64 2.15.1 (R Core Team 2012). 177
178
Track analysis 179
Data were received from the Argos system through the STAT (Satellite Tracking and 180
Analysis Tool) platform, which is a web-based tool that facilitates the reception and 181
7
filtration of Argos data (Coyne & Godley 2005). The specimen’s location, in near real-182
time display, may be sent to a website, allowing the sharing of this information with the 183
general public. 184
The Argos data are classified according to the location accuracy of each point, which 185
mainly depends on the geometrical conditions of the satellite pass at the time it receives 186
the uplinks, and on the stability of the transmitter frequency (Argos, 2011). In the 187
particular case of marine species, the limited time spent at the surface restricts the 188
number of uplinks received by the satellite, so these data are particularly prone to 189
location error (Freitas et al. 2008). The Argos data locations are classified according to 190
an error estimate, and only those in the error classes 1(<1500 m), 2 (<500 m) and 3 191
(<250 m) were retained for further analysis. Locations on land, as well as those that 192
imply an unrealistically high swimming speed of more than 6 km.h-1
for the loggerhead 193
turtle (Bentivegna et al. 2007) and 5 km.h-1
for the green turtles (Luschi et al. 1998) 194
were also discarded. 195
Defining resource use and availability is a fundamental stage in resource selection 196
studies. Resource use can be defined in several ways, such as time spent and distance 197
travelled within the used area (Buskirk & Millspaugh 2006). The availability of 198
resources was defined for each turtle by considering a kernel 99% to avoid the exclusion 199
of data from paths actually used. This was calculated using the fixed kernel with the 200
smoothing parameter computed by the reference bandwidth method (Powell 2000), 201
using the R package “adehabitatHR” (Calenge 2006). The used resources are those 202
within a buffer with a width of 60 km (considering that the maximum daily average 203
distance travelled was just less than 30 km). 204
To identify variables accounting for the turtle path choice (departing from resource 205
availability) a Kolmogorov-Smirnov test (KS) was performed highlighting deviations 206
between availability and actual use of space. Subsequently, for each of the variables for 207
which significant differences were found, a Strauss’ Linear Index (SLI) (Strauss 1979) 208
was computed: 209
iiOSLI ̂ (1) 210
211

8
Where uuO ii / (sample proportion of used units in category i) and mmii /̂212
(sample proportion of available units in category i). 213
The analysis of current and surface winds significance (speed and direction in both 214
cases) was performed using a different strategy, pairing movement direction and speed 215
with the underlying variables. For wind and current direction, the circular correlation 216
statistic was used, running the R package “CircStats” (Agostinelli 2012), while for wind 217
and current speed a linear model was adopted. The analyses were performed separately 218
for each of the turtles. 219
220
Results 221
Location data were obtained for an average of 688 days after release (CC=653 d; 222
CM1=675 d; CM2=736 d). The tracking data from the three turtles are plotted on Figure 223
1, showing that all three animals followed a targeted movement (rather than random) 224
and, most importantly, that the last observed locations coincided with known feeding 225
areas for each species (Marcovaldi & Marcovaldi 1999; Fretey 2001; Dodd & Byles 226
2003; Santos et al. 2011). In the beginning of this study, both of the C. mydas turtles 227
followed a path along the coast, with CM2 crossing the Atlantic to Brazil after reaching 228
Western Sahara, and the CM1 staying near the African coast. The third turtle, the C. 229
caretta, crossed the Atlantic shortly after being released, passing between the Madeira 230
and Canary Islands until it reached the coastal waters of Cuba. 231
FIGURE 1 232
In studies of this nature, data quality can be assessed by evaluating the percentage of 233
locations within each of the error classes, as seen in Table 1. CC had more accurate 234
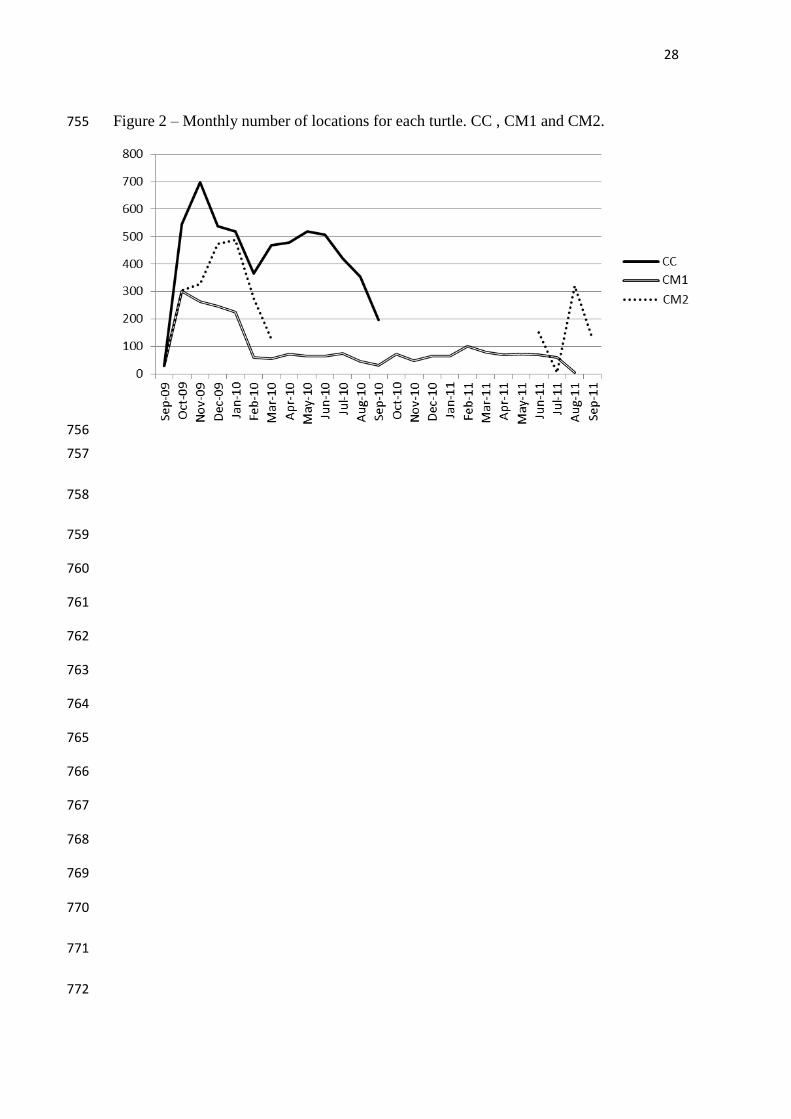
locations, probably due to longer or more frequent surfacing periods. CM1’s satellite 235
data were the least accurate, with more than 80% of the locations having no error 236
estimation, although it is the specimen with the largest time span of data (Figure 2). For 237
unknown reasons, locations from specimen CM2 were interrupted for over a year, 238
during which the animal stayed in the same general area (see Hays et al. 2007 for a 239
discussion of transmission problems). 240
9
TABLE 1 241
FIGURE 2 242
The last recorded locations for each of the turtles were: East coast of Cuba (CC); Banc 243
d’Arguin National Park, off the coast of Mauritania (CM1) and north-eastern coast of 244
Brazil (CM2). 245
The average daily speed of each specimen was: 0.191 km.h-1
(CM1), 1.15 km.h-1
(CC) 246
and 0.995 km.h-1
(CM2). CM1 has a lower average speed because the animal’s 247
movement was reduced upon arriving at the coastal region of the Banc d’Arguin 248
National Park. Ignoring these last locations, speed values were similar to those of the 249
other turtles. 250
251
Track analysis 252
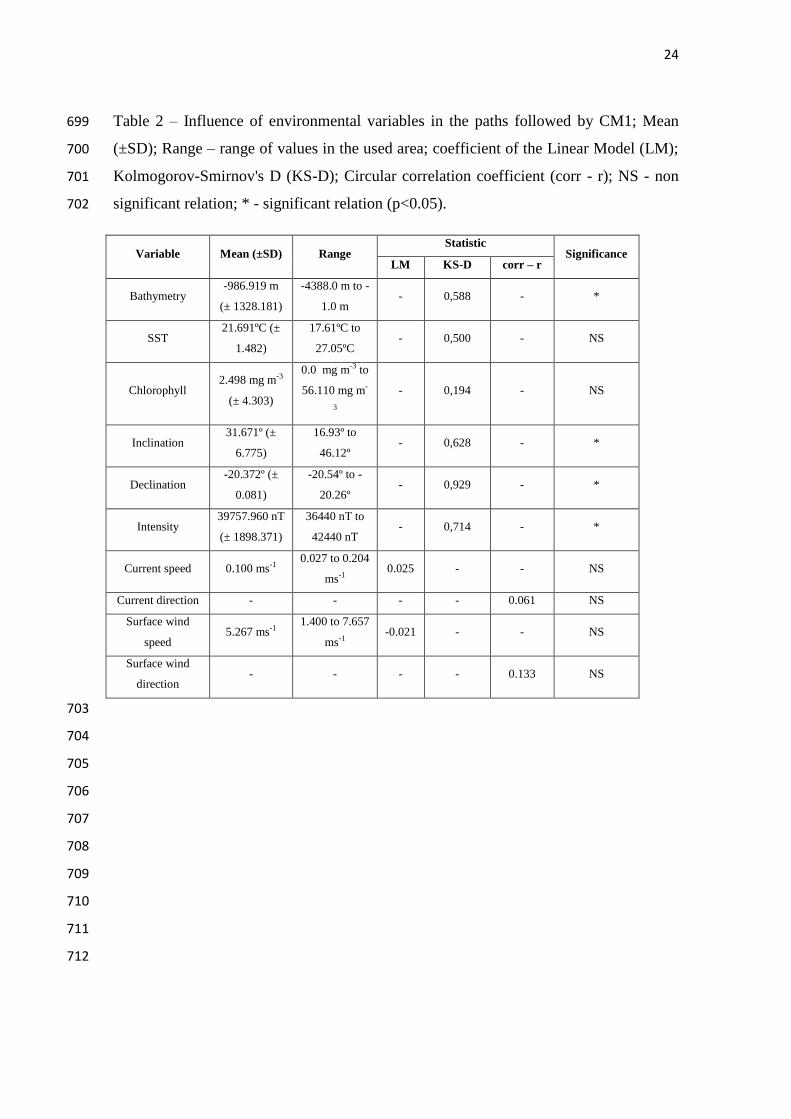
Tables 2 to 4 show the main results of the statistical analysis on the influence of 253
environmental variables in the paths chosen by each sea turtle. 254
TABLE 2 255
TABLE 3 256
TABLE 4 257
The following analysis, using the Strauss Linear Index, evaluates the relation between 258
each turtle and the environmental variables. The curves representing the SLI values are 259
presented in Figure 3. 260
FIGURE 3 261
These results highlight the importance of the geomagnetic variables in the sea turtles’ 262
navigation. 263
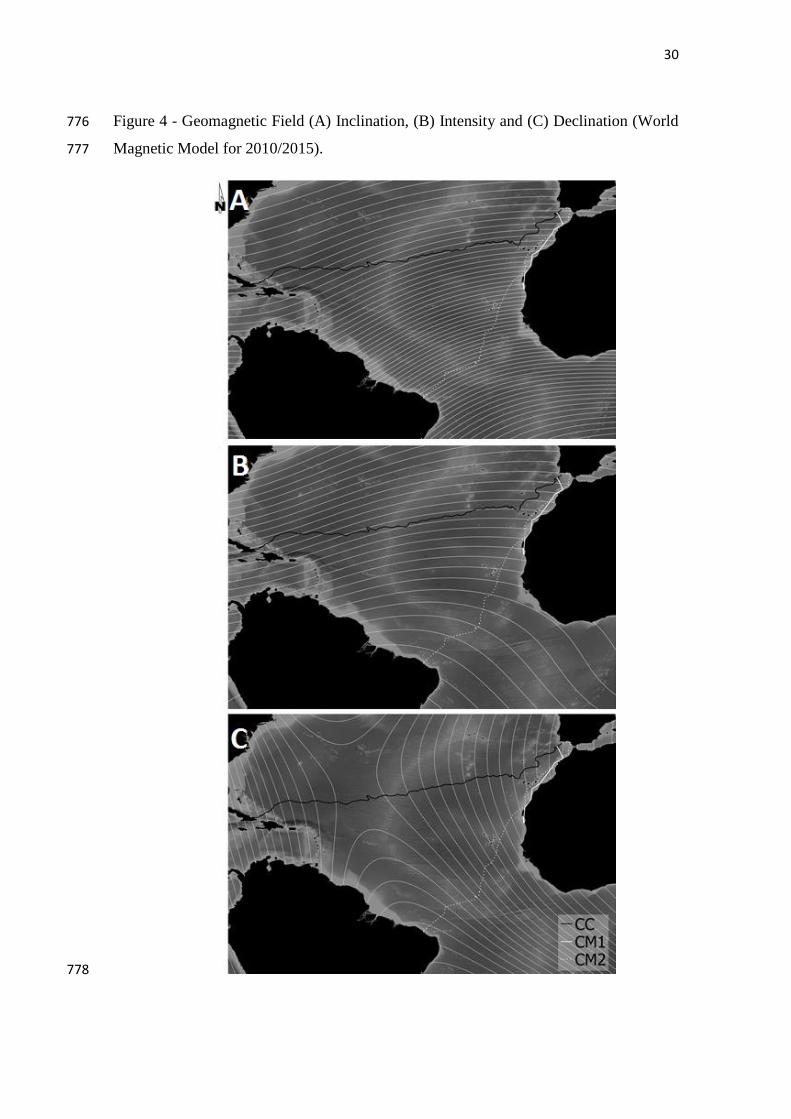
In the case of CM1, all three geomagnetic variables were significant to the path 264
followed. Nevertheless there seems to be no particular preference within each variable. 265
That is explained by the isoline layout, which is fairly perpendicular to CM1’s path 266
(Figure 4). Bathymetry was also important to this specimen’s movement, which showed 267
a strong preference for shallow areas. Surface currents and winds had no significant 268
impact on space use. 269
To CM2, inclination and declination had a more important effect. Regarding 270
geomagnetic field inclination there is a strong selection of values between -12º and -271
10
7.89º, explained by the final part of the path where the turtle moves parallel to the 272
isolines. Geomagnetic field declination is basically perpendicular to this turtle’s path, 273
explaining the variation in the SLI. The coastal path followed indicates a strong 274
selection of shallow areas (and a strong avoidance of depths over 3830 m). Wind 275
direction was also significant. However, it had a residual importance in path choice, 276
considering that the correlation coefficient was very low (r = 0.134). 277
CC was also influenced by the geomagnetic variables. It followed a path parallel to 278
some inclination isolines with a selection of values between 33.1º and 35.3º. 279
Geomagnetic field intensity also shows a degree of selection between 38760 nT and 280
39369 nT, for the same reason. CC moves in a perpendicular path to the declination 281
isolines. In what regards field declination, there was an avoidance of values between –282
20.26º and –19.88º, with no particular selection for values above, as shown by the SLI. 283
Bathymetry was an important variable for this turtle, with a positive selection of depths 284
between 6140 m and 5620 m, and between 5010 m and 3980 m. Contrary to the green 285
turtles, this specimen approached and departed the coast perpendicularly, which is 286
expressed in a negative selection of shallower areas. Finally, SST was also a significant 287
variable to CC. This specimen selected values under 22.4ºC, according to the SLI. 288
Surface currents and wind direction were also significant. 289
290
FIGURE 4 291
292
Discussion 293
Three turtles, of various and unknown origins, spent a long time in captivity, and were 294
finally brought to a rehabilitation centre in the South of Portugal, where their condition 295
was much improved. Considered fit to return to the ocean, they were released after 296
being tagged with satellite transmitters for an opportunistic study of their movements. It 297
was hoped that this effort would produce some insights concerning their preferences 298
and a notion about the survival chances of animals in such circumstances. All three 299
turtles were tracked for a significant time and showed non-random displacements that 300
interestingly brought the animals to traditional feeding regions of both species. The 301
extension of the post-release movements is remarkable (CC = 9709 km, CM1 = 3053 302

11
km and CM2 = 6806 km), but see Hays & Scott (2013) for context. It can be compared 303
to those in a previous study carried out in the Pacific (Luschi et al. 2003). 304
Interestingly, the final locations determined are close to known feeding grounds for both 305
species. Banc d’Arguin National Park (Fretey 2001; Godley et al. 2010) and the coast of 306
Ceará, Brazil (Marcovaldi & Marcovaldi 1999; Santos et al. 2011) for green turtles and 307
the Great Bahamas Bank, near the north coast of Cuba, for the loggerheads (Dodd & 308
Byles 2003). Having no detailed information on the pre-capture background of these 309
specimens, it is impossible to know to what extent any previous migration experience 310
was relevant (CC and CM1 were probably captured as adults, while CM2 was likely 311
collected as a juvenile). 312
The observed effect of bathymetry, which was significant to both C. mydas turtles, 313
might be explained by the extension of their path following the coast of Africa. These 314
coastal movements have been reported in previous works (such as Godley et al. 2002 315
and Troëng et al. 2005) and were considered an optimum strategy regarding feeding. So, 316
it can also be hypothesized that this option might maximize post-release food intake, by 317
moving along the coast and thus increasing the chance of finding food. 318
Geomagnetic variables (intensity, inclination and declination) were the most significant 319
variables explaining the use of space by the turtles. Studies with magnetically disturbed 320
sea turtles and with displaced animals (e.g. Luschi et al. 2007 and Benhamou et al. 321
2011) have supported the notion that sea turtles perceive the magnetic field and navigate 322
using this information. The ability of sea turtles to use geomagnetic inclination as an 323
approximation of latitude (Lohmann & Lohmann 1994) combined with the detection of 324
geomagnetic intensity (Lohmann & Lohmann 1996) might allow navigation with a bi-325
coordinate magnetic map as has been previously proposed and is considered to be 326
possible in some regions of the world (Putman et al. 2011 and Boström et al. 2012). 327
Additionally, as mentioned by Monzón-Argüello et al. (2009), juvenile loggerheads are 328
most frequently found in geomagnetic inclination isolines common to their natal 329
rookeries (between 34º and 46º). Given that CC selected a mean inclination of 37.013º, 330
we might presume that this was an important factor in path choice, although it is an 331
adult. Overall, our data support the notion of geomagnetic navigation abilities for these 332
animals. 333
SST was only significant to CC, which selected values between 20ºC and 22.4º C. The 334

12
initial portion of CC’s path is consistent with an avoidance of lower SST on the 335
northernmost part of the available area. Following this, CC’s path reveals a preference 336
for intermediate SST values, avoiding the warmer southern temperatures. This might be 337
due to other factors, namely the magnetic inclination. The values of the SST selected 338
are comparable to those found in previous works, such as 14.45 °C to 19.95 °C for 339
loggerheads in the Pacific (Kobayashi et al. 2008), 10.21ºC to 28.4ºC for juvenile 340
loggerheads in the South-western Atlantic (Barceló 2011) and 20.20ºC to 29.50ºC for 341
green turtles in the Gulf of California (McDermott et al. 2003). However it has been 342
reported that, in some areas, SST is a variable of minor importance in regard to the path 343
choice by green turtles (Hays et al. 2001). 344
Chlorophyll concentration did not have any significant effect on the path chosen by any 345
of the turtles. Nevertheless, the values of chlorophyll in the area used are similar to 346
those from previous studies, such as 0.458 ± 1.012 mg/m3 for juvenile loggerheads in 347
the South-western Atlantic (Barceló 2011) or between 0.11 mg/m3 and 0.31 mg/m
3 for 348
loggerheads, in the Pacific Ocean (Kobayashi et al. 2008). The lower mean chlorophyll 349
concentration in the area used by CC was probably due to the open ocean path chosen 350
by this specimen. The higher concentration in the area used by CM1 was due to the fact 351
that this turtle spent a considerable proportion of the time in an area with high 352
chlorophyll concentration, at the Banc d’Arguin National Park, Mauritania. 353
Current speed had no significant effect on the turtles’ paths, suggesting that neither of 354
the turtles used the current to assist their movement. This is expected since flow 355
direction assessment can be very difficult in the ocean (Chapman et al. 2011). Only the 356
specimen CC (which spent more time at the surface) was significantly affected by 357
surface current direction. Previous works had confirmed the relevance of ocean currents 358
to loggerheads (Bentivegna et al. 2007) and green turtles (Girard et al. 2006). A recent 359
review on the behaviour of animals in flows, whether air or water (Chapman et al. 2011) 360
has suggested that sea turtles follow a strategy of “Full Drift – Constant Compass 361
Orientation”, which means that sea turtles keep constantly heading towards their goal 362
regardless of the flow, resulting in some lateral displacement. In fact, at least for green 363
turtles, currents have a negative effect on navigation ability, as the turtles cannot 364
compensate the deflecting action of currents (Girard et al. 2006). 365
Surface wind speed and current speed had no significant effect on the paths. 366

13
Nevertheless, the direction of surface winds was considered significantly correlated 367
with the directions followed by CC and CM2. Given that sea turtles are air breathing 368
animals, and spend a portion of their time at the water surface, they might be subjected 369
to wind driven circulation of the water column, as well as wind drag on their carapace, 370
as also suggested by Watson & Granger (1998). 371
In the case of CC, the influence of surface currents and wind direction might be 372
explained by more frequent or extended surfacing periods, therefore with higher 373
exposure to surface winds and currents. This is supported by two sources of 374
information: our own observations (when at the rehabilitation centre this specimen spent 375
more time at the surface than the other two) and the number and quality of locations 376
received. CC had more location data (until transmissions stopped) and the locations 377
were more accurate, which was due to the more frequent presence of the transmitter at 378
the surface. 379
Rehabilitation of stranded or confiscated specimens is an important component of 380
conservation efforts, particularly in species that are facing conservation challenges, such 381
as climate change (Witt et al. 2010; Wallace et al. 2011 and Pike 2013), poaching 382
(eggs), fisheries bycatch, pollution and coastal urban development (Wallace et al. 2011). 383
Additionally, each adult is particularly valuable since few embryos survive to 384
adulthood, (approximately 1/1000 in loggerheads (Frazer 1986) and given that sexual 385
maturity is reached relatively late in life (42 to 44 years in green turtles and 23.5 to 29.3 386
years in loggerheads) (Goshe et al. 2010 and Casale et al. 2011). So, every 387
reproductively active adult is of major importance to the species’ conservation. 388
The main purpose of this study was to evaluate the ability of these sea turtles to survive 389
in the wild after long periods in captivity. Overall, we note that their return to the wild 390
was apparently successful, considering that these animals swam to known feeding areas 391
of their species. 392
The rehabilitation process does not end with the release of the individuals to their 393
natural habitat. Tracking the animals is both a way of obtaining information on their 394
movements and behaviour, and to monitor, at least temporarily, the success of the 395
rehabilitation effort. 396
Acknowledgements 397
The administration board of Zoomarine Portugal funded the spatial analysis, and Élio 398
14
Vicente was instrumental to this study in many ways. We are grateful to the Portuguese 399
Navy for the continuous collaboration in turtle release operations. We thank Michael 400
Coyne (seaturtle.org) for help in data collection, Paulo Relvas (CCMAR/FCT, 401
University of Algarve) for assistance in the interpretation and treatment of some 402
variables, and José Matos (Instituto Nacional de Investigação Agrária e Veterinária, 403
I.P.) for the very useful comments on the manuscript. 404
405
406
References 407
Agostinelli C. 2012. CircStats: Circular Statistics, from Topics in circular Statistics. 408
2001. R package version 0.2-4. http://CRAN.R-project.org/package=CircStats (accessed 409
28 March 2013). Computer program. 410
411
Argos 2011. Argos User’s Manual. http://www.argos-system.org (accessed 1 March 412
2013). 413
414
Barceló C. 2011. Movement Patterns and Marine Habitat Associations of Juvenile 415
Loggerhead Sea Turtles (Caretta caretta) in the Southwestern Atlantic Ocean. Master 416
of Science Thesis. Oregon State University, USA. 76 pages. 417
418
Benhamou S, Sudre J, Bourjea J, Ciccione S, De Santis A, Luschi P. 2011. The Role of 419
Geomagnetic Cues in Green Turtle Open Sea Navigation. PLoS 420
ONE 6(10): e26672. 11 pages. 421
422
Bentivegna F. 2001. Possibilities of reintegrating sea turtles kept in captivity to the 423
wild. Bulletin - Institut Oceanographique Monaco, numero special (1):373-378. 424
425
Bentivegna F, Valentino F, Falco P, Zambianchi E, Hoschscheid S. 2007. The 426
relationship between loggerhead turtle (Caretta caretta) movement patterns and 427
Mediterranean currents. Marine Biology 151:1606-1614 428
429
Bluvias JE. 2008. Marine Turtle Trauma Response Procedures: A Husbandry Manual. 430

15
Duke University, USA: Nicholas School of the Environment and Earth Sciences. 75 431
pages. 432
433
BODC, British Oceanographic Data Centre (2012). www.bodc.ac.uk (accessed 3 434
November 2012). 435
436
Bolten AB, Crowder LB, Dodd MG, MacPherson SL, Musick JA, Schroeder BA, et al. 437
2010. Quantifying multiple threats to endangered species: an example from loggerhead 438
sea turtles. Frontiers in Ecology and the Environment 9(5):295-301. 439
440
Bonjean F, Lagerloef GSE. 2002. Diagnostic Model and Analysis of the Surface 441
Currents in the Tropical Pacific Ocean, Journal of Physical Oceanography 32:2938–442
2954. 443
444
Boström JE, Åkesson S, Alerstam T. 2012. Where on earth can animals use a 445
geomagnetic bi-coordinate map for navigation? Ecography 35:1039-1047. 446
447
Broderick AC, Glen F, Godley BJ, Hays GC. 2003. Variation in reproductive output of 448
marine turtles. Journal of Experimental Marine Biology and Ecology 288(1):95-109. 449
450
Buskirk SW, Millspaugh JJ. 2006. Metrics for Studies of Resource Selection. Journal of 451
Wildlife Management 70(2):358-366. 452
453
Calenge C. 2006. The package adehabitat for the R software: a tool for the analysis of 454
space and habitat use by animals. Ecological Modelling 197: 516-519. 455
456
Cardona L, Fernández G, Revelles M, Aguilar A. 2012. Readaptation to the wild of 457
rehabilitated loggerhead sea turtles (Caretta caretta) assessed by satellite telemetry. 458
Aquatic Conservation: Marine and Freshwater Ecosystems 22:104–112. 459
460
Casale P, Conte N, Freggi D, Cioni C, Argano R. 2011. Age and growth determination 461
by skeletochronology in loggerhead sea turtles (Caretta caretta) from the Mediterranean 462

16
Sea. Scientia Marina 75(1):197-203. 463
464
Chapman JW, Klaassen RH, Drake VA, Fossette S, Hays GC, Metcalfe JD, et al. 2011. 465
Animal orientation strategies for movement in flows. Current Biology 21(20):R861-466
R870. 467
468
Collard SB, Ogren LH. 1990. Dispersal scenarios for pelagic post-hatchling sea turtle. 469
Bulletin of Marine Science 4701: 233-243 470
471
Coyne M, Godfrey M, Godley B, Lay K. 2008. Hard Shell Sea Turtle PTT Attachment 472
Protocol. p.8. http://www.seaturtle.org/documents/PTT_Attachment_Protocol.pdf 473
(accessed 26 March 2013). 474
475
Coyne MS, Goldley BJ. 2005. Satellite Tracking and Analysis Tool (STAT): an 476
integrated system for archiving, analyzing and mapping animal tracking data. Marine 477
Ecology Progress Series 301:1-7. 478
479
Dodd CK, Byles R. 2003. Post-nesting movements and behavior of loggerhead sea 480
turtles (Caretta caretta) departing from East-Central Florida nesting beaches. Chelonian 481
Conservation and Biology 4:530–536. 482
483
Donlan C, Wingfield DK, Crowder LB, Wilcox C. 2010. Using expert opinion surveys 484
to rank threats to endangered species: a case study with sea turtles. Conservation 485
Biology 24(6):1586-1595. 486
487
Epperly SP, Braun J, Chester AJ, Cross FA, Merriner JV, Tester PA, et al. 1996. Beach 488
strandings as an indicator of at-sea mortality of sea turtles. Bulletin of Marine Science 489
59(2):289-297. 490
491
Feck AD, Hamann M. 2003. Effect of sea turtle rehabilitation centres in Queensland, 492
Australia, on people’s perceptions of conservation. Endangered Species Research. 493
20:153-165. 494
17
Frazer NB. 1986. Survival from Egg to Adulthood in a Declining Population of 495
Loggerhead Turtles, Caretta caretta. Herpetologica 42(1):47-55. 496
497
Freitas C, Lydersen C, Fedak MA, Kovacs KM. 2008. A simple new algorithm to filter 498
marine mammal Argos locations. Marine Mammal Science 24(2):315-325. 499
500
Fretey J (2001) Biogeography and Conservation of Marine Turtles of the Atlantic Coast 501
of Africa/Biogéographie et conservation des tortues marines de la côte Atlantique de 502
l'Afrique. CMS Technical Series Publication No. 6, UNEP/CMS Secretariat, Bonn, 503
Germany. 504
505
GEBCO (2012). General Bathymetric Chart of the Oceans, Gridded bathymetry data. 506
http://www.gebco.net/data_and_products/gridded_bathymetry_data/ (accessed 1 507
February 2013). 508
509
Girard C, Sudre J, Benhamou S, Roos D, Luschi P. 2006. Homing in green turtles 510
Chelonia mydas: oceanic currents act as a constraint rather than as an information 511
source. Marine Ecology Progress Series 322:281-289. 512
513
Godley BJ, Barbosa C, Bruford M, Broderick AC, Catry P, Coyne MS, et al. 2010. 514
Unravelling migratory connectivity in marine turtles using multiple methods. Journal of 515
Applied Ecology 47:769-778. 516
517
Godley BJ, Blumenthal JM, Broderick AC, Coyne MS, Godfrey MH, Hawkes LA, et al. 518
2008. Satellite tracking of sea turtles: Where have we been and where do we go next. 519
Endangered Species Research 4(1-2):3-22. 520
521
Godley BJ, Richardson S, Broderick AC, Coyne MS, Glen F, Hays GC. 2002. Long-522
term satellite telemetry of the movements and habitat utilisation by green turtles in the 523
Mediterranean. Ecography 25:352-362. 524
525
Goshe LR, Avens L, Scharf FS, Southwood, A. 2010. Estimation of age at maturation 526
18
and growth of Atlantic green turtles (Chelonia mydas) using skeletochronology. Marine 527
Biology 157:1725-1740. 528
529
GSHHS, Global Self-consistent Hierarchical High-resolution Shoreline (2012). 530
http://www.ngdc.noaa.gov/mgg /shorelines/gshhs.html. (accessed 14 January 2013) 531
532
Hawkes LA, Broderick AC, Coyne MS, Godfrey MH, Godley BJ. 2007. Only some like 533
it hot - quantifying the environmental niche of the loggerhead sea turtle. Diversity and 534
Distributions 13:447–457. 535
536
Hays GC, Bradshaw CJA, James MC, Lovell P, Sims DW. 2007. Why do Argos 537
satellite tags deployed on marine animals stop transmitting? Journal of Experimental 538
Marine Biology and Ecology 349(1):52-60. 539
540
Hays GC, Dray M, Quaife, T, Smyth TJ, Mironnet NC, Luschi P, et al. 2001. 541
Movements of migrating green turtles in relation to AVHRR derived sea surface 542
temperature. International Journal of Remote Sensing 22 (8):1403-1411. 543
544
Hays GC, Scott R. 2013. Global patterns for upper ceilings on migration distance in sea 545
turtles and comparisons with fish, birds and mammals. Functional Ecology 27(3):748–546
756. 547
548
Hijmans RJ, van Etten J. 2012. raster: Geographic analysis and modeling with raster 549
data. R package version 2.0-12. http://CRAN.R-project.org/package=raster (accessed 28 550
March 2013). Computer program. 551
552
Hochscheid S, Bentivegna F, Hamza A, Hays GC. 2010. When surfacers do not dive: 553
multiple significance of extended surface times in marine turtle. Journal of 554
Experimental Biology 213:1328-1337. 555
556
Kobayashi DR, Polovina JJ, Parker DM, Kamezaki N, Cheng I, Uchida I, et al. 2008. 557
Pelagic habitat characterization of loggerhead sea turtles, Caretta caretta, in the North 558

19
Pacific Ocean (1997-2006): Insights from satellite tag tracking and remotely sensed 559
data. Journal of Experimental Marine Biology and Ecology 356: 96-114. 560
561
Lewin-Koh NJ, Bivand R, Pebesma EJ, Archer E, Baddeley A, Bibiko H, et al. 2012. 562
maptools: Tools for reading and handling spatial objects. R package version 0.8-20. 563
http://CRAN.R-project.org/package=maptools (accessed 28 March 2013) Computer 564
program. 565
566
Lohmann KJ, Lohmann CMF. 1994. Detection of magnetic inclination angle by sea 567
turtles: a possible mechanism for determining latitude. Journal of Experimental Biology 568
194:23-32. 569
570
Lohmann KJ, Lohmann CMF. 1996. Detection of magnetic field intensity by sea turtles. 571
Nature 380(7):59-61. 572
573
Lohmann KJ, Lohmann CMF, Ehrhart LM, Bagley DA, Swing T. 2004. Geomagnetic 574
map used in sea-turtle navigation. Nature 428:909-910. 575
576
Lohmann KJ, Lohmann CMF, Putman NF. 2007. Magnetic maps in animals: nature’s 577
GPS. The Journal of Experimental Biology 210:3697-3705. 578
579
Luschi P, Benhamou S, Girard C, Ciccione S, Roos D, Sudre J, et al. 2007. Marine 580
Turtles Use Geomagnetic Cues during Open-Sea Homing. Current Biology 17(2):126-581
133. 582
583
Luschi P, Hays GC, Del Seppia C, Marsh, R, Papi F. 1998. The navigational feats of 584
green sea turtles migrating from Ascension Island investigated by satellite telemetry. 585
Proceedings of the Royal Society of London B 265:2279-2284. 586
587
Luschi P, Hays GC, Papi F. 2003. A review of long-distance movements by marine 588
turtles, and the possible role of ocean current. Oikos 103:293–302. 589
590
20
Marcovaldi MA, Dei Marcovaldi GG. 1999. Marine turtles of Brazil: the history and 591
structure of Projeto TAMAR-IBAMA. Biological Conservation 91(1),35-41. 592
593
McDermott AJ, Seminoff J.A, Jones TT, Resendiz A. 2003. Food intake and retention 594
time in green turtles (Chelonia mydas) from the Gulf of California: preliminary 595
development of a digestive model. Proceedings of the Twenty-third Annual Symposium 596
on Sea Turtle Biology and Conservation. 17 to 21 March, 2003, Kuala Lumpur, 597
Malaysia: 17-20 598
599
Monzón-Argüello C, Rico C, Carreras C, Calabuig P, Marco A, López-Jurado LF. 2009. 600
Variation in spatial distribution of juvenile loggerhead turtles in the eastern Atlantic and 601
western Mediterranean Sea. Journal of Experimental Marine Biology and Ecology 602
373(2):79-86. 603
604
Moore M, Early G, Touhey K, Barco S, Gulland F, Wells R. 2007. Rehabilitation and 605
release of marine mammals in the United States: risks and benefits. Marine Mammal 606
Science 23:731–750. 607
608
OSCAR, Ocean Surface Current Analysis (2012). www.oscar.noaa.gov (accessed 5 609
November 2012). 610
611
Pike DA. 2013. Climate influences the global distribution of sea turtle nesting. Global 612
Ecology and Biogeography 22:555–566. 613
614
Polovina JJ, Howell E, Kobayashi, DR, Seki MP. 2001. The transition zone chlorophyll 615
front, a dynamic global feature defining migration and forage habitat for marine 616
resources. Progress in Oceanography 49:469–483. 617
618
Powell RA. 2000. Animal home range and territories and home range estimators. In: 619
Boitani L, Fuller TK, editors. Research Techniques in Animal Ecology. New York: 620
Columbia University Press, p 65-110. 621
622

21
Putman NF, Endres CS, Lohmann CMF, Lohmann KJ. 2011. Longitude perception and 623
bicoordinate magnetic maps in sea turtles. Current Biology 21(6):463-466. 624
625
Quantum GIS Development Team. 2013. Quantum GIS Geographic Information 626
System. Open Source Geospatial Foundation Project. http://qgis.osgeo.org. Computer 627
program. 628
629
R Core Team. 2012. R: A language and environment for statistical computing. R 630
Foundation for Statistical Computing, Vienna, Austria. ISBN 3-900051-07-0, 631
http://www.R-project.org. Computer program. 632
633
Santos AS, Almeida AP, Santos AJB, Gallo B; Giffoni B, Baptistotte C, et al. 2011. 634
Plano de Ação Nacional para Conservação das Tartarugas Marinhas. Série Espécies 635
Ameaçadas nº 25. Instituto Chico Mendes de Conservação da Biodiversidade, ICMbio. 636
(in Portuguese). 637
638
Sasso CE, Epperly SP. 2007. Survival of pelagic loggerhead turtles in the open ocean. 639
Journal of Wildlife Management 71:1830–1835. 640
641
Snoddy JE, Southwood A. 2010. Movements and post-release mortality of juvenile sea 642
turtles released from gillnets in the lower Cape Fear River, North Carolina, USA. 643
Endangered Species Research 12:235–247. 644
645
Strauss RE. 1979. Reliability estimates for Ivlev's electivity index, the forage ratio, and 646
a proposed linear index of food selection. Transactions of the American Fisheries 647
Society 108:344–352. 648
649
Swimmer Y, Arauz R, McCracken M, McNaughton L, Ballestero J, Musyl M, et al. 650
2006. Diving behavior and delayed mortality of olive ridley sea turtles Lepidochelys 651
olivacea after their release from longline fishing gear. Marine Ecology Progress Series 652
323:253–261. 653
654

22
Troëng S, Evans DR, Harrison E, Lagueux CJ. 2005. Migration of green turtles 655
Chelonia mydas from Tortuguero, Costa Rica. Marine Biology 148(2):435-447. 656
657
Wallace BP, DiMatteo AD, Bolten AB, Chaloupka MW, Hutchinson BJ, Abreu-658
Grobois FA, et al. 2011. Global Conservation Priorities for Marine Turtles. PLOS One, 659
6(9): e24510. 14 pages. 660
661
Watson KP, Granger RA. 1998. Hydrodynamic effect of a satellite transmitter on a 662
juvenile green turtle (Chelonia mydas). Journal of Experimental Biology 201:2497–663
2505. 664
665
Wessel P, Smith WHF. 1996. A global, self-consistent, hierarchical, high-resolution 666
shoreline database. Journal of Geophysical Research 101(B4):8741–8743. 667
668
Witt MJ, Hawkes LA, Godfrey MH, Godley BJ, Broderick AC. 2010. Predicting the 669
impacts of climate change on a globally distributed species: the case of the loggerhead 670
turtle. Journal of Experimental Biology 213:901-911. 671
672
673
674
675
676
677
678
679
680

23
Table 1 - Number of locations for each animal (% percentage) (CC – Caretta caretta; 681
CM1 and CM2 - Chelonia mydas) and error class: 3 (<250 m); 2 (250-500 m); 1 (500-682
1500 m); 0 (>1500 m); A (no error estimation, 3 uplinks); B (no error estimation, 1-2 683
uplinks) and Z (invalid locations). 684
Error Class CC (%) CM1 (%) CM2 (%)
3 659 (11,69) 57 (2,52) 295 (11,20)
2 1313 (23,28) 112 (4,96) 419 (15,91)
1 887 (15,73) 125 (5,53) 360 (13,67)
0 509 (9,03) 87 (3,85) 190 (7,21)
A 856 (15,18) 461 (20,41) 562 (21,34)
B 1367 (24,24) 1386 (61,35) 783 (29,73)
Z 48 (0,85) 31 (1,37) 25 (0,95)
685
686
687
688
689
690
691
692
693
694
695
696
697
698
24
Table 2 – Influence of environmental variables in the paths followed by CM1; Mean 699
(±SD); Range – range of values in the used area; coefficient of the Linear Model (LM); 700
Kolmogorov-Smirnov's D (KS-D); Circular correlation coefficient (corr - r); NS - non 701
significant relation; * - significant relation (p<0.05). 702
Variable Mean (±SD) Range Statistic
Significance LM KS-D corr – r
Bathymetry -986.919 m
(± 1328.181)
-4388.0 m to -
1.0 m - 0,588 - *
SST 21.691ºC (±
1.482)
17.61ºC to
27.05ºC - 0,500 - NS
Chlorophyll 2.498 mg m-3
(± 4.303)
0.0 mg m-3 to
56.110 mg m-
3
- 0,194 - NS
Inclination 31.671º (±
6.775)
16.93º to
46.12º - 0,628 - *
Declination -20.372º (±
0.081)
-20.54º to -
20.26º - 0,929 - *
Intensity 39757.960 nT
(± 1898.371)
36440 nT to
42440 nT - 0,714 - *
Current speed 0.100 ms-1 0.027 to 0.204
ms-1 0.025 - - NS
Current direction - - - - 0.061 NS
Surface wind
speed 5.267 ms-1
1.400 to 7.657
ms-1 -0.021 - - NS
Surface wind
direction - - - - 0.133 NS
703
704
705
706
707
708
709
710
711
712

25
Table 3 – Influence of environmental variables in the paths followed by CM2; Mean 713
(±SD); Range – range of values in the used area; coefficient of the Linear Model (LM); 714
Kolmogorov-Smirnov's D (KS-D); Circular correlation coefficient (corr - r); NS - non 715
significant relation; * - significant relation (p<0.05). 716
Variable Mean (±SD) Range Statistic
Significance LM KS-D corr – r
Bathymetry -2988.544 m
(± 1656.854)
-5612 m to -2
m - 0,424 - *
SST 25.185ºC (±
2.894)
19.46ºC to
30.20ºC - 0,200 - NS
Chlorophyll 0.455 mg m-3
(± 1.060)
0.0 mg m-3
to 12.850 mg
m-3
- 0,095 - NS
Inclination 8.829º (±
17.960)
-15.770º to
46.280º - 0,293 - *
Declination -20.586º (±
0.205)
-21.24º to -
20.05º - 0,462 - NS
Intensity 34741.95 nT
(± 3939.630)
27300 nT to
42980 nT - 0,293 - *
Current speed 0.114 ms-1 0.026 to
0.392 ms-1 -0.207 - - NS
Current direction - - - - 0.012 NS
Surface wind
speed 6.170 ms-1
4.394 to
8.118 ms-1 -0.045 - - NS
Surface wind
direction - - - - 0.134 *
717
718
719
720
721
722
723
724

26
Table 4 – Influence of environmental variables in the paths followed by CC; Mean 725
(±SD); Range – range of values in the used area; coefficient of the Linear Model (LM); 726
Kolmogorov-Smirnov's D (KS-D); Circular correlation coefficient (corr - r); NS - non 727
significant relation; * - significant relation (p<0.05). 728
Variable Mean (±SD) Range Statistic
Significance LM KS-D corr – r
Bathymetry -4679.162 m
(± 1052.146)
-6539 m to -2
m - 0,382 - *
SST 24.141ºC (±
3.267)
19.09ºC to
30.75ºC - 0,391 - *
Chlorophyll 0.063 mg m-3
(± 0.037)
0.0 mg m-3 to
0.427 mg m-3 - 0,333 - NS
Inclination 37.013º (±
3.331)
31.35º to
48.69º - 0,775 - *
Declination -19.674º (±
0.912)
-20.36º to -
16.84º - 0,325 - *
Intensity 40087.49 nT
(± 1146.686)
38090 nT to
42790 nT - 0,436 - *
Current speed 0.080 ms-1 0.006 to 0.328
ms-1 -0.138 - - NS
Current direction - - - - 0.328 *
Surface wind
speed 6.748 ms-1
4.564 to 8.605
ms-1 0.011 - - NS
Surface wind
direction - - - - 0.094 *
729
730
731
732
733
734
735
736

27
Figure 1 - Track of the three specimens followed in this study. 737
738
739
740
741
742
743
744
745
746
747
748
749
750
751
752
753
754
28
Figure 2 – Monthly number of locations for each turtle. CC , CM1 and CM2. 755
756
757
758
759
760
761
762
763
764
765
766
767
768
769
770
771
772

29
Figure 3 - Strauss' Linear Index for the significant variables. 773
774
775
30
Figure 4 - Geomagnetic Field (A) Inclination, (B) Intensity and (C) Declination (World 776
Magnetic Model for 2010/2015). 777
778
Copyright © 2022 FDOKUMEN