


A STUDY OF PROLONGED FASTING - Forgotten Books
427
-
Upload
khangminh22 -
Category
Documents
-
view
1 -
download
0
Transcript of A STUDY OF PROLONGED FASTING - Forgotten Books


A STUDY OF PROLONGED FASTING
GANO BENEDICT
WASHINGTON, D. C .
PUBLISHED BY THE CARNEGIE INSTITUTION OF
1915

PREFACE.
The research reported in this book on the metabolism during prolonged fasting is a continuation and amplification of the investigations reported in “
The influence of inanition on metabolism”(Carnegie
Institution of Washington Publication No . 77,
The opportunity to conduct this series of scientific observations on aman living for 31 days without food and drinking only distilled waterwould have been of little value without the cooperation of a largenumber of scientific associates and computers . Certain cO-workerskindly assumed the responsibility not only for the accumulation of thedata but also for the preparation of a report of their respective findings .In this book special reports are made by Dr. H . W. Goodall on the
physical condition of the subject during the fast,his subjective impres
sions andmental attitude toward the fast,and the microscopy of the
urine and the tests for albumin ; by Dr . J . E . Ash on the blood ; by Dr .H . S . Langfeld on the psycho-physiology of the fast ; byDr. A. I . Kendallon bacterial intestinal flora ; and by Mr. H . L. Higgins on alveolar air .Aside from those who shared directly in the responsibility of the
studies , I am indebted to numerous scientific authorities for counsel andadvice , both during the experiment and during the preparation of thematerial for publication. Those not specifically mentioned in the textare Professors Luciani of Rome, Fano of Florence, Zuntz of Berlin,Tangl of Budapest, Tigerstedt OfHelsingfors , and Lusk ofNewYork .
Inno undertaking of theNutrition Laboratory have the concentrationand the unification of resources and assistants been so intensely appliedand to the whole staff of the Laboratory my warmest thanks are due.
Their interest and conscientious,painstaking work alone made sure
the col lection of the data reported in the following pages . The laborof the final preparation of the material has fallen in no small part intothe excellent hands of my editorial associates
,Mr . W. H . Leslie and
Miss A . N . Darling .
NUTR ITION LABORATORY OF THE CARNEGIE INsTITUTION OF WASHINGTON,
Boston, Ma88 . , July 29 , 1914 .
3


CONTENTS .
Previous observations of prolonged fastsObservations on Succi
General characteristics of subject
Program for research
Summary as to physical condition .
Analysis of losses in body-weigh t .
Insensible perspirationDrinking water
Observations of th e body-temperature in th e nigh t period
Records of pulse-rate obtained in the experiment with subject L .
Comparison of pulse records Obtained in experim ents with the bed calori
Influence Of the work Of writing
Observations on L 's blood
Method of calcu lating the to tal ventilation of the lungsMethod o f calculating the vo lume per inspirationResults of observations on the m echanics o f respiration
Respiration-rate
Ventilation Of the lungs per m inute

6 A STUDY OF PROLONGED FASTING .
PAGE .
Research on metabo lism in pro longed fasting at th e Nutrition Labo ratory— Continued .
Mechanics of respiration— C ontinued .
Results of observations on th e mechani cs of respiration— Continued .
Influence of changes in body position .
Influence of th e work of writingInfluence Of breath ing an oxygen-rich atmosphere
Alveo lar airSignificance of alveo lar airMethods of determ ining the alveo lar airHaldane methodPlesch methodMethod of calculating alveo lar air from respiration experiments
Conditions of taking alveo lar-air samplesDiscussion of results
S ize of dead space in fastingDifl
'
erence in mechani cs of respiration in morning and eveningS ignificance Of change in the alveo lar air during th e fast
ConclusionsSubjective impressions and mental attitude toward th e fast
Subjective impressions .
Mental attitude Of the subj ect toward the fast
Rote memory for digits
Later tests
General summary and conclusions
Observations upon the bacterial intestinal flora of a starving man
General routine of co llection and samplingCompo sition of the urine prior to th e fasting exper im ent
Total so lidsDay and nigh t urines
Comparison Of to tal nitrogen excretion of L . with that of other fastingsubjects
Nitrogen excretion per kilogram of body-weigh t .
Comparison of methods for determining to tal nitrogen and ammonianitrogen .

CONTENTS . 7
Research on metabo lism in pro longed fasting at the Nutrition Laboratory— Continued . m en .
Chem ical constituents of fast ing urine— Continued.
fi-Oxybutyric acidMineral metabo lism .
Reducing powerCarbon in urineCarbon-nitrogen ratio
Calorie-nitrogen ratioCalorie-carbon ratio .
Absorption of water-vapor and carbon dioxideAnalysis of cham ber air at the end of periods
Graph ic registration of degree ofmuscular repose of subject inside th e respiration calorimeter
Methods used ih experiments with the respiration apparatus.
Studies with the bed calorimeter
Atmospheric conditions inside the chamberMeasurement of th e respiratory exchange inside the bed calorimeter
Variations in the metabo lism as th e fast progressedRelationship between th e pulse-rate and th e metabo lismDiurnal variations in metabo lismExternal influences upon metabo lism
Effect of changes in body position .
Influence of the work of writing .
Metabo lism per kilogram of body-weight in calorimeter experiments .
Metabo lism per kilogram of body-weigh t in respiration-apparatus ex
Conclusions regarding the metabo lism per kilogram of body-weight
Metabolism per square meter of body-surface in the calorimeter experi
Metabo lism per square meter of body-surface in th e respiration-appa
Conclusions regarding th e metabo lism per square meter of body-surfaceSummary of results regarding th e metabo lism per kilogram of body-weight
and per square meter of body-surface
Direct calorimetryIndirect calorimetry .
Balance of income and outgo
Total carbon-d ioxide production and oxy gen consumption per 24 hours .

8 A STUDY OF PROLONGED FASTING .
Research on metabo lism in pro longed fasting at the Nutrition Labo ratory— C ontinued.
Balance of income and outgo — C ontinued .
Apportionment of ace-pro te in katabo lism between carbohydrate and fat .
Carbon dioxide produced and oxygen consum ed in the katabo lism of
Energy derived from katabo lism o f carbohydrate and fat

Plate 1 .
Plate 2 .
Plate 3 .
Plate 4 .
Plate 5 .
8 .
9 .
10 .
1 1 .
12 .
13 .
15 .
16 .
17 .
18 .
19 .
20 .
21 .
22 .
23 .
24 .
25 .
26 .
27 .
28 .
29 .
30 .
3 1 .
32 .
33 .
34 .
35 .
36 .
37 .
38 .
3 9 .
ILLUSTRAT IONS .
A . Characteristic pose of L . , sitting in th e balcony , during the day , writing at
hisdesk. B. Use of universal resp iration apparatus for studying the respiratory exchange while writing
C. Respiration experiment made by T . M. Carpenter on the universal respirationapparatus. D. Weighing the subject on the thirty-first day Of th e fast .
E . Th e subject L . ascending the stairs Of the balcony on th e th irty-first day of
the fast. F. Clinical examination by Dr. H . W . GoodallViews of subject Levanzin on first day Of 31-day fastViews of subject Levanzin on last day Of 3 1-day fast
1 . Body-weigh t curves for fasting experiments wi th Succi .2 . Body-weight curve for L evanzin3 . Body-weigh t curves for pro longed fasting experim ents with dogs4 .
5
6
7
Body-temperature curves during the nigh t and early m orning for the second andfourth to eigh th days of fastBody-temperature curves during the nigh t and early morning for th e ninth to thesixteenth days of fastBody-temperature curves during the nigh t and early morning fer th e seventeenthto twenty-second days of fast “
Body-tem perature curves during the nigh t and early morning fOr twenty-third totwenty-ninth days of fastBody-temperature curves during the nigh t and early m orning for th irtieth andthirty-first days Of fast and second and th ird days with foodBody-tem perature curves for approximately 24 hours on twenty-fourth and
Body-temperature curves showing change from lying to sitting position .
Body-temmrature curve sh owing change from lying to sitting positionPulse-rate chart of subject L for days preceding fastPulse-rate chart Of subj ect L . for first to fifth days of fastPulse-rate chart Of subject L . for sixth to eleventh days Of fastPulse-rate chart of subj ect L . for twelfth to eigh teenth days of fastPulse-rate chart of subject L . for nineteenth to twenty-fifth days of fastFume-rate chart of subject L . for twenty-sixth to th irtieth days o f fast .
Pulse-rate chart Of subj ect L for thirty-first day of fast and three subsequentdays with food .
Chart showing blood pressure , pulse pressure , and pulse-rate of subject LChart I . Relation of haemo globin to erythrocytes. Chart II . Compo site curve ofthe polynuclears compared with one of mononuclearsCharts III and IV . Relation of to tal to difl'
erential leuco cyte countsSpecimen respiration curves for subject L . wh en lying on couch in experiments
with the respiration apparatusMemory testsTapping testsS trength tests
Strength testsStrength testsTactual-space thresho ld and visual acuityFree association testsAsso ciation tests. Reactions to verbs and nouns
Association tests. Reactions to adjectivesAsso ciation tests. Reactions to abstract nounsReproduction tests and mean variationsContro lled asso ciation tests .
Cancellation testsSpecimen records of change in vo lume of the spirometer on the bed calorim eter
during last 5 m inutes of periods in experiment with L .
Method for Obtaining graph ic record Of activity in bed calorim eter .
Specimen pneumograph records of movements o f bed calorim eter lever mattress
suppo rt in night experiments with LSchematic outline of universal respiration apparatus
PAGE

10 A STUDY OF PROLONGED FASTING .
Spirometer for studying th e mechani cs Of ventilation. Curves sh owing oxygen consumption , carbon-dioxide production , and respiratoryquotient dur ing nigh t periods In th e bed calorimeter for th e four days precedingthe fast and the first to th e fourth days Of th e fast
42 . Curves showing oxygen consum ption, carbon-dioxide production. and respiratoryquotient during night periods in th e bed calorimeter for th e fifth to the fifteenthdays of th e fast
43 . Curves showing oxygen consumption , carbon-dioxide producti on, and respiratoryquotient during nigh t periods In the bed calorimeter for th e sixteenth to thetwenty-fourth days of th e fast
44 . Curves sh owing oxygen consumption. carbon-diOxide production. and respiratoryquotient during nigh t periods In th e bed calorim eter for the twenty-fifth to th ethirty-first days Of th e fast and the second and third food daysComplete metabo lism chart Of fasting dog (Awrorow No . 2)Complete metabo lism chart of fasting dog (Awrorow NO . 3)Metabo lism chart of th e most immrtant factors measured on subject L . through
out the fast .

FASTING P LATE 1
A . Characteristic pose o f L . sitting in the Balcony, during the day. writing at his desk.
8 . Use o fUniversal Respiratio n Apparatus fo r studying the Respirato ry Exchange while writing.

INTRODUCTION.
Prolonged fasting has formed a part of religious ceremony for centuries . In early times the ascetic
,in his efforts to subdue all carnal
desires,believed it necessary to withdraw from the distractions of daily
life and to abstain either wholly or in part from food, particularly theflesh of animals ; by thus refraining from material things , he hoped tobe free for spiritual thought and philosophical introspection.
Periodic fasting still constitutes a part of the rites of some religiousbodies
,particularly among the Hebrews , but in modern times a pro
longed fast is usually undertaken either in the hOpe of curing or alleviating some ailment or for pecuniary gain . When a fast is resortedto for its supposed therapeutic value, information as to its history andresults usually appears in one of the numerous books published by theadvocates of peculiar dietetic regimes. When a fast is made by aso—called “ professional faster ” for pecuniary gain, the subject is exhibited to the public as an attraction to the lovers of sensational amusements . Three decades ago such exhibitions were not uncommon andin many instances the subjects consented (possibly in the hope ofincreasing the interest in their performance) to more or less strictlycontrolled observations of their fasts . Not infrequently the observations made in these professional fasting exhibitions have contributedmaterially to the sum of human knowledge
,since there is an intense
physiological interest in the vital processes during such prolongedabstinence from food .
When one considers the complex activities which make up the life ofman
,it will be seen that no mechanism thus far invented approximates
the high organization of the vital processes which are necessary to thelife of even the simplest of the warm-blooded animals ; andyet sufficientexperimental evidence has been accumulated to show that under normalconditions of life
,and with similar routine
,there are no marked vari
ations in the life processes of normal individuals . Under varyingconditions of life
,however
,we find that the vital activities are carried
on with a greater or less intensity , this being true even of the normalindividual . We thus see that there may be definite, well-establishedplanes of vital activity. For example
,when the average healthy indi
vidual is lying in bedasleep,there is no intellectual activity andno exter
nalmuscular activity,the vital activity being only sufficient for S imple
maintenance . When he is lying quietly in bed awake,the plane of
vital activity is higher,and as we study the metabolism under the vary
ing conditions of sitting , standing, walking, and doing muscular work ,we find an increasing intensity in the vital processes
,with an increase
in productive capacity and often an increase in efficiency .

12 A STUDY OF PROLONGED FASTING .
The average normal man represents the mean between the twoextremes of the emaciated
,half-starved individual , disinclined to phys
ical or mental work , and the over-fed, obese epicure,both extremes
being relatively low in vital activity and in productivity . Furthermore
,if we consider the metabolism under pathological conditions
,we
find even greater variations in the different levels Of vital activity.
Thus a sick person, much emaciated,lying in bed without food
,and
with subnormal temperature , has unquestionably a low cellular activity.
On the other hand,a sick person with a high fever
,even when asleep
andwithout extraneous muscular activity,may have a greatly increased
cellular activity . It will be seen,therefore
,that from the standpoint
o f both normal physiology and pathology,a study of human individuals
under different conditions and with different planes of activity is offundamental importance .
For such study it is essential to determine the basal or fundamentalmetabolism, when the activities are on a low plane , to be used as a basisOf comparison with other values . We may ask
,then,
“ What is thelowest plane of vital activity which is compatible with life?” Unquestionably there have been severe pathological cases , with emaciation andmuscular atrophy
,in which life has been maintained at a plane far
below that which can be reached by the average normal man,but it has
been the prime Object of most investigators in metabolism to coneentrate their efforts Upon securing , with normal individuals , physiologicalvalues which may wi thst criticism
,since these constitute the only
true basis of compari son.
Taking into consideration the influence uponmetabolism of muscularactivity
,of the ingestion of food , and the state of being awake, we may
assert that the lowest metabolic plane would be found for an individualduring deep sleep in bed
,with complete muscular repose , and without
food in the alimentary tract . As a matter of fact,with most people
such a condition is usually closely approximated each day about 4 a . m.
While in general no food is taken by an individual for about 10 or 12hours during the night
, yet for a considerable period of time after theevening meal nutrients are being absorbed from the ingested food materials and carried to different parts of the body, there to be oxidized ordeposited . It is furthermore true that certain molecular fragments ,probably acid in nature
,maybe absorbed from the food materials which,
when carried to the various parts of the body, may actually stimulatemetabolism to a greater intensity, these being the so-called katabolicstimuli . Usually the influence of the ingestion of food ceases from6 to 8 or 10 hours after the meal , particularly if the food ingested is notprotein-rich . Accordingly, for one or two hours prior to rising in themorning the normal man is probably living at his lowest metabolicplane.

PREV IOUS OBSERVATIONS OF‘
PROLONGED FASTS . 13
As is well known , the normal body is liberally provided with reservematerial
,a fac t which has been strikingly brought out and emphasized
by Meltzer.1 Consequently there is always a plethora of availablematerial stored in the body for drafts in emergencies . In the normallife of man
,the demands for nutrition are usually met by periodic
feeding . When the demands are not met,body reserves must be drawn
upon. Under such conditions it is Of particular interest to note whatkind of body-material is first used , the rapidity of its depletion,
and the
proportions of the various body constituents disintegrated as the draftscontinue . It is to study these problems that Observations are madeupon fasting individuals . Furthermore
,since many prominent clin
icians are inclined to consider disease as closely allied to the variousstages of inanition
,data secured in a study of metabolism during fasting
have a great pathological importance for interpreting the transformations of matter in disease .
PREVIOUS OBSERVATIONS OF PROLONGED FASTS.
The literature giving the results of observations during fasts has beenreviewed at some length in a previous publication,
2 special emphasisbeing laid upon the results Obtained in the earlier stages of a fast . In
this publication it seems desirable to give a review of the longer fastswhich have been more or less scientifically controlled andwhose resultscan be considered as worthy of careful consideration .
The longer fasts have almost without exception been made by professional fasters who , for purposes of exh ibition,
have purposed goingwithout food for a definite length Of time . While such a purpose wouldof itself seem to Show an abnormal mental condition
, yet the majorityof professional fasters who have been used in these experiments are forthe most part physically strong , and the results may usually be lookedupon as of physiological importance
,not comp licated by pathological
lesions of any measurable magnitude . This is particularly fortunate ,asmany fasts reported in the daily press are undertaken as a therapeuticmeasure to overcome some more or less definitely localized r organic
or functional trouble . It is Obvious, however, that such experimentsare of physiological importance when the subjects are normal individuals, voluntarily fasting under strict scientific control .Many professional fasters havemade experiments Of longer or shorter
duration and have been studied by various investigators,but none have
been so carefully studied and had so many experiments made withthem and of such long duration as the Italian
, Succi . Indeed, theclassical work of Luciani on Succi emphasized perhaps more than any
lMeltaer, The Factors of Safety in Animal Structure and Animal Economy. Harvey So cietyLectures, New York. N . Y 1906 —1907 , p . 139 .
2Benedict, Carnegie Inst. Wash . Pub. No . 77 , 1907 .

14 A STUDY OF PROLONGED FASTING .
other piece of research the importance Of studying prolonged fasting .
In this review of the literature on long fasts,therefore, brief descriptions
of the fasts made by subjects other than Succi will first be given chronologically, these being followed by descriptions of experiments madewith the Italian subject . Such discussion of the results as may benecessary will be reserved for later chapters .Observations by Paton and S tockman.
1— An experiment was made inthe fall of 1888 by Paton and Stockman on the professional fasterJacques and continued for 30 days . The body~ weight was recorded
,
but unfortunately the urine was analyzed by the old hypobromitemethod . Furthermore
,the values for total nitrogen output were un
doubtedly disturbed by the singular fact that the subject drank from60 to 300 c c . of his own urine each day. Since the volume of fluidtaken per day varied greatly, the body-weight fluctuated considerably,actual gains in weight be ing Shown on some days . No feces werepassed during the fast .Observations by Lehmann,
Mueller, Munk,Senator, and Zuntz ?
Although this research was hardly long enough to be called a study ofprolonged fasting
,the two experiments made by Lehmann , Mueller,
Munk , Senator, and Zuntz , one on Cetti of 10 days and one on Breithaupt of 6 days
,present a study of metabolism during fasting which
has never been excelled in accuracy for this length of time. The
experimental plan adopted in this research has been followed with butminor changes by practically all succeeding investigators . It was theintention to continue the experiments with these subjects for 20or 30 days
,but they were unavoidably shortened , owing to the condi
tion of the subjects . The experiment on Cetti was made in March1887 , and the observations secured in this experiment were of suchimportance that the experimenters took advantage of an opportunityoccurring in March 1888 to make an experiment with the professionalfaster Breithaupt . Unfortunately this experiment continued onlysix days . Observations were made in both experiments of the bodyfunctions
,body measurements, pulse-rate , urine, feces, and respiratory
exchange, and the computations and conclusions are of fundamental
Mportance. They will be continually referred to in connection withthis report .Observations by vanHoogenhuyze andVerploegh .
3 — In a study made ofthe urine excreted by a professional fasting woman, van Hoogenhuyze
and Verploegh gave especial attention to the creatinine content . The
experiment began on June 1 1 , 1905 , and ended June 25, 1905 ; the
lPaton and Sto ckman , Proc . Royal Soc . of Edinburgh , 1888—1889 , 16, p . 121 .
2Lehmann , Mueller , Munk , Senato r, and Zuntz , Archiv f . path . Anat. u . Physio l . u. f. khn.
Med. ,1893 , 131 , Supp . , p . 1 .
‘Van Hoogenhuyze and Verploegh , Zeitschr. f. physi ol . Chem . , 1905 , 46 , p . 4 15 .

16 A STUDY OF PROLONGED FASTING .
the experiment of Grafe1 with the Jaquet respiration apparatus2 at the
Medical C l inic in Heidelberg is of interest in throwing light upon thegaseous exchange and the character of the katabolism during prolongedinanition and on the ratio of carbon to nitrogen in fasting urine . Furthermore
, it substantiated the observations made by Brugsch and
others on the acidosis during fasting,as indicated by the excretion of
acetone and 6-oxybutyric acid .
Observations at Wesleyan University,Middletown,Connecticut — With
a special view to studying the drafts upon body-material during fastsof 24 to 168 hours , a lengthy series of experiments was undertaken atWesleyan University, Middletown, Connecticut , the results of whichhave already been published .
3 These experiments threw much lightupon the character of the drafts upon body-material during the experimental periods and showed that the organism and particularly thestorage of glycogen in the body may be greatly affected by even ashort fast . It has furthermore been shown that glycogen— the bodymaterial which is first andmost heavily drawnuponduring fasting— maybe considered as one of the most quickly realizable assets , the removalof which affects profoundly one Of the safety factors of the human body .
OBSERVATIONS ON SUCCI.
Fast in Florence, 1888 .
— Although a short account of the experimenton Getti made by Lehmann,
Mueller,Munk
, Senator, and Zuntz waspublished in 1887 ,
4 the details Of their investigation did not appearuntil and the first extensive report of a pro longed fasting investi
gation was that made by Luciani of the fasting experiment with Succiin Florence during the spring Of 1888 . The Italian report of this fastwas published in but the work is best known to other thanItalian readers by Fraenkel ’s translation .
7
Luciani’s study of Succi included an extensive series of observations .
Unfortunately, since the partition of the nitrogen in the urine was atthat time imperfectly understood and as the gaseous exchange wasstudied under conditions affecting seriously the accuracy of the results,Luciani
’s Observations are more especial ly of value as indications of
the general body functions of a fasting man than as measurements of1Grafe , Zeitschr. f. physio l. Chem 1910 , 65 , p. 21 .
2G‘
reh eimrat W . His , on a recent visit to the Nutrition Laboratory, informed us that a fastingexperim ent with a professional faster, a woman , continuing 4 weeks, had been carried out not
long before in his clinic in Berlin by Professo r Staeh elin, in which the Jaquet respiration apparatushad been used . Owing to the indisposition Of the subj ect, the experiment was less successfulthan had been h oped , and Pro fessor Staehelin’
s removal to Basel has indefinitely postponed th epublication of the results.
x‘Benedict, Carnegie Inst . Wash . Pub. NO . 77 , 1907 .
4Lehmann , Mueller, Munk , Senator, and Zun tz , Berliner klin. Woch 1887 , pp . 290 and 4 25 .
lsL ehmann , Mue ller, Munk , Senator, and Zuntz , Arch iv f . path . Anat. u. Physio l. u. f. klin.
Med. , 1893 , 131 , Supp. , p . 1 .
“Luciani , Fisio logia del digiuno ; studi sull' uomo . Florence , 1889 .
7Luciani , Das Hungern . Translation by M. C . Fraenkel . Hamburg and Leipsic, 1890 .

PREV IOUS OBSERVATIONS OF PROLONGED FASTS . 17
Specific chemical transformations . Succi’s peculiar psychical condi
tion,a condition which seems to be characteristic of the ascetic who
sub jects himself to a fast of 30 days or more, is interestingly commentedupon in extenso by Luciani . The research as a whole was a model inplan
,and as a painstaking record of Oooperative research in fasting it is
equaled only by the experiments of the Berlin investigators . Luciani’s
study unquestionably stimulated the considerable number of experiments subsequently carried out with Succi , at least 7 experiments , eachcontinuing 20 or more days , being made with him by different investigato
’
rs and in different places .Fasts in Milan and Paris, 1886 .
— In reporting the results of theFlorence fast, Luciani refers to two fasts said by Succi to have beenmade previously, one in Milan in August and September 1886, and asecond in Paris in the latter part of November and the early part ofDecember 1886 . The Short time between the fasts is of Special interest .Little is known regarding these two fasts , but Luciani considered therecords of the body-weights Obtained from Succi’snotebooks sufficientlyreliab le to include in the published report of his research and he plottedcurves from them Showing the loss in body-weight during the fasts .Fast in London, 1890 .
— In 1890 Succi carried out a 40-day fast inLondon
,which began on March 17 .
1 Although Observations weremade of a number of factors during this fast , the controls were soincomp lete that , aside from the body-weight , the observations have butlittle value at the present time . The body-weights were apparentlyrecorded with a great degree of accuracy and form the basis of a curvewhich will be discussed later . No statements accompanied the recordsof the pu lse and respiration as to whether the subject was lying
,Sitting
,
or standing,so that they can have but little Significance ; fluctuations
in the pulse-rate give evidence of marked changes in the muscularactivity at times . Strength tests were made with a hand dynamometereach day
,showing practically no alteration in the strength . The
axil lary records . Of the body- temperature indicate a lowering of thetemperature toward the end of the fast .Fast in New York
,1890 .
— According to Succi’s own statements,
substantiated by newspaper reports,Succi carried out a large number
of fasts which were not scientifically controlled . One of the mostimportant of these wasmade in New York City about 8 months afterthe London fast .2 The New York fast began on November 6
,1890,
andwas said to have continued 45 days . Correspondence with severalof the physicians who attended this fast shows a diversity Of opinion asto its authenticity. On the other hand
,the body-weights recorded , if
correct , indicate about the usual loss inweight , the records beinglBritish Med. Journ. , 1890, pp. 764 , 819 , 876 , 935 , 996 , and 1056 , also p . 14 44 .
2The New York Daily Tribune, November 6 , 1890 , and December 21 , 1890 .

18 A STUDY OF PROLONGED FASTING .
pounds kilograms) at the beginning of the fast and poundskilograms) at the end.
Fast in Naples, 1892.
— The next scientifi cally control led fast withSucci was in Nap les
, beginning-August Observations were
made by Ajello and Solaro,
1,most of these b eing on the urine . The
body-weight was likewise careft recorded as the fast progressed,as
well as the amounts of water taken . The determinations made on theurine which are of interest at this time are those of the chlorine and
phosphoric and sulphuric acids . On the second day of the fast,2
grams of feces were passed and on the eleventh day, 317 grams .
Fast in Rome,1893 .
— A number of Observations were made on Succiby Dutto and Lo-Monaco2 during a 20-day fast in Rome beginningDecember 16 , 1893 . The body-weight was recorded each day
,also
the amount of water taken . An alyses were made of the urine excreted,
these being much mOre complete than in any of the earlier fasts , as thenitrogen was determined by the Kjeldahl method . Determinationswere also made of the acidity of the urine and the content of sulphur,ethereal sulphates , neutral sulphur , chlorine , phosphorus , sodium,
and
potassium .
Fast in Vienna ,1896 .
-The urine excreted by Succi in a 21-day fastwas studied by E . and O . Freund3 in Vienna in 1896
,an extensive
partition of the nitrogen being attempted for the first time. The
observations as to Succi’s condition,including the body-weight
,were
unfortunately lost .Fast in Zurich, 1896 .
-During a 21-day fast of Succi in Zurich,
beginning September 13 , 1896 , Daiber“ studied the urine and obtained
the body-weight . The body-temperature,the amount of water taken
,
and the chlorides in the urine were al l determined with sufficient accuracy to make them of value at the present day.
Fast in Hamburg, 1904 .
— The last recorded experiment on Succi wasmade in Hamburg in March 1904 . During the last 10 days of th is30-day fast , the urine was examined by Brugsch,
5 who determined thepartition of the nitrogen. Special emphasis was laid upon the acidosis .
lAjello and Solaro , La Riforma Medica, 1893 , 2 , p . 54 2.
2Dutto and Lo-Monaco , PolIclinico , 1895 ,2, p . 1 .
3E . and O . Freund , Wiener klin. Rundschau , 1901 , 15 , pp . 69 and 91 .
‘Daiber. Schweiz . Wo ch . f. Ch em . 11 . Pharm . , 1896 , 34 , p . 395 .
5Brugsch , Zeitschr . f. exp. Path . 11 . Therapie , 1905 , 1 , p . 4 19 .

FASTING PLATE 2
C. Respiration experiment made by T. M. Carpenter, on the Universal Respiration Apparatus.
These experiments were made each mo rning, just after the Subject left the Respiration Calorimeter, and before he sto od up.
D. Weighing the Sub'
eet on the Thirty-first day o f the Fast. At the right asshown the Bed on
which he has just rushed the Respiration EXpenment ; the Universal Respiration Apparatusis shown at the extreme right.


RESEARCH ON METABOLISM IN PROLONGED FASTING AT
THE NUTRITION LABORATORY.
PROBLEMS TO BE STUDIED.
In the research on metabolism during short fasting periods, whichwas carried out at Wesleyan University
,Middletown, Connecticut , the
changes incidental to the first days of fasting were , it is believed , ade
quately studied . On the other hand , it was desirable to supplement theearlier observations by a study of the metabolism during prolongedfasting
,since many points regarding the course of the metabolism
after the body had adjusted itself to the fasting condition had not beenestablished . For instance, as the fast progresses it is important toknow whether the gross metabolism alters either per kilogram of bodyweight or per square meter of body-surface, also Whether the acidosisis extreme or whether there is an acquired tolerance of it , and whateffect the acidosis
,if present
,has upon the metabolism . Since the
carbon,the ammonia
,and the heat of combustion of the urine, also
the composition of the alveolar air,give indications as to acidosis
,a
study of prolonged fasting should include determinations of all of thesefactors . In the earlier fasting study determinations were made of anumber of the constituents of the urine
,including total solids, nitrogen,
creatine and creatinine,phosphorus
,sulphur
, and chlorine . In the
longer research it would be necessary to elaborate these determinations , studying also the composition of the feces , should any be passedduring the period. Furthermore
,the relationship between the pulse
rate and the metabolism,the character of the respiration as shown by
graphic records,the variations in the body-temperature, and the changes
in the composition of the blood,all have sufficient significance to
warrant investigation . Since muscular activity has so great an influence upon metabolism
,the experiments of Zuntz on Breithaupt should
be duplicated with more modern technique . Comparison should bemade of the metabolism in selected periods with constant externalconditions instead of with changing activity as in the earlier research,and experiments in which the subject breathed a high oxygen atmos
phere would also be desirable.
The Nutrition Laboratory was especiallyfitted to carry out a researchof this kind
,being well equipped with apparatus for determining the
respiratory exchange and the heat output,as well as for measuring the
pulse, respiration ,and muscular activity. It was therefore of funda
mental importance to have ready a carefully prepared plan for studyingthe metabolism during prolonged fasting which could be used whenever an Opportunity offered for conducting such a research . On the
other hand , it was not desirable to make undue haste in beginning the19
20 A STUDY or PROLONGED FASTING .
study, inasmuch as the equipment of the Laboratory was steadi ly beingincreased . The chemical technique was also being rapidly perfected
,
the development of the new micro methods of Professor Fo lin being ofespecial value in studying the relatively small volumes of urine excretedduring prolonged fasting.
SELECTION OF SUBJECT.
While no particular effort was made to secure a subject for thisresearch , advantage was taken of a visit to NewYork by Succi to conferwith him . H is age and his somewhat unreasonable demands for alarge compensation made an arrangement with him undesirable . Furthermore
,he would not have cooperated readily in the great number of
tests that were included in the plan for the fasting research . A numberof individuals, stimulated by the report of the earlier study
,offered
themselves to theNutrition Laboratory as subjects for a fasting experiment . A large majority of these were either sufferers or imagined thatthey were sufferers from “
nervous disease,
”and were therefore patho
logically or psychological ly undesirable . Furthermore , none of themhad a clear conception of a scientifically controlled fast and of theimportance of the observations which would be included in such aresearch . They were therefore not seriously considered .
In the spring of 1911 , a letterwas received from A. Levanzin of Malta ,offering himself as a sub ject for a long fasting experiment to be carriedout at the Nutrition Laboratory . The letter was voluminous , but veryintelligently written
,and showed an appreciation of the scientific value
of such a research . As Professor Luciani,of Rome, who had made
the classical study with Succi , later expressed his confidence in the
ability of Levanzin to carry out a fast of this length , it seemed probablethat the subject desired for the research had been found . It was subsequently learned that Professor Luciani’s acquaintance with Levanzinwas through correspondence only, but his recommendation went farto convince us of the desirability of attempting an experiment withthis man . Accordingly an exact statement was sent A. L . of the dutiesinvo lved in a research of this nature and an arrangement was enteredinto for him to come to Boston for the purpose . In accordance withhis own proposition,
the agreementwas made to cover his expenses,with
a bonus if the experiment was successfully completed , and everyattempt wasmade to minimize anxiety on the part of the subject . The
risk of protracted il lness incidental to the j ourney fromMalta to Boston ,
to the change in climate, and possibly as a result of the fasting experiment, had to be considered , and a sworn statement exonerating theNutrition Laboratory from any responsibility for illness of more than4 days’ duration was obtained from L. before he left Malta .

22 A STUDY OF PROLONGED FASTING .
AUTOBIOGRAPHICAL NOTES.
On the twenty-ninth, thirtieth , and thirty-first days of his fast at theNutrition Laboratory, L . wrote a sketch of his life . This is reproducedverbatim, since it shows many of the interesting features of the life,education ,
and habits of thought of the subject .
12th of May, 19 12 (29th day of my fast) .More than one hundred years ago , Gabriele Avanzino , a Sicilian, settled inMalta. Gradual ly the surname was corrupted into Levanzin. My mother,LorenzaBorg , living andaged about 58, descends from pure andnobleMalteseblood since 400 years. Her grandfather’s uncle was the famous VincenzoBarbara, the daring sea-captain of one of the French battle-shipswho was byBotta and other historians falsely accused of having betrayed Marat when helanded him to take possession ofNaples on behalf ofNapoleon . Barbarawasthe right arm of Napoleon to plot and get rid Malta from the yoke of theKnights of St. John and he was also the first Grand-Master of Free-Masonsin the Island . Her grandfather was Joseph Borg, another sea-captain whocame to America in the time of the Revo lution, volunteeredwith the insurgentsand fought for the American independencemany battles as in his portrait thatwe keep he has on his breast from seven to eight medals. That is why Iprobably love so much freedom, independence of thought, and sympathizekeenly with America.
My father, Paolo , living and aged about 68, is also the son of a sea-captain,Agostino, wlio was drowned when my father was only 3 years of age and so
could nothave a liberal education. He learned the art of ship-building whichwas very flourishing in those commercial times, but now being disabled fromboth his hands through two accidents that happened to him during hiswork,he 18 carrying a grocery-shop in a village asmy mother 18 carrying a confec
tionery and toy one in the same place . They are both very honest and hardworking people and although they have sufficient property to keep them upcomfortably during their old days, they do not want to give up their businessas they want “
to leave us something after their death .
” I have a sister,Teresina,
20 years, living with my mother and amarried one to an engineer,Ursola, 28 years.
I was born in the Citta Cospicus ofMalta, on the 23rd of May , 1872— 4 0
years ago . At 6 years of age I went to Egypt with my mother where myfather was working but came back after two years as the hot climate did notsuit us. Frequented the public free-schoo ls and at ten hadmy first prize— a
five shilling piece— for writing the best essay against “ Cruelty to Animals.
"
Then prizes for drawing as I am very fond of art especially of music andpainting. At 12 I entered the free Dockyard Schools and had several prizes.
At 14 I was admitted by competitive examination as shipwright apprentice asI wished to fo llowmy father’s career, then promoted to draughtsman and thento clerk . From infancy I was always inclined to hard study and sometimesduring the night I used to steal out of bed to read some interesting bookbecausemy parents did not like to see me overstrainmy already weak eyes.
During the tim e that I servedmyapprenticeship ln theDockyard I publishedtwo weekly papers, successively, in Maltese the “ Habit ta Cullhadd” (TheFriend of All) and Is-Sengka
”(Art) to educate and enlighten the working
classes that live m a very miserable condition and are total ly forsaken by theGovernment, but both papers failed after a fewmonths through lack of sub
scribers. At 17 I felt inclined to fol low the ecclesiastical career to devote

AUTOB IOGRAPHICAL NOTE S . 23
myself entirely to study and oratory, that I like so much, and became a cleric,but after four years, throughmatter of convictions and bigoted tyranny of thesuperiors, I put Offmy black robe and entered the Lyceum to prepare myselffor a professional career.
At 20 (1892) I passedmymatriculation examinatlon and took up themedicalcourses. At the same time I was contributing literary and political contributions to our best papers and published several poems in Italian that were veryfavorably appreciated by the press. I started also the publication of a
UniversityMagazine L 0 StudenteMaltese to stimulate the other students tocontribute literary and scientific articles and I published in English and
Italian a study on Shakespearean drama and some biographies of eminentMaltese personages. The paper dragged a stinty existence for two years andperished through lack of funds. At the same time I was conducting two otherpolitical papers in vernacular (Maltese) , the
“Cottonera
”and the
“ Habit ta’lPaplu , and it was one of the articles contributed to the “
Cottonera” thatprovoked against me my first libel and was tried by jury.
My father was still working in Dockyard and as his foreman used to takebribes from his employees and borrow from themmoney that he never used toreturn back, and as my father did never like to satisfy him in this because hefulfilled always all his duties honestly and regularly he became his scapegoatand was always ordered to do the most dangerous and hard kind of work .
Twice he was hurt , twice amputations had been Operated on fingers of bothhands, with peril to his life, til l he became a disabled man . I protested to thesuperiors and they answered that they did not care a bit about it and so , at
last, I published in the“Cottonera
,in 1895
,a vio lent article in English in
which I enumerated with details the many bribes and irregularities that werecontinually committed in H . M. Dockyard , signed the article and defied theAdmiral Superintendent that I was ready to prove in court allmy assertions.
The article provoked a great scandal and the Admiral was obliged to arraignme before the criminal courts to provemy assertions. The penalty demandeda
gainst me was six months of hard labor imprisonment and a fine Of £500 .
A I my assertions were proved to the very hilt after a fierce fight and I wastriumphantly acquitted , unanimously, by the jury . As I was defending thecause of thousands of leech-bled victims against a few vampires I was triumphently carried on the shoulders Of the workmen , with bengala-fires and bandsplaying
, but the next morning my father was discharged from the Dockyardand lost his bread that was keeping I felt the shock tremendously butdid not discourage myself. I put myself in correspondence with Mr. Labouchere of the Truth
”of London
, who not only published my contributions inhis very influential paper but brought the matter before Parliament, being anM. P. , and fought it out very bravely. A Commission was sent to Maltaand allmy statementshave been found “
to be true, my father wasput to workagain,
and several important reforms were introduced . But after a few
months my father was discharged again and under the free and
glorious banner of liberalThe libel took place on the 7th ofAugust, 1895 . In September of the sameyear, I took my degree of Bachelor of Arts from the Malta University afterObtaining for three years a 50 per cent in highermathematics, physics, naturalhistory, philosophy, Latin, English and Italian literature and history . Butmy father about that time was out ofwork and so I had to add to my alreadyoverstraining work private lessons after my lectures, sometimes till 10 p . m . ,
and plodded on in thisvery hard and anxious life for about two years in whichI have fo l lowed successfully the Anatomical , General and Patho logical , theDissectional , the Physiological
, the Obstetrical , the Surgical , the General

24 A STUDY OF PROLONGED FASTING .
Patho logy , the Chemistry, the Bacteriology , the MateriaMedica, the Therapeutical and the Pharmaceutical Courses. But asat that time I wasunder thefalse impression that as I was working mentally very hard I had to eat more
andmore , I used to stuffmyselfwith a lot ofmeat and eggs andmilk and these ,added to the great overstrain,
shatteredmy nervous system down with a severeshock of neurasthenia. My professors gave me the good advice to take a longrest and to suspendmy studies for a pro longed period of time . Butmy familycould not afford that formy father was not working all the time and I had towork to live . So I took the warrant as a Pharmaceutical-Chemist after a
severe examination and was employed as director of the most importantpharmacy in Val letta (the capital Of Malta) , cal led
“ Mizzi’s Dispensary.
”
I lived there for ayear andmy neurastheniagot a little better through enforcedrest .
But I was living away from my family and had to run into many expensesto have my meals in hote ls and I was always sleeping in the pharmacy not tocross the sea late in the night and go home . SO I employed myself in a pharmacy at Cospicua, very near home, and lived there for about two years. Myfather andmother at the same time started their business andwere progressingvery prosperously. My wife , Lucia, lived just Opposite, and we loved eachother. I married her on the 24th of April , 1900 . She is the eldest daughterof Doctor G . F. Inglott, Medical Officer to Government
,Knight of the POpe ,
and member of several literary and scientific academies and is considered asthe most clever Obstetrician and gyneco logist in Malta
, enjoying a very widepractice . So I was determined by him to start a pharmacy ofmy own ,
whichI did and the result was a very successful one , but a short time after theTransvaal War broke out and as he is wel l conversant with the English language was called by themilitary authorities in charge Of theMilitary Hospitaland so all his time was absorbed in these exacting duties and could not takecare any more of his private practice . This lasted for over two years and atlast the pharmacy broke down and I had to remove to a wealthy countrydistrict called Birchircara.
13th ofMay, 1912 (30th day of myfast) .
Before going to live in Birchircara I had fought two great battles— one on
behalfof down-trodden andneglected Democracyand the other one advocatingthe maintenance in our tribunals of the Italian language that has been themeans of our civilization since about 600 years. I have founded the first“ Malta Trade Union ,
”ofwhich I was elected President, with 700 members,
free schools, lectures, honest amusements, band, and carried it on successfullyfor some time , but political intrigue not to encourage a lab0 1 party and not toenlighten the lower classmade it dwindle into nothingness and allmy “ love ’slabor was lost.
”
Then I went to Italy, at my own expense , for about a month, to lectureagainstMr. Chamberlain ’
s (England’
s PrimeMinister at that time) edict thatthe Italian language had to be cleared off from our courts within a lapse of
fifteen years. The movement had some good effect, because all the Italianpresswas awakened and protested loudly andvigorously andMr. Chamberlainhad to give up his Order in Council .After creating in Birchircara a prosperous practice for my pharmacy Iwished to provide for the future , and as my neurasthenia was progressingthrough the very close and sedentary life that I was conducting, shut up from7 a. m. to 10 p . m . ,
including holidays, I determined to secure a more easycareer— law. I entered the legal course and succeeded to Obtain a warrant .
But to continue to carry on the pharmacy, to keep upmy family, and to fo llow

AUTOBIOGRAPHICAL NOTE S . 25
a difficult university course was a very severe test on my already shatterednerves, and alwaysunder the false idea that to work very hard I had to overeatand to stuffmyself with asmuch protein as possible, I ruinedmyhealth to suchan extent that I was compelled to give up my pharmacy forever and dedicatemyself to the practice of law that offeredmore leisure and also better prospectsfor me as I was and am still very popular and beloved by the people . Fortu
mately enough to help me at the start ofmy legal career, I was offered at Sliema(a beautiful summer resort in Malta) the management Of a pharmacy with avery good salary with the permission to absent myself during the morninghours to go to court and pleadmy cases . So I went to live there andMirandaCordeliawas born,
while Jolanda Beatrice was born in Birchircara. My legalpractice prospered so rapidly that after a year I had to give up my pharmacymanagement and dedicate myself entirely to the legal career that I am stil lfo llowing at present .When I thought to have fixed asolid basis formyfami ly’s subsistence I tried
again to do some good work for the cause of our trampled down and utterlyneglected lower classes. It has been always my ideal to enlighten them, to
help them to push themselves forward as the workmen Of othermore progressive countries do , because although I have parted from their classmy democratic soul was alwayswith them . So I started the publication of a weeklypaper entitled “
In Nahla” (The Bee) the scOpe of which was to instructin scientific, artistic, historical , and literary knowledge, as plainly and as entertainingly as possible . The effortwasa brilliant success because I had immedi
ate ly the greatest circulation ever attained by any paper published in anylanguage in Malta. My wife Cooperated herself very effectively because shecontributed , every week , some interesting article about the rearing up of
babies, hygiene, against themarriage of consumptivesor between relatives, etc.
I have published in the same paper a historical novel “Is Sahhar Falzon
”
(The Wizard Falzon) in which I have treated fully and faithfully all thehistory Of the first 60 years of the dominion of the Knights ofMalta over theIsland from Lisleadam to La Cassiere . My intent was to teach to the peopleits history not in the usual pedantic andmonotonousway but enhancing it byintermingling to it the attractive episodes of chivalry and love . In the thirdpart Of the novel I have tried the scientific novel trying to popularize science ina delectable and easy way as I have done with history, and as Falzon was aRoman Catho lic priest who was burned up alive accused of witchcraft, Ideveloped all the up
-to-date positive knowledge about psychical science ofwhich I am an ardent and keen student. Inmany notes I have suggested thebest books and authors and described the most authoritative experiment forthose who wished to delve deeper into thematter. All the facts about Falzonwere gathered through a lot of poking in our archives amongst very rare
manuscripts of those past, dark , and barbarous ages. This novel was a greatsuccess because I had to publish separately in three volum es comprising over650 large pages and the edition was so ld out very rapidly.
In the“ Nahla
” I have not only tried to instruct the lower classesbut I havefought hard also to defend their rights and to upliftmy voice for the injusticescommitted against them. Twice I was tried by jury for libelous articles buttwice I was triumphantly acquitted . The first time was on the 28th ofOctober, 1909, when Antonia Azzopardi, a murderer, was hanged . The
doctors in charge had executed their post-mortem examination so carelesslythat there was doubt that the man was buried alive only one hour after theexecution! I accused them of that in a very violent article, and all Maltawas in a devilish row about it. The Governor ordered the Chief MedicalOfficer, who was responsible, to libel me and after a very hard struggle before

26 A STUDY OF PROLONGED FASTING .
the jury I have succeeded to prove that there were no positive and scientificfacts to prove that the executed man was dead when buried . This resultprovoked a new law in Malta and now instead of burying the executed men
after only one hour from the execution as before , they watch them keenly for24 hours, and as I protested also that it was barbarous to bury them in a sackafter that Justice had made its cold vengeance on a creature of God againstwhose life she has no right at all, now they bury them in a cheap coffin.
The second trial was provoked by this fact. To communicate by means Oftelephone in Malta you have to pay 60 cents , and the telephones are at thePo lice Station. Poor people are supplied gratuitously by Governm ent withdoctors, midwives, and medicines. At a village called Zeitum a very poorwoman was dying through post-partum hemorrhage. The midwife sent forthe doctor for assistance as she thought the case a fatal one . The doctorhappened to be in another vil lage , and the policeman refused to call himimmediately before levying the tax of the telephone . The poor woman hadnot the 60 cents to pay for it, andmore than an hour was spent till they gotthem from a distant sister. When the doctor arrived there was nomore hopesto save her and the poor victim Ofhuman brutality died leaving ahusband andsix orphans. I published a vio lent attack against the police accusing them of
manslaughter and was libel led , but having proved to the hilt all the factsstated , I was again acquitted triumphantly by the jury.
As you can seemy “Bee
”was really a busy” one and played very wel l and
smartly her humanitarian and democratic mission. At the same time we didnotmiss to advocate, andvery ardently,
“Fletcherism”
and the Fasting Curefor the cure Of disease as also many other important dietetic reforms. Manyarticleswere also published on behalf of the idea of an international Language .
A lecture in Italian that I delivered in Malta several years ago advocatingEsperanto was published in it. About 25 years ago I learned Sch leyer
’s
Vo lapuk that broke down, substituted by“ IdiomNeutral ,
”amore national
system. I fol lowmy friend Rosenberger of St. Petersburg and learned it alsobut had very little success. Then my dear friend
’
sDr. Zamenhof ofWarsawEsperanto ” came in vogue and I learned it and took up arms in favor Of itvery ardently. I have given inMalta free courses in the University, lectures,founded societies and succeeded also to start the first female course in theUniversity in any branch of knowledge . Mrs. Levanzin was a great help tome in thismovement and now she is the first woman in Malta to enter theUniversity to fo l low a medical career. She is trying with all her efforts notonly to enlighten the female classes ofMalta that are yet shrouded inmediaevaldarkness by publishing very instructive articles but also by setting them the
goo d example of Opening for them new and prosperous careers. Esperantohad a great vogue in Malta; I , with Mrs. Levanzin , took part in the International Congress of Barcelona and there I was elected “
President of the
International Association of Pharmaceutical Esperantists, editor of the
scientific Esperantomonth ly, La Vocho de Farmacustoj ,”and Corresponding
Member of the Co legio des Farmaceuticos (the Oldest one in the world andwhere the first pharmacopmiawas published) aftermy lecture in Esperanto onthe
“Fungus Melitensis” by co l leagues of over 30 different nationalities.
Now I am advocating Ido or Simplified Esperanto as I find that it is easier,more logical , and cropped of all the errors and incongruities contained in Dr.
Zamenh of’s system.
14th ofMay, 1912 (318t and last day of my fast) .I have also at the same time fought hard against much ridicule and prejudice
to found the first “Society of Psychical Studies and Research” in Malta of
which I am President . Honorary Members are Prof. Crookes, Russel l
AUTOBIOGRAPH ICAL NOTE S . 27
Wallace, Lodge, Maxwel l , Richet, Lombroso , Morselli, Carrington, etc . Now
another battle for Science and Humanity— Fasting. About two and a halfyears ago , while I was over-eating, obese, neurasthenic , pessimistic andwith ashattered nervoussystem,
I chanced to read in the Contemporary Review”an
article about fasting. Itwasa flash of lightthatstruckmevividly . It indicatedto me the right path to health and happiness and I fo llowed immediately itsdictateswith enthusiasm. I fasted for 8 dayswith very great benefit. ThenI procured all the possible literature in several languages about fasting andprepared myself thoroughly for a whole year for a long and conquest ” fast.I started that on the lst ofMarch, 191 1 , andMrs. Levanzin did the same asshe had been suffering since several years from severe dyspepsia and insomniathrough over-eating. She broke her fast on the 33rd day and I on the 40thwith immense benefit to our health because our ailments disappeared . We
continued all our usual occupations during our fast and did never feel any badeffects.
In the fo llowing August, cholera broke out in Malta and as a preventiveprecaution I fasted again for 12, Mrs. Levanzin for 17 , andmy daughters forseveral days each. I have cured Jo landa from a severe case Of small-pox by17 days of fasting and Miranda from a severe case of fever with 8 days.
Several otherfriendsand parents underwent the cure of fasting undermyadvicewith marvelous effects. Enthused by these beneficial results, I determined tofix a scientific basis to it by undergoing a thorough and seriously controlledexperiment under the direction of a physio logist of high repute and greatexperience . I submitted the case to my friend , Professor Luciani , of Physiology, of Rome, who studied Succi and published a good book on the Physio logy of Fasting,
”and he suggested to me to come over to Boston at the
Carnegie Institution, as the Institution was the best equipped inthe world for such an important experiment. I took up his suggestion andcrossed over miles to undergo my fast, refusing any pecuniary remuneration, only the expenses being defrayed for it. To-day is the 3lst day and lastday of it, and I can simply tel l you that it is a complete success. I am feelingvery well , very uplifted , and I wished to prolong it further, at least to 40 days,because I do not feel yet any trace Of hunger at all. But Professor Benedictthought it already very expensive and fatiguing and bid me to break it tomorrow. He only allowed me to pro long it for a day more , simply to beat therecord of the longest controlled scientific fast ever made. During the fast I didnot feel the least uncomfortable sensation except the bad taste of my coatedtongue , and the catarrh and congestion of my eyes that I had at the starthave nearly disappeared . I hope that a great benefit to my health shal laccrue from it.

GENERAL CHARACTERISTICS OF SUBJECT.
As will be inferred from his biographical notes,L:was a propagandist
with pronounced views on all subjects . He had had some legal trainingand was inc l ined to be exceedingly contentious . His chirography wasexcellent . He also had a good command of the English language
,aswel l
as of Italian,French
,Spanish
,Maltese
,andEsperanto . His familiarity
with the vagarious literature on fasting was astonishing,and led him
to make many suggestions indicative of a mind working upon a propaganda for the supposed benefits to mankind to be derived from fasting
,
instead of an appreciation of the true scientific value Of a prolongedfasting experiment . As an example Of this
,while he was unwi l ling to
undergo a series Of carefully planned strength tests , he neverthelessattempted some sensational strength tests of which he had read
,such
as lifting up a man and holding him suspended for a moment or two .
He was a moderately wel l-nourished man,but his flesh was soft and
flabby . This was natural , as he was decidedly sedentary in his habitsand much averse to any muscular effort . It was hoped that measurements of the fasting metabolism during muscular work could be madewith this subject by having him take a moderate amount of exercisedaily on the bicycle ergometer, but he absolutely refused to mount theergometer. He said he never rode the bicycle and thought it beneathhis dignity
,and that although the bicycle was used inMalta
,it had not
been employed by his people . As L . showed so strong an objection tomuscular activity
,we were obliged to omit these valuable Observations .
This subject called himself a vegetarian and frequently made astatement to that effect during the fast , but his practice did not whollybear out his claim. He admitted that he ate meat in the Europeanrestaurants and on the boat during his trip to Boston,
but said that itmade him Sick and uncomfortable , and that he was obliged to eat themeat
,since he could not get the food he wished . Of considerable sig
nificance in this connection is his selection of food on the days precedingthe fasting period . On his arrival in Boston he was taken to a hotelby one of the laboratory assistants and when given his choice of foodfrom the menu
,he ordered a large steak covered with onions ; on other
occasions he ordered salmon, pork , and lamb chops . During his stayin the hospital after the fasting experiment was over, he again cal ledfor a beefsteak . While probably not an excessive eater of meat
,he
was by no means a vegetarian for several weeks prior to the fast .The nitrogen found per day in the urine during the ten days precedingthe fast indicated that he was living on a fairly high protein level .During the food days in Boston his diet Was unrestricted and he wasrepeatedly told that he could have whatever he wished to eat duringthis preliminary period, except that it was preferred that the last mealOf the day should not be excessively high in protein to avoid the longduration Of the Specific katabolic action of the protein.
v 28

30 A STUDY OF PROLONGED FASTING .
The threedays preceding the fast— the so-called preliminary periodwere used to accustom the subject and the staff of assistants to theapparatus and to the general routine
,in order that the program could
be carried out as smoothly as possible,andwithout too great a demand
upon the time of the physicians and co-workers who made observationsUpon the subject . His diet and daily life were under constant observation during this period , but he was free to choose his food and toarrange his time as he desired when no tests were being made upon him .
It was necessary to be certain that L . was physically and psychical lya fit subject for the long fasting experiment . He was accordingly givenseveral rigid physical examinations byDr .H.W.Goodal l
,of theHarvard
Medical School , and also underwent a psychical examination by Prof.E . E . Southard, director of the Massachusetts Psychopathic Hosp ital .The results of these examinations gave us every assurance that L.
was a suitable subject for this long fasting experiment .The body-weight of this subject when he reached Boston was some
what smal ler than the initial body-weight reported for his earlier fast.L . stated that his body-weight at the beginning of the previous fastwas excessive and that he desired to begin this experiment with hisnormal body-weight . While this reasoning was scientifically correct ,his small weight caused us considerable anxiety, as it was feared thathe would be unable to endure a 31-day fast . Inasmuch as a fast Of7 to 10 days ’ duration would be of practically no value to us except asa duplication of the earlier work
,every possible arr angement was made
to adjust the conditions so as to prolong the fast ; the subject quicklyfound that if he made the statement that any particularly distastefulroutine or test would tend to “ shorten the fast
,it would be omitted .
On the other hand he took an intense interest in the outcome of theexperiment and had an almost religious belief in the benefits tohumanity to be derived from it. He enj oyed the distinction of havingso many observers studying him, and his peculiar appreciation of thescientific value of the Observations enabled us frequently to induce himto waive his objections to any routine by a summary refusal to go onwith that particular test unless the routine were carried out . To hiscredit it must be said that whatever idiosyncracies he exhibited attimes , he would , after reflecting on the importance of the experiment,beg for the continuation Of the complete routine .
To secure as much information as possible regarding the normalmetabolism of L .
,he was asked to sleep inside the respiration calo
rimeter immediately on arriving in Boston . He was provided with acomfortable bed
,air mattress , and bed clothing, the bed comparing
well in size and comfort with a berth on an ocean steamer . Importantdata regarding the normal metabolism Of this subject were thus securedfor several nights before the actual fast began . Fortunately L . sleptvery quietly, and when not asleep he remained very quietly in the
same position for long periods of time,thus greatly facilitating the
accurate measurement of themetabolism.

FASTING PLATE 3
E. L . on the Thirty-first day of the Fast, ascending the Stairs of the Balcony. The p1cture required20 seconds ; there is no Evidence o fUnsteadiness.
F. Clinical Examination by Dr. H W . Goodall . This pho tograph was taken o n the Thirty-first dayo f Fasti ng, upon the Balcony Occupied by during the day.


GENERAL HISTORY OF FASTING EXPERIMENT . 31
PROGRAM FOR RESEARCH.
The many Observations and the large number of co-workers andassistants made a carefully prepared program absolutely essential
,so
as to use the actual available time of the subject and the co-workers tothe best advantage . The observations planned for each day were theweighing of the subject after he had urinated and arisen ; blood tests ;measurements of blood-pressure and the alveolar air ; test for acetonein the breath ; records of rectal temperature and of pulse-rate ; thecareful collection,
measurement,and subsequent complete analysis
of the urine ; and the apportionment and measurement of the watertaken . The subject entered the bed calorimeter about 8 O
’clock eachnight
,remaining there until 8 O
’clock the next morning,during which
time the respiratory exchange,water vaporized
,and heat produced
were continuously measured. He was then taken out and his respiratory exchange was observed in three experimental periods by meansof the universal respiration apparatus . (See Plate 2, fig . C
,page
Respiration experiments were also frequently made with the subjectat other times of the day and in varying body positions . The respiratory exchange when the subject was breathing an oxygen-rich atmos
phere was determined several times , and a series of respiration experi
ments was made by Mr. T . M . Carpenter when the subject was writing.
(See Plate 1 , figure B ,page In addition to the regu lar routine,
there was a rigid clinical examination by Dr . Goodall every secondday (see Plate 3 , figure F) , psycho logical tests were made by Dr .H . S . Langfeld , and anthropometric measurements were taken byProfessor W. G . Anderson once a week . Every five or six days acomplete series of photographs was made of the naked subject . (SeePlates 4 and 5 , p . Once a week his bodywaswashed with distil ledwater
,the water used being preserved and analyzed . Among themany
incidental Observations carried out during the experiment was a seriesof X—ray plates on the thirtieth day of the fast by Dr . F . H . Williamsand a study of the flora in the colon on the thirty-first day by Dr . A . I .
Kendall . In clear,pleasant weather the subject was taken to the
roof ormore frequently given a drive through the park system of Boston .
The program for a typical day— that of May 7 —8,1912— appears below :
May 7 . 7h 46m a.m . Bed calorimeter experim ent ended .
8 15 a.m . to 9h 17m e .m . Respiration experiment (three periods.)9 28 a.m . Weighed .
10 00 a.m . Photographs taken .
10 30 a.m . Blood sample taken.
1 40 p.m . Blood pressure tests. Alveo lar air.
3 4 3 p.m . to 4 h 14m p.m . Respiration experiment made with subj ectwriting (two periods.)
5 00 p .m . Psycho lo gical tests.
7 01 p.m . to 7h 44m p .m . Respiration experiment (two periods) .7 50 p.m . Bath of distilled water ; underwear changed .
8 23 p.m . Entered bed calorimeter.
9 34 p.m . Calorim eter experiment begun.
May 8. 7 50 a.m . Bed calorim eter experiment ended (5 con
secutive periods.)

32 A STUDY OF PROLONGED FASTING .
It will be noted that the regular clinical examination did not takep lace on this day
,as these examinations were made only on alternate
days . Furthermore,no drive was taken . As will be seen from this
typical program,the subject found himself fully Occupied by the vari
ous observations ; in all of these he took a keen personal interest .
DAILY RECORDS OF FASTING EXPERIMENT.
Although a defini tely arranged program was prepared,and for the
most part rigidly followed,the daily routine was varied by a large
number of extraneous Observations,particularly in regard to the feel
ings and moods of the subject , as well as observations made by co
workers . To present these adequately, it seems desirable to givethem in the form Of a daily record beginning with the arrival of thesubject at the Nutrition Laboratory . This record will be in the natureof a “ log-book
,
” which will Simply give the general history Of the
experiment from day to day, with no attempt to describe the techniqueor discuss the results .The experimental day for most purposes ended with the comp letion
Of the respiration experiment at about 9" 3O’
fu a . m. The last meal
was eaten at 6 p . m . on April 13,1912 ; thus the true fasting period
began at 9" 30m a . m .,April 14
,or about 15 hours after the last meal .
In this daily history the personal observations of the subject on hisexperiences during the night are always given in the notes for the next
,
day,but all events up to the moment Of entering the calorimeter are
recorded on the date of occurrence . While much that is said regardingthe previous fasts of the subjec t must, from a strictly scientific standpoint
,be considered as worthless
, yet the trend of thought is notwithout interest in interpreting the mental make-up of the subject .
PRELIMINARY PERIOD .
April 10 , 1912— L . arrived at the Nutrition Laboratory about 8 p . m . ,
coming directly from the steamer and leaving his baggage on the wharf, butbringing with him the sammes ofurine which he had collected for several dayson hispassage across the ocean. He showed himself to be heartily in sympathywith the plan of the experiment, and appeared to be a subject who wouldcooperate ful ly in the experimental routine ; he placed himself entirely in our
hands. As he had had no evening meal , he was sent to a hotel with one o f thelaboratory assistants. This meal , which was of his own selection, consistedof a large beefsteak with onions, one boiled potato , one portion chocolate icecream , and a glass of water.
He returned to the laboratory at 10 o ’clock , and then reported that he hadhad avery rough passage on the steamer
,there being but a fewhours of smooth
sailing on the third day out and a few hours on the last day . On the otherhand , he appeared to be in very good condition and showed no bad effects fromthe discomforts of the trip . He maintained that during the previous year hehad lived almost exclusively on avegetarian diet, taking occasionallymilk andcheese , very rarely eggs, and no meat. On the steamer, however, the menudid not include the food he was accustomed to and he was compelled to eat

GENERAL HISTORY OF FASTING EXPERIMENT . 33
meat and highly seasoned sauces which he did not particularly care for.
During the previous year he had been living upon one meal a day , whichwaseaten about noon,
using the juice of an orange to satisfy his thirst whennecessary. He claimed that this limited dietary had been very beneficial tohis health. During the fast he wished to drink distilled water. He did notespecial ly like it, and usually drank hot water, but since some people believedthat therewasnutriment inwater, he wished to use distilled water so that therecould be no question as to his obtaining nutriment in this way.
In his previous fasts it had been his custom to carry on his regular businessand to go into court and plead his cases as usual , thus engaging in a not incon
siderable amount of muscular activity. He showed a decidedly intel ligentinterest in the experiment, aswas indicated by his asking if the eyes should notbe examined by an eye specialist, for he had found that as a fast progressed,the eyesight improved considerably, though normal ly he had very poor eyesight. He also thought it important to study the blood and seemed muchgratified when he was to ld that both eye and blood tests would be made. The
important role which he would play in the experiment was emphasized to himand he was shown that the efforts of the laboratory staff would be of no availwithout his full Oooperation. His attitude toward the experiment and understanding of the requirements showed him to be by far the most intel ligentman that has ever been studied as a fasting subject.
When discussing the question of defecation during a fast, he made the statement that in some of his long fasts he had defecated only once or twice . Oftenhe defecated shortly after the beginning of the fast and then not again untilafter the fastwas over, but after beginning eating he defecated quite regularly.
In one fast he said that he did not defecate until the twenty-seventh day .
As there was no time that evening to discuss with him at length his pasthistory and the details of the fasting experiment
,he was taken down to the
calorimeter laboratory, where he urinated , removed all but his underclothing,and prepared to go into the calorimeter. The stethoscope was adjusted , andthe rectal temperature takenwith a clinical thermometer, whichwas left in therectum three minutes. He drank a glass ofwater andwas then placed insidethe chamber of the calorimeter. After he had been shown how to use the telephone and the signal bel l , a black cloth was placed before the window so that
the electric light would not disturb him and the calorimeterwas then sealed .
Even on this first day the subject was inclined to talk about the method ofbreaking his fast, saying that he was accustomed to do this by taking the juiceof one or two lemons, and afterwards orange juice , to which he sometimesadded sugar. As was seen later, such amethod for breaking the fast provedto be disastrous to our predetermined plan of securing data after the fast.
April 11 , 1912— The calorimeter experiment for the previous night was
uneventful and ended at 8h 02m a.m . The measurementswere made in threeconsecutive periods, the idea being to secure observations during the latterpart of the night and thus eliminate, if possible , the influence of food takenduring the evening. The subject kept very quietmost of the time, and provedexceedingly tractable and intel ligent. The importance of lying quietly insidethe respiration chamber had been impressed upon him andwe have rai ely hada subject who lay so quietly for so long a time . About 5h 30m a. m. be te lephoned to ask if everything were all right
,reporting that he felt very wel l but
had been awake for some hours. He was instructed to ring an electric bel levery few minutes by pressing a small push-button inside the chamber, soas to show us that he was awake. He rang this bel l regularly throughoutthe rest of the experiment, beginning at 5h 30m a. m.
When the calorimeter was opened, a strong odor of onions was apparent,

34 A STUDY OF PROLONGED FASTING .
doubtless due to the fact that he had eaten beefsteak and onions the eveningbefore . L. reported that for the first two hours after he entered the chamberhe was very warm, but later became coo l and slept comfortably. Since thetemperature inside the calorimeter se ldomvaries by C . , such an observation serves excellently to il lustrate the futility of placing anyweigh t on personalimpressions. The interior of the respiration chamber reminded him Of his
cabin on the steam er. It was impossible to obtain records of the pulse-ratefor about one hour after 5h 30m a. m . , this being due to some change in theposition of the stethoscope . Later the subject was able to readjust it and therecordswere obtained thereafter.
When L. came out of the chamber, shortly after 8 a. m . ,he urinated and
immediately the experiment with the universal respiration apparatus wasbegun. (See Plate 2, figure C ,
page This experiment consisted of three15—minute periods.
Almost the entire day was spent by the subject in familiarizing himself withthe experimental routines. After the respiration experiment was over, severaltests of the blood pressure were made , and samples Of the alveo lar air taken bythe Plesch and Haldane methods . Professor W. G . Andersonmade a seriesof physical measurements and attempted the routine strength tests, butwas not able to Obtain these , owing to the disinclination of the subject. It didnot seem advisable to complicate the program by taking photographs on thisday . An examination of the blood was made , also a most careful clinicalexamination. L. then took a hot bath andwent out with Mr. H . L. Higginsfor the first meal of the day . Thismeal , se lected ala carte , consisted of one
portion of scal lops and tartare sauce , one portion of roast lamb andmint sauce,two portions of mashed potato, three ro lls, two portions of butter, and one
portion of custard pie .
On returning to the laboratory in the afternoon, he occupied himself inwriting letters and in talking with different members of the staff until4h 30m p . m . ,
when the first series of psycho logical tests wasmade . The visualacuity test was not very successful , as L. has avery short vision and the lettersused were so smal l that new ones had to be secured . The chief value of the
test on this day was to familiarize the subjectwith the routine . L. continuedto have a keen interest in the success of the experiment and cooperated inevery way except in the strength test.
In order to make sure that the last meal of the day should contain only asmal l amount of protein,
I went personal ly with him to the restaurant. Hissupper at this time consisted of half a grapefruit, to which he added quite alittle sugar, a plate of split-pea soup (this containing practical ly all Of the
protein in the who lemeal) , two or three slices Of bread and butter, one portionof stuffed tomatoes, one of fried sweet potatoes, another of white potatoes,one dish of strawberries and cream, and some strawberry ice cream . Hereturned to the laboratory about 9h 30m p . m. and prepared for the night inthe calorimeter.
While I waswith him in theafternoon and evening, L. gave me considerableinformation regarding his previous fasts . Although the unscientific nature ofthese personal impressions is recognized, it seems desirable that they shouldbe recorded . His Observations for the most part had to do with defecation,feelings of hunger, and changes in body-weight . During his fast of 40 days,which he reports as having been broken on April 10, 1911 , he defecated twiceduring the first two days, and again,
according to his reinembrance, on thetwenty-fifth day . The feces on the latter day consisted Of a smal l amount ofblackish or very dark brown material , with a yellowish white mucus. Hedefecated again the evening of the day on which he broke the fast. He

36 A STUDY OF PROLONGED FASTING .
hours each day , but he took no very long walks. He said that at one time,when he was being jeered at in regard to his fasting by one of his clubmates
who said that he was losing strength , he suggested that they test his strengthwith ahand dynamometer, and he was able to showmore pressure on the handdynamometer than the manwho ridiculed him . He did not be lieve in Succi’stheory , however, that there is an increase in muscular strength during a fast.April 12, 1912
— Th e records of the night Observers showed that L . sleptrather quietly from 9h 40m p . m. on April 11 until 3h 33m a. m. on April 12,afterwhich time he rang the bel l at intervals from 5 to 10minutes. At 5“30m
a. 111 . he telephoned that it was necessary to urinate . For this he used a 500c .c . urine jar which had been placed inside the calorimeter the night before ,but notwithstanding its size it was not sufficiently large to contain all of the
urine he desired to pass. The subject reported no particular discomfort fromthe fact that he could not completely empty the bladder.
At noon on this day , L. went to dinner with Mr. T. M. Carpenter. Hisdinner, selected by himself, consisted of one portion of broiled salmon and asmall quantity of green peas, two po rk chops saute, three heaping tablespoonfuls ofmashed potato , a dish of sliced cucumbers and tomatoes
,three smal l
ro lls, two small pieces of butter, one portion Of strawberry ice cream,and two
glasses ofwater.
At 7 p . m . , he took supper, likewise with Mr. Carpenter, eating one largeportion ofmacaroni , with apparently but little cheese in it, one large portion offried sweet potatoes, and one large portion of fried eggplant. In addition, heate two slices of French bread , two portions of butter, one portion of choco lateice cream ,
one-half dozen macaroons, and drank five glasses of water. Heseemed to enjoy thismeal very much .
For the first time on this day he showed apprehension in regard to theexperiment, maintaining that the number of testsmade with him would tendto shorten the fast , as it required concentration on his part to cooperate withthe different observers and this concentration used a certain amount of hisenergy. On the other hand , he suggested that a series of anthropometricmeasurements should be added to the tests planned for him in order to showthat he was a normal individual , citing the fact that one objection that ismade to professional fasters and men who fasted any great length of time isthat they are not normal people inte llectual ly and for that reason the resultsobtained with them could not be considered normal . He considered thesemeasurements Of the greatest importance and thought they could be Obtainedby taking a photograph showing the angle of the face , width of the head , etc .
Since he desired them, a series Of these photographswas subsequently taken.
April 13 , 1912— The records for this day show that the subject entered the
calorimeter chamber at 9h 40“ p . m . ,April 12, and apparently was quiet until
12h 17m a. m . , April 13, when he began ringing the be l l and continued thismoreor less regularly, i . e. , several times an hour, throughout the remainder Of thenight. He telephoned at 4 h 1 1m a. m . , and again at 5h l0m a. m . , statingthat he had slept little but feltvery comfortable . He urinated at 4 h 11m a.m . ,
passing 595 c .c . Of urine . On coming out of the calorimeter, he had considerable to say regarding the dreams that he had had ; between 9h 40
m p . m . and12h 17m a. m . , he slept very well without dreaming. After that period hissleep was much broken,
and he had a number of dreams, one of which wasaccompanied by a seminal emission. He explained this by saying that hissupper the night before contained too large a proportion of carbohydrates,which heated his blood andmade him very uncomfortable . He almost immediately remarked that he had been very comfortable inside the chamber and,in fact, rather enjoyed being there .

GENERAL HISTORY OF FASTING EXPERIMENT . 37
A considerable number of photographs were taken of the nude subject, aprocedure which evidently gave him much pleasure (see Plates 4 and
At l lb 16m a. m . ,be urinated and defecated , and later went out to hismidday
meal with Mr. Higgins. He se lected pea soup with three crackers, one generous portion of fish (finnan haddie) , mashed potatoes, two lamb chops, oneportion of French fried potatoes, four slices of bread with butter, and one
portion of strawberry ice cream and fruit syrup (co llege ice) .In the forenoon of the third day I told the subject that it was importantthat we should have some idea as to how long he expected to fast, for he hadfrequently made the statement that so many tests upon him would tend toshorten the fast. He was shown that a short fast would have no interest forus. He replied that he expected to fast until his body-weight fell below 100pounds kilograms) . Inasmuch as his initial weight was 134 pounds
kilograms) , he thought he would lose about a pound a day , which wouldmake the fast approximately 30 days long.
He broughtme two sealed bottles of the liquor that Succi uses in his fasts toallay the pangs of hunger at the beginning of a fast. One of these bottles hepresented to the Laboratory, and asked me to keep the other for him until thefast was concluded , as he did not wish any one to say that he took the liquorand that it helped him to carry out the fast. The subject sympathized fullywith the strictest surveillance and wasmuch impressed with the fact that somany co-workers were watching and studying him .
In order to obtain an expert opinion regarding themental state of the subjectat the beginning of the fast, arrangements were made by which Dr. E. E.
Southard , of the Massachusetts Psychopathic Hospital , could examine himat 3h 30m p . m. on this day .
L.wasexcessiuelyvoluble, continuallyemphasizingthe importance ofmakingmeasurements of his face andhead , the length ofthe ears, and similar measurements, as he desired that a careful study should be made in order to provethat he was a normal man, and not erratic and abnormal . He also advocatedwith great persistency the study of the influence of fasting on the sexual organs.
At 6 p . m. he wentwithMr. Carpenter to a local restaurant for the last mealbefore beginning the fast. Thismeal consisted of bananas and cream, straw~
berry Shortcake , ice cream, and three glasses ofwater.
In the evening he took a hot bath, afterwhich he was sponged with distilledwater, and then put on aunion suit and a pair ofwhite stockings, both ofwhichhad been previously thoroughlywashed and rinsed in distilled water and dried .
The union suit absorbed the perspiration, so that ameasure could be obtainedof the nitrogen eliminated through the skin in the form of urea or organicnitrogenous material . After drinking a glass of water, he entered the bedcalorimeter at 9h 44 m p . In .
FASTING PERIOD .
April 14, 1912 (first day of fast) —According to the experimental records,L. rang the bel l to show that he wasawake from time to time during the night,there being one hour of quiet between loh 17m p . m. and 1 1h 29m p . m. andan other hour between 1 1h 48“ p . m. and 12h 49m a. m . , but from 2h 06m a. m . ,
April 14 , he rang the bel l more or less regularly until 5h 25m a. m . , when fortwo hours he remained quiet and was apparently asleep . At 2h 06m a. in . hetelephoned that he was compelled to urinate. This disturbed him ,
as he had
been sleeping very soundly. Later he suggested that if he could drink waterduring the day and not have to urinate during the night, he would feel more
comfortable . His program was therefore arranged subsequently, to includethe taking of the greater part of the water during the daytime .
38 A STUDY OF PROLONGED FASTING .
When he came out of the calorimeter, he reported that he felt fairly comfortable . Some of the air had been let out of his airmattress, so that he foundit easier than formerly. After the respiration experiment was over and he hadwashed his hands and face, he went up into the balcony and a thoroughexamination was made of all his clothing and baggag e . This was done tomake sure that nothing was hidden
,such as food tablets, or alkaloids Of any
kind , in a form that might be sewed into his clothing, concealed in ho llowbooks, in the tipsof hisshoes, or in some similar place . As he had had previousexperience as a pharmacist, it seemed desirable that such precautions shouldbe taken . Even the linings of his clothing were examined , but nothing wasfound , only two small cakes of soap being removed from the balcony. Besideshis clothing and num erous testimonials from many of hisMalta associates, alarge part of his luggage consisted of so-cal led
“ fasting literature” ; ofparticular interest to uswere thematerials he had collected in his visit to Succi on hisway to Boston.
He had never been in the habit of using his eyes for reading or studying inthe evening,butfinished hiswork by 6 or 7 o
’clock and rose early in themorning .
It had been his custom to spend the evening with his family or go out for a
walk, or to some place Of am usement. Anticipating the tediousness of the
fast, we sought to interest him in some Simple game as solitaire , checkers, orwhist, but he refused all of these and preferred to retire early, entering therespiration calorimeter even earlier than we had planned .
Much of the first day he talked about how well he would feel as a result ofhis fast, how happy he was to think that he was beginning it, how he would berelieved from the necessity Of eating and drinking, so that the time he nowspent in thisway could be devoted to highermental work . As he usually feltso much better during a fast, he expected that these fasting days would beamong the happiest of his life . He considered that he bore the tests on thisday much better than previously, showing a greater power of concentration .
In the psycho logical test he Observed that the ticking of the metronomeseemed louder than in previous tests and attributed this to the fact that duringfasting hishearing was alwaysmore acute . Inasmuch as this Observation wasmade when he had omitted but onemeal— themeal in the middle of the daythe weight which should be given to this Observation is easily estimated.
Although the weatherwas dul l , which usually depressed him ,he was perfectly
certain that throughout this day he feltmuch better bothmentally and physically than the day before . During the evening he was unusually lively andcheerful , sang andwhistled quite a little, and said he felt like dancing.
Although the temperature on the balconywas22° C . , he began to complain ofthe co ld and in the afternoon wore a blanketwrapper and bedroom slippers inaddition to h is regular clothing. (See Plate 1 , figureA,
page Subsequentlyhewore his heavy-weight suit ofunderclothesover the union suit and stockings,which had been washed in distilled water.
He said that he never used alcoho l in any form and in the afternoon com
plained of having to drink too much water, remarking that it would shortenthe fast if he drank so much, as itwould wash out the salts. While there wasa legitimate foundation for the statement that the distilled watermight affectthe saltmetabo lism,
itwas evident that L. had discovered an efficaciousway ofObtaining anything that he wanted by bringing forward the argument that itwould “
shorten the fast.” It was decided that if the amount ofwater givenhim to drink caused him discomfort , he could lessen the amount. He preferred to drink only when thirsty, but that morning had taken water withoutfeeling the need for it, and had had abso lutely no hunger all the day . The
water tasted much better than he had expected it to taste, as he usually disliked the taste of distilled water.
GENERAL H ISTORY OF FASTING EXPERIMENT . 39
In preparing him for the respiration chamber at night, it was difficult toadjust the stethoscope so as to hear the pulse-beats through it clearly. The
best results were Obtained by placing the stethoscope about 1 cm. above theleft nipple and 2% cm. toward the center line Of the chest. He urinated at
611 201m p . m. and thought he would not urinate again during the night. Bythis time he had become thoroughly accustomed to the calorimeter, showingno anxiety regarding his stay in it and having the greatest confidence in thosewho had charge Of the experiment. He entered the respiration chamber at8h 48m p . In .
April 15 , 1912 (second day offast) — From the experimental records and thereport of the subject, L. evidently had a very comfortable night, ringing thebel l only occasionally and sleeping much better than he had any night sincehe had come to Boston . When he left the apparatus, he reported himself tobe in excel lent condition. There was no noticeable odor when the calorimeterwas opened . He felt no pain or sensation of hunger, and very little thirst.During the forenoon he wrote busily and several long letters were mailed forhim at noon. L. is ambidextrous, using his right hand for writing and lefthand for work , that is, in taking the dynamometer test, he always used the lefthand first. In conversation,
he invariably led up to the discussion of the
innumerable “ popular ” books on fasting, with which he was remarkablyfamiliar. An ingenious argument against fasting, which he reported ashavingbeen given him by a prominent American vegetarian, was that in a fast amanbecame a flesh-eater, as he existed upon his own flesh.
At 4 p . m . ,250 c .c . of water were taken from the 1 liter of distilled water
contained in his bottle, reducing his apportionment of water to 750 c .c .Subsequently this amount was given to him daily. The rectal thermometerwas used for the first time during the night of the second day of fasting
,L.
inserting the thermometer himself. Previous to entering the calorimeter,the
subject was in unusually good spirits, singing and talking a great deal .April 16 , 1912 (third day of fast) —On coming out of the apparatus in themorning, L. said that he wore the rectal thermometer all night and suffered nodistress
,although at times it troubled him somewhat. The Observer reported
agood series of temperaturemeasurements throughout the night. L. evidentlysleptmore soundly than usual , ringing the bel l only occasional ly. NO specialodor was noted when the chamber was opened .
After the subject had been weighed , several photographswere taken of himnude in various positions, corresponding approximate ly to those taken on
April 13 . After he was dressed , at his request several photographs were takenof the head to Show the facial characteristics. His innumerable suggestionsdisplayed a worthy interest in the experiment, though many of them had tobe disregarded .
On this day the drinking water and the urine bottle were placed on a tableat the foot of the stairs leading to the balcony, the subject notifying theassistant whenever he wished water or the urine bottle . In this way all
possibility of h is drinking the urine, as was done by the subject of Paton andStockman, was eliminated . Although L. was less cheerful than he was theday before , he was by no means depressed, Spending a considerable part of theforenoon inwriting in his diary. Hewas particularly cautioned againstwritingany of his experiences or sending out information unauthorized, as misusewould bemade of thematerial which he gave out before the fastwas completed .
We had expected that he would lie down occasionally and had provided a.wel l-upholstered couch for hisuse , but he sat up practically allday . It seemeddesirable , therefore , to study hismetabo lism in this position. Accordingly inthe afternoon he came down from the balcony and a respiration experimentwas

40 A STUDY OF PROLONGED FASTING .
made with him in two experimental periods, while he was sitting in a comfortable chair.
During the day the subject reported that hehad no bad feelings of any kind .
He felt slightly irritable , but considering the confinement, he was remarkablyfree from this fee ling of irritation,
much more so than in his last fast. The
disinclination to exert himse lf in any way which might cause the slighteststrainwas shown on thisdaywhen he complained that the dynamometer hurthis right hand and he did not dare to press it as hard as he would have likedto . He passed no urine from 8h 05m a. m .
,when he came out of the bed
calorimeter , until 8h 05m p . m . , just before entering the chamber, although hedrank al l of the 750 c .c . of distil ledwater, taking the last portion at 5h 50m p .m .
,
when he finished the psychological tests.
In the evening , just before entering the calorimeter, he said that the rectalthermometer irritated him considerably and had kept him awake more or lessthe night before . He was aware of its presence every time he woke up andduring the day the anus had been somewhat irritated . He asked if the temperature could notbe taken every other night instead of every night, as had beenplanned , and the thermometer was accordingly not used on the night ofApril 16— 17 .
April 17 , 1912 (fourth day offast) — Both the experimental records and L .
’s
report indicate that he slept better on the night preceding this day than he hadany night thus far passed in the chamber. The day was uneventful . He saidthat he had no great thirst and he drank the distilled watermore from a sense
of duty than from any desire for it. He did not leave the balcony during theday except for the psychological test at 4 h 5011“ p . in . At one time during theforenoon he was seen to hold up a light man , weighing but 125 poundskilograms) for a few seconds. He appeared pleased with this supposedly“sensational feat and was quite unappreciative Of the caution to conservehis strength for tests ofmuscular strength that could be measured , tests thathe had repeatedly refused to make.
On thisday hewore the stethoscopemost of the day , an assistant counting thepulse-rate at a distance from him and unknown to him for the greater part Ofthe time . It was hoped thatmore or less continuous records of the pulse-ratecould be obtained in thisway . In preparing him for the calorimeter at night,I personal ly inserted the rectal thermometer and he reported that it did nothurt him in any way . He be lieved that, when putting it in himse lf the firstnight, hemust have irritated the anus somewhat, thus causing the subsequentdiscomfort. The subject entered the calorimeter for the night at 8h 19m p . In .
April 18 , 1912 (fifth day offast) —The subject reported in themorning thathe slept quite we ll during the night, but not so wel l as he did the night before.
He thought he went to sleep about an hour after entering the calorimeter and
woke up several times during the night. He said he was entirely comfortable,the rectal thermometer giving him no trouble . The spring supporting thebed had been somewhat weakened in order to obtain a greater sensitivity forthe apparatus recording the muscular activity. The records show,
for the
most part , a remarkably quiet night, so that long calorimeter experiments of
10 or 1 1 hours will be perfectly comparable so far as the muscular activity isconcerned . In this respect the subject was exceptionally wel l adapted for anexperiment of this kind .
Notwithstanding the dul l weather , L. said that he felt very well , with noloss of strength , headache , feeling of hunger, or of apprehension. He was not
usually troubled with headache during a fast. When hismeasurementsweretaken,
his height was found to be meters. He said that his maximumweight was 14 stone or 196 pounds kilograms) . His initial weight for

GENERAL HISTORY OF FASTING EXPERIMENT . 4 1
the Malta fast was 12 stone and 3 pounds, or 171 pounds (776 kilograms) .During this fast he lost 37 pounds kilograms) , and thus weighed at theend Of the fast 134 pounds kilograms) . These measurements includedthe weight of the clothing worn and were taken with ordinary scales, butprobably represent average weights.
In the evening L. talked about his work in Malta and his interest in thenumerous fasting books which he had read . He became quite excited intalking of three legal cases in which he was involved inMalta, speaking with agood deal Of vigor and enthusiasm. There was not the slightest evidence of
his having fasted for 4% days. After inserting the rectal thermometer, thesubject entered the bed calorimeter about the usual time .
April (sixth day.
of fast) — The subject was sleeping very soundlywhen the calorimeter experiment was ended and on leaving the apparatus,reported that he had had a very comfortable night . He seemed very brightand quite like himse lf. According to the records Of the Observers, the subjectslept very well throughout the night until 5h 30m a. m . , when he rang the bel lintermittently for a Short time . He stil l continued to have no discomfort, nosensations of hunger, and no apprehensions, and felt very much inclined tomental work. He said he did not expect to have such an excellent fast andseemed to be content with the progress of the experiment. On this day thesubject spent considerable time in writing. To provide data for subsequentcomputation of the total energy transformation during the 24 hours, it seemeddesirable to measure the respiratory exchange while the subject was writing.
This type of experiment, which had never been attempted in this laboratorybefore, proved to be very successful , the subject sitting in a comfortable chairand writing as usual . (See Plate 1 , figure B , pageApril 20 , 1912 (seventh day of fast) —When the calorimeter was opened, no
odo r of acetone was apparent, and no unpleasant odor of any kind . Thus farin the series of calorimeter experiments, the only unpleasant Odor which hasbeen notedwas the strong smel l of onions on themorning following his eveningmeal of beefsteak and onions. L. said that he was in excellent condition ;intellectually he was very acute . He slept wel l throughout the night with nodiscomfort and rang the bel l only a few times . With the sunny weather thesubject’s spirits rose and he reported himse lf as feeling very happy and
uplifted ; he sang at times during the morning. A barber cut his hair andbeard on this day , the trimmings being saved for analysis.
After taking a bath in the evening, he entered the calorimeter. He toldone of the assistants that he felt very drowsy and expected to go to sleepalmost immediately.
April 21 1912 (eighth day of fast) — Ou coming out of the apparatus, thesubject reported that he did not go to S leep as quickly as he had expected to ;he lay awake for 2 hours and also woke up in the night once or twice . HeSlept well , however, and had several dreamswhich he reported to Dr. Langfeld.
L. asked if he did not have fever during the first 2 or 3 days of the fast, statingthat his wife during the first days of her fast had quite a high fever. Whenhe was told that he had had no fever he wasmuch surprised . His theory wasthat “
in the first days of the fast, the blood rid itself Of all impurities, theburning process producing a high fever.
In the afternoon, the subj ect went up to the roof,using the elevator ; he
remained there for about 1i’ hours, sitting in the sun and chatting on generalsubjects. He said considerable about hisexperiencewith Esperanto and aboutmany of his Maltese customs. His voice was strong, and he seemed to bevery well and bright. He came down from the roof by the elevator to theoffice and dictated into the dictaphone a statement regarding his feelings.
The dictated report is as fo llows .

42 A STUDY OF PROLONGED FASTING .
I felt very bright thismorning because the sun was shining very brightlyand the day is so fine and so sunny that it looks very much like one of myMaltese days for which I am very desirous. This afternoon I have been on
the roof of the laboratory so as to enj oy the sun,which I love so much because
I was born and bred in it, and I do not feel very fatigued at all or any appre
hension or any fear . I feel very hopeful that my fast wil l be not only a
very long one but avery successful one, and I feel no pangs ofhungerwhateveror any other sensations inmy stomach, and I think thatmy health is progressing because the catarrh of the head in my nose and in my pharynx before thestarting of the fast has nearly disappeared and I can aspirate very easilythrough my nostrils, a thing which I could not do very easily before , and alsoI feel that my eyes are getting less congested and better. I do not feel anydizziness at all, and I have never felt it, neither when I lean down to get upsomething that fal ls from the hand ; in fact, I can come down the steep stairsofmy balcony apartment very easily without taking ho ld of the railing andwithout any necessity of being helped by any one . My legs feel very strongand I do not feel any numbness in them.
”
The subject went from the office to the calorimeter laboratory on the elevatoranddrank a glass ofwater, but did not return to the balcony, as it was almosttime for the psycho logical tests . The rectal thermometer was used duringthe bed calorimeter experiment, observations being made every 10 minutesduring the night.
April 22, 1912 (ninth day offast) — Ou opening the calorimeter chamber noOdor was noticeable. The subject reported a very comfortable night and saidthat he felt very well , except that he had had a bad taste in his mouth forseveral days. He slept very quietly, ringing the bel l only three times.
During the day he had visits from a number of scientific men,withwhom he
talked considerably. He was particularly interesting and vivacious in discussing his experiments with Professors Cannon and Fo lin and with Dr.
Cathcart . He reported that he did not now feel so much inclined to mentalwork , explaining this fact on the ground that “
the brain was occupied ineliminating the impurities from the blood .
”
April 23 , 1912 (tenth day offast) — Thismorning L. said that the precedingnight was the best that he had had in the calorimeter. He was very quietduring the night and rang the bel l but a few times. He still complained of thebad taste in hismouth.
In the afternoon a respiration experiment of two periodswasmade with thesubject Sitting in a chair. In this experiment certain abnormal values wereObtained for the pulse-rate and the respiratory quotient, and Mr. Carpenterthought that there was a slight irregularity in the action of the heart . Sincethe man was essential ly different as to his total metabo lism from the daybefore , Dr. Goodal l was asked to examine him during Dr. Langfeld
’s tests.
Dr. Goodal l noted the heart rate before, during, and after the dynamometertest, and pronounced the subject to be in an excellent condition .
L. had been less self-assertive for the week previous, much more inclinedto cooperate in the experimental routine, and a little more reconciled to thefact that the observers were familiar with their technique . He was morequiet and less argumentative than formerly and was at times considerablydepressed , spending much of the time in thinking of home . In conversationhe seemed very intel ligent and interested in everything, and by no meanslethargic . He professed to have no discomfort from the rectal thermometer, although he stated frankly that he feared its use very much beforecoming to America. He also was becoming accustomed to the respirationchamber and did not find it at all irksome .

44 A STUDY OF PROLONGED FASTING .
wasmade with him while he was sitting in a chair. He was very drowsy andthought he could sleep throughout the whole night, as the previous night hehad not slept as wel l as formerly. As he doesnot read in the evening, he foundit somewhat tedious to Sit idle until 8 o
’clock, when he usual ly went into thecalorimeter, and he asked to go into the apparatus an hour earlier. A respiration experiment was made early in the evening just before he went into thecalorimeter, and this experiment was made a part of the experimental routineon subsequent days . He entered the bed calorimeter at 9 p . In.
April 27 , 1912 (fourteenth day of fast) .— The subject reported that he hadhad avery comfortable night ; he rang the be ll but twice during thewhole timehe was in the calorimeter chamber. About 10h 45m a. m . , L. was taken in theelevator to the third floor of the laboratory, where he was shown about andseveral pieces of apparatus were exp lained to him . He then walked downstairs to the second floor and when about a third of the way down, he commenced to move rapidly and final ly actual ly ran down the stairs. In the Officehe looked at some photographs and dictated the fol lowing statement :
To—day is the fourteenth day ofmy fast. I feel exceedingly well ; I feelcheerful and hopeful of the grand success. I have slept several good hoursduring the night, and am enjoying with great enthusiasm all the experiencesthat are carried on me by the professor. I have to-day with ProfessorBenedict gone around the upper floors of the laboratory and I have admiredal l the great formalities that I have seen.
Subsequently hewalked out into the hal l and down-stairs to the calorimeterroom, where he sat down in an arm chair andwas the subject of a respirationexperiment.
In the afternoon I spent about an hourwith L. on the balcony. Hewasverycheerful and talked a great deal , gesticulating freely with his hands. Heseemed to enj oy talking about the “ beautiful island of Malta. He worevery much lighter clothing to-day , not using hisheavy blanket wrapper at all.In fact, while walking about the laboratory, he carried his blanket wrapperover his arm , and although the officewas a little coo l , he did not put it on,
butsat near the window.
One of the striking features Of this fast is the fact that it has been so differentfrom what he expected in many ways, a good il lustration of the unreliabilityof personal impressions. For instance , he had expected to feel very chilly,but while he said he felt chilly the first two or three days, it is possible thatthismay have been due to his imagination,
as subsequently be was not nearlySO chilly and on this day asked that the temperature of the room should belowered , which was done . He also said one of the first days that he was inthe laboratory that he would have a large amount of phlegm as the fast progressed, but this had not been the case up to this date . While talking withDr. Ash on this day , L. said that he had expected that he would become veryhoarse during the fast, but thus far his voice had not changed, except to growclearer. In the evening he was given a bath
,his body being sponged with
distilled water, after which he entered the calorimeter.
A iril 28 , 1912 (fifteenth day of fast) — The experimental records show thatthe subject slept very well throughout the night and he himself reported a
good night. In the afternoon he was taken out for a carriage drive , with thewindows of the carriage Open. He waswell wrapped up, and said that he wasperfectly comfortable and did not get too tired . He walked down to the
basement and out to the carriage and on his return walked from the carriageup
-stairs again into the calorimeter laboratory. He then sat down for severalminutesand later a photographwas taken ofhim,
with the blackboard showing
GENERAL HISTORY OF FASTING EXPERIMENT . 45
his body-weight curve as a background . He seemed unusual ly strong andactive , walked with certain feet, and did not seem to be in any way exhaustedor tired . He talked very excitedly during the whole of the drive ; in fact , hetalked continuously. He said that about 6 O
’clock that morning he had hada normal seminal emission, which did not irritate him as did the one just priorto the fast. His Observation was verified by Dr. Goodal l ’s subsequent examination of the urine , a large number of spermatozoa being found .
April 29 , 1912 (sixteenth day offast) — When the calorimeter was Opened inthemorning, the usual absence of odor was recorded , and the subject reportedhimself as very comfortable and as having slept very well . Inasmuch as itwas not L .
’s custom to use a toothbrush— at least no toothbrush was found in
his luggage and he had not brushed his teeth since his arrival in Boston— itseemed desirable to obtain some cultures of themicro-organisms of themouth.
These were secured by Dr. Kendall , of the Harvard Medical Schoo l , but theexamination of them showed only adventitious organisms. L.wasmuch interested in this test, especial ly as such a test had never beenmade in a previousfast. Early in the forenoon ,
hewasvery irritable and complained of the execssive amount of drinking water ; hewas especially disturbed because he had notheard from home . While Mr. Carpenter wasmaking the respiration experi
ment in the afternoon, the subject did not seem quite so well as on other days.
April 30 , 1912 (seventeenth day offast) —When he came out of the chamberin the morning, L. reported that the night had been one of the best he hadhad since coming to the laboratory. The Observer said that there was no odorand that the subject was very comfortable . Aside from the taking of a seriesOf new photographs, the day was uneventful .May 1 , 1912 (eightet day of fast) — The observers
’records Show that the
subject scarcely moved during the night, and that the bel l rang only once or
twice . There was no odorwhen the apparatuswas Opened . In the afternoonof this day ,
L . was taken for a drive .
May 2, 1912 (nineteenth day offast) — L . reported a very comfortable nightin the calorimeter ; no odor was apparent when the apparatus was opened .
At this stage of the fast, it had become very clear to the observers that L. had
changed since the beginning. While he walked slowly and steadily and gaveno special evidence of weakness, he was much less talkative , less inclined tooffer advice , andmore quiet and subdued . He was by no means so active a
man as at the beginning of the fast. He complained that for severalmorningspast he had “ felt his bones” during the night and was SO uncomfortable thathe waked up and turned over. It had become increasingly difficult to adjustthe stethoscope so as to obtain a clear record of the pulse-rate . On this dayso much difficulty was experienced that an assistant was detailed to watch themovement of an artery in the neck . Hisvoice was somewhat weaker, thoughnothusky, but it occasional ly rose to its original tone . Furtherm ore
,although
he hadmaintained that about this period of the fast he would be intellectuallybetter, he was in reality disinclined to read , write , or talk asmuch as at thebeginning. This was wel l brought out by the fact that when he was to ld on
this day that he ought to spend his time studying the principles of the apparatus and the technique rather than to trouble himself about the results, hestated that he did not want to Spend so much time in thisway and that he didnot find himself very much interested in them,
but that he would be betterlater on . This appears to contradict the statement that he would be moreactive intellectually as the fast progressed . Hewasmeasured byDr.Andersonon this day , who remarked that, as he saw him only once aweek , it was veryObvious to him that he had changed very much Since the beginning of the fast.
His loss in flesh was of course much more apparent to Dr. Anderson than to

4 6 A STUDY OF PROLONGED FASTING .
those of us who saw him daily. In the afternoon he was taken to the roo fagain, where he stayed for a little more than an hour. When he returned tothe calorimeter laboratory, he sat down in a chair until the psycho logical testsbegan. He stil l had a great interest in the various tests and made the suggestion that the rectal thermometer be inserted before the evening respirationexperiment, so as to get the temperature changes during this experiment.
May 3 , 1912 (twentieth day of fast) .— Although the subject reported that hedid not sleep so well as he did the night before, he nevertheless had a fairlycomfortable night. There was no odor apparent on Opening the chamber.
As the weatherwas exceptional ly fine , L. was taken for a drive in the afternoon.
May 4 , 1912 (twenty-first day of fast) — The subject reported thismorningthat he had had “
several good hours of sleep .
” He was very comfortable ,except that he had to change his position several times during the night. A
number of unsuccessful attempts were made to take the pulse-rate with thestring galvanometer, but the apparatus was broken. In the afternoon thesubject was taken out driving. In the eveningmuch time was spent in findinga suitable location for the stethoscope , and when the place was finally foundit was so sharply localized that amovement of the stethoscope be ll 1 cm. in
any direction would prevent the taking of good records. It was then agreedUpon that if during the night the pulse recordswere not obtainable, a signalto L . would be given, who would place the hell of the stethoscope as nearly ashe could in the place decided on. Fortunate ly, on this and also on the fol
lowing night the pulse-rate was secured with considerable regularity.
May 5 , 1912 (twenty-second day offast) — The experimental records Showedthat the subject remained very quiet throughout the night, ringing the bellonly once or twice . In the afternoon of thisday hewas taken out for a carriagedrive of two hours. He enjoyed this drive verymuch indeed , speaking enthuelastical ly about the beauty ofBoston and its suburbs, and how it elevated himto see it. When he returned , he claimed that he was neither tired nor co ld ,although the air was coo ler than when he went out the day before .
He had changed considerably during the preceding week , a fact whichwasnoted by several persons who had not seen him during that period . Hewalkedmuchmore deliberately,but appeared to be perfectlysure of his footing.
When he came down-stairs to take the psycho logical tests, he took the lastthree or four steps quite rapidly and stepped off briskly to greet Dr. Langfeld .
On the other hand , at the end of the psychological test, he sat rather dejectedlyin his chair. When Dr. Langfeld to ld him that the tests were over, however,he rose from the chair immediately, and returned to the balcony, but stoppedhalf-way up the stairs to look at the string galvanometer with which we wereworking , and seemed as inte llectually keen and bright as any one.
May 1912 (twenty-third day of fast) —On coming out of the chamber, L.
reported that he had a fairly comfortable night, Sleeping very well . He complained , however, that as he had lost SO much adipose tissue , he found itrather diffi cult for him to sleep on one side for any length of time , and he wasobliged to turn from one side to the other frequently. The Observers alsofound it extremely difficult to get the records of the pulse-rate . L. wasmuchstimulated as a result of visitors in the forenoon. He exhibited a muchSharper intel lectual activity than had been apparent for several days, whichmight possibly prove his statement that he would become more intellectual lykeen as the fast progressed . Other than that we could see little evidence Of
the so-called intellectual activity that he had referred to frequently duringthe fast .May 7 , 1912 (twenty-fourth day of fast) — The subject was fairly quietthroughout the night, moving only occasionally. When the calorimeter was

GENERAL H ISTORY OF FASTING EXPERIMENT . 4 7
opened , no odor was observed . Thus far in the fast, no acetone odors hadbeen noted . In the forenoon a number of visitors came into the laboratoryand several smal l photographswere taken of L. In the afternoon respirationexperiment, when the subj ect sat writing, he was reported as being veryobstinate and intractable. He seemed to have some difficulty in finding aposition to suit him , and the nose-pieces had to be inserted a second time tomake sure that they were well fitted . He also complained that the writingpaper was too heavy, so that he would have to write on both sides of the paperto save postage . He appeared to be very difficult to please . At 5 o
’clock onthis day , L. reported that he was feeling very much depressed , owing to theweather, and that he Spent the whole time thinking about home and was
much worried .
May 8 , 1912 (twenty-fifth day offast) — The subject reported a very comfortable night, moving only once or twice during the night. In order to controlthe possible influence of smal lmuscular movements on the temperature of theair in the chamber at the end of an experimental period , the height of theSpirometer attached to the calorimeter was recorded on a smoked paper drum,
a routine which proved very helpful on subsequent nights. On this morningL . was very sullen and disagreeable when spoken to , especial ly with Mr.
Carpenter. He said that he had expected there would be a yel low pigmeutation of the skin as in other fasts, but this did not appear. In the afternoonI asked him howmuch longer he wished to fast. He replied by asking howlong I wanted him to fast. As I had previously to ld him on several occasionsthat I should like him to fast 30 days, it was obvious that he wished to beasked to stop fasting rather than to break the fast himself. I to ld him thatwe should probably wish him to fast for 30 or 31 days. The diet of there-alimentation period was then discussed . He believed very strongly thatthe fast should be broken with acid fruit juices alone . The rectal thermometerremained in position throughout the day and the temperature records weresecured for the greater part of the time .
May 9 , 1912 (twenty-sixth day of fast) . -The subject spent an unusual lyquiet night, ringing the bell only three times throughout the night . In the
afternoon,during an active conversation which I had with him
,in which
general questions were discussed , he seemed to be very spirited , lively, andinterested . His pulse-ratewas 86 at this time . In the evening,when he came
down-stairs to take the psychological test, he appeared to be quite unsteadyon his feet and said that he was light-headed . He thought that his unsteadiness was due to the fact that he had lost so much weight that he put unusualstrength on his foot , more than he needed to take his weight, and that thistended to unbalance him . Mr. Carpenter also noticed that when walking
,L.
was quite uncertain in his steps and thereafter we watched him more closelywhen he was on his feet. He said considerable on this day about the methodof breaking the fast, emphasizing the fact that he wished to be able to say thatthe fast was broken by request and not by his desire . It was arranged toallow him to fast for 31 days, and then to begin taking food. He also expresseda preference for breaking his fast on a diet consisting of boiled rice and honey,with the juice of oranges and lemons and grape juice . Obviously such a dietshould have many scientific points of interest, but it was questionablewhether, after fasting so long, the stomach should be fi lled with the acids oforanges, lemons, and grapes. He was firmly convinced that thiswas the dietthat should be used and could not be dissuaded from it. Subsequent experience proved the undesirability of this kind ofa diet for breaking a long fast.
May 10 , 1912 (twenty—seventh day offast) — The subj ect reported that he didnot Sleep SO wel l during the night as he had the night previous. He was not

48 A STUDY OF PROLONGED FASTING .
uncomfortable in any way , but simply could not sleep . There was no noticeable odor. In a discussion with some physicians who visited him to-day , L.
emphasized the fact that his tongue remained coated throughout the wholefast and that he hadmore or less of a bad taste in hismouth. His theory wasthat the waste productswere not all eliminated from the body and that “ theywere trying to find their way out by the mouth.
” He thought that if he haddefecated he would have had less discomfort. Although the subject went fora drive on the afternoon of this day , he complained that the weather hadchanged and that it was not pleasant. He also complained bitterly to Dr.Langfeld regarding Mr. Carpenter, saying that he would like to break everybone in his body. Thiswould pronounce against fasting for amiability.
May 1 1 , 1912 (twenty-eighth day offast) -L . reported that it was late beforehe fel l asleep and that he had not been able to sleep much or soundly duringthe night. In the early part of the evening, after he had been sealed into thecalorimeter
,he signaled that he was obliged to urinate and he had to be taken
out. When he was sealed up again shortly after 10h 30m p .m . , he thought hedid not go to sleep until 12 o
’clock . Hemoved several times during the night.
During the afternoon Of this day he spent some time on the roof, reading, andseemed to enjoy himself very much , appearing to be in good spirits all of theafternoon. Butwhen he came down from the roof, he was extremely stubbornwhen taking his tests with Dr. Langfeld . For example , in a list of tenwordswhich was read to him formemorizing, the eighth word was “ wart.
” L. did
not understand what itmeant and asked to have it explained . Dr. Langfeldtried to keep him quiet until the list was read a second time , but he would notlisten and insisted upon knowing what the word was. When Dr. Langfeldread the list to him a second time , he said that he had not heard the words, ashe was thinking of what the word wart” meant.May 12 , 1912 (twenty-ninth day offast) - The subject said that he slept verywel l the previous night and in the morning seemed very bright. He busiedhimse lf much of the forenoon in writing a history of his life . (See p .
A respiration experiment was made with him in the morning in which the
subject breathed an atmosphere containing a large percentage of oxygen.
In the afternoon I took him for a drive Of 2 hours. During the drive hewas bright and very talkative , telling a good deal about his family, his personal history, and his difficulty in getting an education . He became more
quiet before he returned to the laboratory and in the psycho logical test hetold Dr. Langfeld that the weather depressed him very much . He alsoto ld Dr. Langfeld that he was very sorry that I wanted him to break the fastand that he could easily fast for 10 days more ; he did not like to break hisfast until his tongue had become clear. On the other hand , he said that hewould be out of the laboratory onMay 23 andwould be a free man again and“have free ice cream.
”It was evident that he would be difficult to control .
There has been none of the pigmentation of the skin which he had expectedand very little ph legm.
May 13 , 1912 (thirtieth day offast) —L . reported that he had slept wel l . Hewas in excel lent Spirits on this day and very lively and jolly. Hismovementswere vigorous and he was unusually bright and active . All of his spare timewas occupied inwriting his autobiographical notes, which at this time covered13 closely written pages. As usual he felt quite able to be photographed .
At noon I asked him how he was and he replied that he felt very well indeed ,saying : We have seen the lighthouse and are now entering the harbor andwil l see land shortly.
”
In the afternoon I took him to the Boston City Hospital , where Dr. FrancisH .Wil liamsmade an extensive series ofX -ray photographs. L. was intensely

GENERAL HISTORY OF FASTING EXPERIMENT . 49
interestedin this, and also thoroughlyenjoyed the ride to and from the hospital .He was very much pleased with the whole day’s program. He said that hewas
“now dropping anchor and therefore at the end of the voyage . His
mental condition seemed to make a great difference in his whole make-up.
On some days his faculties were very much keener than on others. For in
stance, during the test for visual acuity, he answered the position of theletter “
E” with great strength of voice and with no hesitation whatever.
May 14 , 1912 (thirty-firstday offast) — Ou this day, which was the last dayof the fast, the program was very full , including an extensive series Of photographs (see Plate 5) and the body measurements . The first word that L.
spoke when the calorimeterwas opened was in regard to having his photographtaken. In response to an invitation issued by the Nutrition Laboratory, anumber of medical men from the vicinity of Boston came to see the subjectbetween 2 and 3 o
’clock in the afternoon. L. talked very rapidly and in alively manner for nearly 40 minutes, setting forth his views in amore or lesslucidmannerto hisaudience . In themiddleofhis talk, I took hispulse-rate andfound it tobe82. The subjectwasparticularlydesirousofhavinghisphotographtaken during the afternoon andwished to be photographedwith each individualwho had worked with him . In this afternoon talk with the physicians
,L.
made many conflicting statements . For instance, he said that he never usedwine or alcoho l in any form, while he had repeatedly told me that he frequentlydrank Malta wine and was not a teetotaler. He also reported that he wasinvariably a vegetarian, fruitarian, and nutarian
,eating no meat ; this was
strikingly in contrast with the fact that he ate meat several times in the daysjust preceding the fast. During the visit Of the physicians, he became verymuch excited and enthusiastic , evidently enjoying the Opportunity of speakingto his audience . During the respiration experiment in the evening, he talkedconsiderably about the end of the fast, saying that while he was not exactlytired , yet there wasmuch emotion connected with his fast and he was thinkingOf the effect produced at home when the news reached them that he hadcompleted the fast of 31 days successfully. Maltawas awaiting the news andall of the people would be discussing his wonderful feat.
Figures D ,E, andF in Plates 2 and 3 (pages 19 and 31) are from photo
graphs secured on this last day of fasting. Figure E is of special interest, asit showsL. posing for 20 secondswhile the exposurewas being made . Thereis no evidence of unsteadiness.
RE—ALIMENTATION PERIOD .
May 15 , 1912 (first day with food) .— The bed calorimeter experiment wasended at 7h 56m a. m. When the apparatus was Opened there was no odorapparent . The observer reported that th e subject was comparatively quietthroughout the night
, with but one movement between l l b 44 m p . m. and
511 28m a. m. L. complained , however, that he was kept awake by acid fumes
and noise in the calorimeter room. Photographs were taken of the subjectwhile he wasupon the respiration apparatus, and also later in various positions.
When he wasweighed after the respiration experiment was over, it was foundthat he had lost kilograms of his initial weight . He seemed muchpleased that the fast was ended and spoke of the excitement there would be athis home when the cablegram was received announcing the successful completion of his fast.The method of breaking the fast had been thoroughly discussed with the
subject previously, but he insisted upon using lemons, oranges, grape juice ,and honey. It was final ly arranged that he should fo llow his own choice in
the matter and, accordingly, lemons, oranges, boiled rice , and honey were

50 A STUDY OF PROLONGED FASTING .
supplied him at his request. At 9h 38m a. m. be peeled and ate two lemons,using neither water nor sugar . In addition, three oranges
,about 300 grams
of honey, and approximately 1 liter of grape juice were taken in portionsduring the day . To study the flora of the co lon, a rectal injection of sterilesalt water was given him at 111 lom p . In . About 4 h 30m p . in . he complained ofsevere co lic, butwas somewhat relieved about 5h 30m p .m. by a copiousmovement Of the bowels. Subsequently he again had colic , with a second movement of the bowels and vomiting. He appeared to be utterly wretched andweak , and to have entirely lost his courage . The contrast between his highSpirits of the day before and his condition on this day was very striking.
NO respiration experiments were attempted on this day after the ingestionof food , but a sample of the blood was taken, and records were made of the
blood pressure and the alveolar air. Under the circumstances, it did not seemwise to have the subject Sleep in the calorimeter. Arrangementswere therefore made for him to sleep on a couch in the calorimeter laboratory, with aphysician in constant attendance . While no records of the metabo lism wereObtained during the night, the pulse-rate was recorded by means of the
stethoscope , the assistant sitting behind a screen out of sight of the patient.
May 1912 (second day with food) . -The subject passed a restless night ,having another attack of colic about 2 a. m . and defecating. The pulse-ratethrough the night was somewhat higher than on previous nigh ts. As he
seemed weak and sick in themorning, Dr. Goodall,who came to see him early
in the day , urged him to take some weak beef tea or clam broth,also toast,
but he utterly refused to take anything of this nature , saying that such foodwould poison him . He furthermore said that as we were now through withhim , we wished to poison him . He was as firm ly convinced as ever that hismethod of breaking the fastwas the correct one , but thought that he took foodtoo soon and that he should have waited until his tongue had cleared , as heconsidered it dangerous to break the fast sooner. He to ld the physician inattendance during the night that a man might have to fast 100 days beforethe natural hunger would return. L. lay on the couch until about 10 a. m . ,
when hewent to the balcony and dressed . He continued his diet of fruit juicesand honey throughout the day , but, at our urgent request, diluted the lemonjuice with distilled water, taking first 77 c .c . of lemon juice , an equal amountof distilled water, and 1 1 grams of honey. Between 9h 30m a. m. and 7h 30m
p . m . , he drank at intervals amixture containing the juice of 6 oranges, 367 c .c .of water, and 128 grams Of honey, making a total vo lume of about c .c .About 7h 3om p . m .
,he took the juice of another orange , saying that he was
hungry but felt very wel l . During the day Dr. Goodall made the usualphysical examination ; the blood pressure and the alveolar air were alsoobserved . The subject entered the bed calorimeter at 8b l4 ‘n p . m. for the
usual night experiment.
May 17 , 1912 (thirddaywith food) — At 10 p . m. the subject te lephoned andurinated , but after that time the experimental records Show that he was veryquiet. When he left the apparatus in themorning, he said that he had had avery comfortable night, Sleeping better than he had for years. He thoughthe must have had at least 10 hours of dream less sleep . He appeared to be ingood Spirits. The usual respiration experiment was made with him thismorning. Throughout the day , he continued taking at intervals a m ixtureof orange juice and honey, diluted with water ; he was also supplied withraisins and dates. The usual physical examination wasmade byDr. Goodall ;also tests of the blood pressure, the alveo lar air, and for acetone in the breath.
A sample of the blood was taken byDr. Ash . In the afternoon he went up onthe roof for a time, but was ill-humored , very diffi cult to please, and ful l of

52 A STUDY OF PROLONGED FASTING .
May 20 .
— Patient was very angry on coming into the hospital , first,because he was in a public institution , whereas he had expected to go into a‘convalescent home for wealthy people .
’Second , because the fact of his
gpi
lng lo a hospital after his fast would detract from the renown and interest
0 is eat.
Yesterday he appeared very happy. He seemed to realize and accept thatthere were certain disadvantages here . He was asked what diet he wantedand requested straight house diet, and this was given him in accordance withthe ideas ofDr. Benedict. He ate thiswith relish. He appeared a littleweak ,
but able to be about. He spent the day in writing and in sorting out variousarticles and pictures, ofwhich he had a half of a valise ful l .
“ Last night he was nauseated and vomited several times, but was not illenough to be reported . This morning he was again very angry. He com
plained that oatmeal was very bad for a man recovering from starvation.
He repeated his complaints of Saturday (May 18) and said that he was beingheld by conspiracy andwanted to summon or go to the British consul . Hewas therefore discharged at his own request .
“ While at the front door waiting to have his bil l arranged and hisvaluablesprocured , he complained loudly that his possessions were being withheld fromhim . While waiting for a carriage to be summoned , he called out loudlymanytimes that he would get out of here if he had to crawl on his hands and knees.
“ While in the wards he was shown every attention by the nurses, andespecially all food and drink brought to him as desired .
“ Discharged to own M. D . (Not
Subsequent to his leaving the Massachusetts General Hospital , L . was seen
by Drs. Langfeld and Goodal l and a second set of X—ray photographs wastaken by Dr. Wil liams. Such data as were secured are included in the
individual reports.

PHYSICAL CONDITION OF THE SUBJECT DURING THE FAST.
BY HARRY W. GOODALL ,
A complete physical examination of the subject was made 60 hoursbefore the beginning of the fast, on the first day of the fast , and everyalternate day thereafter. So far as possible
,the same conditions as to
time of day,posture
,methods
,etc. ,
were Observed at each examination .
The percussion outline of the various organs was markedwith pencil andthese lines were not disturbed until variations in the size of the organsmade it necessary . Owing to the thinness of the subcutaneous tissuethe percussion note could be sharply defined and the favorable mentalattitude of the subject permitted complete muscular relaxation.
Family history— Father 68 years of age , mother 64 years, both living and
well . Two sisters, one 27 years of age , the other 19 years, both living andwell . One sister died in infancy ofmalaria. One brother died in childhoodof croup . Twin brother died in infancy, cause unknown .
Past history— Was a delicate child , the most pronounced characteristic
being a sensitive nervous organization. Does not remember about diseasesof childhood . In his twentieth year (20 years ago) , while in the university,he had a severe nervous breakdown and had to give up his studies. Hassuffered from neurasthenia Since. Has been under the care of several physieiaus at different periods without receiving any benefit. Being discouragedwith these experiences, he became interested in certain popular articles advocating fasting as a cure for diseases, including neurasthenia, and in April 1910he underwent his first fast . SO great was the improvement in his nervouscondition fol lowing this fast that he has since devoted much of his attentionto the study of fasting. Previous to the present experiment he has undergonethe fo llowing fasts :
April 1910. Fasted 8 days, taking nothing but water ; not under observation.
March 1911 Fasted 40 days, taking nothing but water ; under partialobservation .
August 1911 Fasted 12 days, taking nothing but water ; under partialobservation.
November 1911 . Fasted 5 days, complete fast ; not under observation .
These experiences have convinced him that, in health , food not onlymakes the individual susceptible to diseases and causes disease, butalso interferes with the proper exercise of the mental faculties . He
states that during the fasting period the mind is clear and alert andthat there is a strong desire for study. It is now the practice of hiswife
,his two children
,and himself to abstain entirely from food during
any illness , and he is convinced that the severity of any disease isreduced
,the subjective symptoms made less disagreeable
,andthe course
of the disease shortened if such a course is pursued .
54 A STUDY OF PROLONGED FASTING .
His personal experiences and his study have been so convincing thathe was desirous of undergoing a scientific experiment , under the mostperfect conditions
,for the benefit of humanity. Having learned that
the most perfect equipment in the world was at the Nutrition Laboratory , he applied for the privilege of undergoing th is experiment there .
He expressed his pleasure at the cordial manner in which he had beenreceived at the laboratory, and stated that he was very happy in thethought that he was about to undertake the fast , not alone on accorint
of the scientific value of the experiment , but also because Of the im
provement which he anticipated in his own well-being . He expressedhis pleasure in going into minute details as to his subjective fee lings .
RESULTS OF PHYSICAL EXAMINATION.
April 1 1 , 1912 (60 hours before beginning the fast):A well-developed , well-proportioned , and fairly well-nourished man .
Height, cm. weight, kilograms; age , 40 years. Standserect. Walks with body erect, with no abnormalities in the gait.
Hair of head and beard dark . Skin has amuddy yel lowish tinge , butis soft andmoist. Slight conjunctivitis of both eyes. Verymoderateamount of subcutaneous fat. Muscles of moderate size but rathersoft. Has a smal l infected papule on left alae naszs . No pulsationsnoted in the neck , chest, or abdomen. No visible abnormalities.
Mouth : Mucousmembrane ofthe lipsand cheeks ofgood color andmoist.
Tonguemoistwith aslight coating, especiallyon the central andposterior portions. Teeth in fair condition. There is a slight deposit ofdisco lored tartarat the base of the teethandtwo teethhave temporarysoft fillings. No particular odor to the breath. No enlargement ofthe tonsils. Pharynx is reddened , the blood vessels dilated , and thereare a few blebs on the posterior pharyngeal wall with a little mucusadhering.
G lands : Cervical , axillary, and epitrochlea glands not palpable . A fewsmal l glands in both groins .
Reflexes: Pupils equal and react normal ly to light and distance. Abdominal , cremasteric, patella, Achilles, and plantar reflexes normal .
Chest : Symmetrical ,well formed , some sinking in of the supra and infraclavicular spaces. Good expansion with inspiration . NO bulgingof the praecordia, and apex beat of heart is not visible or palpable .
Lungs: Percussion of the right lung shows normal resonance to the upperborder of the fifth rib in the nipple line , to the lower border of thefifth rib in the axillary line, and to the eleventh rib in the back . Onthe left normal resonance to the eighth rib in the mid-axillary lineand to the eleventh interspace in the back . Vocal fremitus isslightly increased and expiration slightly pro longed at the right apex,extending to the second rib in front and the spine of the scapulabehind . There were no rAles and the lungswere otherwise negative .
Heart : The area of superficial cardiac dullness (light percussion) wasmeasured from a perpendicular line through the mid-sternum and ahorizontal line drawn at the level of the nipples. The upper borderof cardiac dul lness was at the third interspace . The left border ofcardiac dullness was cm. from the mid—sternum,
cm. insidethe nipple . The right border of cardiac dul lness was cm . from

PHYS ICAL CONDITION OF SU‘
EJECT DURING FAST . 55
April 1 1 , 1912— C ontinued .
the mid-sternum. The total width of cardiac dullness was cm.
The cardiac soundswere somewhat distant,but of good quality and
regular rhythm. There were no murmurs to be heard . The aorticand pulmonic second sounds were of equal intensity.
Pulse : The pulses were equal , regular at the rate of 82 per minute .
Rhythm regular, vo lume fair. No sclerosis of the vessels noted .
Abdomen : The abdomen was symmetrical , rather prominent whenstanding, but flat when reclining. It was soft, tympanitic, but withno distension. There was no tenderness on palpation . Nothingabnormal was felt.
Liver : The upper border of liver dullness was at the lower border of thefifth rib in the nipple line . The lower border of liver dul lness was1 cm. below the costal margin . Total width of dullness cm.
The edge of the liver was indistinctly palpable, soft, and withoutirregularities.
Stomach : The measurements of the stomach were determined as accurately as possible by means of auscultatory percussion . The linesof measurement were the median line of the body and a horizontalline through a point half-way between the tip of the ensiform and the
umbilicus. Tympany in themedian line extended from the tip of theensiform to a point cm. above the umbilicus, a total distance of
11 cm. The left border of tympany extended to a point 16 cm. fromthe median line . Faint rhythmic sounds were to be heard with thestethoscope . There was no splashing with palpation.
Spleen : The upper border of splenic dul lnesswas at the eighth rib . The
area of splenic dullness was vaguely determ ined as 7X 5 cm. The
Spleen was not felt.
Kidneys: Neither kidney was palpable .
Genital organs : Aside from a long prepuce and a slight left variococele ,the penis and testicles were normal .
April 14 , 1912 (first day offest) :Abdomen : Not as prominent. Flat to percussion everywhere except
over the area Of stomach tympany.
Stomach : No rhythmic sounds heard .
No change noted in general appearance, mouth , glands, reflexes,chest,
lungs , heart, pulse, liver, Spleen,kidneys, or genital organs .
April 1912 (third day offest)Mouth :NIO change noted,with the exception of a pronounced odor to the
breatReflexes : NO change noted except patella reflex not as active .
Liver : Lower border of liver dullness at coStalmargin. Total width of
dullness cm. Edge not felt. (First change noted .)Stomach : Tympany in the median line extends from a point 3 cm. above
the tip of the ensiform to 7 cm. above the umbilicus. Total widthcm. Left border of tympany 18 cm . from the median line .
Active peristalsiswith pronounced rhythmic sounds.
NO change noted in general appearance , glands, chest, lungs, heart, pulse,abdomen , Spleen, kidneys, or genital organs.
April 18 , 1912 (fifth day offest) :Mouth : No change noted . Odor to breath still pronounced and tonguemore heavily coated .
Reflexes: Patella reflexes only obtained with reenforcement.

56 A STUDY OF PROLONGED FASTING .
April 18 , 1912— Continued .
Abdomen : Not as prominent while standing, retracted while reclining.
Dul l to percussion,except over the area of stomach tympany.
Marked visible pulsation of the aorta.
Liver : NO change from note of third fasting day .
Stomach : Tympany in the median line from a point cm. above thetip of ensiform to cm . above umbilicus. Total width, cm .
Left border of tympany 16 cm . frommedian line . Rhythmic soundswere audible but notmarked .
No change noted in general appearance,glands, chest, lungs , heart , pulse,
Spleen, kidneys, or genital organs.
April 20 , 1912 (seventh day offast)General appearance : No change noted , except that the featuresare slightly
drawn and subjectmoves about a little more slowly.
Mouth : No change from note of fifth fasting day .
Reflexes : NO change in pupillary and plantar reflexes. Pate lla reflexesobtained with diffi culty. Achilles reflex very slight.
Heart : Left border of cardiac dullness cm. and right border 1 cm.
from mids ternum . Total width, cm . (first change noted) . NOchange in character of sounds.
Abdomen : NO change from note of fifth fasting day .
Liver : N0 change from note of third fasting day .
Stomach : M pany from a point 3 cm. above the tip of the ensiform to
8 cm . above the umbilicus. Total width cm. Left border 14cm . frommedian line . Rhythm ic sounds heard .
No change noted in glands, chest, lungs, pulse, spleen, kidneys, or genitalorgans.
April 22 , 1912 (ninth day offast) :General appearance : Conjunctivitis not quite so marked . Infected
a w lgal igse Otherwise no particular 0 ange.
Mout Mucous memfirane of tongue andmouth dry. Tongue slightlyless coated . Odor to breath not so pronounced .
Reflexes : Patel la and abdominal reflexes absent . Achil les reflex Obtainedonly with difficulty. Cremasteric and plantar reflexes normal .
Heart : Left border of cardiac dul lness 8 cm. , right border 1 cm. frommid-sternum. Total width 9 cm. (second change in size of heartnoted) . No change in character of Sounds.
Abdomen : No change from note of fifth day .
Liver : NO change from note Of third day .
Stomach : Tympany from a po int 4 cm. above tip of ensiform to 8 cm.
above the umbilicus. Total width, cm. Left border tympany14 cm . from median line.
No change noted in glands, chest, lungs, pulse , spleen, kidneys, or genitalorgans.
April 24 , 1912 (eleventh day offast)General appearance : Features somewhat drawn . Muscles not quite so
firm . Skin more elastic. Seborrhea sicca of entire scalp . Walkswithout evidence ofweakness. No unsteadinesswhen standing witheyes closed .
Mouth : Mucous membrane of mouth and tongue dry. Lips dry and
desquamating. Odor to breath lessmarked .
Reflexes: No change from note of ninth day of fast, except Achilles reflex
Chest : Some sinking in of supra and infra-clavicular spaces.

PHYS ICAL CONDITION OF SUBJECT DURING FAST . 57
April 24, 1912— Continued .
Heart : NO change noted inmeasurements ofheart from ninth day of fast.Faint systolic souffle heard all over the praecordia, loudest at the apex.
Not transmitted, and not related to the respiratorymurmur . Intensity not influenced by posture . Heart sounds not so distinct.
Pulse : Vo lume of pulse not so good .
Abdomen : No change from note of fifth day of fast .Liver : NO change from note of third day of fast.Stom
lach z
d
No change from note of ninth day of fast . Rhythmic soundsear
No change noted in glands, lungs, spleen, kidneys, or genital organs .April (thirteenth day offast)General appearance . Features not so drawn . Conjunctivitis somewhatimmoved . Otherwise no change from note of eleventh fasting day .
Mouth : NO change from note of eleventh fasting day .
Reflexes . No change from note of eleventh fasting day .
Chest : No change from note of eleventh fasting day .
Heart : No change from note of eleventh fasting day .
Pulse : No change from note of eleventh fasting day .
Abdomen : Markedly retracted when reclining.
Liver : No change from note of third fasting day .
Stomach : Tympany from a point 3 cm. above tip of ensiform to 8 cm.
above the umbilicus. Total width cm. Left border of tympanycm. frommedian line . Rhythmic sounds heard.
Kidneys: Pole of right kidney just palpable . (First change noted .)No change noted in glands, lungs, spleen, or genital organs.
April 28 , 1912 (fifteenth day offast)General appearance : Odor to breath less pronounced . Stands erect.
Has normal gait but moves about more deliberately. Seborrheaw m rgl’fid.
Mouth : Mucousmembrane ofmouth and lipsmoist. No desquamationof lips. Tongue slightly less coated .
Reflexes: No change from note of eleventh fasting day .
Chest : No change from note of eleventh fasting day .
Heart . No change in measurements of heart from note of ninth fastingday . The systo lic souffie which appeared on the eleventh fastingday is no longer heard . Intensity of heart sounds not increased .
Pulse . No change noted from note of eleventh fasting day .
Abdomen : Retracted . Dul l to percussion everywhere except over thearea Of stomach tympany. NO tenderness on palpation except slighttenderness over the pulsating aorta. The large intestines appear tobe about the Size of a thumb and can be rolled under the fingerextending from the caecum up to the right hypochondrium and fromthe left hypochondrium down to the brim of the pelvis. There is nogurgling With pressure.
Liver : The upper border of liver dullness is 1 cm. lower thanat the
beginning of the fast. Total width 9 .5 cm. (second change in size) .Stomach : Tympany from a point 8 cm. above the umbilicus . Totalwidth cm. Left border of tympany 13 cm. from themedian line.
Rhythmic sounds heard .
Kidneys: No change from note of thirteenth fasting day .
No change noted in glands, lungs, spleen, or genital organs.

58 A STUDY or PROLONGED FASTING .
April 30 , 1912 (seventeenth day offast)General appearance : Features not so drawn,
otherwise no change fromnote of fifteenth fasting day .
rwise no changes
Reflexes: No change from note of e leventh fasting day .
Chest : No change from note of eleventh fasting day .
Heart : Left border of cardiac dullness cm. ,right cm . frommedian
line . Total width 8 cm . (third change in the size of heart noted .)No further change in quality of heart sounds.
Pulse : No change from the note of the eleventh fasting day .
Abdomen : No change from the note of the fifteenth fasting day .
Liver : No change from the note of the fifteenth fasting day .
Stomach : No change from the note of the fifteenth fasting day .
Kidneys: No change from the note of the thirteenth fasting day.
No change noted in glands, lungs, spleen, or genital organs.
May 2 , 1912 (ninetet day offast)General appearance : No change from note of seventeenth fasting day.
Mouth : No change from note of seventeenth fasting day .
Reflexes : No change from note of eleventh fasting day .
Chest : No change from note of eleventh fasting day .
Heart : Left border of cardiac dullness 7 cm. from the median line, rightborder atmedian line . Total width, 7 cm. (fourth change in measurements of heart noted) . No change in quality of sounds from thenote of the fifteenth fasting day .
Pulse : No change from note of eleventh fasting day .
Abdomen : No change from note of fifteenth fasting day .
Liver : N0 change from note of the fifteenth fasting day.
Stomach : Tympany from a point cm. above tip of the ensiform tocm. above the umbilicus. Total Width
, cm . Left border of tympany 1 1 cm. from median line . No rhythm ic sounds heard .
Kidneys: No change from note of the thirteenth fasting day .
No change noted in glands, lungs , spleen, or genital organs.
May 4 , 1912 (twenty-firstfasting day)General appearance : The soft parts of the extremities not so firm and
not so large . Otherwise no change from the note of the seventeenthfasting day .
Mouth : No change from the note of the seventeenth fasting day .
Reflexes: No change from the note of the eleventh fasting day .
Chest : N0 change from the note of the eleventh fasting day .
Heart : No change from the note of the nineteenth fasting day.
Pulse : No change from note of the eleventh fasting day .
Abdomen : No change from the note of the fifteenth fasting day .
Liver : Upper border of liver dullness at sixth rib, lower border at costalmargin . Total width cm . (third change noted In size of liver) .
Stomach : Area of tympany the same as noted on the nineteenth fastingday . Rhythmic sounds heard .
Kidneys: Right kidney palpable , po le of left kidney (for first time) justfelt with deep inspiration .
No change noted in glands,lungs, Spleen, or genital organs.
May 1912 (twenty-third day offast) :General appearance : No change from note of the twenty-first fasting day .
Mouth : Mucous membrane moist. Very slight coating on tongue .
Very little odor to breath .

60 A STUDY OF PROLONGED FASTING .
May 12, 1912— Continued .
Heart : No chang e from note of twenty—fifth fasting day .
Pulse : No change from note of eleventh fasting day .
Abdomen : Aside from a slight gurgling of gas and liquid in the righthypochondrium with palpation no change noted from twenty-fifthfasting day .
Liver :fill
ota
)
l width of liver dullness cm. (fifth change noted in size0 1ver
Stomach : No change from note of twenty-first fasting day . Rhythmicsounds heard .
Kidneys : No change from note of twenty-first fasting day .
No change noted in glands, spleen, or genital organs.
May 14 , (thirty-first day offast)General appearance : The features have a drawn appearance. Subject
stands erect. Walks with body erect and shows no abnormalities ingait but moves about slowly as if fatigued . The skin has amuddyye llowish appearance but is soft and moist. The skin is relaxed andis easily picked up , as if there were but little subcutaneous fat. Themuscles are rather smal l and not firm . There is a slight conjunctivitis of both eyes. No abnormal pulsation noted in the neck or
chest , but the pulsation of the abdominal aorta ismarked, especiallywhen reclining.
Mouth : Mucousmembrane of the lips and cheeks of good co lor andmoist .Tonguemoist, with avery slight coating on the posterior part . Teethshow a slight deposit of disco lored tartar at the base . The breathhas avery slight odor. No enlargement of the tonsils. The pharynxshows some injection of the blood vessels and a few blebs on theposterior pharyngeal wal l . There is a little mucus on the posteriornaso—pharynx .
G lands : Cervical , axillary and epitrochlea glands not palpable . A fewsmall glands in both groins.
Reflexes : Pupillary, cremasteric, andplantarreflexesnormal . Abdominal ,pate l la and Achilles reflex not obtained . No ankle clonus. NoRhomberg.
Chest : Symmetrical. Ribs prominent. Marked sinking in of the supra~
and infra-clavicular spaces. Good expansion with inspiration .
Lungs : Percussion of the right lung shows normal resonance to the lowerborder of the sixth rib in the axillary line , to the eleventh rib in themid-axillary line and the eleventh rib in the back . On the left normalresonance to the eighth rib in the mid-axil lary line and to the eleventhinterspace in the back . The percussion note is high pitched at
both apices. Vocal fremitus is slightly increased at both apices,more especial ly on the right. The respiratory murmur is normalthroughout.
Heart : The upper borde1 of cardiac dullness is at the fourth rib ; the leftborder of cardiac dullness cm. from the mid-sternum; the rightborder cm . to the left of the mid-sternal line . Total width,cm. The cardiac sounds are distant ; the first sound of the heartis not clear. The aortic second sound is somewhat sharper than thepulmonic second .
Pulse : The pulses are equal and regular, but smal l volume . No sclerosisof vessels noted .
PHYS ICAL CONDITION OF SUBJECT DURING FAST . 61
May 14 , 1912— Continued .
Abdomen : Symmetrical . Flat when standing. Much retracted whenreclining. Marked visible pulsation of the abdominal aorta. The
abdomen is everywhere flat to percussion except over the area of
stomach tympany. There isno tenderness except over the abdominalaorta. Intestinesabout the size of a thumb ; can be ro lled under thefinger extending from the caecum to the right hypochondrium and
from the left hypochondrium down to the brim of the pelvis. Thereis slight gurgling with pressure in the right hypochondrium.
Liver : The upper border of liver dul lness is from the lower border of thesixth rib to the costal margin. Total width of liver dullness 6 cm.
Edge not felt.
Stomach : Tympany from a point 2 cm. above tip of the ensiform to apoint 8 cm. above the um bilicus. Total width cm. Left borderof tympany 13 cm. frommedian line . Rhythmic sounds heard.
Spleen : The upper border of splenic dullness is at the eighth rib . Area
of splenic dul lness vaguely determined as 6X 5 cm. The Spleenwas not felt.
Kidneys : Right kidney readily palpated . The po le of left kidney is felt.Genital organs : Aside from a long prepuce and a slight variococele on the
left, the penis and testicles are normal .May 15 , 1912 (two hours after breaking fast) :General appearance : Features slightly drawn. Walks erect but delib
erately , as if fatigued . No unsteadiness in gait . The tongue is cleanand there is no odor to the breath. Otherwise no change in the
physical examination fromnotesof the thirty-first and last day of fast.May 16 , (24 hours after breaking fast) :General appearance : Features quite drawn. Walks hesitatingly and a
little unsteadily. Marked lassitude . Voice weak and faltering.
Mouth : Mucous membrane of lips and tongue dry . Tongue slightlycoated posteriorly.
Abdomen : When subject is standing, abdomen is symmetrical and slightlymore prominent than on last day of fast. When reclining, theabdomen is not so retracted . The right half of the abdomen issomewhat more prominent than the left. The right half of theabdomen is tympanitic ; the left half flat to percussion. Palpationof the right half elicits some rumbling of gas and liquid and causesslight pain. Rhythmic sounds are heard on the right half.
Liver : Upper border of dullness at upper border of sixth rib, lower borderat the costal margin. Total width, cm. cm. wider than on
last day of fast) . Edge not palpable .
Stomach : Tympany from a point cm. above ensiform to a point 8 cm.
above the umbilicus. Total width, 10 cm. Left border of tympany17 cm . frommedian line . Rhythmic sounds heard . Otherwise thephysical examination is the same as on the last fasting day .
May 18 , 1912 (3 days after breaking fast)General appearance : Features appear thin but not drawn. Walks slowly
but with no unsteadiness. Voice more natural .Mouth : Tongue is clean .
Heart : The left border of cardiac dullness is 7 cm. from the mid-sternalline , the right border at the mid-sternal line . Total width 7 cm .
cm . larger than on last fasting Both sounds of heartdistant but clear and distinct.

62 A STUDY OF PROLONGED FASTING .
May 18 , 1912— Continued .
Pulse : Good vo lume to pulse .
Abdomen : Slightlymore prominent when standing. Abdomen ful l whenreclining. Symmetrical . Tympanitic all over, with no differencebetween the two sides.
Liver : Upper border of liver dullness at fifth rib, lower border at costalmargin. Total width
,cm . (the same as at the beginning of the
fast) . Edge not felt.
Stomach : Tympany from a point cm. above the tip of the ensiformto apoint cm . above the umbilicus. Total width , cm. Theleft border of tympany extends to a point 16 cm. from the medianline . Rhythmic sounds heard . Otherwise no change from the lastfasting day noted in the physical examination.
May 19 , 1912 (4 days after breaking fast)General appearance : Features drawn . Conjunctivae injected (from weep
ing) . Forehead bathed in cold perspiration. Marked tremor tobands . Gait unsteady. Walks as if quite weak physically. (General condition that o f hysteria.)
Tongue : The tongue is clean .
Heart : Left border of cardiac dullness 7 cm. from median line. Rightborder cm . to right of mid-sternum . Total width, cm .
Sounds clear and more distinct. Aortic and pulmonic secondsounds of equal intensity.
Stomach : Tympany from a po int cm. above the tip of the ensiform tocm. above the umbilicus. Total width, cm. Left border
of tympany 16 cm. from the median line . Rhythmic sounds heard .
Otherwise no change from the last fasting day no ted in the physicalexamination.
October 19 , 1912 (5 months after breaking fast) :General appearance : General aspect not that of a well-nourished man.
Weight 126 lbs. , 15 ounces kilograms) (nude) . Stands erect.
Gait normal . Skin has a muddy yellowish tinge , but is soft and
moist . Slight conjunctivitis of both eyes. Smal l amount of subcutaneous fat. Musclesmoderate in size and rather soft . No pulsation noted in neck , chest , or abdomen .
Mouth : Mucousmembrane of lips and cheeks moist and of good co lor.The tongue has a slight coat, especial ly on the posterior portion.
Deposit of disco lored tartar on the teeth. Slight odor to breath.
Pharynx is reddened, the blood vessels injected, and some mucusadherent.
G lands : Cervical , axillary and epitrochlea glands are not palpable . Afew small glands in both groins.
Reflexes : Pupils equal and react normal ly to light and distance . Abdominal , cremasteric, patella, Achilles, and plantar reflexes normal .
Chest : Symmetrical,well formed . Some sinking in of the supra and
infra-clavicular spaces. Good expansionwith inspiration. No bulging of the praecordia and apex beat of the heart is not visible orpalpable.
Lungs: Percussion of the right lung shows normal resonance to the upperborder of the fifth rib in the nipple line , to the lower border of thefifth rib in the axillary line, and to the eleventh rib in the back . On
the left normal resonance to the eighth rib in the mid-axillary lineand to the eleventh interspace in the back . Vocal fremitus is slightlyincreased and expiration slightly prolonged at the right apex, ex

PHYS ICAL CONDITION OF SUBJECT DURING FAST . 63
October 19 , 1912— Continued .
tending to the second rib in front and the spine of the scapula behind .
There were no rales and the lungs were otherwise negative .
Heart : Left border of cardiac dullness 9 cm. from mid-sternum . Rightborder 2 cm . to right ofmid-sternum. Total width, 11 cm. Soundsclear. No murmurs. Aortic and pulmonic second sounds of equalintensity.
Pulse :The pulseswere equal , regular at rate of 82 per minute . Rhythmregular, vo lume fair. No sclerosis of the vessels noted . Systo licblood pressure , 120mm. Hg . , diasto lic , 85mm. (Riva-Rocci instrument, sitting position .)
Abdomen : The abdomen is symmetrical,rather prominent when standing
but flat when reclining. It is soft, tympanitic , but no distension.
There is no tenderness on palpation. Nothing abnormal felt.
Liver : The upper border of liver dullness at the upper border of the Sixthrib. Dullness extends to 2 cm. below costal margin. Total width
ff dullness 1 1 cm. Edge indistinctly palpable, and with no irreguarities.
Stomach : Tympany in themedian line extended from the tip of the ensiform to a point cm . above the umbilicus, a total distance of 1 1 cm.
The left border of tympany extended to a point 16 cm. from the
median line. Faint rhythmic soundsare to be heard with the stethoscope. There is no splashing with palpation.
Spleen : The upper border of splenic dullness is the eighth rib . Area of
splenic dullness vaguely determined as 7X 5 cm. Spleen not felt.Kidneys: Neither kidney palpable .
Genital organs : Aside from a long prepuce and a slight left variococele,the penis and testicles are normal .
SUMMARY AS TO PHYSICAL CONDITION.
General appearance : The general appearance of the subject remainedgood throughout the period of observation. A gradual loss of bodytissuewasevident, but the changeswere notmarked from day to day .
Themost pronounced change was in the abdomen, which became flatas soon as he ceased to take food and was distinctly retracted afterthe fifth fasting day . This for the most part appeared to be due tothe prompt disappearance of gas in the intestines. The actual lossin body tissue appeared to be quite evenly distributed over the body,but wasmost noticeable in the tissue of the back of the neck , in thesinking in of the supra and infra-clavicular spaces, and in the prominemce of the ribs.
The muscles of the extremities, which were but moderately firm at thebeginning of the fast, appeared to have softened to a slight degree .
The muscular movements became less active after the seventh fastingday , but the impression was that of muscular fatigue rather thanweakness. The gait was always steady and there was no swayingof the body while standingwith the feet together and the eyes closed .
The features frequently appeared drawn after the first week , but thiswas present, as a rule , only during periods of mental depression.
The tremor of the hands, the weakness of the muscular movements,and the changes in the voice noted at the end of the fast and afterbreaking the fast were apparently a part of his hysterical condition.
The muddy yel lowish tinge to the skin did not change throughout

A STUDY OF PROLONGED FASTING .
The conjunctivitis present at the beginning improved slightly afterthe ninth day of the fast, butwas even more marked after the fastwas broken, probably because of weeping.
Mouth : The co lor of the mucousmembrane remained good throughout.
No changewasnoted in the teeth (the teethwerenot brushed throughout the period of observation) . The slight coating on the tonguebecame more pronounced until the ninth fasting day , when it beganto disappear slowly. The tongue did not become entirely cleanuntil the third day after food was taken. On the third day the odorof the breathwas offensive, becoming fetid . After the ninth day thiswas less pronounced and gradual ly decreased until the twenty-thirdday , after which time very little odor was noticed .
On the ninth fasting day themucousmembrane of themouth and lipswasdry . On the e leventh day the lipswere desquamating (at the sametime the seborrhea of the scalp appeared) and this continued untilthe fifteenth day of the fast and did not occur again . The decreaseof these signs promptly fol lowed the prescribed intake of largerquantities of water. No change was noted in the chronic nasopharyngitis.
G lands: No change whatever was noted in the cervical , axillary, epitrochlea glands, or the glands in the groins.
Nervous system : During the first week of the fast the mental attitudewas a cheerful one . He was enthusiastic about the experiment butvery Opinionated . From this time on to the end of the fast he was
frequently depressed and sometimes irritable . On these days he wasdisinclined to talk, his physical movements were more deliberate ,and he was more sensitive to any physical discomfort, such as
pressure of the hands. He attributed this to the depressive effectsof the rain and cloudy weather, but the impression was that he feltactual physical fatigue . On the last day of the fast and for the
remaining period of observation be exhibited varying mental statesof depression, irritability, and sullenness, weeping at times. Takingthe period as a who le there was a gradual increasing depression and
irritability, which, with the onset of abdominal pain, manifesteditself in hysterical conditions. There was no outward demonstrationof any mental improvement as a result of the fast.
Reflexes: The pupillary, plantar , and cremasteric reflexes were normal
through the fast. The pate lla reflex gradually diminished and on
the fifth day could only be obtained by re-enforcement and on the
ninth day and during the remainder of the fast could not be obtained .
The abdominal reflexeswere absent on and after the ninth day , andthe Achilles on and after the eleventh day . Five months after, thereflexes were normal .
Chest : No change wasnoted in the chest,with the exceptionofthe gradualsinking in of the supra and infra-c lavicular spaces and the prominence of the ribs as the subcutaneous tissues disappeared .
Lungs: As the loss of tissue in the supra-clavicular space progressed , thepercussion note of the apices became slightly higher pitched . The
lower border of resonance of the right lung fo l lowed the decrease inthe size of the liver. N0 change was noted in the respiratorymurmur.
Heart : There was a gradual decrease in the percussion border of the heartnoted as fo llows, the total diminution in size of heart during fastbeing cm


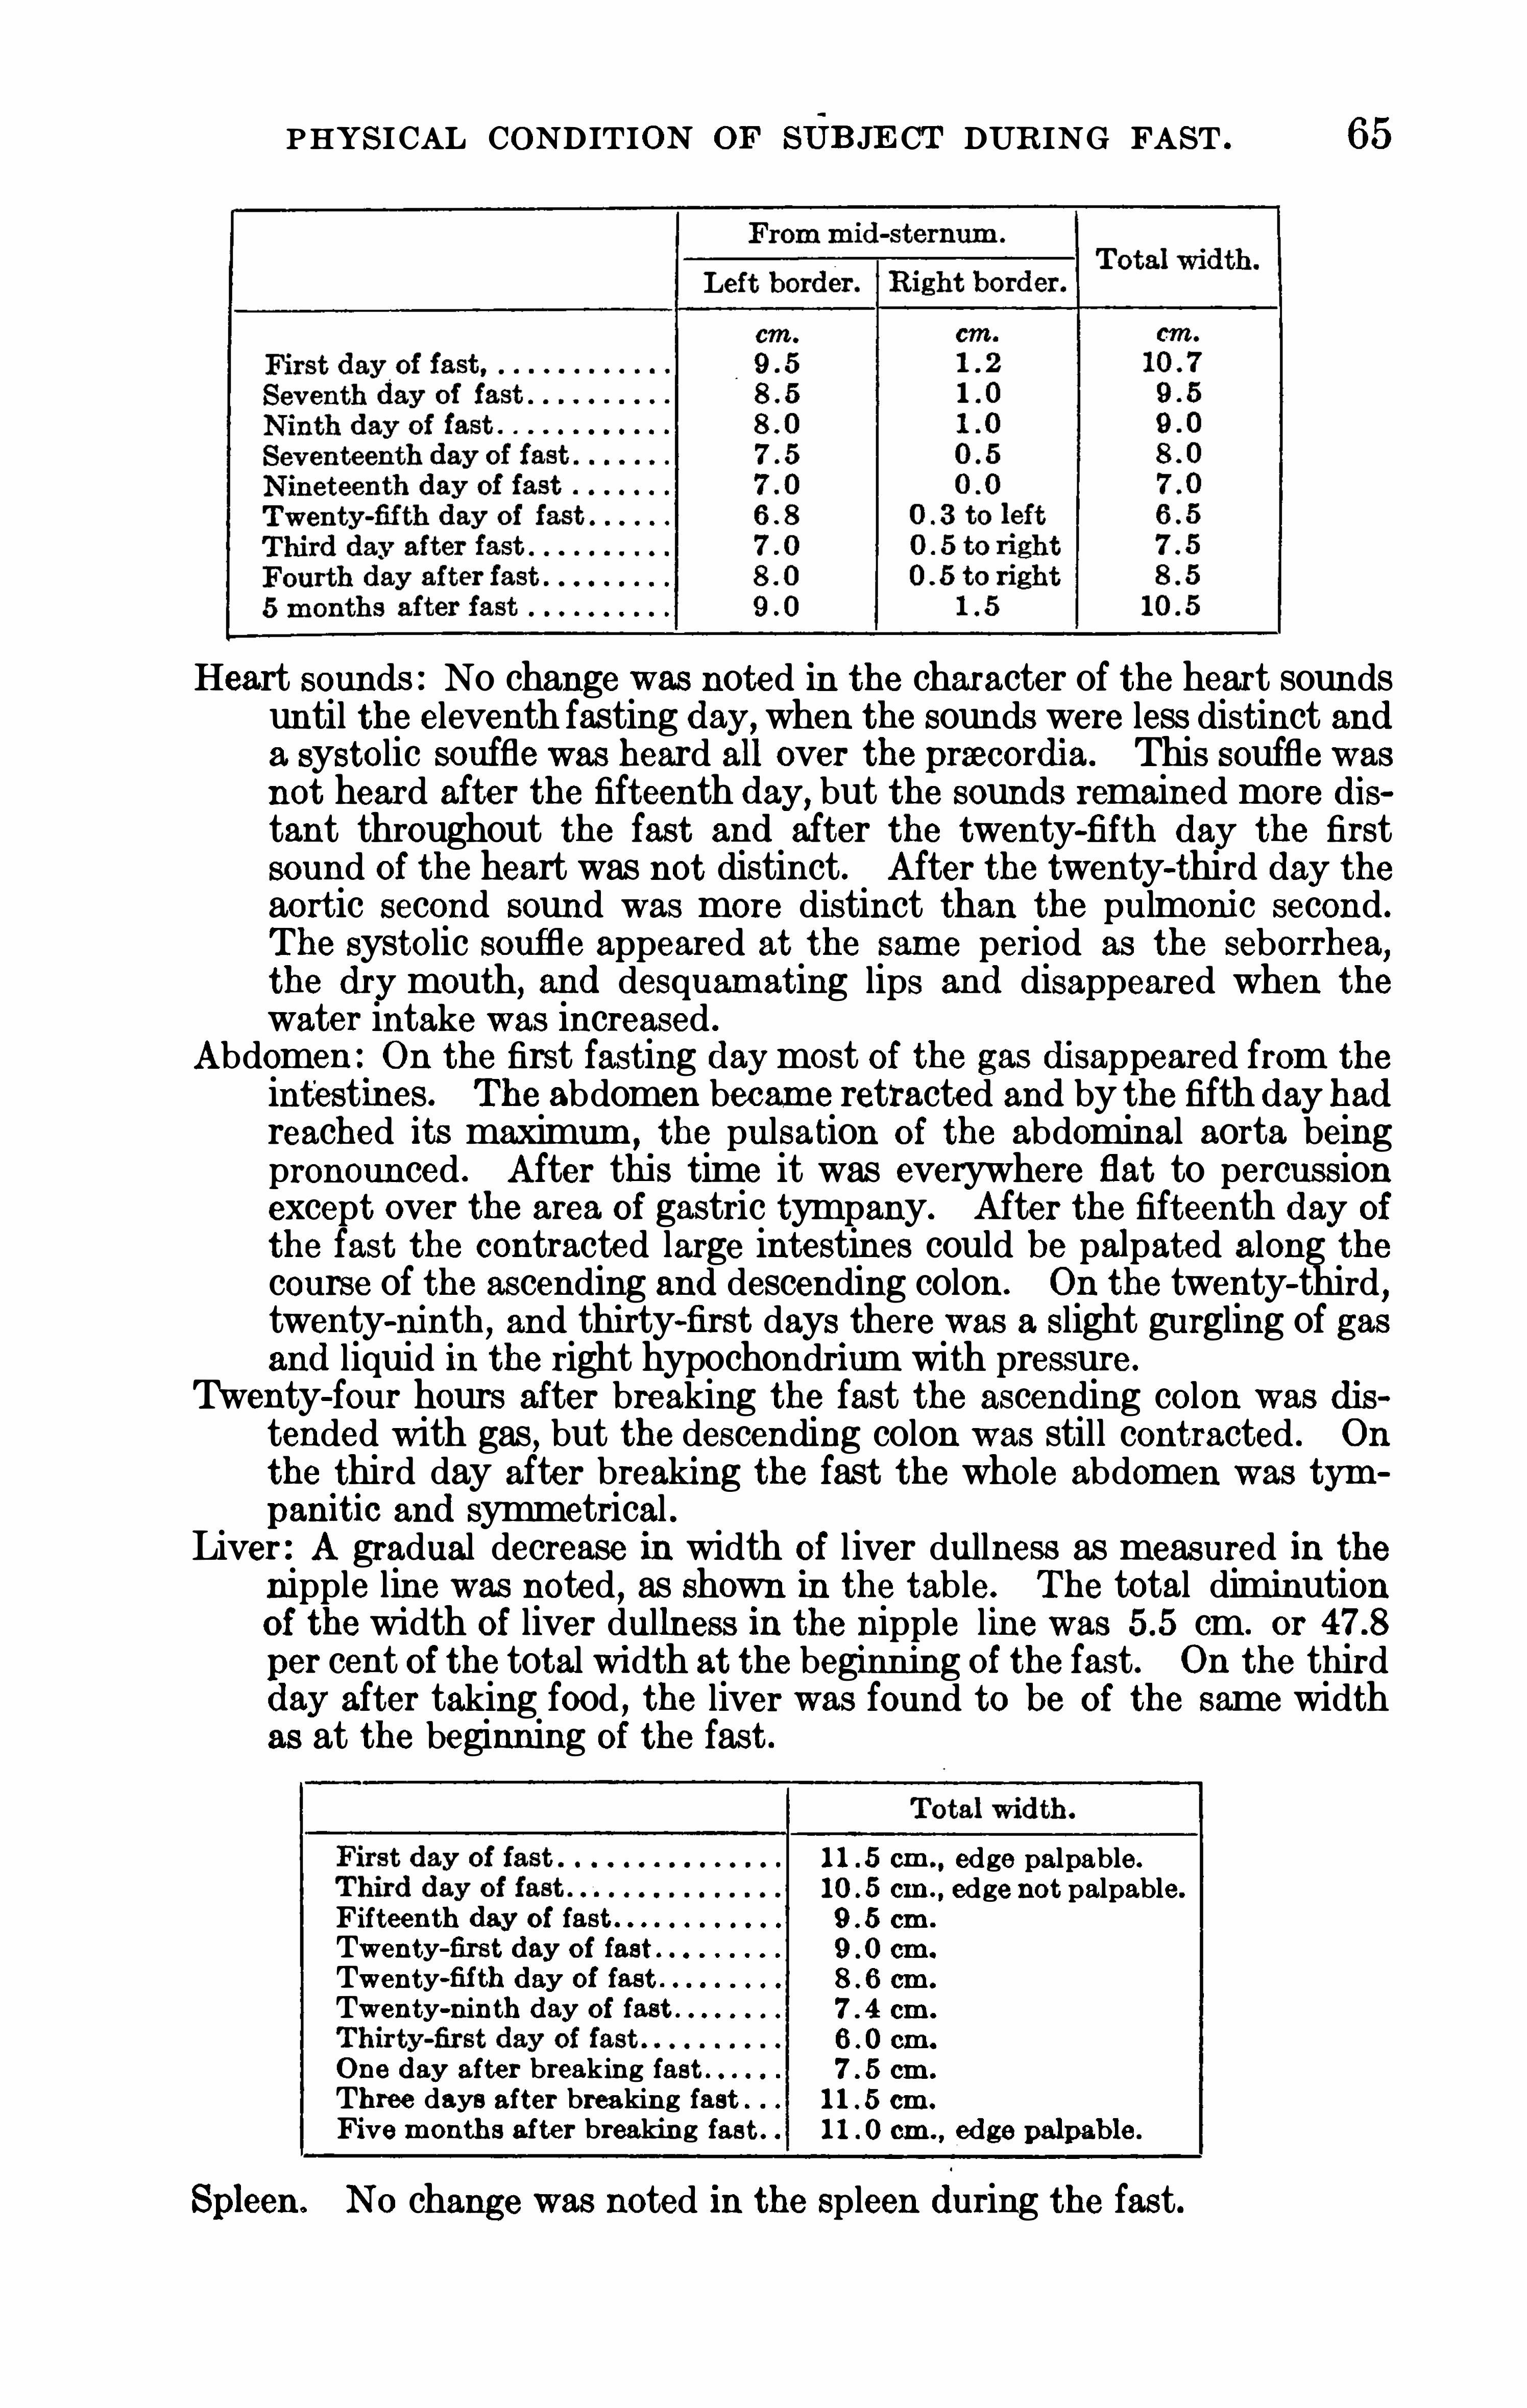
PHYS ICAL CONDITION OF SUBJECT DUR ING FAST . 65
Heart sounds : No change was noted in the character of the heart soundsuntil the eleventh fasting day , when the soundswere less distinct anda systolic souffle was heard all over the przecordia. This souffle wasnot heard after the fifteenth day , but the sounds remained more distant throughout the fast and after the twenty-fifth day the firstsound of the heart was not distinct . After the twenty-third day theaortic second sound was more distinct than the pulmonic second.
The systo lic souffle appeared at the same period as the seborrhea,the dry mouth, and desquam ating lips and disappeared when thewater intake was increased .
Abdomen : On the first fasting daymost of the gas disappeared from the
intestines. The abdomen became retracted and by the fifth day hadreached its maximum , the pulsation of the abdominal aorta beingpronounced . After this time it was everywhere flat to percussionexcept over the area of gastric tympany. After the fifteenth day of
the fast the contracted large intestines could be palpated along thecourse of the ascending and descending colon. On the twenty-third ,twenty—ninth , and thirty-first days there was a slight gurgling of gasand liquid in the right hypochondrium with pressure .
Twenty-four hours after breaking the fast the ascending co lon was distended with gas, but the descending colon was still contracted . On
the third day after breaking the fast the who le abdomen was tympanitic and symmetrical .
Liver : A gradual decrease in width of liver dullness as measured in thenipple line was noted , as shown in the table. The total diminutionof the width of liver dullness in the nipple line was cm. or
per cent of the total width at the beginning of the fast. On the thirdday after taking food , the liver was found to be of the same widthas at the beginning of the fast.
Fifteenth day of fastTwenty-first day of fastTwenty-fifth day of fastTwenty-ninth day of fast
One day after breaking fastThree days after breaking fastFive month s after breaking fast .
Spleen. No change was noted in the spleen during the fast.
1 1 .5 cm edge palpable .
10 5 cm . , edge not palpable.
cm .

66 A STUDY OF PROLONGED FASTING .
Kidneys: On the thirteenth day of the fast the right kidney was palpableand on the twenty-first the left was palpable and both remained soduring the rest of the fasting period . Five months later neitherkidney was palpable.
Genital organs: No change noted in the genital organs during the fast.
Observations ofthephysical condition ofBreithaupt,who fasted for 6 days,ofGetti,who fasted for 10 days, and ofBeauté ,who fasted for 14 days,failed to Show any change in the size or position of the organs.
PHOTOGRAPHIC STUDY OF SUBJECT.
The most striking external evidence of prolonged inanition with afasting subject is the degree of emaciation. In order to visualize thisas much as possible as the fast progressed
,an extensive series of photo
graphs was taken practically once a week . At these times the calorimeter laboratory was specially warmed with gas stoves, particularlyin the part of the room where L. was to pose
,and screens were put in
place for the background . The subject undressed and put on a smallloin c loth ; he was then posed on a low pedestal , which was coveredwith black cloth . In the selection of poses we had the valuable adviceof Professor W. G . Anderson , of Yale University.
Probably no routine throughout the whole fast pleased the subjectmore than this series of photographs , as he seemed obsessed with thedesire to have himself photographed . We were accordingly able toobtain a large number of photographs of the subject in a variety ofposes . Several of those obtained on the first and last days of the fastare given in Plates 4 and 5 . In the latter part of the fast the subjectbecame somewhat less sure of his footing and rested lightly against awooden frame . A rough approximation of the measurements of thisman may be made by using 640 m . as the inside distance betweenthe wooden uprights . Lack of time prevented our adjusting theaccurate mirror arrangement of Friedenthal1 for securing photographsthat could subsequently be measured . It should be considered,however , that the chief reason for taking this series of photographswas to visualize the general appearance
,
of emaciation andnot to furnishmaterial for exact measurements of the loss of tissue . This was supplied by the accurate measurements made according to the regularschedule by Professor W. G . Anderson . (See p .
In addition to the anatomical photographs , a great many photographs were taken of L. at his own desire , since this seemed to bethe one thing which would amuse him at any time . Accordingly thecamera was pointed at him several hundred times throughout thecourse of the fast , although admittedly many of these were false exposures . A considerab le number of photographswere thus obtained whichShow him in his environment , some of which are deemed worthy ofreproduction (see Plates 1 , 2, and 3 , pages 1 1 , 19, and
lFriedenthal , Med. Klmik, 1909 , No . 19 , p. l .

ANTHROPOMETRIC MEASUREMENTS.
The importance of careful anthropometric measurements for notingthe diminution in size of the body as the fast progressed has been recognized by all writers on fasting. Fortunately Professor William G .
Anderson,of Yale University, was in Boston during the period when
this fasting experiment was being made and he kindly offered to makea series of anthropometric measurements of the sub ject . In this hewas assisted by Dr . W. L . Anderson . These measurements were madeapproximately once a week, Dr. W. L . Anderson making a specialtrip from New Haven to complete the series at the end of the fast .Professor Anderson reports that “
the measurements of the forearmare taken with the hand tightly closed and the wrist slightly flexed .
The measurements of the upper arm are taken at the largest part afterthe elbow is completely flexed and a l l flexors and extensors contractedto their utmost . In taking the measurements of the calf and thigh, weselect the largest part after the man has contracted the muscles aswell as he can while in the standing position .
”
The measurements for each week are given in table 1 , the totaldecreases in the various girths for the whole fast being given in the lastcolumn . As would be expected , the largest change in girth was at thewaist
,there being a decrease of 153 mm . The girth of the abdomen
decreased 1 19 mm .,while a large decrease is Shown for both thighs
and for the chest . Certain of the measurements were not made untilthe second or third examination ; the losses are therefore inclosed inparentheses to indicate that the series of measurements was not
complete . The distinct loss in practically all measurements is obvious .In the hope of securing some evidence in regard to the muscular
strength of the subject,Professor Anderson brought with him his
dynamometers to test the strength . To our great surprise , the subjecteven before the fast began refused to carry out any of these tests,stoutly maintaining that he was not an athlete but a professionalgentleman and that he was not accustomed to doing muscular work ofany kind . This was wholly in line with his attitude toward othermuscular-work tests which were contemp lated
,but which it was neces
sary to omit,great ly to our regret . The only evidence that we have
regarding the muscular strength of the subject is the material obtainedin the dynamometer tests which were secured every afternoon byProfessor Langfeld . Even regarding these we are somewhat uncertain as towhether the subject exerted his greatest strength in all the tests . The
pressurewhich he placed Upon the dynamometer was clearly influencedby his fear that such pressure might give him a little pain
,to which he
was strongly averse .

68 A STUDY OF PROLONGED FASTING .
TABLE 1 .— Measurements of subj ect L .

BODY-WEIGHT.
To the ordinary individual the most striking index of the severity ofa prolonged fast is the loss in body-weight , the abstinence from foodresulting in great emaciation . The fact that even in the Short spaceof 24 hours the body-weight changes considerably is not so patent , anda consideration of these changes is of interest . If the body-weight isdetermined each hour throughout the day, it will be seen that whilesudden fluctuations accompany the ingestion of food, the voiding ofurine
,or the passing of feces , there is a general tendency for a regular
fall in the body-weight from hour to hour amounting, with adults, tonot far from 40 grams per hour .
1 During the night , the decrease inthe body-weight is regular, although not quite so rapid . Since such atendency is shown in the course of 24 hours , it would normally beexpected that it would be more especially evident in the 20 or 30 daysof a fast and that the body-weight would decrease steadily as the fastprogressed .
ROUTINE OF OBSERVATIONS.
The losses in body-weight have usually been recorded in everyreported fast , whether scientifically controlled or not. Unfortunately,however , the observations vary in value , as the weighings have not
always been made under constant conditions . At times they evenshow a gain rather than a loss . Comparable results in such observations may be secured by the following routine :
The weights should be taken at approximate ly the same time each day .
If the subject is not weighed nude, the clothing worn should be approximately of the same weight, and its weight should be deducted fromthe total weight recorded , thus giving the true value for the bodyweight of the subject .
The bladder should alwaysbe emptied immediately or a short time beforethe weighing.
The amount of drinking water taken prior to the weighing should beconstant.
No water should be taken for some hours before the observation ismade .
The weighings should always be made on the same careful ly calibratedscales and should be checked by a second observer.
The environmental temperature and the muscular activity should beapproximately constant throughout the who le period of the fast.
As usually fasting subjects are very captions, investigators are ordinarily content to control them only in so far as the collection of theexcreta and the abstinence from food are concerned
,without rigor
ously insisting upon their remaining in a quiet , closed room duringlBenedict and Carpenter, Carnegie Inst. Wash . Pub. No . 126 , 1910 , p . 1 13 . Benedict and
Joslin , Carnegie Inst . Wash . Pub. No . 176 , 1912 , p . 90 .

70 A STUDY OF PROLONGED FASTING .
thewhole period of the fast,with a constancy in the muscular activity.
In the long fasting experiment with L .,however
,the routine for weigh
ing previously out l ined was followed very c losely.
The subject emptied the bladder immediately after leaving the bedcalorimeter each day about 8 a . m . A respiration experiment of threeor four 15-minute periods was next made with him. This was usuallyfinished about 9" 30m a . m. He was then carefully weighed on acalibrated platform balance
,the weighings and records being made by
Mr. Carpenter and checked by a second observer . (See plate 2,figure D
,page The scales used were the so-called “ silk scales
,
capable of weighing 150 kilograms with a sensitivity of 10 grams witha full load . Th e temperature of the calorimeter room was rarelybelow 20° C .
,but as the subject was used to a warmer climate he was
especially sensitive to cold . He was therefore not weighed nude, butin a cotton union suit and socks which had been washed in distilledwater. He also wore over this union suit his heavy woolen underwear.The exact weight of this clothing was known and deducted from the
weight shown on the scales . It was not practicable to make the weighing directly after he had emptied the bladder, as it seemed undesirableto have him stand so long before the respiration experiment began.
No water was taken during the night , so that when the subject wasweighed he had been without water for some 12 hours . Furthermore
,
the amount of water taken during the day was approximately constantin quantity
,i . e.
,for the first 10 days of the fast 750 c . c . and for the
remaining days 900 c . c . During the night the subject had remainedin the calorimeter chamber under constant temperature conditions ,and as he usually lay very quietly, the activity was at a minimum.
Wh ile the temperature conditions and muscular activity necessarilyvaried somewhat during the day, they were fairly constant, especiallyas the subject was by nature averse to muscular activity.
As L . was extremely interested in the records of the body-weightfrom day to day
,the change in weight was computed and roughly
plotted daily in the form of a curve on the blackboard in the calorimmerlaboratory. Any irregularities in the curve would be instantly detectedand verifications made if necessary . AS a matter of fact , such verification never indicated a discrepancy andwe have the fullest confidencein this series of weights .While the time relations were not theoretically ideal , they were asnearly so as was practicable with the large number of observationsnecessary to be made simultaneously upon this man . A sample day’scomputation of the loss of weight is as follows :
Body-weigh t in co tton underwear, so cks, and heavy woo len underwear , kilos.
9ll 35m a.m . , April 20 , 1912
Weight of cotton underwear and heavy woo len underwear 1 . 4 8
Naked body-weight, 9h 35m a.m . , April 20 , 19 12 .
Naked body-weigh t, 9h 40‘m a.m . , April 19 , 1912 .
Loss in body-weigh t, April 19—20 , 19 12

72 A STUDY OF PROLONGED FASTING .
changes in the environmental temperature or muscular activity willof course increase or decrease the regular loss of material .
Table 2 also gives the records of the body-weights obtained in thefasting experiment with our own subject L. The greatest loss shownduIing the 31 days of the fast was kilograms on the first day andthe smallest loss in weight was kilogram on the thirteenth day.
TABLE 2 .—Losses of body-weight by fasting subj ects, with initial weight and weight
on each day of fast.
(Weight given in kilog rams
Day of
Initialwt .
0 0 0 0 0
0 0 0 0 0
0 0 0 0 0 0 0
0 0 0 0 0 0 0
1 Lo ss for 3 days.
3 Loss for 2 days.

BODY-WE IGHT . 73
TABLE 2.— Losses of body-weight by fasting subj ects,
”
with initial weight andweighton each day of fast— Continued.
(Weight given in kilograms .)
Every effort was made to secure uniformity of conditions throughoutthis fast
,and probably in no long fast with man have these ideal con
ditions been so nearly approached . Yet, even with this care, it will beseen that the losses were by no means regular from day to day, althoughthe variations are not so great as in the other fasts referred to in table 2.
Unquestionably the loss in weight in a strictly controlled fast maybe considered a good general measure of the intensity of metabolicprocesses ; yet with such wide fluctuations as are Shown for L . it hardlyseems probable that the body-weight can be looked upon as an accurateindex of the total tissue change. But attempts have frequently beenmade by investigators to establish a mathematical relationship betweenthe daily loss in weight and the length of the fast . Luciani
,basing his
conclusions upon the results of his study with Succi in Florence and
particularly upon two long experiments with dogs,was confident that
such a mathematical relationship existed . To study the possibilities

74 A STUDY OF PROLONGED FASTING .
FIG . 1 .— Body-weigh t curves for fasting experiments

BODY-WE IGHT .
FIG . 2.— Body-weigh t curve for Levanzin .
75

76 A STUDY OF PROLONGED FASTING .
of this relationship , curves have been plotted Showing graphically thechanges in weight duIing each of Succi’s fasts . (See figure Asimilar curve has been p lotted showing the records of body-weightsduring the fasting experiment with L . (See figureIf we analyze the components which make up the loss in weight
of the body, we find it is due not only to the loss of body tissue which isoxidized to supply material for the maintenance of the body activity
,
but to the loss of preformed water, i . e.,the water existing in the tissues
oxidized . According to observations in some of the earlier fastingexperiments in Middletown , Connecticut , this preformed water, whichvaries widely in amount , appears to be rapidly discharged in the firstdays of fasting . We would consequently expect to find that the curvesfor a fasting experiment would indicate a rapid fall in weight at thebeginning of the fast , the percentage loss becoming gradually smaller,until the body-weight curve tends to become a straight line . If thecurves for Succi and Levanzin are examined
,this tendency will be seen .
On the other hand , while all the curves have the same general trend , acareful mathematical analysis shows no regularity that would justifythe use of a mathematical expression by means of which losses of weightmay be predicted during prolonged fasts . When one considers thatonly the Florence fast was controlled by Luciani , and that the otherswere made in different years , at different seasons , and in differentcountries
,it will be seen that but little can be expected from a com
parison of these curves .Nevertheless , the semblance of mathematical regularity shown in
the records of body-weight obtained in Succi’s Florence fast and in theexperiments with dogs led Luciani to seek the aid of his associate ,Bufalini
,who computed that the body-weight curves , especially those
obtained in experiments on dogs , (see P and P ’on figure 3) had a ten
deney to represent an equilateral hyperbola . Reasoning from the
equilateral hyperbola equation obtained with dogs , Luciani computedthe probable curve for Succi’s weights during the Florence fast andfound that the loss in weight was very much less than he would haveexpected . He interpreted this as being due to the fact that Succidrank much larger amounts of water than did the dogs and that waterapparently acted as a nutrient
,thus sparing the tissues .
Since a reasonable regularity was also shown in the course of thecurve obtained for L .
,a probable curve for this subject was developed
by Mr. E . H . Lange,physicist of the Nutrition Laboratory. (See
curve in light line in figure Using W to represent the weight inkilograms and T the time in days, the weight for any given day isfound by the formula
W (10)" 0 ' 143T

BODY-WE IGHT . 77
Asimilar equation has been worked out for Succi’s London fast,as
W= 4 .98 (10)
(See curve in light line in fig . Obvious ly such a complicated curvecan not in any wise be considered a simple mathematical relationship .
IO IS 20 25 3 0 3 5 4 0 4 5 50 55 60 6 5 70 7 5 80 8 5 9 0 95 100 I05 H O ”5 120
FIG . 3 .— Body-weigh t curves for pro longed fasting experiments with dogs.
Ideal conditions for studying the loss in weight during fasts wouldbe those in which the subject had a constant amount of drinking water,emptied the bladder completely at a definite period each day, remainedin an absolutely constant environment with ‘a constant temperature ,

78 A STUDY OF PROLONGED FASTING .
and the metabolism pursued a course entirely unaffected by extraneousconditions . Such constant conditions are impracticab le with humanbeings
,but aremore easily obtained with animals . Several remarkably
long fasting experiments have been‘
made with dogs , but the records arefor the most part not easily accessible . Curves showing the records ofbody-weight in these animal experiments are given in fig . 3 . The bodyweights obtained by Lucian i on two dogs , one in Siena and anotherin Florence
,are rep resented by the curves designated as P and P ’
.
These dogs were catheterized each day, were given exactly 150 c . c .of water daily, and were kept in a room free from disturbance of anykind and in a temperature of approximately 12° to 13° C . It willbe seen that the loss in weight follows a fairly regular course , save on
the last few days of each fast , none of the irregularities shown in thebody-weights of Succi and our subject L . being apparent .Luciani
’
s two experiments with dogs continued 34 and 43 daysrespectively, but still longer experiments have been made by P . B .
Hawk,in which a dog fasted in two experiments of 117 and 104 days
respectively. The complete results of these experiments have not yetbeen published ,
‘ but the investigator has kindly given me the privilegeof using certain of the data in this connection. The body-weightsobtained during these fasts are also shown in figure 3 . The amountof drinking water given to the dog was constant , but the animal wasnot kept in a chamber with even temperature and the other conditionswere not so well controlled as in Luciani’s experiments , as the purposesof the fasts were entirely different . Aside from slight fluctuations
,
however, the curves follow a reasonably constant course . Thesecurves are of particular value owing to the extraordinary length of thefasting periods .A series of observations made by Awrorow on dogs with complete
fasting is of even more interest in studying this specific problem.
Th e dogs were confined in the Pashutin respiration chamber in the
Imperial Medical Academy in St. Petersburg , receiving neither foodnor water. They were catheterized daily, weighed at a regular hour,and spent 22 or more hours out of the 24 hours in the quiet and isolationof the resp iration chamber
,during wh ich the carbon-dioxide production
was careful ly measured. The period of fasting with the four dogscontinued for 16, 44 , 60 , and 66 days respectively. Under these con
ditions one would expect a most regular progress in the metabolism,
with constant loss of water and organic material,and changes in the
body-weight . That this is true to a marked extent is shown from an
examination of the three curves for the dogs which fasted the longest ,i . e.
,4 4
,60
,and 66 days . The striking regularity of these curves bears
out completely Professor Luciani’s view that if such experimental con
1Howe and Hawk , Am . Journ. Physio l. , 1912, 30 , p. 174 ; Howe, Mattill, and Hawk , Journ .
B io l. Ch em . , 1912 , 11 , p . 103 .

A STUDY OF PROLONGED FASTING .
TOTAL LOSS IN BODY-WEIGHT.
An examination of the data in table 2 for the subjects other than L.
show apparent discrepancies in the ini tial weights and in the loss ofweight on the first day. The exact length of the fasting period andthe weight on the last day are also frequently doubtful . The Florenceweights were all taken from the plates at the end of Luciani’s report“ Fisiologia del digiuno .
” It is obviously important to note whetherthe initial weight was taken imm ediately after the meal or beforethe meal , or what was the condition of the alimentary tract . Withour subject L . we believed it to be necessary to obtain an accurateweight at the beginning of the fast ; consequently the initialweight wastaken approximate ly 12 hours after the last meal
,several hours after
drinking water, and a definite time after urinating . Such precautions
were not taken,we believe
,with any of the other subjects given in
table 2,with the possible exception of Cathcart’s subject , Beauté .
The total losses in the various fasts,particularly when computed as
percentages of the initial weights,have certain features that are not
without interest . For comparison we give in table 3 the total loss andthe percentage loss for each subject at the end of 14
,16 , 30, 31 ,
and 40 days respectively (using the data recorded In table Obvi
ously a comparison can be made for all of the subjects for only 14 days,
with all the subjects but one for 16 days , with al l the subjects but twofor 20 days , and finally with but one subject for 40 days . At the endof 14 days the average percentage loss was per cent . The lowestloss was with Succi , in the Rome fast , of per cent ; and the highestloss was per cent with the same subject , in the Paris fast . For
TABLE 13,— Summary of losses of body-weight byfasting subjects.

BODY-WE IGHT . 81
16 days the average percentage loss was 13 .4 per cent, the lowest againappearing with Succi In the Rome fast of 11 .2 per cent and the highest16 .3 per cent in the Paris fast . For 20 days the average percentageloss was per cent , the lowest being with Jacques of 13 per cent,and the highest per cent with Succi in the Paris fast . For 29days the average loss was per cent, the lowest again being withJacques of per cent and the highest per cent in the Paris fastof Succi . For 30 days the average value was per cent , the lowestbeing with Jacques, of per cent, and the highest per cent in theParis fast of Succi . For 31 days only two experiments were comparable, the percentage loss in both of these being about 21 per cent ,while in the 40-day experiment the percentage loss was per cent .Of special interest is the fact that , aside from the fast with Jacques , inwhich the weights of the drinking water and urine were perhaps lesstrustworthy than in the other fasts, it can be said that at the end of 30days of fasting
, per cent of the initial body-weight was lost . Thisis strikingly regular in the fasts of both Succi and Levanzin. The
maximum loss of weight recorded in any controlled fasting experimentwith man was in the London fast with Succi, when at the end of 40days a loss of per cent of the initial body-weight was shown .
In contrast with these values found with man are the losses foundwith animals
,when the degree of emac iation has been carried to an
extreme and,indeed, in some instances to the point of death . In
Hawk’s first fasting experiment , in which the dog fasted 117 days ,per cent of the initial body-weight was lost . The dog recovered
,
was fed,and later underwent a second fast of 104 days, in which he
lost per cent of the initial body-weight and then suddenly died.
Hawk’ s dog lived in the laboratory and was given a definite amount ofwater
,but Awrorow’
s dogs received neither food nor water, and thefasting was carried to the point of death . With dog No . 2 the fastlasted 44 days , with a loss of 55 per cent of the initial body-weight .With dog No . 3 the fast continued 60 days , with a loss of per cent,while with dog No . 4 the fast was 66 days in length , with a loss of
per cent of the initial body-weight . Still other values were obtainedby Luciani with the two dogs whi ch fasted under special experimentalconditions . As shown in his curve,
1 the dog P lost per cent of hisinitial body-weight in a 43-day fast, while the dog P
’ lost per centin a 34-day fast .Incidentally it should be mentioned that Gayer, in his 30—day fast In
New York In 1912, was said to have lost 17 .4 per cent of his initialweight of 210 pounds kilograms) , while Penny, in his self-controlled fast of 30 days, lost 19 per cent of his initial body-weight of
pounds kilograms) . While both these values are somewhatlLuciani, Das Hungern, Hamburg and Leipsic , 1890 , plate 11 . See also th is publication, fig .
3 , p. 77 .

82 A STUDY OF PROLONGED FASTING .
less than the average loss found with L. and Succi , they are suflicientlyclose to imply that in all probability no measurable amounts of foodwere taken during these two uncontrolled fasts .
ANALYSIS OF LOSSES IN BODY-WEIGHT.
An analysis of the factors influencing the body-weight shows thatthere may be a retention of water in the body due to the drinking ofmore water than is excreted in the urine ; a loss due to feces ; a regularloss due to the oxidation of organized material
,the carbon burning
to carbon dioxide and the hydrogen to water ; and a further loss of solidsin the urine . The amount of organized material oxidized in the bodywill be influenced in large part by the muscular activity of the subject
,
and if the activity is constant , the loss due to oxidation will progress ina reasonably regular manner.Considering the body as a living organism,
therefore , we see that ina fasting experiment the intake consists of drinking water and oxygenfrom the air . The output consists of water-vapor and carbon dioxidegiven off from the lungs and skin and the urine and feces excreted.
In this particular fast,however, the subject did not defecate during the
experiment .The water vaporized from the lungs and the skin and given off in the
urine undoubtedly contains a large amount of preformed water whichwas taken with the water drunk each day. It also contains waterwhich has been stored in the body and is given off as a result of thebreaking down of the protein,
i . e.,muscular tissue . There is likewise
a small amount of water due to the combustion of the organic hydrogenof the body with the oxygen taken from the air . Without estimationsof the carbon-dioxide excretion
,there are at present no known means of
satisfactorily computing these separate factors in the measurement ofthe water output . When it is possible to have the subject live theentire time inside the respiration chamber, as was done in the experi
ments at Wesleyan University,l the complete income and outgo may
be determined , including the income of oxygen and water and the output of carbon dioxide
,water-vapor
,water in urine , solids in urine, and
an analysis of the solids . An approximate apportionment may thenbe made of the water leaving the body as oxidized organic hydrogenand as preformed water in the body . This has already been donefor the 7-day experiment reported in the earlier pub lication.
2 Fromthe computed amounts of carbon dioxide excreted and the probableorganic hydrogen oxidized, a similar apportionment of the water losshas been made for this experiment (see page 407 of this report) .Inasmuch as the body consists in large part of water— some 60 per
cent or more— it will be seen that there may be an addition to or losslBenedict, Carnegie Inst. Wash . Pub. No . 77 , 1907 .
”Benedict, Carnegie Inst. Wash . Pub. No . 77 , 1907 , p . 469 .

BODY-WE IGHT . 83
from the storage of water in the body, as , for instance, 200 grams ,without materially affecting the total percentage of water . It is easyto see
,therefore , that the changes in weight noted from day to day with
a fasting subject have only an indirect andpassing influence .
INSENSIBLE PERSPIRATION.
In the long fasting experiment with L .,the subject was not kept
inside the respiration chamber for the entire time of the fast,so that the
complete output of water-vapor was not determined . On the otherhand
,a study of the so- called insensible perspiration, which has been
of great interest ever since the days of Sanctorius , shows some facts ofvalue .
The body loses in weight regularly as a result of the elimination ofcarbon dioxide and water-vapor. It loses weight spasmodically bythe passing of urine and it gains in weight spasmodically by the drinking of water . By correcting for the amount of water taken and the
weight of urine passed,the degree of insensible loss, or the
“ insensibleperspiration
,
” may be accurately calculated . This has been done intable 4
,which gives for each day of the fast the loss of body-weight
in grams,the weight of the urine passed , the weight of the drinking
water taken,and the insensible perspiration. The excretion of urine
was always less than the amount of the drinking water with one exception
,that of April 29- 30. The insensible perspiration is therefore
readily obtained by finding the difference between the amount of watertaken and the weight of urine excreted and adding it to the observedloss in body-weight .A fact of special interest in this connection is that while the losses
in body-weight fluctuate considerably, the losses as shown by the insensib le perspiration are reasonably regular , the lowest being 371 gramsonMay 3— 4 ; after the first 10 days , the highest value was 691 grams onApril 25—26. Theoretically this insensible perspiration should give usa reasonable clue to the progress of the fast and should be an index ofthe loss of water and carbon dioxide . On the other hand, while the lossof preformed water is a real quantitative loss
, the carbon dioxide andwater of oxidation are not, as they are in large part made up of oxygenwhich is taken from the air.In the later part of the fast it will be seen
,from table 4
,that this man
had on the average an insensible perspiration of not far from 20 grams
per hour. The insensible perspiration of the subjects in the fastsdescribed in the earlier publication
,particularly S . A. B .
,was inad
vertently not reported . Subsequently, Benedict and Carpenter,l in
discussing the metabolism of healthy men,computed the insensible
perspiration of all of the fasting subjects . From their figures it willbe seen that the fasting subject S . A . B .
,who spent 24 hours of each day
1Benedict and Carpenter, Carnegie Inst. Wash . Pub. No . 126 , 1910 ,p . 1 14 .
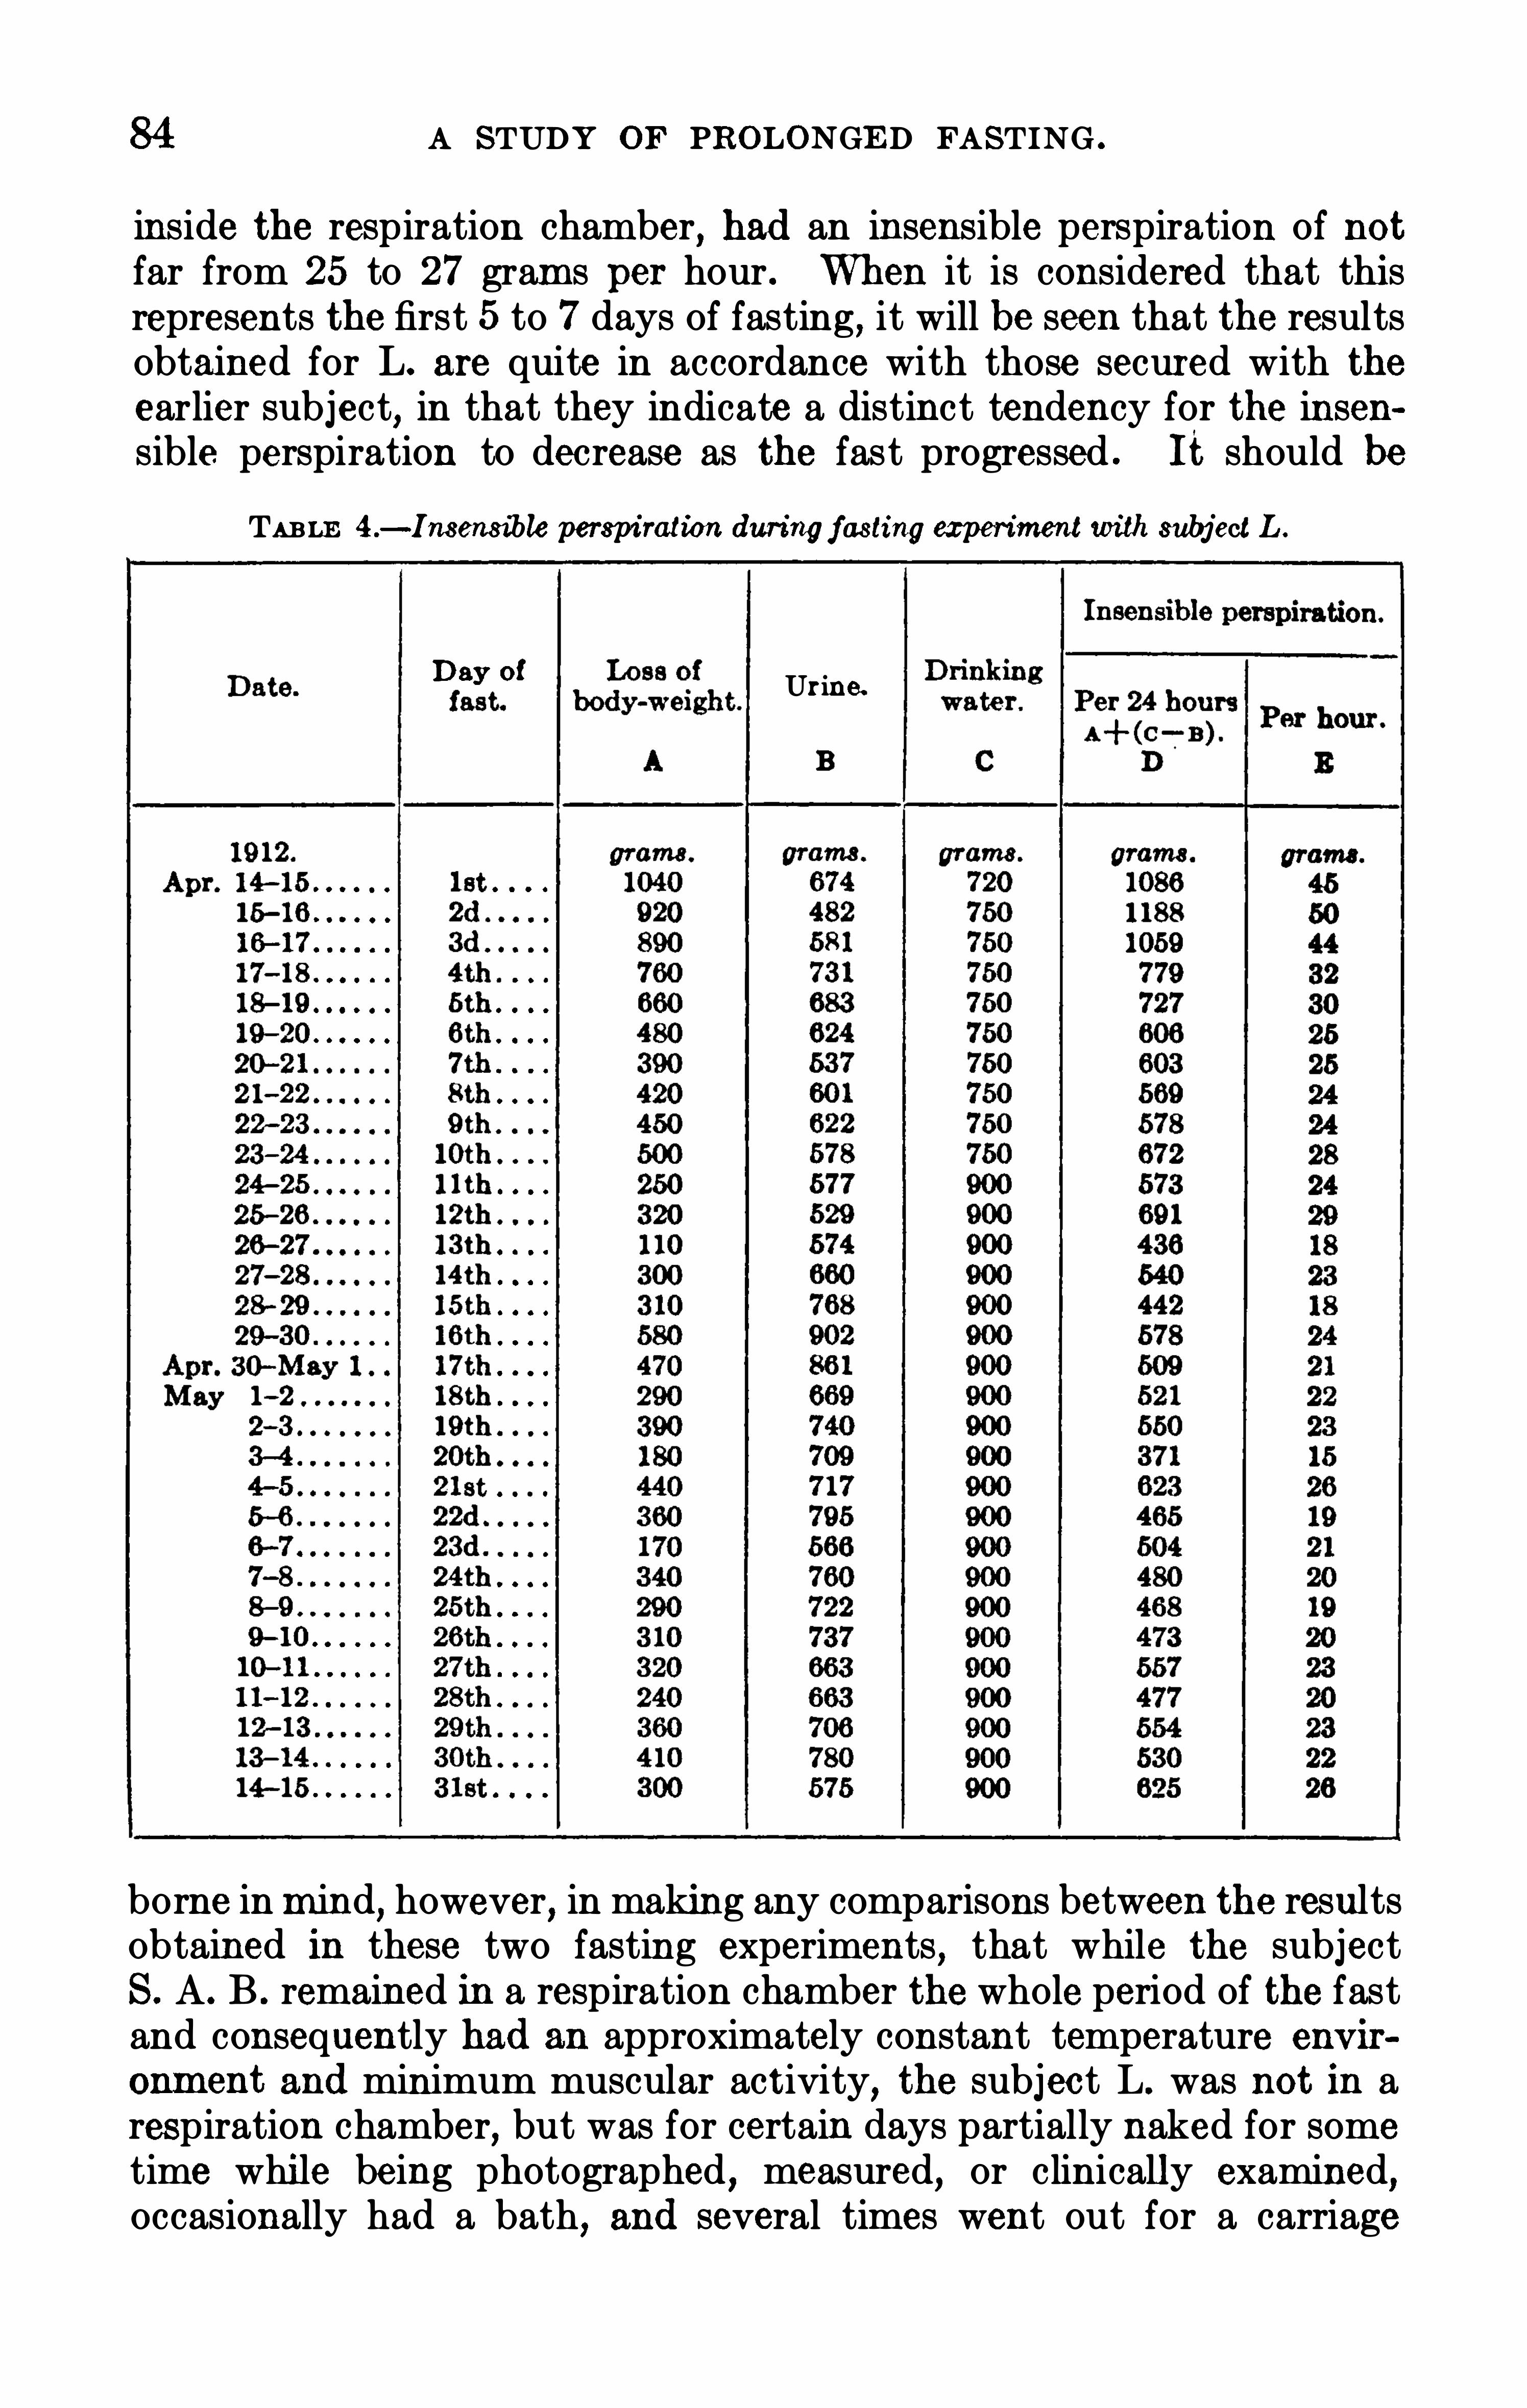
84 A STUDY OF PROLONGED FASTING .
inside the respiration chamber, had an insensible perspiration of notfar from 25 to 27 grams per hour . Wh en it is considered that thisrepresents the first 5 to 7 days of fasting , it will be seen that the resultsobtained for L. are quite in accordance with those secured with theearlier subject, in that they indicate a distinct tendency for the insensible perspiration to decrease as the fast progressed . It should be
TABLE 4 .-Insensible perspiration during fasting experiment with subject L .
Day Urine.
0 0 0 0 0 0
0 0 0 0 0 0
0 0 0 0 0 0
0 0 0 0 0 0
0 0 0 0 0 0
0 0 0 0 0 0
borne in mind, however, in making any comparisons between the resultsobtained in these two fasting experiments , that while the subjectS . A. B . remained in a respiration chamber the whole period of the fastand consequently had an approximately constant temperature envir
onment and minimum muscular activity, the subjec t L. was not in arespiration chamber, but was for certain days partially naked for sometime while being photographed , measured, or clinically examined,occasionally had a bath, and several times went out for a carriage

BODY-WE IGHT . 85
drive. His temperature environment and muscular activity weretherefore more variab le than those of the subject of the earlier fastingexperiment .An exact explanation of the variations in the insensible perspiration
from day to day is difficult,particularly for those of May 3—4 and 4— 5,
when the lowest value of the fast was found on the day before a verymuch higher value was found . It is always possible that there mayhave been an error in the weighing
,but on the other hand these weigh
ings were very carefully made and recorded . Furthermore, an attemptto explain the variations on account of a difference in the activity issomewhat difficult , since the subject had a drive onMay 3—4 and a bathand drive on May 4—5, and on other days when he was given a carriageride the insensible perspiration was much greater than on May 3—4 .
It is obvious,therefore
,that these figures should not be considered
individually ,’
but only as a general picture,this showing that the insen
sible perspiration had a tendency to decrease as the fast progressed .
The increased value for May 14— 15 may without doubt be explainedby the fact that this being the last day of the fast
,there was much
greater excitement and muscular activity on the part of the subject .On this day he talked vigorously to a group of medical men for some40 or 50 minutes ; on this day, also , he wasnude for a time while photographs were being taken and during a series of physical measurements .Considering the values generally, however, it will be seen that the insensible perspiration is a far more scientific basis for estimating the loss ofbody- substance during a fast than is the mere record of body-weight ,which considers neither fluctuations in drinking water nor the volumeof urine passed .
DRINKING WATER.
The intake of a fasting man is confined to water and oxygen of theair . Of these the water may be readily measured . Such measurements are of great importance in intelligently interpreting the lossesin weight from day to day. Accordingly special care was taken toinsure accurate records of the water consumed .
The selection of the kind and amount of drinking water for use in along fast is by no means simple. On the one hand , there is the beliefthat distilled water is dangerous in that it washes out the salts from thebody
,while on the other there is the fact that inmany fasts the subjects
took either ordinary tap water or,as in Succi’s fasts , various alkaline
or spring waters containing large amounts of salts,sometimes of a
distinctly purgative character. It has been believed by some thatthese mineral waters have an actual nutritive value due to the saltscontained in them
,if not to the organic matters . Furthermore, the sup
position is reasonable that the salts interfere seriously with the mineralmetabolism, and it is obviously impossible in a metabolism experimentto make an intelligent study of the output of sulphur, phosphorus , or

86 A STUDY OF PROLONGED FASTING .
chlorine in the urine if at the same time the subject is taking a largeamount of water containing sulphates
,phosphates , or chlorides .
In the fasting experiments at Wesleyan University, one of thesubjects
,S . A. B.
,preferred distilled water.1 Similarly Penny2 records
that he used only distilled water during his fast . Our subject , L .,
himself suggested that he be given distil led water during the fast , asotherwise it might be said that tap water was either not pure or contained mineral or organic matters which would contribute to his sustenance . Although an experiment in which the man used distilledwater only was somewhat unusual , the desirability of being able tostudy the m ineral metabolism without the conflicting factor of theingestion of salts was , of course , apparent and arrangements weretherefore made for supp lying L .with distilled water throughout the fast .Dr. E . P. Cathcart was at this time a Research Associate of the
Nutrition Laboratory and advised that L . be given a constant amountof drinking water each day, since in his observations on Beauté he hadexperienced considerable difficulty with the volumes of the urine .
Our subject was first given c .c . of distilled water, but was ableto take but 720 c .c . on the first day. L. then suggested that he begiven only 750 c .c . This amount was continued for a number of days ,when it was increased to 900 c .c .
,at which volume it continued through
out the remaining days of the fast .The amount of water taken each day by the subject is given intable 4 . Since the body excretes so large an amount of water, it isperhaps somewhat unfortunate that the volume taken by the subjectwas not constant for the whole period of the fast , although it is muchmore nearly uniform than in any long fast heretofore reported . In anydiscussion of the body-weight or the volume of urine , it is obviouslynecessary to consider these fluctuations in the intake of water.The subject was very inconsistent in his comments regarding thewater. On some days he said it was very good , but on other daysconsidered it to be very bad
,although exactly the same amount was
given him and from the same glass carboy. On some days , also , hefound the amount given him was not enough and again not infrequentlycomplained that he was given too much water. He recognized theimportance, however, of maintaining the volume of urine so that a largenumber of analyses could be made.
The daily allotment of distilled water was supplied to the subject ina bottle and from this he poured out the amount desired . Early in thefast he found that it was desirable to drink as large a portion of wateras possible during the first part of the day, so that it would not be necessary forhim to urinateduring thenight . The records show that he rarelyurinated during the night . Furthermore
,as in the later part of the
1Benedict. Carnegie Inst . Wash . Pub. No . 77 , 1907 , pp. 136 and 14 0.
2Penny , British Med. Journal , 1909 , p . 14 14 .

BODY-TEMPERATURE.
The profound alterations in metabolism in the body of a fasting manwould lead one to expect some disturbance between thermogenesis andthermolysis . Body- temperature
,which is the index of the resultant
of these two factors , may obviously be affected by the disturbance ofeither. If there is a decrease in thermogenesis with no change in thethermolysis
,there will be a fall in body-temperature . Conversely
,if
there is an increase in thermolysis with constancy of thermogenesis,
there wi ll again be a fall in temperature.
In this laboratory body-temperature measurements have a dualsignificance : first
,the value per so of the actual fluctuation, which indi
cates a disturbance in the relationship between thermolysis and thermogenesis, and second
,the importance of knowing body-temperature
changes for the accurate computation of the heat production in thebody . To determine the heat production it is not sufficient simplyto measure the heat radiated from the body and to add to this valuethe heat of vaporization of water, for if in a given experimental periodthe body-temperature has decreased , there has been a loss of heat fromthe body unaccompanied by a production ; hence the heat productionis measured only after correcting for the body-temperature changes .In the series of body- temperature measurements in the short fasts atWesleyan University, the average body- temperature did not alternoticeably
,although there was distinct evidence of a flattening out of
the curve showing the daily rhythm. In the prolonged fasting experiment with our subject L . , we attempted to measure with the greatestdegree of refinement all the factors . It seemed important
,therefore
,
that frequent and careful records of the body-temperature should bemade in connection with th is fasting observation.
The subject of body-temperature has been given special attentionin this laboratory for a considerable period, and a year previous to thisfasting experiment an extensive study of the fluctuations of the tem
perature in the various parts of the human body was reported .
1 As aresult of this research, it became evident that the only suitable placefor measuring body-temperature is deep in the body trunk, preferablyin the rectum. The identical apparatus used in the study referred towas available for this fasting experiment and consequently body-tem
perature measurements were secured as frequently as possible. Adetailed description of this apparatus and the tests made with it werepublished in the report cited . Briefly
,the apparatus consists of a
thermal element which is inserted about 7 cm. in the rectum,this
thermal element being connected with another thermal junction in aconstant-temperature bath. By means of this apparatus, it is possible
lBenedict and S lack, Carnegie Inst. Wash . Pub. No . 155 , 1911 .

BODY-TEMPERATURE .
to determine the rectal temperature of a subject within and
records can be made as frequently as desired .
Records of the rectal temperature were obtained nearly every nightwhile the subjec t was in the calorimeter chamber, the j unction beinginserted in the rectum of the subject , connections made with the bindingposts inside the chamber, and observations taken on an average ofevery 15 minutes throughout the night . On some nights records weretaken every 5 or 6 minutes . Observations were also made at varioustimes during the day and on at least two days continuous records weresecured for nearly the whole day-period . The apparatuswas frequentlycontrolled by comparison with a standard thermometer, so we believethat these observations represent the absolute temperature changesof this individual .AS in most of the measurements taken during the fast , the subjectcooperated heartily in these body-temperature observations . Af terthe first night
,and
,in fact
,after the thermometer had been inserted
a few moments , he experienced no particular difficulty and expressedhimself as being very much pleased that this routine gave him no discomfort . It is clear that the use of the thermometer did not interferein the slightest with his sleeping. The observations were therefore madeunder normal conditions, so far as it was possible to control them.
The body-temperature measurements made in this fasting experi
ment may be considered in two ways : first , as to the alteration in theregular rhythm of the temperature as the fast progressed, and second,as to the effect of the fast upon the average of the temperature measurements.
CHANGES IN TEMPERATURE RHYTHM.
In order to study the first of these problems , namely, the changes inthe temperature rhythm , curves have been plotted giving the temperature values for the period beginning about 8 p.m . and ending about 10a. m. the following day. During this time the subject was in thecalorimeter chamber from 8 p . 111 . until about 8 a .m .
, and then, Withoutleaving the bed, he was withdrawn from the apparatus andwas for thenext two hours the subject of the morning respiration experiments .Accordingly, he was lying on the same bed in the same position forthe entire time , the only change being that in the last two hours hewas in the calorimeter room instead of inside the calorimeter chamber.Since the temperature of the calorimeter laboratory was essentially thatof the respiration chamber, there was practically no alteration in thetemperature environment throughout the whole period covered by theobservations shown by the curve.
It is , furthermore , of value to note that this period includes what isnormally found to be the maximum diurnal change
,for with normal
individuals it has been Shown that the lowest temperatures are foundabout 3 a . m . and the highest about 5 p . m . From 5 p . m . until

90 A STUDY OF PROLONGED FASTING .
about 11 p . m . ,or until bedtime, the temperature usually remains
approximately constant . The temperature , as a rule , falls ratherrapidly after one goes to bed, reaching the minimum about 2 or 3a . m. With the fasting subject , the maximum temperature undoubtedly was reached prior to his entering the chamber at 8 p .
‘
m ., as he
usually lay on the couch for an hour or more previous to that time.
The body- temperature was unquestionably falling continuously duringthis preliminary period , so that the range for the night would be somea
what less than the actual daily range.
PM . AM .
FIG . 4 .— Body-temperature curves during the nigh t and early morning
for the second and fourth to e igh th days of fast.

92 A STUDY or PROLONGED FASTING .
OBSERVATIONS OF THE BODY-TEMPERATURE IN THE NIGHT PERIOD.
AVERAGE BODY-TEMPERATURE .
The greatest interest , at least to the clinician , lies not in the courseof the temperature curve throughout the night, but in the average tem
perature values as the fast progresses . These are recorded in table5 (page 95) for nearly every night of the fasting experiment, only thetime that the subjectwasinside the bed calorimeter being included inthevalues . These averages were taken directly from plotted curves and,except in the values for the tenth to the fourteenth nights of the fast .
6 m moo 3 :00 AM cm
FIG. 6.— Body-temperature curves during th e nigh t and early morning
for the seventeenth to twenty-second days of fast.
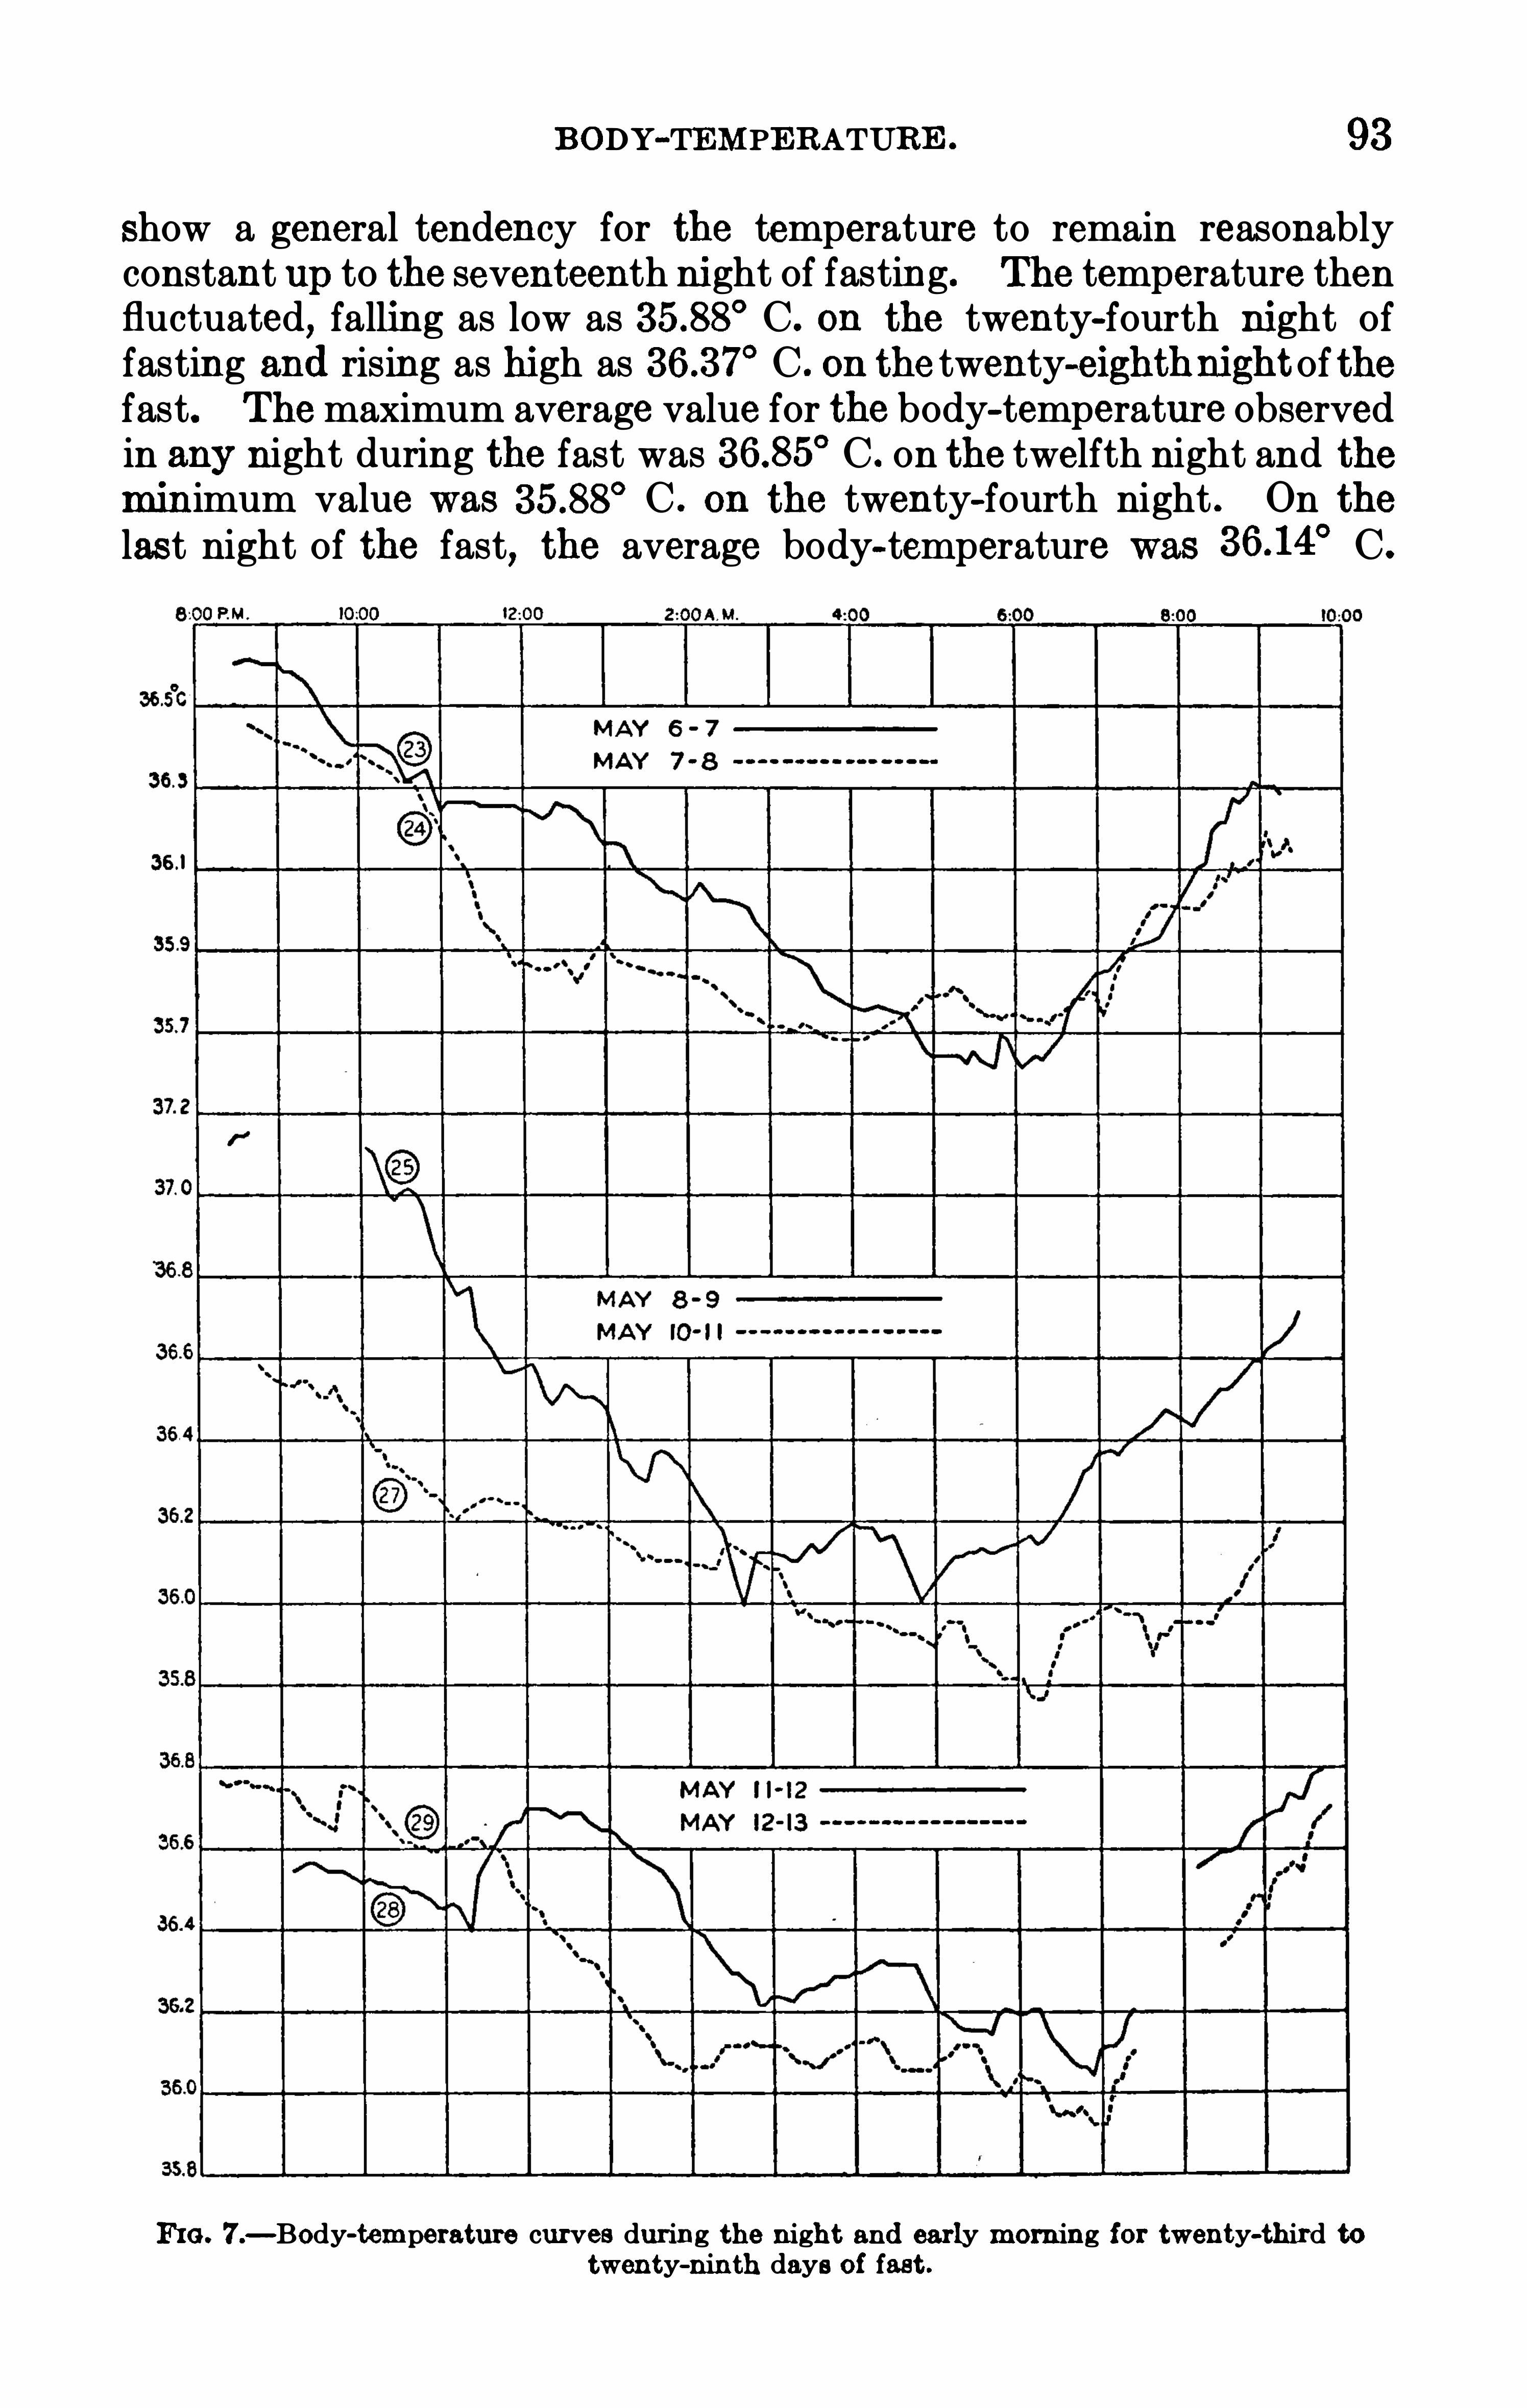
BODY-TEMPERATURE . 93
Show a general tendency for the temperature to remain reasonablyconstant Up to the seventeenth night of fasting. The temperature thenfluctuated, falling as low as C . on the twenty-fourth night offasting and rising as high as C . on the twenty-eighth nightof thefast. The maximum average value for the body-temperature observedin any night during the fast was C . on the twelfth night and the
minimum value was C . on the twenty-fourth night . On thelast night of the fast, the average body-temperature was C .
FIG . 7 .— Body-temperature curves during the night and early morning for twenty-th ird to
twenty-ninth days of fast .

94 A STUDY OF PROLONGED FASTING .
With the resumption of food the average temperature increased on
May 164 7 to C . and on May 17— 18 to C .
RANGE IN BODY-TEMPERATURE .
The maximum and minimum temperatures and the range in thetemperature for each night are l ikewise recorded in table 5 . Th e maximum temperature observed on any fasting night was C . on thefifth night ; the m inimum temperature was C . on the twentysecond and twenty-third nights . The difference between the minimumand maximum values , or the range in temperature , is also recorded intable 5 . The average range was not far from 09 0
° C . The maximumrange
,12 7
°C .
,was observed on the fifth night of fasting ; theminimum
PM . m ay .
FIG . 8 .-Body-temperature curves during the night and earlymorning for thirtieth and th irty-first
days of fast and second and third days with food .

A STUDY OF PROLONGED FASTING .
day,for before the night observation began the subject had been in a
condition of rest for one or more hours . On these two days the maximum temperature observations occurred during the dayt ime, as , forinstance, on May 7— 8, when the maximum temperature observed was37 .10
° C . at about 5 p . m .,the normal hour of the day. The minimum
record was C . at 4 a . m .,the entire range being C .
, a valueexceeding any range given in table 5 . Similarly on May 8—9 , the highest temperature recorded was in the daytime at about 12h 15m p . m . ,
when a temperature of C . was recorded . The min imum valuewas C . , at 2
1140
m a . m. Thus the range was C .,exceeding
even that of the preceding day. These curves give a general pictureof what was probably the average daily course of the body—temperature
BOOPM
FIG. 9.— Body-temperature curves for approximately 24 hours on twenty-fourth and twenty-fifth days of fast.
of this subject throughout the 31 days of fasting. Here,again
,there is a
distinct tendency for the maximum temperature to appear in the lateafternoon and the minimum temperature in the early morning
,this not
being affected by many days of fasting .
On three other days , body-temperature records were obtained for apart of the morning . OnMay 1 and 4
,observations were made during
respiration experiments in which L. was sitting up and writing. (Seeplate 1
,fig . B .) These values are given in figure 10. This experiment
followed the regular morning resp iration experiment,in which the
subject lay upon a couch ; the observations recorded for the lyingposition are also given in figure 10 for comparison . Of particularinterest is the fact that the change in position from lying to sittingdid not greatly alter the rate of the morning rise in temperature .
On May 15 , when the subject first began to eat, the observationscommenced shortly after the end of the regular respiration experiment

B ODY-TEMPERATURE . 97
and continued until noon. During this time the subject was sitting upand eating. The curve given in figure 1 1 for both the respirationexperiment and the eating period shows that when the subject wassitting and eating the ascent is somewhat more noticeable than in thelying period, but it is evident that even eating after a 31-day fast didnot materially disturb the course of the rectal temperature curve .
CONSTANCY IN BODY-TEMPERATURE AT A GIVEN HOUR.
Since at 7 a . m. the subject had been living under constant conditionsof quiet and rest inside the chamber for 8 or 10 hours , a comparisonmay be made of the values for the body-temperature obtained at thistime from day to day. This comparison is the more important since
FIG. 10.— Body—temperature curves showing change from lying to
sitting position.
FIG . 1 1 .— Body-temperature curve showing change from lying to
98 A STUDY or PROLONGED FASTING .
in many fasts the body-temperature measurements are made but onceeach day and usually at a given hour . Accordingly
,in table 5 the
temperature records obtained at or near 7 a . m . have been given foreach day. In general, the variations in the temperature at 7 a . m. are
not markedly different from the variations in the average temperaturethroughout the night , since the maximum and minimum records forthis time were found on the same days as the maximum andminimumaverage temperatures . The maximum value found at 7 a . m. was
C . ,at the end of the twelfth night of fasting, and the minimum
value C .,at the end of the twenty-fourth night of fasting. No
uniformity in the values is apparent .With the fluctuations in the body-temperature varying as they do
it will be seen that the difficulties in securing an average temperaturethroughout the fasting period by means of one or two observationsduring the day have been overlooked . Only by securing average valuesthroughout the entire night or throughout several hours at approximately the same time each day can a true picture of the average temperature change of the body as affected by inanition be secured .
The well-known influence of muscular activity on body-temperaturemakes it the more regrettable that certain experiments with muscularactivity could not have been carried out with this subject
,as the effect
of a moderate amount of muscular exercise upon the temperature regulation as the fast progressed would have great theoretical interest .This is one of the problems that should certainly be studied in any
subsequent fasting experiment .The observations of body-temperature on other fasting individualshave frequently beenmade without reference to the preceding muscularactivityor thegeneral conditionof the subject . Obviously those made inthe morning , j ust before the subject rises , have by far the greatest value .
It is a characteristic of practically al l the fasts heretofore reported— inwhich the temperature observations have been made for the most partin the axilla or in the mouth (both localities unsuited for physiologicalexperiments) —that there has not been sufficient disturbance in the
temperature regulation to be recorded by this method of thermometry .

100 A STUDY OF PROLONGED FASTING .
disturbing to the subject than feeling of the radial pulse , but a fewadditional records were obtained by the latter method . In the laterdays of the fast , when the apex beat of the heart became fainter, it wasoccasionally necessary for the observer in the respiration experimentsto note the pulsations of the carotid artery.
The pulse-rate records may be classed in two groups . The first ineludes a large number of perfectlyComparable observations : thosemadethroughout the night , while the subject was inside the bed calorimeter,andthose during the 1% or2 hours of themorning respiration experiment .Usually the period of continuous observation extended from 8 p . m . to9h 30
m or 10 a . m . during this time the subject was lying quietly upona couch . These records were made regularly every day of the fast .While the subject was in the bed calorimeter, the records were made
by the regular chemical assistant as often as possible, the frequency ofthe observations obviously depending somewhat upon his other duties .Occasionally when the subject moved inside the calorimeter, so as toslightly displace the bell of the stethoscope , the pulse beats could notbe heard and there would consequently be a break in the records untilthe subject again changed his position so as to bring the bell to itsformer location. During the morning respiration experiment a specialobserver was detailed to count the pulse-rate continuously throughoutthe whole period . (See plate 2, figure C , pageThe second group of observations consists of those taken at varioustimes throughout the day, a part of which were continuous , while otherswere individual records . This group includes the observations in themiscellaneous respiration experiments , such as those made in the evening before the subject entered the bed calorimeter, while the subject waswriting
,or when he was breathing an oxygen-rich atmosphere. During
the latter part of the fast , the pulse-rate was also recorded twice whenthe daily record of the blood pressure was taken , and occasional ly whenother special tests were made . At times the subject wore the stethoscope throughout the whole day, so that the observations were more orless continuous for the 24 hours . On the days when the continuousobservations were made , the subject was followed by an assistant whokept out of sight but made the records regularly and also noted thechanges in body-position . These records were frequently verified bya second observer.
RECORDS OF PUISERATE OBTAINED IN EARLIER FASTING EXPERIMENTS.
Before giving the records of the pulse-rate obtained in the fastingexperiment with L . , it will be of interest to cite those secured in fastingexperiments made by other investigators . In discussing such obser
vations, two essential ly different comparisons can be made , first, theinfluence of a prolonged fast upon the pulse-rate determined under anygiven conditions , and second , the variations in pulse-rate incidental tothe changes in position or mental activity. Usually in fasting experi

PULSE-RATE . 101
ments observers have contented themselves with taking the morningpulse-rate and occasionally the evening pulse-rate . No particular emphasis has been placed upon these individual observations , aside fromthe general fact that the pulse may have altered as the fast progressed .
Not recognizing the great significance of the pulse-rate in relation to themetabolism,
experimenters have not ordinarily taken especial precautions (as did Luciani) to keep the subject lying quietly while the pulserate was being observed and, indeed, for some time previous to theobservation. This probably explains difficulties found in comparingthe records , in that some observers note a continually decreasing pulserate during the fast, while others findmarked irregularities . As wouldbe expected , the more recent observations take into account the factorsinfluencing the pulse-rate and the records are thus more trustworthy.
Of the pulse records obtained in Tanner’s fast, we have been able tofind only those given in the British Medical Journal.l On the thirtyseventh day of this fast, the pulse, respiration, and temperature are
reported as having been norma On the twenty-fifth day the pulserate is given as 75, the respiration as 15 , and the temperature of themouth as 98 4 ° F. On the thirtieth day the pulse-rate wasreported as 84 and sligh tly more regular, the temperature as 988
° F .
and the respiration as 14 , with the general statement thathe was weaker than on any previous day. On the twenty-ninth day
,
two of the experts attending him reported that there was no materialalteration in the vascular pressure indicated by the heart ’s impulse
,
while its volume was scarcely less than in health .
”
Paton and Stockman2 report that the pulse—rate of their subjectaveraged between 50 and 60 and the respiration usually between 23 and30, but no continuous records of the pulse-rate are given.
The most extensive series of continuous observations of the pulserate of a fasting subject is that reported by Hoover and Sollmann .
3
In this 5-day fast , the pulse was counted and recorded once every hourby relays of watchers . The initial record of the pulse-rate was 75 , thelowest value of 37 being recorded on the last day
,thus showing a dis
tinct tendency for the pulse-rate to decrease as the fast progressed .
Unfortunately the fast continued for only 5 days and, in the opinionof the authors , the pulse records are vitiated by the fact that they wereobtained with a hypnotic subject and that the pulse-ratewas purposelylowered by suggestion.
In reporting a fast carried out by Succi in NewYork in December1890 , and said to have continued for 4 5 days, a newspaper states
“ thaton the last day of the fast Succi’s pulse-rate was 62. Unfortunately noscientific record of this fast was ever published .
lBritish Med. Journ. , 1880 , 2, p . 171 .zPaton and S tockman , Proc . Roy . Soc . , Edinburgh , 1888- 1889. 16 , p . 121 .‘Hoover and Sollmann , Journ . Exp. Med . , 1897 2 , p. 4 03 .
‘N. Y. Daily Tribune , December 21 , 1890 .

102 A STUDY OF PROLONGED FASTING .
In a fast carried out by Succi in London in 1890,which continued
40 days , the pulse-rates , taken every day at noon,
1 varied from 82 on
the second day of the fast to 52 on the thirty-fifth day. The degree ofirregularity noted in all conditions of the fast , however, shows thatproper attention had not been paid to secure uniform quiet before theobservations were made . The respirations varied from 16 on the
thirty-first day of the fast to 28 on the sixth day of the fast . Hereagain the irregularity noted on all days implies variations in muscularactivity prior to the observations , no general trend of the respirationrate being apparent .In the 10-day fasting experiment with Cetti,
2the pulse-rate ranged
from 68 on the morning of the fourth day to 92 in the afternoon of theseventh day. The high pulse-rate was accompanied by abdominalpains . In certain of the respiration experiments carried out with Cetti,the pulse-rate was likewise recorded . In one instance it was noted thatthe pulse-rate changed from 88 while the subject was lying down to 120while he was walking about the room . In another experiment thepulse-rate changed from 86 while he was lying down to 98 when he wassitting
,smoking
, and talking. The great increase in the heart actionof this subjec t was commented on at some length by these authors .In an experiment with Breithaupt, continuing for 6 days, the sameauthors record a minimum pulse-rate of 47 on the last day of the fastand a maximum rate of 66 on the morning of the second day. Takingadvantage of the fact that their subject performed muscular work onthe ergostat
,the authors made some interesting notes upon the increase
in the heart-beat with a definite amount of work and the return of thepulse-rate to normal after thework ceased . In their general conclusionsthey maintained that with Cetti, who was of an excitable temperament,the pulse-rate in the resting condition was not noticeably changed byfasting
,but that it slowly decreased with Breithaupt, who was quiet
and phlegmatic . They also emphasize the fact that during the fastthere was a distinct tendency to a considerable increase in the irritability of the heart , slight muscular activity producing a great Increasein the pulse-rate .
Luciani contends that,during his experiment with Succi , the pulse
rate remained strictly inside the physiological limits , rising to 70 buttwice and only occasionally fall ing below 50. He also points out thatthe pulse-rate, as well as the temperature and the respiration, werealways measured during complete muscular rest, as the subject waslying in bed. An interesting observation on the irritability of the heart ,as indicated by the rise in the pulse-rate after exercise, was likewisemade by Luciani , who was fortunate in having a fasting subject whofreely indulged in muscular activity.
1British Medical Journal , 1890 , pp. 764 , 819 , 876 , 935 , 996 , 1056 , and 144 4 .
’Lehmann,Mueller, Munk , Senator, and Zuntz , Archiv f. path .Anat. u. Physio l. 11 . f. klin .Med
1893 , 131 , Supp., p . 1 .
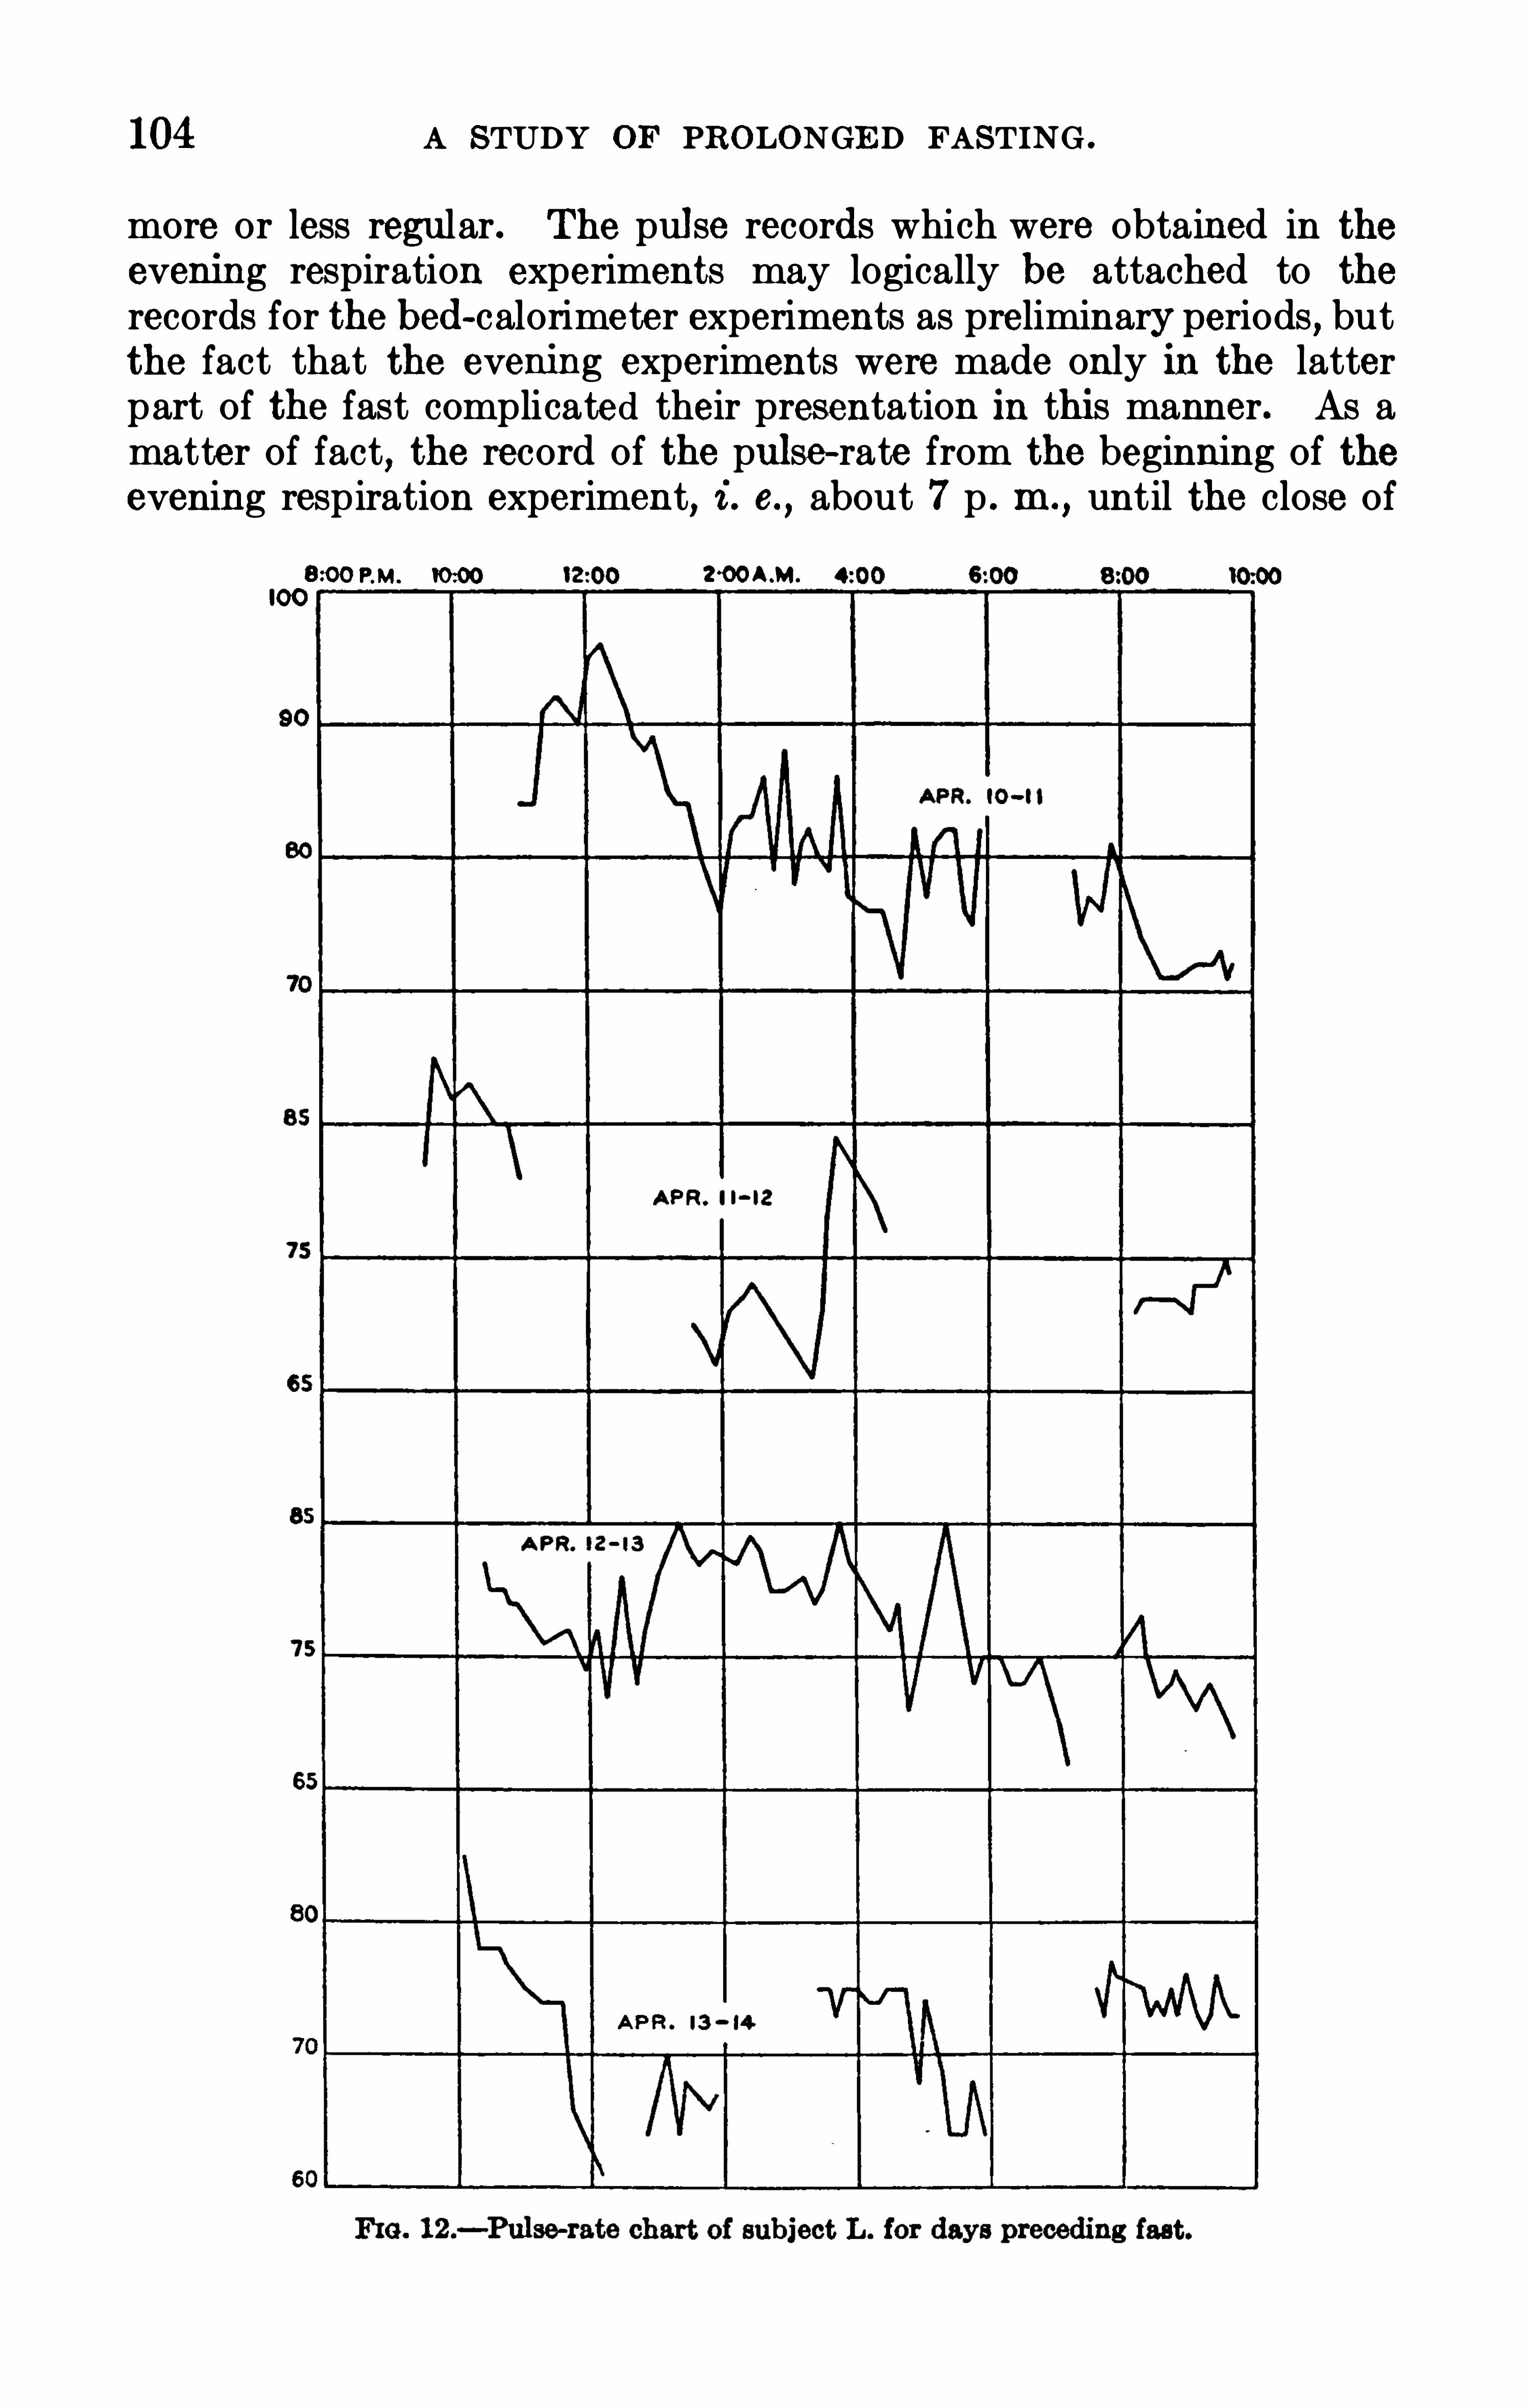
104 A STUDY OF PROLONGED FASTING .
more or less regular. The pulse records which were obtained in theevening respiration experiments may logically be attached to the
records for the bed-calorimeter experiments as preliminaryperiods , butthe fact that the evening experiments were made only 111 the latterpart of the fast complicated their presentation in this manner. As amatter of fact
, the record of the pulse-rate from the beginning of theevening respiration experiment, i . e.
,about 7 p . m .
, until the close of
RM. 20 0A.M.
100

PULSE-RATE. 105
the respiration experiment the next morning at 911 30m or 10 a . m . , was
continuous , as the subjectdidnot rise from his couch during that period .
He urinated lying on the side . Since the conditions of activity were
essentially uniform from the time the subject entered thebed calorimeterat about 8 p . m . until the end of the morning respiration experiment
at 9h 30m or 10 a . m . ,the records of the pulse-rate taken during this
period on every day of the fast are more comparable. It is therefore
FIG . 13 .— PuISG-rate chart of subject L . for first to fifth days of fast.

106 A STUDY OF PROLONGED FASTING .
permissible to discuss these observations first , and later consider themore or less heterogeneous observations taken during the day when the
activity might vary.
PULSE-RATE IN THE NIGHT PERIODS.
The relatively large fluctuations in the pulse-rate that are
in the first two or three nights are naturally to be explained bthat the subject was a stranger in America , and was experiencing for
FIG . 14 .— Pulse-rate chart of subject L . for sixth to
eleventh days of fast.

108 A STUDY OF PROLONGED FASTING .
the curve to become less and less— that is, the fluctuations from maximum to minimum throughout the night were less and the periods ofreasonably constant pulse values grew longer and longer.
On the night of May 14— 15 , the last night of the fast (figurespecial attention was given to the pulse-rate, the records being madefrequently throughout the whole night . Although the curve is in con
FIG . 16.— PuISG-rate chart of subject L . for nineteenth to twenty-fifth days of fast.

PULSE-RATE . 109
sequence irregular in shape, the general trend is not markedly differentfrom those for the preceding and following nights . Even on May 15— 16,the first night following the ingestion of food, although the subjectwasin such distress that he did not go inside the chamber, but lay on a couchoutside, the frequent records of the pulse-rate did not Show extraordi
narily large fluctuations . On the night of May 16— 17 relatively fewrecords of the pulse-rate were taken ; and also on May 17— 18, but on
this night we find a greatly increased amplitude. The general deduction is, therefore, that the amplitude of the fluctuations of the pulserate during the night decreased regularly as the fast progressed , showinga tendency upon the resumption of feeding to return to the variationscommonly experienced.
FIG . 17 .— Pulse-rate chart of subject L . for twenty-sixth to th irtieth days of fast .

1 10 A STUDY OF PROLONGED FASTING .
PULSE-RATE IN THE DAY PERIODS.
From 10 a . m. until 7 p . m .,the records are naturally much less com
plete than the series obtained during the night ; nevertheless on certaindays reasonably complete records of the pulse-rate were obtainedthroughout the day.
18.— Pulse-rate chart of subject L . for th irty-first day of fast and three subsequent days
with food . The po int when the subject took food on May 1 4— 15 is indicated by a heavy
vertical l ine .

1 12 A STUDY OF PROLONGED FASTING .
tions on this day were obtained at a time when there was a reasonablysmall amount of muscular activity. In a series of observations from2b45mp.m. until 4 p .m . , which were made while the subject was sittingquietly eating an orange or drinking grape j uice
,a value of 1 12 was
found . Even an hour after eating, when the subject had colic and wasin much distress , the pulse-rate was considerably lower than duringthe period of eating, while the average value obtained when the subjectwas lying on the couch during a respiration experiment in the earlymorning was about 59. Evidently the process of eating or drinking
,
immediately following a prolonged period of inanition,increased the
pulse-rate very greatly. OnMay 15— 16, the second day of this period ,the Sharp rise in the pulse-rate incidental to taking food was likewisenoted at 9“ 40m a . m. and again at 11”46m a . In . On May 17— 18 thevalues obtained from 6 a . m. to 9 a . m. were unusually high
,this being
due in part to the fact that the subject was extremely excited and afterthe experimental period was over broke out into abusive language .
There was undoubtedly a great increase in the psychic disturbance.
COMPARISON OF PULSE RECORDS OBTAINED IN EXPERIMENTS WITH THEBED CALORIMETER AND THE RESPIRATION APPARATUS .
While an examination of the general trend of the pulse curves showsadmirably the tendency for the amplitude during the night to fall toa lower level , a comparisonof the average values obtained under varyingconditions can best be made in tabular form. Accordingly
, in table 6the average values are given for observations made when the subjectwas lying in the bed calorimeter and also the average of the recordsobtained when the pulse-rate had reached its lowest level during thecalorimeter period . The values for the experiments with the respiration apparatus are likewise given, including those made in the morning , in the evening , when the subject was sitting quietly and alsowhen wri ting . Furthermore, for purposes of comparison the pulse-raterecords taken during the blood-pressure tests are included for bothpositions of sitting and lying . A number of important comparisons canthus be made .
During his stay in the bed calorimeter the subjectwas probably asleepfor the greater part of the time— at least on many nights . On everynight he had periods of wakefulness , which at times may have been ofconsiderable length . Consequently not all of the values obtained inthe bed-calorimeter experiments can be taken as actually obtainedduring sleep , but by examining the curves for these experiments it isrelatively easy to select a value which probably represents the averageminimum pulse-rate for this subject during sleep . These values are
given in column B in table 6. Both the average night pulse-rate andthe average minimum pulse-rate have a distinct tendency to decrease , asthe fast progresses , until about the twenty- second fasting day. From

1 13
that time until the end of the fast the pulse records usually rise, so thatat the end of the observations the average values are 3 or 4 beats higherthan they were at the minimum point .
TABLE 6.— Average puke-rate of subjectL . atdif erent times of the day andwith varying activity .
1The respiration experim cnts in the morning were usually made between 8h 30m and 9b
2During the respiration experiments in th e morning on April 1 1 , 12, 13 , and 14 the subjectwaswithout breakfast .
‘The subject had broken h is fast by means of fruit jui ces during the morning.‘During the nigh t ofMay 15—16 the subject lay on the couch in the calorimeter laborato ry.
“During th e morning respiration experiments on May 17 and 18 th e subject was withoutbreakfast.

A STUDY OF P ROLONGED FASTING .
TABLE 6 .
— Average pulsem te of subject L . atdifierent times of the day andwith varyingactivity— Continued.
lPeriods indicated by an asterisk were obtained with the subject sitting, writing.’The average pulse-rate for a period 3h 16m p.m . to 3h 5 1m p.m . on th is day with the subject
lying on the couch was 6 1 per minute .
Any important deductions from average values for the night are outof the question on account of the irregularity in the number of the pulserecords during the night and the impossibility of recording accuratelythe time when the subject slept and when he woke . If , however , wecompare the values for the average pulse-rate with those for the average minimum pulse—rate , we find that about the middle of the fastthe difference 1s only 1 or 2 beats. The greatest variation betweenthese two series of averages is on the fourth day of fasting, when theaverage during the night was 65 and the average minimum value was58. For further purposes of comparison,
it is obviously more logicalto use the average minimum values .
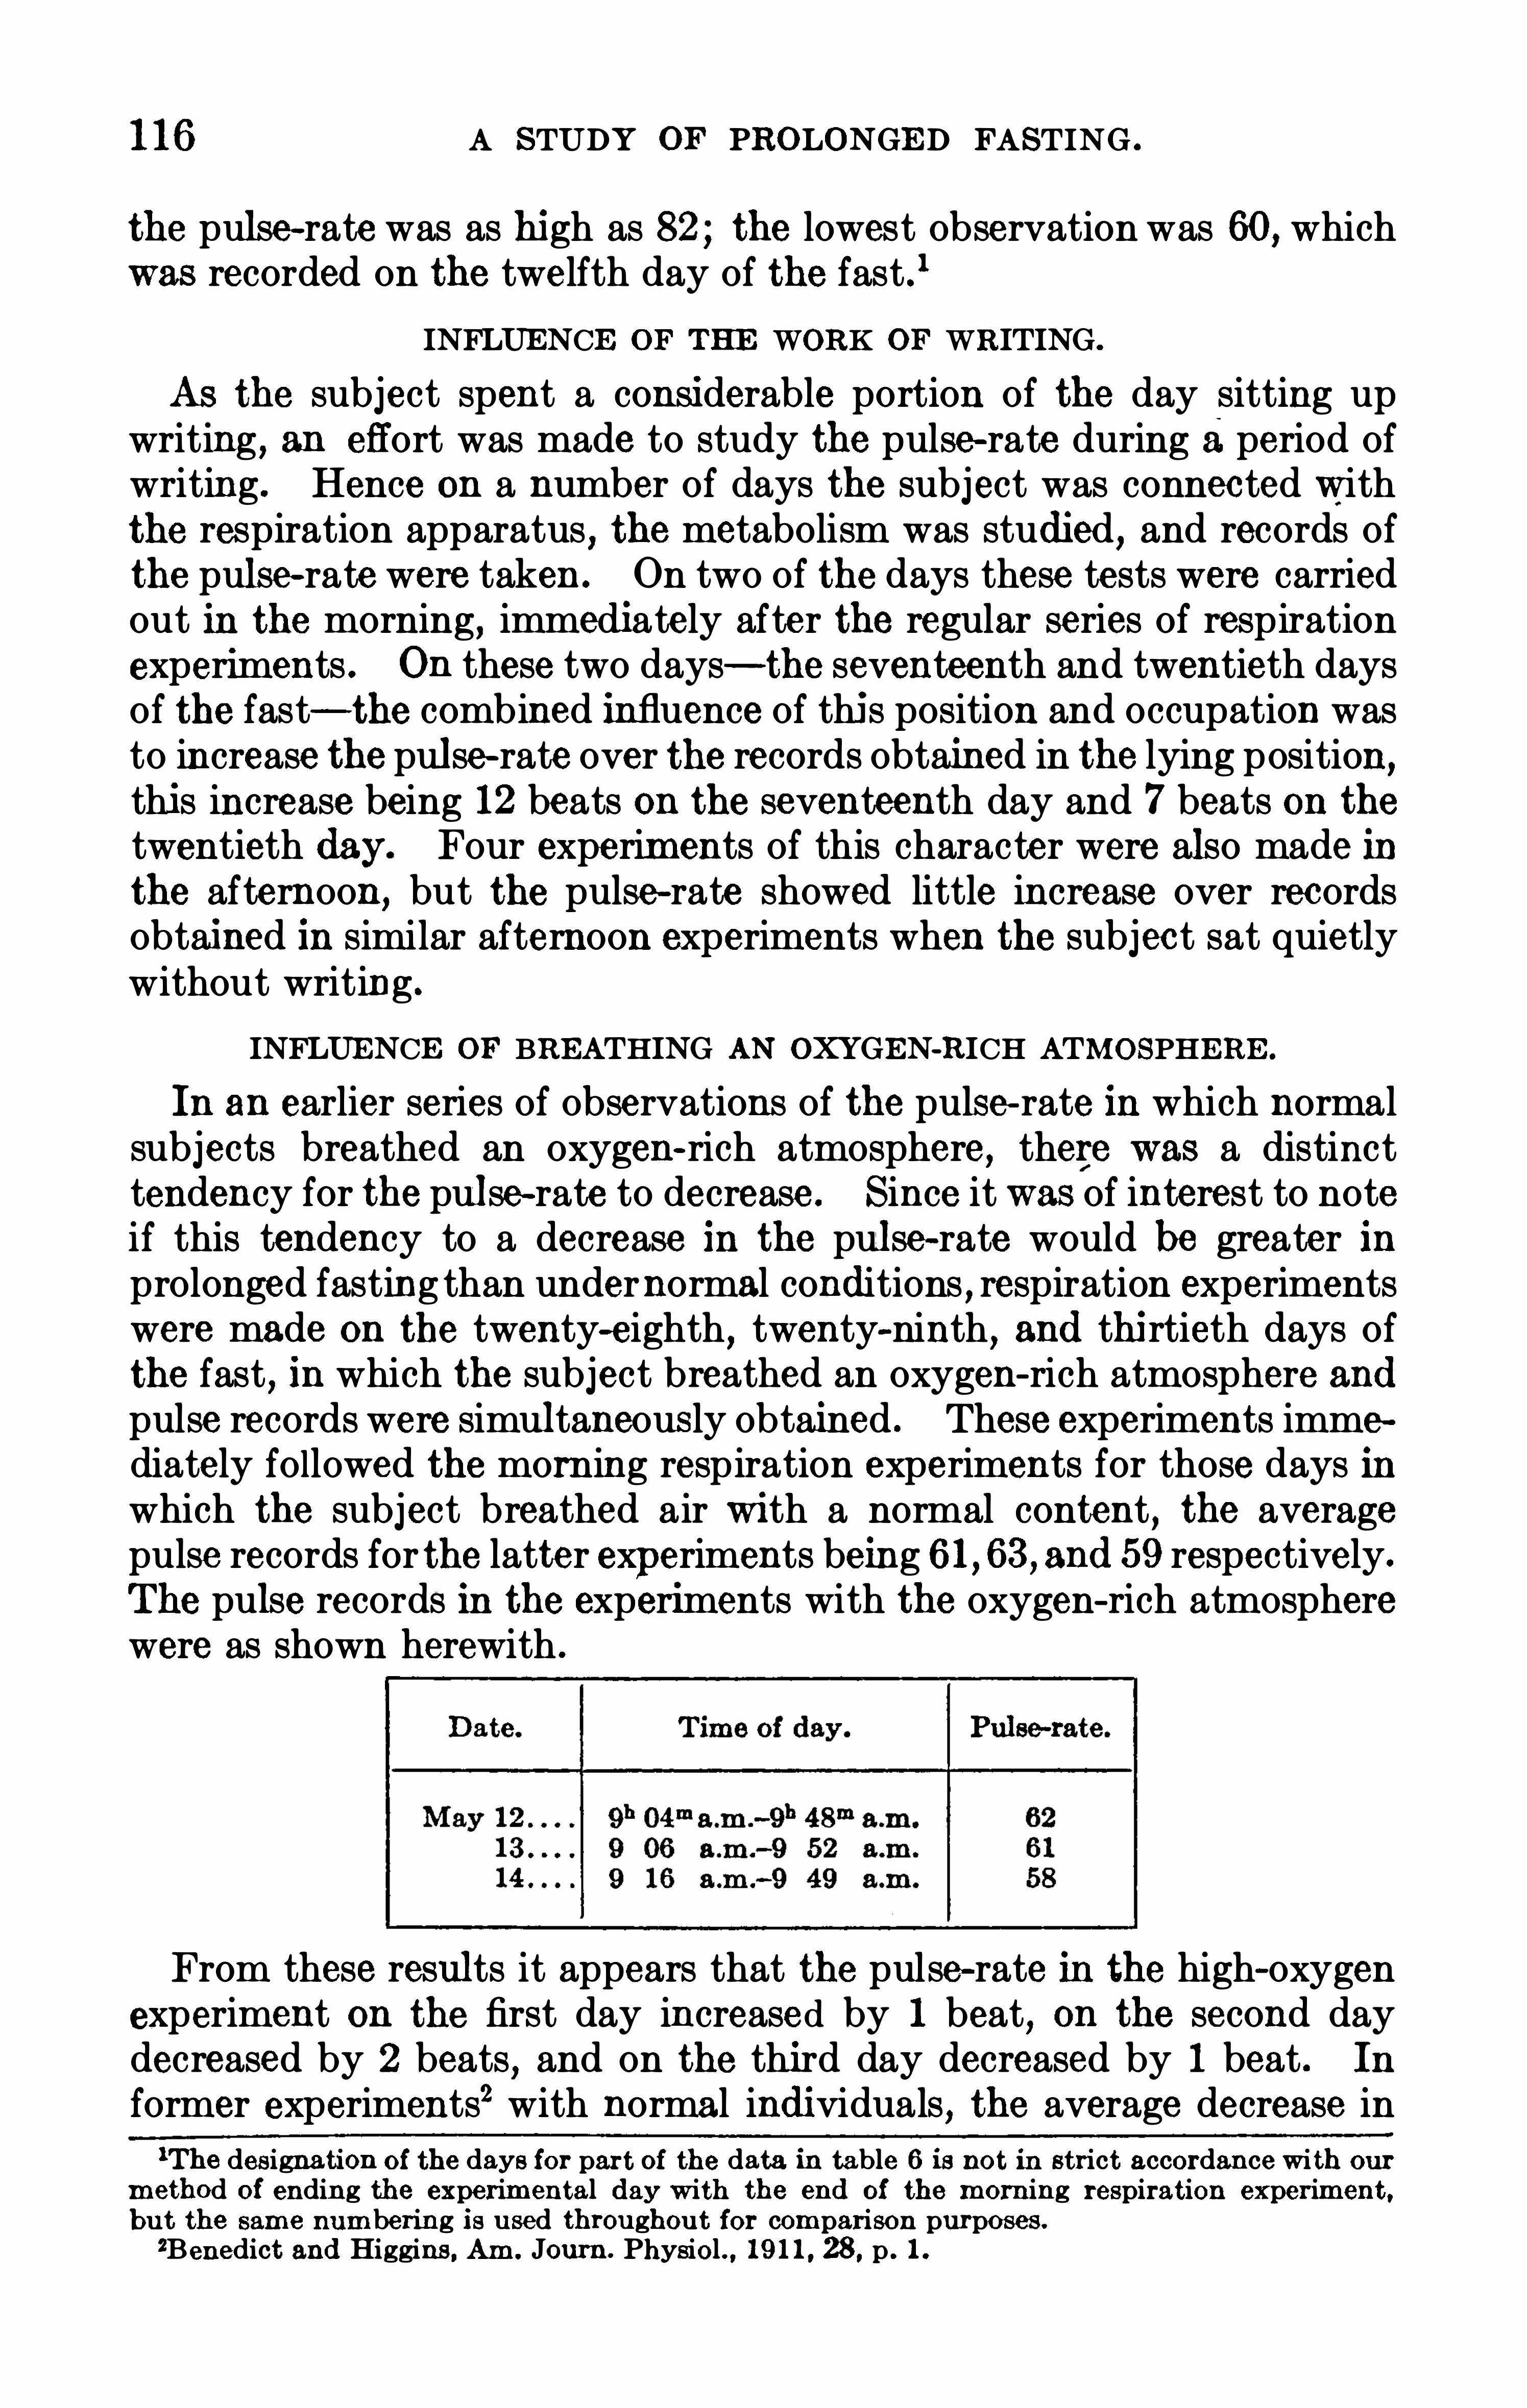
1 16 A STUDY OF PROLONGED FASTING .
the pulse-rate was as high as 82 ; the lowest observation was 60 , whichwas recorded on the twelfth day of the fast . 1
INFLUENCE OF THE WORK OF WRITING.
As the subject spent a considerable portion of the day sitting upwriting
, an effort was made to study the pulse-rate during aperiod ofwriting. Hence on a number of days the subject was connected withthe respiration apparatus , the metabolism was studied, and records ofthe pulse-rate were taken. On two of the days these tests were carriedout in the morning, immediately after the regular series of respirationexperiments . On these two days— the seventeenth and twentieth daysof the fast— the combined influence of this position and occupation wasto increase the pulse-rate over the records obtained in the lying position,
this increase being 12 beats on the seventeenth day and 7 beats on thetwentieth day. Four experiments of this character were also made inthe afternoon, but the pulse—rate showed little increase over recordsobtained in similar afternoon experiments when the subject sat quietlywithout writing .
INFLUENCE OF BREATHING AN OXYGEN-RICH ATMOSPHERE .
In an earlier series of observations of the pulse-rate in which normalsubjects breathed an oxygen-rich atmosphere , there was a distincttendency for the pulse-rate to decrease . Since it was of interest to noteif this tendency to a decrease in the pulse-rate would be greater inprolonged fasting than undernormal conditions , respiration experimentswere made on the twenty-eighth , twenty-ninth, and thirtieth days ofthe fast , in which the subject breathed an oxygen-rich atmosphere andpulse records were simultaneously obtained . These experiments immediately followed the morning respiration experiments for those days inwhich the subject breathed air wi th a normal content , the averagepulse records for the latter experiments being 61 , 63, and 59 respectively.
The pulse records in the experiments with the oxygen-rich atmospherewere as shown herewith .
From these results it appears that the pulse-rate in the high-oxygenexperiment on the first day increased by 1 beat, on the second daydecreased by 2 beats , and on the third day decreased by 1 beat . In
former experiments2 with normal individuals, the average decrease in‘Th e designation of the days for part of th e data in table 6 is no t in strict accordance with our
m ethod of ending th e experim ental day with the end of th e morning respiration experiment,
but the same num bering is used throughout for comparison purposes.
2Benedict and Higgins, Am . Journ. Physio l. , 19 1 1 , 28 , p . 1 .

PULSE-RATE . 1 17
the pulse-rate with the oxygen-rich atmosphere was not far from 5 to6 beats, but with this fasting subject the inhalation of an oxygen-richatmosphere apparently produced no change in the pulse-rate .
DIURNAL RHYTHM.
Beginning with the twelfth day of the fast, respiration experimentswere made each evening, just before the subject entered the bed calorimeter. Comparing the records of the pulse-rate for these experimentswith those obtained in the morning experiments , it will be
‘
seen thatthe pulse-rate in the evening was almost invariably higher than in themorning . While the difference in the middle of the fast is very slight, ittends to increase as the fast progresses
,until on the thirtieth day there is
a difference of 12 beats . On the twenty-first day the evening rate was2 beats lower than that observed in the morning , the lowest pulserecords for the evening experiments being found on this day.
IRRITABILITY OF THE HEART.
In all of the comparisons of the pulse records it is difficult to findany very definite indications of the so-called “ irritable heart , especially emphasized by the Berlin investigators in their study of Cetti.It is true that the change from lying asleep to lying awake resulted in anincrease in the pulse—rate, the difference in the fasting period being notfar from 7 to 8 beats , with a maximum of 10 and a minimum of 4 beats .It is further true that the change from a sitting to a lying position, asnoted at the time of the blood-pressure tests in the latter part of thefast
,tended to decrease the pulse-rate from 4 to 15 beats per minute,
averaging not far from 7 to 8 beats . Likewise, the pulse- rate in theevening respiration experiments averaged a few beats more than in themorning respiration experiments . But no great indication of an irritability of the heart was noted with any of these minor changes in positionand activity.
On the food days,however, there was a great increase in the pulse
rate at the time the food was taken. Eu thermore, the records obtained
at the time of the blood-pressure observations show that the pulse-ratedid not quickly return to the minimum after changing from a sittingto a lying position for the pulse-rate in the lying position is usually afew beats higher than the value obtained in the morning respirationexperiments . Since the value for the lying position was found almostimmediately after the test , it is hardly possib le that the body had timeto adjust itself to the position
,but the tendency to reach the minimum
found in the morning is worthy of note . Evenwi th the slight activitydue to the blood-pressure tests and changing the position , the pulserate is not so high as the pulse-rate obtained in the evening respirationexperiments
,showing that the prevailing diurnal variation was greater
than that obtained with slight activity earlier in the day.
1 18 A STUDY OF PROLONGED FASTING .
A point of considerable importance is the fact that there was adistinct tendency for the pulse-rate to reach a minimum between thefourteenth and twenty-second days of the fast , that is , during the thirdweek . Consequently, all of the pulse records , including the averageminimum records inside the bed calorimeter, the average for the calorimeter experiments , and the average for the morning respiration exper
iments, Show a tendency to increase in the fourth week . The sametendency may be noted in the pulse records obtained at various timesthroughout the day. It is clear
,therefore , that during the latter part
of the fast the heart of the subject was in a somewhat more irritablecondition than during the third week.
The observations on the pulse-rate in this fasting experiment havegreat significance when compared with the simultaneous measurementsof the metabolism, as is done in subsequent sections of this publication.
The records have therefore been presented in extenso, as they show
strikingly that the pulse-rate may legitimately be used as an index ofthe metabolism. The total metabolism was measured only during thetimes when the subject was on the respiration apparatus or inside thebed calorimeter. For the remainder of the day, especially during thosetimes when the subject was most active, the metabolism was not measured, so that the probablemetabolism at these times must be estimatedin so far as possible from the records of the pulse-rate . We thereforehave little evidence of the effect of muscular activity upon the heart ,except as shown by the few pulse records taken following slight activity .
These do not indicate a distinctly irritable heart .Themuscular activity of the subject was probably greater at the timeof the dynamometer tests than during any other observations . The
relatively few records made before and after these tests Show a distinctrise in the pulse-rate incidental to the dynamometer test, but also a veryrapid return . Unfortunately they were not taken with sufficientregularity for us to note positively any indication of the increased ordecreased irritability of the heart as the fast continued . It was theintention to study in this experiment the influence of light muscularactivity upon the heart beat and the metabolism,
but here again theunwillingness of the subject to engage in muscular activity of any kindprevented valuable observations originally planned for.

120 A STUDY OF PROLONGED FASTING .
steadilyduring the fast from 1 10 to 90 mm . The daily observations arenot recorded .
No direct blood-pressure measurements were made by the Berlininvestigators on their fasting subjects , although from an examinationof the pulse curves made with a Marey sphygmograph at the radialartery, Senator and Mueller
1 concluded that there was a noticeabledecrease in the arterial tension which produced not only a dicrotismbut likewise a decrease in the elasticity. This was more noticeablewith a subject who fasted 10 days than with another who only fasted6 days
,notwithstanding the fact that on the last fasting day the pulse
rate was so weak that they could not secure a suitable curve .
The observations made of the blood pressure in the fasting experiment with our subject L . are given graphically in figure 19
,the curves
representing the systolic , diastolic , and pulse pressures for both positions of lying and sitting . With these are compared curves Showingthe average pulse—rate secured in the bed-calorimeter experimentsthroughout the night and also in the morning respiration experiments .During the latter part of the fast , the pulse- rate was likewise securedat the time the blood pressure was taken,
in both positions of lying andsitting. These values are given in table 6 (pages 1 13 andAs is usually the case , the systolic blood pressure when the subjectwas lying down was invariably somewhat higher than when the subjectwas in a sitting position, with a general tendency for the differencebetween the two to become greater as the fast progressed . On the lastday of the fast
,however, the difl
'
erence was not much greater than atthe first of the fast . The curves for the diastolic pressure also Showhigher values for the lying position,
although the difference is not sogreat as with the systolic pressure, for up to about the fifteenth daythe two curves are approximately the same .
The systolic pressure for the lying position falls quite rapid ly throughthe first half of the fast , fluctuating considerably in the last half aboveor below the average value of 100 mm . of mercury. The records rangedfrom 134 mm. on April 16 to 94 mm . on April 30. An even lower valuewas obtained on May 16
,26 hours after taking food, namely, 92 mm .
Two days later, however, it had increased to 124 mm .
The curve for the systolic pressure for the sitting position is nearlyparallel to that of the systolic pressure for the lying position,
althoughin the latter part of the fast the values were considerably lower and thefluctuations were not so great . The range in values was from 123 mm .
on April 16 to 83 mm . on May 8. During the latter part of the fastit averaged not far from 90 mm .
The diastolic pressure for the lying position shows a marked fall fromthe third to the fourth day. Subsequently there is a gradual fall to themiddle of the experiment , with a distinct tendency in the latter part of
lLehmann, Mueller, Munk , Senator, and Zunta, Archiv f. path . Anat. u . Physio l. u . f. klin .
Med., 1893 , 131 , Supp . p . 101 .

BLOOD PRESSURE . 121
APRIL MAY
l l 12 6 14 15 16 | 7 I8 19 20 2 I 22 23 24 25 26 27 28 29 30 l 2 3 4 5 6 7 8 9 IO ” 12 I3 I4 lS 16 17 18
DAFYOSODOI
D DAYS OF FASTING DAggsé oor
1 2 3 4 5 6 7 8 9 l0 1 l 12 l3 t4 l5 16 | 7 l8 | 9 20 2 l 22 23 24 25 26 27 28 29 30 3 l
FIG . 19.— Chart sh owing blood pressure, pulse pressure , and pulse-rate of subject L .

122 A STUDY OF PROLONGED FASTING .
the fast for the general course of the curve to rise . The highest recordwas 100mm . onApril 16and the lowestwas 73 mm . onMay 6 . Twentysix hours after food was first taken the diastolic pressure in this positionfell to 74 , but it rose on the third day to 102 mm .
A similar course is followed by the curve for the diastolic pressure inthe sitting position, although the fall from the third to the fourth day isnot so pronounced . The slight tendency to rise in the last part of thefast is also shown in this curve . The highest record was 90 mm . onApril 16 and the lowest was 70 mm .
, recorded on April 30, May 1 , andMay 2.
The general trend of all four curves for the systolic and diastolicpressures in the two positions is a distinct decrease in blood pressureduring the first 15 days of the fast, followed either by an average constant value or a slight tendency for the pressure to rise in the last partof the fast .With these observations of the systolic and diastolic pressure, it was
possible to obtain the pulse pressure, this being the difference betweenthe maximum and minimum blood pressures . According to somewriters , the pulse pressure is of more significance than the blood-pressure observations themselves . An examination of the curves Showsthat the pulse pressure in the lying position was, except on one day
,
higher than the pulse pressure for the sitting position. The curves areby no means parallel , however, as there are great differences in thelevels . The pulse pressure for the lying position decreases until thefifteenth or sixteenth day of the fast, and then fluctuates considerably ,but averages approximately 23 mm . The pulse pressure for the sittingposition shows a much more marked similarity to the trend of the bloodpressure curves, i . e. , a falling pressure until about the fifteenth day ofthe fast , followed by a period of approximately constant values , andfinally a distinct tendency to increased pressure towards the end ofthe fast.In considering the blood-pressure records, it is of interest to comparethem with the average pulse-rate curves obtained in the bed calorimeterexperiment during the night and on the respiration apparatus in themorning . These curves are given in the lower part of figure 19
, and
Show a general parallelism with each other. Curves are also givenshowing the pulse-rate records for both positions obtained in the latterpart of the fast at the time the blood pressure was taken. A fact ofSpecial interest in connection with these curves is that the averagepulse-rate in the latter part of the fast has a tendency to rise during thecalorimeter experiment and also in the morning respiration experiment.During the same period the blood-pressure curves remain essentiallyconstant , showing only a Slight tendency to rise, the pulse pressure forthe sitting position alone having a tendency to follow more closely theaverage pulse record . From this it may be concluded that the pulse
THE BLOOD.
BY J. E. ASH, M. D
CORRELATION OF LITERATURE.
The blood has frequently been studied during inanition,but an
exhaustive search through the li terature brought to light only a fewrecords of systematic examinations covering so long a period of fastingin man as the case that forms the basis of this report . Fasts of manconducted under scientific supervision and including blood examinations are limited in number, though the work on animals has beenrather prolific . Before presenting the findings in Levanzin’
s blood,
there is given a correlation of abstracts from this literature, of interestnot only from an historical standpoint
,but in demonstrating the diver
sity of results obtained by the various observers .Among the earliest references are those to the work of Valentin l in
1838, who concluded that there was no alteration in the relation ofblood-weight to body-weight as a result of exhaustive starvation
,and
that of Bidder and Schmidt ,”in 1852, though these latter do not report
anything more specifi c than an increase in the solid constituents inthe blood of a starving cat . With reference still to the blood as awhole , London,
3 much later studying a series of 8 rabbits from whichboth food and drink were withheld , found a loss in total quantity ,proportional
,though
,to loss of body-weight . Pashutin4 concludes ,
as the result of the work of Heidenhain,Panum
,and Voit, that the
blood is not impoverished by fasting on the contrary , in certain periods ,the organism is plethoric . He holds it as remarkable that the numberof erythrocytes increase— probably , however, only because of the rapiddecrease in plasma . This latter fact is demonstrated markedly in thedogs observed by W. Miiller and Buntzen,
5 though in none of theiranimals did a loss of more than 15 per cent in body-weight occur.Luciani 6 holds that
,aside from water-content, the blood exhibits a
resistance similar to the nervous system and that the apparent fluctuations
,in corpuscular content at least , depend chiefly on the amount of
water consumed . Chossat, however, quoted by Pashutin,
4 considered1Valentin , Repel . f. Anat. u . Physio l . , 1838, 3 , p . 156 .
2Bidder u . Schmidt, DieVerdauungsfahrte in der Stofi'
wechsel, Mitau u . Leipzig, 1852 , p . 328 .
aLondon , Note sur la question du changement de la quantité générale et de l’
alcalinité du sangdans ls jefine abso lu. Arch . des S ciences B iol . , 1895 p . 5 16 . (Abstract byMuhlmann. See
foo tnote 4 , p .
‘Pashutin , Patho logical Ph ysio logy, Inanition . 1902, 2 , pt. I , p . 81 (Russian) .5Muller and Buntzen, Transfusion and plethora. Christiania, 1875 .
6Luciani , Fisio logia del digiuno . Firenze , 1889 . Authorized translation by M. O. Fraenke l.Das Hung ern , Studien u. Experimente am Mensch en, Hamburg u . Leipzig, 1890 .
124

THE BLOOD . 125
that,next to the fat, the blood suffered the greatest loss , amounting even
to 75 per cent of its former weight . This view is not tenable in the lightof practically all other work and was evidently the result of faultytechnique or observations . Pashutin1 quotes Valentin as notingstriking general changes during hibernation— in part , that the blood
putrefies from 2 to 4 times more slowly, that the arterial blood is not sobright a red
,and that the venous blood is not so dark as normally, due
to disturbance of oxygen interchange.
ERYTHROCYTES .
Considering more specifically the blood elements and beginning withthe erythrocytes, we find that as early as 1843 Schultz
2 studied starvinganimals and found these cells atrOphic, attributing the death of theanimals to the inability of the shrunken cells to bind oxygen. Jones,but a few years later observed that the corpuscles in dogs ’
blood appeared to have undergone “ partial decomposition.
’ Otherssince then have noted these striking alterations in shape and size of thecorpuscles
,among them Manassein
,
4 Andral-Gavarret,4 Laptschinski,
4
and especially Kagen,
5 who studied dogs and rabbits . He found littlechange in the first days , but as the fast progressed the red cells becamesmaller and crenated ones appeared more frequently, until at the end
many “ star forms ” were seen and microcytes predominated . Liuboumdrow6 also found variations in the character of the red cellsmacrocytes , microcytes, and nucleated cells being common, especiallythe large form , which reached 20 to 30 per cent of the total red count .In the roundabout way, we get from Pashutin7 an abstract fromWratsch , 1881 , p . 78
,quoting from foreign j ournals (not specified) a
reference to Dr. Tanner’s blood after his 40-day fast in 1880. This wasa public exhibition
,but well controlled andwas absolute for the first 15
days . The plasma andwhite cells presented nothing unusual . The red
cells, however, were somewhat smaller than normal , being inch indiameter instead of fi l
m; to ” in inch .
Curtis8 made systematic observations of Griscom ’s blood during
his 45-day fast in 1880. This constitutes the longest period with bloodexaminations of which any record could be found .
lPashutin , Path o logical Physio logy , Inanition , 1902 , 2 , pt. I , p . 81 (Russian) .2Schultz , Beitr. z . phys. u. path . Chem . von Sim on , 1884 (quoted by Mahlmann. See footnote
4 , this page .)aJones, Smithsonian Cont. to Knowledge , 1856 .
‘Muhlmann, Russisch Literatur fiber die Patho logie des Hungerns. Centralblatt f. allgem .
Path . , 1899 , 10 , p . 160 .
‘Kagen, B lood andblood pressure in starving organisms. Dissert St. Petersburg, 1884 .Russian.
From the Laboratory for General and Experim ental Path . , Pro f. V. Pashutin , St. Petersburg.‘Liuboumdrow, Changes in the blood and organs in starvation. 7 1 Dissert. , 1893 , Russian.
From the Path . Anat. Laboratory , Pro f. W. Winogradow, St. Petersburg.7Pashutin , Pathological Physio logy , Inanition , 1902, 2, foo tnote p . 605 (Russian) .8Curtis, A study of blood during a prolonged fast. Proc . Am . Ass. Adv. Science , 1881 , 30 ,
pp . 95—105 .

126 A STUDY OF PROLONGED FASTING .
Curtis describes the morphology of the erythrocytes as follows :
The first examination ,made just after Griscom ’
s last meal , showed the cel lsin abundance , of bright color, regular, smoo th of outline, solid in appearance ,and of usual size fi
lm; inch.
On the third day they were paler and apparently not so firm .
Fourth day: The change had progressed . Therewere two sortsof cells to beseen, one pale and large , the other deeper in co lor and contracted . Some of
the former were almost invisible , appeared soft and sticky, enveloping objectsencountered in flow. Their shape was altered to a round rim with abruptdescent to a flat floor. They averaged “
In inch. The other sort were
deeper in co lor, less transparent than normal , and covered with nodules likeblunt cones (evidently crenated) . The cells had lost their usual concavity
, andseemed as though acted upon by an astringent, being much smaller thannormal “
in inch.
Fifth day: The soft pale cells had disappeared, the smal ler variety seemedlarger and nodular. Irregularities in Shape were first noticed
,some cells being
elongated , others lemon or club shaped , and still others had pointed ends.
S ixth to ninth days: The large soft form appeared and persisted in greateror less numbers. Later small colored bodies like red corpuscles appeared ,measuring “
A“ inch. All the erythrocytes at this time were small . The
extremely smal l ones continued to increase in number and diminish in size .
S ixteenth day: Corpuscle-like bodies observed as small as “ 1” inch. Thoseof ”
In to “
1” inch diameter were like normal red cel ls. Others were nodu
lated or of a chestnut-burr appearance.
Thirty-sixth day:“ Saw an erythrocyte undergo direct division. From this
day on, the red cells changed for the worse.
” They became pale, ragged andshrivelled . At this time the subject showed signs of weakened circulationvertigo , numbness of hands and feet.Thirty-eighth day: He fainted on rising from bed.
Thirty-n inth day: There was scarcely a normal corpuscle to be seen .
Fortieth day: After an excursion of 2} hours on the lake, there was a remarkable change in the blood picture. The ragged , pale , and broken corpuscles alldisappeared and all the erythrocytes became smooth in outline and bright inco lor. They seemed quite normal , except that they were smaller, averaging“1” inch. After this, they again retrograded , became soft, pale, and sticky,
but never so bad as just before the lake excursion. Certain minute granuleswere seen in this blood , granules which, in the author
’s experience, exist in all
other persons, except one, whose blood was examined . They were smal l redpo ints fi lmy inch in diameter and highly refractile. They are found also inlymph and cow’s milk. They existed in the blood in great numbers at first,decreasing till after the eighth day ; then disappearing until the twenty-fourthday , when a few pale ones appeared . They then increased in number, butonly returned to their normal abundance after the fast was broken . (Thesewere apparently the platelets that he was observing.)
This report is given in detail to illustrate not only the painstakingcare with which the observations were made, but somewhat the com
parative crudity of the methods employed at that time . As will beseen,
it is only in the earlier reports that the appearance of macrocytes,microcytes, crenated and distorted cells are recorded , and it hasoccurred to the writer that with the improvement of blood techniquethe occasion for their presence was eliminated .
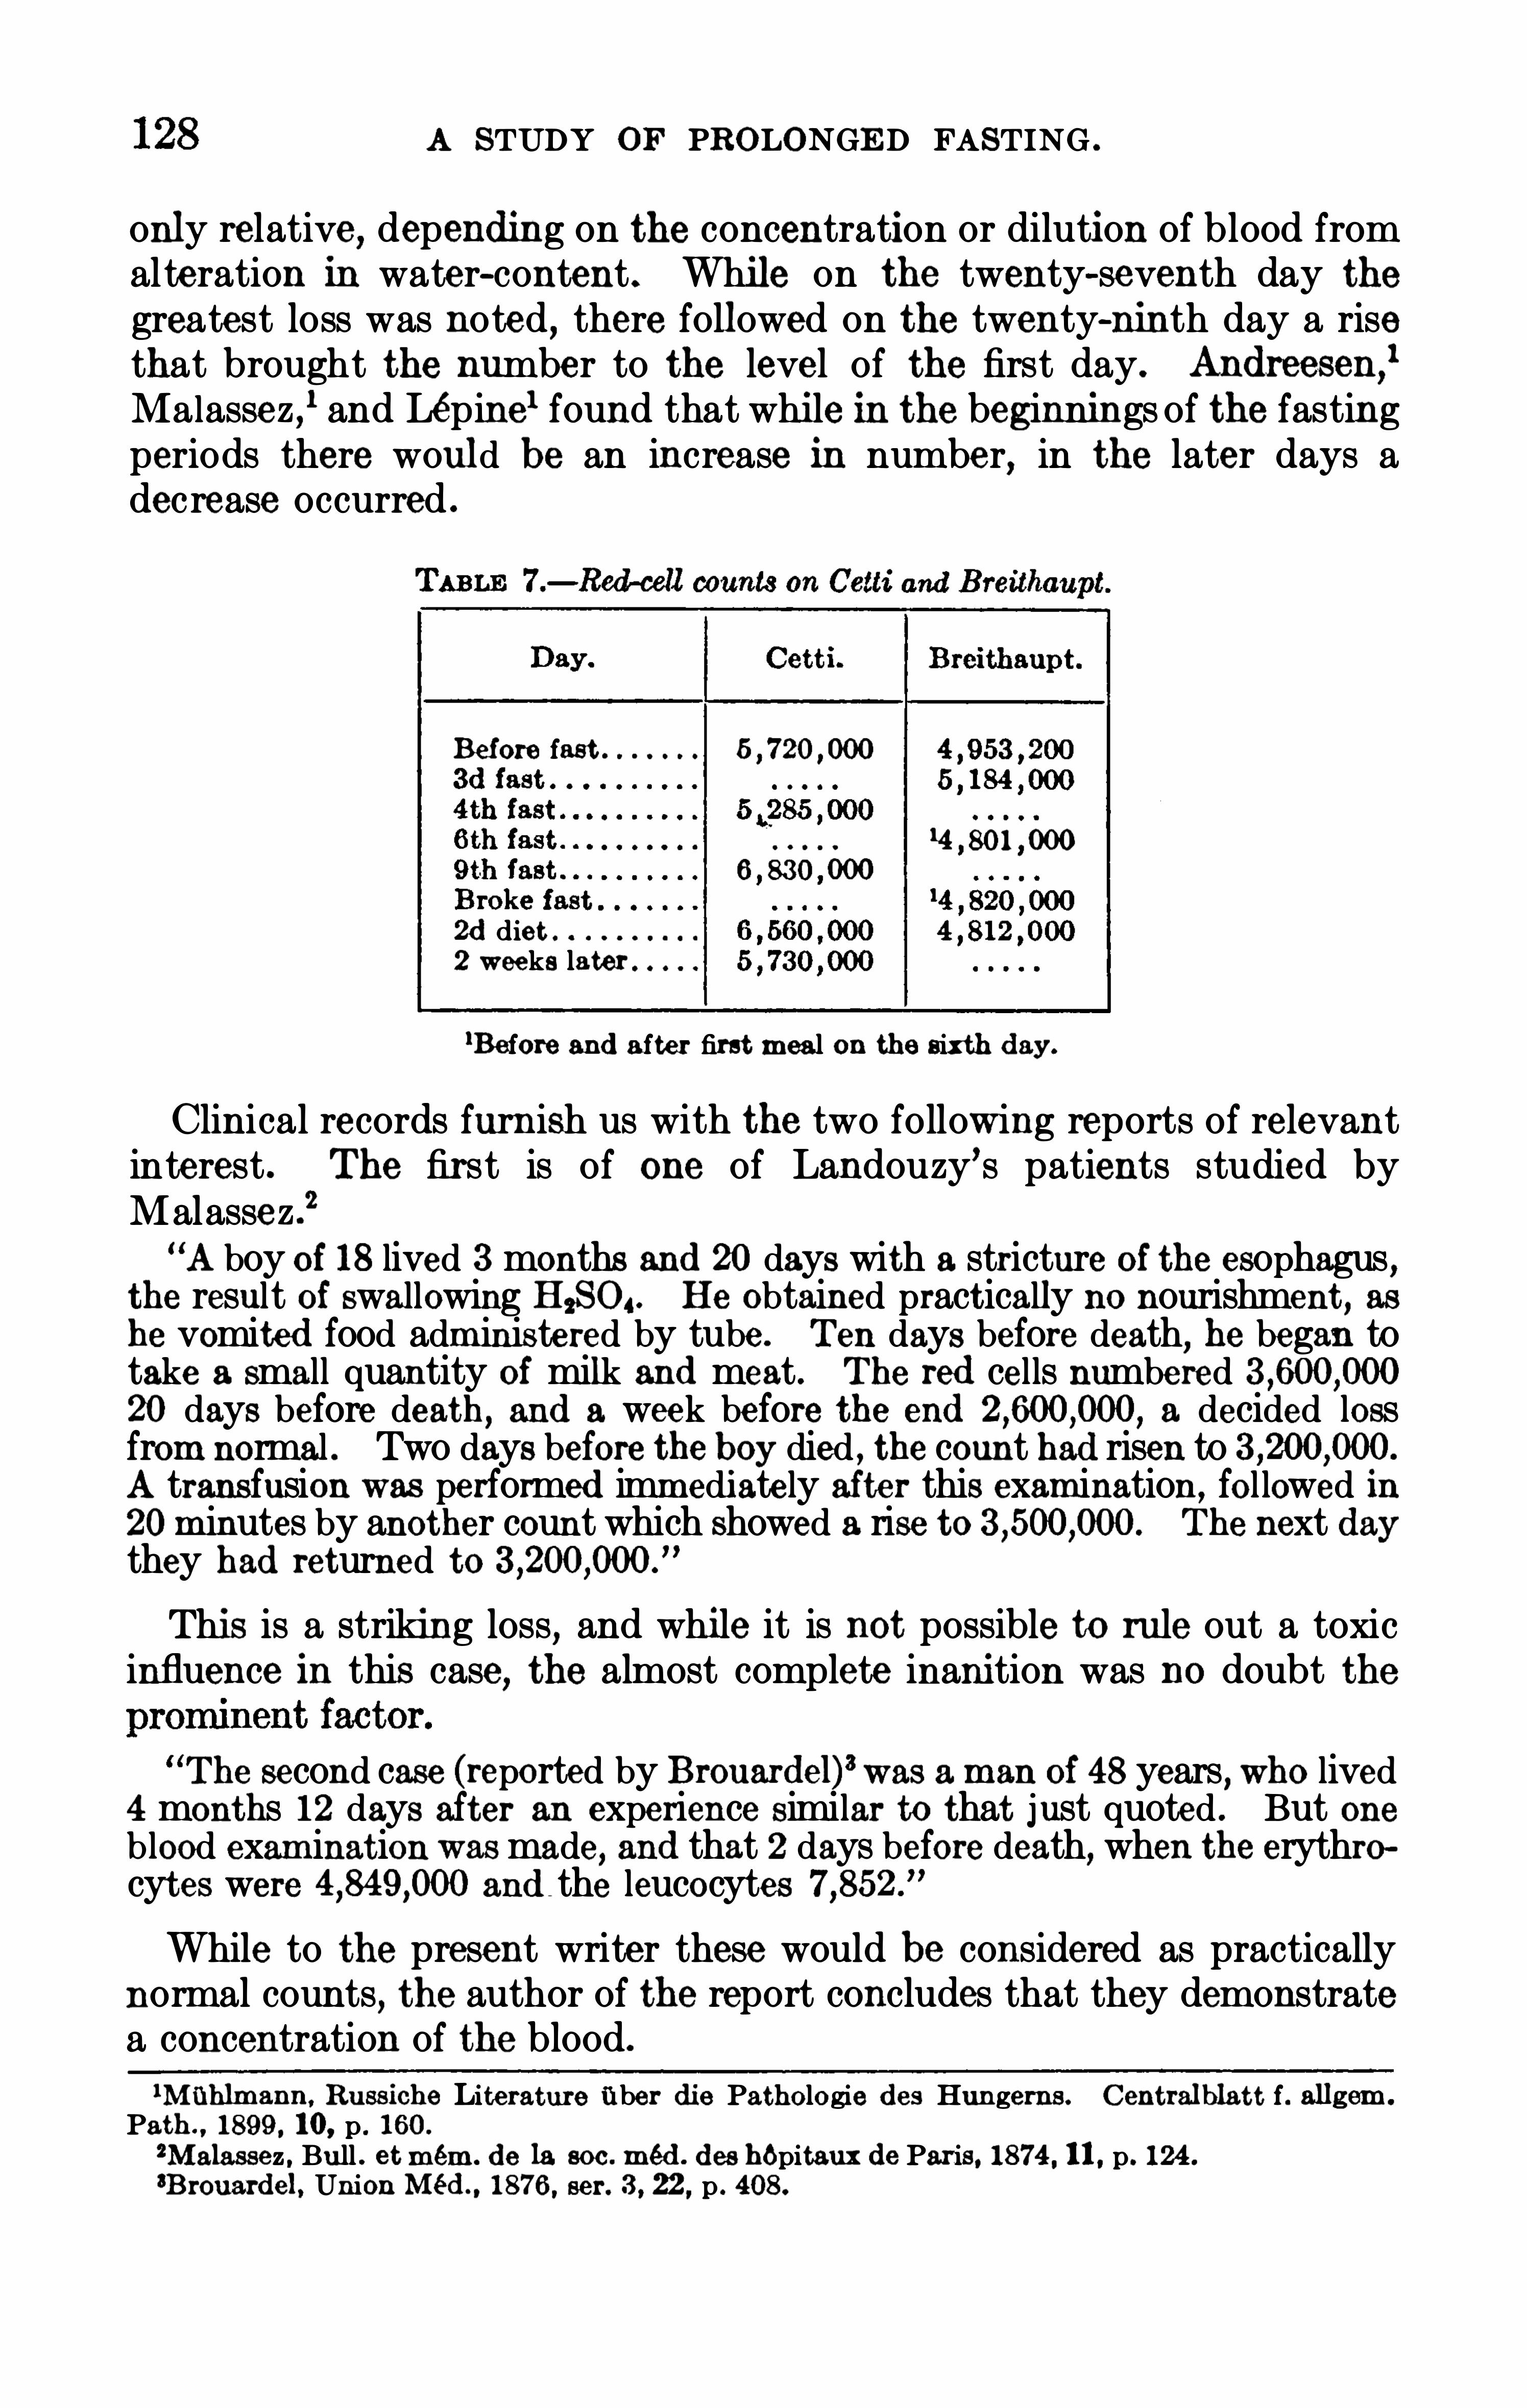
A STUDY OF PROLONGED FASTING .
only relative, depending on the concentration or dilution of blood fromalteration in water-content . While on the twenty-seventh day thegreatest loss was noted , there followed on the twenty-ninth day a risethat brought the number to the level of the first day. Andreesen,
1
Malassez ,1 and Lepinel found that while in the beginnings of the fasting
periods there would be an increase in number, in the later days adecrease occurred .
Before fast
14 80 1 000
6 830 000
2d diet2 weeks later
1Before and after first meal on the sixth day .
Clinical records furnish us with the two following reports of relevantinterest . The first is of one of Landouzy’ s patients studied byMalassez .2
“A boy of 18 lived 3 months and 20 dayswith a stricture of the esophagus ,
the result of swallowing H,SO, . He obtained practically no nourishment, ashe vomited food administered by tube . Ten days before death, he began totake a small quantity of milk and meat . The red cells numbered20 days before death , and a week before the end a decided lossfrom normal . Two days before the boy died , the count had risen toA transfusion was performed immediately after this examination , fo l lowed in20 minutes by another count which showed a rise to The next daythey had returned to
This is a striking loss,and while it is not possible to rule out a toxic
influence in this case, the almost complete inanition was no doubt the
The second case (reported by Brouardel)3was aman of 48 years , who lived4 months 12 days after an experience Similar to that just quoted . But oneblood exam ination wasmade, and that 2 days before death, when the erythrocytes were and the leucocytes
While to the present writer these would be considered as practicallynormal counts, the author of the report concludes that they demonstratea concentration of the blood.
lMtihlmann , Russiche Literature fi ber die Patho lo gie des Hungerns. Centralblatt f. allgem .
Path . , 1899 , 10, p . 160 .
2Malassez , Bull . etmem . de la soc . med. des hopitaux de Paris, 1874 , 11 , p. 124 .
aBrouardel, Union Méd. , 1876 , ser. 3 , 22 , p . 408.
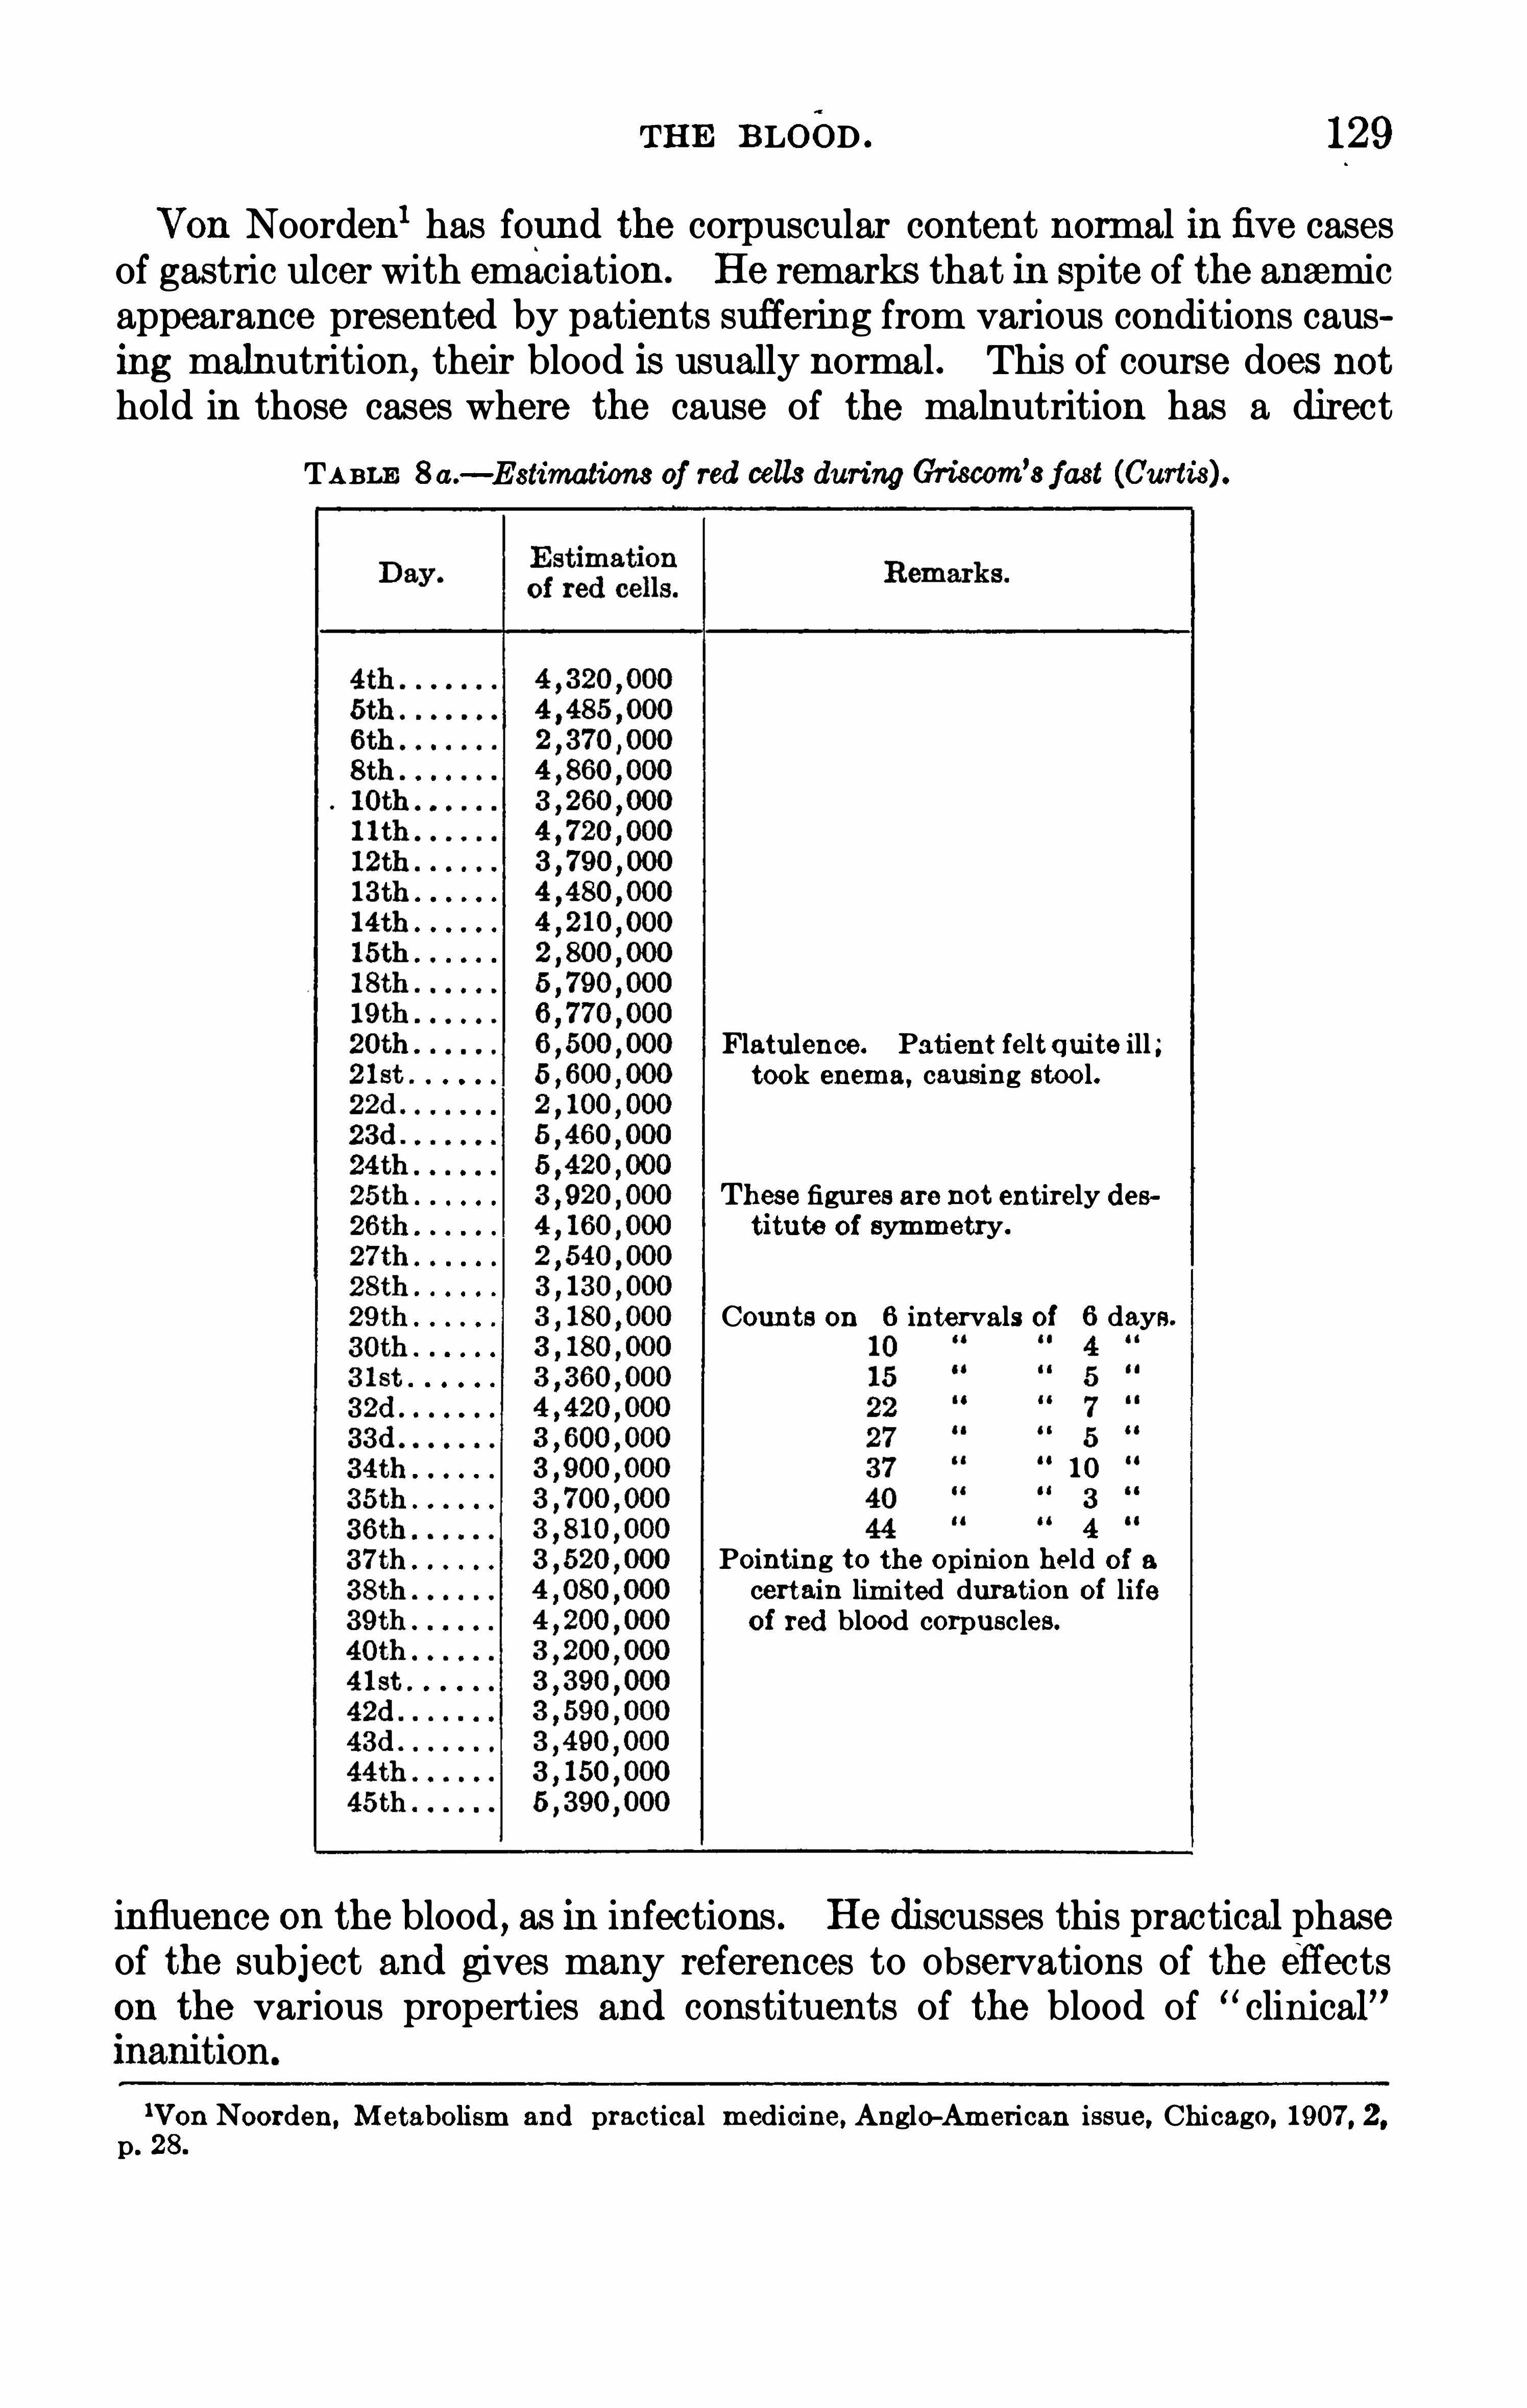
THE BLOOD . 129
Von Noorden1 has found the corpuscular content normal in five casesof gastric ulcer with emaciation. He remarks that in Spite of the anaemicappearance presented by patients suffering from various conditions causing malnutrition, their blood is usually normal . This of course does nothold in those cases where the cause of the malnutrition has a direct
TABLE 8a.— E
’
stimations of red cells during Griscom’sfast (Curtis) .
0 0 0 0 0 0
0 0 0 0 0 0
Flatulence. Patient feltquite ill ;took enema, causing stoo l.
Th ese figures are not entirely destitute of symmetry.
Counts on 6 intervals of 6 days.
0 0 0 0 0 0 0
10
3
4
Pointing to the Opinion held of acertain lim ited duration of lifeof red blood corpuscles.
0 0 0 0 0 0
influence on the blood , as in infections . He discusses this practical phaseof the subject and gives many references to observations of the effectson the various properties and constituents of the blood of “ clinica
lVon Noorden, Metabo lism and practical medicine, Anglo-Am erican issue , Chicago , 1907 , 2,p. 28.

130 A STUDY OF PROLONGED FASTING .
Returning to Curtis’sI article ,wefindthe following protocol (table 8a)of the 38 numerical estimations made of the red cells during the 45—dayfast of Griscom, with the former
’s comments .“The subject was at hisworst physically andmental ly between the twenty
seventh and fortieth days, and during this period the countswere consistentlylow. On the fortieth day he took the excursion on the lake , which was apparently the cause of the drop of from the count of the preceding day .
Itwill also be noted that for the few days before a decided fal l in number therewas usually a rise . The corpuscles on the days of these low counts alwaysappeared healthier than at other times. On the last day Mr. G . drank no
water and the high count of that daymay have been due to concentration.
”
Kagen,
2 in 1884 , claimed that the ordinary methods of determiningthe cell content of blood were open to so many sources of error that theresults were not dependable. He limited his Observations , therefore,to the direct estimation of the solid constituents
, the specific gravity
(by pyknometer) , andhaemoglobin content (Malassez’shaemochromom
eter) . He examined 6 dogs and found in the earlydays an increase in allthree factors , attributing the changes to concentration through waterloss . The amount of solid constituents , he claims , can equal even at theend of the fast that present under normal conditions . Liuboumdrow"
noted , as an average of observations on 17 dogs , a slight increase inerythrocytes till the loss of body-weight amounted to 10 to 15 per cent,then a steady decrease till death, the diminution amounting to as highas 32per cent on the twenty-eighth day . Nasse“ also found an increasein number in a dog after 1 1 days of complete fasting . AS proof thatthis was due to variation in water-content , he states that he obtained areaction in the Opposite direction when the animal was again allowedwater .Polé taew5 studied 8 dogs that received neither food nor water, dyingafter loss of 50 per cent in body-weight . These all showed an increasein red cells until late in the fasts , after a loss of 30 per cent body-weight ,when there was a gradual decrease till death . Polé taéw is not satisfiedwith the exp lanation of this finding simply on the grounds of coneentration,
for he found an increase also in the dogs that were allowedwater . He holds that while there may be interference with bloodformation,
there is also less destruction for bile formation. Tauszk,6
lCurtis, Physio logy of autonutrition ; A study of blood during a pro longed fast. Am . Ass.
Adv . Science , 1880 ,30 , pp . 95— 105 .
2Kagen, B loo d and blood pressure in starving organisms. Dissert . St. Petersburg , 1884 ,Russian . From the Labo rato ry fo r General and Experim ental Path . , Pro f. V. Pashutin , St.
Petersburg .3Liuboumdrow, Changes in the blood and o rgans in starvation . 7 1 Dissert 1893 . Russian .
From the Path . Anat. Labo ratory , Pro f. W . Winogradow , St . Petersburg .
‘de Martigny u . Nasse , Ueber den Einfluss der Nahrung auf das B lut. Marburg u . Leipsic ,1 850 .
5Polé taew, The m orphologic composition of th e blood in complete and incomplete starvationin do gs.
Dissert. 97 , 1894 , St. Petersburg (Russian) . From the Laboratory of Path . Anat . ,
Pro f. Uskow , Riv . internaz . d ’ ig. , Roma,’
95 , 6 , p . 129 , and Arch . d . se . Bio l. St. Petersburg,1893 . 2 , p . 794 .
“Tauszk,Jahrsb. uber d . Fortschr . der Th ier-Chemie , 1894 , 24 , p. 14 7 ; abstracted from Orvors
hetilap,Budapest, 1894 , p . 5 12. Also Haemato log ische Untersuchungen am hungernden mens
chen.Wien . klin. Rundschau , 1896 , 10, p. 306 .

132 A STUDY OF PROLONGED FASTING .
hand, in the case of his already mentioned, could find no suggestivevariation
,though there was some daily fluctuation .
Gordon1 studying the blood of Martin, a medical student who underwent a 9—day fast with the uniform daily water consumption of 24ounces
,could find practically no variation in red-cell count , except that
on the sixth day of refeeding it was about below the normal.At the end of the first week of Succi’s fourth fast
, one of 40 days conducted in London,
2the red cells numbered an increase of
over the average normal individual ’s count . It may be moreor less in this particular case, as the normal count is not given . A . R .
Diefendorf, however, found a slight diminution during and a relativelyrapid rise immediately following each of the two fasts of a man of 7 and4 days interrupted by a feeding period of 19 days
,which formed the
basis of Benedict ’s3 report .Three counts were made on the blood of Dr. Penny,
4 who fasted for30 days , in 1909, drinking only distilled water. They demonstrated amoderate increase till the twentieth day and a loss of duringthe remaining 10 days . Here again no normal count was obtained .
The results for the three counts were for the twelfth day,twentieth day, thirtieth day, Ronsse and van
Wilder5 hold there will always be a slow increase in erythrocytes ifwater as well as food is withheld .
Though the conditions are not altogether analogous, it is interestingto note that in hibernatinganimals there is a decided decrease inerythrocytes, as is reported by Ranke .
°
HfEMOGLOBIN.
Senator, using the v. Fleischl method , noted a moderate increase inhis woman subject7 and in Breithaupt ;
8 a loss, however, of about 20
per cent in Cetti8 in 9 days. (Table
Liuboumdrow9 (with Malassez’s method) found a slight increase in
the blood of dogs until a loss of 10 to 15 per cent of body-weight hadoccurred , when a decrease was recorded that progressed until theanima ls died .
Benedict3 reports a slight loss during, with a rise after, the fasts ,corresponding to the fluctuations of the erythrocytes . The v. Fleischl
and Tallqvist methods were used .
lG ordon, A pro longed fast. Montreal Med . Journ 1907 , 36 , p. 482.
2The fasting man . Brit . Med. Journ 1890 , 1 , p . 144 4 .
‘Benedict , Carnegie Inst. Wash . Pub. 77 , 1907 , p . 322 .
‘Penny , Notes on a th irty-day fast. Brit. Med. Journ. , 1909 , 1 , p . 14 14 .
“Ronsse et van Wilder, Variations du nombre des globules rouges et du taux de l’hemoglobine
eu cours de l’inanition chez le lapin . Arch . intern. de Pharm . et Then , 1903 , 11 , p . 30 1 .
6Ranke. Grundzugs der Physiolog . , 3d cd. , p . 380 .
7Senator , Ueber einenFall von so g . Schlafsuchtmit Inanition. Charité-Annalen, 1887 , 12, p . 316 .
aLehmann , Mueller , Munk , Senato r, and Zuntz , Untersuchungen an zwei hungernden Men
schen . Arch iv f. path . Anat. u . Physio l Virchow’s, 1893 , 131 , supphft. , p . 1 .
“L iuboumdrow,Changes in the blood and organs in starvation . 7 1 Dissert 1893 , Russian.
h orn the Path . Anat. Laboratory , Pro f. W . WiBOgradow, St. Petersburg .

THE BLOOD . 133
Martin ’s1 haemoglobinwas 90 per cent the first day, 95 per cent thefourth
, and 90 per cent again on the last day, the ninth , dropping to 80
per cent 6 days after resuming food .
Penny2 showed an increase of 8 per cent during his 30-day fast , goingfrom 104 to 1 12 per cent .
TABLE 9.
— Haemoglobin estimations on Getti andBreithaupt.
Per cent.Before fast
Fourth dayS ixth day (before first meal)
(2 hours after first meal)
Se cond day of diet
In Luciani’s3 report is to be seen a variation synchronous with that
of the erythrocytes, except on the eleventh and thirteenth days, whenthe percentage failed to rise with them. There was a small increase onthe third and twenty-first days and it was lowest on the thirteenth andtwenty- sixth days . The highest estimation was 90 per cent , the lowest72 per cent (v. Fleischl apparatus) . He concludes that there is anactual loss of haemoglobin . Quoting his studies with Bufalini , carriedout in Sienna in 1882, on a dog that lived 53 days without food , he statesthere was a rapid rise during the first 6 days . (Modified B izzozero
’smethod used) . This he explains as being due not only to concentrationfrom loss of water
,but to the more rapid consumption of plasma than
corpuscles . The initial rise was followed by a gradual decrease con
tinuous until the last 12 days of the fast , during which the percentagewas constant .Gayer
’s“ percentage rose from 80 on the eighteenth day to 100 on the
thirtieth,when his fast was broken.
Charteris ,5 reporting the 14-day fast, notes a drop from 110 per cent
to 96 per cent , after remaining unaffected for the first few days . The
loss was not recovered until several days after breaking fast .Subbotin,
6 using Preyer ’s method (spectroscope) , found a decreaseof haemoglobin in a case fed on nitrogen-free diet . By the twenty-sixthday it had fallen from per cent to per cent and on the thirty
1Gordon , A pro longed fast. Montreal Med. Journ . , 1907 , 36 , p . 4 82.
2Penny , Notes on a th irty-day fast. Brit. Med. Journ . , 1909 , l , p . 14 14 .
8Luciani , Fisio logia del digiuno , Firenze . 1889 . Authorized translation by M. O . Fraenkel .Das Hungern , Studien u . Experim ents am Menschen , Ham burg u . Leipzig , 1890 .
‘Gayer's fast : A private communication from Dr . Wile , of New York City.
“Charteris, Record of changes observed in the blood count and in the Opsonic power of a man
undergo ing a prolonged fast Lancet, 1907 , 2, p . 685 .
6Subbotin , Zeitschr. f. Bio l 1871 , 7 . p . 187 .
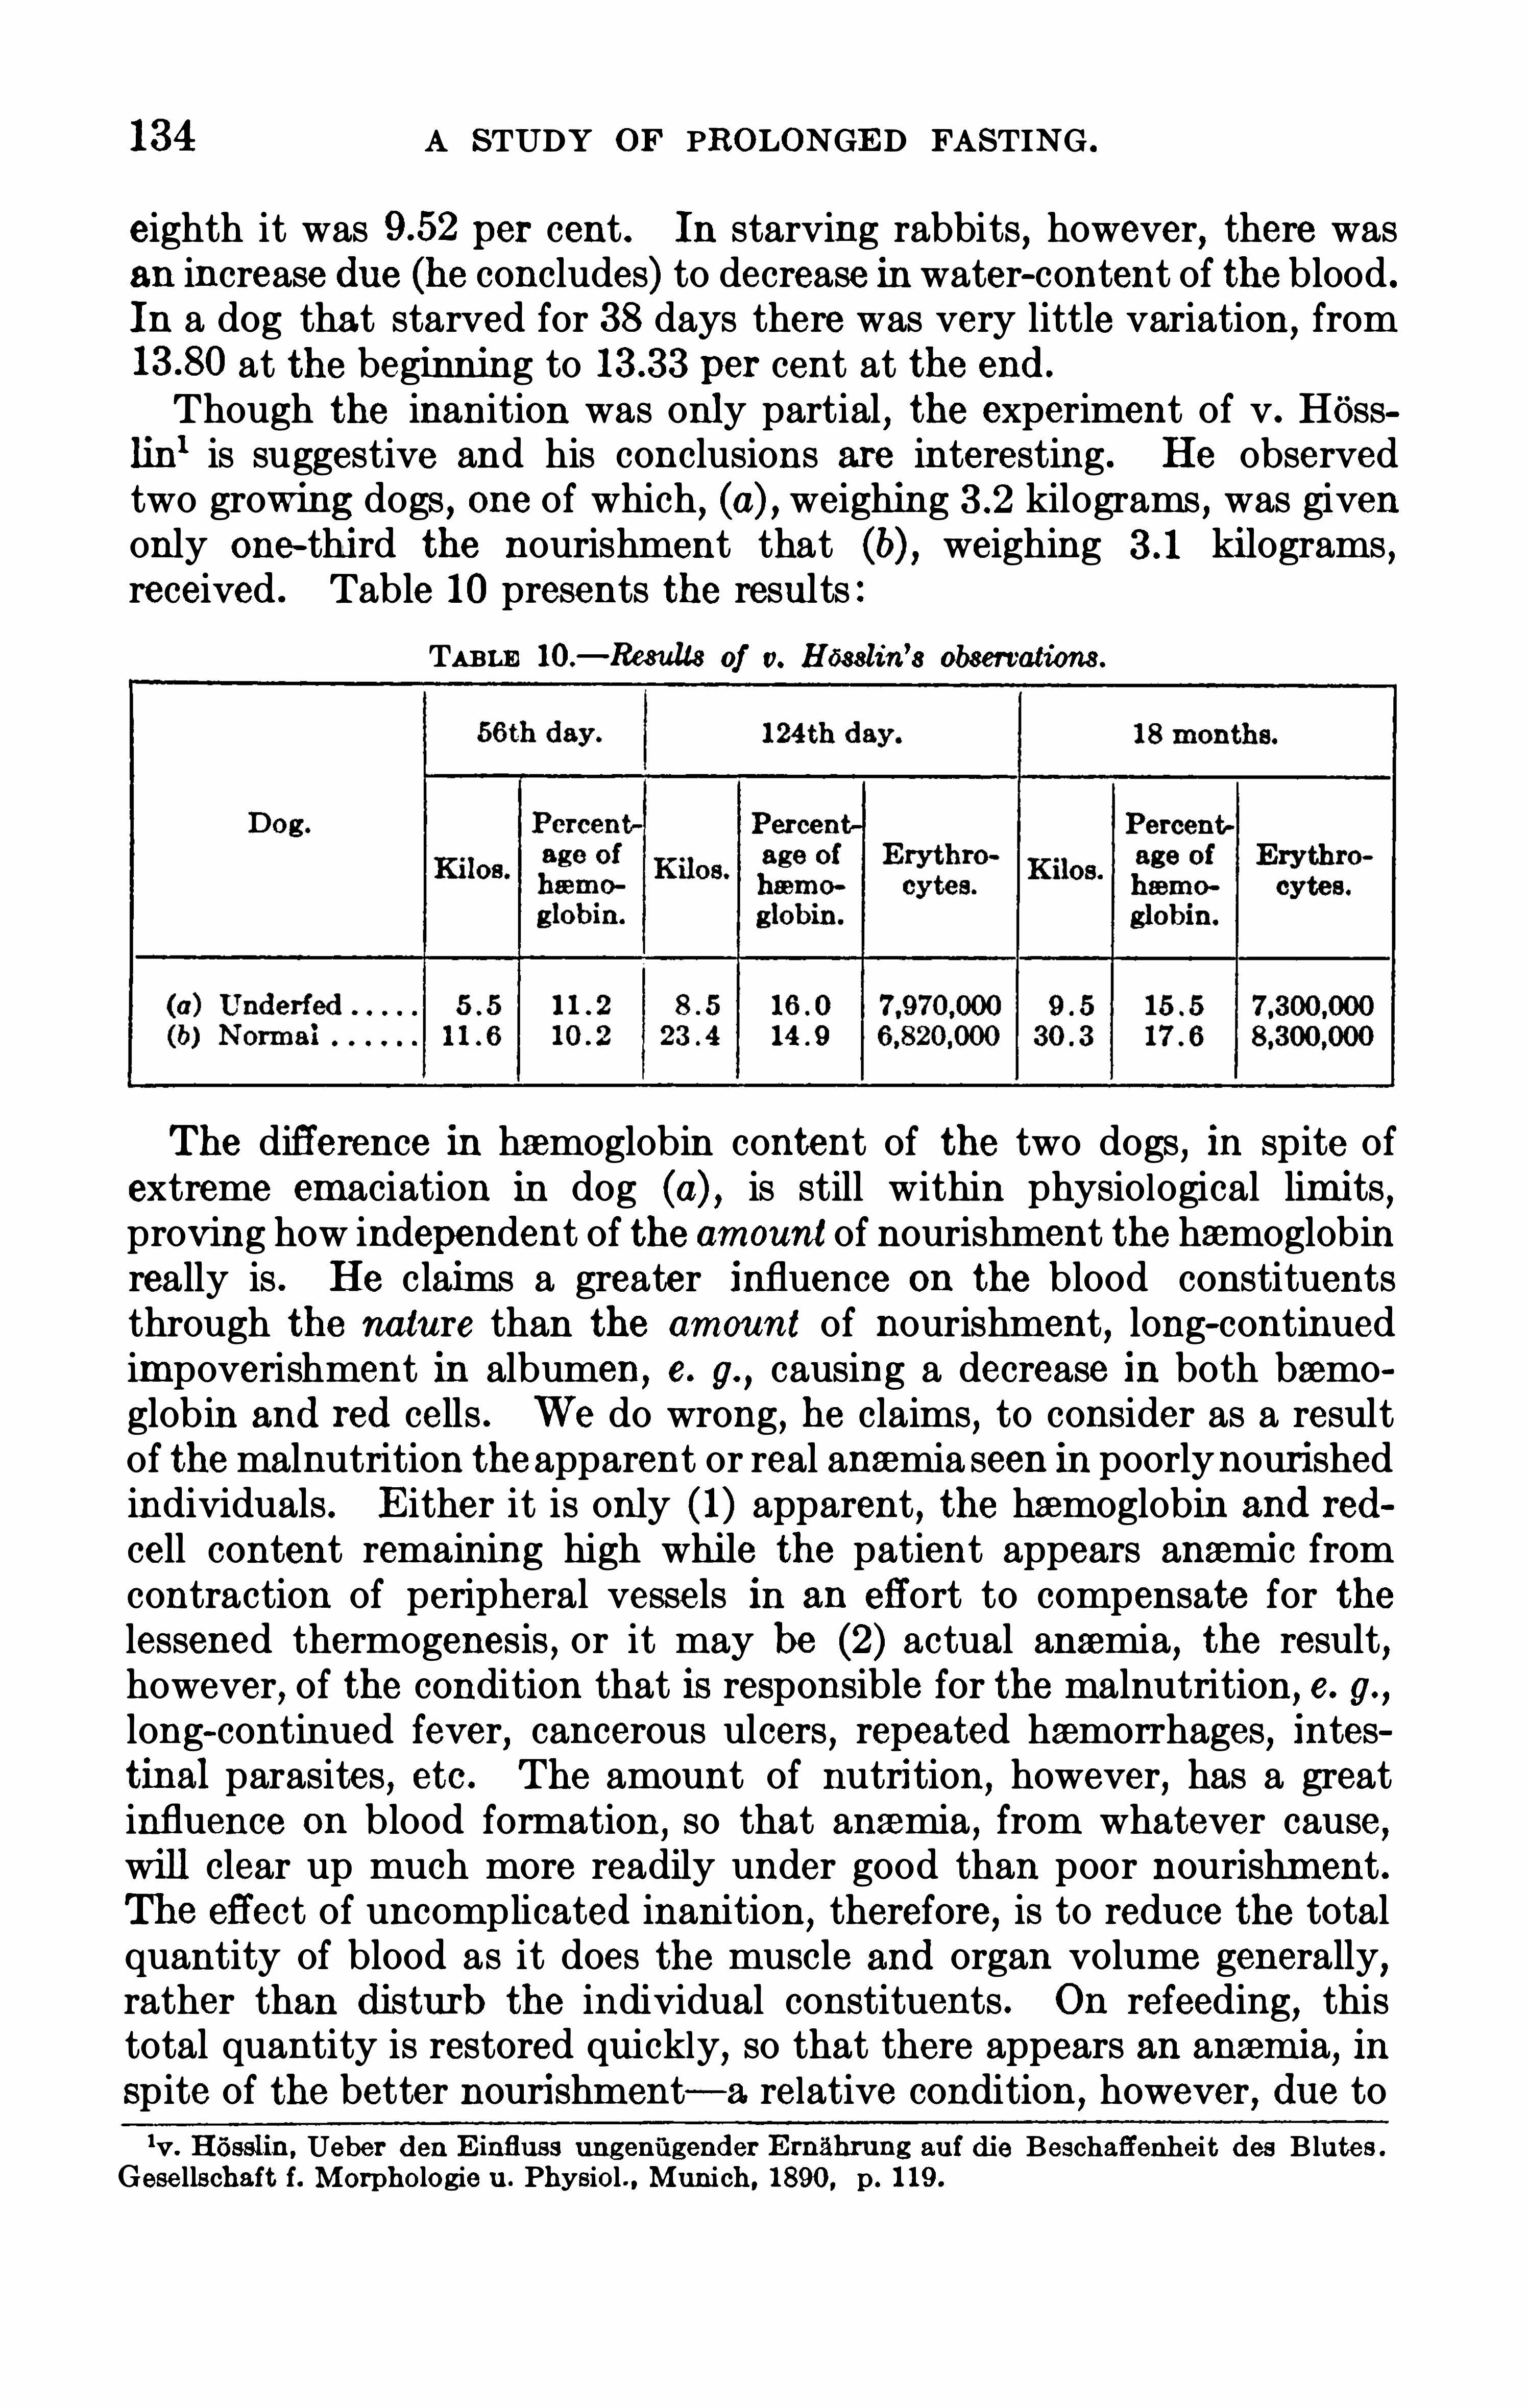
134 A STUDY OF PROLONGED FASTING .
eighth it was per cent . In starving rabbits,however
,there was
an increase due (he concludes) to decrease in water-content of the blood .
In a dog that starved for 38 days there was very little variation,from
at the beginning to per cent at the end.
Though the inanition was only partial,the experiment of v. Hess
lin1 is suggestive and his conclusions are interesting . He observedtwo gron dogs , one of which , (a) , weighing kilograms
,was given
only one-third the nourishment that (b) , weighing kilograms ,received . Table 10 presents the results :
TABLE 10.— Results of v. Hesslin’
s observations.
The difference in haemoglobin content of the two dogs,in spite of
extreme emaciation in dog (a) , is still within physiological limits ,proving how independent of the amount of nourishment the haemoglobinreally is . He claims a greater influence on the blood constituentsthrough the nature than the amount of nourishment , long-continuedimpoverishment in albumen, e. g.
, causing a decrease in both basmoglobin and red cells . We do wrong , he claims, to consider as a resultof the malnutrition the apparent or real anaemia seen in poorlynouri shedindividuals. Either it is only (1) apparent , the haemoglobin and red
cell content remaining high while the patient appears anaemic fromcontraction of peripheral vessels in an effort to compensate for thelessened thermogenesis , or it may be (2) actual anaemia, the result ,however, of the condition that is responsible for the malnutrition, e. g. ,
long-continued fever,cancerous ulcers , repeated haemorrhages, intes
tinal parasites , etc . The amount of nutrition, however, has a greatinfluence on blood formation ,
so that anaemia , from whatever cause ,will clear up much more readily under good than poor nourishment .The effect of uncomplicated inanition, therefore, is to reduce the totalquantity of blood as it does the muscle and organ volume generally,rather than dist the individual constituents . On refeeding, thistotal quantity is restored quickly, so that there appears an anaemia, inSpite of the better nourishment— a relative condition , however, due to1v. Hasslin,
Ueber den Einfluss ung eniigender Ernahrung auf die Beschaffenh eit des B lutes .
Gese llschaft f. Morph o logie u . Physiol . , Munich , 1890 , p . 1 19 .

136 A STUDY OF PROLONGED FASTING .
LEUCOCYTES .
More attention has been paid to the white cells than to any of theother blood constituents and reports aremore at variance as to just whatdoes happen to them during states of inanition. Almost every possiblechange
,especial ly numerical , has been observed at one time or another.
Morphologie alterations are recorded by Luciani ,1 who noted an early
decrease in Size , so that by the fifth day all the leucocytes were smallerthan the red cells . They recovered their normal Size by the ninthday, however.Charteris
,
2on the other hand
,mentions specifically that he observed
no alteration in size .
Manassein3 reports the presence in the leucocytes of fasting rabbits
of refractile bodies that are not affected by acetic acid .
Kallmark“ observed, in his rabbits,rarefaction in the basophiles ,
with agglutination and peripheral arrangement of the granules .Curtis
,
5 in 1880, observed peculiar bodies , resembling leucocytes butlarger, consisting of spherules too small to measure . These cells measured 75 0
16 6 inch in diameter and exhibited amoeboid movement . When
these very indefinite bodies were most abundant, the granules wereabsent from the leucocytes . Curtis does not speculate as to whetherthese were altered white corpuscles or a foreign cell entering the bloodfrom the tissues .Hayem6 concludes that there is no essential change in the leucocytes
during starvation, at least in dogs .Considered numerically bo th as to total and differential estimations
,
the following results are reported from studies of fasts in man :
TABLE l l .—Getti
’s and Breithaupt
’swhite—cell count.
Cetti fasted 1 1 days, Breithaupt 6 .
Ninth day . 4 200
Broke fastSecond day of diet .
Two weeks later
lLuciani, Fisio logia del digiuno , Firenze. 1889 . Authorized translation by M. O. Fraenkel .Das Hungern , Studien u . Experimente am Menschen , Hamburg u . Leipzig , 1890 .
2Charteris, Reco rd of changes observed in the bloo d count and in the Opsonic power of a manundergo ing a pro longed fast . Lancet, 1907 2, p . 685 .
aMt‘
Ihlmann , Russiche Literature fiber d1e Path o logie des Hungerns. Centralblatt f. allgem .
Path . , 1899 , 10, p . 160 .
4Kallmark, Zur K enntniss des Verhaltens der weissen Blutkbrperchen bei Inanition. Fo liaHaamat. , 191 1 , 11 , pt. 1 , p . 4 1 1 .
5Curtis, Physio logy of autonutri tion : A study of blood during a pro longed fast. Am .Ass.Adv.
Science , 1880 , 30 , pp . 95— 105 .
“Hayem , Lecons sur lesm odifications du sang. Paris, 1882 , p . 382.

THE BLOOD . 137
With both Cetti and Breithauptl a moderate decrease was observed
during,with a considerable rise for the first few days following , the
fasting period . (See tableSenator2 concludes that there is a lively new formation of leucocytes
on refeeding.
Luciani3 records a marked diminution in the early period of Succi’s30-day fast
,dropping from the count on the first day , to 861 on
the seventh . The count then rose to where it remained until thetwenty-ninth day with slight fluctuations due to concentration and
dilution of blood . He attributes the marked diminution to the digestive action of trypsin,
which evidently enters the blood as such duringthe cessation of intestinal digestion. He bases this theory on the workof Albertoni , who by intravenous injection of trypsin got almost acomplete disappearance of leucocytes . The trypsin apparently hasno effect on the erythrocytes . It is quite possible, also , that there mayexist in the early days of the hunger period some special destructivecondition
,evidenced also by the loss of hazmoglobin . Two other factors
atwork, he argues, are , first , the disappearance of the lymphocytes, theyno longer being required to alter the assimilated products of digestionin the blood plasma (after the work of Schaeffer, Hofmeister andZawarykins) secondly , the leucocytes may have lost their
“ Wanderlust . There would , then , not only be a failure of
“outwandering
”
from the blood,but of “ inwandering” from the tissues as well , and the
latter would exert the greater influence on the number. The whitecells practically disappeared from Succi’s blood during his fourth fast
,
till late,when small and ill-formed corpuscles were found .
Tauszk4 notes a decrease in total count during one of Succi’s 30-dayfasts . As will be seen in table 12a this was due to loss of mononu
TABLE 12a.— S ucci
’s total and differential white-cell counts.
lLehmann, Mueller, Munk , Senator, and Zuntz , Untersuchungen an zwei hungernden Men
schen . Arch iv f. path . Anat. u . Physio l Virchow’s, 1893 , 131, supphft., p . 1 .
2Senator, Berich t fiber die Ergebnisse des auf Getti ausgefuhrten Hungersversuch s. Berlinklin. Wochenschr 1887 , 24 , p . 427.
8Luciani , Fisio logia del digiuno , Firenze , 1889 . Autho rized translation by M.!O. Fraenkel .
Das Hungern , S tudien u . Experimente am Menschen , Hamburg u . Le ipzig , 1890 .
‘Tauszk, Jahrsb. t’
Iber d . Fortschr. der Th ier—Chem ie , 1894 .24 , p . 14 7 , abstracted from Orvosi
hetilap, Budapest, 1894 , p . 5 12 . Also Haematologische Untersuchungen am hungernden Men
schen. Wien . klin . Rundschau , 1896 , 10 , p . 306 .

138 A STUDY OF PROLONGED FASTING .
clear cells , including lymphocytes. The eosinophiles and polymorphswere increased . Neubert1 found the opposite changes, that is , an
increase in mononuc lear cells and decrease of the eosinophiles and
polymorpho-nuclears. His studies were made on cases of carcinomaand pulmonary tuberculosis , so that the inanition was not Simple .
ThereWas little change in the white-cell content of Martin’s2 bloodduring his 9-day fast , except that on the second and ninth days theyrose to As will be seen in table 12b, there was a very Slightprogressive loss in the polymorphs
,while the lymphocytes were
increased somewhat on the sixth and ninth days . There was nodifferential count made to Specify the total rise noted on the second
TABLE 12b.— Martin
’s differential white-cell counts.
The results of the two examinations of Gayer’s3 blood are given in
table 13 . The striking points in this case are the very low total counton both occasions , the increase in the small and the drop in the largelymphocytes at the end of the fast. No explanation of these changes isoffered by Wile, who made the observations .
TABLE 13 .— Gayer
’s total and differential white-cell counts.
In Professor Benedict ’s subject , whose blood was studied by Dr.Diefendorf ,
4 there was evidently normally a high white-cell count .The results are given in table 14 .
During the first fast of 7 days there was a progressive diminution tillthe last day, when there was a slight rise . After an interval of 19 daysthere was a second fast of 4 days . During this period a gradual riselNeubert, Ein Beitrag zur Blutuntersuchung, speciell Ph thisis pulm . und carcinom , Dorpat.
1889 .
2Gordon ,A pro longed fast. Montreal Med. Journ . , 1907 , 36 . p. 4 82.
3Gayer’s fast : A private communication from Dr. Wile , of NewYork City.
‘Benedict, Carnegie Inst . Wash . Pub. 77 , 1907 , p. 322 .

140 A STUDY or PROLONGED FASTING .
results shown in table 15 . The noteworthy features of the differentialcounts are the high polymorph percentage
,the very marked falling-off
of the lymphocytes , and the increase in the large mononuclears .Reynel could demonstrate no influence on the leucocytes in his dog
that fasted for 25 days .Howe and Hawke2 studied two men during 7-day fasting periods
with uniform water allowance . There was an increase in the polymorphs at the beginning, followed by a decrease to below normal bythe end of the fast . The small lymphocytes presented the reversepicture , while the large lymphocytes increased during the early days .One subject showed amoderate increase in eosinophiles . The bloodof both men returned to normal after several days of diet .
TABLE l5 .
— Penny’s total and diflerential white-cell counts.
Even in animals where conditions can be comparatively readily controlled, there has been a striking lack of harmony in the findings .Rabbits and dogs have been the animals of most frequent choice andOkintschitz
’s3 report of his work on the leucocytes of the former in
1892 is one of the earliest . He was concerned only with the differentialvariations . Normally in rabbits the eosinophiles constitute about 50
per cent , lymphocytes 25 per cent , large round cellsandpolymorphs each
per cent of the total white-cell content . Following Professor Luk
janow’s classificationof the inanition period , he divides it into four parts
(1) the stage of indifference ; (2) that of excitation ; (3) of depression ;(4 ) paralysis of functions . The animals were allowed no water. He
found a diminution of the lymphocytes and po lymorphs and an increasein eosinophiles and large round cells . During the middle periods , therelative diminution was not so rapid as in the first and last periods .The lymphocytes andmononuclears showed their respective alterationsin the first period
,while the po lymorphs and eosinophiles were not
affected till later. The polymorphs showed the most marked diminution and on refeeding they were increased , seeming, therefore , to be thelReyne , quo ted by E . Bardier in h is article on Inanition , in Dictionnaire de Physio logic ,Charles R ichet , 9 , p . 99 .
firHowe and Hawks, Fasting studies, No . IX . On th e differential leucocyte count during prolonged fasting. Am . Journ. Physio l . , 1912, 30 , p . 174 .
aOkintschitz , Ueber die Zahlenverhaltnisse verschiedener Arten weisser Blutkcrperch en beivollstandiger Inanition undbei nach traglicher Aufluterung . (Versuch e an Kaninchen) . Archiv f.exp. Path . 11 . Pharm . , 1892—93 , 31 , p . 383 .

THE BLOOD . 14 1
form most affected by food . The disturbance in blood picture wasstill evident, even when the animals had almost completely regainedtheir body-weight . Hayem,
1 much earlier, in 1882, could see no difference in the variations of the leucocytes in the dog studied by him duringits 25-day fast , and those which occur under normal circumstances .Argaud and Billard2 found about the same alterations in the blood
of the two rabbits they studied , as did Okintschitz . They report amarked hypoleucocytosis with an inversion of the formula, there beingpresent 3 mononuclears to every polymorph . The recovery in theseanimals
,however, wasmore rapid, for in a few days the blood picture
had resumed the normal .Kallmark3 also studied rabbits during periods of complete starvation
varying from 7 to 14 days . He noted a primary fall in lymphocytesand polyneutrophiles, followed by a rise until the seventh day, slow inthe latter form, more rapid in the lymphocytes . In the longer faststhis rise was followed by fluctuations
,none of which
,however
,went as
high as the normal counts . The basophiles showed a marked rise on
the third day of the longer fasts . On refeeding, the polymorphs showeda more rapid rise than the lymphocytes, duplicating the experience ofOkintschitz . Kallmark concludes that the lymphocytes are suppliedin greater abundance during inanition
,most probably by the thymus,
which in so doing atrophies . The primary fall and the post-inanitionrise in the leucocytes occur, he believes , before compensation for thedisturbance of equilibrium has been established or the organism hasadapted itself to the altered conditions . When this has been accom
plished, the changes in the blood are not so much different from thosenoted under normal circumstances .Rieder“ reports finding a marked hypoleucocytosis in the dogs hestudied in 1892.
Liuboumdrow5 found that the leucocytes of his 15 dogs decreasedgradually at the beginning of their fasts or until a loss of 20 per centbody-weight was reached . A gradual rise was then noticed
,except in
6 of them, frequently reaching normal . The lymphocytes showed adiminution persisting to the end, most marked early, dropping from15 per cent to 3 per cent or less . The monocytes reappeared to acertain extent
,after the primary fall . The polymorphs were propor
tional throughout to the total count . Eosinophi les appeared early inthose animals that did not show them before fasting
,and in most cases
there was an increase of 7 to 8 times , which lasted until a loss of fromlHayem , Lecoma sur lesmodifications du sang . Paris, 1882 , p. 382.
2Argaud et Billard , Inversion de la formula leucocytaire sous l’influence de l inanition. Compt.rend . So c . Bio l . , 19 1 1 , 70 , p . 74 6 .
I'K §illmark, Zur K enntniss des Verhaltens der weissen Blutk6rperchen bei Inanition . Fo liam at . , 191 1 , 1 1 , pt. 1 , p . 4 1 1 .
‘Rieder, Beitrage zur K enntniss der Leuko cytose u. s. w. , Leipsic 1892.
l‘Liuboumdrow , Chan ges in the bloo d and organs in starvation. 7 1 Dissert 1893 , Russian .
From the Path . Anat. Labo ratory , Pro f. W . Winogradow, S t. Petersburg.

142 A STUDY OF PROLONGED FASTING .
10 to 30 per cent in body-weight had occurred, when they began todiminish . By the end of the fast they had disappeared altogether.Polé taewl and Reyne2 both observed great variations in the numberof white cells in the dogs they studied
,the former concluding that there
was evidently a diminution in all the forms until a loss of from 30 to40 per cent in weight and then an increase toward the end, of theyounger elements, including lymphocytes .Uskowl interprets these results as follows : In the beginning the
entrance of young leucocytes into the blood is retarded,as is also the
transition of the young into ripe forms . In the later period,however,
the lymph tissue , probably stimulated into increased activity by theproducts of degeneration, sends more cells into the blood , and further,there is probably a more rapid development of the young forms alreadypresent into ripe cells .Keuthe3 noted a decrease in polymorphs and an increase in lymphocytes during the first days and a reversal of this relation in the laterdays of fasting.
Pashutin ,
4on the other hand , concludes that the fast has practically
no effect on the leucocytes , that they show very little alteration.
Howe and Hawke5 observed the following changes in four dogsreceiving only a constant quantity of water : Three of them,
fasting 1 17,15
,and 30 days , respectively, showed a decrease in polymorphs with
an increase in the small lymphocytes . The basophiles , eosinophiles ,and transitional forms showed no noteworthy changes . The fourthdog
,fasting for 48 days , was already anaemic . His blood presented the
reverse picture , the polymorphs increased, the lymphocytes decreased .
An early-developing eosinophilia disappeared . Two of these fouranimals showed an increase in large lymphocytes, while the other twoshowed a fairly constant decrease in the same variety of cell . Duringlater fasting periods of 15 and 30 days in these dogs, the results werequite different, all the forms remaining practically constant, save thelarge lymphocytes .The work of Mann andGage6 is of interest , though it is concerned with
the effects of food rather than of starvation on the morphology and staining properties of the leucocytes . They conclude that during digestionthere is a marked increase in the intensity of staining in the nuclei ; thelPolé taéw The morpho logic compo sition of the bloo d in complete and incomplete starvation
in dogs. D issert . 97 , 1894 , S t. Petersburg (Russian) . From th e Laborato ry of Path . AnatProf. Uskow Riv. internaz . d ’ ig. , Roma,
1895 , 6 , p . 129 . and Arch . d . 3 0 . Bio l . , St. Petersburg ,1893 , 2 ,
p . 794 .
2Reyne ,quoted by E . Bardier in his article on Inanition , in Dictionnaire de Physio logie ,
Charles R ichet, 9 , p . 99 .
3K euth e , Ueber die funktionelle Bedeutung der Leukocyten im Zirkulierenden Blute bei
versch iedener Ernahrung . Deutsch . med. Wo ch enschr. , 1907 , 33 , p . 588 .
‘Pashutin ,Patho logical Physio logy , Inanition , 1902 , 2 , pt . I , p . 8 1 (Russian) .
l‘Howe and Hawke , Fast ing studies No . IX . On the differential leuco cyte count during prolonged fasting. Am . Journ . Physio l 19 12, 30 , p . 174 .
“Mann and Gage , On the changes induced in blood by feeding, etc . Lancet, Lond . , 1912, 2 ,
p . 1069.
144 A STUDY or PROLONGED FASTING .
organ , but in the number of mitotic figures , an evidence of its inactivity.
He quotes v. Friedleben as having made the same observations as earlyas 1859 , Hammar in 1905 , and v. Jonson in 1909. These are the
only references that could be found mentioning the histological appearanoes of the hmmatopoietic organs during starvation . This is a neglected feature of the subject that would seem to offer a rich field forinvestigation. Curran1 and Jolly and Levin2 write of the general pathological changes . The latter carried out their studies on rats and describeparticularly the changes in the lymphatic tissue, essentially, atrophy,particularly of the Malpighian bodies .
PHYSICO-CHEMICAL CHANGES .
Specific gravity — The question of influence of food and drink and theabstinence from them on the density of the blood has been ratherfrequently the subject of investigation. We find that
,as early as 1834 ,
Thacrah 3 noted an increase in the specific gravity during hunger periods. J . Davy4 obtained the same result by depriving his subject onlyof water
,and Nasse,
5 starving dogs but allowing water, found that adecrease occurred in specific gravity after 3 to 4 days , but that by theeleventh day the blood had returned to or even exceeded its normaldensity.
Liuboumdrow,
6 using the pyknometer, detected fluctuations in density as marked , comparatively, as those noted in the number of redcells
,but a complete agreement between specific gravity and erythro
cyte count was not found .
Castellino ,7 studying starving rabbits, found an increase in density
and at the same time a decrease in the serum content of their bloods .P0pel
8 also reports an increase, though a slight one. He studiedboth rabbits and dogs , using Hammerschlag
’s method . In the formerthe increase did not exceed per cent and it was still less in the dogs .After ligation of the ureters , there was the slight fall of per centfrom normal in rabbits
,while the dogs showed a rise of per cent ,
a rather unexpected result , if taking only the water content of the bloodinto consideration.
lCurran , Th e patho lo gy of starvation, Med . Press and Circ . , London, 1880, n. s. , 29 , pp.
210 and 229 .
2Jolly et Levin , Sur lesmodifications histolog’
quesde la rate ala suite du j eune. Compt. rend.
So c . Biol . Paris, 19 12, 72 , p. 829 .
3Thacrah , An inquiry into the nature and properties of th e blood as existent in health and
disease . London, 1819—1834 .
‘Davy , Phy siolog . and Anat. Research es. London , 1839 .
‘de Martigny u .Nasse , Ueber den EinflussderNahrung auf dasB lut. Marburg u .Le ipsic 1850 .
°Liuboumdrow, Changes in the blood and organs in starvation . 7 1 Dissert. , 1893 , Russian .
From th e Path . Anat. Labo ratory , Pro f. W . Winogradow , St. Petersburg.7Castellino , La Suscettibilita infettiva nella inanizione lenta. Riv. d
’
Igiene e Sanita Pub. ,
Roma, 1893 , 4 , No . 3 , p . 4 61 .
3P0pel, Sur les variations de la densité du sang dans ls icfine abso lu, simple , ou compliqué dela ligature des ureteres. From th e Laboratory ofGeneral Patho logy , Pro f. S . Lukjanow,Arch . des
sci . Bio l. , 1895—96 , 4 , p. 354 .
THE BLOOD . 14 5
London’s1 findings do not agree with those above. He also usedHammerschlag’s method, but reports a slight diminution in the rabbitsthat starved for from 5 to 14 days, the average dropping fromto The animals in both the above series were deprived of water.There was evidently a considerable fall in Martin’
s2 blood
,for while
no preliminary estimation was made, on the sixth day of his fast thespecific gravity was on the eighth it rose to and on theninth and last day it had dropped to One week after breakingfast it was still very low if we consider the normal to be to
Lloyd Jones is quoted by Lyonnet3 as finding, on the tenth day of
one of Succi’s fasts, a specific gravity of that rose to on the
thirty-ninth day. In speaking of the influence of food and drink onthe specific gravity, Lyonnet holds that there is usually, though not
invariably,a diminution after the intake of water, the change being
but very temporary. Abstinence from all liquid causes an increase,
but not of so marked a degree as one would suppose . (In this he isquoting Lichtheim .) Food apparently has some effect , in that aftermeals there is a decrease to be found that lasts for an hour or so .
Coagulability.
—Very little mention is made in the literature of theinfluence of inanition on the coagulation time. Vierordt4 was amongthe first to refer to this feature of the subject, having made the observation
,in 1878, that an acceleration of the process occurred as a result
of starving.
Arnold5 and Collard de Martigny5'6 both noticed that the clot waslarger than usual in relation to the amount of serum, and the latter in1850 found a decrease in fibrin content .Jones5 also noted that the water and fibrin decreased more rapidlythan the solid constituents.Kallmark7 noticed that in rabbits, after the fifth or sixth day ofstarvation, the blood coagulated more rapidly, but no estimations ofthe time are given.
Tria8 reports quite recently that he could detect very little variationduring short fasts in rabbits and dogs .lLondon , Note sur la question du changem ent de la quantité generale et de l’alcalinité du sangdans ls jeune abso lu . Ar ch . des Sciences B iol 1895—96 , 4 , p . 5 16 . (Abstract by Muhlmann.
See footnote 5 , this page .)2Gordon , A pro longed fast. Montreal Med. Journ . , 1907 , 36 , p . 4 82.
“Lyonnet, De la densité du sang, sa determination clinique , ses variations physio logiques et
patho logiques. Paris, 1892 , p. 73 .
‘Vierordt, Arch . d . Heilk. , 1878 , 14 , p . 193 .
‘Mfihlmann , Russisch Literatur fi ber die Patho logie des Hungerns. Centralblatt f. allgem .
Path . , 1899 , 10 , p . 160 .
°de Martigny u .Nasse , Ueber denEinflussderNahrung auf dasBlut. Marburg u .Le ipsic . , 1850 .
7Kallmark , Zur K enntniss des Verhaltens der weissen Blutkorperchen bei Inanition . FoliaHaamat. , 191 1 , 11 , pt . 1 , p . 4 1 1 .
aTria, Propri étés ch imico-physiques du sang durant l rnanition. Archiv . ital . do bio l. , Pise ,191 1 , 55 , p . 4 9 . (Arch . di farmacol. sper. . Roma, 1909 , 8 , p .

146 A STUDY or PROLONGED FASTING .
Valentinl noticed a marked retardation of coagulation in hibernating
No report of the Specific estimation of coagulation time during fasting in man could be found . Dr. Wile2 reports that on both examinations of Gayer
’s blood , made on the eighteenth and thirtieth days
,
there was apparent decrease in the platelets , but that coagulation wasaccelerated . He says , of the last examination, that
“the blood was
thick, dark red, and did not flow easily.
” Aside from such generalconclusions without data to demonstrate them
, the only clue as to whatmight be expected in man are a few observations that have been maderelative to meal times .Coleman8 found the longest coagulation time an hour after the
principal meal and the shortest before breakfast .Cohen ,
4 using the method devised by himself, determined that theaverage time before meals was 71
1; minutes and after meals 9 minutes ,
while Mercier, quoted by Cohen in the above article, constantly foundthe coagulation more rapid after meals than before, and Addis
5 claimsthat food has no influence on the process .Cohen“ quotes A. E . Wright as crediting fluids wi th a greater influ
ence on coagulability of the blood than food, but that hunger doesretard the process , a View not upheld by the observations of Colemanand Cohen. Increased consumption of liquids lengthens the time andwithh olding them has the opposite effect .Immum
'
ty.
— There have been a few studies made of the effect ofstarvation on immunity in general and the immune body-content ofthe blood specifically, but the data are scarcely sufficient to warrantdefinite conclusions .In 1890 Canalis and Morpurgo
6 studied the effect on the naturalimmunity pigeons exhibit toward anthrax . They were found constantly to lose this resistance if the fast were begun immediately afterthe injection of the organisms , or a day or so before . They regainedit , however, on refeeding, if the inanition period had not been too long.
This same natural immunity possessed by chickens7 was not lostunless they were starved for more than 8 days . If starved beforeinoculation they proved more susceptible . These workers were unableto make rats susceptible to anthrax by starving.
lValentin , Repel . f. Anat. u . Physio l . , 1838 , 3 , p. 156 .
2Gayer’
s fast : A private communi cation from Dr. Wile , of New York City.
aColeman , Th e coagulation of th e blood and th e effects of certain drugs upon it. Biochem .
Journ. , 1906—7 , 2, p . 184 .
4Cohen , Coagulation tim e of the blood as afi'
ected by various conditions. Arch . Int. Med
191 1 , 8 , pp. 684 and 820.
5Addis, The co agulation time ofthe blood inman. Quart. Journ .Exp.Physio l. , p . 305 .
°CanalisandMorpurgo , Ueber denEinfluss desHungersauf die Empfanglichkeit ffir Infectionskrankh eiten. Fortschr. der Medicin , 1890 , 8 , p . 693 .
7Canalis andMorpurgo , ibid. , 8 , p. 729 .
148 A STUDY OF PROLONGED FASTING .
A decrease in alkalescence was noticed by Tauszk1 in Succi’s blood,
by Castellino2 in rabbits,and Benedict reports the same change in his
subject .3 A very moderate decrease was also observed by London4 inhis eight rabbits. Castellino2 found also a decrease in NaCl contentand in the bulk of serum.
For additional data as to the effects of inanition on the physico—chemical properties, reference can be made to the work of Githens ,
5 Schoeneich
,
6 Fria,
7 Lattes ,8 Robertson,
9 Bierry andFandard,10Daddi
,
11MorozOff,
12andWeber1 3 (who includes an exhaustive correlation of references
to the literature of the entire sub ject of inanition) . Manca14andMac
alum 15 confined their investigations to the cold-blooded animals.
OBSERVATIONS ON L '
S BLOOD.
There is little danger of one’s Opinions being biased by the diverseresults above correlated. We can therefore take up the considerationof our subject ’s blood either with an open mind free from preconceivedideas , or with confused expectations , ranging from absolutely negativefindings to very grave disturbances , with the confidence that we haveprecedent for almost any picture that may present itself . The coagu
lation time and specific gravity were investigated , but the examinations were concerned principally with the red andwhite cell and haemoglobin content , the technique for which follows . That employed in the
lTauszk, Jahreh . fi ber (1. Fortschr. der Th ier—Chem ie , 1894 , 24 , p . 14 7 abstracted from Orvosi
hetilap, Budapest , 1894 , p . 5 12 : also Ham atologische Untersuchungen am hungernden Menschen.
Wien. klin . Rundschau, 1896 , 10, p . 306 .
3Castellino , La suscettibilita infettiva nella inanizione lenta. Riv. d'
Igiene e Sanita Pub. ,
Roma, 1893 , 4 , NO . 3 , p . 46 1 .
aBenedict , Carnegie Inst. Wash . Pub. 77 , 1907 , p . 322 .
‘London , No te sur la question du changem ent de la quantité générale et de l’
alcalanité du sangdans lo jeune abso lu . Arch . des Sciences Bio l 1895—96 , 4 , p . 5 16 . (Abstract byMuhlmann . See
foo tnote 5 , p .
l‘Gith ens, Influence of hunger‘
and haemorrhage on the composition of the blood plasma. Proc .Phila. Count. Med. So c . , Ph iladelph ia, 1904—5 , 25 , p. 279.
‘Schoeneich , Beschafi'
enh eit des Blutes unter verschiedenen Beding ungen. Ztschr. f. exp. Path .
11 . Th erap. , 1905 , 2 , p . 4 19 .
7Fria, Alcune ricerche comparative sulsangue di animali nutriti naturalmente ed innaturalmente .
Fo lia clin ., ch im . et micros. , Salsomaggiore, 19 10— 1 1 , 3 , p. 44 .
8Lattes, Ueber den Fettgehalt des Blutes des Hundes unter normalen u . unter verschiedenenexperimentellen Verhaltnissen (Verdauung, Hungern, Arch . f. exp. Path . u. Pharmacol .,Leipzig, 19 1 1 , 66 , p. 132.
9Robertson, Studies in th e blood relationship of animals, etc. 1 . A comparison of the sera of
the horse , rabbit, rat, and ox with respect to their content of various pro teins in the normaland in the fasting condition . Journ . Bio l. Chem . , Baltim ore , 1912, 13 , p . 325 .
10Bierry et Fandard, Variations de la glycémie pendant l’inanition. Compt. rend. Acad. d . se. ,
Paris, 19 13 , 156 , p. 20 10.
11Daddi, Sur les modifications du po ids de l’extrait éthéré du sang durant ls j eune de longuedurée. Arch . ital. de Bio l. , Turin , 1898 , 30 , p. 4 39 ; also Sulle modificazioni del peso dell estrattoestere
gzdel sangue durante il digiuno di lunga durata. (SperimentaL) Arch . di biol. , Firenze,
1898, p. 4 3.
12Morozoff , On th e effect of fasting for a short time on the morpholo gic composition of the blood .
(Russian) Vrach . St. Petersburg, 1897, 18, p. 1081 .
13Weber, Ueber Hungerstoffwechsel. Ergebnisse der Phy siologic (Bio chemie) , 1902, 1 Abtp.
“ Manca, Le cours de l’inanition chez les animaux a sang froid. Arch . itaL de biol Turin ,
1895 , 23 , p. 24 3 , and 1896 , 25 , p. 299 ; also Chemical researches on animals (cold-blooded) duringinanition (Italian) . Arch . ital. de biol. , Turin, 1903 , 39 , p. 193 .
16Macalum , The inorganic composition of blood plasma in the frog after a long period of inanition. Rep. Brit. Assoc . Adv. Se. , London, 19 1 1 , 80 , p. 766.

THE BLOOD . 149
coagulation and specific-gravity estimations is given under these headings . The attempt was made to determine the opsonic index, but thesubject was so far from an incubator and centrifuge that it was foundimpossible to obtain accurate results . There was a possib ility
,also
,of
this additional manipulation having a disturbing influence on the physiological investigations , so this featurewas abandoned , though still recognized as one of themost important lessons to be learned from the blood .
Technique— For the three days just preceding the fast
, Levanzin’s
blood was examined to determine a normal picture with which tocompare the results later obtained . During the fast, with the exception of the first day and three days scattered through the period ,daily examinations were made and also on the first and third days ofrefeeding . The time of the day did not vary more than half an hourthroughout
,all the specimens being obtained between 10 and 10h 30m
a . m . ,so that there was a constant relation to the general routine of
the subject ’s daily activities —that is,immediately after he had finished
with the respiration experiment,had been weighed , had washed his
face and hands , and climbed the short flight of stairs to his balcony.
It was his habit to take about half a glass Of water before submittingto the lancet prick . (It may be well to mention here that , for the first10 days of the experiment , the subject received the constant quantity of 750 c .c . of distilled water per day, and thereafter, 900
per day .) The specimens of blood were obtained from alternatefingers of the left hand and occasionally from the ear. Deep prickswere made, so as to obtain sufficient blood without squeezing . Forcounting the red and white cells the Thoma -Zeiss apparatus wasused , diluting with fresh salt solution for the former and 1 per centacetic-acid so lution tinged with gentian-violet for the leucocytes . The
usual precautions were taken to insure uniform suspension of corpusclesand the even filling of the counting chamber. In the case of the erythrocytes, 80 small squares were counted and 4 ciphers added to thetotal . The average of two or more such figures was taken as thefinalresult . In estimating the leucocytes , the whole cross-ruled field wascounted and the result multiplied by 200 . The average of three ormore such figures was taken as thefinal estimation. The use of gentianvio let in the acetic-acid solution makes the counting of the leucocytesmuch easier and the likelihood of mistaking foreign particles for cellspractically impossible . The smears for the differential counts werestained by the Wright method ; 200 or more cells were examinedby the use of the far objective andNo . 1 eye
-piece, and classified as fol
lows :Polymorphonuclear neutrophile, eosinoph ile , and basophile ; smalland large lymphocyte ;monocyte ; transitional cell . As the c lassificationof the last three forms is so mooted a question
,it will be necessary to
go into some detail as to just what cel ls were p laced under these heads .Under large lymphocyte was classified the mononuclear cel l , con
siderably larger than the red corpuscle, with a round or typically
150 A STUDY OF PROLONGED FASTING .
indented nucleus (like that of the small lymphocyte though not stainingas deeply) , small amount of cytoplasm in proportion to nucleus , theformer not being markedly baSOphilic and usually containing a fewfaintly-staining granules . The mononuclear was considered the cellwhose nucleus was more indented , the proportion of cytoplasm wasgreater and granules more evident, the latter basophilic and the wholecell staining more deeply than the large lymphocyte . The occasionallarge mononuclear cell of the endothelial type was also counted in withthese cells , though not considered as being associated with them generically. The transitional cell showed a pale-staining, usually kidney orhorse-shoe shaped nucleus , surrounded by cytoplasm, pale and free fromgranules . This classification follows generally that of Pappenh eim .
1
In estimating the haemoglobin percentage the Tallqvist2 scale was
used throughout the series . This method , it is true, is Open to somecriticism in that it is scarcely possible to detect differences of less than3 per cent . My experiences, however, have developed a confidence init that has been justified by comparative readings with other methods .In the present case, from the nineteenth to the twenty-fourth day,estimations were made with the Sahli apparatus and the results werepractically the same as those obtained for the same days with theTallqvist scale . Care must be taken to follow exactly the same technique for each reading , particularly in the matter of light ; the resultswill then be relatively correct, even if the method is comparativelyweaker than some of the others .The results of these examinations are contained in table 16. Theyarecorrelated and presented more graphically by curves given in figures20 and21 . No . I shows the relation of haemoglobin to red cells , andNo .
III the relationof the totalwhite-cell count to the differential . To avoidconfusion of curves the transitional , eosinophile , and basot e are
plotted separately in No . IV and the scale enlarged . In No . II thecomposite curve of the polynuclears, that is , neutrophiles , basophiles ,and eosinophiles and one of the mononuclear cells, large and smalllymphocytes , transitionals , and monocytes, are given for comparison.
Erythrocytes.
— The subject’s normal count apparently was high ; thethree preliminary estimates range well above It maintainedthis highfigure throughout the test , going below it on only two occasions ,the tenth day of the fast and the third day following . In the early partof the fast there is daily variation, ranging under Thisbecomes less evident toward the end. The general impression givenby the curve is that of a very moderate decrease . There were no alterations in the characteristics of the individual cells as to size , shape , andstaining properties and no nucleated red cells were found at any time .
1Pappenh eim u . Ferrata, Ueber die verschiedenen lymphoiden Zellformen des normalen undpatho lo gischen B lutes. Fo lia Haemat 1910 , 10 , p . 78.
2Tallqvist, Ueber die Anwendung des Filtrirpapiers in Dienst der praktischen Haamatologie ,Berl. klin. Woch enschr 1904 , 41 , p. 926 .

152 A STUDY OF PROLONGED FASTING .
APRIL MAYlawnms e nwsmaaau fi mamaml 2 3 4 5 6 7 s swumwmws n
DAY 3
ERYTHROCYTES
M MOGLOBIN
DAY 3
POLY NUCLEAR
F m. 20 .— Chart I . Relation of hemoglobin to erythrocytes.
Chart II . Composite curve of the polynuclears
compared with one of mononuclears.

THE BLOOD . 153
APRIL MAYII 12 8 14 15 16 17 18 192021222324 2526 27282930 I 2 3 4 5 6 7 8 9 10 11 12 l3 l4 15 16 l7
l 2 .0 0
l0 .00 0
0
TOTAL
LEUKOCY
00
SMALL
I .000
FIG . 21 .— Charts III and IV . Relation of total to differential leucocyte counts.
154 A STUDY OF PROLONGED FASTING .
Polymorphonuclear neutrophiles.
— These ran throughout rather consistently with the total count and the marked variations in this latterwere quite apparently due to the change in polynuclear content .Small lymphocytes.
— There are fluctuations in the count of this cell,
except during the period between the fourteenth and twenty-seventhdays
,when they were comparatively constant
,as were also the total and
polymorpho-neutrophile counts . It will be noted that the majority ofthe rises and falls are the opposite of those seen in total and polymor
pho-neutrophile curves . This is particularly the case on the second ,fourth
,thirteenth , fourteenth , Sixteenth, seventeenth , twentieth , and
twenty-first days of fast and the first day of refeeding. It seems safeto conclude, therefore, that these fluctuations are only relative, duereally to the fluctuations in polymorphs
,and that their number was
practically constant throughout the fast .Theother forms of leucocytes presentno distinctive features except thetransitional , which was sub ject to several rises, namely, on the seventh ,sixteenth, nineteenth , and twenty-first days, when they were above 5
per cent . Only an occasional eosinophile was found during the last10 days of the fast and they had not returned to their usual numberwhen examinations were discontinued . By examination of chart No .
II (figure there appears to be a very slight increase in the combinedmononuclear cells throughout the fasting period, the average beingraised by the fluctuations in the transitional form, for the other types ,13. e. ,
monocyte,large and small lymphocyte are practically constant
throughout, except the variations already noted in the latter.
Coagulation time— Toward the end of the second week of inanition
itwasnoticed that the blood coagulated more rapidly than it had duringthe earlier days . This becamemore noticeable each day, so that if themixing pipettes were not filled very rapidly the drop would coagulateor the b lood would clot in the tubes . It is certain that this was not dueto any physical alteration of the patient
’s environment . The temperature of the balcony where the subject stayed andwhere the estimationswere made was practically constant . This is a very important factor,for most experimental evidence goes to Show that vari ations in temperature have decided influences on the coagulation time . Addis
,Fox ,
andWright, quoted by Cohen,1and the latter himself , all showed that
rise in temperature accelerates and cold retards the process . Hartmann2
also notes that the higher the temperature the shorter the coagulationtime, andRudolf,
3 determining the effect more specifically, states thatin general each degree of rise and fall between 15° and 20
° C . decreasedand increased , respectively, the time one minute.
On the seventeenth day the estimations of the coagulation time werebegun. Until the twenty-fifth day the McGowan4 method was used .
lCohen ,Coagulation time of the blood as affected by various conditions. Ar ch . Int. Med
19 1 1 , 8, pp . 684 and 820 .
“Hartmann , Zur Frage der B lutgerinnungszeit. Munch . med. Wochenschr 1909 , 56 , p . 796 .
aRudolf , Tr. Asso c. Am . Phys. , Ph iladelphia, 19 10 , 25 , p . 504 .
‘McG owan , A clinical m ethod for estimating th e coagulation time of the blood . Brit. Med .
Journ . , 1907 , 2 , p . 1580 .

156 A STUDY OF PROLONGED FASTING .
most 2° C . cooler than that of the subject ’s environment,but a deduc
tion of 2 minutes , as correction for this , still leaves the time distinctlylonger than that obtained on the same day in Levanzin’
s blood . Acomparison of the two series of results will demonstrate a distinctincrease in the coagulability of the starving man’s blood
,more notice
able toward the end of his fast .Specific gravity — The specific gravity was determined only twice,while the subject was eating his first meal after fasting and on the
third day of refeeding . The first time it was the second it wasThe estimations were made by the Hammerschlag
l method ,the specific gravity of the mixture of chloroform and benzol beingdetermined by the pyknometer. AS no figures were obtained , eitherbefore or during the fast , these two examinations are of little value
,
except that from them it may be assumed there is a very slight increase in density, taking to as the average normal specificgravity.
DISCUSSION AND CONCLUSIONS.
The results of the above studies are conspicuous rather from the
absence than the presence of striking alterations in the blood picture .
Really the only prominent features are the early rise in polymorphonuclear neutrophiles and the decrease in coagulation time. The leucocytes , i . e.
,the neutrophiles , at least , are the most sensitive of the blood
cells to changes in body conditions, andwe know that apparently Slightdisturbances will call forth a recognizable increase in these cells —a coldbath
,for example . They seem always to be on the alert , ready at the
least evidence of disturbance to rush forth in defense of the organism .
It is scarcely to be wondered at , therefore, that in response to such anunusual condition as starvation there should be an outpouring of thereserve supply, at least for a day or so , or until the organism has had anOpportunity to adapt itself to the altered conditions . The variationsin water-content Of the blood can not be considered a factor in this rise ,involving as this does only the one form of cell . The only explanationthat suggests itself, therefore, and frankly not a particularly scientificone , is this alertness of thepolymorpho-neutrophileandits ever-readinessto be on the defense for the organism . The products of the somewhatperverted metabolism may excite them into thi s early activity and
later fail to do so , but there is no evidence to prove this supposition.
It is not easy to understandwhy they Should respond to toxicproductsinthe early days and not during the later as well , unless we assume theyacquire a tolerance for them,
which seems improbablewhenwe comparethe reaction to infections , in which their fight rs evident throughout thedisease ifthe organism is to conquer. It 1s further possib le that an insignificant, obscure source of bacterial infection happened to develop atthis particular time ; if so , there was no other evidence .
1Hammersch lag, Wien. klin . Woch enschr 1890 , 3 , p . 1018 .

THE BLOOD . 157
As to the effect of the starving on the total quantity of blood , it doesseem evident that there are fluctuations, at least in the first two weeks .By comparing the curves of the white and red- cell counts itwillbenotedthat the variations are synchronous ; that on the third , fifth, ninth , andeleventh days particularly the noticeable increases in the one are accom
panied by equally frank rises in the other . It would seem that thiscould only be due to variations in water-content . The specific gravitywould have gone far toward proving this point , but unfortunately thiswas not determined during this period . Taking these fluctuations asindication of variations in water-content , it appears that during the middle period of the fast , at least , the equilibrium of intake (including thatdrawn from tissues) and output was pretty well established . The lastcounts made, namely, on the third day after the fast was broken , are
considerably lower than those of the last day of fast . This no doubt isa relative decrease , due to increase in water- content . While the dietwas of course limited , there was an increase in the intake of fluids .The haemoglobin appears to be particularly resistant , the percentage
on the last day being within 2 per cent of the highest estimation,
found on the day before fast began, though there was a moderatedecrease during the second 10 days .It 1s difficult to account for the only other marked change ln the
blood— the acceleration of coagulation . Loss of water could be responsib le
,but there is no evidence that this occurred . The very slight
increase in density at the last, determined by the specific gravity , wouldcertainly not demonstrate a sufficient concentration. There were noestimations of the platelet content made, but it is possible that theexplanation lies with these . An increase in them could be responsible .
The final conclusions as to the effects Of uncomplicated starvation on
the blood to be drawn from the results of examinations on Levanzin are :1 . There is a slight actual loss in haemoglobin
,more marked during
the second 10 days .2 . There are moderate fluctuations in water-content
,particularly
during the first half of the period , and an increase after breaking fast ,evident till after the third day, at least .3 . There is a decided rise in polymorphO
-neutrophiles in the earlydays .4 . There is an increase in coagulability, especially after the first twoweeks.5 . In an otherwise normal individual
,whose mental and physical
activities are restricted , the blood as a whole is able to withstand theeffects of complete ~abstinence from food for a period of at least 31 days,without displaying any essentially pathological change.
MECHANICS OF RESPIRATION.
A physiological study of the human body during a prolonged fastwould be incomplete without a careful investigation of the influence ofinanition upon the mechanics of respiration. Fortunately
,it was pos
sible to obtain such data in all of the experiments with the respirationapparatus
,as the spirometer gave a graphic record of the respiration
,
1
from which accurate data regarding the respiration-rate, the ventilationOf the lungs per minute, and the volume of air per inspiration could beobtained . Such data are available for the morning respiration experiment for every day of the fast, for the experiments made in the eveningbefore the subject entered the bed calorimeter, for experiments madeon several occasions when the subject was sitting quietly or sittingwriting
,and also for experiments in which he breathed an oxygen-rich
atmosphere .
TYPICAL GRAPHIC RECORDS OF RESPIRATION.
The graphic records obtained by the spirometer method have aspecial interest in connection with the fasting experiment in that theyindicate the character and rate of the respiration as the fast progressed .
Out of 200 or more records obtained with this subject, four typicalcurves have been selected for reproduction in figure 22, i . e. , one eachfor April 17 and April 30, and two for May 14 , 1912. From thesecurves it will be seen that at each inspiration the pointer on the Spirometer rises and at each expiration falls . The experiments were soconducted that the communication between the subject and the spirometer was made at exactly the endof a normal expiration ; consequentlythe first deviation from the straight line is that due to an inspiration .
Similarly, at the end of the experiment the communication with thespirometer was cut off at the exact end of the normal expiration.
From this record the respiration-rate can easily be counted .
Immediately below the record of the respiration is the line showingthe time inminutes ; the lowest line indicates the number of revolutionsof the recording device— the SO- called work-adder wheel— from whichthe total volume of ventilation is calculated . Since a record of themuscular activity is essential for all intelligent comparison of the resultsof respiration experiments, a method was followed similar to that usedfor the bed calorimeter, the bed upon which the subject lay beingprovided with a pneumograph , tambour , and pointer, by which a recordof the degree of muscular repose was obtained . This record is Shownin the line directly above the respiration curve . Frequent testing hasshown that this form of bed2 is extremely sensitive .
1See description and schematic outline of Spirometer on p. 3 17 and figure 40.
2See arrangement of bed inside respiration calorimeter, figure 37 , page 3 12.
158

160 A STUDY OF PROLONGED FASTING .
the period so far as external muscular activity is concerned,although
it is obvious that no idea of the muscular tonus can be obtained bythis method .
The second curve , that for April 30, 1912, was obtained about themiddle of the fasting period and is typical of many Obtained about thistime . In this respiratory record but two abnormally deep breathsare noted .
The third curve was Obtained on May 14 , 1912, at the end of thethirtieth day of the fast . In this record a greater frequency of respiration may be noted ,with less amplitude, this being clearly Shown evenwithout measurement . The great sensitivity of the device for recording the degree of muscular repose is Shown in the original kymographcurve by a wave-like line above the respiration record indicating theslight disturbance in the center Of gravity of the body due to the res
piratorymovements . While this maybevery plainly seen in the originalcurve , it is lost in the reproduction.
Immediately after the third curve was Obtained , the apparatus wasfilled with pure oxygen ,
so that the subject breathed an atmospherecontaining 95 per cent oxygen . One deep respiration is shown in thecurve obtained (curve IV) . The rate is apparently a little slower thanin the preceding curve and the volume somewhat larger. The lineabove the respiration record again shows that the subject was absolutely quiet throughout the whole period , as was usual with this man .
METHOD OF CALCULATING THE TOTAL VENTILATION OFTHE LUNGS.
The construction of the Spirometer bell is such that each millimeterlength corresponds to a volume in the bell of 23 c .c . ; hence by measuringthe vertical distance between the bottom and top levels of the recordmade on the kymograph drum by the pointer at the beginning and endof every inspiration or expiration ,
the apparent volume of air inhaledor exhaled may be computed . By measuring all the rising portionsof the respiration curve and subsequently multiplying the result by theknown factor, the total ventilation of the lungs during the experimentalperiod can be obtained . To Simp lify this calculation
,a recording
device has been added to the spirometer which is somewhat in thenature of a work-adder wheel1 and permits the accumulative measurement of the movements of the spirometer bel l in one direction. Eachrevolution of this wheel corresponds to a rise in the Spirometer bell of acertain number of mi llimeters , and from the record of the number ofrevolutions of this wheel the apparent volume of air passing throughthe lungs can be calculated .
In these experiments, the apparent volume Obtained by this calculation was converted to standard conditions of temperature and pressure
by multiplying it by the fraction in which p represents the baro
lBenedict, Deutsch . Arch iv f. klin. Med. , 1912, 102, p. 176 .

MECHANICS OF RESPIRATION . 161
metric reading corrected for scale correction and diminished by 5 mm.
This correction of 5 mm . was found desirable as a result of experimentsin which the humidity of the air inside the Spirometer bell was found tobe usually about 30 per cent . As a matter of fact, calculations showedthat the difference due to using an assumed value for complete saturation or partial saturation is not more than 1 or 2 per cent . In addition to the correction for the pressure , the usual correction for temperature was made . The total volume as reported is therefore the totalventilation per minute , corrected for 0
° C . and 760 mm . and likewisefor an average value of 5 mm .
, corresponding to the probable humidityof the air inside the spirometer bell .
METHOD OF CALCULATING THE VOLUME PER INSPIRATION.
The method of calculating the volume per inspiration is not so simpleas it at first appears . Instead of simply dividing the total ventilation
per minute by the number of respirations , most writers have beenaccustomed to calculating the volume per inspiration from the volumeof the air converted to the conditions which exist in the lungs
,that is
,
the prevailing atmospheric pressure less the tension of water-vapor at37
° C . and corrected for the temperature of the lungs at 37° C . Therehas been considerable discussion, particularly in connection with theexperiments of Galeotti
,
1and Loewy and Gerhartz ,
2 as to whether thetemperature conditions should be taken as 37° C .
, and whether the airis saturated at this temperature or not. This value is
,however
,most
commonly used,and, indeed , we are not far in error in doing this
,
although,as was shown in an earlier publication,
3the correct determi
nation of the temperature of the air in the lungs and the degree ofsaturation will obviously affect these computations somewhat .The method used for calculating our results is as follows : The total
ventilation of the lungs, which has been reduced to standard conditionsof 0° C . and 760 mm . pressure, is divided by the number of respirations .This value is then converted to the pressure existing in the lungs
,which
is the atmospheric pressure less the tension of aqueous vapor at 37 C . ,
or mm. It is subsequently converted to the temperature of thelungs by the usual calculation. A sample calculation will serve toshow the method used : In the morning respiration experiment on April1 1
,the ventilation of the lungs was liters per minute at 0
° C . and
760 mm . The observed barometer was mm . and the number Ofrespirations per minute was The volume per inspiration wouldtherefore be
lGaleotti, B iochem . Zeitschr. , 1912, 46 , pi 173 .
2Loewy and Gerhartz , Bio chem . Zeitschr. , 19 12, 47 , p . 34 3 .
”Benedi ct, Carnegie Inst. Wash . Pub. 77 , 1907 , p . 436 .

162 A STUDY OF PROLONGED FASTING .
RESULTS OF OBSERVATIONS ON THE MECHANICS OF RESPIRATION.
The data secured by these methods regarding the respiration-rate,
the ventilation of the lungs per minute, and the volume per inspirationgive material for an interesting study of the effect of prolonged fastingupon the mechanics of respiration . These data are given in table 18,which shows two extensive series of values , one for the morning respiration experiments made directly after the subject came out of the
TABLE 18 .
— Ventilation of lungs in experiments with L . at difierent times of the day, and withvarying activity. (Respiration apparatus.)
1The lung ventilation observed is here reduced to 0° C. and 760 mm . pressure.
2Calculated to th e pressure existing in the lungs and to 37 C .
3During the period 3h 16m p.m . to 3h 5 1m p.m . , with subject in lying position. the observations were : respiration-rate , lung ventilation, liters; volume per inspiration. 466 c .c .

164 A STUDY OF PROLONGED FASTING .
rigidly adhered to each day,the subject lying very quietly for some time
while the respiration-rates were being recorded .
The experiments of the Berlin investigators with Getti and Breithaupt were not sufficiently long to make them comparable with this31-day experiment and they were likewise complicated considerab lyby the fact that the subjects suffered from cold and colic .From an examination of all of the kymograph records obtainedwith L . , i t is clear that while prolonged fasting tended to increasethe average respiration-rate
,there was great regularity of respiration
'
throughout each LES-minute period . Occasionally a deep breath wastaken
,but there was nothing like the great irregularity noted by Zuntz
and his cO-workers on the two Berlin tasters, an irregularity which mayagain be explained by the complications of cold and colic .
VENTILATION OF THE LUNGS PER MINUTE.
The actual amount of air passing through the lungs was measured onthe spiromete r and its recording attachment . The ventilation of thelungs per minute , which is given for each experiment in table 18,followed a somewhat singular course . In the morning observationsthe ventilation per minute showed a persistent , though slight , tendencyto decrease during the first 4 days with food ; it then rose perceptiblyin the first 3 days of the fast and subsequently decreased until the lowvalue of liters was reached on the eleventh day. This was closelyapproximated on the twenty-first day, when a value of liters wasobtained . The lowest value in the experimental period was found onthe second day with food after the fast , when the ventilation wasliters . Few deductions can be drawn from these figures for the lungventilation per minute , save that on certain fasting days the valueswere very low as compared with the four days preceding the fast ,although
,as has already been pointed out
,the minimum value was
obtained on the second day with food after the fast . Here again thevalues for the evening observations Show an increase
,the ventilation
being invariably greater than during the morning experiments, risingat times as high as 6 liters . The average value was 1 liter higher thanthose obtained during the morning Observations .
VOLUME PER INSPIRATION.
In discussing the values for the volume per inspiration given in table18
,it must again be stated that these were not obtained by dividing
the total ventilation of the lungs by the number of respirations , butby using the volumes changed to the conditions in the lungs, as is commonly done by other writers of the present day. These figures Showthat there is a distinct tendency for the vo lume per inspiration to decrease as the fast progressed, although certain high values are found onthe eighth , eleventh , and twenty-first days of fasting . On the other

MECHANICS OF RESPIRATION . 165
band, the lowest value recorded in the morning experiments— 391 c .c .
was on the thirtieth day of fasting . In the evening series we note thatwhile the values in general are somewhat higher than in the morning,this increase seems to become greater toward the end of the fast . Thus ,on the thirtieth dayOf the fast itwas 391 c .c . in themorning and 514 c .c .in the evening . While, therefore, there is a positive average difference ,inasmuch as in the evening the volume per inspiration is greater thanin the morning, the difference has a tendency to become very muchgreater in the last week of the fast .
INFLUENCE OF CHANGES IN BODY POSITION.
On a number of days the subject was studied when sitting in hischair
, either resting or wri ting . The values obtained are given in table18 for comparison with those found while the subject was lying on acouch . During the sitting experiments
,when the subject was not
writing, the respiration-rate was in practically all cases slightly higher
than the values obtained in the morning respiration experiments whilethe subject was lying quietly. On the ninth day of the fast it increasedfrom to respirations per minute . The ventilation of thelungs per minute also increased perceptibly in every instance, the increase being not far from liter . On the other hand , the volume perinsp iration varied considerably. In two instances there was a perceptible increase, on two other days it decreased ,while on another day itremained essentially constant . This difference is not so apparent whenthe results are compared with the records for the evening respirationexperiments . Unfortunately the sitting experiments were not sufficiently extended to draw any definite conclusions regarding the effectof the change in body position ; furthermore , the whole study lackssuitable normal values for comparison.
INFLUENCE OF THE WORK OF WRITING.
On 6 of the fasting days the metabolism of the subject was studiedwhile he sat in a chair and wrote actively. On 2 of these days he wasstudied in the forenoon and on 4 days in the afternoon . Since thereis a tendency towards a diurnal variation in themechanics of respirationbetween morning and evening, as Shown by the increase in the respiration-rate and the ventilation of the lungs per minute , and the tendencyfor the volume per inspiration to increase , it is necessary to take thisfact into consideration in discussing the results . In the two forenoonexperiments there was in bo th instances an increase in the respirationrate , a marked increase in the ventilation of the lungs per minute, anda great increase in the volume per inspiration. Inasmuch as the writingwas accompanied by distinct
,though perhaps slight , muscular effort ,
these findings are only what would be expected . In the afternoonexperiments there was an increase in the respiration-rate much more

166 A STUDY OF PROLONGED FASTING .
noticeable than in the experiments in the forenoon . The ventilationof the lungs per minute showed a large increase, the values averagingabout liters per minute . There was also usually a measurab leincrease in the volume per inspiration .
From these results it can be inferred that the slight muscular work ofwriting letters perceptibly affected the mechanics of ventilation in thatthe respiration-rate was somewhat increased and the ventilation of thelungs per minute noticeab ly so . SO far as we know,
no study has beenmade with normal individuals in which the ventilation of the lungs perminute and the volume per inspiration were so careful ly observed aswere those of our fasting subject
,and hence we have no comparable
valueswhichwill Show towhat extent the factors affecting the mechanicsof respiration were influenced by prolonged fasting . It is reasonableto suppose , however, that muscular exercise of any kind would requirea greater effort in the later stages of inanition. It is of particularinterest that the lung ventilation per minute in the afternoon experi
ments was perceptibly greater than when essentially the same amountof work was carried out in the forenoon.
INFLUENCE OF BREATHING AN OXYGEN-RICH ATMOSPHERE .
On three days during the fast an experiment was made directly afterthe morning respiration experiment
,in which the subject breathed an
atmosphere containing from 95 to 75 per cent of oxygen. The influenceOf this increased amount of oxygen was distinctly noticeable with theventilation of the lungs per minute and the volume per inspiration,
although the respiration-rate changed but little . On the first day on
which these experiments were made (May 12, 1912) the volume perinspiration with normal air was 4 10 c .c . and with the oxygen-richmixture it was 487 c .c .
, an increase of 16 per cent . The values obtainedin these experiments were as follows : Twenty-eighth day of fast , respiration-rate , lung ventilation, volume per inspiration,
487 ;twenty-ninth day, respiration-rate, lung ventilation, and
volume per inspiration ,471 ; on the thirtieth day , respiration-rate ,
lung ventilation, volume per inspiration,454 . It is clear
,there
fore, that with this subject the breathing of oxygen-rich mixturesresulted in a considerable increase in the ventilation of the lungs perminute
,and while the respiration-ratefwas not materially affected ,
there was a considerable increase in the volume per inspiration.
MAXIMUM EXPIRATION OF THE LUNGS .
As an index of a possible change in the volume of the lungs and particularly in the strength of the chest muscles, observations in regard tothe maximum expiration of the lungs were made by Mr . Carpenter on5 days during the fasting period . For these observations a long rubbertube was attached to a 10- liter Bohr meter. The subject stood up and,

BY HAROLD L . HIGGINS .
Observations were made of the carbon-dioxide percentage of thealveolar air nearly every day throughout this fasting experiment . Thisoffered an index as to the acidity of the blood and also an opportunityto study the control andmechanics of respiration throughout the fast .Alveolar air is the air which is in or comes from the alveoli of the
lungs . As the active exchange of carbon dioxide and oxygen betweenthe blood and the lungs takes place in the alveoli , it is readily seen thatthe tension or partial pressures of the different gases in the alveoli
(carbon dioxide , oxygen, and also nitrogen, argon, etc.) will be verynearly the same in the alveoli as in the blood leaving the lungs . Inasmuch as the quantity of a gas dissolved in a liquid is proportional tothe partial pressure , and not to the percentage of the gas, the composition of alveolar air is therefore probably better expressed in tensionsor partial pressures than in percentages .
SIGNIFICANCE OFALVEOLAR AIR.
Haldane and Priestley‘ have shown that carbon dioxide is the prevailing stimulus to respiration under normal conditions . Thus, if thecarbon-dioxide tension in the respiratory center falls below a certainlevel , apncna is the result ; and if, on the other hand , it rises above thislevel , the respiration volume is greatly increased and hyperpnoea setsin . In other words
,the respiratory center by respiratory impulses
automatically keeps its carbon-dioxide tension constant . But thecarbon-dioxide tension of the respiratory center is largely controlled bythat of the arterial blood and the latter is , as mentioned previously,essentially that Of the alveolar air. Haldane has therefore introducedthe use of alveolar carbon-dioxide tension and shown that in any one
individual it is practically constant under normal conditions , althoughthe normal values of individuals may differ markedly from eachother . It has been discovered that when there is an increasedacidity of the b lood , as in diabetic acidosis, or with reduced barometricpressure , as in high altitudes , the alveolar carbon-dioxide tension islower than normal
,and a smaller tension of carbon dioxide stimulates
respiration . This has led to the presentation of the theory ,2now
quite satisfactorily estab lished,that the H-ion concentration of the
b lood rather than the carbon-dioxide tension is the predominatingfactor in the contro l of respiration . Thus
,when the H-ion“ concentra
tion (or degree of acidity) of the blood com ing to the respiratory centerreaches a certain level , impulses are sent out from the center to increase
lHaldane and Priestley, Journ. Physio l 1905 , 32, p . 225 .
2Winterstein, Archiv f . die ges. Phy sio l 191 1 , 138 , p. 167 .

ALVEOLAR AIR . 169
the respiration so that the net result is always the same H-ion concen
tration in the center.The acidity of the blood may be divided into two parts , that due tocarbon dioxide and that due to other acids . As the total aciditynecessary to cause respiration must always be the same, it is readilyseen that if the other acids in the blood increase in amount , less carbondioxide is necessary to raise the acidity to the point of stimulation of therespiratory center. Thus , one may say that the quantity of carbondioxide will vary conversely from that of the other ac ids of the arterialblood . S ince alveolar carbon-dioxide tension represents so closely thecarbon—dioxide tension Of the arterial blood , it affords a very goodindex of the acidity of the blood . It was mainly for this reason thatthe alveolar carbon dioxide in the experiment with L . was so closelyfollowed. In fact , it seems that this index of the degree of acidosis ismuch more satisfactory and important than the urinary tests for acidity
(as B-oxybutyric acid , Eli;N
. total titratable acidity, because
the former represents the acid actually in the blood , while the latteronly represents that excreted from the body. The other factors whichaffect the alveolar carbon-dioxide tension, such as the absorption offood and varying postures
,were avoided with L . , and thus one is able to
study the results almost purely from the point of view of blood acidity.
METHODS OFDETERMINING THE ALVEOLAR AIR.
HALDANE METHOD .
Haldane’s method1 for determining the alveolar carbon-dioxide ten
sion is the oldest and probably theoretically the most sound of any ofthe methods now in use . By it one collects two samples of alveolar airfrom different phases of the respiratory cycle and averages their carbondioxide content . The two phases chosen are immediately at the endof an inspiration, which is approximately when the alveolar carbondioxide tension is lowest, and at the end of an expiration,
when thealveolar carbon-dioxide tension is nearly at its highest point . The
subject breathes normally for some time ; then at the end of a normalinspiration he makes a rapid , deep expiration through a tube about2 cm . in diameter and about 150 cm . long
,sealing with his tongue the
end he has just breathed into . A sample of the air in the tube nearthe mouth is then taken . This sample is considered to be alveolar air ,as the air in the dead space of the respiratory passages and in that partof the tube from which the sample is taken has previously been pushedout by the air from the alveoli. Similarly a sample is taken of airforced through the tube from the lungs at the end of a normal expiration . Instead of sealing Off the end of the tube with the tongue , use
IHaldane and Priestley, Journ. Physio l ., 1905 , 32 , p . 225 .

170 A STUDY OF PROLONGED FASTING .
has been made in our laboratory of a simple Siebeck1 valve , which putsthe subject undermuch less strain , as he does not have to hold his tongueto the tube whi le the sample is being taken into a gas- sampler. The
average of the two analyses gives very closely the composition of thealveolar air.The Haldane method requires considerable attention on the part of
the subject and, as it was feared that possibly in the course Of the longfast the subject would not be physically able to co-operate very satisfactorily , the method used in these tests was modified somewhat . In
view of what we now know Of the condition of the subject throughoutthe fast , we may feel assured that this method would have been verysuccessful ; but as several samp les are often required to be sure Of goodagreement , and as it was probable that the subject
’s time would bemuch occupied , it was decided to modify the method somewhat to besure of better agreement on fewer samples .It has been observed that , in the Haldane method , holding the breath
for several seconds before the expiration does not cause the percentag ;of carbon dioxide in the alveolar air to increase with very great rapidityethis is naturally to be expected , for as the carbon-dioxide tensions ofthe alveo lar air and the blood coming to the lungs approach the samefigure , the increase in the former is slower. Furthermore
,it appears
that if a subject has previously been breathing somewhat abnormallyfor not over three or four respirations , the percentage of carbon dioxidein the alveolar air, after holding the breath for a few seconds , will benearer that of the alveolar air when the breath is held similarly afternormal respiration than is the percentage of carbon dioxide in the
alveolar air of the same two cases when the breath is not held . Thus,
it would seem that small deviations from the normal , such as appear inconscious respiration
,would not be disturbing to agreeing results and
that in a very small number of determinations (seldom more than two)figures can be obtained which are very good duplicates and which willbear a constant relation to the true alveolar carbon-dioxide tensionwhen the subject is in the same position (Sitting quietly) .Themodified method used in these tests ,which later is called the Hal
dane method, is as follows : The subject began by breathing normallyinto the room through a short (5 cm.) tube connected with the Siebeckvalve . Then at the end of an inspiration,
selected by the observer whowas watching the respiration , the subject was told to hold his breath .
At the end of 5 seconds , timed by the observer, during which the valvehad been opened , the subject breathed out rapidly and deeply throughthe long tube as in the Haldanemethod . After the expiration the valvewas again closed . Usually two samp les were taken each day in whichthe subject held his breath5 seconds and two inwhich he held his breath8 seconds . The results. obtained when the subject held his breath 8
1Dr. R . Siebeck , of Heidelberg , has devised an ingenious slide-valve for th is purpose , wh ichmay be secured of Universitats Mechaniker Runge in Heidelberg.

172 A STUDY OF PROLONGED FASTING .
This method is probably the most adaptable for use with the averagepatient, when the condition of acidosis is being compared from day today , or when a gross picture of the degree of acidosis is desired . The
method does not give the carbon-dioxide tension of the arterial blood,
but seems rather to approach the carbon-dioxide tension of the venousblood
,because , as the same air is rebreathed, it is obvious that the
alveolar air , the arterial blood , and venous blood will all have eventually the same carbon-dioxide tension, namely, that of the venous blood ,because it is the highest . For this reason, especially as it is the normalc arbon-dioxide tension of the arterial blood , which is the importantfactor in the regulation of the respiration, this method theoretically isnot so important as the Haldane method .
1 But with the subject inthe same position and with the same amount of previous activity, wehave found that the carbon-dioxide tension determined by this meansbears a very constant relation to that of the Haldane method ; this wasassured from numerous comparisons of the different methods on manynormal individuals , the results be ing about 20 per cent higher than thevalues obtained with the Haldane method . The same relation mayalso be observed with L . , as the results in table 20 Show that, exceptingon the first fewdays , thedifference between the 5 and8-second Haldanemethod and the modified Plesch method is about 10 per cent .
METHOD OF CALCULATING ALVEOLAR AIR FROM RESPIRATIONEXPERIMENTS .
The morning and evening respiration experiments , which were madewith the universal respiration apparatus, included the determinationsof the carbon—dioxide production, oxygen consummion, respiratory
quotient , pulse and respiration-rates, and inspiratory ventilation ofthe lungs . These experiments also give some data regarding the alveo lar carbon-dioxide tension and the dead space of breathing, which areo f interest in considering the other alveolar-air determinations . The
dead space in respiration is the air that is insp and again expiredwithout entering the alveoli , in which active gaseous exchange takesplace, and thus is unchanged . The following formula for calculatingthe percentage of carbon dioxide in the alveolar air is therefore readilyunderstood :
C0 2 V =Total volume of air exAlv. per cent 0 0 2
V — (DSXR) pired in c .c .
C0 2 C0 2 production in DS=Dead space in c .c .R Number of respirations .
Naturally these factors must be measured for the same unit of timeand under the same conditions of pressure , temperature , and aqueoustension . The unit of time chosen in the experiments with L . has been
1The same criticism applies to th e 8-second and 5-second Haldane method as used in theseexperiments, although probably to a less degree .

ALVEOLAR AIR . 173
1 minute,while the gas volumes considered in the application of the
above formula have , for the sake of Simplicity in calculation, been takenat 20° C .
, 760 mm. , and dry .
Elaborating this general formula for use in connection with and calculation from the respiration experiment , we get the following : .
Alv.p.ct.COg
C0 2 0 0 2 production in c .c . perminute at 0° C . and 760 mm . ;
andC0 2X 0 0 2 production at 20°
C . , 760m .
consumption in c .c . per minute, 0°
C ., 760 mm .
V = inspiratory ventilation of lungs per minute at barometer, temperature , andhumidityprevailing in spirom
eter of respiration apparatus (i. e., about 20
°C . and
33 per cent or 66 per cent humidity) .
(95 10
expiratory ven2
tilation of lungs perminute at 760 mm .,20
°C . , dry .
DS=dead space in c .c . (20°C .
,dry, 760 m .)
R=respiration~ rate per minute .
P barometric pressure.
1 .075= factor to convert gas volumes from 0° C . to 20° C .
In a respiration experiment the inspiratory ventilation is obtained at
the pressure, temperature, and humidity of the air in the spirometer onthe apparatus . The temperature is not taken in each experiment , butas it is probably very close to 20° C .
,this temperature is assumed in
Peach calculation. The term
760Obviously reduces the ventilation to
760 mm . The term — 0.015 V (7730) corrects for moisture in theSpirometer ; this moisture comes from two sources , namely, from the
lungs of the subject and from the moistener used to prevent the air inthe respiration apparatus from becoming too dry for comfortable respiration. Two kinds of moisteners were used during the fasting experiment . In the first part of the series (until April 22) a moistener constructed Of the lower part of a Kipp gas-generator was employed . In
this the air before coming to the nosepieces bubbles through water ;the humidity with this form of moistener has been found to be 66 percent saturated ; per cent of the recorded ventilation was thereforewater-vapor and accordingly subtracted . The other moistener was apiece of moist cheese-cloth in the tube leading to the nosepiece . Whenthis was used
,the humidity in the spirometer was found to be only 33
per cent , so that in these experiments per cent of the recordedvolume was subtracted and not per cent . The expiratory volume

174 A STUDY OF PROLONGED FASTING .
is smaller than the inspiratory volume,because the amount of oxygen
consumed is greater than the amount of carbon dioxide produced .
Accordingly we subtract (0 2 - 0 0 2) from the inspiratory ventilation . But during inspirations in a respiration experiment one-halfof the carbon dioxide produced is absorbed in the soda-lime bottles
,
so that the recorded inspiratory vo lume is correspondingly increased ;on the other hand a volume of oxygen equal in volume to one-half thevo lume consumed is added to the respiration apparatus during an
inspiration and thus makes the recorded inspiratory volume correspondingly too small . Thus
,instead of (Oz the factor
for changing the inspiratory volume to the expiratory volume becomes0 2 0 0 2
The only other factors in the equation are Alv. p . ct . 0 0 2 and DS .
With either one known ,the other may easily be determined . The
formula for calculating the dead space is as fo llows :O, X 1 .075
DS
When the experiments on L. were made, we had not considered the
possible use of this equation and so have not the complete data forcalculating either of these factors , but we still have suflicient materialto draw some interesting conclusions .Assuming the personal dead Space of breathing for the subject L . ,
together wi th that of the nosepieces , etc . ,to be 120 c .c . , the percentage
Of carbon dioxide in the alveolar air has been calculated for al l of themorning and evening respiration experiments , and the results for eachseries have been averaged as shown in table 20. Also
,making use of
the alveolar-air figures found on the same day, the respiratory deadspace in each experiment has similarly been calculated and averaged .
As the alveolar air was not taken at the time of the respiration experi
ments and as the dead space might possibly have changed in Sizeduring the fast , fixed differentiation of the results is difficult . Theseresults will be discussed later.
CONDITIONS OF TAKING ALVEOLAR-AIR SAMPLES
The samples were taken by the Haldane and Plesch methods withthe subject sitting in an armchair. After the fast had begun, they weretaken at about l 1l 35m p.m . to 2p.m . Between the taking of the samples ,each of which was analyzed before another was taken, the subject wassitting quietly and usually reading . On several days he had visitorswhile the experiment was in progress . On one of these days , April 22,while talking with a visitor, he became quite excited . On the otherdays there was no marked excitement while the samples were beingtaken. On April 22, it is interesting to note that the alveolar carbondioxide tension by the Haldane method was very low— in fact , much

A STUDY OF PROLONGED FASTING .
this value for each day, it was necessary to assume that the alveo larpercentage of carbon dioxide had not changed between 8 a . m . or8 p . m .
, when the respiration experiments were made, and 2 p . m . ofthe same day
,when the alveo lar percentage of carbon dioxide was
taken. It would seem,however, that if there were a change in the
lObtained by taking 97 per cent of the percentages alveo lar C0 2 from which the figures in co lumn G
were calculated .
2Calculated percentages for the fourth period on Apri l 19 , May 17 , May 18 ,
2‘The subject ended h is fast with the taking of fruit juices and honey on the morning ofMay 15 , afteth e conclusion of the respiration experim ents.
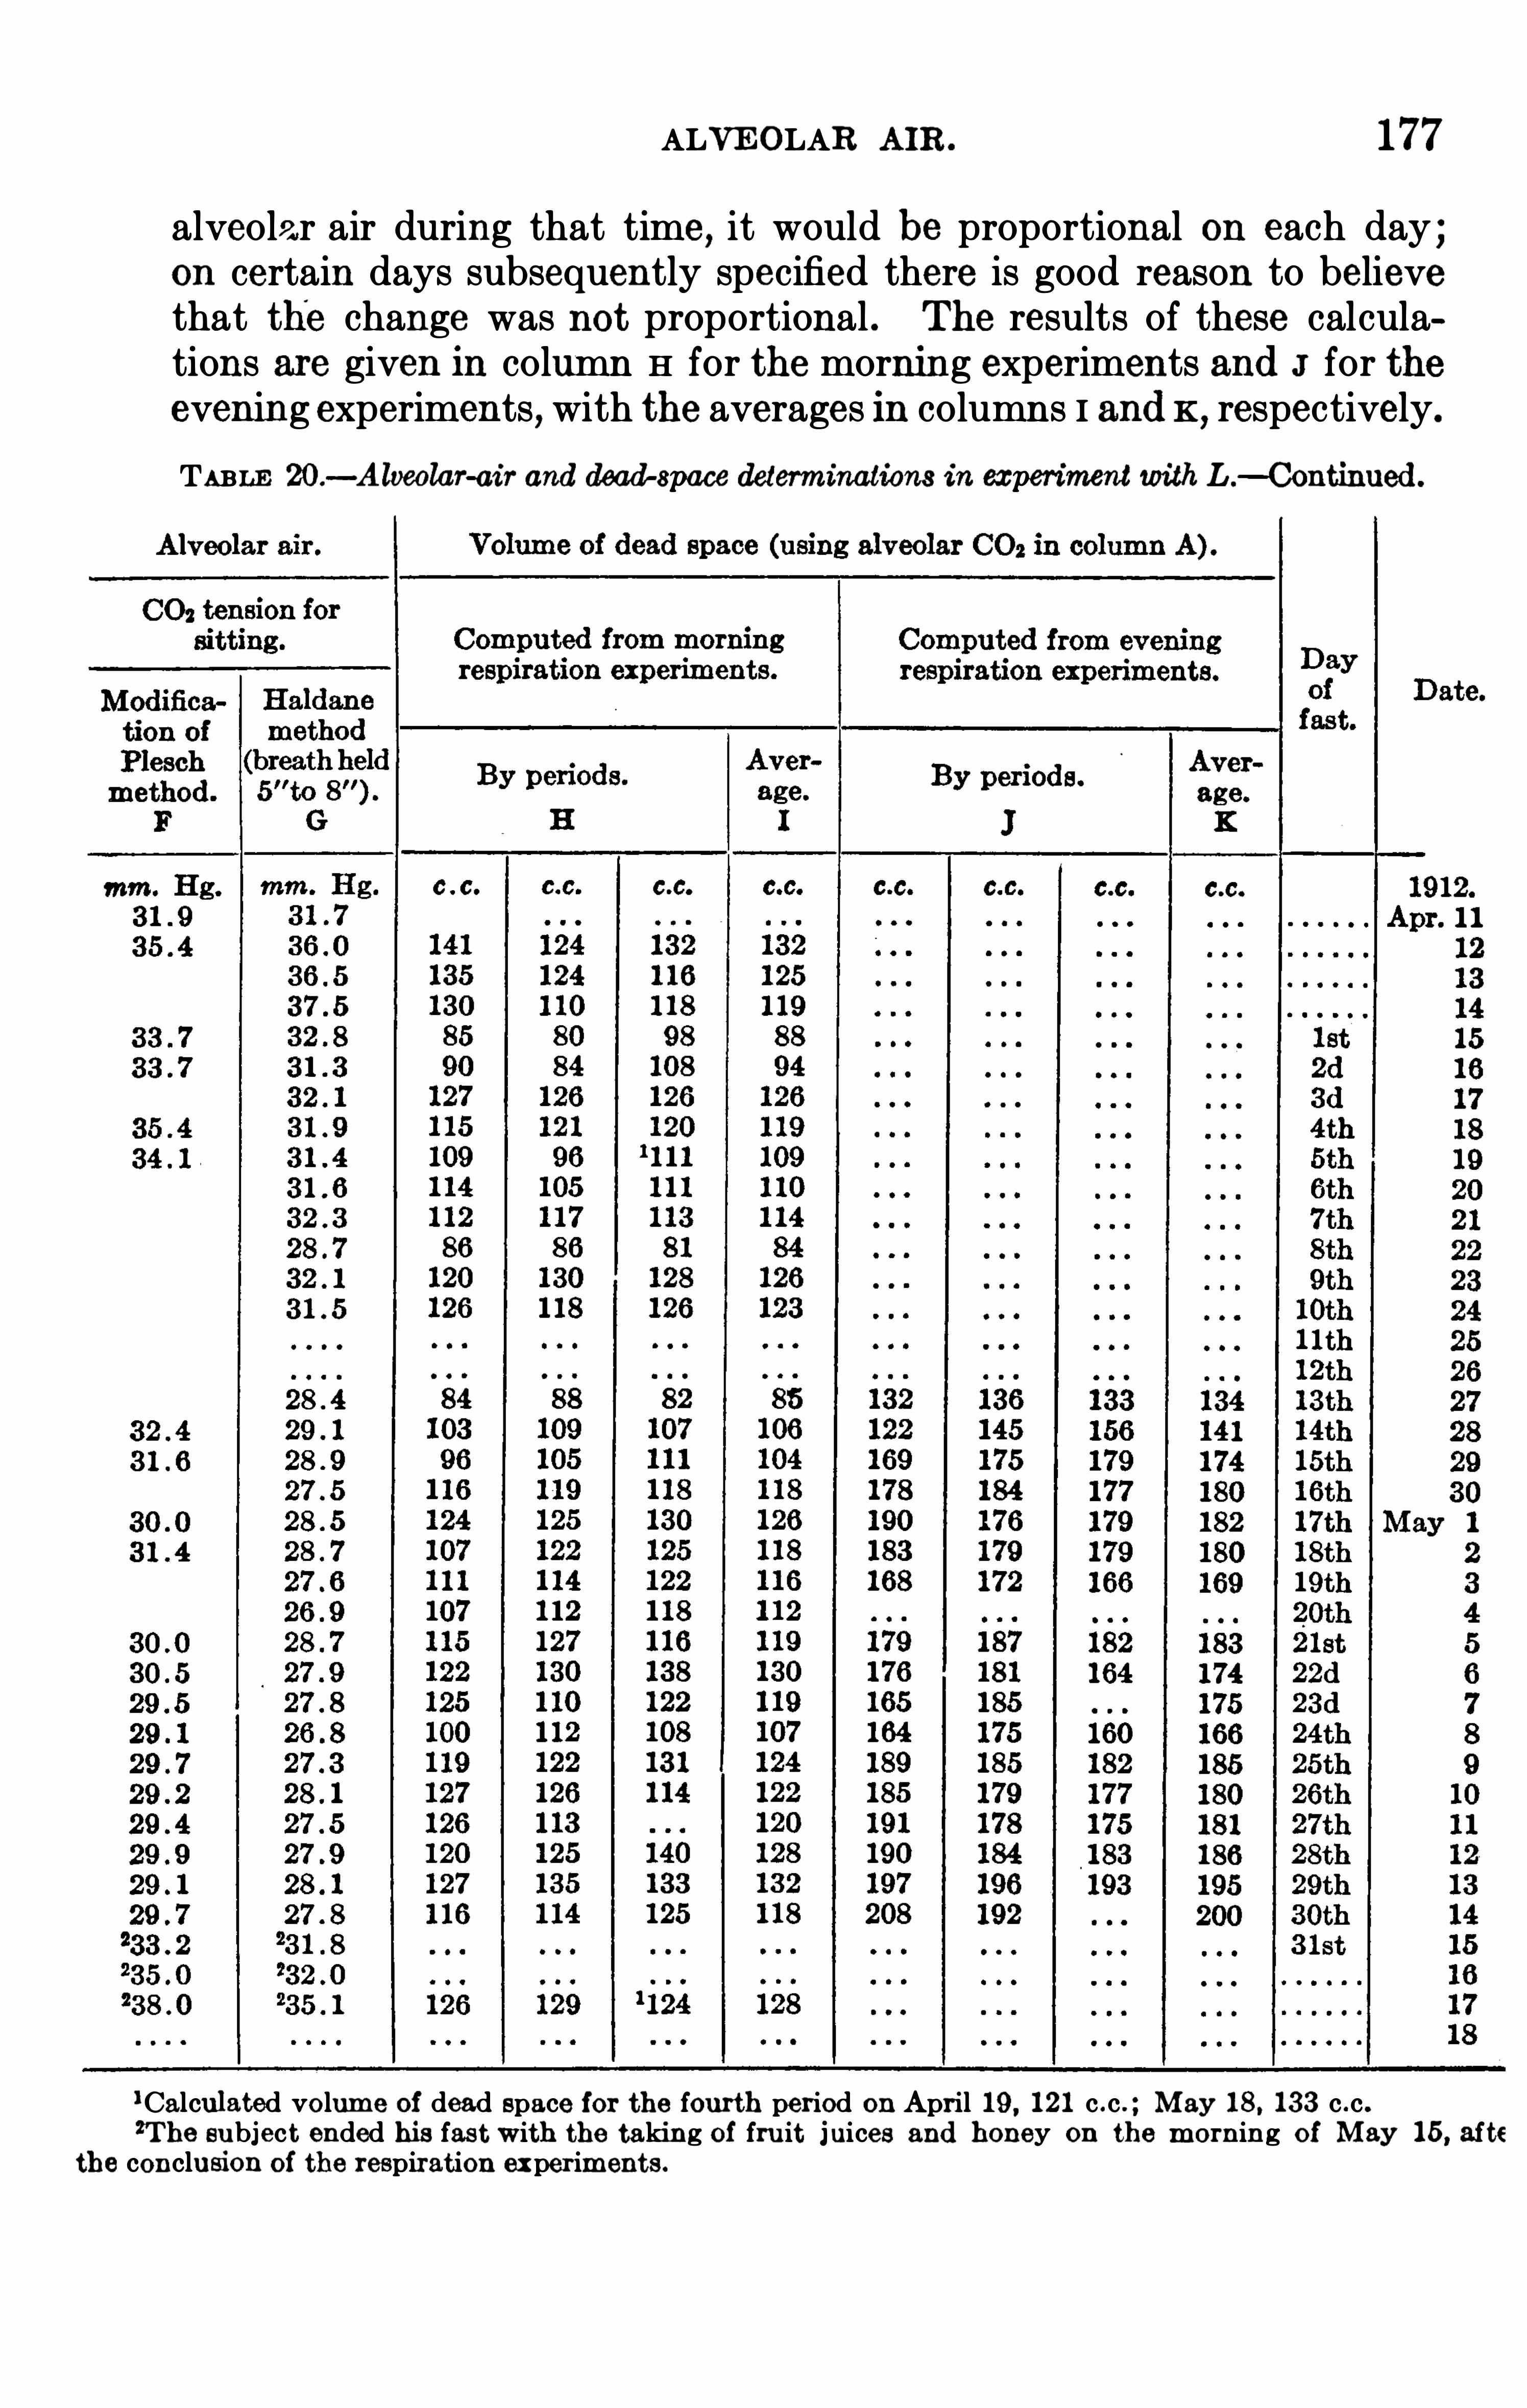
ALVEOLAR AIR . 177
alveolar air during that time, it would be proportional on each day ;on certain days subsequently specified there is good reason to believethat the change was not proportional . The results of these calculations are given in column H for the morning experiments and J for theevening experiments , with the averages in columns I andK ,
respectively.
TABLE 20 .— Alveolar-air and dead-space determinations in experimentwith L .
— Continued.
‘Calculated vo lume of dead space for the fourth period on April 19 , 121 c .c . ; May 18, 133 c .c .2The subject ended his fast with the taking of fru it juices and honey on the morning of May 15 , afte
th e conclusion of the respiration experiments.

178 A STUDY OF PROLONGED FASTING .
Considering each series by itself,the conclusion may be drawn from
both the morning and the evening experiments that there is no constantchange in the size of the dead space of breathing as a result of the fast .Although there is more or less fluctuation from day to day , yet thegeneral average of dead—space volumes found at the beginning of thefast is much the same as that toward the end Of the fast . A numberof very low values may doubtless be explained quite well as follows :On April 15 and 16 there is a markedly lower value for the dead space ;this is probably due to an especially large drop in the alveolar airduring the day
,as one might perhaps expect, these two days being the
first two of the fast. As previously mentioned, the subject was muchexcited on April 22, when the Haldane samples were taken,
and as aresult the value obtained for the alveolar air was probably low ; thusthe calculation makes the dead-space figures also too low . On April 27and 28 there is also an indication of a lower dead Space ; this is likewise probably due to a change in the alveolar air, as it will be noted thattable 20 shows a marked fall in the alveolar carbon-dioxide tensionabout this date .
DIFFERENCE IN MECHANICS OF RESPIRATION IN MORNING AND EVENING .
On comparing the values for the dead space calculated from the
evening experiments with those for the morning experiments , one findsa constantly higher dead space
,which is , on the average , 55 This
,
of course , is based on the assumption that the alveolar percentage ofcarbon dioxide is the same in the morning as it is at night . Since somephysiologists believe that the dead space is always essentially the same,it seems desirable to consider how large a difference in the alveolarpercentage of carbon dioxide must have existed between the morningand evening experiments to indicate so marked a change in the ventilation. Assuming for the size of the dead space the figure 120 c .c . ,which represents approximately the mean value previously calculatedfor the dead space in the morning experiments, the alveolar air hasbeen computed for each respiration experiment
,as shown in columns
B and D and the averages in columns C and E . The alveolar percentageof carbon dioxide (carbon-dioxide tension) in the morning experimentsshows , in general , the same changes that the alveolar carbon-dioxidetensions by the other methods have indicated . In fact
,the alveolar
carbon-dioxide tensions obtained in this manner very satisfactorilysupply the values for April 25 and 26, when the alveolar air was nottaken by the other methods . The close agreement of the values forthe alveolar percentage of carbon dioxide in the several duplicate experiments gives evidence of the even and normal respiration of the subjectand the great care in making the respiration experiments .If the alveolar carbon-dioxide tensions of the morning and evening
experiments of the same day are compared , an average difference is
180 A STUDY OF PROLONGED FASTING .
of gas takes place . As L. was breathing through the three-way valveand nosepiece connected to the apparatus
,the figures given are 30
higher than his actual personal dead space, Since the subject with
each respiration drew from the air system of the apparatus 30which did not reach either the respiratory passages or the lungs .
SIGNIFICANCE OF CHANGE IN THE ALVEOLAR AIR DURING THE FAST.
Finally, it is advisable to compare the data of the alveolar carbondioxide tensions as the fast progressed . Columns 0 , F, and G , in table20
,serve this purpose the best . As onewould naturally expect
,there is a
drop in the alveolar carbon-dioxide tension with the increased acidosisof the fast . The subject ate the last meal before fasting on the eveningof April 13 ; on the afternoon of April 15 the fall in the alveo lar carbondioxide tension is first noted . This fall is about 4 to 5 mm . (2 mm .
Plesch method) ; after this the alveolar air continues at about the samelevel until April 27 or 28,when a second quite sharp drop , also of about4 to 5 mm .
, is apparent . The new level is maintained with only slightfluctuations until the end of the fast . With the taking Of food again
,
there is a rise in the alveolar carbon-dioxide tension, as would beexpected with the resulting diminution of acidosis . On the morningof May 18 a slight fall in the alveolar carbon-dioxide tension is againnoted in connection with the respiration experiments before breakfast .Possibly a part of the rise on May 15 and subsequent days with thePlesch and Haldane methods may have been due not only to the diminution of acidosis , but to an effect similar to that since noticed in thislaboratory with the ingestion of food .
1
In connection with the second Sharp fall in the alveolar carbondioxide tension,
it is of interest to note several parallel experimentalfindings . The chlorine excretion in the urine on April 27 and 28
dropped from a previously high level to a lower figure , at which itcontinued for the remainder of the fast . A rise in the total volume Ofthe urine occurred also at about this time. The daily nitrogen exoretion in the urine for the first 10 or 12 days of the fast was slightlyover 10 grams ; there was then a fall to about 8 grams , which wasmaintained throughout the rest of the fast . It may be noted that thisdrop in the nitrogen excretion is Simultaneous with the drop in thealveolar carbon-dioxide tension .
Since alveolar air is intimately associated with the acidosis of thesubject , one naturally looks for simultaneous changes in the facto rs ofthe urine which are taken as indicators of acidosis . Thus the fi-Oxybutyric acid seems to Show a rise to a high level about the twelfth dayof the fast ; such a change is difficult to judge, however, as the fl-oxybutyric-acid variations from day to day are quite large . The otherindex
,the ratio of ammonia nitrogen , to total nitrogen, also shows a
1Higgins, Am . Journ . , Physiol . , 1914 , 34 , p . 1 17 .

ALVEOLAR AIR . 181
simultaneous rise by reason of the increase of the ammonia and thedecrease of the total nitrogen.
From these data one may safely conclude that there is a markedincrease in the acidity of the blood in the fast, beginning on the secondday ; the acidity then did not change markedly until about the fourteenth day of the fast, when another decided increase in blood acidityoccurred . The recovery to normal acidity in the blood begins to beevident in the first few days after the fast .
CONCLUSIONS.
The results for the alveolar air and dead space may be summ arizedas follows :
(1) On the second day of the fast, the carbon-dioxide tension in thealveolar air showed a drop from the normal value . It remained at thisnew level until about the fourteenth day Of the fast , when there was asecond rather sharp fall , after which no further marked change occurred .
Each of these falls is about 4 mm . Thus the blood acidity may be saidto have markedly increased on the second day of the fast and tohave remained at this higher level until the fourteenth day, when asecond increase occurred ; there was no further change until the end
of the fast .
(2) There is no sign of an accumulative change in the size of the deadspace from day to day as the fast progressed .
(3) A change in the mechanics of respiration on the respirationapparatus between morning and evening experiments during the fastShows that there was either a marked change in the alveolar air orelse a change in the size of the dead space during the course of eachday . If the former, the alveolar air fell about 6 mm . between morning and evening
,returning during the course of the night to essen
tially the morning figure . If the dead space changed, it increased insize about 55 c .c . and again became normal by the next morning.

SUBJECTIVE IMPRESSIONS ANDMENTAL ATTITUDE TOWARDTHE FAST.
BY HARRY W. GOODALL , M. D.
The freedom of speech characterizing this subject , his preconceivedideas on fasting and on the humanitarian service of his fast led to exceptionally ful l comments on the whole project and specifically his subjective impressions . His habit Of thought and introspection probablymake them of average value , though admittedly they are recorded notas scientific observations , but as general indices to his mental makeup ,his personal experiences and his beliefs , as outlined freely to the writeron each visit .
SUBJECTIVE IMPRESSIONS.
April 14, 1912 (18 hours after beginning the fast)The subject states that he is very happy in the though t that the fast has
actual ly begun. The value of the experiment to the world can not
be estimated , and after a few days the mind wil l be clear and active .
In explaining the influence of fasting upon the mind , he stated thaton his long j ourney fromMalta he had been obliged to eat food thatwas poisonous, more especial ly animal foods, and that his body wassaturatedwith this poisonouswaste ,making themind dul l and causinga kind of physical fatigue .
“ When these waste matters are climinated the mind wil l be clear, and I will feel buoyant and hopeful .
”
In referring to the nocturnal emission which occurred during thenight of April 12— 13 , he stated that one of themost important thingsnoted in connection with his fasts was the behavior of the sexualorgans. During fasting there is a reversion to the animal type , aperiodicity of sexual desire at monthly intervals. In speaking of hissubjective sensations since beginning the fast, he states that he feelsperfectly well , has had no sensations of hunger, and no thought Offood . He has been a mouth breather for years . Is troubled withnaso-pharyngitis and tinitus aurium. Both these conditions alwaysimprove with fasting.
April 16 , 1912 (third day of fast) :Feels perfectly wel l . Has had no sensation of hunger, and no abdominal
sensations, aside from slight rumbling of gas in the intestines. Haspassed very little odorless gas by rectum ; there has been no belchingof gas, no sense of fatigue. Mind is not yet clear enough for activemental work .
April 18, 1912 (fifth day of fast) :Feels perfectly wel l . No sensation of hunger. NO longing for food
,but
occasional ly thinks of the agreeable taste of ice cream. NO sense ofmuscular weakness or fatigue . Has passed a little odorless gas byrectum . Naso-pharyngitis and tinitus better.
April 20, 1912 (seventh day Of fast) :Mentally depressed yesterday and to-day . He attributes this to the rain
and cloudy weather, as he always feels depressed when the sun doesnot shine . Feels as wel l physically as usual . Expressed his satisfaction at the manner in which the fast was being conducted.
A STUDY OF PROLONGED FASTING .
May 14 , 1912— Continued .
the fast. This, however, is no more marked than it is many dayswhen he is taking regular meals. The most pronounced physicalchange is a sensation that his body is very light. This has gradual lydeveloped as hisweight has decreased, andnecessitates hismeasuringhis steps when he walks. Says that at no time has he felt likereclining on account of body fatigue . His neurasthenia is greatlyimproved , and during the entire fast has only shown itself as slightdespondency and some irritability on the rainy days. Hismind hasbeen much clearer throughout the fast than it iswhen food is taken.
To-day hismind is clear. He has better imagination. He is full ofhope and courage . Is ambitious to do mental work . Has had no
sensation of hunger, no sensations of faintness. He had no desirefor food, aside from the pleasant thought of ice cream on the thirdand fourth days of the fast, and has been glad that he did not haveto eat. Has had no abdominal pain or discomfort . His nasopharyngitis is much improved , and his tinitus has practical ly disappeared .
Mayl15 , 1912 (two hours after breaking fast)Extremely depressed anddespondent because he had been obliged to break
his fast before his body was prepared for it. Felt very weak physical ly. The foods that he selected in breaking his fast were concentrated orange and lemon juice, grape juice , and honey. Experiencehad taught him that these were the only natural , rational foods to betaken at this time . Meat broths and other animal foods were poisonous. In his Opinion these natural foods should be fo l lowed firstby cooked fruits, then vegetables, and later a return to the ordinarydiet. Stated that he had no appetite , and that nothing tasted good,although the lemon juice was not unpleasant.
10 a. m. Food was first ingested . This immediately caused a sensationOf warmth in the stomach, and he was conscious of a pulsation in theepigastrium. There was no desire to belch gas, no nausea or othersymptoms until
1 l b 45“a. m. when he began to have distress in the abdomen, starting in
the epigastrium and radiating towards the right hypochondrium.
The pain was dul l , intermittent in character, but not co licky. Hedescribes it as a sensation of distension of the stomach accompaniedby rumbling and belching of gas. Furthermore , he believed he couldfeel the progress of the distension of the alimentary tract as the
ingested food moved along the intestines, and he felt by12“ 10m p. m. that the food had proceeded as far as the right iliac fossa.
Then at
1 p. m . the rumbling and belching of gaswasmuch moremarked and thepain was somewhat more severe . Marked lassitude and depression.
Soon after pain became easier, until4“ 15m p. m .
,when the character of the pains changed from the
“ pains ofdistension to intermittent attacks of cramp- like or colicky pain,which became very severe . These were experienced about the umbilicus and in the lower abdomen. Between the attacks he was verydrowsy. The co lic gradual ly increased in severity until
5 p. m .,when he defecated for the first time . This was accomplished
without difliculty or pain . There was some gas, and the movementhad a very bad odor. After this he was free from pain until
5 h 45mp. m . ,
when the cramps began again, increasing in severity, thelocation being the same . This time the pain made him extremely

SUBJECTIVE IMPRE SS IONS'
AND MENTAL ATTITUDE .
May 15 , 191Q— Continued .
weak . There was profuse perspiration and intense thirst . Thiscontinued until
7h 15m p. m .,when he had a second movement of the bowels, liquid in
character. After this he was nauseated, and the pain continuedsevere until
9h 45“
p. m.,when he vomited and then began to feel better, and at
1 1 p. m. the pain stopped.
May (second day after breaking fast)About 2 a. m. began to have severe abdominal cramps again, continuinguntil
2“ 3om a. m . ,when he had a third movement of the bowels, liquid in
character. After this he was comfortable, but passed gasat frequentintervals . The odor of the gaswasvery disagreeable , but the passagewas not accompanied by pain. Was comfortable until
8 p. m. ,when he stated that he was in no physical distress, but that he
was very despondent. He appeared hysterical , crying a good deal .He was offended because he had been .obliged to break the fast, andcomplained that this
,together with a few disagreeable experiences
with some of the men in charge of the experiment, and the lack of
fresh air and exercise throughout the fast, was responsible for hisphysical and mental weakness. He attributed the abdominal painto the presence ofgas. Inasmuch as he hadnot defecated during thefast,
“a hard plug of intestinal secretion had accumulated in the
rectum,andwhen he took food the advancing bo lus compressed the
gas present in the intestines, causing pain.
”
May 1 7 , 1912 (third day after breaking fast) :Feels very weak , but no abdominal pain for past 24 hours. Passed a
fairly comfortable night, but did not sleep aswel l as usual . Is stil ldepressed and emotional , but to a much less degree since the painstopped . Is taking the same kinds of food , but wel l diluted withwater, as was suggested to him . Feels much better physical ly,but has no ambition for mental work . Late yesterday afternoonhe was very thirsty for about an hour, drinking 5 glasses of water.Up to the present time he has eaten the juice of two lemons dilutedwith equal parts ofwater and sweetenedwith a teaspoonful of honey,also c .c . of orange juice diluted one-third with water, to whichenough honey was added to make it sweet. Says his general condition is not nearly so good as it was on the last day of the fast. Hisappetite is just beginning to return , but he is not hungry yet.
May 18 , 1912 (fourth day after breaking fast)Extrememental depression . Marked excitability,hysterical in character.
Weepswhen spoken to , and hisvoice is scarcely audible . Complainsof general weakness, almost prostration . Sensation of trembling al lover the body. Did not sleep one moment during the entire night .Beginning at 5 a. m. he had three loose movements of the bowelspreceded by severe co licky pains. He attributes this diarrhea toworry. Can not bear the thought of food to-day . Explains hismental state as being due to his general dissatisfaction at his treatment at the laboratory. Later in the day ,
at his own request, hewas sent to a private room in the Massachusetts General Hospital .Upon admission his condition was fully described by the writer tothe resident physician and the visiting physician .

A STUDY OF PROLONGED FASTING .
May 19 , 1912 (fifth day after breaking fast)Was seen at the Massachusetts General Hospital at 9 a. m. At the time
hewas sitting on one of theverandasreading. While he stil l appearedsomewhat emotional , he said he was no longer depressed , but wasin a most cheerful state of mind . He expressed his regret for thetrouble he had caused at the laboratory, and said he was so nervousand irritable that he did not realize justwhat he was doing. He senthis apo logies to Professor Benedict, and wished me to say that hewould be glad to go back to the laboratory andgo into the calorimeteragain, if it would add anything to the value of the experiment.When asked about his comfort at the hospital , he said he was verymuch pleased with the care and attention he was getting. Hisappetite had returned , and he had relished his breakfast of
“ Bostonbaked beans
,
” which he ate for the first time.
May 20 , 1912 (sixth day after breaking fast) :The hospital reported that he had vo luntarily left the institution. Hisreason for leaving could not be learned , but in so far as could bedetermined he had no grievance.
October 19 , 1912 (five months after breaking fast)On account of the sensational storieswhich were circulated , an effort wasmade to obtain asmuch information as possible regarding the personalexperiences of the subject after leaving the hospital . He was firstquestioned as to the reason for leaving the hospital so abruptly.
First of all he stated that he was not Sincere in his remark regardingthe hospital , as noted under the date of May 19. His reasons formisrepresenting the true condition was a fear that he would not getgood treatment if hemade any complaints. Hewasquite dissatisfiedat the hospital . In the first place, his pride was injured in that hewas not given the attentionwhichwasdue an individual of his standing . One grievance was the fact that he was recorded on the chartas
“A laborer from the island of Java.
”Another was the fact that ,
although he was in a room by himself, there were a goodmany roomsin the ward and he was obliged to use the common toilet and bathroom. Stil l anotherwas the fact that the physicians at the hospitalhad no experience in fasting and did not order the proper food forhim . The day fo l lowing his admission he was givenmilk and eggs,and he believed that these animal foods would poison his blood andspoil all the benefits of the fast. The ingestion of the food wasfo llowed by cramps and diarrhea, and he thought he was delirious.
The fo llowing morning (May 20) he looked at his chart, and findinghis temperature recorded at 99 degrees and his pulse-rate 90 , heknew he was being poisoned and hastily left the institution .
When he reached the street he did not know where to go , inasmuch as hewas entirely unfamiliar with Boston. Being a newspaper editorhimself, he thought he would find trustworthy advice as to where togo by consulting an editor of one of the Boston papers. He thentook a cab to the Oflice of one of the newspapers, the editor ofwhichengaged a room for him at one of the large hotels. In his room at
the hote l he was visited by some of the staff of the paper and talkedthe situation over with them. He was surprised to find an accountof his fast
,with photographs of himself, in the paper the fo l lowing
morning,as he thought he was speaking in confidence and he was
not aware that photographswere being taken .

188 A STUDY OF PROLONGED FASTING .
dear doctor, you know nothing about fasting, while I have made it ascientific study.
” He considered himself an authority,qualifying the
assertion by saying that he is now and always has been a student,that
h e has repeatedly fasted , carefully watching the effects of fasting,and
that he has studied all the available writings upon the subject. Hestated that his object in undertaking the present experiment was toaccomplish the most complete fast yet undertaken,
under the bestscientific conditions possible to obtain,
not for his own enlightenment,
but to demonstrate to theworld beyond doubt the truth of his theories .He said : “ The experiment I am about to undertake will be of the greatest benefit to mankind .
”
Upon careful questioning itwaslearned thathe had never undertakena fast under strict scientific observation and that his reading had been inthe main confined to non-scientific works
,largely magazine articles .
On the occasion of the first visit it was evident that he was not onlywilling but anxious to assist in every way possible the work that wasbeing done. He was very cheerful and was plainly pleased with attention shown him . This cheerful attitude continued for the first week .
He was interested in what was being done and apparently tried todescribe his subjective feelings with exactness . If any attempt wasmade to oppose his ideas as to fasting , his usual smile disappearedquickly and he assumed a sober, slightly injured air.On the seventh day he appeared downcast, his movements were
less active, and he was decidedly depressed mentally. He attributedthis to the cloudyweather and rain and in so far as could be determinedno other reason for the change existed . He expressed no displeasureat the manner in which the experiment was being conducted . On theninth and eleventh days he was again cheerful , but not so enthusiasticas he had been during the first week, and he moved about as thoughhe fel t some physical fatigue. He admitted that he experiencedmuscular weakness . Any conversation, however, which was pleasingto him would arouse his enthusiasm for a short time . From this timeUp to the twenty-ninth day of the fast he was frequently depressed ,but always courteous and ready to submit to the examination. On the
days wi th sunshine he was always more cheerful , but at no time was heas enthusiastic as during the first week . He appeared to be slightlyfatigued most of the time after the first week . His movements inpreparing for the examinations were more deliberate, and any attemptto hurry him was politely resented . After the first week he graduallybecame more sensitive to discomfort and pain, complaining of anyunusual pressure of the stethoscope or pressure of the hands in palpating the organs . He frequently spoke of the annoyance of the rectalthermometer and of the adhesive tape used in retaining the stethoscopeon the chest wall . This annoyance was p lainly shown in the expressionof his face and in the careful manner in which hemoved about when the

SUBJECTIVE IMPRESS IONS AND MENTAL ATTITUDE .
thermometer was in the rectum. During the periods of depression hewas frequently disinclined to talk , andwas sometimes irritable . At notime , however, did he object to the examination, andhe always seemedwilling to do whatever was necessary for the success of the experiment .On the fifteenth day he said that hismind was beginning for the first
time to become clear ; on the nineteenth day he began to feel the desireto do mental work ; and from this time on he declared that his mind wascontinually gron clearer. Certainly there was no outward evidenceof the truth of this statement . He appeared fatigued mentally
, and
he neither understood nor answered the questions put to him so
promptly as he did early in the fast . As far as could be determinedthere was no such stimulation for study as he had predicted . On the
contrary he seemed to be less occupied with his books andpapers .On the last day of the fast he appeared to be very sober and assumed
rather an injured air. His general attitude was a complaining one .
The fast was being broken contrary to his judgment, as it was harmfulto take food before the desire for food had returned . Then for the firsttime he complained of hismedical care , saying that while the examinations were made in the most careful and painstaking manner no attention had been paid to his physical exercise andhe had not been al lowedto go out in the fresh air as much as he should have .
Nothing was observed at any time which would lead one to supposethat the sub ject experienced any sensation of hunger or any feeling ofdistress in the abdomen throughout the entire fast .1
Two hours after breaking the fast he was seen seated at a tablewhere he was Slowly eating his fruit juice and honey . His expressionwas downcast and his features drawn. His voice was weak and he
Spoke with deliberation. Notwithstanding his resentment at thebreaking of his fast he willingly submitted to examination. He complained ofpain in the abdomen and sudden spasmodic changes in his expressionoccurred at the time he said he was having pain. Palpation of hisabdomen, however, only Slightly intensified the discomfort .Twenty-four hours after breaking the fast the general expression of
depression was more marked . The voice was weak and he movedabout very Slowly. At this time there was no evidence of any physicaldiscomfort other than lassitude.
On the third day after partaking of food he appeared in decidedlybetter spirits . There was no expression of discomfort and he smi ledfrequently during the examination . His movements were not sodeliberate. He attributed his bad feelings of the previous days to thepain and discomfort he had suffered and did not appear to entertain
lCetti on the fifth day of the fast complained of pain in the epigastrium from time to time , on
the sixth day of belching gas and of distress in the abdomen, on the eigh th day of severe abdominalpain, which disappeared on the ninth day after the bowelsmoved ; on the tenth day he complainedof fee ling very weak physically and of being nauseated. N0 note is made of the gastro-enteriocondition in the case of Breithaupt and Beauté .
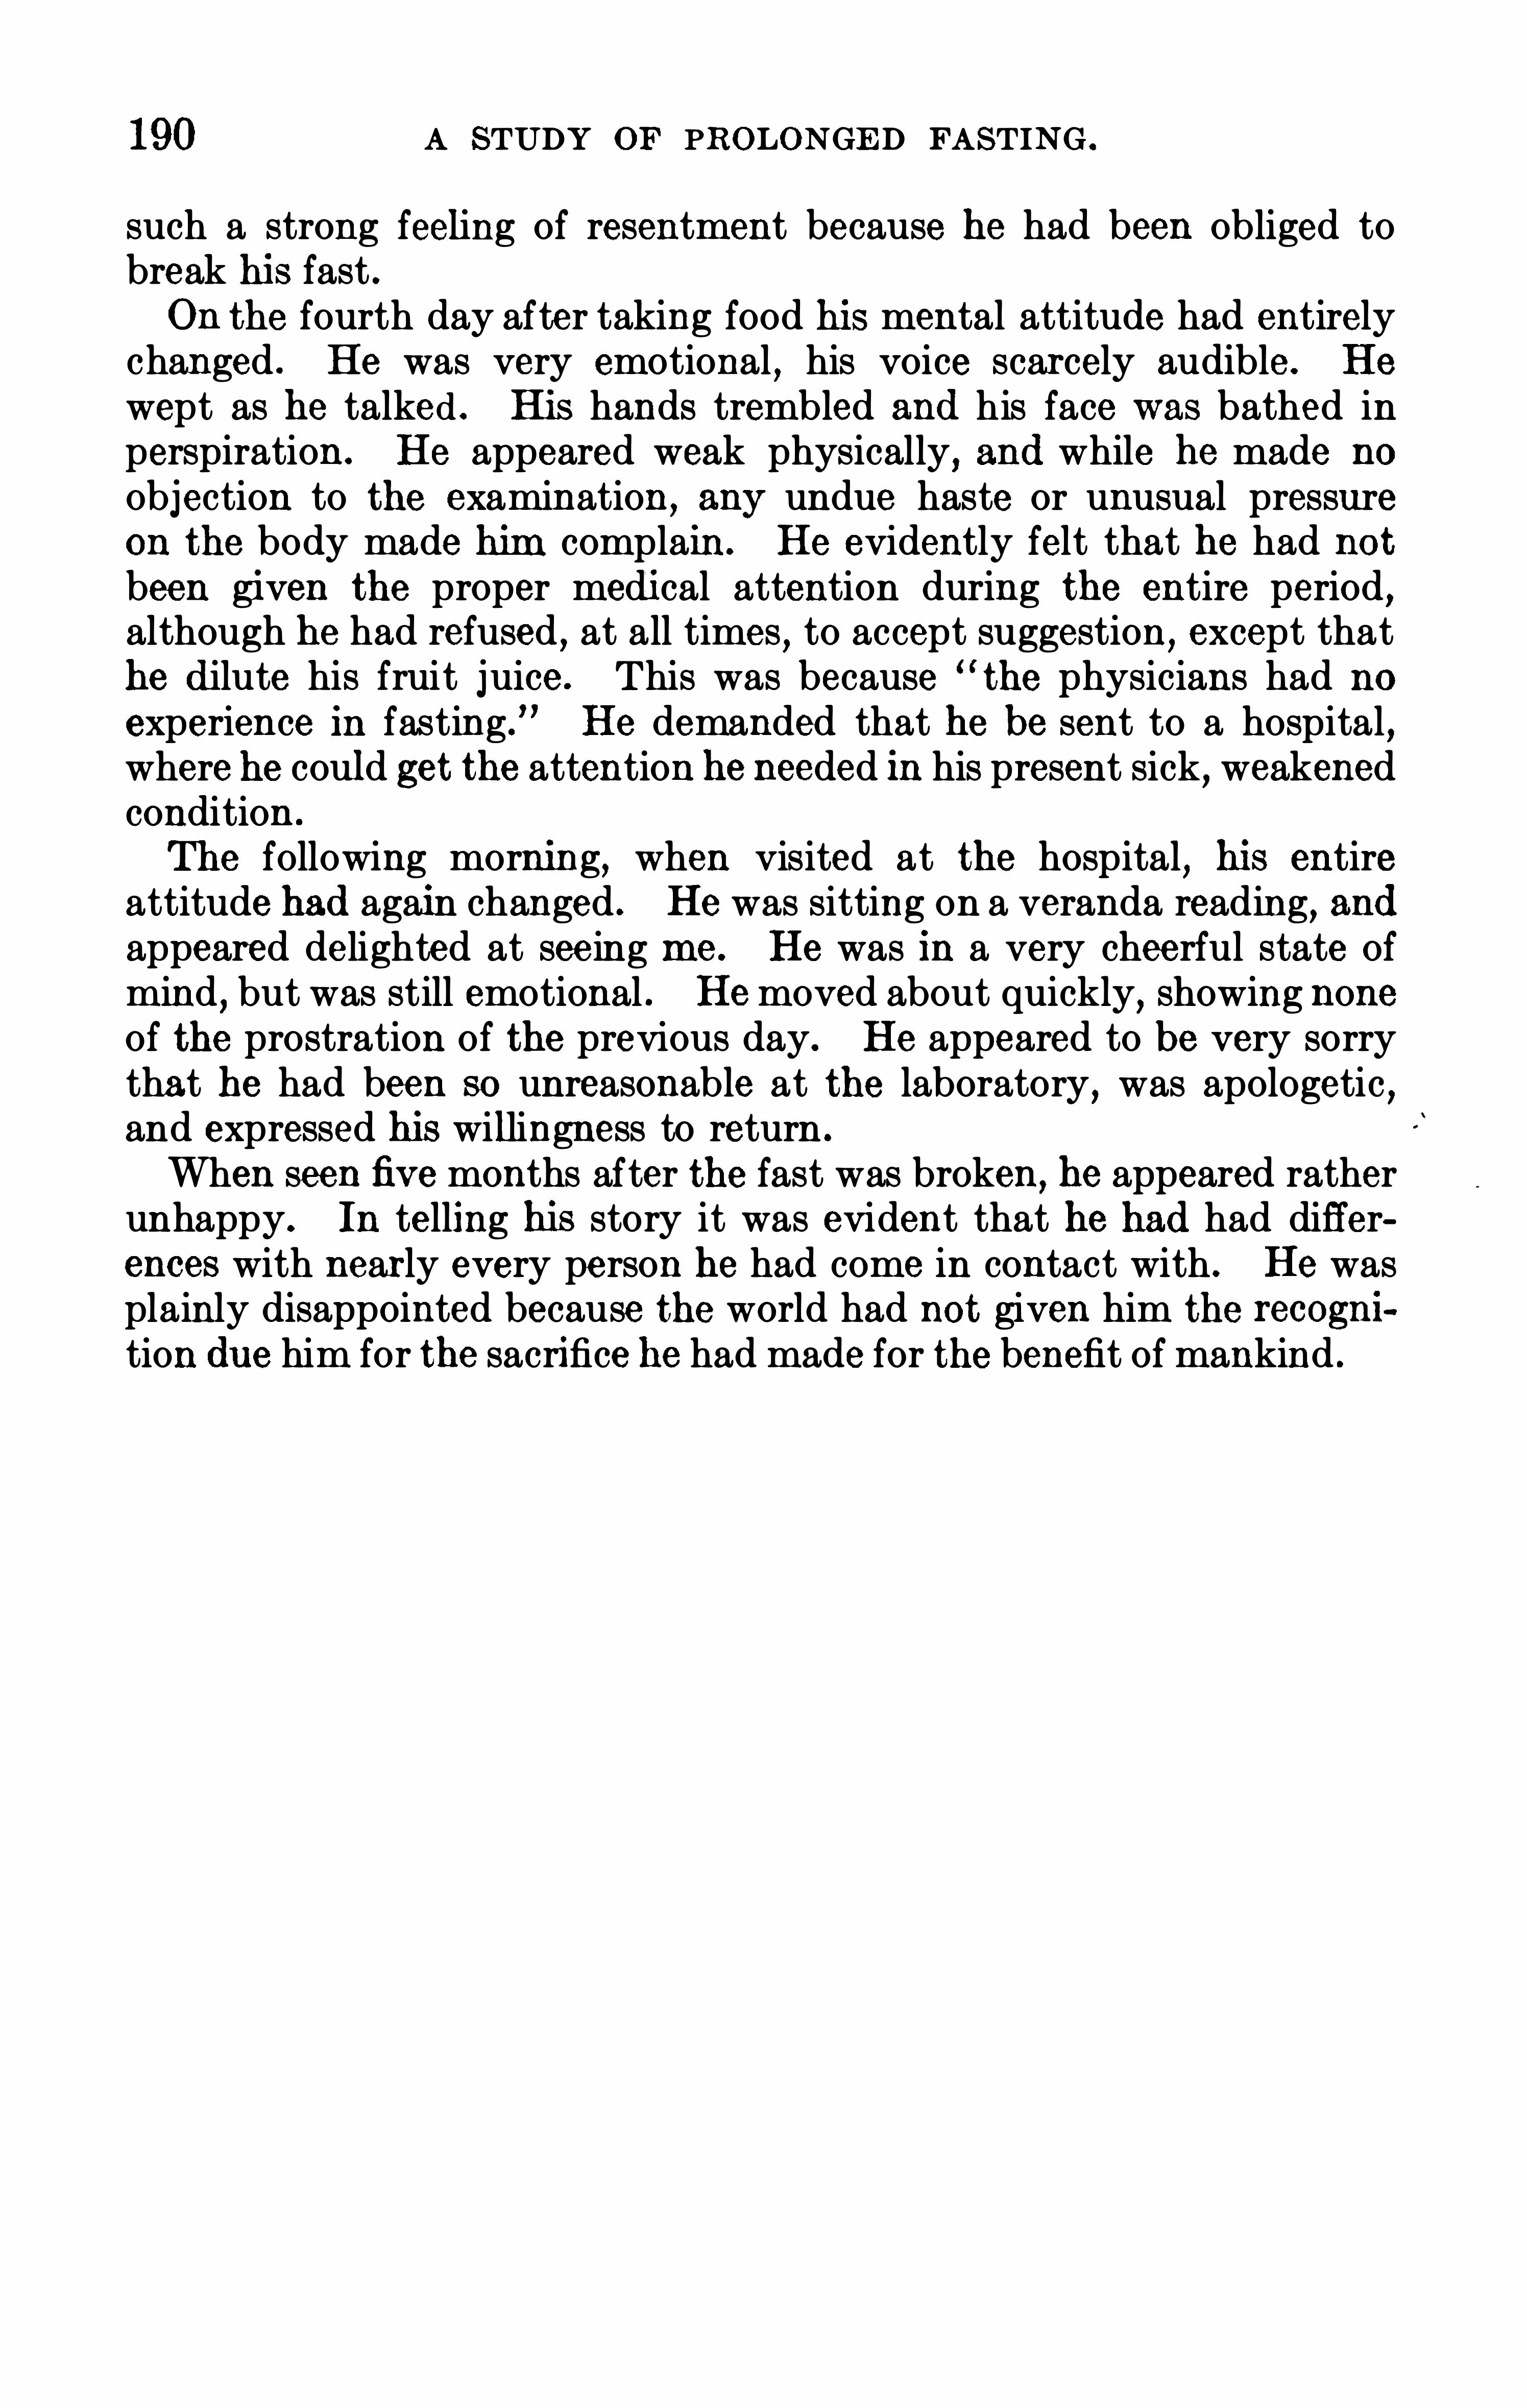
190 A STUDY OF PROLONGED FASTING .
such a strong feeling of resentment because he had been obliged tobreak his fast .On the fourth day after taking food his mental attitude had entirelychanged . He was very emotional , his voice scarcely audible . He
wept as he talked . His hands trembled and his face was bathed inperspiration. He appeared weak physically, and while he made no
objection to the examination, any undue haste or unusual pressureon the body made him complain. He evidently felt that he had notbeen given the proper medical attention during the entire period ,although he had refused , at all times , to accept suggestion, except thathe dilute his fruit juice . This was because the physicians had no
experience in fasting .
” He demanded that he be sent to a hospital,
where he could get the attention he needed in his present sick , weakenedcondition .
Th e following morning, when visited at the hospital, his entireattitude had again changed . He was sitting on a veranda reading
, and
appeared delighted at see ing me . He was in a very cheerful state ofmind , but was still emotional . Hemoved about quickly, showing noneof the prostration of the previous day. He appeared to be very sorrythat he had been so unreasonable at the laboratory , was apologetic ,and expressed his willingness to return .
When seen five months after the fast was broken,he appeared rather
unhappy. In telling his story it was evident that he had had differences with nearly every person he had come in contact with . He wasplainly disappointed because the world had not given him the recogni
tion due him for the sacrifice he had made for the benefit of mankind .

192 A STUDY OF PROLONGED FASTING .
dition of his tongue and the unpleasant taste in his mouth . It washis idea that the fast should continue until this disappeared and it wasfor this reason that he was loath to break his fast on the thirty-firstday .
l Although he seemed more feeble toward the end of the fast andgave one the impression of a man convalescing from a weakeningillness , yet he was always able to walk without assistance and at notime was it necessary to omit or alter a test through lack of strength onhis part . On May 15 , the day he broke his fast , he suffered severecolic
,induced by the food he ate , and although tests weremade the con
ditions were most unfavorable. It had been planned to continue theexamination for several weeks longer, inasmuch as such tests wouldobviously be of inestimable value for comparison with the fasting tests .Unfortunately that was quite impossible under the circumstances andan entire year elapsed before further records could be obtained .
Several factors influenced the selection of the tests . In the firstplace the time was limited . There was only 1 hour daily available andit seemed advisable to arrange for as many tests as possible during thishour in order to obtain a good mental picture . It was therefore necessary to choose Short tests and also those requiring the minimum ofeffort , as one test had to follow the other without pause for recuperation. For example, prolonged tests for fatigue would have been ofgreat value, but they could notbe considered . In the second place
,the
fasting began a few days after L .
’s arrival and little time could be
devoted to preliminary trials in order to obtain the best combination,
and the program once arranged could not be fundamentally changed ?
After consultationwi th ProfessorRaymond Dodge , a series of tests wereselected . A few days ’ experience, however, Showed the necessity ofseveral alterations , and the revised program was as follows : (1) Rotememory for words ; (2) tapping test ; (3) strength test ; (4 ) tactual-spacethreshold ; (5) touch threshold ; (6) free association and reproductionreactions ; (7) association reactions , genus-species ; (8) association reac
tions,noun-verb ; (9) cancellation test ; (10) hand-writing ;
3(11) visual
acuity ; (12) memory for words after 55 minutes . Later the touchthreshold , which was taken on the under part of the lower forearmwith a von Frey hair, was discontinued on account of the impossibility of obtaining reliable results in a short period of time . The
association reaction genus-Species was also omitted through difficultyin finding sufficient reaction words of equal simplicity. In addition tothe tests L . was requested to describe al l the dreams he had on the previous night .4 This was given before the visual acuity test . All the
lThirty days were considered suflicient for the physio logical tests and he was allowed one daymore to excel Succi's record .
2A few minor changes were introduced .
3A superficial exam ination of the daily records revealed no change. A systematic examinationof the data has not yet been made.
‘See Appendix I , p . 222.
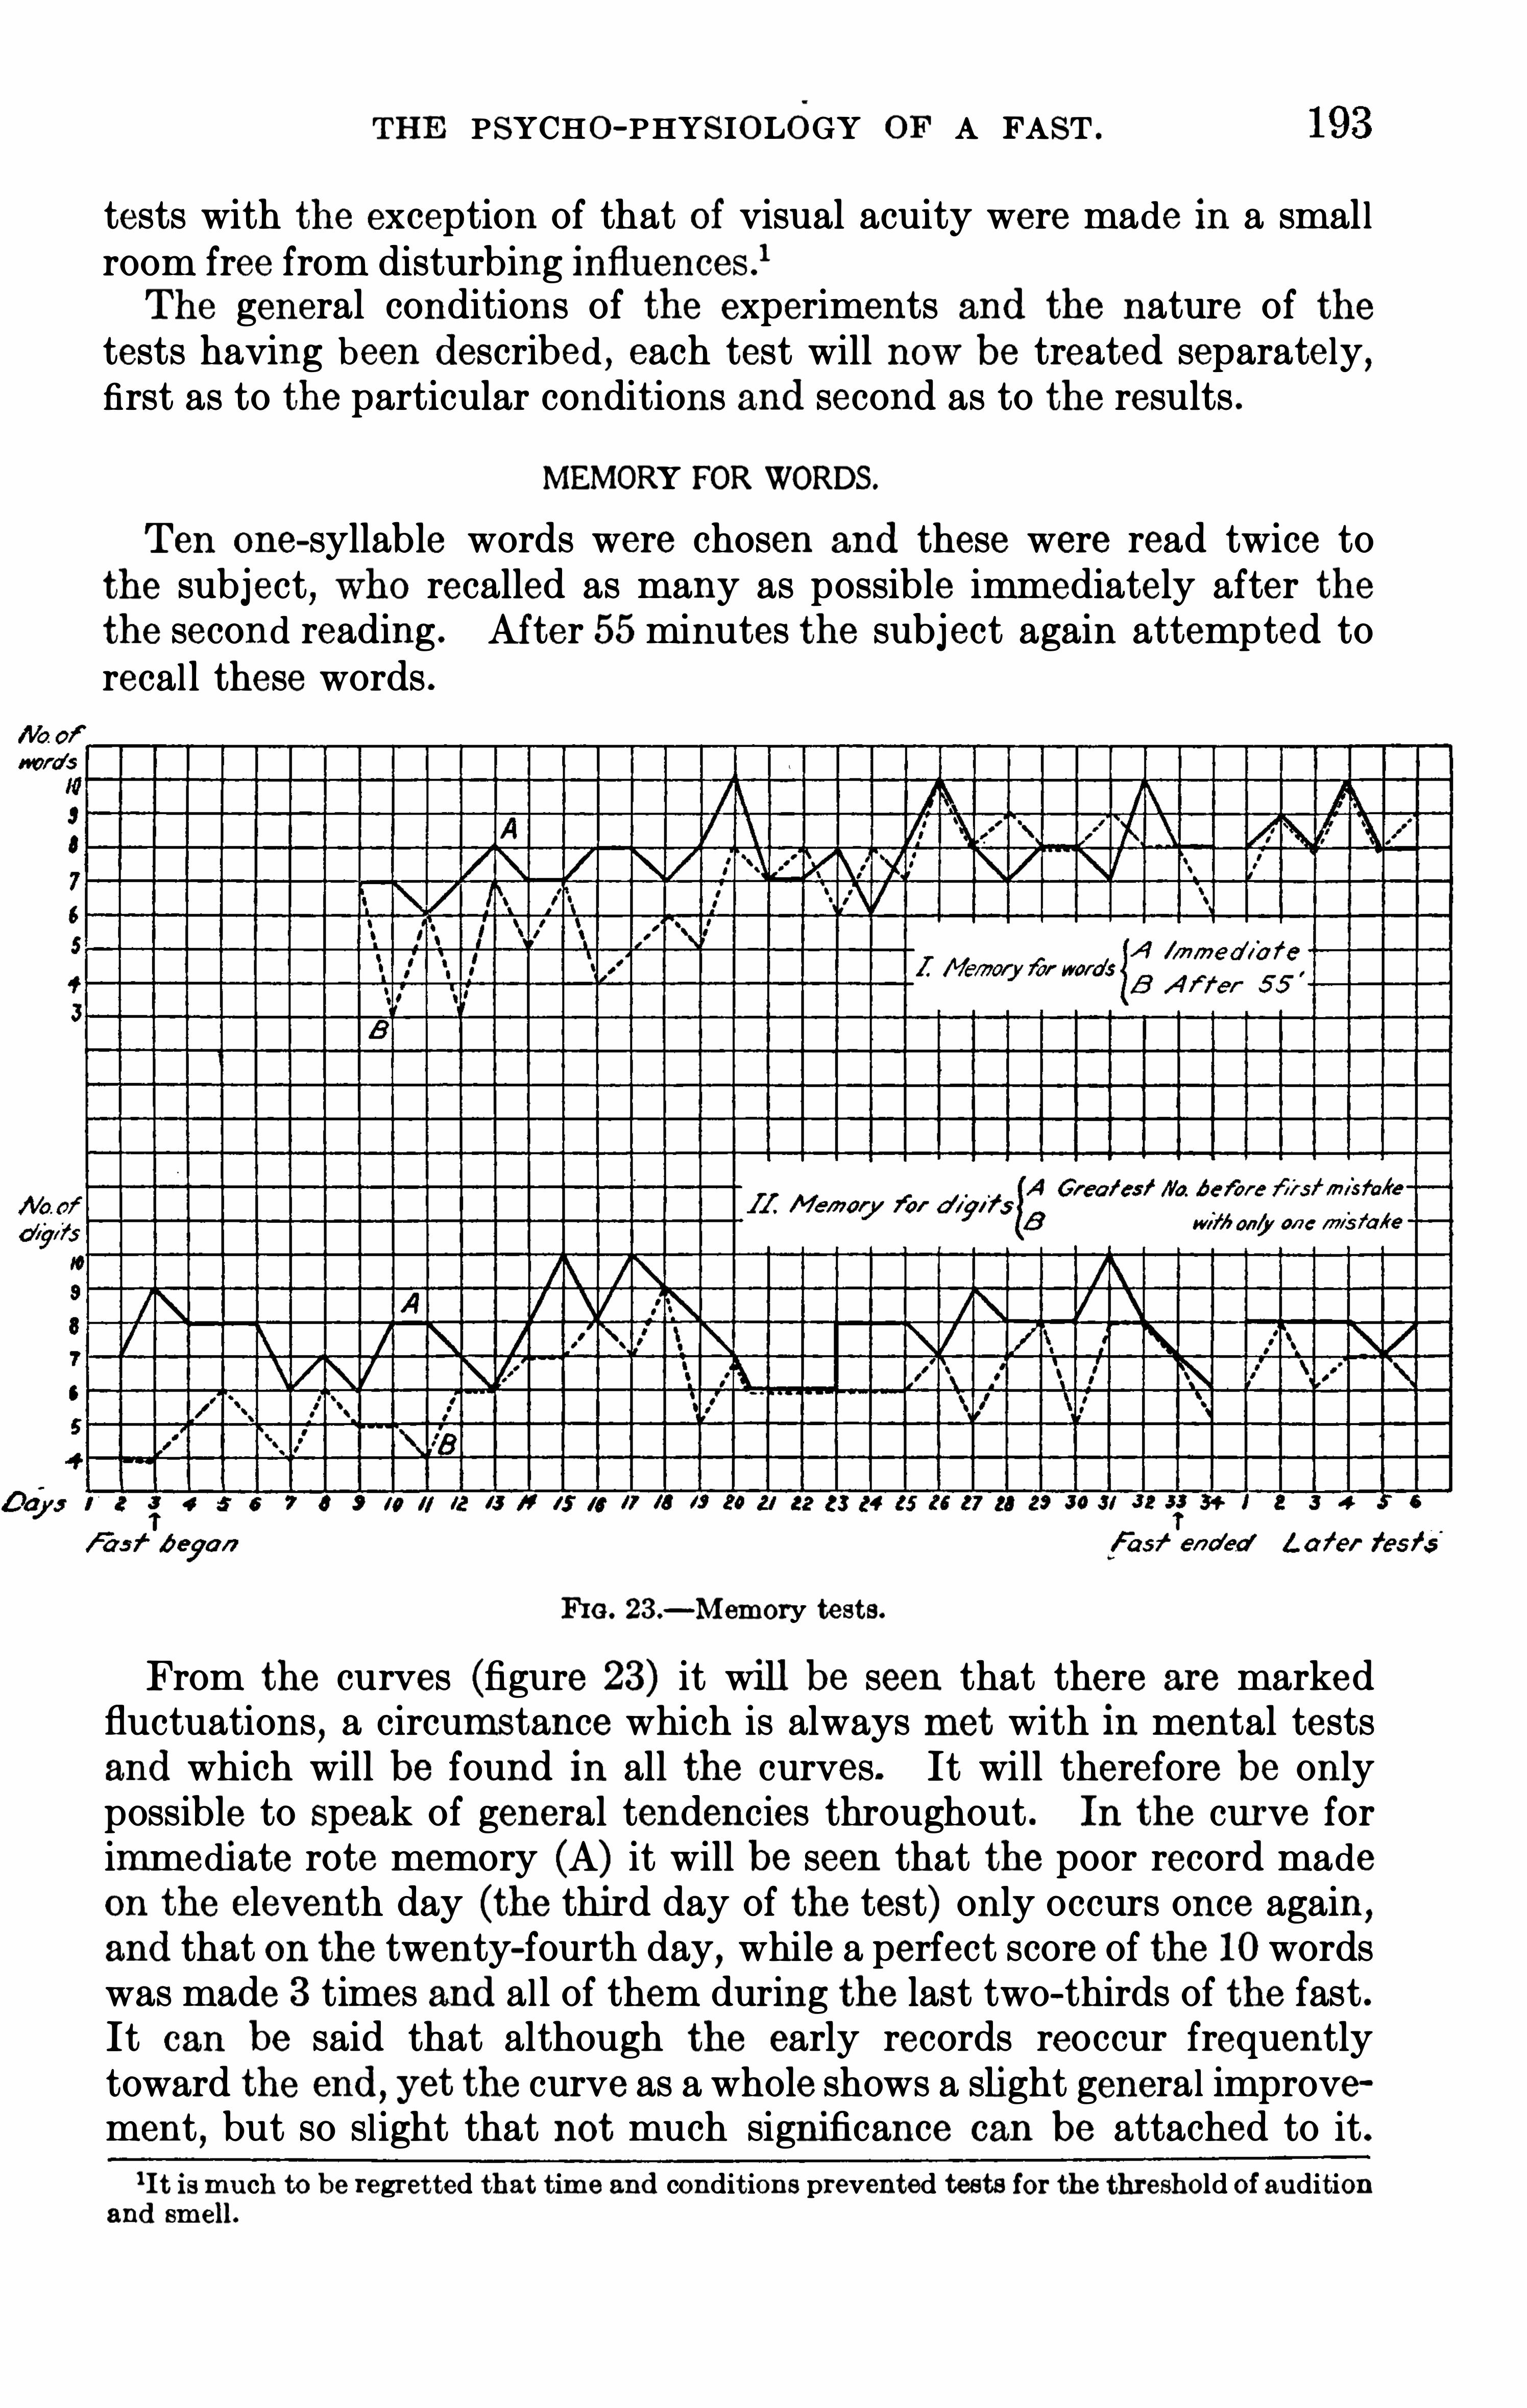
THE PSYCHO- PHYS IOLOGY OF A FAST .
tests with the exception of that Of visual acuity were made in a smal lroom free from disturbing influences.
1
The general conditions of the experiments and the nature of thetests having been described , each test will now be treated separately,first as to the particular conditions and second as to the results .
MEMORY FOR WORDS.
Ten one-syllable words were chosen and these were read twice tothe subject , who recalled as many as possible immediately after thethe second reading . After 55 minutes the subject again attempted torecal l these words .
FIG . 23.-Memory tests.
From the curves (figure 23) it will be seen that there are markedfluctuations
,a circumstance which is always met with in mental tests
and which will be found in all the curves. It will therefore be onlypossible to Speak of general tendencies throughout . In the curve forimmediate rote memory (A) it will be seen that the poor record madeon the eleventh day (the third day of the test) only occurs once again,
and that on the twenty-fourth day, while a perfect score of the 10 wordswas made 3 times and al l of them during the last two—thirds of the fast .It can be said that although the early records reoccur frequentlytoward the end
, yet the curve as a whole shows a slight general improvement , but so slight that not much significance can be attached to it .
gt is r
anch to be regretted that time and conditions prevented tests for the threshold ofaudition
an sm e
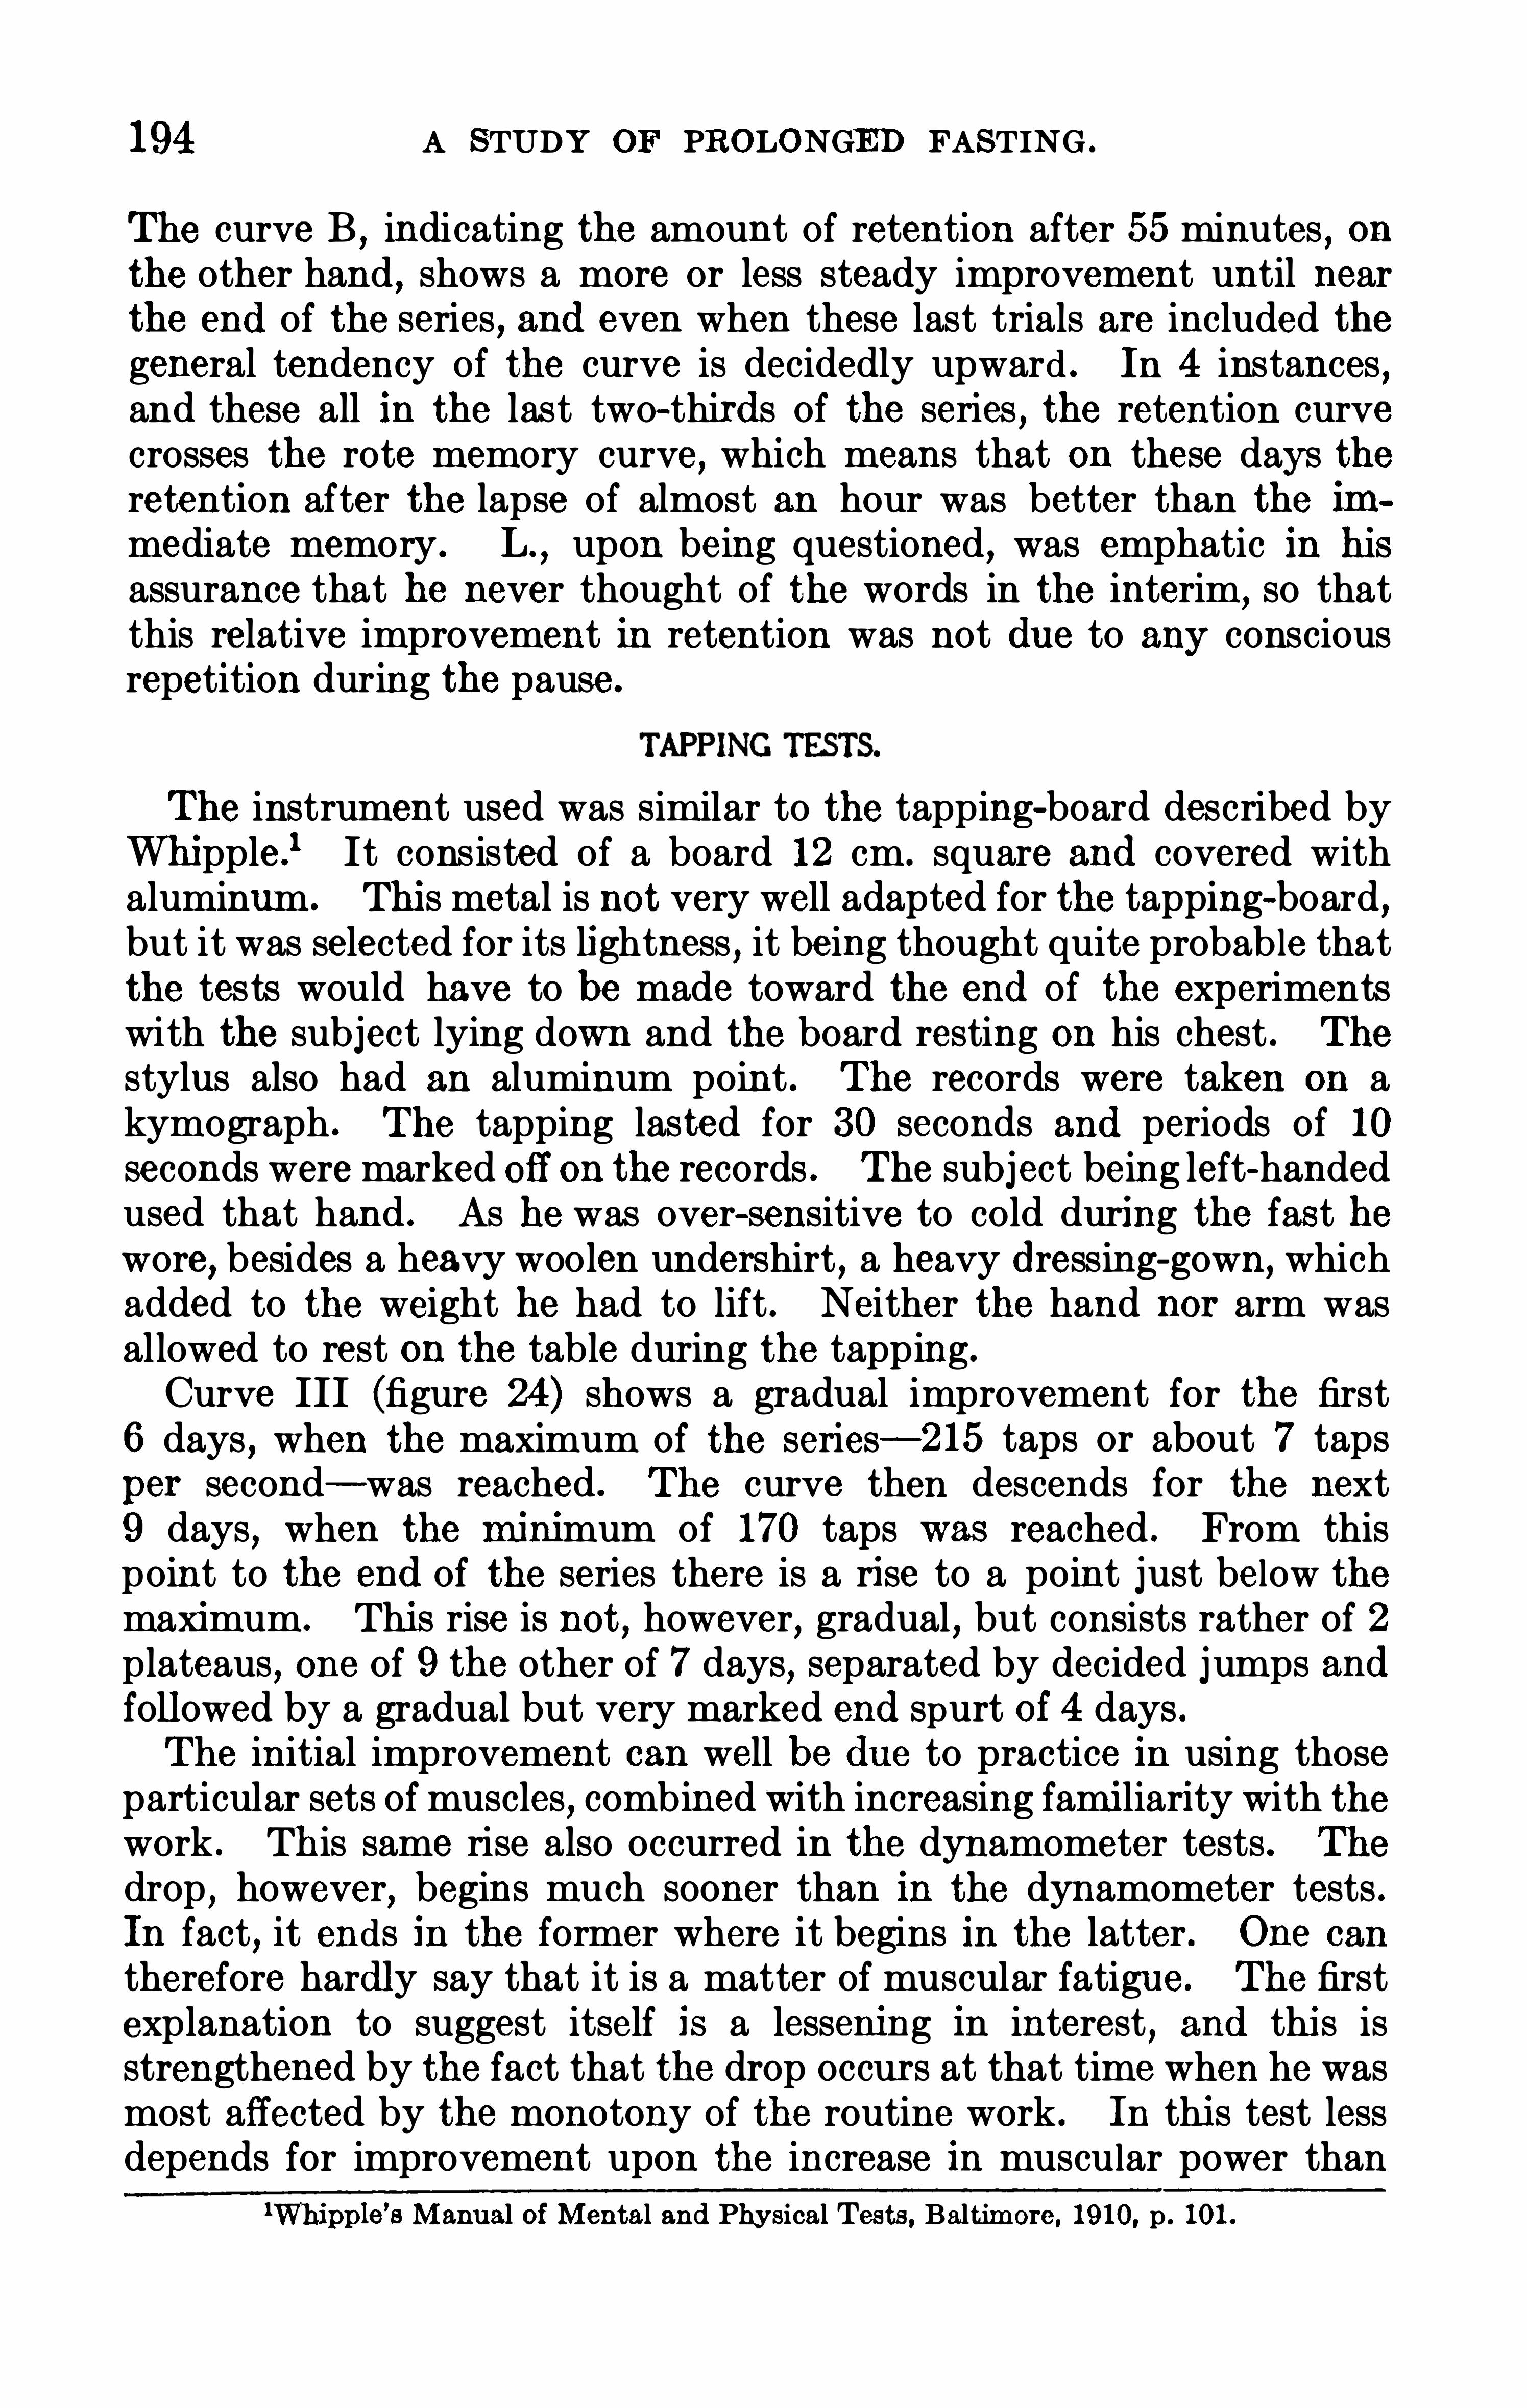
194 A STUDY OF PROLONGED FASTING .
The curve B , indicating the amount of retention after 55 minutes , onthe other hand , shows a more or less steady improvement until nearthe end of the series , and even when these last trials are included thegeneral tendency of the curve is decidedly upward . In 4 instances
,
and these all in the last two-thirds of the series , the retention curvecrosses the rote memory curve
,which means that on these days the
retention after the lapse of almost an hour was better than the immediate memory . L .
,upon being questioned , was emphatic in his
assurance that he never thought of the words in the interim,so that
this relative improvement in retention was not due to any consciousrepetition during the pause .
The instrument used was similar to the tapping-board described byWhipple .
1 It consisted of a board 12 cm. square and covered withaluminum. This metal is not very well adapted for the tapping-board
,
but it was selected for its lightness , it being thought quite probab le thatthe tests would have to be made toward the end of the experimentswith the subject lying down and the board resting on his chest . The
stylus also had an aluminum point . The records were taken on akymograph . The tapping lasted for 30 seconds and periods of 10seconds were marked off on the records . The subject being left-handedused that hand . As he was over-sensitive to cold during the fast hewore, besides a heavy woolen undershirt , a heavy dressing-gown, whichadded to the weight he had to lift . Neither the hand nor arm wasallowed to rest on the table during the tapping.
Curve III (figure 24 ) shows a gradual improvement for the first6 days , when the maximum of the series— 215 taps or about 7 taps
per second— was reached . The curve then descends for the next9 days , when the minimum of 170 taps was reached . From thispoint to the end of the series there is a rise to a point just below themaximum. This rise is not, however, gradual , but consists rather of 2plateaus
,one of 9 the other of 7 days, separated by decided jumps and
followed by a gradual but very marked end spurt Of 4 days .The initial improvement can well be due to practice in using those
particular sets of muscles , combined with increasing familiarity with thework . Th is same rise also occurred in the dynamometer tests . Th e
drop,however, begins much sooner than in the dynamometer tests .
In fact , it ends in the former where it begins in the latter . One can
therefore hardly say that it is a matter of muscular fatigue . The firstexplanation to suggest itself is a lessening in interest , and this isstrengthened by the fact that the drop occurs at that time when he wasmost affected by the monotony of the routine work . In this test lessdepends for improvement upon the increase in muscular power than
lWhipple’
sManual of Mental and Physical Tests, Baltimore , 1910 , p . 101 .
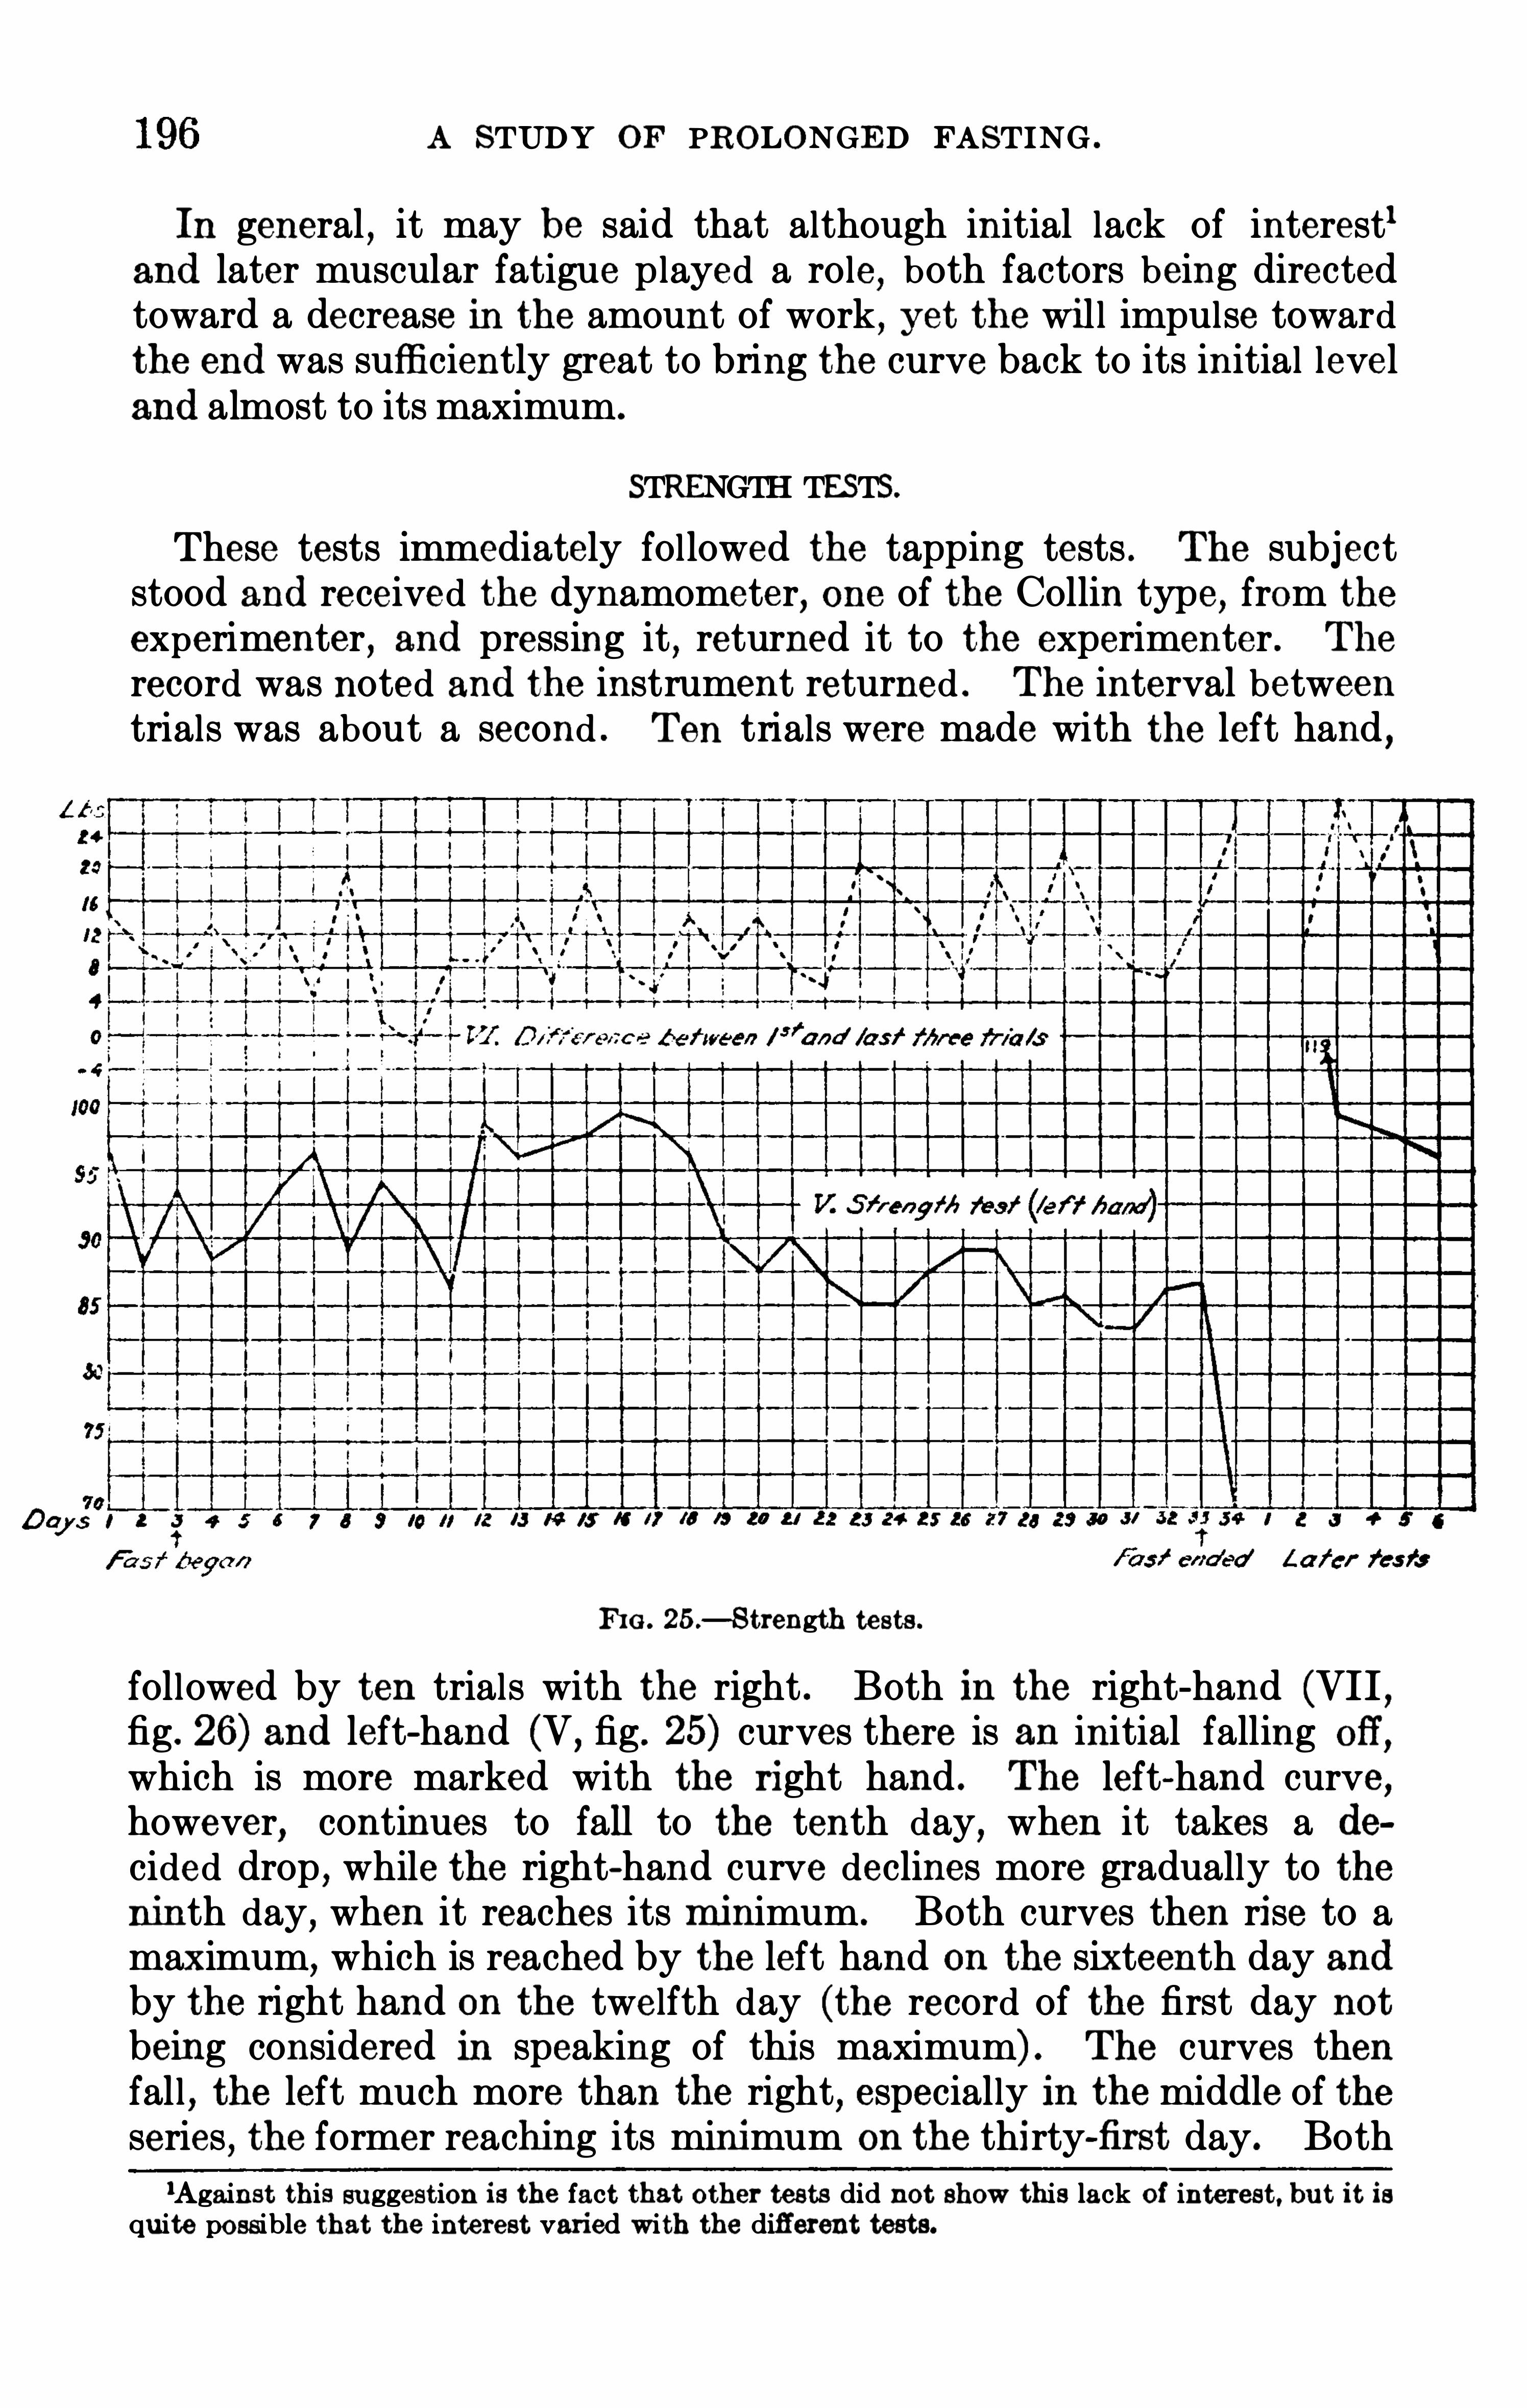
A STUDY OF PROLONGED FASTING .
In general , it may be said that although initial lack of interest1
and later muscular fatigue p layed a ro le, both factors being directedtoward a decrease in the amount of work , yet the wil l impulse towardthe endwas sufficiently great to bring the curve back to its initial leveland almost to its maximum.
STRENGTH TES TS.
These tests immediately fol lowed the tapping tests . The subjectstood and received the dynamometer, one of the Collin type, from the
experimenter , and pressing it , returned it to the experimenter . The
record was noted and the instrument returned . The interval betweentrials was about a second . Ten trials were made with the left hand ,
FIG . 25 .— Strength tests.
followed by ten trials with the right . Both in the right-hand (VII ,fig . 26) and left-hand (V , fig. 25) curves there is an initial falling off
,
which is more marked with the right hand . The left-hand curve ,however, continues to fall to the tenth day, when it takes a decided drop , while the right-hand curve declines more gradually to theninth day, when it reaches its minimum . Both curves then rise to amaximum,
which is reached by the left hand on the sixteenth day andby the right hand on the twelfth day (the record of the first day notbeing considered in speaking of this maximum) . The curves thenfal l
,the left much more than the right , especially in the middle of the
series , the former reaching its minimum on the thirty-first day. Both1Against th is suggestion is the fact that other tests did not Show this lack of interest, but it is
quite possible that the interest varied with the different tests.

THE PSYCHO-PHYS IOLOGY OF A FAST .
curves Show a Slight end spurt . This is , as a glance at the curve willShow,
merely a rough picture , there being decided rises and fal lsthroughout .In interpreting the curve it must be remembered that L .
’s left hand
is the practiced hand and it can therefore be assumed that the musclesof that hand are the stronger. In fact
,the results make this more than
an assumption,for the record of this hand is at al l times decidedly
better than that of the right hand . The ini tial falling off is what onemust expect when the subject is not accustomed to the particularmuscular exercise . There is a great exertion at first , and the muscles ,skin
,and subcutaneous tissue feel the unusual strain for several days .
The muscles least accustomed to exercise are the most affected, and
FIG . 26 .— S trength tests.
for this reason the right-hand record drops more than that of the lefthand . Then the musc les gradually recover and the effect of practicebegins to appear. Acting against the practice is the increasing fatigue .
The right hand being the unused hand gives practice more chance forits influence and although fatigue never al lows the curve to reach itsfirst day’s record , yet the drop which soon begins is much more gradual ,as has been pointed out , than it is with the left hand , which showsmore clearly the effect Of fatigue .
The difference curves (VI and VIII) , which were obtained by subtracting the average of the last three records of each day from the
average of the first three , help to strengthen the conclusions justdrawn . The rise of the difference curve at the same time as the fallof the main curve means
,of course
,increasing fatigue , wh ich Shows
itself in a greater and greater drop toward the end of the daily series .

A STUDY OF PROLONGED FASTING .
This rise in the two difference curves is relatively about the same,which means that the daily increase in fatigue is relatively the samefor the two hands . Further, if we glance at curves IX and X , fig .
27,we find additional indications in the same direction. This curve
is plotted from the first of the daily series of 10 trials . This trial isleast affected by fatigue and therefore shows the greatest influence ofpractice . Here there is a gradual rise for the right hand until next tothe last day, while the curve for the left hand begins to drop whereit should according to our analysis .In general , we may therefore say that fatigue appears in both hands
early in the series . The curve for the left hand drops far below therecord of the first few days . The curve for the right hand shows lessdrop
,due to the greater influence of practice , so that the two curves
tend to approach one another.
FIG . 27 .— Strength tests.
A pair of dividers with wooden tips were used as an aesthesiometer.
The threshold was found on the volar side of the forearm,about 4
inches from the elbow. The points were applied on either side of ared-ink dot which was made on the arm on the first day and renewedwhen necessary. The method of minimal change, with ascending anddescending series, was employed ; 5 trials , excluding one-point
“ vexier”
trials, were made at each distance ; 4 correct out of 5 was consideredthe threshold ?
For the first few days the curve (XI , fig . 28) keeps the high level of 7cm. On the seventh day there is a drop to cm.
,then a slight rise to a
level of 6 cm. and a high threshold of cm . on the fourteenth day,followed by a fall to the minimum of 5 cm . on the twenty-second day,which minimum is again reached on the twenty-sixth and thirtieth
1It had been intended to call 3 out of 5 th e correct threshold , but thiswas not found feasible.
Th e thresho ld is probably too h igh , but for the present purpose , where the change and not the
abso lute thresho ld is being investigated , th is does notmatter. The curve sh ows no record for thefourth and fifth days. The experim enter was absent on these days and the physician who kindlyvolunteered his servicesdid not deem himself sufficiently skilled in thisparticular test to undertake it .

200 A STUDY OF PROLONGED FASTING .
There is , however, a very low minimum in the second half of the curveand a decided drop from the maximumof the thirty-first day . One can ,
therefore,hardly speak of an improvement . The most that can be
said is that toward the end of the fast the subject was again ab le toreach the maximum record of 10 digits obtained near the middle ofthe series . From curve B we see that on the third day a mistake wasmade at 4 digits , yet the retention is 9 digits ; on the eleventh day amistake at 4 digits and a retention of 8, etc. It seems fair to assumefrom these results that curve B represents in a rough manner the degreeof attention . It is only inattention that can produce results like theabove . Curve B shows a decided rise to the eighteenth day
,when it
reaches a maximum , and although it follows a lower level from this dayit never reaches the minimum of the first third Of the series . One maytherefore say that there is an improvement in the state of attention
,at
least for this experiment , as the fast progressed .
ASSOCIATION TESTS.
The free-association experiments consisted of the daily presentationof a list of 20 words , which were selected principal ly from the lists prepared by Woodworth and Wel ls,
1and with the exception of the list
of May 9, which was a repetition of that of April 11 , they were alldifferent ? Several days after the tests were begun it was thoughtadvisable , in order to make the lists as uniform as possible , to havethem composed of an equal number Of verbs , concrete nouns , adjectives ,and abstract nouns , in the order given . This arrangement wasadhered to from April 18 to the end of the tests, with the exception ofMay 9 . The words were read aloud by the experimenter and the timetaken with an ordinary stop-watch . The reproduction experimentsfo l lowed these with only a pause of a minute. Although the subjectwas told that he need not repeat the same word , if it did not come atonce , yet there is little doubt that his efforts were always directedtoward that end. L . had a good command of the English language ,although it is not his native tongue, but at times he had difficulty infinding the word he wanted . In such cases he made a gesture as soonas the idea came to him and the watch was snapped at that time ratherthan when the English word was found . This method of procedurewas not often necessary and it seemed a legitimate means of balancingthe slight disadvantage he had as a foreigner . A reserve list was prepared upon which to draw when he did not understand the word of themain list .The curve (XIII , fig . 29) is plotted from the daily average . The
average was used in order the better to include the influence of thelWoodworth and Wells, Association Tests, Psych . Monog . , 191 1 , 3.
2The listswill be found in Appendix II , pp. 222-229 . In a few instances the same word appearsin two lists.

THE PSYCHO-PHYS IOLOGY OF A FAST . 201
long times , which might very we l l be of 1mportance in these tests? The
few exceptional ly long times,such as 20 seconds
,which may have been
caused by emotional complexes, were not included .
The curve begins with very long reaction times . L . had neverperformed such tests before
,so that the sudden drop on the third day
FIG . 29 .— Free asso ciation tests.
1
FIG . 30 .— Asso ciation tests. Reactions to verbs and nouns.
1The m edian, which was also calculated , gave the sam e general curve .

A STUDY OF PROLONGED FASTING .
must be attributed to the practice improvement , which at this earlystage could very well be sudden and of considerable amount, ratherthan to the fact that it is the first day of the fast . From this point thecurve descends with a few breaks to the fifteenth day, when it reachesseconds ; it then rises to the twenty-second day, when it reaches the
maximum (if we do not consider the first few days) and then falls to theend of the series. On the second from the last day it reaches the minimum of seconds . Also the record of seconds is Obtained 3 times
FIG . 3 1 .— Asso ciation tests. Reac tions to adjectives.
FIG . 32.— Association tests. Reactions to abstract nouns.
in the second half of the series . If we include the first few days it canbe said in general that there is a very decided betterment in the association times ; and even if one calculates from the third day there is anappreciable drop . Especially interesting is the almost steady improvement shown in the last third of the curve .
In order to analyze the curve further, separate curves (XIV, XV,
XVI, and XVII , figs . 30 to 32) have been plotted for each of the four

204 A STUDY OF PROLONGED FASTING .
tions were, on the whole , rapid , averaging about 1 second and droppingas low as second . As the number of false reproductions was verysmall (see I , table amounting to only 23 in 680 reactions, or 3 percent , and never more than 3 in one list, an improvement or the reversein this respect would mean little. At least one can say that the qualityOf reproduction suffered no deterioration with the progress of the fast
,
but that retention was equally as good at the end as at the beginning.
q nhnent
No . o f test .
ducfi ons

THE PSYCHO- PHYS IOLOGY OF A FAST . 205
The quality of the association reactions was of high grade throughoutthe main test (11 , table There were no senseless or pure soundreactions and very few repetitions . Synonym s , word-compoundings,andmisunderstood stimulus words occurred seldom and were scatteredthroughout the days . The word “ woman” appears a number of timesand
“
man” slightly less Often . There was a lso evidence of a religious
complex . An examination of the different categories did not Show suffi~
cient change to warrant an analysis or tabulation as to quality . It wasthought that the introduction of words designating food might produce delayed reactions both with the word itself and the words imm edi
ately following . This was not the case . For example , on April 16 wefind egg
-white seconds ; on April 19 omelet-eat , seconds ; onApril 21 fish -sea
,seconds ; on May 7 candy- sweet , second ; on
I7 /8 20 l l 82 23 24 85
FIG . 34 .
— Contro lled association tests.
May 9 apple- fruit, second ; on May 10 roast-meat , 1 second ; onMay 13 chocolate- sweet , 1 second . None of these reactions werefollowed by unusually long reaction times . It might be of interest tomention at this point the unusually long reactions which point to complexes . On April 13 we find pulse-hand
, 9 seconds ; on April 21 deatheternal , seconds ; and on April 26 uncertainty-pendulum
,
seconds . These are the only extremely long reaction times . The
next longest is 6 seconds . All of these delayed reactions may beexplained from the same cause . L . had asserted that the chief factorfor a successful fast was faith and confidence and absolute lack of fear.He thinks it is the fear combined with exposure which causes deathin shipwrecks and other calamities where food is not obtainable, andnotthe actual lack of food . It is also claimed that thosewho fast frequentlycover their mirrors in order that they may not be disturbed by theevidences of emaciation. One of the supposed dangers in fasting isheart failure . If L .
’S heart had shown alarming symptoms the fast
would have been terminated at once . It does not, therefore, require

206 A STUDY OF PROLONGED FASTING .
a stretch of imagination to suppose that L . would keep his mind fromsuch subjects as death and uncertainty and that he would even avoidthought of the condition of his heart and that the mention of thesewords would cause hesitation.
The determined association reaction noun-verb was begun on the
eighth day. Curve XX (figure 34 ) resembles that of the verb curve,except that the rise continues longer. It starts very low (1 second) ,increases with rather large daily fluctuations , and on the last day of thefast returns to seconds . A particularly disturbing factor in thisseries was the fact that there was an ever-increasing difficulty to obtainappropriate words . At first the words had obvious associations .They were names of common objects , such as dog, gun, eye, etc . ,
butmore unusual words had to be employed in increasing numbers , andthere seems no doubt that this circumstance was at least partly thecause of the increasing length of the reaction time. It is even moreimportant in the determined than in the free-association experiments ,to have the quality of the words the same and not more difficult .For long series of tests the free-association experiments are much tobe preferred.
CANCELLATION TEST.
Special forms were made for this test , consisting of type-written piedtext of 100 a ’s and 50 of each of the other letters of the alphabet . Adifferent combination was made each day, so that the subject shouldnot become accustomed to the order. L. was requested to cancel allthe a ’s . He used his left hand and the time was taken with a stopwatch . Special care was observed to have the illumination constantand the same pencil was employed .
The curve (XXI , fig. 35) represents the time for the completion of thetask. As in some of the other curves , SO here we have the initial rise,whi ch continues to the sixth day , when there is a sudden drop to alevel which slopes slightly to another sudden drop on the twenty-ninthday and a very low level for the final days . The difference between themaximum of 3 minutes 48 seconds on the sixth day and the minimumof 1 minute 53 seconds on the last fast day 1s very considerable . The
maximum is over doub le the minimum,and even if we compare the
minimum with the initial time of 3 minutes 7 seconds or with 2 minutes 43 seconds Of the seventh day, which is the first and largestpractice drop , we still find a very considerable difference . There doesnot seem any doubt , therefore, that there is very much of a bettermentin the time as the fast progresses and that this decrease in the timecontinues to the end of the series . Nor is this improvement in timegained at the sacrifice of accuracy. At no time were there manymistakes made (see III , table In fact , the degree of accuracy wasalways so high that we can not place any importance on the S light

208 A STUDY OF PROLONGED FASTING .
out of the ten trials? The alteration in the position of the E fo l lowedno definite order, but every means was used in this respect to confusethe subject in order to remove all possibi lity of his guessing the position .
Most of the judgments were made without hesitation,both at the very
low and very high thresholds .
The curve (XII , fig . 28) represents the daily threshold in feet .There is a very rapid rise from the fifth to the fourteenth day
,when
the maximum of 37 feet is reached . Then there fo llows a drop to 24feet and a rise to 36 feet on the next to the last day of the fast . The
thirty-fourth day shows a drop to 19 feet . The record of the fifthday is 16 feet , which is the minimum ; that of the thirty-second day is36 feet , which is 1 foot less than the maximum. This difference of 20feet is very great for visual acuity . He saw twice as far at the end
of the fast as he did at the beginning .
Owing to an attack of colic resulting from the nature of the first foodtaken after the fast and the subsequent withdrawal from the laboratory
,it was impossible to continue the tests during the recuperative
period , as had been planned . Only by later tests for comparison coulda decision be reached as to the efficacy of fasting . One year after thetests just described L . volunteered as subject for a short series of tests .These were conducted at the Harvard Psychological Laboratory and
extended over a period of 6 consecutive days . It was not possible toarrange for them to take place at 5 o ’clock as previously and 10 O ’clockin the morning had to be chosen . All the other conditions wereobserved as closely as possible . The same tests , with the exception ofthe visual-acuity test and the hand-writing test
,were performed .
L . seemed in good health . He weighed about 126 pounds,which is
somewhat less than he weighed when he began his fast . His physicalappearance was , however, very much the same as on the day he arrivedat the Nutrition Laboratory . He had remained in Am erica duringthe previous year, engaged in medical studies
,lecturing , etc .
,had
not fasted again, and had had no i llness during that time . In com
ing to the laboratory he made a journey of 4 miles and had alreadyhad several hours ’ work , having risen each day at 5 o ’clock
,exercised
for half an hour , and made several visits . The conditions previous tothe tests are , therefore , hardly comparable to those of the former series .It is evident , however, that he was as strenuous , if notmore so , than hehad been up to the later hour of 5 o ’clock of the previous tests .The rote memory for digits (II A) was somewhat poorer than it wasduring the latter part of the long series . It did not reach themaximum
1Lack of time prevented th e thresho ld being taken in the reverse direction. Th e tests took5 to 10 minutes.
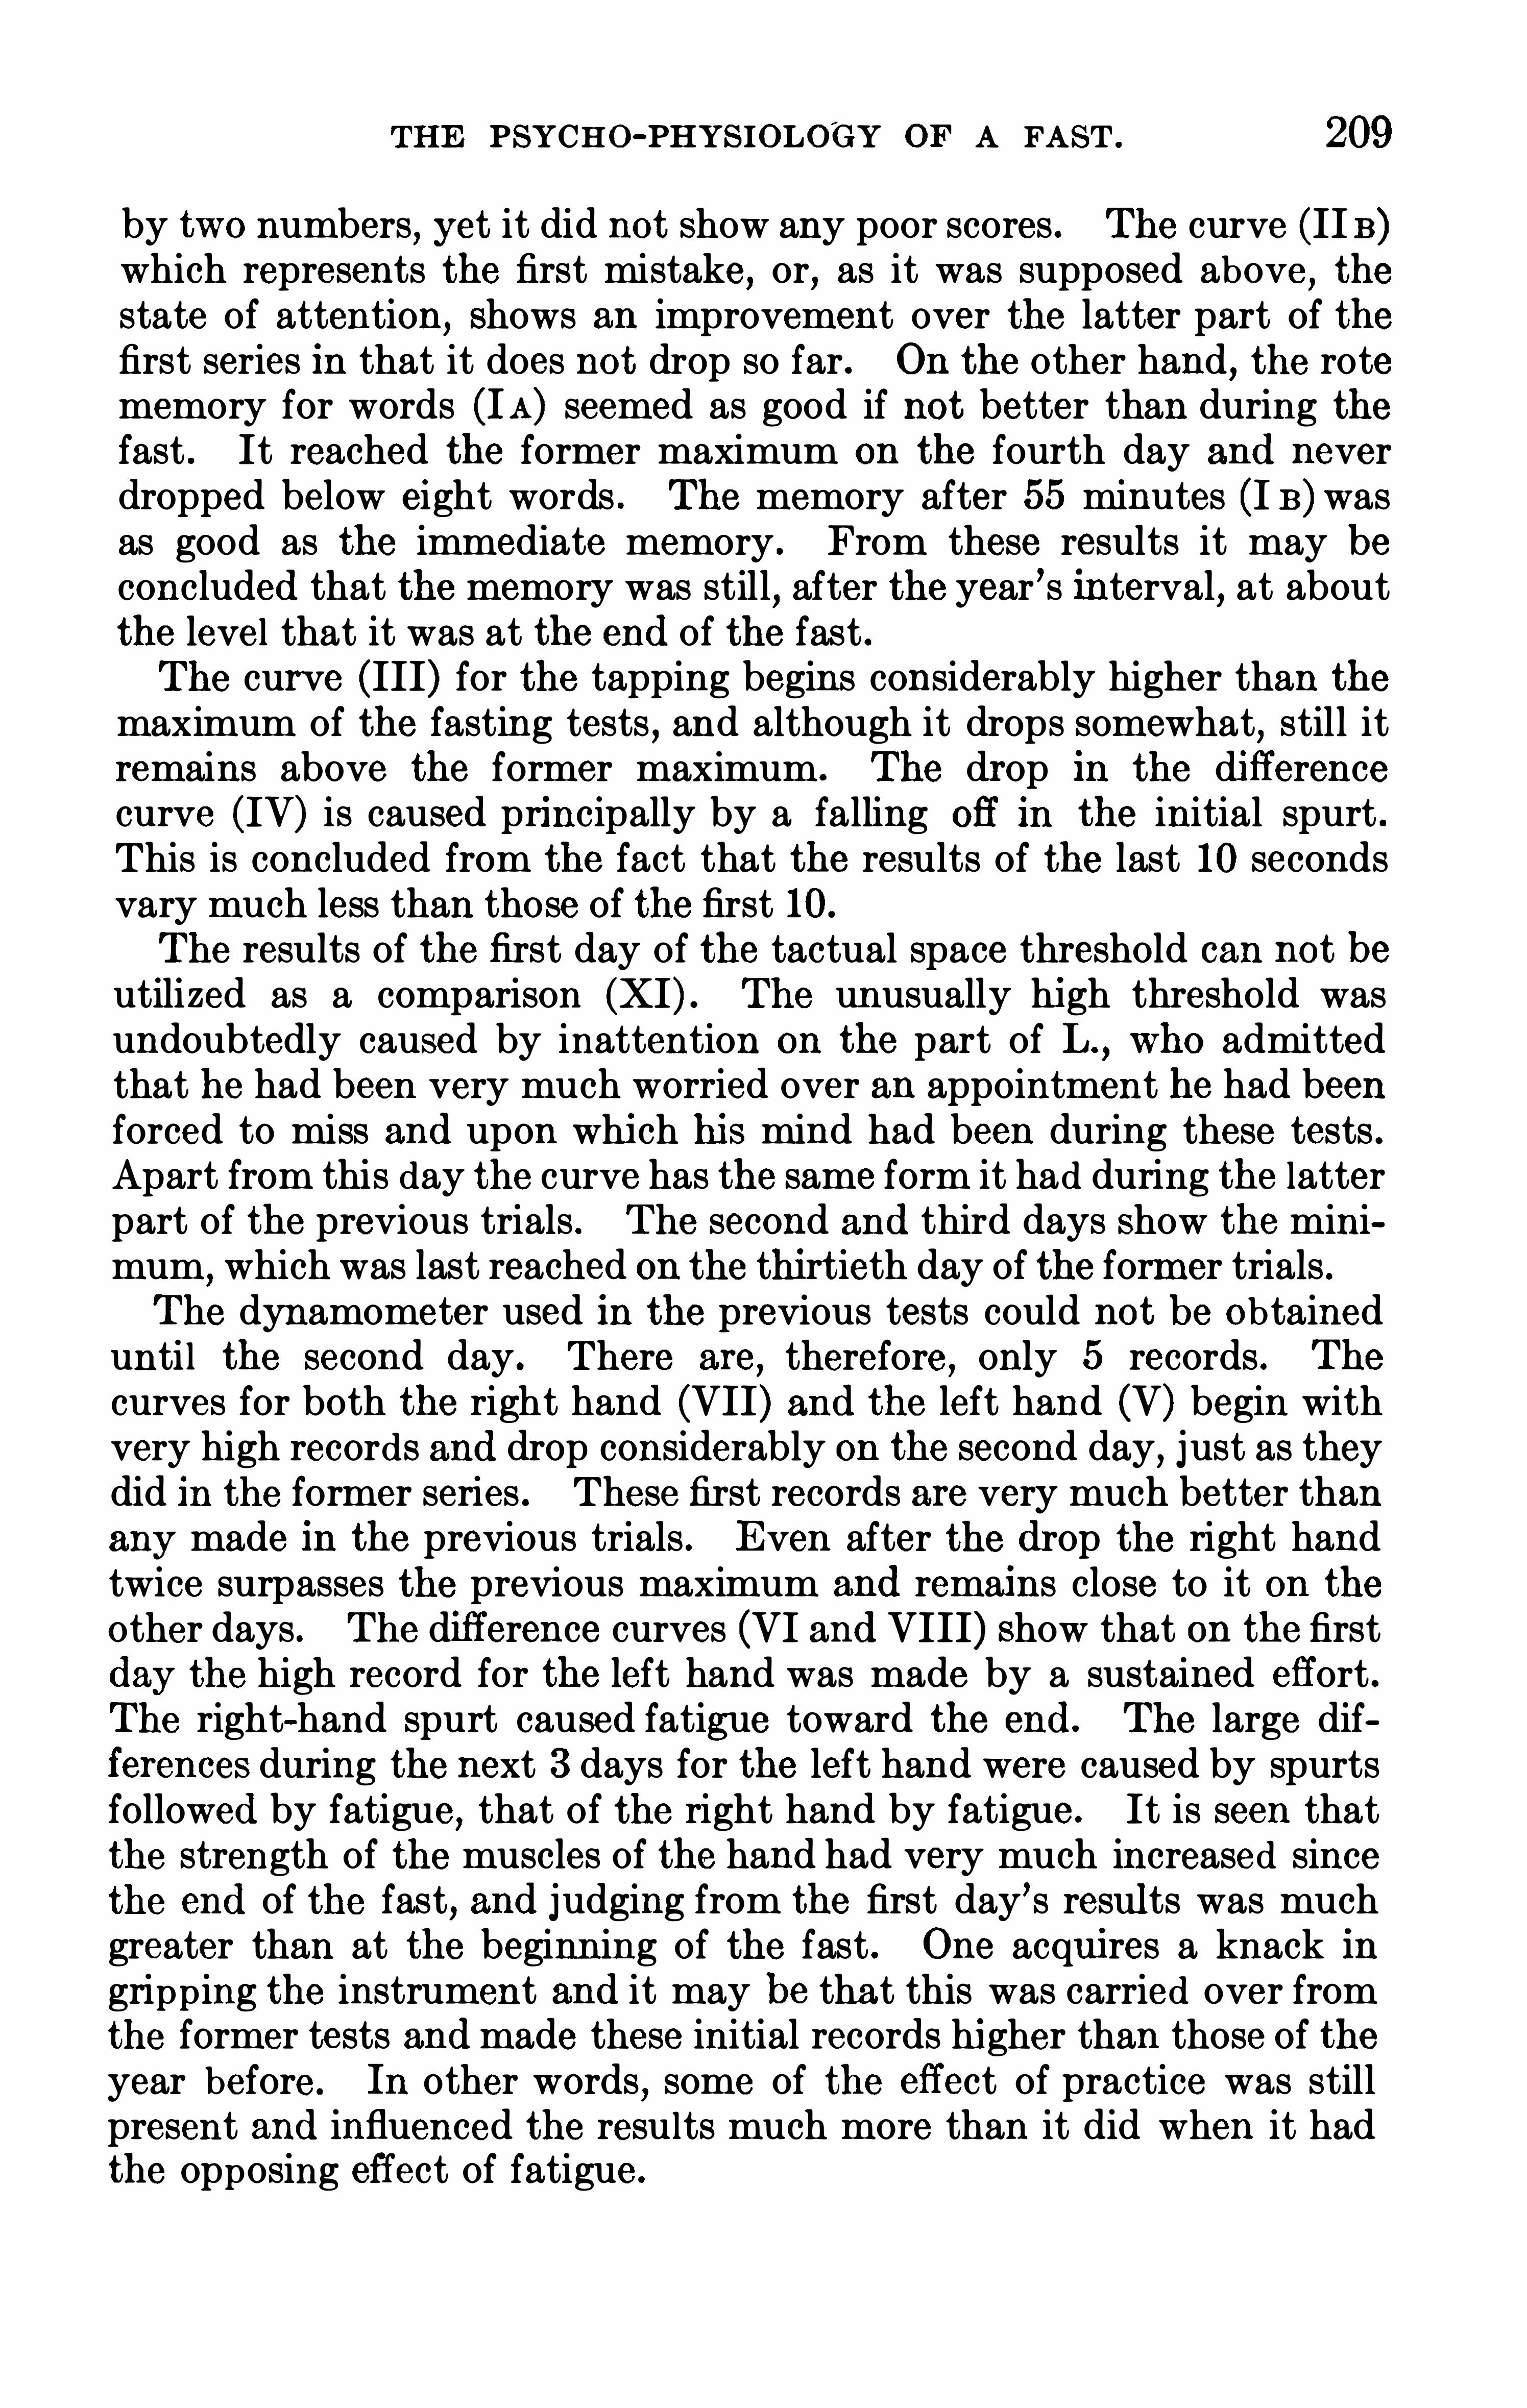
THE PSYCHO-PHYS IOLOGY OF A FAST . 209
by two numbers , yet it did not Show any poor scores . The curve (II B)which represents the first mistake, or, as it was supposed above , thestate of attention, Shows an improvement over the latter part of thefirst series in that it does not drop so far. On the other hand, the rotememory for words (IA) seemed as good if not better than during thefast . It reached the former maximum on the fourth day and neverdropped below eight words . The memory after 55 minutes (I B)wasas good as the immediate memory . From these results it may beconcluded that the memory was still
,after the year ’s interval, at about
the leve l that it was at the end of the fast .The curve (III) for the tapping begins considerably higher than themaximum of the fasting tests , and although it drops somewhat, still itremains above the former maximum. The drop in the differencecurve (IV) is caused principally by a falling off in the initial spurt .This is concluded from the fact that the results of the last 10 secondsvary much less than those of the first 10.
The results of the first day of the tactual space threshold can not be
utilized as a comparison (XI) . The unusually high threshold wasundoubtedly caused by inattention on the part of L .
, who admittedthat he had been very much worried over an appointment he had beenforced to miss and upon which his mind had been during these tests .Apart from this day the curve has the same form it had during the latterpart of the previous trials . The second and third days Show the minimum
,which was last reached on the thirtieth day of the former trials .
The dynamometer used in the previous tests could not be Obtainedunti l the second day . There are
,therefore , only 5 records . The
curves for both the right hand (VII) and the left hand (V) begin withvery high records and drop considerably on the second day, j ust as theydid in the former series . These first records are very much better thanany made in the previous trials . Even after the drop the right handtwice surpasses the previous maximum and remains close to it on theother days . The difference curves (VI and VIII) Show that on the firstday the high record for the left hand was made by a sustained effort .The right-hand spurt caused fatigue toward the end. The large differences during the next 3 days for the left hand were caused by spurtsfollowed by fatigue
,that of the right hand by fatigue . It is seen that
the strength of the muscles of the hand had very much increased sincethe end of the fast, and judging from the first day ’s results was muchgreater than at the beginning of the fast . One acquires a knack ingripping the instrument and it may be that this was carried over fromthe former tests andmade these initial records higher than those of theyear before . In other words
,some of the effect of practice was still
present and influenced the resu lts much more than it did when it hadthe opposing effect of fatigue .

210 A STUDY OF PROLONGED FASTING .
The free-association reaction time (XIII) begins at the low pointOf the last day of the previous series ; on the third day it reaches theshortest time of that series
, and again on the fifth day and on the lastday it falls almost one-fifth of a second below th is point . That is
,the
curve continues the descent it began in the middle of the former seriesin as regular a manner as if a year had not intervened . Inasmuch assome practice was necessary after so long an intermission
,it may be
said that the reaction times were better than they were at the end ofthe fast . The m . V . (XVIII) was second on the first day andsecond on the sixth
,with an almost steady decline .
The average reproduction time (XIX) is second for all the days ;this is very low, and although second was reached 3 times in theformer tests , it is safe to conclude that the reproduction times are atleast as good as they were at the end of the fast . In fact
,the average
for these days is better than for any 6 consecutive days of the previoustests . There was only one false reproduction and that was “ wrong”
for “ bad .
”In view of the fewness of the trials little would be gained
by an analysis of the results according to categories XIV,XV
,XVI ,
XVII . The noun and adjective curves are lower than the verb and
abstract curves. The quality of the reactions is about the same .
Evidence of a religious or mystic complex is as plain here as in the previous results . “
God” was the reaction for “ adore
,
” “ worship,
”
“unseen,
” “ mercy,” “ Divine
,
”and
“ Infinite ,
” “ supreme ” gaveBeing ,
” “ sacred” gave “ church,
” “ adorable gave “ saint,
” “ life”
gave “eternal ,
”and “ ornament” gave “ church . There were no very
long reaction times . In connection with the previous complex it maybe mentioned that death” was the reaction word for “ fear.”1
The reaction noun-verb (XX) begins at the average of the thirtysecond day of the former series and on the third and fourth day reachestheminimum of the next to the last day of the long series . The averageOf these days is very much better than that of the last days of the fastseries or even of the first days, so that there is no doubt of an improvement in these reactions .The cancel lation test (XXI) begins at about the point of the twentyseventh day and the time gradually decreases
,but at the six th day
has not reached the rapid time of the last fast day ; but judging fromthe slope of the curve, one would expect it to do so shortly , so that onecan conclude that the mental functions necessary for this test are inabout the same state they were at the end of the fast . There were only6 mistakes, 4 of them being on the first day.
1It was though t that a year’s interm ission would make the Old lists equivalent to new ones and
as one would then be sure of having the lists of th is series of th e same quality with th ose of the
form er, th e old lists were used on the first day , but 7 of the 20 reactions were th e same as th ose
made a year ago , so that new lists were made.

212 A STUDY OF PROLONGED FASTING .
could say with equal weight that the fatigue following the unusualexertion was the cause . Only the most reliable introspection on the
part of the subject before and after each test could have given strengthto such explanations , and both the lack of time and training on the partof the subject made such a procedure impossible .
It did seem possible , however, to make an exception of the days onwhich L. took a drive or was allowed on the roof and that if the curvesshowed an agreement in their fluctuations on these days an unequivocalexplanation could be found . The drives were taken on the fourteenth ,seventeenth, twentieth , twenty- second , twenty-fourth , twenty-ninth ,thirty-first, and thirty-second days ; the visits to the roof on the tenth ,fifteenth
,twenty-first
,and thirtieth days . As was stated above
,there
was no general agreement even on these days . In regard to the individual curves
,however
,the visual acuity curve seemed to Show the influence
of the drives . The best result in the visual acuity test was made on thefirst drive day and the curve always ascends on the drive days
,although
not always to a peak . It falls , however, on all but one day when a visitwas made to the roof ; that it rises on the drive days is contrary to whatone would expect and is difficult of explanation,
Since the subject ’s eyesshould
,if anything
,have been fatigued by the increased light . If there
had been a stimulation of the central processes causing a heightenedpower of discrimination, this ought to have influenced the other curvesas well.
GENERAL SUMMARY AND CONCLUSIONS.
The fact that a human being could live for a month or longer withoutfood had already been satisfactorily proved? Merlatti is reportedto have fasted for 50 days and Dr. Tanner for 40 days . The fast ofSucci2 is most similar to that of L . in that it was undergone for aboutthe same length of time and under similarly strict s cientific control
,
although never before had quite so many precautions been taken asin the case of L. Succi fasted for 30 days , but took pepton on the
twenty-seventh day. L . continued for one day longer, absolutelynothing but distilled water passing his lips during that time . Bothmen remained in good physical condition throughout and seemed atno time to suffer any unusual discomfort . It was with difficulty thatL . was persuaded to discontinue his fast on the thirty-first day.
Although Luciani doubted that Succi was mentally normal,general
Observations and the tests pointed to a sound mind in the case of L .
Both men were,naturally
,men of great determination and above all of
1E . Bardier, in his article La Faim (Ch . Ri chet’s D ictionnaire dc Physio logic , 1904 , 6 , p .
remarks in regard to vo luntary and invo luntary fasts : On pourra sc soumettre vo lontairement
aun jefine pro longé , comme l’
cxpé ricnce en a plusiers fois é té tentée . ct endurer asses facilement
les soufl'
rances dc la faim . Le beso in dc manger scra d’
autant m o ins douloureux, d’
autant plusfacile aSupporter qu ’ il suffira d’
un si gne pour etre mis en face d’
un succulent rcpas. Au contraire ,la faim scra beaucoup pluspé niblc , scsmanifestations beaucoup plusdouloureuses, Si l’on sc cro itdans un naufrage , dans unc cxpé dition— voué a unc inanition complé tc sans espoir dc salut.”On page 6 , in reference to forced fasting.be furth er says:
“
La luttc quc l’
on est obli gé dc soutcnircontre les causes memes dc cette inanition augm ente la sensation dc faim .
"
2Das Hungern, by Luigi Luciani . Translated into German by Dr. M. O . Fraenkel. 1890.

THE PSYCHO- PHYS IOLO’
GY OF A FAST . 213
implicit faith and confidence in their idea . L . believed fasting to be apanacea for al l ills and the very fact that he is of that type of man whocan narrow his horizon about an idea and stubbornly resist all invasions gave him the best equipment for the fight against the naturaldemands of the flesh . Such a type
'
ofmind can not be cal led abnormal,
although it is unusual . The feeling of hunger was at all times, even
during the first stages of the fast , denied by L . This statement shouldnot be disbelieved, even though frequently there is extreme discomfort ,which those who fast tell us only disappears after the second or thirdday
,as in the case of Succi . With L . and perhaps with other fasters
this feeling of hunger may have been suppressed from the beginningby auto-suggestion. The fact of the deep- ingrained faith in the fastmakes this plausible?The condition of Succi’shigher mental processes was only ascertainedby general Observation . These Observations agree with those madeupon L . There was at no time any symptom of hallucination orlack of clearness in the thought processes . Luciani writes :
“Am 13 Hungertagewo llte ich seine Ausdauer bez . geistiger Anstrengungen
auf die Probe stellen,indem ich ihm schwierige Oder unlOsliche metaphysische
und theosophische Fragen vorlegte und bestandig Einwiirfe gegen seine Antworten erhob , in der Absicht, seinen Verstand zu ermi
’
rden . Ich muss gestehen ,
nicht bemerkt zu haben, dass sein Geist dabei mehr ermi’
rdete als der
j edes andern Sterblichen von gleichem Bildungsgrade und gleicher Begabung,
wenn man ihn solchergestalt martert .” 2
L . is a man of a much higher level of intel ligence and intellectualtraining than Succi . At all times during the fast he was very eager toenter into discussions upon abstract sub jects such as the value of theEsperanto language , the political conditions in Malta , the possibi lityof mental telepathy, and theories of spiritism,
as well as the value offasting . It could not be Observed that there was any diminution ofhis argumentative powers or lack of lucidity of expression . Whenaroused to counter argumentation he showed the same energy in replyat the end as at the beginning of the fast .Succi
’s muscular strength as wel l as his sensory acuity was ascer
tained in a manner somewhat similar to the method employed for L . ,
and the results wil l be compared in the following summary and inter
pretation of results :
(1) In the dynamometer tests made upon Succi it is impossible tote l l from the text how many trials were made daily . As the curves for
1E . Bardier , in criticizing Bernheim .writes : Au sens Oh l’
cntendBernh eim , les jeuneurs qui scsoumettent al
’
inanition ré sistcnt facilement, tout S implem ent par le fait d ’une auto-suggestion .
Discutant en particulier le jeune dc Cetti , il admet que cc dernier -tout en n'
é tantpasun hysterique
s’
est suggestionné . Il dem eure convaincu qu ’ il conservait toute sa force physique , ‘ccla suffit pourréaliser lc ph é nom éne ; l ’ idec fait l'actc ; il s’cxalte , il s’entrafne , il sc nourrit de son idée , il se
m ontre avec complaisance a. sec visiteurs, il jouit de son triomph e ; l’ esprit dom ine le corps ;ctc .
’
L e jefineur , par sa vo lonté , arrive a résister a”
l’
habitude de manger ; il obéit a se
conscience qu i le soumetal’
abstinence , m ais certainement sa vo lonté do it etre incapable dc provoquer la suppression d'une sensation .
"
La Faim in Ch . Rich et ’sDictionnaire dc Physiologic , 1904 ,
6 , p . 10. See also footnote 3 , p . 19 1 of th is publication .
2Luciani , Das Hungern . German translation by Dr. M . O . Fraenkel, 1890 , pp . 68—69 .
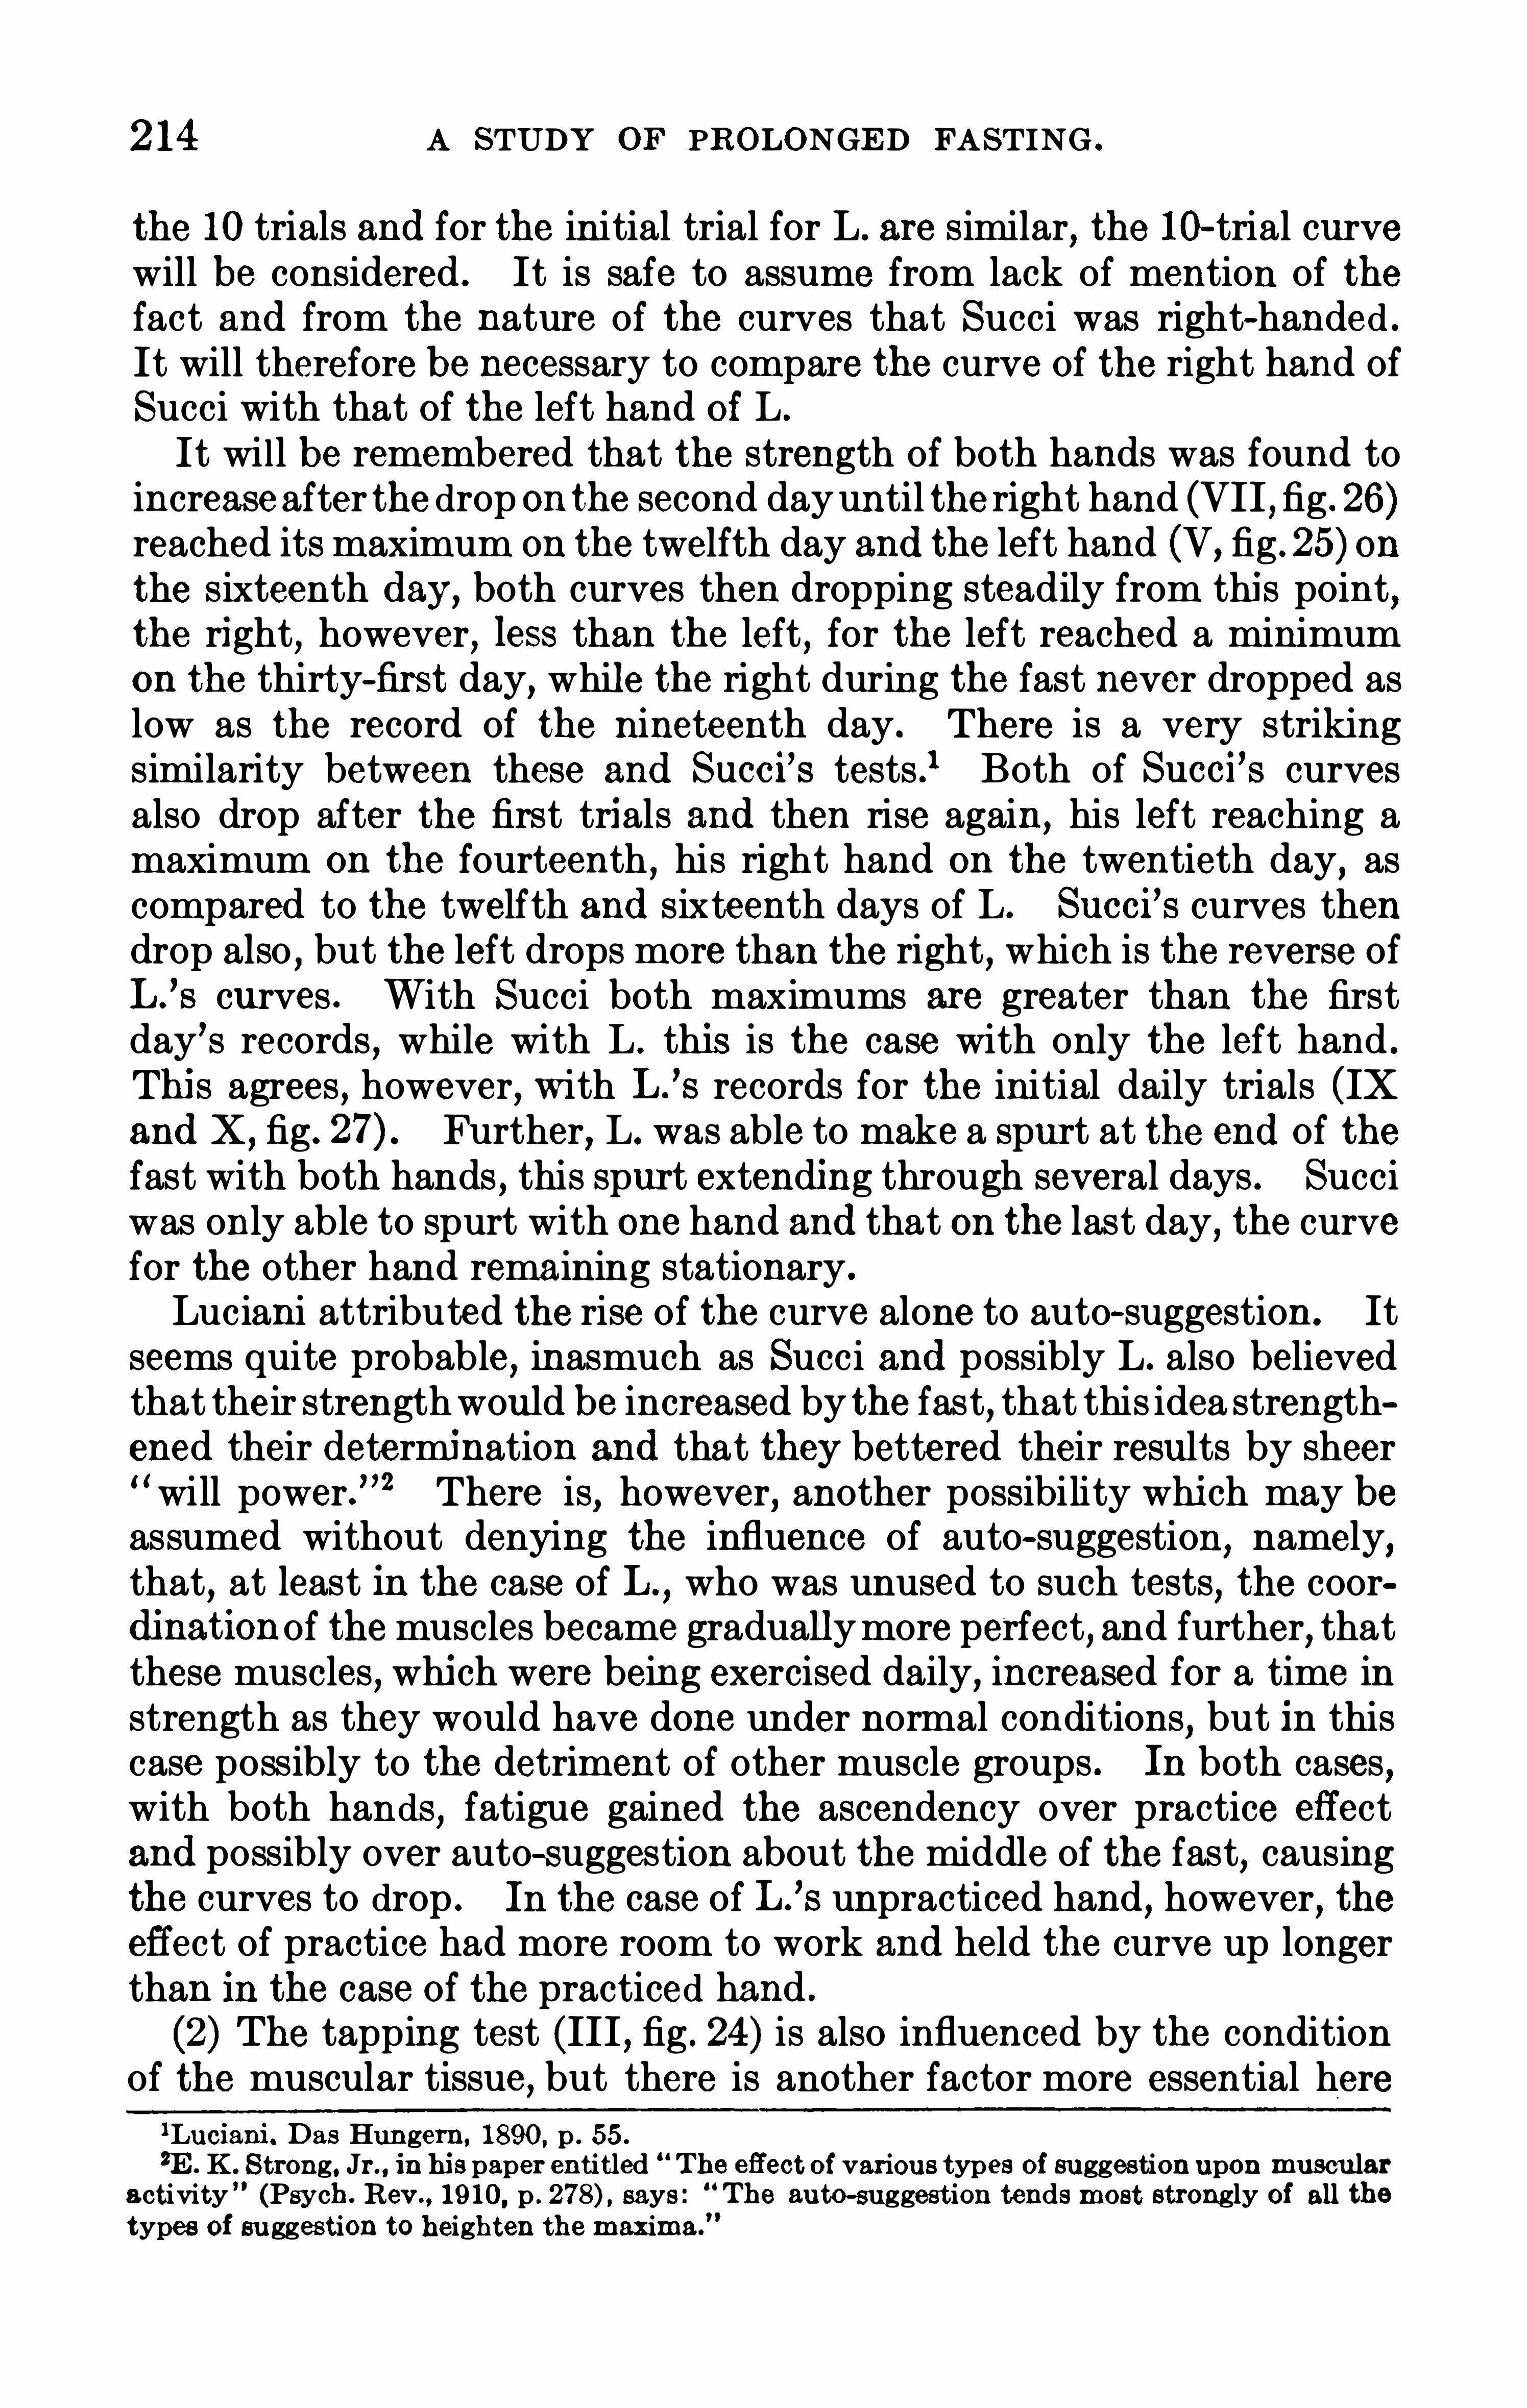
214 A STUDY OF PROLONGED FASTING .
the 10 trials and for the initial trial for L . are similar, the 10- trial curvewill be considered . It is safe to assume from lack of mention of thefact and from the nature of the curves that Succi was right-handed .
It will therefore be necessary to compare the curve of the right hand ofSucci with that of the left hand Of L .
It wi l l be remembered that the strength of both hands was found toincrease after the drop on the second dayuntil the right hand (VII , fig . 26)reached its maximum on the twelfth day and the left hand (V,
fig .25) onthe sixteenth day , both curves then dropping steadily from this point ,the right , however , less than the left , for the left reached a minimumon the thirty-first day, while the right during the fast never dropped aslow as the record of the nineteenth day. There is a very strikingsimilarity between these and Succi
’
s tests ? Both of Succi’s curvesalso drop after the first trials and then rise again, his left reaching amaximum on the fourteenth , his right hand on the twentieth day
,as
compared to the twelfth and sixteenth days of L. Succi’s curves then
drop also,but the left drops more than the right
,which is the reverse of
L .
’s curves . With Succi both maximums are greater than the first
day’s records , while with L . this is the case with only the left hand .
This agrees , however, with L .
’s records for the initial daily trials (IX
and X ,fig. Further, L. was able to make a spurt at the end of the
fast with both hands , this spurt extending through several days . Succiwas only able to spurt with one hand and that on the last day
, the curvefor the other hand remaining stationary.
Luciani attributed the rise of the curve alone to auto-suggestion. Itseems quite probable, inasmuch as Succi and possibly L . also believedthat their strengthwould be increased by the fast, that this idea strengthened their determination and that they bettered their results by sheer“ will power.”2 There is, however, another possibility which may beassumed without denying the influence of auto- suggestion, namely,that
,at least in the case of L .
, who was unused to such tests, the coordinationof the muscles became graduallymore perfect, and further, thatthese muscles, which were being exercised daily, increased for a time instrength as they would have done under normal conditions, but in thiscase possibly to the detriment of other muscle groups . In both cases ,with both hands
,fatigue gained the ascendency over practice effect
and possibly over auto-suggestion about the middle of the fast, causingthe curves to drop . In the case of L .
’s unpracticed hand , however, the
effect of practice had more room to work and held the curve up longerthan in the case of the practiced hand .
(2) The tapping test (III , fig . 24 ) is also influenced by the conditionof the muscular tissue , but there is another factor more essential here
lLuciani. Das Hungern, 1890 , p . 55 .
2E . K. Strong, Jr. , in hispaper entitled Th e efl'
ect of various types of suggestion upon muscularactivity ” (Psy ch . Rev. , 1910, p . says : “
The auto-suggestion tendsmost strongly of all thetypes of suggestion to heighten the maxima.

216 A STUDY OF PROLONGED FASTING .
(3) The threshold for tactual- spacc perception (XI , fig . 28) decreasedsomewhat as the fast progressed . It was on the average much betterduring the last half than the first half of the series . Similar tests weremade upon Succi upon a number of different parts of the body, but onlyon 3 days , before the fast , on the fifteenth day, and on the twenty-ninthday . On some parts of the body there was an increase, on other partsa decrease . Luciani believed the difference in the 3 days due to differences in degree of attention. On that part of the body correspondingmost closely to the spot used in these tests , i . e. ,
the lower third of thevolar side of the forearm,
there happened to be a rather large decreasein the threshold , the three thresholds being respectively 16, 11 , and10mm ? Authorities differ as to whether practice lowers the thresholdin tests performed under normal conditions. Dresslar,
2 for example,found that practice had a considerable effect . Solomons3 found thatif the subject is not informed of his errors there is no effect of practice .
In the above te sts the subject was never told of his mistakes and“ vexier ” trials were introduced at frequent intervals and in no specialorder
, yet there was a lowering of the threshold . This maybe andprobably is due to several causes . A physiological causewould be a decreasein the fat , thus exposing the nerve endings and making them moresensitive . On the psychological side increased attention, which wefind indicated in other of the tests , would lower the threshold for discrimination. Also , as the tests progress the image of the criterion usedbecomes cleared . From what is known of the process of perception
,
this is a most important factor in explaining the above effect of practice.
The physiological change is the only one which could be attributedunequivocal ly to the fast . The central change occurs in series undernormal conditions .If
,as has often been assumed , the tactual space threshold test is a
measure of mental fatigue, then it must be concluded that there is noindication Of such fatigue during the fast .
(4 ) The visual acuity (XII , fig . 28) showed an astonishing betterment . From 17 feet as the distance of clear vision for the particulartest card employed , the curve ascended rapidly to 37 feet on the fourteenth day and, although there is a falling off, 36 feet is the record forthe last day of the fast .If it were not for the maximum of 37 feet midway in the series,
the improvement woirld be comparatively a steady one . One explanation that suggests itself is that the possible change in intra-oculartension caused the eye
-ball to change its shape . Unless his glasseswere not the proper ones for him ,
however, a change in the eye shouldcause more rather than less difficulty as long as he wore his glasses .Further, the suddenness of the rise seems to vitiate such a theory .
‘Luciani , Das Hungern, 1890 , p . 64 .
2F. B . Dresslar . Studies in the psychology of touch . Am . Journ. Psych . , pp . 3 13—368. 1894 .
3L . M . So lomons. Discrimination in cutaneous sensations. Psych . Rev. , pp . 24 6—250. 1897 .

THE PSYCHO-PHYS IOLOGY OF A FAST . 217
A satisfactory explanation seems diffi cult to find. It might be saidthat the 37- foot record was made by chance . This also seems precluded by the fact of the number of previous steps in which 10 correctanswers were given and from the evidence of confidence displayedby the subject?Succi
’s eyes were examined with the ophthalmoscope and his acuity
measured before the fast and on the fifteenth and twenty-eighth days ofthe fast
,but no change was detected ? If L . had happened to be
measured on the third , sixteenth , and one of the days toward the end ofthe series only
,the change would have been thought as negligible as in
the case of Succi . In all such tests where the daily fluctuation is considcrab le three tests inamonthare not sufficient uponwhich to base a judgment as to the change in sensory acuity or higher mental processes .
(5) The rote memory for digits (II , fig . 23) showed very little change .
There is a slight suggestion of immovement during the first half ofthe series . Judging from the curve which indicates the point at whichthe first mistake wasmade (II B) , one can say that therewas a gradualimprovement in this respect , especially in the first half of the series
,
which is probably in part due to a betterment in the pcrception of thespoken word
,but especially to an increase in attention, it becoming
more sustained as the fast progressed . The rote memory for sensewords (IA) showed a greater improvement than did that for digits .Here probab ly the practice effect consisted in the forming of associations between the words . The most marked improvement of all isin the retention after a longer period of time, i . e. , after 55 minutes (I B) .This is probab ly also due, in part at least, to the more frequent formingof associations . Besides, the repetition of the same task through somany days undoubtedly strengthened the determining tendency, i . e.
,
the determination taken at the time of memorizing for the words to appear in consciousness again ,
it remaining either in consciousness orsubconsciousness during the interval . According to L .
’S statement,
hismind did not revert to the task within the hour . Indeed, the othertests followed each other so rapidly that this would have been a dithcult thing to do .
Experiments upon memory under normal conditions also Show the
effect of practice,as evidenced by an appreciable increase in the mem
ory span which may continue for a period of 2 months .3
1Th e subj ect did not knowwhether h e was righ t or wrong or how many correct answers constituted a threshold , so that th e results could no t have been prearranged by him ; and if they couldhave been he would not have allowed such a good reco rd on the fourteenth day . Th e h igh threshold on th e last day is obviously due to his unusually poor physical condition (when, if at any tim e ,
one m igh t be justified in speaking of a lack of effort) .2Lucnani, Das Hungern, 1890 , pp . 66—67 .
3T . L . Bo lton . The growth ofmemory in schoo l ch ildren. Am . Journ. Psych 1 892 , pp. 362—380 .
G . Muller and F. Schumann. Experimentc Beitrage zur Untersuchung dcs c ach tniss,Zeitschr . f . Psych 6 , 1894 , pp . 81- 190 , 257- 339 .
W . H Winch . The transfer o f improvement in m emory in school-children. British Journ .
Psych 1908 , pp . 284— 293 .
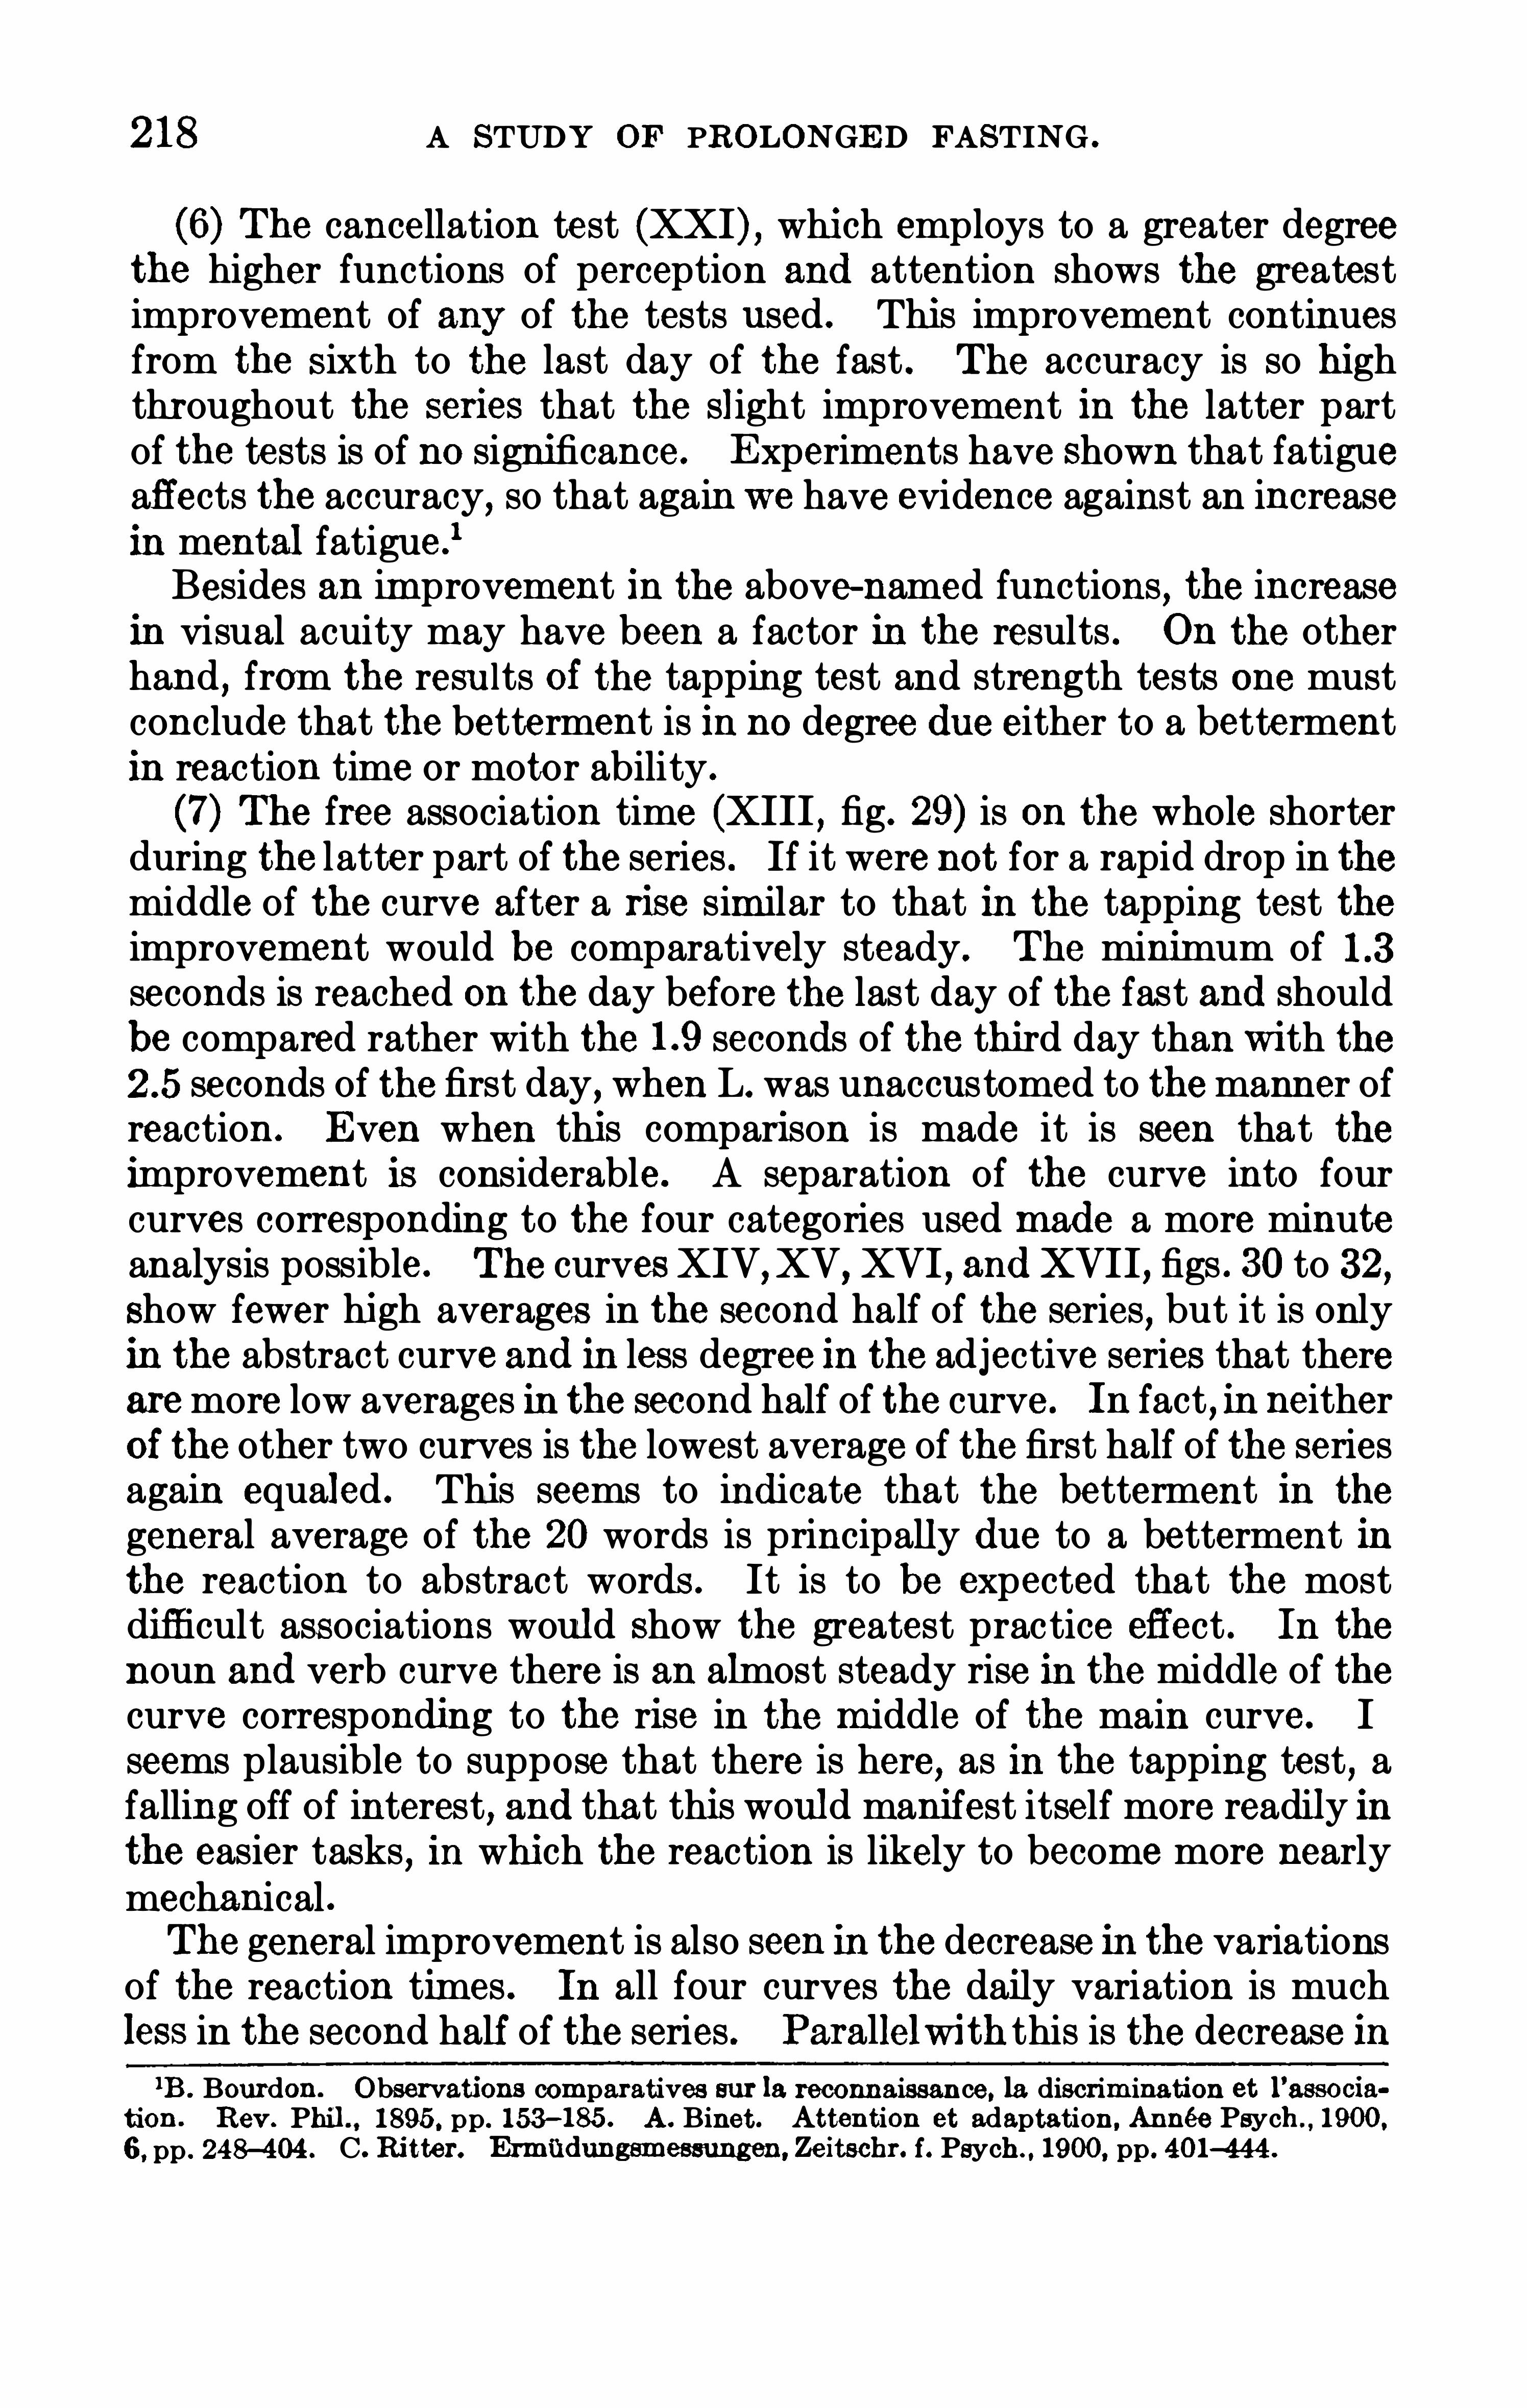
218 A STUDY OF PROLONGED FASTING .
(6) The cancellation test (XXI) , which employs to a greater degreethe higher functions of perception and attention shows the greatestimprovement of any of the tests used . This improvement continuesfrom the Sixth to the last day of the fast . The accuracy is so highthroughout the series that the slight improvement in the latter partof the tests is of no significance. Experiments have Shown that fatigueaffects the accuracy, so that again we have evidence against an increasein mental fatigue?Besides an improvement in the above-named functions , the increase
in visual acuity may have been a factor in the results . On the otherhand , from the resu lts Of the tapping test and strength tests one mustconclude that the betterment is in no degree due either to a bettermentin reaction time or motor ability.
(7) The free association time (XIII , fig. 29) is on the whole shorterduring the latter part of the series . If it were not for a rapid drop in themiddle of the curve after a rise similar to that in the tapping test theimprovement would be comparatively steady. The minimum ofseconds is reached on the day before the last day of the fast and shouldbe compared rather with the seconds of the third day than with theseconds of the first day, when L. was unaccustomed to themanner of
reaction . Even when this comparison is made it is seen that theimprovement is considerable. A separation of the curve into fourcurves corresponding to the four categories used made a more minuteanalysis possible. The curvesXIV,XV, XVI , andXVII, figs . 30 to 32,Show fewer high averages in the second half of the series, but it is onlyin the abstract curve and in less degree in the adjective series that therearemore low averages in the second half of the curve . In fact , in neitherOf the other two curves is the lowest average of the first half of the seriesagain equaled . This seems to indicate that the betterment in the
general average of the 20 words is principally due to a betterment inthe reaction to abstract words . It is to be expected that the mostdifficult associations would Show the greatest practice effect . In the
noun and verb curve there is an almost steady rise in the middle of thecurve corresponding to the rise in the middle of the main curve . Iseems plausible to suppose that there is here , as in the tapping test , afalling off of interest , and that this would manifest itself more readily inthe easier tasks , in which the reaction is likely to become more nearlymechanical .The general improvement is also seen in the decrease in the variations
of the reaction times . In all four curves the daily variation is muchless in the second half of the series . Parallelwith this is the decrease in
1B . Bourdon Observations comparatives sur la reconnaissan ce , la discrimination et l’
associa
tion . Rev. Phil 1895. pp. 153—185 . A . Binet. Attention ct adaptation, Anné c Psych 1900 ,
6 , pp . 24 8—4 04 . C. Ri ttcr. Ermfidungsm essungcn , Zeitschr. f. Psych . , 1900 , pp. 4 01-4 44 .

220 A STUDY OF PROLONGED FASTING .
It will be remembered that the tests range from those involving
principally the muscle groups to those depending in a higher degreeupon central factors . The test depending most on the muscularreactions , i . e.
,the strength test
,Showed a falling Off . The tapping
test , which also involved the muscles but in which the rapidity of reaotion was a more important factor, showed no improvement . AS soonas one turns , however, to the sensory discriminations one notices anincreased efficiency, which is probably due either to a change in theperipheral organs or central processes , or both . Finally all the testsinvolving the higher processes of attention, perception, and associationShow improvement . In a word , there was a loss in muscular strengthdue probably to loss of tissue, a possible gain in sensory acuity and adecided increase in the efficiency of all the central processes . It wouldbe premature to say that the improvement is the direct result of theprolonged abstinence from food , as similar improvement has beenObserved in such tests under normal conditions ,due entirely to the effecto f practice . It can be stated , however, with some degree of certainty ,that the complete abstinence from food for 31 days had little effectupon the higher mental functions , which were able to develop throughpractice very much as they would have done under normal conditions .This agrees with the Observations upon the physiological conditions .
It has been found that during a fast the muscle tissues are the first tosuffer and the nervous tissues the last. From these results it seemsthat up to the thirty-first day the nervous tissues have not suffered .
These results also confirm in part the general observations made bythose fasting . It is frequently stated by them that they can do bettermental work . The results show that at least they can do approximately as well , and it is not at all unlikely that some can do better, for itmust be remembered that there is none of that sluggishness of themental processes directly after eating, when the digestive processes areat their height , and there is also absence of indigestion and the aftereffects of alcoho l and tobacco . That, on the other hand , as has beenO ften c laimed , they are able to do more muscular work and that theirpower of endurance is greater is in this case at least not true . Probablythe contrast of their actual resul ts compared with what they expectedwoul d happen to a man without food makes the result seem greaterthan it is . The claim that the senses are more acute has been verifiedas to the Visual acuity. It is hardly likely that the slight difference inthe tactual—space threshold would have been noticed by the faster?The question remains as to whether prolonged fasting is beneficial
or dangerous to the organism . This can only be satisfactorily answeredlL . stated that the heigh tened sensitivity for odorsmade walking on the streets of Malta during
his first fast positively unpleasant. Th e o ther senses were examined in the case of Succi and noappreciable change discovered . Luciani , Das Hungern, 1890.
Whipple (Manual of Mental and Physical Tests, Baltim ore , 1910 , p . in speaking of thee ffect o f practi ce in the aesthesiom cter test, remarks that Dresslar states :
“ This practice efl'
cct is
rapidly lost, being reduced very definitelywithin 8 days and completely lostwith in a month .
”

THE PSYCHO—PHYS IOLO'
GY OF A FAST . 221
after an exhaustive physiological examination extending over a longperiod Of time subsequent to the fast . The tests made after the l apseof a year permit, however, of some conjecture in this regard concerningthose functions at least which have been discussed in this paper.The strength test shows a great improvement over the former record .
L . exerted a pressure considerably greater than at any time duringthe long series . The record for the tapping test is also above the maximum of the previous record . The association test Shows a markedimprovement and the reproduction is also better, especially in that itvaries less
,and the retention of sense words has perhaps also slightly
improved . The tactual-space threshold and the rote memory for sensewords are about the same as at the end of the fast . Only in the case ofthe memory for digits and in the cancell ation test has the previousmaximum not been reached, but both of these results Show consistentlygood results . It may be stated , in short , that after an entire year’sintermission the curves continued practically from the point they hadpreviously reached , if not considerably above that point , without showing that loss of practice which might well have been expected . Theseimproved conditionsare, however, not necessarily traceable directly tothe beneficial effects of the fast . In regard to the association tests L.
has undoubtedly become still better acquainted with the English language, and in respect to the strength tests it must be noted that L . hasexercised his muscles daily , according to his report . In general he hasled a careful l ife, paying especial attention to his diet . The possibleeffect of climate and his new surroundings is also to be considered .
Finally, and most important , is the possibility that there was actually
a greater effect of practice in the first series than appeared in the
records,but that it was concealed by certain opposing effects of the
fast,so that the results of the later tests may not be quite what might
be supposed from a comparison of the records .It remains, however, an indisputable fact that , according to the tests
made,there was no lasting evil effect of the fast, either upon muscular
strength or mental activity .

222 A STUDY OF PROLONGED FASTING .
APPENDIX I.— DREAMS.
As has been already stated , L. was asked to recount the dreams he had hadduring the previous night . From these records those dreams are here givenwhich pertain to food . It wil l be seen that at one time he ate , at anotherrefused food, but in neither case was there evi dence of anything but a normalemotional reaction. According to the Freudian theory this absence Of anintense emotional state (there were no nightmares nor anything else in therecords indicative either of mental or bodily distress) means that the wil l
to fast was too strong to allow of any serious conflict of ideas. A
great part of the dreams are of a sexual nature and are not here given.
April 13 . I saw a basket covered with a white piece of cloth, whi ch Iimagined full of food . When I tried to uncover it several black rats jumpedout of it and frightened me .
I dreamed I was passing down one of our streets inMaltawith a paper bagunder my arm containing cheese-cakes for my daughter. I found myself ina state ofmental excitement and after going a certain distance I found that thelower end of the bag was opened and the cheese cakes were gone . In theirstead was awhite hand .
Apri l 19 . I dreamed I was in a shOp and on the counter there was a verybig ham ,
about 10 feet in diameter. The proprietorwas riding on the top of itwith a knife in one hand .
“It is avery good one ,
”he said . I answered ,
“ Ido not like it. Do you not know I am fasting?
” Then a friar came in and said,
I wil l take it in hisstead , because I like it. He took it and swal lowed it.April 21 . I dreamed I had been for a walk in the country. I went to a
country tavern and asked for something to eat. The proprietor gave me abeefsteak and some fried red fish . I ate themwith relish and asked what Ihad to pay . He told me and asked if that was too much. I said I didnot think so . In coming out of the tavern I saw a river full of these red fishand people were trying to catch them . I said ,
“You are fishing out all the
fish and if you continue you wil l not have anymore to eat.
’
APPENDIX II— COMPLETE SERIES OF ASSOCIATION TESTS.
April 1 1 , 1 919 April 12
Reaction S timulus Reaction Reaction
white
AverageAverage

224
Allow
Musi c
A STUDY OF PROLONGED FASTING .
April 22
Reaction
Average Averag e
money
AverageAverage
furniture
letter
eternal
AverageAverage

Advance
House
Wh ite
Vacant
Scratch
THE PSYCHO-PHYSIOLQGY OF A FAST .
government
Average
black
Average
sound
Average
Unclean
Rotten
PropositionImprovementInfamy(Competition)competence
Attraction
Imposition
E levation
Level
comm erce
actress
Average
news
Average
Average
225
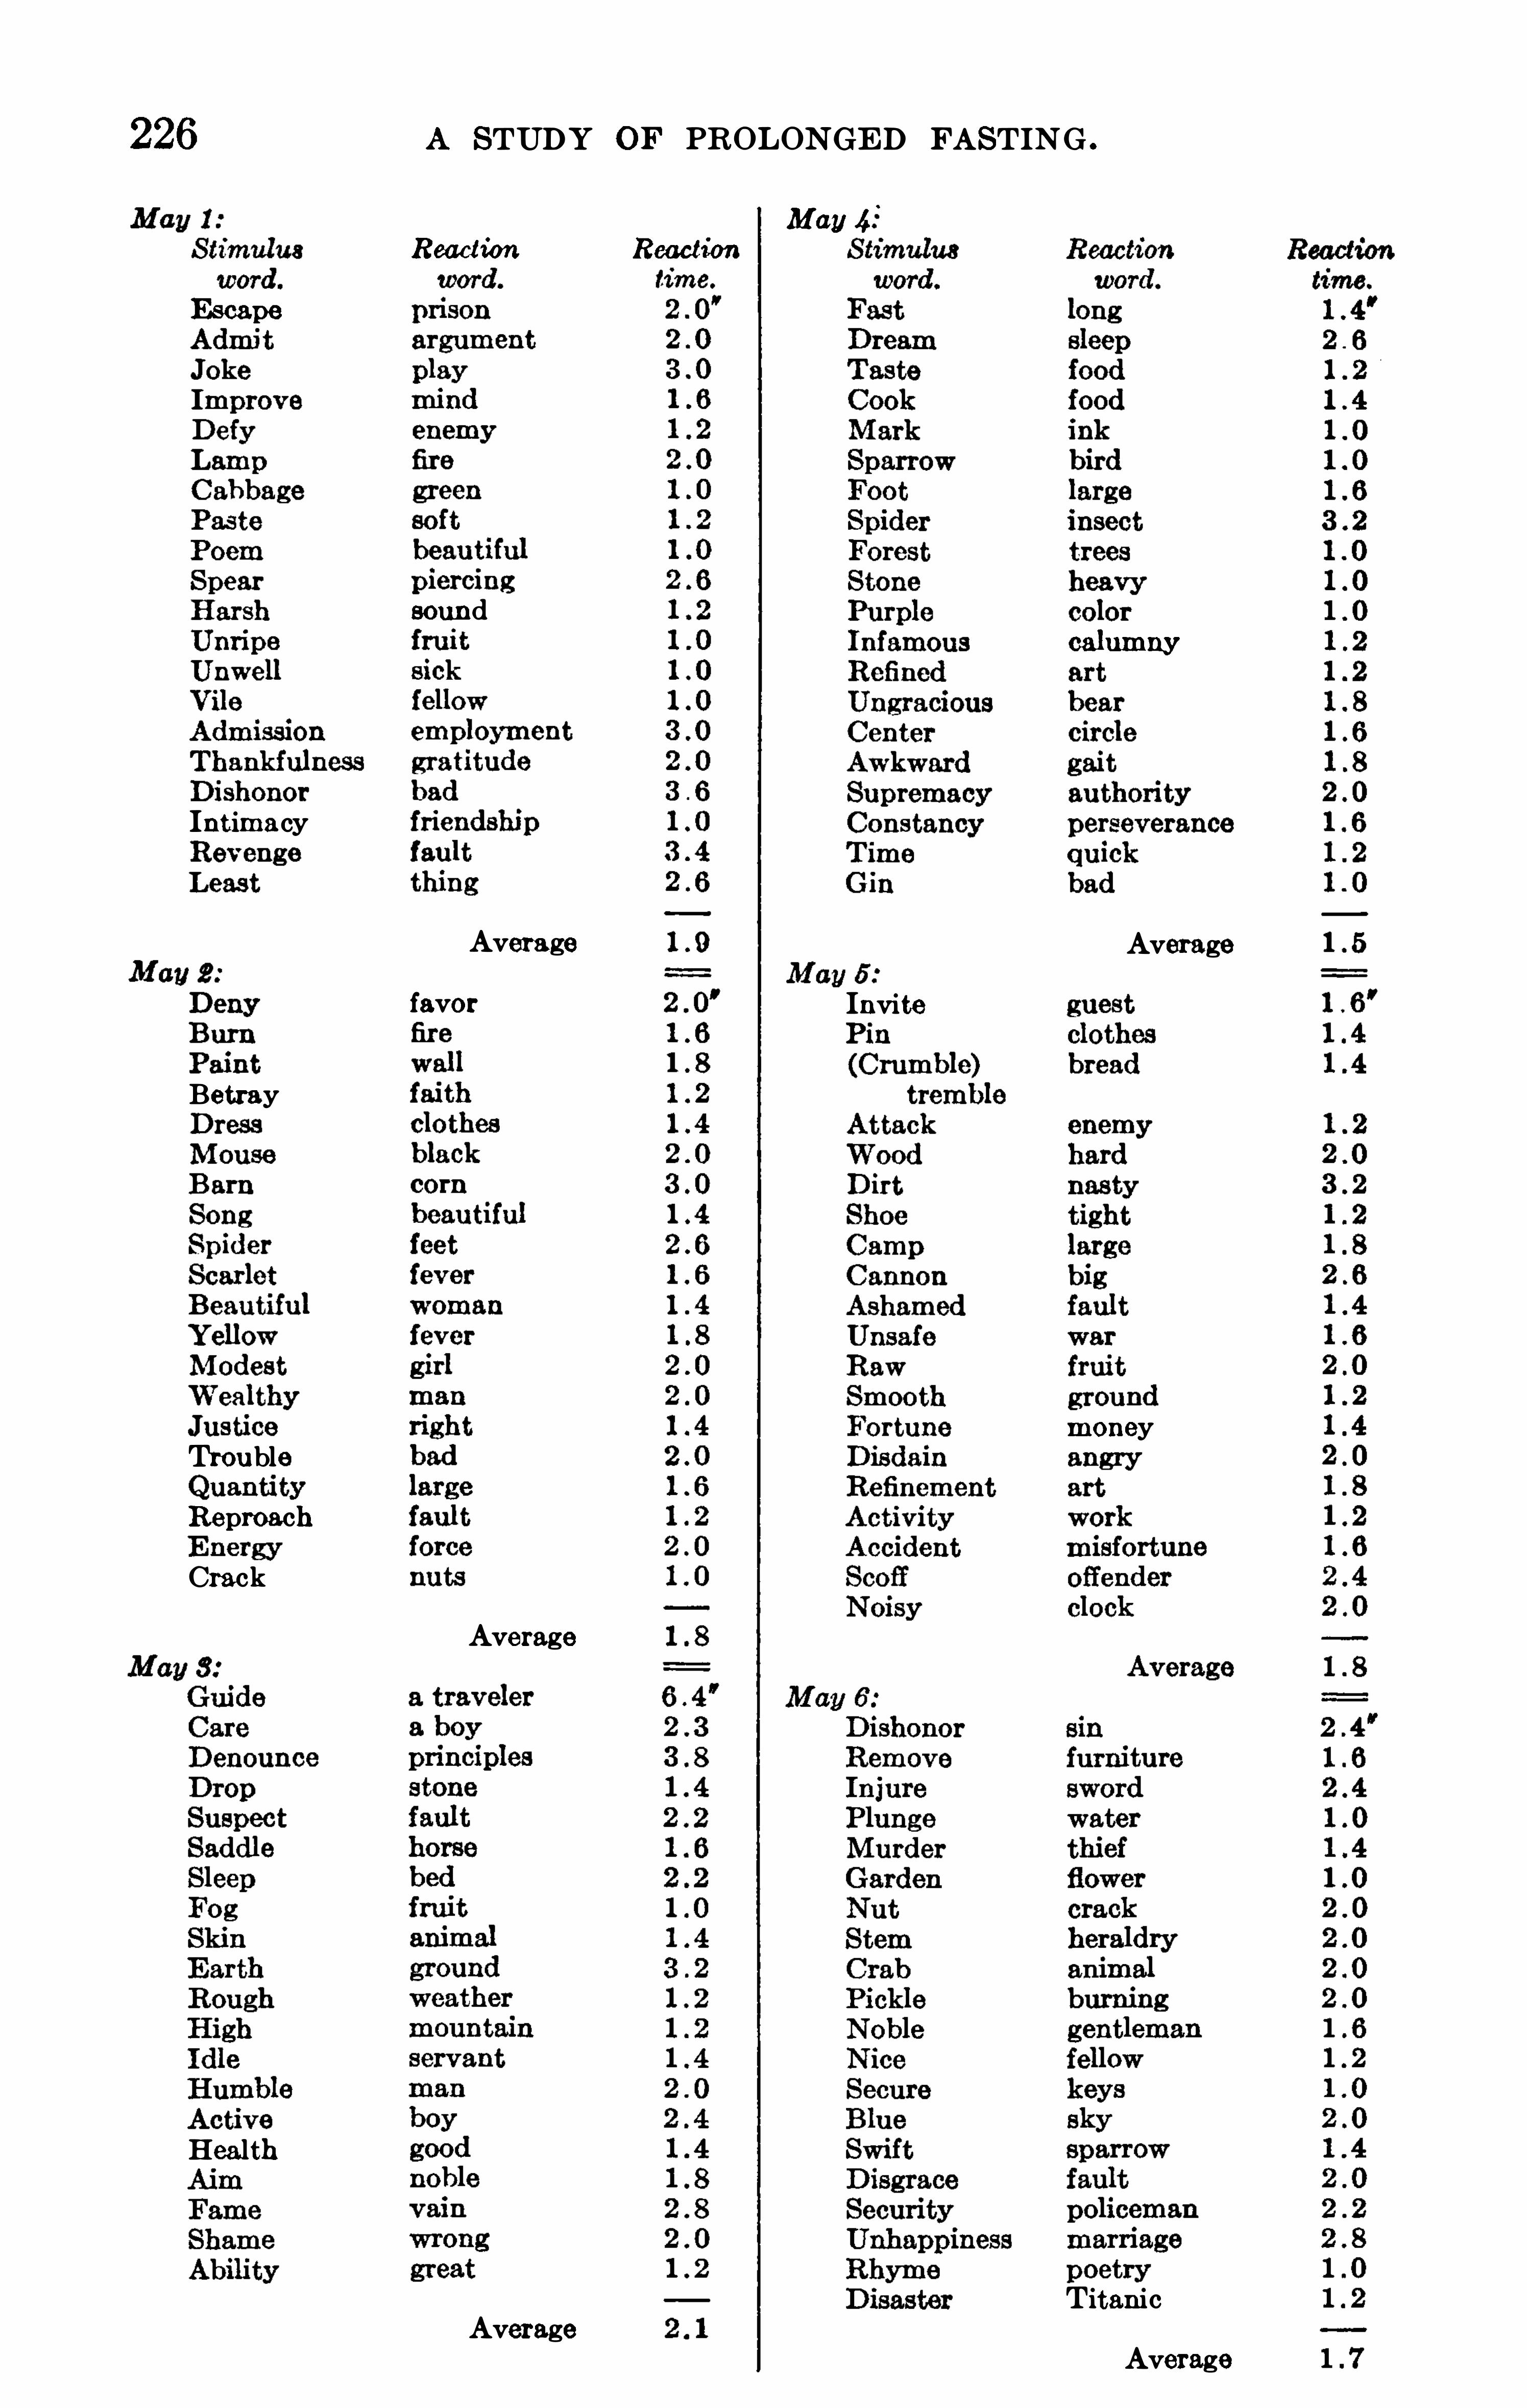
226
Intimacy
Betray
Trouble
Reproach
Crack
Health
A STUDY OF PROLONGED FASTING .
Read ion
sound
Average
favor
Average
Average
Reaction
Maul
Invite
calumm/
Average
money
Titanic
Average

228 A STUDY or PROLONGED FASTING .
May 18 June 2 , 1913
Reac tion Reaction
word.
sweet
white
Average Average
leathervegetable
church
Average Average
SmallThirsty
Impulsive
ProvocationContentment
Pro fanity
Average Average

THE PSYCHO—PHYS IOLOGY or A FAST . 229
June 6— Continued .
c tion Reaction
house
wave
leaves
Average
Sco ldstreet
Elbow
Moon
Average

FECES .
In the days preceding the fasting period , there was more or less regular defecation
,but the special interest in the feces in connection with
this fasting experiment has to do with the defecation immediately preceding the fast and that on the days following the fast . After theevening meal on April 13, L . had a large defecation
,as was noted ln
the history for that day . There was no defecation,however
,through
out the entire fasting period, as no feces were passed from the time ofthe defecation on April 13 until 5h30m p . m. on May 15 , i . e. , about8 hours after the first food had been taken. It was suggested to thesubject that it would be desirable, especially on the first day or two , toempty the lower bowel with a warm-water enema , but he preferred notto do this.
The defecation on May 15 was coincidental with a severe attack ofcolic occasioned by the taking of an excessive amount of acid fruits,which flooded the stomach and the intestinal tract . The defecation,
which was copious , contained a few hard , well-formed lumps of fecesabout 1 cm . in diameter and with a total length of cm . The restof the material was spongy and soft
,running like liquid when turned
from the vessel . The feces had a nauseating odor, necessitatingfrequent access to the outdoor air in transferring and handling thematerial . Another defecation took place about 8 p . m .
,a third shortly
afterward , and still another during the night . The feces were all of avery soft and liquid consistency, and of a light yellowish-brown color.As the hard material was obviously entirely different in nature from thesoft material it was removed , and probably this alone can here be considered as in any way approximating fasting feces . The second and
third defecations were tested with litmus paper and found to be stronglyacid
,probably due in part to the organic acid present in the fruit juices .
The fact that there were no feces throughout the 31 days of this prolonged fast is of special significance, as it is commonly stated that fasting men excrete from 2 to 5 grams of dry fecal material each day.
In the earlier experiments at Wesleyan University,no evidence was
found of what might be called strictly fasting feces . In the prolongedfasting experiment with L .
, since the last defecation prior to the fasttook place only a half hour after the last meal on April 13, at least aportion of the feces of May 15 might be expected to result from the foodon April that we find it difficult to determine what proportion,
if any , of thematerial defecated should be ascribed to the fasting period .
Unfortunately the exigencies of the situation, especially in V iew of thei l lness of the subject , made it impracticable to preserve and preparethese feces for a microscopical examination. This is much to beregretted, as some light might have been thrown upon their source.
The amount was , however, extremely small, as the total air-dried

OBSERVATIONS UPON THE BACTERIAL INTESTINAL FLORA OF ASTARVING MAN.
Br ARTHUR I . K ENDALL .
The question of the composition of the normal bacterial flora ofadult man has never been satisfactorily settled , although the consen
sus of opinion appears to be that B . coli is the form most commonlyfound . The observations recorded below
,while not conclusive,
furnish information which tends to show that at least three organismsmay persist in the intestinal tract for a month after all food is withheld ,and in this sense these bacteria are noteworthy. The history of thecase needs no comment here
,other than to state that the subject had
no food for 30 days prior to the taking of the sample herein reported .
The material for study was obtained from an enema of sterile physiological salt solution, 300 c .c . in all, which was injected into the rectum,
retained for approximately 5 minutes, and recovered in almost fullvolume . The return fluid (collected in a sterile container, with appro
priate precautions) was turbid , with but little odor, practically colorless , and, except for a very small amount of cell detritus , free fromparticulate matter. No fecal material was recovered .
The fluid was plated in plain agar , in a dilution of Turin -
tr, while aportion (undiluted , and diluted fi rm) was examined for anaerobesand certain other bacteria . The latter tests were negative .
The total count on agar plates (in duplicate) was 131 and 133 colonies, respectively, giving a total of and bacteria
per cubic centimeter of washings . Of the 131 colonies , 4 were identicalculturally with B. mesentericus, 17 were found to be Micrococcus ovalisof Escherich
,and the remaining 1 10 were found to be B . coli. B . coli
was also recovered from fermentation tubes inoculated with 1 c .c . of a
Tam i-m dilution of the washings , thus confirming the count by theplate method for this organism.
These results , while not striking, are interesting for two reasons :
(1) Certain bacteria appear to be ab le to live upon the intestinalsecretions , even when all food is withh eld for at least a month .
(2) It appears to be impossible to steri l ize the intestinal tract bysimp le starvation . Th is latter consideration should be of clinicalinterest
,since it is customary in certain diseases to try to “ starve out”
bacteria from the intestinal tract .232

EXCRETION THROUGH THE SKIN.
So great is the total excretion from the body, in the respiration,urine
,
and feces , that aside from the sensible perspiration,the skin as a path of
excretion is rarely considered in any discussion of the loss of bodymaterial . But leaving the sensible perspiration entirely out of con
sideration ,the skin plays an important part , for there is cutaneous
respiration,including both the absorption of oxygen and the excretion
of carbon dioxide ; there is a very considerable insensible perspiration,
which in its strictest meaning refers to the vaporization of water fromthe skin surface ; and there are the excretions of both nitrogenousmaterial and chlorides through the skin .
Although the excretion of gaseous and solid material through theskin of the fasting man would normally be expected to be at a minimum
,it seemed desirable , in order to establish sharp balances of the
nitrogen and particularly of the salts , to determine carefully the cutaneous excretion of soluble nitrogenous materials as well as the sodiumchloride excretion. It was not possible to measure the cutaneousrespiration of our subject in any of the forms of respiration apparatusused in the fasting experiment
,for in the calorimeter the cutaneous
respiration is measured with the pulmonary respiration, and with therespiration apparatus no provision is made for the measurement ofthe cutaneous respiration .
The excretion of the nitrogenous material and chlorides through theskin as the fast progressed was
,however, of particular significance , and
arrangements were made for determining these . By nitrogenousmaterial is meant not the dead cuticle, but the excretion of watersoluble material
,chiefly in the form of urea . In order to determine
this accurately,the body of the subject was given a thorough washing
before the fast . He was then Sponged with distilled water and afreshly extracted and dried cotton union suit was placed upon him .
At the end of the week the union suit was removed , the subject wasagain sponged with distilled water, and another freshly extracted anddried cotton union suit was given him. The union suit which had beenremoved was then carefully extracted with distilled water and theextract water evaporated after the addition of acid . The water inwhich the subject had been bathed was also saved and evaporated.after the addition of acid . The entire operation was in the skilledhands of Mr . T . M . Carpenter . By this procedure it was expectedthat the persp iration accumulating during the week would be absorbedby the cotton union suit and the soluble solids , including salts , urea,o r other material
,would be extracted by the distilled water .
The nitrogen was determined by the Kje ldahl method . The chlorinewas determined by titration with silver nitrate and sulphocyanate .
233

234 A STUDY or PROLONGED FASTING .
The total amount of nitrogen and chlorine found each week is givenin table 22, in which it is seen that the nitrogen ranged from gramin the first week to gram in the last week , and the chlorine from
gram and gram for the first two weeks to gram in the lastweek .
It will be noted that as much as gram per day of nitrogenin water- solub le materia l may be excreted through the skin during thefirst week of fasting and that in all probability this method determinesthe minimum rather than the maximum amount , since unquestionablythere is a continual transformation of urea to ammonium carbonatewith a loss of ammonia . On the other hand
,it is probab ly true that
the secretory activity of the skin decreased somewhat as the fast pro
gressed, as is evidenced by the values for both nitrogen and ch lorine .
This loss of nitrogen through the skin has special significance in con
nection with so-called “nitrogen-balance experiments .”
TABLE 22 .- Cutaneous excretion of nitrogen and chlorine in experiment with L .
Date . Chlorine .
0 0 0 0 0
1Th e subject was bathed on th e evening of April13 and at the end of each week thereafter.
It has previously been shown1 that during severe muscular work asmuch as 200 milligrams of nitrogen may be excreted through theskin per hour. If
,therefore
,the excretion of nitrogen in a fasting exper
imcnt with minimum activity amounts to gram or more per day,it is obvious that nitrogen-balance experiments which do not take intoaccount this loss through the skin will not give accurate results . Iam unaware of any determinations of this kind made on a fasting man,
although Zuntz and his cc—workers on Monte Rosa recorded the loss ofnitrogen and chlorine through the skin in their experiments on the highAlps .2
The amount of chlorine excreted through the skin of L. was relativelysmall
,being approximately from 50 to 60 mi l ligrams per day in the
first 2 weeks of the fast . During the fourth week of the fast only1Benedict, Journ. Bio l . Chem 1906 , l , p. 263 .
1’Schwenkenbecher and Spitta (Arch . f. exp . Path . 11 . Pharm . , 1907 , 56 , p . 284 ) found aboutgram each of nitro gen and sodium ch loride per 24 hourswith a healthy person in bed. Taylor
(Journ. Bio l. Ch em . , 191 1 , 9 , p . 21) found wi th two m en at work but no visible perspiration perday gram sulphur , gram phosphorus, and gram nitrogen in one case and thecorresponding figures for the other were and

URINE.
Urine analysis has in the past decade undergone a striking revolutionas a result of the development of unique and exceedingly accuratemethods by Folin . Formerly clinical examinations of urine includedurea determinations , usually by the hypobromite method , and qualitative or roughly quantitative estimations of phosphates
,chlorides
,
etc .,but to-day the intelligent clinician deals only with the 24—hour
excretion of the various urinary constituents. The introduction ofthe Kjeldahl method did much to advance our knowledge of the constituents of the urine by giving us information as to the total organicnitrogen
,but it remained for Folin to show us the methods for the
partition of the nitrogen in the urine and its significance . The ammonia
,urea , uric acid , creatinine, and creatine 1n the urine then began to
be of much greater signifi cance than was the total nitrogen ; but m allthese advances in the development of urine analysis , and particularlyin the interpretation of the results , we find stress invariably laid uponthe nitrogenous constituents . To such a degree is this true that weare inclined for the most part to think of the urine solely as a path fornitrogen excretion.
Our previous experience with fasting subjects, however, has shown usthat in the urine we have not only indices of the protein katabolism
,
but that with acetone , diacetic acid , and B—oxybutyric acid present,we have indices regarding the defective fat katabolism ; furthermore,the inorganic constituents
,such as chlorine, phosphorus , sulphur, and
the alkaline bases,give us evidence as to the mineral metabolism, the
sulphur excretion also having an importance in interpreting the proteinkatabolism. It was therefore essential to study the urine of our fastingsubject not only from the standpoint of protein katabolism, but likewise from every other possible standpoint, so that complete analyseswere necessary . In carrying out such a study of the fasting urine
, we
have depended more largely upon the results of our former study offasting subjects1 than in any other part of the research .
2
GENERAL ROUTINE OF COLLECTION AND SAMPLING.
In order to give us as much information as possible about the previous dietetic habits of this man
,particularly for the few weeks prior to
lBenedict, Carnegie Inst. Wash . Pub. 77 1907 , pp. 34 5—4 19 .
2After the pages of th is book were in page proo f, my attention was called to the article fromAoyama
’
s clinic in Tokio , by Watanabe and Sassa, entitled “
Die Harnanalyse wahrend des zweiWochigen Hungerns eines Mannes
”(Zeitschr. f. B iol . , 1914 , 64 , p . issued from Munich on
August 27 19 14 , but not received h ere until late in November. It is thus impo ssible to make anyc omm ents upon this interesting paper. The authors studied body-weigh t, measu rem ents of the
body, body-temperature , pulse , respiration, and th e blood , but laid special emphasis upon exten
sive urine analyses. Their findings are , for the most part , in full conform ity with those recordedh ere .
URINE . 237
the fasting experiment, L. was requested to measure and sample theurine each day from the first of April until he reached the NutritionLaboratory on April 10, preserving the samples with chloroform . Thishe did most carefully, his training as a pharmacist assisting him materially in carrying out the routine accurately. When it is considered thathe was traveling rapidly and while on the steamer was obliged to makeall his observations andmeasurements in the narrow confines of a stateroom having three other occupants, it will be seen that it is much tohis credit that the records were so carefully kept . Al though it was impossible to keep an accurate record
‘
of the amount of food eaten, and
particularly the kind and amount of the various proteins,a study of
these urine samples should give some information as to the normal consumption of protein by this individual .From the time of his arrival at the Nutrition Laboratory, the col
lection,measurement, and sampling of the urine weremade by members
of the laboratory staff. Particular attention was given to the urineexcreted during the fasting period , as it was especially important tostudy the entire output of the body at this time .
When the preliminary arrangements were made for the analyses andtheir assignment to the various members of the laboratory staff and itsco-workers , it soon became apparent that the number of determinationsnecessary would require a greater volume of urine than would ordinarilybe passed by a fasting man. It was therefore arranged , in accordancewith a suggestion made by Dr . Cathcart
,to provide the subject with a
liberal and constant supply of drinking-water. Furthermore , thesmallest volume of sample which would give accurate determinationswas carefully considered in order to obtain the greatest number of
results with the available material . Had it not been for the recentdevelopment of the new Folin methods, it is probable that muchvaluable data would have been lost . For example
,while formerly
300 c .c . or even more were required for the determination of the uricacid , with the new Folin method 5 c .c . would suffice . Many of thedeterminations of the ammonia as carried out by the new method werealso made with a relatively small amount of urine .
Before the subject came under observation the time of urinating wasmore or less irregular. During the three food days preceding the fast ,the subject urinated at irregular times , although ending each day at
approximately 8 a . 111 . During the fasting period,he was required
to empty the bladder immediately after coming out of the bed calorimeter in the morning, this being usual ly not far from 8 o ’ clock . He
again emptied the bladder shortly before entering the bed calorimeterat night . Wewere thus able to divide the urine into two periods, eachapproximately 12 hours in length . Use was made of this routine in thelatter part of the fast to study the apportionment of the nitrogen and
ammonia excretion between the day and night periods .
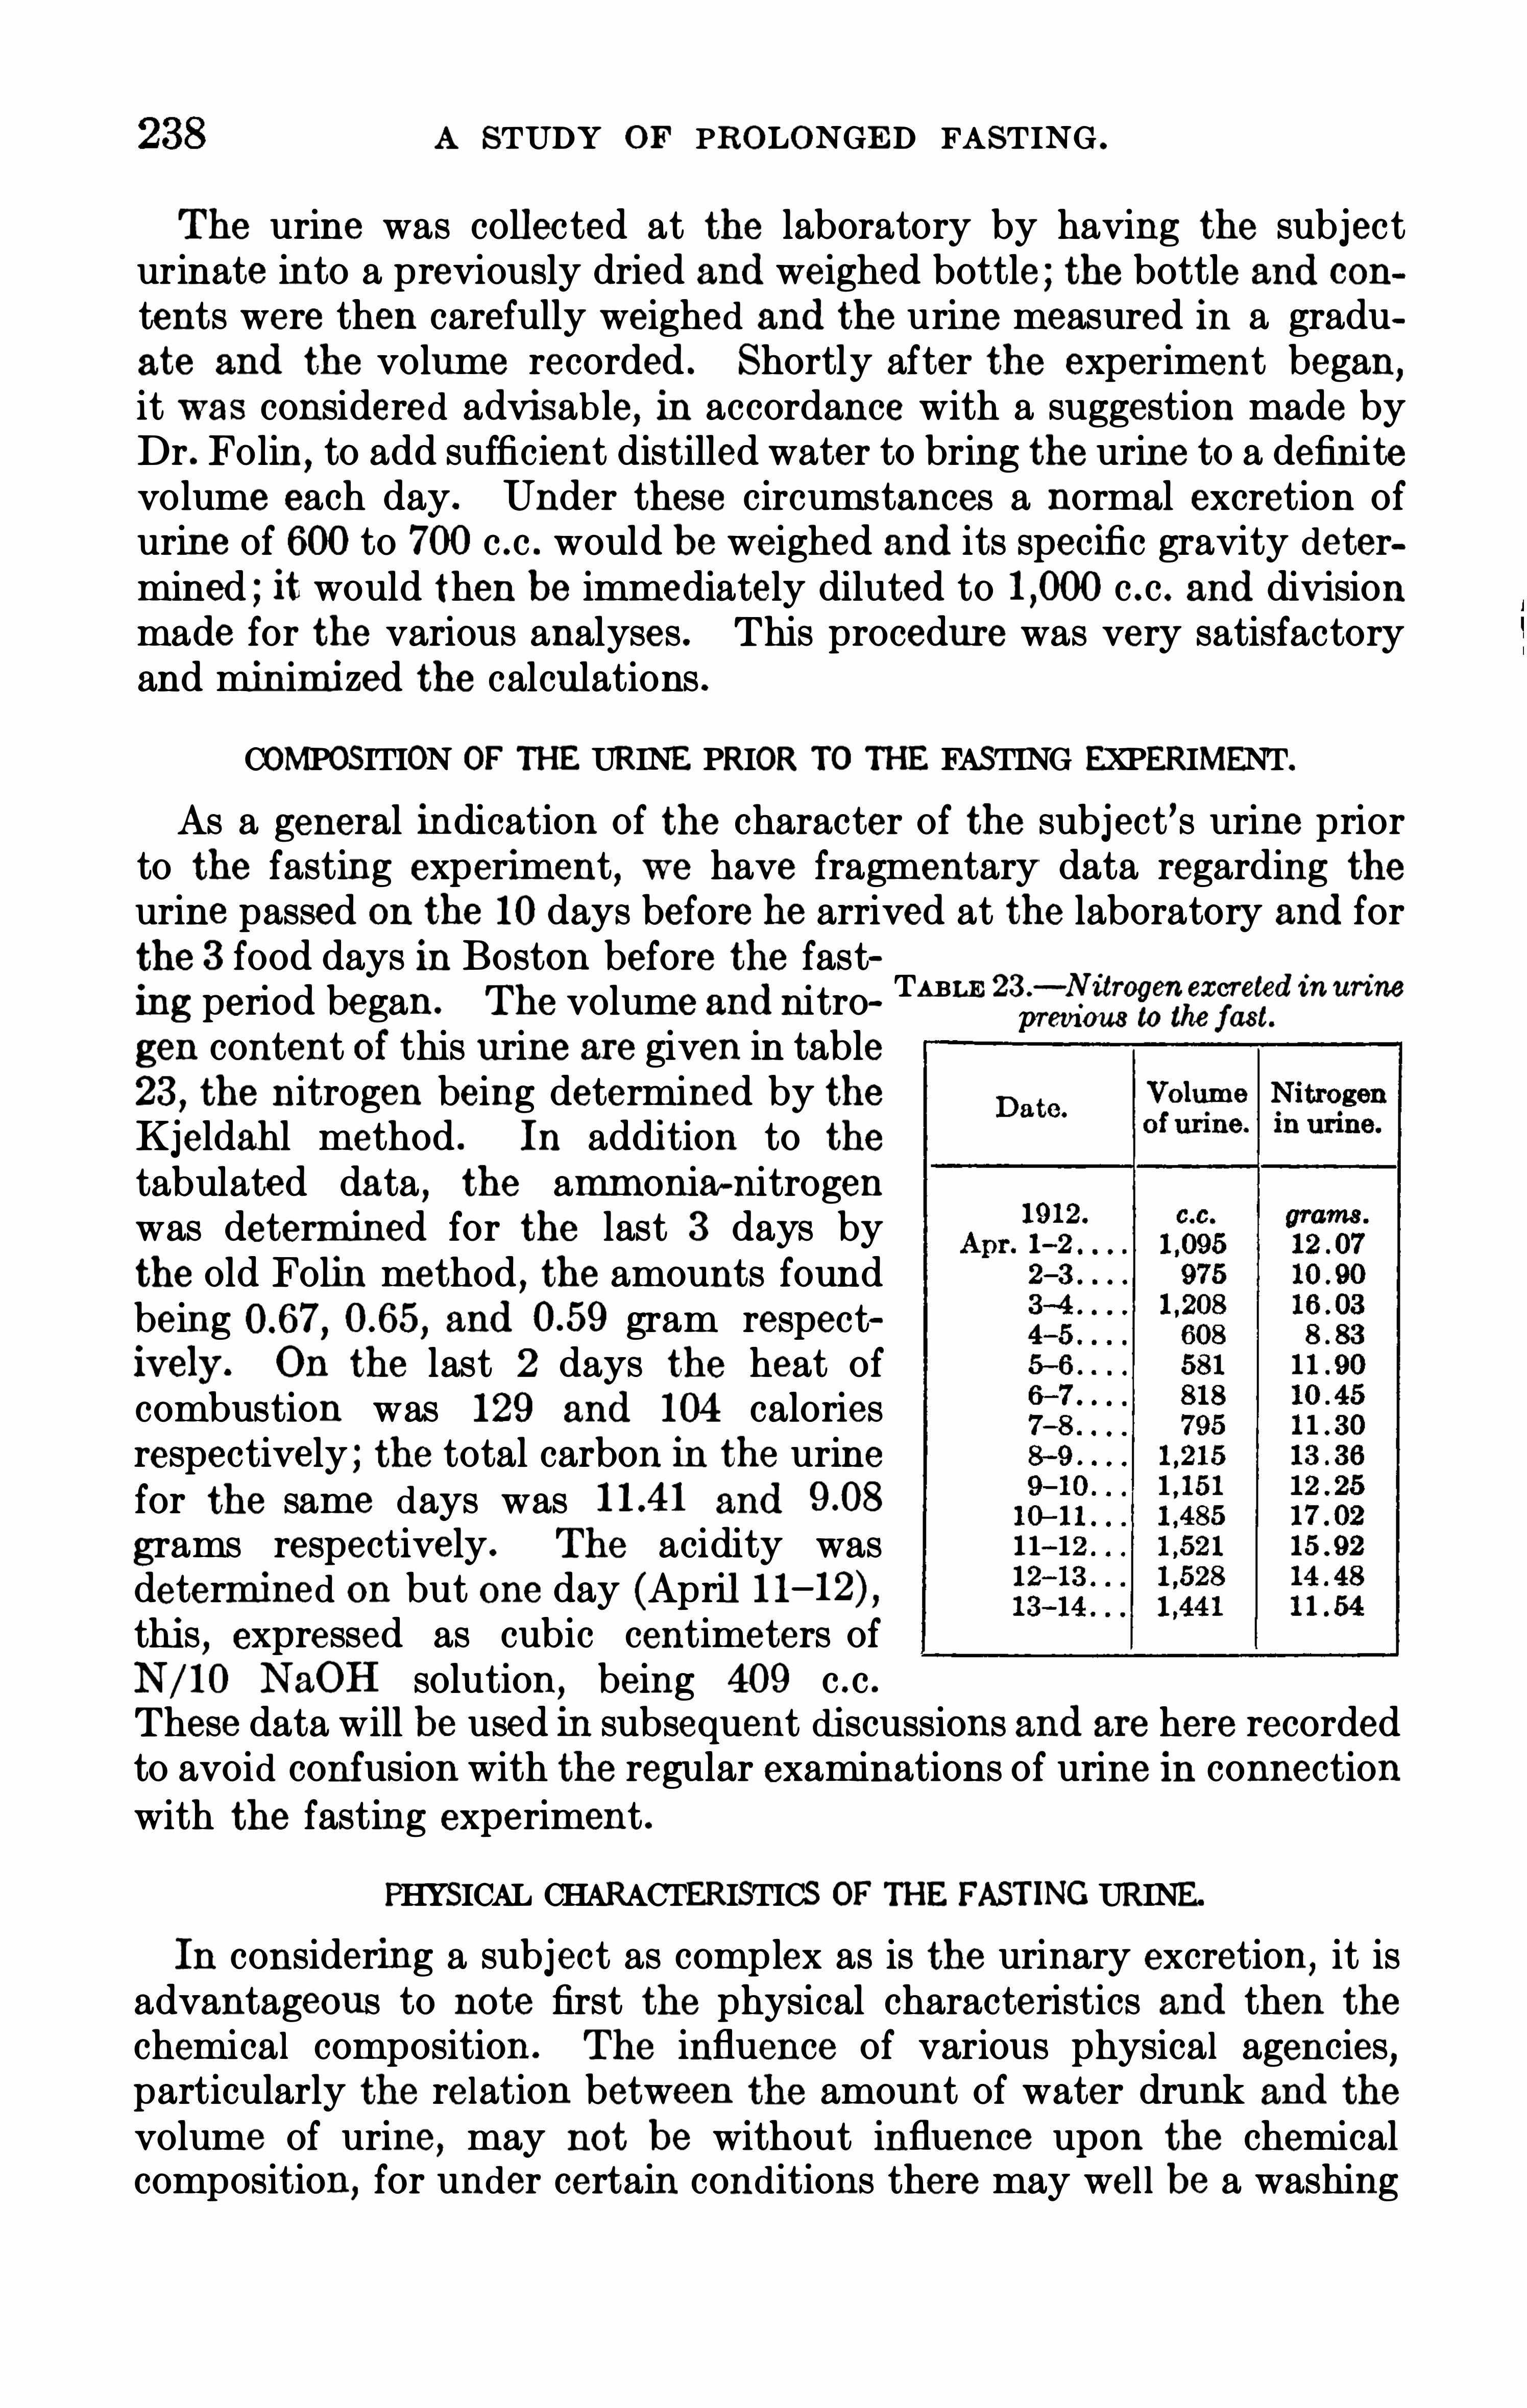
A STUDY OF PROLONGED FASTING .
The urine was collected at the laboratory by having the subjecturinate into a previously dried and weighed bottle ; the bottle and con
tents were then carefully weighed and the urine measured in a graduate and the volume recorded . Shortly after the experiment began
,
it was considered advisab le, in accordance with a suggestion made byDr . Folin, to add sufficient distilled water to bring the urine to a definitevolume each day. Under these circumstances a normal excretion ofurine of 600 to 700 c .c . would be weighed and its specific gravity determined ; it would then be immediately diluted to c .c . and divisionmade for the various analyses . This procedure was very satisfactoryand minimized the calculations .
COMPOSITION OF THE URINE PRIOR TO THE FASTING EXPERIMENT.
As a general indication of the character of the subject’s urine priorto the fasting experiment , we have fragmentary data regarding theurine passed on the 10 days before he arrived at the laboratory and forthe 3 food days in Boston before the fasting period began. The volume andnitro
gen content of this urine are given in table23, the nitrogen being determined by theKjeldahl method . In addition to thetabulated data , the amm onia-nitrogenwas determined for the last 3 days bythe old Folin method , the amounts foundbeing and gram respectively . On the last 2 days the heat ofcombustion was 129 and 104 caloriesrespectively ; the total carbon in the urinefor the same days was and
grams respectively . The acidity wasdetermined on but one day (April 11this
, expressed as cubic centimeters ofN/10 NaOH solution, being 409 c .c .
These data will be used in subsequent discussions and are here recordedto avoid confusion with the regular examinations of urine in connection
with the fasting experiment .
TABLE 23 .-Nitrogen excreted inurine
previous to the fast.
PHYSICAL CHARACTERISTICS OF THE FASTING URINE.
In considering a subject as complex as is the urinary excretion, it isadvantageous to note first the physical characteristics and then the
chemical composition . The influence of various physical agencies,particularly the relation between the amount of water drunk and the
volume of urine, may not be without influence upon the chemicalcomposition
,for under certain conditions there may wel l be a washing

240 A STUDY or PROLONGED FASTING .
VOLUME OF URINE .
In the publication giving the results of the earlier fasting research,
it was clearly brought out that no one factor affects the volume ofurine as does the volume of the water ingested , particularly when thevolume of drinking-water is over c .c . In the experiment withL .
,the water consumed was always under 1 liter and hence the influence
of the amount of the drinking—water on the volume of the urine was notso obvious .The volume of urine varied from 468 c .c . on April 15— 16 to 889 c .c .
on April 29— 30 . The average volume was 659 c .c . On April 24 —25,the volume of the water taken was changed from 750 c .c . to 900 c .c .
,
and it was expected that this change would materially affect the volumeof the urine . An inspection of the data shows , however, that it produced no marked effect upon the water excreted in the urine, at leastduring the first 3 days . Thus , on the 9 days from the second to thetenth days of the fast , inclusive , when the subject drank 750 c .c . ofwater daily, the average volume of urine was 590 c .c . per day and on the3 days from the eleventh to the thirt eenth days of the fast
,inclusive,
when the daily amount had been increased to 900 c .c .,the average
volume of urine per day was 54 7 c .c . Subsequently there was a distinct tendency for the urine volume to increase and on the next 10 daysthe average volume was 728 c .c . , an increase of 138 c .c . over the periodwhen 750 c .c . of water was taken , closely approximating the increase inthe amount of drinking-water. It is to be noted , however, that at thisstage of the fast , 900 c .c . of drinking-water was proportionately largefor th is man’s needs , since he had decreased materially in weight . In
the earlier fasting experiments, when several liters of water were takendaily
,the amount of water drunk unquestionably influenced the
amount of water in the urine excreted , but with the comparativelysmall amount taken by the subject L .
,the effect was evidently at a
minimum, and the absence of any flushing—out of the end-products of
protein katabolism simplifies the subsequent discussion.
In comparing the water drunk with the volume of urine,the discus
sion may be based more advantageously upon the water in the urine .
A determination of the solids in the urine was made only on the last16 days of the fast , but amounts for the earlier days of the fast havebeen computed and these are sufficiently accurate to use in this connection for obtaining the amount of water in the urine .
From the values given in column E of table 24,showing the relation
ship between the water in the urine and the water consumed , it is seenthat in the first days of fasting
,when the amount of water taken by
the subject was only 750 c .c .,about 74 per cent of the water consumed
appeared in the urine . When the amount of drinking-water wasincreased to 900 c .c .
,there were marked disturbances in the ratio for
the next 7 days . The widest variations in the entire series appeared in

URINE . 24 1
these 7 days, namely, from 54 per cent on April 25— 26 to as high as 96
per cent on April 29—30. On the other hand , from May 1— 2 to the end
of the fast , the ratio remained very constant , with but minor variationsabove or below the average figure for the whole series of 02744 , essentially that obtaining on the fir st 10 days of the fast . The disturbancein the ratio was found , therefore, only during the 7 days immediatelyfollowing the change in the amount of water consumed from 750 c .c .to 900 c .c .This surprising constancy in the ratio between the water of urine and
the water consumed, aside from the 7 days mentioned, is difficult toexplain
,particularly since at least two factors might have been ex
pected to disturb this relationship . During the first 10 days of thefast
,there was a considerable loss of preformed water from the body
,
1
ranging from 769 grams to 183 grams . This loss of water might beexpected to increase the volume of urine during these days . Indeed
,if
the volume of urine were not increased , in the absence of other evidence ,this might be taken as an argument against such an excretion of preformed water.Another point which should be taken into consideration in thisconnection is that one would expect that with the greatly diminishedbody substance, the amount of drinking-water consumed might exceedthe physiological need and hence would disturb the relationshipbetween the volume of urine and the vo lume of water consumed . On
the other hand, it is well known that during fasting there is a tendencyfor all the tissues to become water-rich, this retention of water possiblycompensating for the decrease in the physiological need following thedecrease in the size of the organism .
That the relationship between the water of urine and the waterconsumed is reasonably constant, even when the quantity of water isbut 1 liter or less, is likewise substantiated by calcu lations from datapublished regarding Cathcart’s experiment with Beauté
,in which the
volume of drinking-water was also constant, i . e.,
c .c . per day. Byusing the data for the volume of urine, the specific gravity, and thefactor (see page we have computed the total solids and alsothe water in the urine for the sixth, seventh, eighth, tenth, eleventh,twelfth, and fourteenth days of Beauté
’s fast . The ratio of water inthe urine to the water consumed was for the several days as follows :
The average valuewas which is not material ly different from the averageobtained for the values for L . when the 7 days referred to have beenomitted . The high value of found on the tenth day with Cathcart’s sub ject exceeds any found with our subject L .
In general , then, the volume of water in the urine is approximately75 per cent of the amount of drinking-water taken, even when but
1See discussion of preformed water loss on page 4 08.
242 A STUDY or PROLONGED FASTING .
1 liter or less is taken, provided the intake of water is constant . Itis obvious, however, that this would hold true only when the factorsinfluencing the loss of water, such as environmental temperature andexercise
,also remain constant .
The evidence is clear , therefore, that even with the small amounts ofwater taken in this fast , there was a reasonably constant relationshipbetween the water consumed and the water in the urine, the absolutefluctuations in the volume of urine noted being so small that therecould have been no disproportionate washing out from the tissues ofthe crystalline end-products of protein katabolism. There is , to besure , a distinct increase in the average volume of the urine after thetwelfth day , but in this experiment we deal with an average increaseof approximately 100 c .c . , and hence these absolute variations in volumeare not to be compared with the very large variations noted in theearlier fasts at Wesleyan University , when the amount of drinkingwater vari ed within wide limits .
SPECIFIC GRAVITY.
The specific gravity of the urine was carefully determined by MissAlice Johnson, at a constant temperature of 20
°
C . , on a Westphal balance . The position of the scale when the weight was suspended indistilled water was accurately checked , the temperature of the sur
rounding liquid being invariably artificially maintained at 20° C .
Thus the specific gravity of the urine for each day of the fast wasreadily obtained to the fifth significant figure .
These values,which are given in tab le 24 , ranged from on
April 15— 16 to on May 13— 14 , and are therefore well withinnormal limits . As the fast progressed
,there was a distinct tendency
for the specific gravity to decrease, although for the first 10 or 12 daysit was approximately constant at about falling thereafter somewhat sharply and remaining at about for the remainder of the fast .This approximation to constancy may be 1n part accounted for by theapproximately constant volumes of urine passed . In the short fastingexperiments at Wesleyan University
,the specific gravity ranged be
tween and but the lowest specific gravity was aecom
panied by a very large volume of urine and the high specific gravityby a very small volume of mine .
It is obvious that the nature of the solids dissolved in the urine hasa noticeable influence upon the specific gravity . For instance, a solution containing 100 grams of sodium chloride in 1 liter has a density at15
° C . of while a solution of urea 1 to 10 has a density of butconsequently a large amount of sodium chloride in the urine
would have considerable effect upon the specific gravity. From otherfasting studies it is known that a large amount of sodium chloride isexcreted in the first days of fasting
,which would thus increase the

244 A STUDY or PROLONGED FASTING .
When the total amount of dry matter was determined , the contentswere afterwards carefully transferred from the metal bottle-cap to thenickel capsule by means of a swab of ignited asbestos
,the last traces
of so lid material adhering to the bottle—cap being removed by a bit ofasbestos wool moistened with water. Finally, the material was driedin an air-current to a pasty consistency and then placed in a highvacuum until dry enough to burn .
This method has been previously described1 andneed only be referredto here . The 3 samples always gave perfectly agreeing results , indicating that the drying was essentially complete , and testifying to theskilful technique of Mr . Arthur W. Cornell
,who carried out the deter
minations of the total solids , carbon, and heat of combustion . The
results of the determinations of the total solids for the last 16 days of thefast are given in table 24 , and range from grams on April 29— 30to grams on the last day of the fast . From these absolutedeterminations of the total solids , together with the volumes of urineand the specific gravity , it was possible to compute a factor indicatingthe ratio between the total solids and the specific gravity. This factor,although high er than the value for normal individualsvery constant in these later days of the fast , ranging from towith an average of The value which represents the averageratio between the total solids and the specific gravity in the last partof the fast , agrees very closely with those found in three of the fastingexperiments with the subject S . A . B . in the Middletown research,
2
namely, experiments Nos . 71 , 73, and 75 , the ratios being and
respectively . In experiment No . 77 with the same subject , muchlarger amounts of sodium chloride were excreted , and this doubtlesswas the cause , at least in part , for the lower ratio of 2.5 for this 4 dayfasting experiment . In the later days of the fasting experiment withour subject L . there was undoubtedly a min imum sodium
—chlorideexcretion , and the constancy in the ratio between the total solids andthe specific gravity points towards an approximately constant relationship between the organic and inorganic solids of the urine. Unfor
tunately ,we are unab le to apportion the total solids between the min
eral and organic constituents , since it was impossible to determinethe ash content of the fasting urine , owing to the deficiency in material .It can only be pointed out here, therefore, that while the factoris considerably larger than that accepted for normal people, namely,
it is probably explained in part by the fact that there were products of defective fat katabolism in the urine.
This average ratio , i. e.,
was used for computing the total solidsfor the first 15 days of the fast . The results of these computations arealso given in table 24 . In comparing the valueswe find that the largest
1Higgins and Benedi ct , Am . Journ. Physio l 191 1 , 28 , p . 291 .
2Benedict, Carnegie Inst. Wash . Pub. 77 , 1907 , p . 355 .

URINE . 45
amount was grams on Apri l 17— 18. It is probable that , owingto the increased sodium-chloride excretion in the first days of fasting
,
the values are somewhat too high and that the factor used should havebeen less than
DAYANDNIGHT URINES .
While with a fast as prolonged as this the main interest lies in acomparison of the urinary excretion from day to day and there is butlittle interest in a subdivision of the day into 12-hour periods , yet wehave certain fragmentary data regarding the diurnal excretion of urinewhich are of sufficient importance to record here . Usually the bladderwas emptied at 8 a .m . and at 8 p . m .
,the 24—hour daybeing thus divided
into two periods , i . e.,from 8 a . m . to 8 p . m . and from 8 p . m . to 8 a . m .
While this subdivision was not made exactly each day,nevertheless
the variations were generally well within one-half hour. On one day
TABLE 25 .— Periodic distribution of volume and nitrogen of urine in experiment with L .
Day period . Nigh t period .
Date .
Duration . Duration.
a .m . p.m . p.m . c .m .
8b05m to 7h 27m 7h 27m to 7h 57m
21— 22 .
1Gram s.
24 6 A STUDY or PROLONGED FASTING .
(May 10— 11) the day period was 14 hours and 5 minutes and the nightperiod only 9 hours and 55 minutes, a discrepancy which resulted in theomission of the day from the record of the peri odic distribution of theurine . Beginning with April 18— 19, the volumes of the day and nighturines were separately recorded. Furthermore
,toward the end of the
fast , periodic determinations of the nitrogen for the day andnightwere made . The data thus obtained are given in table 25 . Withoutlaying emphasis at this time on the absolute values of total nitrogenexcreted— a discussion which belongs later in this report— we mayproperly consider the data in this tab le as indicating the division ofthe urinary excretion between night and day when no food was taken.
The volume of urine during the day ranged from a minimum of242 c .c . on May 1 1— 12 to a maximum of 407 c .c . on April 29— 30. The
average volume for the day urine was 293 c .c . The average volume forthe night urine was 376 c .c .
,an increase of 83 c .c . On several occasions
there were large diflerences between the day and night urines,which
are not easily explained . Thus,on April 28—29 there were but 263
c .c . in the daytime and 495 c .c . during the night . Although the dayperiod was but 1 1 hours and the night period 13 hours
,this difference
in vo lume is very large . While in general the volumes for the day andthe night were not far apart , the average difference, as we have seen,being but 83 c .c . , it is indeed surprising that a larger volume was notexcreted during the day
,for the subject drank his entire allotment
of 900 c .c . of water before 8 p . m . , taking it in fairly regular portionsthroughout the day. Usually but a small amount was left after 6 p . m.
The drinking of water was thus distributed to obviate the necessity forurinating inside the calorimeter chamber during the night ; and indeed,throughout the fast , the subject retained the urine in the bladderthe entire night period .
On the days for which we have the data for both the volume and
the nitrogen of the urine, we find that on an average 42 per cent of thetotal volume of urine and per cent of the total nitrogen wereexcreted during the daytime .
1 If the volume of urine had had amaterial effect upon the total nitrogen ,
one would expect that a somewhat greater proportion of nitrogen would have been excreted duringthe night than was actually found , and it is reasonable to suppose that,with the relatively small total volume of urine here involved there couldhave been but little washing out of the nitrogenous products as a resultof the differences in volume . But in View of the well-known fact thatlarge quantities of water assist in washing out nitrogenous material , noother explanation than the increase in the volume of urine seems possible for this small but positive increase in the nitrogen output duringthe night .
lObviously sligh t corrections for variations in the relative length of the day and night periodsshould be made , but an inspection of th e table sh ows that the percentage figures would not bematerially altered .

248 A STUDY OF PROLONGED FASTING .
results in many experiments having been recorded in terms of urea .
Nevertheless,the nitrogen values found in several fasts Of 7 or more
days are considered Of sufficient importance in connection with thestudy of the fasting urine of our subject to be reproduced here and
are accordingly recorded in table 26 .
In this table the body-weight at the beginning of the fast is givenfor nearly every subject, and frequently for comparison the nitrogenexcretion is inc luded for the day prior to the fasting. The values forL. are first shown , these being followed by the nitrogen found in Succi
’s
fasts . Unfortunately these latter values are not strictly comparablewith the others , owing to the differences in methods of determination.
Those found for Getti can be relied upon, as can those for Beauté ,Schenk , Tosca , and S . A. B . The values reported for Succi for theLondon and Naples fasts are undoubtedly somewhat low,
but thosefor the Florence fast have been corrected by Munk . Even when thesepoints are taken into consideration,
the most striking feature in thiswhole group of results is the fact that the nitrogen excretion of oursubject L . continues to be extraordinarily high to the fifteenth day ofthe fast , and, indeed , throughout the remainder of the fast the valuesare noticeably higher than those found in any other study Of prolongedfasting .
1 Values as high , and even higher, are shown for Cetti forthe 10 days of his fast , and also for the 7-day experiment Of S . A. B . ,
but in none of the longer fasts are such high values so continuouslyshown . In Succi’s 30-day fast in Hamburg the value found for thelast day grams) was higher than that for the thirtieth day ofthe fasting experiment with L .
, but the earlier values were measurablylower . Another point of interest is that the general tendency is towarda low nitrogen output on the firs t day of the fast, with a higher nitrogenexcretion on the subsequent one or two days . This characteristic isshown in the fasts with L . , S . A. B .
, Tosca , and Beauté , and mayeasi ly be attributed to the protecting action of the body-storage ofglycogen during the first few days .One striking fact in connection with the high nitrogen output in
L .
’s fast is that on the fifteenth day there was a Sudden fall of nearly
2 grams . An inspection of the values for the other subjects showsthat in all of the fasts this sudden fall in the nitrogen excretion occurredat some point . Thus , in Succi
’s fast at Florence, there was a fall of
1 gram on the eighth day ; in the London fast there was a fal l of1None of these subjects shows as abso lute aminimum value for nitrogen excretion aswas found
on one day with Grafe ’s insane subject (Grafe , Zeitschr. f. physio l . Ch emie , 1910 , 65 , p . wh en
the very low excretion of grams o f nitrogen was found . Since th e body-weigh t of thissubject was at the time kilograms, th is excretion would correspond to approximatelygram of nitrogen per kilogram of body-weigh t. This surprisingly low value is difficult to explain,for while Grafe states that during the latter part of the experim ent the urine was frequently spontaneously passed and hence the 24 -hour periods could not be accurately determ ined , yet his discussion of this low value of grams indicates that he believed it represented a 24-hour excretion of nitrogen. This remains th e lowest value that we have as yet seen reported in any fastingobservation on m en or women.

URINE
grams on the seventh day ; in the Naples fast, the nitrogen outputfell grams on the eighth day ; in the Rome fast , it fell grams onthe ninth day ; whi le in the Vienna fast , it fell grams on the tenthday . With Cetti there was a fall in the nitrogen excretion of 2 gramson the eighth day ; with Beauté the decrease was grams on theseventh day ; with Schenk it was 1 gram on the tenth day ; with Tosca ,
TABLE 26 .— Nitrogen eliminated in urine daily by fasting subjects.
Succi .
Day of fast.
1The figures in this co lum n are given for the first 10 days of the fast as corrected by Munk . The results forthe remaining days have been increased in like proportion .
2G iven by Ajello and So laro as urea and h ere converted to nitrogen for purpo ses of comparison . S ince th eauthors do not give the m ethod employed , no attempt is here made to correct the figures.
3The results in th is colum n were reported by th e investigators as grains o f urea, but are h ere converted tograms of nitrogen in urea for purposes of comparison .

250 A STUDY OF PROLONGED FASTING .
grams on the fourteenth day ; and wi th S . A . B. , grams on thefourth day . These sudden drops were almost invariably permanentand were sometimes followed by a day on which even lower values werefound . It is difficult to predict at what point this break in the nitrogencurve is likely to appear , and the irregularity of certain curves does notj ustify giving serious attention at present to this feature of the generalcourse ; nevertheless the fact that it is characteristic of all long fastingexperiments is worthy of note.
The most accurate nitrogen determinations for the prolonged fastsshown in table 26 are unquestionably thosemade by Brugsch for Succi’sfast at Hamburg . These values are somewhat lower than those foundfor L .
,although Succi’s body-weight was 18 kilograms greater than
that of our sub ject . In none of the fasting experiments do we find,save perhaps in the Hamburg fast , any indication Of an increase in thenitrogen excretion near the end of the fast which may be consideredas corresponding to the so- called “
pre-mortal ” rise which has been
observed with many fasting animals , particularly with rabbits . It maybe said , therefore , that the values found for L. follow much the same
general course as the values found with the subjects Of earlier fastingexperiments , except that the level of the nitrogen excretion after thefirst 7 days was distinctly higher than with the other subjects .
DAILY Excnarrox or NrrROOEN .
Since L. had carefully preserved specimens of the urine from April 1until the time of his arrival at the Nutrition Laboratory , we were ableto Obtain information as to the nitrogen excretion Of this subject for13 days preceding the fasting experiment . By reference to the resultsof these determinations (see table 23, page it will be seen that ingeneral the nitrogen excretion was on a moderately high level , averaging not far from 13 grams per day, and even exceeding this when thelow value Of grams is excluded .
On his first day in Boston (April 10 the nitrogen excretion wasgrams . This was the highest value found and doubtless resulted
in part from the large beefsteak eaten by the subject on the night ofhis arrival . The nitrogen excretion subsequently decreased until onthe last day before the fast it was but grams . From April 10until the beginning Of the fast , therefore , the total nitrogen in the urineaveraged over 14 grams per day . This is significant as indicating thatL. was subsisting on a nitrogenous diet , which was quite inconsistentwith his claim that he was a “ low-proteid vegetarian .
”
The values for the nitrogen excretion for the whole experiment,
including not only those for the fasting period , but for the food daysprior to and following the fast, are given in tab le 27As noted in the comparison with other fasting subjects, two striking
features of these values for the total nitrogen excretion are the immedi
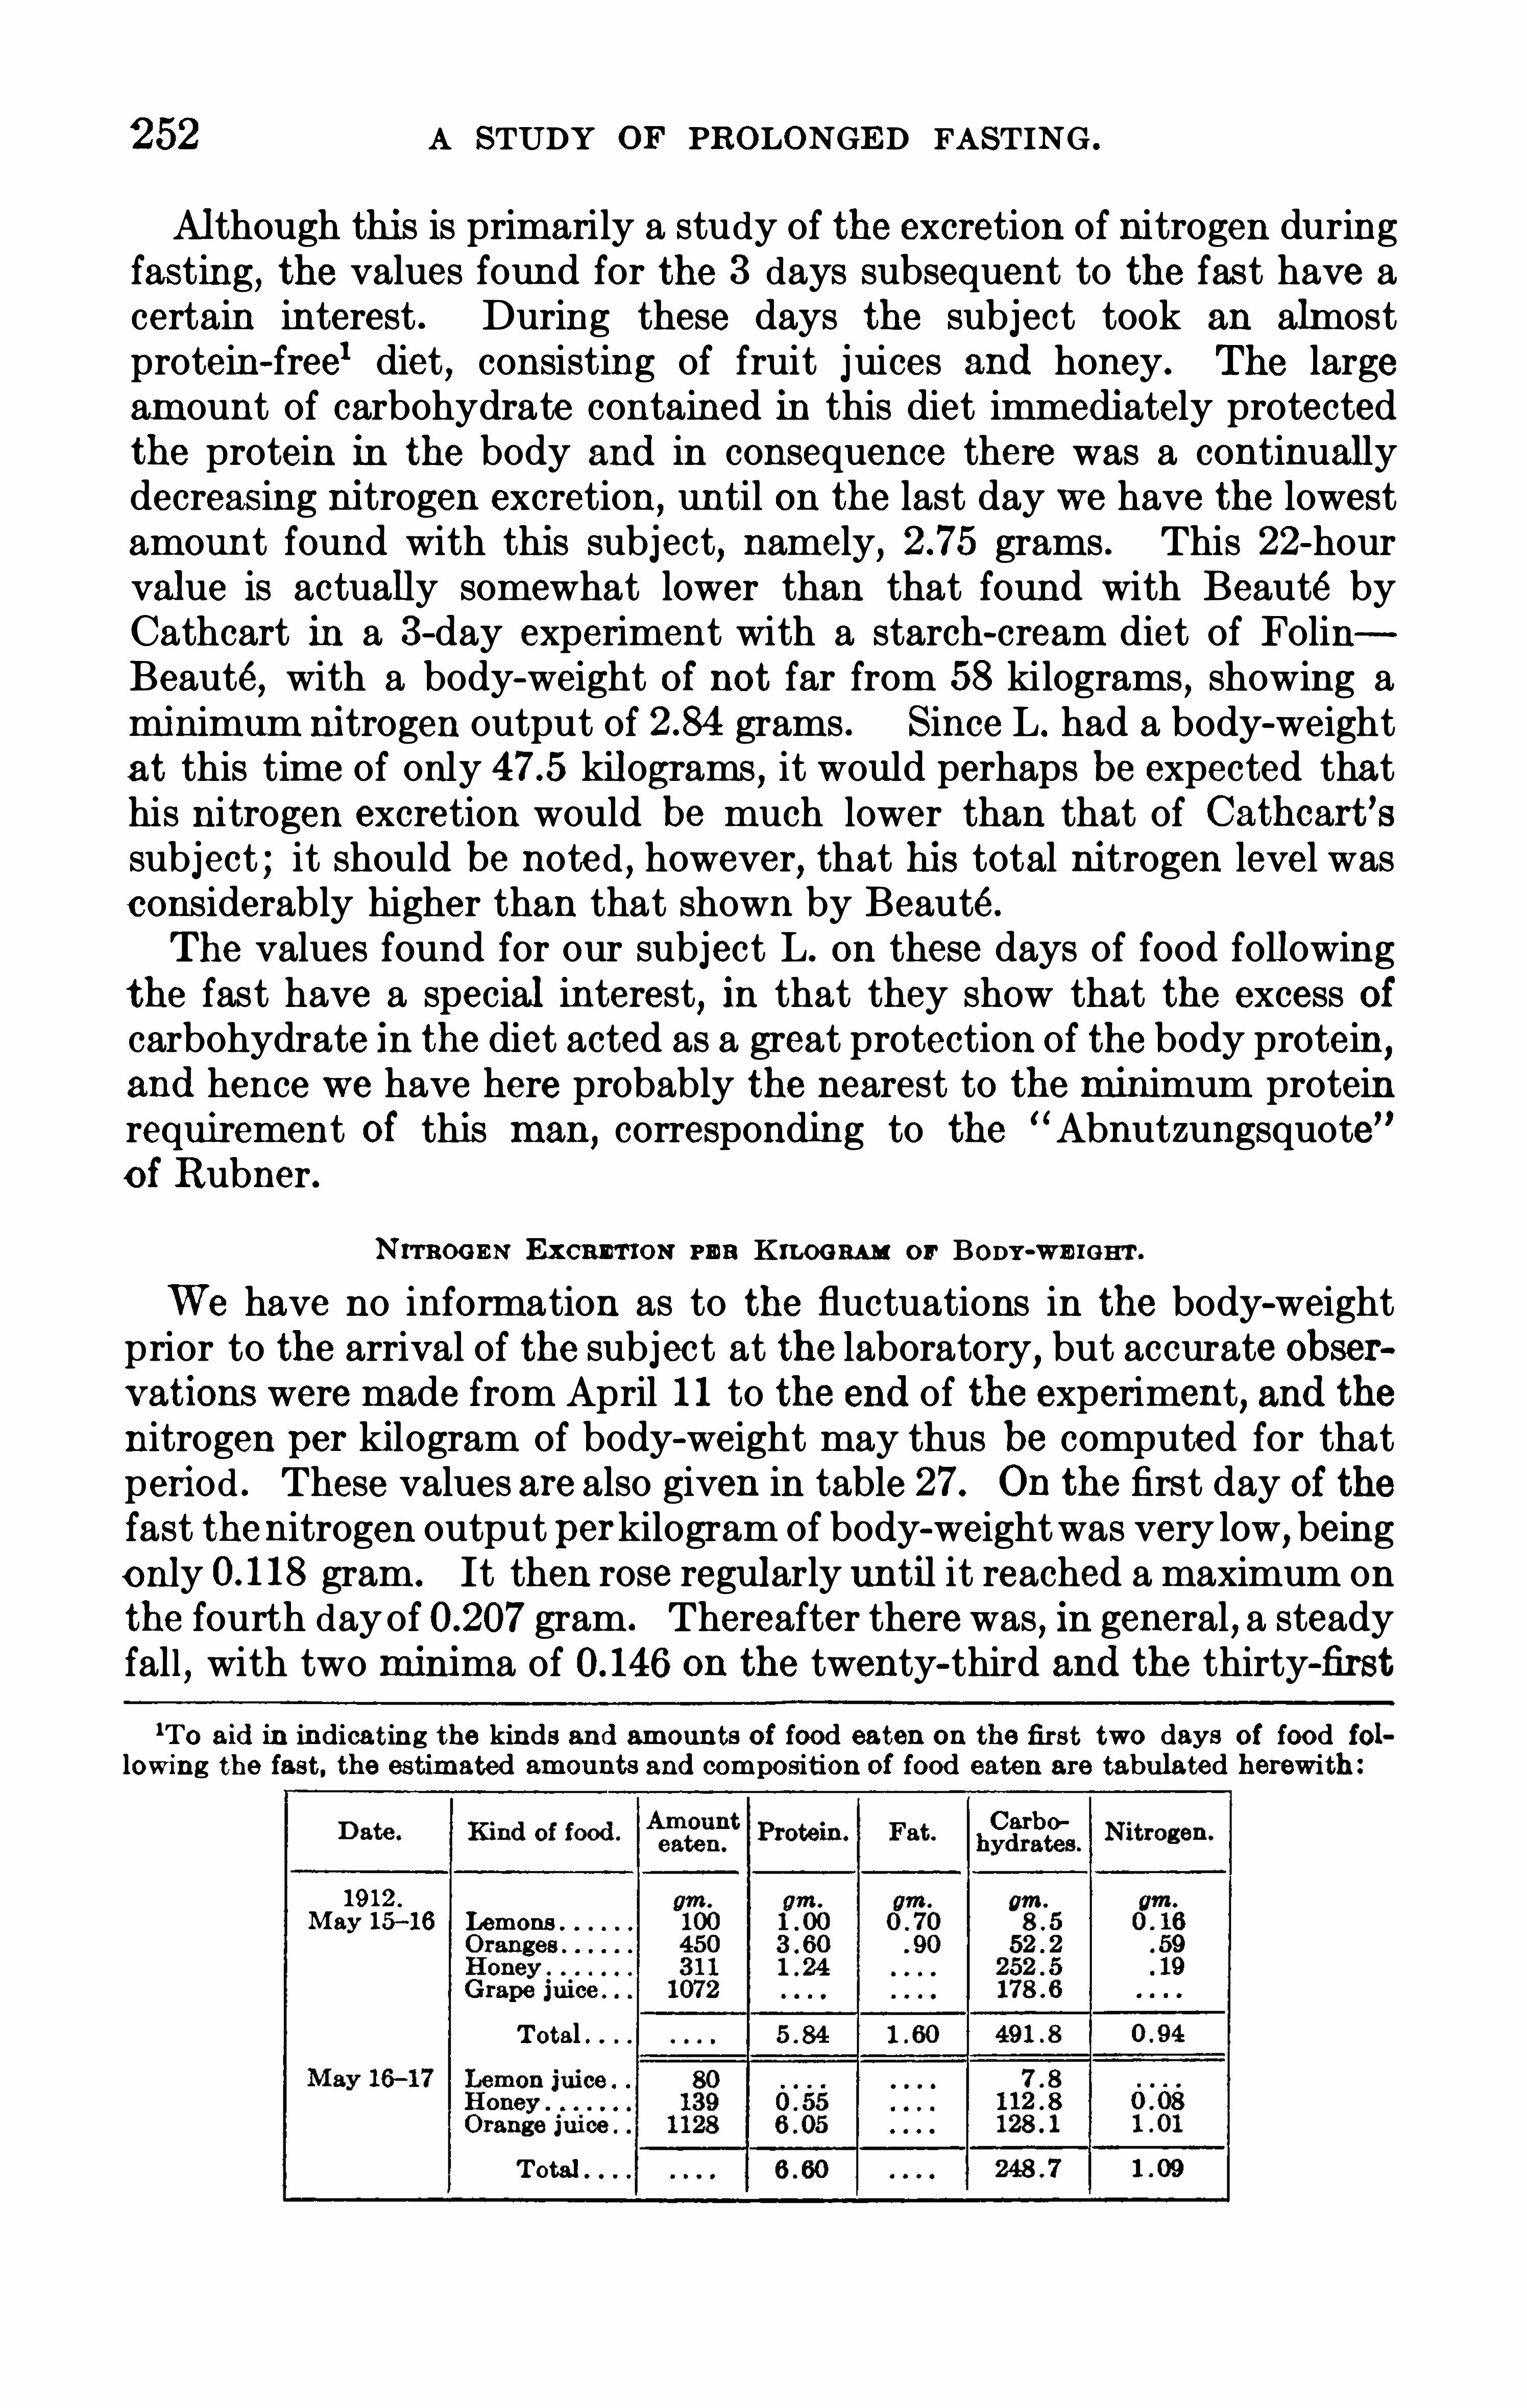
252 A STUDY OF PROLONGED FASTING .
Although this is primarily a study of the excretion of nitrogen duringfasting
,the values found for the 3 days subsequent to the fast have a
certain interest . During these days the subject took an almostprotein-free1 diet , consisting of fruit juices and honey. The largeamount of carbohydrate contained in this diet immediately protectedthe protein in the body and in consequence there was a continuallydecreasing nitrogen excretion, until on the last day we have the lowestamount found with this subject, namely, grams . This 22-hourvalue is actually somewhat lower than that found with Beauté byCathcart in a 3-day experiment with a starch-cream diet of FolinBeauté
,with a body-weight Of not far from 58 kilograms
,showing a
minimum nitrogen output of grams . Since L. had a body-weightat this time of only kilograms , it would perhaps be expected thathis nitrogen excretion would be much lower than that of Cathcart’ssubject ; it should be noted , however, that his total nitrogen level wasconsiderably higher than that shown by Beauté .
The values found for our subject L. on these days of food followingthe fast have a special interest, in that they show that the excess Ofcarbohydrate in the diet acted as a great protection of the body protein
,
and hence we have here probably the nearest to the minimum proteinrequirement Of this man, corresponding to the
“ Abnutzungsquote”
o f Rubner.
Nrrna N ExCBBTrON pan KILOGRAM or BODY-WE IGHT.
We have no information as to the fluctuations in the body-weightprior to the arrival of the subject at the laboratory, but accurate Observations were made from April 1 1 to the end of the experiment, and thenitrogen per kilogram of body-weight may thus be computed for thatperiod . These values are also given in table 27 On the first day Of thefast thenitrogen output perkilogram of body-weightwas very low, beingonly gram. It then rose regularly until it reached a maximum onthe fourth dayof gram. Thereafter there was , in general , a steadyfall , with two minima of on the twenty-third and the thirty-first
1To aid in indicating the kinds and amounts of food eaten on the first two days of food following the fast, the estimated amounts and composition of food eaten are tabulated herewith :
Carbo
1912 .
May 15—16 Lemons
Total .

URINE . 253
days respectively . After food was again taken, the nitrogen excretiondecreased to the surprisingly low value Of gram per kilogram ofbody-weight .
COMPARISON o r METHODS FOR DETERMINING TOTAL NITROGEN AND AMMONIA-NITROGEN.
The microchemical methods had been developed just previous tothis fasting experiment and were therefore used by Mr . H . L . Higginsfor determining the total nitrogen and the ammonia-nitrogen . The
total nitrogen was also determined by the Kjeldahl method and the
ammonia-nitrogen by the o ld Folin method, both determinations beingmade by Miss E . B . Babcock . These analyses Of the fasting urineswere therefore the first control analyses which had beenmade outside ofthe Folin laboratory. Both the Kjeldahl method and the Folin microchemical method were frequently tested by determining the nitrogen of
TABLE 28 .— Comparison of the determinations of nitrogen and ammoniam itrogen by former
methods and the newmicrochemical methods of Folin.
Ammonia-N.
Date .
1912.
27—28
0 0 0 0 0 0 0 0
0 0 0 0 0 0 0 0
1For total amounts of nitrogen and ammoni on this day , see table 29 .

254 A STUDY OF PROLONGED FASTING .
known substances , such as ammonium-sulphate , ammonium ferroussulphate, urea , and uric acid . We were thus assured of the accuracyof the methods . Since the Folin microchemical methods p layed suchan important role in these analyses , particularly in an economicaldistribution of the availab le urine, it seems desirable to publish theresults of the control tests . Accordingly, in table 28
,the values
obtained for the total nitrogen by the Kjeldahl method are comparedwith those secured by the microchemical methods ; the values for theammonia-nitrogen Obtained with the new and old Folin methods arealso compared . As will be seen, the results of such comparison are
most satisfactory. We wish again to emphasize the great value ofthese methods , particularly when there is urgent necessity for the use ofsmall samples .
THE PARTITION OF THE NITROGEN EXCRETION.
While the total nitrogen excretion in the urine of a fasting man hasa general interest , more particularly in the apportionment of the totalenergy requirement and the energy output among the various factors ,protein,
carbohydrate , and fat , a clear understanding of the nature ofthe disintegration of the nitrogenous material is Obtained only when apartition of the nitrogen excretion is made according to the analyticalscheme of Folin . Fortunately , with all of the samples Of urine collected for the 31 days of the fast we were able to secure a completepartition Of the nitrogen,
with the single exception of the determinationof the total purines ; we were , however, able to determine the uricacid-nitrogen . This partition included the determination of the totalnitrogen
,and the nitrogen from urea, ammonia, uric acid , creatinine
preformed , and total creatinine . The nitrogen undetermined is givenas “ rest nitrogen .
” Furthermore , since Folin has shown the greatsignificance of the proportionate distribution Of the nitrogen derivedfrom these various sources , we have computed the percentage Of the
total nitrogen in these nitrogenous constituents of the urine . The
values for each day, expressed in grams and in percentages of totalnitrogen, are given in table 29.
UREA .
With the microchemical method of Folin, the urea-nitrogen in thefasting urines could be determined with great accuracy. The determinationswere accordingly made by Mr . Higgins for the 31 days of thefasting period and for the 3 days following the fast . The results aregiven in tab le 29, together with the percentage Of urea-nitrogen interms of total nitrogen .
In general the course of the excretion Of the urea-nitrogen fol lowsquite closely that of the total nitrogen . The regular increase shownin the first 3 days for the total nitrogen is also apparent here ; the

256 A STUDY OF PROLONGED FASTING .
TABLE 29 .— Partition of nitrogen excreted in urine in experiment with L .
— Continued.
Proportion of total nitro gen in
Date.
Day of
19 12.
70 . 63
15—16
1The amounts for this day were determ ined in th e urine for about 22 hours.
during the last 26 days was per cent on the nineteenth day and
the highest on the eleventh day of per cent . The average valuefor these days was per cent , with a distinct tendency towardsconstancy. Upon the resumption of food , there was at first no markeddisturbance in this ratio , but on the third day the percentage of ureanitrogen decreased to the low value Of 56 per cent , this value beingfound at the time that only grams of nitrogen were excreted inthe urine . These low values in the percentage Of urea-nitrogen are
perfectly comparable with those found by Folin on sub jects subsisting

URINE : 257
on a starch-cream diet , with an excretion of nitrogen correspondingto not far from 4 to 5 grams per day.
These figures are also substantiated by the Observations Of Cathcart .While he found in the first 3 days Of Beauté ’s fast that the urea-nitro
gen averaged not far from 87 per cent instead Of the 80 per cent foundwith our subject L . , and that the values also averaged somewhat higherfor the remainder of the fast, nevertheless the percentage fell as low as71 per cent on the eighth day of the fast . On the food days followingthe fast
,the urea-nitrogen fell to per cent on the day when the
minimum nitrogen excretion was Observed .
E . and O . Freund found in their observations on Succi that the ureanitrogen was 82 per cent or more of the total nitrogen excretion forthe first two weeks of the fast . There was then a rapid fall in thepercentage until but 56 and 58 per cent of urea-nitrogen were foundon the last 2 days . Brugsch’s Observations on Succi in Hamburg Showthat for the last 8 days of the 30-day fast , the uream itrogen was notfar from 60 per cent of the total nitrogen .
Van Hoogenhuyze and Verploegh , in their Observations on Tosca,
note most irregular proportions Of urea-nitrogen. The percentagesof urea-nitrogen computed by us from their data are as follows, thedayof the fast being given inparentheses : (1) (2) (3)(4 ) (5) (6) (7) (8) (9) (10)(11) (12) (13) (14 ) On the sixth day thelow value of 59 per cent is from data questioned by the authors . Inthe light of other fasting studies, there is no obvious explanationfor the unusually high average value, especially for the last 8 days ofthe fast .From all the evidence it can be seen that in general during fasting
the urea output approximately parallels that of the total nitrogen,
there being a decided increase on the first few days of fasting, followedby a decrease . In practically every instance when there is a fluctuation In the total nitrogen output , this 1s paralleled by the urea-nitrogen.
It would thus appear that the determining factor ln the fluctuationsof the total nitrogen IS probably the proportion of urea-nitrogen, andnot the gross alterations in the other factors . The variation in thepercentage distribution can
, however, be intelligently treated only aftera consideration of the changes in the output Of ammonia-nitrogen.
AMMONIA .
The ammonia-nitrogen,on account of its great significance in con
sidering the products of defective fat katabolism,was determined by
both the old and the new Folin methods . The results of these twoseries of determinations are given in table 28, page 253 . An average ofthese two series of values is also given in table 29.
Normal urine always contains a relatively small amount Of ammonia,and the amounts found for L . on the 3 days prior to the fast were

258 A STUDY OF PROLONGED FASTING .
approximately those which would be noted for normal individualssubsisting on a diet containing about 15 gram s of nitrogen. The
ammonia-nitrogen formed not far from per cent of the total nitrogenexcretion per day . At the beginning Of the fasting period the amountof ammonia-nitrogen excreted fell somewhat
,and not until the third
day do we find values exceeding those Obtained before the fast . On
the fourth day it rose quite sharp ly to grams and then continuedto rise steadily , with S light fluctuations , until the maximum value of
grams was reached on the Sixteenth day . Thereafter it slowlyand quite regularly decreased until the end of the experiment
,the
excretion of ammonia-nitrogen on the last day being grams . Thisgradual increase and decrease was exactly that Observed by Cathcart
,
although the maximum value with his subject was observed on the
eighth day, whi le with L . i t did not appear until the sixteenth day.
Brugsch found the excretion Of ammonia-nitrogen quite regular,rang
ing between grams and grams in the last 8 days of Succi’sfast in Hamburg .
Since the amount Of ammonia-nitrogen would normally be expectedto fluctuate somewhat with the fluctuations in the total nitrogenexcretion
,the percentage of ammonia-nitrogen in the total nitrogen
must be considered . On this basis the minimum percentage per
cent) is found on the first day Of the fast , with the maximum
per cent) on the seventeenth day. Even on the percentage basis theammonia-nitrogen tends to increase until the middle of the fast andthen slowly to decrease
,although towards the end it was still 10 per
cent or more larger than it was prior to the fasting period .
It is clear, therefore, that there was some factor which stimulatedthe excretion Of ammonia-nitrogen. From previous experi ence withfasting subjects , it is Obvious that this increase in the excretion wasdue to the organic acids
,chiefly the B—Oxybutyric acid resulting from
defective fat katabolism . The large excretion of ammonia thereforeundoubtedly corresponds to an increasing acidosis , the production ofthe ammonia being a protective action on the part Of the body to overcome the effect of the acids . The amounts Of ammonia-nitrogen foundfor L . during fasting were measurably greater than those Observed byCathcart for his sub ject and the percentage of the total nitrogen wasalso considerably greater. These values would therefore imply that L.
had a somewhat greater acidosis than had Beauté in Cathcart ’sresearch .
The results of the Observations of E . and O. Freund on Succi arediametrically Opposed to the values found by Cathcart on Beauté,Brugsch on Succi , andby us with L .
,for both the absolute amount and
the percentage Of the total nitrogen found , and one is inclined to question somewhat the technique of the Freunds . While the observations ofBonnigerandMohr
1on the fastingwoman Schenkare complicated by the
lBonniger andMohr, Zeitschr. f. exp. Path . u . Therapie , 1906 , 3 , p . 675 .
260 A STUDY OF PROLONGED FASTING .
tion Of nuclein katabolism is undoubtedly true. Beyond this universally accepted fact, the evidence as to the influence Of intestinal
,
glandular , kidney, and muscular activity is much debated .
In previous fasting experiments it has been shown that the glandularactivity, at least so far as the digestive organs are concerned , is at aminimum,
1and hence we should expect to find that if any considerab le
proportion of the uric acid were Obtained as the result Of glandularactivity
,there would be a minimum uric-acid nitrogen excretion during
the fast . As ide from the admittedly low values on the second to thefifth days of the fasting experiment with L . ,
this was not the case,for
there are many days during the fast on which there was ful ly as muchuric-acid nitrogen , if not indeed more, than one would expect to findwith a normal individual subsisting on a purine-free diet .2
After L . had taken food , there was a slight increase in the totaluric-acid nitrogen excretion from gram
,which was Obtained on
the last day Of the fast, to gram on the first day with food . Ordinarily this would not be considered as a substantial increase in thetotal uric-acid nitrogen excretion,
and yet in recent controversialpapers , Mareshas pointed out that a 10 per cent increase is not to beignored and that it does represent an actual Increase . While according to Mares , the ingestion of food which stimulates the digestiveglands to their greatest activity is most productive Of an increase inthe excretion of uric acid , nevertheless , Smetanka has found that suchan excretion took place even with honey . Inasmuch as the food takenby L . was in large part carbohydrate, a portion of the diet beinghoney, it is not impossible to believe that there may have beena positive increase in the uric-acid nitrogen as a result Of the ingestionOf this food . This is the more credible if we give heed to Smetanka
’s
criticism that 24—hour periods are not best suited to the study of thisproblem,
as the influence of the activity of the digestive glands disappears rapidly after the ingestion of food .
During the fasting period , the percentage of the total nitrogen inthe form of uric-acid nitrogen likewise underwent considerable fluctuation
,approximately paral leling the absolute amount of this constituent .
The percentage value sh ows a distinctly increased uric—acid nitrogenexcretion in the post- fasting period , rising to per cent, and whilethe evidence is by no means complete , this may well be interpretedas an index Of an increased glandular (digestive) activity .
Cathcart also determined the uric-acid nitrogen excretion for hissubject , using the method of Hopkins-Fo lin. During the first halfOf the fast he found a distinctly lower value for the uric-acid nitrogenthan in the preceding food period , but there was a continual tendencyfor this form of nitrogen to increase as the fast progressed . With thetaking of food there was an increase in the uri c-acid nitrogen— at
lLuciani, Das Hungern , Hamburg and Leipsic , 1890, p . 44 .
2Fo lin , Am . Journ. Plursiolq 1905 , 13 , p. 62.

URINE . 261
least on the first day— followed by 4 days with the same excretion asin th e last period of the fast . Thus, in Beauté
’s fast there was adefinite tendency towards regularity1 in the excretion Of the uric-acidnitrogen,
inasmuch as there was from the beginning to the end aregu lar, though slight , increase— a regularity that was by no meansparalleled by the Observations on L.
While the values found for L . were decidedly variable, yet in severalpoints they strikingly confirm the earlier x observations. Thus themarked fal l on the second fasting day, followed by a low excretion forseveral days and a subsequent rise, with a higher value on the firstfood day than that shown on the last fasting day, are all in agreementwith the Observations o f Cathcart with Beauté, and of Van Hoogenhuyze and Verploegh in their 14-day experiment with Tosca .
The rapid fal l in the uric-acid nitrogen excretion on the second dayhas also been observed in shorter fasts by Schreiber and Waldvogel ,
2
by Hirschstein,
3and by Feldmann.
4 Scaffidi,5 in experimenting on
the purine metabolism in fasting, concluded that with those animalswith which there was a formation Of oxidative uric acid
,the uric-acid
nitrogen decreased during starvation and there was no regularity inthe relation Of total uric-acid nitrogen to the total nitrogen .
This decrease in the uric-acid excretion Of L . was coincident withthat period Of the fast when the supply Of glycogen was rapidly beingdepleted and the subsequent increase fol lowed sharply the incidenceof the protein-fat katabolism characteristic Of the remainder of thefast . The cessation Of the glandular activity of digestion on the firstfew days may explain the fall in the uric-acid nitrogen, but the subsequent increase can only be exp lained by an increase in the katabolismof the active protoplasmic tissue . The fact that this excretion does notremain constant , or at least does not regularly increase or decrease,is indeed difficult to explain, since there are no Obvious reasons forassuming that the changes in the amount Of the excretion of uric-acidnitrogen are due to corresponding changes in the rate of destructionOf the active protoplasmic tissue . Indeed
,if we observe the total
creatinine excretion,the regular decrease Of that urinary constituent
would imply a proportional regularity in the rate Of destruction of theactive protoplasmic tissue . It is evident that the values Obtained forthe excretion of the uric-acid nitrogen in this fasting experiment Offerno proof of the validity of any Of the present- day conceptions as tothe origin Of endogenous uric-acid excretion.
lRegularity in the uric-acid excretion as the fast progressed was also noted for th e greater partof the experiment with Tosca by Van Hoo genh uyze and V erploegh (loc. cit.) and with Succi inVienna by E . and O . Freund (Wiener klin . Rundsch . , 1901 , 15 , p. Brugsch (Zeitschr. f.exp..Path . u . Therapie , 1905 , l , p . 4 19) found very constant values for the purine-nitrogen duringthe last eigh t days of Snool ’s Hamburg fast.
2S chreiber andWaldvogel , Arch . f. exp . Path . 11 . Pharm . , 1899 , 42 , p . 69 .
”Hirschstein , Arch . f . exp . Path . 11 . Pharm . , 1907 , 57 , p . 229 .
‘Feldmann , cited by Sivé n , Arch iv. f . d . ges. Physio l . , 19 12 , 146, p . 499 .
“Scaffidi, Bio chem . Zeitschr. , 19 1 1 , 33 , p. 153 .

262 A STUDY OF PROLONGED FASTING .
CREATININE .
As a result of Folin’s fundamental observations on the partition ofthe nitrogen of normal urines , special stress was laid upon the determination of the creatinine existing in the urine of this fasting man,
Folin having emphasized the fact that the total creatinine may belooked upon as an index of the total tissue metabolism .
1 Immediatelyafter FOlin ’s papers had appeared
,a large number Of researches on the
creatinine in urine were reported , and Observations were simultaneously made in several laboratories which implied the presence ofcreatine in urine under certain conditions , particularly in pathologicalcases and during fasting .
Folin ’s analytical scheme enabled the direct determination Of creatine
,the creatinine being first determined , and subsequentlyany creatine
in the urine was converted to creatinine by heating with acid for 3hours. These results were reported by him as creatinine preformedand total creatinine, the difference in the two values being estimatedto be a measure Of the creatine expressed in terms Of creatinine .
There is little of positivevalue to be said regarding thedeterminationsof creatine or creatinine in fasting experiments prior to the introductionof the Folin method , hence Baldi
’
s2Observations as well as those of the
Freunds3 on Succi can have but little quantitative interest . One Of the
first studies made after the FOlin method was put forth is that of VanHoogenhuyze and Verploegh on Tosca .
4 The considerable decrease inthe creatinine Obtained by them at the beginning of the fast , followedby an increase after food , shows (in part at least) that only preformedcreatinine was determined, and hence their values correspond morenearly to the values reported for our sub ject as preformed creatinine .
In the experiments at Wesleyan University,the total creatinine
was invariab ly found to be somewhat higher in the fasting periodsthan the preformed creatinine, the difference disappearing when foodwas taken, and thus the conc lusion was drawn that creatine was to befound regu larly in the urine of fasting subjects . This Observation wassimultaneously made and published by Cathcart .5 Laying specialemphasis upon the difference between preformed and total creatinine,Cathcart discussed at considerable length the appearance of creatinein the urine . Although our interpretation of the presence of creatinein the urine differs considerab ly from that OfCathcart , the fact remainsthat since that time considerable research has been carried out on bothcreatinine and creatine excretion, and hence an Observation Of the
amount excreted by our fasting subject was particularly desirable .
IFolin , Am . Journ . Physio l . , 1905 , 13 , pp . 66 and 1 17 .
2Baldi , Sperim entale , March 1889 ; Centrlb f. klin . Med 1889 , 10 , p . 65 1 .
3E . and O . Freund , Wiener klin . Rundsch 190 1 , 15 , pp . 69 and 9 1 .
‘Van Hoogenhuy ze and Verploegh , Zeitschr. f. physiol . Chemie , 1905 , 46 , p. 4 15 .
lsCath cart , Biochem . Zeitschr. , 1907 , 6 , p . 109 .

264 A STUDY OF PROLONGED FASTING .
and are given in table 29. As with the earlier fasting experiments ,there was a difference between the creatinine preformed and the totalcreatinine as thus measured .
At the time these analyses were made, we were firmly of the Opinionthat the results Obtained by such analysis would represent quantitatively the amount of creatine in urine, expressed as creatinine.
Since these investigations were carried out , two papers have appearedwhich lead us to question the quantitative relations exhibited in thevalues here given. Greenwald,
l in his work on diabetic urines , considers the effect of the acetone bodies upon the Jaffe reaction and concludes that urine containing aceto—acetic acid and acetone will givecorrect results for creatinine by the Folin method only after theremoval of these substances. More recently Graham and Poulton2
have studied the influence of aceto-acetic acid on the estimation ofcreatinine and have called into question the interpretation of the difference between preformed and total creatinine as reported in fastingexperiments and in experiments with carbohydrate starvation. Theyconclude that acetone andB-oxybutyric acid , if present in amountscomparable to those which usually occur in urine, produce practically noerror in the estimation of creatinine.
” They furthermore state thataceto-acetic acid causes an error in the preformed creatinine determination
,but does not affect the determination of total creatinine. On
the basis of their experiments , they conclude that the differencebetween creatinine preformed and total creatinine does not representcreatine, since in their experiments with carbohydrate-free diets, theyfound no excretion of creatine.
It is obvious,therefore, that these two researches throw considerable
doub t upon the value of the figures reported under the head of thepreformed creatinine, but affect in no wise the values for the totalcreatinine . We may therefore without further reservation proceed toa consideration of the total creatinine-nitrogen as reported in table 29.
One of the most striking features of these results is their great regularity . After the first 2 days there was an almost continuous fall inthe total creatinine-nitrogen from the maximum on the third day of
to a minimum on the last day Of the fast of The minorfluctuations from this regular fall are so few as to be negligible.
In the fasting experiments with S . A . B . at Wesleyan University,the almost absolute constancy in the total creatinine-nitrogen was amatter of special comment and in the report of the results it waspointed out that it was probably more than a mere coincidence thatthe sum of the creatine-nitrogen and the preformed creatinine-nitrogenremained constant each day as the fast progressed . It will be seenthat for the first 7 days Of the fast with L .
,while the results were not
1Greenwald. Journ. Bio l . Chem . , 1913 , 14 , p . 872Graham and Poulton, Pro c. Royal Soc . , ser. B 1914 , 87 , p. 205 .

URINE . 265
constant,nevertheless the amount excreted did not vary greatly
,
although the variation was wholly in the line of a decrease toward theend. It was only after the thirteenth day that any considerab le decrease in the total creatinine-nitrogen appeared ; from that time itremained at a lower level , gradually decreasing until the end of thefast
,the lowest value being found on the last day Of the fast .
Of particular interest is the striking regularity in thepercentage of thetotal nitrogen excreted in the form of total creatinine . Omitting -
the
first 2 days , the percentage ranged from per cent on the sixth dayto per cent on the twenty-fourth day .
On the first 2 days of the fast,the values for preformed creatinine
nitrogen and for total creatinine-nitrogen are essentially the same,and it is only with the third day that we begin to find the measurabledifferences which have been ascribed to creatine . In an attempt toexplain the presence Of creatine in the fasting urine
,two hypotheses
have been presented : one, that as a result of inanition the body losesits power Of converting creatine to creatinine before excreting it , andthe other that creatine was representative of the flesh katabolized, asin the disappearance of the body material a certain amount Of creatinenormally existing in the flesh was liberated and excreted in the urine .
Against the validity of this latter assumption was the obviously significant fact that the sum of the creatinine-nitrogen and the creatinenitrogen remained constant . While without doubt the observationsOfGreenwald and of Graham andPoulton affect the quantitative valueof the difference between preformed creatinine and total creatinine, theaccumulative evidence of the past eight years is such as to make itreasonably certain that creatine is excreted unchanged in fasting andpathological urines and our uncertainty lies
,therefore, only in our
knowledge as to the quantities thus excreted .
In a recent paper Folin1 has reiterated his belief regarding theinterpretation of the creatinine output in the following terms : The
creatinine elimination becomes more clearly than ever the most clearcut index or measure of the total normal tissue metabolism .
”In this
paper Folin explains the appearance of creatine as an abnormal Splitting Off of a cleavage product which is normally excreted as creatinineand disclaims the presence of isolated , uncombined creatine in flesh ,admitting that in fasting and in various pathological conditions thenormal breaking down into creatinine is accompanied more or less byan abnormal breaking down into creatine. It is clear
,therefore
,that
according to all of Fo lin’s recent interpretations the exact quantitativeknowledge regarding the creatine in urine has no longer the significanceformerly attributed to it , and hence the criticisms Of Greenwald and ofGraham and Poulton, while admittedly justifiable so far as techniqueis concerned , apply to a determination which bids fair to have but
1Fo lin and Denis, Journ. B io l . Chem . , 19 14 , 17 , p . 501 .

266 A STUDY OF PROLONGED FASTING .
little physio logical significance . The pathological significance must,
however,bemeasurab ly increased invalue as a result Of their researches .Of fundamental importance is the possibility Of using Folin’s inter
pretation of the total creatinine excretion as an index Of themetabolismof normal tissue . Throughout th is entire monograph stress has beenlaid upon the importance of knowing, if possible, the active mass ofprotoplasmic tissue in the body,
1and the question arises
,
“ Have we inthe total creatinine excretion an interpretable index of the changesin the active mass Of protoplasmic tissue?” If, as is pointed out inthe section on energy transformation
,the active mass of protoplasmic
tissue is the fundamental factor in the determination of the totalenergy requirement , we Should normally expect to find that the totalenergy output decreased with the loss of creatinine, indicating a continual decrease in the tissue metabolism. As a matter Of fact
,as the
fast progresses,such a decrease in the total heat-production is clearly
shown by vari ous methods and yet, as a reference to the section on the
pulse-rate will show,our whole conception of the relationship between
creatinine and energy transformation is seri ous ly affected by the
increase in the pulse-rate found with this subject during the last weekof the fast . The total energy transformation is clearly due to theactive mass of protoplasmic tissue and the stimulus to cellular activity
,
but at no part Of the fast were conditions so sharply differentiated thatwe may say with accuracy that the loss in the heat-production wasdirectly comparable to the loss in the normal katabolized tissue
,as
indicated by the decrease in the total creatinine excretion. Similarly ,we find no definite relationship between the creatinine excretion and
the total basal heat production, util izing the creatinine elimination asan index Of the total mass of active protoplasmic tissue remaining inthe body . It is
,however, of great significance that the total creatinine
excretion decreased regularly as the fast progressed , thus indicatingnot an approxim ation to dep letion but a distinct tendency on the
part Of the body to a conservation of its active protoplasmic tissue.
The decreasing differences between the preformed creatinine and
the total creatinine observable toward the end of the fast are not
easily explained upon the ground Of the influence of acetone bodiesin th e urine, since from the determinations of the ammonia and the
B-oxybutyric acid we have no reason to believe that the acidosis wasmaterially less in the last week than at any other time. These valueswould therefore indicate that a sufficient amount of acetone bodieswas not present in these urines to affect materially the quantitativedeterminations Of preformed creatinine .
1During the reading of th is proo f , we received the adm irable article , Basal Metabo lism and
Creatinine Elim ination,
" by W . W . Palmer, J. H . Means, and J. L . Gamble (Journ . Biol . Chem .,
19 14 , 19 , p .

268 A STUDY OF PROLONGED FASTING .
20 to 30 milligrams . We have computed the creatinine coeflicient forour subject L . for each day of the 31-day fast and give the values intable 30. After the first 2 days of fasting, the coefficient remainspractically constant until the fourteenth day ; it then shows a tendencyto fall for a week , and the last 10 days it remains nearly constant at19 milligrams .
REST NrTROGEN.
When the urea-nitrogen, the ammonia-nitrogen, the uric-acid nitro
gen,and the total creatinine-nitrogen are combined , we find that the
total amount is somewhat less than the total nitrogen found by thKjeldahl method . This remainder, or the so-called “ rest-nitrogen
,
”
amounts usually to not far from gram of nitrogen in the Observations with our subject L. The values for this undetermined nitrogenare recorded in table 29, in which it is seen that the largest amount
gram) was found on the fourth day and the smallest gram)on the twenty-second day. Since these values include all the errors inth e analyses , the amounts thus recorded are not unexpected . Usuallythey form about 5 per cent of the total nitrogen and in these recordsvary from per cent on the fourth day Of the fast to per centon the twenty—second day . In the food period following the fast, wefind a large increase on the percentage basis in this rest nitrogen,
which reaches per cent of the total nitrogen excretion. It thusappears that the chief factor affecting the nitrogen excretion on the lastday was the urea
,for the absolute amounts of ammonia-nitrogen, uric
acid nitrogen, creatinine-nitrogen, and rest-nitrogen remained essentially constant on all three days of food .
ACID RADICLES .
Fasting urine contains a large number of acid radicles whichmay be either organic or inorganic . Thus there are always presentconsiderable amounts Of chlorine, phosphorus pentoxide, sulphurtrioxide, and (particularly in fasting experiments) B—oxybutyric andother fatty acids . By using Folin’s titration method, it has been possible to determine the “ total acidity.
” For a clear understanding ofthe quantitative relationships Of these various acid radicles , directdeterminations were made of the total chlorine, phosphorus pentoxide,total sulphur, andB-oxybutyric acid .
CHLORINE .
Owing to the general satisfactionwith the standard Volhard method,chlorine has perhaps received more attention than any other of theinorganic constituents of the urine. Recognizing the importance ofthe determination of this constituent , especially in view Of the emphasislaid upon the supposed excess storage of chlorine in the body under

URINE . 269
normal conditions, we made duplicate determinations Of the chlorine inthe urine for each day of the fast . The chlorine excretion in fastingexperiments has always had a particular interest, as the chlorine curveahnost invariably follows a fairly regular course. It is furthermoreimportant as presumably demonstrating whether or not the fast isa true one, for it is comm only supposed that unless the food surreptitiously taken is pure fat or pure carbohydrate, it is practicallyimpossible for a subject to break his fast without almost immediatelyaffecting the chlorine excretion . On the other hand , it was found ,
TABLE 31 .— Chlorine (Cl) excreted in urine daily byfasting subj ects.
‘Reported by the investigatorsasNaCl, but converted to ch lorine for purposes of comparison2Average of 6 days be fore fast began .
3Determ ined in the urine for about 22 hours.
270 A STUDY OF PROLONGED FASTING .
in the experiment with L .,that when the subject took considerable
amounts Of food on the 3 days following the fast , the excretion Of chlorine was but slightly affected , certainly not enough to be considered asproof that food had been taken. The character of the diet on thesefood days easily explains this absence of influence upon the excretionof chlorine .
The determinations of the chlorine excretion were made under Dr .Peters
’s supervision by Mr . W. F . O
’Hara according to the Volhard
method , the excess of silver nitrate added being determined in a filteredportion of the urine. These values are compared in table 31 with thevalues Obtained for several other sub jects in long fasting experiments .With L . there was a large excretion of chlorine on the first day of the
fast , doubtless from the food previously taken. This was followed bya marked fall , even on the second day, this decrease continuing almostregularly until the fifteenth day, when the excretion reached a new
minimum level . It subsequently fluctuated slightly until the end Of
the fast . On the 3 food days there was a Slight increase over the latterpart Of the fasting period .
An intelligent comparison of the values found for L . with those foundfor other fasting subjects is somewhat difficult, owing to the facts thatfrequently the basis upon which the chlorine is reported is somewhatObscure and that some Of the subjects , Succi in particular, were accustomed to drink water containing more or less chlorine. Apparentlythe chlorine excretion in complete inanition varies widely with differentindividuals
,for it will be seen at once, by inspection of the values in
table 31 , that the excretion found for L ., particularly in the first part
of the fast , was lower than that found for any other subject except fora few days with Succi1 in the Naples fast , for 3 days with Tosca , and for4 days with S . A. B . In the latter part of the long fasts
,however,
there is more Of a tendency toward uniformity, although the valuesfor Succi at Naples and at Vienna , and those for the latter portionof Tosca’s fast
,are much higher than those found with L . There is
a general tendency Shown with all Of the subjects for the excretion todecrease gradually until the fifteenth day, but not so rapidly as wasfound for our subject . The observations Of Brugsch on Succi at Hamburg give values that agree well with those found for L .
Relationship between chlorine excretion and preformed water lost — Acritical examination Of the tables in the report of the earlier fastingexperiments2 shows a rather interesting relationship between the exoretion of chlorine and the loss of preformed water from the body . Fora long timewe have been at a loss to exp lain the marked variations inthe absolute amounts of chlorine excreted on different days of a fast
1I have been unable to obtain the original ch lorine data in the studymade of Succi's urine byK oré nyi. published in Orvosi hetilap, 1894 , Nos. 39—4 0. See autoreferat, Maly, Jahrb. d . TierCh emie, 1894 ,
24 , p . 268. K orzi nyi also studied the depression of the freezing-po int.zBenedict, Carnegie Inst . Wash . Pub. 77 , 1907 , table 216 , page 4 15 , and table 229 , page 4 69 .

272 A STUDY or PROLONGED FASTING .
a number of short fasting experiments made with eight subjects atWesleyan University .
It is conceivab le that variations in the chlorine excretion might bedue, in part at least , to a flushing out of the body, and hence we shouldexpect to find the chlorine excretion varying to a certain degree with thevariations in the volume of urine or of the water taken. An examination of the figures in the last column of table 32 (column F) shows ,however , that the water in the urine per gram of chlorine excretedundergoes wide variations, ranging from 102 grams to grams
,with
no obvious average value .
Ifwe consider the body as losing regularly not only carbohydrate, fat ,and protein from its original store of substance at the beginning ofthe fast , but also losing regular amounts of preformed water, i . e.,
waterof flesh and fatty tissue (see note to table and water existing inthe fluids of the body, we can see that the importance of the determination of the preformed water lost is much greater than would at firstappear . The values for the preformed water lost by these fasting sub
jects are given in column 0 of table 32, and for the preformed waterlost per gram of chlorine in column D . An examination of the valuesfor the preformed water lost per gram of chlorine shows that there isat least a semblance to regularity. This is more clearly seen if the firstday of the experiment is omitted , as may properly be done, since it isnatural to suppose that the chlorine excretion on the first day mayhave been influenced by the previous diet . Excluding the values forthe first day , then ,
we find that the remaining values range from 726 onthe second day of experiment 73 with S . A . B . to as low as 148 on thesecond day of experiment 82 with H . C . K . Aside from the very highvalue found in experiment 73 , it will be seen that there is a fairly closeagreement between the ch lorine excreted and the preformed water lostfrom the body. It would thus appear that , in the discharge of thiswater , there is excreted simultaneously an amount of chlorine approximately proportional to the total preformed water lost . It is obviousthat all of the factors involved in the determination of the preformedwater lost from the body are such as to make the absolute values ofsome of the determinations prob lematical , and yet we believe that asa whole there is sufficient agreement here to indicate some approximaterelationship between the chlorine and the preformed water lost fromthe body.
Source of chlorine excreted — The exact source of the chlorine excretedin the first days of fasting is by no means certain , but it is clear thatthe small amounts excreted , in the urine after the first few days offasting
,correspond to the usual percentage of chlorine commonly con
sidered as belonging to human flesh . Thus Katz ,1 whose analyses
have been considered as remarkab ly accurate, maintains that human1Katz , Archiv f. d . ges. Physio l. , 1896 , 63 , p . 1 .
URINE . 273
muscle contains per cent chlorine. Furthermore, Magnus-Levy sanalysis of the flesh o fa suicide agrees remarkably wellwith the values ofKatz . If we use this factor for computing the chlorine in the fleshkatabolized by the subject L . as recorded in column Q , table 61 (page
the values found would be approximately the amounts of chlorineactually excreted . For instance, on the twenty-fifth day, there were235 grams of flesh katabolized, the excretion of chlorine being somewhatlarger than the average for this part of the fast . Applying the factorof Katz
, we find that per cent of 235 grams would give gramof chlorine, while the amount actually excreted on that day as shownby analysis was gram . It is clear, therefore, that , at least in thelater stages of inanition, chlorine is derived for the most part from disintegrated muscle substance. The large storage of salt in the skin,
which was noted by Wahlgren2 and subsequently further studied byPadtberg ,
3 and Scholz and Hinkel ,4 must therefore have been rapidly
depleted during the first days of the fast . In any event,the total
amount of chlorine involved throughout the whole 31 days of ourfasting experiment was but grams , an amount so small as to casta doubt upon the theory that there is an excess 5 of chlorine stored inthe body.
Pnosrnonus.
Since phosphorus has so intimate a relationship with both themineraland the organic constituents of the body, observations have been madeof the amounts present in the fasting urine of a large number of subjects .The phosphorus in the urine of L. was determined by Mr. W. F .
O’Hara under the supervision of Dr. Peters, for each day of the fast
and for the following food days , by titration with uranium acetate .
Usage is followed here in expressing the values as phosphorus pentoxideinstead of as phosphorus , although the inconsistency of expressingthe elements in terms of their compounds is obvious . The absoluteamounts of phosphorus pentoxide determined in these urines, togetherwith those found in other long fasting experiments , are given in table 33 .
The values obtained for L. show an increasing amount for the first4 days and thereafter a very regular decrease for the remainder of thefast . The maximum amount
,grams of phosphorus pentoxide ,
was observed on the fourth day and the minimum amount , grams,on the last day. While in the first part of the fast the values for L .
are exceeded by those for Getti and Beauté and approximately equaledby those for S . A. B .
,in the latter part of the fast they are measurably
lMagnus-Levy. Biochem . Zeitschr 1910, 24 , p . 363 .
7Wah lgren, Archiv f. exp. Path . 11 . Pharm . , 1909 , 61 , p. 97 .
‘Padtberg , Archiv f. exp. Path . u . Pharm . , 19 10 , 63 , p . 60.
‘Sch o lz and Hinkel , Deutsch . Arch iv f . klin . Med. , 1913 . 112, p . 334 .
“For a discussion of this po int, see Magnus-Levy , Physiologic des Stofl'
wechsels, von Noorden’
s
Handbuch der Path . des Stofl'
wechsels, Berlin, 1906 , l , p . 4 5 1 ; Munk , Archiv f. Path . Anat. u.
Physio l. , 1893 , Supp. 131 , p . 14 6 ; andMorawitz , Oppenh eimer’sHandbuch der Biochemie, Jena,1910, 4 p. 282.

274 A STUDY or PROLONGED FASTING .
higher than those recorded for any other subject . The only other fastin which the phosphorus was determined, and which extended overso long a period as that for our sub j ect , was Succi
’s fast in Florence,
but the amount excreted by this subject was considerably less thanthat found for L . The values obtained by Brugsch on Succi in the
TABLE 33 .— Phosphorus (P30 5) eliminated in urine daily by fasting subjects.
!Determined in urine for about 22 hours.
Hamburg fast are also measurably less than those reported for ourfasting subject .Relationship between phosphorus and total nitrogen
— Owing to theintimate relationship between phosphorus and the organic tissues of thebody
,particularly muscle, the ratio between phosphorus and total

276 A STUDY or PROLONGED FASTING .
on the second day of the fast . Furthermore, the figures show no
definite increment in the ratio as the fast progressed . While it is truethat values less than 5 are not found on the last 8 days of the fast ,nevertheless there is a period— that between the seventh and the fifteenth days— when the values again all lie above 5 , while between thefifteenth and the twenty-fourth days values as low as 4 .4 are found .
In examining the values for the other fasts, we find several whichshow distinctly abnormal values for the first day, i . e. , 7 .87 for thefirst day of Succi’s Florence fast , and for the first day of the fastof S . A . B.
, but this would naturally be expected . On the other hand ,after the first day the values should lie well below and any abovethis are Open to suspicion. The ratios established by the Freunds forthe Vienna fast of Succi are remarkably constant , as are those ofBrugsch for a later fast of Succi in Hamburg. Perhaps the greatestuniformity in ratios is shown by Cathcart ’s subject Beauté , theseratios gradually and steadily increasing as the fast progressed . The
values for Succi in the Florence fast are somewhat vitiated by theuncertainty in the nitrogen determinations , although the values werecomputed on the basis of nitrogen as corrected by Munk .
Source of phosphorus excreted — Comparing these ratios , particularlythose for L .
, with the theoretical relationship with flesh , we find inall of the experiments a tendency toward a much larger excretion ofphosphorus pentoxide in its relation to nitrogen than occurs in theordinary composition of flesh . Th e possible sources of phosphorus inthe body other than the flesh are of course the nucleins and, above all,the mineral matter of the bony structure. It is now the consensusof opinion that thedisturbance in the relationship between the phos
phorus pentoxide and nitrogen in fasting experiments is due exclusivelyto the material draft upon the bony structure as the fast progresses .1
This was clearly set forth by Munk in his discussion of the experi
ments with Getti andBreithaupt , but as these were short experimentsMunk frankly stated that he expected to find that the ratio wouldbecome smaller and smaller as the fast progressed . The ratios in the31-day fast with L. do not, however, become smaller as the fast con
tinued, but on the other hand tend to become higher in the last weekthan at any other time. Brugsch has already commented upon thevery high values found in the last week of his study with Succi .During the fast with L .
,277 .32 grams of nitrogen 2 were excreted,
corresponding to grams of flesh katabolized. If we assumethat this flesh had normal ly combined with it per cent of phos
phorus pentoxide, the total amount combined with the katabolizedflesh would be equal to grams . Since grams of phosphorus
lWellman (Ar chiv f. d . ges. Physio l. , 1907— 1908 , 121 , p . 508) believes that the calcium and
pho sphorus losses found by him conform with Munk ’s conclusion that th ere is considerableloss of calcium and phosphorus from the bones during starvation.
2This amount does not include the nitrogen excreted through th e skin (see table

URINE . 277
pentoxide were excreted during the fast , it will be seen that there wasdistinctly an excess excretion,
amounting to 15 grams of phosphoruspentoxide for the whole fast . This was undoubtedly derived— in largepart
,at least— from the bones . It was hoped that the present-day
technique of Roentgen photography would show any material attacksupon the bony structure and possible depletion of calcium
,but the
excellent series of X -ray photographs taken by Dr. Francis H . Wil liams,
of the Boston City Hospital, did not indicate this . On the other hand,
when one considers the large storage of calcium in the body and the
relatively small draft , an ocular indication of such a draft which couldbe measured could hardly be expected .
The exact apportionment of the phosphorus pentoxide betweenmuscle and bone is not permissible with the experimental data atpresent in our hands . In all probability the amount of phosphoruspentoxide actually drawn from the skeleton was considerably morethan 15 grams .Since after the first few days there was no material increase in the
uric-acid excretion as the fast progressed,there was doubtless no direct
attack upon the nucleins , and thus the increase in the phosphoruspentoxide could not have been derived from that source .
SULPHUR.
Sulphur as an integral component of protoplasm is oxidized and ex
creted in the urine in several forms : first, as sulphates ; second, in theform of conjugated sulphates , or sulphuric acid combined with organicradicles ; and finally, as so-called neutral or unoxidized sulphur. The
apportionment of the total sulphur output among these various componente has been studied during fasting in considerable detail
,both
in the laboratory of Wesleyan University and by Cathcart . In the
series of experiments carried out on L ., it was impossible to separate
the sulphur, owing to the lack of experimental material , and only thetotal sulphur was determined . These determinations were personallymade by Dr . A . W. Peters , the constancy in the results testifying tohis technical skill .It has been the custom of many writers to report the sulphur excre
tion as sulphuric acid or sulphur trioxide,but the values given for L .
in table 35 represent the daily excretion of total sulphur. For comparison, the sulphur excretion has been computed from the resultsgiven by other observers for fasting subjects, and these values areincluded in the table. Two difficulties arise in comparing our resultswith those obtained with other subjects . In the first place, frequentlyonly the total sulphuric acid was determined and the organic sulphur was not included . Secondly (in the case of Succi , at least) , thesubject often drank mineral water containing measurable amounts ofsulphates .

278 A STUDY or PROLONGED FASTING .
With our subjectL .,the sulphur excretion followed a course not unlike
that of the nitrogen excretion,there being a slightly increasing amount
excreted for the first 3 days and thereafter an ahnost continuousdecrease until the end of the fast . The maximum amount gram)
TABLE 35 .— Total sulphur (S) excreted in urine daily by fasting subjects.
‘Probably inorganic and ethereal. Given by the investi gator as HzSO4 , but converted to Sfor purposes of comparison.
2Probably inorganic and ethereal .a‘Determined in mine for about 22 hours.
was excreted on the third day of the fast, and the minimum amountgram) was found on the twenty-fourth , twenty-fifth , and thirty
first days .The most carefully determined results for the other subjects are
undoubtedly those for Cathcart’s subject Beauté . Here again we finda decrease in the sulphur excretion as the fast progresses, the values for

280 A STUDY or PROLONGED FASTING .
sulphur excretion in the other fasts in table 35, it was not permissibleto compute the ratio between the nitrogen and the sulphur , since therewere undoubtedly errors in the nitrogen determinations and probablylikewise in those for the sulphur excretion.
The ratios found for L . show at first a slight increase , rising on thefourth day to a maximum of They then decrease with considerable regularity, the lowest value, being on the last day of the fast .In general , the ratios remain within very narrow limits . These valuesare again not unlike those found by Cathcart with Beauté , whichshowed a tendency to decrease as the fast progressed . The same tendeney is shown by the values for S . A. B .
,although at no time during
the 7—day fasting experiment did the ratio fall belowAll of the values found for L. show a somewhat higher excretion of
nitrogen than would normally accompany the amount of sulphur excreted ; it would appear , therefore, that there was a disintegration ofsulphur-poor and nitrogen-rich substance other thanmuscle . Throughout all of the observations , it has been noted that on certain days therewas always a marked lowering in the excretion of the urinary componente. This lowering may be due either to an actual decrease in thekatabolism on that day or to a possible loss of urine. The handling ,sampling, and preservation of the urine were so strictly controlled thatit would seem impossible for such a loss to occur . It is conceivable,of course
,that the subject may not have emptied the bladder com
pletely in the morning , but a compensating increase in the urine ofthe next day would then be expected , which was not observed . If weexamine the values for sulphur, total creatinine, nitrogen,
chlorine,and phosphorus , we find that there was a distinct lowering in the
amount excreted on the fifteenth day of the fast, with occasionally aslight indication of a compensating increase on the sixteenth day .
This points toward a loss of urine which we are as yet unable toaccount for. As a matter of fact, no disturbance in the nitrogensulphur ratio was found on the fifteenth day and, indeed, such disturbance was not expected .
On the other hand , we note a very definite increase in the sulphurnitrogen ratio from on the twenty-third day to on the twentyfourth day. An examination of the values for the total nitrogenexcretion shows that here also there was a marked increase, thus indicating the disintegration of a nitrogen-rich and a sulphur-poor substance other than muscle. The general course of the values for sulphurand total creatinine show a striking similarity, indicating that thekatabolism resulting in the excretion of total creatinine is accompaniedby an excretion of sulphur. If we are to accept Folin’s view
‘
that thetotal creatinine is an admirable index of the total katabolism of tissue,we may then conversely state that the sulphur is likewise an index.

URINE . 281
TOTAL Acmrrr .
When the conditions are such that acidosis may be expected todevelop , as in fasting , a determination of the total acidity of the urineis of special value. Accordingly the total acidity of the urine in thisexperiment was determined for each day of the fasting period and alsofor the 3 days following when food was taken. Under the directionof Dr. A. W. Peters , the determinations were made by W. F . O
’Hara
,
according to the method of Folin,1 in which potassium oxalate was used
and the titration was carried out with 25 c .c . of urine. The values aregiven in table 37, expressed in terms of cubic centimeters of deci-normalsodium hydroxide solution .
TABLE 37 — Total acidity (nNaOH) of urine offasting subjects.
1Acidity of urine on third food day before the fast.’The figures in this co lumn were reported by th e investigator as normal sulphuric acid , but
are here proportionately increased for purposes of comparison.
3Determined on urine for 22 hours.
At the beginning of the fast,the acidity increased rapidly until the
maximum of 655 c .c . was reached on the fourth day . It then showed ageneral tendency to decrease as the fast progressed , although occasionally unusually high values were found, as on the sixteenth and
seventeenth days of the fast . In the 3 food days following the fast, theacidity dropped almost immediately to about 60 c .c .The fasting values best suited for comparison with the values foracidity found for L . are those determined by Cathcart on Beauté andby Brugsch on Succi in Hamburg . Cathcart
’s figures for the total
acidity in the 14—day fast of Beauté show values ranging from a maxilFolin. Am . Journ . Physio l . , 1903 , 9 , p . 265 .

282 A STUDY or PROLONGED FASTING .
mum of 687 on the third day of the fast to a minimum of 212 on thetwelfth day of the fast . Following the fasting period the subject wasgiven a starch-cream diet, and the acidity immediately dropped toapproximately 100 c .c .From the twenty-third to the th irtieth days of the fast in Hamburg
,
Brugsch found with Succi values ranging from 384 c .c . on the twentythird day to 103 c .c . on the thirtieth day— values which are not incomparable with those found by uswith L.
It was impossible, owing to the insufficient supply of urine, to determine the mineral acidity in the urine of our subject.
B—oxYBUTYnIc Aom .
In the earlier fasting experiments at Wesleyan University, there wasstrong evidence that a nitrogen-poor, carbon-rich substance was presentin the urine in large amounts . This was shown by determinations ofthe carbon in the urine and the relationship between the carbon and
nitrogen and calories . At that time the opinion was expressed that inall probability the material was B-oxybutyn
'
c acid , but we were thenunable to make the determinations in addition to the other analyses .Spec ial effort was therefore made in this fasting experiment to determine the B-oxybutyric acid in the urine as accurately as possible,although the interesting paper of Brugsch , reporting the Hamburgfast with Succi, and more recently the paper by Grafe,
1 have left nodoubt as to the nature of this excess non-nitrogenous material in theurine of a fasting man .
Results of determinations.
— Of the methods for the determination of
fl-oxybutyric acid which were available at the time of this experiment,that of B lack”was best fitted for our purpose. By this method , plasterof paris is first mixed with the acidulated , dried urine and the mixtureis then extracted with ether, the B—oxybutyric acid removed beingdetermined with the polariscope .
8 The determinations were carriedout by Miss Alice Johnson under the supervision of Dr. A. W. Peters .Since these determinations were made, a large amount of research
onB-oxybutyric acid has been carried out in the light of the techniqueexisting at the time of the experiment, however, the determinations ,while admittedly having a relatively large error, are nevertheless sufficiently accurate to indicate that there was a material excretion of
B-oxybutyric acid throughout the fast . The results are recorded intable 38 (column F) .On the second day of the fast only gram of B-oxybutyric acid was
found ; this was wholly in line with what would be expected . Subse
quently no values less than grams were found until the fast had been1Grafe , Zeitschr. f. physio l . Chemie , 1910 , 65 , p. 21 .
’B lack , Journ. Bio l . Ch em . , 1908, 5 , p . 207 .
‘For amore explicit statement of th is procedure , see Benedict andJoslin, Carnegie Inst. Wash .
Pub. 136. 1910 , p . 25 .

284 A STUDY or PROLONGED FASTING .
of fi-oxybutyric acid excreted were also computed by an indirectmethod , using the relationship between the nitrogen and the carbon.
The carbon and the nitrogen in the urine were determined for everyday of the fast and for the 3 food days following the fasting period.
Normally there exists a relatively definite relationship between the
carbon and the nitrogen of urine, a relationship which was determinedby Munk on Breithaupt and Getti as being not far from 1 part ofnitrogen to of carbon. This relationship was determined for L .
for 2 days before the fast , and a ratio found , which may be termed“normal ,
” of 1 to We therefore computed the amount of carbonthat would normally be excreted from the amount of nitrogen actuallyexcreted , and deducted the result found from the total amount ofcarbon found in the urine . The excess carbon would be due, in all
probability, to B—oxybutyric acid or to acetone bodies . The resultsof this computation are considered of suffi cient importance to beincluded in table 38, which gives the total nitrogen for each day , thevalues for the normal excretion of carbon as computed with the ratioC the total carbon as actually determined , the differencewhich would be ascribed to B-oxybutyric acid , and finally the values for
6-oxybutyric acid obtained by using as the percentage of carbonin B—oxybutyric acid . As the values for B-oxybutyric acid actuallydetermined are also given in this table, a comparison may readily bemade.
In general the determined values are somewhat lower than thoseobtained by computation. Occasionally
, especially toward the end ofthe fast , the determined values are higher than the calculated values .On the whole, however, there is sufficient agreement to give an approximate estimate as to the amount of B-oxybutyric acid present . Indeed ,taking everything into consideration and the regularity of the figures ,it would appear that the computed values are probably more nearlyaccurate than those which were actually determined . In any event ,the amounts here found are noticeably lessthan those computed from thelsevo-rotation of the urine observed byBrugsch with Succi and by Grafewith his fasting woman. When the computed values are compared , itis found that the greatest excretion of fi-oxybutyric acid was from thesixteenth to the nineteenth days , when for 4 days an average amountof over 7 grams was excreted .
Th e amounts of B—oxybutyn’
c acid present in these urines are notunlike those found in short fasting experiments or in experiments witha carbohydrate- free diet, and the stimulating effect of these acids uponmetabolism is certainly not to be ignored . On the other hand , with theacid present in the body for so long a time, the subject might easilyhave become accustomed to its presence and therefore the reaction beless, as has been found in cases of severe diabetes.
It is perfectly clear, however, that the amounts of B-oxybutyric acidinvolved in these determinations are not sufficient to affect the respira

URINE . 285
tory quotients to an appreciable degree, Since, as Magnus-Levyl has
pointed out , the excretion of 20 grams of 6-oxybutyr ic acid per dayresults in a lowering of the respiratory quotient only The presence of this acid is , however , sufficient to account for the increase inthe ammonia excretion as the fast continued . The effort of the bodyto correct this undue acidity by combining ammonia with the acid isthus clearly Shown .
Bonniger and Mohr2 found with Schenk much greater amounts of
acid than were found or indeed calculated for the urine of L . Brugsch3
likewise found large amounts with Succi , and the excretion for Grafe’s4
insane patient was also large. The uncertainty in the method for thequantitative determination of 6—oxybutyric acid does not permit useof these values for comparison, and it is sufficient to state that lsevorotatory B-oxybutyric acid in appreciable amounts is excreted in the
urine during fasting .
Beginning on the afternoon of April 21 , 1912, and continuing atleast every other afternoon during the fast , a qualitative test for acetonein the breath was made, using the reagent of Scott-Wilson .
6 Severaltests were also made each day after the fast , the latest being on May17 at 7 p . m . In every case the test showed acetone present, but it isimpossible to draw quantitative deductions from the results .
MINERAL METABOLISM.
With normal man the mineral metabolism has two main paths forexcretion— through the solid salts of the urine and through the feces .With L . the entire mineral excretion took place through the urine
,if
one excepts the small amount of sodium chloride excreted through theskin .
-Usually much stress is laid upon the determination of the acidradicles in the urine, nam ely, chlorine, sulphur trioxide, and phosphoruspentoxide, and but little attention is given to the calcium,
magnesium,
potassium,and sodium metabolism . The important relationship
between phosphorus and calcium and the possible draft upon the
Skeletal tissue of the body made the determination of the mineralconstituents of the urine desirab le , and although a very large number ofdeterminations were made of the various components of the urine ofour subject , it was possible , by combining and apportioning the material , to secure a sufficient sample of urine for the determination of themineral constituents .The analyses were made by Mr. J . C . Bock
,who was at that time a
member of the Laboratory staff and who had had previous experienceinmineral analysis . Since special training was necessary for this inves
1Magnus-Levy, Zeitsch r. f . klin . Med. , 1905 . 56 , p . 83 .
zBonniger and Mohr , Zeitschr . f. exp. Path . 11 . Th erapie , 1906 , 3 , p . 675 .
3Brugsch . Zeitschr. f. exp . Patho l. u. Th erapie , 1905 , l , p . 4 19 .
‘Grafe , Zeitschr. f . physio l . Chem ie , 19 10 , 65 , p . 27 .
l‘Seott-Wilson, Journ . Physio l . , 191 1 , 42 , p . 44 4 .

A STUDY OF PROLONGED FASTING .
tigation of the mineral metabolism during fasting ,Mr.Bockwas allowedthe privilege
,through the kindness of Dr. Rufus S . Cole of the Rocke
feller Hospital,of working with Dr. Francis H . McCrudden, at that
time of the Rockefel ler Hospital, and whose researches in mineral
metabolism are too well known to need Special mention here. Havingacquired certain of Dr . McCrudden
’s methods and technique, Mr.
Bock made a most careful analysis of the urine of L .,determining the
calcium, magnesium, sodium, and potassium ,so that we have a fairly
TABLE 39.— Mineral metabolism (urine excretion) in experiment with L .
Day of
0 0 0 0 0
0 0 0 0 0
0 0 0 0 0
Apr. 30—May 1
May 1—2
lDeterminations in urine for about 22 hours.
“
1 o‘
t

288 A STUDY OF PROLONGED FASTING .
sium in the animal body have been recently carefully studied ,landwe
may more advantageously study the excretion of these four elements bynoting the ratios of their oxides to each other than in any other way.
Consequently the percentages of calcium oxide and magnesium oxideexcreted have been computed , using the total of the calcium oxide andmagnesium oxide as 100 . Similarly the potassium and sodium oxideshave been added together and the percentages of potassium oxide andsodium oxide computed . These percentages
,which are given in table
40 , were computed for each sample of urine analyzed .
Prior to the fast there was about eight times as much calcium oxideexcreted in the urine as magnesium oxide, but this relationship became4 to 1 on the first fasting day and subsequently the percentages werefairly constant at approximately 75 per cent for the calcium oxide and25 per cent for the magnesium oxide . It was not until the third daywith food following the fast that this relationship was disturbed , whenthe original percentages prior to the fast were again approximated .
According to these ratios , then, there were relatively much largeramounts of magnesium excreted during fasting than on the food days .In considering the ratios for the potassium oxide and sodium oxide,
we find that the problem is considerably complicated by the fact thata certain amount of sodium chloride exists in the body which is veryloosely, if at all, combined in the tissues . Consequently, on the firstday of the fast , only per cent of the total alkali was found in theform of potassium oxide and per cent in the form of sodium oxide .
On the next day the proportion was reversed , and from that time untilthe eighteenth day there was a tendency toward a gradually increasingpercentage of potassium oxide. For the remaining days of the fast ,about 90 per cent of the alkali was in the form of potassium oxide and10 per cent or less in the form of sodium oxide. One specimen of urinethat for the twenty-eighth and twenty-ninth days— Shows the highpercentage of for potassium oxide as compared with per centfor sodium oxide.
It is Obvious from the values for the potassium and sodium thatShortly after the excretion of the uncombined sodium chloride on the
first few days , the body excreted the potassium and sodium frommusclesubstance and we then have the large differences between these twoelements ; in the last part Of the fast , approximately nine or ten timesmore potassium was excreted than sodium. This far exceeded theordinary proportion between potassium and sodium in muscle givenas a result of the analyses of Bunge.
2
The relationship between calcium and magnesium in animal tissueshas been extensively studied , particularly with dogs and horses.
1Gerard , Ann. de l’
Inst. Pasteur , 1912.26 , p . 12.
2See Aron , Oppenheimer’
s Handbuch der Biochemie desMenschen u . der Tiere , 1909 , l , p . 84 ,
Where the relationsh ip is given‘
as 5 to 6 times as much po tassium as sodium .

URINE
TABLE 40.
— Distribution ofmineralmetabolism (urine excretion) in experimentwith L .
C C C C C
0 0 0 0 0
0 765
1 062
0 6 16
0 604
0 659
0 597
0 701
0 664
0 500
0 4 68
0 428
0 366
0 385
Potassium and sodium .
91 6
1Determinations in urine for about 22 hours.
0 744
O 624
0 268
0 293
0 176
0 224
0 174
0 146
0 096
0 142
Toyonaga1 in Tokio found that in the muscles there is always less
calcium than magnesium,thus confirming the analyses Of Katz ,
2 butin the glands there is always more calcium than magnesium.
Aloy,3 studying the calcium andmagnesium content of muscle, found
about twice as much magnesium as calcium . Perhaps of more interest1Toyonaga, Bul. Coll . of Agr. , Tokio , 1902—1903 , 5 , p. 14 3 , and p . 4 55 ; also 1904
—1905 , 6 , pp.
89 and 357 .
2Katz , Archiv f. d . ges. Physio l 1896 , 63 , p . 1 .
aAloy , Compt. rend . So c. Bio l . , 1902 , 54 , p . 604 .

290 A STUDY OF PROLONGED FASTING .
in this particular study are the observations of Magnus—Levy,1 who ana
lyzed the body of a man who had commi tted suicide. His resultsShowed about three times as much magnesium as calcium in themuscles .On the basis of all the analyses prior to those of Magnus-Levy, Aron
2
gives the average figure for the relationship of magnesium to calciumin the muscle Of dogs as 1 to 0 54—0 60 and in the muscle of horses as1 to In general , then, we may assume that there is approximately three times as much magnesium as calcium in themuscle ofman.
We may consider the magnesium excretion as more nearly an indexof the muscle disintegration than calcium
,for while there is, to be sure,
a smal l percentage of magnesium oxide in bone, there is a much largeravailable supply of calcium oxide in the form of bone which is unquestionably drawn upon. Th e calcium-oxide excretion is therefore theresultant of two factors , i . e.
,muscle disintegration and bone disin
tegration, while magnesium oxide is derived almost exclusively fromthe non-osseous tissue.
It is a matter of regret that the small amount of magnesium presentin the urine and the necessity for combining the samples for severaldays renders it very difficult to make an exact comparison betweenthe magnesium excretion and the other urinary constituents . In
general , however, the magnesium excretion follows approximatelythe nitrogen excretion. Of striking interest is the fact that, on thefirst day of the fast , an extraordinarily low amount of both magnesiumand calcium were excreted . The increment in the magnesium excre
tion on the second day (i . e.,100 per cent) was not approximated by
the excretion of any other element in the body.
The results of the analyses reported by Cathcart for Beauté, whilerelatively few in number, are in full conformity with our findings ,save that the magnesium excretion on the days prior to the fast ismuch larger than that found with L . Furthermore, L . excreted considerably more calcium per day than did Beauté during the fastingperiod .
In the food period following the fast , it is interesting to note thestriking fall in the excretion of all of the minerals save sodium . Forthe first 2 food days there was but half as much calcium excreted ason the last day Of the fast , about one-third as much magnesium,
seventenths as much potassium, and about the same amount of sodium .
On the last day of the food period after the fast , the calcium was seventenths that of the last fasting day, the magnesium one-seventh, thepotassium one-fifth , and the sodium about the same as on the last fasting day .
The amounts of calcium,magnesium,
potassium,and sodium intake
are unknown for these days , yet these elements must have been presentin the food taken. It is Obvious that the effect of the ingestion of a large
1Magnus~ Levy , Biochem . Zeitschr . , 1910, 24 , p . 363 .
2Aron. Oppenh eimer'
s Handbuch der B iochem ie des Mensch en u . der Tiere , 1909 , l , p . 88 .

292 A STUDY OF PROLONGED FASTING .
reducing power as the fast progressed , regardless of any inherent differences which might exist in the two methods .The reducing power of the fasting urines in the experiment with L .
was at all times well within normal limits,averaging not far from the
values Observed on control normals in this laboratory. The largestamount on the fasting days was 498 milligrams for the fourth and sixteenth days , and the smallest amount was 296 milligrams for the thirdand Sixth days .A large amount of reducing power was found on the first day of food
following the fast . On this day the subject ate in a relatively Shorttime about 500 grams of carbohydrate, chiefly in the form of soluble
TABLE 4 1 .— Total reducing power of urine in experimentwith L .
‘Determ ined in urine for about 22 hours.
dextrose, the diet consisting of honey and the juice of grapes, oranges ,and lemons . Unquestionably this amount exceeded his carbohydratetolerance on that day and grams of dextrose were thereforeexcreted in the urine. It is possible that we find here with man thecondition with dogs described by Hofmeister1 as “ hunger diabetes ,
”
and it may be an interesting confirmation of his theory.
Recent ly, also , Rietschel2 has noted that the fasting of infants has
resulted in a marked lowering of their tolerance for carbohydrate substances . This lowering has been so noticeable as to lead Rietschel towarn clinicians in the following words against the undue use of starvingin treating pathological cases :
“ Dass der Hunger spez . die abso lute Nahrungsentziehung furdengesunden,
wie besonders fiir den ernahrungsgestbrten Siiugling auch schwere Gefahrennach Sich ziehen kann ,
ist heute allgemein anerkannt.”
1Ho fmeister , Archiv f. exp. Path . 11 . Pharm . , 1889- 1890, 26 , p . 355 .
2Rietschel, Heubner’s Festschri ft, Berlin, 1913 , p . 5 16 .

URINE . 293
To attempt an analysis of the reducing substances in the urine duringthe fasting period would be somewhat difficult . A certain portionhas already been ascribed to creatinine and to uric acid, but there is nodefinite relationship between the amounts of uric acid , creatinine, andthe reducing power to be noted in the results obtained in this fastingexperiment .
CARBON IN URINE .
Wh ile the excretion of carbon in the form of carbon dioxide is of greatSignificance as indicating the total amount of energy transformed intoheat in the body, nevertheless when a study of the total loss of bodymaterial is of importance , as it is during comp lete fasting, the carbonin the urine must be taken into consideration . Since we were alsomaking a study of the energy output of the urine by burning samplesin a calorimetric bomb , it was relatively Simp le to combine the determinations of the energy output and the carbon content . Conse
quently,after the dried urine had been burned inside the bomb , the
carbon dioxide produced in the combustion was allowed to escape fromthe vessel through weighed soda—lime tubes, in accordance with themethod of Fries .1 These determinations were skilfully carried out byMr . A . W. Cornell , of the L aboratory staff.
The description of the method of preparation and drying Of the urinesamples for the bomb calorimeter has already been given in the discussion of the total solids in the urine .
2 From the weight of the carbondioxide in the soda—lim e tubes and the weight of the urine
,the amount
of carbon per day excreted in the urine is readily computed . Thesevalues are given in table 42 .
The determination of carbon in urine has been for many years asubject of research in this laboratory and in the chemical laboratoryof Wesleyan University . Various methods have been tried
,including
the moist combustion process , drying with and without the additionof salicylic acid
, and with and without the use of the cellulose filterblocks recommended by Kellner .3 The method which gives the largestpercentage of carbon is presumably the best one , and this has been ourcriterion . No method that we have thus far used approaches the largepercentage of carbon which is obtained by the method previously described
,
4namely, drying first with 50 mi l ligrams of salicylic acid, then
transferring to a nickel capsule,drying inadesiccator until readyto burn,
and finally burning in compressed oxygen in a bomb calorimeter, andal lowing the carbon dioxide to escape into soda- lime . Wh en the heatof combustion is desired
,the determination of carbon occupies but
a fewmoments additional, thus providing the Simplest and best methodfor Obtaining the required values . The preliminary operations of dryingrequire but l itt le attention from the assistant .
1Fries, Journ. Am . Chem . So c . , 1909 , 31 , p . 272.
2See p . 243 .
“Kellner, Landw. Jahrb. , 1896 , 47 , p . 297 .
4Higgins and Benedict , Am . Journ. Physio l , 19 1 1 , 28 , p . 291 .
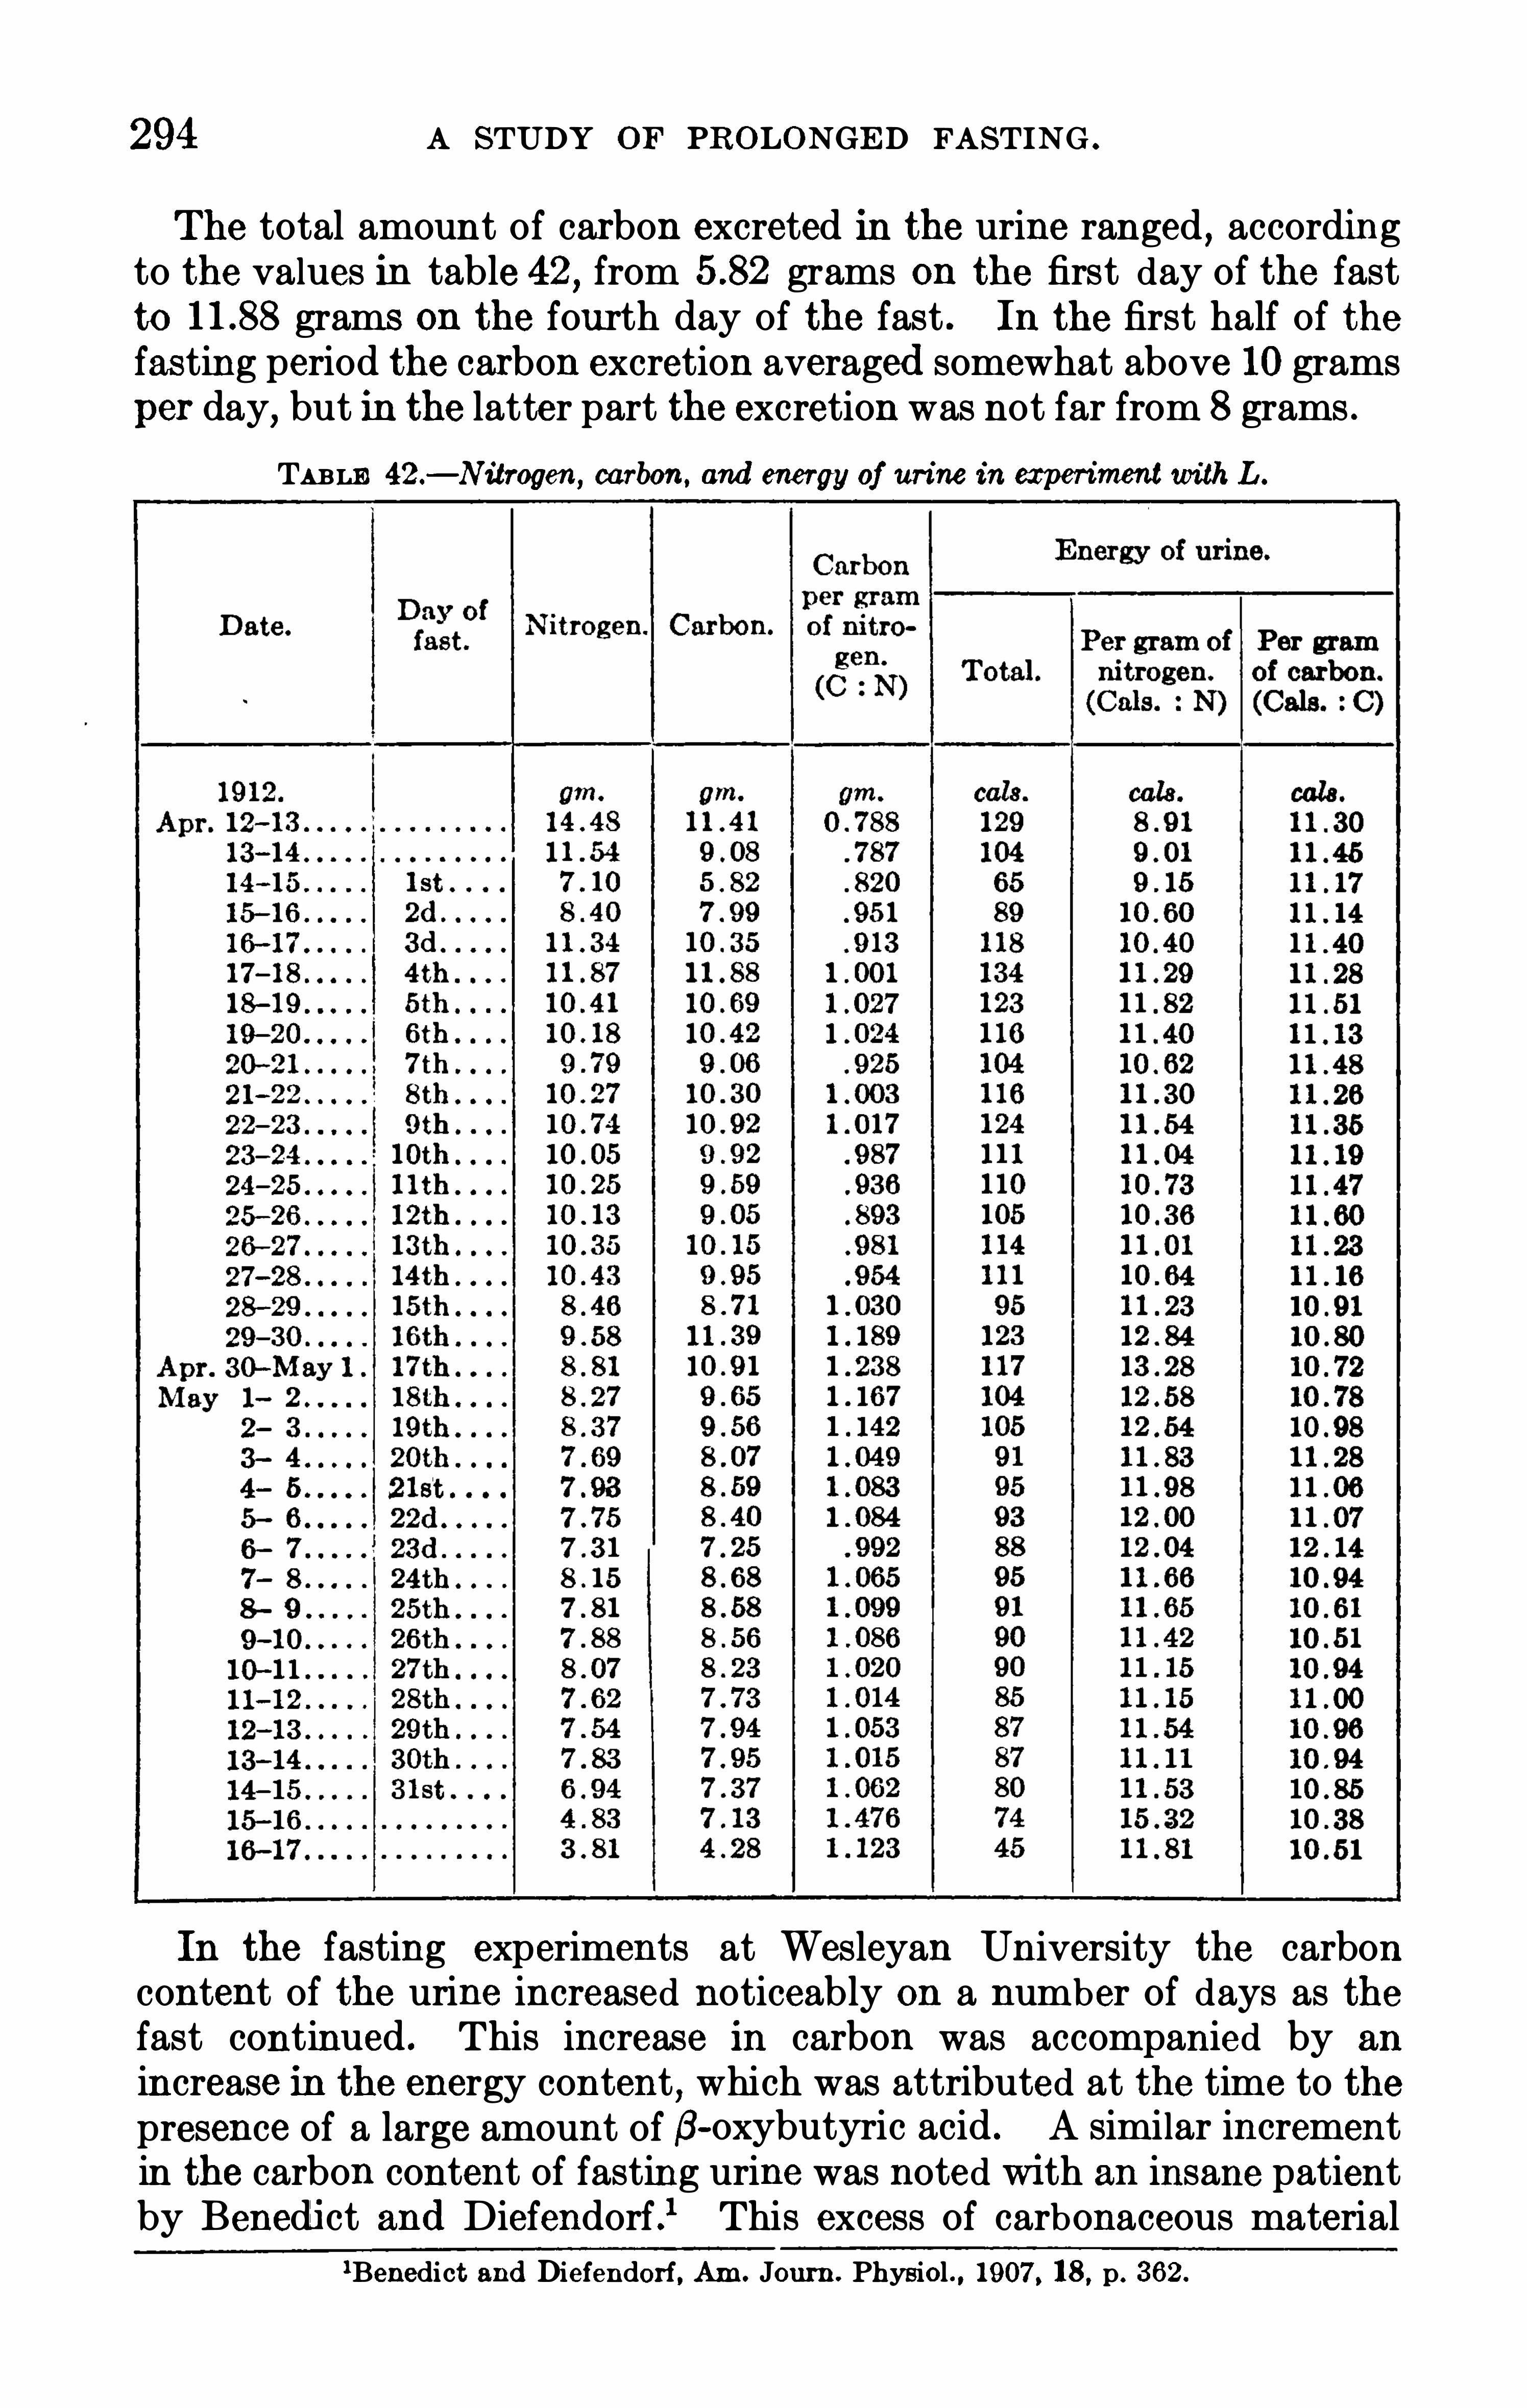
294 A STUDY OF PROLONGED FASTING .
The total amount of carbon excreted in the urine ranged , accordingto the values in table 42, from grams on the first day of the fastto grams on the fourth day of the fast . In the first half of thefasting period the carbon excretion averaged somewhat above 10 grams
per day, but in the latter part the excretion was not far from 8 grams .
TABLE 42.— Nitrogen, carbon, and energy of urine in experimentwith L .
In the fasting experiments at Wesleyan University the carboncontent of the urine increased noticeably on a number of days as thefast continued . This increase in carbon was accompanied by an
increase in the energy content , which was attributed at the time to thepresence of a large amount of fl-oxybutyric acid . A similar incrementin the carbon content of fasting urine was noted with an insane patientby Benedict and Diefendorf .1 This excess of carbonaceous material
1Benedict and Diefendorf , Am . Journ. Physiol . , 1907 , 18 , p. 362.

296 A STUDY OF PROLONGED FASTING .
With normal urines,therefore, one may conclude that the carbon
nitrogen ratio may vary from to Many interesting casesare recorded in which the disturbance of the carbon-nitrogen ratio hasbeen found . In the fasting experiments at Wesleyan Universitycarbon-nitrogen ratios during fasting ranged from a minimum ofto a maximum of On 7 days out Of 43 the ratio was over 1 ,these 7 days being the last 4 days of a 7-day fast and the last 3 of a4—day fast . In certain types of fever, also , Magnus-Alsleben
1 foundan increase of the carbon-nitrogen ratio , while in others there was amarked decrease . He also reports three cases in which extremelyhigh ratios were obtained after severe muscular work , these ratiosbeing and respectively. It is thus clear that underconditions which result in an abnormal katabolism
,disturbances in
the carbon-nitrogen ratio are found,and conversely a disturbance of
this ratio may be taken as primafacie evidence of a distinctly disturbedkatabolism .
Th e carbon-nitrogen ratio has been computed for each day of thefasting experiment with L . and likewise for the food days prior and subsequent to the fast . These values are included in table 42, togetherwith the values for the total nitrogen . On the 2 days before the fastthe ratio was very constant , averaging It then rose rapidly untilthe fourth day, when it was Slightly over and remained at approximately 1 until the maximum level was reached between the sixteenthand nineteenth days of fasting . The very high value of on the
first day with food after the fast is in part explained by the excretionof grams of dextrose in the urine. It is seen from these ratios ,therefore , that the urine excretion after the first day or two regularlycontained some nitrogen-poor and carbon-rich substance which, fromal l evidence, appears to be B—oxybutyric acid. Since the 2 days withfood before the fast agree so perfectly, we have felt justified in using theaverage value of for computing the normal amount of carbonaccompanying nitrogen in the indirect computation of the amount of
B-oxybutyric acidpresent in theurine. (See column B ,table 38, pageThe values found with L . during fasting are materially higherthroughout the entire fast than those reported byMunk for Breithaupt,for on 6 days of the fast Munk found no difference in the carbonnitrogen ratio between the fasting days and the 2 days with foodfollowing the fast . On the last 6 days of a 3-weeks fast Grafe2 foundextraordinarily high carbon-nitrogen ratios as follows :
On the first food day the ratio fell toThe three Observations of Pettenkofer and Voit3 may also be cited,these investigators finding on the first fasting day an average ofas th e carbon-nitrogen ratio .
lMagnus-Alsleben , Zeitschr. f. klin . Med . , 1909 , 68 , p . 358 .
2Grafe , Zeitschr . f . Physio l. Chem . , 19 10 , 65 , p . 21 .
aPettenkofer and Voit, Zeitschr. f. Bio l . , 1866 , 2 , p . 4 59 .

URINE . 297
ENERGY OF URINE .
In studying the metabolism of a fasting man, although we are par
ticularly interested in the energy transformed in the body and leavingthe body as heat , a complete picture of the total breaking-down oftissue and loss of body material can not be had without a knowledge ofthe potential energy of unoxidized material in the urine throughoutthe fasting period . Determinations of the heat of combustion weremadeby Mr. A . W. Cornell , the results given in table 42 being alwaysthe average of two or three well-agreeing analyses .During the fasting period the total amount of energy lost in the
urine ranged from 65 calories on the fir st day to 134 calories on thefourth day . There was a general tendency after the fourth day forthe values to fall off gradually as the fast continued ; excluding the firstday , the smallest amount (80 calories) was found on the last day of thefast . The energy was also determined for the 2 days immediatelypreceding the fast , the values being 129 and 104 calories respectively.
On the days with food following the fast, very small amounts of energywere found , these being 74 calories on the first and 45 calories on thesecond food day .
CALORIE-NITROGEN RA TIO .
Since the total amount of energy lost per day may vary with theamount of nitrogen excreted, and since there will always be a certainamount of potential energy normally accompanying each gram ofnitrogen in the urine, it is important to compute the number of calories
per gram of nitrogen . The results of such computation are also givenin table 42.
On the 2 days before the fast, there were about 9 calories daily per
gram of nitrogen . The ratio remained practically unchanged on the
first day of the fast , but for the next 4 days it Showed a distinct tendency to increase . The highest ratio found during the fasting periodwas calories per gram of nitrogen on the seventeenth day
,and the
lowestwas calories on the first day of the fast . It is thus seen that,except on the first day
,the ratios throughout the fast were compara
tively high , exceeding those found for the preceding food days . The
ratios for the 2 days with food fo llowing the fast are influenced by thefact that on the first day
,when the diet contained an excessive amount
Of carbohydrate, there was a measurable amount of sugar excretedgrams) , which would obviously increase the energy but have no
effect upon the nitrogen ; furthermore , on the second day a very smallamount of nitrogen was excreted . Neither of these values can of coursebe looked upon as obtained under normal conditions .
With normal subjects and an ordinary diet,the ratio of calories
to nitrogen is essentially constant . Thus Benedict and Milner1 foundlBenedict and Milner , U . 8 . Dept . Agr . , O ffice Exp . Sta. Bull . 175 , 1907 , p. 14 5 .

298 A STUDY OF PROLONGED FASTING .
an average calorie-nitrogen ratio of for 58 rest and work experi
ments with normal individuals in the respiration calorimeter at Wes
leyan University, the variations being extremely small , ranging fromto When unbalanced diets are taken, this ratio may be some
what altered . Tangl1 reports the ratio considerably higher on the
days when the diet was rich in carbohydrates and poor in fat,the ratio
becoming as high as on the carbohydrate- rich days and fallingto on the carbohydrate-poor days . On the other hand
,Benedict
andMilner noted no appreciab le change due to diet .In the earlier fasting experiments the energy in the urine has been
rarely determined , the most extensive investigation being that inWes
leyan University? in one experiment a calorie—nitrogen ratio was foundranging from toThe large ratios found during fasting experiments are unquestionablyto be explained by an excretion of nitrogen-poor, carbon-rich material ,which is chiefly B-oxybutyric acid . Unfortunately, in the earlierObservation Of Benedict and Diefendorf , in which the very high ratioof was found , direct evidence of the excretion of B—oxybutyricacid was not obtained , as the determinations were not then feasible .
Assuming that the high calorie nitrogen ratio is due to the presence ofacetone bodies , it can be seen that during the fasting experiment ofthe subject L. the highest acidosis as measured by this means occurredbetween the fifteenth and twenty-fifth days, high ratios prevailing forthis entire period .
CALOBm-CARBON RATIO .
While it is perfectly possible to have a carbon-rich,nitrogen-free
substance in the urine which would profoundly affect the calorienitrogen ratio , the presence of carbonaceous material in all energyproducing material found in urine would lead one to suppose that therelationship between calories and carbon would be much more regularthan that between the calories and the nitrogen . The calorie-carbonratios have been computed for this experiment and are included intable 4 2. The striking irregularities in the other ratios given in thistable are entirely absent in the calorie-carbon ratio , for they remainremarkably constant under all conditions . The values for the entireseries, including both the first and second food periods, range onlybetween on the twenty-third day of the fast and on the firstday with food after the fast . In the fasting period itself the minimumvalue was on the twenty-sixth day . It is thus seen that duringthe total 31 days of the fast there were , on the average, caloriesfor each gram of carbon.
Th e average calorie-carbon ratio in these fasting urines , namely,calories
,is almost exactly the same as that found by Higgins and
lTangl, Arch iv f . Anat. u . Physiol . , 1899 , Physiol . Abth . Supp . , p. 25 1 .
2Benedi ct, Carnegie Inst. !Vash . Pub. 77 , 1907 , p . 4 93 , and Benedict and Diefendorf , AmJourn. Physiol . , 1907 , 18, p . 362.

MICROSCOPY OF URINE AND TESTS FOR ALBUMIN.
BY HARRY W. GOODAL L , M. D.
The heat test was used in making the albumin determinations . Forthe sake of uniformity the microscopic examination was made as followsz Two 15 mm . x 15 mm . cover-glass fields were examined with eachspecimen,
20 minutes being given to searching for and counting casts .Th e urine was centrifuged at a uniform rate for 5 minutes . The resultso f the tests are given herewith .
DETAILED RESULTS .
April 14— 15 (first day of fast) .— Albumin, absent. Sediment, no casts,blood
,or pus; rare round cel l , occasional squamous cell ; little mucus .
April 15— 16 (second day of fast) .— Albumin, absent. Sediment, no casts
or pus ; rare normal red blood corpuscle , rare small round cell ,occasional squamous cell ; little mucus.
April 16— 17 (third day Of fast) .— Albumin, absent. Sediment, one hyalinecast, small diameter, no blood or pus; few smal l round cells, rare largecaudate cell
,numerous squamous cel ls; rare spermatozoa, normal
in appearance ; little mucus.
April 1 7— 18 (fourth day of fast) .— Albumin, absent. Sediment, no casts,blood
,or pus ; few small round and squamous cells, littlemucus .
April 18— 19 (fifth day of fast) .— Albumin, slightest possible trace . Sedi
ment, 13 hyaline casts , 3 coarse granular casts, all of large diameter ;a few of the casts with cel ls adherent ; smal l round cel lsmore numerous ; few squamous cel ls.
April 19—20 (sixth day of fast) .— Albumin, least possible trace. Sediment,15 hyaline casts, 2 coarse granular casts, nearly all Of large diameter,some with cells adh erent ; few smal l round and squamous cel ls.
April20—21 (seventh day of fast) — Albumin, slightest possible trace. Sedi
ment,5 hyaline casts, 9 coarse granular cells, all of large diameter,
some with ce lls adherent ; rare normal red blood globule, numeroussmall round cel ls, few squamous cel ls; rare spermatozoa, normal inappearance .
April 21—22 (eighth day of fast) -Albumin, slightest possible trace .
ment, 4 hyaline casts, 5 coarse granular casts, nearly all Of largediameter, some with cells adherent ; numerous medium and smal lround cel ls; rare smal l caudate cel l ; little mucus.
April 22—23 (ninth day of fast) -Albumin, slightest possible trace . Sediment, 5 hyaline casts, three of which had a few cel ls and fat dropsadherent ; 5 coarse granular casts with cells adherent, all casts oflarge diameter ; no blood or pus; few smal l andmedium round andsquamous cells; rare Spermatozoa, normal in appearance.
April23—24 (tenth day of fast) —Albumin
,slightest possible trace (albumin
cloud more marked than at previous examinations) . Sediment,8 hyaline casts , some with cel ls and fat drops adherent ; 4 coarsegranular casts; all casts of large diameter ; no blood or pus ; few smal landmedium round and squamous cells; little mucus.
April24—25 (eleventh day of fast) —Albumin, slightest possible trace (sameas last examination) . Sediment, 4 hyaline casts; 3 coarse granularcasts; general tendency to diminution in diameter of casts; adherentcells and fat drops less numerous; few smal l andmedium round and
squamous cells.

MICROSCOPY OF URINE AND TESTS FOR ALBUMIN .
April 25— 26 (twelfth day of fast) .w Albumin, least possible trace (same aslast examination) . Sediment, 7 hyaline casts, 6 coarse granular casts,chiefly smal l diameter ; few fat dropsandcel ls adherent ; few leucocytesand smal l round cells; few acid sodium-urate crystals; little mucus.
April 26— 27 (thirteenth day of fast) .— Albumin, slightest possible trace(reaction less marked) . S ediment, 15 hyaline casts; 2 coarse granular casts ofmedium size and with a few cells adherent ; few leucocytes and smal l round cel ls.
April 27— 28 (fourteenth day of fast) .— Albumin, slightest possible trace(same as last examination) . Sediment, 6 hyaline casts, 2 coarsegranular casts, all casts ofmedium Size andwith a few cel ls adherent ;few leucocytes and smal l round cells ; numerous Spermatozoa.
April 28—29 (fifteenth day of fast) — Albumin, slightest possible trace (veryfaint reaction) . Sediment, 15 hyaline casts ; 10 coarse granular casts,few cells and fat drops adherent ; general tendency to decrease indiameter of casts; few smal l and medium round cel ls; rare smal lcaudate and neck-oi-bladder cells.
April 29— 30 (sixteenth day of fast) .— Albumin,
slightest possible trace(same as last examination) . Sediment, 14 hyaline casts ; 12 coarsegranular casts, chiefly of smal l diameter ; few smal l and mediumround cells; rare neck-of-bladder cel ls.
April 30—May 1 (seventeenth day of fast) . —Albumin
,slightest possible
trace (very faint reaction) —Sediment, 7 hyaline casts, 2 fine granularcasts
,some with few fat drops and cells adherent ; casts of smal l
diameter ; few smal l and medium round cel ls; rare neck-Of-bladdercel ls; few squamous cells.
May 1—2 (eighteenth day of fast) — Albumin, slightest possible trace (veryfaint reaction) . S ediment, 8 hyaline casts; 4 coarse granular casts,smal l diameter, few fat drops and cells adherent ; few smal l andmedium round cells; few squam ous cel ls.
May 2— 3 (nineteenth day of fast) — Albumin, slightest possible trace (veryfaint reaction) . Sediment, 8 hyaline casts; 4 coarse granular casts,smal l diameter, few fat drops and cells adherent ; few smal l andmedium round and squamous cells; little mucus.
May 3— 4 (twentieth day of fast) — Albumin, slightest possible trace (veryfaint reaction) . S ediment, 6 hyaline casts; 2 fine granular casts, allcasts of small diameter, a few containing fat drops; few Squamouscel ls; little mucus .
May4— 5 (twenty-firstday of fast) — Albumin, least possible trace (very faintreaction) . Sediment, 4 hyal ine casts; 2 fine granular casts, of smal ldiameter ; few smal l andmedium round cells; few squamous cells.
May 5- 6
'
(twenty-second day of fast) —Albumin, slightest possible trace
(very faint reaction) . Sediment, 7 hyaline casts; 4 coarse granularcasts, all casts of smal l diameter ; few smal l round and squamous cel ls .
May 6— 7 (twenty-third day of fast) —Albumin
,slightest possible trace
(very faint reaction) . Sediment, 7 hyaline casts; 3 coarse granularcasts, al l casts of smal l diameter ; few small round and squamous cel ls.
May 7— 8 (twenty-fourth day of fast) — Albumin ,
least possible trace (veryfaint reaction) . Sediment, 6 hyaline casts; 4 coarse granular casts, allof smal l diameter ; few smal l andmedium round and squamous cells.
May 8— 9 (twenty-fifth day of fast) — Albumin , slightest possible trace(very faint reaction) . Sediment, 6 hyaline casts; 2 coarse granularcasts; all casts of small diameter, occasional fat drops and cel lsadherent ; few smal l and medium round and squamous cells; somecells slightly fatty ; rare Spermatozoa, normal in appearance .

302 A STUDY OF PROLONGED FASTING .
May 9— 10 (twenty-S ixth day of fast) — Albumin, slightest possible trace(very faint reaction) . S ediment, 8 hyaline casts; 1 coarse granularcast ; all casts of smal l diameter ; occasional fat drops and cellsadherent ; few small and medium round and squamous cells
,some
cel ls slightly fatty ; rare spermatozoa, normal in appearance .
May 10—1 1 (twenty-seventh day of fast) -Albumin
,slightest possible trace
(very faint reaction) . Sediment, 8 hyaline casts ; 1 coarse granularcast ; all casts of smal l diameter, with a few fat drops and cel ls adherent ; rare spermatozoa, normal in appearance ; few medium roundcells, slightly fatty ; few squamous cells.
May 1 1— 12 (twenty-eighth day of fast) — Albumin, slightest possible trace(very faint reaction) . Sediment, 6 hyaline casts ; 2 coarse granularcasts; all casts of smal l diameter, a few fat drops and cel ls adherent ;numerous spermatozoa, normal in appearance .
May 12— 13 (twenty-ninth day of fast) -Albumin , slightest possible trace(very faint reaction) . Sediment, 10 hyaline casts, 3 coarse granularcasts ; all casts of smal l diameter, few fat drops and numerous cellsadherent ; few smal l and medium round cells ; few squamous cells ;few Spermatozoa
,normal in appearance .
May 13- 14 (thirtieth day of fast) — Albumin, slightest possible trace (veryfaint reaction) . Sediment, 12 hyaline casts; 1 coarse granular cast ;all casts of smal l diameter, few fat drops and rather numerous cel lsadherent ; few smal l and medium round cells; few squamous cel ls;few spermatozoa, normal in appearance .
May 14— 15 (thirty-first day of fast) . —Albumin,
slightest possible trace(distinctlymore than last examination) . Sediment, 36 hyaline casts;2 coarse granular casts; casts of smal l and large diameter about equalin number ; few fat drops and epithelial cells adherent ; few smal landmedium round cel ls; numerous squamous cel ls.
May 15— 16
‘
(first day after breaking fast) .— Albumin, slightest possibletrace . Sediment, 18 hyaline casts; chiefly of smal l diameter, with afew fat dropsand rare epithelial cellsadherent ; few small andmediumround cells; few squamous cells; very many spermatozoa, normal inappearance ; many acid sodium-urate crystals.
May 16— 17 (second day after breaking fast) . —Albumin, slightest possibletrace . S ediment, 2 hyaline casts of smal l diameter ; few smal l andmedium round cel ls; few squamous cells; little mucus.
May 17— 18 (third day after breaking fast) . —Albumin, slightest possibletrace . S ediment, 2 hyaline casts ; 1 epithelial cast of smal l diameter ;few small andmedium round cells; few squamous cells; many spermatozoa, normal in appearance ; many calcium-oxalate crystals.
October 19 (five months after breaking fast) -Albumin, least possible trace .
Sediment, 2 hyaline casts of small diameter ; few small andmediumround cells; occasional neck-of-bladder cells; few squamous cells.
SUMMARY.
The most remarkable change in character of the urine noted duringthe fastwas the appearance Of albumin and casts on the fifth day, whichpersisted throughout . A summary of the results is given in table 43 .
During the first24 hours that food was taken,the urine contained sugar1
and the sediment Showed numerous calcium-oxalate crystals .Th e sexual system of the subject remained active throughout the
entire period of observation . According to his own statements, aseminal emission occurred two nights before the fast began, he had
1See p . 292.

THE RESPIRATORY EXCHANGE.
Any study of the respiratory exchange in a living animal is of dualvalue , for if properly conducted it throws light upon the character ofthe katabolism and also supplies data for computing by the indirec tmethod the heat-production of the body, thus serving as a controlupon the direct calorimetric measurements of the heat-production.
In the fasting experiments atWesleyan University, themeasurements ofthe respiratory exchange and of the heat-production were coincidentalthroughout the entire period of the fast . This S imultaneous determination had certain great advantages , particularly in establishingthe fundamental laws Of metabolism obtaining in the early stages ofinanition . On the other hand , it gave very little opportunity forsecuring evidence regarding the minimum or basal metabolism of thefasting subject , Since a prerequisite of a study of the basal metabolismis a period of absolute muscular repose .
In these earlier fasting experiments , such a period Of absolute muscular repose was best secured during the night , when the subject wasin bed and supposedly sound asleep , i . e. , quietly at rest . The subjectwent to bed at 11 O
’clock and as the experimental periods were all of2 hours ’ duration,
the period from 1 a . m . to 7 a . m . could reasonablybe taken as the time when the subject had a minimum activity. Unfortunately no direc t evidence regarding the degree of muscular activitycould be Obtained . Furthermore
,there was no evidence as to whether
the subject was asleep the entire time or more or less awake and somewhat restless .It seemed advisable, therefore, in planning the study of the long fastat the Nutrition Laboratory, so to arrange the experimental techniqueand routine as to include a series of respiration experiments whichwould throw definite light upon the character of the katabolism
,
measured in both long and short periods, and to be able to isolate
certain periods in which the subject was perfectly quiet and under thesame conditions of muscular activity throughout the entire series offasting days . The respiratory exchange of the fasting subject wastherefore studied in two ways , i . e .
, by using the bed calorimeterand the so-called “ universal respiration apparatus .” With the bedcalorimeter both the heat-production and the gaseous exchange couldbe studied throughout the period that the subject remained in the
chamber. In the experiments at Wesleyan University the subjectremained in the chamber throughout the whole fasting period and therespiratory exchange could be studied in 24 -hour periods . In the prolonged fasting experiment at the Nutrition Laboratory , however, thecalorimeter periods usually began at 9 or 10 p . m . and continued until8 a . m . the following day . Thus for 10 or 1 1 and but rarely for 9 con
304
THE RE SP IRATORY EXCHANGE . 305
secutive hours , the gaseous metabolism of the subject inside the
chamber could be studied . Graphic records of the degree of muscularactivity were also secured by a special form of bed.
The possible differences in the degree of sleep and the degree ofrestlessness and the impossibility of determining the actual periodsof wakefulness and Sleep made it seem undesirable to rely wholly uponthe determinations of the respiratory exchange made by this methodfor a comparison of the metabolism as the fast progressed . Conse
quently each morning, at the conclusion of the night experiment , therespiratory exchange alone was studied for two or three experimentalperiods by means of the universal respiration apparatus . With thisapparatus it was possible to obtain the gaseous metabolism for severall5—minute periods in which the subject lay perfectly quiet and awake,thus giving material for compari son for each day of the fasting period .
Th e element of uncertainty as to the degree of muscular activity and thedegree of wakefulness or sleep was by this method entirely eliminated .
With both forms of apparatus the respiratory quotient could be accurately determined , SO that amutual controlwas obtained on the accuracyof the two methods of determining the respiratory exchange.
APPARATUS ANDMETHODS USED IN THE CALORIMETER EXPERIMENTS.
It is unnecessary to enter into the details of the construction and the
technique Of using the respiration calorimeter or of the methods of calculating the results Obtained with it , as these have been fully explainedelsewhere.
1 Since the publication of this description, however, a numberof minor though important changes have been made in the apparatus ,andhence it seems desirable to discuss them here somewhat at length , sothat the complete techn ique used in these experiments may be available .
Although the fundamental principle involved in thedetermination of therespiratory exchange has not been altered in the slightest degree, ouraccumulated experience enabled us to develop a technique to meet thespecial conditions of the fasting experiment which not only facilitatedthe manipulation of the apparatus but also gave greater accuracy .
ABSORPTION OF WATER-VAPOR AND CARBON DIOXIDE .
According to the usual arrangement of the absorbing system ofthis apparatus , large porcelain vessels of special form ,
made by theRoyal Berlin Porcelain Works of Berlin , Germany, are used to hold thesulphuric acid for absorbing the water from the air-current
,and silver
plated brass cans for holding the soda-lime for absorbing the carbondioxide . Both of these containers weigh considerable and when theamount of water or carbon dioxide absorbed is 20 to 30 grams , thebalance on which they are weighed (which is accurate to aboutgram) is sufficiently exact . On the other hand
,when small amounts of
1Benedict and Carpenter, Carnegie Inst.Wash . Pub. 123 , 19 10.

306 A STUDY OF PROLONGED FASTING .
water or carbon dioxide are to be determined , as for example 10 gramsor less , these vessels are too large .
In the earlier part of the fasting experiment , the calorimeter experiments were usually subdivided into three periods , SO that the amount ofcarbon dioxide to be weighed represented that produced in about 3hours
,or approxim ately 4 5 to 60 grams . Toward the end of the fasting
period it seemed desirable to obtain more definite information regardingthe progress of the metabolism throughout the night and hence an
attempt was made to secure shorter periods . On one night (May 4— 5)the periods were but 1 hour long ; under these circumstances only about1 1 grams of carbon dioxide were absorbed in each period . It wasnecessary , therefore, to have some form of absorbing vessel which wouldweigh considerably less than the usual containers , as the error in weighing might make a measurable difference in the results . We accordinglyreplaced the large vessels with soda- lime bottles and glass sulphuricacid containers
,i . e.
,
“ Williams bottles ,” similar to those used in the
absorbing circuit of the respiration apparatus, and from that timedivided the calorimeter experiments into relatively Short periodsthroughout the night , weighing the water and carbon dioxide in thesesmaller and more accurately weighed containers . A complete description of the glass sodwlime bottle and the Williams bottle is given elsewhere .
1 Soda- lime was used as the absorbent for carbon dioxidethroughout the whole fasting experiment , for although at the time thedescriptionof the respiration calorimeterwas published experimentswerebeing made with potash-lime, subsequent experience has convinced usthat , as yet, the original form of soda-lim e has not been improved upon.
ANALYSIS OF CHAMBER AIR AT THE END OF PERIODS .
While it was desirable to Obtain as Short and as many periods aspossible in the night calorimeter experiments , it naturally became difficult to arrange the routine so as to secure the largest number of periodswithout decreasing the accuracy and overtaxing the strength of theassistants, especial ly as a continuous metabolism experiment of 35 to40 days was quite outside Of our experience . With three periods ineach experiment , as was at first planned , it was possible to arrange theprogram so that a trained observer with two responsib le assistantscould readily carry out the routine of a calorimeter experiment . One
of the difficult parts of the program was to make provision for theanalysis of the air residual in the chamber at the end of each period .
It had been our custom to do this by deflecting a certain volume of theair from the outgoing air- current through a series of U-tubes containingsoda lime
,and pumice stone and sulphuric acid respectively, which
absorbed the carbon dioxide and water-vapor from the air. The airlBenedict, Deutsch . Ar chiv f. klin . Med . , 19 12, 107 , p . 166 . See , also , figure 39 , p. 3 16 , of
this publication. for a diagrammatic representation of these bottles.

308 A STUDY OF PROLONGED FASTING .
concordant results could be obtained . Hence, to secure records ofthe water-vapor in the residual air
,it was only necessary to place this
psychrometer in the air-current inside the respiration chamber . Itwas so arranged that the air leaving the chamber came through a pipeOpening at the rear and extending along the bottom to the front ofthe chamber near the glass window . The air passed over the drybulb of the psychrometer and from there over the wet bulb
,and then
directly to the blower outside . It was therefore possible for the observer on the outside to read both mercury thermometers through theglass front of the calorimeter chamber ; readings to 0 01
° C . couldordinarily be relied upon. By means of psychrometric tables , theamount of water-vapor residual in the chamber could be very readilycomputed . It is thus apparent that by reading the psychrometer andtaking a single sample of the air in the chamber and subsequently analyzing it , it was possible to obtain information regarding the contentof water-vapor and carbon dioxide in the chamber air at the end of eachperiod with a minimum utilization of the assistant’s time during thenight .The psychrometer is at present used in this laboratory for short
experiments with babies and small animals in which respirationchambers are employed . Having tested this method of determiningthe water-vapor by two other methods , we felt justified in employingi t in the long calorimeter experiments , especially as it requires onlythe reading of the two thermometers by the assistant at the end ofeach period . To use the psychrometer successfully, it is necessarythat the air Should pass rapidly over the bulbs of the thermometers .Care should also be taken that the fabric about the wet-bulb thermometer is kept moist , as in long experiments of 10 or 12 hours itoccasionally becomes dry, so that false readings are obtained .
It is obvious that no one of these methods, i . e. , the sulphuric acidpumice stone
,the Sondén hygrometer, or the psychrometer, gives the
true value for the water-vapor inside the chamber, as they measureonly the water-vapor in the outgoing air, and there is certainly an areaabout the ingoing air pipe (where the air is entering absolutely freefrom water-vapor) which is of a much lower water-content , notwithstanding the fact that the air is fairly well circulated inside the chamberby means of an electric fan. It should be considered, however, thatthe values obtained at the beginning and end of each period are forcomparison only and we deal here with differences rather than withabsolute amounts .This change in methods was particularly advantageous for the deter
mination of the residual carbon dioxide. When U-tubes are used , itis necessary to pass 10 liters of air through them in order to secure aweighable amount of carbon dioxide. For doing this in a relativelyshort time, such as 3 minutes , a ventilation through the U-tubes of

THE RESPIRATORY EXCHANGE . 309
about3% liters per minute is required and the use of fairly largeU- tubes,
each weighing about 80 to 90 grams . A combination of one soda-limeU-tube followed by a pumice-stone sulphuric acid U-tube weighs notfar from 160 to 180 or even 190 grams , while the amount of carbondioxide to be weighed is sometimes no more than 60 milligrams . Whenexperimenting with a man awake or doing severe muscular work, themethod is perfectly satisfactory, but when experimenting with a man asemaciated as our fasting subject , with a minimum metabolism, and
producing only a small amount Of carbon dioxide per hour , it is obviousthat the residual carbon dioxide in the chamber would be low and itwould be difficult to obtain very accurate determinations under theseconditions . With the Sondén gas-analysis apparatus, on the contrary ,it waspossible to determine per cent of carbon dioxide to the thirdsignificant figure with great accuracy . The advantage of thus obtaining a more delicate determination of the carbon dioxide and at the sametime decreasing the work required of an assistant during the long nightperiod made it desirable to introduce the method by which the sampling pipette with subsequent analyses could be used to determine thecarbon dioxide and the wet and dry-bulb psychrometer for determiningthewater-vapor. The sampling tubes were collected each morning afterthe night experiment was over, and the analyses made on the Sondén
apparatus by Miss Alice Johnson, whose technical skill in the use ofthis apparatus was well attested in the research on the composition ofoutdoor air previously referred to .
TENSION EQUALIZER.
The rubber bathing cap used as a tension equalizer in the earlierform of respiration calorimeter has been replaced by a spirometer whichwas first designed for the universal respiration apparatus . A briefdescription of this Spirometer with diagram (figure 40) is given on
page 318, but a more detailed description may be found in an earlierpublication.
1
The Spirometer is attached directly to the side of the respirationchamber and thereby becomes a part of the chamber volume, thus
providing for fluctuations in the volume of the air inside the apparatus .As the carbon dioxide is absorbed by the soda-lime and the oxygen isused by the man inside the calorimeter, the total volume of the airinside the chamber gradually decreases . Accordingly the Spirometerbell slowly falls until a certain point is reached where an electric contact
(not shown in figure 40) is made and oxygen thereby automatical lyadmitted bymeans of an electric valve attached to the oxygen cylinder.When sufficient oxygen is admitted to raise
“
the bell and break thecontact , the flow of oxygen is automatical ly stopped ; in this way thesupply of oxygen is under continuous control .
1Benedict, Deutsch . Arch iv f. klin. Med. , 1912, 107 , p. 172. See also Benedi ct and Talbot.Carnegie Inst. Wash . Pub. 201. 1914 , p . 43 .

310 A STUDY IN PROLONGED FASTING .
In the fasting experiment, use was made of this spirometer to indicate the constancy of conditions . For example , if the oxygen supplywas completely Shut off for 5 or 6 minutes before the probab le end ofan experimental period and the pointer on the spirometer bell wasallowed to rest against the smoked-paper drum
,a regular rising curve
would be drawn on the rotating drum,thus indicating the slow
,steady
fall of the spirometer bell . If the subject made a muscular movement ,as in turning over, or for any reason there was an irregularity in thecurve , it was Obvious that there was a sudden expansion or contractionof the air in the chamber which could not be corrected for by the measurement of the temperature and barometer. Consequently, if such anirregulari ty in the line occurred during the last 5 minutes of the experimental period , the length Of the period was extended until a regularcurve could be secured . This was most helpful in many instances .Specimen curves are given in figure 36 Showing this method of utilizingthe Spirometer. It is of course necessary to note the exact height of thespirometer at the moment the period is ended . This is done by reading the position of the pointer attached to the counterpoise of the Spirometer as it travels over a millimeter scale .
7m !inmus.
MAY IL IQIZ
FIG . 36 .— Specimen records of change in volume of the spirometer on the bed
calorimeter during last 5 minutes of periods in experiment with L .
ARGON IN OXYGEN FROM LIQUID AIR .
In recent years we have used the nearly pure oxygen obtained fromliquid air by the Linde Air Products Company . At first we wereunaware of the fact that the residual gas was not, as commonly conSidered, all nitrogen with an atomic weight of 14 , but consisted in largepart of argon with an atomic weight of 40 . Hence it has been necessaryto emphasize the fact that in computing either the volume of oxygenadmitted from a cylinder or in calibrating a gas-meter by the method ofweighing the oxygen,
1 the composition of this residual gas should betaken into consideration,
as otherwise an appreciable error in the percentage of oxygen may easily occur. Thus , in a series of observationscarried out on diabetics2 and likewise another series on muscular work,
3
1Benedict, Physical Review , 1906 , 22, p . 294 .
2Benedict and Joslin , Deutsch . Arch iv f . klin . Med . , 1913 , 111 , p 350 .
‘Benedict and Cath cart , Carnegie Inst . Wash . Pub. 187 , 1913 , p . 74 .
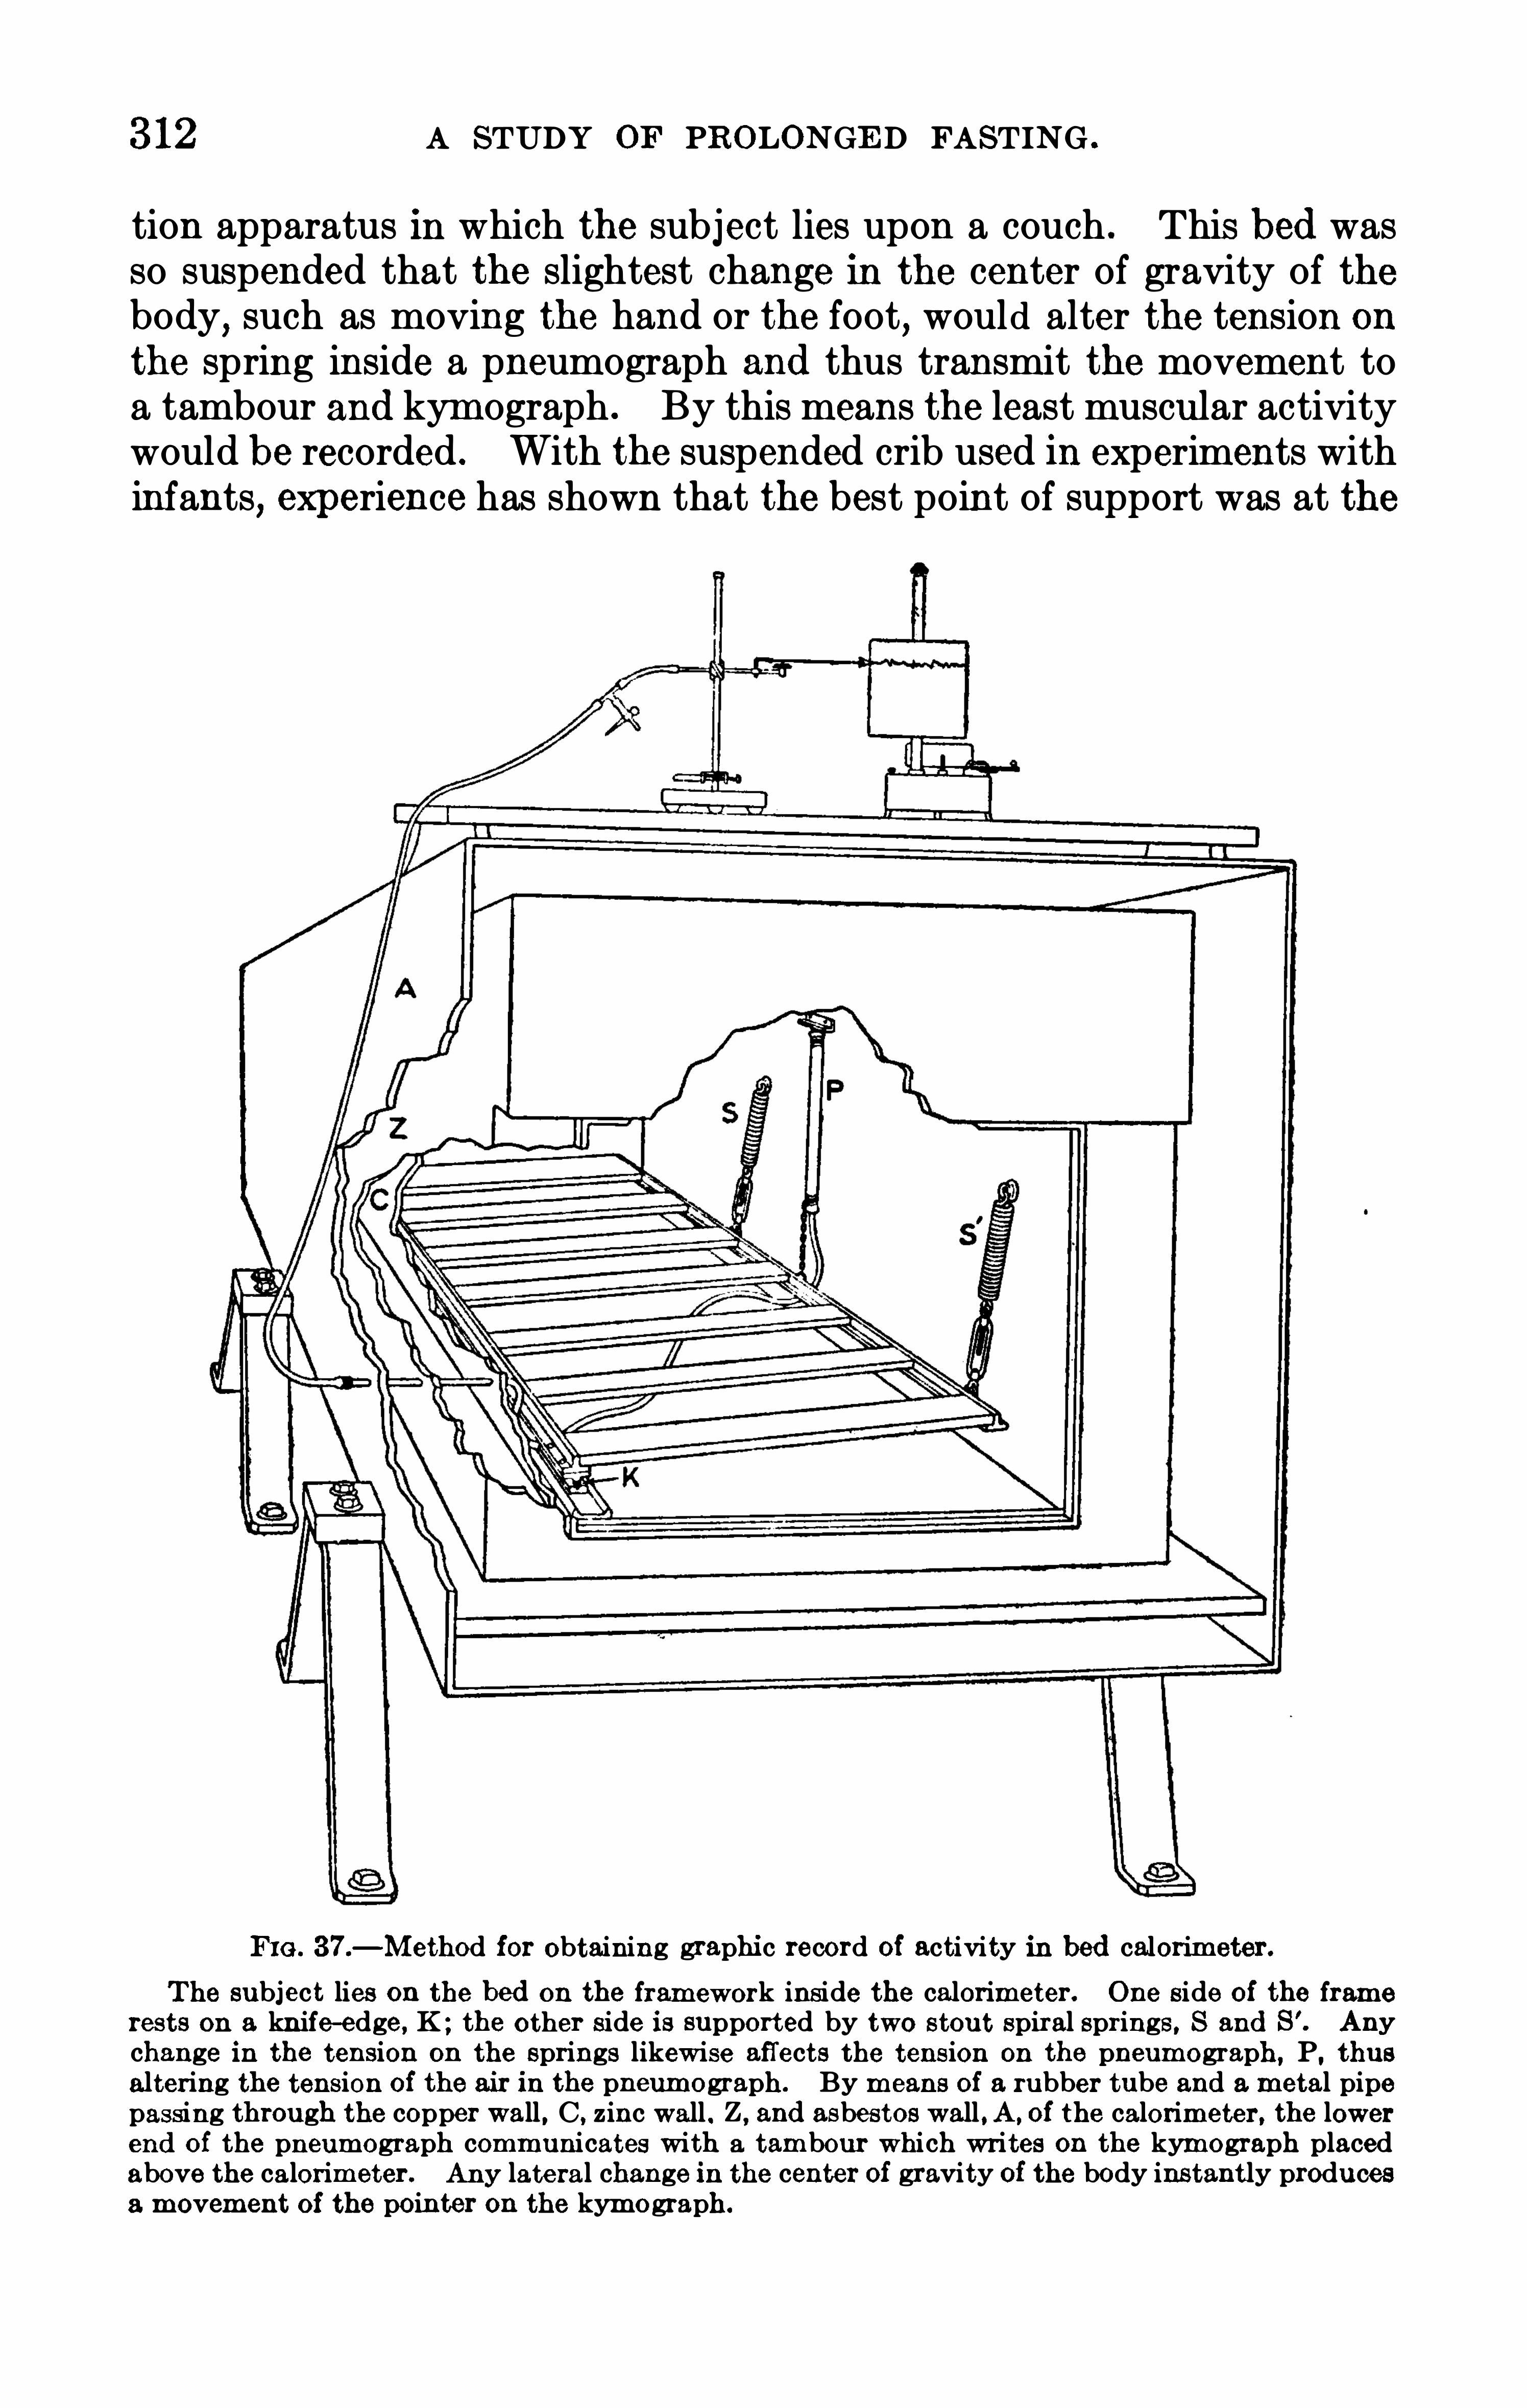
312 A STUDY OF PROLONGED FASTING .
tion apparatus in which the subject lies upon a couch . This bed wasso suspended that the slightest change in the center of gravity of thebody
,such as moving the hand or the foot
,would alter the tension on
the spring inside a pneumograph and thus transmit the movement toa tambour and kymograph . By this means the least muscular activitywould be recorded . With the suspended crib used in experiments withinfants, experience has shown that the best point of support was at the
FIG . 37 .— Method for obtaining graphic record of activity in bed calorim eter.
The subject lies on the bed on the fram ework inside the calorimeter. One side of the frame
rests on a knife-edge , K ; the oth er side is supported by two stout spiral springs, S and S'. Any
change in the tension on the springs likewise affects the tension on the pneum ograph ,P
, thus
altering the tension of the air in the pneumograph . By m eans of a rubber tube and a metal pipepassing th rough the copper wall , C , zinc wall . Z , and asbestoswall , A , of the calorimeter, the lowerend of the pneumograph communicates with a tambour which writes on the kymograph placedabove the calorimeter. Any lateral change in the center of gravity of the body instantly producesa m ovem ent of the po inter on the kymo graph .

THE RE SPIRATORY EXCHANGE . 313
foot of the crib , the Spring being placed at the head . With adults,how
ever, we soon found that the major movements were lateral rather thanlengthwise Of the body and the supports and Springs were accordinglyplaced at the sides of the bed instead of at the head and foot .This bed, when used in the calorimeter chamber, was supported at
one side on two frictionless steel points and at the other by two stoutSpiral Springs which could be adjusted by turnbuckles to bring the bedto a level position. Obviously any change in the center of gravity ofthe body altered the tension upon the two supporting springs, whichwere therefore elongated or shortened . When the pneumograph wasattached to the bed, the same force producing the elongation orcontraction of the Springs affected the pneumograph . The changein the tension of the air inside the pneumograph was transmitted by theusual method, i . e. , by means of a metal tube passing through the wallsof the chamber and subsequently by a rubber tube connecting with thetambour
,writing-point
,and kymograph . The method of obtaining
this graphic registration of the muscular activity is Shown in figure 37 .
In this figure the open end of the bed calorimeter is shown in perspective and in a somewhat schematic way. C ,
Z, and A represent
respectively the inner copper wall of the chamber, the zinc middle wall ,and the outer asbestos wall . The framework of the bed is seen at thebottom of the calorimeter chamber with the left-hand edge restingon the steel support , K . The two Spiral springs, S and S
’
,each pro
videdwith a turnbuckle,are attached at the upper end to the wall of the
calorimeter chamber and at the lower end to the right-hand edge of thebed. Midway between the Springs is attached a pneumograph , P , the
upper end of which is attached to the wall of the calorimeter chamber .The subject, lying upon an air mattress which is in turn resting upon
a long plate of galvanized iron, is slid on to the bed framework feet first .AS the weight of the body falls upon the framework, the Springs , S andS’
, become extended , the adjustment necessary to secure perfect leveling of the bed being made by means of the turnbuckles . If the subjectturns during the night
,a greater tension is put upon the Springs, S
and S’
, and the pneumograph , P , is elongated .
1 The air in the tubeconnecting the pneumograph with the outside of the chamber is thussomewhat rarefied and the tambour pointer sinks, thus producing adepression in the line on the kymograph drum .
1For the benefit of oth er workers in this field , it is of interest to record here the recent experience Of Dr. Paul Roth , of Battle Creek , Mich igan . In recording the body-movements of men or
women ly ing on beds, he replaced the pneumograph with a small Po litzer bulb, so adjustedas to be somewhat compressed by the bed—frame . The bulb was connected to the tam bour and
kymograph . Preliminary tests made in the Nutrition Laboratory with the Politzer bulb arrangement have sh own that th e results of the variation in pressure on the bulb by variation in muscularactivity are most satisfactory , not only with adults but also with small animals— a fact Of specialinterest in connection with the research on infants. Two serious obj ections to the pneumograph ,
i . e. , the danger of leaks through th e rubber and the difficulty Of renewing the rubber, are thusobviated by the use of this bulb. A flexible rubber bulb o f small size is best used .

314 A STUDY OF PROLONGED FASTING .
I. APRIL IO- l I. l9 |2
1 . APRIL I4 -IS . l9 12
rag— “
7 m m IIL APRIL 29 -30 . l9 l2
11 MAY l3 -l4 . I9 I2
FIG . 38.— Specimen pneumograph records of movem ents of bed calorim eter lever mattress
support in ni gh t experiments with L .
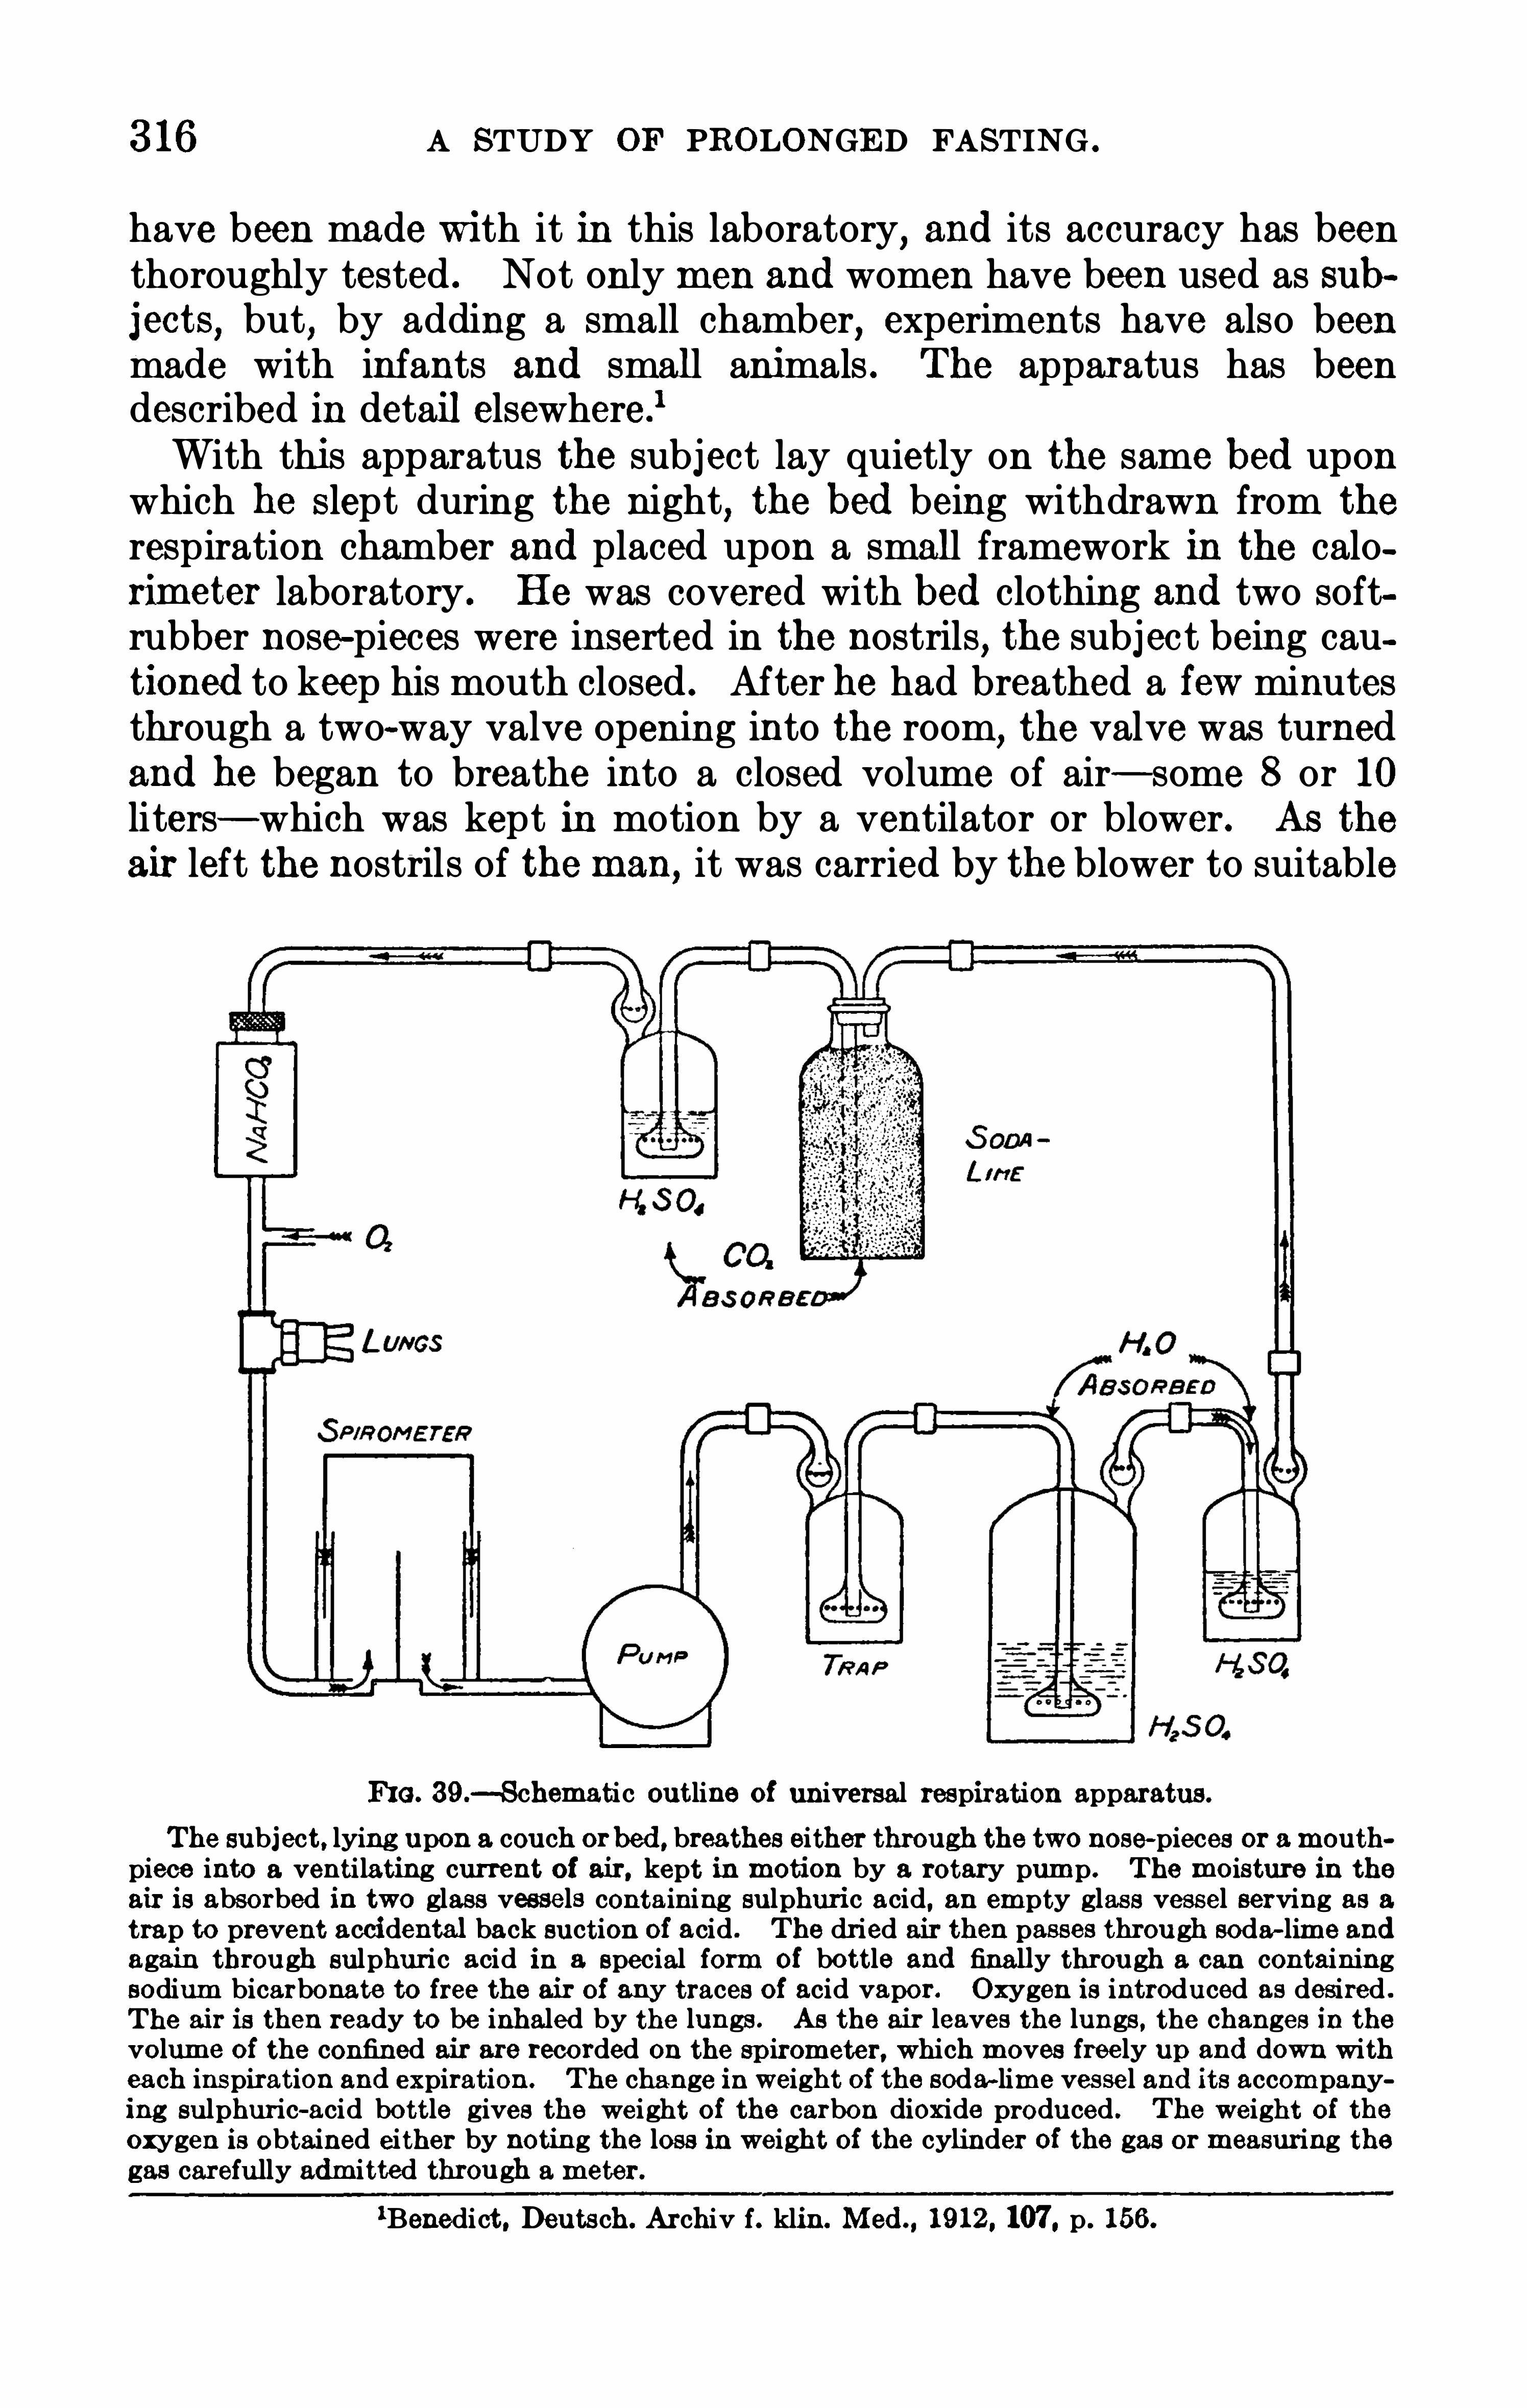
316 A STUDY OF PROLONGED FASTING .
have been made with it in this laboratory, and its accuracy has been
thoroughly tested . Not only men and women have been used as subjects, but , by adding a small chamber, experiments have also beenmade with infants and small animals . The apparatus has beendescribed in detail elsewhere .
1
With this apparatus the subject lay quietly on the same bed uponwhich he S lept during the night, the bed being withdrawn from the
respiration chamber and placed upon a small framework in the calorimeter laboratory . He was covered with bed clothing and two softrubber nose-pieces were inserted in the nostrils
, the subject being cautioned to keep his mouth closed . After he had breathed a few minutesthrough a two-way valve opening into the room
,the valve was turned
and he began to breathe into a closed volume of air— some 8 or 10liters— which was kept in motion by a ventilator or blower. As the
air left the nostrils of the man, it was carried by the blower to suitable
FIG. 39.-Schematic outline of universal respiration apparatus.
The subject, lying upon a couch orbed, breathes either through the two nose-pieces or amouth
piece into a ventilating current of air, kept in motion by a rotary pump. The mo isture in theair is absorbed in two glass vessels containing sulphuri c acid , an empty glass vessel serving as atrap to prevent accidental back suction of acid . The dried air then passes through soda-lime and
again through sulphuric acid in a special form of bo ttle and finally through a can containingsodium bicarbonate to free the air of any traces of acid vapor. Oxygen is introduced as desired .
The air is th en ready to be inhaled by the lungs. As the air leaves the lungs, the changes in thevo lume of th e confined air are reco rded on the spirometer, wh ich moves freely up and down witheach inspiration and expiration. Th e change in weigh t of the soda-lime vessel and its accompanying sulphuric-acid bo ttle gives the weigh t of the carbon dioxide produced . The weight Of theoxygen is Obtained either by noting the loss in weight of the cylinder Of the gas or measuring thegas carefully admitted through a meter.
1Benedict , Deutsch . Archiv f. klin. Med 1912, 107. p. 156.

THE RESPIRATORY EXCHANGE . 317
containers in which the water and carbon dioxide were absorbed ;oxygen was next added from a cylinder of weighed gas or through acalibrated meter to replace that used by the man ; the air was thenreturned to the subject . The amount of carbon dioxide excreted wasobtained from the changes in weight of the absorbersand the amountof oxygen consumed from the record of the oxygen admitted to the aircurrent . Experiments could be made with this apparatus with periodsas short as 15 minutes . The general scheme of the respiration apparatus is shown in figure 39.
In this apparatus provision has been made for fluctuations in thevolume by attaching a tension equalizer. In the earlier forms of therespiration apparatus, a rubber bathing cap was used as a tensionequalizer, but more recently this has been replaced by a Spirometer .This Spirometer not only provides for the fluctuations in the volume ofair
,but has been utilized for recording the character of the respiration
,
as has already been noted in a previous section of this publication.
(See page It has also been usedwith the bed calorimeter for indicating the constancy of conditions . (See page Th e details ofthe Spirometer are Shown in figure 40 .
With each inspiration and expiration,the thin copper bell
,c,of the
spirometer falls and rises in the annular space between the copper walls,
a and b,this space being filled with water . To the counterweight rod
,
g, g, g, is attached a pointer, h, which writes on the smoked-papersurface of the kymograph drum . A wheel , r, with a milled edge, isrotated by each upward movement of the cord , t, which rests in a groovein the edge of the wheel , the pawl , u, preventing any backward movement Of the wheel . By means of a platinum contact on the peripheryof r
,each complete revolution of the wheel may be recorded . An expla
nation of the use made of the records obtained with this spirometerand a series of typical kymograph curves are found on pages 158 to 160.
The respiration apparatus was used regularly each morning of thefast for an experiment immediately following the night ’s sojourn in thebed calorimeter . The subject, lying upon his bed, was transferreddirectly from the calorimeter chamber to the respiration apparatus .He then turned upon his Side and urinated without rising and the
respiration experiment was begun shortly afterwards . In the latterpart of the fast, the apparatus was used for a respiration experimenteach evening about an hour before the subject entered the calorimeter.At irregular intervals throughout the fast the respiratory exchange wasalso studied with the respiration apparatus
,while the subject was
Sitting quietly in a chair or writing steadily , as he did much of the time .
The apparatus was likewise used for experiments in which the subjectbreathed an oxygen-rich atmosphere while lying upon the couch .
All of these experiments included two or three periods of approximately 15 minutes each, in which records of the degree of muscular

318 A STUDY OF PROLONGED FASTING .
FIG . 40.— Spirometer for studying thefmechanics of ventilation.
Air leaving the lungs enters the pipe , m n ,
and passes into the spirometer bell , c. Thisbell moves up and down in the annular spacefilled with water between the inner coppersh ell , 0 , and the outer copper sh ell , b. The
bell is counterpo ised by a rod. 0 g a, and a
small supplementary weight, 1, attached to acord , t, the counterpo ise being supported byan aluminium wheel . e, over which the thread(1 passes. The h eight of th e spirometer can
be read by the po inter, h , on a millim eter
scale , p. or the po inter It can be made towrite directly upon a kymo graph drum . A
work adder wheel , r, is so attached that thecord t passes through a groove in its peri
phery . and the wheel consequently ro tateswith each downward motion of the bell c . The
pawl , u, prevents back motion.
A pro jection, w, in the peripheryof th e wheel makes an electriccontact and permits graph ic t ecord Of each complete revolu
tion of the work adder wheel .For counting the respirations
a new attachment, 3 , has beenemployed . A stee lwire is looselyfastened around the hub Of thewheel , r. By means of a light
spring , lateral tension is
brought againstthe movable rod, 0 .
As the rodascends,the steel wire t o
tates out of the
m e r c u r y c u pbreaking the electric contact : as therod moves down,t h e c o n t a c t i smade. A smallstop above the
m ercury cup pre
ventsthewire fromrising too far.
320 A STUDY OF PROLONGED FASTING .
quotient of but would,under like conditions , be Obtained with the
respiration apparatus . On the other hand, the experiments madewith the universal respiration apparatus are extremely helpful as ageneral index of the resp iratory exchange from which the calorimetrycan be computed by the indirect method . We considered it of importance to make a special effort to secure experiments of shortduration, as the technique of the experiments made by Luciani on Succihave been adversely criticized by Zuntz and the experiments made byZuntz and his co-workers on the fasters Breithaupt and Getti in Berlinwere certainly complicated by colic and a head cold . Moreover, it isnot unreasonable to suppose that the technique in thirty years hasbeen material ly improved .
STUDIES WITH THE BED CALORIMETER.
ATMOSPHERIC CONDITIONS INSIDE THE CHAMBER.
Prior to a consideration of the results of the study of the gaseousexchange inside the bed calorimeter, it is advisable to note the exactconditions of ventilation, temperature, and particularly relativehumidity under which this subject was living in the chamber . The
respiration calorimeter was ventilated at a rate of approximately 40liters per minute, or roughly speaking , liters per hour. Sincethe volume of the chamber was not far from 800 liters , theoreticallythe air would be replaced inside the chamber three times each hour .The cooling arrangement prevented an abnormal rise in the temperature, and a study of the relative humidity under these conditions presents certain features Of interest . Since the air is dried over sulphuricacid before it is returned to the calorimeter, it enters the respirationchamber absolutely water-free and consequently the only sourcesof water-vapor inside the chamber are the lungs and the Skin of theman. The ventilation of the chamber per hour , the amount of watervaporized per hour, the average temperature of the calorimeter chamber, and the relative humidity of the air are given in table 44 .
Daily tests, in which the number of revolutions of the blower arerecorded by an automatic counter, have shown that in general 210 revolutions of the blower correspond to a ventilation of 1 cubic foot orliters of air . The total ventilation may therefore be obtained by dividing the number of revolutions by this factor andmultiplying byAs a matter of fact , the number of revolutions per cubic foot of airwas determined each day and this variable used in the calculation.
From the length of period as given in table 44 , the ventilation per
hour was readily found .
All of the water-vapor removed from the chamber was absorbed bysulphuric acid as the ventilating current passed through the absorbingsystem . The total amount was corrected for the small amount of

THE RE SPIRATORY EXCHANGE . 321
water vaporized from thewet bulb of the psychrometer, and the amount
per hour found in the usual way.
The average calorimeter temperature was secured by means of aseries of resistance thermometers . The relative humidity was calcu
lated from the amount of water vaporized per liter of ventilation and
the number Of milligrams of water-vapor in one liter of air saturatedat the calorimeter temperature.
The rate of ventilation and the rate of carbon-dioxide pro ductionwere such that the usual proportion of carbon dioxide residual in the
TABLE 44 .— Ventilation of chamber and relative humidity during experiments with L . in bed

322 A STUDY OF PROLONGED FASTING .
chamber at the end of each experimental period throughout the nightwas not far from per cent byvolume or approximately 13 times thatof normal air . This percentage of carbon dioxide in the air, and indeeda very much higher percentage
,has been shown to be entirely without
effect upon persons breathing such an atmosphere,
lSO that it may be
stated with perfect confidence that the excess amount of carbon dioxidepresent in the chamber could in no way have influenced either therespiratory exchange or the heat-production of the subject .AS will be seen from table 44 , the ventilation of the chamber averaged not far from to liters per hour throughout the 31 daysof the experiment , the range being from liters to liters perhour . The hourly vaporization Ofwater had a tendency to decrease asthe fast progressed , the largest amount being on the night of the thirdday of fasting and the smallest on the night of the fifteenth day offasting . The average temperature of the calorimeter remained for themost part within a few tenths of a degree of the average figure , C .
The relative humidity shows an interesting course. Beginning withapproximately 60 per cent on the nights fo l lowing food , it decreasedto a m inimum level of approximately 39 per cent from the fifteenth tothe twenty-first day and thereafter rose gradually to the end of thefast . The variations in the excretion of water-vapor and the cause Ofthe fluctuations in the relative humidity will be discussed in a subsequent section of this publication.
2 The results secured in the measurements of the respiratory exchange inside the bed calorimeter may,therefore , now be considered .
MEASUREMENT OF THE RESPIRATORY EXCHANGE INSIDE THE
BED CALORIMETER .
With the bed calorimeter it is possible to determ me Simultaneouslythe water vaporized inside the chamber, the carbon dioxide produced ,and the oxygen consumed . These determinations were made directlyon four nights prior to the fast, on the 31 nights of the fast , and for twonights after the fast . While the greatest emphasis must be laid uponthe total amounts measured , the absorbing vessels were changed severaltimes dming the night , so that the experiment was usually subdividedinto three periods . In the latter part of the fast , the measurementswere made in five or six periods, and on two nights
,seven and nine
periods respectively . It was accordingly possible to compute the carbon-dioxide output , the oxygen intake , and the respiratory quotient forthe whole experiment and also for the individual periods , thus giving acontrol on the measurement of the respiratory exchange.
‘Benedict and Milner , U. S . Dept. Agr . , Office Exp. Stas. Bul. NO . 175 , 1907 , p . 237 .
2See page 373 .

A STUDY OF PROLONGED FASTING .
265 c .c . per minute , and for the third period 270 c .c . per minute . The
carbon-dioxide production for the corresponding periods was respectively 227 , 221 , and 218 c .c . per minute and the respiratory quotients
and respectively .
The subdivision into experimental periods was made in an attemptto secure information regarding the periodic changes throughout thenight . But from fundamental factors in the technique of the calorimeter experiments , the longer the experimental periods , the more accurate are the measurements of the carbon-dioxide production and es
pecially of the oxygen consumption ; hence by subdividing these totalvalues
,a certain degree Of accuracy is sacrificed in the measurements
,
although the average values for the night are unaffected . This mayexplain certain discrepancies in the respiratory quotient and in the
general conformity of the curves for the oxygen and the carbon dioxide .
It will be seen that as a rule the curves for the carbon dioxide and
oxygen are essentially paral lel , although they are by no means straight
O‘
OOPM . QOO ’ M Z OOAM
A PR . 2 0 - 2 !
O 7 l
FIG. 42 .— Curves showing oxygen consumption, carbon-dioxide production, and respiratory quotient durifl
night periods in the bed calorimeter for the fifth to the fifteenth days of the fast.

THE RE SPIRATORY EXCHANGE .
lines for the whole experiment . Occasionally, discrepancies are found,as on April 10— 1 1 (the first night of the experiment) when the carbondioxide production is higher in the second period than in the last period ,while as a matter of fact the oxygen consumption is apparently somewhat lower. This is especially noticeable on April 22— 23
,when the
carbon-dioxide production in the last period increased and the oxygenconsumption decreased . As would be expected , the possibilities for adiscrepancy between the curves increase as the period is shortened andconsequentlywe find on the night of May 4— 5 , when the experiment wasdivided into nine periods , that while the values as a whole are approximately parallel
,in the sixth and seventh periods there is a great in
crease in the oxygen consumed which is unaccompanied by a corresponding increase in the carbon-dioxide production . Similar irregularitiesare to be noted on the night of May 13— 14 . In general , however,there is a striking tendency toward paral lelism in the two curves .After the first three nights of fasting, the minimum values for carbon
dioxide and oxygen are usually found in the middle period of the night,
i . e. ,from 2 to 4 a .m .
,or thereabouts
,the morning period almost inva
MAY 4 - 5
FIG. 43 .— Curves showing oxygen consumption, carbon
dioxide production , and resp iratory quotient duringnight periods in the bed calo rimeter for the sixteenthto the twenty-fourth days of the fast.

A STUDY OF PROLONGED FASTING .
riably showing a tendency to rise . This may be seen with great regularity throughout most Of the curves, although there are enoughexceptions (for instance, on May 4—5 and May 6—7) to make it inapplicable in all cases .After the first few days of the fast , one would not expect a greatchange in the respiratory quotient , Since there would be no materialalteration in the character of the material oxidized in the body . Anexamination Of the respiratory quotients given with the curves showsthat they run not far from a constant value throughout the night withthe different conditions of food and fasting . Thus
,on the first few
nights with food , the values are considerably above but with thebeginning of the fast they drop rapidly to about remaining notfar from throughout the remainder of the fast . Occasionally certain fluctuations above or below the average figure may be observed ,
MAY 13 - 14
“M AY l6 ' l7
h e . 44 .— Curves Sh owing oxygen consumption , carbon-dioxide production , and respiratory quotient duringperiods in th e bed calorimeter for the twenty-fifth to th e th irty-first days of the fast and the seand th ird foo d days.

328 A STUDY OF PROLONGED FASTING .
10 or 12 hours . Consequently a comparison may be made of theresults obtained for the individual nights as the fast progressed . We
may,indeed , go further and compare not only the average values found
throughout the night , but likewise the average values for the minimumperiods in the experiments . While obviously there is an opportunityfor possib le error in thus selecting minimum periods
,particu larly in
the measurements of the oxygen consumption,nevertheless it is be
lieved that such errors will be equalized throughout a 31-day fast .Accordingly, in table 4 5 we give both the average and the minimum
TABLE !ti — Gaseous exchange of subj ect L . during experiments in the bed calorimeter at night.
1For the duration of the period during wh ich the m etabo lism was measured see table 44 .
3The duration of the periods in which these m inimum valueswere observed varies in generalfrom 3 hours to 1 hour .
THE RESPIRATORY EXCHANGE . 329
periodic values for the total gaseous exchange and the respirato ryquotient for each night of the experiment .The average for the carbon-dioxide production varied from 228 c .c .
per minute on Apri l 1 1— 12 (the second night of the preliminary food
period) to 109 c .c . onMay 7— 8 (the twenty-fourth ,night of theThe carbon-dioxide excretion during the fasting period was much lessthan during the days when food was taken, ranging from 165 c .c . onthe first night to 109 c .c . on the twenty-fourth night . This increasewith the taking of food is also shown in the two nights following thefasting period , when the carbon-dioxide production increased from 1 15
c .c . to 124 c .c . on th e second night after the food was taken,and to
188 c .c . on the third night .The minimum periods have a special interest , as they indicate the
lowest plane of metabolism during the experiment . These values rangefrom 218 c .c . on the first night with food to 103 c .c . on both the twentyfirst and thirtieth nights of the fast . As with the average values
, an
increase after taking food is noted in the minimum periods for the twonights following the fast .While the carbon dioxide of itself is a well-known index of themetab
olism,particularly in fasting , when the character of the material
burned remains relatively constant , nevertheless the values for oxygenlikewise have significance . The averagevalues for the oxygen consumption range from 276 c .c . on the first night with food to 151 c .c . on thethirtieth night of the fast . Considering only the fasting values
,the
oxygen consumed ranges from 212 c .c . on the first night of the fast tothe minimum noted above . While no increase in the oxygen consumption is apparent in the fir st value obtained after the taking offood
,a considerable increase is shown on May 17— 18
,the oxygen con
sumed being 194 c .c .The minimum periodic values for the oxygen consumption can notbe
considered to have the same degree of accuracy as the minimumperiodic values for the carbon-dioxide production
,but a comparison is
of interest . These values range from 265 c .c . on the first night withfood to 137 c .c . on the twenty-first night of the fast . During the fasting period the range is from 208 c .c . on the second night of the fast to137 c . c . on the twenty-first night . As with the average values , theminimum periodic values for the oxygen consumption do not Show an
increase after taking food until the third night .From an examination of all of the data given in table 45 for the car
bon-dioxide production and the oxygen consumption,it will be seen
that there was a striking tendency for the total metabolism to decreaseas the fast progressed . Both the average and the minimum periodicvalues show that the metabo lism reached a low point about thetwentieth day of the fast
,and from that time to the end of the fast there
was but little alteration .

330 A STUDY OF PROLONGED FASTING .
The oxygen consumption showed the same general course as the
carbon-dioxide production, there being a steady decrease until aboutthe twentieth day. Wh ile the values for the oxygen between thetwenty-first and the thirty-first days do not Show the regularity thatwas observed with the carbon dioxide during the same period , they stilldo not fluctuate widely from the lowvalue , the average values remainingbetween 151 c .c . and 162 c .c . and the values for the minimum periodsbetween 137 c .c . and 153 c .c . It will be seen , therefore , that themetabolism as indicated by the carbon-dioxide production and the oxygenconsumption decreased regularly until the twentieth day and from thattime until the end of the fast remained essentially constant .This observation is strikingly significant , inasmuch as one would nat
urally expect that , as the organism wasted away as a result of fasting ,the total metabo lism would decrease and likewise the intensity of themetabolism . The fact that the decrease in the metabo lism did not continue beyond the twentieth day is the more surprising , since the lossin weight continued regularly throughout the fast . The absence of acontinued decrease in themetabolism will subsequently be given specialdiscussion .
RESPIRATORY QUOTIENT.
At present the best index we have of the character of the materialburned in the body is the relationship between the volume of the carbondioxide excreted and the oxygen consumed , i . e. , the so- called respiratory quotient . When carbohydrates are burned , the volume of carbondioxide produced is equal to that of the oxygen consumed, the respiratory quotient being On the contrary , when fat is burned , there isa much less volume of carbon dioxide produced per liter of oxygen andthe respiratory quotient is not far fromIn the study of short fasts previously made at Wesleyan University
,
it was shown that the carbohydrates stored in the body (chiefly in theform of glycogen) were heavily drawn upon in the first few days of thefast and thereafter the body subsisted substantial ly upon fat and protein ,
but chiefly fat . In this fasting experiment , therefore , a rapidfall in the respiratory quotient would be expected during the first daysof the fast , and a possible constancy during the remaining days , showing a combustion of fat .By reference to the values for the respiratory quotient given in table
45,it will be seen that on the 4 nights prior to the fast the values
ranged from to averaging not far from This quotientis approximately that which would be expected with ind ividuals subsisting upon a mixed diet . On the first day of fasting, the respiratoryquotient fell to and remained for the next few days not far from
to On the sixth day a low value was found of but forthe remainder of the fast the respiratory quotient ranged above or
332 A STUDY OF PROLONGED FASTING .
pointed out that there is an intimate relationship between the bodytemperature and the metabolism . It is important
,therefore
,to con
sider the relationship between the metabolism as shown by the gaseousexchange and these two indices of the internal condition.
It has seemed impracticable to complicate the curves in figures 4 1 to44 by superimposing others , but a comparison can be made by referringto the curves for the pulse-rate and the body-temperature1 given inprevious sections of this publication . Such a comparison shows thatthe curves for the carbon-dioxide excretion, the oxygen consumption,
the pulse rate, and the body-temperature have in general the samecourse for each experiment , with a distinct tendency to fall off duringthe evening until a minimum is reached about the middle of the night ,and then to rise in the morning . This parallelism with the metabo lismis shown more clearly in the curves for the body-temperature , as thereare more variations in the curves for the pulse-rate , but the generalrhythm of the latter is much like that exhibited by the curves for themetabolism . Furthermore, there does not appear to be a materialdifference in these two relationships at the beginning and end of thefast , so that it would seem that fasting per se does not affect them.
The body acts as a unit , therefore, irrespective of the state of nutrition.
The intimate relationship between the pulse-rate and the metabolism
(which has been emphasized in this laboratory for a number of years)and the relationship between the body-temperature and themetabolismare thus not only demonstrated in a remarkable manner, but are alsoshown to be unaffected by a prolonged fasting period .
The relationship between the pulse-rate and the total metabo lismand the body-temperature and the metabolism as the fast progressedmay be discussed more in detail in connection with the values givenin table 45 , using the average values rather than those for the minimumperiods . In comparing these factors with the total metabolism on
successive nights,it should be borne in mind that the relationships
would not logically be expected to remain constant , for we have on theone hand the pulse-rate and the body-temperature governed by certainlaws and on the other an organism producing heat , the heat-producingmechanism of which is constantly diminishing in size .
The pulse-records for the nights preceding the fast are somewhatirregular, but the technique for making the Observations was not thenso perfectly developed as it was later in the experiment and the assistant had not the time to make such frequent records . It will be seen,
however, that the high pulse-rates were obtained with the high valuesfor the carbon dioxide and the oxygen during the 4 nights prior to thefast and throughout the first 2 weeks of the fasting period . In the
latter portion of the fast there was a distinct tendency for the averagepulse-rate to increase without a corresponding increase in the total
lSee figures 4 to 8 , pages 90 to 94 , and figures 12 to 18, pages 104 to 1 10 .

THE RESPIRATORY EXCHANGE . 333
carbon-dioxide output and oxygen intake . On May 17— 18, however,the great ly increased pulse-rate was accompanied by a correspondingincrease in both the carbon-dioxide output and the oxygen intake .
In general,then
,one may infer that even with an organism whose heat
producing mechanism is constantly decreasing in size, there is stillan intimate relationship between the pulse-rate per minute and the
total heat production. It should also be recognized that this relationship was somewhat disturbed during the latter portion of the fast ,but not sufficiently disturbed as not to be again apparent on the thirdday with food .
The body- temperature was not recorded on the nights precedingthe fast , but observations were made nearly every night of the fast andfor two nights following . The values given in table 45 for the fastingperiod have a distinct tendency to remain not far from an averagevalue of C .
, and range from C . on the twelfth night ofthe fast to C . on the twenty- fourth night . From the twenty-firstnight of the fast
,the values for the most part lie distinctly below the
average of the first 3 weeks of the fasting period ; but little if any relationsh ip is Shown between the average body-temperature and the totalmetabo lism . On the other hand , on the last night of observationafter the fast (May 17 the increased metabolism and increasedpulse-rate were accompanied by the highest average temperaturefound on any night with this subject .It is evident
,therefore, that while there is a tendency towards a
parallelism of the body- temperature and the metabolism throughoutany given night
,there is no distinct tendency towards parallelism
between the average temperatures of successive nights and the totalmetabolism as measured . Evidently the heat-regulating mechanismof the body is in large part independent of the total heat-productionor of the condition of nutrition of the subject .
STUDIES WITH THE UNIVERSAL RESPIRATION APPARATUS.
The facility with which experiments could be carried out with theuniversal respiration apparatus made it specially adapted for measuringthe metabolism of the fasting sub ject under various conditions
,such as
lying awake, sitting up either quiet ly or writing , or lying awake breathing an oxygen-rich atmosphere . It was also possib le to obtain accurate determinations of the respiratory quotient with this apparatus .This was of special importance , Since it was desired to estab lish assharp ly as possible the respiratory quotient obtaining during pro longedfasting , particularly as the low quotients found by Luciani and byZuntz and his co-workers have been the subject of much discussion .
Consequently it was decided that , throughout the entire fast , respiration experiments would be made as frequently as practicable in whichthe respiratory exchange would be determined under various condi

334 A STUDY OF PROLONGED FASTING .
tions . A summary of the data obtained in these experiments is givenin table 46 .
For purposes of comparison the oxygen absorbed and the carbondioxide produced were calculated on the basis of cubic centimeters
per minute. The respiratory quotient for each experiment and theaverage pulse-rate are also given in this table . The morning respiration experiments were made immediately fo l lowing the calorimeter
TABLE 46 .— Gaseous exchange of subject L . at different times of the day and with varying
activity. (Respiration apparatus.)
1During a period from 3ll 16m p.m . to 311 5 1m p . m . on this day , with the subject in the lyingposition. the observations were : Carbon dioxide , 14 0 c .c . ; oxygen , 189 c .c. ; respiratory quotient.
pulse-rate , 61 per minute .

336 A STUDY OF PROLONGED FASTING .
value of 237 c .c . was obtained on the first day of the fast,while the
minimum value of 165 c .c . was found on the twenty-third day of thefast . The striking constancy shown in the values for the oxygen con
sumption on the first four mornings prior to the fast and on the firstday of the fasting period is worthy of spec ial notice
,as it gives evidence
in the first place of the remarkab le constancy in the katabolism of thisman and likewise of the regularity of his muscular repose . Both thecarbon-dioxide production and the oxygen consumption fell off as thefast progressed , and although the minimum value for the oxygen con
sumption was reached on the twenty-third day, yet the remaining days
of the fasting period indicate a katabolism not far from the minimumvalue of 165 c .c . It is of particular interest to note that on the 17thof May, i . e.
,the second day of taking food , the metabolism had not
materially increased , as shown by the oxygen consumption,but on the
last morning (May 18) there was a marked increase from 170 c .c . to183 c .c .
The trend of the respiratory quotient is likewise significant . On the
first 4 days with food , the respiratory quotient varied from tothis being not far from the average respiratory quotient found withnormal individuals subsisting on a mixed diet . At the beginning of thefast , the respiratory quotient was a little lower on the first few daysand then steadily decreased until a minimum value of was foundon the seventeenth and eighteenth days . During the remainder ofthe fast, the value for the respiratory quotient remained at about 3 .
On the second day with food it rose to and on the third day withfood it reached the extraordinarily high value of indicating thatthe subject was surcharged with carbohydrate material . The absenceof very low quotients during the fast was noticeable. It should beborne in mind that the values for the oxygen consumption representmore nearly the true index of the total metabolism than do the valuesfor the carbon-dioxide production,
particularly in the 4 days with foodpreceding the fast and the first few days of fasting . After the third orfourth day of fasting
,however, the values for the carbon-dioxide pro ~
duction and the oxygen consumption were essential ly paral lel,so that
either may be looked upon as a true measure of the total metabolism .
RELATIONSHIP BETWEEN THE PULSE-RATE AND THE METABOLISM.
The pulse- rate remained remarkably constant for the first 4 dayswith food before the fast and likewise on the first few days of fasting ,ranging from 72 to 74 , which is in general conformity with the measurements of the oxygen consumption . It then fel l with a considerab ledegree of regularity until a minimum value of 56 was reached on the
eighteenth day of the fast . Subsequent ly the values Show a slight ,though definite , tendency to rise gradual ly to the end of the fastingperiod . The increase on the second day after food was taken was

THE RESPIRATORY EXCHANGE . 337
considerable, with a still further increase on the last day on which theobservations were made.
A careful examination of the fluctuations in the values for the oxygenconsumption and the pulse—rate shows a remarkable regularity in therelationship between them,
although the absoluteminimum values werenot found on the days that the minimum pulse—rate was found . On
the second day with food after the fast , the pulse-rate rose to 72 andthe oxygen consumption likewise rose , reaching 170 c .c . The valuestaken as a whole, however, show that in the earlier days of this longfast the relationship between the oxygen consumption and the pulserate was reasonably close , but in the latter part of the fasting periodthere was a Slight divergence, as a somewhat increased pulse-rate wasoccasionally accompanied by an actual decrease in the oxygen con
sumption . It Should be considered , however, that the organism waschanging from day to day, and while the total tissue available formetabolism was slowly decreasing the pulse—rate may still have adefinite relationship to the total active tissue remaining . Thus adecrease in the amount of tissue may in part be compensated for by anincrease in the pulse-rate, although this latter factor may still have toosmall an effect to prevent a lowering of the total metabolism. Furtherdiscussion along this line must be deferred until the metabolism per
unit of body-weight and per unit of body- surface are considered .
DIURNAL VARIATIONS IN METABOLISM.
The determination of the respiratory exchange at various timesduring the day gives an excellent opportunity for studying the diurnalvariations in the metabolism of the same individual during fasting .
Thedata given in table 46 show that themetabolism during the eveningexperiments was invariably higher than in the morning experiments ,regardless of whether the carbon-dioxide production or the oxygenconsumption is used as an index .
The pulse-rate was also a few beats higher in the evening hours, thusindicating a close relationship between the pulse-rate and the metabolism . The Slight tendency for the pulse-rate to rise in the morningexperiments beginning with the eighteenth day of the fast and con
tinning to the end was even more marked in the records of the pulserate for the series of evening experiments , in which the minimum valueof 57 was found on the twenty-first day of the fast and the maximumof 71 on the thirtieth day . A general relationship between the oxygenconsumption and the pulse-rate is shown throughout all of the seriesof experiments , although as the fast progressed th is relationship wasnot so pronounced as at the beginning . It should be considered hereagain
,however, that the active mass of protoplasmic tissue was gradu
ally decreasing,so that the relationship can not be expected to hold
constant .

338 A STUDY OF PROLONGED FASTING .
Th e respiratory quotients obtained in the evening were not unlikethose obtained in the morning experiments
,with a slight tendency for
the early evening quotients to be somewhat lower than those obtainedin the morning experiments . This lowering of the quotient in the
evening experiments might be taken as an indication that there mayhave been a formation of carbohydrate from fat by a storage of oxygen,
or a greater formation of B-oxybutyric acid , and that the next morningeither the formation of the B-oxybutyric acid was less or that the slightsupply of glycogen formed during the early evening was being burned .
Unfortunately,although these respiratory quotients were determined
with the best technique that we know of at present , we do not feeljustified in laying much stress upon a change of one or two units in thequotients .
EXTERNAL INFLUENCES UPON METABOLISM.
While the values for the carbon-dioxide output,the oxygen intake
,
the respiratory quotient , and the pulse-rate are given in table 46 for theexperiments in which the subject was lying upon a couch and sittingup in a chair, either writing or quietly at rest , a better understandingof the influence of a change in conditions may perhaps be secured bystudying each change by itself . To this end several small tables havebeen prepared which show the influence of the change in conditionupon the total metabolism and also upon the mechanics of respiration.
EFFECT or CHANGES IN BODY Posm oN.
On the second , tenth , twelfth , and thirteenth days of the fast, themetabolismwas studied while the subject was sitting in a chair . It wasthus possible to compare the metabolism and the mechanics of respiration for the two positions . This comparison is made in table 47, inwhich is given the increase or decrease in the values due to the changeto the sitting position. The figures show that in general there waspractical ly no increase in the carbon-dioxide production— and, indeed ,in two instances a considerable decrease . The oxygen consumptionwas increased in 3 out of the 5 experiments , with a slight decrease inthe other 2, and there was a perceptible though probably not Significantchange in the respiratory quotient, which may have been caused bythe absence of change in the carbon-dioxide production. There wasan average increase in the pulse-rate and respiration-rate and an
increase in the lung ventilation,but varying results in the volume per
respiration .
Since the lying experiments were made in the early morning and thesitting experiments late in the afternoon
,they are not
,strictly speaking
,
comparable. On the other hand , one would expect that there would bea higher metabolism normally in the late afternoon than in the morningafter the subject came out of the calorimeter, and it is accordingly very

A STUDY OF PROLONGED FASTING .
of the oxygen consumNion. In the light of these varying results , it isto be regretted that further observations were not made with the sub
ject sitting quietly . However , a number of observations made whenthe man was sitting up and writing actively may also be compared .
INFLUENCE OF THE WORK OF WRITING.
On the fifth,fifteenth
,seventeenth , twentieth, twenty-third , and
thirtieth days of the fast , the metabolism was studied while the subjectwas sitting up writing , an employment that occupied much of his sparetime during the entire fast . These six experiments are compared intable 48 with data obtained on the same day when the subject waslying upon the couch in themorning experiment . Two of these experiments— those on the seventeenth and twentieth days— immediately
TABLE 48 .— Cmnparison of the gaseous exchange and lung ventilation of subject L . ,
lyingon couch and sitting writing. (Respiration apparatus )
Date . Position.
8h 21tn a.m . to 9h 32m a.m .
4 h 10m p.m . to 4 ll 43m p.m .
Increase .
Apr. 29 8ll 19m a.m . to 9h 19m e .m .
35 23m p.m . to 3h bfim p.m .
Increase .
May 1 8h 22‘n a.m . to 9h 19m a.m .
9h 3 1m a.m . to 10h 04m a.m .
Increase .
8h 22m a.m . to 9h 15m a.m .
9h 35m e .m . to 10h 10m a.m .
Increase
8h 15m a.m . to 9h 17m a.m .
3h 43m p.m . to 4h 14m p .m .
Increase .
May 14 8h 03m e .m . to 811 56m a.m .
Sh 32m p.m . to 7h 02m p.m .
Increase .
1The lung ventilation observed is here reduced to 0° C . and 760 mm . pressure .
2Calculated to the pressure existing in the lungs and to 37° C .

THE RESPIRATORY EXCHANGE . 34 1
followed the morning experiments, and it is again to be regretted thatthis routine was not carried out in all cases .There was a noticeable increase in themetabolism in all of the writing
experiments , which is shown by both the carbon-dioxide excretion and
the oxygen consumption,but the respiratory quotient tended to become
a few points lower during the writing period . The pulse and respiration-rates were both invariably increased, the increase in the pulse-rateranging from 7 to 16 beats per minute . The ventilation of the lungs
per minute likewise increased very considerably during the writingexperiment , this increase at times amounting to 3% liters . The volume
per inspiration did not increase materially, except on the twenty-thirdand thirtieth days of the fast .Under ordinary conditions one would normally expect an increasedmetabolism in the afternoon over the morning, but the comparisonpreviously made between the metabolism for the lying and sitting positions showed no increase for the sitting position in some instances andin others there wasan actual decrease. Consequently a Sharp comparison is difficult to make for the writing experiments .We may assume from these experiments , however, that when thesubject was writing there was invariably an increased metabolism, butthat on the 2 days when the writing experiment immediately followedthe lying experiment the increase was only 50 to 75 per cent of thatobtained on the days when the writing experiment was in the afternoon.
On the seventeenth and twentieth days of fasting, when the writingexperiments were in the morning , the increase in the metabolism due towriting was represented by an increased consumption of about 35 c .c .of oxygen , or not far from 20 per cent . The absolutemaximum increaseof 64 c .c . above the lying position on the fifth day of the fast amountedto approximately 30 per cent , but while the absolute increase on the
twenty-third and thirtieth days was a few cubic centimeters less , the
perOentage increase was greatest , i . e., 34 and 33 per cent respectively .
The work of writing , therefore, produced a distinct increase in themetabolism, which is Shown not only by the increase in the carbondioxide production and the oxygen consumption
,but also by an
increase in the respiration-rate,the ventilation of the lungs
,and the
volumeper inspiration. Finally,therewas a regularanddistinctincrease
in the pulse-rate. These values are used subsequently in computingthe probable metabolism of this subject during several hours in the
day when he sat in the balcony and wrote.
INFLUENCE OF BREATH ING AN OXYGEN-RICH ATMOSPHERE .
On the twenty-eighth , twenty-ninth , and thirtieth days of the fasta series of experiments was made in which the subject breathed an
oxygen-rich atmosphere varying from 95 to 75 per cent of oxygen.
At the beginning of each experiment the percentage of oxygen in the
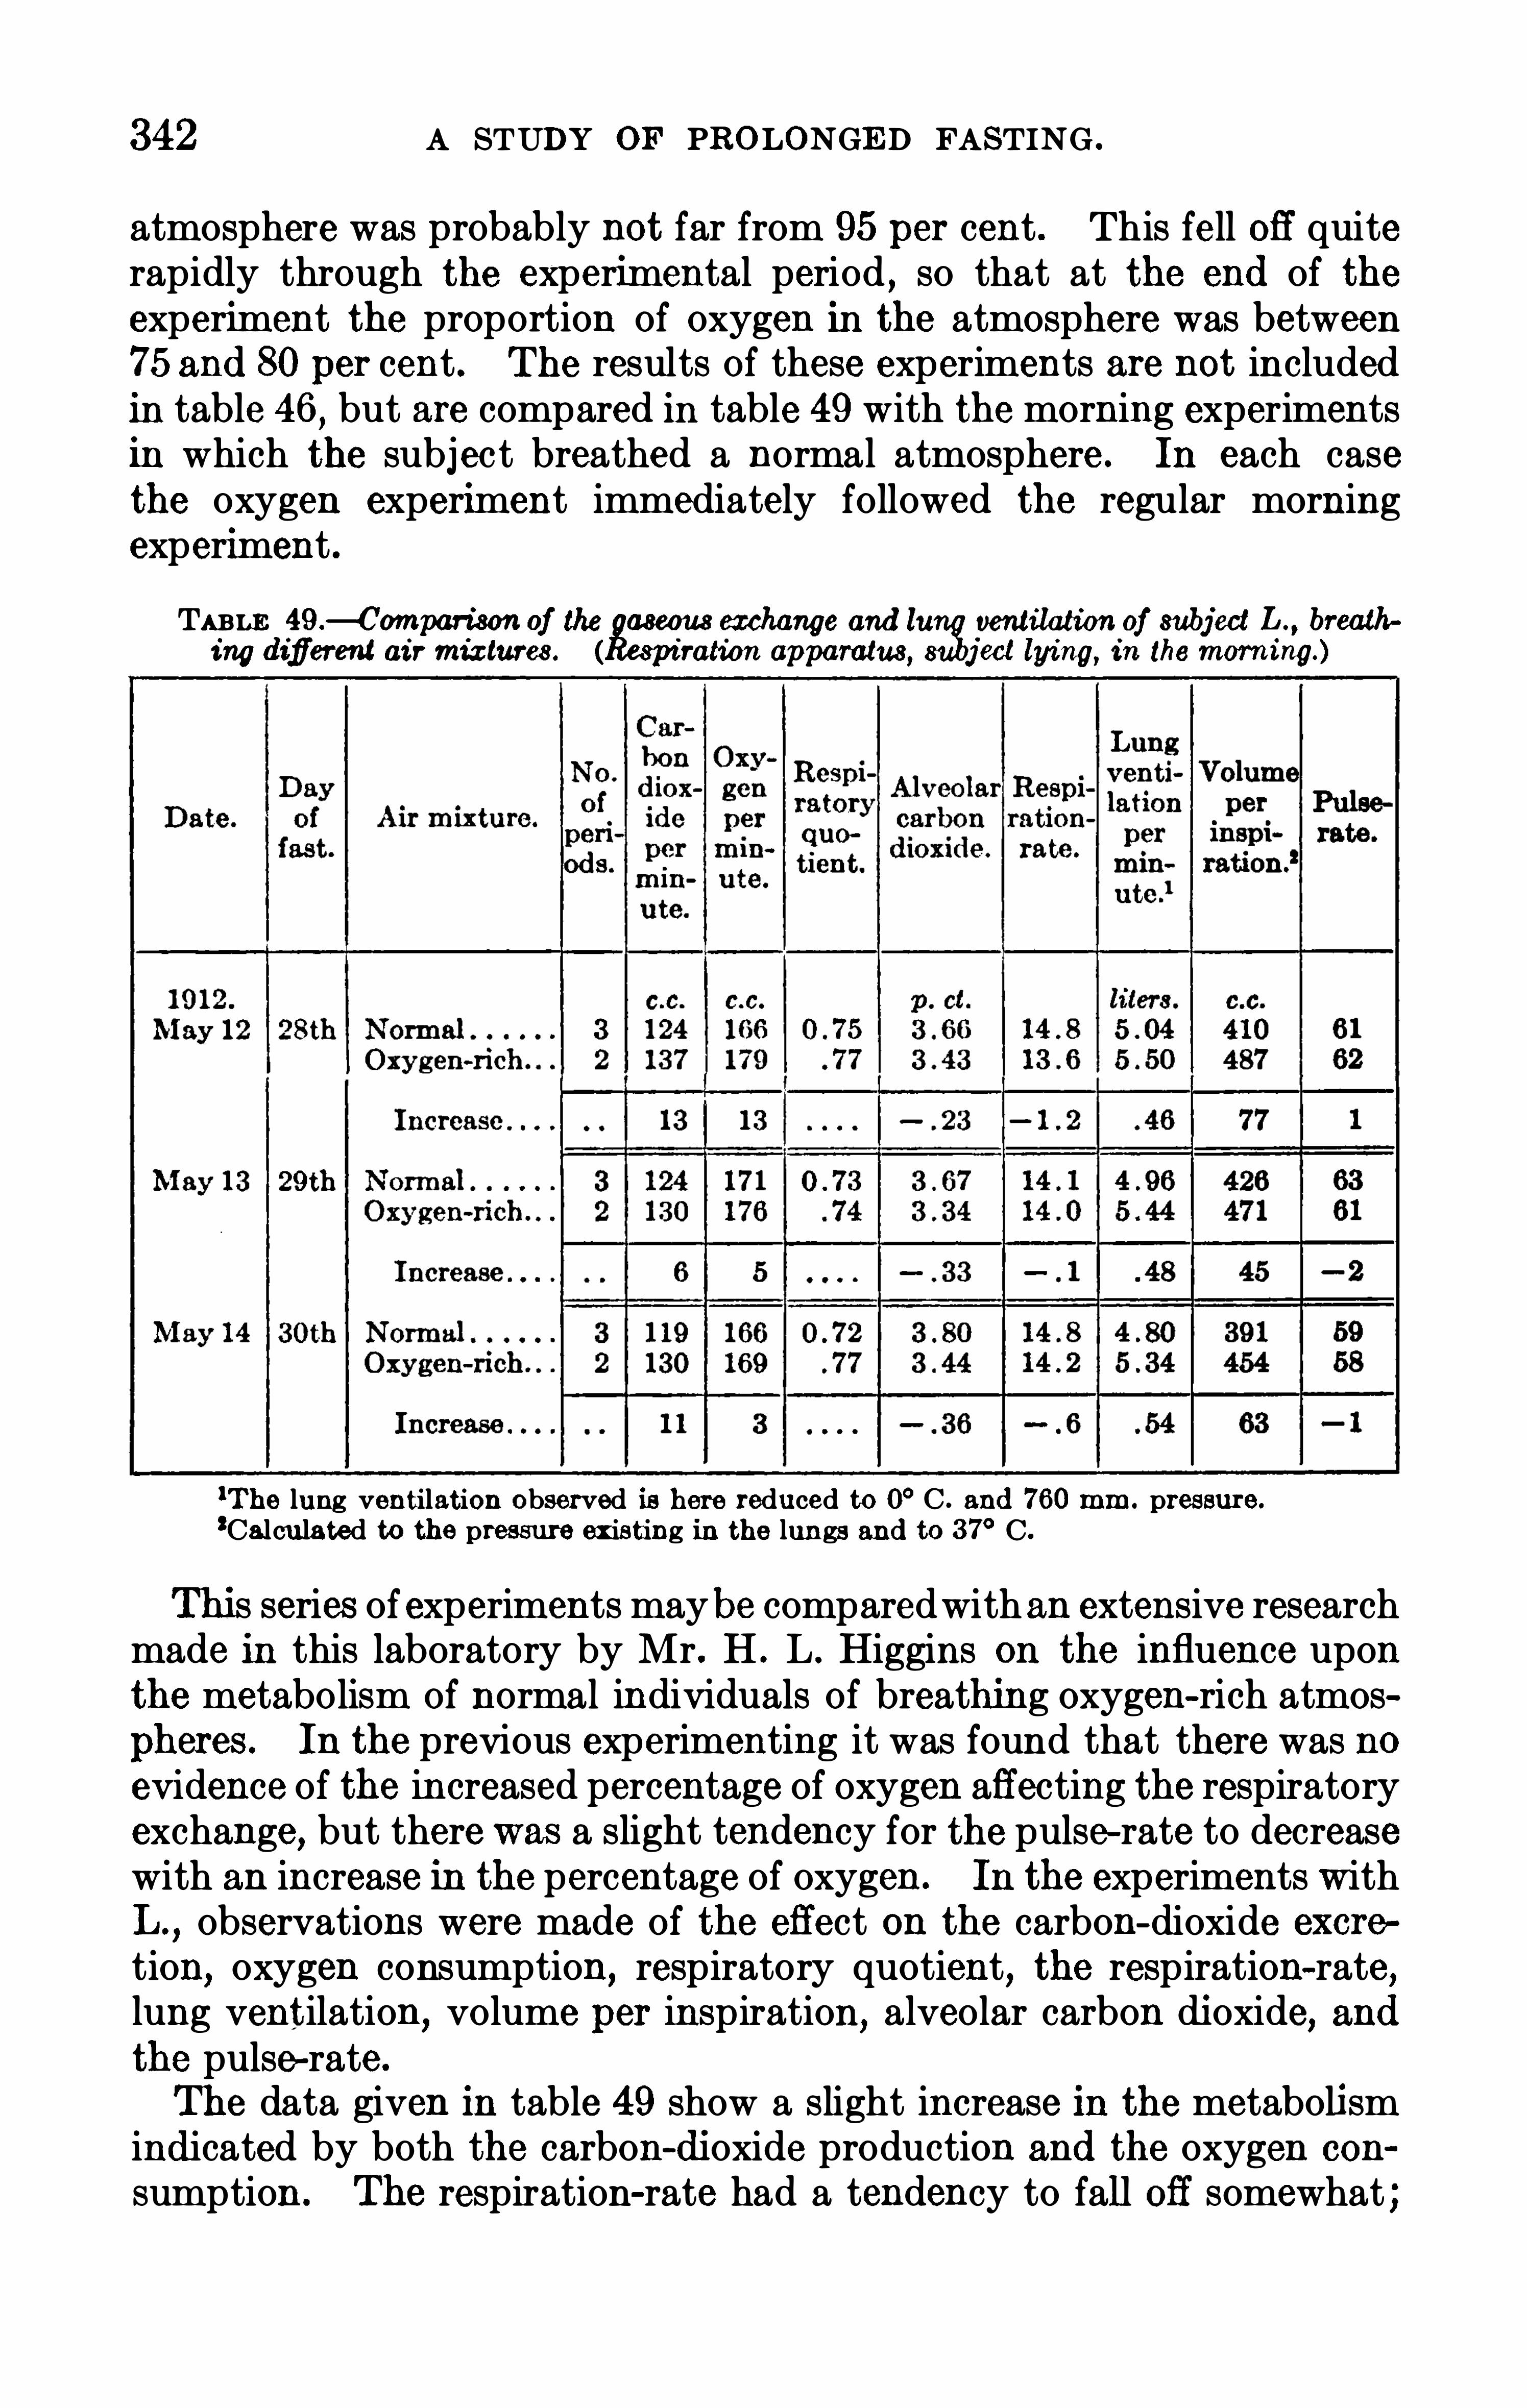
342 A STUDY OF PROLONGED FASTING .
atmosphere was probably not far from 95 per cent . This fell off quiterapidly through the experimental period , so that at the end of theexperiment the proportion of oxygen in the atmosphere was between75 and 80 per cent . The results of these experiments are not includedin table 46, but are compared in table 49 with the morning experimentsin which the subject breathed a normal atmosphere . In each casethe oxygen experiment immediately followed the regular morningexperiment .
TABLE 49 .— Comparison of the aseous exchange and la ventilation of subj ect L . , breath
ing difierent air mixtures.
‘
ration apparatus, j ect lying, in the morning.)
‘The lung ventilation observed is here reduced to 0° C . and 760 mm . pressure.
2Calculated to the pressure existing in the lungs and to 37° C.
This series ofexperiments maybe comparedwithan extensive researchmade in this laboratory by Mr. H . L . Higgins on the influence uponthe metabolism of normal individuals of breathing oxygen-rich atmos
pheres. In the previous experimenting it was found that there was noevidence of the increased percentage of oxygen affecting the respiratoryexchange, but there was a slight tendency for the pulse-rate to decreasewith an increase in the percentage of oxygen. In the experiments withL .
,observations were made of the effect on the carbon-dioxide excre
tion,oxygen consumption, respiratory quotient, the respiration-rate,
lung ventilation, volume per inspiration, alveolar carbon dioxide, andthe pulse-rate.
Th e data given in table 49 show a slight increase in the metabolismindicated by both the carbon-dioxide production and the oxygen con
sumption. The respiration-rate had a tendency to fall off somewhat ;

344 A STUDY OF PROLONGED FASTING .
that the measurements were made wi th another apparatus and thesubject was awake throughout the whole experiment. We have,therefore, as a result of the experiments with the respiration apparatus ,the basal minimum metabolism of the subject when he was awake.
It is accordingly of great interest to compare the metabolism asmeasured in the bed calorimeter during the night with the metabolismas measured with the respiration apparatus in themorning immediatelyafter the subject has been taken out of the calorimeter chamber.Such a comparison has been made in table 50, in which the averagecarbon-dioxide production and oxygen consumption are given for thebed-calorimeter experiments when the subject was a part of the time
asleep and a part of the time awake, and also for the minimum periodswhen the subject was presumably in deep sleep . The average valuesfor the carbon-dioxide production and the oxygen consumption are
likewise given for the experiments with the resp iration apparatus, inwhich the subject was awake throughout the whole period . The comparison of these values is also made by noting the increase when thesubject was awake. In the same table the minimum level of the pulserate observed in the bed-calorimeter experiments‘ is compared withthe average pulse-rate for the experiments with the respiration apparatus . The increase in the pulse-rate when the subject was awake inthe experiments with the respiration apparatus is also shown . Finally,the respiratory quotients obtained in the bed-calorimeter experimentsand in the experiments with the respiration apparatus are compared .
In comparing the results obtained during the first 4 days of theexperiment
,when the subject was taking food , we find that the carbon
dioxide production was 32 c .c . less perminute on the first day than during the minimum period in the bed calorimeter when the subject wasasleep . On the night of April 12— 13, the carbon-dioxide productionwas lower by 4 c .c . and on the following night by 9 c .c . perminute whenthe subj ect was asleep than when awake . These values
,however, pre
sent no abnormalities,since they are easily explained by the previous
ingestion of carbohydrate-rich food in the evening meal . This resultedin a greater production of carbon dioxide in the bed-calorimeter experiment than was obtained in the experiment with the respiration apparatus
,when the subject was without breakfast and therefore in the
post-absorptive condition . The values for the oxygen consumptionfollowed approximately the same course. The pulse-rate, also , in twoinstances was less in the morning experiment than it was the nightprevious and in two others it was 3 and 9 beats higher.However, the results obtained on days when food was taken are not
of such great interest as those obtained during the fasting period .
Beginning with the first night of the fast , it wi l l be seen that in the1See curves showing the pulse-rate in the bed-calorimeter experiments in figures 12 to 18, on
pages 104 to 1 10.

THE RESPIRATORY EXCHANGE . 345
TABLE 50.— Comparison of the gaseous exchange of subject L . , in the bed calorimeter at night and
awake on the respiration apparatus in the morning .
26—27 .
0 0 0 0 0 0
0 0 0 0 0 0 0 0 0
1The duration of the periods in wh ich th ese m inimum values were observed varies in general from 3
hours to 1 hour .
2Represents period of lowest pulse-rate observed . See page 1 12 .
8On the days preceding and fo llowing th e fast th e nigh t experim ents were made after the ingestionof food . The subj ect waswithout breakfast during th e morning respiration experiments.

346 A STUDY OF PROLONGED FASTING .
morning experiment 33 c .c . more of carbon dioxide were produced thandur ing the period of deep sleep in the night . There was likewise an
excess of 4 1 c .c . of oxygen consumed and an increase in pulse-rate of10 beats . This increase in the gaseous metabolism and the pulse-ratepersists throughout the whole 31 days of the fast , for on no day was themetabolism during the morning experiment, when the subject wasawake
,less than during the minimum period of the night experiment
,
when the subject was in deep sleep . Furthermore, in no instance wasan average value secured in the morning experiment with the respiration apparatus which was less than the average value for the wholeexperiment with the bed calorimeter, when the subject was asleep apart of the time and awake a part of the timc.
It will be observed that this increase in the metabolism and in the
pulse-rate underwent extreme variations , the range for the carbondioxide production being from 33 c .c . on the first night to 1 1 c .c . onthe eighteenth and thirty-first nights , and for the oxygen consumptionfrom 4 1 c .c . on the first night to 8 c .c . on the tenth night . Nevertheless there was a fairly average value of 17 c .c . for the increase inthe carbon-dioxide production, the variation as the fast progressedbeing not far from this value, except on the twenty-first
,twenty
seventh , and twenty-ninth nights . With the oxygen consumption,
the variations are much more irregular ; these may partly be explainedby the difficulties of determining the oxygen consumption exactly,especially when the values for the minimum periods are selected . Itis likewise important to note that the oxygen consumption for themorning is invariably higher than not only the minimum during thenight but also the average for the whole night .The increase in the pulse-rate undergoes a much more regular change .
On the first 4 mornings of the fast , the pulse—rate is 10 beats higherwhenthe subject is awake than when he is asleep during the night . Thisincrease throughout the fast remains reasonably constant at 8 beats .On but two occasions , i . e.
, on the twenty-eighth and the thirtiethnights
,was the increase only 4 beats .
It is thus clear that , so far as the absolute metabolism is concerned ,there is an increase in the period when the subject lay awake on the
respiration apparatus over that of the average for the night, when thesubj ect slept for a part or the whole of the time, and particularly overthe minimum for the night .In the post-fasting period , the metabolism on May 16— 17 continued
to be greater in the morning experiment than in the minimum periodfor the night experiment . On May 17— 18, however, when the subjectwas inmuch distress andhad consumed a large amount of carbohydratematerial , a considerable proportion of which had been retained , thecarbon-dioxide production was less in the morning than at night and
the oxygen consumption practically the same. There was likewise no
348 A STUDY OF PROLONGED FASTING .
been published ,1 but a still larger number are being prepared by Mr .
Carpenter for early publication . His results give a complete answerto the first criticism,
as they show that themeasurement of themetabo
lism by the bed calorimeter is essentially the same as that with theresp iration apparatus .Furthermore
,since it has already been shown that the character of
the katabolism as indicated by the respiratory quotient was accuratelydetermined by both of these apparatus
,it is unreasonable to suppose
that there would be any material difference in the measurements ofthe total metabolism, especially as the two apparatus are constructedon the same principle
,i . e.
,the Regnault-Reiset closed-c ircuit principle .
If one apparatus had been built on the closed-circuit principle and theother upon the open- circuit principle
,an error in the measurement of
the total ventilation or of the total volume of air passing through thechamber would affect the measurement of the total metabolism withoutaffecting the respiratory quotient . Since the two apparatus werebuilt upon the same principle , however, the possibility of such an errorwould be very small and any question of a fundamental differencebetween the results obtained with these two forms of apparatus maytherefore be excluded from this discussion .
In considering the second criticism,namely, that there might be a
difference in activity when the subject was awake and asleep , it Shouldbe pointed out that each experiment in both series was accompaniedby a graphic record of the degree of muscular repose of the subjectby means of the movable bed previously described .
2 If the recordsare compared , it will be seen that during the night there were s lightmovements , as would be natural , since no individual could lie inabsolutely the same position for a period of 10 or 12 hours . On
the other hand , the record for the experiment with the respirationapparatus in themorning was almost invariab ly a straight line, showingthat the subjec t had not moved . Mr. Carpenter
, who was in chargeof the respiration experiments , was of the opinion that the subject wasentirely indifferent to the mechanical part of the respiration apparatusand showed not the slightest evidence of muscle tension or apprehension,
which might increase the pulse-rate or general muscle tonus .In other words , this subject unquestionab ly approximated , as nearly asany subject that we have ever experimented with the conditionsdescribed by Johansson3 as
“
VorsatzlicheMuskelruhe . It is,further
more, clear that the average results obtained in the two series of experiments Show that as the fast progressed there was a tendency for thevalues to decrease and essentially at the same rate . This wou ld hardlybe expected if the subject were under any great mental strain or anxiety
lBenedict and Joslin , Carnegie Inst . Wash . Pub. 136 , 1910 , p . 173 .
”See page 3 1 1 .8Johansson, Skand. Archiv f. Physiol . , 1898 , 8, p . 85 .

THE RESPIRATORY EXCHANGE . 349
and it would probably not continue for 31 days . L . frequently saidthat the experiments were very simple and occasionally remarked thatthey were quieting and restful . It would appear, therefore, that hewas as nearly unaffected by the experimental routine as any personcould be, was without anxiety or apprehension, and that there was noevidence of tenseness of muscles .It thus appears that the only evidencewe have of muscular activity
during the two series of experiments is the slight activity Shown by thekym ograph records for the experiments with the bed calorimeter . Butsuch activity would tend to increase the metabolism during the night ,when the subject was a part of the time asleep and a part of the timeawake, over that when the subject was fu l ly awake on the respirationapparatus . The difference between the results would thus be evengreater if the subject were absolutely quiet throughout the night inthe bed calorimeter.Since there was no difference in the methods of measurement and
such activity as existed would tend to lessen rather than increase thedifference between the results, it seems evident that the difference in themetabolism during the Sleeping and waking conditions must be due tothe influence of sleep , an influence which has hitherto been disregardedby experimenters . No series of experiments with which we are familiarshows so completely and in such a control led manner this strikingdifference in the metabolism between a subject asleep and a subjectawake . The pulse-rate is likewise increased during the waking period,being fairly uniform with the increases in the carbon-dioxide productionand oxygen consumption . This completely substantiates our view thatthe pulse-rate gives an admirable index of the internal activity of thebody
,which largely determines the basal metabolism .
To Show more clearly the increase in the metabolism when the sub
ject is awake over the metabolism when he is asleep , the percentageincreases in the carbon-dioxide production, oxygen consumption,
and
pulse—rate are given in table 51 for each day of the experiment . Disregarding the results for the first 4 nights , which are complicated by theinfluence of food upon the metabolism during the Sleeping period , wefind on examining the values for the fasting period that there is invariably a considerable percentage increase for the carbon dioxide , oxygen,
and pulse-rate . For instance,the percentage increase in the carbon
dioxide production rises as high as per cent on the morning fo l lowingthe first night and fal ls as low as per cent on the morning after theninth night . In general , in the latter part of the fast there was not farfrom 15 per cent increase in the carbon-dioxide production when the
subject was awake over that when he was asleep in the minimum periodof the calorimeter experiment . Sim i lar fluctuations were observed inthe oxygen consumption,
but with hardly the regularity noted in thevalues for the carbon-dioxide production . During the latter part of

350 A STUDY OF PROLONGED FASTING .
the fast , the average oxygen consumption of the subject awake wasnot far from 13 to 14 per cent greater than during Sleep .
Wh ile there is no particular reason to give the increase in the pulserate on a percentage basis and expect that it would have a value corresponding to those for the carbon-dioxide production and oxygen con
sumption, for want of a better comparison at the moment it
TABLE 51 .— Increase in metabolism of subj ect awake as compared
metabolism of subject asleep.
advisable to present it in this way. Thus we note here an increase inthe pulse-rate ranging from per cent on the morning following thefourth night of fasting to as low as 7 per cent after the twenty-eighthnight . In the latter part of the fast the pulse—rate is not far from 12
per cent above that found during the s leeping period . There waspractically no increase in the carbon~ dioxide production, the oxygen

352 A STUDY OF PROLONGED FASTING .
lying perfectly quiet , there was still an absence of constancy, for itwas found that the metabolism was much lower during the hours ofdeep s leep at night than in the morning , when the subject was lyingupon a couch and connected with the respiration apparatus ; also thatthe metabolism during the evening just prior to the night calorimeterexperiment was higher than in the morning . We thus find a definitelyestablished daily rhythm
,with the minimum metabolism in the early
morning not far from 2 to 4 a . m . ,a somewhat increased metabolism
between 8 a . m . and 9h 30m a . m ., and a still higher metabolism
between 7 p . m . and 8 p . m . As the measurements in all cases weremade under conditions when there was muscular repose and no foodin the alimentary tract , it is clear that a certain factor not ordinarilyconsidered influences the daily rhythm . This is unquestionably thefactor which we may , for want of a better term ,
designate as “ internalmuscular work” or cellular activity. Wh en the stimulus to this cellular activity is increased , the subject shows a correspondingly highermetabolism.
As we have already found , the pulse-rate is an admirable index tothis tonicity or cellular activity
,since the closest correlation has been
shown to exist between the pulse-rate and the metabolism. This isperhaps no more strikingly brought out than in comparing the metabolism when the subject was asleep with the metabolism when the subjectwas awake . While, therefore, the three series of experiments in whichthe metabolism was determined were not primarily designed to throwlight upon the daily rhythm,
inasmuch as the main purpose was thestudy of the alterations in the metabolism as the fast progressed , yetsince the data were obtained within the 24 hours, they offer a gooddemonstration of this diurnal variation in the metabolism and a hintas to its nature . Furthermore, they show the intimate relationshipbetween the pulse-rate and the diurnal variations .During the 24 hours there was of course no material alteration in
body-weight or in body-surface, and hence the data need not be compared upon any special basis other than that of the body as a whole .
On the otherhand , as the fast progressed there were certain fundamentalchanges taking p lace which should be considered in any attempt tointerpret the variations in the metabolism noted during the fast . In
the first place, theman was obviously losing weight every day. As waspointed out in the discussion of the losses in body-weight of L . duringthe fast , it would have been possible with a fasting animal to arrangethe conditions of the fast so that the loss in weight would have beenregular ; with a fasting man, however, it was impossible so to controlthe daily activity, the ingestion of water, the collection of the urine ,and the environmental temperature that the loss in weight wouldfollow a mathematical curve ; and yet, as has already been shown , itproceeded with a considerable degree of regularity.

THE RESPIRATORY EXCHANGE . 353
As the weight decreases during a fast , there will unquestionably bea change in the body-surface. With certain individuals such loss ofweight , either through old age or illness , is not accompanied by a corresponding Shrinkage of the Skin,
and the surface of the skin is consequently wrinkled and hangs in large folds . In general , however, thisis not the case ; that such a condition certainly did not exist with ourfasting subject is clearly shown by the photographs given in plates4 and 5 . Consequently with L . there was undoubtedly a decreasein the radiating body-surface. These factors of decreasing body-weightand body- surface may reasonably be expected to play a role in themetabolism during a long fast , while in a fast of but 24 hours they wouldbe negligible .
Using as indices the changes in the pulse-rate, the blood-pressure,and the pu lse-pressure, we find that there was also a considerablevariation in the internal muscular activity . Not only do we findvariations in the pulse-rate between the conditions of lying asleep andlying awake, but as the fast progressed we find that there were likewisechanges from day to day in these values . This is clearly broughtout in table 50. On the other hand , the pulse-rate did not continuallydecrease, for , as was pointed out in a previous discussion of the changesin the pulse-rate , there was a period in which the pulse-rate fell ratherrapidly
,fo l lowed by a period when it remained approximately constant
,
while toward the end of the fast there was a tendency for the pu lserate to increase . These changes in the pulse-rate indicate a considerab le alteration in the internal muscular activity of the body as the fastcontinued
,thus clearly establishing a factor in metabolism which has
heretofore been ahnost neglected . It is the purpose of this section toexamine more closely some of the various factors which affected themetabo lism during this prolonged fast .
METABOLISM PER KILOGRAM OF BODY-WEIGHT.
In the attempt to find some unit of comparison,it has long been the
custom of many writers to use the kilogram of body-weight , presumablyon the ground that with animals differing in Size
,the larger animal
would normal ly have the greater metabolism . In other words,it has
been the custom to assume that the metabo lism per kilogram of bodyweight is essentially the same for most animals of the same species .As a result of using this unit certain discrepancies have appeared whichhave been recognized by many writers , but nevertheless this methodof comparison is stil l adhered to and
,indeed
,individuals of widely
varying body-weight have been compared in this way .
If we could determine the composition of the human body, we shouldcertainly find great differences in individuals with different bodyweights . With this fasting man we have an ideal condition for studying themetabolism per kilogram of body-weight in that we have an

354 A STUDY OF PROLONGED FASTING .
organism continually losing weight from the beginning to the end ofthe period of fasting . Furthermore, we can tell with a reasonabledegree of accuracy the character of these losses and thus secure someindication as to the probable composition of the human body at thebeginning and the end of the fast .As the fast continues , the changes in the body-weight show a loss
of body material . It has been demonstrated , in previous fastingstudies ,
1 that at the beginning of a fast this loss consists in large partof water , much of which is preformed water . During the first twodays of the fast there is unquestionably a further loss of several hundredgrams of carbohydrates in the form of glycogen . Subsequently
,the
loss is of fat ; there is also a fairly regular loss of protein from day today, but after the first few days of the fast the loss is chiefly fat andwater . Thus the first 5 kilograms lost from the body in a 31-day fastwould certainly be of greatly different composition from the last 5kilograms lost . The composition of the organism is therefore not thesame on the tenth day of fasting
,for instance
,as on the first day
, and
varies considerably as to the absolute amounts of fat,carbohydrate,
and protein . Consequently , to compare the metabolism on the basisof body-weight is who lly illogical , and although this method of comparison is habitually used by many writers , it is certainly inconsistent withtheir knowledge of the character of the body losses .The character of the body material lost may be determined withconsiderable accuracy . The loss of protein may be computed from thenitrogen found in the urine ; the loss of carbohydrate and fat may becomputed from the respiratory quotient and the carbon dioxide produced or the oxygen consumed, making due correction for the carbondioxide produced and oxygen consumed in the combustion of the protein ; the amount of water lost may also be found by modern technique .
But in considering changes in the metabolism , we are dealing not withthe material lost from the body, but with the body material remainingin the organism, and to determine the composition of the body at anygiven period has been found very difficult . Wh ile it may be reasonableto attribute any difference in the total metabolism for the first andthirty-first days of the fast to the metabolism that wou ld normallybelong to the material lost , this will be true only when we are
assured that the living tissue in each case had precisely the same effi
ciency as to the production of heat and the maintenance of the vitalprocesses .Certain evidence that has been brought forward in discussing the
pulse-rate, and particularly the comparison of the metabolism for asubject lying awake and lying asleep , leads us to believe that there areinfluences affecting the total heat-production, entirely aside from the
organized mass of heat-producing material . Thus we may not saylBenedict, Carnegie Inst. Wash . Pub. 77 , 1907, p . 4 68.

356 A STUDY OF PROLONGED FASTING .
The curves for the body-weight will be recognized as comparable tothose given in figure 3 (page although it will be noted that in thesetwo charts the percentage of loss in body-weight is p lotted , while in figure 3 the actual body-weights are plotted . The total heat-production
and the total carbon-dioxide production for 24 hours fell '
rapidly forthe first 3 days with dog No . 2 and for 7 days with dog No . 3 . There
AWROROW'
S EXPERIMENT No.2 .
DAYS OF FAST o 10 IS 20 25 30
O%
4 0 0 CAL
FIG . 4 5 .-Complete metabo lism chart of fasting dog (Awrorow No .
The calori es from fat may be found by deducting the calories from protein from the totalcalories as indicated by the scale .

THE RESPIRATORY EXCHANGE . 357
AWROROW’
S ExpERlMENT NO3 .
DAYS or FAST s is 20 25 so 3 5 4 0
FIG . 4 6 .— Complete metabo lism chart of fasting dog (Awrorow No .
The calories from fat may be found by deducting th e calories from protein from the totalcalories as indicated by the scale .

358 A STUDY OF PROLONGED FASTING .
after there was a period of 4 or 5 days of equal production and subsequently a more or less regular fall until the end of the fasting period .
It is thus seen that the organisms of these dogs acted not unlike that ofour fastingman
,that is
,the total heat-production and the total carbon
dioxide output decreased with general regularity as the fast progressed .
On the other hand , in both experiments,the curves for the carbon
dioxide and heat-production per kilogram of body-weight rise withgreat regularity throughout the entire fast , falling only on the last 2or 3 days . Unfortunately
,Awrorow does not give the pulse-rate , but
from the curves for the temperature given in the upper part of thecharts it will be seen that the sharp fall in the last few days of the fast ,in both the total heat-production and the heat-production per ki logramof body-weight
,was coincidental with a rapidly falling temperature.
Since both dogs died , it is probable that they were in a moribund con
dition in the last day or two of the experiments . On the other hand ,it is of interest to note that there was no appearance of a premortalrise in the nitrogen excretion.
Since these dogs had a uniform external muscular activity duringtheir stay in the respiration chamber and probably a uniform internalmuscular activity
,we deal here only with the relationship between
cellular activity and the total body-weight . The increase in the carbon—dioxide and the heat-production per kilogram of body-weightfound in these experiments indicates most strongly a resistance todestruction of the heat-producing mechanism in the body which waswholly disprOportionate to the losses in body-weight . It is thus seenthat in the experiments with these dogs , in which the metabolism wasunaffected by muscular work or by the ingestion of food , this distinctconservation of organized material had a marked influence ; accordingly,the heat-production per kilogram of body-weight was not constant,but
,as a matter of fact , increased as the inert water and fat were lost .
Such ideal conditions for experim enting are obviously impossiblewithmen ,
and even with Awrorow’sdogs there was the disturbing element of
fal ling body- temperature on the last few days , which affected profoundly both the total heat-output and the heat-output per kilogramof body-weight . Since , however, it is the custom of writers to givethe heat-production per kilogram of body-weight , it has been necessaryto use this basis in computing the metabolism for the experiment withL . in order that the values may be comparable with those of otherinvestigators . The resu lts of these computations are given in tables52, 53 , and 54 , which Show themetabolism per kilogram of body-weight
per minute for the experiments with the bed calorimeter and with therespiration apparatus . In the belief that a question of such fundamental importance should be considered from every standpoint , notonly the average results are given for the bed-ca lorimeter experiments
(see tab le but also the results for the minimum periods obtainedwith that apparatus (see table The values for themorning experiments with the resp iration apparatus are given in table 54 .

360 A STUDY OF PROLONGED FASTING .
production per kilogram of body-weight ranged from c .c . per minute (the extraordinar ily high value found on May 17— 18) to c .c .
per minute on the twenty-fourth day of fasting . Excluding the dayswith food
,the highest value found was on the first night of the fast
,
namely , c .c . per minute . The values show a distinct tendency tofal l unti l the fourteenth day of the fast , with a subsequent essentiallyconstant production of carbon dioxide until the twenty-S ixth day .
From that time until the end of the fast the carbon-dioxide production tends to be somewhat higher per kilogram of body-weight .The highest value for the oxygen consumption was found on April
10— 1 1 , the first night which the subject Spent inside the resp irationchamber, i . e. ,
c .c . per minute, and the lowest value was c .c .
on the twenty-first night of the fast . Excluding the periods when foodwas taken ,
the highest value , c .c ., was obtained on the second
night of the fast . The oxygen consumption per kilogram of bodyweight fo l lowed a course which was not unlike that of the carbondioxide production,
that is,a persistent fall until the fourteenth day
of the fast , and thereafter an approximate constancy , with a tendencytoward a rise from the twenty-sixth day to the end of the fast .In the previous comparison of the pulse-rate and the total metabo
lism,it was found
,in the latter part of the fast
,that there was a ten
dency fo r the pulse-rate to rise which was unaccompanied byan increasein the total carbon-dioxide output and oxygen intake . When the
values are computed on the basis of per kilogram of body-weight, thecourse of the carbon-dioxide and the oxygen is found to be strikinglysimilar to that of the pulse-rate . At this point
,one noticeab le anomaly
in the otherwise nearly constant relationship between the pulse-rateand the metabolism should be emphasized . On the last night of thefast
, the oxygen consumption was c .c . per kilogram per minute ,while the pulse-rate was 57 . On the second night thereafter (namely,on May 16— 17) the oxygen consumption was somewhat less , being only
c .c . per minute, wh ile there was an increase of 7 beats per minutein the pu lse-rate . This discrepancy is in part explained by takinginto consideration the differences in the calorific value of oxygen withthe different respiratory quotients ; but we stil l have a discrepancywhich is striking
,the only one of any magnitude noted in the long series
of observations . Its exp lanation is not Simp le.
The average values found throughout the night are complicated byvarying conditions of sleeping, waking , and some muscular activity ;hence, for the most accurate comparison,
use shoul d be made of thevalues given in table 53, which represent the metabolism per kilogramof body-weight in the minimum periods of the night . With this basisof comparison we find that in certain instances the carbon-dioxideproduction does not fo llow closely the oxygen consumption, but thegeneral picture of the progress of the metabo lism during the fast is not

THE RESPIRATORY EXCHANGE . 361
altered by these few discrepancies . The pulse-rates given in table 53should be used with considerable reserve, since it is difficult to selectthem intelligently on this basis , as the minimum period for the pulserate may not have been coincident with the minimum period for eitherthe carbon-dioxide production or the oxygen consumption . It issafe to conclude, however, that the general trend of the pulse-rate issuch that its use in this general comparison is not illogical .
TABLE 53 .— Minimum metabolism per kilogram of body-weight and per square meter of body
surface (Meeh) in experimentswith L . (Bed calorimeter atnight.)
Mini
Date .
o f fast .
(subject
1912
Apr. 10— 1 12
21—22
22—23
25—26
27—28
Apr. 30—May 1 .
1See page 1 12 .
2The subject had eaten as usual during the day .
8The fast was ended with the taking of food on the m orning of May 15 . The subject ate at
intervals throughout th e subsequent days.

362 A STUDY OF PROLONGED FASTING .
The highest value for the carbon-dioxide production during theminimum periods 18 found , as with the average values , on the last dayof the experiment, May 17— 18, being 3 .64 c .o . per minute . The lowestvalue is c .c . on the twenty-first day of fasting . Disregarding thedays with food
,we then find the highest value to be c .c . on the
second day of the fast . There is a general tendency for the carbondioxide production per kilogram of body-weight to decrease until thefourteenth day , when there is a marked fall ; from that time till the end
of the fast the carbon-dioxide production remains essentially constant,
with the exception of the low value found on the twenty-first day offasting and the high values on the twenty-eighth and thirty-first days .Owing to the many difficulties in determining the oxygen consumption in short periods— difficulties which have already been empha
sizedl— the selection of the minimum periods for the oxygen consumption is not easy and hence we must not expect to find the regularityin these values that we should find in the values for the carbon-dioxideoutput . The figures given in table 53 have
,however, been selected
with due care for accuracy . The values ranged from c .c . for thefirst night the sub jec t spent in the chamber to c .c . for the twentyfirst night . The highest value found for the fasting period wasc .c . , on the second night of the fast . While there is a general tendencyfor the oxygen values to decrease for the first 15 days of the fast andthereafter to remain essentially constant, one may hardly generalizefrom such irregular figures.
The pulse-rates , which are taken from table 6,show a regular fall
until the fourteenth day , when there is a drop of 3 points . The pulsethen stays at the low value of 50 or 51 until the twenty-third day andsubsequently shows a definite tendency to increase slowly . The pulsecurve is therefore not strictly parallel to that for the carbon-dioxideproduction per kilogram per minute . The discrepancy previouslyfound in the relationship between the pulse-rate and the average oxy
gen consumption also appears in the values given here for the minimumperiods . Thus , on the last night , the oxygen consumptionwas c .c .
per minute and the pulse-rate 54 ; on the second night with food , theoxygen value was only c .c . less or c .c .
, whereas the pulse-rateincreased 6 beats per minute . Since it was noted that the minimumvalues for the body-temperature were not strictly comparable with themetabolism on this basis,we have not included these values in this tab le .
METABOLISM PER KILOGRAM OP BODY-WEIGHT IN RESPIRATION-APPARATUS ExPE RIMENTs .
The difliculties in comparing the values obtained in the bed calorimeter experiments , due to the varying conditions of waking , sleeping ,and some muscular activity, disappear when we consider the valuesobtained in the experiments with the respiration apparatus . In these
1See page 324 .

364 A STUDY OF PROLONGED FASTING .
As in the calorimeter experiments , we again find the highest recordfor the carbon-dioxide production in the last observation of the series
,
namely , c .c . per minute on May 18. The lowest record wasc .c . per minute on May 2. Disregarding the food days , we find thehighest value of c .c per minute on April 15 , at the end of the firstday of fasting . The course of the carbon-dioxide excretion per minutewas remarkably regular in the first part of the fast , there being analmost steady fall until the minimum .value was reached on May 2 ;subsequently there was some fluctuation
,with a general tendency
toward a slight rise .
The highest value for the oxygen consumption during the fastingperiod c .c .) was also found at the end of the first fasting day
,and
the lowest c .c .) was reached on the twenty-third day . The courseof the oxygen consumption was in a large measure parallel with thatof the carbon-dioxide production
,the values showing a slight tendency
toward a rise during the last week .
It is of special interest tonote that the curve for the pulse- rate prepared on th is basis follows with remarkable fidelity the curves for thecarbon-dioxide output and oxygen consumption , although the positivedifferences in the pulse-rate after the tenth day of fasting are very small ,the minimum value being 56 and the highest 63 . Our recent experience in this laboratory with the photographic registration of the pu lserate
,and particularly with the duration of the pulse- cycle, leads us to
believe that our inability to secure registration of the pulse-rate on
account of the breaking of the string galvanometer was a loss muchgreater than was realized at the time of experimentation. The pulserate records were made with as great accuracy as would ordinarilybe expected with the stethoscope
,but the differences are so sma l l that
photographic registration would have been most desirable .
CONCLUS IONS REGARDING THE METABOLISM PEB KILOGRAM o r BODY-WE IGHT .
In these three series of comparisons it will be seen that the metabo
lism per kilogram of body-weight fell rapidly during the first half of thefast
,then remained constant for a time, and during the last week
usually increased slightly . During the entire fasting period the bodylost kilograms of body material
,of which (according to our best
estimates) there were ki lograms of water , 201 grams of carbohydrate
,grams of fat , and grams of protein .
1 It is clear,therefore, that a considerab le proportion of the loss , or per cent ,was made up of material other than protein . It has commonly beenbelieved that the heat-producing organism of the body consists in large
part of protein . Under these circumstances , we should expect theh eat-production per kilogram of body-weight to increase as the fastprogressed , for the total loss of material wasmuch greater in proportionthan the loss of active protoplasmic tissue could have been .
lsee tables 2 , 6 1 , 62, and 63 .

THE RE SPIRATORY EXCHANGE . 365
An examination of the records of the pulse-rate shows,however, that
another factor influenced the metabolism,namely, the stimulus to the
internal muscular activity or the muscle tonus . The exact nature of
this stimulus is difficult at this time to state . Short periods of fastinghave shown the presence of acidosis , and an acidosis experimentallyinduced by giving a carbohydrate-free diet has been found to increasethe metabolism .
l On the other hand , it is known that diabetics toleratea considerable acidosis without great increase in the metabolism
, and
the theory has been advanced that the diabetic organism becomesimmune to or reacts less vigorously to the stimulus of the acidosis .2
Wh ile there was unquestionab ly an acidosis in the 31—day fast,it
is highly probable that its influence upon the metabolism must havebeen practically constant or continually decreasing . Nevertheless
,
during the last week there was a distinct increase in the pulse-rate,
accompanied by a constancy in the metabolism,thus giving striking
evidence that the organism was being influenced by some factor of aninternal nature. This constancy in the total metabolism may possiblyaccount for the increase in the metabolism per ki logram of body-weightduring the last week of the fast , which is similar to the striking increaseobserved throughout the entire fasting experiments with the dogsstudied by Professor Awrorow .
During the first 14 days of the fast there was certainly no constancybetween the carbon-dioxide output and the body—weight
,for the
carbon-dioxide output per kilogram of body-weight was continuallydecreasing . The fact that for two weeks or more the carbon-dioxideoutput and the oxygen intake per kilogram of body-weight remainedconstant should not be taken as a demonstration of an intimate relationship between body-weight and metabolism, since the metabolismhad a tendency to increase during the last week . A more intel ligentinterpretation of the phenomena would be that the total metabo lismdecreased by virtue of the fact that there was a decrease not only in thesize of the heat-producing organism, but in the intensity of the cellularactivity
,as was indicated by the pulse—rate . When this activity was
increased , then the relationship between body-weight and metabolismwas entirely obscured . If it were possible to have an experiment inwhich the pulse-rate remained constant and the change in body-weightwaswhollydue to inert material
,then the values for the heat-production
per kilogram of body-weight could logical ly be compared .
The decrease in the total heat-production as the fast progressed wastherefore only in part due to the fact that there was a decrease in theSize of the heat-producing organism . With a constant size of organism ,
as would obtain on any given experimentaljday during the fast , there
stil l were material differences in the heat production and the intensityof cel lular activity which were evidenced by the change in the pulserate and by the accompanying noticeable increase in the metabo l ism .
lBenedict and Joslin, Carnegie Inst. Wash . Pub. 176 , 1912, p . 125 .
2Ibid. , p . 134 .

366 A STUDY OF PROLONGED FASTING .
While, therefore, the computation of the metabolism on the basisof per kilogram of body-weight is justifiable as a gross index of theprobable metabolism of the organism,
for the proper interpretation ofthe values found in this research this method of computation is whollywithout avail . It is furthermore of great importance to note thatthe level of intensity of metabolism in any given organism may haveequal , if not indeed greater, influence upon the total metabolism thanmay the body-weight . It is illogical , therefore , to compare subjectAwitha pulse-rate of 70 with subject B with a pulse-rate of 70 and assumethat the metabolism per kilogram of body-weight should be the same .
On the other hand , subject A,with a pulse-rate of 70, will almost
invariably have a higher metabolism than with a pulse-rate of 60 .
Evidence with regard to the influence of long-continued changes inthe body-weight
, either as a result of fasting, as a result of diminisheddiet in obesity cures
,or as a result of the increased difference of body
material following periods of fasting, are thus far too few to enable usto make general deductions . The enormous addition of nitrogento the body in the experiments of Mueller1 without a correspondingincrease in the metabolism per kilogram of body-weight suggests aline of research that should prove most profitable . This fundamentallyimportant observation should certainly be repeated and with everycontrol . It is sufficient here only to point out that while custom hassanctioned the general usage of the method of computing the metabo
lism on the basis of per kilogram of body-weight , such computationcan have but little signifi cance when a careful scientific analysis of theresults of metabolism experiments is desired .
METABOLISM PER SQUARE METER OF BODY-SURFACE .
Since the heat-production of an animal body varies as to its size,physiologists have long sought to establish some relationship betweenthem . One of the earliest views was that primarily based upon Newton ’slaw of cooling ; this is set forth in the simplest form by Bergmann
2
to the effect that the surface of the body is a much more logical factorfor considering the needs for heat-production than any other.Bergmann ’s original discussion is of interest here :“ Die Oberflache ist ein einfacher und genau zu ermittelnder Factor fur dieWarmeverluste , dessen Werth , zusammengenommen mit der Beschaffenheitdieser Oberflache (Bedeckung mit Haaren u . s. der Differenz zwischenTemperatur des Thieres und des umgebenden Mediums und BeschaffenheitdiesesMediums (ob esLuft OderWasser ist) dieWarmeverluste bestimmt.
“ Das Volumen des Thieres dagegen wird als ein Maass fur die mOi che
Warmebildung betrachtet werden kennen. Gewiss ist in gleichem Vo lumensowohl verschiedener Thiere alsauch desselben Thieres zu verschiedener ZeitdieWarmebildung sehr verschieden. Aber manwird es nicht gewagt finden ,
lMueller, Zentrlb. f. d . ges. Physio l . 11 . Path . des S tofi 19 1 1 , 6 , p. 6 17 .
2Bergmann ,Ueber die Verhaltnisse der Warmeokonomie der Thi ere zu ihrer Grease Gift
tingen. 184 8. p . 9 .
368 A STUDY OF PROLONGED FASTING .
to the fact that the heat-producing organism of the body,of which
the blood volume is probably a fair index,bears a similar relation to
the law of growth as does the body- surface .
It was believed that further information might be secured on thisimportant point in the experiment with the fasting
‘
man, and since the
heat-production and likewise the oxygen consumption and carbondioxide production are discussed by many physio logists on the basisof per square meter of body- surface , such a form of computation hasbeen used here , the values being given in tables 52
,53
,and 54 .
With the fasting man we have a heat-producing organism which iscontinually decreasing in weight and consequently should decrease insurface . In our calculations it has been assumed that the usualformula for computing the body—surface , namely, that of Mech
,in
which the surface is equal to xa/W? ’ holds for each weight as
the fast progresses . In former publications from this laboratory,in dis
cussing the metabolism oi greatly emaciated patients,particularly
diabetics , the contention has been made that there may be a lack ofproportion between body-weight and body-surface which is not correctly considered by this formula . But with this fasting man
,as has
been po inted out previously , and indeed with diabetics studied in thislaboratory , there has been no evidence that the skin did not shrinkin proportion to the loss in weight , inasmuch as there was no fo lding ofthe skin which indicated such a disturbance in the relationship .
Rubner,l in his experiments on a fat boy and a thin boy
,found that
by computing the surface of the thin boy by Bouchard ’s formula heobtained sq . cm . instead of sq . cm . as computed by theMech formula . With the fat boy thediscrepancy wasmuch greater, theBouchard formula giving sq . cm . and the Meeh formulasq . cm . In any event the maximum error was only about 7 per cent .For the sake of argument , it may be considered that on the first day
of the fast the body-surface of the subject L . was properly indicatedby the Meeh formu la , but judging from Rubner
’s experience with hisfat boy
,the Mech formula would give too high a value . As the fast
progressed , the error with the Meeb formu la would become less andless
,until toward the end of the fast it would give the true body
surface . It might then be considered that at the beginning of theexperiment the computed value for the body-surface was actuallysomewhat large and that the computed value for the metabo lism per
square meter of body-surface would consequently be slightly too smal l .Nevertheless , the fact that the error can not be more than 7 to 10 percent shou ld be borne in mind . Furthermore
, any correction of thisnature wil l tend to raise the values for the metabolism per square meterof body- surface in the early part of the fast , but wil l not affect thosefound for the latter part of the fast .
lRubner, Beitrage zur Ernahrung im Knabenalter m it besonderer Bemcksich tigung der Fettsucht. Berlin , 1902 , p . 40 .

THE RE SPIRATORY EXCHANGE . 369
With this correction in mind, a comparison may be made of themetabolism found with the bed calorimeter and the respiration apparatus on the basis of per square meter of body- surface .
METABOLISM PER SQUARE METER OF BODY-SURFACE IN CALORIMETER EXPERIMENTS .
Table 52 gives the average metabolism per square meter of bodysurface as computed from the values found with the bed calorimeter .On this basis of computation,
the carbon-dioxide production rangedfrom grams on the fir st night inside the respiration chamber to
grams on the twenty-fourth night . Disregarding the food days,
the highest valuewas grams on the first night of the fast . On the
last food night Of the observation,the carbon- dioxide production was
essentially as high as it was on the first 3 nights prior to the fast,
namely, grams per square meter per hour.Considering the values for the oxygen consumption per square meter
of body- surface, we find that it varied from grams on the firstnight inside the respiration chamber to a minimum of grams onthe twenty-first night . Again disregarding the food days
,the highest
value observed is grams on the second night of the fast .If the law ho l ds true that the metabolism per square meter of body
surface remains constant , it is surprising that the variation in the carbon-dioxide production during the fast is SO great , i . e.
,grams to
7 .69 grams— a decrease of 26 per cent . An approximately Similardecrease is noted in the oxygen consumption per square meter of body
surface . Considering the values for both the oxygen consumption and
the carbon- dioxide production, we find that the gaseous exchange persquare meter of body- surface remained essential ly constant from the
fifteenth day to the twenty-seventh day of the fast, but in the last 4days there was a distinct tendency for the gaseous exchange to increaseSlightly
,even on the basis of per square meter of body-surface . While
the values were not in comp lete uniformity with the curve for the pulserate
,they Showed a distinct tendency to follow the same course . NO
clearly established relationship , however, can be found between the
body- temperatureand themetabolism per squaremeter of body- surface.
Since th e objections previously cited in reference to comparisons ofthe average values for the gaseous exchange may apply with equal forcein this connection,
thegaseous exchange per squaremeter of body-surfacein the selected minimum periods may also be compared on thisbasis . These values are given in table 53 . The carbon-dioxide production ranged from grams on the first night inside the chamberto grams on the twenty-first night ; but if the food days are disregarded , the maximum value was grams on the second night ofthe fast . We find here, however, that there is still a range of 26 percent in the metabolism per square meter of body-surface , essentiallythe same as that Shown with the average values . The difficu lties in

370 A STUDY OF PROLONGED FASTING .
making proper selections for the periods for the oxygen consumptionhave already been outlined,
but we find, from such selections as we havebeen able to make, that the values per square meter of body-surfaceranged from grams on the second night of the fast to gramson the twenty-first night .A comparison of the values for the gaseous exchange with the recordsfor the pulse-rate, also given in table 53, must necessarily be made withreserve , owing to the character of the selection as pointed out in thecompai i son of the values per kilogram of body-weight , but it will benoted that , at least during the first part of the fast, there was a distincttendency for the metabolism per square meter of body-surface to fo llowapproximately the curve of the pulse-rate . Indeed
,even in these
minimum selected periods, there was a tendency for the metabolism torise in the last week of the fast , although this tendency was by nomeans as pronounced here as in the values given in table 52.
METABOLISM PER SQUARE METER or BODY-SURFACE IN THE RESPIRATION-APPARATUSEXPERIMENTS .
Perhaps the most satisfactory comparison is that of the valuesobtained with the respiration apparatus in the morning
,just after
the subject came from the calorimeter chamber, since the conditionswere constant in all of the experiments , i. e.
,simultaneous measure
ments of the carbon-dioxide production, oxygen consumption, andpulse—rate , when the subject was without food in the alimentary tractand there was complete absence of muscular activity . Under theseconditions the values given in table 54 show a range in the carbondioxide production per square meter of body-surface from gramsonMay 18 (the last day of observation) to grams on the eighteenthday of the fast . Disregarding the values for the food days before andafter the fast , the maximum value of grams is found at the end ofthe first fasting day. With the oxygen consumption per square meterof body- surface essentially the same results are found, i . e.
,a maximum
of 10 .80 grams at the end of the first fasting day and a minimum of
8 .47 grams at the end of the twenty-third day.
These figures indicate that the metabo lism per square meter of bodysurface tends distinctly to decrease in unison with the pulse-rate duringthe first half of the fast . In the last 15 days the fluctuation was not sosharply marked , though therewas a tendency toward high values in thelast week coincidental with the slight tendency to a rise in pulse-rate :
CONCLUSIONS REGARDING THE METABOLISM PER SQUARE METER OF BODY-SURFACE .
From a consideration of the fundamental theory regarding themetabolism per square meter of body-surface, it will be seen that the valuesshould be constant , assuming that there is no error in the formula forcomputing the body-surface from the body-weight . But even if a cor

372 A STUDY OF PROLONGED FASTING .
metabolism stopped falling and the superimposed factor of an alteredcellular activity compensated in part for the natural fal l in the metabo
lism which would otherwise have been expected .
SUMMARY OF RESULTS REGARDING THE METABOLISM PER KILOGRAM OF
BODY-WE IGHT AND PER SQUARE METER OF BODY-SURFACE .
If we attempt to analyze the prevailing views in regard to the metabolism with the progress of a fast
,we find that in the first place it is
believed that the metabolism per kilogram Of body-weight should risewhen the greater part of the loss in weight is made up of inert fat andwater . Second
,according to the theory of the relationship between
the metabolism and the body- surface,the metabo lism per square meter
of body-surface Should remain constant .SO far as the metabolism per kilogram of body-weight is concerned ,
it is illogical to attribute the same heat-producing value to the bodysubstance which remains as the body loses weight during the progressof the fast , and this method of computation may not be used advantageously in considering the metabolism of a fasting man. Furthermore
,the values for the metabolism per square meter of body-surface
Show difl'
erences of approximately 25 per cent , a result which can not
be accounted for in any way by a possible discrepancy in the formulaused for computing the body-surface each day . Final ly
,the evidence
is strikingly in favor of the belief that the pu lse-rate is an admirableindex of the intensity of cellular activity, an activity that plays a veryimportant role in interpreting the total metabolism , entirely irrespective of body-size or body-weight .An examination of the values appearing in tables 52, 53, and 54
Shows that there is a tendency for the metabolism to divide into threeperiods during the fast . The fir st period , which extends nearly to themiddle of the fast , is characterized by a rapidly falling metabo lism and
a rapidly fal ling pulse-rate,the fal l in the metabolism being shown not
only in the total values , but in the values calculated on the basis of
per ki logram of body-weight and of per square meter of body-surface .
The second period of approximately 10 days shows a comparativelylevel metabolism per kilogram and per square meter with an approxi
mately level pulse-rate. The third and last period,or the last week of
the fast , shows a general tendency toward an increase in themetabolism ,
although this was not so apparent in the values for the metabolism
per kilogram of body-weight in the minimum periods of the calorimeterexperiments . There was also a distinct tendency toward an increasein the pulse-rate in the last week . It thus appears that the strikingfactor of pulse-rate must continually be reckoned with, even with theseconditions of rapidly changing body-weight and body composition .
A more exact statement would perhaps be that the intensity of cellularactivity p lays an important part which is not seriously affected eitherby changes in the body-weigh t or the body-surface .

THE RESPIRATORY EXCHANGE . 373
ELIMINATION OFWATER THROUGH LUNGS AND SKIN.
Since the vaporization of water from the lungs and skin is one of theimportant methods of heat regulation, its determination was formerlygiven great attention,
particularly in the series of 24 -hour respirationexperiments carried out by Atwater and his associates in Middletown,
Connecticut . In the course of these investigations, it became apparentthat the water thus vaporized was subject to considerable variationwhich was
,for the most part , irregular in character. Consequently, a
knowledge of the water vaporized from the lungs and skin, per se
,has
relatively little value in ordinary metabo lism studies, especially with
normal subjects, and as such determinations are difficult and expensive,they do not seem justifiable, except so far as it is necessary to note theamount of water vaporized in the calorimeter chamber in order tocorrect for the heat absorbed in th e vaporization . But with the unusual conditions obtaining in the experiments with L .
,when there was
a constantly Shrinking Skin and at times distinct evidence of a physiological need of water, it seemed desirable to devote the additional timeand expense to securing accurate measurements of the water vaporizedfrom the lungs and skin of this man during the time he was inclosed inthe calorimeter chamber.In the discussion of the atmospheric conditions inside the chamber of
the bed calorimeter, the values were given in table 441 for the amount of
water vaporized per hour, with due correction for the water vaporizedfrom the wet-bulb thermometer. This hourly vaporization of watervaried from grams on the third night of the fast to grams onthe fifteenth night of the fast . An inspection of all the data in table 44shows that there was apparently no constant relationship betweenthe amount of water vaporized and the ventilation of the chamber ; norwas there a constant relationship between the water vaporized and thechamber temperature, for although the highest average temperaturewasobserved on the night of the highest vaporization of water per hour,yet the first night the subject was inside the chamber the temperaturewas within degree of themaximum, while the vaporization of waterwas only grams . In making a further comparison with the relativehumidity
,it Should be noted that the va lues for the relative humidity
were calculated from the total amount of water vaporized . Thesecomputed values , however, agree remarkably well with a number ofvalues obtained by means of a psychrometer in the outgo ing air- current
,although usually they are a litt le lower . They may thus be relied
upon as indicating the genera l course of the relative humidity duringthe fast . An inspection of the values given in table 44 shows that therelationship between the relative humidity and the total vaporizationof water was approximately constant . The only scientific use of thesefigures is inmaking corrections for the heat required for the vaporization.
1See page 321 .
374 A STUDY OF PROLONGED FASTING .
It is possible,however
,to apportion the vaporization of water between
the lungs and the skin by using a method based onthe work of Zuntz,by
means of which the water vaporized from the lungs may be estimated .
During the observations of Zuntz and his co -workers,it was estab
lished that , under the experimental conditions obtaining , each cub iccentimeter of oxygen absorbed from the air was accompanied by a lungventilation of 21 c .c . In the earlier pub licationl giving the results ofthe fasting experiments carried out in Middletown,
Connecticut,this
figure was used for computing indirectly the amount of water-vaporgiven Off from the lungs . In the series of experiments with L . in whichthe respiration apparatus was used , accurate measurements of the lungventilation accompanied the determinations of the oxygen consumption
,and consequently the relationship between the lung ventilation and
the oxygen consumption may be computed for these experiments .From the results of these computations , which are given in table 55
,
it wil l be seen that in the extended series of morning experiments thelung ventilation per cubic centimeter of oxygen consumed varied from
c .c . to c .c .,these values being materially greater than those
obtained in the Observations of Zuntz . As the fast progressed,there
was a distinct tendency for the lung ventilation per cubic centimeter ofoxygen to increase . Observations were also made of the influence ofconditions other than that of lying quietly in the morning
,such as
change of position,time of day
,themuscular activity of writing
, and the
inhalation of oxygen-rich atmospheres,all of which increased the lung
ventilation per cubic centimeter of oxygen consumed . This increasewas usually not far from 4 to 5 c .c . , except that in the last 3 of the 6experiments with writing , the increase was approximately 9 c .c . over thelung ventilation when the subject was lying quietly in the morning .
S ince the relationship between the lung ventilation and the oxygenconsumption in the morning respiration experiments with the sub jectlying quietly is thus wel l established,
it is not unreasonable to assumethat the lung ventilation may in turn be Obtained for the calorimeterexperiments from the oxygen consumed when the sub ject was inside therespiration chamber . Accordingly, using the oxygen consumption forthe night periods and the lung ventilation per cubic centimeter ofoxygen consumed for the experiment with the respiration apparatuson the following morning , the values for the ventilation of the lungshave been computed for each of the bed-calorimeter experiments ,the results being recorded in table 56 .
The air which the sub ject inhaled while inside the calorimeterchamber obviously contained water-vapor . The amount inh aled mayreadily be computed from the ventilation of the lungs and the percentage of water-vapor in the air inside the chamber . For instance , it wil lbe seen by reference to the values given in table 44 for the ventilation
1Benedict, Carnegie Inst. Wash . Pub. 77 , 1907 , p . 4 35 .

376 A STUDY OF PROLONGED FASTING .
TABLE 55 .— Ventilation of lungs per volume of oxy en in arperiments with subjectL .
(Respiration apparatus) -é ontinued.
OxygenDa‘e ' Period .
minute . To tal per
30th
lPeriods indi cated by an asterisk were obtained with the subject sitting , writing .
a temperature of 37° C . and,knowing the ventilation of the lungs
,it
is easy to compute, by means of well-known tables , the amount of waterin the air expired from the lungs . For April 10— 1 1 this was found tobe grams . The amount of water-vapor eliminated from the lungsis therefore the difference between the water in the air inspired and
that in the air expired , this being grams per hour for April 10— 11 .
The amount of water-vapor eliminated per hour from the lungs andskin
,i . e.
,vaporized inside the calorimeter, on this date was grams
(see column D) , so that the amount of water-vapor given off from the
skin would be represented by the difference between co lumns D and E
or grams (column F) for April 10— 1 1 . The percentage distributionof the water-vapor from the lungs and Skin has also been calculatedand recorded in this table in co lumns G and H , and final ly (for reference) ,the relative humidity is given in the last column of the table .
The assumption that the exp ired air is saturated at 37° C . will nuundoubtedly be questioned in the light of the recent work of Loewy
l
and Galeotti .2 Neither of these researches has , however , stood thetest of severe criticism, and while undoubtedly the water-vapor isprobably not quite so great as that represented by assuming the airto be saturated at 37 C .
,nevertheless
,for want of firmly estab lished
values for this factor, we adhere to the o lder assumption . It is, furthermore
,important to note that any error in this assumption affects only
the apportionment of the water vaporization between the lungs and
1Loewy and G erhartz , Biochem . Zeitsch r. , 1912 , 47, p . 343 .
2Galeotti , Bioch em . Zeitschr., 1912, 46, p. 173 .
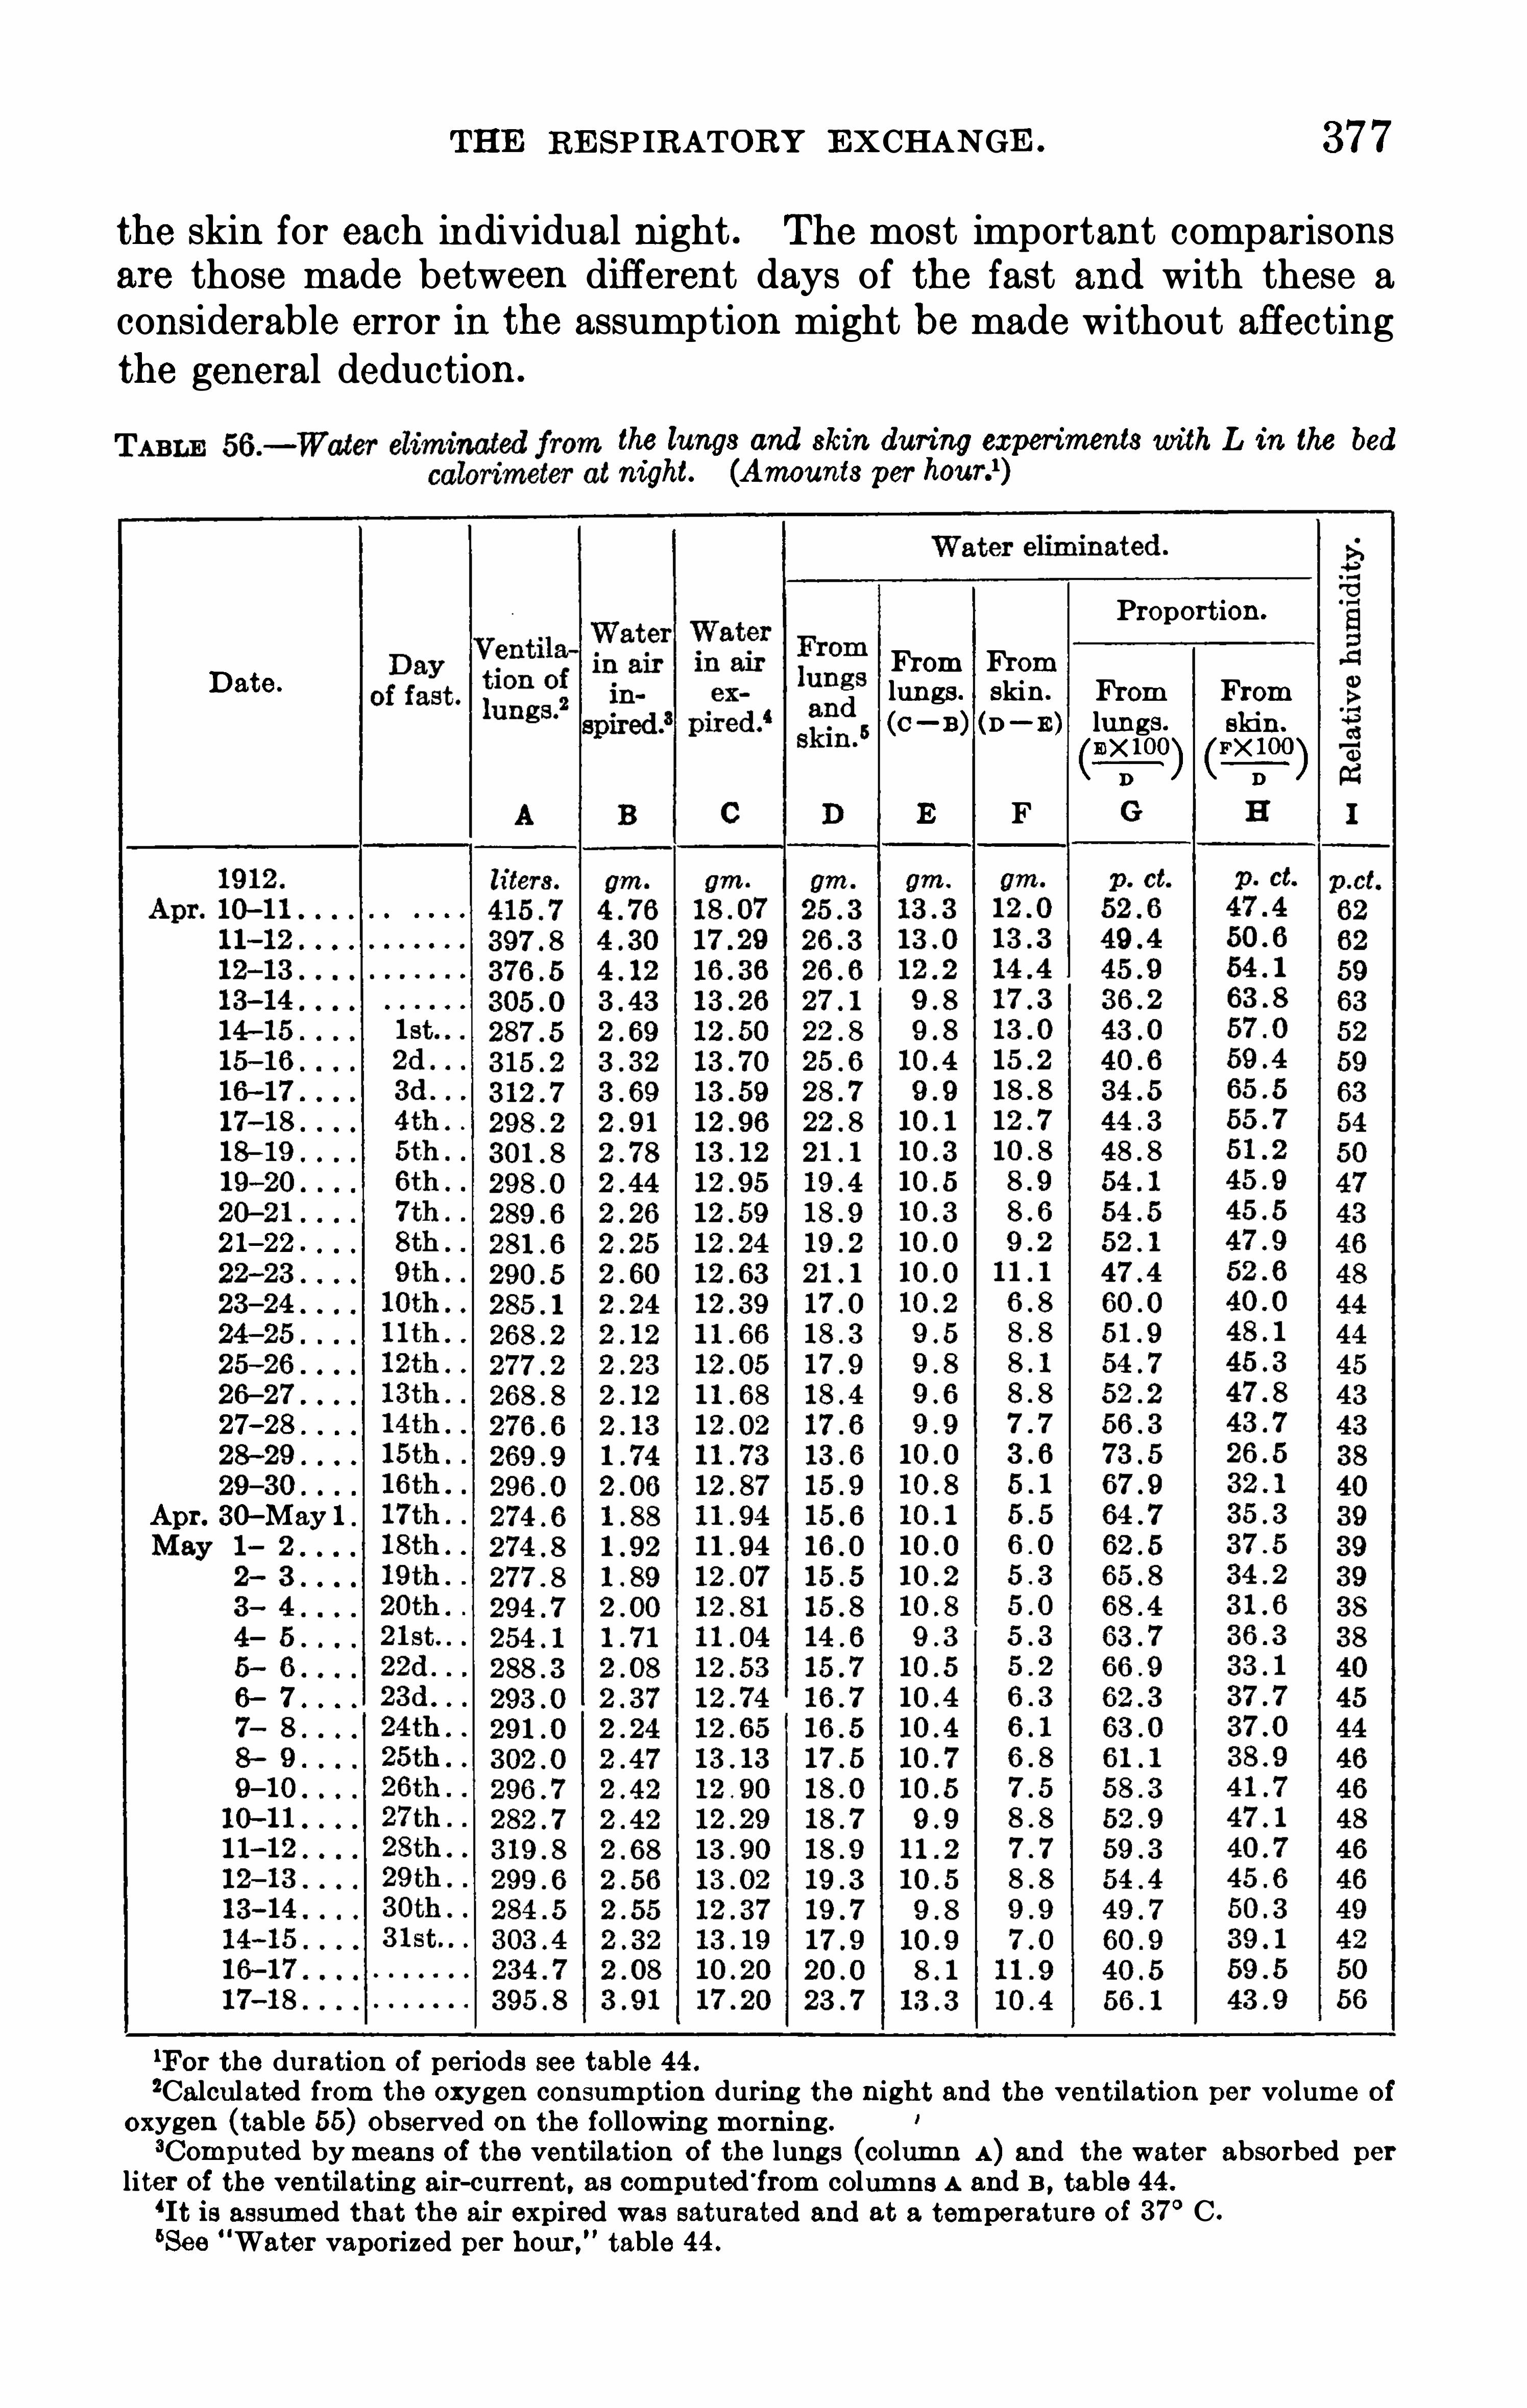
THE RESP IRATORY EXCHANGE . 377
the skin for each individual night . The most important comparisons
are those made between different days of the fast and with these aconsiderable error in the assumption might be made without affecting
the general deduction .
the lungs and skin during experiments with L in the bednight. (Amounts per
Proportion.
D isFrom From
a e . lungs. skin. From From(c — B) (D— E) lungs. Skin.
(110
2100
) (EX
IIOO
)E F
0 0 0 0 0 0 0 0 0 0
21— 22 .
27—28
Apr. 30—May 1
6
1For the duration of periods see table 4 4 .
2Calculated from the oxygen consumption during the night and the ventilation per vo lum e of
oxygen (table 55) observed on the fo llowing morning.acomputed bymeans of the ventilation of the lungs (co lumn A) and the water abso rbed perliter of the ventilating air-current , as computed'
from columns A and B , table 44 .
‘It is assum ed that the air expired was saturated and at a temperature of 37° C .
“See"Water vaporized per hour ,
”table 4 4 .

378 A STUDY OF PROLONGED FASTING .
The apportionment of the water-vapor between the two paths ofexcretion presents certain particularly interesting features . On the
4 nights prior to the fast there was a continual ly decreasing percentageof water excreted from the lungs until the low value of per cent wasnoted on the last night . During the fasting period there was a distincttendency for the proportion given off from the lungs to increase gradually , and although there were marked irregularities in this increase ,particu larly on the tenth and fifteenth nights of fasting
, yet it may besaid that in general the proportion Of water vaporized from the lungsbecame greater and that from the skin less as the fast progressed . The
apportionment between the lungs and the skin does not, however,follow any definite law .
l
Another interesting comparison may be made between the relativehumidity and the excretion of water-vapor from the skin . We haveexisting inside the chamber an essentially constant ventilation and an
essentially constant temperature . With a low relative humidity,a
high vaporization of water from the skinwould be looked for , since onewou ld naturally expect water to vaporize more rapidly from the moistskin of the subject as the air surrounding the body became drier .2 We
find, however, that the opposite is true , since the general course of boththe total amounts and the percentage values follows with approximateconstancy the values for the relative humidity , the lowest percentageof water excreted from the skin,
i . e. ,26 . 5 per cent on the fifteenth night
,
being coincidental with the lowest relative humidity . As has beenpointed out in a previous section,
there was a slight tendency for therelative humidity to increase during the latter part of the fast ; this wasaccompanied in general by an increase in the water vaporized from the
skin . It may be inferred , however , that , in general , the body-surfaceof the man became smaller and the skin less and less moist as the fastprogressed and perhaps , in consequence , less capable of losing water .
1Nevertheless the wide variations noted by Langlois and Boussaguet (Compt. rend . Soc . Bio l1912 , 72 , p . 967) do no t appear in th is fasting experim ent ; th e m ethod here employed is, however,fundam entally different from that employed in the French research .
3 Wo lpert.Archiv f. Hygiene . 1902, 4 1 , p . 301 .

380 A STUDY OF PROLONGED FASTING .
us to make fairly satisfactory comparisons . It is clear , however, thatthe direct measurements of the heat output in this particular series ofcalorimeter experiments were only incidental and not of prime importance in this study . This is particularly fortunate, Since, as will bepointed out later , certain unavoidab le conditions , particularly withreference to the temperature environment in the calorimeter room
,
vitiated to a considerable extent the direct measurements of the heatoutput .Prior to the arrival of the subject in Boston
,the accuracy of the
apparatus as to heat measurement had been repeatedly tested1 byelectrical check tests , in which a definite amount of heat was developedwith an electric current of known amperage and voltage
,and also as
to the accuracy of the measurement of the carbon dioxide , water-vapor,and heat produced , as well as oxygen consumed , by burning knownamounts of alcohol inside the chamber. It was possible
,therefore,
to put the subject inside the calorimeter immediately on his arrivalat the laboratory and determine the heat output on the several nightspreceding the fast .The calorimeter laboratory is so constructed that the temperature of
the room can be kept constant, and during calorimeter experiments itis ordinarily kept at the temperature of the calorimeter . Furthermore
,
the calorimeter is so made that it normally measures the heat-production with great accuracy , irrespective of whether the environmentaltemperature is 1° above or below the temperature of the calorimeter.In this fasting experiment , however, a great difficulty was encoun
tered at the outset , in that the subject (who spent the day on a balcony in the calorimeter room) complained so much of cold that itbecame necessary to increase the temperature of the room throughoutthe day and to cool it somewhat during the night . Accordingly thecalorimeters in the calorimeter laboratory became very much overheated and the measurements of the heat output were inevitablysomewhat too large. After the conclusion of the observations on L .
,
a series of check tests was carried out, with conditions as nearlycomparab le as possib le with those existing while the man was in thelaboratory
, and corrections for the heat output were computed fromthe results of the tests . It is unnecessary here to discuss the theoretical difficulties of measuring heat with the increased temperaturenecessary to make the subject comfortable , but we believe the heatmeasurements as finally recorded here are within 2 or 3 per cent of theactual values . It may be safely said that the measurement is alwaystoo great , and the correction would therefore be a minus correction,
the
probab le error being about per cent .It should be borne in mind that the heat production as measured by
a respiration calorimeter is made up of several factors . First,a certain
lBenedict, Riche , and Emmes, Am . Journ. Physio l. , 1910 , 26 , p . 1 .
CALORIMETRY . 381
amount of heat is given off by radiation and conduction and is absorbedby heat-absorbing pipes through which cold water is passed inside thecalorimeter . While this includes the greater portion of the heat measured, there is likewise a considerable elimination of heat due to thevaporization of water from the lungs and skin of the subject . This ismeasured by weighing the water-vapor in the air-current and makingdue allowance for the heat of vaporization per gram of water, namely ,
calorie . Furthermore , there Should be corrections for any lossof heat through the excretion of urine or feces , and for changes inbody-weight . This latter correction is of somewhat more importancein fasting experiments than in ordinary respiration-calorimeter experiments
,since the losses in weight are natural ly greater. The corrected
value thus obtained may properly be called the heat eliminated bythe body during the experimental period .
By far the most important correction, however, is that for thechanges in the body-temperature, for, as was pointed out in the sectionin which this factor was considered, a complete comparison of directand indirect calorimetry, which is always attempted in respirationcalorimeter experiments , necessitates a knowledge of the fluctuationsin the body-temperature .
1 Wh ile it has been shown that the'
tempera
ture fluctuations in the various parts of the body follow very closelythe temperature fluctuations in the rectum
,
2 it is still true that one ofthe most important and difficult problems in computing the heat production from the heat measured directly by the calorimeter is the possibility of the storage of a considerable amount of heat inside the humanbody . For example, the body-temperature of a man weighing 60kilograms fal ls C . This wou ld correspond to a loss of nearly 25calories
,or the total heat production in 20 to 30 minutes of a man
asleep ; thus , by taking into consideration the temperature changes ofthe body and the body-weight multiplied by the Specific heat (assumedto be the amount of heat lost from or stored in the body may becomputed and in turn may be subtracted from or added to the heateliminated . The heat measurement thus corrected is termed the heatproduced . In the tabular presentation of our results
, we deal usuallywith the heat-production and not with the heat elimination .
The intelligent use of corrections in the direct measurement of theheat output of man is so difficult that the computation of the heatproduced in Short periods is highly questionable . An inspection of theheat measurements obtained with our subject during the night Shows alack of uniform itywhich makes it impracticab le to present the heat production in the form of curves , as was done for the carbon dioxide produced and oxygen consumed in figures 4 1 to 44
,but there is distinct
evidence of the lowest heat production occurring during the midnight1Benedi ct and Joslin, Carnegie Inst. Wash . Pub. 136 , 1910 , p . 19 .
1’Benedict and Slack , Carnegie Inst. Wash . Pub. 155 , 191 1 , p . 72.

382 A STUDY OF PROLONGED FASTING .
hours,this being coincident with the minimum respiratory exchange .
Of far greater significance is the change in the average heat productionthroughout the night as the fast progressed .
The subject spent varying lengths of tim e inside the calorimetereach night , averaging not far from 10 hours
,but to make the values
comparable the computations are all based either upon the amount ofheat produced per hour or per 24 hours . The results of these computations are recorded in table 57, in which the heat produced by thesubject in the bed calorimeter at night is given on the basis of the total
TABLE 57 .— Heat produced by subj ect L . during experiments in the bed calorimeter at night.
I) ate .
7 th
21—22
l t
16—17
1The heat measured during th e nigh t experiments on the days noted has been corrected onlyfor the change in body-weight and not for change in body-temperature.

384 A STUDY OF PROLONGED FASTING .
but during the strictly fasting period we have a variation rangingfrom 836 calories per 24 hours on the third night of the fast to a minimum of 625 calories per 24 hours on the twenty-first night , a variationof somewhat more than 25 per cent . Even on this basis
,when pre
sumably the values should all be constant,there is a distinct falling
off in value during the first 2 weeks of fasting,followed by a period of
approximately constant heat production per square meter, with adistinct rise in the values in the last week of fasting .
It is thus clear that the deductions drawn from an inspection of thedata for the respiratory exchange in the foregoing chapters applyequally well to the total heat production as measured in the respirationcalorimeter, even admitting the discrepancies outlined previously .
The general picture is by no means obscured by the assumptions made,this showing that the influence of fasting per se upon not only the totalheat production but the heat production per kilogram of body-weightandper square meter of body- surface was fully in accord with the influence of fasting upon the respiratory exchange. It seems unwise,however, to dwell further upon these results of the heat measurementsand thereby possibly ascribe to them too much importance . The
errors cited bring them clearly out of the sphere of accurate physiological experimentation and make them of value only for subsidiaryevidence . For a more careful and certainly more nearly exact consideration of the heat production under different conditions during thefast
,we must resort to the method of indirect calorimetry .
INDIRECT CALORIMETRY.
Second only in value to accurate direct measurements of the heatoutput from the body is the method of so-called “ indirect calorimetry,
”
this being an excellent substitute for the difficult and costly directcalorimetry . By considering the nitrogenous material excreted in theurine and the amount of carbon dioxide produced and oxygen absorbed,it is possible to apportion the katabolism among the various body constituents, these being chiefly protein ,
fat, and carbohydrate, and to
compute (from the well-known heats of combustion of these constitu
ents) the amount of heat liberated in the process of their disintegration.
Several methods of computing the heat production thus indirectlyhave been emp loyed by various writers . Perhaps the most elaborateand fundamental ly exact is that based upon 24-hour studies of thegaseous exchange, such as were made with the respiration calorim eterformerly used at Wesleyan University. The elementary analysesoffood
,feces , and urine, and the d irect determination of the oxygen
absorbed and the carbon dioxide produced gave data for computing,by simultaneous equations ,
1the amounts of protein, carbohydrate (gly
cogen) , fat , and water participating in the metabo lism . From thesedata and the heats of combustion of the various body constituents andof the urine and feces , the total energy production could be accurately
1Benedict, Carnegie Inst. Wash . Pub. 77 , 1907 , pp. 36 and 4 52.

CALORIMETRY . 385
computedf Such computed energy transformations agreed remarkab lywell with the direct measurements of the heat produced per 24 hours .When, as is frequently the case, an exact knowledge of the various
amounts of carbohydrate, fat , and protein disintegrated is not of particular significance, it is possible to secure the heat-production indirectly from the measurements of the carbon. dioxide produced and theoxygen consumed without computing the different constituents oxidized . Zuntz has computed most carefully the calorific equivalents ofboth oxygen and carbon dioxide and assum es that for every liter ofoxygen absorbed in normal metabolism a definite number of caloriesmust have been developed . The calorific value of carbon dioxidevaries greatly, the variations depending upon whether the carbon dioxide is produced by the combustion of carbohydrate or of fat . Thus
,with
every gram of carbon dioxide resulting from the oxidation of carbohy‘
drate calories of heat are produced, and from the oxidation of fatcalories . On the other hand, the calorific equivalent of oxygen
does not fluctuate SO widely, for when carbohydrate is burned ,calories of heat are developed for every gram of oxygen consumed, andwhen pure fat is burned , calories are produced . It is thereforeonly necessary to determine the carbon-dioxide production and oxygenconsumption very exactly, and from the respiratory quotient and
the absolute amount of either oxygen or carbon dioxide it is possibleto compute th e heat production by using the calorific value for theoxygen or the carbon dioxide.
With the Zuntz-Geppert apparatus , oxygen is determ ined as accurately as is carbon dioxide, and Since the calorific value of oxygenremains essentially constant , Zuntz has regularly used the oxygenmeasurements and multiplied by the calorific equivalent of oxygen .
In connection with his researches on the physiology of marching, published with Schumburg, Zuntz
1 worked out a tab le which gave therespiratory quotients and calorific equivalents of oxygen with varyingproportions of fat and carbohydrate in the material oxidized .
A more difficult matter is the determination of the calorific equivalent of oxygen when protein is burned . Loewy2 has correctly pointedout that in experiments of short duration it is justifiable to computethe heat production indirectly by using the carbon-dioxide output andoxygen intake without taking into account the protein disintegration ,
S ince the protein disintegration may or may not be Simultaneous withthe nitrogen excretion. As a matter of fact
,the calorific equivalents of
oxygen and carbon dioxide when protein is burned are not greatlydifferent from those for either fat or carbohydrate ; and furthermore ,Since the protein usually furnishes only about 15 per cent of the totalenergy, the error in thus neglecting the protein is extremely small ,especially for Short experiments .
IZuntz and Schumburg , Physiologic des Marsch es, Berlin , 190 1 , p. 361 .
”Loewy, Oppenh eimer’
s Handbuch der B iochemie , Jena, 191 1 , 4 p . 281 .

386 A STUDY OF PROLONGED FASTING .
On the other hand , in considering the results of long experiments , itis not justifiable to neglect the protein entirely . As the result of a largenumber of experim ents made by Rubner and by Zuntz and his associates
,a certain number of standard figures regarding the combustion
of protein may be used with considerable confidence . Thus,they have
definitely established that 1 gram Of nitrogen in the urine correspondsto a heat production of calories as a result of the oxidation ofprotein . Furthermore
,Zuntz has computed that for each gram of
nitrogen in the urine liters of oxygen are absorbed and litersof carbon dioxide are produced . These values were Obtained from ex
perim ents on animals which were fed a diet of meat only . The methodof computing the energy from protein by making a special computationfor the energy accompanying the nitrogen in the urine was employedby Zuntz1 in computing the energy output from the values found withthe fasting subjects Cetti and Breithaupt .William s
, Riche , and Lusk2 have also made use of these values for
computing the heat production even in Short periods , and in accordancewith the computations of Loewy have calculated the non-proteinrespiratory quotient by deducting the carbon dioxide and oxygenapportioned to the protein oxidation from the total measured amountsof these gases . Using this non-protein respiratory quotient and
Zuntz and Schumburg’s table
,they have computed the energy of fat
and carbohydrate . The total urinary nitrogen multiplied bygave the energy value for protein .
Magnus-Levy3 and Lo ewy,
4 in discussing the indirect method ofcalcu lating the heat output
,emphasize the fact that the computation
gives accurate results only when the oxidation in the body proceedsalong normal lines . Recognizing the fact that there is a not inconsiderab le disturbance of the intermediary metabolism during pro longedfasting
,due in part to the excretion of large amounts of ammonia
and the formation OfB-oxybutyric acid , Grafe5 has attempted to com
pute the heat production by making numerous corrections , some ofwhich are certainly based upon premises not beyond question .
After a careful consideration of the various methods for computingindirectly the energy production from the gaseous exchange and the
urinary excretion of nitrogen, and taking into account all the possibleerrors and the weight of the errors in the different determinations ,it seemed most advantageous to use in our calculations the methodrecommended by Magnus—Levy, in which the heat output can be
direct ly computed by using the calorific equivalent of oxygen for1Lehmann , Mueller , Munk , Senato r , and Zuntz , Arch iv f . path . Anat. u. Physio l . u . f . klin.
Med 1893 , 131 , Supp . , p . 208 .
2Williams, R iche , and Lusk , Journ . Bio l . Chem . , 1912 , 12 , p . 357 .
8Magnus-Levy , von Noorden’
s Handbuch der Pathologie des Stofl'
wechsels, Berlin , 1896 ,
l , p . 217 .
‘Lo ewy , Oppenheimer’
s Handbuch der Biochem ie , Jena, 19 1 1 , 4 p . 281 .
I‘Cvrafe , Zeitschr. f. physio l. Chem 1910 , 65 , p . 21 .

388 A STUDY OF PROLONGED FASTING .
TABLE 58 .
— Heat production (indirect) computedfrom the gaseous exchange in experiment withsubj ect L . in the lying position .
Bed calorim eter (night) .
Date .
Respi Calorific
rato ry equivalento f carbon
tient.
28—29
Apr . 30—May 1 .
0 0 0 0 0
lFor duration of periods, see table 4 4 .
2Ou the days preceding and fo llowing th e fast the nigh t experiments were made after the

CALORIMETRY . 389
TABLE 58 .
— Heat production (indirect) computed from the gaseous exchange in experimentwith subj ect L . in the lying position— Contrnued.
Respiration apparatus (morning) .1
Heat.
(asleep)
21— 22
Apr. 30—May 1
1Duration of period was usually 8h 30m a. m . to 9h 3011“ a. m .
2The subject was without breakfast.

390 A STUDY OF PROLONGED FASTING .
The results of the computation of the heat output on these threebases are given in table 58, in which are recorded first the heat output
per 24 hours , computed on the average values obtained with the bedcalorimeter throughout the night ; second , the heat per 24 hours com
puted from resu lts obtained in the selected minimum periods duringthe night ; and third , the heat per 24 hours computed from the resultsobtained with the respiration apparatus ; and finally , the heat per kilogram oi body-weight per hour and per square meter of surface per 24hours computed from the observations with the respiration apparatus .
These values were computed from the total carbon-dioxide output andthe calorific equivalent of carbon dioxide
,corrected for the difference
due to the energy from protein, as stated previously, by deductingcalorie per liter.The average heat output on the 24 -hour basis ranged fromcalories on the first nigh t inside the chamber to a minimum ofcalories on the thirtieth night . Since the results obtained during thefirst 4 nights in the chamber were complicated by the previous ingestionof food
,particularly the night of April 10— 1 1
,when a large amount of
protein was taken in the evening meal, the results obtained for the
fasting period aremore properly compared . The highest value for thefasting period is calories on the first night and the lowest value is
calories on the thirtieth night . It is thus seen that there was asteady decrease in the total heat output as the fast progressed, althoughfrom the twenty-first to the thirty-first day the heat productionshowed a tendency towards constancy .
Using only the minimum periods during the night, we find a maximum value of 1 calories on the first night In the chamber and aminimum of 949 calories on the twenty-first night . For the fastingperiod, the values ranged from calories on the second night ofthe fast to 949 calories on the twenty-first night . Here
,again, it wi ll
be observed there was a steady fall in the heat production to about thetwenty-first day of the fast , and from that time the heat output showeda tendency to remain approximately constant for the last . 10 nights .Any possible criticisms of the comparisons of the minimum bed
calorimeter periods disappear in comparing the values found with therespiration apparatus . Here we find that the heat production rangedfrom calories on the morning fol lowing the first night of the fastto calories on the morning following the thirtieth ni ght of thefast . There is a distinct tendency for the heat production to fall progressively until the twenty-third day , and from that time on it remainsmore or less a constant .Of special importance in connection with this comparison is the fact
that on the first 3 nights the heat production in the bed- calorimeterexperiments was greater than in the experiments with the respirationapparatus the following morning . This was undoubtedly due to the

BALANCE OF INCOME AND OUTGO.
While it was impracticable to have this fasting subject remain in therespiration calorimeter for the entire time
,as in the fasting experiments
at Wesleyan University,and thus secure ideal conditions for studying
the total metabolism and energy transformation during the fast, yet,
recognizing the great value of a knowledge of the entire 24-hour energytransformation, we attempted to secure as frequent respiration experi
ments as possible to supplement the data Obtained inside the respirationcalorimeter during the night . This supplied a logical basis for a subsequent computation of the total energy transformation.
The intake of this subject consisted of pure distilled water and oxy
gen from the air. The output consisted of the water of respiration andperspiration
,the carbon-dioxide excretion from the lungs
, and thewaterand solids of the urine. Theoretically, one should not overlook thesmal l quantities of solid matter in the perspiration,
these being removedby the baths in distilled water.The oxygen in the intake appeared in the output combined with
either carbon or hydrogen ,since the oxygen entered into the combustion
of body material . In this combustion heat was liberated,which left
the body through various paths— by simple radiation and conduction ;as the sensible heat of excreta , i . e.
,the heat of the urine ; and as heat
required to vaporize water and to warm the inspired air to the bodytemperature .
For a complete understanding of the various components of the output
,particularly when considered upon the basis of the total energy
transformation in 24 hours,it is necessary to know the elementary
composition of the excreta . This requires a knowledge of the totalamount of water given off, either as liquid water or as water-vapor, thecarbon
,hydrogen
,and oxygen in the solid matter of urine, and the ni
trogen in the urine and the perspiration . Certain of these factors weredirect ly determined . Thus we have direct determinations of thenitrogen and carbon in the urine and of the nitrogen of perspiration .
The others can only be computed indirectly, for while we have accurateevidence regarding the carbon-dioxide excretion throughout the nightperiod , when the subject was inside the bed calorimeter, we have no
complete evidence of the carbon-dioxide excretion for the daytime,when he was outside of the calorimeter. Our first problem,
then,is
to estimate the probable katabolism of the subject throughout each 24hours .
TOTAL KATABOLISMPER 24 HOURS.
Knowing, as we do , the influence upon the katabolism of the slightestmuscular activity
,it is obvious that the carbon-dioxide output during
the night represents a minimum amount for this subject and that during
392

BALANCE OF INCOME AND OUTGO . 393
the day this will be materially increased . Fortunately the experimentsmade with the respiration apparatus supply evidence which enab lesus to compute this excretion of carbon dioxide with reasonable accuracy .
Thus we have respiration experiments in the morning, with the subj ectlying upon a couch
,which give values higher than those obtained during
the night in the respiration chamber. We have also , in the latter partof the fast at least
,a series of observations with the subject lying on
a couch just prior to his entering the calorimeter, which give valuesstill higher than those obtained with the same apparatus in the morning . On certain days we have values obtained while the subj ect wassitting quietly in a chair or Sitting writing. The increase in katabolismdue to these changes in body position and activity has already beennoted in considering the respiratory exchange .
Roughly Speaking,the subject was inside the respiration calorimeter
for approximately 1 1 or 12 hours each night ; during 10 hours of thistim e the katabolism was directly determined ; from the measured valuewe may estimate the probable katabolism during the entire sojourn of1 1 or 12 hours in the respiration calorimeter . The katabolism wasdetermined on the respiration apparatus for a period of approximately2 hours in the morning and an hour at night , making a sum total oftime during which the respiratory exchange was actual ly measured ,at least in the last part of the fast
,of from 14 to 15 hours . The remain
der of the time , i . e.,some 9 or 10 hours
,the subject was variously
occupied in the laboratory , for the most part sitting , either writing ,or talking with the various men examining him . A number of respiration experiments were made which were special ly designed to secureinformation regarding the probab le katabolism during such periods ofminor physical activity.
DAILY ACTIVITY.
From the notes made by the observers on the varIOus experimentalrecord sheets and by the watchers at other times, it was possible tocompute very carefully the number of minutes spent by the subjecton each day of the fast in different occupations . His daily routineconsisted of practically five degrees of activity— lying, Sitting resting ,sitting active
,standing
,and walking . Since there was a distinct
diurnal variation in the katabolism,lying in the evening
,which was
based upon the evening respiration experiments, was accorded a different value from that given to lying in the morning .
To Show the subdivision of the day into these various activities , thenumber of hoursandminutes occupied in thevariouspositions is recordedin table 59. The first column Shows the period when the subject waslying in the morning
,this including the time from the end of the calori
meter experiment to the time that he was weighed . The lying in theevening includes the entire time from the moment he lay down on the
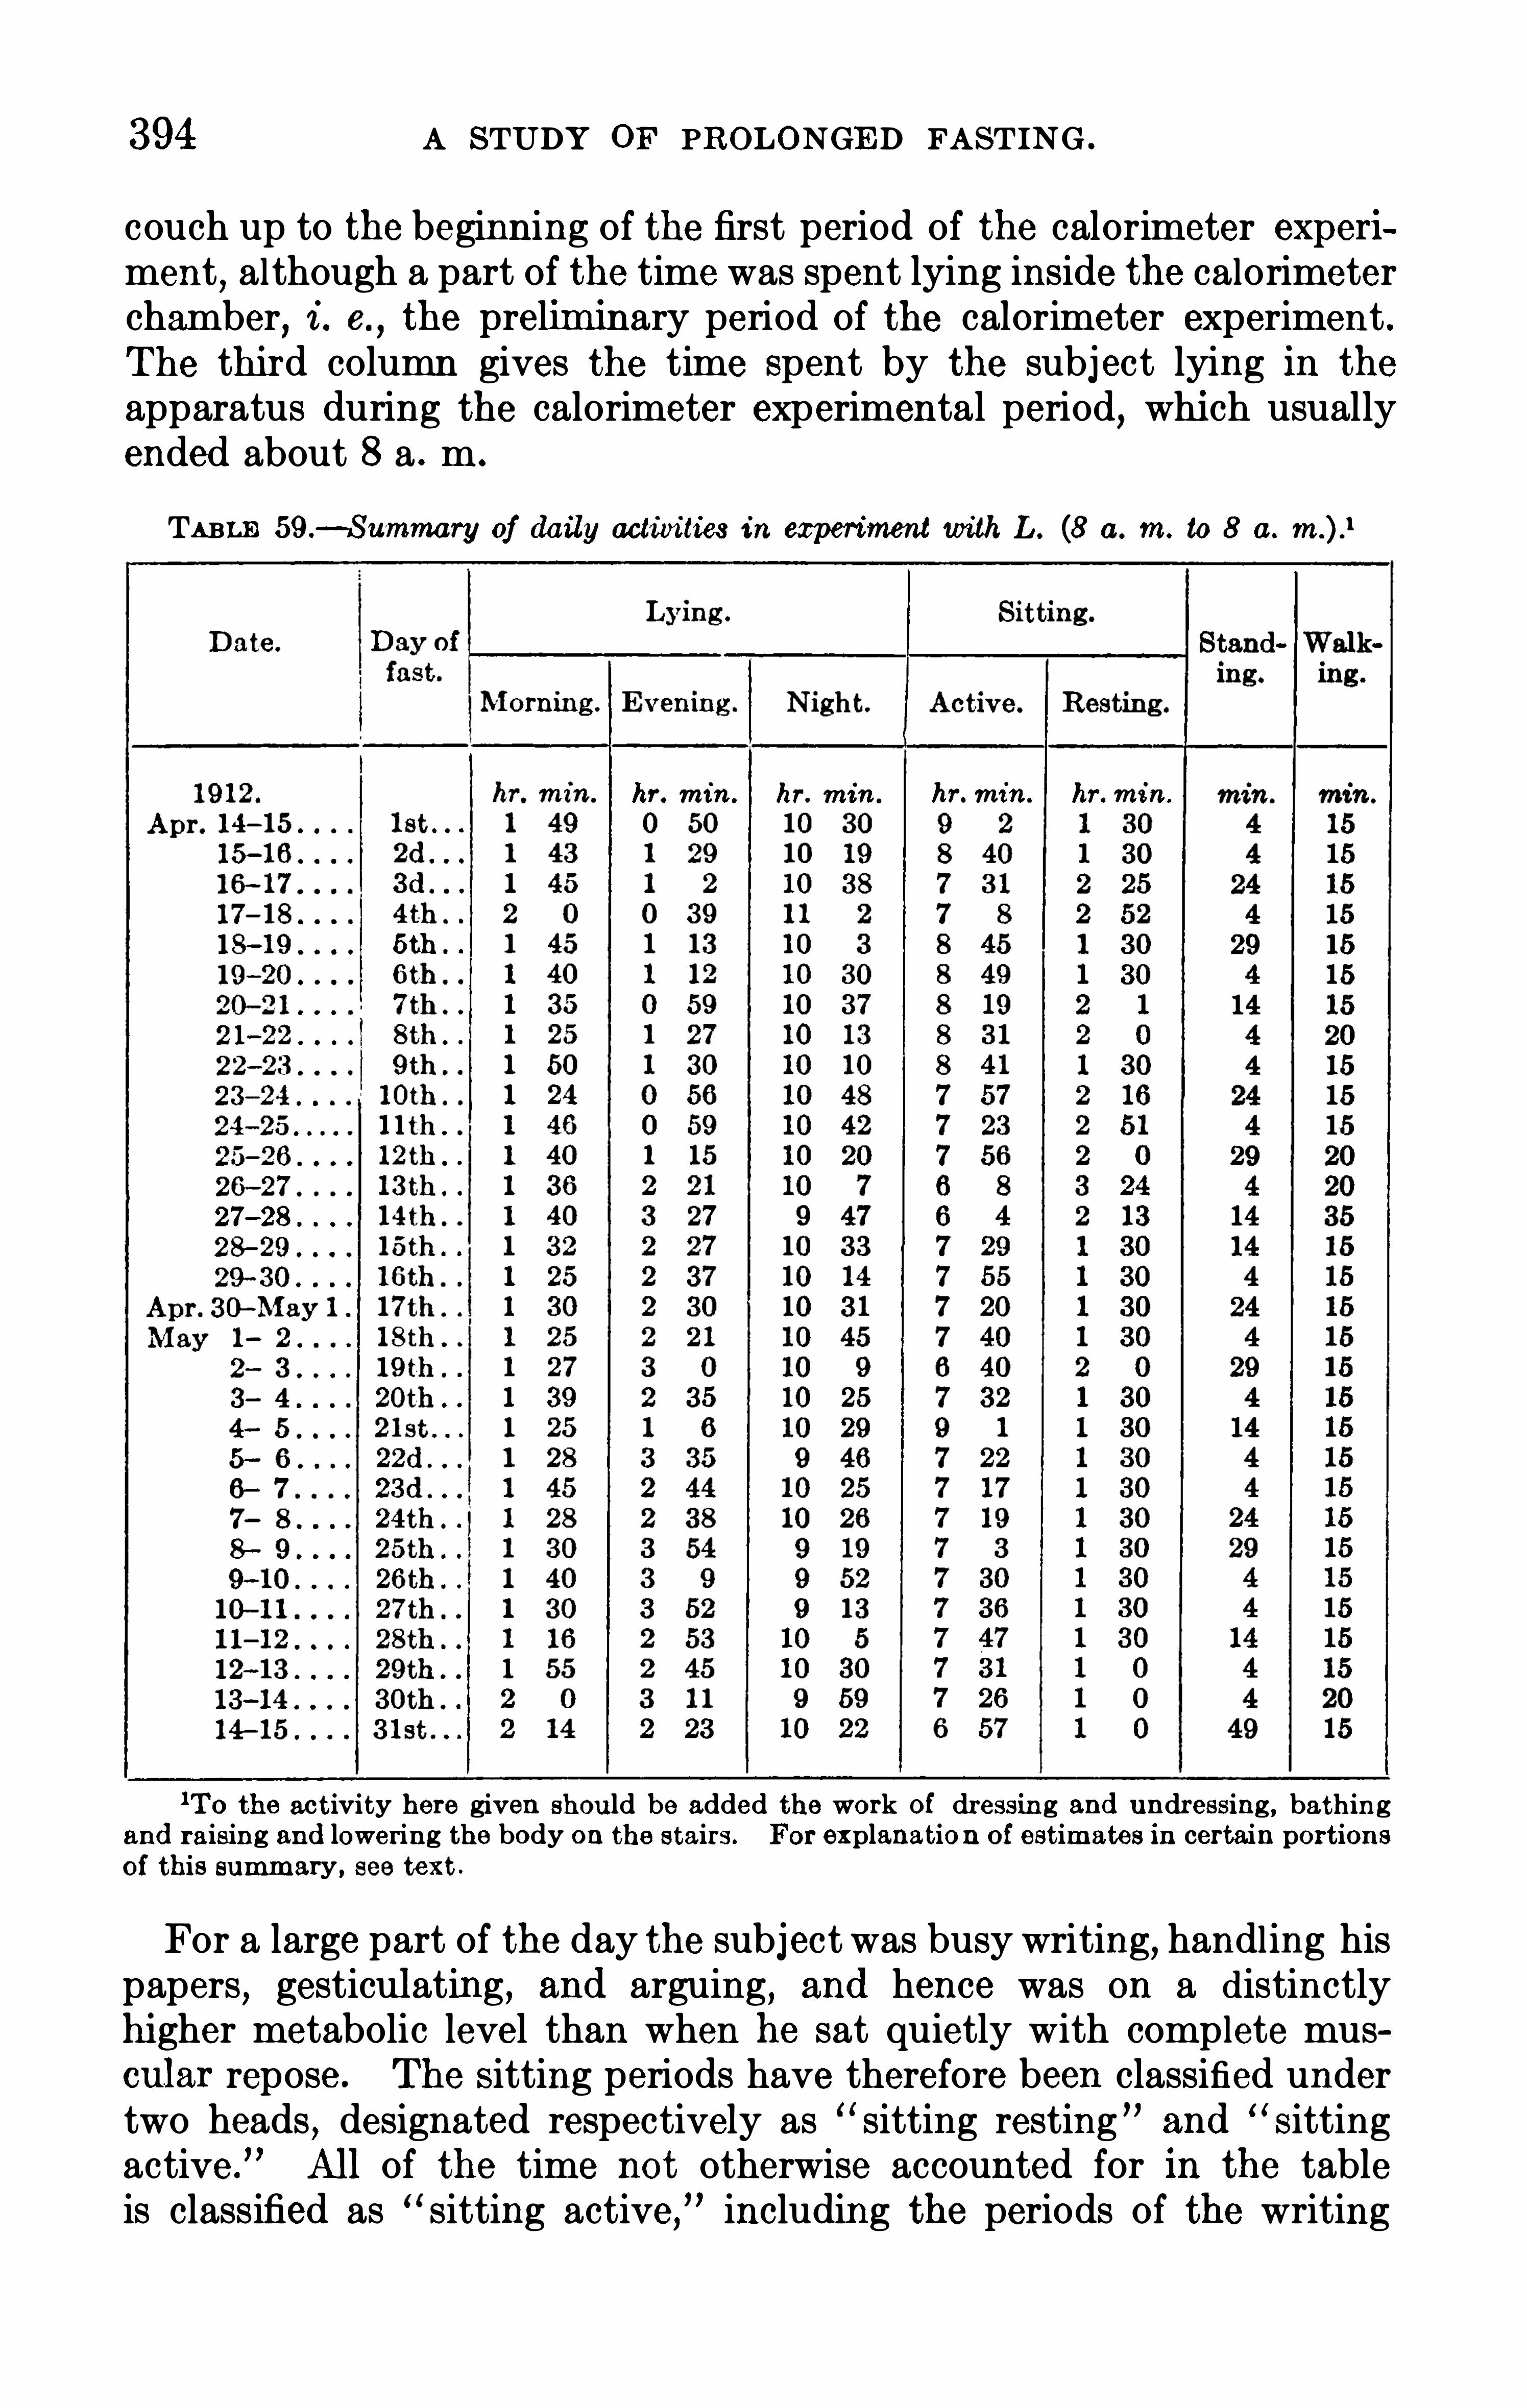
394 A STUDY OF PROLONGED FASTING .
couch up to the beginning of the first period of the calorimeter experiment
,although a part of the time was spent lying inside the calorimeter
chamber,i . e.
,the preliminary period of the calorimeter experiment .
The third column gives the time Spent by the subject lying in the
apparatus during the calorimeter experimental period, which usuallyended about 8 a . m .
TABLE 59 .
— Summary of daily activities in experiment with L . (8 a. m. to 8 a.
hr. min . hr. min . hr. min . hr. min.
5th . .
27—28
1To the activity h ere given sh ould be added the work of dressing and undressing , bath ingand raising and lowering the body on the stairs. For explanatio n of estimates in certain portionsof this summary , see text .
For a large part of the day the subject was busy writing, handling hispapers
,gesticulating , and arguing
, and hence was on a distinctlyhigher metabolic level than when he sat quietly with comp lete muscular repose . The Sitting periods have therefore been classified undertwo heads , designated respectively as sitting resting
”and
“Sitting
active .
” All of the time not otherwise accounted for in the tableis classified as sitting active ,
” including the periods of the writing

A STUDY OF PROLONGED FASTING .
TABLE 60 .
— Carbon—dioxide production and oxygen consumption in liters per 24 hours inexperiment with L . (8 a. m. to 8 a. m .)
Carbon dioxide.
Date .
To tal .
O O O O O
0 0 0 0 0
0 0 0 0 0
237 9
0 0 0 0 0
212 1
29—30 201 . 5
Apr . 30 -May 1 .
!The carbon-dioxide production assumed for the work of bath ing was on April 20—21 ,liters ; April 27— 28 , liters: May 4
— 5 , liters ; May 1 1— 12 , liters.
Laboratory with a professional athlete, in which the subject walked ona treadmi l l of Special construction . Basal figures for these studies weresupplied by the resu lts of a large number of determinations (made byDr . Cathcart)
1 of the metabo lism of this man while in a lying position .
A control experiment which was made within a fewmonths byMr . L .
E . Emm es, of the Laboratory staff, Shows a close agreement with theearlier Observations of Cathcart . Dr . Murschhauser
’s observations
other than walking have dealt entirely with determinations of themetabo l ism while the subject was standing in various positions , such as
lBenedict and Cath cart , Carnegie Inst. Wash . Pub. 187 , 1913 , p . 77 .

BALANCE OF INCOME AND OUTGO .
- !The oxygen consumption assum ed for the work of bathing was on Apri l 20—21 , liters ;April 27- 28 , liters ; May 4- 5 , liters ; May 1 1
— 12, liters.
attention,
’ “ relaxed , and similar positions . Using as a basis Cathcart ’s and Emmes ’ figures for lying and Dr .Murschhauser
’svalues for
standing, we find an increase over lying of about 10 per cent . Conse
quently this 10 per cent increment has been used to compute the valuefor standing for our fasting subject .For the values for walking we have relied imp licitly upon the extensive series of observations made by Dr . Murschhauser with the
professional athlete . This subject showed an increment of 190 percent in the metabolism whi le walking at a “slow pace meters
per minute— over that while lying . Recognizing the fact that Dr .

398 A STUDY or PROLONGED FASTING .
Murschhauser’s subject was a trained athlete and represented the
highest degree of muscular vigor and that our subject was a non
athlete , flabby, and, as the fast progressed, still more emaciated andless inclined to physical exercise
,we have employed but 100 per cent
for the computation of the value for L . ,since there was here the possi
bility of a very considerable error. Fortunately, as will be seen byreference to table 60, the total carbon-dioxide production and oxygenconsumption while the subj ect was walking was hardly 2 per cent ofthe total value for the day ; we may therefore consider any error presentas entirely negligible .
For the numerous physical tests and the photographing, the subject
had to dress and undress at least once or twice each day and on somedays several times . The metabolism involved in dressing and undressing was studied in a large number of experiments in the respirationcalorimeter at Wesleyan University,
1and it was found that the resting
metabolism was increased 30 per cent during one hour . Accordinglythe values obtained while the subject was sitting resting were increasedby 30 per cent of the resting metabolism for one hour to allow for thismuscular work of dressing and undressing . Here, again,
the absolutevalues involved are extremely small when compared with the total forthe day . On 4 days an additional allowance was made for the work ofbathing
,this being considered as equivalent to the metabolism for 10
minutes of standing . The value for this on the seventh day of the fastwas liters of carbon dioxide and liters of oxygen ; on the fourteenth day it was liters of carbon dioxide and liters of oxygen ;on the twenty-first day it was liters of carbon dioxide and
liters of oxygen ; and on the twenty-eighth day it was liters ofcarbon dioxide and liters of oxygen .
A further computation was made of the metabolism involved in thework of going up and down stairs . For lack of better evidence , it wasestimated that the amount of work performed in going down stairswas equal to half of that going up . The number of kilogrammeters
were computed by mu ltiplying the weight of the man by the heightthrough which he lifted his body, increasing this by one—half whenthe work of going down stairs was included . The number of calorieswere then obtained by dividing the number of kilogrammeters by thefactor Finally
,by using the calorific equivalent for the aver
age respiratory quotient for the day, computed from the results ofthe experiments with the calorimeter and the respiration apparatus ,we were able to calculate the amount of carbon dioxide excreted andoxygen consumed in the muscular work of lifting the body . The totalprobab le carbon-dioxide production and oxygen consumption for the24 hours is therefore the sum of the values computed for the varyingdegrees of activity ; these totals are given in the last column of tab le 60.
lBenedict and Carpenter. Carnegie Inst. Wash . Pub. 126 , 1910. p . 24 7 .

400 A STUDY or PROLONGED FASTING .
of the metabolism made during the long soj ourn of the subject in therespiration calorimeter at night
,the daily records of the occupations of
the sub ject during the fast , and standard figures regarding the effectupon the katabolism of variations in activity
,we are able to make for
practically every hour of the day a reasonably satisfactory estimate ofthe probable activity and thus obtain the total katabolism.
Wh en complete 24 -hour determinations of the various factors entering into the computation of the character of the katabolism can be
obtained, namely, the direct measurement of the total carbon-dioxideoutput
,oxygen intake, and elementary composition of the solid matter
of urine,the most exact method for computing the character of the
katabolism and the kinds and the amounts of material burned is thatoutlined in the previous publication on inanition
, in which use wasmade of simultaneous equations . 1 When
,as is the case with this
fasting subject , an element of uncertainty enters into the fundamentalfigures which would be used in such computations and it is necessaryto make our estimates of the total carbon-dioxide output and oxygenintake from the results of fragmentary
,periodic determinations
,it
does not seem justifiable , or indeed logical , to employ the extremelyexact mathematical computation used in the earlier publication .
It is true that the protein katabolism may be as readily obtained forthis experiment as for the experiments previously reported , since wehave data as to the total nitrogen excretion
,but for the apportionment
of the katabolism between fat and carbohydrate a simpler method isprobably more justifiable . We have thus first computed the proteinkatabolism
,and then apportioned the katabolism of carbohydrate
and fat by a method to be subsequently described .
PROTEIN KATABOLISM.
In accordance with the current conception of the relationshipbetween the nitrogen in the urine and protein katabolism,
the totalamount of protein katabolizedmay be computed from the total amountof nitrogen in the urine by using the percentage of nitrogen in the tissuebroken down . In ordinary metabolism experiments
,when the food
ingested is of varying composition and contains proteins of variouskinds
,it is comm only assumed that the nitrogen in the tissue broken
down is represented by the factor so that the amount of nitrogenin the urine may be multiplied by this factor to obtain the amount ofprotein in the tissue broken down . In a fasting experiment, however ,only body-material is katabolized and the percentage of nitrogen indry
,fat-free, and ash-free flesh has been shown to be hence the
factor should be used instead of for computing the protein inthe flesh katabolized from the amount of nitrogen in the urine . Accordingly this factor was used for our computations of the protein kataho l ism in this experiment .
lBenedict, Carnegie Inst. Wash . Pub. 77. 1907 , pp. 36 and 452.

BALANCE or INCOME AND OUTGO . 401
In a previous section of this publication (see table 27, p . it hasbeen shown that the nitrogen in the urine gradually decreased as thefast progressed , but the nitrogen excretion per kilogram of body-weightis also of interest in this connection as showing whether or not thedecreasewas proportional to the loss in weight . From the values givenin table 27 it will be seen that after the first 4 days of the fast, duringwhich there was a marked rise in the nitrogen excretion, the values
per kilogram of body-weight had a tendency to fall as the fast pro
gressed, the highest value gram) being found on the fourth dayof fasting and the lowest gram) on the twenty-third and
thirty-first days of the fast . It is thus unquestionable that therewas a distinct tendency in the latter part of the fast for the nitrogenexcretion per kilogram of body-weight to be lower than in the firstpart of the fast . The values for the total nitrogen excreted and
the computed amounts of protein katabolized are given in columnsA and P, table 61 . The protein katabolized ranged from a maximum of grams on the fourth day of the fast to a minimum of
grams on the last day, the course of the protein curve naturallyfol lowing that of the nitrogen excretion. Finally
, on the assumption that flesh contains 20 per cent protein and 80 per cent water,the flesh equivalent of the protein katabolized has been computed bymultiplying the protein by 5 , the results being given in colunm Q oftable 61 . These values obviously fol low those for the nitrogen and
the protein,the maximum value being 356 grams on the fourth day of
fasting and the minimum 208 grams on the last day of the fast .
APPORTIONMENT OF NON-PROTEIN KATABOLISM BETWEEN CARBOHYDRATEAND FAT .
Themethod used in this publication for computing the katabolism offat and carbohydrate for our fasting subject was
,in brief
,as follows
The amounts of carbon dioxide produced and oxygen consumed inthe combustion of carbohydrate and fat were first obtained bydeductingthe computed amounts for the combustion of protein from the totalamounts of carbon dioxide produced and oxygen consumed . Fromthese values the non-protein respiratory quotient for each day of thefast was readily calculated . Using these non-protein respiratoryquotients, we next found the total heat given off in the combustion ofthe carbohydrate and fat, the apportionment of the heat outputbetween them being made subsequently by the use of certain factors .From the heat output due to the combustion of the carbohydrateand the fat, the amounts of these two body materials katabolized werefinally calculated by means of their heats of combustion.

402 A STUDY OF PROLONGED FASTING .
CARBON DIOX IDE PRODUCED AND OXYGEN CONSUMED IN THE KATABOLI SM or
CARBOHYDRATE AND FAT .
Since we know the amount of nitrogen excreted in the urine , the carbon dioxide produced and the oxygen consumed in the katabolism ofprotein may be computed by using factors established by Zuntz and
his co-workers . Thus , for every gram of nitrogen in the urine , Zuntzhas found that liters of carbon dioxide are produced and litersof oxygen are consumed . The total nitrogen excretion for each dayof the fast is given in column A of table 61 , and the carbon dioxideproduced and the oxygen consumed in the combustion of protein are
given in columns C and F respectively . Deducting these values from
TABLE 6 1 .— Body materials katabolized and total heat
froduction (computed) per 24 hours
in experiment with
Oxygen .
Date .
From fatpro tein
25—26 .
1See table 60 .

404 A STUDY OF PROLONGED FASTING .
We found in this experiment none of the extraordinarily low valuesreported by other observers with fasting man,
the lowest quotientObtained with our subject being which was found for but one day .
When the difliculties in securing accurate determinations of therespiratory quotients are considered— all of the errors in the determination of both the oxygen consumption and the carbon-dioxide productionaffecting the value of the respiratory quotient— it is perhaps surprisingthat values more abnormal than those shown in column H are not
found . It is of course not impossible that abnormal katabolism resulting from the acidosis of this man may in part account for this slightlylowered respiratory quotient .In fasting there is unquestionably a larger excretion of ammonia in
the urine and likewise an excretion of fi-oxybutyric acid . Indeed,
an attempt has been made by Grafe1 to correct for the alteration in thevalues for the respiratory quotient when ammonia is excreted in theurine instead of the ordinary urea . It may be questioned
,however
,
whether data obtainable in fasting experiments are sufficiently accurateand the oxygen measurements are sufficiently exact to warrant suchan attempt . Furthermore
,since the alteration from urea to ammonia
is merely a matter of hydrolysis , the computation may prove to besomewhat problematical . In all probability the protein katabolismis not greatly aflected,
for while there is a distinct disturbance in therelationship between the ammonia and the total nitrogen, there is notan excessive amount of amino-acids formed , as the rest nitrogen is notunduly large . On the other hand , Magnus—Levy
2 has clearly shownthat the formation of acetone bodies due to the partial oxidation offat results in the absorption of oxygen and production of carbon dioxide
,thus influencing slightly the respiratory quotient, but concludes
that a production of 40 grams of fi-oxybutyric acid alters the respiratory quotient not more thanA not inconsiderable proportion of the total energy transformation,
as here computed,is based upon experiments made with the respiration
apparatus,in which the cutaneous respiration was not considered .
The respiratory quotient might thus have been slightly higher had thecutaneous respiration also been determined , Magnus-Levy mentioning
as the probab le correction to be applied to the respiratory quotient determined by nose or mouth appliances .While the determinations of the respiratory quotient by means of
the bed calorimeter and the respiration apparatus check each otherand show that the results are within a few units of being accurate,nevertheless when the protein katabolism correction amounts to buta few thousandths and the correction for the formation of acetonebodies also amounts to only a few thousandths , it can be seen that the
1G rafe , Zeitschr. f. physio l . Chemie , 1910 , 65 , p . 21 .
2Magnus-Levy , Zeitsch r . f. klin. Med 1905 , 56 , p. 83 .

BALANCE OF INCOME AND OUTGO . 405
degree of accuracy in the determination of the respiratory quotientmust be extraordinarily high to admit of an intel ligent discussionof these points . Furthermore
,it is reasonable to question whether
or not one can logical ly use the determination of the respiratoryquotient for analyzing in any way the organic processes which are
affected during fasting . It is certain, of course, that the combustionof fat forms the greatest part of the total combustion . On the otherhand , there may be a slight formation of carbohydrate on some dayswhich would alter the quotient ; there may also be an abnormal excretion of materials in the urine which wou l d l ikewise alter the respiratoryquotient ; and there is always a possibil ity of the production of B-Oxybutyric acid . All of these factors
,however
,affect the quotient but
slightly,and therefore no great stress need be laid upon them. In fact
,
it is doubtful,as was pointed out in the earlier fasting pub lication
,
whether the computation of the total glycogen output was sufficientlyaccurate to justify the assumption that glycogen was actually producedon 2 days of fasting . I believe that the computations of the 24-hourgaseous exchange in the experiment with L . are not sufficiently accurate to throw definite light upon the question as to whether or notglycogen was produced after the first few days of the fast .The general course of the respiratory quotients found with L . is
wholly in accord with those observed with the Middletown subjectS . A . B.
, who remained in the respiration calorimeter the entire periodof the experim ent
, except that the quotients obtained for the lattersubject were almost invariably somewhat higher. Thus , the averagerespiratory quotients for the 7 days of the fasting experiment withS . A . B . were and these valuesbeing substantially higher than those observed for our subj ect L . on
the fourth to seventh days of his fast . The respiratory quotients forL . given in co lumn H of table 61 are
,however, non-protein respiratory
quotients,while those here given for S . A. B . are the total respiratory
quotients . i . e.,they include the protein katabolism . Hence the dis
parity is not so great , as the respiratory quotient for protein is not farfrom In any event
,it is clear that we do not have here sufficient
evidence of so great a disturbance in either fat,carbohydrate
,or protein
katabolism as to lead us to believe that there was a fundamental alteration in the character of the katabolism
,other than that accompany
ing the acidosis during the 31-day fast .
ENERGY DERIVED FROM KATABOL ISM OF CARBOHYDRATE AND FAT.
Using these values for the non-protein respiratory quotient, the oxy
gen consumption required for the combustion of the fatand carbohydrate
(column G of tab le and the calorific ei1uivalents of oxygen given inZuntz and Schumburg
’s table
,
1 we are able to compute the energy1Zuntz and Schumburg , Physio logie des Marsches, Berlin , 1901 , p . 361 .

406 A STUDY OF PROLONGED FASTING .
derived from the carbohydrate and fat katabolized. For instance,
on April 14— 15,the first day of the fast , the non-protein respiratory
quotient was The calorific equivalent of oxygen with this respiratory quotient is 4 .752 calories per liter ; hence the total heat givenofl from the combustion of the fat and carbohydrate would be equalto the oxygen consumed In the combustion liters) multip liedby the calorific equivalent for this non-protein respiratory quotient
,
i . e.,
the calculation being calories . The
values for the total heat resulting from the combustion of the fat andcarbohydrate for each day of the fast are given in column I of table 61 .
The table of Zuntz and Schumburg has been elaborated in a mosthelpful and ingenious way by Wi lliams , Riche , and Lusk ,
1 who haveapportioned (in terms of percentage of total energy) the fat-carbohydrate katabolism ,
using the non-protein respiratory quotient . Witha non-protein respiratory quotient of these authors compute that
per cent of the energy is derived from carbohydrate and per
cent from fat ; consequent ly , on April 14 — 15 about per cent of thecalories as calculated previously , or 291 calories , are derived from
the katabolism of carbohydrate , and the remaining calories fromfat . Obviously
,as the non-protein respiratory quotient fal ls , the per
centage of energy derived from carbohydrate becomes less and less ,until
,at or less , it is assumed that no carbohydrate is burned . In
fact,on several days when the non-protein respiratory quotient wasand on one day we have fol lowed Lusk ’s usage in employing
the value for the quotient ofO
AMOUNTS o r CARBOHYDRATE AND OF FAT KATABOL IZED.
Since Wil liams , Riche , and Lusk were particularly interested in theenergy transformation ,
their apportionment of the non-protein katabolism between fat and carbohydrate was expressed in percentage ofenergy from carbohydrate and percentage of energy from fat . For ourpurpose , since we desire the weight of the carbohydrate and fat burned ,it is very simple to compute th e heat production and then by dividingby the appropriate calorific values for carbohydrate and fat , obtaindirectly the number of grams of carbohydrate and fat entering into thekatabolism .
The heat of combustion of the carbohydrate burned in the body istaken as that of glycogen,
calories per gram ,
2 while the heat ofcombustion for the fat is taken as that of body fat , calories pergram .
3 By dividing the respective amounts of energy by these heatsof combustion
,the number of grams of glycogen and body fat partici
pating in the katabolism are computed . These are recorded in co lumnsN and o in tab le 61 . While this method of computing the probab le
lWilliam s, Riche , and Lusk , Journ . B io l . Chem 19 12 , 12 , p . 357 .
2Emery and Benedict, Am . Journ. Physio l . , 19 1 1 , 28 , p . 301 .
3Benedict and Osterberg, Am . Journ . Physio l . , 1900 , 4 , p . 69 .

408 A STUDY OF PROLONGED FASTING .
Although L . went without food for 31 days , and hence the complicated factor of determining the intake of water in the food was eliminated, nevertheless he drank a definite amount of water each day , andwater was lost from the body through various paths . We know thatin the urine a certain amount of water was mixed with the solids . Thiswas determined very carefully in the latter part of the fast , so that wehad accurate information as to the relationship between the totalamount of water and total solids , andwere accordingly able to computethe water excreted in the urine during the earlier days of the fast .Water was also lost by vaporization from the lungs and skin . In the
method formerly used for obtaining the loss of water from the bodyit was likewise necessary to determine carefully the amount of waterthus vaporized in the 24 hours . In this fasting experim ent , while suchdeterminations were made for the period when the subjec t was insidethe respiration calorimeter, we have no direct evidence regarding theprobable water vaporized from the lungs and skin during the tim e thatL . was outside of the chamber . Even the respiration experiments
,
while supplying information regarding the carbon-dioxide output andoxygen intake , give no evidence as to the excretion of water. Accordingly ,
the total outgo of water must be determined by indirect computation. Fortunately the data regarding the katabolism of L . are sofull and exact that we are justified in employing such a method .
LOSS OF PREFORMED WATER.
To determine the actual drafts upon body material in the form ofpreformed water, the computation proceeds in the following manner,the results being given in table 62 . We have first the “ insensibleperspiration ” (column A) , which is likewise recorded in table 4 (page
From the discussion in the preceding section we have information as to the amounts of carbohydrate, fat , and protein which werekatabolized in the body . Th e carbohydrate was comp letely oxidized ,leaving the body in the form of carbon dioxide and water, and hencewas a complete loss . The fat was similarly burned to carbon dioxideand water . On the other hand
,only a portion of the protein was
actually oxidized and, so to speak , volatilized and lost from the body .
Using standard figures,Loewy1 has computed that for each 100
grams of combustible anhydrous flesh which is katabolized there areavailable for oxidation and conversion to carbon dioxide and water
grams of carbon, grams of hydrogen, and grams ofoxygen. Thus , of the total protein molecule, per cent may beburned and per cent may be excreted in urine or feces . In computing th e total weights of carbohydrate, fat , and protein oxidized andvolatilized in the body we must therefore allow for per cent of theprotein excreted in the urine . The values given in column B of tab le 62
lLoewy , Oppenheimer’
s Handbuch der B io chem ie , Jena, 191 1 , 4 p . 156 .

BALANCE OF INCOME AND OUTGO .
for the anhydrous material burned therefore represent the total weightof carbohydrate burned (column N of table the total weight of fatburned (column and per cent of the total weight given in table61 (column P) for the amount of protein burned .
Since the insensible perspiration represents the actual insensibleloss from the body , the amount of preformed water vaporized may be
TABLE 62.
— Preformed water vaporized or excreted from the body and drafts upon theoriginal supply in experimentwith L .
Preformed water.
Date .
Apr . 30—May 1
-179
— 122
1Allowance has been made for the proportion per cent) of th e pro te in kataboliz ed assum ed to havebeen excreted in th e urine .
2It is assum ed that the amount of water from fatty tissue is equal to 10 per cent of the fat katabo lized.
4 10 A STUDY OF PROLONGED FASTING .
obtained by deducting the total weight of anhydrous material burnedfrom the total amount of insensible perspiration . The results arerecorded in column 0 of table 62, these values representing the totalamount of water actually vaporized from the lungs and skin of thesubject . We know from former experience‘ that the preformed waterlost in this way is affected largely by muscular activity and that it ismade up in part of water wh ich has been combined with flesh andwithfatty tissue .
In addition to the loss of water through the lungs and Skin,there was
also a loss of preformed water through the urine , the amounts beinggiven in column D , while the total amount of preformed water, eithervaporized or excreted , is shown in column E . There was
,however,
not only an outgo but an income of water,as the sub ject drank a
measured am ount of water each day . To find the actual loss of preformed water from the store in the body
,this income of water (see
column F) should be deducted , the values in column G showing theactual loss of preformed water from the store in the body .
The total loss of preformed water varied from 769 grams on the firstday to 8 gram s on the twenty-third day ; as a matter of fact the bodyactually stored 80 grams of water on the thirteenth day . The heaviestlosses occurred on the first few days of the fast . In this discussion itis necessary to consider that the body loses fairly regularly a quantityof protein and fat each day . This loss is accompanied by a loss of thewater normally combined in the flesh and fatty tissue, the amountbeing relatively constant and averaging not far from 200 grams of water
per day . The portion of the body remaining (which may, for convenience , be called the
“ residue”) likewise has a water-content which undergoes fluctuation. The total loss of preformed water in column G maytherefore be classified under three heads : (1)water of flesh broken down ;(2) water of fatty tissue broken down ; (3) water from other sources ,i . e .
,from the residue .
The amounts of water from the flesh d isintegrated and fatty tissuebroken down may be computed by the use of certain factors . Thus itis assumed that there are 4 grams of water combined with every gramof protein to form flesh ; furthermore , that body fat is combined with10 per cent
2 of its weight in water to form fatty tissue. The draftupon the store of preformed water due to the katabolism of proteinmay therefore be found by multiplying the amount of protein katabolized by 4 , and the draft upon the preformed water due to thekatabolism of fatty tissue by finding 10 per cent of the amount of fat
lBenedict. Carnegie Inst. Wash . Pub. 77 , p . 4 29 .
zMunk (Lehmann , Mueller, Munk , Senato r, and Zuntz , Archiv f. path . Anat. u . Physio l1893 . 131 , Supp . , p . 2 16) in computing the body-losses uses 10 per cent ; Albu and Neuberg(Physio l . u . Path . des Mineralstofl
'
wechsels, Berlin , 1906 , p . 9) also assume 10 per cent. On the
other hand , Bozenraad (Deutsch . Archiv f . klin. Med. , 19 1 1 , 103 , p . 120) states that the water
content o f human fat may vary from 7 to 46 per cent. The average water-content Of the fat infat people was per cent, while in emaciated persons it was per cent.

A STUDY OF PROLONGED FASTING .
TOTAL LOSS OF ORIGINAL BODY SUBSTANCE.
From an analysis of the foregoing data we are in a position to state ,with a considerable degree of accuracy , the loss of carbohydrate, fat ,protein, and preformed water, and solids excreted in urine and from theskin
,and thus present a general picture of the total loss of original body
substance during fasting . This is shown in table 63 . The combustionof carbohydrate ceased after the first 13 days of the fast . The combue
TABLE 63 .
—Distribution of loss. in grams of original body-substance per 24 hours, in experimentwith L .
0 0 0 0 0
0 0 0 0 0
27—28
Apr. 30—May 1
1See page 4 08 .
’See table 62.
‘Amounts calcu lated for first 15 days of fast. (See table 24 .
‘Urea plus sodium ch loride calculated from values given in table 22 (p . Excreta from the skin weredetermined each week, 3 . g . , from the tim e of bathing on evening of April 13 to the time of bath ing on th eevening of April 20. For the total nitrogen excreted In th e urine each day , see table 29.

BALANCE OF INCOME AND OUTGO . 4 13
tion of fat and protein continued without material alteration in relativeproportions until the end of the fast . The preformed water lost fromthe body came from three sources , first , that combined with the proteinto form flesh ; second , that combined with fat to form fatty tissue ;third
,water from other sources in the body . Finally , we have the
solid excreta from the body made up of the solids of the urine1 and thesolids from the skin . There was no fecal loss .
TOTAL ENERGY LOSS.
The loss in energy as the fast progressed was in two forms , i . e.,the
kinetic energy in the form of heat , which includes the sensible heat ofexcreta, the heat lost by radiation and conduction , and the heat ofvaporization of water ; and the potential energy of the solid excreta ,chiefly that of the organic material in the urine .
Considering first the kinetic energy or the heat liberated , it is clearthat the heat results from the actual combustion of organic material
,
such as protein,carbohydrate
,and fat . From our former computations
(see table we can apportion the heat-production among these threecompounds . This apportionment is Shown in table 64 , which , for subsequent discussion,
also gives the total amount of energy lost from the
body .
The greatest loss of heat falls upon the fat , with the protein supplying the greater part of the remainder . As a matter of fact
,although
the carbohydrate (glycogen) is rapidly drawn upon and apparently theavailable supply is quickly depleted , sufficient glycogen is burned thefirst day of the fast to furnish somewhat more heat thanwas supplied bythe protein on that day. After the first 3 days , the heat was derivedalmost wholly from a fat-protein katabolism,
with a minimum supply ofglycogen . The combustion of glycogen ceases after the thirteenth day .
The actual quota each compound supplies to the daily energy requirement is best seen by placing the heat output subdivision upon the percentage basis . This is done in table 65 , which Shows that on the fir st3 days from 10 to 16 per cent of the heat was derived from glycogen .
Subsequently , the glycogen combustion furnished hardly more than1 to 3 per cent of the heat . After the thirteenth day , approximately
per cent of the heat was derived from the oxidation of the proteinand the remainder from the combustion of fat .In the fasting experiment with L .
,the body lost not only the kinetic
energy of material burned , but also the potential energy of solid unoxidized material contained in the urine . Since there were no feces duringthe fast
,no potential energy was lost in this way. While both glyco
gen and fat burn completely to form carbon dioxide and water in1It is obvious that the unoxidized material of prote in is a constituent in two co lumns of th e
table . In co lumn A , the total protein includes the unoxidized material wh ich appears again in
the so lids in the urine.

4 14 A STUDY OF PROLONGED FASTING .
normal katabolism, under certain pathological conditions and in
inanition,the fat combustion is defective and certain partially oxidized
bodies— the so-called “ acetone bodies”— are produced and excretedchiefly in the urine .
In the earlier report of fasting experiments1 direct evidence of thepresence of these bodies was not availab le, and in computing the heat
TABLE 64 .
— Distri bution of heat producggdp
er 24 hours to body-materials katabolized, and totalenergy loss of tiw y in experiment with L .
TotalDate .
Day Of
21—22
2 lst
24 th
29 th
14 —15 3 l st
from protein we assumed erroneously that al l of the unoxidized materialin the urine was derived from the cleavage products of protein . The
method of simultaneous equations there emp loyed is fundamentallybased upon the assumption that the cleavages all proceed in a normalmanner . By this method , the total carbon excreted , inc luding thatof urine and carbon dioxide , was apportioned among the protein , car
1Benedict, Carnegie Inst . Pub. 77 1907 , p . 495 .

4 16 A STUDY OF PROLONGED FASTING .
TABLE 66 .
— Complete metabolism results with subject L . during 4 days pres-fastingperiod, 31 daysfasting, and 3 days post-fasting period.
In no series of derived tables IS it possible to draw complete comparisons ofthe various factors of metabolism, and this can be done satisfactorily onlywhen all of the dataare grouped together. I have been requested by anumberof physio logists to summarize all of the data obtained with this subject inone large table at the end of the book . Since so much stress has been laidupon the desirability of such a presentation, the data are given here in full .In order to bring together comparative data for each day of the fast, it
has been necessary to place in each column results which represent in the aggregate a total of 36 hours, each single result, however, being either taken at the
end of 24 hours or representing a total for 24 hours . The results recorded onthe thirty-first day to which an asterisk has been affixed were , as amatter offact, obtained a short time after the first food had been taken .
FIG . 47 .
— Metabolism chart off the most immntfactorsmeasured on subject L .
throughout t f t
Although table 66 gives the exactmathematical expression of the quantitiesof materials involved in the differentmeasurements of the metabo lism of thissubject, a visualization of the relationships between the various factors of
metabo lism is best secured by a series of curves. A chart containing curvesfor all of the factors measured on this subject would be of such great size asto preclude convenient inspection . Hence we have col lected here only themost important or more generally observed factors. Although no specificreference ismade to these curves for any comparisons in the text, it is obviousthat a constant reference to this chart is presupposed in a careful reading ofthe repo rt .