Extreme diel horizontal migrations by a tropical nearshore resident micronekton community
14
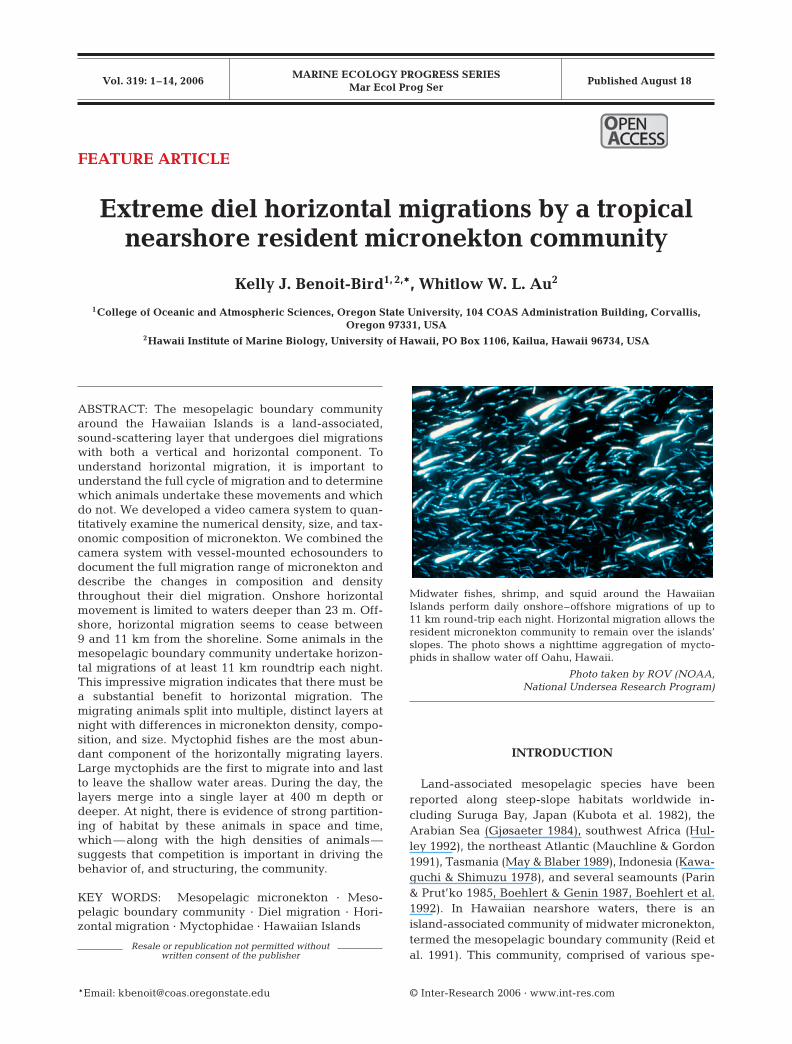
MARINE ECOLOGY PROGRESS SERIES Mar Ecol Prog Ser Vol. 319: 1–14, 2006 Published August 18 INTRODUCTION Land-associated mesopelagic species have been reported along steep-slope habitats worldwide in- cluding Suruga Bay, Japan (Kubota et al. 1982), the Arabian Sea (Gjøsaeter 1984), southwest Africa (Hul- ley 1992), the northeast Atlantic (Mauchline & Gordon 1991), Tasmania (May & Blaber 1989), Indonesia (Kawa- guchi & Shimuzu 1978), and several seamounts (Parin & Prut’ko 1985, Boehlert & Genin 1987, Boehlert et al. 1992). In Hawaiian nearshore waters, there is an island-associated community of midwater micronekton, termed the mesopelagic boundary community (Reid et al. 1991). This community, comprised of various spe- © Inter-Research 2006 · www.int-res.com *Email: [email protected] FEATURE ARTICLE Extreme diel horizontal migrations by a tropical nearshore resident micronekton community Kelly J. Benoit-Bird 1, 2, *, Whitlow W. L. Au 2 1 College of Oceanic and Atmospheric Sciences, Oregon State University, 104 COAS Administration Building, Corvallis, Oregon 97331, USA 2 Hawaii Institute of Marine Biology, University of Hawaii, PO Box 1106, Kailua, Hawaii 96734, USA ABSTRACT: The mesopelagic boundary community around the Hawaiian Islands is a land-associated, sound-scattering layer that undergoes diel migrations with both a vertical and horizontal component. To understand horizontal migration, it is important to understand the full cycle of migration and to determine which animals undertake these movements and which do not. We developed a video camera system to quan- titatively examine the numerical density, size, and tax- onomic composition of micronekton. We combined the camera system with vessel-mounted echosounders to document the full migration range of micronekton and describe the changes in composition and density throughout their diel migration. Onshore horizontal movement is limited to waters deeper than 23 m. Off- shore, horizontal migration seems to cease between 9 and 11 km from the shoreline. Some animals in the mesopelagic boundary community undertake horizon- tal migrations of at least 11 km roundtrip each night. This impressive migration indicates that there must be a substantial benefit to horizontal migration. The migrating animals split into multiple, distinct layers at night with differences in micronekton density, compo- sition, and size. Myctophid fishes are the most abun- dant component of the horizontally migrating layers. Large myctophids are the first to migrate into and last to leave the shallow water areas. During the day, the layers merge into a single layer at 400 m depth or deeper. At night, there is evidence of strong partition- ing of habitat by these animals in space and time, which — along with the high densities of animals — suggests that competition is important in driving the behavior of, and structuring, the community. KEY WORDS: Mesopelagic micronekton · Meso- pelagic boundary community · Diel migration · Hori- zontal migration · Myctophidae · Hawaiian Islands Resale or republication not permitted without written consent of the publisher Midwater fishes, shrimp, and squid around the Hawaiian Islands perform daily onshore–offshore migrations of up to 11 km round-trip each night. Horizontal migration allows the resident micronekton community to remain over the islands’ slopes. The photo shows a nighttime aggregation of mycto- phids in shallow water off Oahu, Hawaii. Photo taken by ROV (NOAA, National Undersea Research Program) OPEN PEN ACCESS CCESS
-
Upload
independent -
Category
Documents
-
view
0 -
download
0
Transcript of Extreme diel horizontal migrations by a tropical nearshore resident micronekton community
MARINE ECOLOGY PROGRESS SERIESMar Ecol Prog Ser
Vol. 319: 1–14, 2006 Published August 18
INTRODUCTION
Land-associated mesopelagic species have beenreported along steep-slope habitats worldwide in-cluding Suruga Bay, Japan (Kubota et al. 1982), theArabian Sea (Gjøsaeter 1984), southwest Africa (Hul-ley 1992), the northeast Atlantic (Mauchline & Gordon1991), Tasmania (May & Blaber 1989), Indonesia (Kawa-guchi & Shimuzu 1978), and several seamounts (Parin& Prut’ko 1985, Boehlert & Genin 1987, Boehlert et al.1992). In Hawaiian nearshore waters, there is anisland-associated community of midwater micronekton,termed the mesopelagic boundary community (Reid etal. 1991). This community, comprised of various spe-
© Inter-Research 2006 · www.int-res.com*Email: [email protected]
FEATURE ARTICLE
Extreme diel horizontal migrations by a tropicalnearshore resident micronekton community
Kelly J. Benoit-Bird1, 2,*, Whitlow W. L. Au2
1College of Oceanic and Atmospheric Sciences, Oregon State University, 104 COAS Administration Building, Corvallis, Oregon 97331, USA
2Hawaii Institute of Marine Biology, University of Hawaii, PO Box 1106, Kailua, Hawaii 96734, USA
ABSTRACT: The mesopelagic boundary communityaround the Hawaiian Islands is a land-associated,sound-scattering layer that undergoes diel migrationswith both a vertical and horizontal component. Tounderstand horizontal migration, it is important tounderstand the full cycle of migration and to determinewhich animals undertake these movements and whichdo not. We developed a video camera system to quan-titatively examine the numerical density, size, and tax-onomic composition of micronekton. We combined thecamera system with vessel-mounted echosounders todocument the full migration range of micronekton anddescribe the changes in composition and densitythroughout their diel migration. Onshore horizontalmovement is limited to waters deeper than 23 m. Off-shore, horizontal migration seems to cease between9 and 11 km from the shoreline. Some animals in themesopelagic boundary community undertake horizon-tal migrations of at least 11 km roundtrip each night.This impressive migration indicates that there must bea substantial benefit to horizontal migration. Themigrating animals split into multiple, distinct layers atnight with differences in micronekton density, compo-sition, and size. Myctophid fishes are the most abun-dant component of the horizontally migrating layers.Large myctophids are the first to migrate into and lastto leave the shallow water areas. During the day, thelayers merge into a single layer at 400 m depth ordeeper. At night, there is evidence of strong partition-ing of habitat by these animals in space and time,which—along with the high densities of animals—suggests that competition is important in driving thebehavior of, and structuring, the community.
KEY WORDS: Mesopelagic micronekton · Meso-pelagic boundary community · Diel migration · Hori-zontal migration · Myctophidae · Hawaiian Islands
Resale or republication not permitted without written consent of the publisher
Midwater fishes, shrimp, and squid around the HawaiianIslands perform daily onshore–offshore migrations of up to11 km round-trip each night. Horizontal migration allows theresident micronekton community to remain over the islands’slopes. The photo shows a nighttime aggregation of mycto-phids in shallow water off Oahu, Hawaii.
Photo taken by ROV (NOAA,National Undersea Research Program)
OPENPEN ACCESSCCESS
Mar Ecol Prog Ser 319: 1–14, 2006
cies of fishes, shrimps, and squids has a compositionunique to the boundary region and is distributed alonga narrow band where the upper slopes of the under-water portion of the islands meet the oceanic, meso-pelagic environment (Reid et al. 1991). Animals inHawaii’s nearshore, micronekton sound-scatteringlayer (SSL) attain remarkably high densities, up to1800 animals m–3 (Benoit-Bird et al. 2001). These ani-mals undergo predictable diel migrations (with both avertical and horizontal component), moving them towithin 1 km of the shoreline each night into watersshallower than typical mesopelagic habitat (Benoit-Bird et al. 2001).
Nocturnal horizontal migration of both plankton andconsumers into shallow waters has been observed inboth freshwater (De Meester 1993, Comeau & Boisclair1998, White 1998) and marine systems (Sasaki 1914,Omori & Ohta 1981, Webb & Wooldridge 1990, Lind-strom 1991, Suh & Yu 1996,). It is hypothesized thatthese horizontal migrations, like the vertical migra-tions that they often accompany, help organisms findfood and avoid predators (White 1998). However, therole of these movements in the life of the migrators andthe ecological consequences of these patterns arepoorly understood, particularly for animals larger thanplankton.
Hawaii’s land-associated mesopelagic micronektonprovides a direct energy subsidy to the pelagic com-munity, where it serves as an important food resourceto billfish (Skillman 1998), tunas (He et al. 1997), andspinner dolphins (Norris & Dohl 1980, Benoit-Bird &Au 2003a). It is also an important component of thedeepwater benthic system, where it is consumed bybottomfish (Haight et al. 1993). We have shown thatpredators of mesopelagic micronekton around theHawaiian Islands are directly and predictably influ-enced by the migration dynamics of this SSL becausethe costs and benefits of foraging change dramaticallythroughout the migration (Benoit-Bird & Au 2003a).Recent studies of the SSL have shown that these ani-mals migrate directly over coral reefs (Benoit-Bird &Au 2004) potentially transforming nutrients availablein these nutrient-limited waters. Mesopelagic micro-nekton consumes most of the zooplankton productionin Hawaii’s coastal waters (Clarke 1973), and thenmoves to deeper, bio-energetically poor waters.Through their diel migration, mesopelagic animalsmove between 2 systems, the deepwater pelagicwaters of their daytime habitat and the shallow,nearshore waters of their nighttime habitat. We sug-gest that the Hawaiian mesopelagic boundary commu-nity provides a fundamental link for energy and nutri-ent transfer between ecosystems, while being the mostimportant consumer of zooplankton and the mostimportant food for higher trophic levels.
Despite the ecological consequences of the meso-pelagic boundary community’s diel movement, only anarrow, nearshore component of the diel horizontalmigration of micronekton around Hawaii has beendescribed. Limited to depths of 156 m (Benoit-Bird &Au 2001), these studies did not observe the full extentof the migration pattern both offshore and inshore.Further, current observations have focused on thebroad pattern of an assemblage, without an under-standing of the movements of constituent taxa. Tounderstand the ultimate significance and benefits ofhorizontal migration, as well as its consequences onthe ecosystem, it is important to understand the fullcycle of migration and to determine which animalsundergo this movement and which do not.
The high mobility of micronektonic animals in themesopelagic boundary community has made it diffi-cult to assess community composition using traditionaltechniques like trawling and strobe photography.Trawling for micronekton could provide substantialinformation on the composition of the mesopelagicboundary community. However, our experience withtrawling for these animals suggests that it is not aviable technique for quantitative sampling of theseanimals: (1) shallow, high-relief areas in nearshorewaters near the landward limit of the animals’ migra-tion present a serious risk of bottom collisions to thegear; (2) the shallow, relatively well-lit waters intowhich these mesopelagic animals migrate each nightpermit a high degree of net avoidance. Any net largeenough to effectively sample mobile micronekton(10 × 10 m opening) cannot be towed from a vesselsmall enough to move into the shallow areas inhab-ited by the boundary community. Previous attemptsto utilize vertically profiling video and still camerasystems that required light yielded limited resultsbecause of strong avoidance of the lights bymicronekton (Benoit-Bird & Au 2003b). Simultaneousacoustic data revealed that when these profiling cam-era systems were utilized without light, avoidancewas not observed, even 2 m from the large frame;however, acoustic data alone could not provide infor-mation on SSL composition.
The goals of this study were to (1) develop a tool toquantitatively examine the taxonomic composition ofmicronekton in Hawaii’s nearshore SSL, (2) documentthe full migration range of micronekton in the SSL, and(3) describe the changes in composition and density ofmesopelagic animals throughout their diel migration.We subsequently addressed questions about the eco-logical role of the nearshore SSL in Hawaiian waters,evaluated the potential costs these animals endureeach day through their migration, and examinedpotential partitioning of habitat among the animals inthis diverse and dense assemblage.
2
Benoit-Bird & Au: Extreme diel horizontal migration of micronekton
MATERIALS AND METHODS
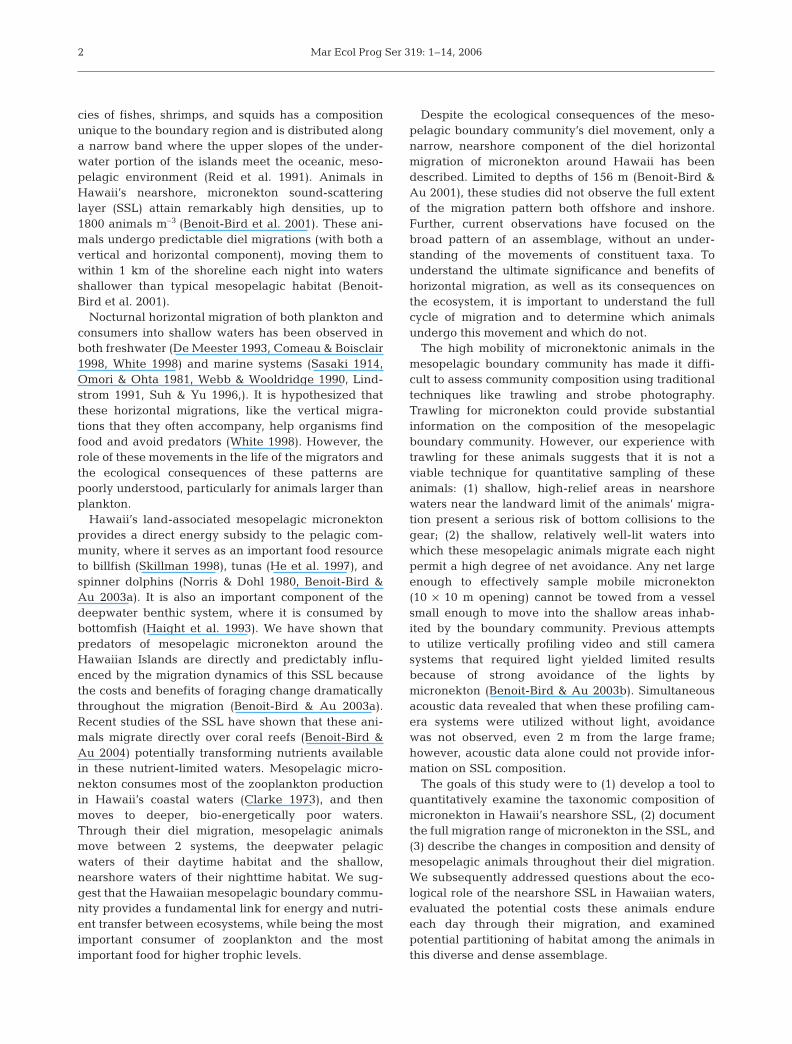
Camera system. To quantitatively identify micronek-tonic animals and estimate their size distribution, weused optical imaging. Optical techniques are con-strained by the quantity and quality of light used forillumination because of strong avoidance of visible lightby micronekton (Benoit-Bird & Au 2003b). Recent at-tempts to image deep-sea nekton have employed redlight beyond the target species’ spectral sensitivity (e.g.Eye-in-the-Sea; Raymond & Widder 2005). To over-come problems with light avoidance by mesopelagicmicronekton, we used a highly sensitive video camerasystem for identification purposes. The camera systemused CCD (charge coupled device) cameras (RemoteOcean Systems Low-Night Navigator with a customlens) with high light sensitivity (3.4 × 10⁻⁴ lux).These cameras use infrared rather than visible lightfor illumination, with a lower likelihood of trigger-ing avoidance (Stone 1998). Two low-light cameraswere used in a stereo fashion to allow animals iden-tified in both cameras to be precisely located withinthe 575 l of the cameras’ overlapping fields of view,permitting quantitative density estimates of meso-pelagic animals to be made and measurements oftheir size to be taken (Fig. 1). Measurements of sizetook into account the apparent length of the animalin both cameras, which allowed their actual lengthto be determined using basic trigonometric relation-ships, eliminating the problem of apparent fore-shortening from one camera.
The cameras were mounted to an aluminumframe 90° relative to each other with the center ofthe lenses 1 m apart. An infrared (940 nm) LEDarray (custom built) in a transparent housing wasmounted directly below each camera. Each arrayconsisted of 140 LEDs, emitting approximately 5500lumens at a 60° radiation angle. Both data andpower for the cameras and lights were transmittedby a Kevlar-jacketed multi-conductor cable (manu-factured to custom specifications by Falmat) thatwas also used to lower the system. Video from the 2cameras was written to digital video discs (DVDs)using stand-alone recorders (Panasonic DMR E-30).This provided the highest resolution recordings andpermitted the files to be opened directly on a com-puter, eliminating any loss of resolution. A pressuresensor on the camera system sent real-time depthinformation to the surface via the camera cable. Inaddition, pressure data were converted to elec-tronic signals using a voltage to frequency con-verter, and recorded to an audio channel of eachDVD recorder.
The camera system was calibrated in a seawatertank utilizing small, linear targets to measure the
edges of the volume of view, confirming the samplingvolume for density estimates. In addition, the width ofthe field of view of each camera at each point was mea-sured at 5 cm intervals using a standard grid. Thesemeasurements showed that over the size range of 2 to12 cm, length measurements for an imaged target thatis not flexed are within ±5% of actual length, regard-less of relative orientation.
Echosounder surveys. To fully observe the distribu-tion of SSLs over time, we conducted surveys using a2-frequency, split-beam echosounder system (SimradEK60s). The 70 kHz echosounder used a 128 μs pulse,while the 200 kHz echosounder used a 64 μs pulse.Both systems had a 7° conical split beam and collected4 pulses s–1. The system was calibrated using an indi-
3
a a
b b
X X
ZY
Camera 1 Camera 2
575 l
0.5 m
0.9 m
1 m
60°
Fig. 1. Micronekton stereo camera system. The system uses lightsensitive cameras to allow identification of animals, measurementof their size, and quantitative assessment of their density. Views of2 ‘fish’ captured in the volume where the views of the 2 camerascross. A simple coordinate system has been drawn on the views toshow an example of the process of data analysis. In the view fromcamera 1, 2 fish of apparently the same length can be seen at thesame y-position. In the view from camera 2, the 2 fish are at differ-ent z coordinates with fish (a) being much further from the camerathan fish (b). Fish (b) is thus much smaller than fish (a). By measur-ing the coordinates of each fish, its apparent length, and the widthof each camera’s field of view at those coordinates, the length of the
fish can be estimated
Mar Ecol Prog Ser 319: 1–14, 2006
rect procedure incorporating a 38.1 mm diametertungsten carbide reference sphere, as prescribed byFoote et al. (1987).
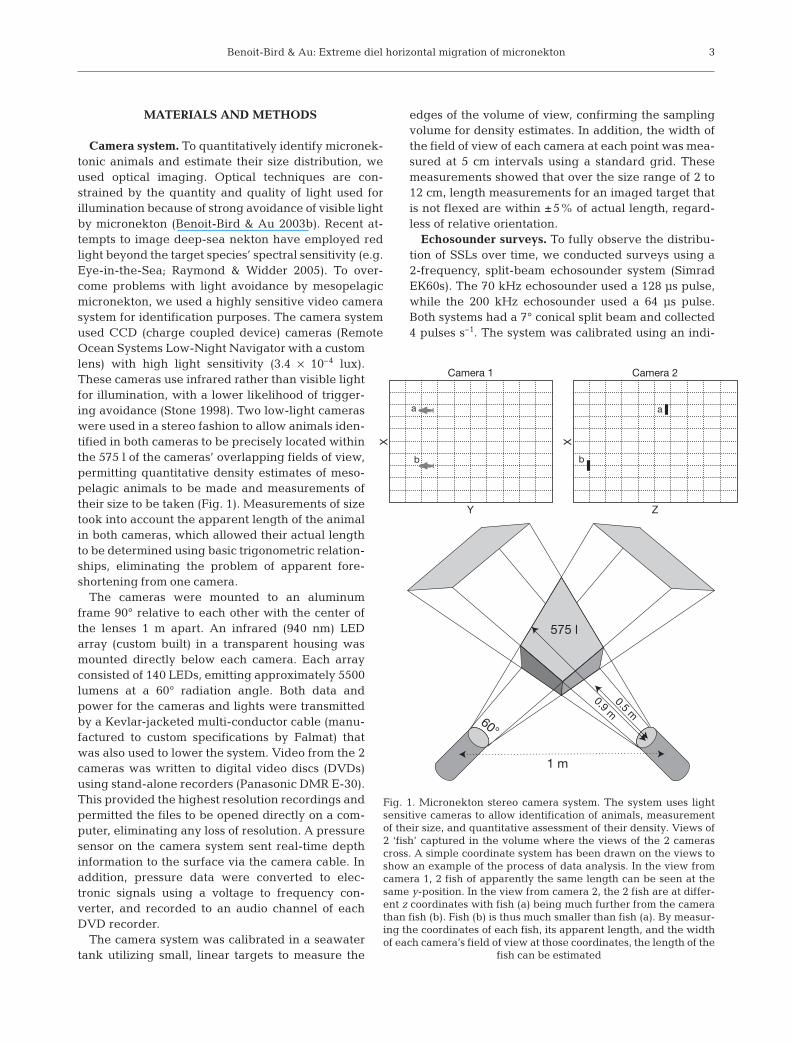
Sampling design. Extensive surveys of the micro-nekton SSLs were conducted off the leeward coast ofOahu, Hawaii (21° 32.21’ N, 158° 14.38’ W; 21° 28.78’ N,158° 14.55’ W; 21° 32.40’ N, 158° 20.13’ W; 21° 28.94’ N,158° 20.24’ W) over 12 d (each 13 h long) between May12 and June 8, and August 20 and 25, 2004.Echosounder surveys were conducted to determine thedistribution as a function of time and space of (1) theSSL (the boundary community as a whole), (2) distinctindividual layers separated in space from other scatter-ers, and (3) strata, or distinct horizontal bands withinindividual layers. Transects ran perpendicular to thedirection of the micronekton migration, to obtain thegreatest statistical power to characterize this move-ment. Surveys covered 8 transects (5 km in length)along the island’s slope; the first transect was located1 km from the shoreline and subsequent transectswere located 2, 3, 4, 5, 7, 9, and 11 km from the shore-line (Fig. 2). The order of transect surveying was ran-domized in a complete block design with 5 transects,each with 2 vertical profiles, conducted each samplingday. Transects were surveyed at a speed of 5 knots(9.3 km h–1) for 1 h, every 3 h to cover all 24 h of theday. The orientation and separation of transects per-mitted the observation of the horizontal components ofthe boundary community’s migration at a large spatialscale. In the hours between surveys of these transects,additional surveys were conducted perpendicular toshore to help integrate data from the parallel transects.
During the alongshore transect surveys, the camerasystem was used to vertically profile the water columnto obtain information on taxonomic composition, ani-mal density, and size. Vertical profiles from the surfaceto the bottom of the layer—or 600 m, whichever wasless—were conducted at 2 locations along each tran-sect (Fig. 2). The location of the first profile was ran-domly selected while the second was conducted2.5 km from the first. The camera was dropped at a rateof 15 to 20 m min–1 until it was 5 m above the top edgeof the SSL identified acoustically; then, it was allowedto descend through the layer at 2 to 4 m min–1, pulledup to 5 m above the layer, and allowed to descendagain for a total of 3 profiles on each drop. Echosound-ing was conducted during profiling to observe thecamera frame and the SSL surrounding it.
Surveys were also conducted to define the landwardedge of the SSL. Between 23:00 and 01:00 h on 3 d dur-ing the sampling period, a series of ‘sawtooth’ transectswere surveyed from 1.5 km from shore shoreward untilthe water depth reached 6 m. Camera profiles wereconducted along each offshore segment of the transectat the nearest to shore point where a SSL was detected.
Data analysis. Camera system: Video data for identi-fication of shrimp and fish was analyzed by extractingstill views every 0.25 m from each of the 2 cameras.The radius of the overlapping field of view was a max-imum of 0.5 m, limiting possible double counting ofanimals. Animals seen in still views from both cameraswere identified to the lowest taxonomic level possible,providing taxonomically-specific density measures inthe quantifiable field of view. The coordinates of theidentified animal and the apparent length of the indi-vidual were used to estimate its size. Measurements ofsize take into account the apparent length of the ani-mal in both cameras which allows their actual length tobe determined using basic trigonometric relationships,eliminating the problem of apparent foreshortening
4
1 km
2 km
3 km
4 km
5 km
9 km
7 km
11 km
Shore
Camera profile
Alongshore transect
Perpendicular surveys
Nearshore camera profile
Nearshore acoustic survey
Fig. 2. Sampling design for the acoustic transects and verticalprofiles off leeward Oahu, Hawaii. Sampling was conductedalong 8 alongshore transects, each 5 km in length. Along eachtransect, 2 vertical profiles from the surface to the bottom ofthe layer, or to 600 m depth were carried out with the videocamera system. Each planned transect was repeated at 12:00,15:00, 18:00, 21:00, 00:00, 03:00, 06:00, and 09:00 h local time.In the hours between these transects, surveys were conductedperpendicular to the shore to help integrate data from the par-allel transects. On 3 nights, sawtooth transects were surveyedacoustically to observe the nearshore edge of the sound-scat-tering layer (SSL). A sample from 1 night’s survey is shown
Benoit-Bird & Au: Extreme diel horizontal migration of micronekton
from one camera. Analysis of video data for squidabundance could not be made from extracted imagesdue to the rapid swimming speeds of these animalscausing blurring in still images. We observed 15 min ofmoving video surrounding each extracted still frame;squid could easily be seen in these moving images,and those identified simultaneously in both cameraswere used to estimate squid density. Custom image-analysis software automatically aligned the 2 videosbased on their time stamps. The software flagged allimages that it calculated to be at least 1.5 cm in anyone dimension, and the extreme edges of the longestdimension were marked. Flagged images were thenvisually analyzed to identify the target and determineif marked animal edges were accurate. The x- or verti-cal position (see Fig. 1) of targets in both images werecompared to determine if an individual was observedby both cameras. Simple button selection of the iden-tity of each target in the software automatically loggedidentity and calculated animal length to a spreadsheet.Data was averaged in 1 m depth bins from each of the3 replicate casts to provide adequate sample sizes,given the small sampling volume.
Echosounder surveys: These were used to charac-terize the vertical extent, density, and horizontal dis-tribution of SSLs (see Benoit-Bird & Au 2003c, Benoit-Bird et al. 2001). Echo energy integration approacheswere utilized to estimate numerical density ofmicronekton for comparison with direct measurementsof density made with the camera system. For thesemeasurements, scattering from large, individualtargets identified with the split-beam echosounder,likely predators on the SSL, was removed.
In situ measurements of target strengths of individu-ally ensonified micronekton were made using the split-beam echosounder whenever target density and separa-tion permitted. The number of targets per acousticreverberation volume for each frequency was deter-mined for each pulse and any values that excluded 1were not included in the analysis (Sawada et al. 1993).This means that at a depth of 10 m, numerical densitiescould not exceed 3 animals m–3 for 70 kHz measure-ments and 6 m–3 for 200 kHz measurements. At 100 m,the maximum densities could not exceed 0.13 and0.26 animals m–3 for 70 and 200 kHz measurements,respectively. At 500 m where only the 70 kHz systemreturned results, single targets could only be measuredwhen densities were below 0.0052 animals m–3. Thesedensity values were within the ranges observed inthe layers, though often far from the mean observeddensities, meaning that the sample sizes are low. Thesingle target measurements were compared with theexpected target strengths for the animals identified bythe camera system. Numerical density of micronektonicanimals was calculated from volume scattering using an
echo energy integration technique which divides thetotal backscattered energy by the average backscatterenergy from an individual animal to estimate thenumber of animals per unit volume sampled (MacLen-nan & Simmonds 1992). The in situ individual targetstrengths for each transect were utilized in this analysis.
Avoidance estimation: The taxonomic identification,size, and numeric density information (n m–3) obtainedfrom the camera were combined with measurements ofbackscattering from individual micronekton (Benoit-Bird & Au 2001) to predict the volume scattering (Sv)that would be expected by an echosounder at thatlocation:
(1)
where TSi is the mean target strength of the i-th classof organisms (e.g. 6 to 7 cm long myctophids) in a givenvolume or in a unit volume, where i = 1, 2 … N. Targetstrength was estimated from equations derived fromexperimental studies: TS = 20 log L –58.8 for mycto-phids, TS = 18.8 log L – 61.7 for squid, and TS = 19.4 logL – 74.1 for shrimp at 200 kHz, where animal length (L)is in cm (Benoit-Bird & Au 2001). The TS at 70 kHz wasestimated by applying the differences in individualtarget strength measurements from the 2 echosoundersmade simultaneously on the same individually identi-fied targets. These differences in paired measurementswere comparable to the differences in the slope be-tween the 2 frequencies for mean myctophid lengthand mean individual target strength, with the targetstrength at 70 kHz being about 2.25 dB higher than thetarget strength at 200 kHz (see Fig. 8). The identity ofanimals, their length (L), and their density (n m–3) wereobtained from the video record. The predictions werecompared with scattering measured with split-beamechosounders at 70 and 200 kHz. The scattering pre-dictions assisted in the interpretation of the echo-sounder surveys, while the surveys placed the small-scale information obtained with the camera systeminto a larger context. Comparisons of these predictionswith measured scattering allowed us to evaluatepotential avoidance behavior. If avoidance was occur-ring, we expected that both the scattering predictionsand measures of volume scattering from the echo-sounder would be consistently lower in the area sam-pled by the camera system than the volume scatteringin surrounding areas.
Vertical stratification: To look at vertical stratifica-tion in the volume scattering, acoustically estimateddensity, individual target strengths, proportion of myc-tophids, and mean size of myctophids in the scattering-layer strength, a single-factor ANOVA with 1 m depthbin as the factor was used. For these analyses, all im-ages of animals in the cameras were used to increasethe potential sample size. After a significant effect was
Snmv i
i
i
N
log= −( )=
∑ TS 10 10 31
5
Mar Ecol Prog Ser 319: 1–14, 2006
found, Tukey’s multiple-range statistic was used to de-termine which depth bins were homogeneous withneighboring depth bins (p > 0.20) and which were sig-nificantly different (p < 0.05). Adjacent 1 m bins thatwere not significantly different from each other, butwere significantly different from depth bins surround-ing the homogenous region, were considered to be astratum with the SSL, as in Benoit-Bird & Au (2003a).
RESULTS
Camera system
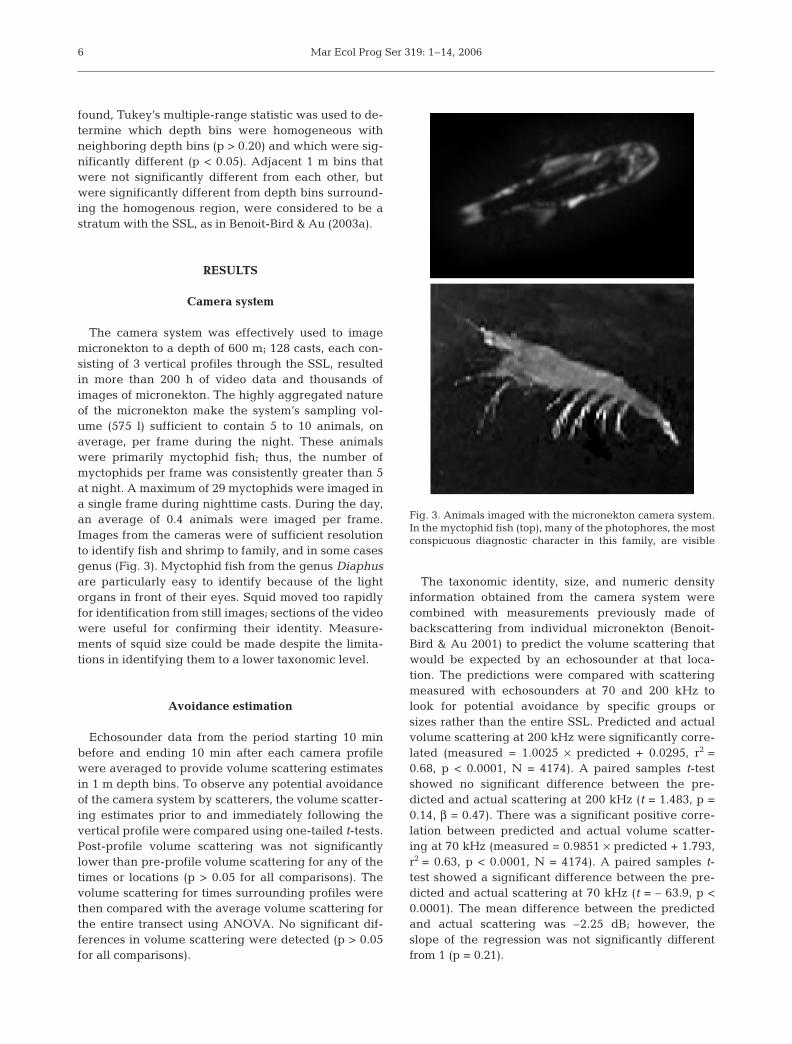
The camera system was effectively used to imagemicronekton to a depth of 600 m; 128 casts, each con-sisting of 3 vertical profiles through the SSL, resultedin more than 200 h of video data and thousands ofimages of micronekton. The highly aggregated natureof the micronekton make the system’s sampling vol-ume (575 l) sufficient to contain 5 to 10 animals, onaverage, per frame during the night. These animalswere primarily myctophid fish; thus, the number ofmyctophids per frame was consistently greater than 5at night. A maximum of 29 myctophids were imaged ina single frame during nighttime casts. During the day,an average of 0.4 animals were imaged per frame.Images from the cameras were of sufficient resolutionto identify fish and shrimp to family, and in some casesgenus (Fig. 3). Myctophid fish from the genus Diaphusare particularly easy to identify because of the lightorgans in front of their eyes. Squid moved too rapidlyfor identification from still images; sections of the videowere useful for confirming their identity. Measure-ments of squid size could be made despite the limita-tions in identifying them to a lower taxonomic level.
Avoidance estimation
Echosounder data from the period starting 10 minbefore and ending 10 min after each camera profilewere averaged to provide volume scattering estimatesin 1 m depth bins. To observe any potential avoidanceof the camera system by scatterers, the volume scatter-ing estimates prior to and immediately following thevertical profile were compared using one-tailed t-tests.Post-profile volume scattering was not significantlylower than pre-profile volume scattering for any of thetimes or locations (p > 0.05 for all comparisons). Thevolume scattering for times surrounding profiles werethen compared with the average volume scattering forthe entire transect using ANOVA. No significant dif-ferences in volume scattering were detected (p > 0.05for all comparisons).
The taxonomic identity, size, and numeric densityinformation obtained from the camera system werecombined with measurements previously made ofbackscattering from individual micronekton (Benoit-Bird & Au 2001) to predict the volume scattering thatwould be expected by an echosounder at that loca-tion. The predictions were compared with scatteringmeasured with echosounders at 70 and 200 kHz tolook for potential avoidance by specific groups orsizes rather than the entire SSL. Predicted and actualvolume scattering at 200 kHz were significantly corre-lated (measured = 1.0025 × predicted + 0.0295, r2 =0.68, p < 0.0001, N = 4174). A paired samples t-testshowed no significant difference between the pre-dicted and actual scattering at 200 kHz (t = 1.483, p =0.14, β = 0.47). There was a significant positive corre-lation between predicted and actual volume scatter-ing at 70 kHz (measured = 0.9851 × predicted + 1.793,r2 = 0.63, p < 0.0001, N = 4174). A paired samples t-test showed a significant difference between the pre-dicted and actual scattering at 70 kHz (t = – 63.9, p <0.0001). The mean difference between the predictedand actual scattering was –2.25 dB; however, theslope of the regression was not significantly differentfrom 1 (p = 0.21).
6
Fig. 3. Animals imaged with the micronekton camera system.In the myctophid fish (top), many of the photophores, the mostconspicuous diagnostic character in this family, are visible
Benoit-Bird & Au: Extreme diel horizontal migration of micronekton
Distribution of the sound-scattering layer
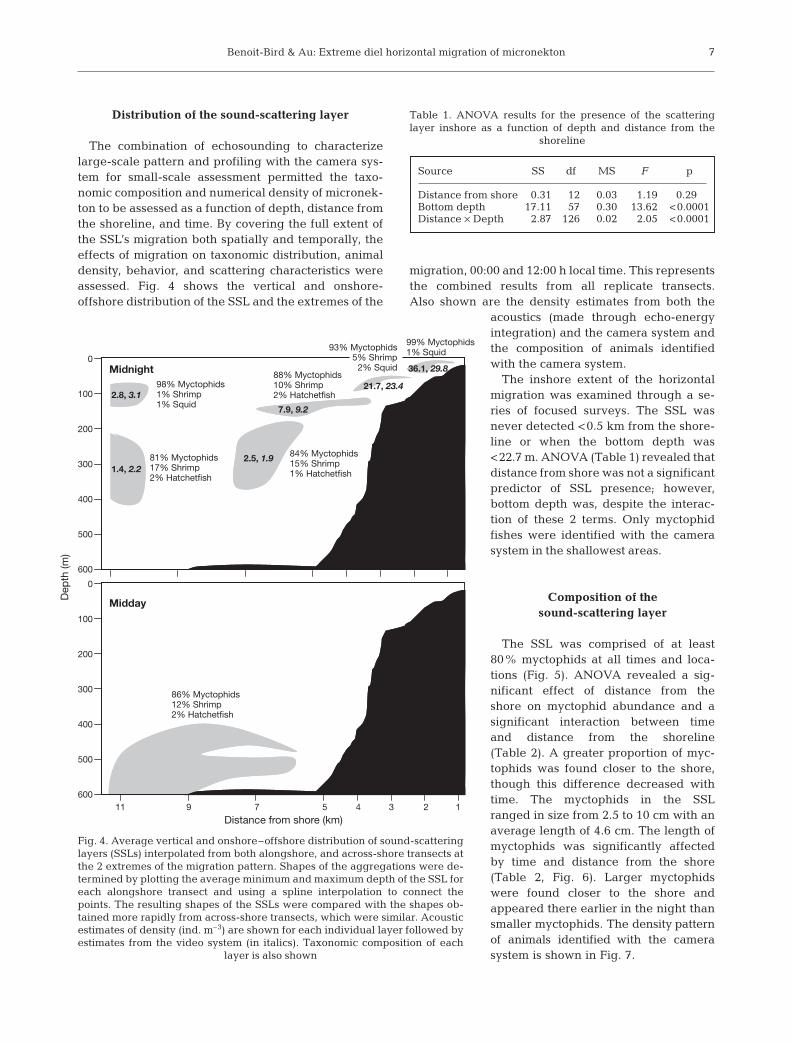
The combination of echosounding to characterizelarge-scale pattern and profiling with the camera sys-tem for small-scale assessment permitted the taxo-nomic composition and numerical density of micronek-ton to be assessed as a function of depth, distance fromthe shoreline, and time. By covering the full extent ofthe SSL’s migration both spatially and temporally, theeffects of migration on taxonomic distribution, animaldensity, behavior, and scattering characteristics wereassessed. Fig. 4 shows the vertical and onshore-offshore distribution of the SSL and the extremes of the
migration, 00:00 and 12:00 h local time. This representsthe combined results from all replicate transects.Also shown are the density estimates from both the
acoustics (made through echo-energyintegration) and the camera system andthe composition of animals identifiedwith the camera system.
The inshore extent of the horizontalmigration was examined through a se-ries of focused surveys. The SSL wasnever detected <0.5 km from the shore-line or when the bottom depth was<22.7 m. ANOVA (Table 1) revealed thatdistance from shore was not a significantpredictor of SSL presence; however,bottom depth was, despite the interac-tion of these 2 terms. Only myctophidfishes were identified with the camerasystem in the shallowest areas.
Composition of the sound-scattering layer
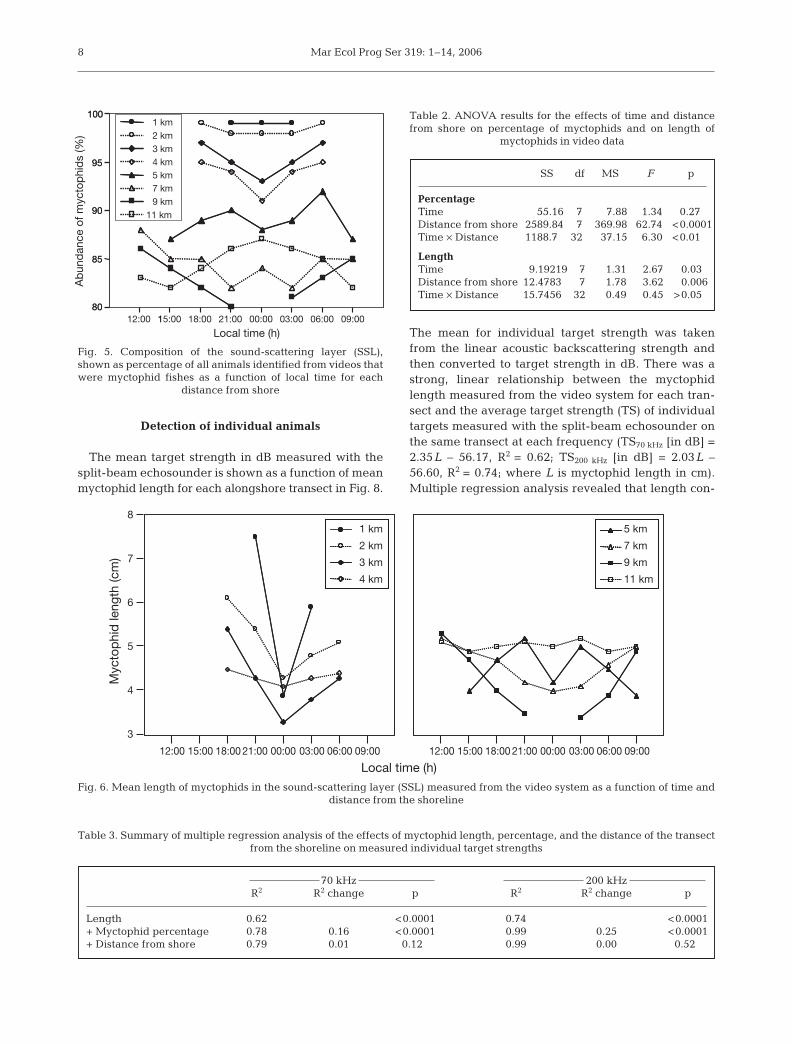
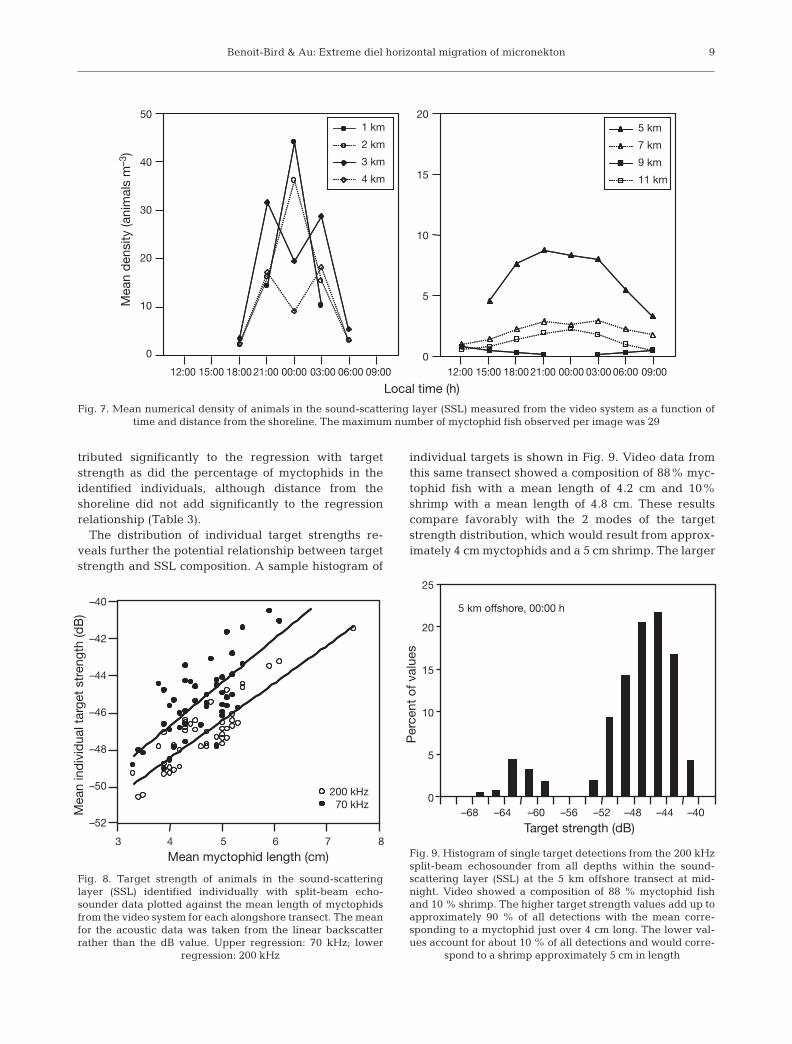
The SSL was comprised of at least80% myctophids at all times and loca-tions (Fig. 5). ANOVA revealed a sig-nificant effect of distance from theshore on myctophid abundance and asignificant interaction between timeand distance from the shoreline(Table 2). A greater proportion of myc-tophids was found closer to the shore,though this difference decreased withtime. The myctophids in the SSLranged in size from 2.5 to 10 cm with anaverage length of 4.6 cm. The length ofmyctophids was significantly affectedby time and distance from the shore(Table 2, Fig. 6). Larger myctophidswere found closer to the shore andappeared there earlier in the night thansmaller myctophids. The density patternof animals identified with the camerasystem is shown in Fig. 7.
7
0
100
200
300
400
500
600
98% Myctophids1% Shrimp1% Squid
2.8, 3.1
0.9, 0.7
36.1, 29.8
1.4, 2.2
99% Myctophids1% Squid
81% Myctophids17% Shrimp2% Hatchetfish
86% Myctophids12% Shrimp2% Hatchetfish
84% Myctophids15% Shrimp1% Hatchetfish
88% Myctophids10% Shrimp2% Hatchetfish
0
100
200
300
400
500
60011 9 7 5 4 3 2 1
93% Myctophids5% Shrimp
2% Squid
21.7, 23.4
2.5, 1.9
7.9, 9.2
Dep
th (m
)
Distance from shore (km)
Midday
Midnight
Fig. 4. Average vertical and onshore–offshore distribution of sound-scatteringlayers (SSLs) interpolated from both alongshore, and across-shore transects atthe 2 extremes of the migration pattern. Shapes of the aggregations were de-termined by plotting the average minimum and maximum depth of the SSL foreach alongshore transect and using a spline interpolation to connect thepoints. The resulting shapes of the SSLs were compared with the shapes ob-tained more rapidly from across-shore transects, which were similar. Acousticestimates of density (ind. m–3) are shown for each individual layer followed byestimates from the video system (in italics). Taxonomic composition of each
layer is also shown
Table 1. ANOVA results for the presence of the scatteringlayer inshore as a function of depth and distance from the
shoreline
Source SS df MS F p
Distance from shore 0.31 12 0.03 1.19 0.290Bottom depth 17.11 57 0.30 13.62 <0.0001Distance × Depth 2.87 126 0.02 2.05 <0.0001
Mar Ecol Prog Ser 319: 1–14, 2006
Detection of individual animals
The mean target strength in dB measured with thesplit-beam echosounder is shown as a function of meanmyctophid length for each alongshore transect in Fig. 8.
The mean for individual target strength was takenfrom the linear acoustic backscattering strength andthen converted to target strength in dB. There was astrong, linear relationship between the myctophidlength measured from the video system for each tran-sect and the average target strength (TS) of individualtargets measured with the split-beam echosounder onthe same transect at each frequency (TS70 kHz [in dB] =2.35L – 56.17, R2 = 0.62; TS200 kHz [in dB] = 2.03L –56.60, R2 = 0.74; where L is myctophid length in cm).Multiple regression analysis revealed that length con-
8
80
85
90
95
100
12:00 1 00:00 03:00 09:0006:0018:00 21:0080
85
90
95
100
15:00
Ab
und
ance
of m
ycto
phi
ds
(%)
Local time (h)
1 km 2 km 3 km 4 km 5 km 7 km 9 km
11 km
Fig. 5. Composition of the sound-scattering layer (SSL),shown as percentage of all animals identified from videos thatwere myctophid fishes as a function of local time for each
distance from shore
Table 2. ANOVA results for the effects of time and distance from shore on percentage of myctophids and on length of
myctophids in video data
SS df MS F p
PercentageTime 55.16 7 7.88 1.34 0.27Distance from shore 2589.84 7 369.98 62.74 <0.0001Time × Distance 1188.7 32 37.15 6.30 <0.01
LengthTime 9.19219 7 1.31 2.67 0.030Distance from shore 12.47830 7 1.78 3.62 0.006Time × Distance 15.74560 32 0.49 0.45 >0.05
12:00
1 km
2 km
3 km
4 km
5 km
7 km
9 km
11 km
Local time (h)15:00 18:00 21:00 00:00 03:00 06:00 09:00 12:00 15:00 18:00 21:00 00:00 03:00 06:00 09:00
Myc
top
hid
leng
th (c
m)
8
7
6
5
4
3
Fig. 6. Mean length of myctophids in the sound-scattering layer (SSL) measured from the video system as a function of time and distance from the shoreline
Table 3. Summary of multiple regression analysis of the effects of myctophid length, percentage, and the distance of the transect from the shoreline on measured individual target strengths
70 kHz 200 kHzR2 R2 change p R2 R2 change p
Length 0.62 <0.0001 0.74 <0.0001+ Myctophid percentage 0.78 0.16 <0.0001 0.99 0.25 <0.0001+ Distance from shore 0.79 0.01 0.120 0.99 0.00 0.520
Benoit-Bird & Au: Extreme diel horizontal migration of micronekton
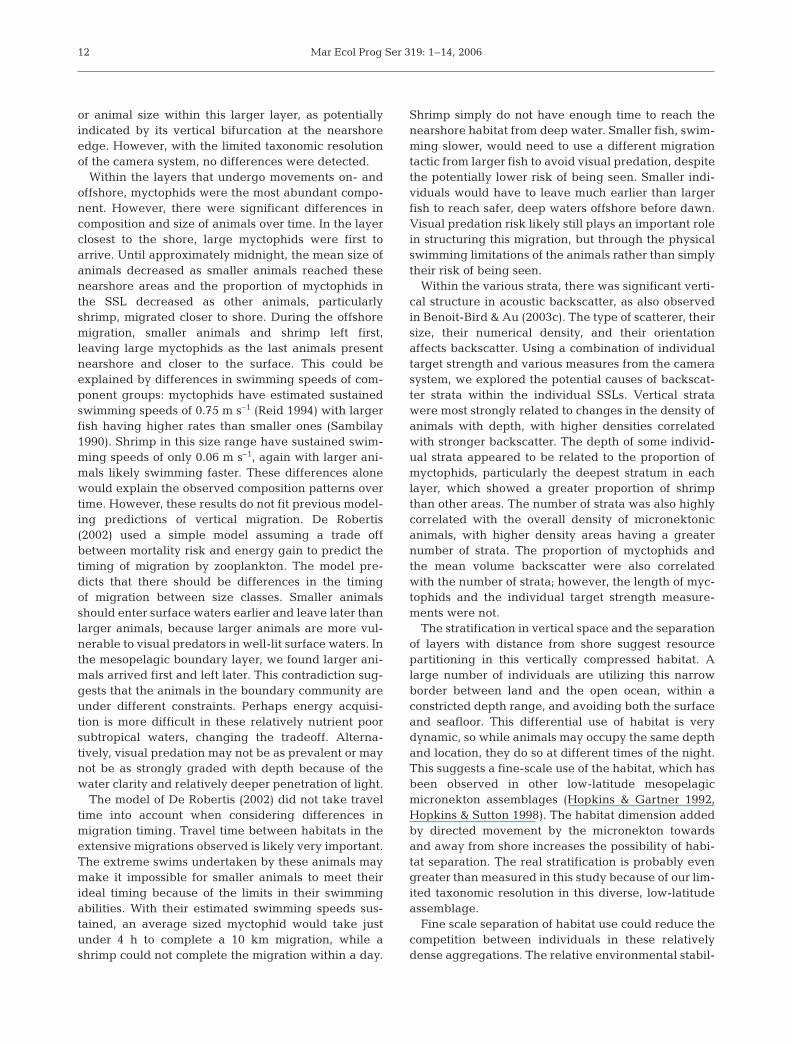
tributed significantly to the regression with targetstrength as did the percentage of myctophids in theidentified individuals, although distance from theshoreline did not add significantly to the regressionrelationship (Table 3).
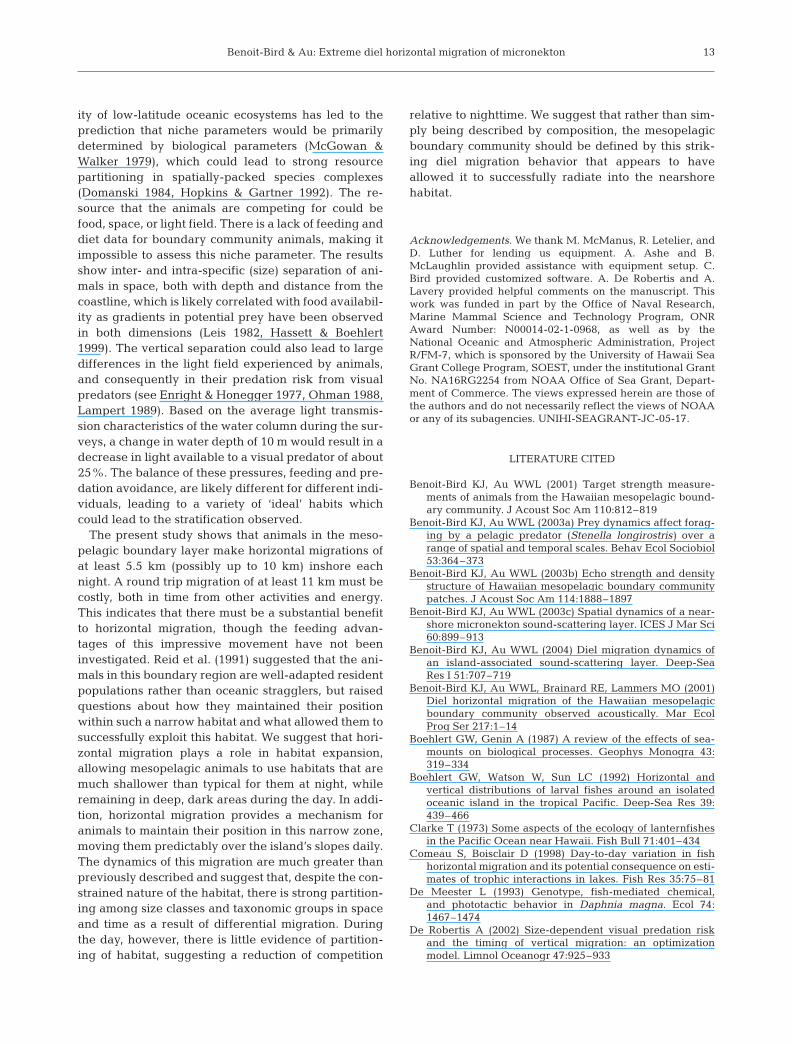
The distribution of individual target strengths re-veals further the potential relationship between targetstrength and SSL composition. A sample histogram of
individual targets is shown in Fig. 9. Video data fromthis same transect showed a composition of 88% myc-tophid fish with a mean length of 4.2 cm and 10%shrimp with a mean length of 4.8 cm. These resultscompare favorably with the 2 modes of the targetstrength distribution, which would result from approx-imately 4 cm myctophids and a 5 cm shrimp. The larger
9
12:00
1 km
2 km
3 km
4 km
5 km
7 km
9 km
11 km
Local time (h)15:00 18:00 21:00 00:00 03:00 06:00 09:00 12:00 15:00 18:00 21:00 00:00 03:00 06:00 09:00
Mea
n d
ensi
ty (a
nim
als
m–3
)50
40
30
20
10
0
20
15
10
5
0
Fig. 7. Mean numerical density of animals in the sound-scattering layer (SSL) measured from the video system as a function of time and distance from the shoreline. The maximum number of myctophid fish observed per image was 29
Mea
n in
div
idua
l tar
get
stre
ngth
(dB
)
3 4 5 6 7
200 kHz70 kHz
8
Mean myctophid length (cm)
–40
–42
–44
–46
–48
–50
–52
Fig. 8. Target strength of animals in the sound-scatteringlayer (SSL) identified individually with split-beam echo-sounder data plotted against the mean length of myctophidsfrom the video system for each alongshore transect. The meanfor the acoustic data was taken from the linear backscatterrather than the dB value. Upper regression: 70 kHz; lower
regression: 200 kHz
Per
cent
of v
alue
s
25
20
15
10
5
0–68
5 km offshore, 00:00 h
–64 –60 –56 –52 –48 –44 –40
Target strength (dB)
Fig. 9. Histogram of single target detections from the 200 kHzsplit-beam echosounder from all depths within the sound-scattering layer (SSL) at the 5 km offshore transect at mid-night. Video showed a composition of 88 % myctophid fishand 10 % shrimp. The higher target strength values add up toapproximately 90 % of all detections with the mean corre-sponding to a myctophid just over 4 cm long. The lower val-ues account for about 10 % of all detections and would corre-
spond to a shrimp approximately 5 cm in length

Mar Ecol Prog Ser 319: 1–14, 2006
values accounted for approximately 90% of all values,while the lower values accounted for about 10% of thevalues with no overlap in the middle.
Vertical stratification
Strata within the SSL were identified using the vol-ume scattering data at 70 kHz. There was always atleast 1 distinct stratum within the SSL and as many as18 strata (1 km from shore, 00:00 h local time). Thestrata identified from the volume scattering data werecompared with the vertical structure observed in indi-vidual target strength measurements as well as a vari-ety of results from the camera system including numer-ical density, proportion myctophids, and myctophidlength. An example is shown in Fig. 10. To quantifythese relationships, the number of significant verticalstrata was compared with each of the explanatory vari-ables (Table 4). Because of the strong correlationbetween animal density and number of significantstrata, the temporal and spatial patterns of both aresimilar (see Fig. 6).
DISCUSSION
New methodology for quantifying micronekton
Micronekton in general and mesopelagic micronek-ton in particular are poorly understood. Lack of data islargely due to limitations in the suite of tools availablefor sampling these mobile organisms. Our vessel sizeand the animals’ habitat precluded using large mid-water trawls with discrete sampling capabilities. Thevideo camera system developed in the present studyis a novel application of existing technology, and theresults show that it can provide insights into meso-pelagic micronekton. We found here and in previouswork (Benoit-Bird & Au 2004) that horizontal migrationinto shallow water habitats compresses the verticalscales of the micronekton distribution. This makes itcritical to have fine vertical sampling resolution, whichthe combination of vessel-mounted acoustics and theprofiling camera system provided.
The camera system is an effective means of ground-truthing the acoustic data, providing information on ba-sic animal taxonomic identity, numerical density, andsize. There were no significant effects of vertical profil-ing with the camera system on volume backscatter,suggesting that the camera system does not causelarge-scale avoidance by the micronekton. Further,scattering predictions made from the camera datamatched very well with the measured backscatter fromthe echosounders. This supports the conclusion that theanimals in the field of view of the cameras are the sameas those detected by the echosounders, suggesting noavoidance within 1 m of the camera frame. Finally, us-ing the information from the cameras to provide animalcomposition and size for echo-energy integration withthe acoustics provided density estimates comparable
10
Dep
th (m
)
–55 –50 –45 –40 –35 –30 0 0 2 4 6 8 0.6 0.7 0.8 0.910 10 1.020 30 40 50
Volume backscatter (dB) Density (animals m–3) Myctophid length (cm) Proportion myctophids
110
120
130
140
150
160
170
Fig. 10. Sound-scattering layer (SSL) at 00:00 local time, 5 km leeward of Oahu. The 9 strata statistically identified from the70 kHz volume backscatter data are shown in grey. Potential factors that could contribute to the acoustic strata—camera system
measurements of density, myctophid length, and proportion of myctophids—are also shown as a function of depth
Table 4. Summary of regression relationships between pos-sible explanatory variables and the number of significantvertical strata within the sound-scattering layer. Sv: volume
scattering
R2 p Slope
Numerical density 0.89 <0.001 +Proportion myctophids 0.43 <0.010 +Myctophid length 0.03 ns70 kHz target strength 0.06 nsMean Sv 0.62 <0.005 +

Benoit-Bird & Au: Extreme diel horizontal migration of micronekton
with those made from the cameras alone. This furthersupports the utility of the video camera system forground-truthing the echosounder data.
The combination of acoustic data and the video sys-tem provides other important validation. The split-beam echosounders are capable of measuring the tar-get strengths of individual animals when they are nottoo closely spaced. The target strength of an animal isaffected by its identity, size, and orientation (Mac-Lennan & Simmonds 1992), making it difficult to inter-pret these measurements without some knowledge ofthe target. Comparing the target strengths measuredusing the echosounders with the lengths measuredfrom the camera system of the most abundant animals,myctophid fishes, showed a strong correlation. Furtherexamination of the distribution of target strengthsrevealed that it was relatively easy to distinguishmyctophids from other micronektonic scatterers. Thedistributions matched the modes of the compositionobserved with the cameras, showing a high targetstrength mode and, when a significant proportion ofshrimp were present, a low target strength mode. Thetotal proportion of the data accounted for by eachnode approximates the proportion of animal groupsobserved by the camera profiles. Further, the sizes thatwould be estimated from the target strengths based onthe relationships measured by Benoit-Bird & Au (2001)are extremely close to those measured directly fromthe camera system. This suggests that for this commu-nity, the distribution of individual target strength val-ues can be used to determine the composition of thelayer, particularly the percentage of myctophids. Thelength distribution of the animals can also be estimatedfrom the individual target strengths.
Micronekton migration pattern
To understand horizontal migration behavior, it isimportant to understand the full cycle of migration,and which animals undertake these movements andwhich do not. Through focused nearshore surveys, wefound midwater micronekton in extremely shallowwaters as close as 0.5 km from the shore around mid-night. It appears that the inward migration is limited bybottom depth rather than distance from the shoreline,though previous results have shown distance from theshore is more important in driving the distribution fur-ther from the shore (Benoit-Bird et al. 2001). The SSLwas present only when the water was deeper thanabout 23 m, regardless of how far away from shore thispoint occurred. The only animals detected in shallowareas were myctophid fishes.
Observations of the SSL reveal that in the middle ofthe night the micronektonic scatterers are actually dis-
tributed in multiple, distinct layers. There are 4 layersthat move inshore in addition to upwards. The shallow-est layer is found closest to the shore and each subse-quent layer is deeper, and further from the shore. Thedensity of each layer decreases with distance from theshoreline, leading us to predict that a gradient inresources should exist, decreasing with increasing dis-tance from the shoreline. Further offshore, there are 2vertically distinct layers that are separated by nearly100 m in the water column, but do not appear to movetowards or away from the shore. Consequently, there isa large gap in the presence of SSLs at around 9 kmfrom the shoreline at midnight. It appears that horizon-tal migration ceases about 9 km from the shore in thisarea. The distinct layers show differences in their com-position as well as in the size of animals comprisingthem. The deeper layers have a greater proportion ofmesopelagic shrimp than the shallower layers whichcontain more myctophids. In addition, the size of themyctophids in these shallower layers is consistentlylarger than those in further offshore, deeper layers.
During the day, there was only 1 SSL in the studyarea, extending from 6 km offshore to just past 11 kmfrom the shore. The SSL’s upper limit was about 400 mand it did not extend into waters shallower than 570 m.Reid et al. (1991) determined the daytime upper limitof the mesopelagic boundary community with nets tobe located between 350 and 400 m in areas with bot-tom depths of 400 to 700 m, consistent with the resultsof this study. The SSL came to within a few meters ofthe bottom near the edge of the offshore slope, approx-imately 9 km from the shoreline, similar to observa-tions from a submersible (Reid 1994).
Rough calculations of the number of animals en-countered on a transect running offshore from theinshore edge of the SSL to 11 km offshore at midnightand midday compare favorably. Approximately 1.7million micronektonic animals would be observed in a1 m wide swath at midnight, while we estimate 1.5 mil-lion micronektonic animals would be detected in thissame area at midday. Based on the composition ofeach layer determined from the camera system, about1.5 million myctophids would be encountered at mid-night, while about 1.3 million myctophids would bepresent at midday. If we partition these estimates into2 regions—areas within 9 km of the shore and areas 9to 11 km from the shore—the nighttime and daytimeestimates within each partition remain approximatelyequal. This suggests that animals outside approxi-mately 9 km from the shoreline in this area do notmigrate towards the shore. These rough approxima-tions along with the observations of SSL distributionand movement also suggest that the daytime layer is amerger of all 6 individual layers observed during thenight. There may be distinct differences in composition
11
Mar Ecol Prog Ser 319: 1–14, 2006
or animal size within this larger layer, as potentiallyindicated by its vertical bifurcation at the nearshoreedge. However, with the limited taxonomic resolutionof the camera system, no differences were detected.
Within the layers that undergo movements on- andoffshore, myctophids were the most abundant compo-nent. However, there were significant differences incomposition and size of animals over time. In the layerclosest to the shore, large myctophids were first toarrive. Until approximately midnight, the mean size ofanimals decreased as smaller animals reached thesenearshore areas and the proportion of myctophids inthe SSL decreased as other animals, particularlyshrimp, migrated closer to shore. During the offshoremigration, smaller animals and shrimp left first,leaving large myctophids as the last animals presentnearshore and closer to the surface. This could beexplained by differences in swimming speeds of com-ponent groups: myctophids have estimated sustainedswimming speeds of 0.75 m s–1 (Reid 1994) with largerfish having higher rates than smaller ones (Sambilay1990). Shrimp in this size range have sustained swim-ming speeds of only 0.06 m s–1, again with larger ani-mals likely swimming faster. These differences alonewould explain the observed composition patterns overtime. However, these results do not fit previous model-ing predictions of vertical migration. De Robertis(2002) used a simple model assuming a trade offbetween mortality risk and energy gain to predict thetiming of migration by zooplankton. The model pre-dicts that there should be differences in the timingof migration between size classes. Smaller animalsshould enter surface waters earlier and leave later thanlarger animals, because larger animals are more vul-nerable to visual predators in well-lit surface waters. Inthe mesopelagic boundary layer, we found larger ani-mals arrived first and left later. This contradiction sug-gests that the animals in the boundary community areunder different constraints. Perhaps energy acquisi-tion is more difficult in these relatively nutrient poorsubtropical waters, changing the tradeoff. Alterna-tively, visual predation may not be as prevalent or maynot be as strongly graded with depth because of thewater clarity and relatively deeper penetration of light.
The model of De Robertis (2002) did not take traveltime into account when considering differences inmigration timing. Travel time between habitats in theextensive migrations observed is likely very important.The extreme swims undertaken by these animals maymake it impossible for smaller animals to meet theirideal timing because of the limits in their swimmingabilities. With their estimated swimming speeds sus-tained, an average sized myctophid would take justunder 4 h to complete a 10 km migration, while ashrimp could not complete the migration within a day.
Shrimp simply do not have enough time to reach thenearshore habitat from deep water. Smaller fish, swim-ming slower, would need to use a different migrationtactic from larger fish to avoid visual predation, despitethe potentially lower risk of being seen. Smaller indi-viduals would have to leave much earlier than largerfish to reach safer, deep waters offshore before dawn.Visual predation risk likely still plays an important rolein structuring this migration, but through the physicalswimming limitations of the animals rather than simplytheir risk of being seen.
Within the various strata, there was significant verti-cal structure in acoustic backscatter, as also observedin Benoit-Bird & Au (2003c). The type of scatterer, theirsize, their numerical density, and their orientationaffects backscatter. Using a combination of individualtarget strength and various measures from the camerasystem, we explored the potential causes of backscat-ter strata within the individual SSLs. Vertical stratawere most strongly related to changes in the density ofanimals with depth, with higher densities correlatedwith stronger backscatter. The depth of some individ-ual strata appeared to be related to the proportion ofmyctophids, particularly the deepest stratum in eachlayer, which showed a greater proportion of shrimpthan other areas. The number of strata was also highlycorrelated with the overall density of micronektonicanimals, with higher density areas having a greaternumber of strata. The proportion of myctophids andthe mean volume backscatter were also correlatedwith the number of strata; however, the length of myc-tophids and the individual target strength measure-ments were not.
The stratification in vertical space and the separationof layers with distance from shore suggest resourcepartitioning in this vertically compressed habitat. Alarge number of individuals are utilizing this narrowborder between land and the open ocean, within aconstricted depth range, and avoiding both the surfaceand seafloor. This differential use of habitat is verydynamic, so while animals may occupy the same depthand location, they do so at different times of the night.This suggests a fine-scale use of the habitat, which hasbeen observed in other low-latitude mesopelagicmicronekton assemblages (Hopkins & Gartner 1992,Hopkins & Sutton 1998). The habitat dimension addedby directed movement by the micronekton towardsand away from shore increases the possibility of habi-tat separation. The real stratification is probably evengreater than measured in this study because of our lim-ited taxonomic resolution in this diverse, low-latitudeassemblage.
Fine scale separation of habitat use could reduce thecompetition between individuals in these relativelydense aggregations. The relative environmental stabil-
12
Benoit-Bird & Au: Extreme diel horizontal migration of micronekton
ity of low-latitude oceanic ecosystems has led to theprediction that niche parameters would be primarilydetermined by biological parameters (McGowan &Walker 1979), which could lead to strong resourcepartitioning in spatially-packed species complexes(Domanski 1984, Hopkins & Gartner 1992). The re-source that the animals are competing for could befood, space, or light field. There is a lack of feeding anddiet data for boundary community animals, making itimpossible to assess this niche parameter. The resultsshow inter- and intra-specific (size) separation of ani-mals in space, both with depth and distance from thecoastline, which is likely correlated with food availabil-ity as gradients in potential prey have been observedin both dimensions (Leis 1982, Hassett & Boehlert1999). The vertical separation could also lead to largedifferences in the light field experienced by animals,and consequently in their predation risk from visualpredators (see Enright & Honegger 1977, Ohman 1988,Lampert 1989). Based on the average light transmis-sion characteristics of the water column during the sur-veys, a change in water depth of 10 m would result in adecrease in light available to a visual predator of about25%. The balance of these pressures, feeding and pre-dation avoidance, are likely different for different indi-viduals, leading to a variety of ‘ideal’ habits whichcould lead to the stratification observed.
The present study shows that animals in the meso-pelagic boundary layer make horizontal migrations ofat least 5.5 km (possibly up to 10 km) inshore eachnight. A round trip migration of at least 11 km must becostly, both in time from other activities and energy.This indicates that there must be a substantial benefitto horizontal migration, though the feeding advan-tages of this impressive movement have not beeninvestigated. Reid et al. (1991) suggested that the ani-mals in this boundary region are well-adapted residentpopulations rather than oceanic stragglers, but raisedquestions about how they maintained their positionwithin such a narrow habitat and what allowed them tosuccessfully exploit this habitat. We suggest that hori-zontal migration plays a role in habitat expansion,allowing mesopelagic animals to use habitats that aremuch shallower than typical for them at night, whileremaining in deep, dark areas during the day. In addi-tion, horizontal migration provides a mechanism foranimals to maintain their position in this narrow zone,moving them predictably over the island’s slopes daily.The dynamics of this migration are much greater thanpreviously described and suggest that, despite the con-strained nature of the habitat, there is strong partition-ing among size classes and taxonomic groups in spaceand time as a result of differential migration. Duringthe day, however, there is little evidence of partition-ing of habitat, suggesting a reduction of competition
relative to nighttime. We suggest that rather than sim-ply being described by composition, the mesopelagicboundary community should be defined by this strik-ing diel migration behavior that appears to haveallowed it to successfully radiate into the nearshorehabitat.
Acknowledgements. We thank M. McManus, R. Letelier, andD. Luther for lending us equipment. A. Ashe and B.McLaughlin provided assistance with equipment setup. C.Bird provided customized software. A. De Robertis and A.Lavery provided helpful comments on the manuscript. Thiswork was funded in part by the Office of Naval Research,Marine Mammal Science and Technology Program, ONRAward Number: N00014-02-1-0968, as well as by theNational Oceanic and Atmospheric Administration, ProjectR/FM-7, which is sponsored by the University of Hawaii SeaGrant College Program, SOEST, under the institutional GrantNo. NA16RG2254 from NOAA Office of Sea Grant, Depart-ment of Commerce. The views expressed herein are those ofthe authors and do not necessarily reflect the views of NOAAor any of its subagencies. UNIHI-SEAGRANT-JC-05-17.
LITERATURE CITED
Benoit-Bird KJ, Au WWL (2001) Target strength measure-ments of animals from the Hawaiian mesopelagic bound-ary community. J Acoust Soc Am 110:812–819
Benoit-Bird KJ, Au WWL (2003a) Prey dynamics affect forag-ing by a pelagic predator (Stenella longirostris) over arange of spatial and temporal scales. Behav Ecol Sociobiol53:364–373
Benoit-Bird KJ, Au WWL (2003b) Echo strength and densitystructure of Hawaiian mesopelagic boundary communitypatches. J Acoust Soc Am 114:1888–1897
Benoit-Bird KJ, Au WWL (2003c) Spatial dynamics of a near-shore micronekton sound-scattering layer. ICES J Mar Sci60:899–913
Benoit-Bird KJ, Au WWL (2004) Diel migration dynamics ofan island-associated sound-scattering layer. Deep-SeaRes I 51:707–719
Benoit-Bird KJ, Au WWL, Brainard RE, Lammers MO (2001)Diel horizontal migration of the Hawaiian mesopelagicboundary community observed acoustically. Mar EcolProg Ser 217:1–14
Boehlert GW, Genin A (1987) A review of the effects of sea-mounts on biological processes. Geophys Monogra 43:319–334
Boehlert GW, Watson W, Sun LC (1992) Horizontal andvertical distributions of larval fishes around an isolatedoceanic island in the tropical Pacific. Deep-Sea Res 39:439–466
Clarke T (1973) Some aspects of the ecology of lanternfishesin the Pacific Ocean near Hawaii. Fish Bull 71:401–434
Comeau S, Boisclair D (1998) Day-to-day variation in fishhorizontal migration and its potential consequence on esti-mates of trophic interactions in lakes. Fish Res 35:75–81
De Meester L (1993) Genotype, fish-mediated chemical,and phototactic behavior in Daphnia magna. Ecol 74:1467–1474
De Robertis A (2002) Size-dependent visual predation riskand the timing of vertical migration: an optimizationmodel. Limnol Oceanogr 47:925–933
13
Mar Ecol Prog Ser 319: 1–14, 2006
Domanski P (1984) The diel migrations and distribution withina mesopelagic community in the North East Atlantic. 8.A multivariate analysis of community structure. ProgOceanogr 13:491–511
Enright JT, Honegger HW (1977) Diurnal vertical migration:adaptive significance and timing. Part 2. Test of the model:details of timing. Limnol Oceanogr 22:873–886
Foote KG, Vestnes G, Maclennan DN, Simmonds EJ (1987)Calibration of acoustic instruments for fish density in-formation: a practical guide. International Council for theExploration of the Sea Cooperative Research Report 144
Gjøsaeter J (1984) Mesopelagic fish, a large potential re-source in the Arabian Sea. Deep-Sea Res 31:1019–1035
Haight WR, Parrish JD, Hayes TA (1993) Feeding ecology ofdeepwater lutjanid snappers at Penguin Bank, Hawaii.Trans Am Fish Soc 122:328–347
Hassett RP, Boehlert GW (1999) Spatial and temporal distrib-utions of copepods to leeward and windward of Oahu,Hawaiian Archipelago. Mar Biol 134:571–584
He X, Bigelow KA, Boggs CH (1997) Cluster analysis of long-line sets and fishing strategies within the Hawaii-basedfishery. Fish Res 31:147–158
Hopkins TL, Gartner JVJ (1992) Resource-partitioning andpredation impact of a low-latitude myctophid community.Mar Biol 114:185–197
Hopkins TL, Sutton TT (1998) Midwater fishes and shrimpsas competitors and resource partitioning in low latitudeoligotrophic ecosystems. Mar Ecol Prog Ser 164:37–45
Hulley PA (1992) Upper-slope distributions of oceanic lantern-fishes. Mar Biol 114:365–383
Kawaguchi K, Shimuzu H (1978) Taxonomy and distributionof the lanternfishes, genus Diaphus, in the western Pacific,eastern Indian Oceans and the Southeast Asian Seas. BullOcean Res Inst Univ Tokyo 10:1–145
Kubota T, Iizka K, Okutani T (1982) Some biological aspectsof Abralia andamanica from Suruga Bay, Japan. J Fac MarSci Tech 40:150–159
Lampert W (1989) The adaptive significance of diel verticalmigration of zooplankton. Funct Ecol 3:21-27
Leis JM (1982) Nearshore distributional gradients of larvalfish and planktonic crustaceans in Hawaii. Mar Biol 72:89–97
Lindstrom M (1991) Factors affecting the horizontal migrationof the amphipod Pontoporeia affinis Lindstrom. 1. Record-ing method and response to water currents. J Exp Mar BiolEcol 150:149–162
MacLennan DN, Simmonds EJ (1992) Fisheries acoustics.Chapman & Hall, New York
Mauchline J, Gordon JDM (1991) Oceanic pelagic prey ofbenthopelagic fish in the benthic boundary layer of a mar-ginal oceanic region. Mar Ecol Prog Ser 74:109–115
May JL, Blaber SJM (1989) Benthic and pelagic fish biomass
of the upper continental slope off eastern Tasmania. MarBiol 101:11–25
McGowan JA, Walker PW (1979) Structure in the copepodcommunity of the North Pacific Central Gyre. EcolMonogr 49:195–226
Norris KS, Dohl TP (1980) Behavior of the Hawaiian spinnerdolphin, Stenella longirostris. Fish Bull 77:821–849
Ohman MD (1988) Behavioral responses of zooplankton topredation. Bull Mar Sci 43:530–550
Omori M, Ohta S (1981) The use of underwater camera instudies of vertical distribution and swimming behaviourof a sergestid shrimp, Sergia lucens. J Plankton Res 3:107–121
Parin NV, Prut’ko VG (1985) The thalassial mesobentho-pelagic icthyocoene above the equator seamount in thewestern tropical Indian Ocean. Oceanol 25:781–783
Rasmussen OI, Giske J (1994) Life history parameters andvertical distribution of Maurolicus muelleri in Masfjordenin summer. Mar Biol 120:649–664
Raymond EL, Widder EA (2005) Eye-in-the-sea: a platform forunobstrusive in-situ observations of deep-sea nekton. AmSoc Limnol Oceanogr 2005 Aquatic Sciences Meeting, Feb20–25, 2005, Salt Lake City, UT. Am Soc Limnol Oceanogr,Waco, TX
Reid SB (1994) Spatial structure of the mesopelagic fishcommunity in the Hawaiian boundary region. PhD Disser-tation, University of Hawaii, Honolulu, HI
Reid SB, Hirota J, Young RE, Hallacher LE (1991) Meso-pelagic-boundary community in Hawaii: micronekton atthe interface between neritic and oceanic ecosystems. MarBiol 109:427–440
Sambilay VC Jr (1990) Interrelationships between swimmingspeed, caudal fin aspect ratio and body length of fishes.Fishbyte 83:16–20
Sasaki M (1914) Observations on Hotaru-ika, Watasenia scin-tillans. J Coll Agric, Hokkaido Univ 6:75–107
Sawada K, Furusawa M, Williamson NJ (1993) Conditions forthe precise measurement of fish target strength in situ.Fish Sci 20:15–21
Skillman RA (1998) Central Pacific swordfish, Xiphias glad-ius, fishery development, biology, and research. NOAATech Rep 142, NMFS
Stone R (1998) First glimpse at hidden life of seals. Science279:657
Suh HL, Yu OH (1996) Diel horizontal migration of planktoniccopepods in the surf zone of Yongil Bay, Korea. J KoreanFish Soc 29:527–536
Webb P, Wooldridge TH (1990) Diel horizontal migration ofMesopodopsis slabberi (Crustacea: Mysidacea) in AlgoaBay, Southern Africa. Mar Ecol Prog Ser 62:73–78
White MG (1998) Horizontal distribution of pelagic zooplank-ton in relation to predation gradients. Ecography 21:44–62
14
Editorial responsibility: Otto Kinne (Editor-in-Chief), Oldendorf/Luhe, Germany
Submitted: March 6, 2006; Accepted: June 26, 2006Proofs received from author(s): July 29, 2006