Arctic complexity: a case study on diel vertical migration of zooplankton
Upload
independentCategory
view
0download
0
MARINE ECOLOGY PROGRESS SERIESMar Ecol Prog Ser
Vol. 367: 109–123, 2008doi: 10.3354/meps07571
Published September 11
INTRODUCTION
Many zooplankton and micronekton undergo dielvertical migrations. Usually these animals reside indeeper waters during the day and ascend into nearsurface layers at night (Longhurst 1981). The timingand vertical extent of these migrations are affected bylight levels (Clarke 1970, Blaxter 1974, Ringelberg1995), food resources (George 1983), and temperatureand other environmental factors (Enright 1977). Thewidespread occurrence of these movements suggeststhat the advantages of migration outweigh energeticexpenditures and other potential costs.
Diel vertical migration has been hypothesized toresult from a balance among the selective pressures of
energy acquisition, energy expenditure, and predationrisk (see review by Lampert 1989). The vertical irradi-ance gradient in the ocean results in more photosyn-thesis and thus more food near the surface, and agreater range of visual detection by predators (Gliwicz1986). Moving into surface waters to feed only at nightwhile remaining in deep, dark waters during the dayallows vertical migrators to maximize survival by min-imizing their risk of visual predation while still access-ing abundant food resources at the surface (Stich &Lampert 1981, Ohman et al. 1983, Gliwicz 1986).
Like most deep sound-scattering layers (Roe 1974),the layer of mesopelagic micronekton around theHawaiian Islands undergoes diel vertical migrations,with an amplitude of up to 600 m (Reid et al. 1991, Reid
© Inter-Research 2008 · www.int-res.com*Email: [email protected]
Diel variation of zooplankton distributions inHawaiian waters favors horizontal diel migration by
midwater micronekton
Kelly J. Benoit-Bird1,*, Marnie Jo Zirbel1, Margaret A. McManus2
1College of Oceanic and Atmospheric Sciences, Oregon State University, 104 COAS Admin Bldg., Corvallis, Oregon 97333, USA2Department of Oceanography, University of Hawaii at Manoa, 1000 Pope Road, Honolulu, Hawaii 96822, USA
ABSTRACT: Micronekton in deep-scattering layers around the Hawaiian Islands undergo dielmigrations with both vertical and horizontal components. We sought to determine whether resourceavailability provides an adaptive explanation for this migration. We simultaneously measured thespatio-temporal patterns of micronekton, using acoustics and imaging optics, and of their potentialzooplankton prey, using net tows, acoustics, and optics. Zooplankton biomass, density, and totalabundance were higher at night than prior to sunset at nearshore sites, whereas relatively little dielvariation was observed offshore. All measures of zooplankton availability were 5 to 6 times highernearshore than offshore during nighttime hours when migrating micronekton species werenearshore. There was no significant nearshore–offshore gradient in zooplankton prior to sunset,leading to 2 possible explanations for the day–night patterns in zooplankton: benthic emergence andvertical migration coupled with horizontal motion. Analysis of taxonomic patterns from net tows didnot support the benthic emergence hypothesis. All 3 zooplankton assessment techniques supportedthe conclusion that zooplankton distribution could favor horizontal migration by micronekton giventhe pressures for micronketon to be in deep water during daylight to avoid predators. Recently pub-lished work has shown that small animals (2 to 10 cm in length) in scattering layers comprised ofmicronekton travel distances of at least 11 km roundtrip each night, often against currents, to obtainthese increased food resources. The length and likely cost of the journey provides some insight aboutthe importance of the potential feeding gains.
KEY WORDS: Micronekton . Diel migration . Zooplankton . Resource availability · Acoustics · Optics
Resale or republication not permitted without written consent of the publisher

Mar Ecol Prog Ser 367: 109–123, 2008
1994, Benoit-Bird & Au 2006). Unlike scattering layersthat have been extensively studied elsewhere, the dielmigration of the mesopelagic layer near Hawaiiincludes a nearshore–offshore component (Benoit-Birdet al. 2001). This results in micronekton coming within1 km of the shoreline at night, into water as shallow as25 m and then returning to deeper offshore watersbefore dawn, a round trip movement of at least 11 kmover the island’s slope (Benoit-Bird & Au 2006). Dielhorizontal migrations of micronekton have also beenobserved in other areas with high bottom relief (Sasaki1914, Omori & Ohta 1981, Bordes et al. 1999). How-ever, the mechanisms and cues underlying the dielmovement of micronekton capable of significant swim-ming have received little attention.
The extensive horizontal migrations undertaken byvarious mesopelagic myctophid fish, shrimp, and squideach day (Benoit-Bird & Au 2006) suggest that theymust provide strong benefits. The animals make theseswims actively, often against the prevailing currents(McManus et al. 2008), highlighting the potentialthough unmeasured energetic costs of this behavior.We hypothesized that horizontal migration providesthe micronekton with greater access to food resources.While the gut contents of species from the horizontallymigrating layer around Hawaii have not beenreported, many similar species of vertically migratingmicronektonic animals living father offshore (includ-ing those in the same genera as horizontally migratingspecies) are zooplanktivorous and feed in the upper250 m on euphausiids and medium to large copepods(Clarke 1980). A limited number of studies have char-acterized the composition of the oceanic zooplanktonassemblages near the Hawaiian Islands. These includeinvestigations of pelagic gammaridean amphipods(Brusca 1973), copepods (Hirota & Szyper 1976, Leis1982, Ferrari & Hayek 1990, Hassett & Boehlert 1999),chaetognaths (Szyper et al. 1976, Kimmerer 1984), andmixed zooplankton assemblages (Hirota & Szyper1976, Hu 1978). nearshore–offshore gradients in zoo-plankton abundance have been observed in thesewaters, paralleling measures of phytoplankton abun-dance (Leis 1982, Hassett & Boehlert 1999). These gra-dients may be a result of the ‘island-mass’ effect (Doty& Oguri 1956). An island, by interacting with circula-tion, can increase biological activity by creatingeddies, forming wind and current shadows, shallowingthe nutricline, or leaching important nutrients. In addi-tion, nearshore zooplankton abundance appears to behigher at night than during the day (Hassett & Boehlert1999), and many of the nocturnal zooplankters belongto taxa that emerge from within or near the seafloor inshallow waters over reefs and flats (Hobson & Chess1979). Thus, micronekton migrating into nearshorewaters over reefs and flats are likely to encounter a
substantially richer forage than is available in the off-shore epipelagic.
Our goal was to determine whether food availabilityprovides an adaptive explanation for the nearshoremigration of micronekton around the Hawaiian Islandsby simultaneously measuring the movements of themesopelagic layer and the density, abundance, andidentity of potential zooplankton prey. Specifically, wetested the prediction that zooplankton biomass anddensity are higher nearshore than offshore duringnighttime hours when migrating micronekton speciesare feeding.
MATERIALS AND METHODS
Sampling. Sampling was conducted off the 31 foot(9.5 m) FV ‘Alyce C’ using shipboard echosounders, ahigh-resolution vertical profiler, and zooplankton nettows. Underway sampling of transects was conductedat a vessel speed of approximately 5 knots (2.6 m s–1).The study area extended west of the leeward coast ofOahu, Hawaii, USA, covering 2 sites: a southern site inthe vicinity of 21° 19.3’ N, 158° 8.3’ W and a northernsite surrounding 21° 30.5’ N, 158° 14.2’ W (Fig. 1).
110
Fig. 1. Transect sampling design at 2 sites off the leewardcoast of Oahu, Hawaii. Bottom contours are shown in meters.Both sites were sampled during 2 different cruises, indicatedby different dashed patterns. Note the slight offset oftransects that were sampled during both cruises for clarity.The position of casts with the vertical profiler and net tows
are indicated by circles

Benoit-Bird et al.: Zooplankton distributions favor micronekton migration
Sampling was conducted between 18:00 and 04:00 hlocal time from 20 to 28 February 2005. At each site,3 km long transects were located at 1.5, 3.0, 5.0, and7.0 km from the shoreline. These distances were cho-sen based on the results of Benoit-Bird & Au (2006)showing that this range covers nearly the entire night-time range of the horizontally migrating mesopelagiclayer. Over the course of the sampling period, eachtransect was sampled once in the hour following 18:00,21:00, 00:00, and 03:00 h local time. The order of sam-pling by site and the order of transects within a sitewas determined using a randomized complete blockdesign with only 1 site surveyed in a single night. Highresolution profiles were taken at the end of each tran-sect, and vertical net tows for zooplankton were con-ducted at the ends and midpoint of each transect. Eachtransect, including all net tows and vertical profile, wascompleted in less than 1 h. The transect at 18:00 h wascompleted before sunset, which occurred nominally at19:00 h throughout the study.
Between 20 April and 27 May 2005, the southern sitewas sampled from 20:00 until 03:00 h local time duringfour 3 night series. The surveys coincided with spring(full moon 23–25 April, new moon 7–9 May, full moon22–24 May) and neap (first quarter 15–17 May) tides.Sampling in each 3 night survey was conducted con-tinuously. Three 3 km long transects were located 1.0,1.5, and 3 km from the shoreline. Vertical casts withthe profiling package and a zooplankton net were car-ried out at the ends and midpoint of each transect. Thestarting position along the survey grid was randomizedeach night, as was the order of the transects.
Between 9 April and 16 May 2006, the northern sitewas sampled from 20:00 until 03:00 h local time duringthree 3 night series. The surveys coincided with spring(full moon 13–15 April, new moon 26–28 April) andneap (third quarter 12–14 May) tides. All surveysspanned both ebb and flood of each tidal cycle. Three3 km long transects were located across slope, runningfrom 1 to 3 km from shore. Vertical profiles and nettows were conducted 1, 1.5, 2, and 3 km from shorealong the center transect. The position of the first castwith the profiler and net along the center transect wasrandomly selected each night, as was the initial tran-sect direction toward or away from shore and whetherthe right or left flanking transect was sampled next.
Data were collected at the southern and northernsites in the springs of 2 different years. Sampling wasconducted on 12 nights at the southern site in 2005 and9 nights at the northern Site in 2006, all in the samemonth in each case. Because each site was sampled ina different year, inter-site comparisons are not appro-priate. The primary purpose for these data was todetermine if the patterns observed over 9 contiguousnights in February 2005 were consistent over a longer
time period. Other sampling considerations meant thatprofiles and net tows were not conducted as far fromthe shoreline. However, at each site, at least the 1.5and 3.0 km transects overlapped with those conductedin February 2005.
Echosounders. Along each transect, micronektonscattering was continuously recorded using SimradEK60 split-beam echosounders at 38, 70, 120, and200 kHz. The 38 kHz system used a pulse length of1024 µs and had a 12° conical beam. The 70, 120, and200 kHz echosounders each had a beam angle of 7°with pulse lengths of 512, 256, and 256 µs, respec-tively. Echosounders were calibrated using an indirectprocedure incorporating a 38.1 mm diameter tungstencarbide reference sphere as prescribed by Foote et al.(1987).
Echosounder data were analyzed using SonarData’sEchoview software. First, using the split-beam capabil-ities of each echosounder, all echoes from solitary indi-vidual targets, i.e. targets at densities lower than 1 persampling volume, were identified as individual fish ormarine mammals and removed from the data(MacLennan & Simmonds 1992). A target strengththreshold of –75 dB was used along with a ‘pulselength determination level,’ the value in dB belowpeak value considered when determining the pulselength, or envelope, of a single-target detection, of12 dB. ‘Normalized pulse lengths,’ the measured pulselength divided by transmitted pulse length, wererequired to be between 0.8 and 2.0. The ‘maximumbeam compensation’ to correct for transducer directiv-ity was set to 12 dB. To confirm that all sources of scat-tering within the measured pulse length were from asingle target, all samples within this pulse envelopewere required to have a standard deviation in angularposition of <3° in both the along and athwart shipdirections of the beam. The remaining volume scatter-ing data were thresholded at a value of –80 dB andintegrated in 100 m horizontal by 1 m vertical bins.Numerical density of micronektonic animals for each100 m along a transect nearest to a profiling stationwas calculated from volume scattering using echoenergy integration, a technique that divides the totalbackscattered energy by the average backscatterenergy from an individual animal to estimate the num-ber of animals per unit volume sampled (MacLennan &Simmonds 1992). The animal size and identity ob-tained in each 1 m depth range in the video camerasystem on the high-resolution profiler (see below) oneach transect were combined with the relationshipsestablished by Benoit-Bird & Au (2001) to calculateindividual target strengths ranging from –66.4 to–54.7 dB//1 m for individual shrimp and from –52.7 to–38.8 dB//1 m in myctophid fishes. Density estimatesfor animals in the layers obtained from each acoustic
111

Mar Ecol Prog Ser 367: 109–123, 2008
frequency and those obtained independently with thecamera system were then compared.
High resolution profiler. Casts to within 3 m of thebottom or to 300 m, whichever was shallower, wereconducted using the high-resolution profiler with adescent rate of approximately 10 cm s–1. The profilerwas equipped with a number of instruments includingan SBE-25 CTD (conductivity, temperature, pressure),a Wet Labs Wetstar chlorophyll fluorometer, an opticalplankton counter (OPC), a Tracor acoustic profilingsystem (TAPS) for assessing zooplankton, and a low-light video camera system to identify micronekton andmeasure animal size and numerical density.
Micronekton camera system. To ground truth theacoustic estimates of micronekton density, a 2-cameralow-light video system with infrared illumination wasused to obtain information on taxonomic composition,numerical density, and size of micronekton. The sys-tem, described by Benoit-Bird & Au (2006), has shownno significant avoidance reaction by the micronektonunlike previous attempts with capture-based methodsand visible light photography (e.g. Benoit-Bird & Au2001, 2003). Data were analyzed similarly to Benoit-Bird & Au (2006). Video data for identification of spe-cies was analyzed by extracting still views every0.25 m from each of the 2 cameras, which together hada sampling volume of 575 l. Animals seen in still viewsfrom both cameras were identified to the lowest taxo-nomic level possible, providing taxonomically-specificdensity measures in the measured volume of the over-lapping fields of view. The coordinates of the identifiedanimal and its apparent length were used to estimateits size. Measurements of size take into account theapparent length of the animal in both cameras, allow-ing their actual length to be determined using trigono-metric relationships, eliminating apparent foreshort-ening from 1 camera. Data were averaged in 1 m depthbins to provide adequate sample sizes given the smallsampling volume.
OPC. An OPC (Focal Technologies model OPC-1T)on the profiler provided the vertical distribution of par-ticle abundance in sizes ranging from 0.25 to 20 mm(Herman 1988, 1992). The equivalent spherical diame-ter (ESD) was calculated according to the methods ofHerman (1992) with a 15% increase to compensate forunderestimation of size due to the random orientationof particles as they cross the OPC light beam, as pro-posed by Beaulieu et al. (1999). A flowmeter attachedto the profiler was used to estimate of the volume ofwater sampled by the OPC. Data were measured asparticle counts, and biovolume was estimated per m2
and per m3 for each cast.TAPS. TAPS uses acoustical scattering at 6 frequen-
cies to quantitatively estimate zooplankton abundancein size classes (Holliday & Pieper 1995). TAPS operates
at 265, 420, 700, 1100, 1850, and 3000 kHz and wasused to collect volume scattering strength profiles.These measurements were transformed to estimates ofzooplankton biovolume bin ESD classes via a con-strained, non-linear, least-squares algorithm (Holliday1977, MacLennan & Simmonds 1992, Holliday &Pieper 1995, Medwin & Clay 1997) that employed asimple spherical model. The choice of a sphericalmodel was guided by the body forms observed in nettow results, which consisted primarily of copepodswith few elongate scatterers. These estimates of bio-volume were converted to estimates of density bydividing the biovolume at a given size by the volume ofa spherical animal of that ESD. Large individual tar-gets (e.g. micronekton) were rarely sampled due to thesmall sample volume of TAPS (about 3 l).
Net tows. Vertically integrated net tows were con-ducted using a 333 µm mesh, 0.75 m diameter ring net.The net was lowered until the weight located 3 m fromthe cod end reached the bottom, or until the netreached 100 m as identified on the echosounders, andthen pulled to the surface at approximately 30 m min–1.During 2005, the net was equipped with a calibrated,custom-built flowmeter, and in 2006, with a calibratedTSK flowmeter to allow calculation of the volume ofwater sampled. Comparison of flowmeter readings andechosounder readings of net depth showed nearlyidentical estimates of the distance the net was pulled.Immediately after each tow, samples were rinsedthrough a series of sieves: 4 mm, 2 mm, 500 µm, and250 µm. Each size fraction was preserved in a 90 ml jarwith a final concentration of 4% buffered formalin inseawater. Within 1 wk of preservation, the wet weightof each size fraction was measured by washing thesample onto a 9 cm diameter, 40 µm particle retentionsize Whatman filter paper. The preservative solutionwas allowed to drain until no standing solution wasleft, and then more fluid was removed by 3 min undervacuum pressure. This procedure was followed on five90 ml volumes of 4% buffered formalin in seawaterthat did not contain a sample to obtain the weight ofthe empty filter paper. Each filter was then weighed onan analytical balance, and the sample rinsed back intothe sample jar with the preservative solution. Theweights of the wet control filters were within ±2%.The mean weight of the control filters was subtractedfrom the sample weight to provide a wet weight esti-mate. Samples that weighed within ±5% of the meanof the control filters were assigned a wet weight of0 mg. For analysis, all weights were converted to mgm–3.
After returning to the lab, individual zooplankton inthe samples were identified. Because of the high diver-sity and relatively low abundance of individuals, manysamples were counted in their entirety. Subsampling
112

Benoit-Bird et al.: Zooplankton distributions favor micronekton migration
was conducted on dense samples so that at least 30individuals were counted in each major taxonomicdivision in which animals were abundant. The smallestsubsample was an eighth of the entire sample. Forcopepods, identification was typically to family withthe abundant family Calanidae identified to genus andall copepods sorted by juvenile or adult form. Foreuphausiids and shrimp, identification was to species,and for other, less common groups, the level of identi-fication depended on diversity within a group and thecondition of the individual. Plankton from net towswere sorted into 99 categories that were then groupedinto 17 major classes. These classes, with the numberof categories separately identified in parentheseswhere appropriate, were as follows: copepods (juve-niles and adults separately of 21 calanoid families, 2cyclopoid, 2 harpacticoid, and 4 poecilostomid fami-lies, and copepod nauplii), fish larvae and eggs(3 groups including larval myctophids), urochordates(4 groups), protists (4 groups), malacostracans (11 spe-cies), ostractods, chaetognaths, gelatinous zooplank-ton (7 groups), crab zoea, mollusks (5 groups), amphi-pods, euphausiids (2 species, juveniles, and eggs),annelids (2 groups), holothurian larvae (echinoderm),bryozoans, isopods, and colonies of Trichodesmiumthiebautii (a phytoplankton species). Based upon flow-meter readings and percentage of sample counted,these counts were then converted to numerical densi-ties (ind. m–3).
Zooplankton data integration. Data from each TAPSand OPC cast were vertically integrated to a maximumdepth of 100 m to allow comparison to the total zoo-plankton biomass measured in the net casts. Density ofzooplankton in addition to total abundance likely playsan important role in successful micronekton foraging.The densities of zooplankton within depth intervalswere calculated for the TAPS and OPC data. Theseresults were compared to depth-specific densities ofmicronekton obtained from the echosounders and ver-ified with the camera system. Total abundance andnumerical density of micronekton and zooplanktonwere assessed as a function of distance from the shore-line and time using a multivariate analysis of variance(MANOVA). A simple MANOVA was chosen ratherthan a repeated measures ANOVA because it washighly unlikely that samples taken at a given locationwere dependent on samples taken previously at thatsame location for the following reasons: (1) samplingwas never repeated at 1 site on the same day; (2) areset in the distribution of micronekton and apparentlyzooplankton occurs daily; (3) previous work has shownthat micronekton do not cue to the substrate (Benoit-Bird et al. 2001); and (4) the water is constantlymoving, making results from an individual site differ-ent from one sample to the next. Zooplankton species
distributions obtained from the net tows were alsocompared as a function of distance from the shorelineand time using single factor ANOVA. Levene’s test ofequality of error variances was conducted for eachcomparison, and an analysis of the residual values foreach model was conducted to determine if theybehaved randomly, ensuring that the data fulfill theassumptions of the ANOVA.
RESULTS
February 2005
Zooplankton composition
Zooplankton biomass from net tows was dominatedby organisms between 2 and 4 mm in sieve size.Numerically, animals in this size range made up morethan half of all samples.
Plankton from net tows were sorted into 99 cate-gories that were then grouped into 17 major classes.Classes with mean densities greater than 1 ind. m–3 arelisted in descending order by mean density: copepods(juveniles and adults separately of 21 calanoid fami-lies, 2 cyclopoid, 2 harpacticoid, and 4 poecilostomidfamilies, and copepod nauplii), fish larvae and eggs,urochordates, protists, malacostracans, ostracods,chaetognaths, gelatinous zooplankton, crab zoea,mollusks, and amphipods. The total mean density ofzooplankton over all net tows was 107.1 ind. m–3. Netsamples were dominated by juvenile and adult cope-pods at densities averaging 69.7 ind. m–3, about 65% ofall individuals. Of all copepods, approximately 40%were copepodite stages, and 60% were adults.Calanoid copepods made up about 75% of the cope-pods at an average density of 54.3 ind. m–3. Approxi-mately 20% of the calanoids were Clausocalanus spp.,which accounted for nearly 15% of all zooplankton bynumber. Other animals that had mean densities>5 ind. m–3 were Undinula, Euchaetidae, Pleuro-mamma, Acartia, and Lucicutiidae (all calanoid cope-pod genera or families), Oncaea (a poecilostomid cope-pod genus), Oithona (a cyclopoid copepod genus),transparent fish eggs, ostracods, a stomatopod speciesof shrimp, and spumellarian radiolarians.
Space–time distribution patterns
Micronketon distribution patterns are shown inFig. 2. These patterns were consistent with thoseobserved previously off the leeward coast of Oahu,Hawaii. Density estimates did not vary significantlybetween frequencies (ANOVA df = 3,216, p > 0.05).
113

Mar Ecol Prog Ser 367: 109–123, 2008
For simplicity, only estimates calculated using the70 kHz echosounder, the same frequency used to sam-ple the full range of the scattering layer throughout itsmigration by Benoit-Bird & Au (2006), were used forfurther analysis. Density estimates made through echoenergy integration at 70 kHz were not significantly dif-ferent from those made using the camera system(paired t-test, p > 0.05, 1–β = 0.81). In all estimates,more than 80% of the micronektonic animals identi-fied with the camera system were myctophid fish. Themajority of the remainder were midwater shrimp atleast 3 cm in length. A MANOVA was conducted onvarious measures of micronekton abundance and den-sity as a function of site, distance from shore, and time.The results are shown in Table 1.
A variety of density, biomass, biovolume, and abun-dance measurements of zooplankton were made using3 different approaches: acoustic, optical counter, andnet. The results of a MANOVA for the effects of site,time of night, and distance from shore on each mea-sure of zooplankton are shown in Table 1. The resultsshow strong similarities in pattern between measuresand sampling systems. This can be seen by comparingFig. 3, data from net samples, to Fig. 4, data fromTAPS. These patterns in zooplankton are also quitesimilar to the time-space patterns observed inmicronekton (Fig. 2). A similar analysis was carried outfor raw fluorescence measured with the fluorometer onthe vertical profiler. Results are also shown in Table 1.
A significant effect of site was observed for allmicronekton abundance and density measures and
nearly all measures of zooplankton (Table 1). Therewas no observed site effect on fluorescence. Post hoctests revealed that the northern site consistently had ahigher abundance and density of micronekton andzooplankton than the southern site. However, there
114
Local time (h)
03:0000:0021:0018:00
Distance from shore
7 km5 km
1.5 km3 km
0
10
20
30
40
50
Mic
ron
ekto
n d
en
sity (in
d.
m–3)
Fig. 2. Micronekton density within the scattering layer mea-sured acoustically as a function of time and distance from theshoreline. February 2005 data from both sites are pooled, be-cause although there were differences in the overall mean be-tween sites, the time–distance from shore patterns werethe same, thus increasing the 95% confidence intervals about
each mean, which are indicated by error bars
0
50
100
150
200
250
300
Local time (h)
Zo
op
lan
kto
n w
et
weig
ht
(mg
m–3)
03:0000:0021:0018:00
Distance from shore
7 km5 km
1.5 km3 km
Fig. 3. Average wet weight of zooplankton captured in verti-cally integrated net tows for the entire water column to within3 m of the bottom or 100 m. February 2005 data from bothsites are pooled because, although there were differences inthe overall mean between sites, the time–distance from shorepatterns were the same, thus increasing the 95% confidenceintervals about each mean, which are indicated by error bars
0
300
600
900
1200
1500
1800
Zo
op
lan
kto
n b
iovo
lum
e (m
m3 m
–3)
Local time (h)03:0000:0021:0018:00
Distance from shore
7 km5 km
1.5 km3 km
Fig. 4. Average biovolume of zooplankton for the entire watercolumn to within 3 m of the bottom or 100 m. Backscatteringdata from a Tracor acoustic profiling system (TAPS), a 6 fre-quency acoustic sensor attached to a vertical profiler, weretransformed to estimates of zooplankton biovolume via a non-linear least squares algorithm constrained by the types of zoo-plankton observed and their sizes. February 2005 data fromboth sites are pooled because, although there were differencesin the overall mean between sites, the time–distance from shorepatterns were the same, thus increasing the 95% confidenceintervals about eachmean, which are indicated by error bars

Benoit-Bird et al.: Zooplankton distributions favor micronekton migration
were no significant interaction terms involving site,suggesting that the across slope space-time patternsare similar between sites.
Micronekton measures and many zooplankton mea-sures showed significant time-of-day and distance-from-shore effects. A significant interaction effect oftime-of-day and distance-from shore was observed forall micronekton and nearly all zooplankton measures(Figs. 2 to 4).
Nearshore–offshore gradients
The strong interactions observed between time anddistance from shore on measures of zooplanktonabundance necessitate a simplification in the analy-ses to test the hypothesis that zooplankton abun-dance is higher in surface waters nearshore than off-shore. Micronekton are primarily found in nearshorewaters near the middle of the night (Fig. 2). A
115
Site Distance from Time Site × Site × Distance ×shore Distance Time Time
(df = 1) (df = 3) (df = 3) (df = 9) (df = 3) (df = 9)
Micronekton acoustics (error df = 216)Mean density (ind. m–3) <0.005 <0.001 <0.001 ns ns <0.001Max density (ind. m–3) <0.005 <0.001 <0.001 ns ns <0.001Abundance (ind. m–3) <0.001 <0.001 <0.001 ns ns <0.001
Zooplankton net tows (error df = 334)Biomass (mg m–3)500 µm > Z > 333 µm <0.005 ns ns ns ns <0.052 mm > Z > 500 µm <0.001 <0.001 <0.001 ns ns <0.014 mm > Z > 2 mm ns <0.001 <0.001 ns ns <0.05Z > 4 mm <0.005 ns ns ns ns nsAll sizes ns <0.001 <0.001 ns ns <0.05
Total biomass (mg m–2)500 µm > Z > 333 µm <0.005 ns ns ns ns <0.052 mm > Z > 500 µm <0.001 <0.001 <0.001 ns ns <0.0014 mm > Z > 2 mm ns <0.005 <0.001 ns ns <0.05Z > 4 mm <0.001 ns ns ns ns nsAll sizes ns <0.01 <0.005 ns ns <0.05
Density (ind. m–3)500 µm > Z > 333 µm <0.01 ns ns ns ns <0.012 mm > Z > 500 µm ns <0.001 <0.05 ns ns <0.0054 mm > Z > 2 mm <0.05 ns ns ns ns <0.001Z > 4 mm <0.005 ns ns ns ns <0.01All sizes <0.01 <0.05 <0.005 ns ns <0.005
Abundance (ind. m–2)500 µm > Z > 333 µm <0.01 ns ns ns ns <0.052 mm > Z > 500 µm <0.05 <0.001 <0.01 ns ns <0.054 mm > Z > 2 mm <0.01 ns ns ns ns <0.001Z > 4 mm <0.005 ns ns ns ns <0.01All sizes <0.005 <0.05 <0.05 ns ns <0.05
Zooplankton TAPS (error df = 216)Biovolume (mm3 m–3) <0.01 <0.01 <0.05 ns ns <0.001Max biovolume (mm3 m–3) <0.01 <0.005 <0.001 ns ns <0.001Total biovolume (mm3 m–2) <0.01 <0.001 <0.01 ns ns <0.001
Zooplankton OPC (error df = 216)Biovolume (mm3 m–3) <0.01 <0.01 <0.01 ns ns <0.001Max biovolume (mm3 m–3) <0.01 <0.005 <0.001 ns ns <0.001Total biovolume (mm3 m–2) <0.005 <0.01 <0.01 ns ns <0.001Mean density (counts m–3) <0.01 <0.001 <0.01 ns ns <0.01Max density (counts m–3) <0.01 <0.001 <0.005 ns ns <0.01Abundance (counts m–2) <0.01 <0.001 <0.01 ns ns <0.01
Chlorophyll fluorescence (error df = 216)Mean chl (mg m–3) ns ns ns ns ns nsMax chl (mg m–3) ns ns ns ns ns nsTotal chl (mg m–2) ns <0.01 <0.01 ns ns ns
Table 1. February 2005 results of a MANOVA to observe the effects of site, distance from shore, and time of night on micronek-ton, zooplankton measured with several techniques, and chlorophyll fluorescence. Z: individual zooplankters. p-values are
indicated for significant results, ns: no significant effect (p > 0.05) of that factor on the variable

Mar Ecol Prog Ser 367: 109–123, 2008
MANOVA was conducted to test the effects of dis-tance from shore on the density of zooplankton ineach of the 17 major taxonomic classes and 1 sub-class, calanoid copepods, as well as total zooplanktondensity from all net tows in the hour after midnightwhen the greatest number of micronekton werefound at the stations closest to shore (Table 2). Forgroups that were significantly affected by distancefrom shore, a series of post hoc tests was used todetermine whether densities in each group werehigher nearshore than at the next distance fartheroffshore. A Bonferroni correction was used to com-pensate for multiple comparisons. Because thehypothesis was that nearshore transects would havehigher densities than offshore transects, all testswere 1-tailed. The mean densities for each zooplank-ton group in each distance class are shown in Table2, as are the results of the post hoc analyses. A simi-lar analysis of distance effect on the density of the 99groups originally identified from the net tows wascarried out. The taxonomic groups that were signifi-cantly affected by distance from the shoreline inmidnight samples are shown in Table 3. Post hocanalyses were corrected using the Bonferronimethod. Finally, an ANOVA on the biomass density(mg m–3) from net tows showed a similar patternwith a significant effect of distance (p < 0.01) andsignificant 1-tailed differences between each adja-
cent distance (1.5–3.0 km: p < 0.005; 3.0–5.0 km: p <0.01; 5.0–7.0 km: p < 0.05).
Comparison of zooplankton techniques
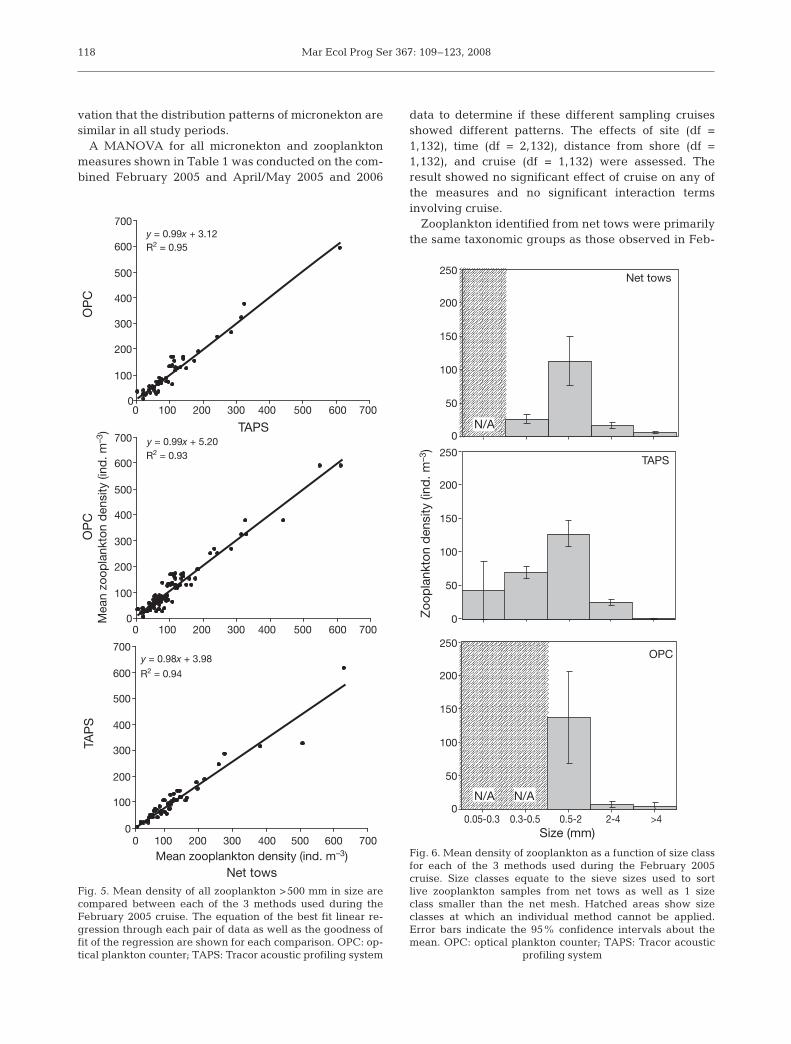
A variety of techniques was used to quantify zoo-plankton abundance and density. All 3 methodsshowed similar results with respect to the nearshore–offshore hypothesis, as indicated by the statistical re-sults shown in Table 1. To quantify the ability of eachmethod to measure the abundance of zooplankton, theestimates of density of zooplankton >0.5 mm in size, theminimum size for the OPC and a sieve mesh size, wascompared for net tows, TAPS, and the OPC for the Feb-ruary 2005 data. Fig. 5 shows a series of pairwise linearregressions comparing each method. None of theslopes is significantly different from 1 (p > 0.05) for allcomparisons, the y-intercepts are very close to 0, andfor all regressions the variation in zooplankton densitymeasured with 1 technique that could be explained bythe variation in zooplankton density measured with adifferent technique was greater than 90%.
The mean density of zooplankton by the sieve sizeclasses used for net sampling during February 2005 isshown for all 3 methods in Fig. 6. Fig. 7 shows the den-sity of zooplankton by size for TAPS and OPC data in0.2 mm increments. In these data sets, very few zoo-
116
Distance effect (p) Midnight mean density (ind. m–3) Post hoc comparisons (p)Plankton group(df = 3,334) 1.5 km 3.0 km 5.0 km 7.0 km 1.5–3 km 3–5 km 5–7 km
All Copepoda <0.05 227.2 167.2 98.1 50.4 <0.05 <0.05 <0.05All calanoid copepods <0.05 182.8 94.3 78.5 37.0 <0.05 <0.05 <0.05Amphipoda ns 3.7 1.8 1.7 1.9 – – –Isopoda ns 0.1 0.0 0.0 0.0 – – –Ostracods ns 13.7 4.1 4.5 4.9 – – –Euphausiia <0.05 1.1 0.6 0.4 0.3 <0.05 ns nsCrab zoea <0.05 17.2 1.3 0.9 0.8 <0.05 ns nsShrimp (decapoda) <0.05 18.7 6.2 3.5 1.8 <0.05 ns nsChaetognatha ns 4.8 1.7 1.5 1.4 – –Urochordata <0.05 10.4 3.2 4.1 4.8 <0.05 ns nsFish <0.05 20.4 4.2 4.4 4.1 <0.05 ns nsGelatinous ns 5.6 1.0 1.4 2.0 – – –Protista ns 9.2 4.6 7.8 6.1 – – –Annelida ns 0.3 0.3 0.3 0.4 – – –Molluska ns 6.3 2.1 2.3 2.1 – – –Bryozoa ns 0.0 0.0 0.1 0.1 – – –Holothuroidia larva ns 0.9 0.3 0.4 0.2 – – –Trichodesmium colony ns 0.0 0.0 0.0 0.0 – – –Total density <0.05 339.4 198.5 131.4 81.3 <0.05 <0.05 <0.05
Table 2. Results of a MANOVA of the effect of distance from shore on the density of plankton in 17 large taxonomic groups identi-fied from February 2005 net tows in the hour following midnight are shown in the second column. p-values are indicated for signif-icant results; ns: no significant effect of that factor on the variable (p > 0.05). The next 4 columns show the mean density of individ-uals in each group for all midnight net tow samples at each distance from shore. The results of 1-tailed post hoc comparisons forthose groups that showed a significant distance effect on numerical density of plankton are shown in the last 3 columns

Benoit-Bird et al.: Zooplankton distributions favor micronekton migration
plankton were observed with an equivalent sphericaldiameter >3.5 mm and so are not shown.
Vertical distribution
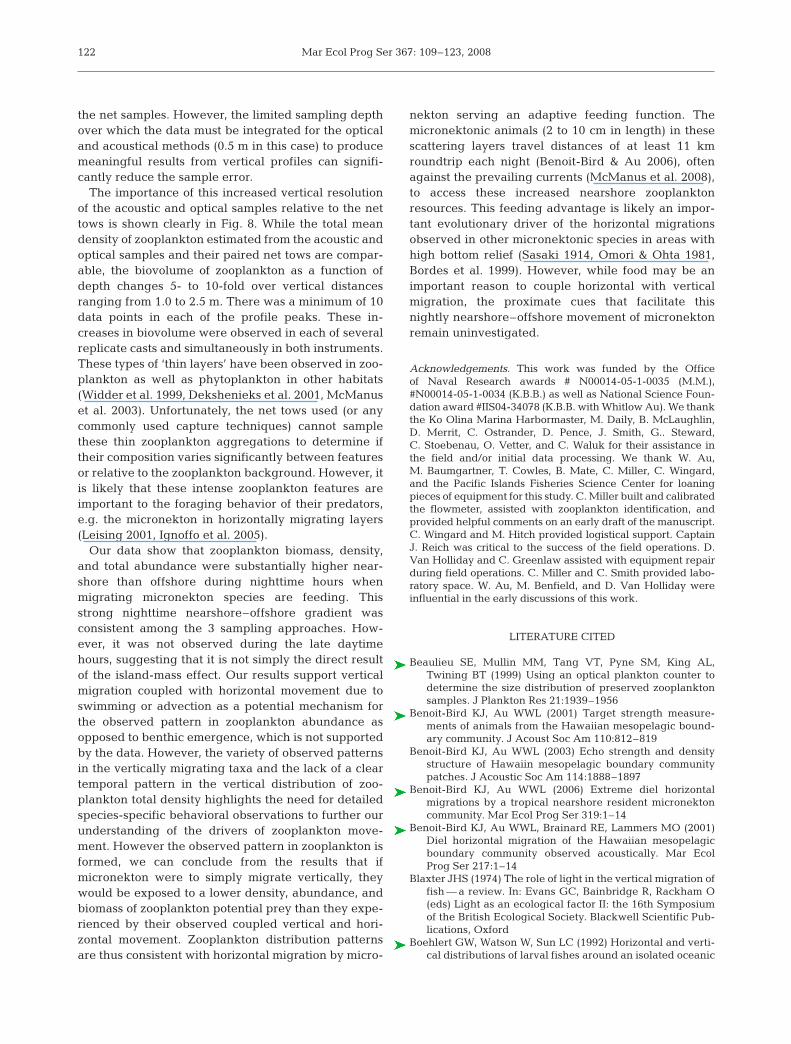
The vertical distribution of zooplankton was mea-sured with TAPS and the OPC. The zooplankton verti-cal distribution was highly variable with sharp discon-tinuities in zooplankton that represent order ofmagnitude changes in biovolume or density in <1 mchange in depth. An example cast is shown in Fig. 8.Despite this intense vertical variation, the results fromthe TAPS and OPC on the same cast were very similar,and replicate profiles showed repeatable patterns. Theexample cast shown in Fig. 8 shows distinct sizeclasses present in each peak of zooplankton biovol-ume. Distinct peaks in the zooplankton vertical struc-ture were associated with differences in the size of theparticles in many of the casts.
In both the TAPS and OPC data, the center of thezooplankton distribution, i.e. the depth at which half ofthe biovolume for the TAPS or density for the OPC wasabove that point and half below it, was not significantlyaffected by time (p > 0.05 for both methods) but didshow a significant effect in response to distance fromshore (TAPS data: p < 0.01; OPC data: p < 0.005) witha shallowing of the center of the zooplankton distri-bution inshore, in shallow water. Neither measure
showed a significant interaction effect between timeand distance from the shoreline. The center depth ofzooplankton was always less than the midpoint of theprofile at the location of the cast. The differencebetween the center depth and midpoint depth was notsignificantly affected by time (p > 0.05 for both com-parisons) but was affected by distance from the shore-line (TAPS data: p < 0.05; OPC data: p < 0.01) with sitescloser to shore and thus in shallower water showingless of a difference between the center and midpointdepths than those farther from shore. Neither showeda significant interaction term. These results do notshow a clear vertical shift in the distribution of overallzooplankton biomass as a function of time as would beexpected during diel migration synchronized amongvarious zooplankton taxa. Rather, overall zooplanktondepth appears tied to seafloor depth as it shallowscloser to the shoreline, regardless of time of night.
April/May 2005 and 2006
Micronekton distribution patterns in April/Maysamples of both years were nearly identical to thoseobserved in February 2005. ANOVAs for the April/May 2005 and 2006 data both showed significanteffects (p < 0.01) of time, distance from shore, and theinteraction of these 2 variables for all measures ofmicronekton shown in Table 1, supporting the obser-
117
Distance effect (p) Midnight mean density (ind. m–3) Post hoc comparisons (p)Plankton groupdf = 3,334 1.5 km 3.0 km 5.0 km 7.0 km 1.5–3 km 3–5 km 5–7 km
Adult Acartia (calanoid) <0.05 14.8 8.9 5.8 2.4 <0.05 <0.05 <0.05Adult Clausocalanus (calanoid) <0.05 36.7 20.8 16.4 12.9 <0.05 <0.05 <0.05Adult Eucalanoidae (calanoid) <0.05 1.4 1.1 0.8 0.1 <0.05 <0.05 <0.05Juvenile Euchaetidae (calanoid) <0.05 21.4 6.7 5.9 5.5 <0.05 ns nsJuvenile Lucicutiidae (calanoid) <0.05 6.1 3.7 1.2 0.6 <0.05 <0.05 <0.05Adult Scolecithrix (calanoid) <0.05 4.6 2.4 1.5 0.3 <0.05 <0.05 <0.05Juvenile Scolecithrix (calanoid) <0.05 9.5 6.2 3.3 0.6 <0.05 <0.05 <0.05Oithonidae (cyclopoid) <0.05 18.7 2.8 3.6 4.9 <0.05 ns nsCopilia (poecilostomid) <0.05 2.2 1.2 0.1 0.1 <0.05 <0.05 nsEuphausiid calyptopis stage <0.05 0.7 0.1 0.1 0.1 <0.05 ns nsCrab zoea <0.05 17.2 6.1 0.9 0.8 <0.05 <0.05 nsStomatopod shrimp sp. <0.05 16.8 3.5 1.5 1.2 <0.05 <0.05 nsChaetognatha <0.05 4.8 2.6 1.2 1.4 <0.05 <0.05 nsApendicularia <0.05 9.9 0.7 1.4 1.8 <0.05 ns nsTransparent fish egg <0.05 18.6 3.9 3.5 3.7 <0.05 ns nsOpaque fish egg <0.05 1.1 0.2 0.2 0.2 <0.05 ns nsLarval Myctophidae (fish) <0.05 0.7 0.0 0.1 0.2 <0.05 ns nsSiphonophora <0.05 1.8 0.3 0.3 0.5 <0.05 ns nsPelagic Gastropoda <0.05 5.1 3.3 1.5 1.4 <0.05 <0.05 ns
Table 3. Results of a MANOVA of the effect of distance from shore on the numerical density of plankton in the original 99 groupsidentified from February 2005 net tows in the hour following midnight are shown in the second column. p-values are indicated forsignificant results while groups that showed no significant effect are not shown. The next 4 columns show the mean density of zoo-plankton in each category for all midnight net tow samples at each distance from shore. The results of 1-tailed post hoc compar-isons for those groups that showed a significant distance effect on zooplankton density are shown in the last 3 columns. ns: p > 0.05
Mar Ecol Prog Ser 367: 109–123, 2008
vation that the distribution patterns of micronekton aresimilar in all study periods.
A MANOVA for all micronekton and zooplanktonmeasures shown in Table 1 was conducted on the com-bined February 2005 and April/May 2005 and 2006
data to determine if these different sampling cruisesshowed different patterns. The effects of site (df =1,132), time (df = 2,132), distance from shore (df =1,132), and cruise (df = 1,132) were assessed. Theresult showed no significant effect of cruise on any ofthe measures and no significant interaction termsinvolving cruise.
Zooplankton identified from net tows were primarilythe same taxonomic groups as those observed in Feb-
118
y = 0.98x + 3.98
R2 = 0.94
R2 = 0.93
R2 = 0.95
0
100
200
300
400
500
600
700
100
200
300
400
500
600
700 y = 0.99x + 5.20
0
y = 0.99x + 3.12
0
100
200
300
400
500
600
700
Mean zooplankton density (ind. m–3)
Mean z
oo
pla
nkto
n d
ensity (in
d. m
–3)
TAP
S
TAPS
OP
CO
PC
Net tows
0 100 200 300 400 500 600 700
0 100 200 300 400 500 600 700
0 100 200 300 400 500 600 700
Fig. 5. Mean density of all zooplankton >500 mm in size arecompared between each of the 3 methods used during theFebruary 2005 cruise. The equation of the best fit linear re-gression through each pair of data as well as the goodness offit of the regression are shown for each comparison. OPC: op-tical plankton counter; TAPS: Tracor acoustic profiling system
N/A
0
50
100
150
200
250
>42-40.5-20.3-0.50.05-0.3
TAPS
Net tows
N/A
Size (mm)
OPC
0
50
100
150
200
250
Zo
op
lan
kto
n d
en
sity
(ind
. m
–3)
0
50
100
150
200
250
N/A
Fig. 6. Mean density of zooplankton as a function of size classfor each of the 3 methods used during the February 2005cruise. Size classes equate to the sieve sizes used to sortlive zooplankton samples from net tows as well as 1 sizeclass smaller than the net mesh. Hatched areas show sizeclasses at which an individual method cannot be applied.Error bars indicate the 95% confidence intervals about themean. OPC: optical plankton counter; TAPS: Tracor acoustic
profiling system

Benoit-Bird et al.: Zooplankton distributions favor micronekton migration
ruary 2005 and in nearly the same order of relativeimportance, with the exception of a significant numberof mysids in April/May 2005 at the southern site thatwere not observed in the February samples that year.For both the April/May 2005 and 2006 data, the pat-terns of zooplankton distribution were very similar tothe February 2005 samples with significant effects oftime, distance from the shoreline, and a significantinteraction between the two observed on most mea-sures of zooplankton from all 3 techniques. Consider-ing only the density data within 1 h following mid-night, a significant effect of distance from the shorelinewas identified in both data sets for total copepods, totalcalanoid copepods, euphausiids, crab zoea, shrimp,and fish. In April/May 2005, mollusks also showed thiseffect and in April/May 2006, urochordates (salps,doliolids, and appendicularians) showed an effect ofdistance from shore. These are primarily the same
groups whose densities were significantly affected bydistance from the shore at midnight in February 2005(Table 2). Considering the individually identifiedgroups, distance-from-shore results were quite similarto those from February 2005, with a few additionalcalanoid copepod groups showing a significant dis-tance effect in April/May 2005 (juvenile Haloptilus,juvenile and adult Pontellidae), as well as one calanoidgroup that did not show a distance effect in April/Maythat did in February 2005 (Euchetiidae). Similarly, inApril/May 2006, salps and Oncaea (poecilostomidcopepod) showed a significant distance effect, whileeuphausiids at the calyptosis stage did not. One-tailedpost hoc tests showed that in April/May 2005, the den-sity of each group shown to have a significant distance-from-shore effect was significantly higher at 1.0 than1.5 km from the shoreline, and greater at 1.5 than 3.0km from the shoreline. One-tailed post hoc tests wereconducted on zooplankton density for each group thatshowed a significant distance-from-shore effect inApril/May 2006. These analyses revealed that the den-sity of each zooplankton group was greater at 1.0 than1.5, greater at 1.5 than 2.0, and greater at 2.0 than3.0 km from the shore.
DISCUSSION
Our goal was to determine whether food availabilitycould provide an adaptive explanation for the near-shore migration of micronekton of the scattering layeraround the Hawaiian Islands by simultaneously mea-suring the movements of the mesopelagic layer ofmicronekton and the density, abundance, and identityof potential zooplankton prey. We tested the predictionthat zooplankton biomass or density would be highernearshore than offshore during nighttime hours whenmigrating micronekton species are feeding (Clarke1978). Our results show that while there was a signifi-cant nearshore–offshore effect on zooplankton in theupper 100 m for some measures, the biomass, density,and biovolume of nearly every size class of zooplank-ton from 3 different techniques was strongly affectedby the interaction of distance from shore and time,meaning that the horizontal distribution pattern in theupper 100 m is changing over the course of a day. Anincreasingly strong nearshore to offshore gradient inzooplankton was observed between 18:00 h and mid-night, with a decreasing difference between nearshoreand offshore locations toward morning. This pattern ofan increase in zooplankton density, total numbers, andbiomass in the upper water column nearshore relativeto offshore near the middle of the night was consistentbetween the 2 sampling sites studied and over 3 sam-pling periods covering winter and spring in 2 different
119
0
50
100
150
200TAPS
OPC
00 0.5 1.0 1.5 2.0 2.5 3.0 3.5
50
100
150
200
Zo
op
lan
kto
n d
en
sity (in
d. m
–3)
Size (mm)
N/A
Fig. 7. Mean density of zooplankton integrated over the upper100 m of the water column. Data were taken during the Feb-ruary 2005 cruise using Tracor acoustic profiling system(TAPS) and the optical plankton counter (OPC) and areshown as a function of the size classes used in the TAPSmodel. Very few individuals greater than 3.5 mm in size wereobserved and so are not shown. Hatched area highlights zoo-plankton sizes smaller than the OPC can detect. Both data areshown with the same size bins. Error bars indicate the 95%confidence intervals about the mean. For the TAPS data,
some error bars were too small to be represented

Mar Ecol Prog Ser 367: 109–123, 2008
years. This suggests that this pattern is consistentalong the leeward coast of Oahu over a significantportion of the year and from year to year and is likelyto be an ecologically important pattern of resourcedistribution.
The observed zooplankton distribution should favorthe nearshore–offshore migration of micronekton ob-served at the same time and examined in more detailin recent work (Benoit-Bird et al. 2001, Benoit-Bird &Au 2006, McManus et al. 2008). The results of ourstudy show that the density of micronekton is corre-lated with simultaneous measures of zooplanktonabundance. Increases in micronekton occur at thesame relative position and at nearly the same time asincreases in zooplankton. No gut content informationis available from the micronekton during their horizon-tal migration because of the difficulties of capturingthese highly mobile animals in shallow water. Wetherefore cannot test when feeding occurs. However,the observed diel vertical and horizontal migrationwould allow micronekton access to 5–6 times greaterbiomass, density, and abundance of zooplankton thanwould diel vertical migration alone.
The observed pattern in zooplankton could resultfrom either benthic emergence or vertical migrationcoupled with horizontal movement through eitheractive swimming or passive advection. While notspecifically tested in the study, the taxonomic composi-
tion of net samples, specifically the taxa that showednearshore–offshore patterns, reveals the potentialimportance of each proposed mechanism. Zooplanktonwere diverse, although both biomass and density weredominated by copepods, specifically calanoids. Of the99 groups into which zooplankton from net tows weresorted, 24 showed a significant effect of distance fromthe shoreline in their densities at midnight during atleast 1 cruise. All 24 groups showed a higher concen-tration of individuals nearshore compared to transectsfarther from shore, with the distance over which thechange occurred varying between taxa. Taxa thatshowed nearshore–offshore patterns included a vari-ety of forms. Fish eggs showed a higher concentrationat 1.5 km from the shoreline than at any other site,which is likely due to the spawning behavior of adultfish that were not sampled. All other taxa showingnearshore to offshore gradients were mobile andbelonged to groups known to be primarily or exclu-sively pelagic rather than benthic or epibenthic spe-cies. Some groups are coastal (the calalanoid copepodsAcartia and Clausocalanus); some are primarily knownfrom deep-water areas (calanoid copepods Eucala-noidae, Euchatidae, Lucicutiidae, and Scolecithrix,and cyclopoid copepods from the family Oithonidae).Many groups that show this nearshore–offshore gradi-ent commonly migrate vertically (Calanoidae: Scole-cithrix; Poecilostomidae: Copilia and Oncaea; calypto-
120
1.2-2.0 mm
2.0-2.6 mm
2.7 mm ESD
0
10
20
30
40
50
0 200 400 600 800 1000 1200 0 200 400 600 800 1000 1200
Dep
th (m
)
OPC biovolume (mm3 m–3) TAPS biovolume (mm3 m–3)
Fig. 8. Zooplankton biovolume measured by the optical plankton counter (OPC left) and Tracor acoustic profiling system (TAPSright), both in 0.5 m vertical bins, as a function of depth on 22 February 2005, 00:12 h local time 5 km from shore. This cast had atotal biovolume that was approximately the same as the average for all casts. The vertical structure was similar between the OPCand TAPS measurements. In this example, 3 distinct peaks are observed in zooplankton biovolume. Each peak is dominated
by different sized zooplankton. Equivalent spherical diameters (ESD) observed in each peak are shown

Benoit-Bird et al.: Zooplankton distributions favor micronekton migration
sis stage euphausiids). Groups that did not show anearshore–offshore gradient were from both pelagictaxa (Calanoidae: Calanidae, Candacia, Centropages,Eucalanus, Mecynocera, Pleuromamma spp.) and bot-tom-associated taxa (Calanoidae: Aetideus; Harpacti-coida: Miraciidae). Several of these groups exhibitmarked vertical migrations (Calanoidae: Calanidae,Pleuromamma sp.). The identification of significantnearshore–offshore gradients only in pelagic taxa doesnot support benthic emergence as a mechanism forthe observed increase in zooplankton nearshore atmidnight. Vertical migration combined with otherbehavioral and physical processes may indeed beimportant mechanisms by which zooplankton aggre-gate nearshore, e.g. through trapping of verticallymigrating zooplankton over shallow shelves as hasbeen observed in other steep slope habitats (Boehlertet al. 1992, Dower & Brodeur 2004, Genin 2004). How-ever, not all groups that vertically migrate show anearshore–offshore gradient. Future studies on themechanisms of zooplankton aggregation in thisecosystem will need to examine the behavior and dis-tribution of individual species and their relationship tocurrents at small scales.
Of those groups identified as showing a significantnearshore–offshore pattern, 4 were addressed in pre-vious studies in the same area, as were 4 that did notshow an across-slope gradient in our study. Leis (1982)studied 6 crustacean species sampled between 0.2 and3 km from the shoreline in an area overlapping withour southern study site. Hassett & Boehlert (1999) alsohad a site overlapping our southern study site withsamples taken 1.8, 9.3, and 28 km from the shoreline,with a focus on 4 species of copepods. Species ofcalanoid copepods (Undinula) and those from the fam-ily Pontellidae were categorized by both studies as‘nearshore associated’ with higher abundances near-shore than offshore. In our study, pontellid copepodsshowed a significant pattern during only 1 of the 3 fieldefforts, and Undinula did not show an across-slopegradient in any period we studied. Leis (1982) furthercharacterized Labidocera madurae, a species ofeuchaetid copepod, and a species of shrimp, Luciferchacei, as showing a higher concentration nearshore,while neither showed a significant pattern in any of oursampling periods. Myctophid fish larvae were catego-rized in that study as an offshore group while theyshowed the opposite pattern in all 3 sampling periodsof our study. Copepods from the calanoid familyCalanidae were identified by Hassett & Boehlert (1999)as being randomly distributed, as they were in all 3 ofour sampling periods. A species of Acartia was ran-domly distributed in the observations of Leis (1982);however, it showed a strong nearshore–offshore gradi-ent in our data. None of the other groups we found was
discussed in the previous studies. The differencesobserved between the current and previous studiesmay have to do with taxonomic specificity of the stud-ies. Previous studies typically identified only a fractionof the net sample and identified those individuals tospecies, while we took a broader look at the zooplank-ton samples, including all taxa at a coarser resolution.An even larger effect may be the temporal componentof the sampling. Hassett & Boehlert (1999) groupedtheir samples into ‘night’ and ‘day’ while Leis (1982)combined all samples, regardless of sampling time. Wesampled from just before dusk through the night andwere thus unable to look at daytime patterns. Theextremely strong diel component observed here in all 3sampling periods shows that samples taken just afew hours apart during the night can differ dramati-cally and thus pooling nighttime samples for analysiscould alter the apparent across-slope distribution ofabundance.
Acoustic, optical, and direct sampling were used toquantify zooplankton in this study. A comparison of thedensity estimates and size classes from all 3 methodsshowed similar results when the data from each werereduced to the same resolution. The greatest differ-ences between techniques were not found in the inte-grated numbers that can be directly compared, butrather in the data each can uniquely provide. Net towsare the only sampling technique used that can providedirect measures of biomass, density, and species com-position, although they can do so only over the entiredepth range, and with the 333 µm net we used, theycan miss small animals. Both the optical (OPC) andacoustical (TAPS) approaches can provide depth-specific data of some measure of abundance by sizebut cannot provide information on animal identity. Forboth techniques, a description of the size distributionand body forms likely to be found are important fordata interpretation. The OPC does not sample smallparticles (a problem corrected in the next generation ofthis instrument, the Laser OPC), is affected by the lighttransmittance characteristics of the zooplankton, andcan mis-size animals when they are found at high den-sities (Herman 1988, 1992). TAPS is similarly affectedby the acoustic scattering properties of zooplankton;for example, air inclusions and hard parts can increaseacoustic scattering strength and must be accounted for(in this case, using net tow data; see summaries byStanton et al. 1998a,b). Both of these indirect tech-niques rely on a relatively small sample volume,approximately 2.5 l, about 0.5 to 1.5 m away from theinstrument in the case of the acoustics and in the caseof the optics, a 0.1 l volume passing through a 2 × 25 cmrectangular channel in the instrument. This may biasboth of these instruments against larger animalsbecause of avoidance, a problem also likely to affect
121
Mar Ecol Prog Ser 367: 109–123, 2008
the net samples. However, the limited sampling depthover which the data must be integrated for the opticaland acoustical methods (0.5 m in this case) to producemeaningful results from vertical profiles can signifi-cantly reduce the sample error.
The importance of this increased vertical resolutionof the acoustic and optical samples relative to the nettows is shown clearly in Fig. 8. While the total meandensity of zooplankton estimated from the acoustic andoptical samples and their paired net tows are compar-able, the biovolume of zooplankton as a function ofdepth changes 5- to 10-fold over vertical distancesranging from 1.0 to 2.5 m. There was a minimum of 10data points in each of the profile peaks. These in-creases in biovolume were observed in each of severalreplicate casts and simultaneously in both instruments.These types of ‘thin layers’ have been observed in zoo-plankton as well as phytoplankton in other habitats(Widder et al. 1999, Dekshenieks et al. 2001, McManuset al. 2003). Unfortunately, the net tows used (or anycommonly used capture techniques) cannot samplethese thin zooplankton aggregations to determine iftheir composition varies significantly between featuresor relative to the zooplankton background. However, itis likely that these intense zooplankton features areimportant to the foraging behavior of their predators,e.g. the micronekton in horizontally migrating layers(Leising 2001, Ignoffo et al. 2005).
Our data show that zooplankton biomass, density,and total abundance were substantially higher near-shore than offshore during nighttime hours whenmigrating micronekton species are feeding. Thisstrong nighttime nearshore–offshore gradient wasconsistent among the 3 sampling approaches. How-ever, it was not observed during the late daytimehours, suggesting that it is not simply the direct resultof the island-mass effect. Our results support verticalmigration coupled with horizontal movement due toswimming or advection as a potential mechanism forthe observed pattern in zooplankton abundance asopposed to benthic emergence, which is not supportedby the data. However, the variety of observed patternsin the vertically migrating taxa and the lack of a cleartemporal pattern in the vertical distribution of zoo-plankton total density highlights the need for detailedspecies-specific behavioral observations to further ourunderstanding of the drivers of zooplankton move-ment. However the observed pattern in zooplankton isformed, we can conclude from the results that ifmicronekton were to simply migrate vertically, theywould be exposed to a lower density, abundance, andbiomass of zooplankton potential prey than they expe-rienced by their observed coupled vertical and hori-zontal movement. Zooplankton distribution patternsare thus consistent with horizontal migration by micro-
nekton serving an adaptive feeding function. Themicronektonic animals (2 to 10 cm in length) in thesescattering layers travel distances of at least 11 kmroundtrip each night (Benoit-Bird & Au 2006), oftenagainst the prevailing currents (McManus et al. 2008),to access these increased nearshore zooplanktonresources. This feeding advantage is likely an impor-tant evolutionary driver of the horizontal migrationsobserved in other micronektonic species in areas withhigh bottom relief (Sasaki 1914, Omori & Ohta 1981,Bordes et al. 1999). However, while food may be animportant reason to couple horizontal with verticalmigration, the proximate cues that facilitate thisnightly nearshore–offshore movement of micronektonremain uninvestigated.
Acknowledgements. This work was funded by the Officeof Naval Research awards # N00014-05-1-0035 (M.M.),#N00014-05-1-0034 (K.B.B.) as well as National Science Foun-dation award #IIS04-34078 (K.B.B. with Whitlow Au). We thankthe Ko Olina Marina Harbormaster, M. Daily, B. McLaughlin,D. Merrit, C. Ostrander, D. Pence, J. Smith, G.. Steward,C. Stoebenau, O. Vetter, and C. Waluk for their assistance inthe field and/or initial data processing. We thank W. Au,M. Baumgartner, T. Cowles, B. Mate, C. Miller, C. Wingard,and the Pacific Islands Fisheries Science Center for loaningpieces of equipment for this study. C. Miller built and calibratedthe flowmeter, assisted with zooplankton identification, andprovided helpful comments on an early draft of the manuscript.C. Wingard and M. Hitch provided logistical support. CaptainJ. Reich was critical to the success of the field operations. D.Van Holliday and C. Greenlaw assisted with equipment repairduring field operations. C. Miller and C. Smith provided labo-ratory space. W. Au, M. Benfield, and D. Van Holliday wereinfluential in the early discussions of this work.
LITERATURE CITED
Beaulieu SE, Mullin MM, Tang VT, Pyne SM, King AL,Twining BT (1999) Using an optical plankton counter todetermine the size distribution of preserved zooplanktonsamples. J Plankton Res 21:1939–1956
Benoit-Bird KJ, Au WWL (2001) Target strength measure-ments of animals from the Hawaiian mesopelagic bound-ary community. J Acoust Soc Am 110:812–819
Benoit-Bird KJ, Au WWL (2003) Echo strength and densitystructure of Hawaiin mesopelagic boundary communitypatches. J Acoustic Soc Am 114:1888–1897
Benoit-Bird KJ, Au WWL (2006) Extreme diel horizontalmigrations by a tropical nearshore resident micronektoncommunity. Mar Ecol Prog Ser 319:1–14
Benoit-Bird KJ, Au WWL, Brainard RE, Lammers MO (2001)Diel horizontal migration of the Hawaiian mesopelagicboundary community observed acoustically. Mar EcolProg Ser 217:1–14
Blaxter JHS (1974) The role of light in the vertical migration offish — a review. In: Evans GC, Bainbridge R, Rackham O(eds) Light as an ecological factor II: the 16th Symposiumof the British Ecological Society. Blackwell Scientific Pub-lications, Oxford
Boehlert GW, Watson W, Sun LC (1992) Horizontal and verti-cal distributions of larval fishes around an isolated oceanic
122

Benoit-Bird et al.: Zooplankton distributions favor micronekton migration
island in the tropical Pacific. Deep-Sea Res 39:439–466Bordes F, Uiblein F, Castillo R, Barrera A and others (1999)
Epi- and mesopelagic fishes, acoustic data, and SSTimages collected off Lanzarote, Fuerteventura and GranCanaria, Canary Islands, during cruise ‘La bocaina 04-97’.Inf Tec Inst Canario Cienc Mar 5:1–45
Brusca GJ (1973) Pelagic Amphipoda from the waters nearOahu, Hawaii, excluding the Family Scinidae. Pac Sci27:8–27
Clarke GW (1970) Light conditions in the sea in relation to thediurnal vertical migrations of animals. In: Farquar GB (ed)Proceedings of an International Symposium on BiologicalSound Scattering in the Ocean. Department of the Navy,Washington, DC, p 41–50
Clarke T (1978) Diel feeding patterns of 16 species of meso-pelagic fishes from Hawaiian waters. Fish Bull (Wash DC)76:495–513
Clarke TA (1980) Diets of fourteen species of verticallymigrating mesopelagic fishes in Hawaiian waters. FishBull (Wash DC) 78:619–640
Dekshenieks MM, Donaghay PL, Sullivan JM, Rines JEB,Osborn TR, Twardowski MS (2001) Temporal and spatialoccurrence of phytoplankton thin layers in relation tophysical processes. Mar Ecol Prog Ser 223:61–71
Doty MS, Oguri M (1956) The island mass effect. J Cons IntExplor Mer 22:33–37
Dower JF, Brodeur RD (2004) The role of biophysical couplingin concentrating marine organisms around shallow topo-graphies. J Mar Syst 50:1–2
Enright JT (1977) Diurnal vertical migration: adaptive signifi-cance and timing. Limnol Oceanogr 22:856–886
Ferrari FD, Hayek LAC (1990) Monthly differences in distribu-tions of sex and assymetry in a looking-glass copepod, Pleu-romamma xiphias, off Hawaii. J Crustac Biol 10:114–127
Foote KG, Vestnes G, MacLennan DN, Simmonds EJ (1987) Cal-ibration of acoustic instruments for fish density estimation: apractical guide. ICES Coop Res Rep 144. ICES, Copenhagen
Genin A (2004) Bio-physical coupling in the formation of zoo-plankton and fish aggregations over abrupt topographies.J Mar Syst 50:3–20
George DG (1983) Interrelations between the vertical migra-tion of Daphnia and chlorophyll a in two large limneticenclosures. J Plankton Res 5:457–475
Gliwicz ZM (1986) Predation and the evolution of verticalmigration in zooplankton. Nature 320:746–748
Hassett RP, Boehlert GW (1999) Spatial and temporal distrib-utions of copepods to leeward and windward of Oahu,Hawaiian Archipelago. Mar Biol 134:571–584
Herman AW (1988) Simultaneous measurement of zooplank-ton and light attenuance with a new optical planktoncounter. Cont Shelf Res 8:205–221
Herman AW (1992) Design and calibration of a new opticalplankton counter capable of sizing small zooplankton.Deep-Sea Res I 39:395–415
Hirota J, Szyper JP (1076) Standing stocks of zooplanktonsize-classes and trophic levels in Kaneohe Bay, Oahu,Hawaiin Islands. Pac Sci 30:341–361
Hobson ES, Chess JR (1979) Trophic relationships amongfishes and plankton in the lagoon Enewetak Atoll, Mar-shall Islands. Fish Bull 76:133–153
Holliday DV (1977) Extracting biophysical information fromthe acoustic signals of marine organisms. In: AndersonNR, Zahuranec BJ (eds) Oceanic sound scattering predic-tion. Plenum, New York, p 619–624
Holliday DV, Pieper RE (1995) Bioacoustical oceanography athigh frequencies. ICES J Mar Sci 52:279–296
Hu VJH (1978) Relationships between vertical migration and dietin four species of euphausiids. Limnol Oceanogr 23:293–306
Ignoffo TR, Bollens SM, Bochdansky AB (2005) The effects ofthin layers on the vertical distribution of the rotifer, Bra-chionus plicatilis. J Exp Mar Biol Ecol 316:167–181
Kimmerer WJ (1984) Selective predation and its impact onprey of Sagitta enflata (Chaetognatha). Mar Ecol Prog Ser15:55–62
Lampert W (1989) The adaptive significance of diel verticalmigration of zooplankton. Funct Ecol 3:21–27
Leis JM (1982) Nearshore distributional gradients of larvalfish and planktonic crustaceans in Hawaii. Mar Biol 72:89–97
Leising AW (2001) Copepod foraging in patchy habitats andthin layers using a 2-D individual-based model. Mar EcolProg Ser 216:167–179
Longhurst AR (1981) Analysis of marine ecosystems. Acade-mic Press, London
MacLennan DN, Simmonds EJ (1992) Fisheries acoustics.Chapman & Hall, New York
McManus MM, Alldredge AL, Barnard AH, Boss E and others(2003) Characteristics, distribution, and persistence of thinlayers over a 48 hour period. Mar Ecol Prog Ser 261:1–19
McManus MM, Benoit-Bird KJ, Woodson CB (2008) Behaviorexceeds physical forcing in the diel horizontal migration ofa midwater sound-scattering layer in Hawaiian waters.Mar Ecol Prog Ser 365:91–101
Medwin H, Clay C (1997) Fundamentals of acoustical oceano-graphy. Academic Press, San Diego, CA
Ohman MD, Frost BW, Cohen EB (1983) Reverse diel verticalmigration: an escape from invertebrate predators. Science220:1404–1407
Omori M, Ohta S (1981) The use of underwater camera in stud-ies of vertical distribution and swimming behaviour of asergestid shrimp, Sergia lucens. J Plankton Res 3: 107–121
Reid SB (1994) Spatial structure of the mesopelagic fish com-munity in the Hawaiian boundary region. PhD disserta-tion, University of Hawaii, Honolulu, HI
Reid SB, Hirota J, Young RE, Hallacher LE (1991) Meso-pelagic-boundary community in Hawaii: micronekton atthe interface between neritic and oceanic ecosystems. MarBiol 109:427–440
Ringelberg J (1995) Changes in light intensity and diel verti-cal migration: a comparison of marine and freshwaterenvironments. J Mar Biol Assoc UK 75:15–25
Roe HSJ (1974) Observations on the diurnal vertical migra-tions of an oceanic animal community. Mar Biol 28:99–113
Sasaki M (1914) Observations on hotaru-ika, Watasenia scin-tillans. J Coll Agric Hokkaido Univ 6:75–107
Stanton TK, Chu D, Wiebe PH (1998a) Sound scattering byseveral zooplankton groups: II. Scattering models.J Acoust Soc Am 103:236–253
Stanton TK, Chu D, Wiebe PH, Martin LV, Eastwood RL(1998b) Sound scattering by several zooplankton groups:I. Experimental determination of dominant scatteringmechanisms. J Acoust Soc Am 103:225–235
Stich HB, Lampert W (1981) Predator evasion as an explana-tion of diurnal vertical migration by zooplankton. Nature293:396–398
Szyper JP, Hirota J, Caperaon J, Ziemann DA (1976) Nutrientregeneration by the larger net zooplankton in the south-ern basin of Kaneohe Bay, Oahu, Hawaiin Islands. Pac Sci30:363–372
Widder EA, Johnsen S, Bernstein SA, Case JF, Neilson DJ (1999)Thin layers of bioluminescent copepods found at density dis-continuities in the water column. Mar Biol 134: 429–437
123
Editorial responsibility: Peter Verity,Savannah, Georgia, USA
Submitted: February 6, 2008; Accepted: May 14, 2008Proofs received from author(s): September 4, 2008
Copyright © 2022 FDOKUMEN