Artificial selection for high activity favors mighty mini-muscles in house mice
15
Artificial selection for high activity favors mighty mini-muscles in house mice PHILIPPE HOULE-LEROY, 1 HELGA GUDERLEY, 1 JOHN G. SWALLOW, 2 AND THEODORE GARLAND, JR. 3 1 De ´partement de Biologie, Universite ´ Laval, Que ´bec, Canada G1K 7P4; 2 Department of Biology, University of South Dakota, Vermillion, South Dakota 57069; and 3 Department of Biology, University of California, Riverside, California 92521 Submitted 22 March 2002; accepted in final form 25 September 2002 Houle-Leroy, Philippe, Helga Guderley, John G. Swallow, and Theodore Garland, Jr. Artificial selection for high activity favors mighty mini-muscles in house mice. Am J Physiol Regul Integr Comp Physiol 284: R433–R443, 2003; 10.1152/ajpregu.00179.2002.—After 14 generations of selection for voluntary wheel running, mice from the four replicate se- lected lines ran, on average, twice as many revolutions per day as those from the four unselected control lines. To examine whether the selected lines followed distinct strategies in the correlated responses of the size and metabolic capacities of the hindlimb muscles, we examined mice from selected lines, housed for 8 wk in cages with access to running wheels that were either free to rotate (“wheel access” group) or locked (“sedentary”). Thirteen of twenty individuals in one selected line (line 6) and two of twenty in another (line 3) showed a marked reduction (50%) in total hindlimb muscle mass, con- sistent with the previously described expression of a small- muscle phenotype. Individuals with these “mini-muscles” were not significantly smaller in total body mass compared with line-mates with normal-sized muscles. Access to free wheels did not affect the relative mass of the mini-muscles, but did result in typical mammalian training effects for mitochondrial en- zyme activities. Individuals with mini-muscles showed a higher mass-specific muscle aerobic capacity as revealed by the maxi- mal in vitro rates of citrate synthase and cytochrome c oxidase. Moreover, these mice showed the highest activities of hexoki- nase and carnitine palmitoyl transferase. Females with mini- muscles showed the highest levels of phosphofructokinase, and males with mini-muscles the highest levels of pyruvate dehy- drogenase. As shown by total muscle enzyme contents, the increase in mass-specific aerobic capacity almost completely compensated for the reduction caused by the “loss” of muscle mass. Moreover, the mini-muscle mice exhibited the lowest contents of lactate dehydrogenase and glycogen phosphory- lase. Interestingly, metabolic capacities of mini-muscled mice resemble those of muscles after endurance training. Overall, our results demonstrate that during selection for voluntary wheel running, distinct adaptive paths that differentially exploit the genetic variation in morphological and physiolog- ical traits have been followed. aerobic capacity; correlated response; exercise physiology; muscle metabolic capacities; wheel running behavior SELECTIVE BREEDING has proven effective at altering many aspects of the phenotype, including behavioral, morphological, and physiological traits (2, 9, 10, 13). When selection is imposed on an organismal trait, such as behavior or body size, various lower-level traits may change as well. For example, selection for fast growth in pigs leads to more efficient feed conversion, less fat accumulation, and a greater number of muscle fibers, whereas selection for high back fat thickness leads pigs to grow more slowly and have fewer muscle fibers (27). When replicate lines are subjected to the same selec- tion regimen, they can show heterogeneous responses. Such heterogeneity is often observed for traits other than the one under direct selection, including traits at lower levels of biological organization that may be functionally related to the selected trait. The causes of heterogeneous responses in correlated traits include founder effects and genetic drift, variability of pleiotro- pic effects among loci, and multiple physiological re- sponses to selection (1, 7, 21, 23, 25). Even if replicate selected lines show similar phenotypic responses, these may have evolved by different genetic mechanisms (e.g., Refs. 3, 15). Although selection experiments are becoming increasingly popular in comparative and evo- lutionary physiology (8–11, 13), few studies have ex- plored the potential for heterogeneous responses of the morphological and physiological mechanisms underly- ing adaptation (but see Refs. 5, 6, 16, 33). Swallow et al. (29) used selective breeding to create four replicate lines of mice that exhibit high levels of voluntary wheel running while maintaining four ran- dom-bred lines as a control. After 14 generations of selection, mice from the selected lines were running more than twice as far as, and at higher speeds than, mice from the control lines (31). As wheel running in these mice is presumed to be primarily aerobic (see Refs. 14, 18, 19, 30, 34), we reasoned that the selection protocol would favor mice with a high aerobic capacity in their hindlimb muscles. Although access to running wheels led to effects typical of endurance training, after 14 generations mice from selected lines did not have significantly higher muscle aerobic capacities than those from control lines (18; see also Ref. 34). Address for reprint requests and other correspondence: H. Guder- ley, De ´partement de Biologie, Universite ´ Laval, Que ´bec, Canada G1K 7P4 (E-mail: [email protected]). The costs of publication of this article were defrayed in part by the payment of page charges. The article must therefore be hereby marked ‘‘advertisement’’ in accordance with 18 U.S.C. Section 1734 solely to indicate this fact. Am J Physiol Regul Integr Comp Physiol 284: R433–R443, 2003; 10.1152/ajpregu.00179.2002. 0363-6119/03 $5.00 Copyright © 2003 the American Physiological Society http://www.ajpregu.org R433
-
Upload
independent -
Category
Documents
-
view
2 -
download
0
Transcript of Artificial selection for high activity favors mighty mini-muscles in house mice

Artificial selection for high activity favors mightymini-muscles in house mice
PHILIPPE HOULE-LEROY,1 HELGA GUDERLEY,1
JOHN G. SWALLOW,2 AND THEODORE GARLAND, JR.31Departement de Biologie, Universite Laval, Quebec, Canada G1K 7P4; 2Departmentof Biology, University of South Dakota, Vermillion, South Dakota 57069; and3Department of Biology, University of California, Riverside, California 92521Submitted 22 March 2002; accepted in final form 25 September 2002
Houle-Leroy, Philippe, Helga Guderley, John G.Swallow, and Theodore Garland, Jr. Artificial selectionfor high activity favors mighty mini-muscles in house mice. AmJ Physiol Regul Integr Comp Physiol 284: R433–R443, 2003;10.1152/ajpregu.00179.2002.—After 14 generations of selectionfor voluntary wheel running, mice from the four replicate se-lected lines ran, on average, twice as many revolutions per dayas those from the four unselected control lines. To examinewhether the selected lines followed distinct strategies in thecorrelated responses of the size and metabolic capacities of thehindlimb muscles, we examined mice from selected lines,housed for 8 wk in cages with access to running wheels thatwere either free to rotate (“wheel access” group) or locked(“sedentary”). Thirteen of twenty individuals in one selectedline (line 6) and two of twenty in another (line 3) showed amarked reduction (�50%) in total hindlimb muscle mass, con-sistent with the previously described expression of a small-muscle phenotype. Individuals with these “mini-muscles” werenot significantly smaller in total body mass compared withline-mates with normal-sized muscles. Access to free wheels didnot affect the relative mass of the mini-muscles, but did resultin typical mammalian training effects for mitochondrial en-zyme activities. Individuals with mini-muscles showed a highermass-specific muscle aerobic capacity as revealed by the maxi-mal in vitro rates of citrate synthase and cytochrome c oxidase.Moreover, these mice showed the highest activities of hexoki-nase and carnitine palmitoyl transferase. Females with mini-muscles showed the highest levels of phosphofructokinase, andmales with mini-muscles the highest levels of pyruvate dehy-drogenase. As shown by total muscle enzyme contents, theincrease in mass-specific aerobic capacity almost completelycompensated for the reduction caused by the “loss” of musclemass. Moreover, the mini-muscle mice exhibited the lowestcontents of lactate dehydrogenase and glycogen phosphory-lase. Interestingly, metabolic capacities of mini-muscled miceresemble those of muscles after endurance training. Overall,our results demonstrate that during selection for voluntarywheel running, distinct adaptive paths that differentiallyexploit the genetic variation in morphological and physiolog-ical traits have been followed.aerobic capacity; correlated response; exercise physiology;muscle metabolic capacities; wheel running behavior
SELECTIVE BREEDING has proven effective at alteringmany aspects of the phenotype, including behavioral,
morphological, and physiological traits (2, 9, 10, 13).When selection is imposed on an organismal trait, suchas behavior or body size, various lower-level traits maychange as well. For example, selection for fast growthin pigs leads to more efficient feed conversion, less fataccumulation, and a greater number of muscle fibers,whereas selection for high back fat thickness leads pigsto grow more slowly and have fewer muscle fibers (27).
When replicate lines are subjected to the same selec-tion regimen, they can show heterogeneous responses.Such heterogeneity is often observed for traits otherthan the one under direct selection, including traits atlower levels of biological organization that may befunctionally related to the selected trait. The causes ofheterogeneous responses in correlated traits includefounder effects and genetic drift, variability of pleiotro-pic effects among loci, and multiple physiological re-sponses to selection (1, 7, 21, 23, 25). Even if replicateselected lines show similar phenotypic responses, thesemay have evolved by different genetic mechanisms(e.g., Refs. 3, 15). Although selection experiments arebecoming increasingly popular in comparative and evo-lutionary physiology (8–11, 13), few studies have ex-plored the potential for heterogeneous responses of themorphological and physiological mechanisms underly-ing adaptation (but see Refs. 5, 6, 16, 33).
Swallow et al. (29) used selective breeding to createfour replicate lines of mice that exhibit high levels ofvoluntary wheel running while maintaining four ran-dom-bred lines as a control. After 14 generations ofselection, mice from the selected lines were runningmore than twice as far as, and at higher speeds than,mice from the control lines (31). As wheel running inthese mice is presumed to be primarily aerobic (seeRefs. 14, 18, 19, 30, 34), we reasoned that the selectionprotocol would favor mice with a high aerobic capacityin their hindlimb muscles. Although access to runningwheels led to effects typical of endurance training,after 14 generations mice from selected lines did nothave significantly higher muscle aerobic capacitiesthan those from control lines (18; see also Ref. 34).
Address for reprint requests and other correspondence: H. Guder-ley, Departement de Biologie, Universite Laval, Quebec, CanadaG1K 7P4 (E-mail: [email protected]).
The costs of publication of this article were defrayed in part by thepayment of page charges. The article must therefore be herebymarked ‘‘advertisement’’ in accordance with 18 U.S.C. Section 1734solely to indicate this fact.
Am J Physiol Regul Integr Comp Physiol 284: R433–R443, 2003;10.1152/ajpregu.00179.2002.
0363-6119/03 $5.00 Copyright © 2003 the American Physiological Societyhttp://www.ajpregu.org R433

A complementary response to selection for highwheel running could involve changes in muscle mass.Body mass of mice from the selected lines has becomesignificantly lower than that in control lines (31). Al-though a loss of body fat explains much of this change(32; see also Ref. 4), decreased muscle mass couldcontribute. In humans, endurance runners are typi-cally relatively small individuals who have reducedmass of some hindlimb muscles (e.g., see Ref. 20). Inrats, voluntary wheel running can reduce muscle mass,especially in the hindlimbs (26). This suggests thatselection for increased voluntary wheel running couldfavor decreases in the mass of muscles used for run-ning.
Indeed, at generation 22, mice from the four selectedlines show a significant reduction in mass of the tricepssurae complex (corrected for variation in total bodymass; 12), an important extensor of the ankle. More-over, two of the selected lines exhibit a discrete poly-morphism in the triceps surae that almost halves mus-cle mass and seems to be inherited as a simpleMendelian recessive (12). Hierarchical models that in-cluded effects of genetic drift and/or selection indicatedthat the small-muscle allele was present at low fre-quency (�7%) in the base population and has sinceexperienced strong positive selection in the selectedbut not control lines (12). We hypothesized that the“mini-muscles” may possess functional characteristicsthat facilitate high levels of wheel running. For exam-ple, if the mini-muscles were primarily composed ofsmall oxidative fibers, they could facilitate wheel run-ning as this would increase muscle mass specific aero-bic capacity as well as reduce diffusion distances fordelivery of oxygen and blood-borne substrates (24).
To examine possible heterogeneity in the response ofhindlimb muscles to selection for voluntary wheel run-ning, we housed mice from the selected and controllines for 8 wk in cages with access to running wheelsthat were either free to rotate (wheel-access group) orlocked (sedentary group). This design allowed us toexamine whether effects of selection are only expressedin the presence of the selected behavior, i.e., wheelrunning.
To obtain an overview of the capacities of the majorpathways of energy metabolism in the hindlimb mus-cles, we measured three enzymes that may limit flux inthese pathways: phosphofructokinase [PFK (glycoly-sis)], pyruvate dehydrogenase [PDH (mitochondrialpyruvate oxidation)], and carnitine palmitoyl trans-ferase [CPT (mitochondrial fatty acid oxidation)]. Wealso measured enzymes that deliver glucose to glycol-ysis, hexokinase (HK), and glycogen phosphorylase[both in the activated (GPa) and total forms (GPa �GPb)], as well as the terminal enzyme of anaerobicglycolysis, lactate dehydrogenase (LDH). Finally, wemeasured citrate synthase (CS) and cytochrome c oxi-dase (CCO) as markers of mitochondrial abundance,respectively, located in the matrix and inner mitochon-drial membrane. By measuring enzymes in a widerange of pathways, we sought to establish whetherputative modifications of muscle metabolic capacity
were generalized or whether they were pathway spe-cific. Previously, we presented overall comparisons ofmuscle metabolic capacity in relation to selection andwheel access (18). Here we examine variation in en-zyme activities in relation to the small-muscle poly-morphism.
METHODS
The selection experiment. Mice used in this study weresampled from generation 14 (2nd litters) of our artificialselection experiment for increased voluntary activity on run-ning wheels. Swallow et al. (29) provide full details of theselection experiment and only a brief overview will be givenhere.
The original progenitors for the selection experiment wereoutbred Hsd:ICR house mice (Mus domesticus) obtained fromHarlan Sprague Dawley, Indianapolis, IN. In each genera-tion, 10 pairs (families) of mice were used to propagate eachline, four selected for high wheel running and four randomlybred as control lines. The selection criterion was the totalnumber of revolutions run on days 5 and 6 of a 6-day periodwhen the mice had access to running wheels (beginning at5.5–8 wk of age): in the selected lines, the highest runningmale and female from each family were chosen as breeders.In the control lines, one male and one female from eachfamily were chosen randomly. The 10 males and 10 femalesfrom each line were paired randomly within the line, but nomatings occurred between siblings. Pups were weaned at 21days of age, weighed, and toe clipped for identification. Thepups were housed with three siblings until the following day,when they were housed individually with access to runningwheels that were either free to rotate or locked.
Animal husbandry. Routine housing was as described bySwallow et al. (31). In the selection experiment and for themice studied in this study, voluntary wheel running wasmeasured on Wahman-type activity wheels as described inSwallow et al. (31) and Houle-Leroy et al. (18).
Sampling strategy. We determined activities of muscleenzymes (CCO, CS, CPT, PDH HK, GP, PFK, and LDH) in 10mice per line with locked wheels (sedentary group) and in 10mice per line with access to free wheels (wheel access group).Within each family and sex, one individual was assigned to afree wheel (wheel access group) and one was assigned to alocked wheel (sedentary group). Therefore, each line (4 se-lected and 4 control) was represented by five wheel accessmales, five wheel access females, five sedentary males, andfive sedentary females. Within each line, one mouse in eachof the four subgroups came from the same family to obtain abalanced design. When, as occurred twice in the control lines,an individual died, the corresponding same-sex sibling (inthe opposite activity group) was omitted from analyses toretain a balanced design.
Muscle dissection, enzyme extraction, and assay. Mice werekilled by cervical dislocation to avoid effects of pharmaceuti-cals. Within �10 min of death, all the muscles of the lefthindlimb (except the triceps surae, which includes the lateraland medial heads of the gastrocnemius, soleus, and planta-ris) were weighed, frozen on dry ice, and placed at �80°C.The masses of the left and right triceps surae, which wereused for other experiments, were also recorded (see Ref. 12).The muscle samples were transported in liquid nitrogen toUniversite Laval for enzymatic determinations and measure-ments of protein concentrations as described in Houle-Leroyet al. (18). Enzyme activities and protein concentrations weremeasured in a pool of all hindlimb muscles, except the tricepssurae.
R434 MIGHTY MINI-MUSCLES IN ARTIFICIALLY SELECTED MICE
AJP-Regul Integr Comp Physiol • VOL 284 • FEBRUARY 2003 • www.ajpregu.org

Statistical analysis. The general linear models procedurein JMP (SAS Institute) was used to apply analysis of covari-ance (ANCOVA) models to our data. Inspection of graphs ofmuscle mass in relation to body mass revealed the presenceof individuals with extremely small muscles (see Fig. 1).These individuals only occurred in selected lines 3 and 6 butwere present in both mice with and without access to freelyrotating wheels and in both sexes. Our statistical analysisexamined whether this mini-muscle phenotype was respon-sible for the heterogeneity of muscle metabolic capacitiesapparent among the selected lines (18). Given that males andfemales differ in many traits, including wheel running, bodymass, and muscle enzyme activities (18, 19, 29, 31), weanalyzed them separately. We used two complementary ap-proaches.
First, we performed cross-nested two-way ANCOVAs totest the effects of line type (selected vs. control mice) andactivity group (sedentary vs. wheel access mice) on our 156experimental mice (see also Ref. 18) adding “mini” as a factorto code for mini- vs. regular-sized muscles. In these models,the main grouping factors, line type and activity group, wereconsidered fixed effects. Replicate line (n � 8 total), nestedwithin line type, was a random effect. Family, nested withinline, was also included as a random effect. In these mixedmodels (i.e., with both random and fixed effects), we testedthe effects over appropriate error terms as follows. Effects ofline type were tested over the mean squares of line, andeffects of line were tested over the mean squares of family.Effects of activity and the activity-line type interaction weretested over the mean squares of the line-activity interaction.Effects of mini were tested over the mean square of the errorterm. This analysis served to evaluate whether the occur-rence of the mini-muscle phenotype in two of the four selectedlines was responsible for the heterogeneity of muscle meta-bolic capacities among selected lines.
In models examining quantitative effects of wheel running(i.e., restricting analysis to mice with access to free wheels),we performed one-way ANCOVAs to test the effects of linetype. We included replicate line (nested within line type) as arandom effect and mini as a factor coding for muscle size.
Second, to examine specifically whether muscle metaboliccharacteristics differed between the normal and mini-musclephenotypes, we focused on the two selected lines (3 and 6) inwhich the mini-muscle phenotype occurred. We compared theproperties of the mice from these lines using mini, line,activity group, and family (nested within line) as factors; onesibling was sedentary, whereas the other had access to a freewheel.
Several covariates were used in all of the ANCOVA mod-els. Body mass, age, time of death, and z-transformed time ofdeath2 were included as covariates in all models of muscleand body masses, enzyme activities, and protein fractions.Because body mass differed among the selected lines, all theANCOVA models analyzing the enzyme activities, expressedboth in units per gram muscle and as total hindlimb con-tents, were tested with and without body mass as a covariate.In models of wheel running amounts, covariates used werebody mass, age, wheel freeness, and number of toes cut foridentification.
RESULTS
Body and hindlimb muscle masses. As expected,body mass and the mass of the hindlimb muscles westudied were positively correlated (Fig. 1). However,two distinct relationships were apparent: 141 of theexperimental mice were described by one relationship.A group of mice (7 females and 8 males) from twoselected lines showed a completely distinct relation-ship between body and hindlimb muscle mass (Fig. 1);13 of the 15 mice were from line 6 (7 males, 6 females),the other two were from line 3 (one male, one female).For a given range of body mass, mice from this mini-muscle group had masses of their hindlimb muscles (allmuscles except the triceps surae) that were approxi-mately one-half of those in the other group (240–376vs. 411–748 mg; Fig. 1A). When we included the massof the triceps surae to obtain the total hindlimb musclemass, the same individuals composed the mini-musclegroup. The total hindlimb muscle mass in the mini-
Fig. 1. Relationship between body mass and mass of left hindlimbmuscles [excluding (A) and including (B) triceps surae mass] for 156mice. Experimental design was balanced between control and se-lected mice as well as between sexes and activity states. Normal sizemuscled mice: r2 � 0.62 (A), r2 � 0.69 (B); mini-muscled mice: r2 �0.58 (A), r2 � 0.66 (B).
R435MIGHTY MINI-MUSCLES IN ARTIFICIALLY SELECTED MICE
AJP-Regul Integr Comp Physiol • VOL 284 • FEBRUARY 2003 • www.ajpregu.org

muscle group was 289–458 mg, whereas that of theother mice was 506–910 mg (Fig. 1B). Neither sex norwheel access appeared to affect expression of the mini-muscle phenotype. In line 6, of the seven males withmini-muscles, three had access to free wheels; of thesix females, three had access to free wheels. For themice with mini-muscles in line 3, the female had access
to a free wheel, whereas the male was sedentary.Means for each subgroup are reported in Table 1.
As suggested by our inspection of the data, for bothmale and female mice, the mass of the total hindlimbmuscles was significantly (P � 0.01) lower in mice withthe mini-muscle phenotype, for both ANCOVA models(Table 2). Exclusion of body mass as a covariate did not
Table 1. Body and hindlimb muscle masses for selected lines
Variable
Male Female
Line 3 Line 6
Line 7 Line 8
Line 3 Line 6
Line 7 Line 8Mini Normal Mini Normal Mini Normal Mini Normal
Body, gSedentary 32.0(1) 34.4�1.4(4) 29.6�1.3(4) 29.9(1) 30.8�1.1 32.2�0.7 ND 28.4�1 23.1�0.9(3) 26.1�0(2) 24.8�0.6 24.8�0.5Wheel
access ND 31.1�1.1 27.7�0.3(3) 32.6�1.6(2) 29.5�1.1 29.2�0.4 24.7(1) 26.8�0.6(4) 23.3�1.7(3) 25.3�0.8(2) 22.9�0.9 22.9�0.4Hindlimb
muscles,mg
Sedentary 376(1) 741�23(4) 359�6(4) 602(1) 595�26 643�20 ND 616�20 259�10(3) 564�19(2) 499�12 532�21Wheel
access ND 658�17 319�16(3) 655�36(2) 592�48 648�15 332(1) 622�18(4) 299�15(3) 482�19(2) 464�19 487�12
Values are means � SE. Sample size per cell was n � 5, except where it was indicated in parentheses. Hindlimb muscle mass excludes themass of the triceps surae. ND, no data available.
Table 2. Statistical effects (F test) from 2-way ANCOVAs for mini-muscle factor
Male Female
All individuals(n�78)
Line 3 and 6(n�20)
All individuals(n�78)
Line 3 and 6(n�20)
Body mass, g F1,27�0.97 F1,5�0.27 F1,27�0.70 F1,5�0.55Hindlimb muscle mass, mg
All covariates F1,26�27.07§ F1,4�424.51§ F1,26�53.10§ F1,4�36.84†Without body mass F1,27�27.18§ F1,5�135.59§ F1,27�40.0§ F1,5�34.11†
Enzyme activities, U/g muscleCCO F1,26�35.14§ F1,4�13.99* F1,26�16.81‡ F1,4�13.39*CS F1,26�29.83§ F1,4�24.34† F1,26�87.94§ F1,4�8.97*HK F1,26�19.68§ F1,4�27.26† F1,26�21.74§ F1,4�6.68CPT F1,26�5.66* F1,4�0.91 F1,26�14.19‡ F1,4�12.19*PDH F1,26�11.52† F1,4�2.32 F1,26�0.69 F1,4�0.18GPa F1,26�1.90 F1,4�4.03 F1,26�1.36 F1,4�1.71GPtot F1,26�2.09 F1,4�0.12 F1,26�0.01 F1,4�0.01PFK F1,26�0.79 F1,4�3.40 F1,25�12.68† F1,3�97.08†LDH F1,26�0.47 F1,4�1.43 F1,26�0.28 F1,4�0.48
Enzyme contents, UCCO F1,26�0.15 F1,4�0.001 F1,26�0.26 F1,4�1.59CS F1,26�0.16 F1,4�0.02 F1,26�0.07 F1,4�0.30HK F1,26�0.72 F1,4�0.02 F1,26�1.63 F1,4�5.90CPT F1,26�0.10 F1,4�0.06 F1,26�1.59 F1,4�1.87PDH F1,26�0.50 F1,4�0.01 F1,26�3.75 F1,4�3.11GPa F1,26�4.77* F1,4�51.58† F1,26�7.57* F1,4�8.94*GPtot F1,26�7.31* F1,4�2.43 F1,26�20.61§ F1,4�17.37*PFK F1,26�1.08 F1,4�0.38 F1,25�1.43 F1,3�174.63‡LDH F1,26�4.49* F1,4�22.69† F1,26�10.85† F1,4�11.32*
Protein concentrations, mg/g muscleSarcoplasmic F1,26�0.28 F1,4�0.49 F1,26�0.21 F1,4�2.10Myofibrillar F1,26�8.00† F1,4�2.63 F1,26�25.88§ F1,4�16.90*Total F1,26�4.22* F1,4�1.93 F1,26�6.58* F1,4�12.49*
Protein contents, mgSarcoplasmic F1,26�10.92† F1,4�66.65† F1,26�14.71‡ F1,4�91.65‡Myofibrillar F1,26�19.26‡ F1,4�54.24† F1,26�71.82§ F1,4�30.77†Total F1,26�23.42§ F1,4�93.96‡ F1,26�48.11§ F1,4�24.04†
Contents were expressed per hindlimb muscle mass (excluding triceps surae mass). Covariates used in these models were body mass, age,time of death, and (z-transformed time of death)2. *P � 0.05; †P � 0.01; ‡P � 0.001; §P � 0.0001. When F values are not followed by a symbol,the result was not statistically significant. See Fig. 2 for definitions.
R436 MIGHTY MINI-MUSCLES IN ARTIFICIALLY SELECTED MICE
AJP-Regul Integr Comp Physiol • VOL 284 • FEBRUARY 2003 • www.ajpregu.org
alter the statistical conclusions. The same results werefound for mass of the triceps surae alone (data notshown). Hindlimb muscle mass increased with bodymass for both the normal and mini-muscle mice (Fig.1). Nonetheless, body mass did not differ significantlybetween mice with mini and normal muscles (P � 0.05;Table 2). In females, some heterogeneity in body masswas apparent among replicate lines (F6,31 � 4.30; P �0.005), especially for the selected lines. Female micefrom line 3 were larger by almost 13% than females inthe other selected lines (Table 1).
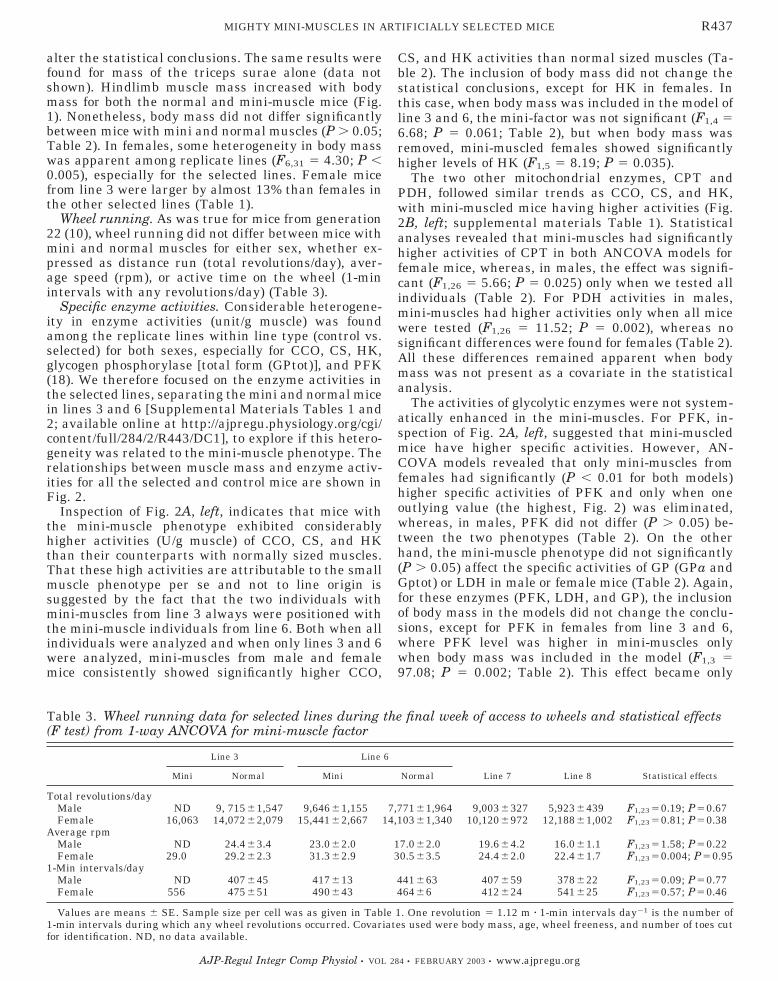
Wheel running. As was true for mice from generation22 (10), wheel running did not differ between mice withmini and normal muscles for either sex, whether ex-pressed as distance run (total revolutions/day), aver-age speed (rpm), or active time on the wheel (1-minintervals with any revolutions/day) (Table 3).
Specific enzyme activities. Considerable heterogene-ity in enzyme activities (unit/g muscle) was foundamong the replicate lines within line type (control vs.selected) for both sexes, especially for CCO, CS, HK,glycogen phosphorylase [total form (GPtot)], and PFK(18). We therefore focused on the enzyme activities inthe selected lines, separating the mini and normal micein lines 3 and 6 [Supplemental Materials Tables 1 and2; available online at http://ajpregu.physiology.org/cgi/content/full/284/2/R443/DC1], to explore if this hetero-geneity was related to the mini-muscle phenotype. Therelationships between muscle mass and enzyme activ-ities for all the selected and control mice are shown inFig. 2.
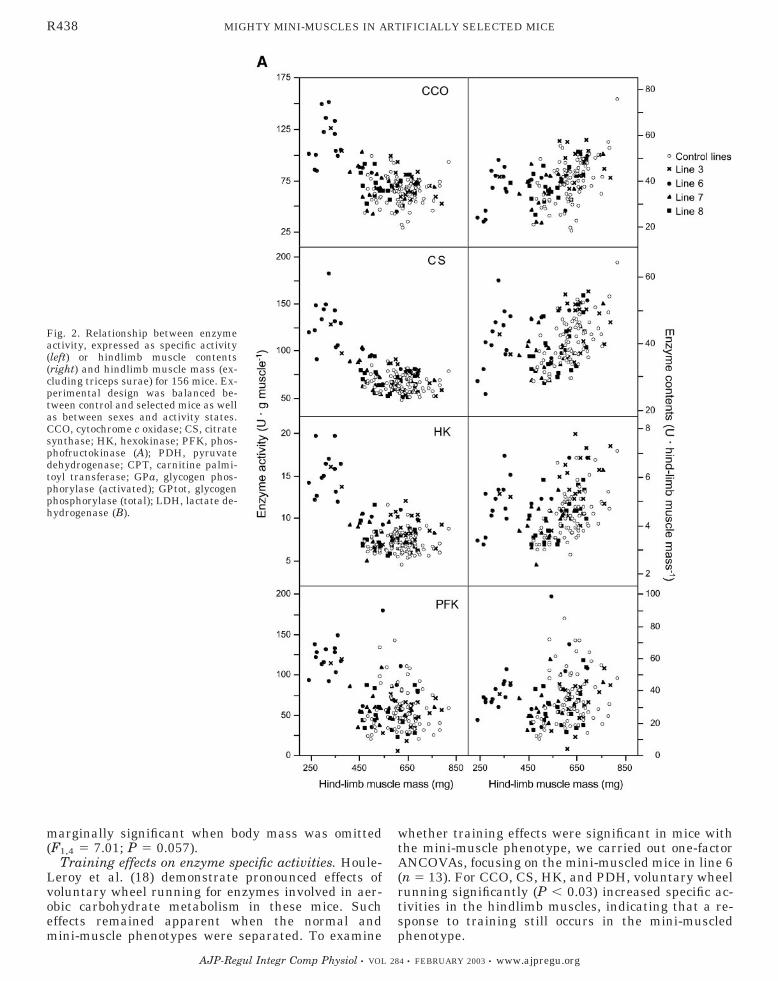
Inspection of Fig. 2A, left, indicates that mice withthe mini-muscle phenotype exhibited considerablyhigher activities (U/g muscle) of CCO, CS, and HKthan their counterparts with normally sized muscles.That these high activities are attributable to the smallmuscle phenotype per se and not to line origin issuggested by the fact that the two individuals withmini-muscles from line 3 always were positioned withthe mini-muscle individuals from line 6. Both when allindividuals were analyzed and when only lines 3 and 6were analyzed, mini-muscles from male and femalemice consistently showed significantly higher CCO,
CS, and HK activities than normal sized muscles (Ta-ble 2). The inclusion of body mass did not change thestatistical conclusions, except for HK in females. Inthis case, when body mass was included in the model ofline 3 and 6, the mini-factor was not significant (F1,4 �6.68; P � 0.061; Table 2), but when body mass wasremoved, mini-muscled females showed significantlyhigher levels of HK (F1,5 � 8.19; P � 0.035).
The two other mitochondrial enzymes, CPT andPDH, followed similar trends as CCO, CS, and HK,with mini-muscled mice having higher activities (Fig.2B, left; supplemental materials Table 1). Statisticalanalyses revealed that mini-muscles had significantlyhigher activities of CPT in both ANCOVA models forfemale mice, whereas, in males, the effect was signifi-cant (F1,26 � 5.66; P � 0.025) only when we tested allindividuals (Table 2). For PDH activities in males,mini-muscles had higher activities only when all micewere tested (F1,26 � 11.52; P � 0.002), whereas nosignificant differences were found for females (Table 2).All these differences remained apparent when bodymass was not present as a covariate in the statisticalanalysis.
The activities of glycolytic enzymes were not system-atically enhanced in the mini-muscles. For PFK, in-spection of Fig. 2A, left, suggested that mini-muscledmice have higher specific activities. However, AN-COVA models revealed that only mini-muscles fromfemales had significantly (P � 0.01 for both models)higher specific activities of PFK and only when oneoutlying value (the highest, Fig. 2) was eliminated,whereas, in males, PFK did not differ (P � 0.05) be-tween the two phenotypes (Table 2). On the otherhand, the mini-muscle phenotype did not significantly(P � 0.05) affect the specific activities of GP (GPa andGptot) or LDH in male or female mice (Table 2). Again,for these enzymes (PFK, LDH, and GP), the inclusionof body mass in the models did not change the conclu-sions, except for PFK in females from line 3 and 6,where PFK level was higher in mini-muscles onlywhen body mass was included in the model (F1,3 �97.08; P � 0.002; Table 2). This effect became only
Table 3. Wheel running data for selected lines during the final week of access to wheels and statistical effects(F test) from 1-way ANCOVA for mini-muscle factor
Line 3 Line 6
Line 7 Line 8 Statistical effectsMini Normal Mini Normal
Total revolutions/dayMale ND 9, 715�1,547 9,646�1,155 7,771�1,964 9,003�327 5,923�439 F1,23�0.19; P�0.67Female 16,063 14,072�2,079 15,441�2,667 14,103�1,340 10,120�972 12,188�1,002 F1,23�0.81; P�0.38
Average rpmMale ND 24.4�3.4 23.0�2.0 17.0�2.0 19.6�4.2 16.0�1.1 F1,23�1.58; P�0.22Female 29.0 29.2�2.3 31.3�2.9 30.5�3.5 24.4�2.0 22.4�1.7 F1,23�0.004; P�0.95
1-Min intervals/dayMale ND 407�45 417�13 441�63 407�59 378�22 F1,23�0.09; P�0.77Female 556 475�51 490�43 464�6 412�24 541�25 F1,23�0.57; P�0.46
Values are means � SE. Sample size per cell was as given in Table 1. One revolution � 1.12 m � 1-min intervals day�1 is the number of1-min intervals during which any wheel revolutions occurred. Covariates used were body mass, age, wheel freeness, and number of toes cutfor identification. ND, no data available.
R437MIGHTY MINI-MUSCLES IN ARTIFICIALLY SELECTED MICE
AJP-Regul Integr Comp Physiol • VOL 284 • FEBRUARY 2003 • www.ajpregu.org
marginally significant when body mass was omitted(F1,4 � 7.01; P � 0.057).
Training effects on enzyme specific activities. Houle-Leroy et al. (18) demonstrate pronounced effects ofvoluntary wheel running for enzymes involved in aer-obic carbohydrate metabolism in these mice. Sucheffects remained apparent when the normal andmini-muscle phenotypes were separated. To examine
whether training effects were significant in mice withthe mini-muscle phenotype, we carried out one-factorANCOVAs, focusing on the mini-muscled mice in line 6(n � 13). For CCO, CS, HK, and PDH, voluntary wheelrunning significantly (P � 0.03) increased specific ac-tivities in the hindlimb muscles, indicating that a re-sponse to training still occurs in the mini-muscledphenotype.
Fig. 2. Relationship between enzymeactivity, expressed as specific activity(left) or hindlimb muscle contents(right) and hindlimb muscle mass (ex-cluding triceps surae) for 156 mice. Ex-perimental design was balanced be-tween control and selected mice as wellas between sexes and activity states.CCO, cytochrome c oxidase; CS, citratesynthase; HK, hexokinase; PFK, phos-phofructokinase (A); PDH, pyruvatedehydrogenase; CPT, carnitine palmi-toyl transferase; GPa, glycogen phos-phorylase (activated); GPtot, glycogenphosphorylase (total); LDH, lactate de-hydrogenase (B).
R438 MIGHTY MINI-MUSCLES IN ARTIFICIALLY SELECTED MICE
AJP-Regul Integr Comp Physiol • VOL 284 • FEBRUARY 2003 • www.ajpregu.org

Total enzyme contents. The increased mass-specificactivities of the mitochondrial enzymes (especially CS,CCO, and CPT) and HK in the mini-muscles led thetotal contents of these enzymes to be similar to those inthe normal muscles (Fig. 2, A–B, right; SupplementalMaterials Table 2). This was true for both male andfemale mice. Thus the increase in the specific activityof the mitochondrial enzymes completely compensatedfor the decrease in muscle size. Whereas the specificactivities of PDH were not significantly increased in
mini-muscles, except in males, hindlimb muscle PDHcontents did not differ (P � 0.05) between mice withthe mini- and normal muscle phenotypes for either sex(Table 2).
The mice with the mini-muscle phenotype had thelowest contents of GPa, GPtot, and LDH (Fig. 2B,right). Again, the two mini-muscled individuals fromline 3 exhibited the same pattern as those from line 6.Statistical analyses confirmed the significance (P �0.05) of this pattern for both sexes using both ANCOVA
Fig. 2.—Continued
R439MIGHTY MINI-MUSCLES IN ARTIFICIALLY SELECTED MICE
AJP-Regul Integr Comp Physiol • VOL 284 • FEBRUARY 2003 • www.ajpregu.org
models, except that the GPtot contents did not differbetween mini- and normally muscled males in thecomparison of the mice in lines 3 and 6 (Table 2).
Generally, PFK was not affected by the mini-musclephenotype. However, when the ANCOVA focused onthe females in lines 3 and 6, PFK contents were higherin mini- than in normally sized muscles only when oneoutlying value was eliminated (F1,3 � 174.63; P �0.001; Table 2). Overall, for all enzyme contents, thesame statistical conclusions were obtained with andwithout body mass as a covariate in the models.
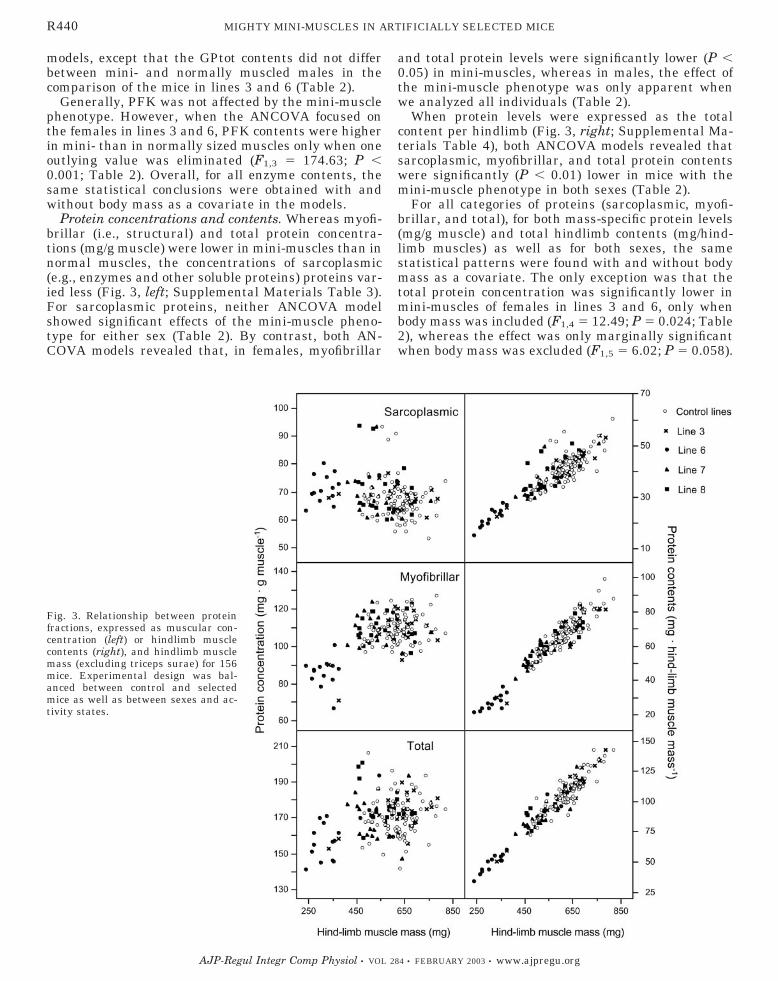
Protein concentrations and contents. Whereas myofi-brillar (i.e., structural) and total protein concentra-tions (mg/g muscle) were lower in mini-muscles than innormal muscles, the concentrations of sarcoplasmic(e.g., enzymes and other soluble proteins) proteins var-ied less (Fig. 3, left; Supplemental Materials Table 3).For sarcoplasmic proteins, neither ANCOVA modelshowed significant effects of the mini-muscle pheno-type for either sex (Table 2). By contrast, both AN-COVA models revealed that, in females, myofibrillar
and total protein levels were significantly lower (P �0.05) in mini-muscles, whereas in males, the effect ofthe mini-muscle phenotype was only apparent whenwe analyzed all individuals (Table 2).
When protein levels were expressed as the totalcontent per hindlimb (Fig. 3, right; Supplemental Ma-terials Table 4), both ANCOVA models revealed thatsarcoplasmic, myofibrillar, and total protein contentswere significantly (P � 0.01) lower in mice with themini-muscle phenotype in both sexes (Table 2).
For all categories of proteins (sarcoplasmic, myofi-brillar, and total), for both mass-specific protein levels(mg/g muscle) and total hindlimb contents (mg/hind-limb muscles) as well as for both sexes, the samestatistical patterns were found with and without bodymass as a covariate. The only exception was that thetotal protein concentration was significantly lower inmini-muscles of females in lines 3 and 6, only whenbody mass was included (F1,4 � 12.49; P � 0.024; Table2), whereas the effect was only marginally significantwhen body mass was excluded (F1,5 � 6.02; P � 0.058).
Fig. 3. Relationship between proteinfractions, expressed as muscular con-centration (left) or hindlimb musclecontents (right), and hindlimb musclemass (excluding triceps surae) for 156mice. Experimental design was bal-anced between control and selectedmice as well as between sexes and ac-tivity states.
R440 MIGHTY MINI-MUSCLES IN ARTIFICIALLY SELECTED MICE
AJP-Regul Integr Comp Physiol • VOL 284 • FEBRUARY 2003 • www.ajpregu.org
DISCUSSION
Replicated selection for high voluntary wheel run-ning in house mice led to marked heterogeneity amongthe four selected lines in total hindlimb muscle mass,in the mass of the triceps surae complex (12), and inmuscle metabolic capacities. In contrast, no statisti-cally significant heterogeneity in muscle mass andlittle heterogeneity in muscle metabolic capacitieswere observed among the four replicate random-bredcontrol lines (18). Comparison of the hindlimb musclesof the selected lines revealed that in one of the selectedlines (line 6), 13 of the 20 mice showed the significant,almost 50% reduction in mass typical of the mini-muscle phenotype, along with two mice from line 3(Fig. 1). The metabolic capacities of these mini-musclesdiffered markedly from those of normal muscles, par-ticularly with respect to the enzymes of glucose oxida-tion. The virtually twofold increases in the specificactivities (activity/g muscle) of these enzymes led theirtotal contents (activity/hindlimb muscles) to be equiv-alent in the mini- and normal muscles (Fig. 2).
During voluntary wheel running, the highest levelsof wheel running, expressed in revolutions run per dayand in mean rpm, were attained in the selected lines inwhich the mini-muscle phenotype occurred. However,individuals with mini- vs. normal-sized musclesshowed no significant difference in wheel running (Ta-ble 3). Thus mice with the mini-muscle phenotype ranas much as their counterparts with normal muscles, aswas true for mice from generation 22 (12). Body mass,a trait that has responded negatively to selection (31,32) and that was significantly lower in mini-muscledindividuals at generation 22 (12), was not affected bythe mini-muscle phenotype at generation 14. That thisphenotype is not dependent on wheel running for itsexpression was shown by its approximately equal oc-currence among wheel access and sedentary mice.
Within the selected lines, individuals with mini-muscles for both sexes showed the highest mass-spe-cific activities (U/g muscle) for mitochondrial (CCO,CS, and CPT) and glycolytic (HK) enzymes (Fig. 2). Infemale mice, the mini phenotype apparently increasedspecific activities of PFK (but see RESULTS), whereasspecific activities of PDH were elevated in mini-mus-cles only in males. The total contents of these enzymesin the hindlimb muscles were equivalent in the micewith mini- and normal muscles. On the other hand,mini-muscled mice had the lowest contents of LDH intheir hindlimb muscles (Fig. 2). The combination of thelower LDH contents and the 1.5- to 2-fold higher activ-ities (U/g muscle) of HK and PFK (in females) suggeststhat mini-muscles have an enhanced capacity for theoxidation of blood glucose. The reduced total contentsof GP (both in activated and total forms) in mini-muscles (except in the comparison of males in lines 3and 6) suggest sparing of muscle glycogen. Overall, theenzymatic “compensation” for the reduced muscle massin the mini-phenotype was limited to aerobic path-ways, a response that is similar to enzymatic adapta-tions to voluntary wheel running (18 and references
therein; 22, 26, 34) and to endurance training (17,referenced therein).
The increased frequency in the selected lines ofsmall, highly aerobic muscles suggests that a markedreduction in muscle size, coupled with maintenance ofaerobic capacity in the total hindlimb mass, facilitateshigh rates of aerobic activity (see also Ref. 12). Thecapacity for mechanical power development “lost” inthe reduction of hindlimb muscle mass was apparentlycounterbalanced by the increased mass-specific capac-ity for oxidative ATP generation. As the high activitiesof mitochondrial markers (CS and CCO) suggest anincreased mitochondrial abundance, the myofibrillarvolume fraction (i.e., contractile proteins) may be re-duced in these muscles, compounding the loss of con-tractile capacity caused by the reduction of overallmuscle mass. In fact, mice with the small-muscle phe-notype maintained similar concentrations of sarcoplas-mic proteins (mg/g muscle) in the hindlimb musclesrelative to the other selected mice but showed signifi-cantly reduced concentrations of structural (myofibril-lar) proteins (Fig. 3). Nonetheless, as for mice fromgeneration 22 (12), mice with mini-muscles ran asmuch as those with normally sized muscles.
Why did selection for voluntary wheel running notsimply favor increases in muscle oxidative capacity ascan be attained via training effects? Among selectedmice, only those with mini-muscles exhibit enhancedoxidative capacities, as is shown by the tight groupingof the oxidative enzyme levels of the control and se-lected mice with normally sized muscles (Fig. 2). Highmass-specific rates of sustained aerobic ATP produc-tion may be difficult to maintain in larger musclefibers, perhaps because of difficulties of substrate de-livery. Accordingly, we suggest that a reduction oflarge, fast-twitch glycolytic fibers in favor of fast-twitchoxidative fibers underlay the development of the mini-muscle phenotype. Muscles with smaller fibers arelikely to have greater contact between fibers and cap-illaries, facilitating delivery of blood glucose and oxy-gen during exercise. On the other hand, such a changein fiber-type distribution would compromise the capac-ity for power development. Training effects during vol-untary wheel running may lead to remodeling of fiberultrastructure, but these changes are not as extensiveas the postulated loss of large, fast-twitch glycolyticfibers. Possibly, skeletal muscle fibers may alwaysmaintain an oxidative “reserve” that can be added inresponse to training. Exploitation of this reserve mayonly be possible on a temporary basis for a given fibertype, making it difficult for selection to lead to higheroxidative capacities while maintaining a given profileof fiber types in a muscle. The cost of maintenance ofmitochondrial membrane potential with its concomi-tant generation of reactive oxygen species may accountfor this response.
In designing our experiment, we measured enzymesas representatives of metabolic pathways and mito-chondrial markers not as indicators of flux throughthese pathways. Effectively, nonequilibrium enzymessuch as HK, PFK, and GP only work near their maxi-
R441MIGHTY MINI-MUSCLES IN ARTIFICIALLY SELECTED MICE
AJP-Regul Integr Comp Physiol • VOL 284 • FEBRUARY 2003 • www.ajpregu.org

mal capacities (and reflect maximal pathway flux) inso-called high-flux muscles, such as found in bees,hummingbirds, and hagfish tongue (28). The charac-teristics that allow some systems to exploit their enzy-matic capacities more fully than others are unknown.Clearly, the marked training response elicited by vol-untary wheel running in rodents (18, 22, 26, 34) indi-cates that a high aerobic capacity is favorable for thesustained wheel running they voluntarily carry out.However, in our experiment, selection for high wheelrunning primarily increased muscle aerobic capacityby favoring the mini-muscle phenotype. Although wedo not know whether the mini-muscles function ashigh-flux muscles, the marked shift in metabolic capac-ities between these muscles and the normal phenotypesuggests such a difference. Thus voluntary wheel run-ning by normal-muscled mice may be limited by thedifficulty of shifting from a normal flux mode to a highflux mode. This difficulty is at least partially overcomeby the training response that increases muscle aerobiccapacity (18). Interestingly, even the mice with themini-muscle phenotype showed a training response tovoluntary wheel running. If the mini-muscle pheno-type is so advantageous during selection for voluntarywheel running, then why is it not present in all se-lected lines? Presumably, the other selected lines lostthe rare allele either at founding or, more likely, sub-sequently via random genetic drift (12).
In summary, our results demonstrate that selec-tion for a behavioral trait can engender a variety ofadaptive changes among subordinate traits that sup-port the behavior. Considering the four selectedlines, selective breeding for high wheel runningshowed only a weak tendency to enhance muscleaerobic capacity (18). However, in two lines (lines 3and 6), selection has resulted in a high frequency(�50% at generation 22; 12) of a small hindlimbmuscle phenotype that exhibits an enhanced mass-specific aerobic capacity. The increase in mass-spe-cific aerobic capacity in these mini-muscles almostcompletely counteracts the reduction in capacitycaused by the “loss” of mass. Individuals with mini-muscles run at the same intensity as their counter-parts with normal-sized muscles. The observed het-erogeneity of the response in muscle mass andaerobic capacity to selection suggests that wild ani-mals exhibiting high rates of aerobic activity mayvary in the underlying morphological, physiological,and biochemical traits that permit high activity.
We thank P. Koteja for help with dissections.This work was supported by National Science Foundation Grants
IBN-9728434 and IBN-0212567 to T. Garland and by an operatinggrant from National Sciences and Engineering Research Council(Canada) to H. Guderley. P. Houle-Leroy was supported by a schol-arship from FCAR (Quebec).
REFERENCES
1. Bell G. Selection: The Mechanism of Evolution. New York: Chap-man & Hall, 1997 .
2. Britton SL and Koch LG. Animal genetic models for complextraits of physical capacity. Exerc Sport Sci Rev 29: 7–14, 2000.
3. Bult A and Lynch CB. Multiple selection responses in housemice bidirectionally selected for thermoregulatory nest-buildingbehavior: crosses of replicate lines. Behav Genet 26: 439–446, 1996.
4. Dumke CL, Rhodes JS, Garland T Jr, Maslowski E, Swal-low JG, Wetter AC, and Cartee GD. Genetic selection of micefor high voluntary wheel running: effect on skeletal muscleglucose uptake. J Appl Physiol 91: 1289–1297, 2001.
5. Eisen EJ and Pomp D. Replicate differences in lines of miceselected for body composition. Genome 33: 294–301, 1990.
6. Falconer DS, Gauld IK, and Roberts RC. Cell numbers andcell sizes in organs of mice selected for large and small body size.Genet Res 31: 287–301, 1978.
7. Falconer DS and Mackay TFC. Introduction to QuantitativeGenetics (4th ed.). Essex, UK: Longman, 1996.
8. Feder ME, Bennett AF, and Huey RB. Evolutionary physiol-ogy. Ann Rev Ecol System 31: 315–341, 2000.
9. Garland T Jr. Phylogenetic comparison and artificial selection:two approaches in evolutionary physiology. In: Hypoxia: FromGenes to the Bedside, edited by Roach RC, Wagner PD, andHackett PH. New York: Plenum/Kluwer, 2001, p. 107–132.
10. Garland T Jr. Selection experiments: an underutilized tool inbiomechanics and organismal biology. In: Vertebrate Biomechan-ics and Evolution, edited by Bels VL, Gasc J-P, and Casinos A.Oxford, UK: Bios Scientific, 2003, p. 23–56.
11. Garland T Jr and Carter PA. Evolutionary physiology. AnnuRev Physiol 56: 579–621, 1994.
12. Garland T Jr, Morgan MT, Swallow JG, Rhodes JS, GirardI, Belter JG, and Carter PA. Evolution of a small-musclepolymorphism in lines of house mice selected for high activitylevels. Evolution 56: 1267–1275, 2002.
13. Gibbs AG. Laboratory selection for the comparative physiolo-gist. J Exp Biol 202: 2709–2718, 1999.
14. Girard I, McAleer MW, Rhodes JS, and Garland T Jr.Selection for high voluntary wheel running increases intermit-tency in house mice (Mus domesticus). J Exp Biol 204: 4311–4320, 2001.
15. Gromko MH. Unpredictability of correlated responses to selec-tion: pleiotropy and sampling interact. Evolution 49: 685–693,1995.
16. Hastings IM and Hill WG. Analysis of lines of mice selected forfat content. 2. Correlated responses in the activities of enzymesinvolved in lipogenesis. Genet Res 55: 55–61, 1990.
17. Holloszy JO and Coyle EF. Adaptations of skeletal muscle toendurance exercise and their metabolic consequences. J ApplPhysiol 56: 831–838, 1984.
18. Houle-Leroy P, Garland T Jr, Swallow JG, and GuderleyH. Effects of voluntary activity and genetic selection on musclemetabolic capacities in house mice, Mus domesticus. J ApplPhysiol 89: 1608–1616, 2000.
19. Koteja P, Swallow JG, Carter PA, and Garland T Jr. En-ergy cost of wheel running in house mice: implications for coad-aptation of locomotion and energy budgets. Physiol Biochem Zool72: 238–249, 1999.
20. Pollock ML, Gettman LR, Jackson A, Ayres J, Ward A, andLinnerud AC. Body composition of elite class distance runners.Ann NY Acad Sci 301: 361–370, 1977.
21. Robertson A. Selection Experiments in Laboratory and Domes-tic Animals. Slough, UK: Commonwealth Agricultural Bureau,Farnam Royal, 1980.
22. Rodnick KJ, Reaven GM, Haskell WL, Sims CR, and Mon-don CE. Variations in running activity and enzymatic adapta-tions in voluntary running rats. J Appl Physiol 66: 1250–1257, 1989.
23. Roff DA. Evolutionary Quantitative Genetics. New York: Chap-man & Hall, 1997.
24. Rome LC and Lindstedt SL. Mechanical and metabolic designof the muscular system in vertebrates. In: Handbook of Physiol-ogy. Comparative Physiology. Bethesda, MD: Am Physiol Soc,sect. 13, vol. 11, p. 1587–1651, 1997.
25. Rutledge JJ, Eisen EJ, and Legates JE. Correlated re-sponses in skeletal traits and replicate variation in selected linesof mice. Theor Appl Genet 45: 26–31, 1974.
26. Sexton WL. Vascular adaptations in rat hindlimb skeletal mus-cle after voluntary running-wheel exercise. J Appl Physiol 79:287–295, 1995.
R442 MIGHTY MINI-MUSCLES IN ARTIFICIALLY SELECTED MICE
AJP-Regul Integr Comp Physiol • VOL 284 • FEBRUARY 2003 • www.ajpregu.org
27. Stickland NC and Dwyer CM. The pre-natal influence onpost-natal muscle growth. In: Molecular Physiology of Growth.Cambridge: Cambridge Univ. Press, 1996, p. 135–150.
28. Suarez RK, Staples JF, Lighton JRB, and West TG. Rela-tionships between enzymatic flux capacities and metabolic fluxrates: nonequilibrium reactions in muscle glycolysis. Proc NatlAcad Sci USA 94: 7065–7069, 1997.
29. Swallow JG, Carter PA, and Garland T Jr. Artificial selec-tion for increased wheel-running behavior in house mice. BehavGenet 28: 27–237, 1998.
30. Swallow JG, Garland T Jr, Carter PA, Zhan WZ, and SieckGC. Effects of voluntary activity and genetic selection on aerobiccapacity in house mice (Mus domesticus). J Appl Physiol 84:69–76, 1998.
31. Swallow JG, Koteja P, Carter PA, and Garland T Jr. Arti-ficial selection for increased wheel-running activity in housemice results in decreased body mass at maturity. J Exp Biol 202:2513–2520, 1999.
32. Swallow JG, Koteja P, Carter PA, and Garland T Jr.Food consumption and body composition in mice selected forhigh wheel-running activity. J Comp Physiol [B] 171: 651–659, 2001.
33. Travisano M and Lenski RE. Long-term experimental evolu-tion in Escherichia coli: IV. Targets of selection and the specific-ity of adaptation. Genetics 143: 15–26, 1996.
34. Zhan WZ, Swallow JG, Garland T Jr, Proctor DN, CarterPA, and Sieck GC. Effects of genetic selection and voluntaryactivity on the medial gastrocnemius muscle in house mice.J Appl Physiol 85: 2326–2333, 1999.
R443MIGHTY MINI-MUSCLES IN ARTIFICIALLY SELECTED MICE
AJP-Regul Integr Comp Physiol • VOL 284 • FEBRUARY 2003 • www.ajpregu.org

Supplemental Materials (for Web site) Table 1. Enzyme activities of hind-limb muscles (U · g muscle-1) for selected lines
Male Female Enzymes Line 3 Line 6 Line 7 Line 8 Line 3 Line 6 Line 7 Line 8
Mini Normal Mini Normal Mini Normal Mini Normal CCO Sedentary 104.1 61.2 ± 3.5 107 ± 5 45.4 69.5 ± 3.9 61.6 ± 3.6 N.D. 62.9 ± 2.7 90.2 ± 5.4 66.1 ± 1.2 56.3 ± 5.0 66.7 ± 1.8 Wheel access N.D. 80.7 ± 1.4 140 ± 5 74.1 ± 0.2 76.8 ± 6.8 73.9 ± 1.9 126.5 84.5 ± 7.8 125 ± 14 85.4 ± 2.7 81.3 ± 5.1 78.4 ± 7.2 CS Sedentary 98.2 59.5 ± 2.9 118 ± 7 63.4 60.9 ± 2.3 57.2 ± 4.1 N.D. 60.7 ± 3.1 111 ± 10 64.5 ± 0.8 67.8 ± 3.7 61.7 ± 3.3 Wheel access N.D. 80.4 ± 3.0 142 ± 5 79.0 ±2.1 77.2 ± 8.2 73.0 ± 3.1 128.9 82.7 ± 2.5 159 ± 12 99.0 ± 3.5 87.7 ± 3.2 79.0 ± 4.4 CPT Sedentary 0.60 0.44 ± 0.07 0.85 ± 0.16 0.20 0.48 ± 0.07 0.45 ± 0.05 N.D. 0.51 ± 0.06 0.69 ± 0.14 0.45 ± 0.07 0.43 ± 0.07 0.41 ± 0.07 Wheel access N.D. 0.62 ± 0.08 1.15 ± 0.10 0.73 ± 0.08 0.74 ± 0.10 0.65 ± 0.03 1.12 0.57 ± 0.07 0.73 ± 0.11 0.65 ± 0.33 0.70 ± 0.05 0.51 ± 0.09 PDH Sedentary 5.5 4.0 ± 0.4 5.1 ± 0.3 3.3 3.6 ± 0.4 4.0 ± 0.1 N.D. 4.0 ± 0.3 4.9 ± 0.7 3.4 ± 0.3 4.3 ± 0.6 4.1 ± 0.4 Wheel access N.D. 5.1 ± 0.1 5.6 ± 0.8 3.7 ± 1.5 4.7 ± 0.3 4.9 ± 0.2 5.9 5.6 ± 0.5 6.3 ± 0.4 6.6 ± 0.4 5.2 ± 0.2 5.3 ± 0.8 HK Sedentary 13.8 7.9 ± 0.6 14.3 ± 1.0 8.4 7.4 ± 0.3 6.5 ± 0.2 N.D. 7.4 ± 0.5 13.0 ± 0.6 8.6 ± 0.7 6.4 ± 0.4 6.6 ± 0.3 Wheel access N.D. 10.7 ± 0.4 17.0 ± 1.5 10.4 ± 0.6 8.6 ± 0.6 8.2 ± 0.2 16.1 9.3 ± 0.6 17.3 ± 1.3 10.4 ± 0.2 9.1 ± 0.3 8.9 ± 0.8 GPa Sedentary 36.3 60.3 ± 9.3 39.8 ± 3.8 48.9 49.7 ± 3.1 48.3 ± 3.9 N.D. 62.5 ± 4.2 44.4 ± 8.2 67.2 ± 8.7 50.6 ± 4.3 53.7 ± 4.7 Wheel access N.D. 51.7 ± 6.2 41.0 ± 5.4 64.9 ± 2.8 47.0 ± 3.7 44.8 ± 4.5 42.1 40.7 ± 11.8 48.3 ± 6.7 39.0 ± 3.1 41.3 ± 2.5 45.5 ± 2.9 GP tot Sedentary 128 139 ± 19 119 ± 18 135 103 ± 8 115 ± 2 N.D. 145 ± 7 122 ± 3 137 ± 13 122 ± 6 118 ± 3 Wheel access N.D. 122 ± 8 118 ± 2 149 ± 11 103 ± 8 115 ± 6 108 103 ± 9 108 ± 8 99.2 ± 5.6 101 ± 3 111 ± 2 PFK Sedentary 120 53.4 ± 7.5 124 ± 10 87.0 69 ± 11 44.6 ± 9.5 N.D. 48.4 ± 5.9 120 ± 14 125 ± 55 55.6 ± 6.4 46.9 ± 4.8 Wheel access N.D. 62.7 ± 3.7 126 ± 6 95 ± 16 61.0 ± 6.8 53 ± 10 114 34.0 ± 15.4 110 ± 9 49 ± 13 55.7 ± 8.5 62 ± 10 LDH Sedentary 815 1019 ± 68 871 ± 80 814 958 ± 41 963 ± 80 N.D. 1152 ± 104 850 ± 65 996 ± 52 1 072 ± 31 975 ± 59 Wheel access N.D. 952 ± 56 813 ± 39 1214 ± 46 931 ± 54 1 101 ± 44 1043 868 ± 38 882 ± 79 881 ± 67 976 ± 39 1 002 ± 8 Values are means ± SE. The sample size per cell was as given in Table 1. N.D: no data available.
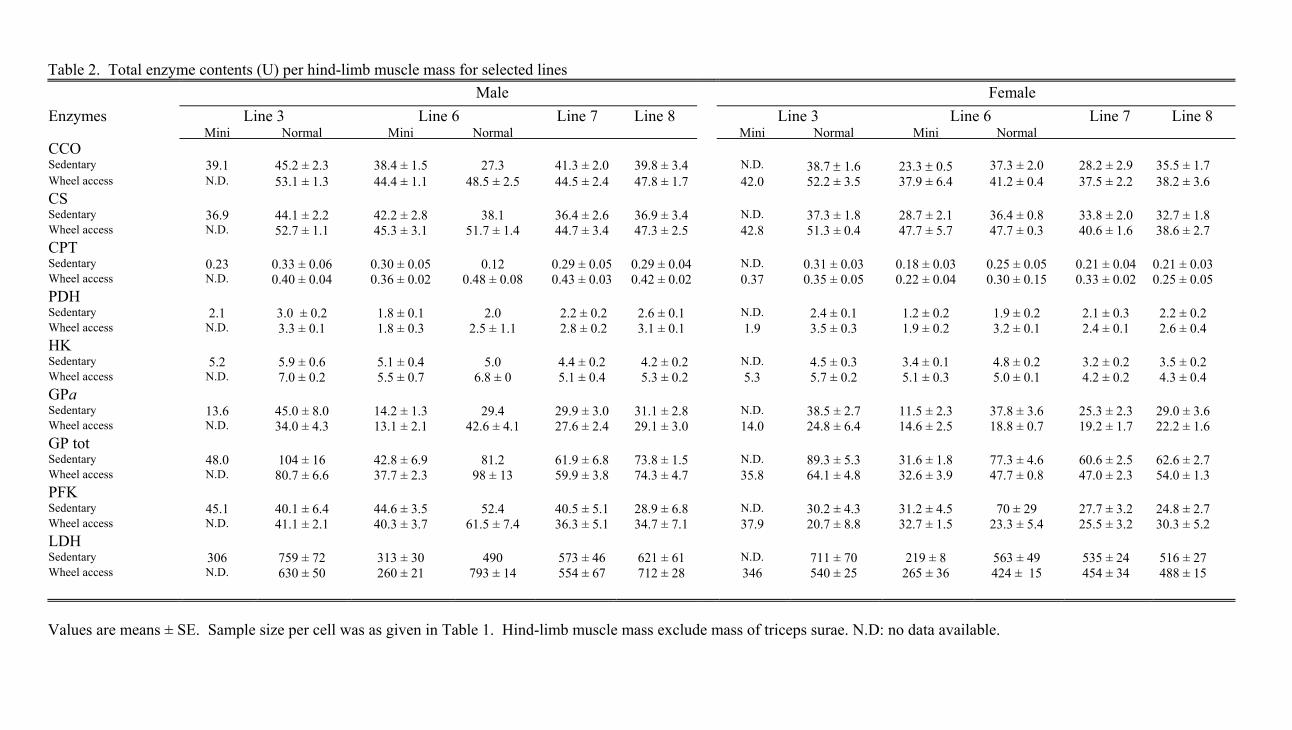
Table 2. Total enzyme contents (U) per hind-limb muscle mass for selected lines Male Female
Enzymes Line 3 Line 6 Line 7 Line 8 Line 3 Line 6 Line 7 Line 8 Mini Normal Mini Normal Mini Normal Mini Normal
CCO Sedentary 39.1 45.2 ± 2.3 38.4 ± 1.5 27.3 41.3 ± 2.0 39.8 ± 3.4 N.D. 38.7 ± 1.6 23.3 ± 0.5 37.3 ± 2.0 28.2 ± 2.9 35.5 ± 1.7 Wheel access N.D. 53.1 ± 1.3 44.4 ± 1.1 48.5 ± 2.5 44.5 ± 2.4 47.8 ± 1.7 42.0 52.2 ± 3.5 37.9 ± 6.4 41.2 ± 0.4 37.5 ± 2.2 38.2 ± 3.6 CS Sedentary 36.9 44.1 ± 2.2 42.2 ± 2.8 38.1 36.4 ± 2.6 36.9 ± 3.4 N.D. 37.3 ± 1.8 28.7 ± 2.1 36.4 ± 0.8 33.8 ± 2.0 32.7 ± 1.8 Wheel access N.D. 52.7 ± 1.1 45.3 ± 3.1 51.7 ± 1.4 44.7 ± 3.4 47.3 ± 2.5 42.8 51.3 ± 0.4 47.7 ± 5.7 47.7 ± 0.3 40.6 ± 1.6 38.6 ± 2.7 CPT Sedentary 0.23 0.33 ± 0.06 0.30 ± 0.05 0.12 0.29 ± 0.05 0.29 ± 0.04 N.D. 0.31 ± 0.03 0.18 ± 0.03 0.25 ± 0.05 0.21 ± 0.04 0.21 ± 0.03 Wheel access N.D. 0.40 ± 0.04 0.36 ± 0.02 0.48 ± 0.08 0.43 ± 0.03 0.42 ± 0.02 0.37 0.35 ± 0.05 0.22 ± 0.04 0.30 ± 0.15 0.33 ± 0.02 0.25 ± 0.05 PDH Sedentary 2.1 3.0 ± 0.2 1.8 ± 0.1 2.0 2.2 ± 0.2 2.6 ± 0.1 N.D. 2.4 ± 0.1 1.2 ± 0.2 1.9 ± 0.2 2.1 ± 0.3 2.2 ± 0.2 Wheel access N.D. 3.3 ± 0.1 1.8 ± 0.3 2.5 ± 1.1 2.8 ± 0.2 3.1 ± 0.1 1.9 3.5 ± 0.3 1.9 ± 0.2 3.2 ± 0.1 2.4 ± 0.1 2.6 ± 0.4 HK Sedentary 5.2 5.9 ± 0.6 5.1 ± 0.4 5.0 4.4 ± 0.2 4.2 ± 0.2 N.D. 4.5 ± 0.3 3.4 ± 0.1 4.8 ± 0.2 3.2 ± 0.2 3.5 ± 0.2 Wheel access N.D. 7.0 ± 0.2 5.5 ± 0.7 6.8 ± 0 5.1 ± 0.4 5.3 ± 0.2 5.3 5.7 ± 0.2 5.1 ± 0.3 5.0 ± 0.1 4.2 ± 0.2 4.3 ± 0.4 GPa Sedentary 13.6 45.0 ± 8.0 14.2 ± 1.3 29.4 29.9 ± 3.0 31.1 ± 2.8 N.D. 38.5 ± 2.7 11.5 ± 2.3 37.8 ± 3.6 25.3 ± 2.3 29.0 ± 3.6 Wheel access N.D. 34.0 ± 4.3 13.1 ± 2.1 42.6 ± 4.1 27.6 ± 2.4 29.1 ± 3.0 14.0 24.8 ± 6.4 14.6 ± 2.5 18.8 ± 0.7 19.2 ± 1.7 22.2 ± 1.6 GP tot Sedentary 48.0 104 ± 16 42.8 ± 6.9 81.2 61.9 ± 6.8 73.8 ± 1.5 N.D. 89.3 ± 5.3 31.6 ± 1.8 77.3 ± 4.6 60.6 ± 2.5 62.6 ± 2.7 Wheel access N.D. 80.7 ± 6.6 37.7 ± 2.3 98 ± 13 59.9 ± 3.8 74.3 ± 4.7 35.8 64.1 ± 4.8 32.6 ± 3.9 47.7 ± 0.8 47.0 ± 2.3 54.0 ± 1.3 PFK Sedentary 45.1 40.1 ± 6.4 44.6 ± 3.5 52.4 40.5 ± 5.1 28.9 ± 6.8 N.D. 30.2 ± 4.3 31.2 ± 4.5 70 ± 29 27.7 ± 3.2 24.8 ± 2.7 Wheel access N.D. 41.1 ± 2.1 40.3 ± 3.7 61.5 ± 7.4 36.3 ± 5.1 34.7 ± 7.1 37.9 20.7 ± 8.8 32.7 ± 1.5 23.3 ± 5.4 25.5 ± 3.2 30.3 ± 5.2 LDH Sedentary 306 759 ± 72 313 ± 30 490 573 ± 46 621 ± 61 N.D. 711 ± 70 219 ± 8 563 ± 49 535 ± 24 516 ± 27 Wheel access N.D. 630 ± 50 260 ± 21 793 ± 14 554 ± 67 712 ± 28 346 540 ± 25 265 ± 36 424 ± 15 454 ± 34 488 ± 15
Values are means ± SE. Sample size per cell was as given in Table 1. Hind-limb muscle mass exclude mass of triceps surae. N.D: no data available.

Table 3. Protein concentrations of hind-limb muscles (mg · g muscle-1) for selected lines Male Female
Protein fractions Line 3 Line 6 Line 7 Line 8 Line 3 Line 6 Line 7 Line 8 Mini Normal Mini Normal Mini Normal Mini Normal
Sarcoplasmic Sedentary 69.3 66.2 ± 2.1 71.0 ± 2.7 62.6 63.8 ± 1.7 66.8 ± 3.1 N.D. 71.8 ± 1.3 67.6 ± 2.0 72.1 ± 4.1 72.7 ± 5.3 72.1 ± 5.7 Wheel access N.D. 67.1 ± 1.0 72.9 ± 3.9 71.7 ± 2.2 67.6 ± 0.8 66.0 ± 1.8 67.9 70.3 ± 2.5 74.1 ± 1.8 70.8 ± 4.4 68.8 ± 2.4 74.7 ± 4.7
Myofibrillar Sedentary 71.2 109 ± 2 84.3 ± 7.1 118 106 ± 3 108 ± 4 N.D. 107 ± 4 86.7 ± 2.0 108 ± 1 114 ± 4 111 ± 2 Wheel access N.D. 109 ± 4 87.6 ± 1.7 108 ± 6 107 ± 3 114 ± 4 90.3 114 ± 3 85.3 ± 3.6 104 ± 3 108 ± 3 109 ± 3
Total Sedentary 158.1 176 ± 2 153 ± 4 160 172 ± 9 171 ± 1 N.D. 169 ± 6 149 ± 4 184 ± 10 168 ± 4 176 ± 4 Wheel access N.D. 176 ± 3 165 ± 4 176 ± 9 168 ± 4 174 ± 2 153 179 ± 2 159 ± 8 172 ± 2 172 ± 5 180 ± 8
Values are means ± SE. Sample size per cell was as given in Table 1. N.D: no data available.

Table 4. Protein contents (mg) per hind-limb muscle mass for selected lines Male Female
Protein fractions Line 3 Line 6 Line 7 Line 8 Line 3 Line 6 Line 7 Line 8 Mini Normal Mini Normal Mini Normal Mini Normal
Sarcoplasmic Sedentary 26.1 49.1 ± 2.6 25.5 ± 1.2 37.7 37.9 ± 1.9 43.0 ± 2.8 N.D. 44.2 ± 0.8 17.5 ± 1.2 40.6 ± 0.9 36.5 ± 3.5 38.0 ± 1.9 Wheel access N.D. 44.2 ± 1.2 23.3 ± 1.7 46.9 ± 1.1 40.1 ± 3.2 42.8 ± 1.8 22.5 43.6 ± 0.4 22.1 ± 1.2 34.2 ± 3.5 31.8 ± 0.9 36.5 ± 3.0
Myofibrillar Sedentary 26.8 80.5 ± 1.4 30.3 ± 2.7 71.0 62.7 ± 2.6 69.4 ± 1.4 N.D. 65.8 ± 3.1 22.4 ± 0.7 60.8 ± 1.4 56.8 ± 2.4 59.1 ± 2.1 Wheel access N.D. 71.9 ± 4.3 28.0 ± 1.6 70.7 ± 0 63.4 ± 5.9 73.9 ± 3.5 30.0 70.7 ± 1.9 25.5 ± 1.9 50.3 ± 0.8 50.3 ± 2.6 53.2 ± 2.5
Total Sedentary 59.4 131 ± 5 54.8 ± 2.3 96.1 102 ± 8 110 ± 3 N.D. 104 ± 5 38.8 ± 2.5 104 ± 2 83.7 ± 3.1 93.5 ± 2.8 Wheel access N.D. 116 ± 4 52.4 ± 1.3 115 ± 1 99.6 ± 9.3 112 ± 2 50.8 112 ± 4 47.7 ± 3.9 83.1 ± 4.5 79.7 ± 2.0 87.5 ± 3.1
Values are means ± SE. Sample size per cell was a given in Table 1. Hind-limb muscle mass exclude mass of