Comparative Hourly Scheduling of Centralized and Distributed Storage in Day-Ahead Markets
9
This article has been accepted for inclusion in a future issue of this journal. Content is final as presented, with the exception of pagination. Comparative Hourly Scheduling of Centralized and Distributed Storage in Day-Ahead Markets Masood Parvania, Member, IEEE, Mahmud Fotuhi-Firuzabad, Fellow, IEEE, and Mohammad Shahidehpour, Fellow, IEEE Abstract—Electric energy storage (EES) installations in power systems are migrating from large centralized systems to more distributed installations for microgrid applications. This trend signifies modular EES installations for the local control of buildings and processes. A centralized EES system is often dispatched by grid operators for increasing the overall efficiency and enhancing the security of power systems. The distributed EES (DEES) is locally managed by aggregators to maximize the local impact of EES, before the aggregators’ adjusted load profiles are submitted to grid operators for the day-ahead scheduling. In this paper, we present and analyze two models for the hourly scheduling of centralized and distributed EES systems in day-ahead electricity markets. The proposed models take into account specific characteristics and inter- temporal constraints of EES systems in transmission-constrained power systems. The proposed models are applied to a 6-bus system and the IEEE-RTS, and the results are presented to compare impacts of utilizing the two EES models on system operations and quantify operation benefits of EES in power systems. Index Terms—Day-ahead electricity market, distributed energy systems, electric energy storage (EES) systems, load aggregators. NOMENCLATURE A. Indices Index of generating units. Index of transmission lines. Index of time. Index of bus. Index of electric energy storage (EES) systems. EES systems representation including DT for distributed EES and CT for centralized EES. B. Sets Set of generating units. Set of scheduling hours. Set of buses. Set of generating units connected to bus . Set of transmission lines connected to bus . Set of EES systems connected to bus . C. Constants Number of segments of piecewise linear cost function of generating unit . Slope of segment of cost function of unit at . Minimum production cost of unit . Lower/upper limit on power generation of unit . Startup/shutdown cost of unit . Ramp-up/down limit of unit (MW/min). Minimum ON/OFF time of unit . Startup ramp of unit (MW/min). Shutdown ramp of unit (MW/min). Maximum capacity of line . Reactance of line . Initial energy stored in EES system . Minimum energy stored in EES system at time . Maximum energy stored in EES system at time . Power rating of EES system . Load demand of bus at time . Maximum hourly load demand allowed at bus . Spinning reserve requirement of system at time . Charge efficiency of EES facility of participant . Discharge efficiency of EES facility of participant . D. Binary Decision Variables Commitment state of unit at time . 0/1 for charge/discharge of EES system at time . E. Continuous Decision Variables Startup cost of unit at time . Shutdown cost of unit at time . Real power scheduled for unit at time . Real power scheduled for unit in segment at time . Real power flow of line at time . Voltage angle of sending-end bus of line at time . Voltage angle of receiving-end bus of line at time . Adjusted load demand of bus at time . Energy stored in EES system at time . Charge/discharge power of EES system at time . I. INTRODUCTION E LECTRIC energy storage (EES) systems represent a fun- damental component of smart grid for enhancing power system reliability, sustainability, and energy efficiency [1], [2]. The Electric Power Research Institute (EPRI)’s energy storage Manuscript received April 20, 2013; revised August 21, 2013 and November 27, 2013; accepted January 12, 2014. M. Parvania is with the Department of Electrical and Computer Engi- neering, University of California, Davis, CA 95616 USA (e-mail: mparvania@ ucdavis.edu). M. Fotuhi-Firuzabad is with the Center of Excellence in Power System Control and Management, Electrical Engineering Department, Sharif University of Technology, Tehran, Iran 11365-9363 (e-mail: fotuhi@sharif. edu). M. Shahidehpour is with the Galvin Center for Electricity Innovation, Illinois Institute of Technology, Chicago, IL 60616 USA (e-mail: [email protected]). Color versions of one or more of the figures in this paper are available online at http://ieeexplore.ieee.org. Digital Object Identifier 10.1109/TSTE.2014.2300864 IEEE TRANSACTIONS ON SUSTAINABLE ENERGY 1 1949-3029 © 2014 IEEE. Personal use is permitted, but republication/redistribution requires IEEE permission. See http://www.ieee.org/publications_standards/publications/rights/index.html for more information.
-
Upload
independent -
Category
Documents
-
view
0 -
download
0
Transcript of Comparative Hourly Scheduling of Centralized and Distributed Storage in Day-Ahead Markets
This article has been accepted for inclusion in a future issue of this journal. Content is final as presented, with the exception of pagination.
Comparative Hourly Scheduling of Centralized andDistributed Storage in Day-Ahead Markets
Masood Parvania, Member, IEEE, Mahmud Fotuhi-Firuzabad, Fellow, IEEE, andMohammad Shahidehpour, Fellow, IEEE
Abstract—Electric energy storage (EES) installations in powersystems are migrating from large centralized systems to moredistributed installations for microgrid applications. This trendsignifies modular EES installations for the local control of buildingsand processes. A centralized EES system is often dispatched by gridoperators for increasing the overall efficiency and enhancing thesecurity of power systems. The distributed EES (DEES) is locallymanaged by aggregators to maximize the local impact of EES,before the aggregators’ adjusted load profiles are submitted to gridoperators for the day-ahead scheduling. In this paper, we presentand analyze two models for the hourly scheduling of centralizedand distributed EES systems in day-ahead electricity markets. Theproposed models take into account specific characteristics and inter-temporal constraints of EES systems in transmission-constrainedpower systems. The proposed models are applied to a 6-bus systemand the IEEE-RTS, and the results are presented to compare impactsof utilizing the two EES models on system operations and quantifyoperation benefits of EES in power systems.
Index Terms—Day-ahead electricity market, distributedenergy systems, electric energy storage (EES) systems, loadaggregators.
NOMENCLATURE
A. IndicesIndex of generating units.Index of transmission lines.Index of time.Index of bus.Index of electric energy storage (EES) systems.EES systems representation including DT fordistributed EES and CT for centralized EES.
B. SetsSet of generating units.Set of scheduling hours.Set of buses.Set of generating units connected to bus .Set of transmission lines connected to bus .Set of EES systems connected to bus .
C. ConstantsNumber of segments of piecewise linear costfunction of generating unit .Slope of segment of cost function of unit at .Minimum production cost of unit .Lower/upper limit on power generation of unit .Startup/shutdown cost of unit .Ramp-up/down limit of unit (MW/min).Minimum ON/OFF time of unit .Startup ramp of unit (MW/min).Shutdown ramp of unit (MW/min).Maximum capacity of line .Reactance of line .Initial energy stored in EES system .Minimum energy stored in EES system at time .Maximumenergy stored in EES system at time .Power rating of EES system .Load demand of bus at time .
Maximum hourly load demand allowed at bus .Spinning reserve requirement of system at time .Charge efficiency of EES facility of participant .
Discharge efficiency of EES facility ofparticipant .
D. Binary Decision VariablesCommitment state of unit at time .0/1 for charge/discharge of EES system at time .
E. Continuous Decision VariablesStartup cost of unit at time .Shutdown cost of unit at time .Real power scheduled for unit at time .Real power scheduled for unit in segment attime .Real power flow of line at time .Voltage angle of sending-end bus of line attime .Voltage angle of receiving-end bus of line attime .Adjusted load demand of bus at time .Energy stored in EES system at time .Charge/discharge power of EES system attime .
I. INTRODUCTION
E LECTRIC energy storage (EES) systems represent a fun-damental component of smart grid for enhancing power
system reliability, sustainability, and energy efficiency [1], [2].The Electric Power Research Institute (EPRI)’s energy storage
Manuscript received April 20, 2013; revised August 21, 2013 and November27, 2013; accepted January 12, 2014.
M. Parvania is with the Department of Electrical and Computer Engi-neering, University of California, Davis, CA 95616 USA (e-mail: [email protected]).
M. Fotuhi-Firuzabad is with the Center of Excellence in Power SystemControl and Management, Electrical Engineering Department, SharifUniversity of Technology, Tehran, Iran 11365-9363 (e-mail: [email protected]).
M. Shahidehpour is with the Galvin Center for Electricity Innovation,Illinois Institute of Technology, Chicago, IL 60616 USA (e-mail: [email protected]).
Color versions of one or more of the figures in this paper are available onlineat http://ieeexplore.ieee.org.
Digital Object Identifier 10.1109/TSTE.2014.2300864
IEEE TRANSACTIONS ON SUSTAINABLE ENERGY 1
1949-3029 © 2014 IEEE. Personal use is permitted, but republication/redistribution requires IEEE permission.See http://www.ieee.org/publications_standards/publications/rights/index.html for more information.

This article has been accepted for inclusion in a future issue of this journal. Content is final as presented, with the exception of pagination.
roadmap indicates that the total EES capacity in the year 2025would be 10%–20% of the installed generation capacity [3]. EESsystems located near generation unit sites could be charged andprovide backup power for such units, minimize production andmaintenance costs, and increase the efficiency of units by shiftingpower productions to more crucial hours of operation. Thesefeatures are especially essential for reducing the volatility ofenergy produced by renewable energy sources.
EES could be placed along a transmission network to provideancillary voltage and reactive power controls and to increase theutilization of transmission capacity. EES can be located at sub-transmission and distribution levels to buffer transmission linesfrom load variations, resulting inmore settled levels of load at thetransmission level and less stress on substation equipment. EESlocated at power distribution levels could also provide peakshaving and optimize power flow among feeders, thus deferringadditional investments on distribution systems. EES can also beinstalled at customer sites to level off individual load fluctuations[1], [4], [5].
From the electricity market viewpoint, independent systemoperators (ISOs) can utilize EES for improving market opera-tions, reduce operation costs and environmental concerns, andenhance asset utilizations [6], [7]. Smart grid technologies,especially versatile communication infrastructures, have furtherenabled the real-timemonitoring and control for the utilization ofEES as market assets. However, changes to market rules areessential for allowing EES to participate in electricity markets. Inthe United States, FERC has issued orders 719 and 890 [8], [9] toallow nongenerating resources, such as demand response andEES, and to participate in electricity markets on a comparablebasis to services provided by generation resources. In response,ISOs in the United States are in various stages of implementingrule changes and pilot projects that would allow EES systems toparticipate in such markets [10], [11].
The EES utilization in the day-ahead scheduling could intro-duce significant benefits to power system economics and reli-ability. In particular, the hourly EES scheduling could smoothout the daily load profile by shifting peak loads to off-peak hours.This would eliminate the need for committing peaking units andwould prevent price spikes at the peak hours. However, inter-temporal characteristics of EES systems would require charge/discharge processes to be scheduled in advance of real-timeoperations in electricity market operations. Furthermore, EESlocations in transmission networks would impact EES schedulesand the associated benefits. The problem may be of greaterimportance when EES schedules cannot be satisfied locally bythe constrained transmission network.
We divide EES operation issues into the following twocategories:
1) large and centrally located EES (CEES);2) small and distributed EES (DEES).CEESare often connected to transmission and sub-transmission
systems and dispatched by ISOs for supporting bulk transmissionnetwork operations. Conventional hydro-based pumped storageunits, compressed air energy storage, and large sodium sulfur(NaS) batteries are among the examples for CEES [12], [13].
DEES include community energy storage consisting of smallstorage units connected to distribution transformers and
controlled by local distribution hubs [1], [13]. Most emergingstorage technologies including flow batteries and flywheel ener-gy storage would support DEES applications [14]. A localcontrol hub would aggregate and manage such small storageunits for regional power system applications.
The CEES modeling with applications to power systemoperations was investigated in the literature [15]–[17]. A modelwas proposed in [15] for the ISO’s real-time energy dispatch.However, it neither considered the impact of transmission net-work constraints nor included the issues with day-ahead opera-tion in the EES scheduling. Reference [16] considered theoptimal utilization of EES for transmission network applicationsusing an optimal power flow (OPF) model. However, the modelin [16] did not optimize the coupled operation of generating unitsand EES systems, which underestimated the benefits of EESutilization. The economics of NaS batteries and flywheel storagesystems were considered in [17] without discussing the day-ahead operation issues. References [18]–[20] discussed theeconomic viability and the operation scheduling of DEES atdistribution and customer levels. Reference [18] presented anoverview of DEES for residential applications and its economicand operation scheduling values to distribution grids. The eco-nomic aspects of micro-storage systems for individual customerutilizations were presented in [19]. An optimization frameworkfor load aggregators with EES was presented in [20]. However,the DEES operation in transmission-constrained day-ahead elec-tricity markets is not considered in the technical literature.
This paper considers the EES scheduling in the day-aheadpower system operation planning for the given set of EES units.According to the growing interest in applications of DEES topower systems, the goal of this research is to present properscheduling models for DEES and compare its impacts with thoseof CEES installations on day-ahead power system operation. Inthis context, the paper proposes optimization models for thehourly scheduling of CEES and DEES in transmission-constrained system operations. The proposed models are basedon mixed-integer linear programming (MILP) formulation andrecognize specific characteristics and intertemporal constraintsof DEES and CEES in day-ahead markets while satisfyingtransmission network constraints. We have developed a generalscheduling model that would apply to any storage type withtypical hourly constraints. However, the proposed model couldbe tailored to include practical characteristics of any specific typeof storage. The proposedmodels are utilized in Sections IV andVto quantify and compare the operation benefits of CEES andDEES in power systems.
This paper contributes to the technical literature as follows:1) EES installations in power systems are categorized into CEESand DEES, and specific scheduling models are proposed for thetwo EES options in day-ahead electricity markets. The effects ofEES location and transmission network limitations on EESschedules are considered in the market-clearing formulation.We have used simple cases in Section IV to demonstrate themerits of the proposed models to existing approaches. 2) Thebenefits of CEES are maximized in the proposed schedulingmodel by co-optimizing the charge/discharge strategy of CEESand the commitment status of thermal generating units within theday-ahead market clearing process. 3) The proposed scheduling
2 IEEE TRANSACTIONS ON SUSTAINABLE ENERGY
This article has been accepted for inclusion in a future issue of this journal. Content is final as presented, with the exception of pagination.
model for DEES takes into account the roles of ISO and localaggregators during the scheduling process and incorporates localDEES fleets into the ISO’s wholesale operation.
The rest of the paper is organized as follows. Section IIpresents the proposed method for day-ahead electricity marketclearing considering CEES systems. The proposed method forday-ahead market clearing in the presence of DEES systems ispresented in Section III. Section IVpresents the simulation resultson a 6-bus system and the IEEE-RTS, and Section V outlines theobservations. Finally, the conclusion is given in Section VI.
II. MARKET CLEARING WITH CENTRALIZED EES
The ISO schedules the CEES for optimizing its hourlycharge/discharge strategy. The objective of the proposed MILPformulation is to minimize the total production cost, which isgiven as
The objective function (1) is subjected to prevailing thermalgenerating unit constraints, EES constraints, as well as transmis-sion and system constraints, which is given as
The constraints (2)–(10) are thermal generating unit con-straints including (2)–(6) representing linearized energy produc-tion costs and startup/shutdown costs and (7)–(10) for theminimum ON/OFF time and ramping up/down. The CEES con-straints are given in (11)–(17). The hourly energy balance ofCEES is presented in (11). The initial energy and the capacitylimit of EES are presented in (12) and (13). The charge/dischargeconstraints are given in (14) and (15). The binary variable in(14) and (15) is 1 when the EES system is discharging and is 0otherwise. Constraints (16) and (17) would limit the charge/discharge ramping of CEES. Constraint (18) represents dc powerflow equation for transmission networks. Constraints (19) and(20) represent line flows and the associated flow limits. Con-straint (21) considers the required level of the hourly spinningreserve.
III. MARKET CLEARING WITH DISTRIBUTED EES
The proposed model for DEES utilization in the day-aheadmarket is presented here. In the following, we first present theproposed hierarchical market structure with DEES and thendiscuss the formulation of the proposed self-scheduling modelutilized by aggregators for optimizing the hourly DEESoperation.
A. Market Structures
From the electricity market viewpoint, the difference betweenCEES and DEES is that the latter is locally scheduled by loadaggregators before submitting the proposed schedule to the ISO.Rational aggregators install DEES units at the distribution levelfor their local use and schedule DEES for supplying loads at theminimum cost. The local DEES units would impact the ISO’swholesale operation by reshaping the aggregators’ hourly loadprofile. The aggregator schedule provides an integrated controlfor a large number of EES.
The linkage between DEES aggregators and the ISO is shownin Fig. 1. In this figure, DEES aggregators would forecast hourlylocational market prices (LMPs) and loads for the next day andincorporate them into the self-scheduling optimizationmodel forcalculating the hourly charge/discharge strategy of the local fleetof DEES. Aggregators would forecast hourly market pricesbased on historical market price data along with their experiencewithDEES operations. The choice of forecastingmethodwill notaffect our proposed method, since the hourly forecasted price isthe given input to the aggregators’ optimization problem[21]–[23]. The ISO would not schedule the DEES charge/discharge strategy and rather consider the impacts of local
PARVANIA et al.: COMPARATIVE HOURLY SCHEDULING OF CENTRALIZED AND DISTRIBUTED STORAGE 3

This article has been accepted for inclusion in a future issue of this journal. Content is final as presented, with the exception of pagination.
DEES scheduling on day-ahead market operations through theaggregators’ adjusted hourly load profiles. In Fig. 1, the self-scheduling results of the DEES aggregation would then besubmitted to the ISO as the adjusted hourly load profile. TheISO utilizes the aggregators’ adjusted hourly load along withother participants’market data for clearing the day-aheadmarket.
B. DEES Aggregator’s Self-Scheduling Model
The objective of the self-schedulingmodel ofDEES is to servelocal loads at the minimum cost, which is formulated as follows:
where is the aggregator’s forecasted hourly market price atbus , and is the hourly adjusted load at bus consideringthe DEES charge/discharge schedule. The objective (22) isconstrained as follows:
The nonnegativity constraint (23) refers to the fact that theaggregators would utilize the available DEES capacity locally toserve local loads at the minimum cost. The maximum hourlydemand constraint (24) indicates that the aggregators’ DEESschedulewould not violate any systemoperation constraints. TheDEES charge/discharge variables in (23) are governed by the
hourly energy balance (25), initial energy level (26), the energycapacity limits (27), rated power constraints (28), (29), andramping limitations (30), (31).
IV. SIMULATION RESULTS
In this section, the proposed day-ahead scheduling model forutilizing CEES and DEES is tested and the results are demon-strated for a 6-bus system and the IEEE-RTS.
A. The 6-Bus System
The 6-bus system shown in Fig. 2 is used to analyze the effectsof CEES and DEES systems on the day-ahead market using theproposedmodels. In Fig. 2, an EES system is located at each loadbus. The system data are available at http://motor.ece.iit.edu/data/6bus_Data_ES.pdf.
Three cases are studied on the 6-bus system. In Case 0, the6-bus system operation is simulated without any EES schedul-ing. The ISO’s operating cost is $113 839.7.
In Cases 1 and 2, the operation of DEES and CEES systems is,respectively, considered in the 6-bus system. In both cases, thestorage capacity is 10% of the system daily peak load, i.e.,28 MW, which is divided equally between the three buses. TheEES energy capacity is six times its power rating, while thecharge/discharge efficiency is set at 0.9 with an overall efficiencyof 0.81.
InCase 1, the aggregatorswould schedule theDEES operationusing the proposed self-scheduling model in Section III andsubmit the corresponding hourly adjusted loads to the ISO. TheISO, then, schedules the day-ahead market based on the adjustedloads. The ISO’s operating cost in Case 1 with DEES is$112 923.3, which shows aminor reduction of 0.8% in the ISO’soperating cost, as compared to Case 0 without the EES utiliza-tion. In Case 2, the ISO centrally dispatches the CEES hourlycharge/discharge strategy during the day-ahead market clearing.The ISO’s operating cost in Case 2 is reduced to $107 562.6 (i.e.,lowered by 5.5%) after the CEES utilization, which emphasizesthat the ISO’s operating cost with CEES is much lower than thatwith the aggregators’ proposedDEES. This is, because theCEESunits are centrally scheduled by the ISO to minimize the totaloperating cost (1), while the DEES units are locally scheduled bythe aggregators to minimize the local cost of serving the loads.
Fig. 1. DEES aggregator and the ISO operations.Fig. 2. One-line diagram of the 6-bus system.
4 IEEE TRANSACTIONS ON SUSTAINABLE ENERGY

This article has been accepted for inclusion in a future issue of this journal. Content is final as presented, with the exception of pagination.
Fig. 3 summarizes the supplied load curves which show thatthe utilization of EES in Cases 1 and 2 would shift peak loads tooff-peak hours. However, the load profile in Case 2with the ISO-controlled CEES is smoother than that of Case 1. The reason isfound by reviewing the charge/discharge patterns of EES de-picted in Fig. 4, and the average hourly LMPs in Fig. 5.
In Fig. 4, positive power corresponds to the EES charging. InCase 1, DEES is scheduled by local aggregators to be charged atlow-LMP hours and then discharged at subsequent high-LMPhours. As expected, the aggregators’ DEES schedule in Case 1
would closely follow the forecasted hourly LMPs in Fig. 5 as twocharge/discharge cycles are scheduled in Fig. 4. In the first cycle,the DEES units are charged at hours 1–7 and then discharged athours 11–18. In the second cycle, theDEESs are charged at hours19–21 and then discharged at hour 22 as there is a forecastedLMP spike at hour 22. This schedule would minimize theaggregators’ cost of serving the local loads as shown in Table I.
In Table I, the aggregators’ cost of supplying the load at thethree buses is reduced to $178 813.9 in Case 1, which demon-strates a 3.03% reduction in the aggregators’ daily cost presentedin Case 0. The highest reduction in cost occurs for the aggregatorlocated at bus 4, which is an attractive location for DEESutilization. This table demonstrates the economic merits of localDEES with a capacity of 10% of the load.
In Fig. 3, the ISO’s schedule in Case 2 tends to flatten thehourly load profile, which resulted in a lower operation cost. Inaddition, the ISO’s schedule would require a single daily cyclethat would extend the EES life as compared to that in Case 1withtwo daily cycles. In Fig. 4, the schedule inCase 2 differs from thatin Case 1 as the ISO in Case 2 seeks to minimize the total systemoperating cost while satisfying the transmission constraints. InFig. 5, the hourly LMPs are reduced when EES is discharged. InCase 2, the average LMPs are flat at peak hours when CEESswould reduce the transmission congestion. However, the LMPprofile in Case 1 shows three spikes at hours 10, 21, and 23 and isnot asflat. Here, the tightly congested transmission line L3wouldcause the LMP spikes.
The nonsmooth load profile in Case 1 would modify thehourly commitment of units in Table III as compared to that ofCase 0 in Table II. In Table III, the startup/shutdown cycles ofgenerating units G2 and G3 are increased as the ISO has to caterto the aggregators’ local demand by cycling the units more often.The increased cycling cost of units in Case 1 would increase thecost as compared to that inCase 2. In Table IV, the expensive unit
Fig. 3. Daily load profile in the 6-bus system.
Fig. 4. Scheduled storage power in the 6-bus system.
Fig. 5. Average LMPs in the 6-bus system.
TABLE IAGGREGATORS’ COST OF SERVING LOAD IN THE 6-BUS SYSTEM
TABLE IIHOURLY UNITS COMMITMENT IN THE 6-BUS SYSTEM—CASE 0
TABLE IIIHOURLY UNITS COMMITMENT IN THE 6-BUS SYSTEM—CASE 1
PARVANIA et al.: COMPARATIVE HOURLY SCHEDULING OF CENTRALIZED AND DISTRIBUTED STORAGE 5
This article has been accepted for inclusion in a future issue of this journal. Content is final as presented, with the exception of pagination.
G2 is not committed in Case 2, and the hourly commitment ofG3 is reduced by 1 h when supplying the smooth load profile inCase 2 given in Fig. 3.
Here, we simulate a case to demonstrate that our proposedmodel for operation optimization of CEES systems in day-aheadenergy markets outperforms the existing OPF-based approaches[16]. In this regard, day-ahead operation of the 6-bus system issimulated using an OPF-based scheduling model in which thecommitment states of generating units are fixed to those ofCase 0. The CEES system capacity, settings, and locations areequal to those of Case 2. The ISO’s operating cost in this case isequal to $112 095.2, which is much larger than that of ourproposed model in Case 2. This large operating cost happenswhile the full available CEES capacity is utilized by the model.This result emphasizes that the benefits of CEES integrationcannot be fully captured using the existing OPF-based model, asit cannot affect the schedule of generating units. However, one ofthe features of our proposed model is that it co-optimizes thecharge/discharge strategy of CEES and the commitment status ofgenerating units within the day-ahead market clearing process.
B. The IEEE-RTS
The proposed model is applied to the IEEE-RTS [24]. Theshutdown costs of the units are assumed to be 50% of theirrespective startup costs. The hourly load corresponds to aweekday on week 23 with a daily peak load of 2850 MW. Theprevious line limits of 175 MW are reduced to 100 MW in orderto simulate the transmission system congestion.
Here, we first determine buses that best fit the EES systemobjectives. We follow a popular notion that the best EES loca-tions for day-ahead energy markets are buses with highest LMPs[1]. Higher LMPs correspond to transmission congestion thatdoes not allow cheaper generation to be fully dispatched forsupplying bus loads. Thus, the operation of EES at or near suchbuses could provide the supply deficiency for reducing LMPvalues. In order to determine such buses, the average daily LMPsof the IEEE-RTS are sorted in ascending order of 7, 8, 10, 6, 5, 1,2, 13, 20, and 14, which are chosen as EES locations. However,the choice of EES locations in power systems will not affect ourproposed algorithm because the system topology is given asinput to the proposed day-ahead scheduling model. In thefollowing, we investigate the impact of available DEES andCEES capacity and the impact of transmission flow limits on theoperating characteristics of the IEEE-RTS system. The compu-tation times of the MILP models, solved by CPLEX 12 [25], areall less than 10 s, with the upper bound of the duality gap set at0.1%.
1) Case 1: Integration of DEES: The available DEES capacityis incrementally increased from 0% to 40% in 10% increments ofthe system daily peak load. The total DEES capacity is divided
equally among the 10 buses. The DEES energy capacity is sixtimes its power rating, while the charge/discharge efficiency isset at 0.9.
We first relax the maximum hourly demand constraint (24)and calculate adjusted loads at DEES buses by running the self-scheduling model for aggregators. In Case 1, the ISO marketcould not be cleared for any of the DEES capacities. In order toovercome this obstacle, we introduce adjustment limits forloads at DEES buses as stated by (24). The adjusted load limitsare set at the daily peak loads of DEES buses. Table V showsthe ISO’s market clearing results with a 10%–40% DEEScapacity.
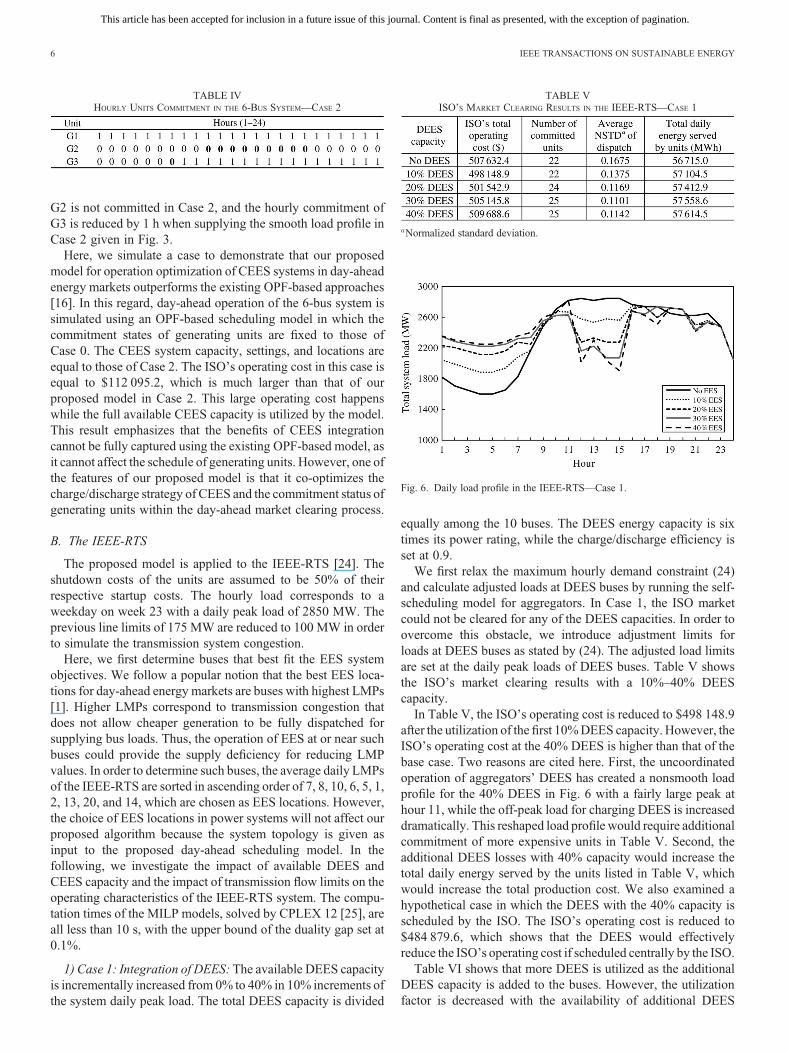
In Table V, the ISO’s operating cost is reduced to $498 148.9after the utilization of thefirst 10%DEES capacity. However, theISO’s operating cost at the 40% DEES is higher than that of thebase case. Two reasons are cited here. First, the uncoordinatedoperation of aggregators’ DEES has created a nonsmooth loadprofile for the 40% DEES in Fig. 6 with a fairly large peak athour 11, while the off-peak load for charging DEES is increaseddramatically. This reshaped load profile would require additionalcommitment of more expensive units in Table V. Second, theadditional DEES losses with 40% capacity would increase thetotal daily energy served by the units listed in Table V, whichwould increase the total production cost. We also examined ahypothetical case in which the DEES with the 40% capacity isscheduled by the ISO. The ISO’s operating cost is reduced to$484 879.6, which shows that the DEES would effectivelyreduce the ISO’s operating cost if scheduled centrally by the ISO.
Table VI shows that more DEES is utilized as the additionalDEES capacity is added to the buses. However, the utilizationfactor is decreased with the availability of additional DEES
TABLE IVHOURLY UNITS COMMITMENT IN THE 6-BUS SYSTEM—CASE 2
TABLE VISO’S MARKET CLEARING RESULTS IN THE IEEE-RTS—CASE 1
Normalized standard deviation.
Fig. 6. Daily load profile in the IEEE-RTS—Case 1.
6 IEEE TRANSACTIONS ON SUSTAINABLE ENERGY

This article has been accepted for inclusion in a future issue of this journal. Content is final as presented, with the exception of pagination.
capacity. The largest utilization factor has occurredwhen the first10%DEES capacity is added to the system. The utilization factorwith 10%DEES capacity is 107.9%whenDEES is charged twiceduring the day.
Table VII shows the aggregators’ economic benefits foradding the local DEES. The largest benefit would be that ofadding the first 10% DEES capacity with a $12 936.3 reductionin the total aggregators’ cost of serving loads. The total financialbenefit divided by the total added capacity in each step wouldquantify the benefit per megawatt of the added DEES. Thefinancial benefits listed in Table VII are based on the proposedsingle-day operation that would be added up on an annual basis.
2) Case 2: Integration of CEES: In this case, CEES is added tothe 10 selected buses of the IEEE-RTS. The available CEEScapacity is incrementally increased from 0% to 40% of the sys-tem daily peak load with 10% increments. The CEES energycapacity is six times its power rating, while the charge/dischargeefficiency is set at 0.9. In Table VIII, the number of committedunits and the ISO’s total operating cost are reduced aswe utilize ahigher CEES capacity. In Table VIII, the highest reduction of2.5% in the ISO’s operating cost occurs when thefirst 10%CEESis added. Table VIII also shows that the average normalizedstandard deviation of dispatched power of committed units isreduced as the additional CEES is introduced. This resultindicates that a sufficient integration of CEES would reducethe hourly volatility of the thermal generation dispatch.
The large hourly fluctuations in generation dispatch couldincrease power plant operation and maintenance costs due toturbinewear and tear. TableVIII shows a higher daily dispatch ofenergy as EES energy losses are considered. A higher utilizationof EES capacity would also increase such losses. In Table IX, theutilization factor is decreased as the additional CEES is madeavailable. DEES utilization for large capacities is limited by localconstraints in Table VI, while the ISO can utilize CEES forbroader system applications.
The CEES utilization at some buses could have a higherimpact on electricity markets. Table X shows that higher CEESis utilized at buses 5, 6, 10, 13, 14, and 20, as the additional CEEScapacity is made available. In Fig. 7, the additional CEES isutilized at buses 10, 13, and 20. However, the utilization factor isreduced at certain buses as the transmission system would notsupport a higher CEES capacity. Accordingly, buses 10, 13, and20 are the best CEES locations for reducing the ISO’s operationcosts.
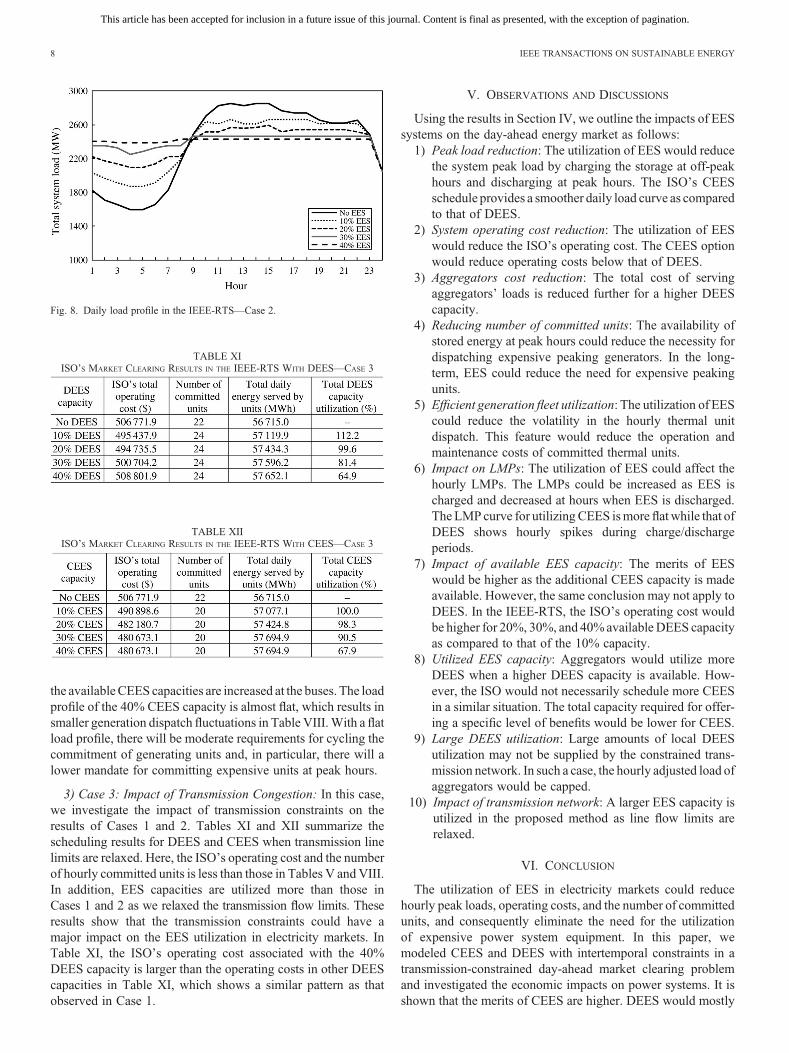
Fig. 8 shows the daily load profiles for available CEEScapacities. The daily load profiles in Fig. 8 get more flat when
TABLE VITOTAL UTILIZED DEES CAPACITY IN THE IEEE-RTS—CASE 1
TABLE VIIAGGREGATORS’ COST OF SERVING LOAD IN THE IEEE-RTS—CASE 1
TABLE VIIIISO’S MARKET CLEARING RESULTS IN THE IEEE-RTS—CASE 2
Normalized standard deviation.
TABLE IXTOTAL UTILIZED CEES CAPACITY IN THE IEEE-RTS—CASE 2
TABLE XCEES CAPACITY UTILIZED AT THE IEEE-RTS BUSES (MWH)—CASE 2
Fig. 7. CEES capacity utilization factors at the IEEE-RTS buses—Case 2.
PARVANIA et al.: COMPARATIVE HOURLY SCHEDULING OF CENTRALIZED AND DISTRIBUTED STORAGE 7
This article has been accepted for inclusion in a future issue of this journal. Content is final as presented, with the exception of pagination.
the availableCEES capacities are increased at the buses. The loadprofile of the 40% CEES capacity is almost flat, which results insmaller generation dispatch fluctuations in Table VIII.With a flatload profile, there will be moderate requirements for cycling thecommitment of generating units and, in particular, there will alower mandate for committing expensive units at peak hours.
3) Case 3: Impact of Transmission Congestion: In this case,we investigate the impact of transmission constraints on theresults of Cases 1 and 2. Tables XI and XII summarize thescheduling results for DEES and CEES when transmission linelimits are relaxed. Here, the ISO’s operating cost and the numberof hourly committed units is less than those in Tables V andVIII.In addition, EES capacities are utilized more than those inCases 1 and 2 as we relaxed the transmission flow limits. Theseresults show that the transmission constraints could have amajor impact on the EES utilization in electricity markets. InTable XI, the ISO’s operating cost associated with the 40%DEES capacity is larger than the operating costs in other DEEScapacities in Table XI, which shows a similar pattern as thatobserved in Case 1.
V. OBSERVATIONS AND DISCUSSIONS
Using the results in Section IV, we outline the impacts of EESsystems on the day-ahead energy market as follows:
1) Peak load reduction: The utilization of EES would reducethe system peak load by charging the storage at off-peakhours and discharging at peak hours. The ISO’s CEESschedule provides a smoother daily load curve as comparedto that of DEES.
2) System operating cost reduction: The utilization of EESwould reduce the ISO’s operating cost. The CEES optionwould reduce operating costs below that of DEES.
3) Aggregators cost reduction: The total cost of servingaggregators’ loads is reduced further for a higher DEEScapacity.
4) Reducing number of committed units: The availability ofstored energy at peak hours could reduce the necessity fordispatching expensive peaking generators. In the long-term, EES could reduce the need for expensive peakingunits.
5) Efficient generation fleet utilization: The utilization of EEScould reduce the volatility in the hourly thermal unitdispatch. This feature would reduce the operation andmaintenance costs of committed thermal units.
6) Impact on LMPs: The utilization of EES could affect thehourly LMPs. The LMPs could be increased as EES ischarged and decreased at hours when EES is discharged.The LMP curve for utilizingCEES ismore flatwhile that ofDEES shows hourly spikes during charge/dischargeperiods.
7) Impact of available EES capacity: The merits of EESwould be higher as the additional CEES capacity is madeavailable. However, the same conclusion may not apply toDEES. In the IEEE-RTS, the ISO’s operating cost wouldbe higher for 20%, 30%, and 40%availableDEES capacityas compared to that of the 10% capacity.
8) Utilized EES capacity: Aggregators would utilize moreDEES when a higher DEES capacity is available. How-ever, the ISO would not necessarily schedule more CEESin a similar situation. The total capacity required for offer-ing a specific level of benefits would be lower for CEES.
9) Large DEES utilization: Large amounts of local DEESutilization may not be supplied by the constrained trans-mission network. In such a case, the hourly adjusted load ofaggregators would be capped.
10) Impact of transmission network: A larger EES capacity isutilized in the proposed method as line flow limits arerelaxed.
VI. CONCLUSION
The utilization of EES in electricity markets could reducehourly peak loads, operating costs, and the number of committedunits, and consequently eliminate the need for the utilizationof expensive power system equipment. In this paper, wemodeled CEES and DEES with intertemporal constraints in atransmission-constrained day-ahead market clearing problemand investigated the economic impacts on power systems. It isshown that the merits of CEES are higher. DEES would mostly
Fig. 8. Daily load profile in the IEEE-RTS—Case 2.
TABLE XIISO’S MARKET CLEARING RESULTS IN THE IEEE-RTS WITH DEES—CASE 3
TABLE XIIISO’S MARKET CLEARING RESULTS IN THE IEEE-RTS WITH CEES—CASE 3
8 IEEE TRANSACTIONS ON SUSTAINABLE ENERGY

This article has been accepted for inclusion in a future issue of this journal. Content is final as presented, with the exception of pagination.
impact local levels by reducing the costs incurred by loadaggregators. The numerical results also indicate that the localDEES schedules may have to be modified according to theimposed transmission network constraints. The methodologyproposed in this paper provides a valuable tool for EES operationanalyses, which also provides the basis for long-term cost-benefitanalyses of EES in power systems. Further research is underwayto analyze the economic benefits of EES for providing ancillaryservices in constrained power systems.
REFERENCES
[1] J. Eyer and G. Corey, “Energy storage for the electricity grid: Benefits andmarket potential assessment guide,” Sandia National Laboratories, Albu-querque, NM, USA, Rep. SAND2010-0815, Feb. 2010.
[2] S. Schoenung, “Energy storage systems cost update,” Sandia NationalLaboratories, Albuquerque, NM, USA, Rep. SAND2011-2730, Apr. 2011.
[3] EPRI–DOE Handbook of Energy Storage for Transmission and Distribu-tion Applications, EPRI, Palo Alto, CA, USA, and the U.S. Department ofEnergy, Washington, DC, USA, 2003, no. 1001834.
[4] J. Iannucci and S. Schoenung, “Energy storage concepts for a restructuredelectric utility industry,” Sandia National Laboratories, Albuquerque, NM,USA, Rep. SAND2000-1550, Jul. 2000.
[5] P. C. Butler, J. Iannucci, and J. Eyer, “Innovative business cases for energystorage in a restructured electricity market place,” Sandia National Labora-tories, Albuquerque, NM, USA, Rep. SAND2003-0362, Feb. 2003.
[6] S. Schoenung, J. Eyer, J. Iannucci, and S. Horgan, “Energy storage for acompetitive power market,” Annu. Rev. Energy Environ., vol. 21,pp. 347–370, 1996.
[7] R. Walawalkar, H. Kamath, R. Mancini, S. Fernands, D. Crudele, andK. Gomatom, “Electric energy storage: Opportunities and challenges inNY,” in Proc. Elect. Energy Storage: Appl. Technol., San Francisco, CA,USA, Oct. 17–19, 2005.
[8] Federal Energy Regulatory Commission (FERC). (2008, Oct.). WholesaleCompetition in Regions with Organized Electric Markets, Order 719[Online]. Available: http://www.ferc.gov/.
[9] Federal Energy Regulation Agency FERC. (2007, Feb. 16). PreventingUndueDiscrimination and Preference in Transmission Service. Order 890.
[10] New York Independent System Operator (NYISO). (2010, Mar.). EnergyStorage in the New York Electricity Markets [Online]. Available: http://www.nyiso.com/.
[11] California Independent System Operator (CAISO) website. EnergyStorage Technology [Online]. Available: http://www.caiso.com/23bb/23bbc08911460.html.
[12] A. Nourai, “Large-scale electricity storage technologies for energy man-agement,” in Proc. IEEE Power Eng. Soc. Summer Meet., 2002,pp. 310–315.
[13] American Electric Power (AEP). (2012, Oct.). Community Energy StorageDemonstration [Online]. Available: http://www.dolantechcenter.com/Focus/DistributedEnergy/EnergyStorage.aspx.
[14] “Electric energy storage technology options: A white paper primer onapplications, costs, and benefits,” EPRI, Palo Alto, CA, USA, Rep.1020676, 2010.
[15] C. Yonghong,M. Keyser,M. H. Tackett, andM.Xingwang, “Incorporatingshort-term stored energy resource into midwest ISO energy and ancillaryservice market,” IEEE Trans. Power Syst., vol. 26, no. 2, pp. 829–838,May 2011.
[16] H. Oh, “Optimal planning to include storage devices in power systems,”IEEE Trans. Power Syst., vol. 26, no. 3, pp. 1118–1128, Aug. 2011.
[17] R. Walawalkar, J. Apt, and R. Mancini, “Economics of electric storage forenergy arbitrage and regulation in New York,” Energy Policy, vol. 35,pp. 2558–2568, 2007.
[18] A. A. Hussein, N. Kutkut, Z. J. Shen, and I. Batarseh, “Distributed batterymicro-storage systems design and operation in a deregulated electricitymarket,” IEEE Trans. Sustain. Energy, vol. 3, no. 3, pp. 545–555, Jul. 2012.
[19] W. Zhu, D. Garrett, J. Butkowski, and Y. Wang, “Overview of distributiveenergy storage systems for residential communities,” in Proc. IEEEEnergytech, May 29–31, 2012, pp. 1–6.
[20] Y. Xu, L. Xie, and C. Singh, “Optimal scheduling and operation of loadaggregator with electric energy storage in power markets,” in Proc. NorthAmer. Power Symp. (NAPS), Sep. 26–28, 2010, pp. 1–7.
[21] M. Shahidehpour, H. Yamin, and Z. Y. Li, Market Operations in ElectricPower Systems. Hoboken, NJ, USA: Wiley, 2002.
[22] L. Wu andM. Shahidehpour, “A hybrid model for price forecasting,” IEEETrans. Power Syst., vol. 25, no. 3, pp. 1519–1530, Aug. 2010.
[23] J. Contreras, R. Espinola, F. J. Nogales, and A. J. Conejo, “ARIMAmodelsto predict next-day electricity prices,” IEEE Trans. Power Syst., vol. 18,no. 3, pp. 1014–1020, Aug. 2003.
[24] “The IEEE reliability test system-1996,” IEEE Trans. Power Syst., vol. 14,no. 3, pp. 1010–1020, Aug. 1999.
[25] CPLEX 12.2 Manual. Armonk, NY, USA: IBM Corporation, 2011.
Masood Parvania (S’09–M’14) received the B.S. degree from the Iran Univer-sity of Science and Technology, Tehran, Iran, in 2007, and theM.S. and the Ph.D.degrees from the Sharif University of Technology, Tehran, Iran, in 2009 and2013, respectively, all in electrical engineering.From June 2012 to June 2013, he was a Research Associate with the Robert
W. Galvin Center for Electricity Innovation, Illinois Institute of Technology,Chicago, IL, USA. Currently, he is a Postdoctoral Scholar with the Department ofElectrical and Computer Engineering at the University of California, Davis, CA.His research interests include operation and optimizations of smart electricitygrid, sustainable energy integration, and modeling, analysis, and security assess-ment of cyber-physical systems. He is the Chair of the IEEE/PES Task Force onReliability Impacts of Demand Response Integration.Dr. Parvania received the 2013 Sharif University’s Outstanding Achievement
Award for his academic achievements during graduate studies. He is also therecipient of the prestigious 2013NationwideDistinguished Ph.D. Student Awardfrom the Ministry of Science, Research and Technology, Iran.
Mahmud Fotuhi-Firuzabad (F’14) received the B.Sc. degree in electricalengineering from Sharif University of Technology, Tehran, Iran, in 1986, theM.Sc. degree in electrical engineering from Tehran University, Tehran, Iran, in1989, and the M.Sc. and Ph.D. degrees in electrical engineering from theUniversity of Saskatchewan, Saskatoon, Canada, in 1993 and 1997, respectively.Currently, he is a Professor and Head of the Department of Electrical
Engineering, Sharif University of Technology. He is also an Honorary Professorin the Universiti Teknologi Mara (UiTM), Shah Alam, Malaysia.Dr. Fotuhi-Firuzabad is amember of the Center of Excellence in Power System
Management and Control. He serves as an Editor of the IEEE TRANSACTIONS ON
SMART GRID.
MohammadShahidehpour (F’01) is the BodineChair Professor andDirector ofthe Robert W. Galvin Center for Electricity Innovation, Illinois Institute ofTechnology, Chicago, IL, USA. He was the Chair of the 2012 IEEE InnovativeSmart Grid Technologies Conference and the Chair of the 2012 Great LakesSymposium on Smart Grid and the New Energy Economy.Dr. Shahidehpour was the recipient of an Honorary Doctorate from the
Polytechnic University of Bucharest, Romania. He is an IEEE DistinguishedLecturer and the Editor-in-Chief of the IEEE TRANSACTIONS ON SMART GRID. Hereceived the 2012 IEEE PES Outstanding Power Engineering Educator Award.
PARVANIA et al.: COMPARATIVE HOURLY SCHEDULING OF CENTRALIZED AND DISTRIBUTED STORAGE 9