Road work ahead - Maastricht University
261
Road work ahead Citation for published version (APA): Michielse, S. M. A. (2018). Road work ahead: cerebral pathways mediating psychological mechanisms underlying the psychosis spectrum. [Doctoral Thesis, Maastricht University]. Maastricht University. https://doi.org/10.26481/dis.20181019sm Document status and date: Published: 01/01/2018 DOI: 10.26481/dis.20181019sm Document Version: Publisher's PDF, also known as Version of record Please check the document version of this publication: • A submitted manuscript is the version of the article upon submission and before peer-review. There can be important differences between the submitted version and the official published version of record. People interested in the research are advised to contact the author for the final version of the publication, or visit the DOI to the publisher's website. • The final author version and the galley proof are versions of the publication after peer review. • The final published version features the final layout of the paper including the volume, issue and page numbers. Link to publication General rights Copyright and moral rights for the publications made accessible in the public portal are retained by the authors and/or other copyright owners and it is a condition of accessing publications that users recognise and abide by the legal requirements associated with these rights. • Users may download and print one copy of any publication from the public portal for the purpose of private study or research. • You may not further distribute the material or use it for any profit-making activity or commercial gain • You may freely distribute the URL identifying the publication in the public portal. If the publication is distributed under the terms of Article 25fa of the Dutch Copyright Act, indicated by the “Taverne” license above, please follow below link for the End User Agreement: www.umlib.nl/taverne-license Take down policy If you believe that this document breaches copyright please contact us at: [email protected] providing details and we will investigate your claim. Download date: 17 Jul. 2022
-
Upload
khangminh22 -
Category
Documents
-
view
4 -
download
0
Transcript of Road work ahead - Maastricht University
Road work ahead
Citation for published version (APA):
Michielse, S. M. A. (2018). Road work ahead: cerebral pathways mediating psychological mechanismsunderlying the psychosis spectrum. [Doctoral Thesis, Maastricht University]. Maastricht University.https://doi.org/10.26481/dis.20181019sm
Document status and date:Published: 01/01/2018
DOI:10.26481/dis.20181019sm
Document Version:Publisher's PDF, also known as Version of record
Please check the document version of this publication:
• A submitted manuscript is the version of the article upon submission and before peer-review. There canbe important differences between the submitted version and the official published version of record.People interested in the research are advised to contact the author for the final version of the publication,or visit the DOI to the publisher's website.• The final author version and the galley proof are versions of the publication after peer review.• The final published version features the final layout of the paper including the volume, issue and pagenumbers.Link to publication
General rightsCopyright and moral rights for the publications made accessible in the public portal are retained by the authors and/or other copyrightowners and it is a condition of accessing publications that users recognise and abide by the legal requirements associated with theserights.
• Users may download and print one copy of any publication from the public portal for the purpose of private study or research.• You may not further distribute the material or use it for any profit-making activity or commercial gain• You may freely distribute the URL identifying the publication in the public portal.
If the publication is distributed under the terms of Article 25fa of the Dutch Copyright Act, indicated by the “Taverne” license above,please follow below link for the End User Agreement:
www.umlib.nl/taverne-license
Take down policyIf you believe that this document breaches copyright please contact us at:
providing details and we will investigate your claim.
Download date: 17 Jul. 2022

Road work ahead:Cerebral pathways mediating
psychological mechanisms underlying the psychosis spectrum
Stijn Martinus Arnoldus Michielse

The work presented in this thesis was performed at the Department of Psychiatry and Neuropsychology, School for Mental Health and Neuroscience, Maastricht University, Maastricht, the Netherlands. The research was supported by ‘Stichting de Weijerhorst’, a NARSAD YI investigator grant (ID 21543) of the Brain and Behaviour Research Foundation to Machteld Marcelis and by the Brain Foundation of the Netherlands (grant nr 2012(1)-03) awarded to Marieke Wichers.
ISBN: 978-94-9301-490-9 Cover design: Eelco Heuvelmans Printing: Gildeprint B.V., The Netherlands © 2018 - Stijn Michielse
All rights reserved. No part of this publication may be reproduced or transmitted in any form of by any means, electronic or mechanical, including photocopy, recording, or any information storage or retrieval system, without permission in writing the author.

ROAD WORK AHEAD
Cerebral pathways mediating psychological mechanisms
underlying the psychosis spectrum
PROEFSCHRIFT
Ter verkrijging van de graad van Doctor aan de Universiteit Maastricht, op gezag van de Rector Magnificus Prof.Dr. Rianne M. Letschert,
volgens het besluit van het College van Decanen,in het openbaar te verdedigen
op Vrijdag 19 Oktober 2018, om 10.00 uur
Door:STIJN MICHIELSE

PROMOTORProf. Dr. J.J. van Os
COPROMOTORDr. M.C. Marcelis
BEOORDELINGSCOMMISSIEProf. Dr. B. Ruttten (Voorzitter) Prof. Dr. Ph. Delespaul Dr. H. Jacobs Prof. Dr. N. van Haren (Erasmus MC) Prof. Dr. D. Veltman (VU Medisch Centrum Amsterdam)

A human being is a part of the whole called by us universe, a part limited in time and space. He experiences himself, his thoughts and
feelings as something separated from the rest, a kind of optical delusion of his consciousness. This delusion is a kind of prison for
us, restricting us to our personal desires and to affection for a few persons nearest to us. Our task must be to free ourselves from this
prison by widening our circle of compassion to embrace all living creatures and the whole of nature in its beauty.
Albert Einstein

PARANIMFENGiel KesselsHendrick Abrahams
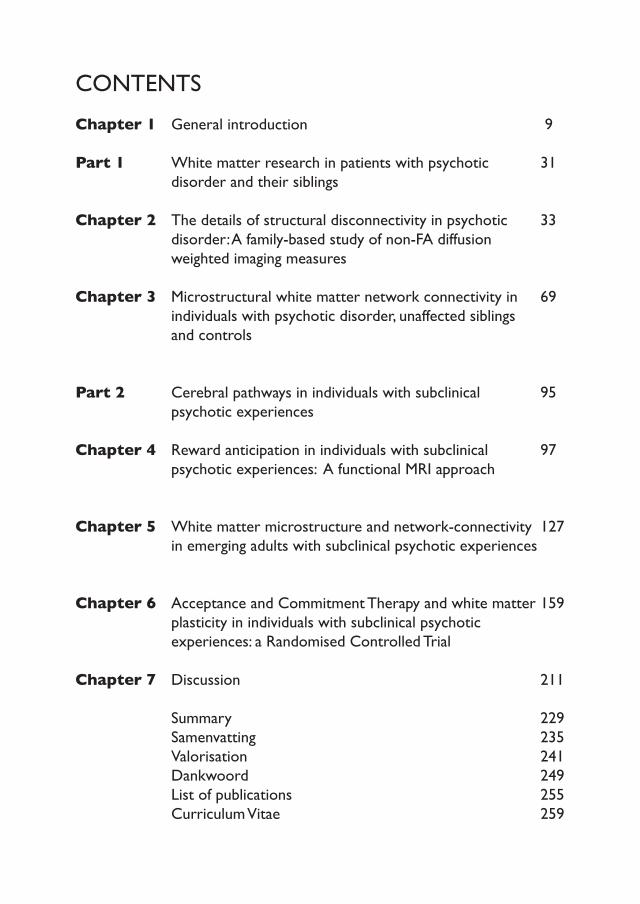
CONTENTS
Chapter 1 General introduction Part 1 White matter research in patients with psychotic disorder and their siblings
Chapter 2 The details of structural disconnectivity in psychotic disorder: A family-based study of non-FA diffusion weighted imaging measures
Chapter 3 Microstructural white matter network connectivity in individuals with psychotic disorder, unaffected siblings and controls
Part 2 Cerebral pathways in individuals with subclinical psychotic experiences
Chapter 4 Reward anticipation in individuals with subclinical psychotic experiences: A functional MRI approach
Chapter 5 White matter microstructure and network-connectivity in emerging adults with subclinical psychotic experiences
Chapter 6 Acceptance and Commitment Therapy and white matter plasticity in individuals with subclinical psychotic experiences: a Randomised Controlled Trial Chapter 7 Discussion
Summary Samenvatting Valorisation Dankwoord List of publications Curriculum Vitae
9
31
33
69
95
97
127
159
211
229235241249255259


CH
APT
EROne
GENERAL INTRODUCTION

Chapter 1
10
The brain – a complicated road mapThe human brain consists of approximately 86 billion neuron cells (1) and a normal functioning human body has more synapses (100 trillion) than blood cells (26 trillion). The brain consumes more energy than any other organ, accounting for up to 20% of the body’s total supply. Therefore, the cerebrum is the key organ in the central nervous system enabling bodily activities, processing, integration, coordination, decision-making, and sensory processing. The cerebrum is a highly complex organ that has massively evolved over time. The human brain size was considerably larger 28,000 years ago in the era of the Homo Neanderthalensis (1,736 cm3(2)) compared to the brain volume in the modern era (1,500 cm3(3)), making it more compact and effi cient. In line with the evolutionary path from our primates, such as chimpanzees, humans developed an extensive frontal lobe for emotion, planning, decision-making and higher cognitive functioning. This makes the human species unique compared to other species, but this development is also thought to have increased the risk to develop mental problems. Although this remains a hotly debated topic, the fundamental basis for at least some mental disorders is thought to be located in the brain. In the cerebrum, distinct cells are described based on color as pertaining to either white matter or gray matter. White matter received this name due to a high level of fat enabling fast connections between cortical areas. Cortical areas contain neural cells with specifi c function and have a gray color. The white matter forms the ‘roads’ interconnecting villages and cities with each other. Due to several factors (e.g. heavy traffi c or bad weather conditions) a road becomes less effi cient in handling traffi c resulting in traffi c jams, accidents and, as a result, an individual experiencing a degree of mental discomfort. Therefore, it is important to investigate cerebellar white matter in terms of ‘road work ahead’.
Men ought to know that from the brain, and from the brain only, arise our pleasures, joy, laughter and jests, as well as our sorrows, pains, griefs, and tears.
Hippocrates 460-377 BC.Psychosis spectrum disorderPsychotic disorder is a mental illness of widely varying but sometimes poor prognosis, with an estimated lifetime prevalence of 3.5% in the general

1
11
GENERAL INTRODUCTION
population (4), of which the poor outcome fraction (often referred to as ‘schizophrenia’) has a lifetime prevalence of 0.7% (5). The disorder is most frequently diagnosed in men, as evidenced by an incidence risk ratio of 1.42 relative to women (6). Psychotic disorder is a complex mental illness characterized by positive and negative symptoms and can be rather subtle, such as the incorrect observation of a person standing on side of the street at dusk, while on second notion this actually appears to be a lamppost. This illusion or visual misinterpretation has its origin in a temporary hitch in the processing and integration of information in the brain. The incorrect interpretation, personalizing a lamppost, is a factor contained within the mind of the person. The environment also plays a role in the incorrect observation, since visual perception was likely distorted given the fact that darkness was falling. These are fairly normal misconceptions happening to many people and they are usually not very disturbing or causing any major problems. Currently, the Diagnostic and Statistical Manual of Mental Disorder 5th edition (DSM-V) (7) is in use for the practice of diagnosis in clinical psychiatric practice. This ‘bible’ of mental health care provides a category named schizophrenia spectrum and other psychotic disorders and lists fi ve key symptoms of psychotic disorders: 1) delusions, 2) hallucinations, 3) disorganized speech, 4) disorganized or catatonic behavior, and 5) negative symptoms. A patient will be diagnosed with schizophrenia based on the observation of two of these fi ve symptoms and is required to have at minimum one of the fi rst three symptoms (delusions, hallucinations, and disorganized speech). When a person with solely isolated delusional thoughts visits a mental health professional for help, he/she will likely not be diagnosed with schizophrenia, although he/she may be treated for delusional disorder if the delusional thoughts are clinically relevant and impact functioning. Delusional thoughts are, per defi nition, held with certainty, cannot be changed and have bizarre or impossible content (8). Delusional thoughts can emerge from irrational beliefs, and the symptom can be detectable in an early stage before a diagnosis has been made (9). The early detection and prevention of further development into clinically relevant mental disorder can be of great value, especially in adolescents (10, 11). It is during this developmental phase, ranging from 16 to 26 years of

Chapter 1
12
age, that there are massive social, cognitive, maturational and developmental changes. Internal factors can be hormonal changes, emotional fl uctuations and novel feelings, while environmental factors such as social interactions, relationships, and career decisions likewise play a role (12, 13). These stressors could lead to an increased risk of psychopathology and could later contribute to the onset of psychotic disorder (14). Therefore, it is essential to investigate the pathway towards early psychosis and psychotic disorder. Over time, symptoms can occur more often and accumulate in frequency and degree of impact on daily life, causing a spiral of increasing levels of distress. It has been shown that psychosis may arise when general psychopathology becomes more severe and persistent (15-17), so that eventually a person may develop psychosis spectrum disorder.
Positive and negative symptomsBefore the onset of a fi rst psychotic episode, commonly a phase of subclinical symptoms is present, including subtle expression of positive and negative symptoms. These symptoms can fl uctuate over time and may lead to distress and impairment in daily life functioning. Broadly defi ned subclinical psychotic experiences have an estimated prevalence of 7% in the general population (18) and can predict the persistence and severity of later psychopathology (19). Subclinical psychotic experiences consist of mild or attenuated positive or negative psychotic experiences. Positive symptoms encompass delusions as described previously, but also include disordered thoughts and speech or hallucinations. The word hallucination originates from the Latin word alucinari, which means ‘to wander in the mind’ (20). A hallucination occurs when the brain perceives an event without having an external stimulus. These events can be intense, extensive and externalized. The resulting incorrect perception can be thought of as mediated by the brain and pertains to one of the senses; visual, auditory, proprioceptive, olfactory, tactile, equilibrioceptive, nociceptive, thermoceptive, chronoceptive or gustatory. Paracusia (hearing voices) affects more than 70% of the patients with psychotic disorder and can be very distressing (21). Hallucinations are sometimes distinguished from so-called nonpsychotic hallucinations, or pseudohallucinations, which could happen when the person perceives an external stimulus while knowing it is

1
13
GENERAL INTRODUCTION
unreal. However, in modern terms this could be more correctly described as hallucinatory experiences with retained insight.While positive symptoms are most visible and distressing, negative symptoms in psychotic disorder have gained increased research interest over the last decades (22). Negative symptoms can be described as a defi ciency of feelings or behaviors that are regularly present and include blunted emotions, loss of drive, social withdrawal and thought poverty (23). Additionally to these features, the MATRICS (Measurement and Treatment Research to Improve Cognition in Schizophrenia) identifi ed the following negative symptom domains; affective fl attening, alogia, avolition, asociality, and anhedonia (24). It is useful to not only investigate positive symptoms, but also consider negative symptoms that might be hidden underneath the more dramatic expression of psychosis. Several factors are related to the emergence of positive and negative symptoms.
Genetic vulnerability Genetics are thought to have a role in the risk related to the development of psychotic disorder (25). However, research on genetic vulnerability has been challenging. Based on the genetics literature in psychotic disorder, it can be concluded that the disorder is highly polygenic with many risk loci across the allelic frequency spectrum and that risk genes / alleles are shared with bipolar disorder, intellectual disability, major depression disorder and autism spectrum disorders (26). There are around 200 risk variants based on genome-wide association studies in psychotic disorder, but there are many more risk variants of which the risk levels are too small to stand out individually. An endophenotype – a behavioral, cognitive, biological or other marker of genetic risk - can be identifi ed via non-affected family members, who per defi nition have a higher rate of an endophenotype, or genetic marker, compared to the general population (27). Another option to investigate genetic factors is a model including siblings of patients with psychotic disorder. Because siblings share on average half of their genes with their ill brother or sister, this model allows investigating heritability and exploring environmental factors interacting with genetic risk, infl uencing disease development. Several environmental increasing the risk of psychotic disorder such as cannabis use, childhood trauma, and urbanicity

Chapter 1
14
have been described (28). Siblings of patients with psychotic disorder have a higher than average genetic risk for developing the disorder and therefore may be used productively in research focusing on endophenotypes or gene-environment interaction.
Daily life experience sampling method in subclinical psychosisExperience Sampling MethodThe Experience Sampling Method (ESM) is an ecological momentary technique and has been used in research to study feelings, thoughts, mood, and social functioning in daily life (29, 30). This structured electronic diary allows data collection in a naturalistic environment and has advantages over traditional assessment techniques (31). First, answers are provided in the moment and refl ect current thoughts and feelings instead of reporting how a person generally feels in a laboratory setting. This reduces recall biases to a minimum while it can be integrated in daily life (32, 33). Secondly, ESM measures multiple time points during the day (usually 10 times) allowing for trend analyses and detection of change over time. ESM can be customized to incorporate exercises in daily life and allows self-monitoring, self-insight and feedback to the patient (34). Furthermore, ESM can have added therapeutic value in treatments as demonstrated by two randomized controlled trials (RCT) (35, 36). The ESM technique has been applied in several research populations and, within the scope of the current thesis, the current focus will be on ESM in psychotic disorder.
ESM in psychotic disorderESM is known as a feasible, valid and reliable method to assess psychotic disorder in a daily context (37-39). Based on several studies it can be concluded that patients with psychotic disorder report similar levels of positive emotions compared to controls (40-42). This notion might be interpreted as an intact hedonic capacity, although this might not be true (43, 44). An explanation of this might be that patients with psychotic disorder tend to engage less in pleasurable activities compared to controls, while still enjoying the event when engaged to it (40-42). The underlying mechanism of pleasure forecasting or the anticipation of reward therefore

1
15
GENERAL INTRODUCTION
plays an important role in psychotic disorder. This might be related to positive and negative affect due to some sort of disconnect that may exist between engaging to enjoyable activities (anticipation) and liking the event at that moment.Assessment of positive and negative affect usually is accomplished by factorizing items that are based on questions on a seven-point Likert-scale (45). A consistent fi nding in people with psychotic disorder shows increased negative emotion (effect size of 0.84) and decreased positive emotion (effect size -0.75) compared to healthy controls (46). These results are in agreement with research using questionnaires such as the PANAS (Positive and Negative Affect Schedule (47)). Research into delusional moments in patients has shown that these moments are frequently accompanied by increased negative and decreased positive affect, further fuelling psychotic symptoms in daily life (48).
ESM in subclinical psychosisWhile most ESM research has focused on psychotic disorder, literature on ESM in subclinical psychosis is limited. A study on the so-called at-risk mental state (ARMS), and additionally a study on the conceptually similar ultra-high-risk state (49, 50), reported increased emotional reactivity to activity-related items and social stress (51). Stress sensitization and related distress might be a key feature inducing further psychotic experience development. Furthermore, aberrant salient experiences are stronger linked with psychotic experiences in ARMS compared to control individuals (52). Aberrant salience might be an early indication before onset of psychotic disorder. This concept has been closely related to motivational impairment.
Brain alterations in psychotic disorder and subclinical psychosisMagnetic Resonance ImagingSince the fi rst experiments on Magnetic Resonance Imaging (MRI) in 1971 (53), the technique has evolved signifi cantly over time. Nowadays cutting-edge techniques allow for sub-millimeter image acquisition in order to examine white matter and gray matter. The structural white matter tracts enable connections between brain regions on the cortex. The cortex mainly

Chapter 1
16
consists of gray matter and has dedicated functions located at specifi c regions. White matter can be examined using Diffusion Weighted Imaging (DWI; see below), while gray matter can be investigated using functional MRI based on activation derived from the Blood-Oxygen Dependent (BOLD) contrast. FMRI was invented in 1992 and allows for the dynamic assessment of the brain in-vivo based on a signal that is indirectly related to energy consumption of the brain (54). This BOLD signal originates from the hemodynamic response as blood releases oxygen to the neurons that require energy because of an active task or function. In turn, the relative levels of oxyhemoglobin and deoxyhemoglobin change resulting in a measurable alteration of differential magnetic susceptibility (55). With the application of fMRI task related BOLD signal can be recorded via time series enabling dynamic evaluation of the human brain in-vivo. MRI has been widely used in clinical research and has been applied to examine the neurobiological basis of psychotic disorder.
Brain volume and morphometry in psychotic disorderBrain MRI research in psychotic disorder begun in the year 1984 by describing and visualizing morphometric properties using a 0.3T (Tesla) scanner (56). An increase in cerebrospinal fl uid (CSF) in psychotic disorder was noted and prominent in the frontal horns (57). This notion has been further examined and it became apparent that lateral ventricular and third ventricular enlargement were related to psychotic disorder (58) in combination with gray matter defi cits located in the left superior temporal gyrus and the left medial temporal lobe (59). Loss of gray matter in these specifi c areas may be linked to hallucinations and formal thought disorder. Furthermore, morphometric changes may also occur in siblings of patients with psychotic disorder. Research suggests they show a divergent developmental pattern with lower cortical thickness in the prefrontal and temporal cortex compared to healthy controls (60-62). Additionally, there is some evidence that the development of young adults at high risk for psychotic disorder is associated with smaller fronto-temporal cortical regions (63). Morphometry allows for detecting crude overall changes and might be fairly non-specifi c. As psychotic disorder has been described as a white matter disorder, perhaps more specifi c MRI techniques can

1
17
GENERAL INTRODUCTION
contribute to a better understanding of myelin alterations.
Diffusion Weighted Imaging In 1985, DWI was invented to study white matter abnormalities in-vivo via molecular diffusion (64). The principles of DWI are based on Brownian motion (or isotropic diffusion), which can be more or less restricted by surrounding structures (65). In CSF, there is no restriction of free water movement and therefore isotropic diffusion can happen within the molecules without a preferable path. Highly myelinated white matter has a profound directionality called anisotropic diffusion and restricts/hinders the movement of molecules to the myelin sheet surrounding the axons. The fatty myelin sheet allows for a fast transmission of electrical signals trough axons connecting brain regions (66, 67). Diffusion in the brain can quantify specifi c properties of the underlying microstructure on the voxel level. A voxel is a volume element, which captures properties of cells within the volume commonly in the order of magnitude of 2mm3. While DWI indeed captures several distinct processes in cells within one voxel, several studies have shown the added value of quantifi cation of white matter.
DWI measurementsThe composition of white matter can be quantifi ed using measures derived from the DWI acquisition. A commonly used measure to express ‘integrity’ is the Fractional Anisotropy (FA). This measure refl ects a mixture of axonal density, fi ber density and myelination in a fairly non-specifi c matter and can range from 0 (isotropic diffusion and unrestricted movement of water molecules) to 1 (anisotropic diffusion and full restriction of movement along one axis) (68-71). Next to FA, axial (AXD) and radial diffusivity (RAD) measurements provide more detail on white matter composition. Decreased AXD has been related to axonal injury/loss and may be related to the number of axons within the white matter (72). Additionally to AXD, RAD is able to quantify the diffusion of water perpendicular to the main axis. RAD might increase as an indication of demyeliniation allowing more free diffusion perpendicular to the main direction (73, 74). Over the last decades DWI measurements have been applied to further investigate microstructural white matter alterations in psychotic disorder.

Chapter 1
18
DWI in psychotic disorderThe “disconnection hypothesis” in psychotic disorder proposes that communication between regions is impaired (75). This concept has been studied extensively and in chronic psychotic disorder, FA reductions have been suggested in the left frontal and left temporal white matter regions when compared against healthy controls. Specifi cally, the genu and splenium of corpus callosum, cingulum bundle, fornix, left anterior thalamic radiation (ATR), left corticobulbar tract, left inferior fronto-occipital fasciculus (IFOF), and left inferior longitudinal fasciculus (ILF) may show decreased FA in patients (76, 77). In patients with a fi rst-episode, white matter volume reductions occur in frontal regions and the bilateral internal capsula (78). Although reports of FA reductions are dominating the white matter literature in psychotic disorder, some studies comparing ultra-high risk patients who convert to psychosis against non-converters may show increased FA. These increases are located in the left medial temporal lobe (79), arcuate fasciculus bilaterally (80, 81), left anterior cingulum and left superior longitudinal fasciculus (SLF) (82) and may be related to auditory hallucinations.
DWI in siblings and subclinical populationsResearch on white matter alterations in siblings and subclinical populations can provide information on the emergence of psychotic disorder. Individuals at higher than average genetic risk of developing a psychotic disorder seem to have lower FA compared to healthy controls in the corpus callosum (83), bilateral cuneus (84), ILF, IFOF (85), and SLF (86). However some studies showed no difference in FA between siblings and controls (87). Psychotic disorder has been theorized as a disorder of disturbed neurodevelopment and potentially white matter alterations occur before disease onset. DWI research in subclinical populations is limited to a few studies and is heterogeneous. One study showed that psychosis-like personality traits are negatively associated with FA located in the ATR, genu of the corpus callosum, uncinate fasciculus (UF) and IFOF (88). And another study in individuals at ultra-high risk for psychosis showed lower FA compared to healthy controls in SLF (89). Especially during adolescence, the detection

1
19
GENERAL INTRODUCTION
of developmental disturbance may be important. It is during this phase that psychopathology starts to emerge with several environmental factors involved. White matter plasticity may hold a key role in elucidating this process.
White matter plasticity The brain can, to a certain extent, adapt to a changing environment and can refi ne or weaken white matter connections. The time frame in which white matter plasticity takes place ranges from one day to months. Attempts to explore white matter plasticity provided evidence that working memory training can lead to increased FA in left parietal and frontal white matter, whereas meditation training may result in increased FA in corpus callosum and medial anterior corona radiata (90). Currently, there remains a dearth of knowledge on white matter plasticity in individuals with subclinical psychosis at the mild end of the psychosis spectrum, as well as in psychotic disorder.
Reward anticipation alterations in psychotic disorder and subclinical psychosisThe dopamine hypothesisBesides the structural alterations related to (the emergence of) psychotic disorder, many functional alterations take place. In psychotic disorder, the dopamine hypothesis is a long standing hypothesis and has been developed and indeed has been researched a lot since the discovery of antipsychotic medication (91). Dopamine is a neurotransmitter in the brain that is involved in eight distinct circuits. Especially dopamine D
2 receptor functioning is a main target in the treatment of psychotic disorder. The basis for this originates from research on two specifi c dopamine circuits; the mesolimbic and the mesocortical pathway. The mesolimbic pathway, the main reward pathway, originates in the ventral tegmental area (VTA) and projects via the ventral striatum (VS) to regions in the frontal lobe that are related to the limbic system. It is thought to mediate incentive salience (i.e. desire and want) to a rewarding stimulus and the perception of pleasure. The nucleus accumbens (NAC), embedded in the VS, holds a central role in the reward system by mediating the process of reward valuing (92). Valuing

Chapter 1
20
happens when a rewarding stimulus is presented and processed, resulting in dopamine release in the NAC. The mesocortical pathway also originates in the VTA and projects to the prefrontal cortex. This pathway is thought to mediate basic cognitive tasks, emotional responses and motivation. The two pathways may have a central role in explaining symptoms related to psychotic disorder. Positive symptoms have traditionally been related to the mesolimbic pathway, while negative symptoms are hypothesized to be related to the mesocortical pathway (93), although this is a simplifi cation as negative symptoms can well be explained from mesolimbic alterations and many other neurotransmitters are involved. Aberrant salience in psychotic disorder is proposed as an over-attribution of meaning and motivational value to irrelevant stimuli (94), which can be attributed to dysfunction of the reward system.
FMRI reward anticipation In psychotic disorder, the reward system has been extensively investigated, specifi cally the anticipation of reward as a concept of aberrant salience. With the application of fMRI, these mechanisms can be explored and have shown hypo-activation in the VS during reward anticipation in psychotic disorder (95). This hypo-activation has been widely reported, but research at the phenotypic level of subclinical psychotic experiences is less abundant and more inconsistent. Two studies found hypo-activation in the VS during reward anticipation in ultra-high risk samples compared to healthy controls (96, 97), while two other studies found no differences (98, 99). Another study using polygenetic risk profi le scores (PRS) for psychosis showed a positive association between PRS and VS activation during reward anticipation (100). The monetary incentive delay task (MIDt) has been developed to examine reward anticipation during fMRI recording (101, 102). In the MIDt, participants can win money or prevent losing money by making the correct decisions. The task has been designed to invoke activation related to reward anticipation in the ventral striatum, ventral medial prefrontal cortex (VMPFC), and VTA. One of the aims of this thesis was to investigate reward anticipation in a sample with subclinical psychotic experiences.

1
21
GENERAL INTRODUCTION
ESM and brain structural changesResearch on the link between daily life behavioral (measured via ESM) and white matter alterations is limited. However, it remains important to associate both techniques in order to get a better understanding of the working mechanisms underlying the early stages of a disorder. Everyday life experiences (103) and physical or mental skill acquisition (104) can have an effect on brain structure. These changes might occur due to changes in impulse transmission through spatially distinct, but functionally related regions (105). A daily life self-monitoring measurement tool such as ESM contributes to the evaluation of behavioral alterations in early stages of illness and may contribute to early detection. Moreover, as a feedback tool and platform for therapy exercises, it may help individuals in building resilience. Therefore, it would be interesting to know whether early behavioral changes occur in parallel with early brain changes and can be detected in early developmental stages. As said before, ESM has, besides monitoring, a role in feedback and in exercises as part of psychological training, such as Acceptance and Commitment Therapy (ACT). This third-generation behavioral therapy might be of great importance in populations with subclinical psychopathology targeting mild symptoms (106). As a potential early intervention, it may help young people to better understand and deal with their complaints. Integration of ACT in daily life is important to go beyond clinical care outside of the caretakers’ offi ce. Thus, integrating daily life symptomatology with therapeutic mechanisms, and combining it with biological mechanisms, may contribute to better understanding of cerebral mechanisms and brain plasticity in individuals with psychosis spectrum syndromes or symptoms.

Chapter 1
22
Sample descriptionsGenetic Risk and Outcome of Psychosis (G.R.O.U.P.)The data were collected in collaboration within a consortium (the academic psychiatric hospitals of Utrecht, Groningen, Amsterdam and their affi liations) in an observational cohort study entitled Genetic Risk and Outcome of Psychosis (G.R.O.U.P.) in the Netherlands. This study was conducted from April 2004 till December 2013 aiming at understanding the interplay between genetic, biological, psychological and social factors. The baseline assessment consisted of 1120 patients with psychotic disorder, 1057 healthy siblings of the patients, 919 parents and 590 unrelated healthy controls (107). Data included symptomatology measures, blood samples, urine samples, and risk and protective factors. In Maastricht, additionally, MRI scans were acquired using a 3T Allegra syngo MR A30 Siemens scanner. The fi rst part of this thesis describes studies performed (in part) with this sample.
SmartscanThe Self-Management of Altered environmental Reactivity Training SCANning (Smartscan) was an intervention project applying ACT-related self-management techniques for early expression of psychopathology. This experimental randomized controlled trial (RCT) study aimed at linking neural and mental state reactivity in a sample of young adolescents (16-25 years old). In total 199 participants were included in the study, who received an extensive assessment including psychiatric interview, neuropsychological testing, blood sample, ESM and MRI. Smartscan had an RCT embedded in the project design and the same assessment was conducted after the intervention. A total of 53 participants were included in the RCT and randomized for ACT or topic discussion group conditions. MRI scans for this project were acquired at Scannexus Maastricht using a 3T Prisma Siemens scanner. The second part of this thesis describes studies conducted with (a subgroup of) this sample.

1
23
GENERAL INTRODUCTION
Aim of this thesisThe overall aim of this thesis was to examine cerebral pathways in order to understand, at the biological cerebral level, the psychological mechanisms underlying the psychosis spectrum. The pathways in this context are the white matter connections in the brain. Both extremes of the psychosis spectrum, ranging from subclinical psychotic experience to schizophrenia, were investigated. Details of white matter composition included fractional anisotropy, axial diffusivity, radial diffusivity, mean diffusivity and the network measures global/local effi ciency and clustering coeffi cient. Effects of a psychological intervention (ACT) on these white matter parameters were explored. Furthermore, the thesis reports on reward anticipation in a sample with subclinical psychotic experiences.

Chapter 1
24
Thesis outlineThe fi rst part of the thesis reports on the GROUP study. In the study described in chapter 2, details on white matter alteration in patients with psychotic disorder and their healthy siblings are described. It was hypothesized that more detailed measures would provide additional information on white matter ‘integrity’ besides the frequently used fractional anisotropy (FA) measure. This was investigated with the use of axial (AXD), radial (RAD) and mean (MD) diffusivity and tensor shape measures (case linear, case planar and case spherical). In chapter 3 the inter-regional network connectivity was examined in the same sample. It was hypothesized that graph theory would show structural network-connectivity decreases in psychotic disorder.Part two comprises three studies from the Smartscan project. On a brain functional level, it was expected that reward anticipation within a sample of youngsters with mild psychopathology/psychotic experiences from the general population, would be decreased in specifi c reward related regions such as the ventral striatum and ventral tegmental area, as described in chapter 4. Chapter 5 examined structural white matter alterations, in line with previous research on psychotic disorder, it was hypothesized that in this sample of emerging adults white matter integrity (as measured via FA) would be decreased, myelination would be decreased and network-based connectivity would also be altered. The evaluation of the effects of an ACT intervention in the same individuals with mild psychopathology, applied through an RCT design, has been explained in chapter 6. It was anticipated that the intervention would decrease symptomatology, increase daily life functioning and restore white matter connections. The general discussion (chapter 7) provides a critical appraisal of the signifi cance and clinical implications of the fi ndings.

1
25
GENERAL INTRODUCTION
ReferencesAzevedo FAC, Carvalho LRB, Grinberg 1. LT, Farfel JM, Ferretti REL, Leite REP, et al. Equal numbers of neuronal and nonneuronal cells make the human brain an isometrically scaled-up primate brain. J Comp Neurol. 2009;513(5):532-41.Amano H, Kikuchi T, Morita Y, Kondo O, 2. Suzuki H, Ponce de Leon MS, et al. Virtual reconstruction of the Neanderthal Amud 1 cranium. Am J Phys Anthropol. 2015.Michielse S, Coupland N, Camicioli R, 3. Carter R, Seres P, Sabino J, et al. Selective effects of aging on brain white matter microstructure: a diffusion tensor imaging tractography study. Neuroimage. 2010;52(4):1190-201.Guloksuz S, van Os J. The slow death of 4. the concept of schizophrenia and the painful birth of the psychosis spectrum. Psychological medicine. 2017:1-16.McGrath J, Saha S, Chant D, Welham J. 5. Schizophrenia: a concise overview of incidence, prevalence, and mortality. Epidemiol Rev. 2008;30:67-76.Aleman A, Kahn RS, Selten JP. Sex 6. differences in the risk of schizophrenia: evidence from meta-analysis. Arch Gen Psychiatry. 2003;60(6):565-71.American Psychiatric Association., 7. American Psychiatric Association. DSM-5 Task Force. Diagnostic and statistical manual of mental disorders : DSM-5. 5th ed. Washington, D.C.: American Psychiatric Association; 2013. xliv, 947 p. p.Jaspers K. Allgemeine psychopathologie. 8. Berlin,: J. Springer; 1913.Bortolotti L. Delusions and other 9. irrational beliefs. Oxford: Oxford University Press; 2010. xvii, 299 p. p.Chan V. Schizophrenia and Psychosis: 10. Diagnosis, Current Research Trends, and Model Treatment Approaches with Implications for Transitional Age Youth. Child Adolesc Psychiatr Clin N Am. 2017;26(2):341-66.McGorry PD. “A stitch in time” ... the 11. scope for preventive strategies in early psychosis. Eur Arch Psychiatry Clin Neurosci. 1998;248(1):22-31.Blakemore S-J. Imaging brain 12. development: the adolescent brain. NeuroImage. 2012;61(2):397-406.Casey BJ, Getz S, Galvan A. 13. The adolescent brain. Dev Rev.
2008;28(1):62-77.Yung AR, Phillips LJ, Yuen HP, Francey 14. SM, McFarlane CA, Hallgren M, et al. Psychosis prediction: 12-month follow up of a high-risk (“prodromal”) group. Schizophr Res. 2003;60(1):21-32.Guloksuz S, van Nierop M, Lieb R, 15. van Winkel R, Wittchen HU, van Os J. Evidence that the presence of psychosis in non-psychotic disorder is environment-dependent and mediated by severity of non-psychotic psychopathology. Psychol Med. 2015;45(11):2389-401.Guloksuz S, van Nierop M, Bak M, de 16. Graaf R, Ten Have M, van Dorsselaer S, et al. Exposure to environmental factors increases connectivity between symptom domains in the psychopathology network. BMC Psychiatry. 2016;16:223.van Os J, Reininghaus U. Psychosis as a 17. transdiagnostic and extended phenotype in the general population. World Psychiatry. 2016;15(2):118-24.Linscott RJ, van Os J. An updated 18. and conservative systematic review and meta-analysis of epidemiological evidence on psychotic experiences in children and adults: on the pathway from proneness to persistence to dimensional expression across mental disorders. Psychol Med. 2013;43(6):1133-49.Kline E, Thompson E, Bussell K, Pitts 19. SC, Reeves G, Schiffman J. Psychosis-like experiences and distress among adolescents using mental health services. Schizophr Res. 2014;152(2-3):498-502.Browne T. Pseudodoxia epidemica, 20. or, Enquiries into very many received tenents and commonly presumed truths. London: Printed by T.H. for E. Dod; 1646. 19 p. p.Hugdahl K, Loberg EM, Specht K, Steen 21. VM, van Wageningen H, Jorgensen HA. Auditory hallucinations in schizophrenia: the role of cognitive, brain structural and genetic disturbances in the left temporal lobe. Front Hum Neurosci. 2007;1:6.Remington G, Foussias G, Fervaha G, 22. Agid O, Takeuchi H, Lee J, et al. Treating Negative Symptoms in Schizophrenia: an Update. Curr Treat Options Psychiatry. 2016;3:133-50.Foussias G, Agid O, Fervaha G, 23. Remington G. Negative symptoms of

Chapter 1
26
schizophrenia: clinical features, relevance to real world functioning and specifi city versus other CNS disorders. Eur Neuropsychopharmacol. 2014;24(5):693-709.Kirkpatrick B, Fenton WS, Carpenter 24. WT, Jr., Marder SR. The NIMH-MATRICS consensus statement on negative symptoms. Schizophr Bull. 2006;32(2):214-9.Corvin A, Sullivan PF. What Next 25. in Schizophrenia Genetics for the Psychiatric Genomics Consortium? Schizophr Bull. 2016;42(3):538-41.Kavanagh DH, Tansey KE, O’Donovan 26. MC, Owen MJ. Schizophrenia genetics: emerging themes for a complex disorder. Mol Psychiatry. 2015;20(1):72-6.Gottesman, II, Gould TD. The 27. endophenotype concept in psychiatry: etymology and strategic intentions. Am J Psychiatry. 2003;160(4):636-45.Cougnard A, Marcelis M, Myin-Germeys 28. I, De Graaf R, Vollebergh W, Krabbendam L, et al. Does normal developmental expression of psychosis combine with environmental risk to cause persistence of psychosis? A psychosis proneness-persistence model. Psychological medicine. 2007;37(4):513-27.Csikszentmihalyi M, Larson R. Validity 29. and reliability of the Experience-Sampling Method. J Nerv Ment Dis. 1987;175(9):526-36.Myin-Germeys I, Oorschot M, Collip 30. D, Lataster J, Delespaul P, van Os J. Experience sampling research in psychopathology: opening the black box of daily life. Psychol Med. 2009;39(9):1533-47.Myin-Germeys I, van Os J. Stress-31. reactivity in psychosis: evidence for an affective pathway to psychosis. Clin Psychol Rev. 2007;27(4):409-24.Ebner-Priemer UW, Trull TJ. Ecological 32. momentary assessment of mood disorders and mood dysregulation. Psychol Assess. 2009;21(4):463-75.Shiffman S, Stone AA, Hufford MR. 33. Ecological momentary assessment. Annu Rev Clin Psychol. 2008;4:1-32.van Os J, Verhagen S, Marsman A, 34. Peeters F, Bak M, Marcelis M, et al. The experience sampling method as an mHealth tool to support self-monitoring, self-insight, and personalized health care in clinical practice. Depress Anxiety.
2017;34(6):481-93.Hartmann JA, Wichers M, Menne-35. Lothmann C, Kramer I, Viechtbauer W, Peeters F, et al. Experience sampling-based personalized feedback and positive affect: a randomized controlled trial in depressed patients. PLoS One. 2015;10(6):e0128095.Kramer I, Simons CJP, Hartmann JA, 36. Menne-Lothmann C, Viechtbauer W, Peeters F, et al. A therapeutic application of the experience sampling method in the treatment of depression: a randomized controlled trial. World Psychiatry. 2014;13(1):68-77.Kimhy D, Delespaul P, Corcoran C, Ahn 37. H, Yale S, Malaspina D. Computerized experience sampling method (ESMc): assessing feasibility and validity among individuals with schizophrenia. J Psychiatr Res. 2006;40(3):221-30.Myin-Germeys I, Birchwood M, Kwapil 38. T. From environment to therapy in psychosis: a real-world momentary assessment approach. Schizophr Bull. 2011;37(2):244-7.Myin-Germeys I, Delespaul PA, deVries 39. MW. Schizophrenia patients are more emotionally active than is assumed based on their behavior. Schizophr Bull. 2000;26(4):847-54.Gard DE, Kring AM, Gard MG, 40. Horan WP, Green MF. Anhedonia in schizophrenia: distinctions between anticipatory and consummatory pleasure. Schizophr Res. 2007;93(1-3):253-60.Gard DE, Sanchez AH, Cooper K, 41. Fisher M, Garrett C, Vinogradov S. Do people with schizophrenia have diffi culty anticipating pleasure, engaging in effortful behavior, or both? J Abnorm Psychol. 2014;123(4):771-82.Oorschot M, Lataster T, Thewissen V, 42. Lardinois M, Wichers M, van Os J, et al. Emotional experience in negative symptoms of schizophrenia--no evidence for a generalized hedonic defi cit. Schizophr Bull. 2013;39(1):217-25.Kring AM, Caponigro JM. Emotion 43. in Schizophrenia: Where Feeling Meets Thinking. Curr Dir Psychol Sci. 2010;19(4):255-9.Kring AM, Elis O. Emotion defi cits in 44. people with schizophrenia. Annu Rev Clin Psychol. 2013;9:409-33.Likert R. A Technique for the 45.

1
27
GENERAL INTRODUCTION
Measurement of Attitudes. Archives of Psychology. 1932;22(140).Cho H, Gonzalez R, Lavaysse LM, Pence 46. S, Fulford D, Gard DE. Do people with schizophrenia experience more negative emotion and less positive emotion in their daily lives? A meta-analysis of experience sampling studies. Schizophr Res. 2017;183:49-55.Watson D. CLA. The PANAS-X: Manual 47. for the Positive and Negative Affect Schedule-Expanded Form.: Cedar Rapids: University of Iowa; 1994.Myin-Germeys I, Nicolson NA, 48. Delespaul PA. The context of delusional experiences in the daily life of patients with schizophrenia. Psychological medicine. 2001;31(3):489-98.Fusar-Poli P, Borgwardt S, Bechdolf A, 49. Addington J, Riecher-Rossler A, Schultze-Lutter F, et al. The psychosis high-risk state: a comprehensive state-of-the-art review. JAMA Psychiatry. 2013;70(1):107-20.Yung AR, Yuen HP, McGorry PD, Phillips 50. LJ, Kelly D, Dell’Olio M, et al. Mapping the onset of psychosis: the Comprehensive Assessment of At-Risk Mental States. Aust N Z J Psychiatry. 2005;39(11-12):964-71.Palmier-Claus JE, Dunn G, Lewis SW. 51. Emotional and symptomatic reactivity to stress in individuals at ultra-high risk of developing psychosis. Psychological medicine. 2012;42(5):1003-12.Reininghaus U, Kempton MJ, Valmaggia 52. L, Craig TKJ, Garety P, Onyejiaka A, et al. Stress Sensitivity, Aberrant Salience, and Threat Anticipation in Early Psychosis: An Experience Sampling Study. Schizophr Bull. 2016;42(3):712-22.Lauterbur PC. Image formation by 53. induced local interactions. Examples employing nuclear magnetic resonance. 1973. Clin Orthop Relat Res. 1989(244):3-6.Ogawa S, Tank DW, Menon R, Ellermann 54. JM, Kim SG, Merkle H, et al. Intrinsic signal changes accompanying sensory stimulation: functional brain mapping with magnetic resonance imaging. Proc Natl Acad Sci U S A. 1992;89(13):5951-5.Ogawa S, Lee TM, Kay AR, Tank DW. 55. Brain magnetic resonance imaging with contrast dependent on blood oxygenation. Proc Natl Acad Sci U S A. 1990;87(24):9868-72.
Smith RC, Calderon M, Ravichandran 56. GK, Largen J, Vroulis G, Shvartsburd A, et al. Nuclear magnetic resonance in schizophrenia: a preliminary study. Psychiatry Res. 1984;12(2):137-47.Andreasen NC. Evaluation of brain 57. imaging techniques in mental illness. Annu Rev Med. 1988;39:335-45.Shenton ME, Dickey CC, Frumin M, 58. McCarley RW. A review of MRI fi ndings in schizophrenia. Schizophr Res. 2001;49(1-2):1-52.Honea R, Crow TJ, Passingham D, 59. Mackay CE. Regional defi cits in brain volume in schizophrenia: a meta-analysis of voxel-based morphometry studies. The American journal of psychiatry. 2005;162(12):2233-45.Moran ME, Hulshoff Pol H, Gogtay N. 60. A family affair: brain abnormalities in siblings of patients with schizophrenia. Brain. 2013;136(Pt 11):3215-26.Gogtay N, Sporn A, Clasen LS, 61. Greenstein D, Giedd JN, Lenane M, et al. Structural brain MRI abnormalities in healthy siblings of patients with childhood-onset schizophrenia. The American journal of psychiatry. 2003;160(3):569-71.Ordonez AE, Luscher ZI, Gogtay N. 62. Neuroimaging fi ndings from childhood onset schizophrenia patients and their non-psychotic siblings. Schizophr Res. 2016;173(3):124-31.Brent BK, Thermenos HW, Keshavan 63. MS, Seidman LJ. Gray matter alterations in schizophrenia high-risk youth and early-onset schizophrenia: a review of structural MRI fi ndings. Child and adolescent psychiatric clinics of North America. 2013;22(4):689-714.Le Bihan D. [Microcomputer simulation 64. of nuclear magnetic resonance imaging contrasts]. J Radiol. 1985;66(4):303-8.Einstein A. Über die von der 65. molekularkinetischen Theorie der Wärme geforderte Bewegung von in ruhenden Flüssigkeiten suspendierten Teilchen. Annalen der Physik. 1905;322(8):549-60.Moseley ME, Cohen Y, Kucharczyk J, 66. Mintorovitch J, Asgari HS, Wendland MF, et al. Diffusion-weighted MR imaging of anisotropic water diffusion in cat central nervous system. Radiology. 1990;176(2):439-45.Virchow R. Ueber das ausgebreitete 67.
Chapter 1
28
Vorkommen einer dem Nervenmark analogen Substanz in den thierischen Geweben. Archiv für pathologische Anatomie und Physiologie und für klinische Medicin. 1854;6(4):562-72.Basser PJ, Pierpaoli C. Microstructural 68. and physiological features of tissues elucidated by quantitative-diffusion-tensor MRI. J Magn Reson B. 1996;111(3):209-19.Mori S, Zhang J. Principles of diffusion 69. tensor imaging and its applications to basic neuroscience research. Neuron. 2006;51(5):527-39.O’Donnell LJ, Pasternak O. Does 70. diffusion MRI tell us anything about the white matter? An overview of methods and pitfalls. Schizophr Res. 2015;161(1):133-41.Assaf Y, Pasternak O. Diffusion tensor 71. imaging (DTI)-based white matter mapping in brain research: a review. J Mol Neurosci. 2008;34(1):51-61.Song SK, Sun SW, Ju WK, Lin SJ, Cross 72. AH, Neufeld AH. Diffusion tensor imaging detects and differentiates axon and myelin degeneration in mouse optic nerve after retinal ischemia. Neuroimage. 2003;20(3):1714-22.Song SK, Yoshino J, Le TQ, Lin SJ, Sun 73. SW, Cross AH, et al. Demyelination increases radial diffusivity in corpus callosum of mouse brain. Neuroimage. 2005;26(1):132-40.Giorgio A, Watkins KE, Douaud G, 74. James AC, James S, De Stefano N, et al. Changes in white matter microstructure during adolescence. Neuroimage. 2008;39(1):52-61.Friston KJ, Frith CD. Schizophrenia: a 75. disconnection syndrome? Clin Neurosci. 1995;3(2):89-97.Ellison-Wright I, Bullmore E. Meta-76. analysis of diffusion tensor imaging studies in schizophrenia. Schizophrenia research. 2009;108(1-3):3-10.Vitolo E, Tatu MK, Pignolo C, Cauda F, 77. Costa T, Ando A, et al. White matter and schizophrenia: A meta-analysis of voxel-based morphometry and diffusion tensor imaging studies. Psychiatry Res. 2017;270:8-21.Di X, Chan RCK, Gong Q-y. White 78. matter reduction in patients with schizophrenia as revealed by voxel-based morphometry: an activation likelihood estimation meta-analysis. Prog
Neuropsychopharmacol Biol Psychiatry. 2009;33(8):1390-4.Bloemen OJN, de Koning MB, Schmitz N, 79. Nieman DH, Becker HE, de Haan L, et al. White-matter markers for psychosis in a prospective ultra-high-risk cohort. Psychological medicine. 2010;40(8):1297-304.Hubl D, Koenig T, Strik W, Federspiel 80. A, Kreis R, Boesch C, et al. Pathways that make voices: white matter changes in auditory hallucinations. Archives of general psychiatry. 2004;61(7):658-68.Rotarska-Jagiela A, Oertel-Knoechel V, 81. DeMartino F, van de Ven V, Formisano E, Roebroeck A, et al. Anatomical brain connectivity and positive symptoms of schizophrenia: a diffusion tensor imaging study. Psychiatry Res. 2009;174(1):9-16.Shergill SS, Kanaan RA, Chitnis XA, 82. O’Daly O, Jones DK, Frangou S, et al. A diffusion tensor imaging study of fasciculi in schizophrenia. The American journal of psychiatry. 2007;164(3):467-73.Knochel C, Oertel-Knochel V, 83. Schonmeyer R, Rotarska-Jagiela A, van de Ven V, Prvulovic D, et al. Interhemispheric hypoconnectivity in schizophrenia: Fiber integrity and volume differences of the corpus callosum in patients and unaffected relatives. Neuroimage. 2012;59(2):926-34.Moran ME, Luscher ZI, McAdams H, 84. Hsu JT, Greenstein D, Clasen L, et al. Comparing fractional anisotropy in patients with childhood-onset schizophrenia, their healthy siblings, and normal volunteers through DTI. Schizophr Bull. 2015;41(1):66-73.Oestreich LK, McCarthy-Jones S, 85. Australian Schizophrenia Research B, Whitford TJ. Decreased integrity of the fronto-temporal fi bers of the left inferior occipito-frontal fasciculus associated with auditory verbal hallucinations in schizophrenia. Brain imaging and behavior. 2015.Nakamura K, Kawasaki Y, Takahashi 86. T, Furuichi A, Noguchi K, Seto H, et al. Reduced white matter fractional anisotropy and clinical symptoms in schizophrenia: a voxel-based diffusion tensor imaging study. Psychiatry Res. 2012;202(3):233-8.Harms MP, Akhter KD, Csernansky JG, 87. Mori S, Barch DM. Fractional anisotropy in individuals with schizophrenia and

1
29
GENERAL INTRODUCTION
their nonpsychotic siblings. Psychiatry Res. 2015;231(1):87-91.Grazioplene RG, Chavez RS, Rustichini A, 88. DeYoung CG. White matter correlates of psychosis-linked traits support continuity between personality and psychopathology. J Abnorm Psychol. 2016;125(8):1135-45.Karlsgodt KH, Niendam TA, Bearden 89. CE, Cannon TD. White matter integrity and prediction of social and role functioning in subjects at ultra-high risk for psychosis. Biol Psychiatry. 2009;66(6):562-9.Valkanova V, Eguia Rodriguez R, Ebmeier 90. KP. Mind over matter--what do we know about neuroplasticity in adults? Int Psychogeriatr. 2014;26(6):891-909.Tost H, Alam T, Meyer-Lindenberg 91. A. Dopamine and psychosis: theory, pathomechanisms and intermediate phenotypes. Neurosci Biobehav Rev. 2010;34(5):689-700.Floresco SB. The nucleus accumbens: 92. an interface between cognition, emotion, and action. Annu Rev Psychol. 2015;66:25-52.Howes OD, Kapur S. The dopamine 93. hypothesis of schizophrenia: version III--the fi nal common pathway. Schizophr Bull. 2009;35(3):549-62.Kapur S. Psychosis as a state of aberrant 94. salience: a framework linking biology, phenomenology, and pharmacology in schizophrenia. The American journal of psychiatry. 2003;160(1):13-23.Radua J, Schmidt A, Borgwardt S, Heinz 95. A, Schlagenhauf F, McGuire P, et al. Ventral Striatal Activation During Reward Processing in Psychosis: A Neurofunctional Meta-Analysis. JAMA Psychiatry. 2015;72(12):1243-51.Juckel G, Friedel E, Koslowski M, 96. Witthaus H, Ozgurdal S, Gudlowski Y, et al. Ventral striatal activation during reward processing in subjects with ultra-high risk for schizophrenia. Neuropsychobiology. 2012;66(1):50-6.Wotruba D, Heekeren K, Michels L, 97. Buechler R, Simon JJ, Theodoridou A, et al. Symptom dimensions are associated with reward processing in unmedicated persons at risk for psychosis. Front Behav Neurosci. 2014;8:382.Kirschner M, Hager OM, Muff L, Bischof 98. M, Hartmann-Riemer MN, Kluge A, et al. Ventral Striatal Dysfunction and
Symptom Expression in Individuals With Schizotypal Personality Traits and Early Psychosis. Schizophr Bull. 2016.Bourque J, Spechler PA, Potvin S, Whelan 99. R, Banaschewski T, Bokde ALW, et al. Functional Neuroimaging Predictors of Self-Reported Psychotic Symptoms in Adolescents. The American journal of psychiatry. 2017;174(6):566-75.Lancaster TM, Linden DE, Tansey KE, 100. Banaschewski T, Bokde AL, Bromberg U, et al. Polygenic Risk of Psychosis and Ventral Striatal Activation During Reward Processing in Healthy Adolescents. JAMA Psychiatry. 2016;73(8):852-61.Knutson B, Fong GW, Adams CM, 101. Varner JL, Hommer D. Dissociation of reward anticipation and outcome with event-related fMRI. Neuroreport. 2001;12(17):3683-7.Knutson B, Westdorp A, Kaiser E, 102. Hommer D. FMRI visualization of brain activity during a monetary incentive delay task. Neuroimage. 2000;12(1):20-7.Taubert M, Draganski B, Anwander 103. A, Muller K, Horstmann A, Villringer A, et al. Dynamic properties of human brain structure: learning-related changes in cortical areas and associated fi ber connections. J Neurosci. 2010;30(35):11670-7.Taya F, Sun Y, Babiloni F, Thakor N, 104. Bezerianos A. Brain enhancement through cognitive training: a new insight from brain connectome. Front Syst Neurosci. 2015;9:44.Zatorre RJ, Fields RD, Johansen-Berg H. 105. Plasticity in gray and white: neuroimaging changes in brain structure during learning. Nat Neurosci. 2012;15(4):528-36.McGorry P, van Os J. Redeeming 106. diagnosis in psychiatry: timing versus specifi city. Lancet. 2013;381(9863):343-5.Korver N, Quee PJ, Boos HBM, 107. Simons CJP, de Haan L, investigators G, et al. Genetic Risk and Outcome of Psychosis (GROUP), a multi-site longitudinal cohort study focused on gene-environment interaction: objectives, sample characteristics, recruitment and assessment methods. Int J Methods Psychiatr Res. 2012;21(3):205-21.


Part 1 WHITE MATTER RESEARCH IN PATIENTS WITH PSYCHOTIC
DISORDER AND THEIR SIBLINGS
Chapters are based on the GROUP project


CH
APT
ERTwoTHE DETAILS OF STRUCTURAL DISCONNECTIVITY IN PSYCHOTIC DISORDER: A FAMILY-BASED STUDY OF NON-FA DIFFUSION WEIGHTED IMAGING MEASURES
Stijn Michielse, Ed Gronenschild, Patrick Domen, Jim van Os, Machteld Marcelis; for Genetic Risk and Outcome of Psychosis (G.R.O.U.P.)
Published in: Brain Research. 2017 Sep 15;1671:121-130. DOI: 10.1016/j.brainres.2017.07.002.

Chapter 2
34
AbstractBackground: Diffusion Tensor Imaging (DTI) studies in psychotic disorder have shown reduced FA, often interpreted as disturbed white matter integrity. The observed ‘dysintegrity’ may be of multifactorial origin, as changes in FA are thought to refl ect a combination of changes in myelination, fi ber organization and number of axons. Examining the structural substrate of the diffusion tensor in individuals with (risk for) psychotic disorder may provide better understanding of the underlying structural changes.Methods: DTI scans were acquired from 85 patients with psychotic disorder, 93 siblings of patients with psychotic disorder and 80 controls. Cross-sectional group comparisons were performed using Tract-Based Spatial Statistics (TBSS) on six DTI measures: axial diffusivity (AXD), radial diffusivity (RD), mean diffusivity (MD), and the case linear (CL), case planar (CP) and case spherical (CS) tensor shape measures. Results: AXD did not differ between the groups. RD and CS values were signifi cantly increased in patients compared to controls and siblings, with no signifi cant differences between the latter two groups. MD was higher in patients compared to controls (but not siblings), with no difference between siblings and controls. CL was smaller in patients than in siblings and controls, and CP was smaller in both patients and siblings as compared to controls. Conclusion: The differences between individuals with psychotic disorder and healthy controls, derived from detailed diffusion data analyses, suggest less fi ber orientation and increased free water movement in the patients. There was some evidence for association with familial risk expressed by decreased fi ber orientation.

2
35
THE DETAILS OF STRUCTURAL CONNECTIVITY
IntroductionWhite matter integrity changes in psychotic disorder can be examined by measuring fractional anisotropy (FA). However, the FA provides information on white matter integrity combining myelination, fi ber organization and number of axons in a single measure, making it a rather non-specifi c measure (1, 2). A systematic review on voxel-wise diffusion-weighted imaging (DWI) studies in psychotic disorder reported reduction of FA in the left frontal lobe and the temporal lobe (3). In addition, lower FA in the splenium of the corpus callosum and the cingulum bundle may also be associated with psychotic disorder (4, 5). A more recent study found decreased FA in the right temporal lobe in a group with schizotypal personality disorder (6). Furthermore, a review on early onset schizophrenia showed a widespread lower FA in patients relative to controls (7). The available evidence for individuals at higher than average genetic risk suggest that white matter integrity is reduced, compared with healthy controls, in the corpus callosum (8), the inferior longitudinal fasciculus, the left inferior fronto-occipital fasciculus (9) and the superior longitudinal fasciculus (10-12), although not all studies agree (4).As described above, FA alterations may have several origins. Therefore, additional DWI measures that provide more specifi c information on white matter integrity in psychotic disorder may be of interest. The axial diffusivity (AXD) describes the diffusion of water diffusion parallel to the white matter tracts (λ1, see Fig. 1) and may refl ect axonal function related to the number of axons. A decrease in AXD may be indicative of axonal injury/loss (13). The radial diffusivity (RD) measures the diffusion of water perpendicular to the white matter tracts and may be a marker for myelin content; an increase in RD indicates demyelination (14, 15). Previous literature suggests that the disruption of connectivity in psychotic disorder may be associated with dysfunction in myelin maintenance and repair and less with a decrease in the number of axons (16, 17). Indeed, higher RD in the bilateral cortico-spinal tracts, left arcuate fasciculus (18) and right superior longitudinal fasciculus (17) have been reported. Mean diffusivity (MD) measures the total water diffusion; increased MD may indicate an increase in the cellular or interstitial fl uid compartments (19). Psychotic disorder has consistently been associated with increased

Chapter 2
36
ventricular enlargement and an overall increase in cerebrospinal fl uid (CSF) (20). This cerebrospinal fl uid increase may originate from specifi c white matter alterations, such as demyelination. For example, previous studies on psychotic disorder have found an increase in free water movement (increased RD and MD) for commissural fi bers and projection fi bers (21).
Figure 1. Diffusion tensor model depicted by three eigenvectors.
AXD and RD are related to respectively diffusion parallel and perpendicular to the of fi ber tracts, while geometrical measures (tensor shapes) take all three eigenvalues into account (Fig. 1). With the tensor shape representation method, more knowledge on white matter composition, can be provided by specifying the linear (CL), spherical (CS), and planar (CP) tensor shape measures (22). An increase in CL may be related to increased anisotropy, which is associated with fi bers being more oriented in one primary direction. In highly organized and myelinated white matter regions, such as the corpus callosum, CL will be high (22, 23). CS is related to the diffusion of water in any direction, having no profound preferable direction. In highly isotropic matter, such as cerebrospinal fl uid, the CS will be high because water molecules can go in any direction not having one distinct preference. The more isotropic, the more spherical (CS towards one) the tensor becomes. CP is probably associated with fi ber orientation and structure (23). High CP refl ects areas with increased
2
37
THE DETAILS OF STRUCTURAL CONNECTIVITY
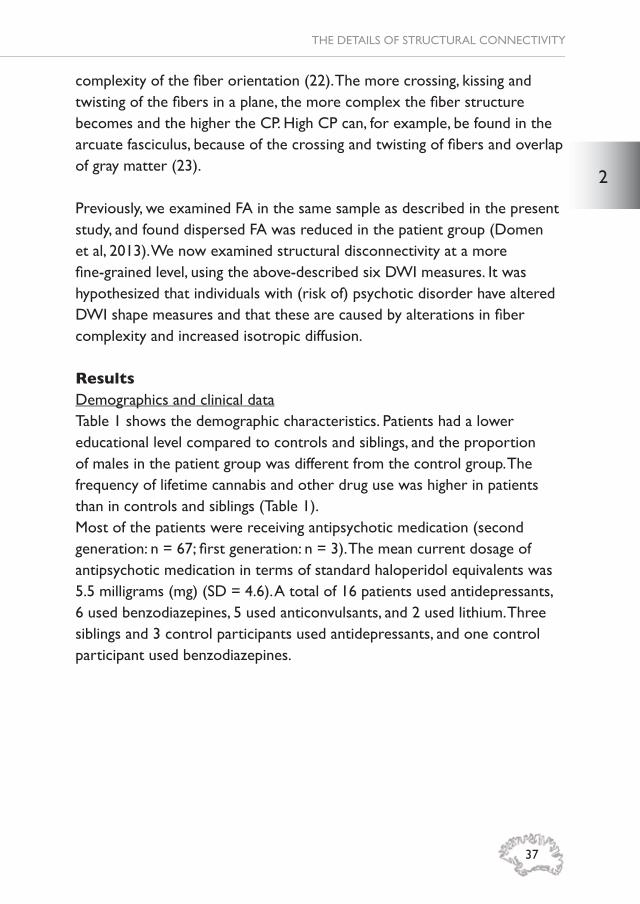
complexity of the fi ber orientation (22). The more crossing, kissing and twisting of the fi bers in a plane, the more complex the fi ber structure becomes and the higher the CP. High CP can, for example, be found in the arcuate fasciculus, because of the crossing and twisting of fi bers and overlap of gray matter (23).
Previously, we examined FA in the same sample as described in the present study, and found dispersed FA was reduced in the patient group (Domen et al, 2013). We now examined structural disconnectivity at a more fi ne-grained level, using the above-described six DWI measures. It was hypothesized that individuals with (risk of) psychotic disorder have altered DWI shape measures and that these are caused by alterations in fi ber complexity and increased isotropic diffusion.
ResultsDemographics and clinical dataTable 1 shows the demographic characteristics. Patients had a lower educational level compared to controls and siblings, and the proportion of males in the patient group was different from the control group. The frequency of lifetime cannabis and other drug use was higher in patients than in controls and siblings (Table 1).Most of the patients were receiving antipsychotic medication (second generation: n = 67; fi rst generation: n = 3). The mean current dosage of antipsychotic medication in terms of standard haloperidol equivalents was 5.5 milligrams (mg) (SD = 4.6). A total of 16 patients used antidepressants, 6 used benzodiazepines, 5 used anticonvulsants, and 2 used lithium. Three siblings and 3 control participants used antidepressants, and one control participant used benzodiazepines.

Chapter 2
38
Table 1. Demographical characteristics.
Controls (n=80) Siblings (n=93) Patients (n=85)
Age (years) 30.8±10.8 29.4±8.8 28.3±7.0Handedness 76.3 73.9 72.9Education (level) 5.4±1.8 5.1±2.1 4.1±2.0Male sex (%) 29 (36%) 49 (53%) 58 (68%)Age of onset (years) - - 22.8±6.4Illness duration (years) - - 5.4±3.6Antipsychotics a - - 6692.71±6254.18Cannabis (lifetime) b 7.8±21.9 19.3±37.2 44.0±47.0Other drugs (lifetime) b 0.90±4.7 6.2±31.4 42.4±90.8Alcohol c 5.0±7.0 9.8±17.3 5.0±9.1PANSS Positive symptoms 7.3±1.1 7.3±0.9 10.4±5.0 Negative symptoms 8.2±1.0 8.4±2.0 12.0±5.9 Disorganization 10.2±1.2 10.3±0.7 12.5±4.1 Excitement 8.3±1.1 8.6±1.4 9.7±2.7 Emotional distress 9.2±2.1 9.9±2.6 13.2±5.2
Means ± standard deviations are reported.
Abbreviations: PANSS, Positive and Negative Syndrome Scalea Lifetime exposure in haloperidol equivalents.b Lifetime mean number of times of substance use. c Weekly consumption during last 12 months.
Whole brain differences in DWI measuresThe reported skeleton mean values were calculated in R and the reported number of voxels were derived from randomise (P<0.05 and P<0.01; see Supplemental information) and this is true for all measures presented below.Axial diffusivityThe mean AXD value did not show signifi cant differences between the groups in any of the six comparisons. Radial diffusivityThe mean RD value was signifi cantly higher in patients (0.00052 mm2/s) compared to controls (0.00050 mm2/s) in 12838 voxels dispersed over the brain (Figure 2A). The following brain areas were signifi cant using a more conservative threshold P<0.01: right anterior limb internal capsule, bilateral retrolenticular part of internal capsule, bilateral anterior/superior/

2
39
THE DETAILS OF STRUCTURAL CONNECTIVITY
posterior corona radiata, bilateral posterior corona radiata, bilateral saggital striatum, bilateral external capsule, right superior longitudinal fasciculus, right superior fronto-occipital fasciculus, right uncinate fasciculus, bilateral tapetum and corpus callosum fi bers (total number of voxels: 12048). In addition, the mean RD value was signifi cantly higher in patients compared to siblings (0.00050 mm2/s) in a total of 13275 voxels dispersed over the brain (Figure 2B). The brain areas that survived the threshold of P<0.01 were: bilateral anterior/superior/posterior corona radiata and corpus callosum fi bers (total number of voxels: 8886). The RD value of siblings was not signifi cantly different from controls.
Figure 2. Statistical signifi cance maps for RD (A: patients > controls and B: patients > siblings) and MD (C: patients > controls) overlaid on the white matter skeleton (in green) and the standard MNI space (Z=98). The patient-sibling comparison for MD did not show any signifi cant differences. Images

Chapter 2
40
are radiologically oriented (participant’s left is to the right).
Mean diffusivityThe mean MD value was higher in patients (0.00079 mm2/s) compared to controls (0.00078 mm2/s) in 7503 signifi cant voxels (Figure 2C). Most voxels with higher MD values were found in bilateral projection and commissural fi bers. The brain areas that survived the threshold of P<0.01 were: bilateral retrolenticular part of internal capsule, bilateral anterior/superior corona radiata and corpus callosum fi bers (total number of voxels: 5552). Patients had a slightly higher mean MD than siblings (0.00079 mm2/s), but not at the a priori set signifi cance threshold. The mean MD value of siblings was not signifi cantly different from controls.
Linear shape measureThe CL measure showed a lower value in patients (0.5273) compared to controls (0.5370) in 4715 signifi cant voxels. Atlas labeling showed that all fi ber types had decreased values, with a larger number of voxels in the right hemisphere (3037 voxels) than in the left hemisphere (1678 voxels) for patients compared to controls (Figure 3A). The left superior corona radiata, and the body of the corpus callosum (total number of voxels: 1929) were upheld using the threshold of P<0.01. The patients had a lower CL compared to siblings (0.5348) in 10460 signifi cant voxels, with a slightly higher number of voxels in the right hemisphere for the projection and association fi bers (Table 2 and Figure 3B). Using a more conservative threshold P<0.01 the following regions were upheld: right anterior limb of internal capsule, bilateral anterior/superior corona radiata, right posterior corona radiata, right external capsule, right superior longitudinal fasciculus, right superior fronto-occipital fasciculus and the corpus callosum fi bers (total number of voxels: 7748). The CL was lower in siblings compared to controls, but there was no signifi cant difference.Planar shape measureThe case planar (CP) showed a lower value in patients (0.1550) compared to controls (0.1567) in 6498 signifi cant voxels. The decreased CP in patients over controls was more profound in the left hemisphere (4089 voxels) than in the right hemisphere (2409 voxels), and located in the projection

2
41
THE DETAILS OF STRUCTURAL CONNECTIVITY
and commissural fi bers (Table 2). The following brain areas were signifi cant using a more conservative threshold P<0.01: left anterior/posterior limb of internal capsule, right retrolenticular part of internal capsule, bilateral anterior/superior/posterior corona radiata, left superior fronto-occipital fasciculus and the corpus callosum fi bers (total number of voxels: 6462). Similarly, CP values were lower in siblings (0.1554) than in controls (0.1567) in 4200 signifi cant voxels, with more voxels in the left (2819 voxels) than in the right (1381 voxels) hemisphere, and located in the projection and commissural fi bers (Table 2). The bilateral anterior corona radiata, left superior corona radiata and genu/body of the corpus callosum (total number of voxels: 3431) survived the more conservative thresholding.Spherical shape measureThe CS measure was higher in patients (0.3177) compared to controls (0.3063) in 17611 signifi cant voxels (Figure 3C). The following brain areas were signifi cant using a more conservative threshold P<0.01: bilateral anterior/posterior limb internal capsule, bilateral retrolenticular part of internal capsule, bilateral anterior/superior/posterior corona radiata, bilateral posterior corona radiata, right sagittal striatum, bilateral external capsule, left cingulum, bilateral fornix, bilateral superior longitudinal fasciculus, bilateral superior fronto-occipital fasciculus, right uncinate fasciculus, bilateral tapetum and corpus callosum fi bers (total number of voxels: 17253). In addition, the CS was higher in patients compared to siblings (0.3099) in 13909 signifi cant voxels (Figure 3D). The fi ndings in the left retrolenticular part of internal capsule, bilateral anterior/superior/posterior corona radiata, bilateral posterior thalamic radiation, right superior longitudinal fasciculus, bilateral tapetum and the corpus callosum fi bers (total number of voxels: 11190) were upheld at P<0.01. Increased CS in patients and siblings was found in many white matter areas, with no signifi cant difference between siblings and controls (Table 2). The areas with increased CS and decreased CL were partly overlapping.

Chapter 2
42
Table 2. Number of signifi cant voxels by fi ber type for the geometrical DWI measures (case linear (CL), case planar (CP) and case spherical (CS)) in the group comparisons.
CL CP CS
TypePatients
<controls
Patients<
siblings
Patients<
controls
Siblings<
controls
Patients>
controls
Patients>
siblingsTotal
Projection 1743 4696 2602 1215 8485 6594Association 930 1719 34 0 3532 1836Commissural 2042 4045 3862 2985 5594 5479LeftProjection 388 1963 2064 948 4072 3569Association 374 808 34 0 1820 1155Commissural 916 2057 1991 1871 2810 2777RightProjection 1355 2733 538 267 4413 3025Association 556 911 0 0 1712 681Commissural 1126 1988 1871 1114 2784 2702
Results from tract-based spatial statistics. Table shows number of voxels at the P<0.05
threshold. Note: Not all signifi cant voxels were labeled, because the atlas did not cover the
entire skeleton.

2
43
THE DETAILS OF STRUCTURAL CONNECTIVITY
Figure 3. Statistical signifi cance maps for CL (A: patients < controls and B: patients < siblings) and CS (C: patients > controls and D: patients > siblings) overlaid on the white matter skeleton (in green) and the standard MNI space (Z=95). Images are radiologically oriented (participant’s left is to the right).

Chapter 2
44
Models with drug- and medication useCannabis and other drug useTract-based spatial statistics analyses did not show major differences in the amount of voxels detected in atlas labels when controlled for cannabis and other drug use (see supplementary Tables 1 - 4). Generally, the amount of signifi cant voxels in all DWI measures increased slightly, and in some instances decreased slightly, when controlled for cannabis and other drugs. Antipsychotic medication useControlling for medication use in tract-based spatial statistics showed an overall decrease of 4% in the amount of signifi cant voxels detected in all group comparisons, with an exception for the CL measure where an increase in the patient-sibling comparison (projection fi bers 2% for both left and right hemispheres) was found. Also the CS measure showed an increase in the amount of voxels in the patient-sibling comparison (10% projection fi bers and 19% association fi bers right side) (data available on request). There was no main effect of medication on the outcome measures. AP Antipsychotic medication use lifetime was non-signifi cantly associated with any of the DWI measures in patients (AXD: B = -7.49 x 10⁻¹¹ P = 0.933; RD: B = -1.42 x 10⁻¹⁰, P = 0.815; MD: B = -1.21 x 10⁻¹⁰, P = 0.845; CL: B = -1.57 x 10⁻⁷, P = 0.679; CP: B = 8.25 x 10⁻⁸, P = 0.588; CS: B = 5.88 x 10⁻⁸, P = 0.884).
DiscussionThe results from this study in individuals with (increased risk for) psychotic disorder provide novel insights into microstructural connectivity and suggest less fi ber orientation and increased free water movement in the patients. The study, showed an increase in RD in patients compared to controls and siblings, with no differences between the latter two groups. MD was increased in patients compared to controls, whereas AXD was not different between the groups. Furthermore, there was evidence for increased CS and decreased CL in patients compared to both controls and siblings. CP, in comparison with controls, showed a decrease in both patients and siblings.
Non-FA diffusivity measuresThe absence of differences in AXD between patients and controls is

2
45
THE DETAILS OF STRUCTURAL CONNECTIVITY
consistent with previous whole brain voxel-wise studies (21, 24-28), denoting preservation of axonal cells in the white matter (13). This indicates that the decrease in FA in the patients, as reported previously (4), may not be related to a reduction in the number of axons. The results suggest that this also applies to individuals at higher than average genetic risk for schizophrenia. Only one previous study included siblings: this study reported, fi nding decreased AXD, although however in a much smaller sample (n=33) and based on a region of interest analysis of language fi ber connections (6).The current study showed an increase in RD in patients compared to controls and siblings. Increased RD may refl ect myelin loss rather than changes in the number of axons, as demonstrated in an animal study (29). These demyelineation processes (and less directed fi bers) may also occur in human white matter (30). In the present study, clusters of signifi cantly increased RD were dispersed over the brain and also represented in the corpus callosum of patients with psychotic disorder. Previous whole brain voxel-wise studies (28, 31-34) and ROI region of interest based studies (35-37) in psychotic disorder have found similar increases in RD, although some ROI region of interest studies reported reduced RD in specifi c areas (26, 32, 38). In addition, increased RD has been found in individuals at ultra high-risk for psychotic disorder (38), suggesting that alterations may already be present in the prodromal stages. Similarly, RD changes in the left anterior thalamic radiation may be apparent in specifi c stages of psychotic disorder (39). In the current study, fewer areas with increased RD were present in the patient-sibling comparison than in the patient-control comparison. This might hint to less difference in RD between patients and siblings compared to patients and controls. MD was increased in patients compared to controls. An increase of free water molecules in the white matter may indicate an increase of isotropy and therefore an increase in MD. The MD can be seen as a marker for microstructural changes related to cerebrospinal fl uid increase in psychotic disorder (19). However, MD captures the overall mean water molecular displacement in a volume (40), representing a non-specifi c measure and therefore unable to point to myelin or axonal alterations (2). Increased MD in patients with psychotic disorder compared to healthy controls
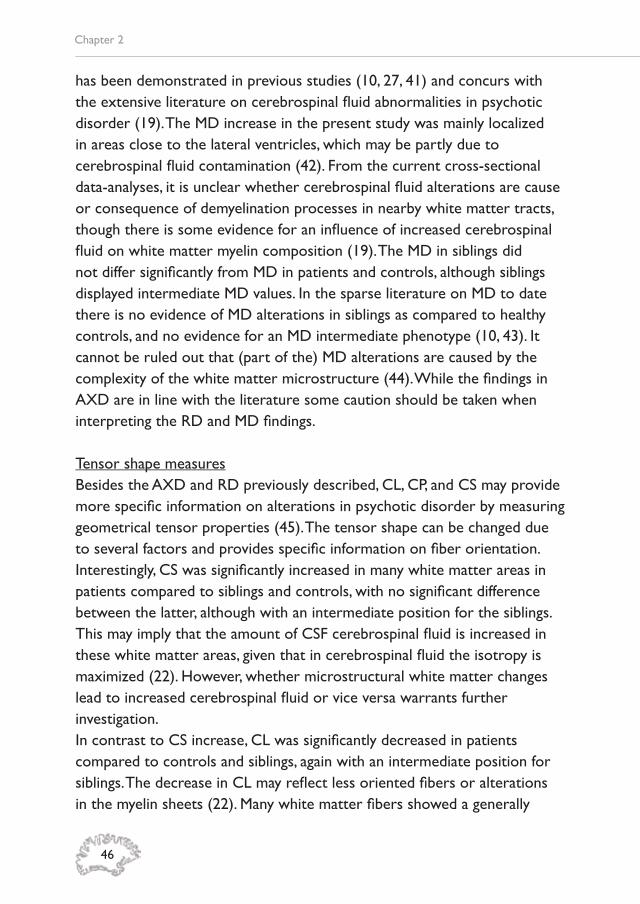
Chapter 2
46
has been demonstrated in previous studies (10, 27, 41) and concurs with the extensive literature on cerebrospinal fl uid abnormalities in psychotic disorder (19). The MD increase in the present study was mainly localized in areas close to the lateral ventricles, which may be partly due to cerebrospinal fl uid contamination (42). From the current cross-sectional data-analyses, it is unclear whether cerebrospinal fl uid alterations are cause or consequence of demyelination processes in nearby white matter tracts, though there is some evidence for an infl uence of increased cerebrospinal fl uid on white matter myelin composition (19). The MD in siblings did not differ signifi cantly from MD in patients and controls, although siblings displayed intermediate MD values. In the sparse literature on MD to date there is no evidence of MD alterations in siblings as compared to healthy controls, and no evidence for an MD intermediate phenotype (10, 43). It cannot be ruled out that (part of the) MD alterations are caused by the complexity of the white matter microstructure (44). While the fi ndings in AXD are in line with the literature some caution should be taken when interpreting the RD and MD fi ndings.
Tensor shape measuresBesides the AXD and RD previously described, CL, CP, and CS may provide more specifi c information on alterations in psychotic disorder by measuring geometrical tensor properties (45). The tensor shape can be changed due to several factors and provides specifi c information on fi ber orientation. Interestingly, CS was signifi cantly increased in many white matter areas in patients compared to siblings and controls, with no signifi cant difference between the latter, although with an intermediate position for the siblings. This may imply that the amount of CSF cerebrospinal fl uid is increased in these white matter areas, given that in cerebrospinal fl uid the isotropy is maximized (22). However, whether microstructural white matter changes lead to increased cerebrospinal fl uid or vice versa warrants further investigation. In contrast to CS increase, CL was signifi cantly decreased in patients compared to controls and siblings, again with an intermediate position for siblings. The decrease in CL may refl ect less oriented fi bers or alterations in the myelin sheets (22). Many white matter fi bers showed a generally

2
47
THE DETAILS OF STRUCTURAL CONNECTIVITY
decreased CL and increased CS in patients compared to controls (see Table 2). CP is thought to be associated with fi ber orientation. The fi nding of lower CP in both patients and siblings compared to controls may refl ect less crossing and twisting fi bers, making the white matter structure less oriented (23). The left superior fronto-occipital fasciculus (interconnecting the occipital and frontal lobe) showed lower CP in patients compared to controls. These alterations may be related to auditory and/or visual hallucinations, as described by De Weijer and colleagues (18). In addition, fi bers connecting the internal capsule showed lower CP mainly in the left hemisphere in patients and siblings. Furthermore, a third area with lower CP in both patients and siblings, compared to controls, was the corpus callosum. However, fi ndings in CP have to be interpreted with caution, since noise in the data may infl uence this measure more than the other tensor shape measures (23). In conclusion, these new fi ndings on tensor shape measures in psychotic disorder may hint at alterations in fi ber orientation rather than axonal loss. In addition, increased CS in combination with decreased CL and CP was found.
Cannabis useMost fi bers showed slight increases and some showed slight decreases in the amount of signifi cant voxels when adding cannabis and other drug use to the tract-based spatial statistics models. In general, there was no evidence for major effects of these substances on any of the outcome measures. This fi ts with previous cross-sectional studies showing absence of associations between cannabis and white matter structure (4, 46-48). However, a study of patients with adolescent-onset psychotic disorder with early cannabis use showed FA decrease in the internal capsule, corona radiata and superior and inferior longitudinal fasciculus with respect to controls (49). The study sample described by James and colleagues included relatively young participants compared to our sample and as white matter is still developing during adolescence, the impact of cannabis use may be more prominent in this stage of life. This is supported by a recent longitudinal, 18-months follow-up, study in adolescents with early onset psychotic disorder,

Chapter 2
48
showing that cannabis use during adolescence may lead to a decrease in FA in the left inferior longitudinal fasciculus and the left inferior fronto-occipital fasciculus (50). As stated in recent reviews (51, 52), more research is needed on the impact of cannabis use on risk for psychotic disorder.
Medication useThe results showed that there was a decrease in the amount of signifi cant voxels for most of the outcome measures after correcting for cumulative antipsychotic medication exposure. However, there was no evidence for a main effect of antipsychotic medication on the six outcome measures. The exact infl uence of antipsychotic medication on FA alterations is not clear (4, 53). However, a longitudinal study has described increased FA values after 12 weeks of clozapine exposure (54). Another longitudinal study reported that AXD decreased (indicative of axonal loss) and RD increased (indicative of myelin preservation) over time, in response to antipsychotic medication use (55). Therefore, the infl uence of antipsychotic medication on myelin and axons within the white matter needs further attention and investigation.
Methodological considerationsA tract-based spatial statistics processing stream was used, in which only the white matter in the skeleton was taken into the analysis. This method reduces the amount of voxels and focuses only on the core of the main white matter tracts making it robust for group comparisons. Although this method is widely used, some detail on the white matter is lost and it may not be sensitive to detect changes in peripheral regions located on the skeleton (56). Moreover, the skeleton thickness and thus the statistical power depends on the orientation of the brain in the scanner (56). Finally, as with all voxel-based methods, registration of the FA data to a template may cause both type I and II errors (57).Related to this consideration is the atlas labeling method. Most of the voxels, but not all, got a label and arbitrary borders are set in the specifi c atlases used. Therefore, some signifi cant voxels located closely to borders were not assigned to the specifi c area delineated by the atlas. Interpretation of the outcomes of the study is limited to the millimeter scale resolution, capturing many individual cells, while several processes

2
49
THE DETAILS OF STRUCTURAL CONNECTIVITY
like demyelination and axonal loss can take place within a single voxel (58). With the protocol used it may not be possible to disambiguate the effects of microstructural architecture and pathological processes on our fi ndings. More advanced scan acquisitions and analysis techniques are required to accomplish this complex task (59).Since the application of tensor shape measures in psychotic disorder is relatively new, the results need replication. In addition, post-mortem research can add to the biological understanding of changes in diffusion tensor shape measures. Longitudinal assessment of shape measures may contribute to further interpretation and understanding of these measures in the neurobiology of psychotic disorder.
ConclusionThe study showed that geometrical tensor shape diffusion tensor measures might contribute to our understanding of the neurobiological alterations vulnerability associated with psychotic disorder. Patients with psychotic disorder, and in part their siblings, showed changes at the level of white matter and may be related to alterations in fi ber orientation rather than number of axons. The data support the notion that cerebral vulnerability underlying psychotic disorder may be detectable in white matter.
Methods and MaterialsParticipantsData was collected in the context of a multicenter longitudinal study (Genetic Risk and Outcome of Psychosis, G.R.O.U.P) in the Netherlands. In selected representative geographical areas in the Netherlands and neighboring Belgium, patients were identifi ed through representative clinicians providing health care for those with psychotic disorder. Siblings were contacted through participating patients. Mailings and advertisements were effectuated in local newspapers of the same geographical area in order to recruit control participants. The total sample consisted of 258 participants: 85 patients with a psychotic disorder, 93 siblings without a psychotic disorder and 80 healthy controls. Familial relatedness of the participants has been described previously (4). For the current analyses, baseline data were used.
Chapter 2
50
Inclusion criteria were: age range 16-50 years, a good command of Dutch language and for patients: a diagnosis of non-affective psychotic disorder with an illness duration of <10 years. Siblings and controls did not have a lifetime diagnosis of any non-affective psychotic disorder. In addition, controls had no fi rst-degree relative with a lifetime diagnosis of any psychotic disorder, assessed using the Family Interview for Genetic Studies (FIGS) (60). Diagnosis was based on the Diagnostic and Statistical Manual of Mental Disorder-IV (DSM-IV) criteria (61), measured with the Comprehensive Assessment of Symptoms and History (CASH) interview (62). Patients were diagnosed as follows: schizophrenia (n=59), schizoaffective disorder (n=9), schizophreniform disorder (n=4), brief psychotic disorder (n=2), and psychotic disorder not otherwise specifi ed (n=11). Psychopathology in the siblings and controls was also assessed and respectively 18 and 12 participants had a history of a major depressive disorder. None of these met the criteria for a current depressive episode.All participants were screened before MRI scanning using the following exclusion criteria: brain injury with unconsciousness of > than 1 hour, meningitis or other neurological diseases with possible impact on brain structure or function, cardiac arrhythmia requiring medical treatment and severe claustrophobia. In addition, participants with metal corpora aliena were excluded from the study, as were women with intrauterine device status and (suspected) pregnancy. The standing ethics committee approved the study protocol, and all the participants gave written informed consent in accordance with the committee’s guidelines.
MeasuresLevel of psychotic symptomatology at the time of scanning was assessed with the Positive and Negative Symptom Scale (PANSS) (63) in all three groups. The fi ve factor model by van der Gaag and colleagues (64) was used. Level of education was defi ned as the highest accomplished level of education. Handedness was assessed using the Annett Handedness Scale (65), ranging from +100 (fully right-handed) to -100 (fully left-handed).In the patient group, antipsychotic medication use was determined by

2
51
THE DETAILS OF STRUCTURAL CONNECTIVITY
patient report and verifi ed with the treating consultant psychiatrist. Best estimate lifetime (cumulative) antipsychotic medication use was determined by multiplying the number of days of antipsychotic medication use with the corresponding haloperidol equivalents and summing these scores for all periods of antipsychotic medication use (including the exposure period between baseline assessment for the G.R.O.U.P. study and the moment of baseline MRI scanning), using the standard conversion formulas for antipsychotic medication AP dose equivalents described by Andreasen and colleagues (66).Substance use was measured with the Composite International Diagnostic Interview (CIDI) sections B-J-L (67). Use of cannabis and other drugs was assessed as reported frequency of use during the last 12 months, as well as lifetime use. CIDI frequency data on lifetime cannabis and other drug use was available for respectively 250 participants (3% missing data) and 256 participants (1% missing data). Alcohol use was defi ned as the reported number of weekly consumptions during the last 12 months.
MRI data acquisitionMagnetic resonance imaging scans were obtained at Maastricht University, the Netherlands, using an Allegra syngo MR A30 (Siemens, Erlangen, Germany) operating at 3.0 Tesla. The following anatomical scan parameters were used: Modifi ed Driven Equilibrium Fourier Transform (MDEFT) sequence; 176 slices, 1 mm isotropic voxel size, echo time 2.4 msec, repetition time 7.92 msec, inversion time 910 msec, fl ip angle 15°, total acquisition time 12 min 51 sec; Magnetization Prepared Rapid Acquisition Gradient-Echo (MPRAGE; Alzheimer’s Disease Neuroimaging Initiative) sequence 192 slices, 1 mm isotropic voxel size, echo time 2.6 msec, repetition time 2250 msec, inversion time 900 msec, fl ip angle 9°, total acquisition time 7 min 23 sec. The matrix size was 256 x 256 and fi eld of view was 256 x 256 mm2. The number of excitations was one. Two sequences were used because of a scanner update during data collection. Microstructural anatomy was examined using diffusion tensor imaging with an echo-planar-imaging sequence (fi eld of view 230 x 230 mm2, TR 10800 ms, TE 84 ms, voxel size 1.8 x 1.8 x 1.8 mm³, b-value 1000 s/mm², noise

Chapter 2
52
level 40, 85 slices, no overlap). As a result of the scanner update, two DTI sequences were used: one with 76 directions (of which 4 T2-weighted (B0) and 72 diffusion-weighted (B)), and one with 81 directions (8xB0 and 73xB). The proportion of scans with 76 directions was balanced between the groups (78% in controls, 75% in siblings and 69% in patients (χ2 =1.52, P= 0.468), preventing any systematic bias. Total acquisition time of the DTI sequence was 15 minutes.
Data preprocessingRaw DICOM images were converted to NIfTI standard using the tool “dcm2nii” from the MRIcron software package (68) and T1 data were cropped to remove slices containing background noise. All imaging data were visually inspected for artifacts and only data without artifacts got included.
DWI processingDWI data were processed in ExploreDTI v4.8.3 (69) in a MatLab (The MathWorks, Inc., Natick, Massachusetts, United States) programming environment. Subject motion and eddy-current induced geometrical distortions were corrected by realigning the DW images to the B0 images incorporating B-matrix rotation (69). The DWI data were coregistered to the individual’s T1 data to correct for echo-planar imaging (EPI) distortion (70, 71). Next, diffusion tensors were estimated using the Robust Estimation of Tensors by the Outlier Rejection (RESTORE) method (72). Finally, eigenvalue-maps per dataset were produced providing the primary (λ1), secondary (λ2) and tertiary (λ3) eigenvalues sorted in decreasing order, all expressed in mm2/s. The AXD is equal to the λ1, RD is the average of λ2 and λ3 and the mean diffusivity (MD) is the average of λ1, λ2 and λ3. In addition, geometrical tensor shape measures CL ((λ1- λ2) / λ1), CS (λ3 / λ1) and CP ((λ2- λ3) / λ1) were calculated (22). All measures were calculated using an in-house build MatLab script.Subsequent analysis of the six DWI measures was performed using tract-based spatial statistics v1.2 in FSL 4.1.6 (FMRIB Analysis Group, Oxford, UK, http://www.fmrib.ox.ac.uk/analysis/research/tbss/TBSS). Non-linear registration aligned each FA volume to 1 x 1 x 1 mm standard FMRIB58_

2
53
THE DETAILS OF STRUCTURAL CONNECTIVITY
FA space containing a template derived from high-resolution images of 58 participants in a well-aligned population (73). After co-registration, a group mean FA skeleton was derived and thresholded at 0.25 to obtain the major white matter pathways, to exclude smaller peripheral tracts that would cause excess inter-participant variability, and to diminish non-linear registration misalignments. In addition, this threshold setting avoided inclusion of regions that are likely to be composed of multiple tissue types or fi ber orientations. Finally, each registered FA volume was projected onto this skeleton and concatenated into a 4D volume containing the FA skeletonised data to be used for voxel-wise group comparison. In a similar way, using the warps from the FA volumes and the thresholded FA skeleton, the AXD, RD, MD, CL, CP and CS 4D skeletonised data were derived for voxel-wise group comparisons.
Statistical analysesStatistical voxel-wise group analysis on the AXD, RD, MD, CL, CP and CS skeletons was based on linear model permutation testing (74) by means of “randomise” in FSL (v2.1) controlling the family-wise error (FWE) (75). The threshold-free cluster enhancement (TFCE) option (76) was enabled to fi nd clusters without setting an initial cluster level. Statistical maps, corrected for multiple comparisons, were used for assessing differences between groups. A total of six contrasts per DWI measure were created to test for signifi cant (P<0.05) differences: i) patients have higher/lower outcome measures than controls, ii) siblings have higher/lower outcome measures than controls, and iii) patients have higher/lower outcome measures than siblings. The a priori hypothesized confounding variables age, sex, handedness and level of education and lifetime (non-) cannabis/other drug use were used in the statistical models. The models with and without drug use were compared. Additionally, cumulative antipsychotic medication exposure was added as an additional covariate to the model in tract-based spatial statistics.
A number of 10,000 permutations were applied to reduce the error margin to an acceptable level of 8.7%, corresponding to ±0.0044 at P=0.05. After the randomisation testing, the statistical maps were thresholded at

Chapter 2
54
a level of P<0.05 (and P<0.01 to correct for multiple testing) and assigned with a label from a specifi c white matter tract name. Labels were taken from the Johns Hopkins University International Consortium for Brain Mapping (JHU-ICBM)-DTI-81 white-matter atlas (77) and the JHU white-matter tractography atlas (78). Combining these two label atlases provided suffi cient coverage of the signifi cant voxels produced by randomise. All fi bers were grouped based on different types of fi ber systems: projection, association and commissural fi bers. This provided a total of 7 projection and 8 association fi bers both left and right separately. The fornix (column and body of the fornix) and the 3 corpus callosum fi ber types were taken as a whole, except for the tapetum (for which left and right were separated). Additionally, the forceps minor and major from the JHU white-matter tractography atlas were included as a whole.
To extend the tract-based spatial statistics analyses with multilevel random regression, taking into account the familial relatedness of the individuals, mean DWI value per area from all six diffusion measures were extracted from the TBSS tract-based spatial statistics skeleton and exported to R version 3.2.0 (79). Associations between group and respectively AXD, RD, MD, CL, CP, and CS measures were examined using a hierarchical ‘long format’ dataset, with the 38 regions (level 1) nested in participants (level 2) being part of families (level 3), with the number of voxels per region used as an analytic weight factor and with region as covariate. The ”lme” package was used to fi t these multilevel random regression models, with the six different DWI measures as the dependent variables and participant/family number modeled as random effects with age, sex, handedness and level of education as covariates. In patients, associations between the cumulative lifetime antipsychotic medication dose and the respective DWI measures were examined and expressed by regression coeffi cients (B).

2
55
THE DETAILS OF STRUCTURAL CONNECTIVITY
ReferencesMori S, Zhang J. Principles of diffusion 1. tensor imaging and its applications to basic neuroscience research. Neuron. 2006;51(5):527-39.O’Donnell LJ, Pasternak O. Does 2. diffusion MRI tell us anything about the white matter? An overview of methods and pitfalls. Schizophr Res. 2015;161(1):133-41.Ellison-Wright I, Bullmore E. Meta-3. analysis of diffusion tensor imaging studies in schizophrenia. Schizophrenia research. 2009;108(1-3):3-10.Domen PA, Michielse S, Gronenschild E, 4. Habets P, Roebroeck A, Schruers K, et al. Microstructural white matter alterations in psychotic disorder: A family-based diffusion tensor imaging study. Schizophrenia research. 2013;146(1-3):291-300.Fitzsimmons J, Schneiderman JS, Whitford 5. TJ, Swisher T, Niznikiewicz MA, Pelavin PE, et al. Cingulum bundle diffusivity and delusions of reference in fi rst episode and chronic schizophrenia. Psychiatry research. 2014;224(2):124-32.Sun Y, Zhang L, Ancharaz SS, Cheng S, Sun 6. W, Wang H, et al. Decreased fractional anisotropy values in two clusters of white matter in patients with schizotypal personality disorder: A DTI study. Behavioural brain research. 2016;310:68-75.Tamnes CK, Agartz I. White Matter 7. Microstructure in Early-Onset Schizophrenia: A Systematic Review of Diffusion Tensor Imaging Studies. J Am Acad Child Psy. 2016;55(4):269-79.Knochel C, Oertel-Knochel V, 8. Schonmeyer R, Rotarska-Jagiela A, van de Ven V, Prvulovic D, et al. Interhemispheric hypoconnectivity in schizophrenia: Fiber integrity and volume differences of the corpus callosum in patients and unaffected relatives. Neuroimage. 2012;59(2):926-34.Oestreich LK, McCarthy-Jones S, 9. Australian Schizophrenia Research B, Whitford TJ. Decreased integrity of the fronto-temporal fi bers of the left inferior occipito-frontal fasciculus associated with auditory verbal hallucinations in schizophrenia. Brain imaging and behavior. 2015.Clark KA, Nuechterlein KH, Asarnow 10.
RF, Hamilton LS, Phillips OR, Hageman NS, et al. Mean diffusivity and fractional anisotropy as indicators of disease and genetic liability to schizophrenia. J Psychiatr Res. 2011;45(7):980-8.Nakamura K, Kawasaki Y, Takahashi 11. T, Furuichi A, Noguchi K, Seto H, et al. Reduced white matter fractional anisotropy and clinical symptoms in schizophrenia: a voxel-based diffusion tensor imaging study. Psychiatry research. 2012;202(3):233-8.Sun H, Lui S, Yao L, Deng W, Xiao Y, 12. Zhang W, et al. Two Patterns of White Matter Abnormalities in Medication-Naive Patients With First-Episode Schizophrenia Revealed by Diffusion Tensor Imaging and Cluster Analysis. JAMA psychiatry. 2015;72(7):678-86.Song SK, Sun SW, Ju WK, Lin SJ, Cross 13. AH, Neufeld AH. Diffusion tensor imaging detects and differentiates axon and myelin degeneration in mouse optic nerve after retinal ischemia. Neuroimage. 2003;20(3):1714-22.Song SK, Yoshino J, Le TQ, Lin SJ, Sun 14. SW, Cross AH, et al. Demyelination increases radial diffusivity in corpus callosum of mouse brain. Neuroimage. 2005;26(1):132-40.Giorgio A, Watkins KE, Douaud G, 15. James AC, James S, De Stefano N, et al. Changes in white matter microstructure during adolescence. Neuroimage. 2008;39(1):52-61.Davis KL, Stewart DG, Friedman JI, 16. Buchsbaum M, Harvey PD, Hof PR, et al. White matter changes in schizophrenia: evidence for myelin-related dysfunction. Archives of general psychiatry. 2003;60(5):443-56.Ruef A, Curtis L, Moy G, Bessero S, 17. Badan Ba M, Lazeyras F, et al. Magnetic resonance imaging correlates of fi rst-episode psychosis in young adult male patients: combined analysis of grey and white matter. Journal of psychiatry & neuroscience : JPN. 2012;37(5):305-12.de Weijer AD, Neggers SF, Diederen 18. KM, Mandl RC, Kahn RS, Hulshoff Pol HE, et al. Aberrations in the arcuate fasciculus are associated with auditory verbal hallucinations in psychotic and in non-psychotic individuals. Human brain mapping. 2013;34(3):626-34.

Chapter 2
56
Narr KL, Hageman N, Woods RP, 19. Hamilton LS, Clark K, Phillips O, et al. Mean diffusivity: a biomarker for CSF-related disease and genetic liability effects in schizophrenia. Psychiatry Res. 2009;171(1):20-32.Shenton ME, Dickey CC, Frumin M, 20. McCarley RW. A review of MRI fi ndings in schizophrenia. Schizophrenia research. 2001;49(1-2):1-52.Scheel M, Prokscha T, Bayerl M, Gallinat 21. J, Montag C. Myelination defi cits in schizophrenia: evidence from diffusion tensor imaging. Brain structure & function. 2013;218(1):151-6.Westin CF, Maier SE, Mamata H, Nabavi 22. A, Jolesz FA, Kikinis R. Processing and visualization for diffusion tensor MRI. Medical image analysis. 2002;6(2):93-108.Alexander AL, Hasan K, Kindlmann 23. G, Parker DL, Tsuruda JS. A geometric analysis of diffusion tensor measurements of the human brain. Magn Reson Med. 2000;44(2):283-91.de Leeuw M, Kahn RS, Zandbelt BB, 24. Widschwendter CG, Vink M. Working memory and default mode network abnormalities in unaffected siblings of schizophrenia patients. Schizophrenia research. 2013;150(2-3):555-62.Seal ML, Yucel M, Fornito A, Wood 25. SJ, Harrison BJ, Walterfang M, et al. Abnormal white matter microstructure in schizophrenia: a voxelwise analysis of axial and radial diffusivity. Schizophrenia research. 2008;101(1-3):106-10.Kikinis Z, Fitzsimmons J, Dunn C, Vu 26. MA, Makris N, Bouix S, et al. Anterior commissural white matter fi ber abnormalities in fi rst-episode psychosis: a tractography study. Schizophr Res. 2015;162(1-3):29-34.Zeng B, Ardekani BA, Tang Y, Zhang T, 27. Zhao S, Cui H, et al. Abnormal white matter microstructure in drug-naive fi rst episode schizophrenia patients before and after eight weeks of antipsychotic treatment. Schizophr Res. 2016;172(1-3):1-8.Reid MA, White DM, Kraguljac NV, Lahti 28. AC. A combined diffusion tensor imaging and magnetic resonance spectroscopy study of patients with schizophrenia. Schizophrenia Research. 2016;170(2-3):341-50.Song SK, Sun SW, Ramsbottom 29. MJ, Chang C, Russell J, Cross AH.
Dysmyelination revealed through MRI as increased radial (but unchanged axial) diffusion of water. Neuroimage. 2002;17(3):1429-36.Beaulieu C. The basis of anisotropic 30. water diffusion in the nervous system - a technical review. NMR in biomedicine. 2002;15(7-8):435-55.Clark K, Narr KL, O’Neill J, Levitt J, 31. Siddarth P, Phillips O, et al. White matter integrity, language, and childhood onset schizophrenia. Schizophrenia research. 2012;138(2-3):150-6.Koch K, Wagner G, Schachtzabel C, 32. Schultz C, Gullmar D, Reichenbach J, et al. Neural activation and radial diffusivity in schizophrenia: Combined fMRI and diffusion tensor imaging study. Br J Psychiatry. 2011;198(3):223-9.Lu LH, Zhou XJ, Keedy SK, Reilly 33. JL, Sweeney JA. White matter microstructure in untreated fi rst episode bipolar disorder with psychosis: comparison with schizophrenia. Bipolar disorders. 2011;13(7-8):604-13.Whitford T, Kubicki M, Schneiderman 34. J, O’Donnell L, King R, Alvarado J, et al. Corpus Callosum Abnormalities and Their Association with Psychotic Symptoms in Patients with Schizophrenia. Biological psychiatry. 2010;68(1):70-7.McCarthy-Jones S, Oestreich LK, 35. Australian Schizophrenia Research B, Whitford TJ. Reduced integrity of the left arcuate fasciculus is specifi cally associated with auditory verbal hallucinations in schizophrenia. Schizophrenia research. 2015;162(1-3):1-6.Ohtani T, Bouix S, Hosokawa T, Saito Y, 36. Eckbo R, Ballinger T, et al. Abnormalities in white matter connections between orbitofrontal cortex and anterior cingulate cortex and their associations with negative symptoms in schizophrenia: A DTI study. Schizophrenia research. 2014;157(1-3):190-7.Seitz J, Zuo JX, Lyall AE, Makris N, Kikinis 37. Z, Bouix S, et al. Tractography Analysis of 5 White Matter Bundles and Their Clinical and Cognitive Correlates in Early-Course Schizophrenia. Schizophr Bull. 2016.Carletti F, Woolley JB, Bhattacharyya S, 38. Perez-Iglesias R, Fusar Poli P, Valmaggia L, et al. Alterations in white matter evident

2
57
THE DETAILS OF STRUCTURAL CONNECTIVITY
before the onset of psychosis. Schizophr Bull. 2012;38(6):1170-9.Lagopoulos J, Hermens DF, Hatton 39. SN, Battisti RA, Tobias-Webb J, White D, et al. Microstructural white matter changes are correlated with the stage of psychiatric illness. Translational psychiatry. 2013;3:e248.Brubaker CJ, Schmithorst VJ, Haynes EN, 40. Dietrich KN, Egelhoff JC, Lindquist DM, et al. Altered myelination and axonal integrity in adults with childhood lead exposure: a diffusion tensor imaging study. Neurotoxicology. 2009;30(6):867-75.Ardekani BA, Tabesh A, Sevy S, Robinson 41. DG, Bilder RM, Szeszko PR. Diffusion tensor imaging reliably differentiates patients with schizophrenia from healthy volunteers. Hum Brain Mapp. 2011;32(1):1-9.Metzler-Baddeley C, O’Sullivan MJ, Bells 42. S, Pasternak O, Jones DK. How and how not to correct for CSF-contamination in diffusion MRI. Neuroimage. 2012;59(2):1394-403.Goghari VM, Billiet T, Sunaert S, Emsell 43. L. A diffusion tensor imaging family study of the fornix in schizophrenia. Schizophrenia research. 2014;159(2-3):435-40.Vos SB, Jones DK, Jeurissen B, Viergever 44. MA, Leemans A. The infl uence of complex white matter architecture on the mean diffusivity in diffusion tensor MRI of the human brain. Neuroimage. 2012;59(3):2208-16.Wheeler-Kingshott CAM, Cercignani M. 45. About “Axial” and “Radial” Diffusivities. Magn Reson Med. 2009;61(5):1255-60.Peters BD, Blaas J, de Haan L. Diffusion 46. tensor imaging in the early phase of schizophrenia: what have we learned? J Psychiatr Res. 2010;44(15):993-1004.DeLisi LE. The effect of cannabis on the 47. brain: can it cause brain anomalies that lead to increased risk for schizophrenia? Current opinion in psychiatry. 2008;21(2):140-50.Solowij N, Yucel M, Respondek C, 48. Whittle S, Lindsay E, Pantelis C, et al. Cerebellar white-matter changes in cannabis users with and without schizophrenia. Psychol Med. 2011;41(11):2349-59.James A, Hough M, James S, Winmill L, 49. Burge L, Nijhawan S, et al. Greater white
and grey matter changes associated with early cannabis use in adolescent-onset schizophrenia (AOS). Schizophrenia research. 2011;128(1-3):91-7.Epstein KA, Kumra S. White matter 50. fractional anisotropy over two time points in early onset schizophrenia and adolescent cannabis use disorder: A naturalistic diffusion tensor imaging study. Psychiat Res-Neuroim. 2015;232(1):34-41.Cookey J, Bernier D, Tibbo PG. 51. White matter changes in early phase schizophrenia and cannabis use: An update and systematic review of diffusion tensor imaging studies. Schizophrenia research. 2014;156(2-3):137-42.Lubman DI, Cheetham A, Yucel M. 52. Cannabis and adolescent brain development. Pharmacology & therapeutics. 2015;148:1-16.Minami T, Nobuhara K, Okugawa G, 53. Takase K, Yoshida T, Sawada S, et al. Diffusion tensor magnetic resonance imaging of disruption of regional white matter in schizophrenia. Neuropsychobiology. 2003;47(3):141-5.Ozcelik-Eroglu E, Ertugrul A, Oguz KK, 54. Has AC, Karahan S, Yazici MK. Effect of clozapine on white matter integrity in patients with schizophrenia: a diffusion tensor imaging study. Psychiatry research. 2014;223(3):226-35.Szeszko PR, Robinson DG, Ikuta T, 55. Peters BD, Gallego JA, Kane J, et al. White matter changes associated with antipsychotic treatment in fi rst-episode psychosis. Neuropsychopharmacology : offi cial publication of the American College of Neuropsychopharmacology. 2014;39(6):1324-31.Edden RA, Jones DK. Spatial and 56. orientational heterogeneity in the statistical sensitivity of skeleton-based analyses of diffusion tensor MR imaging data. Journal of neuroscience methods. 2011;201(1):213-9.Jones DK, Cercignani M. Twenty-fi ve 57. pitfalls in the analysis of diffusion MRI data. NMR in biomedicine. 2010;23(7):803-20.O’Donnell LJ, Westin CF. An introduction 58. to diffusion tensor image analysis. Neurosurgery clinics of North America. 2011;22(2):185-96, viii.Jones DK, Knosche TR, Turner R. White 59. matter integrity, fi ber count, and other
Chapter 2
58
fallacies: the do’s and don’ts of diffusion MRI. Neuroimage. 2013;73:239-54.Maxwell M. Family Interview for Genetic 60. Studies (FIGS): Manual For FIGS. Clinical Neurogenetics Branch, Intramural Research Program, National Institute of Mental Health, Bethesda, MD. 1992.APA. Diagnostic and statistical manual 61. of mental disorders, 4th ed. Washington, DC; American Psychiatric Association. 2000.Andreasen NC, Flaum M, Arndt S. 62. The Comprehensive Assessment of Symptoms and History (CASH). An instrument for assessing diagnosis and psychopathology. Archives of general psychiatry. 1992;49(8):615-23.Kay SR, Fiszbein A, Opler LA. The 63. positive and negative syndrome scale (PANSS) for schizophrenia. Schizophr Bull. 1987;13(2):261-76.van der Gaag M, Hoffman T, Remijsen 64. M, Hijman R, de Haan L, van Meijel B, et al. The fi ve-factor model of the Positive and Negative Syndrome Scale II: a ten-fold cross-validation of a revised model. Schizophrenia research. 2006;85(1-3):280-7.Annett M. A classifi cation of hand 65. preference by association analysis. British Journal of Psychology. 1970;61(3):303-21.Andreasen NC, Pressler M, Nopoulos 66. P, Miller D, Ho BC. Antipsychotic Dose Equivalents and Dose-Years: A Standardized Method for Comparing Exposure to Different Drugs. Biol Psychiatry. 2010;67(3):255-62.WHO. Composite International 67. Diagnostic Interview (CIDI). 1990(Geneva: World Health Organization).Rorden C, Brett M. Stereotaxic display 68. of brain lesions. Behavioural neurology. 2000;12(4):191-200.Leemans A, Jeurissen B, Sijbers J, Jones 69. DK, editors. ExploreDTI: a graphical toolbox for processing, analyzing, and visualizing diffusion MR data. 17th Annual Meeting of Intl Soc Mag Reson Med; 2009; Hawaii, USA.Irfanoglu MO, Walker L, Sarlls J, 70. Marenco S, Pierpaoli C. Effects of image distortions originating from susceptibility variations and concomitant fi elds on diffusion MRI tractography results. Neuroimage. 2012;61(1):275-88.Klein S, Staring M, Murphy K, Viergever 71.
MA, Pluim JP. elastix: a toolbox for intensity-based medical image registration. IEEE Trans Med Imaging. 2010;29(1):196-205.Chang LC, Jones DK, Pierpaoli C. 72. RESTORE: robust estimation of tensors by outlier rejection. Magn Reson Med. 2005;53(5):1088-95.Smith SM, Jenkinson M, Johansen-Berg H, 73. Rueckert D, Nichols TE, Mackay CE, et al. Tract-based spatial statistics: Voxelwise analysis of multi-subject diffusion data. Neuroimage. 2006;31(4):1487-505.Anderson MJ, Robinson J. Permutation 74. tests for linear models. Aust Nz J Stat. 2001;43(1):75-88.Winkler AM, Ridgway GR, Webster 75. MA, Smith SM, Nichols TE. Permutation inference for the general linear model. Neuroimage. 2014;92:381-97.Smith SM, Nichols TE. Threshold-76. free cluster enhancement: addressing problems of smoothing, threshold dependence and localisation in cluster inference. Neuroimage. 2009;44(1):83-98.Mori S, Oishi K, Jiang H, Jiang L, Li X, 77. Akhter K, et al. Stereotaxic white matter atlas based on diffusion tensor imaging in an ICBM template. Neuroimage. 2008;40(2):570-82.Hua K, Zhang J, Wakana S, Jiang H, Li 78. X, Reich DS, et al. Tract probability maps in stereotaxic spaces: analyses of white matter anatomy and tract-specifi c quantifi cation. Neuroimage. 2008;39(1):336-47.Team RDC. R: A language and 79. environment for statistical computing. In: R Foundation for Statistical Computing V, Austria, editor. 2008.

2
59
THE DETAILS OF STRUCTURAL CONNECTIVITY
Supplementary material
Abbreviations used:ALIC_R = Anterior limb of internal capsule Right• ALIC_L = Anterior limb of internal capsule Left• LPLIC_R = Posterior limb of internal capsule Right• PLIC_L = Posterior limb of internal capsule Left• RPIC_R = Retrolenticular part of internal capsule Right• RPIC_L = Retrolenticular part of internal capsule Left• ACR_R = Anterior corona radiata Right• ACR_L = Anterior corona radiata Left• SCR_R = Superior corona radiata Right• SCR_L = Superior corona radiata Left• PCR_R = Posterior corona radiata Right• PCR_L = Posterior corona radiata Left• PTR_R = Posterior thalamic radiation Right• GCOR = Genu of corpus callosum• PTR_L = Posterior thalamic radiation Left• SAS_R = Sagittal stratum Right• SAS_L = Sagittal stratum Left• EXC_R = External capsule Right• EXC_L = External capsule Left• CIN_R = Cingulum (cingulate gyrus) Right• CIN_L = Cingulum (cingulate gyrus) Left• CINH_R = Cingulum (hippocampus) Right• CINH_L = Cingulum (hippocampus) Left• FOR_C_R = Fornix (cres) / Stria terminalis Right• BCOR = Body of corpus callosum• FOR_C_R = Fornix (cres) / Stria terminalis Right• FOR_C_L = Fornix (cres) / Stria terminalis Left• SLF_R = Superior longitudinal fasciculus Right• SLF_L = Superior longitudinal fasciculus Left• SFOF_R = Superior fronto-occipital fasciculus Right• SFOR_L = Superior fronto-occipital fasciculus Left• UF_R = Uncinate fasciculus Right• UF_L = Uncinate fasciculus Left• TAP_R = Tapetum Right• TAP_L = Tapetum Left• SCOR = Splenium of corpus callosum• FOR_B = Column and body of fornix• FMAJ = Forceps major• FMIN = Forceps minor•

Chapter 2
60
Table 1. Number of signifi cant (P<0.05; the numbers in gray did not remain signifi cant after a more conservative threshold of P<0.01) voxels located at the radial diffusivity (RD) skeleton in each brain area for the patients > controls and patients > siblings comparisons in the two models (basic model and cannabis and other drugs) and number of signifi cant voxels located at the mean diffusivity (MD) skeleton in each brain area for the patients > controls comparison in the two models.

2
61
THE DETAILS OF STRUCTURAL CONNECTIVITY
RD RD RD RD MD MD
Basic model
+ Cannabis / other drugs
Basic model
+ Cannabis / other drugs
Basic model
+ Cannabis / other drugs
Type Area
Patients>
controls
Patients>
controls
Patients>
siblings
Patients>
siblings
Patients>
controls
Patients>
controls
Proj
ectio
n fi b
ers
ALIC_R 239 234 105 328 4 0ALIC_L 3 208 21 276 13 13PLIC_R 185 151 72 221 0 0PLIC_L 53 64 0 304 118 86RPIC_R 334 315 305 303 210 195RPIC_L 172 179 165 213 145 148ACR_R 1001 1105 920 1040 403 340ACR_L 982 963 844 897 468 471SCR_R 690 587 827 793 547 472SCR_L 475 441 659 707 541 511PCR_R 550 511 415 404 338 295PCR_L 460 440 334 330 390 345PTR_R 622 573 505 529 435 382PTR_L 581 522 453 439 337 68
Ass
ocia
tion
fi ber
s
SAS_R 251 182 203 220 163 161SAS_L 186 170 103 108 163 0EXC_R 410 447 239 258 3 6EXC_L 334 367 15 98 20 16CIN_R 58 0 44 51 0 0CIN_L 67 1 0 0 4 0CINH_R 56 0 2 2 0 0CINH_L 1 0 0 0 0 0FOR_C_R 105 104 135 134 75 79FOR_C_L 116 122 29 135 0 0SLF_R 407 420 313 384 236 154SLF_L 53 41 167 190 71 340SFOF_R 50 49 57 55 26 0SFOF_L 0 0 0 40 3 4UF_R 19 36 0 0 0 1UF_L 4 4 2 3 0 0
Com
mis
sura
l fi b
ers TAP_R 36 38 3 5 19 0
TAP_L 1 1 0 0 1 1GCOR 896 990 1128 1206 725 817BCOR 2654 2662 2575 2629 2355 2333SCOR 743 816 771 880 353 265FOR_B 51 95 0 93 0 0FMAJ 623 639 529 567 274 188FMIN 1016 1233 1316 1406 969 1078
No regions with higher RD where found comparing siblings > controls. Results controlled for; age, sex, handedness, highest level of education (basic model); and basic model + cannabis and other drugs.

Chapter 2
62
Table 2. Shape measure case linear (CL) and signifi cant (P<0.05; the numbers in gray did not remain signifi cant after a more conservative threshold of P<0.01) voxels in each brain area for the patients < controls and patients < siblings comparisons in the two models.

2
63
THE DETAILS OF STRUCTURAL CONNECTIVITY
CL CL CL CL
Basic model + Cannabis / other drugs
Basic model + Cannabis / other drugs
Type Area
Patients <
controls
Patients <
controls
Patients <
siblings
Patients <
siblings
Proj
ectio
n fi b
ers
ALIC_R 19 27 15 50ALIC_L 0 0 36 37PLIC_R 41 0 4 170PLIC_L 0 13 108 137RPIC_R 56 3 0 241RPIC_L 0 0 91 174ACR_R 573 707 863 968ACR_L 0 85 765 842SCR_R 440 245 434 583SCR_L 176 178 202 309PCR_R 279 202 70 205PCR_L 156 88 89 129PTR_R 192 171 0 516PTR_L 203 24 246 335
Ass
ocia
tion
fi ber
s
SAS_R 12 43 0 99SAS_L 0 3 9 31EXC_R 368 274 154 532EXC_L 36 277 342 488CIN_R 7 6 28 29CIN_L 69 1 0 0CINH_R 0 0 0 0CINH_L 2 0 0 0FOR_C_R 7 46 0 4FOR_C_L 0 59 146 151SLF_R 128 1 166 191SLF_L 0 0 0 138SFOF_R 39 42 51 56SFOR_L 0 0 0 0UF_R 35 46 0 0UF_L 0 34 0 0
Com
mis
sura
l fi b
ers TAP_R 43 40 0 33
TAP_L 1 0 0 0GCOR 183 125 910 993BCOR 1893 1751 2416 2455SCOR 251 126 323 564FOR_B 1 98 0 0FMAJ 317 142 178 412FMIN 107 86 1145 1225
Abbreviations are as in Table 1. No regions with lower CL where found comparing siblings and controls. Results controlled for: (basic model) age, sex, handedness, highest level of education; (+ cannabis and other drugs) age, sex, handedness, highest level of education and cannabis use.

Chapter 2
64
Table 3. Shape measure case planar (CP) and signifi cant (P<0.05; the numbers in gray did not remain signifi cant after a more conservative threshold of P<0.01) voxels in each brain area for the patients < controls and siblings < controls comparisons in the two models.
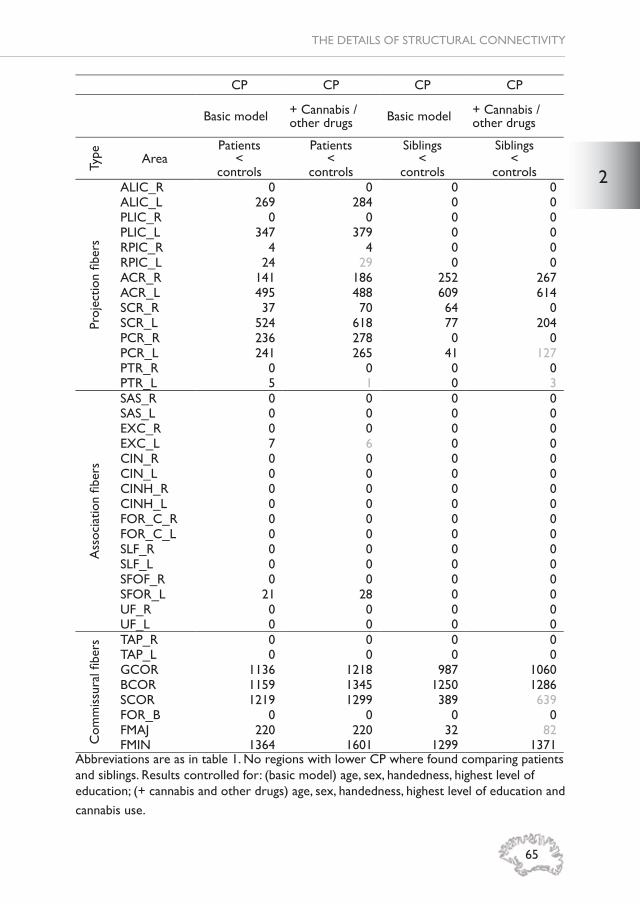
2
65
THE DETAILS OF STRUCTURAL CONNECTIVITY
CP CP CP CP
Basic model + Cannabis / other drugs Basic model + Cannabis /
other drugs
Type Area
Patients <
controls
Patients <
controls
Siblings <
controls
Siblings <
controls
Proj
ectio
n fi b
ers
ALIC_R 0 0 0 0ALIC_L 269 284 0 0PLIC_R 0 0 0 0PLIC_L 347 379 0 0RPIC_R 4 4 0 0RPIC_L 24 29 0 0ACR_R 141 186 252 267ACR_L 495 488 609 614SCR_R 37 70 64 0SCR_L 524 618 77 204PCR_R 236 278 0 0PCR_L 241 265 41 127PTR_R 0 0 0 0PTR_L 5 1 0 3
Ass
ocia
tion
fi ber
s
SAS_R 0 0 0 0SAS_L 0 0 0 0EXC_R 0 0 0 0EXC_L 7 6 0 0CIN_R 0 0 0 0CIN_L 0 0 0 0CINH_R 0 0 0 0CINH_L 0 0 0 0FOR_C_R 0 0 0 0FOR_C_L 0 0 0 0SLF_R 0 0 0 0SLF_L 0 0 0 0SFOF_R 0 0 0 0SFOR_L 21 28 0 0UF_R 0 0 0 0UF_L 0 0 0 0
Com
mis
sura
l fi b
ers TAP_R 0 0 0 0
TAP_L 0 0 0 0GCOR 1136 1218 987 1060BCOR 1159 1345 1250 1286SCOR 1219 1299 389 639FOR_B 0 0 0 0FMAJ 220 220 32 82FMIN 1364 1601 1299 1371
Abbreviations are as in table 1. No regions with lower CP where found comparing patients and siblings. Results controlled for: (basic model) age, sex, handedness, highest level of education; (+ cannabis and other drugs) age, sex, handedness, highest level of education and cannabis use.

Chapter 2
66
Table 4. Shape measure case spherical (CS) and signifi cant (P<0.05; the numbers in gray did not remain signifi cant after a more conservative threshold of P<0.01) voxels in each brain area for the patients > controls and patients > siblings comparisons in the two models.

2
67
THE DETAILS OF STRUCTURAL CONNECTIVITY
CS CS CS CS
Basic model + Cannabis / other drugs Basic model + Cannabis /
other drugs
Type Area
Patients >
controls
Patients >
controls
Patients >
siblings
Patients >
siblings
Proj
ectio
n fi b
ers
ALIC_R 439 458 38 342ALIC_L 447 466 327 377PLIC_R 337 376 0 193PLIC_L 341 352 353 368RPIC_R 351 367 0 68RPIC_L 289 350 260 318ACR_R 1155 1220 689 873ACR_L 1185 1185 700 882SCR_R 848 839 865 915SCR_L 669 662 756 780PCR_R 620 612 436 468PCR_L 480 480 350 365PTR_R 523 541 138 166PTR_L 607 577 467 479
Ass
ocia
tion
fi ber
s
SAS_R 233 258 0 84SAS_L 208 213 96 102EXC_R 581 682 0 7EXC_L 553 660 273 354CIN_R 0 0 46 51CIN_L 76 240 8 12CINH_R 0 0 0 4CINH_L 6 8 5 5FOR_C_R 129 140 0 29FOR_C_L 157 167 91 137SLF_R 354 431 198 447SLF_L 380 438 41 488SFOF_R 55 52 0 40SFOR_L 50 58 30 54UF_R 41 48 0 1UF_L 32 36 3 3
Com
mis
sura
l fi b
ers TAP_R 34 34 9 10
TAP_L 1 1 1 1GCOR 1267 1387 1288 1408BCOR 2752 2785 2651 2719SCOR 1262 1387 1168 1341FOR_B 98 101 0 18FMAJ 667 684 489 569FMIN 1599 1834 1474 1616
Abbreviations are as in table 1. No regions with higher CS where found comparing siblings and controls. Results controlled for: (basic model) age, sex, handedness, highest level of education; (+ cannabis and other drugs) age, sex, handedness, highest level of education and cannabis use.

CH
APT
ERThreeMICROSTRUCTURAL
WHITE MATTER NETWORK CONNECTIVITY IN INDIVIDUALS WITH PSYCHOTIC DISORDER, UNAFFECTED SIBLINGS AND
CONTROLS
Stijn Michielse, Kimberley Rakijo, Sanne Peeters, Wolfgang Viechtbauer, Jim van Os, Machteld Marcelis; for Genetic Risk and Outcome of Psychosis (G.R.O.U.P.)
Submitted for publication

Chapter 3
70
AbstractBackground: Altered structural network-connectivity has been reported in psychotic disorder but whether these alterations are associated with genetic vulnerability, and/or with phenotypic variation, has been less well examined. This study examined network-connectivity in individuals with (increased risk for) psychotic disorder with respect to controls, and whether network-connectivity alterations vary with (subclinical) symptomatology. Methods: Network-connectivity measures (global effi ciency (GE), local effi ciency (LE), clustering coeffi cient (CC)) were derived from diffusion weighted imaging (DWI) and were compared between 85 patients with psychotic disorder, 93 siblings without psychotic disorder and 80 healthy comparison subjects using multilevel regression models. In patients, associations between Positive and Negative Syndrome Scale (PANSS) symptoms and topological measures were examined. In addition, interactions between subclinical psychopathology and sibling/healthy comparison subject status were examined in models of topological measures.Results: Patients, siblings and healthy comparison subjects did not differ in GE, LE, or in CC. While there was no main effect of group, siblings had a signifi cantly higher CC compared to patients (B=0.0039, p=0.002). In patients, none of the PANSS symptom domains were signifi cantly associated with the three network-connectivity measures. The two-way interaction between group and SIR-r positive score in the model of LE was signifi cant (χ2 =6.24, p=0.01, df=1). In the model of CC, the interactions between group and respectively SIS-r positive (χ2 =5.59, p=0.02, df=1) and negative symptom scores (χ2 =4.71, p=0.03, df=1) were signifi cant. Stratifi ed analysis showed that, in siblings, decreased LE and CC was signifi cantly associated with increased SIS-r positive scores (LE: B=-0.0049, p=0.003, CC: B=-0.0066, p=0.01) and that decreased CC was signifi cantly associated with increased SIS-r negative scores (B=-0.012, p=0.003).Conclusion: The fi ndings indicate absence of structural network-connectivity alterations in individuals with psychotic disorder and in individuals at higher than average genetic risk for psychotic disorder, in comparison with healthy subjects. The differential subclinical symptom-network connectivity associations in siblings with respect to controls may be a sign of psychosis vulnerability in the siblings.

3
71
MICROSTRUCTURAL NETWORK CONNECTIVITY
IntroductionStructural white matter disconnectivity may contribute to the cerebral vulnerability for psychotic disorder (1). Diffusion Magnetic Resonance Imaging (dMRI) in combination with network analysis techniques, allows for the in-vivo study of white matter tracts and testing the ‘disconnectivity hypothesis’. The human brain can be considered a small-world network (2) as there is a very short distance between neighboring brain areas and few direct connections to distant areas. This small-world network features a fast system response and enables the interaction between brain areas in an effi cient matter (3). An effi cient structural brain connection requires preserved axonal wiring and an extensive total wiring volume of the network. Furthermore, high clustering and small path lengths refl ect effi cient information transfer over the network with a high capacity to integrate information across the network (4). Research on structural network-connectivity in psychotic disorder has provided evidence for alterations in network measures, such as increased characteristic path length (i.e., the average shortest path length between two regions) and a loss of frontal lobe hub regions (5, 6). Additionally, studies on the clustering coeffi cient (CC), a measure of local cohesiveness indicating a stronger local specialization, showed increased (7), decreased (8) and unchanged (9) CC in patients compared to healthy subjects. Furthermore, decreased local effi ciency (LE; i.e., how well information circulates over the network) has been found in the frontal, temporal, (para)-limbic regions and in the putamen in patients with psychotic disorder compared to healthy subjects (10, 11). Previous research also showed reduced global effi ciency (GE) in patients with psychotic disorder compared to healthy subjects (10, 12-14), indicating a less effi cient information circulation over the network in general. In order to understand how brain connectivity is related to the psychosis phenotype, prior studies have examined symptom-structural network-connectivity relationships. For example, a decrease in GE may result in disrupted integration of the brain networks (15), which may be, indirectly, related to impaired cognitive processing and general functioning in patients with psychotic disorder (9). In addition, a negative correlation between structural network GE and LE properties and positive, negative, and total scores of the Positive and Negative Syndrome Scale (PANSS) has been reported (10). Notably, all associations between distinct symptom dimensions and network effi ciency showed similar directions of effect. In another study, higher positive symptom severity in patients was associated with overall reduction of structural connectivity in the default mode
Chapter 3
72
network as measured by the number of tracts connecting the network (16). Thus, both general and cognitive/symptomatic functioning have been associated with reduced network effi ciency and alterations in CC. Furthermore, reduced asymmetric (specifi c for a hemisphere) LE has been reported in several frontal regions and the hippocampus in patients with psychotic disorder compared to healthy subjects in a cross-sectional study (17). A follow-up longitudinal dMRI study in a smaller sample within the same study, showed increased small-worldness (which may indicate higher local clustering and shorter path lengths between regions) in patients over time (18). Additionally, this study indicated that with reduced positive symptoms over time in patients, small-worldness increased, suggesting restoration of global structural integration of the brain network (18).If structural network-connectivity were infl uenced by genetic vulnerability, fi rst-degree relatives would be expected to have increased levels of altered network-connectivity compared to healthy subjects. Indeed, a previous study reported decreased LE in unaffected parents (fi rst-degree relatives) compared to healthy subjects in the right temporal cortices, left supplementary motor area, left superior temporal pole and left thalamus (11). While research in fi rst-degree relatives on LE is limited to this one study (and reports on CC are missing), research on rich club (a tightly interconnected core of regions) organization of structural networks suggests impaired connectivity in siblings (14, 19) and parents (20) of patients with psychotic disorder. Studies on help-seeking individuals with an at-risk mental state for psychotic disorder (help-seeking individuals with affective or substance use disorder and a degree of psychosis admixture, some of whom will have a poor prognosis) showed preserved (19) as well as reduced GE (21, 22). In addition, while there is little known about associations between symptomatology and brain network topology in patients, there is very little work on associations between subclinical symptomatology and DWI based network-connectivity in siblings. Therefore, the current study examined structural brain network alterations in individuals with psychotic disorder, siblings without disorder and healthy comparison subjects. It is hypothesized that patients and siblings will show reduced GE and LE compared to healthy comparison subjects, in addition to alterations in CC. We also examined whether (subclinical) symptoms would be associated with decreased network effi ciency and CC.
Methods and MaterialsParticipantsData was collected in the context of a multicenter longitudinal study

3
73
MICROSTRUCTURAL NETWORK CONNECTIVITY
(Genetic Risk and Outcome of Psychosis, G.R.O.U.P) in the Netherlands. In selected representative geographical areas in the Netherlands and neighboring Belgium, patients were identifi ed through clinicians providing health care for those with psychotic disorder. Siblings were contacted through participating patients. Mailings and advertisements in local newspapers of the same geographical areas were used in order to recruit healthy comparison subjects. The total sample consisted of 258 participants: 85 patients with a psychotic disorder, 93 siblings without a psychotic disorder, and 80 healthy comparison subjects. Familial relatedness can be found elsewhere (23) and in the supplementary information. All participants were screened before MRI scanning using the following exclusion criteria: brain injury with unconsciousness > than 1 hour, meningitis or other neurological diseases with possible impact on brain structure or function, cardiac arrhythmia requiring medical treatment, and severe claustrophobia. In addition, participants with metal corpora aliena were excluded from the study, as were women with intrauterine device status and (suspected) pregnancy. The standing ethics committee approved the study protocol, and all the participants gave written informed consent in accordance with the committee’s guidelines.
Clinical measuresThe PANSS (24) was used to measure psychotic symptoms in patients over the two weeks prior to inclusion. A fi ve-factor model (25) for the PANSS yielded positive symptoms, negative symptoms, disorganization symptoms, excitement and emotional distress. The scores of the individual items of the fi ve symptom dimensions were summed. In healthy comparison subjects and siblings, the Structured Interview for Schizotypy –revised (SIS-r) was used for assessing subclinical psychotic symptoms (26). Subclinical positive symptoms were measured by the items referential thinking, psychotic phenomena, derealisation, magical ideation, illusions, and suspiciousness. Negative-disorganized symptoms were covering the items social isolation, sensitivity, introversion, restricted affect, disturbances in associative and goal-directed thinking, poverty of speech, and eccentric behavior. The mean of the positive SIS-r and negative SIS-r items was calculated per participant. Educational level was defi ned as the highest accomplished level of education. Handedness was assessed using the Annett Handedness Scale (27). In the patient group, antipsychotic medication use (AP use) was evaluated by patient report and verifi ed with the treating consultant psychiatrist. Best estimate lifetime (cumulative) AP use was determined

Chapter 3
74
by multiplying the number of days of AP use with the corresponding haloperidol equivalents and summing these scores for all periods of AP use (including the exposure period between baseline assessment for the G.R.O.U.P study and the moment of baseline MRI scanning), using previously described AP dose equivalents calculations (28). Substance use was measured with the Composite International Diagnostic Interview (CIDI) sections B-J-L (29). Cannabis and other drug use were reported as frequency during the last 12 months as well as lifetime use. Data on lifetime cannabis and other drug use was missing for respectively eight (3% missing) and two participants (1% missing). Information on alcohol use was reported as weekly consumption over the last year and was missing for 33 participants (13%). Additional information on this sample can be found elsewhere (23).
MRI data acquisitionMethods for data acquisition were identical to those in previously described protocol (23). In short, magnetic resonance imaging scans were obtained at Maastricht University, the Netherlands, using an Allegra syngo MR A30 (Siemens, Erlangen, Germany) operating at 3.0 Tesla. The following anatomical scan parameters were used: Modifi ed Driven Equilibrium Fourier Transform (MDEFT) sequence; 176 slices, 1 mm isotropic voxel size; Magnetization Prepared Rapid Acquisition Gradient-Echo (MPRAGE; Alzheimer’s Disease Neuroimaging Initiative) sequence 192 slices, 1 mm isotropic voxel size. Microstructural anatomy was examined using diffusion tensor imaging with an echo-planar-imaging sequence (1.8 mm isotropic voxel size, b-value 1000 s/mm², 85 slices). Total acquisition time of the DTI sequence was 15 minutes. Details on the balance between the two different scan types due to a scanner update can be found in the supplementary materials.
DWI processingDetails on processing of the DWI data can be found elsewhere (23) and in the supplementary materials. Processing was conducted in ExploreDTI (30) and after tensor estimation, white matter (WM) tracts were reconstructed for each individual dataset, using deterministic fi ber tractography (31). Parcellation of the whole brain fi ber tracts was done using the generally accepted standard automated anatomical atlas labeling (AAL, (32)). This procedure provides 90 (sub)-cortical brain regions of interest (ROI), each representing a node in the network. The reconstructed white matter tracts were represented as edges between each pair of nodes. The AAL atlas

3
75
MICROSTRUCTURAL NETWORK CONNECTIVITY
provides adequate cortical coverage and is widely used in both structural and functional connectivity analysis, as shown in Figure 1.

Chapter 3
76
Figu
re 1
. For
eac
h D
WI d
atas
et (
A)
who
le-b
rain
det
erm
inis
tic t
ract
ogra
phy
was
per
form
ed. T
he a
utom
ated
an
atom
ical
labe
ling
atla
s (A
AL)
tem
plat
e w
ith a
tot
al o
f 90
cort
ical
and
sub
cort
ical
bra
in r
egio
ns, w
ithou
t ce
rebe
llum
(B
), w
as c
o-re
gist
ered
to
the
DW
I tra
ctog
raph
y im
age
(C).
The
num
ber
of c
onne
ctio
ns b
etw
een
any
2 re
gion
s of
the
A
AL
tem
plat
e w
as c
alcu
late
d re
sulti
ng in
a s
ymm
etri
c 90
x 9
0 w
eigh
ted
conn
ectiv
ity m
atri
x (D
). T
he c
onne
ctiv
ity
mat
rix
can
be v
isua
lized
as
a gr
aph,
com
pose
d of
nod
es (
brai
n ar
eas)
and
edg
es (
whi
te m
atte
r tr
acts
) (E
).

3
77
MICROSTRUCTURAL NETWORK CONNECTIVITY
Network constructionWith the use of the individual brain networks, connectivity measures were computed in order to quantify the network architecture using the Brain Connectivity Toolbox. Connectivity was described in terms of GE, LE, and CC (33) based on the pass criteria (the direction is unknown, because tractography is bidirectional) per ROI. All connectivity network measures were calculated per individual and statistically analyzed using R version 3.2.3 (34).
Statistical analysisGroup comparisons of GEGroup comparisons (patients, siblings, healthy comparison subjects) for GE were carried out using a multilevel linear regression model with one GE measure per individual, who belong to a family (level 1). The “lme” (linear mixed effect) command in R was used to fi t a mixed-effects models with random intercepts at the family level (34, 35). Group was treated as a three-level factor. The model included age, sex, handedness, level of education, and cannabis use as a priori hypothesized confounders (in line with previous research (23)). Group comparisons of LE an dCCGroup comparisons for LE and CC were done based on 90 regions clustered within individuals (level 1), and individuals clustered within families (level 2). Hence, random intercepts were added to the model for families and individuals within families. Group × ROI interactions in models of LE and CC were examined using Wald-type chi-square tests. The number of voxels was used in the model as an analytic weight to control for the ROI extent (i.e., the error variance for a particular observation was inversely weighted by the number of voxels within the corresponding region). Post-estimation linear hypothesis testing was performed in case of signifi cant group × ROI interactions, to test for differences in slopes between i) patients and healthy comparison subjects, ii) siblings and healthy comparison subjects and iii) patient and siblings. Because we consider the analysis approach exploratory and hence hypotheses-generating, the analysis was conducted for all 90 ROIs and a Bonferroni correction was applied. If the group × ROI interaction were not signifi cant, the main effect of group was investigated in a model without ROI. The analyses were corrected for the previously mentioned confounders.
Associations with (subclinical) symptoms Patients with psychotic disorder

Chapter 3
78
In the multiple regression model of GE (dependent variable), the association with the PANSS positive, negative, disorganized, excitement, and emotional distress symptoms (independent variables in separate models) was examined in patients. Bonferroni correction (equal to p<0.01) was applied to correct for testing the fi ve symptom models.In the models of LE and CC, the interactions between PANSS symptoms and ROI were tested. In case of signifi cant interactions in any of the fi ve PANSS dimensions, post-hoc estimation was applied for all 90 regions. Analyses were corrected for multiple comparisons, at the level of the fi ve (symptom) interaction tests, using a conservative p-level of p<0.01, and at the level of 90 regions, with Bonferroni. The multilevel analyses were corrected for age, sex, level of education, illness duration, cannabis use and lifetime AP exposure. If the PANSS symptom × ROI interaction was not signifi cant (p≥0.01), main effects of PANSS symptoms on overall LE and CC were investigated in a model without ROI. Bonferroni correction (equal to p<0.01) was applied to correct for testing the fi ve symptom models.
Siblings and healthy comparison subjects.The associations between SIS-r positive/negative score and GE, LE and CC were separately examined in the total group (combined sibling and healthy comparison group). In the model of GE, the interactions between group and SIS-r positive and negative symptoms were examined separately. In case of a signifi cant interaction (p<0.05), stratifi cation was applied per group to investigate association between GE and symptoms. In the multilevel models of LE and CC, the two group × ROI × SIS-r symptom interactions were tested (for positive and negative symptoms). In case of signifi cant group × ROI × SIS-r interactions (p<0.01), post-estimation linear hypothesis testing was performed for all 90 regions to test for differences in slopes between siblings and healthy comparison subjects. This analysis was corrected for multiple comparisons with Bonferroni. Confounding factors in the model were age, sex and level of education. If the group x ROI × SIS-r interaction was not signifi cant (p≥0.01), the interaction between group and SIS-r symptom was investigated in a model without ROI.
ResultsDemographicsThere were more men in the patient and sibling group compared to the healthy comparison group. The healthy comparison group had a higher

3
79
MICROSTRUCTURAL NETWORK CONNECTIVITY
educational level than the patients and siblings. Most patients were not in acute illness phases as evidenced by low PANSS score (Table 1) and by the fact that 58% of the patients were in remission according to the remission criteria of Andreasen (36). The patients were more frequent cannabis and non-cannabis drug users than the siblings and healthy comparison subjects (Table 1). At the time of scanning, seventy patients were receiving AP medication (second generation: n = 67; fi rst generation; n =3). The mean current dosage of AP medication in terms of standard haloperidol equivalents was 4.6 milligrams (mg) (SD = 5.0).
Table1. Demographic characteristics
Healthy comparison
subjects(n=80)
Siblings (n=93)
Patients (n=85)
Age at scan (years) 30.8 (10.8) 29.4 (8.8) 28.3 (7.0)
Sex (% male) 29 (36 %) 49 (52%) 58 (68%)
Handedness 76.3 (58.2) 75.1 (58.6) 71.1 (63.9)Level of education 5.4 (1.8) 5.1 (2.1) 4.1 (2.0)No. of times cannabis use last year 5.4 (41.5) 7.3 (40.2) 37.0 (97.8)
No. of times non-cannabis drug use last year 4.7 (41.2) 0.4 (4.1) 22.5 (71.0)
PANSS Positive 7.3 (1.1) 7.2 (0.9) 10.3 (4.9)
PANSS Negative 8.1 (0.9) 8.4 (1.9) 12.0 (5.8)
PANSS Disorganization 10.1 (1.1) 10.3 (0.7) 12.5 (4.1)
PANSS Excitement 8.3 (1.1) 8.5 (1.3) 9.7 (2.7)
PANSS Emotional Distress 9.2 (2.0) 9.8 (2.5) 13.1 (5.2)
SIS-r Positive 0.46 (0.44) 0.56 (0.40) -
SIS-r Negative 0.25 (0.23) 0.33 (0.24) -
In remission - - 49/84 (58%)
Age of onset (years) - - 21.9 (7.1)
Duration of illness (years) - - 6.4 (4.0)Cumulative lifetime AP exposure in mean haloperidol equivalents
- -6692.7
(6254.2)Alcohol use per week frequency 5.0 (7.0) 9.8 (17.3) 5.0 (9.1)
Means (SDs) are reported. Abbreviations: SD= Standard Deviation; PANSS = Positive and Negative Syndrome Scale; SIS-r = Structured Interview for Schizotypy-revised; AP=Antipsychotic. Cumulative lifetime AP exposure is expressed as haloperidol equivalents. Some data were missing as described in the supplementary materials.

Chapter 3
80
Group comparison of global effi ciency (GE)The GE was not signifi cantly different between the three groups (χ2=3.50, p=0.17, df=2) (Table 2).
Group comparison on local effi ciency and clustering coeffi cient (CC)In the model of LE, there was no signifi cant interaction between group and ROI (χ2 =198.29, p=0.14, df=178) and neither in the model of CC (χ2=204.99, p=0.08, df=178) (Table 2). There was a signifi cant main effect of group in the model of CC (χ2=9.77, p=0.008, df=2), but not in the model of LE (χ2=1.68, p=0.43, df=2). The CC was equal between healthy comparison subjects and respectively patients (B=-0.0032, p=0.07) and siblings (B=0.00069, p=0.68), but signifi cantly different between siblings and patients (B=0.0039, p=0.002).
Table 2: Means and group comparison of topological outcome measures.
Mean (SD)Group
Comparison
Patients SiblingsHealthy
comparison subjects
χ2 p-value
Global effi ciency 0.68 (0.018) 0.69 (0.020) 0.69 (0.021) 3.50 0.17Local effi ciency 0.82 (0.067) 0.82 (0.064) 0.82 (0.065) 199.71 0.15Clustering coeffi cient 0.32 (0.065) 0.33 (0.063) 0.33 (0.065) 204.99 0.08
Reported are the mean values and SD (standard deviation) over all regions for local effi ciency and clustering coeffi cient and the χ2 and p-values of the multilevel regression analyses.
Association between topological measures and PANSS scores in patients with psychotic disorderNo signifi cant associations were found between any of the PANSS symptom scores and GE in patients with psychotic disorder (Table 3). Similarly, the interactions between any of the PANSS symptom scores and ROI in the models of LE and CC were not signifi cant (Table 3). In the main effect analyses, none of the associations between PANSS symptom scores and overall LE and CC were signifi cant at a conservative p-level of p<0.01 (LE; PANSS positive: B=0.00014, p=0.45, PANSS negative: B=-0.00023, p=0.14, PANSS disorganization: B=0.000028, p=0.92, PANSS excitement: B=0.000030, p=0.75, PANSS emotional distress: B=0.00018, p=0.25; CC; PANSS positive: B=-0.000012, p=0.95, PANSS negative: B=-0.00020, p=0.19, PANSS disorganization: B=-0.00021, p=0.36, PANSS excitement: B=-0.00044, p=0.16, PANSS emotional distress: B=-0.0000873, p=0.57).

3
81
MICROSTRUCTURAL NETWORK CONNECTIVITY
Tabl
e 3:
Ass
ocia
tions
bet
wee
n PA
NN
S sy
mpt
oms
netw
ork
conn
ectiv
ity m
easu
res
in p
atie
nts
with
psy
chot
ic d
isor
der.
PA
NSS
pos
itive
PAN
SS n
egat
ive
PAN
SS
diso
rgan
izat
ion
PAN
SS e
xcite
men
tPA
NSS
em
otio
nal
dist
ress
χ2
*p-
valu
eχ2
*p-
valu
eχ2
*p-
valu
eχ2
*p-
valu
eχ2
*p-
valu
eG
loba
l effi
cien
cy-0
.000
800.
12-0
.000
410.
34-0
.000
940.
14-0
.000
960.
27-0
.000
430.
32Lo
cal e
ffi ci
ency
x R
OI
87.5
70.
5283
.32
0.65
68.8
60.
9455
.49
0.99
93.4
10.
38C
lust
erin
g co
effi c
ient
x R
OI
91.0
00.
4583
.05
0.66
63.6
50.
9855
.63
0.99
87.4
90.
53χ2
val
ues
for
loca
l effi
cien
cy a
nd c
lust
erin
g co
effi c
ient
and
the
p-v
alue
s ar
e de
rive
d fr
om m
ultil
evel
reg
ress
ion
anal
yses
. *F
or g
loba
l effi
cien
cy t
he B
val
ues
and
p-va
lues
are
pro
vide
d.

Chapter 3
82
Association between topological measures and SIS-r scores in siblings and healthy comparison subjectsGlobal effi ciencyThere was no signifi cant interaction between group and SIS-r positive symptoms and between group and SIS-r negative symptoms in the model of GE (Table 4). Main effect analyses of the total group of siblings and healthy comparison subjects showed no signifi cant association between SIS-r positive (B=0.0042, p=0.45) or negative symptom score (B=0.0054, p=0.39).
Local effi ciency and Clustering Coeffi cientNo signifi cant three-way interactions were found between group, ROI and SIS-r positive symptoms in the models of LE and CC, and neither so with respect to SIS-r negative symptoms. The two-way interaction between group and SIR-r score in the LE model was signifi cant for SIS-r positive symptoms (χ2 =6.24, p=0.01, df=1), but not for SIS-r negative symptoms (χ2
=1.35, p=0.24, df=1). Stratifi ed analyses showed a signifi cant decrease in overall LE with increasing SIS-r positive symptom scores in siblings (B=-0.0049, p=0.003), while this association was absent in controls (B=0.00091, p=0.58). In the model of CC, the interactions between group and respectively SIS-r positive (χ2 =5.59, p=0.02, df=1) and negative (χ2 =4.71, p=0.03, df=1) symptom scores were signifi cant. Stratifi ed analyses for SIS-r positive symptoms showed a signifi cant decrease in overall CC with increasing SIS-r positive symptoms in the sibling group (B=-0.0066, p=0.01), but not in the control group (B=0.0021, p=0.43). Stratifi ed analyses for the SIS-r negative score showed a signifi cant decrease in overall CC with increasing SIS-r negative symptoms in the sibling group (B=-0.012, p=0.003), which was not the case for the control group (B=0.0022, p=0.673). There was no signifi cant association between SIS-r positive or negative score and LE and CC in the total group (siblings and controls) (Table 4).

3
83
MICROSTRUCTURAL NETWORK CONNECTIVITY
Table 4: Associations between subclinical psychotic symptoms and network connectivity measures in siblings and healthy comparison subjects.
SIS-r positive SIS-r negativeGroup x ROI x SIS-r χ2* p-value χ2* p-valueLocal effi ciency 77.85 0.79 64.17 0.98Clustering coeffi cient 80.71 0.72 68.57 0.95Group x SIS-rGlobal effi ciency 0.0057 0.14 0.0054 0.39Local effi ciency 6.24 0.01 1.35 0.24Clustering coeffi cient 5.59 0.02 4.71 0.03Main effect in total groupLocal effi ciency 100.90 0.18 103.03 0.15Clustering coeffi cient 99.44 0.21 103.05 0.15χ2 and p-values of multilevel regression analyses are provided for local effi ciency and clustering coeffi cient. For global effi ciency the B and p-values are provided. *For global effi ciency the B values and p-values are provided. Signifi cant p-values are noted in bold.
DiscussionIn this cross-sectional study, microstructural white matter inter-regional network-connectivity was examined in patients with psychotic disorder, non-psychotic siblings and healthy comparison subjects. The results showed no differences between the groups with respect to structural network-connectivity properties, except for the comparison between siblings and patients on CC. In the symptom-network connectivity analyses, none of the PANSS scores symptoms in patients were associated with the structural network-connectivity measures. Moreover, SIS-r subclinical symptom scores were not associated with regional structural network-connectivity in siblings and healthy comparison subjects. With respect to overall LE and CC, it was shown that in the sibling group higher SIS-r positive symptom scores were associated with lower overall LE and that higher SIS-r positive and negative symptom scores were associated with lower overall CC.
Group comparison of topological measuresContrary to the hypothesis and the literature, the current study fi ndings did not show lower GE and LE in patients and siblings compared to healthy subjects. The majority of prior work suggests alterations in structural white matter connectivity (1, 10, 37, 38), with generally lower GE as previously reported in patients with respect to healthy comparison subjects (10, 12, 14), while the evidence for alterations in these DWI based network-connectivity measures in siblings is scarce (14). The studies on patients included medication naïve fi rst episode patients (12), while the current population had an average illness duration of 6.4 years and almost all

Chapter 3
84
patients were medicated. Our study population had a little longer illness duration. Possibly, environmental or illness-related factors may have contributed to the differential fi ndings. The majority of the patients of the current study used cannabis (37 times in total over the last year), while the frequency of cannabis use was much lower in one study (14), and another study did not report about cannabis use (10). As cannabis use decreases the network effi ciency while increasing the CC (39), this could potentially have diminished effects on the group level in our study although we corrected for this factor in the analyses. Interestingly, previous analyses on this sample showed alterations in DWI parameters, i.e., decreased fi ber orientation and increased free water movement (23) and also lower CC based on fMRI activation (40). These DWI parameter and functional connectivity analyses are different from the current network-based connectivity analyses and show different aspects of brain alterations. Thus, whether the absence of GE and LE alterations in individuals with (vulnerability for) psychotic disorder is related to technical procedures specifi c to these DWI based network-connectivity measures, or refl ects a true fi nding has to be investigated further in future studies.
The fi nding of a non-deviated CC in patients and siblings compared to healthy comparison subjects falls into the mixed fi ndings of previous research, showing increased (7), decreased (8), and unchanged (9) CC in patients with psychotic disorder compared to healthy comparison subjects. Besides, to our knowledge, there are no reports on CC in siblings of patients with psychotic disorder. While the interaction between group and ROI in the model of CC was not signifi cant, the group by group comparison showed that siblings had a higher CC compared to patients. The inconsistent fi ndings on CC alterations in psychotic disorder may be related to differences in patient characteristics, illness-related factors or other methodological issues. One study investigated medication naïve fi rst-episode patients (8), while another study did not report on medication use (9). In the current study, most patients were treated with medication, while the group with higher than average psychosis vulnerability (siblings) was not subjected to illness-related factors such as medication use. This makes comparison of the studies diffi cult as medication and other drug use could heavily infl uence the structural brain network. Another study applied a structural network approach on anatomical data instead of white matter tracts (7), a different technique that is hard to compare with DWI based network-connectivity.

3
85
MICROSTRUCTURAL NETWORK CONNECTIVITY
While several studies have described that disconnectivity may be an important contribution to pathophysiologic alterations in psychotic disorder, refl ected by alterations in effi ciency and clustering, recent studies have also shown alterations in psychotic disorder at the level of abnormal hub organization (37, 38, 41). A hub-based (rich-club) approach, using a specifi c selection of hubs within the brain network, may be considered in future research. However, research into the structural hub organization of brain networks has the limitation of how to defi ne and select the hub regions (42). The whole brain network-based connectivity approach does not use a selection of hub regions. As described earlier, functional connectivity analyses in the current study sample showed lower CC in patients compared to healthy comparison subjects (40), while structural DWI white matter parameters indicated decreased fi ber orientation and increased free water movement (23). Combining both functional and structural MRI analyses, via a fusion MRI approach, can be very informative and would be a future step (43). Structural DWI white matter analyses are not based on tractography and are based on parameters derived from the tensor model. Thus, network-based analyses allow for a more detailed investigation of the tracts, but more processing is required. For example, selection of fi bers that pass through the region (instead of end) could have resulted in minimizing the effect size of the network-based parameters.
Association between topological measures and clinical psychotic symptomsNo signifi cant associations were found between PANSS symptom domains and network-connectivity properties in patients with psychotic disorder. This is in line with prior work by Zhang and van den Heuvel, who did not fi nd signifi cant associations between several network properties (strength, CC, characteristic path length, betweenness centrality, GE, shortest path length, and degree) and clinical psychotic symptoms (12, 44) in patients. In that study, patients with a fi rst episode of psychosis were included and were medication-naïve, so that potential confounders such as duration of illness, drug use and anti-psychotic medication were minimized (12). A study by Wang and colleagues (10) found a negative correlation between the PANSS and GE and LE, but used a general linear model that did not include covariates such as handedness and level of education. Most patients in the current study were in a remitted phase as refl ected by the relatively low PANSS scores with little variance and had shorter illness duration than the patients in the study of Wang and colleagues (10). Based on the previous literature on patients with psychotic disorder, it could be speculated that alterations in white matter network-connectivity and phenotypic correlates

Chapter 3
86
are more likely to be detected at the more severe side of the psychosis spectrum. However, this does not hold when examining individuals at the lower end of the spectrum (see below).
Association between topological measures and subclinical psychotic symptomsThe current study showed that associations between SIS-r positive and negative symptom domains and regional network-connectivity properties were not conditional on group (sibling/healthy comparison subject). While regional differences were not associated with symptoms, the overall network-measure approach showed some group differences. In siblings, signifi cant negative associations between SIS-r positive symptoms and respectively overall LE and CC were found, which was not the case for the healthy comparison subjects. In addition, there was a signifi cant negative association between SIS-r negative symptoms and CC in siblings, but not in controls. This indicates that differential subclinical symptom-global white matter network-connectivity associations may exist, depending on the genetic risk for psychotic disorder. A limited number of studies have examined the association between subclinical symptoms and topological measures in the general population or in siblings of patients with psychotic disorder. One study in help-seeking individuals with an at-risk-mental state in a population-based cohort showed that reduced rich-club organization was associated with an increased severity of negative symptoms as measured by the Scale for the Assessment of Negative Symptoms (19). In another study, no signifi cant correlation was found between rich club connectivity (integration between hubs) and total subclinical psychotic symptoms measured by the CAPE in siblings (14). The CAPE, in contrast to the SIS-r, allows for measurement of separate frequency and distress scales over the past 12 months (45), allowing for a broader assessment of subclinical psychotic symptoms since distress from the symptoms can be more informative compared to the frequency. While rich club connectivity does measure a different feature of the structural network architecture, as stated in the previous paragraph, the current fi ndings on subclinical symptoms in individual at higher than average genetic risk (siblings) not being associated with regional effi ciency and clustering, may agree with other research fi ndings in individuals at the highest genetic risk level (patients). The fi nding in siblings that lower overall LE and CC is associated with higher SIS-r positive scores, and that lower CC is associated with higher SIS-r negative symptoms scores, shows that, at the subclinical level, symptom-network connectivity association patterns can be detected and

3
87
MICROSTRUCTURAL NETWORK CONNECTIVITY
that differential patterns may exist dependent on the background genetic risk level, a fi nding that warrants replication.
Methodological considerationsParticular strengths of this study are the relatively large sample size, including a sample of siblings (higher than average genetic risk), which allowed for examination of topological measures in a genetically sensitive design in which illness-related confounding factors were not present. There were large differences in other (non-cannabis) drug use between the groups. As described in table 1, the average non-cannabis drug use over the last year was higher in patients (22.5 times) compared to controls (4.7 times) and siblings (0.4 times). While the statistical models included cannabis use as a confounder, non-cannabis drug use may have infl uenced the results. Of note, there was substantial variation in the amount of non-cannabis use over the last year in patients. In order to not overcorrect on patient status and because of the low variance of non-cannabis use in siblings and of medication use in siblings and controls, the models did not include non-cannabis drug use and medication as confouders. A problem in region-based analyses of topological measures is the necessity to correct for multiple comparisons, while maintaining suffi cient statistical power. As there is no consensus on how to control for these multiple tests, we chose to be conservative.Topological measures of the structural brain networks are highly dependent on the wiring cost of the network, which can be described as the number of possible connections between regions (46). Due to alternatives for setting a threshold of the wiring cost of the network, studies could show different results and make them less generalizable. Moreover, the applied deterministic tractography algorithm could have infl uenced the results of the network-based connectivity analyses. While this approach was carefully chosen, studies have shown that other algorithms may provide different network-based outcomes (31, 47).
ConclusionThis cross-sectional study analyzed structural white matter network-connectivity in individuals at different levels of genetic risk for psychotic disorder. The results showed absence of differences in three network-connectivity properties between patients with psychotic disorder, siblings, and healthy comparison subjects, except for an increased CC in the sibling compared against patients. Symptom measurements were not associated with the regional network-properties in patients, while in siblings a higher

Chapter 3
88
SIS-r positive symptom score was associated with lower overall LE/CC and a higher SIS-r negative symptom score was associated with lower overall CC. Although the fi ndings were not in line with the a priori stated hypotheses, the current study adds to the literature by providing evidence for absence of network-based connectivity in individuals with (vulnerability for) psychotic disorder. With respect to global network-connectivity parameters, differential patterns of association with subclinical symptoms may exist between siblings and controls.

3
89
MICROSTRUCTURAL NETWORK CONNECTIVITY
Friston KJ. Schizophrenia and the 1. disconnection hypothesis. Acta psychiatrica Scandinavica Supplementum. 1999;395:68-79.Sporns O, Chialvo DR, Kaiser M, 2. Hilgetag CC. Organization, development and function of complex brain networks. Trends in cognitive sciences. 2004;8(9):418-25.Lago-Fernandez LF, Huerta R, Corbacho 3. F, Siguenza JA. Fast response and temporal coherent oscillations in small-world networks. Phys Rev Lett. 2000;84(12):2758-61.Laughlin SB, Sejnowski TJ. 4. Communication in neuronal networks. Science. 2003;301(5641):1870-4.van den Heuvel MP, Mandl RC, Stam 5. CJ, Kahn RS, Hulshoff Pol HE. Aberrant frontal and temporal complex network structure in schizophrenia: a graph theoretical analysis. The Journal of neuroscience : the offi cial journal of the Society for Neuroscience. 2010;30(47):15915-26.Zhou Y, Fan L, Qiu C, Jiang T. Prefrontal 6. cortex and the dysconnectivity hypothesis of schizophrenia. Neurosci Bull. 2015;31(2):207-19.Zhang Y, Lin L, Lin CP, Zhou Y, Chou 7. KH, Lo CY, et al. Abnormal topological organization of structural brain networks in schizophrenia. Schizophrenia research. 2012;141(2-3):109-18.Li F, Lui S, Yao L, Ji G-J, Liao W, Sweeney 8. JA, et al. Altered White Matter Connectivity Within and Between Networks in Antipsychotic-Naive First-Episode Schizophrenia. Schizophrenia Bull. 2018;44(2):409-18.Yeo RA, Ryman SG, van den Heuvel 9. MP, de Reus MA, Jung RE, Pommy J, et al. Graph Metrics of Structural Brain Networks in Individuals with Schizophrenia and Healthy Controls: Group Differences, Relationships with Intelligence, and Genetics. J Int Neuropsychol Soc. 2016;22(2):240-9.Wang QF, Su TP, Zhou Y, Chou KH, 10. Chen IY, Jiang TZ, et al. Anatomical insights into disrupted small-world networks in schizophrenia. Neuroimage. 2012;59(2):1085-93.Yan H, Tian L, Wang Q, Zhao Q, Yue 11. W, Yan J, et al. Compromised small-
world effi ciency of structural brain networks in schizophrenic patients and their unaffected parents. Neurosci Bull. 2015;31(3):275-87.Zhang R, Wei Q, Kang Z, Zalesky A, Li M, 12. Xu Y, et al. Disrupted brain anatomical connectivity in medication-naive patients with fi rst-episode schizophrenia. Brain Struct Funct. 2015;220(2):1145-59.van den Heuvel MP, Sporns O, Collin 13. G, Scheewe T, Mandl RCW, Cahn W, et al. Abnormal rich club organization and functional brain dynamics in schizophrenia. Jama Psychiat. 2013;70(8):783-92.Collin G, Kahn RS, de Reus MA, Cahn 14. W, van den Heuvel MP. Impaired rich club connectivity in unaffected siblings of schizophrenia patients. Schizophr Bull. 2014;40(2):438-48.Deco G, Tononi G, Boly M, Kringelbach 15. ML. Rethinking segregation and integration: contributions of whole-brain modelling. Nat Rev Neurosci. 2015;16(7):430-9.Skudlarski P, Jagannathan K, Anderson 16. K, Stevens MC, Calhoun VD, Skudlarska BA, et al. Brain connectivity is not only lower but different in schizophrenia: a combined anatomical and functional approach. Biol Psychiatry. 2010;68(1):61-9.Sun Y, Chen Y, Collinson SL, Bezerianos A, 17. Sim K. Reduced Hemispheric Asymmetry of Brain Anatomical Networks Is Linked to Schizophrenia: A Connectome Study. Cereb Cortex. 2017;27(1):602-15.Sun Y, Chen Y, Lee R, Bezerianos A, 18. Collinson SL, Sim K. Disruption of brain anatomical networks in schizophrenia: A longitudinal, diffusion tensor imaging based study. Schizophrenia research. 2016;171(1-3):149-57.Schmidt A, Crossley NA, Harrisberger 19. F, Smieskova R, Lenz C, Riecher-Rossler A, et al. Structural Network Disorganization in Subjects at Clinical High Risk for Psychosis. Schizophr Bull. 2016.Zhao X, Tian L, Yan J, Yue W, Yan H, Zhang 20. D. Abnormal Rich-Club Organization Associated with Compromised Cognitive Function in Patients with Schizophrenia and Their Unaffected Parents. Neurosci Bull. 2017;33(4):445-54.
References
Chapter 3
90
Choi SH, Kyeong S, Cho KIK, Yun JY, 21. Lee TY, Park HY, et al. Brain network characteristics separating individuals at clinical high risk for psychosis into normality or psychosis. Schizophrenia research. 2017;190:107-14.Drakesmith M, Caeyenberghs K, Dutt A, 22. Zammit S, Evans CJ, Reichenberg A, et al. Schizophrenia-like topological changes in the structural connectome of individuals with subclinical psychotic experiences. Hum Brain Mapp. 2015;36(7):2629-43.Michielse S, Gronenschild E, Domen 23. P, van Os J, Marcelis M, for Genetic R, et al. The details of structural disconnectivity in psychotic disorder: A family-based study of non-FA diffusion weighted imaging measures. Brain Res. 2017;1671:121-30.Kay SR, Fiszbein A, Opler LA. The 24. positive and negative syndrome scale (PANSS) for schizophrenia. Schizophr Bull. 1987;13(2):261-76.van der Gaag M, Cuijpers A, Hoffman 25. T, Remijsen M, Hijman R, de Haan L, et al. The fi ve-factor model of the Positive and Negative Syndrome Scale - I: Confi rmatory factor analysis fails to confi rm 25 published fi ve-factor solutions. Schizophrenia research. 2006;85(1-3):273-9.Vollema MG, Ormel J. The reliability 26. of the Structured Interview for Schizotypy-Revised. Schizophrenia Bull. 2000;26(3):619-29.Annett M. A classifi cation of hand 27. preference by association analysis. Br J Psychol. 1970;61(3):303-21.Andreasen NC, Pressler M, Nopoulos 28. P, Miller D, Ho BC. Antipsychotic Dose Equivalents and Dose-Years: A Standardized Method for Comparing Exposure to Different Drugs. Biol Psychiatry. 2010;67(3):255-62.Robins LN, Wing J, Wittchen HU, 29. Helzer JE, Babor TF, Burke J, et al. The Composite International Diagnostic Interview - an Epidemiologic Instrument Suitable for Use in Conjunction with Different Diagnostic Systems and in Different Cultures. Arch Gen Psychiat. 1988;45(12):1069-77.Leemans A, Jeurissen B, Sijbers J, Jones 30. DK, editors. ExploreDTI: a graphical toolbox for processing, analyzing, and visualizing diffusion MR data. 17th Annual Meeting of Intl Soc Mag Reson Med;
2009; Hawaii, USA.Basser PJ, Pajevic S, Pierpaoli C, Duda J, 31. Aldroubi A. In vivo fi ber tractography using DT-MRI data. Magn Reson Med. 2000;44(4):625-32.Tzourio-Mazoyer N, Landeau B, 32. Papathanassiou D, Crivello F, Etard O, Delcroix N, et al. Automated anatomical labeling of activations in SPM using a macroscopic anatomical parcellation of the MNI MRI single-subject brain. Neuroimage. 2002;15(1):273-89.Rubinov M, Sporns O. Complex network 33. measures of brain connectivity: uses and interpretations. Neuroimage. 2010;52(3):1059-69.Team RC. R: A Language and 34. Environment for Statistical Computing. 3.2.3 ed. Vienna, Austria: R Foundation for Statistical Computing; 2015.Laird NM, Ware JH. Random-effects 35. models for longitudinal data. Biometrics. 1982;38(4):963-74.Andreasen NC. Standardized remission 36. criteria in schizophrenia. Acta Psychiatr Scand. 2006;113(2):81.Rubinov M, Bullmore E. Schizophrenia 37. and abnormal brain network hubs. Dialogues Clin Neurosci. 2013;15(3):339-49.Wheeler AL, Voineskos AN. A review of 38. structural neuroimaging in schizophrenia: from connectivity to connectomics. Front Hum Neurosci. 2014;8:653.Kim D-J, Skosnik PD, Cheng H, Pruce 39. BJ, Brumbaugh MS, Vollmer JM, et al. Structural network topology revealed by white matter tractography in cannabis users: a graph theoretical analysis. Brain Connect. 2011;1(6):473-83.Peeters SC, Gronenschild EH, van 40. Amelsvoort T, van Os J, Marcelis M, Genetic R, et al. Reduced specialized processing in psychotic disorder: a graph theoretical analysis of cerebral functional connectivity. Brain Behav. 2016;6(9):e00508.Ellison-Wright I, Bullmore E. Meta-41. analysis of diffusion tensor imaging studies in schizophrenia. Schizophrenia research. 2009;108(1-3):3-10.van den Heuvel MP, Sporns O. Rich-club 42. organization of the human connectome. The Journal of neuroscience : the offi cial journal of the Society for Neuroscience. 2011;31(44):15775-86.Zhu D, Zhang T, Jiang X, Hu X, Chen H, 43.
3
91
MICROSTRUCTURAL NETWORK CONNECTIVITY
Yang N, et al. Fusing DTI and fMRI data: a survey of methods and applications. Neuroimage. 2014;102 Pt 1:184-91.van den Heuvel MP, Mandl RCW, Stam 44. CJ, Kahn RS, Pol HEH. Aberrant Frontal and Temporal Complex Network Structure in Schizophrenia: A Graph Theoretical Analysis. J Neurosci. 2010;30(47):15915-26.Yung AR, Nelson B, Baker K, Buckby JA, 45. Baksheev G, Cosgrave EM. Psychotic-like experiences in a community sample of adolescents: implications for the continuum model of psychosis and prediction of schizophrenia. Aust N Z J Psychiatry. 2009;43(2):118-28.Griffa A, Baumann PS, Thiran JP, Hagmann 46. P. Structural connectomics in brain diseases. NeuroImage. 2013;80:515-26.Zalesky A, Fornito A, Seal ML, Cocchi 47. L, Westin CF, Bullmore ET, et al. Disrupted axonal fi ber connectivity in schizophrenia. Biol Psychiatry. 2011;69(1):80-9.

Chapter 3
92
Supplementary materials
Additional methodological informationContribution of familiesFifty-six families participated: 35 families with one patient and one healthy sibling, three families with one patient and three siblings. One family with two patients, six families with two healthy siblings, and one family with three healthy siblings. In the control group, there were nine families with two siblings. Furthermore, 44 families contributed a single patient, 34 families contributed a single sibling, and 62 families, contributed a single control.
MRI data acquisitionMRI scans were obtained at Maastricht University, the Netherlands, using an Allegra syngo MR A30 (Siemens, Erlangen, Germany) operating at 3.0 Tesla. For the anatomical scan these parameters were used: Modifi ed Driven Equilibrium Fourier Transform (MDEFT) sequence; 176 slices, 1 mm isotropic voxel size, echo time 2.4 msec, repetition time 7.92 msec, inversion time 910 msec, fl ip angle 15°, total acquisition time 12 min 51 sec; Magnetization Prepared Rapid Acquisition Gradient-Echo (MPRAGE; Alzheimer’s Disease Neuroimaging Initiative) sequence 192 slices, 1 mm isotropic voxel size, echo time 2.6 msec, repetition time 2250 msec, inversion time 900 msec, fl ip angle 9°, total acquisition time 7 min 23 sec. The matrix size was 256 x 256 and fi eld of view was 256 x 256 mm2. The number of excitations was one. Because of a scanner update during data collection, two different scans were used. The DTI data were acquired with an echo-planar-imaging sequence (fi eld of view 230 x 230 mm2, TR 10800 ms, TE 84 ms, 1.8 mm isotropic voxel size, b-value 1000 s/mm², noise level 40, 85 slices, no overlap). Due to the scanner update, two DTI sequences were used: one with 76 directions (of which 4 T2-weighted (B0) and 72 diffusion-weighted (B)), and one with 81 directions (8xB0 and 73xB). The amount of scans with 76 directions was equalized between groups (78% in controls, 75% in siblings and 69% in patients (χ2 =1.52, P= 0.468), avoiding any systematic bias. Total acquisition time of the DTI sequence was 15 minutes.
Data processingRaw DICOM images were converted to NIfTI standard using the tool “dcm2nii” from the MRIcron software package (168) and cropped to remove sagittal slices containing background noise. The cropping procedure reduces data and processing time.

3
93
MICROSTRUCTURAL NETWORK CONNECTIVITY
The next step in processing the DWI data was the conversion from NIfTI standard to .mat standard using ExploreDTI (169) in MatLab (The MathWorks, Inc., Natick, Massachusetts, United States). Participant movement and eddy-current induced geometrical distortions were corrected by realigning the DW images to the B0 images incorporating B-matrix rotation (223) and coregistered to the individual’s T1 data to correct for echo-planar imaging (EPI) distortion (170, 171). The diffusion tensor metrics were calculated using the Robust Estimation of Tensors by Outlier Rejection (RESTORE) method (172). Fractional Anisotropy (FA) maps were calculated with a threshold of < 0.25.
Supplement to table 1There were missing data in table 1. Data not available: 8 missings for cannabis use (2 controls; 4 siblings; 2 patients); 4 missings for hard drug use (2 controls and 2 patients); 20 missings for AP exposure; 1 patient missing all PANSS scores, remission, age of onset and duration of illness; 4 controls missing for all PANSS scores; 10 siblings missing for all PANSS scores plus 2 missing for negative and disorganization; 2 patients missings for PANSS disorganization; 1 missing for SIS-r negative scale (1 control); 33 missings for alcohol use (11 controls, 14 siblings and 8 patients).
ReferencesRorden C, Brett M. Stereotaxic display of brain lesions. Behavioural 1. neurology. 2000;12(4):191-200.Leemans A, Jeurissen B, Sijbers J, Jones DK, editors. ExploreDTI: a 2. graphical toolbox for processing, analyzing, and visualizing diffusion MR data. 17th Annual Meeting of Intl Soc Mag Reson Med; 2009; Hawaii, USA.Leemans A, Jones DK. The B-Matrix Must Be Rotated When Correcting 3. for Subject Motion in DTI Data. Magn Reson Med. 2009;61(6):1336-49.Irfanoglu MO, Walker L, Sarlls J, Marenco S, Pierpaoli C. Effects of 4. image distortions originating from susceptibility variations and concomitant fi elds on diffusion MRI tractography results. Neuroimage. 2012;61(1):275-88.Klein S, Staring M, Murphy K, Viergever MA, Pluim JP. elastix: a toolbox 5. for intensity-based medical image registration. IEEE Trans Med Imaging. 2010;29(1):196-205.Chang LC, Jones DK, Pierpaoli C. RESTORE: robust estimation of 6. tensors by outlier rejection. Magn Reson Med. 2005;53(5):1088-95.


Part 2 CEREBRAL PATHWAYS IN
INDIVIDUALS WITH SUBCLINICAL PSYCHOTIC EXPERIENCES
Chapters are based on the SmartScan project


CH
APT
ERFourREWARD ANTICIPATION IN
INDIVIDUALS WITH SUBCLINICAL PSYCHOTIC EXPERIENCES:A FUNCTIONAL MRI APPROACH
Stijn Michielse, Iris Lange, Jindra Bakker, Liesbet Goossens, Simone Verhagen, Silvia Papalini, Marieke Wichers, Ritsaert Lieverse, Koen Schruers, Therese van Amelsvoort, Jim van Os, Graham K Murray, Machteld Marcelis
Submitted for publication

Chapter 4
98
AbstractBackground: Previous research in patients with psychotic disorder has shown widespread abnormalities in brain activation during reward anticipation. Research at the level of subclinical psychotic experiences in individuals unexposed to antipsychotic medication is limited with inconclusive results. Therefore, brain activation during reward anticipation was examined in a larger sample of individuals with subclinical psychotic experiences (PE).Methods: A sample of emerging adults aged 16-26 years (n=47) with PE and healthy controls (HC) (n=40) underwent fMRI scanning. The Monetary Incentive Delay task was conducted with cues related to win, loss or neutral conditions. fMRI nonparametric tests were used to examine the reward versus neutral cue contrast.
Results: A signifi cant main effect of the large win (€3.00) > neutral contrast was found in both groups showing activation in many brain areas, including classic reward regions. Whole brain analysis on the group comparison regarding the large win > neutral contrast showed signifi cantly decreased activation in the right insula, putamen and supramarginal gyrus in the PE-group compared to controls. There was no group difference in the hypothesized reward-related region.
Conclusions: Decreased activation in the right insula, putamen and supramarginal gyrus during reward anticipation in individuals with PE may be consistent with altered processing of sensory information, related to decreased emotional valuing and motivational tendencies and/or altered motor-cognitive processes. The absence of group differences in ventral striatal activation suggests that activation here is intact in the earliest stages of psychosis and may exhibit progressive deterioration in as the disease state develops.

4
99
FMRI REWARD ANTICIPATION
IntroductionDevelopment of the adolescent brain towards adulthood continues until the age of 25 years and a broad range of developmental and environmental factors impact during this time frame. The same developmental phase is also associated with a high risk of developing a mental disorder, 75% of psychiatric morbidity presenting with an onset before the age of 24 years (1). The emergence of a fi rst psychotic episode is often preceded by a phase of subclinical psychotic experiences comprising mild positive (e.g., hallucinations and delusions) or negative symptoms (e.g., affective fl attening, anhedonia and motivational impairment) with accompanying distress. The prevalence of these broadly defi ned subclinical psychotic experiences is estimated at 7% in the general population (2), and they have been found to predict persistence and severity of later psychopathology including psychotic disorder (3-6). Motivation for or engagement in activities that involve getting rewards and gaining pleasure is generally lower in patients with psychotic disorder (7). The processing of reward can be parsed into (at least) two stages; the anticipation and the consumption of reward, and these are thought to have dissociable neural substrates (8). Reward anticipation is the expectation of reward, often associated with a learned, therefore expected, positive reinforcement of an action, which often stimulates behavior by engaging motivation. In order to investigate the brain circuitry underlying reward anticipation, functional MRI (fMRI) can be used for in vivo functional assessment of this psychological function. The neural correlates of reward anticipation can be assessed in vivo in an fMRI scanner using the Monetary Incentive Delay task (MIDt); in this task the participant can win money according to performance, which consists of a rapid button press in response cues signaling the magnitude of rewarding feedback available (9, 10). The most widely reported measure in this task is brain activation at the time of the cue signaling the potential for a large reward versus activation at the time of a cue associated with a neutral outcome; this contrast evokes robust activation in the ventral striatum (VST) and and widespread cortical regions (11).
A substantial body of fMRI literature has confi rmed striatal involvement in reward anticipation (12). In a large-scale synthesis of fMRI studies of healthy participants, the VST was presented as a key region in reward anticipation (13). To date, studies show some difference in fMRI activation during reward consumption between patients with psychotic disorder and controls (14, 15). Furthermore, several studies have reported alterations in reward anticipation in patients with psychotic disorder in comparison with healthy

Chapter 4
100
controls using the MIDt (16, 17). In drug-naïve fi rst episode patients with schizophrenia, decreased activation was observed in the VST during reward anticipation, compared to controls (18, 19). Another study in unmedicated patients with schizophrenia showed reduced VST activation during reward anticipation compared to healthy controls, with decreased activation in the left VST being inversely correlated with severity of negative symptoms (20, 21). Furthermore, a neuro-functional meta-analysis examining specifi cally the VST, combined 23 studies in patients with schizophrenia spectrum disorders compared to controls concluded that VST was hypoactive during reward anticipation (22).
There is less literature on individuals with subclinical psychotic experiences and available studies generally have modest samples sizes, with about 20-30 participants per group. Alterations in VST activation have been described during reward anticipation in some studies (21, 23), but another found no differences in VST activation in people with schizotypal personality trait symptoms (n=26) compared to controls (24). In contrast, decreased VST activation with increasing levels of psychotic experiences based on the Community Assessment of Psychic Experiences (CAPE) in a fairly limited healthy sample (n=11) has been reported (25). A study of siblings of psychotic patients, investigating higher than average risk for psychotic disorder, in a comparison with controls, also showed reduced activation in the VST, insula, and supplementary motor area during reward anticipation (26). Another study in fi rst-degree relatives found no differences in striatal areas related to reward processing, but did fi nd deactivation in the insula, posterior cingulate cortex and medial frontal gyrus (27). The fi ndings in relatives suggested that part of the genetic susceptibility to psychosis may be expressed as altered reward anticipation. This is in agreement with a study on 22q11.2 deletion syndrome (a genetic model to study elevated risk for psychotic disorder in people who have a microdeletion on the long arm of chromosome 22), which reported reduced activation in the medial frontal regions during reward anticipation compared to controls (28). Furthermore, one study with a larger sample of participants from the general population using polygenetic risk profi le scores (PRS), found a positive association between psychosis PRS and VST activation during reward anticipation (29). This may indicate hyperactivation in the VST related to PRS and seems to oppose other smaller studies on genetic susceptibility to psychosis (although note that that study used a slightly unusual contrast, thus differs in methodology from most other studies on the MID) (30). Overall, these studies provide some suggestion that elevated
4
101
FMRI REWARD ANTICIPATION
genetic risk for psychotic disorder may be associated with alterations in reward anticipation; it remains unknown whether individuals at clinical risk of psychosis have reward anticipation defi cits.
As the literature on reward anticipation in individuals with subclinical expression of psychosis is sparse and inconsistent, the current study investigated reward anticipation in emerging adults (aged 16 to 25 years) at psychometric risk for psychotic disorder, compared to healthy controls, analyzing a larger sample size than previous studies. Based on what has been described in the literature, it was hypothesized that in a group of emerging adults with subclinical psychotic experiences (PE), reward anticipation related brain activation would be changed with respect to healthy controls. This was examined, fi rst, at the whole brain level and, second, more specifi cally, focussing on the VST as an priori defi ned region of interest to investigate in the context of reward anticipation. Explorative analyses were conducted to investigate the relationship between fMRI reward anticipation and mild psychopathology (CAPA positive and MADRS).
MethodsParticipantsThis cross-sectional study took place within the Smartscan project (Dutch Trial Register Number: NTR3808), comprising a sample of emerging adults aged 16-25 years with subclinical psychotic experiences (PE-group) as well as a comparison group without psychopathology, in the region of Southern Limburg in the Netherlands. Participants were recruited via advertisements, posters, or via referral by primary health care professionals. The inclusion criteria for the PE-group were based on a Community Assessment of Psychic Experiences (CAPE (31)) positive subscale frequency score of ≥10 and/or a CAPE distress score on the positive subscale of ≥2, in combination with a Global Assessment of Functioning (GAF (32)) of <70 (33). The Mini International Neuropsychiatric Interview (MINI) was used to identify addictive substance abuse and additional axis I diagnoses. Inclusion for the control group was based on a depression score derived from the Montgomery–Åsberg Depression Rating Scale (MADRS (34)) of <10, a CAPE positive subscale frequency score of <10 in combination with a distress score of <2. Level of education was indexed by the completed level of education ranging from 0 (no education completed) to 7 (completed master degree). Individuals with a history of psychiatric diagnosis or treatment were excluded from the control group.Exclusion criteria were current psychological or psychiatric treatment,

Chapter 4
102
signifi cant need for care, left-handedness, a history of neurological disorder (e.g. severe brain injury with unconsciousness, meningitis, migraine or epilepsy) or MRI contraindications (e.g. cardiac arrhythmia, diabetes, and claustrophobia). In addition, participants with implanted ferromagnetic materials were excluded from the study, as were women with (suspected) pregnancy. The medical ethics committee of Maastricht University Medical Center approved this study according to the declaration of Helsinki. All participants gave written informed consent in person and additionally via a proxy (a parent) when younger than 18 years of age (n=4).
Monetary Incentive Delay taskAn adapted version of the Monetary Incentive Delay task (MIDt) by Knutson et al (9) was used to investigate brain activity during reward anticipation. In the MIDt, participants start with €5 and can win or avoid losing money, depending on their response to the target (fi gure 1). To minimize learning effects during the scan, the task was explained and practiced twice before the start: once outside the MRI scanner and once inside, just before the start of scanning. The task included two runs (each 6 min, 12 s) of 72 randomly ordered trials. Each trial started with a fi xation cross (duration 200ms), followed by a cue (266ms) and a variable delay of 2000-2500ms (fi gure 1). Visual cues were presented indicating reward (circle), loss (square) or neutral (triangle) conditions. The reward and loss amount increased with the number of lines from €0.10 to €0.60 and €3.00, and the money gain was paid as an incentive after completion. After the cue and fi rst delay phase, the participants had to respond to the target via a button press with the right index fi nger in order to get the reward or avoid losing (e.g. at level 5, target durations were 266ms, 216ms and 166ms; slow, medium and fast), followed by the second delay phase (1025ms) and a feedback phase (1468ms). The feedback phase showed win or loss and the current amount of money. Task diffi culty was set by the researcher after the practice trial and adjusted after the fi rst run (if the success rate was >66%). Diffi culty settings were based on RTs and varied between slow, medium and fast target duration. The task was shown on a screen (resolution 1920x1200 pixels) via E-prime v2.0.10.242 software (Psychology Software Tools, Inc. Pittsburgh, PA) (35) in the fMRI scanner using a Windows computer. Responses were recorded via a fi ber optic button box (Current Designs, Inc., Philadelphia, PA). Event onsets were recorded and synchronized with the fMRI start. At the fi rst delay start (delay 1 in fi gure 1), the reward anticipation was determined and related to specifi c cue shapes.

4
103
FMRI REWARD ANTICIPATION
Figu
re 1
. MID
tas
k (9
) w
ith d
iffer
ent
cues
. Tim
ings
are
pro
vide
d in
mill
isec
onds
(m
s).
Chapter 4
104
AcquisitionMRI scans were acquired at Scannexus, Maastricht, The Netherlands, on a 3T Siemens Magnetom Prisma system (Siemens, Erlangen, Germany) equipped with a 64-channel head/neck coil. Whole brain T1-weighted Magnetization Prepared Rapid Acquisition Gradient Echo (MPRAGE) images with a voxel size of 1.0x1.0x1.0mm were acquired (repetition time (TR)=2250msec, echo time (TE)=2.21msec, fl ip angle=9°, fi eld of view (FOV)=256x256, 192 sagittal orientated slices, GRAPPA=2, no fat suppression, acquisition time (TA)=5.05 min). Whole brain functional scans were acquired using a T2*-weighted echo-planar imaging (EPI) sequence (TR=2450msec, TE=28msec, fl ip angle=75°, interleaved ascending order, FOV=72x72, 47 slices in axial orientation, A>P phase encoding, GRAPPA=3, TA=6.33min) with a voxel size of 3x3x3mm. For each run 155 volumes were acquired.
fMRI processingAfter conversion of raw DICOM images to NIfTI format (36), fi rst level analysis of the FMRI data processing was carried out using FEAT (FMRI Expert Analysis Tool) Version 6.00, in FSL (FMRIB’s Software Library, www.fmrib.ox.ac.uk/fsl). Registration to standard space images was carried out using FLIRT (FMRIB’s Linear Image Registration Tool) (37, 38) and registration to high resolution anatomical data was done using BBR (Boundary-Based Registration) (39).
The following pre-processing steps were applied: motion correction with the middle volume as the reference using MCFLIRT (37); slice-timing correction using Fourier-space time-series phase-shifting; fMRI non-brain removal using BET (40); on the anatomical scans, after removing 50 axial slices of the neck and fi ve sagittal slices on each side of the head, skull stripping was done using a hybrid watershed/surface deformation procedure incorporated in FreeSurfer v5.3 recon-all (www.freesurfer.net) (41); spatial smoothing using a Gaussian kernel of FWHM 6.0mm; grand-mean intensity normalisation of the entire 4D dataset by a single multiplicative factor; highpass temporal fi ltering (Gaussian-weighted least-squares straight line fi tting, with cutoff = 100s). Normalization using FNIRT was done into the Montreal Neurological Institute 152 stereotaxic space (42). The general linear model (GLM) was created with 16 regressors for the fi rst level: circles_small_hit, circles_small_miss, circles_medium_hit, circles_medium_miss, circles_large_hit, circles_large_miss, triangles_hit, triangles_miss, squares_small_hit, squares_small_miss, squares_medium_hit,

4
105
FMRI REWARD ANTICIPATION
squares_medium_miss, squares_large_hit, squares_large_miss, button_press and non_response. Note: hit and miss conditions were split up in the model and hit conditions were added to the model to link a positive outcome to the anticipation of the reward. The model incorporated only the early delay phase; the anticipation just after cue representation until target onset.
Time-series statistical analysis was carried out using FMRIB’s Improved Linear Model (FILM) with local autocorrelation correction (43). A total of four Contrasts Of Parameter Estimates (COPEs) were created for the hit conditions: small reward (circles_small>triangles), medium reward (circles_medium>triangles), high reward (circles_large>triangles) and total reward (circles>triangles). The standard (three rotations and three translations) and extended (the derivative of the motion parameters and the squares of the parameters and derivatives) motion parameters and button press were added as confounders. Motion above the threshold of 3mm in any of the directions lead to exclusion of the dataset. A manual data quality check was conducted for each dataset to check for any errors in the registration. Next, for each individual, the two runs were averaged to obtain one COPE by using fi xed effects GLM in FSL FEAT.
Whole brain fMRI analysisWhole brain group analysis was conducted using the mixed effects model FLAME (FMRIB’s Local Analysis of Mixed Effects) stage 1+2 in FSL with a total of four contrasts: main effect of PE group, main effect of HC group, PE>HC, and HC>PE (44-46). Z-statistic images were cluster thresholded at Z>3.1 and a (corrected) cluster signifi cance threshold of p=0.05 (47). Non-parametric permutation for inference testing was done using FSL’s randomise tool (48). A total of 5000 permutations were done for the same four contrasts to compare results. Statistical analyses were done for the high reward condition, i.e., comparing the COPE for circles_large > triangles cue shapes, providing parameter estimates as a proxy for task related brain activation. In line with previous studies this COPE has been selected and the non-response is expected to be lowest for the high reward. In two separate models, a voxelwise regression against CAPE positive symptom frequency and MADRS total score was conducted. The models included age, sex and educational level as the a priori hypothesized confounding factors.

Chapter 4
106
Region of interest (ROI) analysisIn addition to the whole brain analysis, a specifi c ROI analysis was conducted in the ventral striatum (STR), based on the ROI defi ned by Mawlawi, Martinez and colleagues (49), (50) (see Figure 1 in the supplementary materials). With the application of FSL’s featquery the mean parameter estimate per participant was extracted and exported for use in statistical analysis in STATA (release 13) (51). In STATA, linear regression models were applied to examine group differences with age, sex and educational level as the a priori hypothesized confounding factors. Groups were coded ‘0’ for HC-group and ‘1’ for PE-group.Furthermore, to investigate the association between mild psychopathology and reward anticipation, analyses on symptom scales has been performed. The associations between CAPE positive frequency, distress and MADRS total score were examined with mean parameter estimates for the VST in separate regression models including the a priori hypothesized confounders.
Behavioral analysesThe task was split usp in two runs. Both runs were analyzed separately and combined. In order to study the validity of the reward-anticipation test, learning effects and group effects in the behavioral data were examined (10). Mean reaction time (in milliseconds) and number of non-responses, indicating task compliance and engagement, were recorded per cue shape and differences between groups were examined. Comparability between groups with regard to the diffi culty level per individual and incentive outcome (gain in euros) was also examined. For these purposes, t-tests and χ2 -tests were done in STATA release 13 (51).

4
107
FMRI REWARD ANTICIPATION
ResultsEighty-seven participants completed the entire interview assessment, had quality approved fMRI scans and were assigned to the PE (n=47) or HC (n=40) group. Mean age and sex did not differ between groups (see table 1). On average, participants were 22 years old, with slightly more females in the PE-group (n=40) compared to the HC-group (n=33). Educational level was lower in the PE-group compared to the HC-group (p=0.02). CAPE and MADRS scores were signifi cantly higher in the PE-group while GAF scores were signifi cantly lower.
Table 1: Demographic information per group.
PE-group (n=47) HC-group (n=40)Age (mean (SD)) 21.5 (2.50) 21.9 (1.73)Sex (%female) 40 (85%) 33 (82%)Education level (mean (SD)) 5.85 (0.62) 6.17 (0.64)CAPE positive score (mean (SD)) 4.45 (3.07) 0.90 (1.41)CAPE positive distress score (mean (SD)) 4.47 (3.14) 0.17 (0.38)MADRS total score (mean (SD)) 13.53 (7.18) 1.42 (1.85)GAF global functioning (mean (SD)) 63.74 (10.90) 86.65 (6.50)
PE; subclinical psychotic experiences and HC; healthy controls. Means and standard deviations are provided, sex is in % female. CAPE; Community Assessment of Psychic Experiences, MADRS; Montgomery–Åsberg Depression Rating Scale, GAF; Global Assessment of Functioning.
MIDt behavioral analysisTable 2 shows the descriptive results of the MIDt; the mean RT with standard deviation per cue and the total money gain, per run and per group. For the RT towards the circle (win), square (loss) and triangle (neutral) cue, no differences were found between the PE-group and HC-group (RT reward p = 0.52, loss p = 0.70 and neutral p = 0.18). RTs for neutral cues were longer in both groups compared to the reward and loss cues. The difference on the money gain between the HC (15.17±4.89 euro) and PE-group (13.17 ±5.66 euro) did not reach signifi cance (p=0.08). The mean diffi culty level (ranging from 1 – 5) was 4.19 in the PE-group and 4.05 in the HC-group in the fi rst run. For the second run, the mean was 3.74 in the PE-group and 3.92 in the HC-group. Diffi culty levels were not signifi cantly different between groups (run 1 p=0.4614; run 2 p=0.45). The RTs to the cue shapes were equal for both groups (table 2). Non-responses were equal in both groups for the reward (p=0.59), loss (p=0.06) and neutral (p=0.88) shapes.
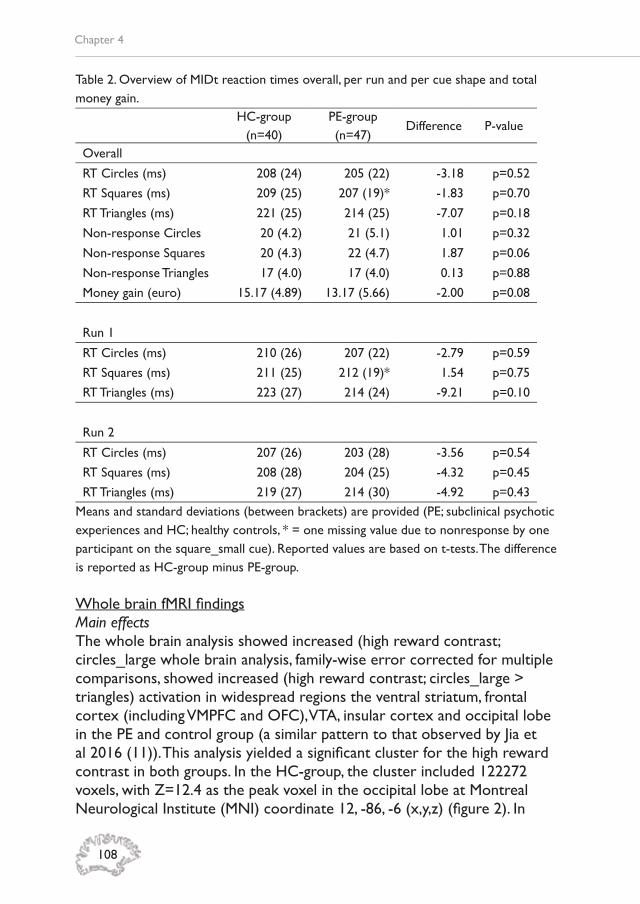
Chapter 4
108
Table 2. Overview of MIDt reaction times overall, per run and per cue shape and total money gain.
HC-group (n=40)
PE-group (n=47)
Difference P-value
Overall
RT Circles (ms) 208 (24) 205 (22) -3.18 p=0.52
RT Squares (ms) 209 (25) 207 (19)* -1.83 p=0.70
RT Triangles (ms) 221 (25) 214 (25) -7.07 p=0.18
Non-response Circles 20 (4.2) 21 (5.1) 1.01 p=0.32
Non-response Squares 20 (4.3) 22 (4.7) 1.87 p=0.06
Non-response Triangles 17 (4.0) 17 (4.0) 0.13 p=0.88
Money gain (euro) 15.17 (4.89) 13.17 (5.66) -2.00 p=0.08
Run 1
RT Circles (ms) 210 (26) 207 (22) -2.79 p=0.59
RT Squares (ms) 211 (25) 212 (19)* 1.54 p=0.75
RT Triangles (ms) 223 (27) 214 (24) -9.21 p=0.10
Run 2
RT Circles (ms) 207 (26) 203 (28) -3.56 p=0.54
RT Squares (ms) 208 (28) 204 (25) -4.32 p=0.45
RT Triangles (ms) 219 (27) 214 (30) -4.92 p=0.43Means and standard deviations (between brackets) are provided (PE; subclinical psychotic experiences and HC; healthy controls, * = one missing value due to nonresponse by one participant on the square_small cue). Reported values are based on t-tests. The difference is reported as HC-group minus PE-group.
Whole brain fMRI fi ndingsMain effectsThe whole brain analysis showed increased (high reward contrast; circles_large whole brain analysis, family-wise error corrected for multiple comparisons, showed increased (high reward contrast; circles_large > triangles) activation in widespread regions the ventral striatum, frontal cortex (including VMPFC and OFC), VTA, insular cortex and occipital lobe in the PE and control group (a similar pattern to that observed by Jia et al 2016 (11)). This analysis yielded a signifi cant cluster for the high reward contrast in both groups. In the HC-group, the cluster included 122272 voxels, with Z=12.4 as the peak voxel in the occipital lobe at Montreal Neurological Institute (MNI) coordinate 12, -86, -6 (x,y,z) (fi gure 2). In

4
109
FMRI REWARD ANTICIPATION
the PE-group the cluster included 113565 voxels, with Z=11.4 as its peak located in the insular cortex at MNI 32, 22, -4 (fi gure 3). A table with local maxima per group is provided in the supplementary material (Table 1 in the Supplementary material).

Chapter 4
110
Figu
re 2
. Mai
n ef
fect
s in
hea
lthy
cont
rols
(H
C)
grou
p on
the
cir
cles
_lar
ge >
tri
angl
es c
ontr
ast
at
MN
I coo
rdin
ate
0, 8
, -4
(x,y,
z).

4
111
FMRI REWARD ANTICIPATION
Figu
re 3
. Mai
n ef
fect
s in
the
sub
clin
ical
psy
chot
ic e
xper
ienc
es (
PE)
grou
p on
the
cir
cles
_lar
ge >
tri
angl
es c
ontr
ast
at
MN
I coo
rdin
ate
0, 8
, -4
(x,y,
z).

Chapter 4
112
Group differencesTwo signifi cant clusters were found when examining the PE-group < HC-group on the high reward contrast (fi gure 4). These clusters were located in the right supramarginal gyrus (551 voxels; Z=3.87; MNI 42, -42, 38; BA40, fi gure 5) and the right insula and putamen (487 voxels; Z=4.02; MNI 32, 22, -4; BA13, fi gure 6). The other contrast (PE-group > HC-group) did not show signifi cant effects above the threshold.
The fi ndings were confi rmed by non-parametric testing showing overlap in the group main effect for the high reward and the two largest clusters in the right supramarginal gyrus (382 voxels; Z=3.35 MNI 38, -44, 38) and the right insula (273 voxels; Z=3.09, MNI 22, 36, -12).
Symptom regressionWhole brain voxelwise regression analyses showed no signifi cant voxels below the p<0.05 threshold in the CAPE positive frequency symptom score and MADRS total score models.

4
113
FMRI REWARD ANTICIPATION
Figu
re 4
. Sig
nifi c
ant
grou
p di
ffere
nce
whe
n ex
amin
ing
the
subc
linic
al p
sych
otic
exp
erie
nces
(PE
) gr
oup
< h
ealth
y co
ntro
l (H
C)
grou
p on
the
hi
gh r
ewar
d co
ntra
st. O
ne c
lust
er is
loca
ted
in t
he r
ight
insu
la (
Z=
4.02
, MN
I 32,
22,
-4)
and
ext
ends
to
the
puta
men
and
the
oth
er in
the
ri
ght
supr
amar
gina
l gyr
us (
Z=
3.87
, MN
I 42,
-42
, 38)
. T
his
fi gur
e is
als
o av
aila
ble
as d
ownl
oad
on F
igSh
are;
htt
ps://
fi gsh
are.
com
/s/d
f509
5204
3f1e
cf8a
d0e

Chapter 4
114
Figure 5. Boxplot of the mean parameter estimate per group in the right supramarginal gyrus (whole brain analyses). HC-group; Healthy Control group and PE-group; Subclinical Psychotic Experiences group.
Figure 6. Boxplot of the mean parameter estimate per group in the right insula (whole brain analyses). HC-group; Healthy Control group and PE-group; Subclinical Psychotic Experiences group.

4
115
FMRI REWARD ANTICIPATION
ROI analysesThe linear regression analysis on the STR did not indicate any signifi cant difference between the PE-group and the HC-group on the big reward contrast (see table 3).
Table 3: Region of interest (ROI) differences for the big reward (circles_large > triangles) contrast.
ROI PE-group HC-group B P-value
Striatal cortex 55.37 (±46.27) 64.80 (±44.23) -7.77 0.45PE: subclinical psychotic experiences, HC: healthy control. Mean and standard deviation for parameter estimate for STR is provided. The linear regression model included age, sex and educational level as confounding factors.
ROI and symptom analysisBased on the regression analysis there was no signifi cant association between the parameter estimate in the STR ROI and CAPE positive frequency score (B=1.99, p=0.23), CAPE positive distress score (B=1.36, p=0.39) and MADRS total score (B=-0.16; p=0.80).
DiscussionThe current study presents fi ndings in fMRI alterations during reward anticipation in a sample of individuals with subclinical psychotic experiences (PE) compared to healthy controls during reward anticipation. The behavioral task outcomes (money gain, reaction times and non-responses) were similar in both groups while some differences related to reward anticipation were found at the brain level. The right supramarginal gyrus and right insula/putamen showed decreased activation during reward anticipation in the PE-group compared to the controls. No group differences were found in the a priori hypothesized specifi ed region of interest of ventral striatum. There were no signifi cant associations between the region and mild symptoms of psychopathology.
Whole brain reward anticipation Both the PE-group and healthy controls showed increased (high reward contrast; circles_large > triangles) activation during reward anticipation in regions including the occipital lobe, insular cortex, ventral striatum, frontal cortex (including VMPFC and OFC) and VTA, consistent with previous studies (11). This fi nding confi rms brain reward-related activation during reward anticipation while performing the MID task. In the group comparison on reward anticipation, two signifi cant clusters were found.

Chapter 4
116
Particularly, the PE-group showed decreased activation in the right supramarginal gyrus and the right anterior insula and putamen during reward anticipation. The anterior insula has been associated with salience processing over a specifi c functional network (52), and prior studies using the MID and other reward tasks have indicated its involvement in reward processing (53). Interestingly, previous work using the MIDt in healthy controls showed increased activation in the right anterior insula when rewarding stimuli were presented (10, 20, 54). The current study in individuals with PE showed decreased activation in this area, in line with a MIDt study in patients with schizophrenia with about the same sample size, but somewhat older in age (18, 55). In research focusing on reward prediction in patients with psychosis, abnormal responses in the insula have been reported (56). Decreased activation in the insula has also been found in siblings of patients with schizophrenia (26, 27) while MIDt research in so-called ‘ultra high-risk’ (for psychosis) groups of the same age did not fi nd alterations in this region (57). However, this study was conducted in a sample of 27 participants meeting ultra-high risk criteria and may have been underpowered. The insula is a key cortical region receiving sensory information from all modalities, and in turn it projects heavily to the ventral striatum (58). Furthermore, decreased activation in the right anterior insula in the PE-group may be related to potential motivational defi cits in this group. The insula is linked to stimulus evaluation and for allocating the appropriate arousal for task performance and motor preparation, as highlighted in a sample of 11 participants (59). Motor preparation and selective attention features play a role in the MIDt, since participants prepare to engage a button press and have to pay attention to the task. Furthermore, the insula is involved in emotional arousal, neural mapping of body states and subjective feeling states (60). This interoceptive process may be dampened in individuals with mild psychotic experiences and therefore lead to decreased activation during the anticipation of reward. Valueing emotions in the anticipation of reward may be related to the anterior insula (61). Another explanation for the decreased insular activation that was present in the current study may be a developmental shortfall in individuals with psychotic experiences, given that during adolescence, brain activation in the insula related to reward anticipation tends to increase with age (62). Decrease in activation during reward anticipation in the PE-group was also partly located in the right putamen (dorsal striatum). Decreased reward-related activation has been found in the right putamen in patients with major depressive disorder (63) and psychotic disorder (64). It has been suggested that a reduced putamen

4
117
FMRI REWARD ANTICIPATION
response is associated with lowered motivational tendencies in young adolescents (65), but its precise role requires further research.
The fi nding of decreased activation in the right supramarginal gyrus (inferior parietal lobe) in the PE-group with respect to the healthy controls, has previously been reported in unmedicated fi rst episode patients with schizophrenia (18). In ultra high-risk groups this fi nding has not been described (57). Furthermore, this region seems to be engaged in a functional network related to reward anticipation in youngsters at 14 years of age (11). The right supramarginal gyrus (inferior parietal lobe) is involved in sensory processing, but also supports mathematical operations as it plays an important role in number comparisons (66). During the MIDt, individuals may process numerical information (i.e., calculate how much they won). The supramarginal gyrus may thus be involved in (but not directly related to VST) reward processing by means of numerical processing. Reward defi cits in the parietal lobe may be specifi c for psychotic disorder, as a prior study showed reward processing defi cits in this area in schizophrenia but intact activation in depression (67). An abnormal activation in the parietal region has previously been associated with reward-related activation during highly uncertain outcomes (68). This fi nding of reduced activation during reward anticipation in the PE-group requires further research and replication.
Region of interest analysisIn line with the whole-brain group analyses, no group difference was found in the VST region of interest. One explanation is that the region remain contained, while at the whole brain level alterations in other regions (right insula and supramarginal gyrus) are apparent. In turn, a ROI approach is focused on a priori selected region and thus less sensitive compared to whole brain analysis, since the method captures mean activation per region instead of a voxel-based approach (69). The right insula and supramarginal gyrus were not a priori hypothesized areas for the ROI analysis. Previous literature showed absence of group differences between individuals with subclinical psychotic experiences and healthy controls in VST (and other areas outside the VST) activation during reward anticipation (23). Based on the results of the current study, it seems that VST is unaffected in emerging adults with PE and remains functionally engaged during reward anticipation. This contradicts fi ndings of decreased activation in the VST (25), but is in line with one study in people with schizotypical personality traits (24). However, the sample sizes of these studies were relatively small. Furthermore, there were no signifi cant associations between regions and

Chapter 4
118
CAPE positive (frequency and distress) symptom and MADRS scores. This may indicate that both subclinical psychotic experiences and depressive symptoms are unrelated to reward anticipation in the VST.
MIDt behavioral reward anticipationThe reaction times on the different reward shapes and performance outcome (money gain and non-response) on the MIDt were similar across both groups. The absence in behavioral differences between groups agrees with previous research in subclinical samples (24, 25) as well as fi ndings in siblings of patients with psychotic disorder (26, 27, 70). These behavioral results validate the fMRI application of the MIDt in this sample.
Methodological considerationsAlthough a careful design, setup and methodological approach were applied, some limitations should be taken into consideration. First, as the sample had mixed mild psychotic and depressive symptoms, effects on activation during reward anticipation may be confounded. Of the participants in the PE-group, 79% also had depressive symptoms (based on a MADRS score ≥10). Findings on reward processing in depression has indeed some similarity (such as decreased VST activation) with reward processing in psychotic disorder (71), but it has not been investigated in a mixed symptomatology sample like the current. Previous research has focused on isolated groups of people with either psychotic or depressive symptomatology, but these samples may be less representative than the current as PE are strongly associated with affective psychopathology (72) and genetic risk for psychosis is expressed in both the psychotic and affective domains (73). Second, the spatial resolution is limited to 3mm voxel size capturing many neurobiological processes in one voxel. The currently used fMRI scan technique operating at 3T only provides an estimate of the average activation (as measured via the parameter estimate) in the VST. Furthermore, fMRI acquisitions are infl uenced by noise factors such as system-related instabilities and physiological fl uctuations unrelated to the task. These can have an effect on the fairly low task-related signal measured via fMRI in general (74). With more advanced fMRI techniques at higher fi eld strength, increased spatial resolution can provide a more fi ne-grained examination of the reward system.
ConclusionThe current study showed that emerging adults with subclinical psychotic experiences have decreased activation in the right supramarginal gyrus,

4
119
FMRI REWARD ANTICIPATION
right insula and putamen during reward anticipation with respect to healthy controls. The decrease in activation may be explained as a defi cit in motor preparation and selective attention and/or altered motivational and emotional processing (insula), altered motivational tendencies (putamen) or altered numerical processing (in the supramaginal gyrus). At the behavioral level (reaction times, non-response and monetary gain) the groups displayed similar results. No group differences were found in a reward anticipation-related area such as VST, which was confi rmed by ROI-based analysis. This may be related to the relatively low psychometric risk levels and, as yet, non-detectable reward-system alterations. It is speculated that more regions besides the reward system are engaged during reward anticipation.
Chapter 4
120
ReferencesKessler RC, Berglund P, Demler O, Jin 1. R, Merikangas KR, Walters EE. Lifetime prevalence and age-of-onset distributions of DSM-IV disorders in the National Comorbidity Survey Replication. Arch Gen Psychiatry. 2005;62(6):593-602.Linscott RJ, van Os J. An updated 2. and conservative systematic review and meta-analysis of epidemiological evidence on psychotic experiences in children and adults: on the pathway from proneness to persistence to dimensional expression across mental disorders. Psychol Med. 2013;43(6):1133-49.Chan V. Schizophrenia and Psychosis: 3. Diagnosis, Current Research Trends, and Model Treatment Approaches with Implications for Transitional Age Youth. Child Adolesc Psychiatr Clin N Am. 2017;26(2):341-66.Kline E, Thompson E, Bussell K, Pitts 4. SC, Reeves G, Schiffman J. Psychosis-like experiences and distress among adolescents using mental health services. Schizophr Res. 2014;152(2-3):498-502.Yung AR, Phillips LJ, Yuen HP, Francey 5. SM, McFarlane CA, Hallgren M, et al. Psychosis prediction: 12-month follow up of a high-risk (“prodromal”) group. Schizophr Res. 2003;60(1):21-32.McGorry PD. “A stitch in time” ... the 6. scope for preventive strategies in early psychosis. Eur Arch Psychiatry Clin Neurosci. 1998;248(1):22-31.Strauss GP, Waltz JA, Gold JM. A review 7. of reward processing and motivational impairment in schizophrenia. Schizophr Bull. 2014;40 Suppl 2:S107-16.Berridge KC, Kringelbach ML. 8. Pleasure systems in the brain. Neuron. 2015;86(3):646-64.Knutson B, Fong GW, Adams CM, 9. Varner JL, Hommer D. Dissociation of reward anticipation and outcome with event-related fMRI. Neuroreport. 2001;12(17):3683-7.Knutson B, Westdorp A, Kaiser E, 10. Hommer D. FMRI visualization of brain activity during a monetary incentive delay task. Neuroimage. 2000;12(1):20-7.Jia T, Macare C, Desrivieres S, 11. Gonzalez DA, Tao C, Ji X, et al. Neural basis of reward anticipation and its genetic determinants. Proceedings of the National Academy of Sciences
of the United States of America. 2016;113(14):3879-84.Wang KS, Smith DV, Delgado MR. Using 12. fMRI to study reward processing in humans: past, present, and future. J Neurophysiol. 2016;115(3):1664-78.Yarkoni T, Poldrack RA, Nichols TE, 13. Van Essen DC, Wager TD. Large-scale automated synthesis of human functional neuroimaging data. Nat Methods. 2011;8(8):665-70.Simon JJ, Biller A, Walther S, Roesch-Ely 14. D, Stippich C, Weisbrod M, et al. Neural correlates of reward processing in schizophrenia--relationship to apathy and depression. Schizophr Res. 2010;118(1-3):154-61.Nielsen MO, Rostrup E, Wulff S, Bak N, 15. Lublin H, Kapur S, et al. Alterations of the brain reward system in antipsychotic naive schizophrenia patients. Biol Psychiatry. 2012;71(10):898-905.Howes OD, Kapur S. The dopamine 16. hypothesis of schizophrenia: version III--the fi nal common pathway. Schizophr Bull. 2009;35(3):549-62.Maia TV, Frank MJ. An Integrative 17. Perspective on the Role of Dopamine in Schizophrenia. Biol Psychiatry. 2017;81(1):52-66.Esslinger C, Englisch S, Inta D, Rausch 18. F, Schirmbeck F, Mier D, et al. Ventral striatal activation during attribution of stimulus saliency and reward anticipation is correlated in unmedicated fi rst episode schizophrenia patients. Schizophr Res. 2012;140(1-3):114-21.Horga G, Cassidy CM, Xu X, Moore 19. H, Slifstein M, Van Snellenberg JX, et al. Dopamine-Related Disruption of Functional Topography of Striatal Connections in Unmedicated Patients With Schizophrenia. JAMA Psychiatry. 2016;73(8):862-70.Juckel G, Schlagenhauf F, Koslowski M, 20. Wustenberg T, Villringer A, Knutson B, et al. Dysfunction of ventral striatal reward prediction in schizophrenia. Neuroimage. 2006;29(2):409-16.Wotruba D, Heekeren K, Michels L, 21. Buechler R, Simon JJ, Theodoridou A, et al. Symptom dimensions are associated with reward processing in unmedicated persons at risk for psychosis. Front Behav Neurosci. 2014;8:382.

4
121
FMRI REWARD ANTICIPATION
American Psychiatric Association. Task Force on DSM-IV. Diagnostic and statistical manual of mental disorders : DSM-IV-TR. 4th ed. Arlington, VA: American Psychiatric Association; 2000. xxxvii, 943 p. p.McGorry PD, Hickie IB, Yung AR, 32. Pantelis C, Jackson HJ. Clinical staging of psychiatric disorders: a heuristic framework for choosing earlier, safer and more effective interventions. Aust N Z J Psychiatry. 2006;40(8):616-22.Montgomery SA, Asberg M. A new 33. depression scale designed to be sensitive to change. Br J Psychiatry. 1979;134:382-9.Schneider W, Eschman A, Zuccolotto 34. A. E-Prime User’s Guide. Pittsburgh, PA: Psychology Software Tools Inc.; 2002.Rorden C, Brett M. Stereotaxic display 35. of brain lesions. Behavioural neurology. 2000;12(4):191-200.Jenkinson M, Bannister P, Brady M, 36. Smith S. Improved optimization for the robust and accurate linear registration and motion correction of brain images. Neuroimage. 2002;17(2):825-41.Jenkinson M, Smith S. A global 37. optimisation method for robust affi ne registration of brain images. Med Image Anal. 2001;5(2):143-56.Greve DN, Fischl B. Accurate and robust 38. brain image alignment using boundary-based registration. Neuroimage. 2009;48(1):63-72.Smith SM. Fast robust automated 39. brain extraction. Hum Brain Mapp. 2002;17(3):143-55.Segonne F, Dale AM, Busa E, Glessner 40. M, Salat D, Hahn HK, et al. A hybrid approach to the skull stripping problem in MRI. Neuroimage. 2004;22(3):1060-75.Woolrich MW, Ripley BD, Brady M, 41. Smith SM. Temporal autocorrelation in univariate linear modeling of FMRI data. Neuroimage. 2001;14(6):1370-86.Beckmann CF, Jenkinson M, Smith SM. 42. General multilevel linear modeling for group analysis in FMRI. Neuroimage. 2003;20(2):1052-63.Woolrich M. Robust group analysis 43. using outlier inference. Neuroimage. 2008;41(2):286-301.Woolrich MW, Behrens TE, Beckmann 44. CF, Jenkinson M, Smith SM. Multilevel linear modelling for FMRI group analysis using Bayesian inference. Neuroimage.
Radua J, Schmidt A, Borgwardt S, Heinz 22. A, Schlagenhauf F, McGuire P, et al. Ventral Striatal Activation During Reward Processing in Psychosis: A Neurofunctional Meta-Analysis. JAMA Psychiatry. 2015;72(12):1243-51.Juckel G, Friedel E, Koslowski M, 23. Witthaus H, Ozgurdal S, Gudlowski Y, et al. Ventral striatal activation during reward processing in subjects with ultra-high risk for schizophrenia. Neuropsychobiology. 2012;66(1):50-6.Kirschner M, Hager OM, Muff L, Bischof 24. M, Hartmann-Riemer MN, Kluge A, et al. Ventral Striatal Dysfunction and Symptom Expression in Individuals With Schizotypal Personality Traits and Early Psychosis. Schizophr Bull. 2016.Simon JJ, Cordeiro SA, Weber 25. M-A, Friederich H-C, Wolf RC, Weisbrod M, et al. Reward System Dysfunction as a Neural Substrate of Symptom Expression Across the General Population and Patients With Schizophrenia. Schizophrenia Bull. 2015;41(6):1370-8.de Leeuw M, Kahn RS, Vink M. Fronto-26. striatal dysfunction during reward processing in unaffected siblings of schizophrenia patients. Schizophr Bull. 2015;41(1):94-103.Hanssen E, van der Velde J, Gromann 27. PM, Shergill SS, de Haan L, Bruggeman R, et al. Neural correlates of reward processing in healthy siblings of patients with schizophrenia. Front Hum Neurosci. 2015;9:504.van Duin EDA, Goossens L, Hernaus 28. D, da Silva Alves F, Schmitz N, Schruers K, et al. Neural correlates of reward processing in adults with 22q11 deletion syndrome. J Neurodev Disord. 2016;8:25.Lancaster TM, Linden DE, Tansey KE, 29. Banaschewski T, Bokde AL, Bromberg U, et al. Polygenic Risk of Psychosis and Ventral Striatal Activation During Reward Processing in Healthy Adolescents. JAMA Psychiatry. 2016;73(8):852-61.Stefanis NC, Hanssen M, Smirnis 30. NK, Avramopoulos DA, Evdokimidis IK, Stefanis CN, et al. Evidence that three dimensions of psychosis have a distribution in the general population. Psychological medicine. 2002;32(2):347-58.American Psychiatric Association., 31.
Chapter 4
122
2004;21(4):1732-47.K.J. W. Statistical analysis of activation 45. images. Ch 14. In: Jezzard P, Matthews PM, Smith SM, editors. Functional MRI : an introduction to methods. Oxford ; New York: Oxford University Press; 2001. p. xiii, 390 p.Winkler AM, Ridgway GR, Webster 46. MA, Smith SM, Nichols TE. Permutation inference for the general linear model. Neuroimage. 2014;92:381-97.Bernacer J, Corlett PR, Ramachandra P, 47. McFarlane B, Turner DC, Clark L, et al. Methamphetamine-induced disruption of frontostriatal reward learning signals: relation to psychotic symptoms. Am J Psychiatry. 2013;170(11):1326-34.Mawlawi O, Martinez D, Slifstein M, 48. Broft A, Chatterjee R, Hwang DR, et al. Imaging human mesolimbic dopamine transmission with positron emission tomography: I. Accuracy and precision of D(2) receptor parameter measurements in ventral striatum. J Cereb Blood Flow Metab. 2001;21(9):1034-57.Martinez D, Slifstein M, Broft A, 49. Mawlawi O, Hwang DR, Huang Y, et al. Imaging human mesolimbic dopamine transmission with positron emission tomography. Part II: amphetamine-induced dopamine release in the functional subdivisions of the striatum. J Cereb Blood Flow Metab. 2003;23(3):285-300.StataCorp L. Stata Statistical Software: 50. Release 13. . College Station, TX; 2009.Wang L, Yu H, Hu J, Theeuwes J, Gong 51. X, Xiang Y, et al. Reward breaks through center-surround inhibition via anterior insula. Human brain mapping. 2015;36(12):5233-51.Rademacher L, Krach S, Kohls G, 52. Irmak A, Grunder G, Spreckelmeyer KN. Dissociation of neural networks for anticipation and consumption of monetary and social rewards. Neuroimage. 2010;49(4):3276-85. Koch SP, Hagele C, Haynes JD, Heinz 53. A, Schlagenhauf F, Sterzer P. Diagnostic classifi cation of schizophrenia patients on the basis of regional reward-related FMRI signal patterns. PLoS One. 2015;10(3):e0119089.Murray GK, Corlett PR, Clark L, 54. Pessiglione M, Blackwell AD, Honey G, et al. Substantia nigra/ventral tegmental reward prediction error disruption in
psychosis. Mol Psychiatry. 2008;13(3):239, 67-76.Schmidt A, Antoniades M, Allen P, Egerton 55. A, Chaddock CA, Borgwardt S, et al. Longitudinal alterations in motivational salience processing in ultra-high-risk subjects for psychosis. Psychol Med. 2017;47(2):243-54.Haber SN. Neuroanatomy of Reward: 56. A View from the Ventral Striatum. In: Gottfried JA, editor. Neurobiology of Sensation and Reward. Frontiers in Neuroscience. Boca Raton (FL)2011.Eckert MA, Menon V, Walczak A, 57. Ahlstrom J, Denslow S, Horwitz A, et al. At the heart of the ventral attention system: the right anterior insula. Human Brain Mapping. 2009;30(8):2530-41.Namkung H, Kim SH, Sawa A. The 58. Insula: An Underestimated Brain Area in Clinical Neuroscience, Psychiatry, and Neurology. Trends Neurosci. 2017;40(4):200-7.Craig ADB. How do you feel--now? The 59. anterior insula and human awareness. Nat Rev Neurosci. 2009;10(1):59-70.Hoogendam JM, Kahn RS, Hillegers 60. MH, van Buuren M, Vink M. Different developmental trajectories for anticipation and receipt of reward during adolescence. Dev Cogn Neurosci. 2013;6:113-24.Zhang WN, Chang SH, Guo LY, Zhang KL, 61. Wang J. The neural correlates of reward-related processing in major depressive disorder: a meta-analysis of functional magnetic resonance imaging studies. J Affect Disord. 2013;151(2):531-9.Waltz JA, Schweitzer JB, Ross TJ, 62. Kurup PK, Salmeron BJ, Rose EJ, et al. Abnormal responses to monetary outcomes in cortex, but not in the basal ganglia, in schizophrenia. Neuropsychopharmacology. 2010;35(12):2427-39.Joseph JE, Zhu X, Lynam D, Kelly TH. 63. Modulation of meso-limbic reward processing by motivational tendencies in young adolescents and adults. Neuroimage. 2016;129:40-54.Chochon F, Cohen L, van de Moortele PF, 64. Dehaene S. Differential contributions of the left and right inferior parietal lobules to number processing. J Cogn Neurosci. 1999;11(6):617-30.Segarra N, Metastasio A, Ziauddeen 65. H, Spencer J, Reinders NR, Dudas

4
123
FMRI REWARD ANTICIPATION
RB, et al. Abnormal Frontostriatal Activity During Unexpected Reward Receipt in Depression and Schizophrenia: Relationship to Anhedonia. Neuropsychopharmacology. 2016;41(8):2001-10.Paulus MP, Frank L, Brown GG, 66. Braff DL. Schizophrenia subjects show intact success-related neural activation but impaired uncertainty processing during decision-making. Neuropsychopharmacology. 2003;28(4):795-806.Poldrack RA. Region of interest analysis 67. for fMRI. Soc Cogn Affect Neurosci. 2007;2(1):67-70.Hopfi nger JB, Buchel C, Holmes AP, 68. Friston KJ. A study of analysis parameters that infl uence the sensitivity of event-related fMRI analyses. NeuroImage. 2000;11(4):326-33.Carlen M. What constitutes 69. the prefrontal cortex? Science. 2017;358(6362):478-82.Grimm O, Heinz A, Walter H, Kirsch P, 70. Erk S, Haddad L, et al. Striatal response to reward anticipation: evidence for a systems-level intermediate phenotype for schizophrenia. JAMA Psychiatry. 2014;71(5):531-9.Luking KR, Pagliaccio D, Luby JL, Barch 71. DM. Reward Processing and Risk for Depression Across Development. Trends Cogn Sci. 2016;20(6):456-68.van Rossum I, Dominguez MD, Lieb 72. R, Wittchen HU, van Os J. Affective dysregulation and reality distortion: a 10-year prospective study of their association and clinical relevance. Schizophr Bull. 2011;37(3):561-71.van Os J, van der Steen Y, Islam MA, 73. Guloksuz S, Rutten BP, Simons CJ, et al. Evidence that polygenic risk for psychotic disorder is expressed in the domain of neurodevelopment, emotion regulation and attribution of salience. Psychol Med. 2017:1-17.Liu TT. Noise contributions to the 74. fMRI signal: An overview. Neuroimage. 2016;143:141-51.

Chapter 4
124
Supplementary materials
Figu
re 1
: Reg
ion
of in
tere
st R
egio
n of
inte
rest
in t
he s
tria
tum
(ST
R).

4
125
FMRI REWARD ANTICIPATION
Table 1. Main effect on the high reward contrast (circles_large > triangles) in the healthy control (HC) and subclinical psychotic experiences (PE) group. The table provides the local maxima within the cluster per group and the x, y, z MNI coordinates. Cluster-based correction was applied at the level of Z>3.1.
HC local maxima
Z-value x y z
12.4 12 -86 -6
11.8 32 22 -4
10.7 10 10 2
10.5 -32 20 2
9.67 34 22 2
9.6 0 4 52
PE local maxima
Z-value x y z
11.4 32 22 -4
10.9 10 10 2
10.9 12 -86 -6
9.33 -10 -90 -10
9.14 -8 -2 8
9.03 -8 6 0


CH
APT
ERFiveWHITE MATTER
MICROSTRUCTURE AND NETWORK-CONNECTIVITY IN EMERGING ADULTS WITH SUBCLINICAL PSYCHOTIC
EXPERIENCES
Stijn Michielse, Iris Lange, Jindra Bakker, Liesbet Goossens, Simone Verhagen, Marieke Wichers, Ritsaert Lieverse, Koen Schruers, Therese van Amelsvoort, Jim van Os, Machteld Marcelis
Submitted for publication
Chapter 5
128
AbstractBackground: Group comparisons of individuals with psychotic disorder and controls have shown alterations in white matter microstructure. Whether white matter microstructure and network connectivity is altered in adolescents with subclinical psychotic experiences (PE) at the lowest end of the psychosis severity spectrum is less clear. Methods: DWI scan were acquired in 48 individuals with PE and 43 healthy controls (HC). Traditional DWI parameters: Fractional Anisotropy, Axial Diffusivity, Mean Diffusivity and Radial Diffusivity, as well as network connectivity measures (global/local effi ciency and clustering coeffi cient) were compared between the groups. Subclinical psychopathology was assessed with the Community Assessment of Psychic Experiences (CAPE) and Montgomery–Åsberg Depression Rating Scale (MADRS) questionnaires and, in order to capture momentary subclinical expression of psychosis, the Experience Sampling Method (ESM) questionnaires. Within the PE-group, interactions between subclinical (momentary) symptoms and brain regions in the model of DWI parameters and network connectivity measures were investigated in a hypothesis-generating fashion. Results: Whole brain analyses showed no group differences in DWI parameters and network connectivity measures. In the PE-group, a higher positive symptom distress score was associated with both higher local effi ciency and clustering coeffi cient in the right middle temporal pole. Conclusion: The fi ndings indicate absence of microstructural white matter differences between emerging adults with subclinical PE and controls. In the PE-group, attenuated symptoms were positively associated with network effi ciency/cohesion, which requires replication and may indicate that individuals with network alterations may be predisposed to psychotic expression or that these cerebral changes are reactive to emerging mild psychopathology.

5
129
MICROSTRUCTURE AND CONNECTIVITY IN SUBCLINICAL PSYCHOTIC EXPERIENCES
IntroductionOver the last decades, white matter ‘integrity’ alterations have been frequently reported as a neural characteristic associated with psychotic disorder (1-3). Decreased fractional anisotropy (FA, an index for white matter ‘integrity’) in fronto-temporal and fronto-limbic connections has also been described in help-seeking individuals considered at ultra-high risk for psychosis (4). The basis of water diffusion in cerebral white matter can be characterised by FA (refl ecting both degree of myelination and coherence of fi ber tracts), but also by other indicators such as mean diffusivity (MD; indicates free water movement in the white matter), axonal density (AXD; diffusion along the fi bre axis indicating axonal packing) and radial diffusivity (RAD; diffusion perpendicular to the axis indicating myelin content) (5). Lower AXD and increased RAD have respectively been related to a lower number of axons and decreased myelin content (6). Previous research on patients with psychotic disorder suggests that AXD is unaffected (7-9), whereas RAD and MD may be increased with respect to controls (10-12). In addition, higher levels of positive psychotic symptoms have been associated with a decrease in FA (13, 14) and with altered RAD, AXD or MD (15). Another element in understanding structural connectivity and alterations therein is the network-based approach. This method is complimentary to the above described more traditional diffusion-weighted measures (DWI). As white matter alterations in psychotic disorder are spatially widespread (16), convergence can be achieved through network-based connectivity (17). Indeed, studies have pointed towards alterations in white matter network connectivity as expressed by widespread fi bre bundle disruption (17), decreased global effi ciency (18), fewer prefrontal hubs (brain regions facilitating integration) (19, 20) and decrease of frontal lobe nodes (21, 22). Additionally, decreased local effi ciency (defi ned as how well information circulates over the network (23)) has been described in frontal, temporal, (para)-limbic and putamen regions (24, 25). Findings on the clustering coeffi cient (CC; measure of local cohesiveness/interconnectedness) are inconsistent, showing increased (26), decreased (27) and unchanged CC (28). Furthermore, studies have reported negative associations between structural network effi ciency on the one hand, and negative and positive symptoms in patients with psychotic disorder on the other (18, 29).While knowledge has accrued regarding microstructural white matter alterations in psychotic disorder, little is known about AXD, RAD and MD in individuals with early stage, mild psychopathology, such as attenuated psychotic symptoms. Individuals with expression of attenuated psychotic symptoms are at increased risk for later stage emergence or persistence of psychopathology
Chapter 5
130
(30). This group of individuals can be distinguished from clinical psychotic disorder based on the lower intensity and frequency of symptoms and associated distress of the attenuated symptoms (31). Attenuated psychotic symptoms have an estimated prevalence of 7.2% in the general population (32), and a similar prevalence (6.9%) of attenuated psychotic symptoms has been described in adolescent populations (33). The existing literature on structural white matter changes in individuals with subclinical psychotic experiences (PE) involves samples with diverse defi nitions and risks. One study found an association between increased psychosis-proneness and decreased FA in the frontal lobe in individuals with psychosis-linked personality traits (34). Another study in young adults at familial risk for developing psychosis, reported decreased FA and increased RAD in association and projection fi bers in the left hemisphere (35). In contrast, increased FA and MD have been found in help-seeking individuals with so-called Ultra-High-Risk (UHR) status compared to controls (4). A one-year follow up study on individuals with an ‘at risk mental state’ (ARMS), found decreased FA and that only the individuals without transition to psychosis showed improvement of symptom levels associated with an increase in FA over the follow-up period (36).Previous studies have also examined network-connectivity alterations in individuals with subclinical PE compared to controls. One study found lower betweenness centrality (the number of shortest paths passing through a region) in a sample with subclinical expression of psychosis, indicating a disruption of the backbone of the hub regions (37). Furthermore, help-seeking participants considered to have an ARMS showed reduced mean strength of the rich-club organisation (how well connected a network is), and decreased local effi ciency in the right accumbens, while global effi ciency was preserved (38). However, other studies showed increased local effi ciency and decreased global effi ciency (39), or reduced global effi ciency and density with no alterations in mean clustering coeffi cient and betweenness (40). Overall, network measures may be altered in individuals with PE, but the literature to date has not yielded a consistent pattern. Evidence for an association between attenuated symptoms and network-connectivity comes from a report on a negative association between negative symptoms and rich-club organisation in a help-seeking clinical high risk sample (38), but there is also a fi nding of absence of association between attenuated symptoms and network-connectivity measures in young adults at familial risk for psychotic disorder (41). The current study combines network-based measures with traditional DWI measures in order to better understand structural white matter alterations in emerging adults with mild attenuated symptomatology at the

5
131
MICROSTRUCTURE AND CONNECTIVITY IN SUBCLINICAL PSYCHOTIC EXPERIENCES
lowest end of the psychosis severity spectrum who were not help-seeking (subclinical psychotic experiences and depressive symptoms, hereafter: PE-group). Based on the above described white matter alterations in psychotic disorder and the sparse fi ndings in subclinical samples, it was hypothesized that the PE-group would display altered FA, AXD, RAD and MD with respect to controls (given the fact that the literature described both higher and lower microstructural white matter in PE). We also hypothesize lower global effi ciency and local effi ciency and a non-deviated clustering coeffi cient in the PE-group compared to controls. Lastly, in the PE-group, associations between symptoms and DWI white matter (network) alterations were explored. Attenuated symptoms were assessed cross-sectionally using questionnaires. In addition, we examined momentary measures of psychopathology using Experience Sampling Technology, shedding light on symptoms dynamics in the continuous fl ow of daily life, which arguably may be closer to cerebral dynamics than the traditional static, period-based psychopathology measures (42). Since the literature is inconclusive with respect to regional DWI changes and associated attenuated symptoms, a region-based, complementary to the whole brain approach, was applied.
MethodsParticipantsThe study took place within the Smartscan project (Dutch Trial Register Number: NTR3808), comprising a sample of individuals between 16-25 years of age with attenuated symptoms of depression and psychotic experiences (PE-group) as well as a healthy control group, recruited in the area of Southern Limburg in the Netherlands. A total of 48 participants were included in the PE-group and 43 in the healthy control (HC)-group. The inclusion criteria for the PE-group were based on the Community Assessment of Psychic Experiences (CAPE (43)) positive subscale frequency score ≥10 and/or positive subscale distress score ≥2. Participants with a Montgomery–Åsberg Depression Rating Scale (MADRS) (44) score ≥10 (45) who met the subclinical PE inclusion criteria were also included. Inclusion criteria for the control group were based on MADRS <10, CAPE positive subscale frequency score <10 and CAPE positive subscale distress <2. Individuals with a history of mental diagnosis or treatment were excluded from the control group.General exclusion criteria were current mental health treatment or requiring mental health treatment. Exclusion criteria were: left-handedness, a history of neurological disorder (e.g. severe brain injury with unconsciousness, meningitis, migraine or epilepsy) and MRI contraindications (e.g. diabetes, claustrophobia, participants with inclusions of ferromagnetic material, and

Chapter 5
132
women with (suspected) pregnancy). The local medical ethics committee approved the study according to the declaration of Helsinki. All participants gave written informed consent in person and in addition a parent when younger than 18 years of age.
Clinical measures Previous mental health treatment in the PE-group was reported per category; psychotherapy, pharmacotherapy, paramedical (psychomotor, creative arts therapy and social skill training), social support and alternative treatment. Lifetime cannabis and other drug use were assessed with the Composite International Diagnostic Interview (CIDI) section L (46). Lifetime use was calculated by multiplying the number of weeks of use times the weekly frequency. Level of education was defi ned by completed level of education ranging from 0 (no education) to 7 (master degree). The scores of the MADRS, CAPE positive, negative, depressive dimension as well as the CAPE total score on both the frequency and distress scales were calculated by summing the relevant items (43). Momentary measures of subclinical PE in daily life were monitored using the Experience Sampling Method (ESM). The questions ‘I feel unreal’ and ‘I feel suspicious’ covered the psychosis dimension, based on previous work in this area (42, 47). The item-score ranged from 1 (not at all) to 7 (very) on a Likert-scale. Individuals were asked to self-monitor their momentary mental state with the PsyMate (an electronic device with a touchscreen to record answers) during 15 days. The average over the items ‘I feel unreal’ and ‘I feel suspicious’ was calculated per individual as a composite momentary PE-score. At ten semi-random times during the day, the PsyMate signaled the participant with a beep, after which a short (5 minute) questionnaire was completed within 15 minutes. Data were included if >30% of the completed beep questions were available, conform earlier work (48) (in the present study > 45 out of 150 beeps). As a result, the number of individuals in the ESM analyses was 40 participants in each group (three participants in the HC-group and eight in the PE-group were excluded). This sample was used in the ESM analyses, while for all other analyses the entire sample was used.
MRI AcquisitionThe MRI scans were acquired on a 3T Siemens Magnetom Prisma system (Siemens, Erlangen, Germany) equipped with a 64-channel head/neck coil at Scannexus, Maastricht, The Netherlands. T1-weighted Magnetization Prepared Rapid Acquisition Gradient Echo (MPRAGE) whole brain images were acquired with a voxel size of 1.0mm x 1.0mm x 1.0mm (repetition

5
133
MICROSTRUCTURE AND CONNECTIVITY IN SUBCLINICAL PSYCHOTIC EXPERIENCES
time (TR) = 2250 msec, echo time (TE) = 2.21 msec, fl ip angle = 9°, fi eld of view (FOV) = 256x256, 192 sagittal orientated slices, GRAPPA = 2, no fat suppression, acquisition time (TA) = 5.05 min). Whole brain structural Diffusion Weighted Imaging scans were acquired using an interleaved echo-planar-imaging sequence (fi eld of view 200 x 200 mm2, TR 7300 ms, TE 49 ms, voxel size 2 x 2 x 2 mm³, b-value 1000 s/mm², 72 slices, no overlap). 119 directions were recorded; 11 B0 volumes and 108 B-1000 volumes. Total acquisition time was 14m52s. Due to a scanner update a one scan (PE-group) was recorded with TR 7800ms.
Diffusion Weighted Imaging processingAfter conversion of raw DICOM images to NIfTI format (49), the DWI data were converted from NIfTI standard to .mat standard using ExploreDTI (50) in a MatLab (The MathWorks, Inc., Natick, Massachusetts, United States) programming environment. Motion and eddy-current induced geometrical distortions were corrected by realigning the diffusion images to the B0 images incorporating B-matrix rotation (50) and coregistered to the individual’s anatomical data to correct for echo-planar imaging (EPI) distortions (51, 52). The diffusion tensor metrics were calculated using the Robust Estimation of Tensors by Outlier Rejection (RESTORE) method (53). FA maps were calculated with a threshold of > 0.2. White matter tracts were reconstructed at 1mm3 resolution using deterministic fi ber tractography, for each individual dataset (54). Individual MD, AXD and RAD maps were exported from ExploreDTI to be used in the next steps.
Tract-based analysisTract-based spatial statistics (TBSS) in FSL 5.0.9 (FMRIB Analysis Group, Oxford, UK) was effectuated for further processing of the DWI data. Nonlinear registration aligned all FA volumes to 1 x 1 x 1 mm standard FMRIB58_FA space. The standard FMRIB58_FA consists of a template derived from high-resolution images of 58 participants (males and females between 20 and 50 years of age) (55). A mean FA skeleton based on the whole sample was generated. This skeleton follows the major white matter tracts in each individual participant (normalized in MNI152 space) and provides a way to examine group differences. The FA threshold was set at 0.2 after visual inspection of the FA skeleton in order to include major white matter tracts while removing small peripheral tracts that would cause excess inter-participant variability. A voxel-wise statistical analysis was performed based on the mean FA skeleton using a general linear model applying permutation testing using FSL’s randomise (v2.9) (56). Based on the FA processing, the

Chapter 5
134
mean MD, AXD and RAD were extracted.
Group differences in DWI measuresWhole brain analysesStatistical evaluation of group differences in mean FA, AXD, RAD and MD was performed in two directions: PE-group > controls and PE-group < controls. The a priori hypothesized confounding variables age, sex, level of education, lifetime cannabis use and other lifetime drug use (57) were added to this and other statistical models described below. A total of 5000 permutations were used. A threshold-free cluster enhancement (TFCE) threshold of p>0.05 was applied to all statistical tests in TBSS (58).
ROI analysesIn order to investigate group differences in 38 white matter regions based on the Johns Hopkins University International Consortium for Brain Mapping (JHU ICBM)-DTI-81 atlas labels (59) the mean FA, AXD, RAD and MD per region of interest (ROI) were computed per individual resulting in a hierarchical dataset (38 assessments per DWI measure clustered within participants). This data was exported and statistically analyzed in R (60). The interactions between group and ROI (dummy coded 1 till 38) in the models of FA, AXD, RAD and MD were investigated using a multilevel random effects model. Group status was coded ‘1’ for PE-group and ‘0’ for HC-group. The number of voxels was added to the model as an analytic weight to control for ROI size (i.e., the error variance for a particular observation was inversely weighted by the number of voxels within the corresponding region). In case of a signifi cant interaction between group and ROI (p<0.05), the association between group and DWI measure was tested per ROI. Bonferroni correction was applied to control the type I error rate, since group differences in 38 regions were tested.
Group differences in network parametersParcellation of the whole brain fi ber tracts was done using the standard automated anatomical atlas labeling (AAL, (61)). This procedure provides 90 (sub)-cortical brain regions of interest, each representing a node in the white matter network. The reconstructed white matter tracts were represented as edges between each pair of nodes. The AAL atlas provides proper cortical coverage and is widely used in both structural and functional connectivity analysis. With the use of the individual brain networks, connectivity measures were computed in order to quantify the network architecture using the Brain Connectivity Toolbox (62). The connectivity measures were global/

5
135
MICROSTRUCTURE AND CONNECTIVITY IN SUBCLINICAL PSYCHOTIC EXPERIENCES
local effi ciency and clustering coeffi cient. Effi ciency quantifi es the exchange of information on a global or local nodal level. Clustering coeffi cient indicates to what extent nodes in a network tend to cluster together. Network connectivity was described in terms of local effi ciency and clustering coeffi cient (62) based on the pass criteria (i.e., where the tract passes through) per ROI node. All three connectivity network measures (global effi ciency, local effi ciency and clustering coeffi cient) were computed per individual, exported and statistically analyzed in R (60).
Global effi ciencyGroup differences in global effi ciency were assessed with a multiple linear regression model (wide format).
Local effi ciency and clustering coeffi cientThe interaction between group and ROI in the models of local effi ciency and clustering coeffi cient was investigated using a multilevel random effects model, including a random effect for participant (long format). The number of voxels was added to the model as an analytic weight to control for ROI size (i.e., the error variance for a particular observation was inversely weighted by the number of voxels within the corresponding region). In case of a signifi cant interaction between group and ROI (p<0.05), the association between group and DWI measure was tested per ROI. Bonferroni correction was applied to control the type I error rate, since group differences in 90 regions were tested.
Associations between attenuated symptoms and DWI white matter parameters.Within the PE-group, the interactions between the CAPE scores and ROI in the models of DWI measures FA, AXD, RAD and MD were analyzed in multilevel random regression models with a random intercept for participants. The same model was used for all four CAPE dimensions (frequency/distress scores), the MADRS total score and the ESM momentary composite PE-score. In case of a signifi cant interaction between symptom and ROI (at a conservative level of p<0.01 given multiple tests with symptoms scores), the association between symptom score and DWI measure was tested per ROI. Bonferroni correction was applied to control the type I error rate, since a total of 38 tests were conducted at ROI level.

Chapter 5
136
Associations between attenuated symptoms and network connectivity parametersGlobal effi ciencyWithin the PE-group, the association between CAPE score (independent variable) and connectivity measure (global effi ciency; dependent variable) was investigated using a multiple linear regression model. The same model was used for all four CAPE dimensions (frequency/distress), the MADRS total score and the ESM composite PE-score.
Local effi ciency and clustering coeffi cientWithin the PE-group, the interaction between CAPE score and ROI in the models of local effi ciency and clustering coeffi cient were analyzed with multilevel random regression. The same model was applied for all four CAPE dimensions (frequency/distress scores), MADRS total score and ESM momentary composite PE-score. In case of a signifi cant interaction between symptom and ROI (at a conservative level of p<0.01 given multiple tests with symptoms scores), the association between symptom score and DWI measure was tested per ROI. Bonferroni correction was applied to control the type I error rate, since a total of 90 hypotheses were tested.
ResultsParticipant characteristicsNinety-one participants with quality-controlled DWI scans were included for analysis: 48 participants within the PE-group and 43 within the HC-group. Groups were comparable with regard to age, sex, educational level, cannabis use and lifetime drug use and differed in CAPE symptom scores, MADRS score and GAF score as shown in table 1. Individuals in the PE-group reported higher levels of momentary ESM composite PE-score in daily life compared to the HC-group (table 1).In 13 participants pertaining to the PE-group, psychotropic medications had been used in the past: selective serotonin reuptake inhibitors (2 participants), methylphenidate (4 participants), melatonine (4 participants), risperidone (1 participant), minor tranquilizers / benzodiazepines (5 individuals) and bupropion (1 participant). The number of individuals currently using psychotropic medication was 2 (both in the PE-group). These individuals used a minor tranquilizer (Valerian) and quetiapine (25 milligram at night) when needed. None of the participants were ever admitted to hospital for a mental disorder.

5
137
MICROSTRUCTURE AND CONNECTIVITY IN SUBCLINICAL PSYCHOTIC EXPERIENCES
Table 1. Participant characteristics.
HC (n=43) PE (n=48)
Age (mean (sd)) 21.81 (1.69) 21.31 (2.48)
Sex female (%) 35 (81.4) 37 (77.1)
Educational level:
Lower general education (%) 0 (0.0) 1 (2.1)
Vocational education (%) 1 (2.3) 2 (4.2)
High school (%) 2 (4.7) 5 (10.4)
Higher education (Bachelor) (%) 29 (67.4) 37 (77.1)
University (Master) (%) 11 (25.6) 3 (6.2)
CAPE positive frequency (mean (sd)) 0.84 (1.38) 4.71 (2.99)
CAPE positive distress (mean (sd)) 0.16 (0.37) 4.33 (2.90)
CAPE negative frequency (mean (sd)) 3.93 (2.78) 14.14 (6.30)
CAPE negative distress (mean (sd)) 2.14 (2.14) 14.50 (8.14)
CAPE depressive frequency (mean (sd)) 1.88 (1.55) 9.08 (4.50)
CAPE depressive distress (mean (sd)) 1.44 (1.86) 10.35 (5.23)
CAPE total frequency (mean (sd)) 6.65 (4.69) 27.92 (11.89)
CAPE total distress (mean (sd)) 3.74 (3.76) 29.21 (14.11)
MADRS score (mean (sd)) 1.35 (1.81) 13.58 (7.16)
GAF score (mean (sd)) 86.81 (6.34) 62.17 (11.17)
Cannabis lifetime (mean (sd)) 3.05 (9.93) 8.15 (20.25)
Other drugs lifetime (mean (sd)) 0.33 (1.49) 11.06 (50.54)
PE-score (mean (sd))* 1.10 (0.17) 1.66 (0.86)
Means, standard deviations and frequencies are provided per group. HC-group; Healthy Control group; PE-group: Subclinical Psychotic Experiences group; CAPE: community assessment of psychic experiences; MADRS: Montgomery–Åsberg Depression Rating Scale; GAF: Global Assessment of Functioning. The total lifetime cannabis and other drug use were calculated by multiplying the frequency per week times the number of weeks of use. * ESM data were missing for three participants in the HC-group and eight in the PE-group.
Group differences in DWI measuresWhole brain analyses and ROI analysesWhole brain TBSS analyses did not show signifi cant differences between the groups for any of the DWI measures. Additionally, no signifi cant interaction between group and ROI in the model of FA (χ2=34.64, p=0.53), AXD (χ2=27.60, p=0.84), RAD (χ2=42.96, p=0.20) and MD (χ2=40.22, p=0.29) were found (table 2).
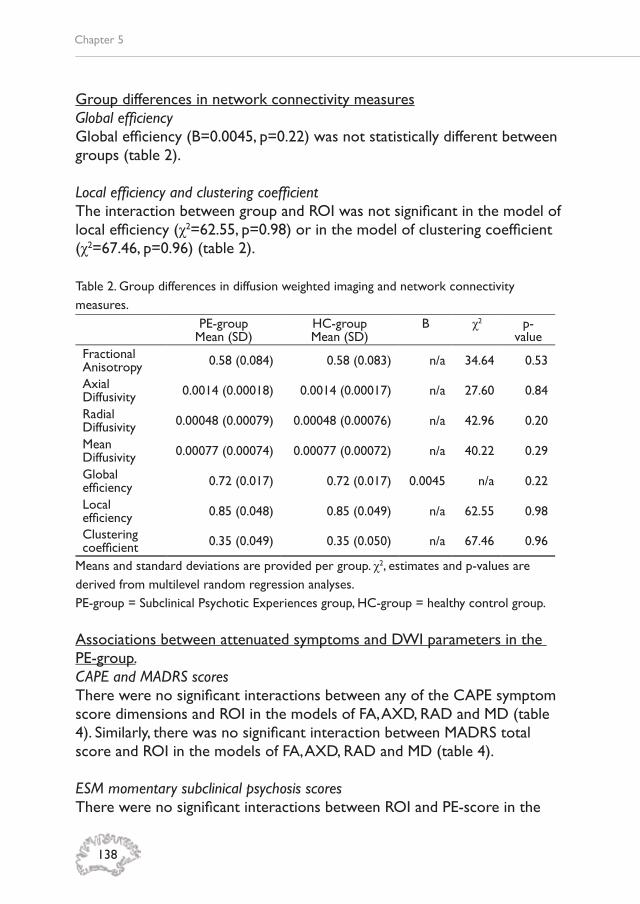
Chapter 5
138
Group differences in network connectivity measuresGlobal effi ciencyGlobal effi ciency (B=0.0045, p=0.22) was not statistically different between groups (table 2).
Local effi ciency and clustering coeffi cientThe interaction between group and ROI was not signifi cant in the model of local effi ciency (χ2=62.55, p=0.98) or in the model of clustering coeffi cient (χ2=67.46, p=0.96) (table 2).
Table 2. Group differences in diffusion weighted imaging and network connectivity measures.
PE-groupMean (SD)
HC-groupMean (SD)
B χ2 p-value
Fractional Anisotropy 0.58 (0.084) 0.58 (0.083) n/a 34.64 0.53
Axial Diffusivity 0.0014 (0.00018) 0.0014 (0.00017) n/a 27.60 0.84
Radial Diffusivity 0.00048 (0.00079) 0.00048 (0.00076) n/a 42.96 0.20
Mean Diffusivity 0.00077 (0.00074) 0.00077 (0.00072) n/a 40.22 0.29
Global effi ciency 0.72 (0.017) 0.72 (0.017) 0.0045 n/a 0.22
Local effi ciency 0.85 (0.048) 0.85 (0.049) n/a 62.55 0.98
Clustering coeffi cient 0.35 (0.049) 0.35 (0.050) n/a 67.46 0.96
Means and standard deviations are provided per group. χ2, estimates and p-values are derived from multilevel random regression analyses. PE-group = Subclinical Psychotic Experiences group, HC-group = healthy control group. Associations between attenuated symptoms and DWI parameters in the PE-group.CAPE and MADRS scoresThere were no signifi cant interactions between any of the CAPE symptom score dimensions and ROI in the models of FA, AXD, RAD and MD (table 4). Similarly, there was no signifi cant interaction between MADRS total score and ROI in the models of FA, AXD, RAD and MD (table 4).
ESM momentary subclinical psychosis scoresThere were no signifi cant interactions between ROI and PE-score in the

5
139
MICROSTRUCTURE AND CONNECTIVITY IN SUBCLINICAL PSYCHOTIC EXPERIENCES
any of the DWI white matter models (table 3). Table 3. Interactions between attenuated symptoms and ROI in the models of DWI measures within the PE-group.
FA AXD RAD MD
χ2 p-value χ2 p-
value χ2 p-value χ2 p-
valueCAPE positive frequency score 25.69 0.92 26.52 0.90 23.32 0.96 16.00 0.99
CAPE positive distress score 38.69 0.39 37.62 0.44 31.93 0.71 22.23 0.98
CAPE negative frequency score 24.77 0.94 20.17 0.99 22.79 0.97 26.54 0.92
CAPE negative distress score 29.49 0.81 22.27 0.97 41.20 0.29 51.64 0.07
CAPE depressive frequency score 30.77 0.76 25.06 0.93 35.03 0.56 43.10 0.26
CAPE depressive distress score 31.36 0.73 32.11 0.70 38.70 0.39 56.52 0.03
CAPE total frequency score 26.60 0.90 21.33 0.98 24.37 0.95 25.14 0.95
CAPE total distress score 30.73 0.76 23.21 0.96 40.82 0.31 50.28 0.09
MADRS total score 28.42 0.84 41.94 0.27 22.99 0.97 43.09 0.26
PE-score 21.28 0.98 19.85 0.99 17.92 0.99 14.23 0.99
FA; Fractional Anisotropy, AXD; Axial Diffusivity, RAD; Radial Diffusivity and MD; Mean Diffusivity. CAPE; Community Assessment of Psychic Experiences, MADRS; Montgomery–Åsberg Depression Rating Scale, ESM; Experience Sampling Method. χ2, estimates and p-values are derived from multilevel random regression analyses. * There were missing ESM data for three participants in the HC-group and eight in the PE-group.
Associations between attenuated symptoms and network connectivity parameters in the PE-groupCAPE and MADRS scores in association with global effi ciencyThere was no signifi cant association between any of the CAPE or MADRS scores and global effi ciency (table 4).
ESM momentary subclinical psychosis scores in association with global effi ciencyThe daily life composite ESM item PE-score showed no signifi cant association with global effi ciency (table 4).
CAPE and MADRS scores in association with nodal network connectivityThe positive symptom frequency score of the CAPE showed a signifi cant interaction with ROI in the model of local effi ciency (χ2=149.91, p<0.0001)

Chapter 5
140
and clustering coeffi cient (χ2=127.09, p=0.006). After correction for multiple testing, no signifi cant interactions remained (Supplementary tables 1 and 2). The positive symptom distress score of the CAPE showed a signifi cant interaction with ROI in the model of local effi ciency (χ2=138.26, p=0.0006) and clustering coeffi cient (χ2=128.67, p=0.005) (table 4). Stratifi ed analyses showed a signifi cant increase in both local effi ciency (b=0.0040, p=0.01) and clustering coeffi cient (b=0.0039, p=0.05) in the right middle temporal pole (MTP) with increasing levels of distress from positive symptoms, after Bonferroni correction (Supplementary tables 3 and 4). There were no signifi cant interactions between ROI and the CAPE depressive symptom, negative symptom and total scores or the MADRS total score in the models of local effi ciency and clustering coeffi cient (table 4).
ESM momentary psychosis scores in association with nodal network connectivityThe ESM composite PE item showed no signifi cant interaction with ROI in the models of local effi ciency and clustering coeffi cient (table 4).

5
141
MICROSTRUCTURE AND CONNECTIVITY IN SUBCLINICAL PSYCHOTIC EXPERIENCES
Table 4. Association between symptoms and network connectivity measures.
global effi ciency local effi ciency clustering coeffi cient
estimate p-value χ2 p-value χ2 p-value
CAPE positive frequency score 0.000038 0.97 149.91 <0.0001 127.09 0.006
CAPE positive distress score 0.00024 0.80 138.26 0.0006 128.67 0.005
CAPE negative frequency score 0.00040 0.33 119.10 0.02 107.87 0.10
CAPE negative distress score 0.00019 0.55 97.17 0.28 87.31 0.56
CAPE depressive frequency score 0.00012 0.84 93.04 0.39 80.50 0.75
CAPE depressive distress score -0.00021 0.97 88.24 0.53 84.13 0.65
CAPE total frequency score 0.00014 0.54 118.76 0.02 101.29 0.20
CAPE total distress score 0.000066 0.61 102.67 0.17 91.02 0.45
MADRS total score -0.00016 0.64 66.30 0.97 72.98 0.90
PE-score -0.0084 0.97 77.90 0.81 72.49 0.91
Estimated values and p-values are derived from multilevel random regression analyses. MADRS; Montgomery–Åsberg Depression Rating Scale, ESM; Experience Sampling Method. χ2, estimates and p-values are derived from multilevel random regression analyses. * There were missing ESM data for three participants in the HC-group and eight in the PE-group.
Chapter 5
142
DiscussionThis study showed that microstructural white matter measures and structural network connectivity parameters were not different between non-help seeking young individuals with subclinical PE and controls. While attenuated subclinical symptoms were not associated with white matter structural alterations, there was some evidence for an association between symptoms and network connectivity in the PE group. Explorative, hypothesis-generating analyses in this group showed positive associations between positive symptom distress scores and local effi ciency and clustering coeffi cient in the right MTP.
Structural disconnectivity in individuals with subclinical psychotic experiencesThe fi ndings showed that non-help seeking individuals with subclinical PE were not different from controls with regard to any of the DWI parameters. This is in contrast with previously described decreased FA and increased MD in help-seeking Ultra-High-Risk (UHR) samples (see meta-analysis based on 12 studies (4)), though in line with another UHR-study reporting absence of microstructural white matter differences in young adults with respect to controls (63). Thus, the results suggest that non-help seeking individuals with subclinical PE have preserved white matter microstructure, in contrast to individuals with psychotic disorder (16), or to help-seeking individuals at high risk for psychotic disorder (4), who, at group level, show reduced white matter ‘integrity’. Compared to UHR studies, which include individuals who already are help-seeking in the context of mostly an existing affective disorder or a substance use disorder with a certain degree of psychosis admixture (64), the current study included individuals who were not help-seeking and likely had lower levels of psychopathology and psychosis admixture. There is also variation in age of the samples that have been studied (with the individuals of the current study being relatively young), implying differential stages of white matter maturation. To date, research on individuals at the attenuated, subclinical end of psychopathology remains sparse, though information on (early) phenomenological and biological differentiation is important to understand variation and alteration during development. In addition, it is informative with respect to efforts on clinical and biological staging and profi ling (65).
Structural network connectivity in individuals with subclinical psychotic experiences.No differences were found in the network-connectivity measures between

5
143
MICROSTRUCTURE AND CONNECTIVITY IN SUBCLINICAL PSYCHOTIC EXPERIENCES
the PE-group and controls. It was hypothesized that the frontal brain regions would show signs of disconnectivity in the fronto-occipital and fronto-temporal white matter, based on previous evidence in psychotic disorder (17-20). The literature on white matter network alterations in individuals with attenuated psychotic symptoms is rather limited and inconclusive, also due to different techniques that are used. Some studies have described alterations in rich-club organization (38, 39) and reduced local effi ciency (38, 39, 66) of the structural brain network in help-seeking individuals at high risk for psychotic disorder, which is likely different from the current, non-help seeking population. Moreover, it is challenging to compare studies, since high-risk sampling strategy, high-risk criteria, age groups, severity of symptomatology and network measures often differ between studies. The fi ndings of the current study nevertheless suggest that network connectivity may be preserved in individuals with subclinical PE.
Associations between symptoms and DWI measures in individuals with PE.In the current study, no associations were found between CAPE and MADRS symptom scores and DWI measures. This can be due to the sampling frame aimed at the lower end of psychosis severity spectrum. A previous cross-sectional study has pointed to positive associations between positive schizotypy symptoms and FA in a sample with nonclinical psychosis-linked personality traits (34), while a longitudinal study in a help-seeking at-risk sample showed that improvement in positive symptoms was related to increased FA (36). Both studies were at higher levels of the psychosis severity spectrum, which may explain the difference.Despite the fact that daily life assessment using ESM can be a more valid way of assessing mild symptoms as compared to fi lling in a questionnaire, since recall bias is reduced and questions are answered in the moment, and may be closer to brain dynamics in daily life, there was no evidence for associations between ESM subclinical PE and the DWI measures.
Associations between symptoms and network measures in individuals with PE. Explorative analyses on the associations between symptoms and network measures were conducted within the PE-group. There was a positive association between the CAPE positive symptom distress scores and local effi ciency and clustering coeffi cient in the right MTP. While the association between symptom distress and structural network connectivity has not been described in individuals with (or at risk for) psychotic disorder, distress can be the difference between help-seeking and clinical relevance
Chapter 5
144
of psychotic experiences (67). Replication is required to assess whether network effi ciency and cohesion within the right MTP may be an early sign of symptoms related to emerging psychosis.Furthermore, no association between the frequency/distress of negative symptoms and local effi ciency was found. Research on subclinical negative symptoms is limited, let alone in association with DWI network alterations. Two studies in individuals at high-risk for psychosis reported a negative association between subclinical negative symptoms and rich-club organization (27, 38), while another study reported no associations between network connectivity and subclinical negative symptoms (66). In psychotic disorder, absence of an association between negative symptoms and network-based measures (68), as well as a negative association between network connectivity and negative symptoms has been described (18). As emerging psychosis is often preceded by (subclinical) negative symptoms (69, 70), and negative symptoms impact on daily life functioning (71), it is important to understand the association with cerebral network alterations in order to identify and improve ways of early detection and intervention. The current study showed no signifi cant associations between depressive symptoms (measured with CAPE and MADRS) and network connectivity measures. Research on the relation between depressive symptomatology and brain network connectivity is limited to several small studies and suggests that, in siblings of patients with psychotic disorder, rich-club connectivity was not associated with depressive symptom severity (72), while one study with an ARMS population, showed a correlation between rich-club disorganization and depressive symptom severity (38). Thus, based on sparse previous literature and fi ndings from the current study, it has yet to be determined whether variations in brain network confi guration co-occur with variation in depressive symptoms in individuals with subclinical PE. Additionally to the use of more traditional questionnaires, we explored whether change in momentary PE measurement varied with brain network connectivity measures, which did not provide signifi cant results. Since it was the fi rst time that this research question was tested, no hypotheses were stated. It is thus clear that the current explorative and hypothesis-generating fi ndings warrant further investigation.
Methodological considerationsThe study comprised a fairly large sample of 48 individuals with subclinical PE and 43 controls. While the study was carefully designed, some considerations need to be taken into account. First, the PE-group had mild symptom levels, as inclusion was based on a CAPE positive distress score

5
145
MICROSTRUCTURE AND CONNECTIVITY IN SUBCLINICAL PSYCHOTIC EXPERIENCES
of ≥2, and help-seeking was excluded. Thus, the sampling frame targeted a group at the lowest level of the severity spectrum, below the high-risk sampling frame of help-seeking individuals with affective or substance use disorder and a degree of psychosis admixture. Whether the absence of differences between the groups refl ects a true fi nding needs to be ascertained in future studies at the lower end of the psychosis severity spectrum. Second, the sample size did not allow for specifi c sensitivity analyses in subgroups with for example higher or lower symptom levels. It can be questioned whether this would provide more information against the dimensional approach. Third, the association between attenuated symptoms and DWI measures was investigated only in the mild psychopathology group, as controls would have insuffi cient variance in symptomatology. Therefore, it is not known whether similar associations exist may in controls and it cannot be claimed that the fi ndings are specifi c for the group under investigation. The tensor estimation model had information on 119 directions to reconstruct the diffusion tensor in 2mm3 resolution. The RESTORE algorithm (54) is a widely used method for reducing the impact of outliers on the data, but novel techniques such as HARDI (high angular resolution diffusion imaging) or CHARMED (composite hindered and restricted model of diffusion) might improve the estimation (5). Lastly, the TBSS method might have been too crude to detect minor white matter changes. Since small white matter tracts were excluded in the processing, slight but relevant details may have been lost in the procedure.
ConclusionThis study demonstrated absence of differences between individuals at the lowest end of psychosis severity spectrum (subclinical PE) and controls with respect to FA, AXD, RAD and MD measures. Similarly, there were no network-based connectivity differences between the groups. In explorative analyses within the PE group, some attenuated symptom measures were positively associated with network effi ciency/cohesion, which could indicate that individuals with certain network alterations are predisposed to later psychotic symptom development or that these cerebral changes are reactive to emerging mild psychopathology.
Chapter 5
146
ReferencesFornito A, Zalesky A, Pantelis 1. C, Bullmore ET. Schizophrenia, neuroimaging and connectomics. Neuroimage. 2012;62(4):2296-314.Friston KJ. Schizophrenia and the 2. disconnection hypothesis. Acta Psychiatr Scand Suppl. 1999;395:68-79.Stephan KE, Friston KJ, Frith CD. 3. Dysconnection in schizophrenia: from abnormal synaptic plasticity to failures of self-monitoring. Schizophr Bull. 2009;35(3):509-27.Vijayakumar N, Bartholomeusz C, 4. Whitford T, Hermens DF, Nelson B, Rice S, et al. White matter integrity in individuals at ultra-high risk for psychosis: a systematic review and discussion of the role of polyunsaturated fatty acids. BMC Psychiatry. 2016;16(1):287.Jones DK, Knosche TR, Turner R. White 5. matter integrity, fi ber count, and other fallacies: the do’s and don’ts of diffusion MRI. Neuroimage. 2013;73:239-54.Basser PJ, Pierpaoli C. Microstructural 6. and physiological features of tissues elucidated by quantitative-diffusion-tensor MRI. 1996. J Magn Reson. 2011;213(2):560-70.Kikinis Z, Fitzsimmons J, Dunn C, Vu 7. MA, Makris N, Bouix S, et al. Anterior commissural white matter fi ber abnormalities in fi rst-episode psychosis: a tractography study. Schizophr Res. 2015;162(1-3):29-34.Reid MA, White DM, Kraguljac NV, Lahti 8. AC. A combined diffusion tensor imaging and magnetic resonance spectroscopy study of patients with schizophrenia. Schizophrenia Research. 2016;170(2-3):341-50.Scheel M, Prokscha T, Bayerl M, Gallinat 9. J, Montag C. Myelination defi cits in schizophrenia: evidence from diffusion tensor imaging. Brain structure & function. 2013;218(1):151-6.Ardekani BA, Tabesh A, Sevy S, Robinson 10. DG, Bilder RM, Szeszko PR. Diffusion tensor imaging reliably differentiates patients with schizophrenia from healthy volunteers. Hum Brain Mapp. 2011;32(1):1-9.Clark KA, Nuechterlein KH, Asarnow 11. RF, Hamilton LS, Phillips OR, Hageman NS, et al. Mean diffusivity and fractional
anisotropy as indicators of disease and genetic liability to schizophrenia. J Psychiatr Res. 2011;45(7):980-8.Zeng B, Ardekani BA, Tang Y, Zhang T, 12. Zhao S, Cui H, et al. Abnormal white matter microstructure in drug-naive fi rst episode schizophrenia patients before and after eight weeks of antipsychotic treatment. Schizophr Res. 2016;172(1-3):1-8.Lener MS, Wong E, Tang CY, Byne W, 13. Goldstein KE, Blair NJ, et al. White matter abnormalities in schizophrenia and schizotypal personality disorder. Schizophr Bull. 2015;41(1):300-10.Michael AM, Calhoun VD, Pearlson GD, 14. Baum SA, Caprihan A. Correlations of diffusion tensor imaging values and symptom scores in patients with schizophrenia. Conf Proc IEEE Eng Med Biol Soc. 2008;2008:5494-7.Michael AM, Calhoun VD, Pearlson GD, 15. Baum SA, Caprihan A. Correlations of diffusion tensor imaging values and symptom scores in patients with schizophrenia. Conf Proc IEEE Eng Med Biol Soc. 2008;2008:5494-7.Ellison-Wright I, Bullmore E. Meta-16. analysis of diffusion tensor imaging studies in schizophrenia. Schizophrenia research. 2009;108(1-3):3-10.Klauser P, Baker ST, Cropley VL, Bousman 17. C, Fornito A, Cocchi L, et al. White Matter Disruptions in Schizophrenia Are Spatially Widespread and Topologically Converge on Brain Network Hubs. Schizophr Bull. 2017;43(2):425-35.Wang Q, Su T-P, Zhou Y, Chou K-H, 18. Chen IY, Jiang T, et al. Anatomical insights into disrupted small-world networks in schizophrenia. Neuroimage. 2012;59(2):1085-93.Rubinov M, Bullmore E. Schizophrenia 19. and abnormal brain network hubs. Dialogues Clin Neurosci. 2013;15(3):339-49.van den Heuvel MP, Fornito A. 20. Brain networks in schizophrenia. Neuropsychol Rev. 2014;24(1):32-48.van den Heuvel MP, Mandl RC, Stam 21. CJ, Kahn RS, Hulshoff Pol HE. Aberrant frontal and temporal complex network structure in schizophrenia: a graph theoretical analysis. The Journal of neuroscience : the offi cial journal

5
147
MICROSTRUCTURE AND CONNECTIVITY IN SUBCLINICAL PSYCHOTIC EXPERIENCES
of the Society for Neuroscience. 2010;30(47):15915-26.Zhou Y, Fan L, Qiu C, Jiang T. Prefrontal 22. cortex and the dysconnectivity hypothesis of schizophrenia. Neurosci Bull. 2015;31(2):207-19.Latora V, Marchiori M. Economic small-23. world behavior in weighted networks. Eur Phys J B. 2003;32(2):249-63.Wang QF, Su TP, Zhou Y, Chou KH, 24. Chen IY, Jiang TZ, et al. Anatomical insights into disrupted small-world networks in schizophrenia. Neuroimage. 2012;59(2):1085-93.Yan H, Tian L, Wang Q, Zhao Q, Yue 25. W, Yan J, et al. Compromised small-world effi ciency of structural brain networks in schizophrenic patients and their unaffected parents. Neurosci Bull. 2015;31(3):275-87.Zhang Y, Lin L, Lin CP, Zhou Y, Chou 26. KH, Lo CY, et al. Abnormal topological organization of structural brain networks in schizophrenia. Schizophrenia research. 2012;141(2-3):109-18.Li F, Lui S, Yao L, Ji G-J, Liao W, Sweeney 27. JA, et al. Altered White Matter Connectivity Within and Between Networks in Antipsychotic-Naive First-Episode Schizophrenia. Schizophrenia Bull. 2018;44(2):409-18.Yeo RA, Ryman SG, van den Heuvel 28. MP, de Reus MA, Jung RE, Pommy J, et al. Graph Metrics of Structural Brain Networks in Individuals with Schizophrenia and Healthy Controls: Group Differences, Relationships with Intelligence, and Genetics. J Int Neuropsychol Soc. 2016;22(2):240-9.Skudlarski P, Jagannathan K, Anderson 29. K, Stevens MC, Calhoun VD, Skudlarska BA, et al. Brain connectivity is not only lower but different in schizophrenia: a combined anatomical and functional approach. Biological psychiatry. 2010;68(1):61-9.van der Gaag M, Smit F, Bechdolf A, 30. French P, Linszen DH, Yung AR, et al. Preventing a fi rst episode of psychosis: meta-analysis of randomized controlled prevention trials of 12 month and longer-term follow-ups. Schizophr Res. 2013;149(1-3):56-62.van Os J, Linscott RJ, Myin-Germeys 31. I, Delespaul P, Krabbendam L. A systematic review and meta-analysis of the psychosis continuum: evidence
for a psychosis proneness-persistence-impairment model of psychotic disorder. Psychol Med. 2009;39(2):179-95.DeRosse P, Karlsgodt KH. Examining 32. the Psychosis Continuum. Curr Behav Neurosci Rep. 2015;2(2):80-9.Fusar-Poli P, Borgwardt S, Bechdolf A, 33. Addington J, Riecher-Rossler A, Schultze-Lutter F, et al. The psychosis high-risk state: a comprehensive state-of-the-art review. JAMA Psychiatry. 2013;70(1):107-20.Grazioplene RG, Chavez RS, Rustichini A, 34. DeYoung CG. White matter correlates of psychosis-linked traits support continuity between personality and psychopathology. J Abnorm Psychol. 2016;125(8):1135-45.Koivukangas J, Bjornholm L, Tervonen O, 35. Miettunen J, Nordstrom T, Kiviniemi V, et al. Body mass index and brain white matter structure in young adults at risk for psychosis - The Oulu Brain and Mind Study. Psychiatry Res. 2016;254:169-76.Katagiri N, Pantelis C, Nemoto T, Zalesky 36. A, Hori M, Shimoji K, et al. A longitudinal study investigating sub-threshold symptoms and white matter changes in individuals with an ‘at risk mental state’ (ARMS). Schizophrenia research. 2015;162(1-3):7-13.van Dellen E, Bohlken MM, Draaisma 37. L, Tewarie PK, van Lutterveld R, Mandl R, et al. Structural Brain Network Disturbances in the Psychosis Spectrum. Schizophr Bull. 2016;42(3):782-9.Schmidt A, Crossley NA, Harrisberger 38. F, Smieskova R, Lenz C, Riecher-Rossler A, et al. Structural Network Disorganization in Subjects at Clinical High Risk for Psychosis. Schizophr Bull. 2017;43(3):583-91.Choi SH, Kyeong S, Cho KIK, Yun JY, 39. Lee TY, Park HY, et al. Brain network characteristics separating individuals at clinical high risk for psychosis into normality or psychosis. Schizophrenia research. 2017;190:107-14.Drakesmith M, Caeyenberghs K, Dutt A, 40. Zammit S, Evans CJ, Reichenberg A, et al. Schizophrenia-like topological changes in the structural connectome of individuals with subclinical psychotic experiences. Hum Brain Mapp. 2015;36(7):2629-43.Collin G, Scholtens LH, Kahn RS, 41. Hillegers MHJ, van den Heuvel MP. Affected Anatomical Rich Club and
Chapter 5
148
Structural-Functional Coupling in Young Offspring of Schizophrenia and Bipolar Disorder Patients. Biological psychiatry. 2017;82(10):746-55.van Os J, Verhagen S, Marsman A, 42. Peeters F, Bak M, Marcelis M, et al. The experience sampling method as an mHealth tool to support self-monitoring, self-insight, and personalized health care in clinical practice. Depress Anxiety. 2017;34(6):481-93.Stefanis NC, Hanssen M, Smirnis 43. NK, Avramopoulos DA, Evdokimidis IK, Stefanis CN, et al. Evidence that three dimensions of psychosis have a distribution in the general population. Psychological medicine. 2002;32(2):347-58.Montgomery SA, Asberg M. A new 44. depression scale designed to be sensitive to change. Br J Psychiatry. 1979;134:382-9.McGorry PD, Hickie IB, Yung AR, 45. Pantelis C, Jackson HJ. Clinical staging of psychiatric disorders: a heuristic framework for choosing earlier, safer and more effective interventions. Aust N Z J Psychiatry. 2006;40(8):616-22.WHO. Composite International 46. Diagnostic Interview (CIDI). Geneva: World Health Organization; 1990.Delespaul P. Assessing Schizophrenia 47. in Daily Life: The Experience Sampling Method. Maastricht: Maastricht University Medical Centre; 1995.Delespaul P. Assessing Schizophrenia in 48. Daily Life. Maastricht: Universitaire Pers Maastricht; 1995.Rorden C, Brett M. Stereotaxic display 49. of brain lesions. Behavioural neurology. 2000;12(4):191-200.Leemans A, Jones DK. The B-Matrix Must 50. Be Rotated When Correcting for Subject Motion in DTI Data. Magn Reson Med. 2009;61(6):1336-49.Irfanoglu MO, Walker L, Sarlls J, 51. Marenco S, Pierpaoli C. Effects of image distortions originating from susceptibility variations and concomitant fi elds on diffusion MRI tractography results. Neuroimage. 2012;61(1):275-88.Klein S, Staring M, Murphy K, Viergever 52. MA, Pluim JPW. elastix: a toolbox for intensity-based medical image registration. IEEE Trans Med Imaging. 2010;29(1):196-205.Chang L-C, Jones DK, Pierpaoli C. 53.
RESTORE: robust estimation of tensors by outlier rejection. Magn Reson Med. 2005;53(5):1088-95.Basser PJ, Pajevic S, Pierpaoli C, Duda J, 54. Aldroubi A. In vivo fi ber tractography using DT-MRI data. Magn Reson Med. 2000;44(4):625-32.Smith SM, Jenkinson M, Johansen-Berg H, 55. Rueckert D, Nichols TE, Mackay CE, et al. Tract-based spatial statistics: voxelwise analysis of multi-subject diffusion data. Neuroimage. 2006;31(4):1487-505.Winkler AM, Ridgway GR, Webster 56. MA, Smith SM, Nichols TE. Permutation inference for the general linear model. Neuroimage. 2014;92:381-97.Cookey J, Bernier D, Tibbo PG. 57. White matter changes in early phase schizophrenia and cannabis use: an update and systematic review of diffusion tensor imaging studies. Schizophrenia research. 2014;156(2-3):137-42.Salimi-Khorshidi G, Smith SM, Nichols TE. 58. Adjusting the effect of nonstationarity in cluster-based and TFCE inference. Neuroimage. 2011;54(3):2006-19.Mori S, Oishi K, Jiang H, Jiang L, Li X, 59. Akhter K, et al. Stereotaxic white matter atlas based on diffusion tensor imaging in an ICBM template. Neuroimage. 2008;40(2):570-82.Team RDC. R: A language and 60. environment for statistical computing. In: R Foundation for Statistical Computing V, Austria, editor. 2008.Tzourio-Mazoyer N, Landeau B, 61. Papathanassiou D, Crivello F, Etard O, Delcroix N, et al. Automated anatomical labeling of activations in SPM using a macroscopic anatomical parcellation of the MNI MRI single-subject brain. Neuroimage. 2002;15(1):273-89.Rubinov M, Sporns O. Complex network 62. measures of brain connectivity: uses and interpretations. Neuroimage. 2010;52(3):1059-69.Koivukangas J, Bjornholm L, Tervonen 63. O, Miettunen J, Nordstrom T, Kiviniemi V, et al. White matter structure in young adults with familial risk for psychosis - The Oulu Brain and Mind Study. Psychiatry Res. 2015;233(3):388-93.van Os J, Guloksuz S. A critique of 64. the “ultra-high risk” and “transition” paradigm. World Psychiatry. 2017;16(2):200-6.Koutsouleris N, Meisenzahl EM, 65.

5
149
MICROSTRUCTURE AND CONNECTIVITY IN SUBCLINICAL PSYCHOTIC EXPERIENCES
Borgwardt S, Riecher-Rossler A, Frodl T, Kambeitz J, et al. Individualized differential diagnosis of schizophrenia and mood disorders using neuroanatomical biomarkers. Brain. 2015;138(Pt 7):2059-73.Zhao X, Tian L, Yan J, Yue W, Yan H, Zhang 66. D. Abnormal Rich-Club Organization Associated with Compromised Cognitive Function in Patients with Schizophrenia and Their Unaffected Parents. Neurosci Bull. 2017;33(4):445-54.Cohen AS, Davis TE, 3rd. Quality of life 67. across the schizotypy spectrum: fi ndings from a large nonclinical adult sample. Compr Psychiatry. 2009;50(5):408-14.Levitt JJ, Nestor PG, Levin L, Pelavin P, Lin 68. P, Kubicki M, et al. Reduced Structural Connectivity in Frontostriatal White Matter Tracts in the Associative Loop in Schizophrenia. Am J Psychiatry. 2017;174(11):1102-11.Piskulic D, Addington J, Cadenhead KS, 69. Cannon TD, Cornblatt BA, Heinssen R, et al. Negative symptoms in individuals at clinical high risk of psychosis. Psychiatry Res. 2012;196(2-3):220-4.Yung AR, McGorry PD. The initial 70. prodrome in psychosis: descriptive and qualitative aspects. Aust N Z J Psychiatry. 1996;30(5):587-99.Blair MA, Nitzburg G, DeRosse P, 71. Karlsgodt KH. Relationship between executive function, attachment style, and psychotic like experiences in typically developing youth. Schizophrenia research. 2018.Collin G, Kahn RS, de Reus MA, Cahn 72. W, van den Heuvel MP. Impaired rich club connectivity in unaffected siblings of schizophrenia patients. Schizophr Bull. 2014;40(2):438-48.

Chapter 5
150
Supplementary material
Table 1. CAPE positive symptom frequency score associations with local effi ciency in the PE-group. The estimates, uncorrected p-values and Bonferroni corrected p-values are provided per region of interest. L=left, R=right.Region of interest estimate p-value p-value correctedPrecentral L -0,0015 0,16 1Precentral R 0,0006 0,55 1Frontal Superior L 0,0004 0,81 1Frontal Superior R 0,0013 0,19 1Frontal Superior Orbital L 0,0001 0,98 1Frontal Superior Orbital R 0,0012 0,50 1Frontal Middle L -0,0014 0,27 1Frontal Middle R -0,0010 0,49 1Frontal Middle Orbital L 0,0016 0,39 1Frontal Middle Orbital R 0,0018 0,17 1Frontal Inferior Oper L -0,0027 0,43 1Frontal Inferior Oper R -0,0036 0,00 0,18Frontal Inferior Pars Triangularis L -0,0038 0,08 1Frontal Inferior Pars Triangularis R -0,0043 0,03 1Frontal Inferior Orbital L -0,0002 0,88 1Frontal Inferior Orbital R 0,0027 0,10 1Rolandic Oper L -0,0028 0,05 1Rolandic Oper R -0,0046 0,09 1Supplemenatry Motor Area L -0,0002 0,90 1Supplemenatry Motor Area R 0,0005 0,78 1Olfactory L 0,0001 0,97 1Olfactory R 0,0009 0,47 1Frontal Superior Medial L 0,0010 0,50 1Frontal Superior Medial R 0,0003 0,81 1Frontal Medial Orbital L -0,0027 0,10 1Frontal Medial Orbital R -0,0006 0,62 1Rectus L -0,0007 0,72 1Rectus R 0,0006 0,62 1Insula L -0,0028 0,01 0,63Insula R 0,0002 0,85 1Cingulum Anterios L -0,0008 0,53 1Cingulum Anterios R -0,0002 0,91 1Cingulum Middle L -0,0007 0,70 1Cingulum Middle R -0,0008 0,44 1Cingulum Posterior L -0,0007 0,66 1Cingulum Posterior R -0,0008 0,69 1Hippocampus L 0,0002 0,92 1Hippocampus R 0,0006 0,85 1ParaHippocampal L 0,0002 0,89 1ParaHippocampal R 0,0019 0,62 1Amygdala L 0,0004 0,76 1Amygdala R 0,0020 0,24 1

5
151
MICROSTRUCTURE AND CONNECTIVITY IN SUBCLINICAL PSYCHOTIC EXPERIENCES
Region of interest estimate p-value p-value correctedCalcarine L 0,0021 0,03 1Calcarine R 0,0005 0,80 1Cuneus L 0,0025 0,03 1Cuneus R 0,0031 0,00 0,40Lingual L 0,0023 0,03 1Lingual R 0,0023 0,22 1Occipital Superior L 0,0013 0,18 1Occipital Superior R 0,0008 0,65 1Occipital Middle L 0,0024 0,14 1Occipital Middle R 0,0005 0,70 1Occipital Inferior L 0,0004 0,79 1Occipital Inferior R -0,0006 0,71 1Fusiform L 0,0005 0,67 1Fusiform R 0,0028 0,41 1Postcentral L -0,0028 0,04 1Postcentral R 0,0002 0,91 1Parietal Superior L -0,0014 0,52 1Parietal Superior R 0,0008 0,57 1Parietal Inferior L -0,0008 0,63 1Parietal Inferior R -0,0013 0,34 1SupraMarginal L -0,0023 0,46 1SupraMarginal R -0,0002 0,93 1Angular L -0,0023 0,20 1Angular R -0,0025 0,49 1Precuneus L -0,0005 0,72 1Precuneus R 0,0003 0,84 1Paracentral Lobule L -0,0004 0,75 1Paracentral Lobule R 0,0006 0,73 1Caudate L -0,0001 0,95 1Caudate R 0,0011 0,56 1Putamen L -0,0014 0,25 1Putamen R 0,0013 0,22 1Pallidum L -0,0006 0,62 1Pallidum R -0,0008 0,62 1Thalamus L -0,0005 0,74 1Thalamus R -0,0003 0,84 1Heschl L 0,0005 0,68 1Heschl R -0,0054 0,01 0,70Temporal Superior L -0,0025 0,19 1Temporal Superior R -0,0024 0,19 1TemporalPole Superior L -0,0004 0,90 1TemporalPole Superior R 0,0026 0,15 1Temporal Middle L -0,0011 0,76 1Temporal Middle R 0,0007 0,52 1TemporalPole Middle L 0,0015 0,35 1TemporalPole Middle R 0,0032 0,00 0,14Temporal Inferior L 0,0001 0,96 1Temporal Inferior R 0,0012 0,28 1

Chapter 5
152
Table 2. CAPE positive symptom frequency score associations with clustering coeffi cient in the PE-group. The estimates, uncorrected p-values and Bonferroni corrected p-values are provided per region of interest.
Region of interest estimate p-value p-value correctedPrecentral L -0,0010 0,39 1Precentral R 0,0008 0,48 1Frontal Superior L 0,0005 0,80 1Frontal Superior R 0,0012 0,26 1Frontal Superior Orbital L 0,0000 0,99 1Frontal Superior Orbital R 0,0009 0,63 1Frontal Middle L -0,0014 0,28 1Frontal Middle R -0,0005 0,75 1Frontal Middle Orbital L 0,0010 0,62 1Frontal Middle Orbital R 0,0015 0,30 1Frontal Inferior Oper L -0,0012 0,73 1Frontal Inferior Oper R -0,0028 0,03 1Frontal Inferior Pars Triangularis L -0,0035 0,12 1Frontal Inferior Pars Triangularis R -0,0038 0,07 1Frontal Inferior Orbital L -0,0005 0,71 1Frontal Inferior Orbital R 0,0023 0,17 1Rolandic Oper L -0,0017 0,24 1Rolandic Oper R -0,0034 0,22 1Supplemenatry Motor Area L 0,0000 0,99 1Supplemenatry Motor Area R 0,0002 0,92 1Olfactory L 0,0001 0,98 1Olfactory R 0,0009 0,53 1Frontal Superior Medial L 0,0009 0,57 1Frontal Superior Medial R 0,0002 0,90 1Frontal Medial Orbital L -0,0034 0,05 1Frontal Medial Orbital R -0,0011 0,39 1Rectus L -0,0007 0,73 1Rectus R 0,0002 0,86 1Insula L -0,0027 0,02 1Insula R -0,0001 0,92 1Cingulum Anterios L -0,0009 0,49 1Cingulum Anterios R -0,0007 0,68 1Cingulum Middle L -0,0014 0,45 1Cingulum Middle R -0,0013 0,28 1Cingulum Posterior L -0,0012 0,48 1Cingulum Posterior R -0,0008 0,69 1Hippocampus L 0,0000 0,99 1Hippocampus R 0,0005 0,89 1ParaHippocampal L 0,0003 0,88 1ParaHippocampal R 0,0021 0,59 1Amygdala L 0,0004 0,77 1Amygdala R 0,0016 0,35 1Calcarine L 0,0021 0,05 1Calcarine R 0,0009 0,69 1

5
153
MICROSTRUCTURE AND CONNECTIVITY IN SUBCLINICAL PSYCHOTIC EXPERIENCES
Region of interest estimate p-value p-value correctedCuneus L 0,0025 0,04 1Cuneus R 0,0041 0,00 0,06Lingual L 0,0022 0,05 1Lingual R 0,0024 0,21 1Occipital Superior L 0,0012 0,24 1Occipital Superior R 0,0007 0,73 1Occipital Middle L 0,0021 0,21 1Occipital Middle R 0,0004 0,78 1Occipital Inferior L 0,0010 0,54 1Occipital Inferior R 0,0001 0,93 1Fusiform L 0,0009 0,51 1Fusiform R 0,0029 0,40 1Postcentral L -0,0022 0,12 1Postcentral R 0,0002 0,93 1Parietal Superior L -0,0009 0,69 1Parietal Superior R 0,0008 0,62 1Parietal Inferior L -0,0003 0,88 1Parietal Inferior R -0,0014 0,32 1SupraMarginal L -0,0018 0,58 1SupraMarginal R 0,0005 0,80 1Angular L -0,0022 0,23 1Angular R -0,0029 0,43 1Precuneus L -0,0005 0,73 1Precuneus R 0,0005 0,79 1Paracentral Lobule L 0,0000 0,98 1Paracentral Lobule R 0,0008 0,62 1Caudate L -0,0002 0,90 1Caudate R 0,0008 0,66 1Putamen L -0,0014 0,28 1Putamen R 0,0010 0,37 1Pallidum L -0,0007 0,63 1Pallidum R -0,0010 0,56 1Thalamus L -0,0006 0,70 1Thalamus R -0,0006 0,72 1Heschl L 0,0008 0,53 1Heschl R -0,0032 0,13 1Temporal Superior L -0,0024 0,21 1Temporal Superior R -0,0023 0,23 1TemporalPole Superior L -0,0005 0,89 1TemporalPole Superior R 0,0026 0,17 1Temporal Middle L -0,0009 0,81 1Temporal Middle R 0,0004 0,74 1TemporalPole Middle L 0,0013 0,46 1TemporalPole Middle R 0,0028 0,01 0,95Temporal Inferior L 0,0002 0,89 1Temporal Inferior R 0,0010 0,40 1

Chapter 5
154
Table 3. CAPE positive symptom distress score associations with local effi ciency in the PE-group. The estimates, uncorrected p-values and Bonferroni corrected p-values are provided per region of interest.
Region of interest estimate p-value p-value correctedPrecentral L -0,0015 0,18 1Precentral R 0,0014 0,21 1Frontal Superior L 0,0011 0,57 1Frontal Superior R 0,0008 0,44 1Frontal Superior Orbital L -0,0005 0,79 1Frontal Superior Orbital R 0,0018 0,36 1Frontal Middle L -0,0011 0,39 1Frontal Middle R -0,0008 0,61 1Frontal Middle Orbital L 0,0015 0,45 1Frontal Middle Orbital R 0,0014 0,29 1Frontal Inferior Oper L -0,0028 0,43 1Frontal Inferior Oper R -0,0028 0,02 1Frontal Inferior Pars Triangularis L -0,0017 0,46 1Frontal Inferior Pars Triangularis R -0,0024 0,25 1Frontal Inferior Orbital L -0,0012 0,39 1Frontal Inferior Orbital R 0,0026 0,12 1Rolandic Oper L -0,0037 0,01 0,86Rolandic Oper R -0,0050 0,07 1Supplemenatry Motor Area L 0,0007 0,71 1Supplemenatry Motor Area R 0,0003 0,86 1Olfactory L 0,0015 0,72 1Olfactory R 0,0017 0,22 1Frontal Superior Medial L 0,0006 0,69 1Frontal Superior Medial R 0,0001 0,96 1Frontal Medial Orbital L -0,0033 0,05 1Frontal Medial Orbital R 0,0007 0,53 1Rectus L -0,0003 0,86 1Rectus R 0,0016 0,24 1Insula L -0,0026 0,02 1Insula R 0,0007 0,62 1Cingulum Anterios L 0,0003 0,84 1Cingulum Anterios R 0,0006 0,72 1Cingulum Middle L 0,0004 0,82 1Cingulum Middle R -0,0005 0,66 1Cingulum Posterior L -0,0004 0,80 1Cingulum Posterior R -0,0002 0,94 1Hippocampus L 0,0008 0,69 1Hippocampus R 0,0008 0,83 1ParaHippocampal L 0,0013 0,49 1ParaHippocampal R 0,0009 0,81 1Amygdala L 0,0010 0,44 1Amygdala R 0,0024 0,16 1Calcarine L 0,0021 0,03 1Calcarine R 0,0014 0,54 1

5
155
MICROSTRUCTURE AND CONNECTIVITY IN SUBCLINICAL PSYCHOTIC EXPERIENCES
Region of interest estimate p-value p-value correctedCuneus L 0,0024 0,04 1Cuneus R 0,0033 0,00 0,40Lingual L 0,0019 0,08 1Lingual R 0,0021 0,29 1Occipital Superior L 0,0010 0,33 1Occipital Superior R 0,0018 0,35 1Occipital Middle L 0,0020 0,23 1Occipital Middle R 0,0021 0,13 1Occipital Inferior L 0,0031 0,04 1Occipital Inferior R -0,0004 0,84 1Fusiform L 0,0010 0,46 1Fusiform R 0,0025 0,48 1Postcentral L -0,0020 0,14 1Postcentral R 0,0007 0,75 1Parietal Superior L -0,0007 0,74 1Parietal Superior R 0,0011 0,47 1Parietal Inferior L -0,0002 0,93 1Parietal Inferior R -0,0002 0,89 1SupraMarginal L -0,0012 0,70 1SupraMarginal R 0,0009 0,66 1Angular L 0,0000 0,99 1Angular R -0,0013 0,73 1Precuneus L -0,0003 0,83 1Precuneus R 0,0004 0,82 1Paracentral Lobule L 0,0007 0,58 1Paracentral Lobule R 0,0014 0,40 1Caudate L 0,0004 0,79 1Caudate R 0,0014 0,47 1Putamen L -0,0008 0,51 1Putamen R 0,0019 0,08 1Pallidum L -0,0006 0,66 1Pallidum R 0,0001 0,96 1Thalamus L -0,0006 0,68 1Thalamus R 0,0001 0,95 1Heschl L 0,0015 0,21 1Heschl R -0,0052 0,01 1Temporal Superior L -0,0020 0,29 1Temporal Superior R -0,0021 0,27 1TemporalPole Superior L -0,0011 0,76 1TemporalPole Superior R 0,0031 0,10 1Temporal Middle L -0,0013 0,73 1Temporal Middle R 0,0008 0,50 1TemporalPole Middle L 0,0014 0,41 1TemporalPole Middle R 0,0040 0,00 0,01Temporal Inferior L -0,0005 0,78 1Temporal Inferior R 0,0015 0,18 1

Chapter 5
156
Table 4. CAPE positive symptom distress score associations with clustering coeffi cient in the PE-group. The estimates, uncorrected p-values and Bonferroni corrected p-values are provided per region of interest.
Region of interest estimate p-value p-value correctedPrecentral L -0,0010 0,43 1Precentral R 0,0016 0,18 1Frontal Superior L 0,0013 0,53 1Frontal Superior R 0,0008 0,45 1Frontal Superior Orbital L -0,0005 0,83 1Frontal Superior Orbital R 0,0018 0,38 1Frontal Middle L -0,0009 0,52 1Frontal Middle R -0,0002 0,93 1Frontal Middle Orbital L 0,0012 0,55 1Frontal Middle Orbital R 0,0014 0,33 1Frontal Inferior Oper L -0,0011 0,75 1Frontal Inferior Oper R -0,0021 0,11 1Frontal Inferior Pars Triangularis L -0,0016 0,50 1Frontal Inferior Pars Triangularis R -0,0019 0,38 1Frontal Inferior Orbital L -0,0013 0,41 1Frontal Inferior Orbital R 0,0026 0,14 1Rolandic Oper L -0,0028 0,07 1Rolandic Oper R -0,0037 0,20 1Supplemenatry Motor Area L 0,0012 0,56 1Supplemenatry Motor Area R 0,0001 0,97 1Olfactory L 0,0015 0,71 1Olfactory R 0,0017 0,24 1Frontal Superior Medial L 0,0009 0,59 1Frontal Superior Medial R 0,0000 0,97 1Frontal Medial Orbital L -0,0040 0,02 1Frontal Medial Orbital R 0,0004 0,78 1Rectus L -0,0003 0,89 1Rectus R 0,0014 0,31 1Insula L -0,0023 0,06 1Insula R 0,0006 0,68 1Cingulum Anterios L 0,0001 0,95 1Cingulum Anterios R 0,0001 0,98 1Cingulum Middle L -0,0002 0,92 1Cingulum Middle R -0,0010 0,42 1Cingulum Posterior L -0,0007 0,71 1Cingulum Posterior R -0,0001 0,96 1Hippocampus L 0,0009 0,67 1Hippocampus R 0,0009 0,80 1ParaHippocampal L 0,0012 0,53 1ParaHippocampal R 0,0014 0,73 1Amygdala L 0,0010 0,50 1Amygdala R 0,0025 0,16 1Calcarine L 0,0024 0,03 1Calcarine R 0,0020 0,39 1

5
157
MICROSTRUCTURE AND CONNECTIVITY IN SUBCLINICAL PSYCHOTIC EXPERIENCES
Region of interest estimate p-value p-value correctedCuneus L 0,0028 0,03 1Cuneus R 0,0043 0,00 0,05Lingual L 0,0022 0,06 1Lingual R 0,0023 0,27 1Occipital Superior L 0,0010 0,36 1Occipital Superior R 0,0020 0,31 1Occipital Middle L 0,0020 0,25 1Occipital Middle R 0,0024 0,10 1Occipital Inferior L 0,0042 0,01 0,75Occipital Inferior R 0,0009 0,62 1Fusiform L 0,0015 0,30 1Fusiform R 0,0025 0,49 1Postcentral L -0,0016 0,28 1Postcentral R 0,0006 0,78 1Parietal Superior L -0,0003 0,91 1Parietal Superior R 0,0012 0,43 1Parietal Inferior L 0,0003 0,85 1Parietal Inferior R 0,0001 0,96 1SupraMarginal L -0,0007 0,85 1SupraMarginal R 0,0014 0,50 1Angular L -0,0002 0,91 1Angular R -0,0013 0,74 1Precuneus L -0,0002 0,92 1Precuneus R 0,0006 0,72 1Paracentral Lobule L 0,0008 0,55 1Paracentral Lobule R 0,0014 0,41 1Caudate L 0,0004 0,78 1Caudate R 0,0014 0,49 1Putamen L -0,0007 0,59 1Putamen R 0,0019 0,11 1Pallidum L -0,0005 0,74 1Pallidum R 0,0002 0,89 1Thalamus L -0,0005 0,72 1Thalamus R 0,0001 0,94 1Heschl L 0,0015 0,23 1Heschl R -0,0031 0,16 1Temporal Superior L -0,0019 0,35 1Temporal Superior R -0,0018 0,36 1TemporalPole Superior L -0,0008 0,84 1TemporalPole Superior R 0,0034 0,08 1Temporal Middle L -0,0009 0,82 1Temporal Middle R 0,0008 0,54 1TemporalPole Middle L 0,0015 0,41 1TemporalPole Middle R 0,0039 0,00 0,05Temporal Inferior L -0,0001 0,96 1Temporal Inferior R 0,0017 0,16 1


CH
APT
ERSixACCEPTANCE AND COMMITMENT THERAPY AND WHITE MATTER PLASTICITY IN INDIVIDUALS
WITH SUBCLINICAL PSYCHOTIC EXPERIENCES: A RANDOMISED
CONTROLLED TRIAL
Stijn Michielse, Jindra Bakker, Iris Lange, Tim Batink, Liesbet Goossens, Marieke Wichers, Ritsaert Lieverse, Inez Myin-Germeys, Koen Schruers, Therese van Amelsvoort, Wolfgang Viechtbauer, Jim van Os, Machteld Marcelis
Submitted for publication

Chapter 6
160
AbstractBackground: Research indicates that Acceptance and commitment therapy (ACT) is effective in reducing symptoms of depression, anxiety and psychosis. During adolescence, vulnerability to psychopathology peaks, creating a window for early interventions. This study aims to examine microstructural white matter before and after ACT versus a control intervention in youngsters with mild psychopathology, as well as white matter-symptom associations.Methods: Forty-fi ve individuals with mild psychopathology were randomly and double-blinded allocated to a fi ve-week intervention (ACT (n=20)) or control condition (topic discussion (TD, n=25)). Symptomatology was assessed with the Community Assessment of Psychic Experiences (CAPE), Montgomery–Åsberg Depression Rating Scale (MADRS) and at the momentary level in daily life with the Experience Sampling Method (ESM). Diffusion Weighted Imaging (DWI) and network-connectivity parameters were obtained and compared before and after the intervention/control condition. Interactions between microstructural white matter change and condition were examined in models of CAPE positive symptoms and ESM subclinical psychotic experiences (PE)) as well as in models of mood alterations (MADRS depression score and ESM negative affect (NA) levels).Results: ACT, compared to TD, was associated with a decrease in MADRS depressive symptoms (B=-5.08 p=0.03), no change in NA level (B=-0.31, p=0.24), no change in CAPE positive symptom level (frequency; B=0.38, p=0.54, distress; B=0.0007, 0.99) and an increase in PE level (B=0.33, p=0.03). There was no signifi cant change in DWI or network connectivity in either condition and no signifi cant difference between both conditions. There were no signifi cant interactions between DWI parameters and condition in the models of the CAPE positive symptoms, MADRS and PE. In the model of NA, several regional interactions between condition and network measures were signifi cant, but stratifi cation per condition provided no signifi cant associations.Conclusion: The fi ndings suggest that behavioral (symptom) changes are more sensitive to a fi ve-week psychological training than microstructural white matter changes which did not show signifi cant changes over time. Besides a signifi cant decrease in depressive symptoms, a small increase in PE in response to ACT was reported, while other CAPE subclinical psychosis symptoms remained unchanged, possibly indicating that participants in the ACT intervention became more aware of themselves and the environment.
6
161
ACT AND WHITE MATTER PLASTICITY: AN RCT
IntroductionMRI studies in humans have shown that white matter volume steadily increases from childhood into adolescence, accompanied by changes in Diffusion Weighted Imaging (DWI) parameters, suggesting that maturation of axons/myelin sheaths represents an ongoing (developmental) process (1). In addition, studies on human brain development have shown that myelination of axons follows a chronological order, with prefrontal axonal myelination maturing the latest, proceeding well into adolescence (2). DWI may be a valuable instrument to detect structural white matter dysconnectivity alterations over time and describe white matter plasticity using parameters such as Fractional Anisotropy (FA; white matter ‘integrity’), Axial Diffusivity (AXD; number of axons), Radial Diffusivity (RAD; a measure for water diffusion perpendicular to the white matter tracts and a potential marker for myelin content) and Mean Diffusivity (MD; free water movement) (3). The presence of structural dysconnectivity has been shown in depression (3) and psychotic disorder (4) and this may even be detectable in early stages of the illness (5), and associated cognitive/behavioral alterations (6). This raises the question to what degree such structural alterations can be altered by non-pharmacological training. It seems that even slight but powerful everyday life experiences can affect brain structure as demonstrated by an interventional study on a complex whole-body balancing task in which participants learned new balancing skills which resulted in decreased FA in prefrontal white matter (7). How white matter contributes to learning is unclear, but it is plausible that changes in impulse transmission through spatially distinct, but functionally related regions, may be an important aspect of learning (8). So-called third generation psychotherapies for mental disorders are on the rise, of which Acceptance and Commitment Therapy (ACT) (9) has been extensively investigated. In ACT, a stressing thought is accepted as a thought and then defused. ACT comprises three techniques: mindfulness (including defusion), acceptance, and commitment to value-based living. Overall, the aim of ACT is to alter the psychological relationship between thoughts, feelings and sensations to stimulate and increase the individuals’ psychological fl exibility (9). Randomized controlled trials (RCT) have shown an effect size of 0.68 in favor of the ACT intervention in samples with clinical anxiety, depression and psychotic disorder (10). In a meta-analysis on individuals with psychotic disorder, ACT was shown to reduce positive symptoms and hospitalization over time (11), to reduce distress related to hallucinations in psychotic disorder (12) and to improve emotional functioning reducing the number of crisis contacts after treatment (13).

Chapter 6
162
The application of ACT in individuals with major depression with psychotic features led to sustained improvements in depressive and psychotic symptoms as well as improved psychosocial functioning (14). There may also be benefi t in depression with social anxiety, research showing improved quality of life, less depressive symptoms and less anxiety following ACT (15). Taken together, ACT has the potential to be a cost-effi cient, feasible and acceptable intervention. It is attractive to hypothesize that when ACT is provided as an early intervention in samples showing early, mild expression of psychopathology, symptoms may be reduced. There is some evidence that points towards the effectiveness of ACT to reduce subclinical depressive symptomatology in student populations via both regular therapy programs (16-21) as well as online interventions (22, 23). To date, however, its effectiveness in individuals with subclinical psychotic experiences remains unknown.In addition, very little is known about psychological training/therapy effects on white matter plasticity. A longitudinal study in healthy students showed decreased RAD and AXD accompanied by increased FA after a 4-week integrative body-mind training compared to a relaxation training (24). Furthermore, in the longer term, experienced mindfulness meditators showed increased FA compared to meditation-naïve controls (25-27).The current RCT examines symptomatology, structural DWI white matter and network-connectivity changes from pretreatment as a result of 6-week ACT in comparison with a control condition in individuals with subclinical symptoms of depression and psychotic experiences. Symptoms (Community Assessment of Psychic Experiences (CAPE) positive symptoms and associated distress, Montgomery–Åsberg Depression Rating Scale (MADRS) and Negative Affect (NA)) were previously investigated in this sample (28) and the current paper extends research based on these outcomes. ACT was applied in part through the Experience Sampling Method (ESM), as described previously (29). ESM is a structured electronic self-monitoring technique to assess momentary mental state and context in people’s daily living environment, yielding prospective and ecologically valid data (30-32). ESM-based interventions provide the individual with ACT exercises through the electronic device or application, taking the therapy beyond the treatment session with a therapist into daily life. In this way, ACT thus becomes more integrated in daily life with personal fl exibility to perform an exercise if a person wishes to do so in the moment (29). We hypothesized that ACT would impact symptom measures more than TD. Also, it was hypothesized that FA would increase, AXD would remain unchanged and RAD would decrease in response to the ACT intervention

6
163
ACT AND WHITE MATTER PLASTICITY: AN RCT
compared to the control condition. This was investigated from a whole-brain perspective, with the use of global and regions of interest (ROI) measures, corrected for multiple testing. Network connectivity alterations as a result of the ACT intervention were also examined and it was hypothesized that the intervention would increase network effi ciency and clustering. Symptom change over time (based on CAPE positive scores, MADRS and daily life subclinical psychotic experiences (PE)) were investigated and associated with microstructural regional changes in subsequent analyses. As individuals were selected on the basis of level of subclinical positive and depressive symptoms, the effect of the psychological intervention on these two (interviewer-based and self-reported) symptom dimensions were a priori selected as most relevant. Lastly, it was investigated whether the DWI parameter change was predictive of symptom change, and whether these associations were different between the two conditions.
MethodsThis RCT took place at Maastricht University, The Netherlands, as part of the Smartscan project (Dutch Trial Register Number: NTR3808). The white matter imaging part was an add-on and specifi cially investigated the link between symptoms and white matter alterations as a result of the intervention. The study comprised individuals who were between 16-25 years of age with subclinical psychotic experiences (PE) and subclinical depressive symptoms recruited in the area within Maastricht and neighbouring cities. The criteria for inclusion were defi ned using the Community Assessment of Psychic Experiences (CAPE (33)) positive symptom subscale frequency score ≥10 and/or the positive symptom subscale distress score ≥2. Participants with a Montgomery–Åsberg Depression Rating Scale (MADRS) score ≥10 (34) who met the subclinical PE inclusion criteria were also included. Exclusion criteria were current psychological or psychiatric treatment, signifi cant need for care (as discussed in consensus meetings after the screening), left-handedness and a history of neurological disorder (e.g. severe brain injury with unconsciousness, meningitis, migraine or epilepsy). Other exclusion criteria were MRI contraindications (e.g. diabetes and claustrophobia), participants with implanted ferromagnetic materials or (suspected) pregnancy in female participants. The local medical ethics committee approved this study according to the declaration of Helsinki. All participants gave written informed consent in person or additionally via a proxy (parent) when <18 years of age.

Chapter 6
164
Trial designThe RCT was designed as a double-blinded (participants and researchers) intervention. Equal random block allocation to the conditions was done independently from the researchers via a statistician ensuring blinding. The procedure was executed via preparation of lists using a computer-generated random table. A total of 55 participants were included in the RCT and were assigned to a group to attend the weekly training sessions during fi ve weeks (on average 5 participants per training group). The active and control condition were, respectively, the Acceptance and Commitment Therapy (ACT) and a topical discussion group (TD). The ACT-condition followed a specifi c protocol during fi ve weekly meetings according to the guidelines entitled “Get Out Of Your Mind And Into Your Life”, in Dutch (35). The ACT-condition and TD-condition are described in more detail in the supplementary materials and a previous paper on the intervention study (28).
Demographics and symptom measuresThe level of education was defi ned by the accomplished level of education ranging from 0 (no education) to 7 (master degree). Lifetime cannabis and other drug use was assessed with the Composite International Diagnostic Interview (CIDI) section L (36). Lifetime use was calculated by multiplying the frequency per week times the number of weeks of used. Subclinical symptom scores were contructed using the self-report CAPE questionnaire using four dimensions; positive (range 0 – 60), negative (range 0 – 42), depressive (range 0 – 24) and total (range 0 – 126), with both frequency and distress scores calculated per dimension. In addition, the MADRS total score (range 0 – 60) was used to assess subclinical depressive symptoms (34). MADRS was administered by interview, assessing sadness, inner tension, reduced sleep, reduced appetite, concentration diffi culties, lassitude, inability to feel, pessimistic thoughts and suicidal thoughts during the last week (37). A trained interviewer conducted the interviews under supervision of a psychiatrist.
ESM data collection and analysisThe Experience Sampling Method (ESM) allows for daily life assessment of mental states and behaviour using the PsyMate (an electronic device with a touchscreen to store answers). The ESM assessment comprised 40 days of self-monitoring: fi rst, 15 consecutive days before the intervention, then three days per week during the fi ve week intervention period (self-monitoring and ACT-based exercises) and, lastly, seven days after the intervention. At ten

6
165
ACT AND WHITE MATTER PLASTICITY: AN RCT
random moments during the day, the PsyMate signalled a beep, at which the ESM questionnaire had to be fi lled in within 15 minutes after the beep. Data were included for analyses if >30% of completed beep questionnaires were available (in the current study >45 out of 150 beep moments (baseline) and >21 out of 70 beep moments (post-intervention), conform earlier work (38). Items for assessing subclinical PE in daily life were ‘I feel suspicious’ and ‘I feel unreal’. These items were highly correlated (r=0.87) and therefore averaged and named ‘PE-score’. The PE-score per participant was calculated per time point before and after intervention. Similarly, negative affect (NA) was assessed by calculating the average of the items ‘Feeling down’, ‘Feeling insecure’, ‘Feeling lonely’, ‘Feeling anxious’ and ‘Feeling guilty’. NA per participant per time point was assessed before and after intervention). All items were quantifi ed on 7-point Likert scales (ranging from 1=not at all to 7=very).
MRI acquisition and processingThe MRI scans were acquired on a 3T Siemens Magnetom Prisma system (Siemens, Erlangen, Germany) equipped with a 64-channel head/neck coil at Scannexus, Maastricht, The Netherlands. Anatomical T1-weighted whole brain images were acquired at a 1.0mm x 1.0mm x 1.0mm resolution. Diffusion Weighted Imaging (DWI) scans were acquired at 2mm x 2mm x 2mm resolution using 119 directions. Data were processed in ExploreDTI (39) and included the application of Robust Estimation of Tensors by Outlier Rejection (RESTORE) algorithm to estimate the diffusion tensors (40). This provided maps of FA, AXD, RAD and MD per individual dataset. Whole brain tractography and network analyses were conducted using ExploreDTI to calculate the network measures. The network connectivity-based measures global effi ciency, clustering coeffi cient and local effi ciency were calculated using the Brain Connectivity Toolbox (41). Details on the MRI data acquisition and further processing of the data are provided in the supplementary materials.
Statistical analysesComparison of pre-post CAPE and MADRS scoresPaired sample t-tests were performed to compare the mean CAPE and MADRS scores between T0 and T1 per condition. Alterations over time were compared between conditions using a multilevel random effects regression model in R, version 3.2 (42). The association between condition (independent variable) and CAPE positive symptom frequency score at T1 (dependent variable) was investigated. CAPE positive symptom frequency score at T0 was added as a covariate. The multilevel random regression

Chapter 6
166
model included training-group as a level, since participants were randomly assigned to different training-groups, with individuals from the same group clustering together. The a priori hypothesized confounding variables age, sex, level of education, days between assessment (T0 and T1), lifetime cannabis and other drug use were included. Condition was coded as ‘1’ for the ACT-condition and ‘0’ for the TD-condition. The same models were created for the CAPE distress symptom and the MADRS symptom score.
Comparison of pre-post momentary daily life PE and NA symptom levelsPaired sample t-tests were performed to compare the mean PE and NA scores between T0 and T1 per condition. Changes over time in the ESM PE and NA levels were compared between conditions using a multilevel random regression model with ESM symptoms (PE and NA) at T1 as dependent variable and condition as independent variable. Confounding factors were age, sex, educational level and days between the assessments. Baseline ESM symptom levels were included as a covariate.
Whole brain analyses of therapy effects (ACT vs. control condition)A voxel-wise statistical analysis was performed based on the mean FA skeleton using a general linear model applying permutation testing using FSL’s randomise (v2.9) (43). Based on the skeleton generated via FA processing, the maps of MD, AXD and RAD were extracted from the same skeleton. Tests of between-condition differences in FA change (i.e., �FA = post-intervention (T1) minus pre-intervention (T0)) were conducted in two ways: mean �FA is lower or higher in the ACT-condition compared to TD-condition. The a priori hypothesized confounding variables age, sex, level of education and lifetime cannabis and other drug use were added to the statistical model (and to all other models described below). The same statistical tests were performed with the other DTI indices, i.e., �MD, �AXD and �RAD. A threshold-free cluster enhancement (TFCE) threshold of p>0.05 was applied to all statistical tests in TBSS (44) and a total of 5000 permutations were used.
Regional brain analyses of therapy effect (ACT vs. control condition)Regional white matter differences in 37 white matter regions were investigated using the Johns Hopkins University International Consortium for Brain Mapping (JHU ICBM)-DTI-81 atlas labels (45). The mean FA, AXD, RAD and MD per region of interest (ROI) were computed per individual and analyzed in R (42) using a multilevel structure which consisted of 37 brain regions clustered within participants, with these participants clustered

6
167
ACT AND WHITE MATTER PLASTICITY: AN RCT
within training sessions. The interactions between condition and ROI were tested in the models of DWI measures at T1 (mean FA, AXD, RAD and MD; dependent variables) using a multilevel random regression model. The models included the respective DWI measure at T0 as a covariate. This model allows for investigating change from pretreatment within a RCT design and has more power than a model using a change score (46). Number of voxels was included as an analytic weight to control for the ROI extent (i.e., the error variance for a particular observation was inversely weighted by the number of voxels within the ROI). In case of a signifi cant interaction effect (p<0.05) between condition and ROI in the four models of DWI measures, associations between condition and the four DWI measures were examined for each ROI separately. Bonferroni correction was applied to correct for the number of comparisons per measure as implemented in the R stats package function ‘p.adjust’. Specifi cially, correction was done based on 148 tests.
Network connectivity analyses of therapy effects (ACT vs. control condition)Parcellation of the white matter tracts was done using the automated anatomical atlas labeling (AAL) template (47). This analysis provided 90 (sub)-cortical brain regions of interest, each representing a node in the white matter network, providing adequate coverage of the cortex. The reconstructed white matter tracts were the edges between the node pairs. Individual brain networks were used to compute connectivity measures in order to quantify the network architecture using the Brain Connectivity Toolbox (41). Regional connectivity was described as local effi ciency and clustering coeffi cient (41) based on the pass criteria (the tracts that pass through) per node. Global effi ciency was calculated over the entire brain network. Effi ciency quantifi es the exchange of information on a global or local nodal level. Clustering coeffi cient is a measure of to what extent nodes in a network tend to cluster together. Global effi ciencyGlobal effi ciency was analyzed in wide format (one measure per person). The associations between condition and change from pretreatment in global effi ciency (T1 global effi ciency, controlled for T0 global effi ciency) were investigated in a multilevel random regression model. Training session was added as a random effect.Local effi ciency and clustering coeffi cientThe local network measures were computed per individual, exported and statistically analyzed with multilevel random regression models in R (42).

Chapter 6
168
The multilevel structure consisted of 90 brain regions clustered on the level of participants, and participants clustered on the level of training group. The interactions between condition and ROI were tested in the models of local effi ciency and clustering coeffi cient at T1, controlled for T0. Number of voxels was included as an analytic weight to control for the ROI extent. In case of a signifi cant interaction (p<0.05), each ROI was examined separately to test for an association between condition and network measure. Bonferroni correction was applied to correct for the number of comparisons per measure. Specifi cially, correction was done for 180 tests.
Interactions between DWI parameter change and condition in the models of subclinical depressive and psychotic experience changeTo examine whether associations between FA change and symptom change were conditional on the ACT or TD condition and brain region, interactions between condition and �FA (defi ned as FA (T1) minus FA (T0)) were tested in multilevel random regression models of symptom scores at T1 (dependent variable) corrected for T0 (added as a covariate). The CAPE positive (frequency and distress) symptom scores, the MADRS score and the ESM momentary PE and NA scores were selected for these analyses. The association between condition and whole brain �FA in the fi ve symptom models were tested in separate multilevel models. The same models were created for �AXD, �RAD and �MD. The interactions between condition and �FA in the fi ve symptom models were tested for each ROI separately (37x; the model does not allow for a three-way interaction with ROI since the dependent variable comprised only the T1 symptom score, minimizing the power of the statistical analyses). Bonferroni correction was used to correct for the 37 ROIs tested. Specifi cally, a correction for 37 ROIs in fi ve symptom models and for four DWI measures was performed, making a total of 740 tests. In case of a signifi cant interaction after correction, stratifi cation per condition was done and the estimated coeffi cient (B) and p-values were calculated per condition.
Interactions between network connectivity change and condition in the models of subclinical depressive and psychotic experience changeThe two-way interaction between �GE (change T1-T0 global effi ciency) and condition was investigated in the models of CAPE positive frequency and distress symptom scores at T1 corrected for T0. Besides the CAPE positive symptom scores, the MADRS symptom score and momentary PE- and NA-scores were examined. In case of a signifi cant (p<0.05) interaction, stratifi cation per condition was done and the estimated coeffi cient (B) and

6
169
ACT AND WHITE MATTER PLASTICITY: AN RCT
p-values were calculated per condition. Similarly, the above described interaction models were created for �LE (change T1-T0 local effi ciency) and �CC (change T1-T0 clustering coeffi cient). The association between condition and whole brain �LE/CC in the fi ve symptom score models were tested in separate multilevel models. The interactions between condition and respectively �LE and �CC in the fi ve symptom models were tested for each ROI separately (90x). In order to control for testing of multiple regions, Bonferroni correction was done based on 90 regions in fi ve symptom models and for two network measures, making a total of 900 tests. In case of a signifi cant interaction after correction, stratifi cation per condition was done and the estimated coeffi cient (B) and p-values were calculated per condition.
ResultsParticipant characteristicsAs depicted in the RCT-fl owchart in fi gure 1, a total of 55 participants were allocated for randomisation. In the ACT condition, two participants were unable to attend the sessions and withdrew from the study. Two participants in the ACT-condition were excluded from the analysis due to claustrophobia and excessive movement during the MRI scan. ESM data were incomplete (based on <30% of data availability) for three participants in each condition. Therefore 45 participants were included in the main analyses. The sample included 20 individuals in the ACT-condition and 25 in the TD-condition. Analyses for NA were conducted in a sample of 35 participants (n=13 in the ACT-condition and n=17 in the TD-condition (because of missing data for the NA items).Individuals within the ACT-condition (n=20) and TD-condition (n=25) did not differ with respect to age, sex, educational level and subclinical symptom scores at baseline (CAPE subscales and MADRS; see table 2). There was no difference between groups at baseline on ESM PE and NA scores. Lifetime cannabis and other drug use were equal in both conditions. The number of days between pre- and post-assessments did not differ between conditions. See table 1 for an overview of the conditions.

Chapter 6
170
Figu
re 1
: Ove
rvie
w o
f the
ran
dom
ized
con
trol
led
tria
l (R
CT
) w
ith b
oth
acce
ptan
ce a
nd c
omm
itmen
t th
erap
y (A
CT
) an
d to
polo
gica
l fi l
m d
iscu
ssio
n (T
D)
cond
ition
arm
s. Fo
r ea
ch p
hase
the
num
ber
of w
ithdr
awal
s is
pro
vide
d an
d cl
assi
fi ed
base
d on
exc
lusi
on c
rite
ria.
MR
I; M
agne
tic R
eson
ance
Imag
ing.

6
171
ACT AND WHITE MATTER PLASTICITY: AN RCT
Table 1: Participant characteristics for both the ACT and control (TD) condition
ACT-condition(n=20)
TD-condition(n=25)
Age (mean (sd)) 21.09 (2.56) 21.74 (2.51)
Sex = Female (%) 16 (80.0) 18 (72.0)
Educational level category:
High school (%) 2 (10.0) 3 (12.0)
Higher education (Bachelor) (%) 16 (80.0) 17 (68.0)
University (Master) (%) 2 (10.0) 5 (20.0)
GAF (mean (sd)) 57.30 (14.59) 60.12 (7.44)
Days between T0 and T1 (mean (sd)) 165.85 (64.59) 168.20 (87.42)
Lifetime cannabis use (mean (sd)) 10.50 (64.59) 14.48 (29.57)
Lifetime other drug use (mean (sd)) 3.15 (9.21) 15.96 (68.04)
ACT: Acceptance and Commitment Therapy, TD: Topic Discussion, T0: time point before intervention. CAPE: Community Assessment of Psychic Experiences, MADRS: Montgomery–Åsberg Depression Rating Scale, GAF; Global Assessment of Functioning.
Training effect (ACT vs. control condition) on symptom changeWithin-condition symptom change (T1-T0)The change in symptoms over time per condition showed that there was no signifi cant T1-T0 difference in CAPE positive symptom frequency score in the ACT-condition (B=-0.20, p=0.53) and the TD-condition (B=-0.16, p=0.56). There was no signifi cant T1-T0 difference in CAPE positive symptom distress score in the ACT-condition (B=0.30, p=0.36) or TD-condition (B=0.12 p=0.59). There was a signifi cant T1-T0 difference in MADRS score in the ACT-condition (B=-5.65. p=0.00020), but not in the TD-condition (B=-1.08, p=0.20). Associations between condition (ACT vs. TD) and CAPE and MADRS scoresThere were no signifi cant associations between condition and CAPE positive symptom frequency/distress score (at T1, corrected for T0) (table 2). The MADRS score (at T1, corrected for T0) was signifi cantly lower in the ACT-condition compared to the TD-condition (B=-5.08 p=0.03) (fi gure 2).

Chapter 6
172
Figure 2: MADRS score before (time-point 1) and after intervention (time-point 2) MADRS; Montgomery–Åsberg Depression Rating Scale. Acceptance and Commitment Therapy condition in blue and Topic Discussion condition in black.

6
173
ACT AND WHITE MATTER PLASTICITY: AN RCT
Within-condition momentary daily life symptom levels There were no signifi cant differences between T1-T0 in PE-score in the ACT-condition (B=0.14, p=0.17) and the TD-condition (B=-0.05, p=0.11). There were no signifi cant differences between T1-T0 in NA in the ACT condition (B=0.18, p=0.20), while in the TD-condition this was signifi cant (B=-0.20, p=0.02). Association between condition and ESM momentary daily life symptom levelsThe PE-score (at T1, corrected for T0) was signifi cantly higher for the ACT-condition than for the TD-condition (B=0.33, p=0.03). The NA scores (at T1, corrected for T0) were not signifi cantly different between the two conditions (table 2).
Tabl
e 2:
Sym
ptom
sco
res
befo
re (
T0)
and
aft
er (
T1)
the
act
ive
and
cont
rol i
nter
vent
ion.
A
CT-
cond
ition
T
D-c
ondi
tion
T
0M
ean
(SD
)T
1M
ean
(SD
)T
0M
ean
(SD
)T
1M
ean
(SD
)B
p-va
lue
CA
PE p
ositi
ve
freq
uenc
y sc
ore
3.2
(3.3
)3.
4 (3
.0)
3.2
(3.0
)3.
4 (3
.2)
0.38
0.54
dist
ress
sco
re2.
8 (3
.1)
3.1
(3.4
)3.
2 (3
.5)
3.4
(4.0
)0.
007
0.99
MA
DR
S to
tal
scor
e14
.0 (
7.5)
8.3
(6.2
)14
.2 (
4.2)
13.1
(6.
9)-5
.08
0.03
PE-s
core
1.55
(0.
80)
1.82
(1.
09)
1.44
(0.
57)
1.34
(0.
47)
0.41
0.03
Neg
ativ
e A
ffect
2.23
(0.
83)
2.31
(0.
96)
2.20
(0.
75)
1.96
(0.
63)
-0.3
10.
24
Rep
orte
d ar
e th
e m
ean
and
stan
dard
dev
iatio
n pe
r sy
mpt
om s
core
per
con
ditio
n. A
CT:
A
ccep
tanc
e an
d C
omm
itmen
t The
rapy
, TD
: Top
ic D
iscu
ssio
n, C
APE
: Com
mun
ity A
sses
smen
t of
Ps
ychi
c Ex
peri
ence
s, M
AD
RS:
Mon
tgom
ery–
Åsb
erg
Dep
ress
ion
Rat
ing
Scal
e. R
epor
ted
B an
d p-
valu
es a
re b
ased
on
mul
tilev
el r
ando
m e
ffect
s re
gres
sion
mod
els
(AC
T v
s co
ntro
ls o
n sy
mpt
om
chan
ge).
PE-s
core
; the
ave
rage
of t
he t
wo
ESM
item
s ‘fe
elin
g un
real
’ and
‘sus
pici
ous
moo
d’.

Chapter 6
174
Training-effect (ACT vs. control condition) on DWI parameters and network connectivityWhole brain analyses of DWI parametersBased on the whole brain analyses in TBSS, the change in ΔFA, ΔMD, ΔAXD and ΔRAD did not signifi cantly differ between conditions. There were no signifi cant voxels above the threshold of p<0.05.Regional analyses of DWI parametersThe analyses in R did not reveal any signifi cant interaction between condition and ROI in the models of FA (χ2=35.39, p=0.50), AXD (χ2=34.39, p=0.55), RAD (χ2 =26.12, p=0.89) and MD (χ2=22.91, p=0.96) at T1, corrected for T0 (table 3).Network connectivity analysisThere was no signifi cant association between condition and ΔGE (B=-0.0013, p=0.82). The interaction between condition and ROI in the models of ΔLE (χ2=2.49, p=0.99) and ΔCC changes from baseline was not signifi cant (χ2=5.58, p=0.99) (table 3).
Interactions between DWI parameter change and condition in the models of subclinical depressive and psychotic experience change.CAPE positive symptom frequency and distress scoreThe whole brain analyses in R revealed no signifi cant differences between conditions in the model of CAPE positive symptom score (ΔFA; χ2=0.83, p=0.36, ΔAXD; χ2=1.88, p=0.17, ΔRAD; χ2=2.60, p=0.11, ΔMD; χ2=3.54, p=0.06) or CAPE positive distress symptom score (ΔFA; χ2=0.57, p=0.45, ΔAXD; χ2 =1.10, p=0.30, ΔRAD; χ2=2.01, p=0.16, ΔMD; χ2=2.15, p=0.14). The analyses in R did not reveal any signifi cant interaction between condition and ROI in the models of CAPE positive symptom frequency and distress score (Bonferroni corrected for 740 tests; see supplementary materials: ΔFA in table 1, ΔAXD in table 2, ΔRAD in table 3 and ΔMD in table 4). MADRS total scoreThe whole brain analyses in R revealed no signifi cant differences between conditions in the model of MADRS total score (ΔFA; χ2=0.28, p=0.59, ΔAXD; χ2=0.81, p=0.37, ΔRAD; χ2=0.53, p=0.47, ΔMD; χ2=0.87, p=0.35). The regional analyses in R, corrected for 740 tests, did not reveal any signifi cant interaction between condition and ROI in the models of MADRS total score (see supplementary materials: ΔFA in table 5, ΔAXD in table 6, ΔRAD in table 7 and ΔMD in table 8). Momentary psychotic experiences (PE) and negative affect (NA)The whole brain analyses in R revealed no signifi cant differences between conditions in the model of PE score (ΔFA; χ2=1.14, p=0.29, ΔAXD; χ2=0.72, p=0.40, ΔRAD; χ2=0.26, p=0.61, ΔMD; χ2=0.62, p=0.43) and NA score (ΔFA; χ2=0.97, p=0.32, ΔAXD; χ2=0.05, p=0.83, ΔRAD; χ2=1.66, p=0.20, ΔMD; χ2=1.24,

6
175
ACT AND WHITE MATTER PLASTICITY: AN RCT
Tabl
e 3:
Mea
ns a
nd s
tand
ard
devi
atio
ns p
er D
TI m
easu
re b
efor
e (T
0) a
nd a
fter
(T
1) in
terv
entio
n.
A
CT
con
ditio
nT
D c
ondi
tion
T
0M
ean
(SD
)T
1M
ean
(SD
)T
0M
ean
(SD
)T
1M
ean
(SD
)χ2
*p-
valu
e
Frac
tiona
l A
niso
trop
y0.
58 (
0.09
)0.
58 (
0.09
)0.
58 (
0.08
)0.
58 (
0.08
)35
.39
0.50
Axi
al
Diff
usiv
ity0.
0014
(0.
0001
8)0.
0014
(0.
0001
8)0.
0014
(0.
0001
8)0.
0014
(0.
0001
8)34
.39
0.55
Rad
ial
Diff
usiv
ity0.
0004
8 (0
.000
082)
0.00
047
(0.0
0008
3)0.
0004
8 (0
.000
082)
0.00
047
(0.0
0008
1)26
.12
0.89
Mea
n D
iffus
ivity
0.00
077
(0.0
0007
8)0.
0007
7 (0
.000
080)
0.00
077
(0.0
0007
9)0.
0007
7 (0
.000
078)
22.9
10.
96
Loca
l ef
fi cie
ncy
0.85
(0.
048)
0.83
(0.
022)
0.86
(0.
047)
0.82
(0.
019)
2.49
0.99
Clu
ster
ing
coef
fi cie
nt0.
35 (
0.04
9)0.
33 (
0.02
4)0.
35 (
0.04
9)0.
33 (
0.02
3)5.
580.
99
Glo
bal
effi c
ienc
y0.
72 (
0.02
0)0.
71 (
0.02
4)0.
73 (
0.01
8)0.
72 (
0.02
2)-0
.001
30.
82
AC
T: A
ccep
tanc
e an
d C
omm
itmen
t The
rapy
, TD
: Top
ic D
iscu
ssio
n. χ
2 and
p-v
alue
s ar
e de
rive
d fr
om m
ultil
evel
ran
dom
reg
ress
ion
anal
yses
. *
For
glob
al e
ffi ci
ency
, the
B-e
stim
ate
(cha
nge
per
cond
ition
; TD
to
AC
T)
is p
rovi
ded.

Chapter 6
176
Interactions between network connectivity change and condition in the models of subclinical depressive and psychotic experience changeCAPE positive symptom frequency and distress scoreThere were no signifi cant interactions between condition and ΔGE in the models of CAPE positive symptom frequency (χ2=0.39, p=0.53) and distress score (χ2=0.40, p=0.53).Similarly, the whole brain analyses showed no signifi cant interactions between condition and network parameters in the models of CAPE positive symptom frequency (ΔLE; χ2=0.07, p=0.80, ΔCC; χ2=0.02, p=0.90) and CAPE positive symptom distress score (ΔLE; χ2=0.49, p=0.48, ΔCC; χ2=0.39, p=0.53). The analyses did not reveal any signifi cant interaction between condition and ROI in the models of CAPE positive symptom frequency and distress score (Bonferroni corrected for 900 tests; see supplementary materials: ΔLE in table 11, ΔCC in table 12).MADRS total scoreThe interaction between condition and ΔGE in the model of MADRS total score was not signifi cant (χ2=1.05, p=0.30). In the whole brain analyses, no signifi cant interaction was found between condition and network parameters in the model of MADRS total score (ΔLE; χ2=0.02, p=0.90, ΔCC; χ2=0.01, p=0.92). Regional analyses with the model of MADRS total score (at T1, corrected for T0), showed no signifi cant interactions between condition and ΔLE and ΔCC in any ROI (Bonferroni corrected for 900 tests; see supplementary materials: ΔLE in table 13 and ΔCC in table 14).Momentary psychotic experiences (PE) and negative affect (NA)The association between condition and ΔGE in the model of PE-score was not signifi cant (χ2=2.92, p=0.09). The whole brain analyses in R revealed no signifi cant interactions between condition and the other two network parameters (ΔLE and ΔCC) in the models of PE score (ΔLE; χ2=0.08, p=0.78, ΔCC; χ2=0.13, p=0.72), while the models for NA did not run (singularity error as a result of a lack of variance). Regional analyses showed that, in the model of PE (at T1, corrected for T0), there were no signifi cant interactions between condition and ΔDWI network measures (ΔLE and ΔCC, corrected for 900 tests) in the ROIs (see supplementary materials: ΔLE in table 13 and ΔCC in table 14). In the
p=0.27). In the the regional analyses (corrected for 740 tests), the models of PE and NA (at T1, corrected for T0) showed no signifi cant interaction between condition and change in DWI measures (see supplementary materials: PE; ΔFA in table 5, ΔAXD in table 6, ΔRAD in table 7 and ΔMD in table 8 and NA; ΔFA and ΔAXD in table 9, ΔRAD and ΔMD in table 10).
6
177
ACT AND WHITE MATTER PLASTICITY: AN RCT
model of NA (at T1, corrected for T0) there were signifi cant interactions between condition and ΔLE in the right anterior cingulum: χ2=24.99, p=0.0005, left parahippocampal gyrus: χ2=23.30, p=0.001 and left angular gyrus: χ2=27.28, p=0.0002, (see supplementary table 15) and between condition and ΔCC in the left frontal superior medial gyrus: χ2=18.15, p=0.02, left parahippocampal gyrus: χ2=40.76, p=0.0000002, left angular gyrus: χ2=22.21, p=0.002, right paracentral lobule: χ2=20.50, p=0.005 and left caudate: χ2=18.29, p=0.02, after correction for 900 tests (see supplementary table 15). Stratifi cation per condition showed no signifi cant associations between NA and ΔLE in the right anterior cingulum: B=1.94, p=0.59, left parahippocampal gyrus: B=-0,58, p=0.85 and left angular gyrus: B=5.30, p=0.06 or between NA and ΔCC in the left frontal superior medial gyrus: B=0.02, p=0.99, left parahippocampal gyrus: B=-0.99, p=0.75, left angular gyrus: B=5.40, p=0.06, right paracentral lobule: B=-1.90, p=0.58 and left caudate: B=1.49, p=0.71, in the TD-condition. The models for the ACT-condition had not enough variation in NA and ΔCC to be executed.
DiscussionThe randomized application of ACT or TD in emerging adults with subclinical PE and or depressive symptoms yielded lower MADRS scores and higher momentary PE levels after ACT, with no changes in NA or the CAPE positive symptom scores. There were no signifi cant changes in DWI white matter parameters or network-based measures in either condition, with no signifi cant difference between the two conditions. The CAPE positive symptom frequency and distress scores, MADRS or daily life PE-scores showed no signifi cant interaction with white matter microstructural changes. In the model of NA several regions showed signifi cant interactions between condition and respectively ΔLE and ΔCC. Although the stratifi cation models per condition did not run for the ACT-condition, the TD-condition showed no signifi cant associations between NA symptom levels and ΔLE and ΔCC.
ACT and pre-post intervention symptom changeThe results showed no signifi cant changes in CAPE subclinical symptom dimensions (as measured via the CAPE) after the ACT intervention or TD condition. The CAPE total symptom distress score decreased more in the TD condition than in the ACT condition, but not signifi cantly so. This may have to do with the rather mild symptomatology in the sample, not allowing for a large change in a relatively small sample. Moreover, the ACT intervention seemed effective in reducing depressive symptoms (MADRS score) by fi ve points, while the TD-condition showed no alteration (described elsewhere

Chapter 6
178
(28)). Although the sample did not have severe symptoms, a fi ve-point decrease in depressive symptoms can still be relevant on the individual level in terms of personal well-being. This effect is presumably due to the fact, that during the ACT intervention, participants learned to set goals and value things more in their environment (such as being with friends and family), which has been found to increase emotional functioning (13). While ACT has shown to be effective in depression in depressed women (48), in individuals recovering from psychosis (49) and in individuals with anxiety and depression (50), the current and previous fi ndings described in (25) has shown that ACT may be effective on depressive symptomatology in a sample with mild psychopathology. Possibly, the discrepancy between results for the CAPE and MADRS symptomatology can be related to recall bias introduced by the questionnaire since the CAPE captures psychotic symptoms over the last three months, while the MADRS inquires about the last week. This is in line with previous research in an equal, but not the same, sample (28). In contrast to the observer-rated MADRS change, self-reported NA did not change as a result of the ACT intervention and this may be related to less recall bias in the ESM method used although there was missing data in the NA items (leading to a total of n=13 in the ACT-condition and n=17 in the TD-condition). Using ESM, recall bias is reduced as questions on feelings, mood and thoughts are answered in the moment during daily life and provide a more valid detection of fl uctuations over time (51, 52). Within the TD-condition a signifi cant, but marginal (B=-0.20), decrease in NA was found. This reduction in NA may indicate natural fl uctuation of negative feelings in daily life within the condition and may not be directly related to the intervention. Results from the current study showed a small, but signifi cant increase in the ESM subclinical PE item (comprising the items ‘feeling unreal’ and ‘suspicious mood’) after the ACT intervention compared against the TD-condition. Although the baseline scores of the PE items was fairly low and the relevance of a 1.55-1.82 PE score increase on a 1-7 Likert scale is questionable, the small increase in “feeling unreal/mood suspiciousness” may refl ect that participants become more aware of their environment during the training (9). In addition, minor daily life stress may be seen as an underlying factor leading to increased PE (53), which can be a temporary effect during psychological training due to increased self-refl ection/awareness. Notably, from a symptom-network perspective, feelings of suspiciousness could potentially lead to less ‘down feelings’ and more ‘cheerful and content feelings’ in individuals with psychosis and depression (54). Since participants in the ACT intervention may have become more aware and refl ective and were able to accept their feelings better, this may have resulted in more positive experiences in daily

6
179
ACT AND WHITE MATTER PLASTICITY: AN RCT
life. While the momentary PE-score may be more sensitive to subtle changes, as compared to an interview session or questionnaire (59), the application of ESM to investigate subclinical psychotic symptoms in the general population has not yet been fully explored. The current fi ndings in a relatively small group of individuals with mild levels of psychopathology are tentative and warrant further investigation to provide more defi nite conclusions.
ACT and pre-post microstructural white matter changeNo signifi cant white matter and network-connectivity changes as a result of the ACT intervention were found in individuals with mild psychopathology. Baseline and follow-up measures were rather close to each other (on average 24 weeks), although white matter plasticity may occur in a period ranging from one day to months. Nevertheless, the possibility that pre- and post-intervention time-points were still too close together to detect any alterations related to the ACT intervention cannot be fully excluded. Another explanation for the absence of white matter change over time can be the mild psychopathology levels of this group, i.e., a mean CAPE positive distress score of three and a mean MADRS score 14 in combination with a Global Assessment of Functioning of 60. Thus, compared to UHR samples described in previous literature, the current sample had milder symptom levels and better functioning levels and the question is if any of these individuals was going to develop psychosis. Based on the above, the tentative conclusion is that there were no microstructural white matter changes in response to a fi ve-week psychological training plus self-monitoring period in individuals at the very mild end of the psychosis-continuum.
DWI parameter-symptom associations conditional on intervention and brain regionSubclinical depressive symptoms and DWI/network connectivityA main effect of condition on white matter changes over time was absent, and there were no signifi cant interactions between condition and white matter measures in the MADRS and NA models. Previous literature showed lower FA (compared to healthy controls) in the cingulum bundle, anterior thalamic radiation, posterior limb of the internal capsule and the superior and posterior corona radiata in patients with major depressive disorder (MDD) and suicidal thoughts (55). In addition, decreased FA in the ALIC has been identifi ed in patients with MDD compared to healthy controls (56). The current sample consisted of young individuals with rather mild depressive symptoms as compared to the above mentioned studies. The null fi ndings in the MADRS and NA symptom models from the current study may be

Chapter 6
180
explained by the lack of overall changes in ΔFA and rather small effect sizes. Additionally, the NA models had a smaller sample as a result of missing items. This may have resulted in limited variance and replication in a larger sample is required.The change in network connectivity parameters showed no signifi cant interactions with condition in the models of MADRS. There was some indication for differential associations between NA and ΔLE/ΔCC in the two conditions. However, the models stratifi ed per condition did not run for the ACT condition, which precludes adequate interpretation of the signifi cant interactions between condition and ΔLE/ΔCC in models of NA.
Subclinical psychotic symptoms and DWI/network connectivityThere was no signifi cant interaction between change in DWI measure over time and condition in the models of CAPE positive symptom frequency/distress change. Contrarily, in cross-sectional early stage schizophrenia research, an increase in PANSS disorganized thoughts has been related to an increased RAD and decreased FA located in the corpus callosum (57), while another study showed a positive association between positive schizotypy symptoms and FA (58). It needs to be noted that these studies involved participants with higher subclinical symptoms as compared to the current study. Furthermore, the current study aimed at changing the interaction between white matter measures and subclinical symptoms as a result of an ACT intervention. As this is the fi rst time that DWI-symptom associations in relation to psychological training in individuals with emerging psychopathology was investigated, a direct comparison with similar studies was not feasible. There were no signifi cant interactions between the white matter changes (ΔFA, ΔAXD, ΔRAD and ΔMD) and condition in the model of PE-score change. It was the fi rst time ever to explore the interaction between brain white matter measures and an ACT-intervention in models of PE. The absence of fi ndings may be explained due to the small, non-signifi cant, white matter changes that may not have been detectable in relation to PE change. Further work on the relationship between white matter measurements and daily life subclinical psychotic symptoms should aim at a larger sample size and longer term interventions to investigate plasticity, as compared to the current study (24 weeks). Similarly, the network-connectivity parameters showed no signifi cant interactions with condition in the symptom models (CAPE symptom frequency/distress score and PE-score). It is important to note that the network-based analyses depends on the fi ber tractography algorithm that is used (60). The current study applied deterministic tractography and perhaps probabilistic tractography was more valid to obtain more detailed

6
181
ACT AND WHITE MATTER PLASTICITY: AN RCT
white matter networks.
Methodological considerationsWhile the carefully designed RCT is a strength of the study, some limitations need to be taken in consideration. First, the study was based a rather small sample (n=45) and therefore the study might be underpowered for detecting a difference between the two conditions (n=20 versus n=25) and needs replication. Furthermore, participants may have known about which training they may have received. The ACT-condition was very different from the TD-condition in a practical matter, since the ACT-condition had exercises embedded in the ESM. The number of monitoring days was equal in both conditions, while the exercises were added to this protocol during these days. Blinding could therefore not be guaranteed from the perspective of the participant and could have led to a more positive outcome in the ACT-condition as compared to the TD-condition. Ths effect has been minimized by an equal number of days of ESM assessment before and after the intervention period. As the expected effect size were largely unknown, the tentative results from this study can be seen as a start for further hypotheses-generating. The sample comprised young people with mild symptomatology at the milder end of the psychosis-continuum and therefore are not directly comparable with individuals with At-Risk Mental State or Ultra-High-Risk samples. Moreover, it needs to be noted that most models to analyse the associations between NA and ΔLE/ΔCC per ROI within the ACT-condition (after a signifi cant interaction between condition and ΔLE/ΔCC in the NA models) did not converge. This can be explained by the missing values for NA items (7 missing in the ACT-condition and 8 in the TD-condition). The sample of 13 participants in the ACT-condition reduced the variance in ΔLE/ΔCC and therefore the NA models did not converge, while the models with 20 participants in the TD-condition did converge.The use of tract-based spatial statistics limits the number of voxels to the white matter skeleton. This reduces the error term, but also limits analyses to the strongest structural connections only. Also, arbitrary borders have been used based on the Johns Hopkins University International Consortium for Brain Mapping (JHU ICBM)-DTI-81 atlas labels. Regions can be closely located next to each other, but are separated due to the borders in the atlas. This limits interpretation to the available atlas labels. The current study applied deterministic tractography (60). Deterministic tractography allows to inspect specifi c regions (as based on the AAL), while probabilistic requires to set thresholds to do the same. Removal of small fi bers, as based on FA<0.2, may have resulted in removal of important

Chapter 6
182
information for the network-based analyses, possibly explaining part of the absence of fi ndings.
ConclusionThis RCT in youngsters with mild psychopathology showed no effect of ACT on microstructural white matter or network-connectivity parameters, but did show behavioural effects in terms of decreased depressive symptoms. Besides, a small but signifi cant increase in a composite ESM subclinical PE score was reported, while other CAPE subclinical psychosis symptoms remained unchanged, possibly indicating that participants in the ACT intervention became more aware of themselves and the environment. There was an indication for differential associations between change in network connectivity and NA as a result of the ACT intervention, but the current sample did not allow for complete stratifi ed analyses (since there was not enough variance).

6
183
ACT AND WHITE MATTER PLASTICITY: AN RCT
Paus T, Keshavan M, Giedd JN. Why do 1. many psychiatric disorders emerge during adolescence? Nature reviews Neuroscience. 2008;9(12):947-57.Blakemore SJ. Imaging brain development: 2. the adolescent brain. NeuroImage. 2012;61(2):397-406.Tae WS, Ham BJ, Pyun SB, Kang SH, 3. Kim BJ. Current Clinical Applications of Diffusion-Tensor Imaging in Neurological Disorders. J Clin Neurol. 2018;14(2):129-40.Parnanzone S, Serrone D, Rossetti MC, 4. D’Onofrio S, Splendiani A, Micelli V, et al. Alterations of cerebral white matter structure in psychosis and their clinical correlations: a systematic review of Diffusion TensorImaging studies. Riv Psichiatr. 2017;52(2):49-66.Kochunov P, Hong LE. 5. Neurodevelopmental and neurodegenerative models of schizophrenia: white matter at the center stage. Schizophr Bull. 2014;40(4):721-8.Friston K, Brown HR, Siemerkus 6. J, Stephan KE. The dysconnection hypothesis (2016). Schizophr Res. 2016;176(2-3):83-94.Taubert M, Draganski B, Anwander A, 7. Muller K, Horstmann A, Villringer A, et al. Dynamic properties of human brain structure: learning-related changes in cortical areas and associated fi ber connections. The Journal of neuroscience : the offi cial journal of the Society for Neuroscience. 2010;30(35):11670-7.Zatorre RJ, Fields RD, Johansen-8. Berg H. Plasticity in gray and white: neuroimaging changes in brain structure during learning. Nature neuroscience. 2012;15(4):528-36.Hayes SC, Luoma JB, Bond FW, Masuda 9. A, Lillis J. Acceptance and commitment therapy: model, processes and outcomes. Behav Res Ther. 2006;44(1):1-25.Ost LG. Effi cacy of the third wave of 10. behavioral therapies: a systematic review and meta-analysis. Behav Res Ther. 2008;46(3):296-321.Cramer H, Lauche R, Haller H, 11. Langhorst J, Dobos G. Mindfulness- and Acceptance-based Interventions for Psychosis: A Systematic Review and Meta-analysis. Glob Adv Health Med.
2016;5(1):30-43.Gaudiano BA, Herbert JD, Hayes SC. 12. Is it the symptom or the relation to it? Investigating potential mediators of change in acceptance and commitment therapy for psychosis. Behav Ther. 2010;41(4):543-54.White R, Gumley A, McTaggart J, 13. Rattrie L, McConville D, Cleare S, et al. A feasibility study of Acceptance and Commitment Therapy for emotional dysfunction following psychosis. Behaviour research and therapy. 2011;49(12):901-7.Gaudiano BA, Nowlan K, Brown 14. LA, Epstein-Lubow G, Miller IW. An open trial of a new acceptance-based behavioral treatment for major depression with psychotic features. Behav Modif. 2013;37(3):324-55.Dalrymple KL, Morgan TA, Lipschitz JM, 15. Martinez JH, Tepe E, Zimmerman M. An Integrated, Acceptance-Based Behavioral Approach for Depression With Social Anxiety: Preliminary Results. Behav Modif. 2014;38(4):516-48.Bohlmeijer ET, Fledderus M, Rokx 16. TAJJ, Pieterse ME. Effi cacy of an early intervention based on acceptance and commitment therapy for adults with depressive symptomatology: Evaluation in a randomized controlled trial. Behaviour research and therapy. 2011;49(1):62-7.Burckhardt R, Manicavasagar V, 17. Batterham PJ, Hadzi-Pavlovic D. A randomized controlled trial of strong minds: A school-based mental health program combining acceptance and commitment therapy and positive psychology. J Sch Psychol. 2016;57:41-52.Danitz SB, Orsillo SM. The Mindful Way 18. Through the Semester: An Investigation of the Effectiveness of an Acceptance-Based Behavioral Therapy Program on Psychological Wellness in First-Year Students. Behavior Modifi cation. 2014;38(4):549-66.Fledderus M, Bohlmeijer ET, Pieterse 19. ME, Schreurs KMG. Acceptance and commitment therapy as guided self-help for psychological distress and positive mental health: a randomized controlled trial. Psychol Med. 2012;42(3):485-95.Jeffcoat T, Hayes SC. A randomized 20.
References

Chapter 6
184
E, Bentley L, Udachina A, Delespaul PA, et al. Experience sampling research in individuals with mental illness: refl ections and guidance. Acta Psychiatr Scand. 2011;123(1):12-20.Myin-Germeys I, Oorschot M, Collip 32. D, Lataster J, Delespaul P, van Os J. Experience sampling research in psychopathology: opening the black box of daily life. Psychol Med. 2009;39(9):1533-47.Stefanis NC, Hanssen M, Smirnis 33. NK, Avramopoulos DA, Evdokimidis IK, Stefanis CN, et al. Evidence that three dimensions of psychosis have a distribution in the general population. Psychol Med. 2002;32(2):347-58.Montgomery SA, Asberg M. A new 34. depression scale designed to be sensitive to change. Br J Psychiatry. 1979;134:382-9.Hayes SC, Smith S. Uit je hoofd in het 35. leven: een werkboek voor een waardevol leven met mindfulness en Acceptatie en Commitment therapie. Amsterdam: Nieuwezijds; 2015.WHO. Composite International 36. Diagnostic Interview (CIDI). Geneva: World Health Organization; 1990.Williams JBW, Kobak KA. Development 37. and reliability of a structured interview guide for the Montgomery Asberg Depression Rating Scale (SIGMA). The British journal of psychiatry : the journal of mental science. 2008;192(1):52-8.Delespaul PAEG. Assessing Schizophrenia 38. in Daily Life. Maastricht, The Netherlands: Universitaire Pers Maastricht, 1995. 1995.Leemans A, Jeurissen B, Sijbers J, Jones 39. DK, editors. ExploreDTI: a graphical toolbox for processing, analyzing, and visualizing diffusion MR data. 17th Annual Meeting of Intl Soc Mag Reson Med; 2009; Hawaii, USA.Chang L-C, Jones DK, Pierpaoli C. 40. RESTORE: robust estimation of tensors by outlier rejection. Magn Reson Med. 2005;53(5):1088-95.Rubinov M, Sporns O. Complex network 41. measures of brain connectivity: uses and interpretations. Neuroimage. 2010;52(3):1059-69.Team RDC. R: A language and 42. environment for statistical computing. In: R Foundation for Statistical Computing V, Austria, editor. 2008.Winkler AM, Ridgway GR, Webster 43.
trial of ACT bibliotherapy on the mental health of K-12 teachers and staff. Behaviour research and therapy. 2012;50(9):571-9.Levin ME, Pistorello J, Seeley JR, Hayes 21. SC. Feasibility of a prototype web-based acceptance and commitment therapy prevention program for college students. J Am Coll Health. 2014;62(1):20-30.Lappalainen P, Langrial S, Oinas-22. Kukkonen H, Tolvanen A, Lappalainen R. Web-based acceptance and commitment therapy for depressive symptoms with minimal support: a randomized controlled trial. Behavior modifi cation. 2015;39(6):805-34.Rasanen P, Lappalainen P, Muotka J, 23. Tolvanen A, Lappalainen R. An online guided ACT intervention for enhancing the psychological wellbeing of university students: A randomized controlled clinical trial. Behaviour research and therapy. 2016;78:30-42.Tang YY, Lu Q, Fan M, Yang Y, Posner MI. 24. Mechanisms of white matter changes induced by meditation. Proc Natl Acad Sci U S A. 2012;109(26):10570-4.Kang D-H, Jo HJ, Jung WH, Kim SH, 25. Jung Y-H, Choi C-H, et al. The effect of meditation on brain structure: cortical thickness mapping and diffusion tensor imaging. Soc Cogn Affect Neurosci. 2013;8(1):27-33.Luders E, Clark K, Narr KL, Toga AW. 26. Enhanced brain connectivity in long-term meditation practitioners. Neuroimage. 2011;57(4):1308-16.Laneri D, Schuster V, Dietsche B, Jansen 27. A, Ott U, Sommer J. Effects of Long-Term Mindfulness Meditation on Brain’s White Matter Microstructure and its Aging. Front Aging Neurosci. 2015;7:254.Bakker JM. On the bumpy road of 28. happiness - Mechanisms of daily life reward processing and how it can be changed: Proefschri maken || Proefschri maken.nl; 2018.Myin-Germeys I, Nicolson NA, 29. Delespaul PA. The context of delusional experiences in the daily life of patients with schizophrenia. Psychol Med. 2001;31(3):489-98.Csikszentmihalyi M, Larson R. Validity 30. and reliability of the Experience-Sampling Method. J Nerv Ment Dis. 1987;175(9):526-36.Palmier-Claus JE, Myin-Germeys I, Barkus 31.

6
185
ACT AND WHITE MATTER PLASTICITY: AN RCT
MA, Smith SM, Nichols TE. Permutation inference for the general linear model. Neuroimage. 2014;92:381-97.Salimi-Khorshidi G, Smith SM, Nichols TE. 44. Adjusting the effect of nonstationarity in cluster-based and TFCE inference. Neuroimage. 2011;54(3):2006-19.Mori S, Oishi K, Jiang H, Jiang L, Li X, 45. Akhter K, et al. Stereotaxic white matter atlas based on diffusion tensor imaging in an ICBM template. Neuroimage. 2008;40(2):570-82.Van Breukelen GJ. ANCOVA versus 46. change from baseline: more power in randomized studies, more bias in nonrandomized studies [corrected]. J Clin Epidemiol. 2006;59(9):920-5.Tzourio-Mazoyer N, Landeau B, 47. Papathanassiou D, Crivello F, Etard O, Delcroix N, et al. Automated anatomical labeling of activations in SPM using a macroscopic anatomical parcellation of the MNI MRI single-subject brain. Neuroimage. 2002;15(1):273-89.Zettle RD, Rains JC. Group cognitive 48. and contextual therapies in treatment of depression. J Clin Psychol. 1989;45(3):436-45.Nowak I, Sabariego C, Switaj P, 49. Anczewska M. Disability and recovery in schizophrenia: a systematic review of cognitive behavioral therapy interventions. BMC Psychiatry. 2016;16:228.Hacker T, Stone P, MacBeth A. Acceptance 50. and commitment therapy - Do we know enough? Cumulative and sequential meta-analyses of randomized controlled trials. J Affect Disord. 2016;190:551-65.Ebner-Priemer UW, Trull TJ. Ecological 51. momentary assessment of mood disorders and mood dysregulation. Psychol Assess. 2009;21(4):463-75.Shiffman S, Stone AA, Hufford MR. 52. Ecological momentary assessment. Annu Rev Clin Psychol. 2008;4:1-32.Klippel A, Viechtbauer W, Reininghaus 53. U, Wigman J, van Borkulo C, Merge, et al. The Cascade of Stress: A Network Approach to Explore Differential Dynamics in Populations Varying in Risk for Psychosis. Schizophr Bull. 2017.Wigman JTW, van Os J, Borsboom D, 54. Wardenaar KJ, Epskamp S, Klippel A, et al. Exploring the underlying structure of mental disorders: cross-diagnostic differences and similarities from a
network perspective using both a top-down and a bottom-up approach. Psychol Med. 2015;45(11):2375-87.Taylor WD, Boyd B, McQuoid DR, Kudra 55. K, Saleh A, MacFall JR. Widespread white matter but focal gray matter alterations in depressed individuals with thoughts of death. Prog Neuropsychopharmacol Biol Psychiatry. 2015;62:22-8.Zhang A, Ajilore O, Zhan L, Gadelkarim J, 56. Korthauer L, Yang S, et al. White matter tract integrity of anterior limb of internal capsule in major depression and type 2 diabetes. Neuropsychopharmacology. 2013;38(8):1451-9.Hummer TA, Francis MM, Vohs JL, 57. Liffi ck E, Mehdiyoun NF, Breier A. Characterization of white matter abnormalities in early-stage schizophrenia. Early Interv Psychiatry. 2016.Grazioplene RG, Chavez RS, Rustichini A, 58. DeYoung CG. White matter correlates of psychosis-linked traits support continuity between personality and psychopathology. J Abnorm Psychol. 2016;125(8):1135-45.Myin-Germeys I, Delespaul PA, deVries 59. MW. Schizophrenia patients are more emotionally active than is assumed based on their behavior. Schizophr Bull. 2000;26(4):847-54.Zalesky A, Fornito A, Seal ML, Cocchi 60. L, Westin CF, Bullmore ET, et al. Disrupted axonal fi ber connectivity in schizophrenia. Biol Psychiatry. 2011;69(1):80-9.

Chapter 6
186
Supplementary materialsMethodsInterventionDescription of the ACT-conditionThe randomized controlled trial incorporated an Acceptance and Commitment Therapy (ACT) condition and a topical discussion (TD) condition as comparison. The ACT-condition followed a specifi c protocol during six weekly meetings according to the guidelines from “Get Out Of Your Mind And Into Your Life”, in Dutch (1). The ACT-condition and TD-condition are described in more detail in the supplementary materials. The sessions were guided by a professional Acceptance and Commitment Therapy (ACT)-trainer and included fi ve participants per group. After each session the participants received a PsyMate® device to collect ESM data and to practice the acquired skills. The PsyMate® is an app or device (in the current study the device was used) that needs to be carried for three consecutive days and will beep at ten random times during the day to allow for unpredicted sampling. Questions are related to mood, feelings and social context. Throughout the day, a participant can freely choose to practice an ACT-exercise linked to the topic of the week. Topics covered are acceptance, commitment and mindfulness based.
Description of the TD-conditionNext to the active treatment arm, the RCT incorporated an active control condition as comparison. The Topological Discussion (TD)-condition comprised six sessions to discuss a movie of choice by the group. Themed sessions were i) biography (with choices “I am”, “Charles Bradley - The Soul Of America”, “Kumaré”, “Christian Dior: The Man Behind The Myth” and “Classic Literature - Jane Austen”), ii) crime (“The Cove”, “National Geographic-FBI behind the scenes”, “Munich 1972”, “Black Gold” and “Breivik - Terrorist, Murder, Psychopath”), iii) history (“Escape From Auschwitz”, “Life of the Romans with Terry Jones”, “Vikings: Journey To New Worlds”, “National Geographic – The lost Maya kingdom” and “Tomb of Toetanchamon”), iv) nature (“The Meerkats”, “Colony”, “Chimpanzee”, “BBC Earth - Snow Babies” and “National Geographic - Woede Van De Natuur”) and v) art (“Searching for Sugar Man”, “Heimatklänge”, “Annie Leibovitz: Life through a Lens”, “Benda Bilili” and “Talking Guitars”). After watching the movie a discussion on the main aspect and the take-home message followed. After the session all participant received the PsyMate® device with the same questions as the ACT-condition, but without the ACT exercises. The ESM data collection protocol for the TD-condition was equal

6
187
ACT AND WHITE MATTER PLASTICITY: AN RCT
to the ACT-condition. Time investment for TD and ACT-condition were equal at around 2h per session.
MRI acquisition and processingScan acquisitionT1-weighted Magnetization Prepared Rapid Acquisition Gradient Echo (MPRAGE) whole brain images were acquired with a voxel size of 1.0mm x 1.0mm x 1.0mm (repetition time (TR) = 2250 msec, echo time (TE) = 2.21 msec, fl ip angle = 9°, fi eld of view (FOV) = 256x256, 192 sagittal orientated slices, GRAPPA = 2, no fat suppression, acquisition time (TA) = 5.05 min). Whole brain structural Diffusion Weighted Imaging scans were recorded using an interleaved echo-planar-imaging sequence (fi eld of view 200 x 200 mm2, TR 7300 ms, TE 49 ms, voxel size 2 x 2 x 2 mm³, b-value 1000 s/mm², 72 slices, no overlap). 119 directions were recorded; 11 B0 volumes and 108 B-1000 volumes. Total acquisition time was 14m52s. Due to a scanner update one scan (a participant at T1 in the TD condition) was recorded with TR 7800ms.
Diffusion Weighted Imaging processingAfter conversion of raw DICOM images to NIfTI format (2), the DWI data were converted from NIfTI standard to .mat standard using ExploreDTI (3) in a MatLab (The MathWorks, Inc., Natick, Massachusetts, United States) programming environment. Motion and eddy-current induced geometrical distortions were corrected by realigning the diffusion images to the B0 images incorporating B-matrix rotation (4) and coregistered to the individual’s anatomical data to correct for echo-planar imaging (EPI) distortions (5, 6). The diffusion tensor metrics were calculated using the Robust Estimation of Tensors by Outlier Rejection (RESTORE) method (7). Fractional Anisotropy (FA) maps were calculated with a threshold of > 0.2. White matter tracts were reconstructed at 1mm3 resolution using deterministic fi ber tractography, for each individual dataset (8). Individual mean diffusivity, axial diffusivity and radial diffusivity maps were exported from ExploreDTI to be used in the next steps.
Tract-based analysisTract-based spatial statistics (TBSS) in FSL 5.0.9 (FMRIB Analysis Group, Oxford, UK) was used for further processing of the DWI data. Nonlinear registration aligned all FA volumes to 1 x 1 x 1 mm standard FMRIB58_FA space. The standard FMRIB58_FA consists of a template derived from high-resolution images of 58 participants (males and females between 20 and
Chapter 6
188
50 years of age) (9). Next, a mean FA skeleton based on the whole sample was generated. This skeleton follows the major white matter tracts in each individual participant (normalized in MNI152 space) and provides a way to compare between conditions. The FA threshold was set at 0.2 after visual inspection of the FA skeleton in order to include major white matter tracts while removing small peripheral tracts that would cause excess inter-participant variability.
Supplementary tablesNote that the tables 1-10 are Bonferroni corrected as a whole (37 ROI’s in four DWI models (ΔFA, ΔAXD, ΔRAD and ΔMD) and in fi ve symptom models (CAPE positive frequency/distress symptom, MADRS, PE and NA scores). This resulted in a total of 740 interaction tests, corrected via the Bonferroni method as implemented in the R stats package function ‘p.adjust’. In this method the uncorrected p-values were multiplied by 740 and thresholded with p<0.05. If corrected p-values were higher than 1, the values were set to 1.
The tables 11-15 are Bonferroni corrected as a whole (90 ROI’s in two network connectivity models (ΔLE and ΔCC) and in fi ve symptom models (CAPE positive frequency/distress symptom, MADRS, PE and NA scores). This resulted in a total of 900 interaction tests, corrected via the Bonferroni method as implemented in the R stats package function ‘p.adjust’. In this method the uncorrected p-values were multiplied by 900 and thresholded with p<0.05. If corrected p-values were higher than 1, the values were set to 1.

6
189
ACT AND WHITE MATTER PLASTICITY: AN RCT
References
Hayes SC, Smith S. Uit je hoofd in het leven: een werkboek voor een waardevol leven 1. met mindfulness en Acceptatie en Commitment therapie. Amsterdam: Nieuwezijds; 2015.Rorden C, Brett M. Stereotaxic display of brain lesions. Behavioural neurology. 2. 2000;12(4):191-200.Leemans A, Jeurissen B, Sijbers J, Jones DK, editors. ExploreDTI: a graphical toolbox for 3. processing, analyzing, and visualizing diffusion MR data. 17th Annual Meeting of Intl Soc Mag Reson Med; 2009; Hawaii, USA.Leemans A, Jones DK. The B-Matrix Must Be Rotated When Correcting for Subject 4. Motion in DTI Data. Magn Reson Med. 2009;61(6):1336-49.Irfanoglu MO, Walker L, Sarlls J, Marenco S, Pierpaoli C. Effects of image distortions 5. originating from susceptibility variations and concomitant fi elds on diffusion MRI tractography results. Neuroimage. 2012;61(1):275-88.Klein S, Staring M, Murphy K, Viergever MA, Pluim JPW. elastix: a toolbox for intensity-6. based medical image registration. IEEE Trans Med Imaging. 2010;29(1):196-205.Chang L-C, Jones DK, Pierpaoli C. RESTORE: robust estimation of tensors by outlier 7. rejection. Magn Reson Med. 2005;53(5):1088-95.Basser PJ, Pajevic S, Pierpaoli C, Duda J, Aldroubi A. In vivo fi ber tractography using DT-8. MRI data. Magn Reson Med. 2000;44(4):625-32.Smith SM, Jenkinson M, Johansen-Berg H, Rueckert D, Nichols TE, Mackay CE, et al. Tract-9. based spatial statistics: voxelwise analysis of multi-subject diffusion data. Neuroimage. 2006;31(4):1487-505.

Chapter 6
190
Table 1: Interaction between conditions and change in fractional anisotropy (T1-T0) in the model of CAPE positive symptom frequency/distress score (score at T1, corrected for T0). The χ2, uncorrected p-values and Bonferroni corrected p-values (for 740 tests) are provided per region of interest. L=left, R=right.
Frequency Distress
Region of interest χ2 p-value p-valuecorr. χ2 p-value p-value
corr.Genu of corpus callosum 0,000 0,98 1 0,019 0,89 1Body of corpus callosum 5,948 0,01 0,55 2,601 0,11 1Splenium of corpus callosum 0,014 0,90 1 0,009 0,93 1Anterior limb of internal capsule R 0,001 0,97 1 0,090 0,76 1Anterior limb of internal capsule L 0,210 0,65 1 3,120 0,08 1Posterior limb of internal capsule R 0,594 0,44 1 0,168 0,68 1Posterior limb of internal capsule L 2,192 0,14 1 1,807 0,18 1Retrolenticular pt. internal capsule R 0,168 0,68 1 0,008 0,93 1Retrolenticular pt. internal capsule L 0,031 0,86 1 0,034 0,85 1Anterior corona radiata R 0,079 0,78 1 0,039 0,84 1Anterior corona radiata L 0,694 0,40 1 1,470 0,23 1Superior corona radiata R 0,012 0,91 1 0,006 0,94 1Superior corona radiata L 0,506 0,48 1 0,656 0,42 1Posterior corona radiata R 0,167 0,68 1 0,012 0,91 1Posterior corona radiata L 0,028 0,87 1 0,245 0,62 1Posterior thalamic radiation R 0,038 0,85 1 0,556 0,46 1Posterior thalamic radiation L 0,182 0,67 1 1,072 0,30 1Sagittal stratum R 0,695 0,40 1 0,117 0,73 1Sagittal stratum L 0,068 0,79 1 1,121 0,29 1External capsule R 0,304 0,58 1 0,031 0,86 1External capsule L 0,102 0,75 1 1,245 0,26 1Cingulum (cingulate gyrus) R 0,515 0,47 1 0,097 0,76 1Cingulum (cingulate gyrus) L 0,428 0,51 1 0,025 0,88 1Cingulum (hippocampus) R 0,936 0,33 1 0,204 0,65 1Cingulum (hippocampus) L 0,024 0,88 1 0,671 0,41 1Fornix (cres) R 0,008 0,93 1 0,112 0,74 1Fornix (cres) L 0,298 0,58 1 3,231 0,07 1Superior longitudinal fasciculus R 0,467 0,49 1 0,591 0,44 1Superior longitudinal fasciculus L 0,000 1,00 1 0,362 0,55 1Superior fronto-occipital fasciculus R 1,134 0,29 1 2,124 0,15 1Superior fronto-occipital fasciculus L 3,282 0,07 1 0,427 0,51 1Uncinate fasciculus R 0,222 0,64 1 0,084 0,77 1Uncinate fasciculus L 1,085 0,30 1 2,572 0,11 1Tapetum L 0,812 0,37 1 0,676 0,41 1Fornix 0,522 0,47 1 0,149 0,70 1Forceps minor 0,678 0,41 1 0,110 0,74 1Forceps major 0,158 0,69 1 0,150 0,70 1

6
191
ACT AND WHITE MATTER PLASTICITY: AN RCT
Table 2: Interaction between conditions and change in axial diffusivity (T1-T0) in the model of CAPE positive symptom frequency/distress score (score at T1, corrected for T0). The χ2, uncorrected p-values and Bonferroni corrected p-values (for 740 tests) are provided per region of interest. L=left, R=right.
Frequency Distress
Region of interest χ2 p-value p-value corr. χ2 p-value p-value
corr.Genu of corpus callosum 0,353 0,55 1 0,009 0,92 1Body of corpus callosum 0,204 0,65 1 0,207 0,65 1Splenium of corpus callosum 0,115 0,73 1 1,827 0,18 1Anterior limb of internal capsule R 1,811 0,18 1 0,203 0,65 1Anterior limb of internal capsule L 0,554 0,46 1 0,000 1,00 1Posterior limb of internal capsule R 0,430 0,51 1 1,162 0,28 1Posterior limb of internal capsule L 0,038 0,85 1 0,099 0,75 1Retrolenticular pt. internal capsule R 0,536 0,46 1 0,001 0,98 1Retrolenticular pt. internal capsule L 0,490 0,48 1 0,245 0,62 1Anterior corona radiata R 0,185 0,67 1 0,196 0,66 1Anterior corona radiata L 0,227 0,63 1 0,053 0,82 1Superior corona radiata R 0,928 0,34 1 1,029 0,31 1Superior corona radiata L 0,051 0,82 1 0,067 0,80 1Posterior corona radiata R 1,944 0,16 1 3,572 0,06 1Posterior corona radiata L 0,033 0,86 1 0,007 0,93 1Posterior thalamic radiation R 0,609 0,44 1 0,699 0,40 1Posterior thalamic radiation L 0,118 0,73 1 0,373 0,54 1Sagittal stratum R 0,268 0,60 1 0,445 0,50 1Sagittal stratum L 0,785 0,38 1 0,162 0,69 1External capsule R 1,164 0,28 1 0,918 0,34 1External capsule L 0,027 0,87 1 0,046 0,83 1Cingulum (cingulate gyrus) R 0,000 0,99 1 0,983 0,32 1Cingulum (cingulate gyrus) L 0,165 0,68 1 0,000 1,00 1Cingulum (hippocampus) R 0,706 0,40 1 0,780 0,38 1Cingulum (hippocampus) L 0,107 0,74 1 0,068 0,80 1Fornix (cres) R 0,015 0,90 1 0,128 0,72 1Fornix (cres) L 0,012 0,91 1 1,086 0,30 1Superior longitudinal fasciculus R 0,223 0,64 1 0,287 0,59 1Superior longitudinal fasciculus L 0,526 0,47 1 0,135 0,71 1Superior fronto-occipital fasciculus R 2,247 0,13 1 0,099 0,75 1Superior fronto-occipital fasciculus L 8,340 0,004 1 3,634 0,06 1Uncinate fasciculus R 0,918 0,34 1 0,767 0,38 1Uncinate fasciculus L 0,185 0,67 1 0,002 0,96 1Tapetum L 0,730 0,39 1 0,407 0,52 1Fornix 0,040 0,84 1 1,836 0,18 1Forceps minor 4,244 0,04 1 0,640 0,42 1Forceps major 0,977 0,32 1 0,115 0,73 1

Chapter 6
192
Table 3: Interaction between conditions and change in radial diffusivity (T1-T0) in the model of CAPE positive symptom frequency/distress score (score at T1, corrected for T0). The χ2, uncorrected p-values and Bonferroni corrected p-values (for 740 tests) are provided per region of interest. L=left, R=right.
Frequency Distress
Region of interest χ2 p-value p-value corr. χ2 p-value p-value
corr.Genu of corpus callosum 0,080 0,78 1 0,002 0,96 1Body of corpus callosum 2,793 0,09 1 2,468 0,12 1Splenium of corpus callosum 0,041 0,84 1 0,102 0,75 1Anterior limb of internal capsule R 1,010 0,31 1 0,251 0,62 1Anterior limb of internal capsule L 0,022 0,88 1 2,449 0,12 1Posterior limb of internal capsule R 1,226 0,27 1 0,111 0,74 1Posterior limb of internal capsule L 1,276 0,26 1 0,720 0,40 1Retrolenticular pt. internal capsule R 0,095 0,76 1 0,000 0,99 1Retrolenticular pt. internal capsule L 0,000 1,00 1 0,205 0,65 1Anterior corona radiata R 0,019 0,89 1 0,018 0,89 1Anterior corona radiata L 0,179 0,67 1 1,883 0,17 1Superior corona radiata R 0,018 0,89 1 0,290 0,59 1Superior corona radiata L 0,900 0,34 1 1,515 0,22 1Posterior corona radiata R 0,054 0,82 1 0,216 0,64 1Posterior corona radiata L 0,004 0,95 1 0,001 0,97 1Posterior thalamic radiation R 0,110 0,74 1 0,823 0,36 1Posterior thalamic radiation L 0,394 0,53 1 1,634 0,20 1Sagittal stratum R 0,253 0,62 1 0,006 0,94 1Sagittal stratum L 0,800 0,37 1 1,646 0,20 1External capsule R 0,050 0,82 1 0,340 0,56 1External capsule L 0,119 0,73 1 2,119 0,15 1Cingulum (cingulate gyrus) R 0,087 0,77 1 0,033 0,86 1Cingulum (cingulate gyrus) L 0,058 0,81 1 0,060 0,81 1Cingulum (hippocampus) R 0,939 0,33 1 0,008 0,93 1Cingulum (hippocampus) L 2,084 0,15 1 6,505 0,01 1Fornix (cres) R 0,033 0,86 1 0,483 0,49 1Fornix (cres) L 0,718 0,40 1 1,768 0,18 1Superior longitudinal fasciculus R 0,540 0,46 1 1,187 0,28 1Superior longitudinal fasciculus L 0,145 0,70 1 0,218 0,64 1Superior fronto-occipital fasciculus R 0,526 0,47 1 3,590 0,06 1Superior fronto-occipital fasciculus L 0,009 0,92 1 0,496 0,48 1Uncinate fasciculus R 0,476 0,49 1 0,473 0,49 1Uncinate fasciculus L 2,228 0,14 1 5,133 0,02 1Tapetum L 1,601 0,21 1 1,036 0,31 1Fornix 0,290 0,59 1 0,799 0,37 1Forceps minor 0,533 0,47 1 0,140 0,71 1Forceps major 0,017 0,90 1 0,006 0,94 1
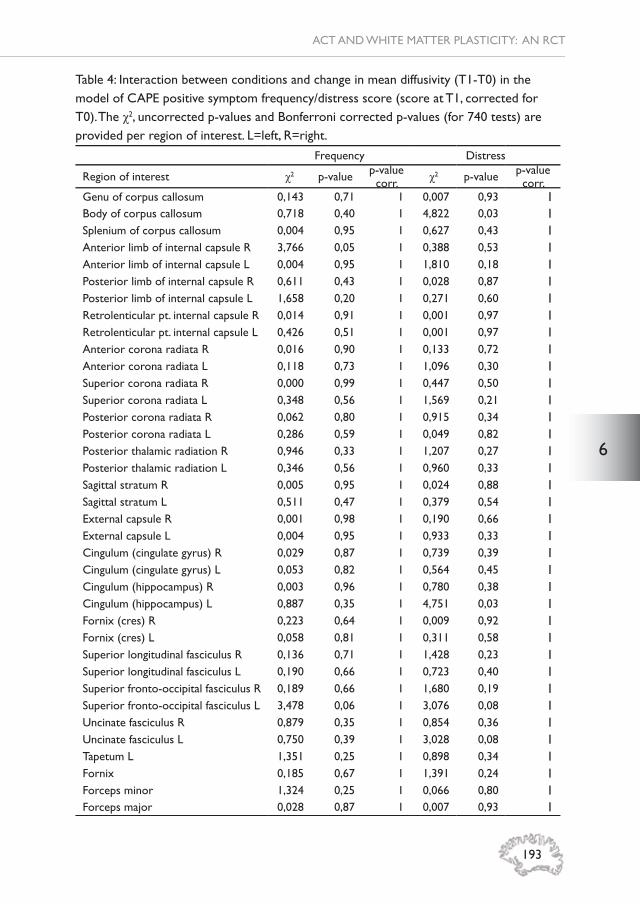
6
193
ACT AND WHITE MATTER PLASTICITY: AN RCT
Table 4: Interaction between conditions and change in mean diffusivity (T1-T0) in the model of CAPE positive symptom frequency/distress score (score at T1, corrected for T0). The χ2, uncorrected p-values and Bonferroni corrected p-values (for 740 tests) are provided per region of interest. L=left, R=right.
Frequency Distress
Region of interest χ2 p-value p-value corr. χ2 p-value p-value
corr.Genu of corpus callosum 0,143 0,71 1 0,007 0,93 1Body of corpus callosum 0,718 0,40 1 4,822 0,03 1Splenium of corpus callosum 0,004 0,95 1 0,627 0,43 1Anterior limb of internal capsule R 3,766 0,05 1 0,388 0,53 1Anterior limb of internal capsule L 0,004 0,95 1 1,810 0,18 1Posterior limb of internal capsule R 0,611 0,43 1 0,028 0,87 1Posterior limb of internal capsule L 1,658 0,20 1 0,271 0,60 1Retrolenticular pt. internal capsule R 0,014 0,91 1 0,001 0,97 1Retrolenticular pt. internal capsule L 0,426 0,51 1 0,001 0,97 1Anterior corona radiata R 0,016 0,90 1 0,133 0,72 1Anterior corona radiata L 0,118 0,73 1 1,096 0,30 1Superior corona radiata R 0,000 0,99 1 0,447 0,50 1Superior corona radiata L 0,348 0,56 1 1,569 0,21 1Posterior corona radiata R 0,062 0,80 1 0,915 0,34 1Posterior corona radiata L 0,286 0,59 1 0,049 0,82 1Posterior thalamic radiation R 0,946 0,33 1 1,207 0,27 1Posterior thalamic radiation L 0,346 0,56 1 0,960 0,33 1Sagittal stratum R 0,005 0,95 1 0,024 0,88 1Sagittal stratum L 0,511 0,47 1 0,379 0,54 1External capsule R 0,001 0,98 1 0,190 0,66 1External capsule L 0,004 0,95 1 0,933 0,33 1Cingulum (cingulate gyrus) R 0,029 0,87 1 0,739 0,39 1Cingulum (cingulate gyrus) L 0,053 0,82 1 0,564 0,45 1Cingulum (hippocampus) R 0,003 0,96 1 0,780 0,38 1Cingulum (hippocampus) L 0,887 0,35 1 4,751 0,03 1Fornix (cres) R 0,223 0,64 1 0,009 0,92 1Fornix (cres) L 0,058 0,81 1 0,311 0,58 1Superior longitudinal fasciculus R 0,136 0,71 1 1,428 0,23 1Superior longitudinal fasciculus L 0,190 0,66 1 0,723 0,40 1Superior fronto-occipital fasciculus R 0,189 0,66 1 1,680 0,19 1Superior fronto-occipital fasciculus L 3,478 0,06 1 3,076 0,08 1Uncinate fasciculus R 0,879 0,35 1 0,854 0,36 1Uncinate fasciculus L 0,750 0,39 1 3,028 0,08 1Tapetum L 1,351 0,25 1 0,898 0,34 1Fornix 0,185 0,67 1 1,391 0,24 1Forceps minor 1,324 0,25 1 0,066 0,80 1Forceps major 0,028 0,87 1 0,007 0,93 1
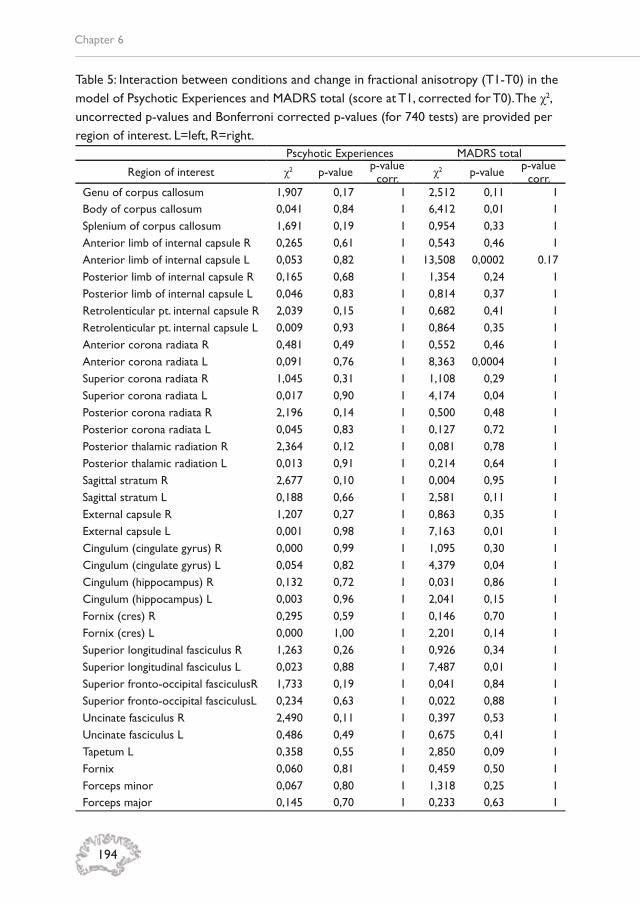
Chapter 6
194
Table 5: Interaction between conditions and change in fractional anisotropy (T1-T0) in the model of Psychotic Experiences and MADRS total (score at T1, corrected for T0). The χ2, uncorrected p-values and Bonferroni corrected p-values (for 740 tests) are provided per region of interest. L=left, R=right.
Pscyhotic Experiences MADRS total
Region of interest χ2 p-value p-value corr. χ2 p-value p-value
corr.Genu of corpus callosum 1,907 0,17 1 2,512 0,11 1Body of corpus callosum 0,041 0,84 1 6,412 0,01 1Splenium of corpus callosum 1,691 0,19 1 0,954 0,33 1Anterior limb of internal capsule R 0,265 0,61 1 0,543 0,46 1Anterior limb of internal capsule L 0,053 0,82 1 13,508 0,0002 0.17Posterior limb of internal capsule R 0,165 0,68 1 1,354 0,24 1Posterior limb of internal capsule L 0,046 0,83 1 0,814 0,37 1Retrolenticular pt. internal capsule R 2,039 0,15 1 0,682 0,41 1Retrolenticular pt. internal capsule L 0,009 0,93 1 0,864 0,35 1Anterior corona radiata R 0,481 0,49 1 0,552 0,46 1Anterior corona radiata L 0,091 0,76 1 8,363 0,0004 1Superior corona radiata R 1,045 0,31 1 1,108 0,29 1Superior corona radiata L 0,017 0,90 1 4,174 0,04 1Posterior corona radiata R 2,196 0,14 1 0,500 0,48 1Posterior corona radiata L 0,045 0,83 1 0,127 0,72 1Posterior thalamic radiation R 2,364 0,12 1 0,081 0,78 1Posterior thalamic radiation L 0,013 0,91 1 0,214 0,64 1Sagittal stratum R 2,677 0,10 1 0,004 0,95 1Sagittal stratum L 0,188 0,66 1 2,581 0,11 1External capsule R 1,207 0,27 1 0,863 0,35 1External capsule L 0,001 0,98 1 7,163 0,01 1Cingulum (cingulate gyrus) R 0,000 0,99 1 1,095 0,30 1Cingulum (cingulate gyrus) L 0,054 0,82 1 4,379 0,04 1Cingulum (hippocampus) R 0,132 0,72 1 0,031 0,86 1Cingulum (hippocampus) L 0,003 0,96 1 2,041 0,15 1Fornix (cres) R 0,295 0,59 1 0,146 0,70 1Fornix (cres) L 0,000 1,00 1 2,201 0,14 1Superior longitudinal fasciculus R 1,263 0,26 1 0,926 0,34 1Superior longitudinal fasciculus L 0,023 0,88 1 7,487 0,01 1Superior fronto-occipital fasciculusR 1,733 0,19 1 0,041 0,84 1Superior fronto-occipital fasciculusL 0,234 0,63 1 0,022 0,88 1Uncinate fasciculus R 2,490 0,11 1 0,397 0,53 1Uncinate fasciculus L 0,486 0,49 1 0,675 0,41 1Tapetum L 0,358 0,55 1 2,850 0,09 1Fornix 0,060 0,81 1 0,459 0,50 1Forceps minor 0,067 0,80 1 1,318 0,25 1Forceps major 0,145 0,70 1 0,233 0,63 1

6
195
ACT AND WHITE MATTER PLASTICITY: AN RCT
Table 6: Interaction between conditions and change in axial diffusivity (T1-T0) in the model of Psychotic Experiences and MADRS total (score at T1, corrected for T0). The χ2, uncorrected p-values and Bonferroni corrected p-values (for 740 tests) are provided per region of interest. L=left, R=right.
Pscyhotic Experiences MADRS total
Region of interest χ2 p-value p-value corr. χ2 p-value p-value
corr.Genu of corpus callosum 0,963 0,33 1 0,954 0,33 1Body of corpus callosum 0,887 0,35 1 2,031 0,15 1Splenium of corpus callosum 4,121 0,04 1 0,039 0,84 1Anterior limb of internal capsule R 1,607 0,20 1 3,511 0,06 1Anterior limb of internal capsule L 1,223 0,27 1 0,474 0,49 1Posterior limb of internal capsule R 3,587 0,06 1 0,141 0,71 1Posterior limb of internal capsule L 0,294 0,59 1 0,064 0,80 1Retrolenticular pt. internal capsule R 0,138 0,71 1 0,098 0,75 1Retrolenticular pt. internal capsule L 0,008 0,93 1 0,001 0,98 1Anterior corona radiata R 5,228 0,02 1 0,966 0,33 1Anterior corona radiata L 1,533 0,22 1 0,819 0,37 1Superior corona radiata R 2,263 0,13 1 0,030 0,86 1Superior corona radiata L 0,000 0,98 1 0,000 1,00 1Posterior corona radiata R 3,953 0,05 1 0,017 0,90 1Posterior corona radiata L 0,110 0,74 1 1,623 0,20 1Posterior thalamic radiation R 0,156 0,69 1 0,526 0,47 1Posterior thalamic radiation L 0,055 0,81 1 1,452 0,23 1Sagittal stratum R 7,330 0,01 1 0,421 0,52 1Sagittal stratum L 0,118 0,73 1 0,000 1,00 1External capsule R 2,041 0,15 1 0,377 0,54 1External capsule L 0,374 0,54 1 0,029 0,86 1Cingulum (cingulate gyrus) R 0,938 0,33 1 0,545 0,46 1Cingulum (cingulate gyrus) L 0,074 0,79 1 2,010 0,16 1Cingulum (hippocampus) R 0,898 0,34 1 2,262 0,13 1Cingulum (hippocampus) L 3,986 0,05 1 0,565 0,45 1Fornix (cres) R 0,272 0,60 1 0,353 0,55 1Fornix (cres) L 0,029 0,87 1 0,366 0,55 1Superior longitudinal fasciculus R 2,841 0,09 1 0,056 0,81 1Superior longitudinal fasciculus L 0,813 0,37 1 0,097 0,76 1Superior fronto-occipital fasciculus R 0,082 0,77 1 2,389 0,12 1Superior fronto-occipital fasciculus L 0,476 0,49 1 1,188 0,28 1Uncinate fasciculus R 6,541 0,01 1 0,002 0,97 1Uncinate fasciculus L 1,178 0,0005 0,44 0,004 0,95 1Tapetum L 0,496 0,48 1 0,040 0,84 1Fornix 0,163 0,69 1 0,337 0,56 1Forceps minor 3,886 0,05 1 3,587 0,06 1Forceps major 0,011 0,92 1 0,890 0,35 1

Chapter 6
196
Table 7: Interaction between conditions and change in radial diffusivity (T1-T0) in the model of Psychotic Experiences and MADRS total (score at T1, corrected for T0). The χ2, uncorrected p-values and Bonferroni corrected p-values (for 740 tests) are provided per region of interest. L=left, R=right.
Pscyhotic Experiences MADRS total
Region of interest χ2 p-value p-value corr. χ2 p-value p-value
corr.Genu of corpus callosum 2,064 0,15 1 1,052 0,30 1Body of corpus callosum 0,122 0,73 1 3,199 0,07 1Splenium of corpus callosum 2,663 0,10 1 0,816 0,37 1Anterior limb of internal capsule R 1,304 0,25 1 0,079 0,78 1Anterior limb of internal capsule L 0,286 0,59 1 10,684 0,001 0.80Posterior limb of internal capsule R 0,958 0,33 1 1,073 0,30 1Posterior limb of internal capsule L 0,116 0,73 1 2,453 0,12 1Retrolenticular pt. internal capsule R 2,282 0,13 1 0,685 0,41 1Retrolenticular pt. internal capsule L 0,001 0,97 1 0,967 0,33 1Anterior corona radiata R 5,470 0,02 1 0,108 0,74 1Anterior corona radiata L 0,627 0,43 1 4,518 0,03 1Superior corona radiata R 4,936 0,03 1 0,976 0,32 1Superior corona radiata L 0,001 0,98 1 3,756 0,05 1Posterior corona radiata R 5,756 0,02 1 0,346 0,56 1Posterior corona radiata L 0,069 0,79 1 0,190 0,66 1Posterior thalamic radiation R 3,365 0,07 1 0,043 0,84 1Posterior thalamic radiation L 0,027 0,87 1 0,082 0,77 1Sagittal stratum R 4,795 0,03 1 0,005 0,94 1Sagittal stratum L 0,638 0,42 1 2,740 0,10 1External capsule R 4,301 0,04 1 0,048 0,83 1External capsule L 0,080 0,78 1 8,378 0,004 1Cingulum (cingulate gyrus) R 0,378 0,54 1 1,004 0,32 1Cingulum (cingulate gyrus) L 0,201 0,65 1 2,014 0,16 1Cingulum (hippocampus) R 0,911 0,34 1 0,983 0,32 1Cingulum (hippocampus) L 1,076 0,30 1 0,412 0,52 1Fornix (cres) R 2,152 0,14 1 0,447 0,50 1Fornix (cres) L 0,000 0,99 1 1,703 0,19 1Superior longitudinal fasciculus R 1,839 0,18 1 0,657 0,42 1Superior longitudinal fasciculus L 0,052 0,82 1 5,716 0,02 1Superior fronto-occipital fasciculus R 1,873 0,17 1 0,195 0,66 1Superior fronto-occipital fasciculus L 0,419 0,52 1 2,343 0,13 1Uncinate fasciculus R 6,994 0,01 1 0,486 0,49 1Uncinate fasciculus L 0,471 0,49 1 2,032 0,15 1Tapetum L 0,037 0,85 1 2,054 0,15 1Fornix 0,018 0,89 1 0,289 0,59 1Forceps minor 2,713 0,10 1 0,242 0,62 1Forceps major 0,929 0,34 1 0,896 0,34 1

6
197
ACT AND WHITE MATTER PLASTICITY: AN RCT
Table 8: Interaction between conditions and change in mean diffusivity (T1-T0) in the model of Psychotic Experiences and MADRS total (score at T1, corrected for T0). The χ2, uncorrected p-values and Bonferroni corrected p-values (for 740 tests) are provided per region of interest. L=left, R=right.
Pscyhotic Experiences MADRS total
Region of interest χ2 p-value p-value corr. χ2 p-value p-value
corr.Genu of corpus callosum 1,740 0,19 1 0,004 0,95 1Body of corpus callosum 1,078 0,30 1 0,890 0,35 1Splenium of corpus callosum 3,973 0,05 1 0,573 0,45 1Anterior limb of internal capsule R 5,486 0,02 1 0,066 0,80 1Anterior limb of internal capsule L 0,599 0,44 1 5,576 0,02 1Posterior limb of internal capsule R 3,590 0,06 1 0,413 0,52 1Posterior limb of internal capsule L 0,000 0,99 1 4,445 0,04 1Retrolenticular pt. internal capsule R 1,436 0,23 1 0,868 0,35 1Retrolenticular pt. internal capsule L 0,012 0,91 1 0,477 0,49 1Anterior corona radiata R 12,100 0,0005 0,37 0,024 0,88 1Anterior corona radiata L 3,778 0,05 1 1,278 0,26 1Superior corona radiata R 7,288 0,01 1 0,304 0,58 1Superior corona radiata L 0,007 0,93 1 2,129 0,14 1Posterior corona radiata R 6,789 0,01 1 0,101 0,75 1Posterior corona radiata L 0,012 0,91 1 0,078 0,78 1Posterior thalamic radiation R 1,920 0,17 1 0,207 0,65 1Posterior thalamic radiation L 0,002 0,96 1 0,375 0,54 1Sagittal stratum R 7,038 0,01 1 0,042 0,84 1Sagittal stratum L 1,177 0,28 1 1,234 0,27 1External capsule R 4,304 0,04 1 0,085 0,77 1External capsule L 1,333 0,25 1 5,000 0,03 1Cingulum (cingulate gyrus) R 1,911 0,17 1 0,603 0,44 1Cingulum (cingulate gyrus) L 1,220 0,27 1 0,508 0,48 1Cingulum (hippocampus) R 2,249 0,13 1 2,959 0,09 1Cingulum (hippocampus) L 10,504 0,0001 1 0,010 0,92 1Fornix (cres) R 1,953 0,16 1 0,789 0,37 1Fornix (cres) L 0,036 0,85 1 0,150 0,70 1Superior longitudinal fasciculus R 2,218 0,14 1 0,297 0,59 1Superior longitudinal fasciculus L 0,792 0,37 1 5,053 0,02 1Superior fronto-occipital fasciculus R 1,322 0,25 1 1,805 0,18 1Superior fronto-occipital fasciculus L 0,409 0,52 1 3,764 0,05 1Uncinate fasciculus R 11,082 0,0009 0,64 0,214 0,64 1Uncinate fasciculus L 9,529 0,002 1 1,580 0,21 1Tapetum L 0,217 0,64 1 1,008 0,32 1Fornix 0,051 0,82 1 0,031 0,86 1Forceps minor 5,657 0,02 1 0,010 0,92 1Forceps major 1,175 0,28 1 1,402 0,24 1

Chapter 6
198
Table 9: Interaction between conditions and change in fractional anisotropy and axial diffusivity (T1-T0) in the model of Negative Affect (score at T1, corrected for T0). The χ2, uncorrected p-values and Bonferroni corrected p-values (for 740 tests) are provided per region of interest. L=left, R=right.
Fractional Anisotropy NA Axial Diffusivity NA
Region of interest χ2 p-value p-value corr. χ2 p-value p-value
corr.Genu of corpus callosum 0,70 0,40 1 0,74 0,39 1Body of corpus callosum 0,31 0,58 1 2,00 0,16 1Splenium of corpus callosum 1,02 0,31 1 1,72 0,19 1Anterior limb of internal capsule R 0,06 0,80 1 2,46 0,12 1Anterior limb of internal capsule L 0,45 0,50 1 8,86 0,003 1Posterior limb of internal capsule R 0,97 0,32 1 2,49 0,11 1Posterior limb of internal capsule L 0,04 0,84 1 1,00 0,32 1Retrolenticular pt. internal capsule R 0,65 0,42 1 0,20 1,00 1Retrolenticular pt. internal capsule L 0,12 0,73 1 1,15 0,28 1Anterior corona radiata R 0,07 0,80 1 2,93 0,09 1Anterior corona radiata L 1,44 0,23 1 9,74 0,002 1Superior corona radiata R 0,51 0,48 1 4,46 0,03 1Superior corona radiata L 0,08 0,78 1 1,31 0,25 1Posterior corona radiata R 0,02 0,90 1 3,31 0,07 1Posterior corona radiata L 0,20 0,65 1 1,08 0,30 1Posterior thalamic radiation R 0,11 0,74 1 0,43 0,51 1Posterior thalamic radiation L 0,79 0,37 1 0,10 0,75 1Sagittal stratum R 0,36 0,55 1 4,91 0,03 1Sagittal stratum L 0,38 0,54 1 0,54 0,46 1External capsule R 1,86 0,17 1 3,07 0,08 1External capsule L 0,16 0,69 1 2,05 0,15 1Cingulum (cingulate gyrus) R 5,28 0,02 1 8,53 0,003 1Cingulum (cingulate gyrus) L 0,07 0,80 1 3,01 0,08 1Cingulum (hippocampus) R 6,60 0,01 1 8,13 0,004 1Cingulum (hippocampus) L 0,48 0,49 1 4,04 0,04 1Fornix (cres) R 10,67 0,001 0,80 4,12 0,04 1Fornix (cres) L 0,66 0,42 1 2,23 0,14 1Superior longitudinal fasciculus R 0,33 0,56 1 4,30 0,04 1Superior longitudinal fasciculus L 0,03 0,87 1 3,63 0,06 1Superior fronto-occipital fasciculus R 0,02 0,89 1 0,02 0,89 1Superior fronto-occipital fasciculus L 3,37 0,07 1 3,20 0,07 1Uncinate fasciculus R 0,33 0,57 1 6,05 0,01 1Uncinate fasciculus L 1,74 0,19 1 11,35 0,0008 0,56Tapetum L 0,95 0,33 1 0,80 0,37 1Fornix 12,50 0,0004 0,30 1,71 0,19 1Forceps minor 0,12 0,73 1 7,75 0,01 1Forceps major 0,01 0,90 1 0,04 0,84 1
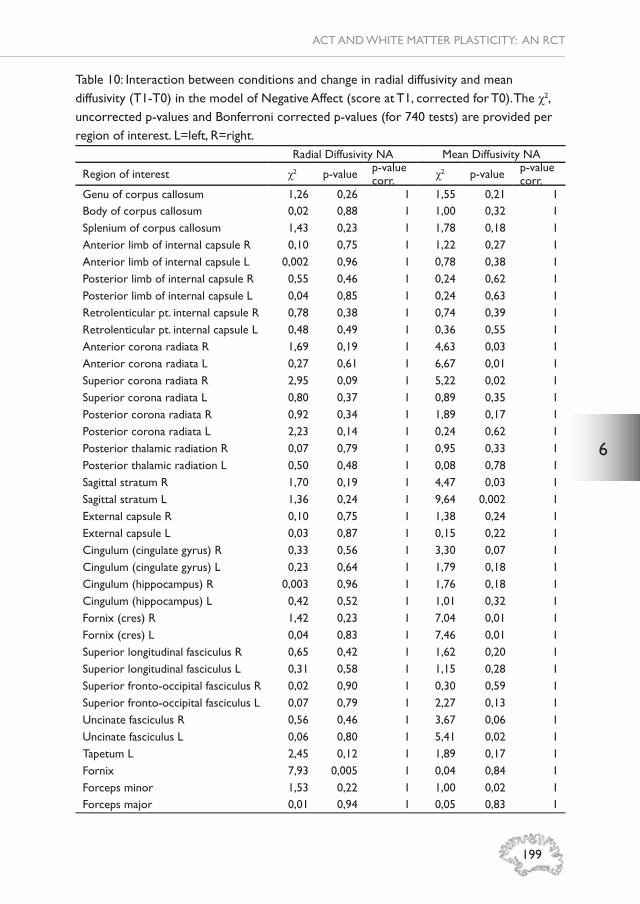
6
199
ACT AND WHITE MATTER PLASTICITY: AN RCT
Table 10: Interaction between conditions and change in radial diffusivity and mean diffusivity (T1-T0) in the model of Negative Affect (score at T1, corrected for T0). The χ2, uncorrected p-values and Bonferroni corrected p-values (for 740 tests) are provided per region of interest. L=left, R=right.
Radial Diffusivity NA Mean Diffusivity NA
Region of interest χ2 p-value p-value corr. χ2 p-value p-value
corr.Genu of corpus callosum 1,26 0,26 1 1,55 0,21 1Body of corpus callosum 0,02 0,88 1 1,00 0,32 1Splenium of corpus callosum 1,43 0,23 1 1,78 0,18 1Anterior limb of internal capsule R 0,10 0,75 1 1,22 0,27 1Anterior limb of internal capsule L 0,002 0,96 1 0,78 0,38 1Posterior limb of internal capsule R 0,55 0,46 1 0,24 0,62 1Posterior limb of internal capsule L 0,04 0,85 1 0,24 0,63 1Retrolenticular pt. internal capsule R 0,78 0,38 1 0,74 0,39 1Retrolenticular pt. internal capsule L 0,48 0,49 1 0,36 0,55 1Anterior corona radiata R 1,69 0,19 1 4,63 0,03 1Anterior corona radiata L 0,27 0,61 1 6,67 0,01 1Superior corona radiata R 2,95 0,09 1 5,22 0,02 1Superior corona radiata L 0,80 0,37 1 0,89 0,35 1Posterior corona radiata R 0,92 0,34 1 1,89 0,17 1Posterior corona radiata L 2,23 0,14 1 0,24 0,62 1Posterior thalamic radiation R 0,07 0,79 1 0,95 0,33 1Posterior thalamic radiation L 0,50 0,48 1 0,08 0,78 1Sagittal stratum R 1,70 0,19 1 4,47 0,03 1Sagittal stratum L 1,36 0,24 1 9,64 0,002 1External capsule R 0,10 0,75 1 1,38 0,24 1External capsule L 0,03 0,87 1 0,15 0,22 1Cingulum (cingulate gyrus) R 0,33 0,56 1 3,30 0,07 1Cingulum (cingulate gyrus) L 0,23 0,64 1 1,79 0,18 1Cingulum (hippocampus) R 0,003 0,96 1 1,76 0,18 1Cingulum (hippocampus) L 0,42 0,52 1 1,01 0,32 1Fornix (cres) R 1,42 0,23 1 7,04 0,01 1Fornix (cres) L 0,04 0,83 1 7,46 0,01 1Superior longitudinal fasciculus R 0,65 0,42 1 1,62 0,20 1Superior longitudinal fasciculus L 0,31 0,58 1 1,15 0,28 1Superior fronto-occipital fasciculus R 0,02 0,90 1 0,30 0,59 1Superior fronto-occipital fasciculus L 0,07 0,79 1 2,27 0,13 1Uncinate fasciculus R 0,56 0,46 1 3,67 0,06 1Uncinate fasciculus L 0,06 0,80 1 5,41 0,02 1Tapetum L 2,45 0,12 1 1,89 0,17 1Fornix 7,93 0,005 1 0,04 0,84 1Forceps minor 1,53 0,22 1 1,00 0,02 1Forceps major 0,01 0,94 1 0,05 0,83 1

Chapter 6
200
Table 11: Interaction between conditions and change in local effi ciency (T1-T0) in the model of CAPE positive symptom frequency/distress score (score at T1, corrected for T0). The χ2, uncorrected p-values and Bonferroni corrected p-values (for 900 tests) are provided per region of interest. L=left, R=right.
Frequency Distress
Region of interest χ2 p-value p-valuecorr. χ2 p-value p-value
corr.Precentral L 0,276 0,60 1 0,261 0,61 1Precentral R 0,052 0,82 1 0,888 0,35 1Frontal Superior L 0,002 0,96 1 0,346 0,56 1Frontal Superior R 0,059 0,81 1 0,214 0,64 1Superior frontal, orbital part L 0,318 0,57 1 0,985 0,32 1Superior frontal, orbital part R 1,278 0,26 1 2,323 0,13 1Frontal Middle L 0,722 0,40 1 2,658 0,10 1Frontal Middle R 0,014 0,91 1 0,034 0,85 1Frontal Middle, orbital part L 0,254 0,61 1 0,072 0,79 1Frontal Middle, orbital part R 0,490 0,48 1 1,724 0,19 1Frontal Inferior, pars opercularis L 1,474 0,22 1 0,188 0,66 1Frontal Inferior, pars opercularis R 7,936 0,00 0,44 4,502 0,03 1Frontal Inferior, pars triangularis L 1,298 0,25 1 1,990 0,16 1Frontal Inferior, pars triangularis R 0,515 0,47 1 0,093 0,76 1Frontal Inferior, pars orbitalis L 0,338 0,56 1 1,762 0,18 1Frontal Inferior, pars orbitalis R 0,672 0,41 1 2,546 0,11 1Rolandic Operculum L 0,492 0,48 1 0,024 0,88 1Rolandic Operculum R 0,171 0,68 1 0,611 0,43 1Supplementary Motor Area L 0,392 0,53 1 2,213 0,14 1Supplementary Motor Area R 0,376 0,54 1 0,726 0,39 1Olfactory cortex L 0,634 0,43 1 2,035 0,15 1Olfactory cortex R 0,006 0,94 1 0,553 0,46 1Frontal Superior Medial L 0,416 0,52 1 0,179 0,67 1Frontal Superior Medial R 1,274 0,26 1 0,202 0,65 1Frontal Medial Orbito L 0,885 0,35 1 0,000 1,00 1Frontal Medial Orbito R 0,017 0,90 1 0,383 0,54 1Rectus L 0,293 0,59 1 1,467 0,23 1Rectus R 0,589 0,44 1 0,578 0,45 1Insula L 0,312 0,58 1 0,852 0,36 1Insula R 1,115 0,29 1 0,026 0,87 1Cingulum Anterior L 3,876 0,05 1 1,673 0,20 1Cingulum Anterior R 0,325 0,57 1 0,371 0,54 1Cingulum Middle L 4,877 0,03 1 5,265 0,02 1Cingulum Middle R 0,377 0,54 1 0,882 0,35 1Cingulum Posterior L 1,388 0,24 1 0,101 0,75 1Cingulum Posterior R 0,280 0,60 1 0,004 0,95 1Hippocampus L 0,131 0,72 1 1,887 0,17 1Hippocampus R 0,039 0,84 1 0,716 0,40 1ParaHippocampal L 0,404 0,53 1 0,332 0,56 1ParaHippocampal R 0,311 0,58 1 0,365 0,55 1Amygdala L 0,257 0,61 1 0,001 0,98 1Amygdala R 0,076 0,78 1 0,304 0,58 1

6
201
ACT AND WHITE MATTER PLASTICITY: AN RCT
Region of interest χ2 p-value p-valuecorr. χ2 p-value p-value
corr.Calcarine L 0,097 0,76 1 0,200 0,65 1Calcarine R 0,705 0,40 1 0,539 0,46 1Cuneus L 0,138 0,71 1 0,058 0,81 1Cuneus R 0,309 0,58 1 0,036 0,85 1Lingual L 0,818 0,37 1 0,088 0,77 1Lingual R 0,641 0,42 1 0,060 0,81 1Occipital Superior L 0,141 0,71 1 0,017 0,90 1Occipital Superior R 0,160 0,69 1 1,185 0,28 1Occipital Middle L 0,122 0,73 1 0,082 0,77 1Occipital Middle R 1,484 0,22 1 2,453 0,12 1Occipital Inferior L 2,007 0,16 1 0,844 0,36 1Occipital Inferior R 4,426 0,04 1 4,022 0,04 1Fusiform L 0,241 0,62 1 0,608 0,44 1Fusiform R 0,103 0,75 1 0,008 0,93 1Postcentral L 0,014 0,91 1 0,096 0,76 1Postcentral R 0,497 0,48 1 0,097 0,75 1Parietal Superior L 0,031 0,86 1 0,442 0,51 1Parietal Superior R 0,301 0,58 1 0,130 0,72 1Parietal Inferior L 0,361 0,55 1 2,321 0,13 1Parietal Inferior R 0,058 0,81 1 0,545 0,46 1Supramarginal L 1,487 0,22 1 0,528 0,47 1Supramarginal R 0,258 0,61 1 0,402 0,53 1Angular L 0,102 0,75 1 0,326 0,57 1Angular R 0,068 0,79 1 0,084 0,77 1Precuneus L 0,037 0,85 1 0,829 0,36 1Precuneus R 0,014 0,91 1 0,068 0,79 1Paracentral Lobule L 5,659 0,02 1 6,903 0,01 0,77Paracentral Lobule R 0,591 0,44 1 0,473 0,49 1Caudate L 0,015 0,90 1 0,511 0,47 1Caudate R 2,380 0,12 1 5,722 0,02 1Putamen L 0,810 0,37 1 0,049 0,83 1Putamen R 0,101 0,75 1 0,008 0,93 1Pallidum L 1,369 0,24 1 0,001 0,98 1Pallidum R 0,036 0,85 1 0,114 0,74 1Thalamus L 0,573 0,45 1 0,006 0,94 1Thalamus R 0,067 0,80 1 0,503 0,48 1Heschl L 0,052 0,82 1 0,288 0,59 1Heschl R 0,374 0,54 1 1,390 0,24 1Temporal Superior L 0,045 0,83 1 0,430 0,51 1Temporal Superior R 0,351 0,55 1 3,475 0,06 1Temporal Pole Superior L 0,080 0,78 1 0,083 0,77 1Temporal Pole Superior R 0,451 0,50 1 0,000 1,00 1Temporal Middle L 0,198 0,66 1 0,749 0,39 1Temporal Middle R 1,494 0,22 1 0,415 0,52 1Temporal Pole Middle L 0,026 0,87 1 0,016 0,90 1Temporal Pole Middle R 0,707 0,40 1 0,354 0,55 1Temporal Inferior L 1,267 0,26 1 0,228 0,63 1Temporal Inferior R 0,081 0,78 1 0,000 0,99 1
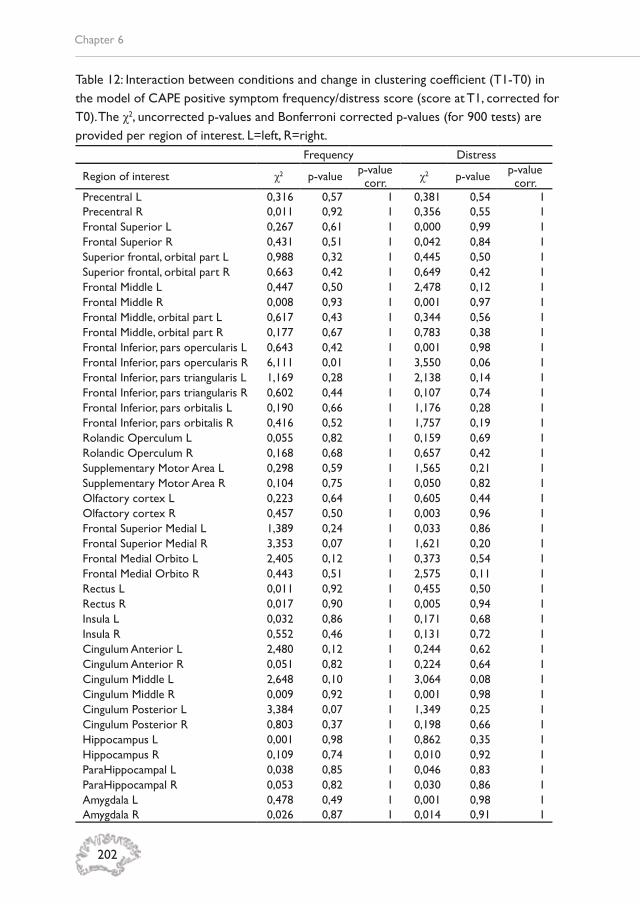
Chapter 6
202
Table 12: Interaction between conditions and change in clustering coeffi cient (T1-T0) in the model of CAPE positive symptom frequency/distress score (score at T1, corrected for T0). The χ2, uncorrected p-values and Bonferroni corrected p-values (for 900 tests) are provided per region of interest. L=left, R=right.
Frequency Distress
Region of interest χ2 p-value p-valuecorr. χ2 p-value p-value
corr.Precentral L 0,316 0,57 1 0,381 0,54 1Precentral R 0,011 0,92 1 0,356 0,55 1Frontal Superior L 0,267 0,61 1 0,000 0,99 1Frontal Superior R 0,431 0,51 1 0,042 0,84 1Superior frontal, orbital part L 0,988 0,32 1 0,445 0,50 1Superior frontal, orbital part R 0,663 0,42 1 0,649 0,42 1Frontal Middle L 0,447 0,50 1 2,478 0,12 1Frontal Middle R 0,008 0,93 1 0,001 0,97 1Frontal Middle, orbital part L 0,617 0,43 1 0,344 0,56 1Frontal Middle, orbital part R 0,177 0,67 1 0,783 0,38 1Frontal Inferior, pars opercularis L 0,643 0,42 1 0,001 0,98 1Frontal Inferior, pars opercularis R 6,111 0,01 1 3,550 0,06 1Frontal Inferior, pars triangularis L 1,169 0,28 1 2,138 0,14 1Frontal Inferior, pars triangularis R 0,602 0,44 1 0,107 0,74 1Frontal Inferior, pars orbitalis L 0,190 0,66 1 1,176 0,28 1Frontal Inferior, pars orbitalis R 0,416 0,52 1 1,757 0,19 1Rolandic Operculum L 0,055 0,82 1 0,159 0,69 1Rolandic Operculum R 0,168 0,68 1 0,657 0,42 1Supplementary Motor Area L 0,298 0,59 1 1,565 0,21 1Supplementary Motor Area R 0,104 0,75 1 0,050 0,82 1Olfactory cortex L 0,223 0,64 1 0,605 0,44 1Olfactory cortex R 0,457 0,50 1 0,003 0,96 1Frontal Superior Medial L 1,389 0,24 1 0,033 0,86 1Frontal Superior Medial R 3,353 0,07 1 1,621 0,20 1Frontal Medial Orbito L 2,405 0,12 1 0,373 0,54 1Frontal Medial Orbito R 0,443 0,51 1 2,575 0,11 1Rectus L 0,011 0,92 1 0,455 0,50 1Rectus R 0,017 0,90 1 0,005 0,94 1Insula L 0,032 0,86 1 0,171 0,68 1Insula R 0,552 0,46 1 0,131 0,72 1Cingulum Anterior L 2,480 0,12 1 0,244 0,62 1Cingulum Anterior R 0,051 0,82 1 0,224 0,64 1Cingulum Middle L 2,648 0,10 1 3,064 0,08 1Cingulum Middle R 0,009 0,92 1 0,001 0,98 1Cingulum Posterior L 3,384 0,07 1 1,349 0,25 1Cingulum Posterior R 0,803 0,37 1 0,198 0,66 1Hippocampus L 0,001 0,98 1 0,862 0,35 1Hippocampus R 0,109 0,74 1 0,010 0,92 1ParaHippocampal L 0,038 0,85 1 0,046 0,83 1ParaHippocampal R 0,053 0,82 1 0,030 0,86 1Amygdala L 0,478 0,49 1 0,001 0,98 1Amygdala R 0,026 0,87 1 0,014 0,91 1

6
203
ACT AND WHITE MATTER PLASTICITY: AN RCT
Region of interest χ2 p-value p-valuecorr. χ2 p-value p-value
corr.Calcarine L 0,007 0,93 1 0,053 0,82 1Calcarine R 1,297 0,25 1 0,985 0,32 1Cuneus L 0,402 0,53 1 0,050 0,82 1Cuneus R 0,552 0,46 1 0,208 0,65 1Lingual L 1,469 0,23 1 0,671 0,41 1Lingual R 1,570 0,21 1 0,549 0,46 1Occipital Superior L 0,138 0,71 1 0,086 0,77 1Occipital Superior R 0,002 0,97 1 0,424 0,51 1Occipital Middle L 0,544 0,46 1 0,050 0,82 1Occipital Middle R 0,871 0,35 1 2,422 0,12 1Occipital Inferior L 1,557 0,21 1 0,148 0,70 1Occipital Inferior R 3,871 0,05 1 1,925 0,17 1Fusiform L 0,096 0,76 1 0,527 0,47 1Fusiform R 0,530 0,47 1 0,160 0,69 1Postcentral L 0,904 0,34 1 1,135 0,29 1Postcentral R 0,038 0,84 1 0,019 0,89 1Parietal Superior L 0,200 0,65 1 0,005 0,94 1Parietal Superior R 0,892 0,34 1 0,798 0,37 1Parietal Inferior L 0,439 0,51 1 2,830 0,09 1Parietal Inferior R 0,015 0,90 1 0,212 0,65 1Supramarginal L 1,366 0,24 1 1,002 0,32 1Supramarginal R 0,325 0,57 1 0,360 0,55 1Angular L 0,001 0,98 1 0,220 0,64 1Angular R 0,051 0,82 1 0,079 0,78 1Precuneus L 0,172 0,68 1 0,284 0,59 1Precuneus R 0,422 0,52 1 0,150 0,70 1Paracentral Lobule L 4,637 0,03 1 5,967 0,01 1Paracentral Lobule R 0,059 0,81 1 0,014 0,91 1Caudate L 0,046 0,83 1 0,052 0,82 1Caudate R 1,423 0,23 1 3,380 0,07 1Putamen L 1,964 0,16 1 0,495 0,48 1Putamen R 0,495 0,48 1 0,272 0,60 1Pallidum L 2,159 0,14 1 0,085 0,77 1Pallidum R 0,393 0,53 1 0,124 0,72 1Thalamus L 1,310 0,25 1 0,201 0,65 1Thalamus R 0,006 0,94 1 0,029 0,87 1Heschl L 0,169 0,68 1 0,565 0,45 1Heschl R 0,301 0,58 1 0,495 0,48 1Temporal Superior L 0,007 0,93 1 0,146 0,70 1Temporal Superior R 0,829 0,36 1 5,862 0,02 1Temporal Pole Superior L 0,209 0,65 1 0,002 0,97 1Temporal Pole Superior R 0,325 0,57 1 0,098 0,75 1Temporal Middle L 0,936 0,33 1 0,023 0,88 1Temporal Middle R 2,921 0,09 1 1,289 0,26 1Temporal Pole Middle L 0,173 0,68 1 0,075 0,78 1Temporal Pole Middle R 0,259 0,61 1 0,015 0,90 1Temporal Inferior L 2,009 0,16 1 0,002 0,96 1Temporal Inferior R 0,114 0,74 1 0,874 0,35 1

Chapter 6
204
Table 13: Interaction between conditions and change in local effi ciency (T1-T0) in the model of Psychotic Experiences and MADRS total (score at T1, corrected for T0). The χ2, uncorrected p-values and Bonferroni corrected p-values (for 900 tests) are provided per region of interest. L=left, R=right.
Psychotic Experiences MADRS total
Region of interest χ2 p-value p-valuecorr. χ2 p-value p-value
corr.Precentral L 0,369 0,54 1 5,367 0,02 1Precentral R 0,063 0,80 1 0,279 0,60 1Frontal Superior L 0,359 0,55 1 2,255 0,13 1Frontal Superior R 4,727 0,03 1 1,669 0,20 1Superior frontal, orbital part L 0,012 0,91 1 0,022 0,88 1Superior frontal, orbital part R 1,293 0,26 1 5,200 0,02 1Frontal Middle L 0,269 0,60 1 4,191 0,04 1Frontal Middle R 0,030 0,86 1 0,995 0,32 1Frontal Middle, orbital part L 0,007 0,93 1 1,889 0,17 1Frontal Middle, orbital part R 1,147 0,28 1 0,708 0,40 1Frontal Inferior, pars opercularis L 0,631 0,43 1 0,965 0,33 1Frontal Inferior, pars opercularis R 0,845 0,36 1 1,002 0,32 1Frontal Inferior, pars triangularis L 4,016 0,05 1 2,033 0,15 1Frontal Inferior, pars triangularis R 6,237 0,01 1 0,269 0,60 1Frontal Inferior, pars orbitalis L 0,056 0,81 1 0,176 0,67 1Frontal Inferior, pars orbitalis R 0,358 0,55 1 1,807 0,18 1Rolandic Operculum L 0,518 0,47 1 0,114 0,74 1Rolandic Operculum R 0,062 0,80 1 0,005 0,95 1Supplementary Motor Area L 3,409 0,06 1 3,498 0,06 1Supplementary Motor Area R 3,265 0,07 1 1,089 0,30 1Olfactory cortex L 0,508 0,48 1 1,717 0,19 1Olfactory cortex R 0,031 0,86 1 1,178 0,28 1Frontal Superior Medial L 0,147 0,70 1 0,060 0,81 1Frontal Superior Medial R 8,862 0,00 0,26 1,243 0,26 1Frontal Medial Orbito L 0,396 0,53 1 0,489 0,48 1Frontal Medial Orbito R 12,246 0,00 0,04 0,038 0,85 1Rectus L 0,531 0,47 1 0,569 0,45 1Rectus R 1,561 0,21 1 6,856 0,01 0,80Insula L 0,011 0,92 1 0,000 0,99 1Insula R 0,001 0,97 1 0,679 0,41 1Cingulum Anterior L 4,128 0,04 1 0,327 0,57 1Cingulum Anterior R 5,227 0,02 1 0,322 0,57 1Cingulum Middle L 0,126 0,72 1 1,008 0,32 1Cingulum Middle R 1,133 0,29 1 2,833 0,09 1Cingulum Posterior L 0,180 0,67 1 2,982 0,08 1Cingulum Posterior R 0,235 0,63 1 0,780 0,38 1Hippocampus L 0,007 0,93 1 0,491 0,48 1Hippocampus R 0,420 0,52 1 1,766 0,18 1ParaHippocampal L 1,639 0,20 1 0,028 0,87 1ParaHippocampal R 0,026 0,87 1 3,296 0,07 1Amygdala L 0,898 0,34 1 0,013 0,91 1Amygdala R 0,025 0,87 1 2,190 0,14 1

6
205
ACT AND WHITE MATTER PLASTICITY: AN RCT
Region of interest χ2 p-value p-valuecorr. χ2 p-value p-value
corr.Calcarine L 0,887 0,35 1 1,956 0,16 1Calcarine R 0,007 0,93 1 0,228 0,63 1Cuneus L 8,562 0,00 0,31 8,456 0,00 0,33Cuneus R 0,010 0,92 1 1,121 0,29 1Lingual L 0,093 0,76 1 0,350 0,55 1Lingual R 0,006 0,94 1 0,176 0,68 1Occipital Superior L 2,052 0,15 1 6,562 0,01 0,94Occipital Superior R 0,044 0,83 1 4,314 0,04 1Occipital Middle L 2,996 0,08 1 1,317 0,25 1Occipital Middle R 0,764 0,38 1 3,583 0,06 1Occipital Inferior L 6,396 0,01 1 1,506 0,22 1Occipital Inferior R 0,309 0,58 1 4,646 0,03 1Fusiform L 0,013 0,91 1 0,786 0,38 1Fusiform R 1,066 0,30 1 1,537 0,21 1Postcentral L 3,751 0,05 1 0,472 0,49 1Postcentral R 0,782 0,38 1 2,286 0,13 1Parietal Superior L 0,444 0,50 1 0,044 0,83 1Parietal Superior R 0,589 0,44 1 1,792 0,18 1Parietal Inferior L 1,815 0,18 1 0,819 0,37 1Parietal Inferior R 1,212 0,27 1 0,004 0,95 1Supramarginal L 1,356 0,24 1 1,762 0,18 1Supramarginal R 0,057 0,81 1 3,203 0,07 1Angular L 0,866 0,35 1 0,001 0,97 1Angular R 1,243 0,26 1 0,026 0,87 1Precuneus L 0,327 0,57 1 1,366 0,24 1Precuneus R 0,211 0,65 1 1,033 0,31 1Paracentral Lobule L 0,165 0,68 1 1,340 0,25 1Paracentral Lobule R 1,297 0,25 1 1,783 0,18 1Caudate L 0,872 0,35 1 2,239 0,13 1Caudate R 0,216 0,64 1 3,147 0,08 1Putamen L 0,615 0,43 1 0,097 0,76 1Putamen R 0,480 0,49 1 0,399 0,53 1Pallidum L 0,535 0,46 1 1,274 0,26 1Pallidum R 1,486 0,22 1 1,369 0,24 1Thalamus L 0,713 0,40 1 0,031 0,86 1Thalamus R 1,223 0,27 1 0,479 0,49 1Heschl L 4,998 0,03 1 0,603 0,44 1Heschl R 1,040 0,31 1 0,794 0,37 1Temporal Superior L 0,849 0,36 1 0,050 0,82 1Temporal Superior R 0,016 0,90 1 0,519 0,47 1Temporal Pole Superior L 0,119 0,73 1 0,001 0,97 1Temporal Pole Superior R 0,028 0,87 1 0,244 0,62 1Temporal Middle L 0,067 0,80 1 0,025 0,87 1Temporal Middle R 0,241 0,62 1 2,290 0,13 1Temporal Pole Middle L 0,426 0,51 1 0,124 0,72 1Temporal Pole Middle R 0,051 0,82 1 3,032 0,08 1Temporal Inferior L 0,330 0,57 1 0,986 0,32 1Temporal Inferior R 0,021 0,88 1 0,815 0,37 1

Chapter 6
206
Table 14: Interaction between conditions and change in clustering coeffi cient (T1-T0) in the model of Psychotic Experiences and MADRS total (score at T1, corrected for T0). The χ2, uncorrected p-values and Bonferroni corrected p-values (for 900 tests) are provided per region of interest. L=left, R=right.
Psychotic Experiences MADRS total
Region of interest χ2 p-value p-valuecorr. χ2 p-value p-value
corr.Precentral L 0,124 0,73 1 2,971 0,08 1Precentral R 0,209 0,65 1 0,000 0,99 1Frontal Superior L 0,192 0,66 1 1,508 0,22 1Frontal Superior R 4,170 0,04 1 1,184 0,28 1Superior frontal, orbital part L 0,222 0,64 1 0,007 0,93 1Superior frontal, orbital part R 1,207 0,27 1 5,129 0,02 1Frontal Middle L 0,167 0,68 1 4,280 0,04 1Frontal Middle R 0,036 0,85 1 0,472 0,49 1Frontal Middle, orbital part L 0,003 0,96 1 2,806 0,09 1Frontal Middle, orbital part R 0,657 0,42 1 0,533 0,47 1Frontal Inferior, pars opercularis L 0,279 0,60 1 1,349 0,25 1Frontal Inferior, pars opercularis R 0,985 0,32 1 0,956 0,33 1Frontal Inferior, pars triangularis L 3,731 0,05 1 2,479 0,12 1Frontal Inferior, pars triangularis R 6,231 0,01 1 0,290 0,59 1Frontal Inferior, pars orbitalis L 0,169 0,68 1 0,244 0,62 1Frontal Inferior, pars orbitalis R 0,427 0,51 1 1,210 0,27 1Rolandic Operculum L 1,382 0,24 1 1,527 0,22 1Rolandic Operculum R 0,163 0,69 1 0,048 0,83 1Supplementary Motor Area L 3,710 0,05 1 2,683 0,10 1Supplementary Motor Area R 3,781 0,05 1 0,661 0,42 1Olfactory cortex L 0,350 0,55 1 1,064 0,30 1Olfactory cortex R 0,004 0,95 1 0,392 0,53 1Frontal Superior Medial L 0,008 0,93 1 0,007 0,94 1Frontal Superior Medial R 7,291 0,01 0,62 0,690 0,41 1Frontal Medial Orbito L 0,169 0,68 1 0,221 0,64 1Frontal Medial Orbito R 7,131 0,01 0,68 0,214 0,64 1Rectus L 0,563 0,45 1 0,498 0,48 1Rectus R 1,234 0,27 1 4,613 0,03 1Insula L 0,317 0,57 1 0,031 0,86 1Insula R 0,003 0,96 1 0,175 0,68 1Cingulum Anterior L 2,980 0,08 1 1,225 0,27 1Cingulum Anterior R 3,079 0,08 1 0,055 0,82 1Cingulum Middle L 1,680 0,19 1 1,268 0,26 1Cingulum Middle R 1,216 0,27 1 2,840 0,09 1Cingulum Posterior L 0,039 0,84 1 2,853 0,09 1Cingulum Posterior R 0,006 0,94 1 0,630 0,43 1Hippocampus L 0,228 0,63 1 0,364 0,55 1Hippocampus R 0,262 0,61 1 1,289 0,26 1ParaHippocampal L 0,889 0,35 1 0,016 0,90 1ParaHippocampal R 0,001 0,97 1 3,982 0,05 1Amygdala L 1,008 0,32 1 0,006 0,94 1Amygdala R 0,000 1,00 1 1,434 0,23 1

6
207
ACT AND WHITE MATTER PLASTICITY: AN RCT
Region of interest χ2 p-value p-valuecorr. χ2 p-value p-value
corr.Calcarine L 0,925 0,34 1 1,887 0,17 1Calcarine R 0,000 0,99 1 0,409 0,52 1Cuneus L 1,157 0,00 0,06 8,896 0,00 0,26Cuneus R 0,048 0,83 1 1,169 0,28 1Lingual L 0,052 0,82 1 0,371 0,54 1Lingual R 0,027 0,87 1 0,234 0,63 1Occipital Superior L 1,676 0,20 1 6,729 0,01 0,85Occipital Superior R 0,000 1,00 1 3,947 0,05 1Occipital Middle L 2,736 0,10 1 1,778 0,18 1Occipital Middle R 1,214 0,27 1 4,243 0,04 1Occipital Inferior L 4,381 0,04 1 2,162 0,14 1Occipital Inferior R 0,020 0,89 1 2,324 0,13 1Fusiform L 0,000 1,00 1 1,404 0,24 1Fusiform R 0,968 0,33 1 1,415 0,23 1Postcentral L 2,649 0,10 1 1,053 0,30 1Postcentral R 0,414 0,52 1 2,199 0,14 1Parietal Superior L 0,001 0,97 1 0,163 0,69 1Parietal Superior R 0,627 0,43 1 2,137 0,14 1Parietal Inferior L 0,632 0,43 1 0,302 0,58 1Parietal Inferior R 0,998 0,32 1 0,066 0,80 1Supramarginal L 1,084 0,30 1 0,107 0,74 1Supramarginal R 0,178 0,67 1 1,794 0,18 1Angular L 0,247 0,62 1 0,562 0,45 1Angular R 2,158 0,14 1 0,027 0,87 1Precuneus L 0,024 0,88 1 1,317 0,25 1Precuneus R 0,143 0,70 1 0,865 0,35 1Paracentral Lobule L 0,004 0,95 1 0,721 0,40 1Paracentral Lobule R 1,575 0,21 1 0,739 0,39 1Caudate L 0,789 0,37 1 1,931 0,16 1Caudate R 0,086 0,77 1 2,670 0,10 1Putamen L 0,226 0,63 1 0,030 0,86 1Putamen R 0,209 0,65 1 0,203 0,65 1Pallidum L 0,025 0,87 1 1,404 0,24 1Pallidum R 0,423 0,52 1 0,518 0,47 1Thalamus L 0,436 0,51 1 0,044 0,83 1Thalamus R 1,087 0,30 1 0,158 0,69 1Heschl L 3,345 0,07 1 0,604 0,44 1Heschl R 0,242 0,62 1 0,440 0,51 1Temporal Superior L 0,265 0,61 1 0,019 0,89 1Temporal Superior R 0,152 0,70 1 1,165 0,28 1Temporal Pole Superior L 0,197 0,66 1 0,032 0,86 1Temporal Pole Superior R 0,003 0,95 1 0,111 0,74 1Temporal Middle L 0,230 0,63 1 0,005 0,94 1Temporal Middle R 0,229 0,63 1 1,167 0,28 1Temporal Pole Middle L 0,036 0,85 1 0,017 0,90 1Temporal Pole Middle R 0,416 0,52 1 1,373 0,24 1Temporal Inferior L 0,268 0,60 1 1,298 0,25 1Temporal Inferior R 0,076 0,78 1 0,548 0,46 1

Chapter 6
208
Table 15: Interactionbetween conditions and change in local effi ciency and clustering coeffi cient (T1-T0) in the model of ESM Negative Affect (score at T1, corrected for T0). The χ2, uncorrected p-values and Bonferroni corrected p-values (for 900 tests) are provided per region of interest. L=left, R=right.
Local effi ciency Clustering coeffi cient
Region of interest χ2 p-value p-valuecorr. χ2 p-value p-value
corr.Precentral L 1,19 0,27 1 1,31 0,25 1Precentral R 6,15 0,01 1 3,87 0,05 1Frontal Superior L 7,32 0,01 1 12,06 0,0005 0,46Frontal Superior R 7,58 0,01 1 7,44 0,01 1Sup. frontal, orbital L 3,82 0,05 1 9,01 0,00 1Sup. frontal, orbital R 0,33 0,57 1 0,11 0,73 1Frontal Middle L 0,39 0,53 1 1,04 0,31 1Frontal Middle R 4,38 0,04 1 10,05 0,00 1Frontal Middle, Orb. L 2,34 0,13 1 3,11 0,08 1Frontal Middle, Orb. R 0,11 0,74 1 0,09 0,76 1Frontal Inf, oper. L 1,54 0,21 1 1,29 0,26 1Frontal Inf, oper. R 0,22 0,64 1 0,04 0,84 1Frontal Inf, triang. L 1,68 0,19 1 2,46 0,12 1Frontal Inf, triang. R 7,64 0,01 1 5,95 0,01 1Frontal Inf, orbitalis L 0,74 0,39 1 0,11 0,74 1Frontal Inf, orbitalis R 0,31 0,58 1 1,99 0,16 1Rolandic Operculum L 1,61 0,21 1 2,97 0,08 1Rolandic Operculum R 3,49 0,06 1 4,66 0,03 1Supple. Motor Area L 2,89 0,09 1 4,83 0,03 1Supple. Motor Area R 3,50 0,06 1 6,11 0,01 1Olfactory cortex L 9,35 0,002 1 9,37 0,00 1Olfactory cortex R 3,36 0,07 1 3,59 0,06 1Frontal Sup. Medial L 8,71 0,003 1 18,15 <0.00001 0,02Frontal Sup. Medial R 8,56 0,003 1 4,50 0,03 1Frontal Med. Orbito L 1,74 0,19 1 1,89 0,17 1Frontal Med. Orbito R 5,91 0,02 1 1,87 0,17 1Rectus L 3,84 0,05 1 8,37 0,004 1Rectus R 0,76 0,38 1 0,53 0,47 1Insula L 0,51 0,48 1 0,55 0,46 1Insula R 6,22 0,01 1 8,69 0,003 1Cingulum Anterior L 3,82 0,05 1 5,37 0,02 1Cingulum Anterior R 24,99 <0.00001 0,0005 14,43 0,0001 0,13Cingulum Middle L 1,36 0,24 1 0,02 0,89 1Cingulum Middle R 8,88 0,00 1 6,00 0,01 1Cingulum Posterior L 0,00 0,98 1 0,05 0,82 1Cingulum Posterior R 0,07 0,80 1 0,00 0,97 1Hippocampus L 5,57 0,02 1 6,86 0,01 1Hippocampus R 2,28 0,13 1 3,02 0,08 1ParaHippocampal L 23,30 <0.00001 0,001 40,76 <0.00001 0,0000002ParaHippocampal R 2,07 0,15 1 3,35 0,07 1Amygdala L 1,49 0,22 1 3,93 0,05 1Amygdala R 3,82 0,05 1 7,43 0,01 1
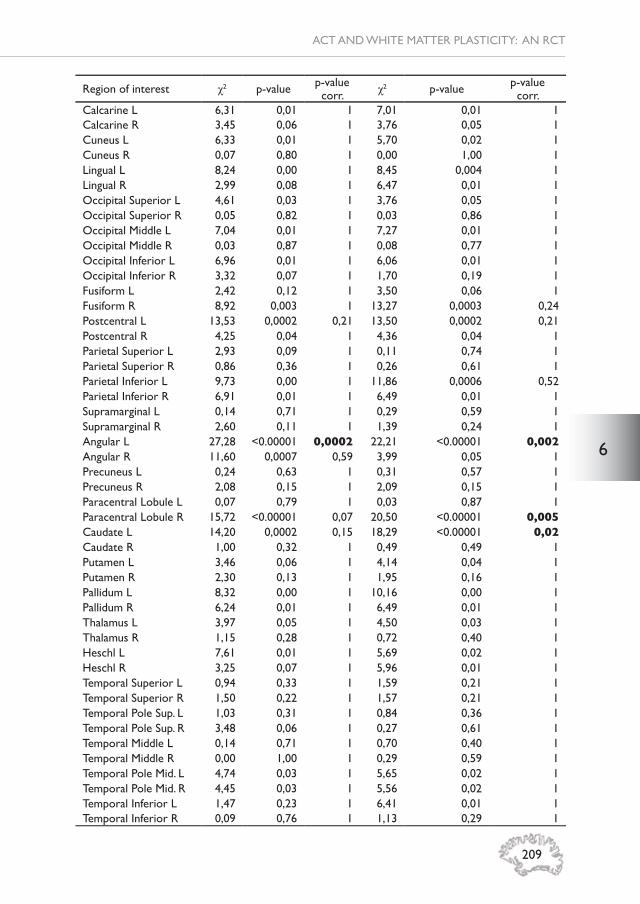
6
209
ACT AND WHITE MATTER PLASTICITY: AN RCT
Region of interest χ2 p-value p-valuecorr. χ2 p-value p-value
corr.Calcarine L 6,31 0,01 1 7,01 0,01 1Calcarine R 3,45 0,06 1 3,76 0,05 1Cuneus L 6,33 0,01 1 5,70 0,02 1Cuneus R 0,07 0,80 1 0,00 1,00 1Lingual L 8,24 0,00 1 8,45 0,004 1Lingual R 2,99 0,08 1 6,47 0,01 1Occipital Superior L 4,61 0,03 1 3,76 0,05 1Occipital Superior R 0,05 0,82 1 0,03 0,86 1Occipital Middle L 7,04 0,01 1 7,27 0,01 1Occipital Middle R 0,03 0,87 1 0,08 0,77 1Occipital Inferior L 6,96 0,01 1 6,06 0,01 1Occipital Inferior R 3,32 0,07 1 1,70 0,19 1Fusiform L 2,42 0,12 1 3,50 0,06 1Fusiform R 8,92 0,003 1 13,27 0,0003 0,24Postcentral L 13,53 0,0002 0,21 13,50 0,0002 0,21Postcentral R 4,25 0,04 1 4,36 0,04 1Parietal Superior L 2,93 0,09 1 0,11 0,74 1Parietal Superior R 0,86 0,36 1 0,26 0,61 1Parietal Inferior L 9,73 0,00 1 11,86 0,0006 0,52Parietal Inferior R 6,91 0,01 1 6,49 0,01 1Supramarginal L 0,14 0,71 1 0,29 0,59 1Supramarginal R 2,60 0,11 1 1,39 0,24 1Angular L 27,28 <0.00001 0,0002 22,21 <0.00001 0,002Angular R 11,60 0,0007 0,59 3,99 0,05 1Precuneus L 0,24 0,63 1 0,31 0,57 1Precuneus R 2,08 0,15 1 2,09 0,15 1Paracentral Lobule L 0,07 0,79 1 0,03 0,87 1Paracentral Lobule R 15,72 <0.00001 0,07 20,50 <0.00001 0,005Caudate L 14,20 0,0002 0,15 18,29 <0.00001 0,02Caudate R 1,00 0,32 1 0,49 0,49 1Putamen L 3,46 0,06 1 4,14 0,04 1Putamen R 2,30 0,13 1 1,95 0,16 1Pallidum L 8,32 0,00 1 10,16 0,00 1Pallidum R 6,24 0,01 1 6,49 0,01 1Thalamus L 3,97 0,05 1 4,50 0,03 1Thalamus R 1,15 0,28 1 0,72 0,40 1Heschl L 7,61 0,01 1 5,69 0,02 1Heschl R 3,25 0,07 1 5,96 0,01 1Temporal Superior L 0,94 0,33 1 1,59 0,21 1Temporal Superior R 1,50 0,22 1 1,57 0,21 1Temporal Pole Sup. L 1,03 0,31 1 0,84 0,36 1Temporal Pole Sup. R 3,48 0,06 1 0,27 0,61 1Temporal Middle L 0,14 0,71 1 0,70 0,40 1Temporal Middle R 0,00 1,00 1 0,29 0,59 1Temporal Pole Mid. L 4,74 0,03 1 5,65 0,02 1Temporal Pole Mid. R 4,45 0,03 1 5,56 0,02 1Temporal Inferior L 1,47 0,23 1 6,41 0,01 1Temporal Inferior R 0,09 0,76 1 1,13 0,29 1


CH
APT
ERSevenGENERAL DISCUSSION

Chapter 7
212
This thesis examined cerebral pathways to understand psychological mechanisms that are thought to underlie the expression of psychosis across its spectrum of severity. The main focus was on structural white matter alterations in patients with psychotic disorder, their healthy siblings and youngsters with mild subclinical expression of psychopathology. Diffusion Weighted Imaging (DWI) technology was used to investigate white matter in-vivo in order to study group differences, but also within-group effects of an intervention, i.e., daily life Acceptance and Commitment Therapy (ACT) for individuals with subclinical psychopathology. Furthermore, reward anticipation in the subclinical sample was studied using functional Magnetic Resonance Imaging (fMRI). The thesis thus covers two subgroups at the extremes of the psychosis spectrum.
This discussion aims at interpreting the fi ndings from the studies presented in the thesis and exploring the wider context of the neurobiological changes associated with the psychosis spectrum. It also provides some suggestions for further research that may be conducted to further elucidate the main research questions formulated in this thesis, in the light of the results reported here.
Psychosis spectrumDiagnostic systems in psychotic disorderThe Diagnostic and Statistical Manual of mental disorders (DSM) has been in place since 1952 and DSM-5 is currently widely used in clinical psychiatric practice (2). While this system provides a well-defi ned diagnosis based on several clearly defi ned criteria, the DSM has some shortcomings. For example, a clinician can follow a certain protocol and diagnose a broken collarbone, based on clear criteria. The outcome is dichotomous and unambiguous in most cases. In psychiatry, a diagnosis is based on clinical observations resulting in establishing the presence of one or more symptom as described in the DSM. Such an observation is subjective and has been found to be not very reliable in routine practice. Given that adding up a number of symptoms automatically leads to a diagnosis, a patient will likely receive treatment if the number of symptoms is high enough. However, the use of cumulative symptoms counts up to an arbitrary binary cut-off is risky as it may result in both under-treatment (in the non-diagnosed) and overtreatment (in the diagnosed). In fact, it has been noted that impairment and needs in psychotic disorder can be best considered as lying on a spectrum that are only loosely associated with formal diagnosis, questioning the use of arbitrary diagnostic cut-offs (4). Furthermore, the DSM is based on phenomenological features that classify a patient into a certain diagnostic category, not dissimilar to how a biologist would classify certain birds in categories (6). Given that the causes of psychosis remain unknown, causal cerebral and other factors are ignored within the diagnostic system. Given growing dissatisfaction with the categorical DSM system, alternative approaches have been presented. For example, the Research Domain Criteria (RDoC) provides a more biological

7
213
DISCUSSSION
and dimensional research framework for mental disorders (7, 8). RDoC aims at a novel dimensional diagnostic system based on linking aspects of neurobiology with aspects of behavior and cognition. While this approach seems promising and leaves open the domains and classes, the RDoC method is only semi-data driven.
Subclinical psychotic experiences or attenuated symptomsYoungsters in the critical phase of development during adolescence could have mild psychotic experiences causing distress in daily life. Research in stages before onset of psychotic disorder is heterogeneous because of different sample descriptions. Terms used are At-Risk Mental State, Ultra-High-Risk, prodromal, subclinical psychotic experiences or attenuated symptoms and are based on different assessments such as Community Assessment of Psychic Experiences (CAPE (9)), Early Psychosis Screener (EPS (10)), Structured Interview for Psychosis-Risk Syndromes (SIPS (11)) and Comprehensive Assessment of At-Risk Mental States (CAARMS (12)). Consensus on the threshold for “more than normal” psychotic experiences still needs to be reached. This is a precise balance between labeling and prevention, and remains open for discussion. Labeling an adolescent as “abnormal” might stigmatize the person, but preventing symptoms from getting worse is also essential. Another option might be to use screening tools for detecting psychosis risk (13) and referring to professional care after positive screening. This may help adolescents during this phase of life towards healthy development. However, screening is grounded in rules to do with minimal parameters of sensitivity, specifi city, treatability and cost-effectiveness, the evidence for which in the case of psychosis remains weak (14). Nevertheless, the approach requires further exploration in the area of research, as presented here.
Developmental perspectiveIn the development of psychotic disorder several factors play a role. These can be of environmental origin, such as urbanicity, cannabis use, or childhood trauma (15), and could also have a non-environmental neurodevelopmental source. This thesis studied individuals in the general population with mild psychotic experiences. Co-occurrence of depressive and anxiety-related symptoms was predictably (16), common and therefore this group can also be described as individuals with a broad range of undifferentiated mild psychopathology. It remains unknown in which direction the mild symptoms will develop over time and if participants will be diagnosed with a mental disorder eventually. Hence the sample cannot be described as prodromal. Follow-up of symptoms at 6 and 12 months after completion of the study is also part of the project. At the time of writing this thesis data from this follow-up were not available. It would be interesting to have a longer follow-up of the cohort of young people between 16 and 25 years of age.

Chapter 7
214
Structural white matter biomarkers White matter alterations in (subclinical) psychotic disorderCerebral white matter in humans develops with age, and white matter in the frontal lobe is the latest to mature (17). During brain development, psychotic symptoms may emerge and this may be related, in the broadest sense, to white matter alterations. Based on results from a structural white matter study in youngsters with psychotic experiences, described in chapter 5, it can be concluded that no alterations in Diffusion Weighted Imaging (DWI) parameters indicating ‘integrity’, myelination and anisotropy were detectable. This fi nding is in line with one study in at-risk youngsters (18), although increased integrity has been reported in an Ultra-High-Risk sample (13). When moving to the other end of the psychosis spectrum, white matter ‘integrity’ decrease has been consistently reported in tracts connecting the left frontal and temporal lobes (19). The results described in chapter 2 showed several alterations in the white matter of patients with psychotic disorder. As a follow-up on previous research in this sample (20), increased demyelination without axonal loss was found in patients. Since fractional anisotropy (FA) is too broad a marker to measure white matter ‘integrity’, the need for other DWI parameters is paramount (see box 1 for more information). Currently, more and more axial (AXD) and radial diffusivity (RAD) measures are being reported as indicators of respectively number of axons and demyelination within the white matter tracts. This can be informative, but interpretation on the underlying pathological substrate is challenging when not accompanied by mathematical or geometrical properties of the tensor (21). These tensor shape measures provide knowledge on white matter organization, water content, orientation and directional preference (22, 23). The tensor can be expressed as a linear (CL), planar (CP) or spherical (CS) shape, which all relate to each other. This relation is based on the eigenvalues from the diffusion tensor model expressing the magnitude of the vectors x, y and z. The geometrical tensor shape measures are calculated using the three eigenvalues from the diffusion tensor estimation model and represent specifi c shapes:
CL = , CP =
diffusion tensor estimation model and represent specifi c shapes:
and CS =
diffusion tensor estimation model and represent specifi c shapes:
.
As shown in fi gure 1, tissue can be more or less formed towards linear, planar or spherical tensor shapes. Interestingly, CL was decreased in patients with psychotic disorder, and CP was decreased in both patients and siblings compared to healthy controls. This could indicate increased free water movement and less linear arrangement of the tensors. Since research in psychotic disorder with the application of the tensor shape measures is rather limited (24), more research is needed to further investigate the added value.

7
215
DISCUSSSION
Figure 1; Tensor shape measure representation via linear, planar and spherical shape measures. Different colors represent different structures. The measures are related to each
other via this formula; x =
measures. Different colors represent different structures. The measures are related to each
; y = 1 – CL – CP.

Chapter 7
216
Network-based connectivity in (subclinical) psychotic disorderBesides the previously described white matter tensor measures, structural white matter networks might provide novel information on connectivity using graph theory. The network-based method has been applied in samples with psychotic disorder showing that frontal brain regions are less connected to other brain parts (25-28). The study in chapter 3 has described an absence of differences in network-based connectivity in patients with psychotic disorder compared to siblings and healthy controls, while siblings had a signifi cantly higher CC compared to patients. This fi nding contradicts the stated hypothesis on disconnectivity in psychotic disorder. Since network-based connectivity analyses depend on the used fi ber tractography algorithm, the applied deterministic approach might explain the current fi nding. It can be speculated whether probabilistic tractography is more precise and different algorithms could include more fi bers. It remains unclear if brain effi ciency is increased or decreased in psychotic disorder, as other studies were also inconclusive on this fi nding (28-31). Similarly, in individuals with subclinical psychotic symptoms, both increased and decreased network connectivity has been described (32-
Box 1: White matter ‘integrity’ White matter can be measured in-vivo using Diffusion Weighted Imaging. The most commonly reported measure is the Fractional Anisotropy (FA), a broadly defi ned white matter ‘integrity’ measure. Based on the tensor model the FA can be calculated with the following formula (1);
In the formula, the eigenvalues are denoted as λ. The FA is scaled and will range from 0 (isotropic) to 1 (anisotropic). In highly isotropic matter such as cerebrospinal fl uid in the lateral ventricles, there is no profound direction and the water molecules will show random Brownian motion. In tissue such as the corpus callosum the movement becomes anisotropic and more directed (a preferable direction along the aligning white matter tracts). The underlying neurobiology for FA change can be of different origins. An increase in FA ‘integrity’ has been related to increased number of axons and myelination, but could also be a result of decreased fi ber mixture (3). It has been shown that FA is also infl uenced by factors such as cell death, edema, gliosis, demyelination and increase in extracellular or intercellular water (5). Therefore, FA is a non-specifi c measure detecting a broad range of neuropathology. Related to this non-specifi city is the measurement of a voxel (volume element) at millimeter scale capturing several neurobiological processes at once while these events are happening on a micron scale. This results in a fairly crude summary of all the processes occurring within the voxel.

7
217
DISCUSSSION
35), and our own study in chapter 5 has shown absence of altered network-connectivity in young individuals. Nevertheless, chapter 5 also showed that, in the PE-group, some subclinical symptoms measures were positively associated with network effi ciency/cohesion in the right middle temporal pole (MTP), suggesting that individuals with these network alterations are predisposed to later psychotic symptom development or that these cerebral changes are reactive to emerging mild psychopathology. Interestingly, the results in chapter 3 showed an association between decreased overall LE and CC with increased SIS-r positive scores and a decreased overall CC was associated with increased SIS-r negative scores. These fi ndings may seem to contradict the regional fi ndings in the PE-group (chapter 5), but there were no specifi c signifi cant regions with alterations in effi ciency or cohesion in siblings. Thus, overall effects and regional effects are diffi cult to directly compare and the opposite direction of effect in the symptom-networkconnectivity association in the clinical (PE-group) and in the familial risk group (siblings) may also have been infl uenced by methodological issues (different assessment techniques in the groups: interviewer-based versus self-report). Overall, the fi ndings suggest the presence of differential subclinical symptom-networkconnectivity associations in people ‘at (clinical/familial) risk’ with respect to controls.Although the results from the study in chapter 3 did not report network-connectivity alterations in patients, white matter alterations have been reported in the same sample as described in chapter 2 and previously (20). The applied network-based method is however different from the DWI parameters FA, AXD, RAD and MD, and investigates specifi c network dynamics over the brain. A network-based approach, therefore, has a broader scope and does not examine the diffusion tensor itself, but the tracts. The use of a network-based analysis approach opens the door for multimodal imaging techniques. Resting state functional MRI (rsfMRI) has been applied widely in psychotic disorder to explore alterations in default mode network functioning (36). Integration of both structural and functional MRI could provide novel insights, as both techniques are complementary to each other.
Clinical relevance of white matter alterationsThe outcome of white matter alterations in patients with psychotic disorder may have clinical value in evaluating treatment effects. As described earlier, targeting the fronto-temporal white matter connections might be the best option towards restoration of cognitive functioning. If certain neurodevelopmental mechanisms indeed would impact myelination and if its contributing role in symptom formation could be established, then research into pharmacological and psychological training preventing myelin loss is necessary as such new developments may be benefi cial to patients. Implementation of DWI techniques in clinical practice needs to be considered once validity has been proven. As DWI enables better understanding of neurobiological mechanisms, evaluation of novel treatments could possibly be developed using this technique. Currently,

Chapter 7
218
the vast majority of clinicians know that biomarkers, such as DWI, are unimportant in clinical decision-making. A suggestion would be to pool together MRI datasets and apply machine-learning techniques to discover how mental disorders cluster. This will be further discussed later in the paragraph about future directions.Furthermore, DWI case studies can add to the development of novel treatment options. Via these n = 1 study designs insight into the working mechanisms of new medication or non-pharmacological treatments can be closely evaluated. This robust design conducting measurements within one patient with psychotic disorder may allow for response prediction at the individual level. This allows for better-tailored mental health care in line with personalized medicine, although many challenges remain (62).
Imaging as a tool to study therapeutic interventionsACT intervention In order to support youngsters with mild psychopathology, an easily accessible, cheap and simple intervention can have benefi t in this population. As discussed previously, the developing brain is vulnerable and both structure and function can change in (bidirectional) relation to mild psychopathology. The RCT described in chapter 6 reports on the fi ndings after a six weeks Acceptance and Commitment Therapy (ACT) intervention in adolescents with mild psychopathology. This intervention did not show an effect of ACT on DWI measures or network-connectivity (possibly due to a fl oor effect), while it had some behavioral effects in decreasing the level of depressive symptoms and increasing the ESM composite score of subclinical psychotic experience. The fi nding of slightly increased post-intervention ESM subclinical psychotic experience scores (suspiciousness and unreal feelings) in the ACT condition should be interpreted in the light of already low scores (non-prodromal individuals) and could have been the result of ACT making people more aware, critical and/or refl ective about themselves. There were no signifi cant interactions between the DWI parameters and condition in the symptom models, which may indicate that white matter remains preserved while depressive symptoms change as a result of the ACT-intervention. Alternatively, this can also be explained by the fact that there were very small effect sizes on the level of white matter plasticity.The application of ACT in a population of adolescents with mild psychopathology needs further testing and fi ndings need to be replicated before any conclusions can be drawn, but nevertheless may contribute towards developing preventive intervention. Results from the Randomized Controlled Trial (RCT) need to be interpreted with caution because of the limited sample size (n=25 versus n=20): replication is essential.
Reward anticipationIn addition to structural alterations in psychotic disorder, functional changes in the brain also seem to be prominent. Reward anticipation is thought to represent an important concept to understand dopamine dysfunction

7
219
DISCUSSSION
in psychotic disorder (37). The neuronal basis of reward anticipation functioning in psychotic disorder has been investigated in a meta-analysis and showed hypoactivation of the ventral striatum during reward anticipation (38). Research in subclinical populations has shown both hypo- and hyperactivation of the ventral striatum while performing a reward-anticipation task (39-42). Interestingly, the study described in chapter 4 of this thesis provided evidence for hypoactivation in the right insula and right supramarginal gyrus in individuals with psychotic experiences whereas the activation in the ventral striatum was unchanged compared to healthy controls. The insula is a structure involved in motor preparation and selective attention and the results may possibly indicate an attention or stimulus evaluation shortfall. From a developmental perspective, the insula is an interesting brain region, since during adolescence the reward anticipation activation in this area tends to increase (43). Maturation of the reward system, and specifi cally disturbed development of frontostriatal regions, may impact cognitive control (44). Adolescents are known to be risk-taking, sensation seeking and impulsive, and have to develop balance between a motivational effort to do something and behavioral regulator mechanisms (45, 46). Several behavioral norms need to be learned and the brain develops until the age of 25 years, with the frontal regions maturing latest. The frontal brain regions are imperative for inhibition control. Therefore examination of fMRI reward anticipation in adolescents has added value for investigating a dysfunction in the reward system.
Methodological considerations All studies conducted within the scope of this thesis have been realized with extensive consideration and planning. In order to achieve a broad view over the psychosis spectrum, two distinct groups with various symptoms have been examined. As explained earlier, the DSM classifi cation system has several drawbacks in diagnosing mental illnesses. Within the GROUP project, a consideration was made to use the DSM classifi cation system. This approach puts a person to a diagnostic group, although the underlying neurobiological alterations can be more complex due to what is called co-morbidity (i.e.. extensive differences in psychopathology of individuals pertaining to the same diagnostic group), illness duration, medication, and drug use. The Smartscan project involved participants with mild psychopathology as defi ned by a CAPE positive distress score ≥2 (9), total Montgomery–Åsberg Depression Rating Scale (MADRS) ≥10 (47). These inclusion criteria might be fairly mild compared to other samples using CAARMS or Ultra High-Risk for psychosis inclusion norms. A clear defi nition and consensus on the psychosis high-risk state has not been reached, but it creates a framework for service providers for seeking help from services at an early stage (48) and is different from psychometric risk samples derived from the general population (14).The MRI acquisition techniques used in this thesis have their limitations. At the time being the protocols were created for high-quality DWI and fMRI. Both GROUP and Smartscan projects have an adequate number of gradient

Chapter 7
220
directions (76 and 119 respectively) for the tensor estimation with a fairly high spatial resolution (49). Meanwhile several novel DWI acquisition techniques have been developed improving the tensor estimation procedure such as High Angular Resolution Diffusion Imaging (50), generalized Q-sampling imaging (51), Orientation Distribution Function (52) and Diffusion Kurtosis Imaging (53, 54). These novel acquisitions provide more information on white matter properties, but require longer scan times. In fMRI research, the aim is to acquire signal related to a specifi c task. The main point is that the signal is very noisy and several factors such as shimming, movement, heart rate, and respiration will distort the signal (55, 56). To a certain extent these noise factors can be fi ltered out or controlled for via advanced preprocessing of the data. Furthermore, and probably more worrisome, is the variation in the parameters chosen in the processing of fMRI data (57). A transparent and reproducible way of reporting (f)MRI acquisitions and processing is important for the neuroimaging fi eld. Studies within this thesis were reported in line with guidelines from the Organization for Human Brain Mapping Committee on Best Practice in Data Analysis and Sharing (COBIDAS) initiative (58). Choosing different parameters jeopardizes comparability between studies and even software updates could change the results from a study (59). Additionally, obtaining MRI data is an expensive procedure. Therefore, careful reporting, documentation and data sharing are important factors in MRI research. Another concern in MRI research is the power problem, particularly in fMRI research. The effect size can be estimated a priori to the start of an fMRI experiment based on previous fi ndings or via an independent pilot study. Commonly, group comparisons are conducted in psychiatric fMRI research and these can be rather low on statistical power due to small sample sizes (60). Within-subject experiments are relatively high-powered as compared to between-subject evaluations. This issue became apparent in a study comparing fMRI studies using standard cluster-based parametric tests with fairly liberal thresholds leading to family wise error rates of up to 60% (61). Therefore, it is important to critically choose proper statistical analyses methods for fMRI data. One suggestion might be to apply non-parametric permutation testing in order to test for group differences. Another solution would be to gather larger data sets or pool together data via sharing and collaboration (see future directions below).
Directions for future research The fi eld of research in psychotic disorder is moving and it has been suggested to leave the concept of schizophrenia and use the term psychosis spectrum disorder instead (63). Future research should focus on the spectrum of psychotic disorder and assess the full range of symptoms related to the psychosis spectrum. Within this framework, early intervention can take place in order to prevent symptoms at one point in the spectrum from getting worse. This may prevent patients from

7
221
DISCUSSSION
progressing to more severe disease states, becoming more chronically ill and treatment resistant. The spectrum approach of psychotic disorder allows capturing mild psychopathology in youngsters. This group ranging from 16 to 25 years old, in a crucial developmental phase, should be investigated further and arguably more frequently. The Australian Headspace initiative could be of great value for this specifi c group of youngsters in an open, supportive and accessible way (64). In Maastricht, this initiative has been launched as well via the @ease center for youngsters. This will help to detect symptoms early and provide care if needed in a user-friendly approach. As discussed earlier in the methodological considerations section, there is a healthy academic debate on the relative merit of MRI analyses in psychiatry. Especially in neuroimaging it is important to have reliable and replicable research since the methods allow for many options, choices and considerations to be made within the processing pipeline. The Findable, Accessible, Interoperable, Reusable (FAIR) guiding ethics are essential in MRI data management (65). While some argue that direct replication should be made a mainstream routine in science (66), a fi rst step would be to try and replicate previous (f)MRI research on a smaller scale. It would be a suggestion to integrate study replication in university education. This would lead to researchers complying better to FAIR guidelines and eventually improve neuroimaging research. The educational value of replication should not be underestimated. As replication does not imply duplication (exactly the same), there is room for improvement of methods. The Brain Imaging Data Structure (BIDS) standard helps to organize and describe MRI datasets and it is recommended to follow these standards (67). Openly sharing neuroimaging data helps the fi eld further and sharing fMRI via initiatives such as OpenfMRI (68) and NeuroVault (69) is highly recommended. Specifi c collaborations in the fi eld of psychotic disorder are the way forward by pooling data. Forthcoming research should focus on expanding cooperation via consortia such as ENIGMA (70) and SchizConnect (71).
Big data in psychotic disorderA research approach purely based on data could advance the neurobiological understanding of mental disorder classifi cation. In other medical disciplines this data driven methodology has been developed as a valuable tool in clinical decision-making, such as in radiomics (72). The technique uses large (imaging) datasets and is able to learn from the provided data to predict new diagnoses in cancer research. Currently machine learning and deep learning techniques are being developed in mental health research. Psychotic disorder is a highly complex phenotype that may well benefi t from big data approaches shedding light on its complexity. Symptoms on the psychosis spectrum can vary and many factors (cerebral and extra-cerebral) play a role in the development of psychotic disorder. The application of large scale imaging data has the potential to gain novel insights. Applying machine learning in psychiatry

Chapter 7
222
can be fairly accurate in classifying patients with psychotic disorder under certain circumstances (73) and helps individualized prediction of psychotic disorder (74, 75). Moreover, machine learning might have a useful application in supporting the diagnosis of psychotic disorder by providing additional information to the psychiatrist or create a data-driven classifi cation system (76). In order to make big data acceptable in practice, the data should be supportive to the mental health professional in decision-making but shall not replace the clinician entirely.
ConclusionThe psychosis spectrum is emerging as a clinical diagnostic severity framework and there seems to be some evidence on neurobiological alterations at some positions within this spectrum. All the results reported in this thesis are tentative and require replication. The fMRI study of individuals with subclinical psychotic experiences showed that the right insula, putamen and supramarginal gyrus had decreased activation compared to controls, suggesting that the reward system itself may be intact, while brain regions related to emotional valuing, motivation and motor-cognitive processes are affected. The focus of the other studies of this of the thesis was on white matter. There was evidence for microstructural white matter alterations (FA, RAD and MD) in patients diagnosed with psychotic disorder and, in part, alterations in siblings of patients with respect to controls. Our work suggests that tensor-shape parameters may have added value in addition to the more traditional DWI measures. Network-based measures may also be useful in unraveling pathways between multiple involved regions, although the current work did not show alterations in network-based connectivity in patients and siblings from the GROUP sample. In the Smartscan sample, comprising individuals with mild psychopathology, there were neither microstructural white matter, nor network connectivity differences with respect to controls. However, within the PE-group, subclinical symptoms were positively associated with network effi ciency/cohesion in the right middle temporal pole, suggesting that individuals that do have network alterations may be predisposed to psychotic symptom development or that these cerebral changes are reactive to emerging mild psychopathology. Interestingly there were signifi cant negative associations between overall network effi ciency/cohesion and subclinical symptoms in siblings, but this was not found in regions specifi cally. Finally, a psychological intervention (ACT) did not impact microstructural white matter or network connectivity over time, while behavioral changes did occur. The ACT intervention reduced subclinical depressive symptoms and increased psychotic experiences in daily life.Overall, much work remains to be done in order to (i) fi rmly replicate, (ii) further elucidate and (iii) clinically validate these fi ndings. In conclusion, research in the early phases of the psychosis spectrum remains important. In order to better understand the neurobiological underpinnings of the psychosis spectrum, and their clinical relevance, there is road work ahead.

7
223
DISCUSSSION
Pierpaoli C, Basser PJ. Toward a 1. quantitative assessment of diffusion anisotropy. Magn Reson Med. 1996;36(6):893-906.American Psychiatric Association., 2. American Psychiatric Association. DSM-5 Task Force. Diagnostic and statistical manual of mental disorders : DSM-5. 5th ed. Washington, D.C.: American Psychiatric Association; 2013. xliv, 947 p. p.Mori S, Zhang J. Principles of diffusion 3. tensor imaging and its applications to basic neuroscience research. Neuron. 2006;51(5):527-39.Strauss JS, Carpenter WT, Jr. The 4. prediction of outcome in schizophrenia. I. Characteristics of outcome. Arch Gen Psychiatry. 1972;27(6):739-46.O’Donnell LJ, Pasternak O. Does 5. diffusion MRI tell us anything about the white matter? An overview of methods and pitfalls. Schizophr Res. 2015;161(1):133-41.McHugh PR. Striving for coherence: 6. psychiatry’s efforts over classifi cation. Jama. 2005;293(20):2526-8.Cuthbert BN, Insel TR. Toward new 7. approaches to psychotic disorders: the NIMH Research Domain Criteria project. Schizophr Bull. 2010;36(6):1061-2.Insel T, Cuthbert B, Garvey M, Heinssen 8. R, Pine DS, Quinn K, et al. Research domain criteria (RDoC): toward a new classifi cation framework for research on mental disorders. Am J Psychiatry. 2010;167(7):748-51.Stefanis NC, Hanssen M, Smirnis 9. NK, Avramopoulos DA, Evdokimidis IK, Stefanis CN, et al. Evidence that three dimensions of psychosis have a distribution in the general population. Psychological medicine. 2002;32(2):347-58.Brodey BB, Addington J, First MB, Perkins 10. DO, Woods SW, Walker EF, et al. The Early Psychosis Screener (EPS): Item development and qualitative validation. Schizophr Res. 2017.Miller TJ, McGlashan TH, Rosen JL, 11. Cadenhead K, Cannon T, Ventura J, et al. Prodromal assessment with the structured interview for prodromal syndromes and the scale of prodromal
symptoms: predictive validity, interrater reliability, and training to reliability. Schizophr Bull. 2003;29(4):703-15.Yung AR, Yuen HP, McGorry PD, Phillips 12. LJ, Kelly D, Dell’Olio M, et al. Mapping the onset of psychosis: the Comprehensive Assessment of At-Risk Mental States. Aust N Z J Psychiatry. 2005;39(11-12):964-71.Vijayakumar N, Bartholomeusz C, 13. Whitford T, Hermens DF, Nelson B, Rice S, et al. White matter integrity in individuals at ultra-high risk for psychosis: a systematic review and discussion of the role of polyunsaturated fatty acids. BMC Psychiatry. 2016;16(1):287.van Os J, Guloksuz S. A critique of 14. the “ultra-high risk” and “transition” paradigm. World Psychiatry. 2017;16(2):200-6.Cougnard A, Marcelis M, Myin-Germeys 15. I, De Graaf R, Vollebergh W, Krabbendam L, et al. Does normal developmental expression of psychosis combine with environmental risk to cause persistence of psychosis? A psychosis proneness-persistence model. Psychological medicine. 2007;37(4):513-27.van Rossum I, Dominguez MD, Lieb 16. R, Wittchen HU, van Os J. Affective dysregulation and reality distortion: a 10-year prospective study of their association and clinical relevance. Schizophr Bull. 2011;37(3):561-71.Lebel C, Gee M, Camicioli R, Wieler 17. M, Martin W, Beaulieu C. Diffusion tensor imaging of white matter tract evolution over the lifespan. Neuroimage. 2012;60(1):340-52.Koivukangas J, Bjornholm L, Tervonen 18. O, Miettunen J, Nordstrom T, Kiviniemi V, et al. White matter structure in young adults with familial risk for psychosis - The Oulu Brain and Mind Study. Psychiatry Res. 2015;233(3):388-93.Ellison-Wright I, Bullmore E. Meta-19. analysis of diffusion tensor imaging studies in schizophrenia. Schizophr Res. 2009;108(1-3):3-10.Domen PAE, Michielse S, Gronenschild E, 20. Habets P, Roebroeck A, Schruers K, et al. Microstructural white matter alterations in psychotic disorder: a family-based diffusion tensor imaging study. Schizophr
References

Chapter 7
224
Res. 2013;146(1-3):291-300.Wheeler-Kingshott CAM, Cercignani M. 21. About “axial” and “radial” diffusivities. Magn Reson Med. 2009;61(5):1255-60.Alexander AL, Hasan K, Kindlmann 22. G, Parker DL, Tsuruda JS. A geometric analysis of diffusion tensor measurements of the human brain. Magn Reson Med. 2000;44(2):283-91.Westin CF, Maier SE, Mamata H, Nabavi 23. A, Jolesz FA, Kikinis R. Processing and visualization for diffusion tensor MRI. Med Image Anal. 2002;6(2):93-108.Chan W-Y, Yang G-L, Chia M-Y, Lau I-Y, 24. Sitoh Y-Y, Nowinski WL, et al. White matter abnormalities in fi rst-episode schizophrenia: a combined structural MRI and DTI study. Schizophr Res. 2010;119(1-3):52-60.Klauser P, Baker ST, Cropley VL, Bousman 25. C, Fornito A, Cocchi L, et al. White Matter Disruptions in Schizophrenia Are Spatially Widespread and Topologically Converge on Brain Network Hubs. Schizophr Bull. 2017;43(2):425-35.Rubinov M, Bullmore E. Schizophrenia 26. and abnormal brain network hubs. Dialogues Clin Neurosci. 2013;15(3):339-49.van den Heuvel MP, Fornito A. 27. Brain networks in schizophrenia. Neuropsychol Rev. 2014;24(1):32-48.Wang Q, Su T-P, Zhou Y, Chou K-H, 28. Chen IY, Jiang T, et al. Anatomical insights into disrupted small-world networks in schizophrenia. Neuroimage. 2012;59(2):1085-93.Liu Y, Liang M, Zhou Y, He Y, Hao Y, Song 29. M, et al. Disrupted small-world networks in schizophrenia. Brain. 2008;131(Pt 4):945-61.Rubinov M, Knock SA, Stam CJ, 30. Micheloyannis S, Harris AWF, Williams LM, et al. Small-world properties of nonlinear brain activity in schizophrenia. Hum Brain Mapp. 2009;30(2):403-16.van den Heuvel MP, Mandl RCW, 31. Stam CJ, Kahn RS, Hulshoff Pol HE. Aberrant frontal and temporal complex network structure in schizophrenia: a graph theoretical analysis. J Neurosci. 2010;30(47):15915-26.Choi S-H, Kyeong S, Cho KIK, Yun J-Y, 32. Lee TY, Park HY, et al. Brain network characteristics separating individuals at clinical high risk for psychosis into normality or psychosis. Schizophr Res.
2017;190:107-14.Drakesmith M, Caeyenberghs K, Dutt A, 33. Zammit S, Evans CJ, Reichenberg A, et al. Schizophrenia-like topological changes in the structural connectome of individuals with subclinical psychotic experiences. Hum Brain Mapp. 2015;36(7):2629-43.Schmidt A, Crossley NA, Harrisberger 34. F, Smieskova R, Lenz C, Riecher-Rossler A, et al. Structural Network Disorganization in Subjects at Clinical High Risk for Psychosis. Schizophr Bull. 2017;43(3):583-91.van Dellen E, Bohlken MM, Draaisma 35. L, Tewarie PK, van Lutterveld R, Mandl R, et al. Structural Brain Network Disturbances in the Psychosis Spectrum. Schizophr Bull. 2016;42(3):782-9.van den Heuvel MP, Hulshoff Pol HE. 36. Exploring the brain network: a review on resting-state fMRI functional connectivity. Eur Neuropsychopharmacol. 2010;20(8):519-34.Howes OD, Kapur S. The dopamine 37. hypothesis of schizophrenia: version III--the fi nal common pathway. Schizophr Bull. 2009;35(3):549-62.Radua J, Schmidt A, Borgwardt S, Heinz 38. A, Schlagenhauf F, McGuire P, et al. Ventral Striatal Activation During Reward Processing in Psychosis: A Neurofunctional Meta-Analysis. JAMA Psychiatry. 2015;72(12):1243-51.Juckel G, Friedel E, Koslowski M, 39. Witthaus H, Ozgurdal S, Gudlowski Y, et al. Ventral striatal activation during reward processing in subjects with ultra-high risk for schizophrenia. Neuropsychobiology. 2012;66(1):50-6.Kirschner M, Hager OM, Muff L, Bischof 40. M, Hartmann-Riemer MN, Kluge A, et al. Ventral Striatal Dysfunction and Symptom Expression in Individuals With Schizotypal Personality Traits and Early Psychosis. Schizophr Bull. 2016.Simon JJ, Cordeiro SA, Weber 41. M-A, Friederich H-C, Wolf RC, Weisbrod M, et al. Reward System Dysfunction as a Neural Substrate of Symptom Expression Across the General Population and Patients With Schizophrenia. Schizophr Bull. 2015;41(6):1370-8.Wotruba D, Heekeren K, Michels L, 42. Buechler R, Simon JJ, Theodoridou A, et al. Symptom dimensions are associated with reward processing in unmedicated

7
225
DISCUSSSION
persons at risk for psychosis. Front Behav Neurosci. 2014;8:382.Hoogendam JM, Kahn RS, Hillegers 43. MHJ, van Buuren M, Vink M. Different developmental trajectories for anticipation and receipt of reward during adolescence. Dev Cogn Neurosci. 2013;6:113-24.Duerden EG, Lee M, Chow S, Sato J, 44. Mak-Fan K, Taylor MJ. Neural Correlates of Reward Processing in Typical and Atypical Development. Child Neurol Open. 2016;3:2329048X16667350.Bjork JM, Pardini DA. Who are those 45. “risk-taking adolescents”? Individual differences in developmental neuroimaging research. Dev Cogn Neurosci. 2015;11:56-64.Romer D, Reyna VF, Satterthwaite TD. 46. Beyond stereotypes of adolescent risk taking: Placing the adolescent brain in developmental context. Dev Cogn Neurosci. 2017;27:19-34.Montgomery SA, Asberg M. A new 47. depression scale designed to be sensitive to change. Br J Psychiatry. 1979;134:382-9.Fusar-Poli P, Borgwardt S, Bechdolf A, 48. Addington J, Riecher-Rossler A, Schultze-Lutter F, et al. The psychosis high-risk state: a comprehensive state-of-the-art review. JAMA Psychiatry. 2013;70(1):107-20.Jones DK, Knosche TR, Turner R. White 49. matter integrity, fi ber count, and other fallacies: the do’s and don’ts of diffusion MRI. Neuroimage. 2013;73:239-54.Tuch DS, Reese TG, Wiegell MR, Makris 50. N, Belliveau JW, Wedeen VJ. High angular resolution diffusion imaging reveals intravoxel white matter fi ber heterogeneity. Magn Reson Med. 2002;48(4):577-82.Yeh F-C, Wedeen VJ, Tseng W-YI. 51. Generalized q-sampling imaging. IEEE Trans Med Imaging. 2010;29(9):1626-35.Tuch DS, Reese TG, Wiegell MR, Wedeen 52. VJ. Diffusion MRI of complex neural architecture. Neuron. 2003;40(5):885-95.Jensen JH, Helpern JA, Ramani A, Lu H, 53. Kaczynski K. Diffusional kurtosis imaging: the quantifi cation of non-gaussian water diffusion by means of magnetic resonance imaging. Magn Reson Med. 2005;53(6):1432-40.Lu H, Jensen JH, Ramani A, Helpern JA. 54. Three-dimensional characterization of
non-gaussian water diffusion in humans using diffusion kurtosis imaging. NMR Biomed. 2006;19(2):236-47.Caballero-Gaudes C, Reynolds RC. 55. Methods for cleaning the BOLD fMRI signal. Neuroimage. 2017;154:128-49.Liu TT. Reprint of ‘Noise contributions 56. to the fMRI signal: An Overview’. Neuroimage. 2017;154:4-14.Pauli R, Bowring A, Reynolds R, Chen G, 57. Nichols TE, Maumet C. Exploring fMRI Results Space: 31 Variants of an fMRI Analysis in AFNI, FSL, and SPM. Front Neuroinform. 2016;10:24.Nichols TE, Das S, Eickhoff SB, Evans 58. AC, Glatard T, Hanke M, et al. Best practices in data analysis and sharing in neuroimaging using MRI. Nat Neurosci. 2017;20(3):299-303.Gronenschild EH, Habets P, Jacobs 59. HI, Mengelers R, Rozendaal N, van Os J, et al. The effects of FreeSurfer version, workstation type, and Macintosh operating system version on anatomical volume and cortical thickness measurements. PLoS One. 2012;7(6):e38234.Cremers HR, Wager TD, Yarkoni T. The 60. relation between statistical power and inference in fMRI. PLoS One. 2017;12(11):e0184923.Eklund A, Nichols TE, Knutsson H. 61. Cluster failure: Why fMRI inferences for spatial extent have infl ated false-positive rates. Proc Natl Acad Sci U S A. 2016;113(28):7900-5.van Os J. [Personalised psychiatry: no 62. substitute for personal care]. Tijdschr Psychiatr. 2018;60(3):199-204.Guloksuz S, van Os J. The slow death of 63. the concept of schizophrenia and the painful birth of the psychosis spectrum. Psychol Med. 2018;48(2):229-44.McGorry PD, Tanti C, Stokes R, Hickie IB, 64. Carnell K, Littlefi eld LK, et al. headspace: Australia’s National Youth Mental Health Foundation--where young minds come fi rst. Med J Aust. 2007;187(7 Suppl):S68-70.Wilkinson MD, Dumontier M, 65. Aalbersberg IJ, Appleton G, Axton M, Baak A, et al. The FAIR Guiding Principles for scientifi c data management and stewardship. Sci Data. 2016;3:160018.Zwaan RA, Etz A, Lucas RE, Donnellan 66. MB. Making Replication Mainstream. Behav Brain Sci. 2017:1-50.

Chapter 7
226
Gorgolewski KJ, Auer T, Calhoun VD, 67. Craddock RC, Das S, Duff EP, et al. The brain imaging data structure, a format for organizing and describing outputs of neuroimaging experiments. Sci Data. 2016;3:160044.Poldrack RA, Barch DM, Mitchell JP, 68. Wager TD, Wagner AD, Devlin JT, et al. Toward open sharing of task-based fMRI data: the OpenfMRI project. Front Neuroinform. 2013;7:12.Gorgolewski KJ, Varoquaux G, Rivera G, 69. Schwarz Y, Ghosh SS, Maumet C, et al. NeuroVault.org: a web-based repository for collecting and sharing unthresholded statistical maps of the human brain. Front Neuroinform. 2015;9:8.Jahanshad N, Kochunov PV, Sprooten E, 70. Mandl RC, Nichols TE, Almasy L, et al. Multi-site genetic analysis of diffusion images and voxelwise heritability analysis: a pilot project of the ENIGMA-DTI working group. Neuroimage. 2013;81:455-69.Ambite JL, Tallis M, Alpert K, 71. Keator DB, King M, Landis D, et al. SchizConnect: Virtual Data Integration in Neuroimaging. Data Integr Life Sci. 2015;9162:37-51.Lambin P, Leijenaar RTH, Deist TM, 72. Peerlings J, de Jong EEC, van Timmeren J, et al. Radiomics: the bridge between medical imaging and personalized medicine. Nat Rev Clin Oncol. 2017;14(12):749-62.Winterburn JL, Voineskos AN, Devenyi 73. GA, Plitman E, de la Fuente-Sandoval C, Bhagwat N, et al. Can we accurately classify schizophrenia patients from healthy controls using magnetic resonance imaging and machine learning? A multi-method and multi-dataset study. Schizophr Res. 2017.Xiao Y, Yan Z, Zhao Y, Tao B, Sun H, Li 74. F, et al. Support vector machine-based classifi cation of fi rst episode drug-naive schizophrenia patients and healthy controls using structural MRI. Schizophr Res. 2017.Chen Y-J, Liu C-M, Hsu Y-C, Lo Y-C, 75. Hwang T-J, Hwu H-G, et al. Individualized prediction of schizophrenia based on the whole-brain pattern of altered white matter tract integrity. Hum Brain Mapp. 2018;39(1):575-87.Veronese E, Castellani U, Peruzzo D, 76. Bellani M, Brambilla P. Machine learning
approaches: from theory to application in schizophrenia. Comput Math Methods Med. 2013;2013:867924.

7
227
DISCUSSSION


Appendices
SUMMARY

APPENDICES
230
Summary
Research on the cerebral pathways to better understand the psychological mechanisms underlying expression within the psychosis spectrum has shown structural white matter alterations in patients with psychotic disorder and their siblings. In part, this is also observed in individuals with subclinical psychotic experiences. This thesis, entitled “Road work ahead: Cerebral pathways mediating psychological mechanisms underlying the psychosis spectrum”, examines white matter alterations linked to psychotic symptoms in two samples with psychometric expression within the psychosis spectrum.
The work presented in this thesis starts with a general introduction, chapter 1. First, it provides an overview of the concept of psychosis spectrum disorder explaining how this mental disorder develops, how its symptoms develop and the role of genetic vulnerability. In order to better understand the neurobiological pathways related to psychotic disorder, MRI can be used to quantify white matter alterations. This fi ts the framework
known as the disconnectivity hypothesis of psychotic disorder, in which especially demyelination is thought to play a key role.
In chapter 2, the details of structural disconnectivity are researched in patients with psychotic disorder, their siblings and controls. In order to better understand what white matter ‘integrity’ decrease in psychotic disorder may mean, geometrical tensor shape parameters were explored. This novel approach showed increased radial diffusivity, possibly indicating that mainly the myelin is affected in psychotic disorder. The linearity of the tensor was lower in patients compared to controls, suggesting less oriented fi bers, which might indicate altered information transfer. In parallel, siblings
also showed decreased fi ber orientation, which could indicate alterations
related to familial risk and possibly endophenotypic status.
In addition to the study that described structural disconnectivity by using white matter DTI parameters, the study in chapter 3 explored tthe value of network-based connectivity indices in relation to (vulnerability for) psychotic disorder. The fi ndings in patients with psychotic disorder and
their siblings indicated an absence of structural network-based connectivity alterations. This null fi nding was unexpected, as there is literature suggesting
the existence of network alterations in psychotic disorder. Another explanation may be that the approach used to study the structural brain network was too broad. The network was fairly extensive, covering the entire brain, and may still contain regions with higher connectivity and lower connectivity. Findings may therefore have been diluted. Specifi cally
in the siblings, a signifi cant overall decrease in network effi ciency and
clustering was associated with increased positive symptom scores and an overall decrease in clustering was associated with increased negative symptom scores. These differential symptom-networkconnectivity

231
SUMMARY
associations in siblings and controls, may indicate psychosis vulnerability in the sibling group.
The second part of the thesis involves a sampling frame of individuals with subclinical psychotic experiences. In chapter 4, a study is described that used functional MRI to inspect brain activation related to reward anticipation. This concept has been researched extensively in psychotic disorder and taps into dopamine alterations that have been related to psychotic illness. The reward system requires dopamine to function properly and the alterations associated with psychosis appear to affect the anticipation of reward. This concept has been investigated using the Monetary Incentive Delay task in which young adults had to try and gain money by responding correctly. It was shown that the group with subclinical psychotic experiences performed equally well on the task as compared to healthy controls, but the level of activation was decreased. fMRI showed specifi cally that the right insula, putamen and supramarginal gyrus had
decreased activation in the subclinical group compared to controls. Therefore, it seems that the reward system itself may be intact, while brain regions related to emotional valuing, motivation and motor-cognitive processes are affected. It can be speculated that regions outside the reward system are incorrectly processing reward anticipation information.
In line with research on patients with psychotic disorder, as described in the chapters 2 and 3, chapter 5 examined structural white matter microstructure and network connectivity alterations in individuals with subclinical symptoms. Research in young adults ranging from 16 to 25 years in age is important, since brain development is ongoing and the majority of mental disorders emerge during this phase. The results indicated an absence of white matter differences between individuals with mild psychopathology and controls, but showed an association between subclinical psychotic experiences and white matter network connectivity. An increased effi ciency
and clustering in the right middle temporal pole was positively associated with positive symptom distress scores in the PE-group. This may indicate that individuals with white matter network alterations may be predisposed to the development of psychotic phenomena. While this is a fi rst indication
of brain alterations linked to subclinical psychotic experiences, the participants in the sample had very low symptom levels and replication is required.
Chapter 6 described a Randomised Controlled Trial (RCT) in which the effect of six weeks Acceptance and Commitment Therapy (ACT) on subclinical psychotic symptoms and white matter was investigated. It is important to provide young adolescents with support in an early stage of psychopathology symptom development. ACT can be an easily accessible and inexpensive preventive intervention for this group of people. Since this study for the fi rst time tried to link white matter alterations to ACT, most
analyses were explorative. The results showed that subclinical depressive

APPENDICES
232
symptoms were decreased and the combined items ‘mood suspicious’ and ‘feeling unreal’ were slightly increased after the ACT intervention. This could indicate that participants in the ACT condition became more aware of their environment. The ACT intervention did not infl uence structural
white matter or network connectivity change over time, and there were no signifi cant associations between white matter change and symptom change
over time. The study showed that behavioral changes occur in emerging adults, while the structural white matter confi guration remains intact (or
changes cannot be detected) as a result of the ACT intervention.
Lastly, in chapter 7, the fi ndings from the studies are discussed and placed
in the context of research across the psychosis spectrum. The clinical relevance of this research and ideas for future directions are discussed. While diffusion weighted imaging techniques have been developed as a useful clinical tool for understanding cerebral pathways, there still is much work ahead on the research road.

233
SUMMARY


Appendices
SAMENVATTING

APPENDICES
236
Onderzoek naar hersenverbindingen, welke kunnen zorgen voor het beter begrijpen van psychologische mechanismen onderliggend aan de expressie binnen het psychose spectrum, heeft structurele witte stof veranderingen in patiënten met psychotische stoornis en hun broers/zussen aangetoond. Gedeeltelijk is deze bevinding ook aangetoond bij individuen met subklinische psychotische ervaringen. Deze thesis, met de titel “Road work ahead: Cerebral pathways mediating psychological mechanisms underlying the psychosis spectrum”, onderzoekt de link tussen witte stof afwijkingen en psychotische symptomen in twee steekproeven met psychometrische uiting van psychose binnen het psychose spectrum.
Het werk gepresenteerd in deze thesis begint met een algemene introductie, hoofdstuk 1. Allereerst wordt een overzicht gegeven van het begrip psychose spectrum stoornis door uit te leggen hoe deze mentale ziekte zich ontwikkeld, hoe symptomen ontstaan en wat de rol van genetische kwetsbaarheid is. Om de neurobiologische verbindingen gerelateerd aan psychotische stoornis beter te begrijpen, worden MRI-scans gebruikt voor het kwantifi ceren van witte stof afwijkingen. Dit past
in het kader van de ‘disconnectivity’ (loskoppeling) veronderstelling binnen psychotische stoornissen waarin specifi ek de afname van myeline een
belangrijke rol lijkt te spelen.
In hoofdstuk 2 worden de details van structurele disconnectivity onderzocht bij patiënten met een psychotische stoornis, hun broers/zussen en controles. Om beter te begrijpen wat witte stof ‘integriteit’ afname in psychotische stoornissen zouden kunnen betekenen, zijn geometrische tensor vorm parameters onderzocht. Deze nieuwe aanpak heeft een toename in radiale diffusiviteit aangetoond, wat mogelijk zou kunnen duiden op een afwijking in de myeline door een psychotische stoornis. De rechtlijnigheid van de tensor was verlaagd bij patiënten vergeleken met controles. Dit suggereert minder georiënteerde vezels en kan een indicatie zijn voor gewijzigde informatieoverdracht. Tegelijkertijd toonden broers en zussen ook verlaagde vezel oriëntatie, wat zou kunnen duiden op veranderingen gerelateerd aan familiaal risico en mogelijk de endofeno-typische status.
Naast de studie die structurele disconnectivity beschrijft met behulp van witte stof DTI-parameters, onderzocht de studie in hoofdstuk 3 de waarde van op netwerk gebaseerde verbindingsindices bij (kwetsbaarheid voor) psychotische stoornis. De bevindingen bij patiënten met psychotische

237
SAMENVATTING
stoornis en broers/zussen laten een afwezigheid zien van veranderingen in structurele netwerk verbindingsindices. Deze nul-bevinding was onverwacht, omdat er literatuur is waarin de netwerkveranderingen in psychotische stoornissen worden gesuggereerd. Het zou verder kunnen zijn dat de structurele netwerk aanpak wellicht te breed was. Het netwerk was behoorlijk uitgebreid, het gehele brein omvattend, en zou regio’s kunnen bevatten met hogere en lagere verbindingssterktes. Hierdoor kan het zijn dat bevindingen vertroebeld waren. Specifi ek bij de broers/zussen is er
een relatie tussen een algemene afname van de netwerk effectiviteit en clustering met een toename in positieve symptoom scores aangetoond. Ook is er een relatie tussen een algemene afname van de netwerk clustering met een toename van negatieve symptoom scores gerapporteerd. Dit kan een indicatie zijn voor psychose kwetsbaarheid in deze groep van broers/zussen.
Het tweede deel van deze thesis kijkt naar een steekproef van personen met subklinische psychotische ervaringen. In hoofdstuk 4 is een studie omschreven waarin functionele MRI is gebruikt voor het onderzoeken van hersenactivatie gerelateerd aan het verwachten van beloning. Deze opvatting is uitgebreid onderzocht bij patiënten met een psychotische stoornis en kijkt naar dopamine (een neurotransmitter in het brein) veranderingen, welke verband houden met psychotische ziekte. Het beloningssysteem heeft dopamine nodig om goed te kunnen functioneren en de veranderingen in relatie met psychose lijken de verwachting van beloning te beïnvloeden. Dit concept is onderzocht met behulp van de Monetaire Stimulans Vertragingstaak (Monetary Incentive Delay task), waarbij jongvolwassenen moesten proberen om geld te verdienen door correct te reageren. Er werd aangetoond dat de groep met subklinische psychotische ervaringen even goed presteerde in vergelijking met gezonde controles, maar dat de brein-activering afnam. Functionele MRI toonde specifi ek aan
dat de rechter insula, putamen en supramarginale gyrus verminderde activatie hadden in de subklinische groep vergeleken met controles. Daarom zou het kunnen zijn dat het beloningssysteem onaangedaan is, terwijl hersenregio’s gerelateerd aan emotionele waardering, motivatie en motorisch-cognitieve processen wel worden beïnvloed. Er kan worden gespeculeerd dat regio’s buiten het beloningssysteem onjuiste informatie over de verwachting van beloning verwerken.
In overeenstemming met onderzoek naar patiënten met psychotische stoornissen, zoals beschreven in de hoofdstukken 2 en 3, onderzocht

APPENDICES
238
hoofdstuk 5 de structurele witte stof microstructuur en veranderingen in netwerk verbindingsindices bij personen met subklinische symptomen. Onderzoek bij jongvolwassenen van 16 tot 25 jaar oud is belangrijk, omdat de ontwikkeling van de hersenen aan de gang is en de meeste psychische stoornissen zich tijdens deze fase voordoen. De resultaten duiden op afwezigheid van witte stof verschillen tussen individuen met milde psychopathologie en controles, maar er is wel een verband aangetoond tussen subklinische psychotische ervaringen en netwerkverbindingen van witte stof. Een verhoogde effi ciëntie en clustering in de rechter
middelste temporale schacht was positief geassocieerd met scores voor positieve symptomen in de groep met subklinische psychotische ervaringen. Dit kan erop duiden dat personen met veranderingen in witte stof netwerkverbindingen vatbaar kunnen zijn voor de ontwikkeling van psychotische verschijnselen. Hoewel dit een eerste indicatie is van hersenveranderingen gekoppeld aan subklinische ervaringen, hadden de deelnemers aan deze studie zeer lage symptoomniveaus en is replicatie vereist.
Hoofdstuk 6 beschrijft een gerandomiseerd onderzoek met controlegroep (een Randomised Controlled Trial (RCT)) waarin het effect van zes weken Acceptatie en Commitment Therapie (Acceptance and Commitment Therapy (ACT)) op witte stof in subklinische psychotische stoornis onderzocht is. Het is belangrijk om jongvolwassenen steun te geven in een vroeg stadium van het ontstaan van psychopathologische symptomen. ACT kan dienen als een gemakkelijk toegankelijke en goedkope preventieve interventie voor deze groep mensen. Omdat deze studie voor het eerst probeerde om witte stof veranderingen te koppelen aan een ACT-interventie, waren de meeste analyses verkennend van aard. De resultaten toonden aan dat subklinische depressieve symptomen waren verminderd na de ACT-interventie. De gecombineerde items ‘Ik voel me wantrouwig’ en ‘Ik voel me onwerkelijk’ lieten een kleine stijging zien na de ACT-interventie. Dit kan erop duiden dat deelnemers aan de ACT-interventie zich meer bewust werden van hun omgeving. De ACT-interventie had geen invloed op structurele witte stof of de verandering van netwerkverbindingen in de loop van de tijd. Tevens was er geen verband aangetoond tussen witte stof maten en symptomen. De studie toonde aan dat gedragsveranderingen optreden bij jongvolwassenen, terwijl de structurele samenstelling van de witte stof intact blijft (of dat veranderingen niet kunnen worden opgepikt).
Ten slotte worden in hoofdstuk 7 de bevindingen van de studies

239
SAMENVATTING
besproken en geplaatst in de context van onderzoek binnen het psychose spectrum. De klinische relevantie van dit onderzoek en ideeën voor toekomstige richtingen worden besproken. Hoewel diffusie gewogen beeldvormingstechnieken zijn ontwikkeld als een nuttig klinisch hulpmiddel voor het begrijpen van cerebrale verbindingen, is er nog altijd veel werk te doen op de onderzoekswegen binnen psychotische stoornis.


Appendices
KNOWLEDGE VALORISATION

APPENDICES
242
Knowledge valorisation
SummaryClinically relevant expression of the psychosis spectrum has an estimated lifetime prevalence of 3.5% in the general population (1), of which the diagnosis of schizophrenia accounts for the third with a relatively poor outcome (2). The total costs related to the poor outcome end of psychotic disorder are estimated at nearly €94 billion in 2010 in Europe (3). Expenditures are related to high treatment costs, enduring care use and long-standing unemployment. Symptoms in psychotic disorder can be of perceptual, cognitive, emotional or behavioral origin leading to persistent impairments in daily life. The overall aim of this thesis was to examine cerebral pathways in order to understand brain-mediated psychological mechanisms of phenotypic expression in the psychosis spectrum. The focus was on white matter connections in the brain. Both sides of the psychosis spectrum – mild expression below the threshold of clinical need and severe expression in the context of diagnosable psychotic disorder requiring treatment – were investigated, using sampling frames of young people with subclinical psychopathology and a clinical sample with diagnosed psychotic disorder. Although the factors implicated in disease emergence and progression remain unclear, beyond the general aetiological contribution of genetic and non-genetic factors, the hypothesis of white matter alterations in psychotic disorder representing cerebral ‘disconnection’ mediating risk of psychosis expression may be productive (4). This hypothesis is built around the notion of brain white matter alterations occurring in psychotic disorder and fi nds its origin in research focusing on the tracts that connect the cortical areas. This was made possible by the emergence of Magnetic Resonance Imaging (MRI) and especially Diffusion Weighted Imaging (DWI) techniques, creating unique opportunities to study hypothesized alterations in these areas. DWI is able to provide insights on the composition of white matter by measuring the ‘integrity’ of the fi ber tracts. While this term is widely used, the time has come to further advance this research area, using other measures to gain a more detailed impression of white matter alterations in psychotic disorder. This thesis reports, for the fi rst time, on results from an Acceptance and Commitment Therapy (ACT) intervention, a so-called third-generation psychotherapy method, in a sample with subclinical psychotic experiences. This intervention can be easily administered and therefore has a real prospect of being used in routine clinical practice in the treatment of very early states of psychosis. The ACT intervention additionally made

243
VALORISATION
use of the Experience Sampling Method (ESM) to integrate exercises and goals in daily life. ESM is similarly available as a low cost self-monitoring and self-management option to assist people with subclinical psychotic experiences (6). Thus, the instruments underlying the (intervention) studies in this thesis were chosen specifi cally with a view to their possible broader dissemination and use in routine clinical practice, assuring easy bridging of the gap between research and clinical practice.
This thesis reports also on reward anticipation in a sample with subclinical psychotic experiences. Research on alterations of the reward system is important to understand the symptoms of psychosis. With the use of functional MRI, the reward system can be investigated in order to study possible alterations (5). This type of research can contribute by elucidating the reward-related mechanisms underlying symptoms, with the possibility of providing a theoretical framework for development of interventions in the realm of psychopharmacology or psychotherapy.
Importance of this workThe thesis made an attempt to investigate white matter changes over the whole spectrum of psychosis expression and psychosis risk including patients, siblings of patients and a subclinical sample. While the DWI technique is still developing (7), the method has potential to remain and become a valid way to explore the disconnection hypothesis. In addition, DWI can be a useful instrument to investigate medication interventions and is able to detect changes over time. This thesis may have contributed a small step in this endeavor.
I think it is important for the DWI community researching psychotic disorder to abandon the concept of white matter ‘integrity’. This ‘integrity’ is actually a misnomer and captures a broad range of alterations within the white matter such as axon density, myelin content and water content. With the proposed DWI measures in this thesis (axial, radial and mean diffusivity) a more complete overview of white matter alterations can be compiled. The importance of geometrical tensor shape measures should not be underestimated and further research into these measures can help to further elucidate neurobiological underpinnings of psychotic disorder.
Although mental health services are increasingly attempting to start treatment early in order to use relatively conserved plasticity in the earliest stages of mental illness, often a substantial diagnostic delay remains for

APPENDICES
244
patients to receive adequate assessment and early interventions in the earliest stages of psychotic disorder. Delayed treatment increases the risk of school drop-out, drug use and self-harm. In turn, this results in high societal costs and loss in quality of life. Early detection and prevention in the stage of milder symptoms progressing to the next stage of clinical relevance is of paramount importance (8). As noted earlier, the application of an ACT intervention can be a feasible, effi cient and cost-effective way to support youngsters in the earliest stages of expression of psychosis. ACT may in fact represent a non-stigmatizing and generic intervention to help youngsters self-manage early psychopathology. The intervention is tailor made, allowing for personal input and therefore empowers the person. This kind of third wave psychotherapy thus represents personalized, empowering care.
Conducting research in a group of young people within the age range of 16-25 years was challenging. It is therefore important to develop productive strategies to target the vulnerable (and resilient) subgroup of young people during the key developmental phase of life. Stigma reduction is an important element in helping young people to come forward to discuss mental health. The Transition Psychiatry movement aims at providing a low stigma environment and a low stigma language to discuss mental health issues in young people. Generating public awareness on mental disorders as a part of human variation (autism spectrum, addiction spectrum, psychosis spectrum, etc.) helps endeavors to discuss symptoms early and reduces stigma. This can be done through educational and general information efforts in the general (school) population. For example, locally in the area where the thesis research was conducted, systematic contacts with high schools in the Maastricht area have been established along these lines.
AudienceThe results from the research described in this thesis can and should be disseminated beyond the academic community. First, the results may help to gain more insight into preventive intervention opportunities for youngsters with mild psychopathology in the general population. This knowledge can be applied at schools within the realm of assessment and care delivered by school psychologists. It will be important to co-create a low-stigma language with youngsters, which can be used to discuss mental health problems. The role of the parents, school mentor and others in the network in early detection and treatment of mild psychopathology cannot be underestimated, as the network has an important role in preventing both overtreatment and under treatment of those at risk. Indiscriminate

245
VALORISATION
screening and early intervention is a real risk of early intervention and therefore the transition psychiatry approach of creating low-stigma and easily accessible environments where youngsters will experience a low threshold to disclose mental health issues and engage in low-stigma and high-empowerment treatments such as ACT is the best way to go forward, as indeed we are attempting to do in the Maastricht area.
Accomplishments, activities and results One of the activities within the Smartscan project was related to public engagement and participant recruitment. Results from the project can be disseminated via the Brain Awareness Week (BAW), an initiative by the Dana foundation (www.dana.org/baw/). The BAW provides a platform for connecting with schools and talk about the advancement and benefi ts of brain research. It allows for the busting of myths, controversies and misunderstandings. The BAW works not only in a one-way direction, given that in interactive presentations, researchers can also gain novel insights and co-creation ideas from questions raised by the audience. Results from the Smartscan project will also be disseminated through the website of the project (www.smartscanproject.nl).
Furthermore, openly sharing data becomes more and more common in science. The MRI data generated for the two projects can contribute to the bigger good of the neuroimaging community by sharing via NeuroVault or by collaborating via the Enhancing Neuro Imaging Genetics Through Meta Analysis (ENIGMA) consortium or SchizConnect. As part of the GROUP study, data were already shared with other research groups. In the future, Smartscan data will be similarly shared.
The GROUP study on patients with psychotic disorder, their healthy siblings and healthy controls highlighted the power of studying genetic liability in healthy individuals. A genetic predisposition does not determine the life course and the health outcomes in it, however avoiding additional risk factors such as cannabis may prevent a person from developing symptoms (9). Future work may attempt to study the impact of environmental factors on the outcome of interventions like ACT in the target population.
InnovationWhile the main aim of the studies was to generate fundamental knowledge on the neurobiological understanding of psychotic disorder, we also showed that the ACT intervention may be of value in early prevention programs

APPENDICES
246
and the Smartscan study does provide some evidence for an advantageous effect of this mindfulness-based treatment, although requires further study. As ACT is a relatively novel therapy the Smartscan project may contribute to enhanced public awareness about this third wave psychotherapy alternative.
From a more technical perspective, MRI scans may be of (innovative) signifi cance. DWI has proven to be a useful research instrument for in-vivo examination of structural brain alterations. Results are based on group differences and clearly suggest how diffi cult it may be to apply these types of fi ndings at the level of the individual in clinical practice and to generalize the fi ndings across the spectrum of severity in psychosis. Indeed, our fi ndings suggest that DWI fi ndings are not constant across the spectrum of severity. ‘Big data’ collaborative efforts may shed more light on these issues, given the large within and across sample heterogeneity in MRI research. Another innovative approach would be to conduct time-series, repeated measure case studies within patients, focusing on the working mechanisms of interventions in n=1 longitudinal designs. Given very high levels of heterogeneity in mental health research in general and in MRI research in particular, n=1 time series may yield precise solutions at the n=1 level. Meta-analysis of multiple n=1 studies may be used to examine group tendencies.
Future implementationThe methods described in this thesis, with the exception of ACT and ESM, can be rather diffi cult to implement in daily clinical practice, given that for example MRI scans are expensive cannot be used routinely in clinical populations. The scans require a participant to lie motionless for some time in a narrow tunnel with loud noises occurring close to the head. This interplay makes it challenging to have good marketing openings for clinical applications of MRI in psychotic disorder. Potentially there might be opportunities for the application of big data science techniques in neuropsychiatry, which would allow for pooling of data collected worldwide. Many MRI scans are acquired and pooling together datasets might provide novel insights in the neurobiological underpinnings of mental illnesses, as indeed has been shown by the ENIGMA consortium. The clinical psychiatric diagnostic classifi cation system (DSM) was created based on counting the number of symptoms, which add up to a diagnosis. This system is now widely acknowledged as not facilitating the elucidation of underlying mechanisms, be it biological or mental. Thus, there is a paradigm

247
VALORISATION
shift of stepping away from the binary diagnostic true-false system towards a transdiagnostic spectrum phenotypes approach. A transdiagnostic data driven style might elucidate biomarkers that were unknown in the DSM classifi cation system. Part of this data driven approach would be to advance MRI deep learning techniques in order to understand hitherto undetected patterns in the data.Clinically, we think the combination of ACT and ESM, as relatively affordable and workable clinical self-monitoring, self-management and early intervention methods in those with early psychopathology, represent the best ‘value’ for further clinical development, particularly in low-stigma settings as envisioned in transition psychiatry. While we did not show large effects that require direct implementation, we think replication and further research along the lines suggested earlier is an option. We hope that the efforts as laid out in this thesis represent a small step in the global effort to improve the lot of the mentally ill.
ReferencesPerala J, Suvisaari J, Saarni SI, Kuoppasalmi K, Isometsa E, Pirkola S, et 1. al. Lifetime prevalence of psychotic and bipolar I disorders in a general population. Arch Gen Psychiatry. 2007;64(1):19-28.McGrath J, Saha S, Chant D, Welham J. Schizophrenia: a concise overview 2. of incidence, prevalence, and mortality. Epidemiol Rev. 2008;30:67-76.Jin H, Mosweu I. The Societal Cost of Schizophrenia: A Systematic 3. Review. Pharmacoeconomics. 2017;35(1):25-42.Friston KJ, Frith CD. Schizophrenia: a disconnection syndrome? Clin 4. Neurosci. 1995;3(2):89-97.Knutson B, Westdorp A, Kaiser E, Hommer D. FMRI visualization of 5. brain activity during a monetary incentive delay task. Neuroimage. 2000;12(1):20-7.van Os J, Verhagen S, Marsman A, Peeters F, Bak M, Marcelis M, et al. 6. The experience sampling method as an mHealth tool to support self-monitoring, self-insight, and personalized health care in clinical practice. Depress Anxiety. 2017;34(6):481-93.Karlsgodt KH. Diffusion Imaging of White Matter In Schizophrenia: 7. Progress and Future Directions. Biol Psychiatry Cogn Neurosci Neuroimaging. 2016;1(3):209-17.McGorry P, van Os J. Redeeming diagnosis in psychiatry: timing versus 8. specifi city. Lancet. 2013;381(9863):343-5.Genetic Risk and Outcome in Psychosis Investigators. Evidence that 9. familial liability for psychosis is expressed as differential sensitivity to cannabis: an analysis of patient-sibling and sibling-control pairs. Arch Gen Psychiatry. 2011;68(2):138-47.


Appendices
DANKWOORD

APPENDICES
250
In dit hoofdstuk wil ik graag iedereen bedanken die een bijdrage heeft geleverd aan de totstandkoming van dit proefschrift.
Allereerst mijn dank aan alle deelnemers in de GROUP en Smartscan projecten. Het ondergaan van een MRI-scan is een behoorlijke opgave, zeker als je twee uur lang stil moet liggen. Jullie bijdrage aan de wetenschap is van onschatbare waarde, vaak onderschat en erg belangrijk voor dit proefschrift.
Natuurlijk wil ik mijn promotieteam bedanken voor de samenwerking. Jim en Machteld, met jullie inzichten, ideeën en inspiratie is dit proefschrift gekomen tot wat het nu is. Jim, als promotor was je altijd betrokken en geïnteresseerd, ook al was dit op afstand in het laatste jaar. Voor de wekelijkse begeleiding had ik enorme steun aan jou, Machteld. Met jouw intensieve ondersteuning en scherpe blik kwam ik steeds een stap verder.
Een woord van dank ook aan de beoordelingscommissie voor het beoordelen van het proefschrift; voorzitter Prof. Dr. Bart Rutten, Prof. Dr. Philippe Delespaul, Prof. Dr. Neeltje van Haren, Dr. Heidi Jacobs en Prof. Dr. Dick Veltman, en aan de leden van de corona.
De vele collega’s van divisie 2 op Vijverdal wil ik bedanken. Te beginnen met het Smartscan team en in het bijzonder Jindra en Iris. Veel hebben we samen meegemaakt op onderzoeksgebied en daarbuiten. Iris; altijd geïnteresseerd, gemotiveerd en veel passie voor de wetenschap. Met jou was het altijd gezellig sparren en discussie voeren. De vele scanuren maakte je iets meer dragelijk. Samen lekker trappen op de fi ets, dat is wat Jindra en
ik veel samendeden naast het promoveren. Het Ardennen weekend was erg fi jn, dit soort fi ets trips zouden we vaker moeten doen. Met de generatie
PhD studenten, te weten Annelie, Yori, Henni, Thomas, Zuzana, en Silvia was het altijd erg gezellig om samen spellen te spelen in de keuken of wat te drinken op een terras. Van de vorige generatie PhD studenten heb ik destijds veel geleerd. Niet alleen in het uitvoeren van wetenschap, maar ook het organiseren van de LAM. Hiervoor ben ik Sanne, Petra, Feikje, Johan, Tineke, Tim, Mayke, Dennis, Nicole, Christine, Martine en Aleida dankbaar. Natuurlijk was het ook erg inspirerend om met de nieuwere generatie PhD studenten, te weten Boris, Sophie, Simone, Naomi, Esther en Maud te mogen werken en van elkaar te leren. I am very gratefull to work with and learn from Ozan, Christian and Ehsan. You guys are amazing and do great work, keep it up! De Amsterdam connectie via Geor, Martin en Claudia

251
DANKWOORD
kan ik natuurlijk niet snel vergeten. Onze avonturen tijdens de avonduren in Toronto zullen me nog lang bij blijven. A special note for Lotta as an offi ce buddy to share stories with and have a good laughter. Sorry for the
cold conditions during winter time… Verder wil ik Patrick bedanken voor de frisse klinische blik op de witte stof en het delen van ervaringen in het uitvoeren van onderzoek en de daaraan gerelateerde zaken. Natuurlijk kan Ed niet ontbreken in dit dankwoord. Zonder jou waren de analyses nooit zo vlot gelukt en ik heb enorm veel geleerd op het gebied van programmeren en data analyse. The SCRUM-club is a great initiative towards open science and data sharing. Thanks Wolfgang for taking the lead and putting effort in arranging the meetings. Overall it was informative, inspiring and very often an eye-opener to learn about all the wonderful freely available scientifi c
software tools. Also thanks for the support in setting up those complicated statistical models in R. Keep up the good work! Het bruggetje naar Marjan is nu eenvoudig te maken. Bedankt voor de steun als collega epidemioloog, het was een plezier om de CAT’s te beoordelen. Het ondersteunend personeel op de afdeling is van onschatbare waarde. Het Belgische team bestaande uit Truda, Debora, Nele V. en Bea heeft het Smartscan project gedragen en met jullie praktische kijk op de zaken is het succesvol geworden. Het Smartscan project was een behoorlijke uitdaging en met de ondersteuning van de team Koen, Therese, Marieke, Ritsaert en Lies is het tot een goed resultaat gekomen. Bedankt voor de prettige samenwerking. A word of appreciation to my international collaborators; Dr. Nikolai Malykhin (University of Alberta, Canada) and Dr. Graham Murray (University of Cambridge, UK). It is a great pleasure to learn from you and join forces to puch research further. Vele stagiaires hebben een steentje bij kunnen dragen aan de wetenschap. Het was een waar genoegen om de begeleiding van Frank, Kimberley, Nicole, Betül, Janneke en Evita te verzorgen. Het was interessant om samen discussie te voeren en nieuwe ideeën uit te denken, soms onder het genot van bier. De technische IT-ondersteuning van Ron en Jo is altijd correct en op tijd geweest. Zelfs als de zoveelste harde schijf het begaf, waren jullie direct in de weer om te regelen dat alles weer snel op orde was zodat het werk voort gezet kon worden.
De verschillende clubs zorgden voor de nodige ontspanning en sociale contacten. MSBC HEEP (Latijn; ‘Humanum Enim Est Peccare’; het is immers menselijk om fouten te maken) heeft voor veel badminton plezier gezorgd gedurende vele jaren. Hopelijk blijft de club nog vele jaren voortbestaan. De fi etsgroep van UM Cycling zorgde voor geweldig mooie tochten op
de maandagavond. Het was leuk om Dirk, Bert, Joost, Michiel en anderen

APPENDICES
252
uit dagen op de racefi ets. Het organiseren van de Kempenoptocht is elk
jaar een hoogtepunt van het carnaval. De commissie is misschien wat oud qua leeftijd, maar altijd nog jong van geest. Vrienden staan me erg nabij en het is fi jn om samen met Eelco, Mieke, Joost, Teun, Lotje, Mark, Maartje,
Ruud, Renée, Thijs, Koen, Marieke, Ida, Anique, Eva, Nol, Dian, Danielle en Wouter gezellige dingen te doen. De vele weekenden weg, rally’s, optochten en feesten die we samen beleefd hebben zorgden voor memorabele momenten. Vincent, bedankt voor de gezellige avonden in de Thembi. Natuurlijk kan de aanhang hierin niet ontbreken; Asel, Lidion, Rens, Nicky, Dirk, Marian, Mathew, Frank, Ron en Paul. Samen opgesloten zitten in een afgesloten kamer en er uiteindelijk toch uitkomen is een leuke bezigheid met Bart en Michelle. De lichting van de opleiding Biometrie 2010 is en blijft fi jn gezelschap. Regelmatig bijpraten met ons allen moeten we blijven
doen. Bedankt dat je me bijstaat als paranimf Hendrick.
Familie is en blijft erg belangrijk voor mij. Natuurlijk hoort een ‘schoonfamilie’ hier ook bij en het is goed om Bertie, Thei, Rik en Michelle te leren kennen. Een echte schoonbroer heb ik er één, maar het voelt vaak als een broer. Giel, super dat je me wilt ondersteunen als paranimf. Tegen de tijd dat jij zover bent, laat het maar weten. Een zus als voorbeeld hebben is altijd handig. Bedankt voor je steun, interesse en de kans om te vertellen over hersenen op de basisschool. Met Timo en Loek erbij is het geen moment rustig en het is mooi om te zien dat ze zoveel plezier hebben. Pa en ma, het is superfi jn dat jullie altijd klaar voor me staan en het is genieten
op de verschillende uitstapjes die we gemaakt hebben. Oma, bedankt voor je interesse en nu kan ik eindelijk zeggen dat ik echt dokter ben (wel geen arts). Met jou samen is alles beter, Mieke. Laten we samen nog vele mooie avonturen gaan beleven.

253
DANKWOORD


Appendices
LIST OF PUBLICATIONS

APPENDICES
256
Scientifi c publications in international peer-reviewed journalsI. Lange, L. Goossens, J. Bakker, - S. Michielse, R. van Winkel, S. Lissek, N. Leibold, M. Marcelis, M. Wichers, R. Lieverse, J. van Os, T. van Amelsvoort, K. Schruers. Neurobehavioral mechanisms of threat generalization moderate the link between childhood maltreatment and psychopathology in emerging adulthood. Journal of Psychiatry and Neuroscience.P. Domen, - S. Michielse, S. Peeters, W. Viechtbauer, J. van Os, M. Marcelis. Childhood trauma-and cannabis-associated microstructural white matter changes in patients with psychotic disorder: a longitudinal family-based diffusion imaging study. Psychological medicine, 1-11.I. Lange, L. Goossens, - S. Michielse, J. Bakker, S. Lissek, S. Papalini, S. Verhagen, N. Leibold, M. Marcelis, M. Wichers, R. Lieverse, J. van Os, T. van Amelsvoort, K. Schruers. Behavioral pattern separation and its link to the neural mechanisms of fear generalization. Social cognitive and affective neuroscience 12 (11), 1720-1729S. Michielse- , E. Gronenschild, P. Domen, J. van Os, M. Marcelis. The details of structural disconnectivity in psychotic disorder: A family-based study of non-FA diffusion weighted imaging measures. Brain research 1671, 121-130J. Bakker, L. Goossens, I. Lange- , S. Michielse, K. Schruers, R. Lieverse, M. Marcelis, Thérèse van Amelsvoort, J. van Os, I. Myin-Germeys, M. Wichers. Real-life validation of reduced reward processing in emerging adults with depressive symptoms. Journal of abnormal psychology 126 (6), 713C. van der Leeuw, S. Peeters, E. Gronenschild, - S. Michielse, M. Verbeek, P. Menheere, J. van Os, M. Marcelis. Serum S100B: A proxy marker for grey and white matter status in the absence and presence of (increased risk of) psychotic disorder? PloS one 12 (3), e0174752.P. Domen, S. Peeters, - S. Michielse, E. Gronenschild, W. Viechtbauer, A. Roebroeck, J. van Os, M. Marcelis, Genetic Risk and Outcome of Psychosis (GROUP). Differential time course of microstructural white matter in patients with psychotic disorder and individuals at risk: a 3-year follow-up study. Schizophrenia bulletin 43 (1), 160-170.C. van der Leeuw, P. Habets, E. Gronenschild, P. Domen, - S. Michielse, M. van Kroonenburgh, J. van Os, M. Marcelis. Testing the estrogen hypothesis of schizophrenia: associations between cumulative estrogen exposure and cerebral structural measures. Schizophrenia research 150 (1), 114-120P. Domen, - S. Michielse, E. Gronenschild, P. Habets, A. Roebroeck, K. Schruers, J. van Os, M. Marcelis. Microstructural white matter alterations in psychotic disorder: a family-based diffusion tensor imaging study. Schizophrenia research 146 (1-3), 291-300.N. Malykhin, S. Vahidy, - S. Michielse, N. Coupland, R. Camicioli, P. Seres, R. Carter. Structural organization of the prefrontal white matter pathways in the adult and aging brain measured by diffusion tensor imaging. Brain Structure and Function 216 (4), 417.S. Michielse- , N. Coupland, R. Camicioli, R. Carter, P. Seres, J. Sabino, N. Malykhin. Selective effects of aging on brain white matter microstructure: a diffusion tensor imaging tractography study. Neuroimage 52 (4), 1190-1201.
Submitted and in progress papersS. Michielse- , K. Rakijo, S. Peeters, W. Viechtbauer, J. van Os, M. Marcelis; for Genetic Risk and Outcome of Psychosis (G.R.O.U.P.). Microstructural white matter network connectivity in individuals with psychotic disorder, unaffected siblings and controls.

257
LIST OF PUBLICATIONS
S. Michielse- , J. Bakker, I. Lange, T. Batink, L. Goossens, M. Wichers, R. Lieverse, K. Schruers, T. van Amelsvoort, W. Viechtbauer, J. van Os, M. Marcelis. Acceptance Commitment Therapy and white matter plasticity in individuals with subclinical psychotic experiences: a Randomised Controlled Trial.S. Michielse- , I. Lange, J. Bakker, L. Goossens, S. Verhagen, S. Papalini, M. Wichers, R. Lieverse, K. Schruers, T. van Amelsvoort, J. van Os, G. Murray, M. Marcelis. Reward Anticipation in individuals with Subclinical Psychotic Experiences: A Functional MRI Approach.S. Michielse- , I. Lange, J. Bakker, L. Goossens, S. Verhagen, M. Wichers, R. Lieverse, K. Schruers, T. van Amelsvoort, J. van Os, M. Marcelis. White matter microstructure and network-connectivity in emerging adults with subclinical psychotic experiences.
Conference presentationsS. Michielse, - I. Lange, J. Bakker, L. Goossens, S. Papalini, S. Verhagen, M. Wichers, R. Lieverse, T. van Amelsvoort, K. Schruers, J. van Os, G. Murray, M. Marcelis. Reward Anticipation in Early Expression of Psychotic Disorder: A Functional MRI Approach. Biological Psychiatry 81 (10), S373. Presented at the 72th Annual meeting of the Society of Biological Psychiatry in San Diego, United States, May 18-20, 2017.S. Michielse- , J. Roelofs, J. van Os, M. Marcelis. Early expression of psychopathology: psychological pathways to psychosis. Summer School in Cognitive Neuroscience, Helsinki, Finland, August 11-17, 2016.S. Michielse- , E. Gronenschild, P. Domen, J. van Os, M. Marcelis. The Details of Structural Dysconnectivity in Psychotic Disorder: A Study of Diffusion Weighted Imaging Measures. Biological Psychiatry 77 (9), 122S-122S. Presented at the 70th Annual meeting of the Society of Biological Psychiatry in Toronto, Canada, May 14-16, 2015.S. Michielse- , P. Domen, E. Gronenschild, J. van Os, M. Marcelis Structural Brain Network Analysis Methods Using ExploreDTI. Presented at the Images of the Mind Congress in Milan, Italy, April 9-10, 2015.S. Michielse- , E. Gronenschild, P. Domen, P. Habets, J. van Os, M. Marcelis. Een gedetailleerde analyse van witte stof parameters in relatie tot psychotische kwetsbaarheid. Voorjaarscongres NVvP, Maastricht, April 9-11, 2014.S. Michielse.- Fibertracking and brain DTI. MRI Symposium Parkstad, Heerlen, May 13, 2013.S. Michielse- . DTI techniek en het gezond ouder worden van de hersenen. MRI Symposium NVMBR, Ede, September 22, 2011.S. Michielse- . Selective effects of aging on brain white matter microstructure: a DTI tractography study. International Society for Neuroimaging in Psychiatry, Heidelberg, Germany, September 7-10, 2011.S. Michielse- . Selective effects of aging frontal lobe white matter microstructure: a DTI tractography study. International School of Clinical Neuroanatomy. Palermo, Italy, May 25-28, 2011.


Appendices
CURRICULUM VITAE

APPENDICES
260
Curriculum VitaeStijn Michielse was born in Hapert, the Netherlands, on March 2nd, 1985. After graduating from secondary school (HAVO) at the Pius X College in 2002, he started a fi rst Bachelor’s education in Medical Imaging and Radiation Therapy at Fontys Higher Professional Education in Eindhoven. After successful completion of this education and afterwards working as a radiation therapist at the University Hospital of Leuven (Gasthuisberg) in 2006, further learning
followed. The Bachelor of Biometrics (Medical Technology) at Zuyd University in Heerlen was the succeeding step in order to learn more about measurements on the human body. This was the fi rst time he went abroad for a research visit at the University of Alberta (Edmonton, Canada) and got attracted to the fascinating fi eld of MRI research. The Bachelor thesis was a project at the clinical gait analysis laboratory at Pellenberg revalidation center (Belgium) and resulted in the completion in 2010. Subsequently, he started working as a research assistant at the Department of Psychiatry and Neuropsychology in the School for Mental Health and Neuroscience at Maastricht University. The next step in 2011 was to obtain a Master’s degree at the Research Master in Health Sciences – specialization in Clinical Epidemiology – within the School for Public Health and Primary Care. He graduated in the year 2013 and was able to directly start working as a PhD student at division 2 in Department of Psychiatry and Neuropsychology, Maastricht University. During the PhD trajectory Stijn was involved in several projects related to psychotic disorder and white matter imaging using Diffusion Weighted Imaging and won the award for best poster at the annual MHeNS research day twice. During the PhD there was a research visit at the University of Cambridge (United Kingdom), supported by a NENS training stipend. After obtaining the PhD, Stijn will continue to work in the fi eld of MRI and visit the University of Alberta (Edmonton, Canada) for a research project on the fusion of structural and functional MRI data.