Passenger Road Transport in India: Major Challenges in Reducing Energy Consumption and CO2 Emissions...
43
Passenger Road Transport in India: Major Challenges in Reducing Energy Consumption and CO2 Emissions and Ways Ahead Kaushik Ranjan Bandyopadhyay and K.L.Thukral Asian Institute of Transport Development
-
Upload
teriuniversity -
Category
Documents
-
view
1 -
download
0
Transcript of Passenger Road Transport in India: Major Challenges in Reducing Energy Consumption and CO2 Emissions...

Passenger Road Transport in India: Major Challenges in Reducing Energy Consumption and CO2 Emissions and Ways Ahead
Kaushik Ranjan Bandyopadhyay and
K.L.Thukral
Asian Institute of Transport Development

Passenger Road Transport in India: Major Challenges in Reducing Energy Consumption and CO2 Emissions and Ways Ahead
Abstract
The shift of the Indian economy to a higher trajectory of growth over the last two decades has been primarily associated with urbanisation and rapid motorisation both as a cause and as an effect. Motorised passenger transport is now being considered as a fulcrum for inclusive growth in India. Thus putting a cap on its growth may be difficult. Given the key challenge to decouple the economic and social development from the inherent growth in energy consumption and CO2 emissions, the paper takes cue from the Bellagio Declaration 2009 and essentially argues for an integrated and multi-pronged Avoid-Shift-Improve approach to steer passenger road transport growth in India towards a sustainable low carbon path.
Keywords: Passenger, road transport, challenges, energy consumption, CO2 emission

1. Introduction
Transport plays a crucial role in development and constitutes a significant share of world
energy consumption. Transportation primarily relies on petroleum which supplies nearly 95
per cent of the total energy used by the world transport. As of 2005, the total final
consumption of petroleum products by the World stood at 3,420 million tons of oil
equivalent, of which 2,067 million tons or 60.4 per cent was consumed by the transport
sector. Hence, the transport sector has also been largely responsible for the pollution and
greenhouse gas (GHG) emissions which pervade all across the globe (Kahn et al., 2007).
Figure 1 further delineates that within the transport sector, road transport consumes the
largest share of 76.0 per cent (1,571 million tons of oil equivalent) followed respectively by
shipping, international aviation, domestic aviation, domestic navigation, rail, pipeline and
others.
Insert figure1 here
Figure 2 disaggregates the transport CO2 emissions across the modes for 2005. The figure
clearly shows that road transport has the largest contribution to emissions from fuel
combustion in the transport sector and the on-road vehicles that are primarily responsible for
such emissions are passenger cars and light duty vehicles (LDVs) i.e. four wheeled vehicles
(including sports utility vehicles, small passenger vans with up to 8 seats).
Insert figure 2 here
The Intergovernmental Panel on Climate change (IPCC) advises in its fourth assessment
report (AR4) that in order to avoid worst impact of climate change global CO2 emissions
must be cut by at least 50 per cent. Transport has a very significant role to play in order
achieve that goal. Although all modes of transport has to be a part of that emission reduction
process, it is quite evident from the modal shares of CO2 emissions (as shown in figure 2)
that the onus would fall primarily on passenger road transport and especially on passenger
cars and light-duty vehicles.
As far as India is concerned, reducing CO2 emissions from transport as an issue has generally
not been driving policy discussions at the national level as well at the state and local level in
India until recently. The key drivers of transportation policies had been the externalities like

congestion, local air pollution, safety and other environment related concerns the impact of
which is immediately visible or perceptible. Although policies aimed at reducing energy
consumption and CO2 emissions has potential synergies with these drivers, they usually
continued to remain as an issue of secondary concern.
Considering the trend and pattern of growth in transport sector in India, road transport has
emerged as the dominant segment with a share of 4.5 per cent in India’s GDP as of 2006-7.
From 2000-1 to 2006-7, the annual average growth rate registered by GDP pertaining to the
road transport sector was 9.4 per cent and was considerably higher than the overall growth
rate of GDP during the same period which was around 6.9 per cent1. An important feature in
road based mobility in India is the phenomenal growth registered by the motor vehicle
population over the years. Between 1951 and 2006 the vehicle population grew at a
compound annual growth rate (CAGR) of nearly 11 per cent. Personalized modes (primarily
comprised of two wheelers and cars) account for more than four-fifth of the motor vehicles in
the country as of 2006 as compared to their share of little over three-fifth in 1951. On the
contrary, the share of public transport (buses) in total registered vehicles has declined from
11.1% in 1951 to 1.1 % as in 2006 (Government of India, 2009). This uneven pattern of
growth pertaining to land based passenger transport sector in India poses serious challenges
in terms of reducing energy consumption and CO2 emissions.
In the light of this brief backdrop, the analysis in this paper would essentially focus on
challenges and opportunities of reducing energy consumption and CO2 emissions from
passenger road transport in India.
2. Challenges in Reducing Energy Consumption and CO2 Emissions from India’s
Passenger Road Transport Sector
The challenges in reducing CO2 emissions and hence ensuring low carbon road mobility in
passenger transport emanates from the fact that a range of factors influences passenger
transport emissions both directly and indirectly. Figure 3 shows the range of factors that
determines or influences energy consumption and CO2 emissions from the passenger
transport sector.
Insert figure 3 here 1 RBI, Handbook of Statistics for the Indian Economy, available at: www.rbi.org.in.

Thus the challenges in curbing absolute and relative emissions in passenger road transport
could be clubbed under four broad categories: 1) challenges in controlling vehicle activity
(A); 2) structural challenges in influencing modal shift (S); 3) challenges in reducing energy
intensity (I) of modes; and 4) challenges in influencing or affecting the choice of fuel (F)
used.2 In India, however, the biggest challenge arises from controlling the travel activity (A)
due to increasing urbanisation coupled with favourable factors for rapid motorisation. The
other primary challenges pertaining to the broad classification mentioned above are: 1)
marginalisation of public transport and declining share of non-motorised modes (influences
both S and I); 2) relative decline in rail transport’s share in both intra-city and inter-city
passenger traffic (S); 3) distortions in prices of domestic auto-fuel (influences both I and F)
4) lack of effective fuel efficiency and emission standards (I) 5) absence of adequate low
carbon substitutes of appropriate quality (F); and finally 6) Governance related challenges
that reinforces all the aforementioned challenges in some way or the other. Each of these
challenges is taken up and discussed in more details below.
Urbanisation and Rapid Motorisation
Economic growth and development in most of the developing nations including India has
been largely propelled by their urban areas, which provide the bulk of employment
opportunities. A recent study carried out by Asian Development Bank (ADB, 2006) projected
that nearly 38 per cent of India’s population would live in cities by 2025. In India, the
number of cities with population above 1 million increased from 12 in 1981 to 35 in 2001 as
per the decennial Census for the respective years. The growing population in urban areas led
to de-densification of cities, with rapid growth in suburban areas. This trend of de-
densification in turn led to increase in distances that are required to be travelled in order to
access jobs and basic services resulting in a rising demand for travel (Kahn et al., 2007).
However, this rising travel demand could hardly be served by the existing unsound,
unattractive and inadequate public transport systems that are incapable of meeting this
demand. This inherently led to an increasing dependence on personalised vehicles and a
concomitant decline of walking and cycling as a share of total travel. The trend has been
2 This broad framework was first suggested in a seminal paper in 1999 by Schipper et al. and is referred to as ASIF framework (Schipper et. al , 2000)

reinforced further by lack of integrated land use and transport planning, distortions within
transport planning coupled with a liberalised automobile sector.
Although the National Urban Transport Policy (NUTP)3 in India emphasises on the need for
integration of the land use and transport planning, the mega cities with million plus
population still continue to address these two problems in isolation. Transport planning in
these cities is intended merely to cater to the immediate mobility needs of growing urban
sprawls by encouraging the growth of personalised motorised modes rather than preventing
the rapid growth of sprawls. Urban planning and land use planning in these cities also
address current demands by implementing specific projects but are hardly aimed at shaping
the structure of the city or pivot its future growth on a sustainable foundation.
Distortions in transport planning and markets in India like most other developing countries
also tend to increase usage of personalised modes. For example, motorists are rarely charged
the full costs of congestion, road space, parking, and air pollution. Moreover, the bulk of
public expenditure in most of the cities is devoted to expanding infrastructure (like highways,
roads, flyovers, parking facilities and so on) to cater to the needs of these personalised modes
(Sundar and Dhingra, 2008).
Moreover, due to liberalization of the Indian economy in 1991, a number of new firms
entered automobile sector and started producing a large variety of cars in different segments
(small, medium and large) and two-wheelers. The availability of plethora of vehicles along
with the easy financing of purchase at competitive interest rates has increased the sale of cars
and two wheelers substantially during 1990s and afterwards. For example, during the year
2004-5 the number of cars sold in the country already exceeded one million and the number
of two wheelers exceeded six million4. Figure 4 shows the vehicle fleet projections in India
till 2025 (ADB, 2006).
Insert figure 4 here
3 Available at: http://www.urbanindia.nic.in/policies/TransportPolicy.pdf 4 Available at: http://www.siamindia.com/scripts/domestic-sales-trend.aspx.

The increasing motorisation and growth of private vehicles especially cars is clearly a matter
of serious concern as the energy intensity and CO2 emission per passenger km for cars is the
highest among all modes of transport (as illustrated in Table 1 for India).5
Insert table 1 here
Despite the rapid growth in private vehicles in the post-liberalisation era, the current vehicle
density in India is nearly 22 vehicles per 1000 persons, compared to say 598 in Germany, 675
in USA and 586 for Japan. Also the number of cars per 1000 people is about 10 per thousand
people for India. However, the number of two-wheelers per 1000 population is much higher
at around 58 in case of India. The low vehicle density is however marked by its skewed
distribution in favour of cities, as indicated above. Although India starts from a low vehicle
density but it is quite obvious that as India shifts to a higher growth trajectory the ownership
of personal vehicles especially cars would grow at a rapid pace due to increase in per capita
incomes and growing trend of urbanisation coupled with growing aspirations of the middle
class, which forms a very large segment of metropolitan cities in India. The problem might
get all the more compounded with increasing consumer preferences for larger personal
vehicles fitted with more energy consuming power steering, air-conditioning etc. leading to
higher energy consumption and more emissions.6
In addition to the above factors that are increasingly driving motorisation, the Government of
India is undertaking an ambitious programme aimed at connecting all villages with all-
weather roads by 2012 (Prime Minister Village Road Scheme). Although such a programme
will definitely provide easy access to schools, post offices, hospitals and help in faster
movement of the rural people and products to bigger markets or mandis, this will
simultaneously lead to a concomitant rise in demand for motorized transport in place of
existing non-motorised modes (like bullock-carts and camel-carts). While this development is
desirable, rather inevitable, if no efforts are really made to either increase the fleet of high
capacity public transport in rural areas or use efficient motorised modes then the challenge of 5 Vehicle kilometer is the unit of vehicle traffic and indicates the total distance travelled by a vehicle. One vehicle kilometer basically means one kilometer traversed by the vehicle. Usually vehicle km is measured and considered on an annual basis. Passenger km is the unit of passenger traffic and is usually measured by multiplying the vehicle km by the occupancy ratio (no. of occupants in the vehicle). 6 The National Road Transport Policy of India underscores that in the coming years the profile of motorization is expected to witness a number of changes in terms of segment shifts in car ownership, driven by rising incomes, desire for safety and comfort and government regulations. (available at: http://morth.nic.in/writereaddata/sublinkimages/278.pdf).

decoupling economic and social development from energy consumption and CO2 emission
through rapid motorisation would simply get compounded.
Marginalisation of Public Transport and Non-motorised Modes
In the post reform period (1991-2006), while the vehicle population grew at a CAGR of
around 10 per cent, the number of buses grew by less than 7 per cent with a meagre growth of
less than 1 per cent in the number of public buses owned by the public sector entities (GoI,
2009). The marginalization of public bus transport in India is natural fallout of major
sociological and economic changes related to increase in disposable income of households,
changes in lifestyles, urbanization which inherently led to demand for speed, service quality,
convenience, flexibility and availability. In addition to these behavioural factors, the
government regulation and control have exacerbated the poor operational and financial
performance of publicly owned transport undertakings, which are the main provider of bus
transport services in the country, resulting in increasing reliance on personalized private
modes of passenger transport and further marginalization of public transport. One of the
major reasons for the poor performance of the public sector undertakings is the high staff cost
and loss on account of concessions in fares provided to various special and vulnerable
categories of commuters (such as students, freedom fighters etc.) which is not compensated
for by state or central governments. Furthermore, operation of the public transport on
economically unviable routes and high rate of various taxes are the other major reasons for
the financial non-viability of public transport system in India (Kharola and Tiwari, 2008).
Figure 5 indicates the contribution of different taxes to the total operating cost of a bus. A
good system of public transport is highly desirable in India since it provides higher capacity
at less marginal cost; produces less emission per passenger km travelled (see table 1); and
reduces congestion on roads by weaning away personal vehicle users. Although buses are
popular mode of public transport and are carrying around 40 to 60 per cent of total trips in
some large cities of India (GoI, 2009), the fleet is in want of modernisation and strengthening
in order to restrain fuel consumption and emissions.
Insert figure 5 here

The non-motorised modes of transport such as walking and cycling are environmentally most
benign and have zero emissions. However, with the easy availability of motorized transport
coupled with safety concerns in walking and cycling, a marked shift has occurred in India
especially in the cities from non-motorised transport to motorised ones. A large number of
cities in India even rely on para-transit vehicles (like mini buses and vans) which are usually
fuel inefficient and lead to higher emissions.
Relative Decline in Rail Transport Share in Intra-city and Inter-city Passenger Traffic
Table 2 provides a summarised overview of the total road based and rail based passenger and
freight traffic from 1951 onwards till 2006. Over the last three and a half decades from 1970-
1 to 2005-6, while the total population registered a growth of around 98 per cent, absolute
road-based passenger traffic increased from 210 billion passenger km to 4252 billion
passenger km in India which represents an overwhelming growth of around 1924 per cent at a
CAGR of nearly 9.0 per cent per year. However the rail based passenger traffic remained a
laggard and lost its shares to road based passenger traffic.
Insert table 2 here
Railway is popular for inter-city travel and a relatively environmentally benign mode of
transport as compared to road transport. In this context, it is worth mentioning about an
empirical study carried out by the Asian Institute of Transport Development (AITD, 2002)
that made a comparative assessment of rail and road transport in India from perspectives of
social and environmental sustainability. The study took into account equivalent volumes of
passenger traffic on the two modes across the entire stretches of eight selected inter-city
sections of the railway track which are competing with either a state or a national highway.
The study revealed that railways consume much less energy per passenger kilometre than
road and are environmentally and socially more benign. The energy consumption on different
rail sections has been observed to vary between 78.77 to 94.91 per cent of the energy
consumed by road transport (see figure 6).7
Insert figure 6 here
7 If one discounts for the higher tare weight of passenger coaches as compared to road vehicles the saving in energy consumption and emission turns out to be phenomenal and much higher than what is specified above.

Unabated Dependence on Imported Crude and Distortions in Domestic Auto-fuel Prices
Among the sectors that use oil in India, transport has the largest share (see table 3). Moreover
nearly 96 per cent of the total commercial energy used in the transport sector comes from oil
(see table 4). Thus, the transport sector, in general, and road transport sector, in particular, is
the most exposed part of the economy to volatility in international crude prices. Increasing
volatility creates uncertainties making it non-conducive for fresh investments to pour in and
often leads to delay in major investments in new oil production and refining capacity (see
Bandyopadhyay, 2008; Bandyopadhyay 2009b). It also acts as a deterrent to investment in
fuel efficient car technology aggravating the problem for a major oil consumer like India with
the challenge of its growing road transport sector.
Unfortunately the growth in the transport sector in India has been coupled with control on
retail selling (pump) prices of petrol (gasoline) and diesel in order to shield these fuels from
fluctuation in international oil prices. The regulation has generated perverse incentives and
invariably led to an unabated increase in consumption of both the fuel. The high fuel prices
acts as a signal to consumers that they need to take action to reduce consumption. Thus,
removing that signal also removes the incentive to invest, for example, in more fuel efficient
vehicles and make the transport sector, in general, and consumers, in particular, more
vulnerable to future price increases. Although India has surplus refining capacities but more
than 75 per cent of refinery throughput comes from imported crude. The dependence on
imported crude is only going to increase in future as India shifts to a higher trajectory of
growth and would inherently lead to higher oil demand. Hence, a process of complete
deregulation and determination of retail selling price of automotive fuel by maintaining parity
with the movement in global crude prices is necessary in order to encourage conservation and
generate higher incentives for investment in fuel efficiency and renewable.
Furthermore, any discussions on pricing of auto-fuel (petrol and diesel) in India remains
incomplete without considering the price distorting excise and customs duties that are
imposed by the centre and sales taxes imposed by the states on these products. Taking Delhi,
the capital city of India, as a benchmark, nearly 49 % of the retail price of petrol and 25% of
the retail price of diesel could be observed as comprising of these taxes (see figures 7 and 8).
Insert figure 7 and 8 here

Furthermore, due to India’s federal structure, the state governments are authorised to levy
certain taxes and surcharges on petroleum products. These mostly include value added tax
(VAT) and/or sales tax, entry tax, transit charges and other levies. The charges are either
imposed as specific or flat rate or on ad valorem basis and sometimes a combination of both.
The number of levies and their magnitude vary widely among states. Figure 9 portrays the
comparative picture of the state-wise sales taxes in India on petrol and diesel, which
constitute the major component among all these taxes. Although considerable efforts have
been made to rationalise central levies (illustrated in the next section), the states have shown
little inclination towards rationalising the duties levied on auto-fuel (despite repeated
insistence from the centre). The reason that have been frequently cited by most of the states is
that in order to meet disparate economic and social challenges at the sub-national level, the
revenue generated from the levies on auto-fuel is crucial. However rationalisation of these
levies is crucial in facilitating the domestic auto-fuel prices to correctly reflect upon the
variations in international oil prices.
Insert figure 9 here
Dearth of Effective Fuel Efficiency and Emission Standards
Appropriate fuel-efficiency and vehicle emissions standards designed for new and in-use
vehicles and well-designed and functional inspection and maintenance (I/M) program are
important elements of an overall strategy to reduce vehicle emissions and air pollution.
Introduction of mandatory fuel economy standards is a key strategy for fuel saving and GHG
emission (especially CO2) from vehicles. The report of the National Integrated Energy Policy
brought out by the Planning Commission in 2006 (GoI, 2006c) in India underscored that 50
per cent improvement in fuel economy could facilitate a saving of nearly 86 million tonnes of
oil consumption by 2030-31.
The developed countries namely USA, Europe, Japan, Australia and South Korea have
regulations for the automobile industry where the regulated metric involves either fuel
economy of vehicles, fuel consumption of vehicles, CO2 emission from vehicles or a
combination of fuel economy and CO2 emissions over a targeted period of time (see table 3).
Among the developing countries, only China introduced regulations to improve fuel
efficiency in 2005.

Insert table 3 here
India does not have mandatory fuel economy standards. The Society of Indian Automobile
Manufacturers (SIAM) announced a ‘Voluntary Labelling Programme’ in September 2008 to
disclose fuel economy details of vehicles manufactured by its constituents. The leading
Indian car manufacturer Maruti Suzuki was the first to act under the programme and has
successfully labelled all categories of vehicles that it manufactures. However, there are no
legal obligations on the part of Indian automobile manufacturers to notify fuel economy
levels of vehicle models they manufacture (Thukral, 2009). Later on the Bureau of Energy
Efficiency (BEE) under the Ministry of Power had been entrusted with the responsibility to
develop and notify the norms of mandatory fuel economy standards under Energy
Conservation (EC) Act.8 However, the process got unnecessarily stalled due to revival of a
long-standing dispute between BEE and Ministry of Road Transport and Highways on the
basis for setting fuel efficiency standards. The latter holds the view that the fuel efficiency
standards should be designed under Motor Vehicle Act9 rather than EC Act.
With regard to emissions standards, while India’s two wheeler standards are stricter
than those in Europe, it lags way behind Europe in respect of four wheelers. Furthermore, the
national roadmap for fuel quality and vehicle emission standards is selective and focuses only
on the larger cities and neglects the rapidly motorizing medium and small towns (due largely
to the non-availability of fuels of the appropriate quality). Emission standards in India were
introduced with Bharat Stage I (equivalent to Euro1) in 2000 covering whole of India. Bharat
stage II (equivalent to Euro II) standards came into force in the whole of India in 2005. Euro
III standards were introduced in 2005 across 11 cities; these will be extended nationwide in
2010. Euro IV standards are in the process of being introduced in 11 major and more polluted
cities but no date has yet been set for introducing Euro IV equivalent standards in the rest of
India. With regard to inspection and maintenance system (comprising inspection,
maintenance, and certification of vehicles) the large population of personalised passenger
vehicles in Indian metropolises is not yet covered by any mandatory requirement of periodic
8 Considering the vast potential of energy savings and benefits of energy efficiency, the Government of India enacted the Energy Conservation Act, 2001 (52 of 2001). The Act provides for the legal framework, institutional arrangement and a regulatory mechanism at the Central and State level to embark upon energy efficiency drive in the country. 9 For more details of the Motor Vehicle Act see- http://dorth.gov.in/index2.asp?sublinkid=120&langid=2.

fitness certification. What exists in practice is a simple pollution under control (PUC) check
which came into existence in 1991 for all on road vehicles.
Absence of Adequate Low Carbon Substitutes to Petrol and Diesel
The substitutes for oil in road transport are currently inadequate or in nascent stage and are
not always commercially viable. In 1998, the Supreme Court mandated conversion of all
public buses in Delhi to Compressed Natural Gas (CNG), a low carbon alternative, and for
subsequent conversion of all Government of India vehicles to CNG. However, no road map
has been constructed towards that end due primarily to dearth of adequate natural gas supply.
Until recently, the primary source of natural gas in India has been from the offshore Western
coast of Bay of Bengal which has also started deteriorating in terms of production. The
pumping of natural gas by Reliance Industries Limited (RIL) and Oil and Natural Gas
Corporation (ONGC) from the Krishna Godavari (KG) basin of Bay of Bengal has just begun
(see Bandyopadhyay, 2009a) and it is only after adequate distribution network and
infrastructure are put in place in all the cities for distribution of CNG could one expect the
dependence on petroleum to come down considerably.
Furthermore, the government has also been encouraging the use of bio-fuels and has
mandated blending of 5 per cent ethanol with gasoline. The government came out with the
National Biofuel Policy (NBP) in December 2009 which has set a target level of biofuel
blending of 20 per cent to be achieved by 2017 (GoI, 2009a). The blending level will be
reviewed periodically depending on the availability of feed stocks. The NBP tried to allay the
concerns related to the potential trade-offs between first generation biofuels and food-crop
production, land-use changes and bio-diversity by emphasising that such trade-offs are not
relevant in the Indian context since bio-ethanol in India is produced primarily from molasses,
a by-product of sugar industry and bio-diesel is produced from non-edible oil seeds (like
jatropha, karanja, jojoba etc.) grown in waste and degraded forest and non-forest lands.
However, the concerns regarding the first generation biofuels’ potential for reducing GHG
emissions still remain. Furthermore, given the existing infrastructure and the institutional set
up, the achievement of target lending of 20 per cent in the next decade seems a remote
possibility.

The ethanol industry is facing acute shortage of sugarcane molasses besides countering
restrictive government policies, and unsustainable prices. Moreover, the management and
operation of the biofuel sector, in general, and ethanol, in particular, has got increasingly
complex due to the involvement of multiple government agencies and poses a serious
challenge in terms of coordination. For the bio-diesel industry, the foremost problem is
availability of land for planting jatropha. The Planning Commission estimated in 2003 that in
order to reach a blending target of 20 per cent, the requirement of land would be around 14
million hectares for jatropha cultivation (GoI, 2003). While the land may exist on ground, a
considerable part of it may be occupied by landless and marginal farmers who need to be
persuaded to grow only jatropha. In the case of wasteland, local farmers may participate only
if they are assured of adequate returns. Furthermore, the high yielding varieties of jatropha
oilseeds are in the process of being developed and may take a number of years till they
become available commercially. Additionally, the present insurance policies that are being
offered by the companies for covering the risks involved in planting jatropha are limited in
scope. The policies only provide cover for the replanting cost and loss of income and do not
include risks involved in loss of yields. This clearly acts as a deterrent. Some other primary
concerns relate to fixation of appropriate floor price for the crops; periodic revisions in order
to account for increase in cost of production; and setting up appropriate purchasing agencies
to buy the crops at the pre-determined prices (Thukral, 2010).
Governance Related Challenges
Transport planning and management especially in urban areas necessitates a holistic and
coordinated approach. However in India, there are a plethora of impediments in bringing
about such a coordinated approach due mainly to absence of appropriate institutional
arrangements and linkages (Sundar and Dhingra, 2008). The authorities and associated
responsibilities pertaining to transport planning and management are often fragmented and
divided between and within the state and city governments. Furthermore these sub-national
authorities also lack the necessary power, resources and capacity to address problems of
congestion, air pollution and GHG emissions. The institutional challenges in the context of
reducing energy consumption and emissions from transport sector influence most of the
components that affects energy use and emissions in some way or other. A particular
difficulty in institutional development for sustainable transport in India is posed by the large

share of para-transit modes.10 These modes operate in the (semi-) informal sector and are
often undercapitalized. They are not easy to integrate in governmental programs for
modernisation and fleet renewal aimed at reforming the transport sector in order to make it
less carbon intensive.11
3. Addressing the Challenges Passenger road transport is considered as a major plank for inclusive economic growth in
India. Therefore putting a cap on its growth may not be feasible. Hence, as India continues to
grow on a higher trajectory in future and as India’s population especially its urban population
continue to soar, the demand for passenger road transport would continue to increase. Thus,
the primary challenge that the transport planners and policymakers in India are facing is to
decouple economic and social development from the unabated increase in energy
consumption and CO2 emissions that may arise from rapid growth in passenger transport
sector due to reasons explained in the preceding section.
However, a standalone policy of reducing CO2 emissions from passenger road
transport sector may not appeal much to the policymakers and other stakeholders because the
cost involved is considerably higher. Thus, initiatives to restrain CO2 emissions from
passenger road transport in India need to be aligned closely with overall strategies to reform
the sector. Hence, besides addressing the bigger question of energy security in India and the
transport sector’s contribution, in particular, towards that end, reduction of CO2 emissions
should essentially be recognised as co-benefits of a more holistic transport reform.
In this context, a meeting that was held in Bellagio in May 2009 assumes great
significance (for details see Box 1). The meeting came out with a declaration and formulated
a common policy framework on sustainable low carbon transport for developing countries
aimed primarily at the road transport. The common policy framework recognised an
integrated multi-pronged approach based on co-benefits. The framework also recognised that
technological improvement by themselves might not be enough for the transport sector in
10 In South Asia this includes the motorized three wheeled rickshaws, in the Philippines locally assembled
jeepneys and buses built around imported second hand truck engines, in the Indonesia the Bemo. 11 Because they operate in the informal sector they often do not keep formal books, have formal franchises, or
pay taxes on a regular basis which can be a guarantee to benefit from financial assistance programs.

order to make a significant dent on CO2 emissions. Thus it underscored on sector wide re-
orientation of transport sector combining policies and measures aimed at - a) avoiding or
reducing travel or need to travel b) shifting to more environment friendly or energy efficient
modes and c) improving efficiency of motorised modes. The approach is more popularly
known as Avoid-Shift-Improve framework. This framework would be instrumental in saving a
chunk of energy consumption by –
Reducing the distances driven or the number of trips taken (Avoid)
Reducing emissions per passenger unit (Shift)
Reducing emissions per kilometre driven per vehicle (Improve)
Insert Box 1 here
Some of the important measures pertaining to this framework are as follows:
• Reducing the distances driven or the number of trips taken (Avoid): This
includes, among others, changing people’s behaviour, substituting or reducing the
need to travel through various virtual mobility alternatives using information and
communication technology; better traffic management and route designs; integrated
land use and transport planning.
• Reducing emissions per passenger unit (Shift): This includes generating incentives
of modal switch from private vehicles to public transport by restraining vehicle
ownerships (using measures like vehicle taxes, congestion charges, parking charges,
toll taxes and road pricing for private vehicles); encouraging car-pooling and non-
motorised transport like cycling and walking for shorter distances; increasing share of
public transport and introducing high capacity comfortable and attractive buses along
with bus rapid transit; expansion of mass rapid transit system (like metro rail) across
all the cities in India.
• Reducing emissions per kilometre driven (Improve). This could be achieved in a
number of ways which includes, among others, fuel switch to cleaner fuels with low
carbon density (like CNG, biofuels etc.); introducing or expanding battery operated
hybrid vehicles; introducing low carbon and combustion efficient vehicle
technologies, introducing best practices (e.g. improved maintenance, introducing fuel
efficiency standards and stringent fuel quality and emission standards for personalised

modes), changing behaviour (by creating incentives for purchase of more energy
efficient vehicles) and continued infrastructure improvements to reduce congestion.
Significant emission reductions could be achieved by introducing more efficient modes of
transport, changing people’s travel habits and up gradation of technology. The most
promising among all these measures especially in urban areas are mass urban transit projects
like metro railway and bus rapid transit (BRT), which not only increases the efficiency of
transporting passengers but also has significant sustainable development co-benefits, such as
reducing air pollution and congestion.
It also deserves to be underscored that an essential prerequisite for ensuring a
sustainable transport system is to provide for a rational modal distribution amongst the
alternative modes of transport. This can be achieved primarily by government policies on
transport which could legislate for internalization of social costs into the pricing of different
modes. Better land use and transport planning, substituting need for travel by use of
information technology (IT), better traffic management, increased share of public transport
and improving vehicle and fuel technologies, as already mentioned above, are some ways to
improve efficiency in road transport especially in urban areas. But for inter-city long-
distance travel an optimum modal choice could be achieved through an intermodal shift from
road to rail.
Furthermore, appropriate and non-distortionary automobile fuel pricing is considered
as a very effective economic instrument for energy conservation that facilitates in reinforcing
measures pertaining to the multipronged approach illustrated above. Continuance of price
control on automobile fuels inherently tends to benefit the relatively well-off section of
passengers primarily in the densely populated cities in India as the propensity for travel using
personalised modes like cars tends to be considerably higher among the latter. This, in turn
leads to higher energy consumption and CO2 emissions. In this context, an earlier study
carried out in 2009 (Bandyopadhyay, 2009) made an attempt to assess the potential
implication of fuel price deregulation on fuel consumption and CO2 emissions across various
modes of passenger road transport in India. Table 5 and 6 summarises the results of the study.
Insert table 5 here
Insert table 6 here
Instead of universally insulating the domestic pump prices of automobile fuel from
international oil price variations, a better targeted social policy catering to relatively poor

travellers (in both rural and urban areas), say in the form of subsidised public transport,
would be able to cater to the objectives of sustainable mobility much more efficiently and
effectively. Furthermore, in order to allow public transport to provide affordable mobility to
the rural and urban poor, incentives could be provided in the form of subsidised fuel
exclusively for public transport.
4. Recent Policy Initiatives Undertaken by the Indian Government: A Snapshot
Indian government has undertaken a number of recent policy initiatives at the national
level in order to address some of these challenges. Box 2 gives a snapshot of the recent
national policies that addresses some components of the multi-pronged Avoid Shift Improve
approach as illustrated above.
Insert Box 2 here
In terms of financing initiatives to bring about changes at the local level with support of
strategic plans and programs at national level the Jawaharlal Nehru National Urban Renewal
Mission (JnNURM) in India provides a great example (see Box 3 for details). JnNURM
provides financial assistance as soft loans, grant-cum-loans or grants to Urban Local Bodies
and parastatal bodies via state-level nodal agencies in return for formulating City
Development Plans (CDPs) and detailed project reports for urban infrastructure development.
Furthermore, grants for urban buses have recently been made available, subject to the set-up
of Dedicated Urban Transport Funds at state and city levels.
Insert Box 3 here
Considering some notable city level public transport initiatives, the first BRT corridor
in India opened in Delhi. Surveys among the users of the BRT indicated general satisfaction
with the service provided despite the shortcomings in the original design and its
implementation of the corridor. In Ahmedabad, the city residents have embraced their new
Janmarg BRT system; 18,000 daily passengers use Janmarg to commute to work, to school
and elsewhere. In just a few months of operation, Janmarg has transformed the delivery of

transit in South Asia. 12 Janmarg uses innovative central median stations pulled away from the
junctions. Bus stations feature passive solar design, an inexpensive way to keep stations
naturally cool. The city is making continued efforts to be a leader in sustainable transport,
including incorporating high-quality pedestrian facilities in some corridors, as well as bicycle
lanes.
Considering the recent initiatives with respect to providing encouragement to non-
motorised transport, a landmark judgment dated 10 February 2010 in Delhi High Court
deserves special mention. In response to petitions filed against the cap of 99,000 three
wheeler cycle rickshaw licenses imposed by the Municipal Corporation of Delhi in 1997, the
Chief Justice bench of the Delhi High Court removed the restriction on the number of
licenses that can be issued to the rickshaw pullers. The bench also stated that confiscation and
scrapping of cycle rickshaws are against the law.13 The High Court thus pro-actively saved an
important non-motorised mode from near extinction. The High Court bench also mandated
the formation of special task force to explore all questions pertaining to road traffic in the city
aimed at minimising congestion, reducing pollution levels from vehicles and ensuring
equitable access to all classes of vehicles that ply on roads (including non-motorised transport
such as bicycles and cycle rickshaws).14 Additionally, the final ruling also endorsed
congestion charges for car owners passing through congested areas of the city. In this context,
the Delhi High Court bench drew examples from the existing congestion charging system in
other developing countries and directed for regulation on movement of personal vehicles in
the city and suggested considering all options including congestion fee on private cars in
certain congested areas of the city and limit their use.15
With respect to rationalisation of duties on petrol and diesel, a number of government
committees have also deliberated since 2005 (GoI, 2005; GoI, 2006a; GoI, 2006b; GoI, 2008;
GoI, 2010). In line with these recommendations, first from March 2005 onwards, excise
duties had been reduced from 30 % and 14% respectively to 8 % plus Rs. 13/litre and to 8 %
and Rs. 3.25/litre while custom duties were reduced from 20 % to 10 % for branded petrol
and diesel. Then, from March 2007 onwards the ad valorem component of excise duties on
12 The city of Ahmedabad has recently bagged the award of most sustainable transport system for 2010 among the developing countries.The information on sustainable transport award is available at: www.st-award.org. 13 Delhi High Court ruling in the two cases - Manushi Sangathan, Delhi vs. Government of India and others, WP(C) No. 4572/2007; Initiative for Transportation and Development Programmes vs. Municipal Corporation of Delhi and others, WP(C) No. 8580/2009. 14 Staff Reporter, ‘Task Force to find solution to Delhi’s traffic woes’, the Hindu, February 11, 2010. 15 Abhinav Garg, ‘Delhi High Court moots congestion fee on cars’, the Times of India, February 11, 2010.

both petrol and diesel has been reduced from 8% to 6% and the custom duties on both
products were reduced from 10% to 7.5 %. From July 7, 2009 onwards the basic excise duty
on branded petrol and diesel has been revised from 6 % plus Rs 5 per litre and 6 % plus Rs
1.25 per litre to Rs 6.5 per litre and Rs 2.75 per litre respectively. In other words, the basic
excise duty has been altered from a combination of specific and ad valorem to specific
duties.13 However, the state sales taxes on petrol and diesel could not be reduced
concomitantly despite repeated requests from the central government to state governments for
doing so.
Conclusion
Many of the potential policies and measures under Avoid-Shift-Improve framework are
already well known and have been tested in specific countries and cities in the developing or
developed world and can be relatively easily replicated or scaled up. The Indian
policymaking with respect to passenger transport has also internalised some components of
this approach. However the financial, technological, and institutional resources are yet to be
fully reoriented towards this integrated framework in order to address the multi-faceted
challenges involved in restraining or reducing energy consumption and GHG emission
(especially CO2) from passenger transport in India.
An important issue that deserves attention is that contrary to the perception created by the
heightened concern and growing public attention for climate change, climate change does not
seem to be the key driver of transport policies and projects in India and other developing
countries. This is because the potential financial earnings from GHG reduction tends to be
significantly lower than other earnings or cost savings associated with a good transport policy
or project that addresses local benefits, such as reduced traffic congestion and air pollution.
Thus the observable and perceptible negative spillovers like traffic congestion and air
pollution still play a much bigger role in development of transport polices and investments
rather than climate change, where the consequence is not immediately visible.
In this context, it needs to be recognised that the transport policies and programs can have:
(a) Benefits –the primary intentional goal of policies and project (say, reduced traffic
congestion), (b) Primary co-benefits - other benefits that directly result from transport
policies or projects (e.g. GHG and air pollution reduction), or (c) Secondary co-benefits -

benefits that indirectly result from transport policies or project (e.g. reduced health impact
and costs from air pollution). The success of passenger transport in addressing the challenges
of energy consumption and CO2 emission could be achieved in an efficient manner by a
holistic implementation of integrated Avoid–Shift-Improve approach which synergises these
benefits and co-benefits most effectively. However the speed of implementation and costs
involved therewith is largely contingent upon the nature of policies and institutions (whether
fragmented with lack of clarity or well-coordinated); availability of tools; and institutional
capacity to apply such tools; and finally the availability of resources.
Thus, a critical mass of well equipped institutions is needed in order to enable structural
changes in policies to implement this approach. Institutional development in support of low
carbon passenger transport includes- (a) clarification of institutional mandates at all
geographical levels (local, sub-national, national, regional and global) (ii) strengthening of
institutional capacities within all sectors (government, civil society, academia and private
sector), and (c) improved coordination and cooperation between different sectors at, and
between, different geographical levels. The requirement of improved coordination applies
especially to integration of land-use and transport planning and should essentially be directed
towards development of comprehensive passenger transport systems, rather than individual,
ad-hoc, projects.
Furthermore, private sector participation in the provision of low-carbon passenger transport
needs to be encouraged as the private sector is better at mobilizing investments. However, in
order to facilitate increased private sector participation appropriate regulatory frameworks
need to be developed and put in the first place. The same applies to civil society which can
help in mobilizing support for policy development and implementation and which can also
take on an important role in flagging problems before they become unmanageable and in
following-up of policy commitments made by governments.
Developing countries like India should be playing a key role in applying this co-benefit
approach and making their transport system sustainable and low carbon based through the
combination of policy instruments, institutional capacity development, appropriate pricing
mechanisms and mobilisation of financial resources. However in order to implement co-
benefits approach it should also be integrated in a more structured and quantified manner in
policy analysis and the feasibility studies of programmes and projects.

References
Asian Development Bank, 2006. Energy Efficiency and Climate Change Considerations for on-road Transport in Asia. Philippines: Asian Development Bank. Asian Institute of Transport Development, 2002. Environmental and Social Sustainability of Transport: Comparative Study of Rail and Road. New Delhi: Asian Institute of Transport Development.
Bandivadekar, A., 2009. Review of Fuel Economy/Greenhouse Gas Standards Worldwide. Presentation at the GFEI (Global Fuel Economy Initiative) Symposium held in New Delhi, 25 November.
Bandyopadhyay, K. R., 2008. OPEC’s Price-making Power. Economic and Political Weekly, 2008, 43(46), pp 18-21.
Bandyopadhyay, K.R., 2009a. Potential Implication of Fuel Deregulation on Energy Demand and CO2 Emissions: A Case Study of Passenger Transport in India. Discussion Paper1, Transport and Climate Change, New Delhi: Asian Institute of Transport Development, August 2009.
Bandyopadhyay, K.R., 2009b. Adding KGs to GDP. The Financial Express, 4 December 2009.
Bandyopadhyay, K.R., 2009c.What will oil do in 2010? The Financial Express, 30 December 2009.
Bandyopadhyay, K.R., 2010a. Fossil Fuel Subsidy Reform in India. Policy Brief 45, New Delhi: Research and Information System for Developing Countries, January. <available at: www.ris.org.in/pb45.pdf >
Bandyopadhyay, K.R., 2010b. Crude logic lies in decontrol. The Financial Express, 4 February 2010.
Browne, Jodi, Eduardo Sanhueza, Erin, Silsbe, Steve Winkelman and Christopher Zegras (2005). Getting on Track: Finding a Path for Transportation in the CDM. Manitoba: International Institute of Sustainable Development.
Government of India, 2003. Report of the Committee on Development of Biofuel. Planning Commission, New Delhi, February 2003.
Government of India, 2005. Pricing of Petroleum Products: Sixth Report of the Standing Committee on Petroleum and Natural Gas 2004-05. Fourteenth Lok Sabha, Lok Sabha Secretariat, New Delhi, August 2005.

Government of India, 2006a. Report of the Committee on Pricing and Taxation of Petroleum Products. New Delhi, February 2006.
Government of India, 2006b.Pricing of Petroleum Products: Tenth Report of the Standing Committee on Petroleum and Natural Gas 2005-06. Fourteenth Lok Sabha, Lok Sabha Secretariat, New Delhi, May 2006.
Government of India, 2006c. Integrated Energy Policy. Report of the Expert Committee, Planning Commission, New Delhi, August 2006. Government of India, 2006d. Report of the Working Group on Petroleum and Natural Gas Sector for the XI Plan (2007-2012). Ministry of Petroleum and Natural Gas, New Delhi, November 2006. Government of India, 2008. Report of the High Powered Committee on Financial Position of Oil Companies”, report submitted to the Prime Minister, New Delhi, August 2008.
Government of India, 2009. Road Transport Yearbook 2006-07. New Delhi: Ministry of Shipping, Road Transport, and Highways.
Government of India, 2009a. National Policy on Biofuels. New Delhi: Ministry of New and Renewable Energy.
Government of India, 2010. Report of the Expert Group on a Viable and Sustainable System of Pricing of Petroleum Products. New Delhi, February 2010.
International Energy Agency, 2007a. World Energy Statistics and Balances, Paris: IEA.
International Energy Agency, 2007b. CO2 Emissions from Fuel Combustion: 1971-2005, Paris: IEA.
Leather, J, 2009. Rethinking Transport and Climate Change. Draft Sustainable Development Working Paper, Philippines: Asian Development Bank, September 2009.
Kahn, R., S. S. Kobayashi, M. Beuthe, et al., 2007. Transport and its Infrastructure. in Metz, B., O.R. Davidson, P.R. Bosch, et al. (eds.) Climate Change 2007: Mitigation, Contribution of Working Group III to the Fourth Assessment Report of the Intergovernmental Panel on Climate Change(IPCC), Switzerland: IPCC.
Kharola B.S. and G Tiwari, 2008. Urban Public Transport Systems: Are the Taxation Policies Congenial for their Survival and Growth. Economic and Political Weekly, 43(41), October 2008, pp 41-7.
Schipper, L, C M-Lilliu and Roger Gorham, 2000. Flexing the Link between Transport and Greenhouse Gas Emissions: A Path for the World Bank, Paris: IEA, June 2000.
Sengupta, R., 2007.High Economic Growth, Equity and Sustainable Energy Development of India. Discussion Paper Series, 213, Japan: Research Institute of Economics and Business Administration, Kobe University, December 2007 <available at: http://www.rieb.kobe-u.ac.jp/academic/ra/dp/English/dp213.pdf>.

Sundar, S., and C. Dhingra, 2008. Reducing Transport CO2 Emissions in Emerging Economies. Paper presented at the Second Annual Conference of the International Transport Forum, Leipzig, Germany.
Thukral, K.L., 2009a. The Need for Vehicle Fuel Economy Norms in India. The Financial Express, June 21, 2009. Thukral, K.L., 2010. Can India get to a 20% Biofuel Blend by 2017? The Financial Express, April 16, 2010.

Figure 1. World Petroleum Products Consumption by the Transport Sector, 2005
Source: IEA (2007a)

Figure 2. Modal Shares of Transport CO2 Emissions (2005)
Source: IEA, 2007b

Figure 3. Potential Determinants of Emissions from Passenger Transport
=
× × ×
Source: Browne et al. (2005)
Passenger Transport Emissions
Vehicle Activities
(trips× distance) (pkm)
Potential Determinants
• Population • Demographics • Income • Urban Form • Travel Behaviour
Mode Share
(percent pkm)
Potential Determinants
• Income • Motorisation
rate • Infrastructure
Conditions • Service
Provision • Urban Form
Fuel Intensity
(litres per pkm)
Potential Determinants
• Fuel Efficiency
• Engine type • Vehicle load • Vehicle Age • Congestion
Levels • Capacity Mix • Urban Form
Fuel Choice
(emission per litre)
Potential Determinants
• Fuel Type • Fuel Quality • Engine Type • Vehicle
Technology • Vehicle Age • Temperature • Altitude

Figure 4. Projections of Vehicle Fleet
Source: ADB (2006)

Table 1. Energy Intensity and CO2 Emission for an On-road Passenger Vehicle across All
Modes of Road Transport in India (as of 2004-05)
Modes
Energy Intensity (in MJ/passenger
km) CO2 emissions
(in Kg) Cars 0.864 0.058- 0.064 2-wheelers 0.476 0.032- 0.036 3-wheelers 0.580 0.039- 0.043 Buses 0.137 0.009- 0.0102
Note: MJ-Mega Joule; CO2 emissions have been computed for the uncertainty range of CEF factors provided in
IPCC Guidelines, 2006 Source: Calculated by the author using data on passenger traffic for 2004-05.
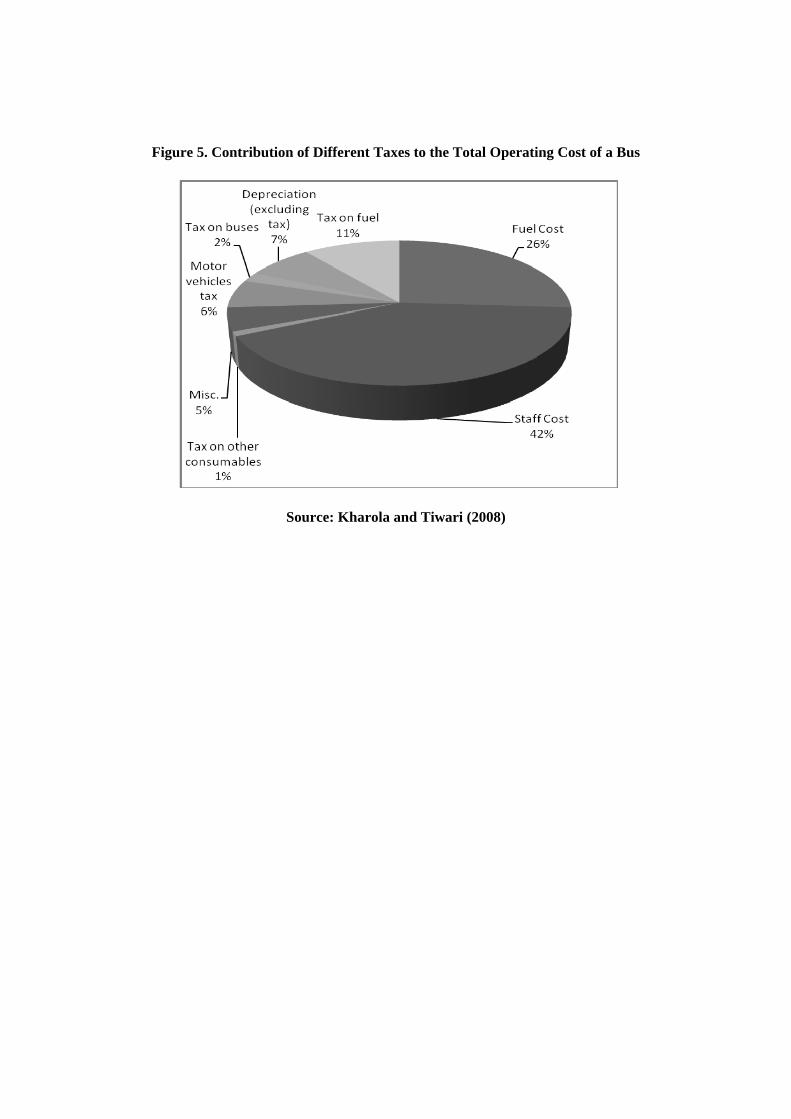
Figure 5. Contribution of Different Taxes to the Total Operating Cost of a Bus
Source: Kharola and Tiwari (2008)

Table 2. Road Based and Rail Based Passenger and Freight Traffic
Year Road Based Passenger
Traffic Rail Based Passenger
Traffic (billion passenger km)
1950-51 23.00 66.50
(15.40) (84.60)
1960-61 80.90 80.90
(51.0) (49.0)
1970-71 210.00 118.10
(64.0) (36.0)
1980-81 541.80 208.60
(72.2) (27.8)
1990-91 767.70 295.60
(72.2) (27.8)
1999-00 1831.60 430.70
(81.0) (19.0)
2000-01 2075.50 457.70
(82.0) (18.0)
2001-02 2413.10 1490.90
(83.1) (16.9)
2002-03 2814.70 515.00
(84.5) (15.5)
2003-04 3070.20 541.20
(85.0) (15.0)
2004-05 3469.30 575.70
(85.8) (14.2)
2005-06 4251.70 615.60
(87.4) (12.6)
*Figures in the parenthesis indicate percentage share
Source: Government of India (2009)

Figure 6. Energy Consumption: Intercity Passenger Road and Rail
Source: AITD (2002)

Table 3. Sectoral Distribution of Oil Use in India. (as percentage share of total oil use across sectors)
Year Industry Transport Agriculture Commercial & Public Services
Residential Households
1971 24.5 37.4 4.3 0.8 21.6
1990 22.9 45.1 0.4 3.1 23.8
2005 17.9 33.3 5.6 0.4 19.7
Note: The shortfall of the row sum from 100 is to be imputed to non-energy use of energy resources or use by other sectors. Source: Sengupta (2007); originally computed using different volumes of Energy Balances of Non-OECD Countries published by IEA.

Table 4. Sector-wise Oil Application in India (as percentage of total final commercial energy use in a sector)
Year Industry Transport Agriculture Commercial & Public Services
Residential Households
1971 19.3 45.8 63.6 27.8 64.8
1990 17.0 88.9 4.7 47.2 79.6
2005 26.6 95.8 41.5 - 63.0
Source: Sengupta (2007); originally computed using different volumes of Energy Balances of Non-OECD Countries published by IEA.

Figure 7. Percentage Share of Duties and Taxes in Petrol Price at Delhi
Price without Duties and Taxes51%
Sales Tax17%
Customs Duty1%
Excise Duty31%
Data Source: Petroleum Planning and Analysis Cell (PPAC), website:ppac.org.in

Figure 8. Percentage Share of Duties and Taxes in Diesel Price at Delhi
Price without Duties and
Taxes75%
Sales Tax12%
Customs Duty2%
Excise Duty11%
Data Source: PPAC, website:ppac.org.in

Figure 9. Sales Tax Rates on Petrol and Diesel in Various States across India
(As of November 2009)
Note: Rates are inclusive of cess, additional tax and VAT concession and sales tax at last point but precludes entry tax and other irrecoverable taxes.
Data Source: PPAC, website: ppac.org.in

Table 4. Worldwide Automobile Efficiency or GHG Standards
Country/Region Regulated metric Expected reduction in CO2 per-
distance emissions*
European Union CO2 emissions (CO2/km) 40% reduction, MY@ 2008-20
United States Fuel economy (miles/gallon) 20% reduction, MY 2011-16
GHG emissions (CO2e/miles)
Japan Fuel economy (km/L) 19% reduction, MY 2010-15
China Fuel consumption (L/100km) 12 % reduction, MY2008-15
California GHG emissions (CO2e/miles) 25% reduction, MY 2008-16
Australia Fuel consumption (L/100km) 10% reduction, MY 2004-10
South Korea Fuel economy (km/L) 13% reduction, MY 2012-15
CO2 emissions (CO2/km)
* Expected reduction in CO2 reduction pertains to different test driving cycles for different countries. @ MY stands for measurable year. Source: Bandivadekar (2009)

Box1: Bellagio Declaration Twenty one representatives from eighteen different organizations working on transport and climate change in developing countries met 12 -16 May, 2009 in Bellagio, in a meeting to build a consensus on the required policy response to the growing CO2 emissions from transport in the developing world. The meeting resulted in the Bellagio Declaration on Transportation and Climate Change. This Declaration calls on organizations and individuals to support urgent action to change the change the trajectory of future GHG emissions from transport and to make transport in developing countries more sustainable. It appeals to all participants in the climate negotiations to provide strong support for the following 3 key-principles
• Principle 1: Effective Climate Action Is Incomplete Without Addressing the Overall System Performance of the Transport Sector.
• Principle 2: Climate action in the transport sector should recognize co-benefits • Principle 3: Carbon finance mechanisms and associated procedures should catalyze sustainable
transport policies, programs and projects The meeting also formulated a Common Policy Framework on Sustainable, Low Carbon Transport, which elaborates the vision underpinning the Bellagio Declaration on Transportation and Climate Change.
Source: www.sutp.org/bellagio-declaration

Table 5. Estimated Energy Demand for an On-road Passenger Vehicle per Year across Various
Modes of Road Transport (in Tera Joule)
Year Scenario Car Two Wheeler
Three Wheeler
Buses
2004 0.038 0.005 0.035 0.561
2010 BAU 0.049 0.006 0.042 0.822 HP 0.045 0.005 0.033 0.644
HPHE 0.041 0.004 0.030 0.585
2020 BAU 0.738 0.009 0.058 1.391 HP 0.044 0.004 0.024 0.573
HPHE 0.328 0.003 0.018 0.431
2030 BAU 0.112 0.013 0.079 2.412 HP 0.039 0.002 0.014 0.417
HPHE 0.024 0.001 0.009 0.259
Note:
BAU (Business as Usual) Scenario- In this scenario it is assumed that no policy initiatives are taken to reduce
energy consumption or CO2 emissions
HP (High Price) Scenario- In this scenario it is assumed that variation in domestic real fuel prices will be
aligned to changes in international real crude prices
HPHE (High Price High Efficiency)- In this scenario in addition to the assumption under High Price scenario
an increase in fuel efficiency per vehicle at the rate of 10 % every five years is assumed
Source: Bandyopadhyay (2009)

Table 6. Estimated CO2 emissions for an on-road Passenger Vehicle per year across Various
Modes of Road Transport (in kg)
Year Scenario Car Two Wheeler
Three Wheeler
Buses
2004 2691.74 335.43 2455.34 39898.48
2010 BAU 3485.80 427.45 2995.64 58502.38 HP 3201.71 334.72 2345.79 45811.23
HPHE 2910.64 304.29 2132.53 41646.57
2020 BAU 5248.58 635.58 4119.23 98999.13 HP 3102.02 261.96 1697.81 40804.09
HPHE 2330.59 196.82 1275.59 30656.72
2030 BAU 7947.36 940.42 5647.26 171648.9 HP 2740.03 162.49 975.74 29657.78
HPHE 1701.34 100.89 605.86 18415.15
Note: Same as table 5
Source: Same as table 5

Box 2 : Indian Government Initiatives that Addresses Some Components of Avoid-Shift-Improve Framework
National Urban Transport Policy (NUTP), 2006
• Integrate land use and transport planning • Invest in and promote public transport and encourage in non-motorized modes • Develop transport projects focused on equitable allocation of road space • Promote clean vehicles • Raise resources through innovative financing mechanism • Build capacities
Source: http://www.urbanindia.nic.in/policies/TransportPolicy.pdf
National Action Plan on Climate Change (NAPCC), 2008
• Suggests early introduction of fuel economy standards. • Promotes investments in high capacity public transport systems • Suggests introducing transport pricing measures to influence purchase of vehicles on the basis of
their energy efficiency • Abandoning old vehicles to be made illegal; fixing the responsibility of the last owner of the
vehicle to handover the vehicle at the end of its life to the collection centres to be nominated by the government.
• Encourages setting up of demonstration centers to take up recycling of vehicles especially two wheelers
• Encourages energy R&D in Indian railways • Promotes use of coastal shipping , inland waterways, encourage rail based movement instead of
long distance road based movement
Source: http://pmindia.nic.in/climate_change.htm

Box 3: Transport Funds in India Examples of local transport funds in action can be seen in India, where recently two urban areas have adopted such an approach. In Surat, vehicle taxes, parking charges and advertisement fees are fed into a dedicated urban transport fund, which is used to support its urban mobility plan, including the expansion of bus services and modification of three-wheelers to power on CNG. In Pimpri-Chinchwad, a 130km BRT network is being developed through an urban transport fund, funded by fares, monthly passes, advertisement and land related taxes (e.g. development rights around the BRT corridor, and property tax). India also possesses the Jawaharlal Nehru National Urban Renewal Mission (JnNURM) which at national level provides assistance to megacities in their efforts to improve urban infrastructure. Sustainable transport is one focus of this ambitious scheme. The philosophy behind the JNNURM is one of cost-sharing between national and local level, in design, construction and operation of infrastructure. Recently, as part of the Indian government’s economic stimulus package, a one-time assistance grant of $58 billion has been provided to the states under the framework of the JnNURM for the purchase of urban buses. This provision is subject to various conditions, including the setting up of a dedicated Urban Transport Fund at both the state and the city level. Revenue sources suggested for the Fund at state level include sales tax on petrol, vehicle registration fees, renewal fees for driving licenses, congestion taxes and green taxes. The Fund at the city level includes betterment levies on land, parking fees, property development taxes, advertisement revenue.
Source: Leather (2009)