Influence of temperature and moisture on the electrical ...
11
Journal of Research of the National Bureau of Standards Vol. 48, No.5, May 1952 Research Paper 2322 Influence of Temperature and Moisture on the Electrical Properties of Leather Charles E. Weir Appar ent, or bulk , diel ect ric constan ts and power factor s of chrome and vegeta ble leat her and un ta nned hide are repor ted for moisture contents up to 30 perce nt , at tempera- t ur es of 23° C, 0° C, and - 70° C over the frequ ency ran ge 0.75 to 96 kilocycles. Diel ectric cons tant s of fibers determ ined on dr'y ma te rial at 3 kilocycles and 22° C are : chrome 5.4; vegetabl e 6.4 ; and kan garoo te ndon 5.1. Apparent dir ect-c urre nt resist ivity decreases from values > 10 '6 ohm- cm when dr y to va lu es < 10 9 ohm-cm at 30-percent mois ture. Apparent di el ectric co nstant decreases wi th fre quency and te mperat ure at a ll moist ur e cont ents, t he fr equ ency dependence in creasing with moi st ur e co nte nt. Apparent power fac to rs generally exhibit s imilar behavior. At - 70° C at high moist ure co nt ents, a diffuse abs orption ma xi- mum observed may be due to ice or to permanent dipoles of co llagen w hich ar e freed by moi st ure. Obser ved behavior is inte rpr ete d as probab ly aris in g fr om a co mbi nat i on of int er- facial polarization at s urfaces existing in the fibrous leather and dipolar polarization. Results indicate el ect ri cal meas ur e ment s in this frequency range are probably not reliable for precise quant itati ve moisture anal yses. 1. Introduction Adsorption of moist me by hygroscopic mat erials generally causes a marked chang e in the electrical prop ert ies (conduc tivit y, dielectric constant , and power fa ctor ) of such substances. This effe ct is gen- erally attr ibuted to the high dielectric constant and co ndu ct iv it y of the adsorbed moist ure as compar ed to the much lower values exhibited by the dry ad- s Ol 'bate . In view of th e large electrical eff ects pro- duced by the moist ure and th e rapidity, r el ative sim- plicit y, and nond estructive natur e of electrical meas- mement s, such determinations have been proposed as m ethods for quantitat ive moi st ure determina tions [3, 14 , 41].1 Unfortunately, the mat erials of par- ticular int erest in this connection ar e usually powders or fibrous ma teri als that possess large adsorption surface areas and , therefor e, the r es ult s of electrical measmements are not eas il y interpr eted be cause of the complex physical structme of the specimens. R ecentl y, int erest has ar isen in application of dielec- tric measur ement s for the det ermination of moi st me in l eath er [27]. This report describes the results of critical st udies of the effects of moistme and temperature on the dielectric constant and power factor of leather in the audio and low int ermediate frequency range . In mo st measmements dealing with a porous mate- rial such as l eath er , two experimental values are recognized, a "real" value associat ed with the fibers alone, and an "apparent" value that refers to the bulk material including the air in the intersti ces. To avoid confusion b et we en the former and the real part of the complex dielectric constant , the term "fiber dielectric constant " will be used instead. Apparent valu es as used are und erstood to refer to the bulk mat erial. I Figures in brackets ind icate the literature referenccs at the end of this paper. 2. Experimental Method 2.1. Electric Appara tus :M eas ur em ent s of capacitance a nd resis tance wer e obtained with a shi eld ed resistanc e-capa citance bridge co ntaining a Wagner-e arthing circuit . Th e bridg e is shown schemati cally in fi gure 1. A d etailed discussion of t hi s bridge has been publish ed pr e- viously [29]. Hi gh -s tability input signal in the fre- q uen cy range 0.75 to 96 kc were prov id ed by a variable frequency oscillator. Br idge balance was ascertained through dir ect use of earphone at all fr equ encies as hi gh as 12 k c, wh il e at hi gher frequ en- cies a regener ative, all-wave re ceiver was used to d etect and amplify the output signals. Fiber dielectric co n stants were determined by th e immersion m ethod [42 , 45] in a co mpl etely shi eld ed, cylindrical, guard-ring cond enser. This condenser was construct ed of h eavy brass, and all s w-faces were given a fine machine finish. Th e guard was located near the top of the condenser below an opening fitt ed with a reservoir that was used as an overflow. A second opening at the bottom of the condenser was fitt ed to permit introduction of liquids and suspen- sions. The capacitance of the empt y condenser was 40 .2 2 p.p.f, a valu e that was reproducible to within ± O.Ol , up.f. All measurements with this condenser were carried out at 22.2° C at a frequen cy of 3 le c in the fo llowing mann er : The condenser was fi lled with a sui table solution of ethylene dichloride in benzen e. Choice of these liquids resulted from previous st udi es [26] indicating negligible intera ction b et ween leather and liquid. Th e sol ution was then circu- lated through the condenser by using the two open- ings until a stable and reproducible value of capac- i tance was ob tained. Upon attainment of eq ui lib- 349
-
Upload
khangminh22 -
Category
Documents
-
view
1 -
download
0
Transcript of Influence of temperature and moisture on the electrical ...

Journal of Research of the National Bureau of Standards Vol. 48, No.5, May 1952 Research Paper 2322
Influence of Temperature and Moisture on the Electrical Properties of Leather
Charles E. Weir
Apparent , or bulk, die lectric constan ts and power factors of chrome and vegetable leather and un tanned hide are reported for moisture co nte nts up to 30 percent, at temperat ures of 23° C, 0° C, and - 70° C over the frequency range 0.75 to 96 kilocycles . Dielectric constants of fibers determ ined on dr'y material a t 3 kilocycles and 22° C are : chrome 5.4 ; vegetable 6.4 ; and kangaroo tendon 5.1. Apparent direct-current resistivity decreases from values > 10' 6 ohm-cm when dry to values < 109 ohm-cm at 30-percent mois ture. Apparent dielectric co nstant decreases with frequency and te mperature at a ll moisture contents, t he frequency dependence increasi ng with moisture co nte nt. Apparent power fac tors generally ex hibit similar behavior. At - 70° C at high moist ure contents, a diffuse absorption maximum observed may be due to ice or to perma nent dipoles of collagen which are freed by moist ure. Obser ved behavior is interpreted as probably aris in g from a co mbinat ion of interfacial polari zation at surfaces existing in the fibrous leather a nd dipolar polarization. Res ul ts indicate electri cal measurements in t his frequency range a re probably not reliable for precise quant ita t ive moistu re analyses.
1. Introduction
Adsorption of moistm e by hygroscopic materials generally causes a marked change in the electrical properties (conductivity, dielectric constant, and power factor) of such substances. This effect is generally attributed to the high dielec tric constant and conductivity of the adsorbed moisture as compared to the much lower values exhibited by the dry adsOl'bate. In view of the large electrical effects produced by the moisture and the rapidity, r elative simplicity, and nondestructive nature of electrical measmements, such determinations have been proposed as methods for quantitative moisture determinations [3, 14, 41].1 Unfortunately, the materials of particular interest in this connection are usually powders or fibrous materials that possess large adsorption surface areas and, therefore, the results of electrical measm ements are not easily interpreted because of the complex physical structme of the specimens. Recently, interest has arisen in application of dielect ric measurements for the determination of moistm e in leath er [27].
This report describes the results of critical studies of the effects of moistme and temperature on the dielectric constant and power factor of leather in the audio and low intermediate frequency range.
In most measmements dealing with a porous material such as leather , two experimental values are recognized, a "real" value associated with the fibers alone, and an "apparent" value that refers to the bulk material including the air in the interstices. To avoid confusion between the former and the real part of the complex dielectric constant, the term "fiber dielectric constant" will be used instead. Apparent values as used are understood to r efer to the bulk material .
I Figures in brackets ind icate the literature referenccs at the end of this paper.
2. Experimental Method
2 .1. Electric Apparatus
:Measurements of capacitance and resistance wer e obtained with a shielded resistance-capacitance bridge containing a Wagner-earthing circuit. The bridge is shown schematically in figure 1. A detailed discussion of this bridge has been published previously [29]. High-stability input signal in the freq uency range 0.75 to 96 kc were provided by a variable frequency oscillator. Bridge balance was ascertained through direct use of earphone at all frequencies as high as 12 kc, while at higher frequencies a regenerative, all-wave receiver was used to detect and amplify the output signals .
Fiber dielectric constan ts were determined by the immersion method [42 , 45] in a completely shielded, cylindrical, guard-ring condenser. This condenser was constructed of heavy brass, and all sw-faces were given a fine machine finish. The guard was located near the top of the condenser below an opening fitted with a r eservo ir that was used as an overflow. A second opening at the bottom of the condenser was fitted to permit introduction of liquids and suspensions. The capacitance of the empty condenser was 40 .22 p.p.f, a value that was reproducible to within ± O.Ol ,up.f.
All measurements with this condenser were carried out at 22.2° C at a frequency of 3 lec in the following manner : The condenser was filled with a suitable solution of ethylene dichloride in benzene. Choice of these liquids resulted from previous studies [26] indicating negligible interaction between leather and liquid. The solution was then circulated through the condenser by using the two openings until a stable and reproducible value of capaci tance was ob tained. Upon attainment of eq uilib-
349

INPUT
FIGURE l.- Capacitance-resistance bridge used for measurements of dielectric constant and power factor.
rium, a suspension of finely ground dry leather or collagen was made up by using a portion of the excess liquid , and this suspension was introduced so as to displace the liquid in the condenser. A change in capacitance upon introducing the suspension was indicative of inequality of liquid and solid dielectric constants. The composition of the solution was varied until the dielectric constant of the suspended material was closely bracketed between values for two solutions. The usual method of linear interpolation to determine dielectric constants by the immersion method [11] was difficult to apply with this apparatus as the finely ground solid material used to minimize anisotropic effects tended to settle out or surface slowly and render the suspension nonuniform .
.M easurements of apparent dielectric constant were made by using a shielded, parallel-plate, guard-ring condenser. Electrodes were made of heavy brass plates }f in. thick, which were given a fine machine finish. The measuring electrode was Mi6 in. in diameter, and the normal (empty) plate separation was approximately 0.04 in. The air capacitance was approximately 37 J.lJ.lf. This condenser was used at all frequencies in the range studied and at temperatures varying between + 200
to - 70 0 C. At lowest frequencies balance was
obtained to a preClSlOl1 of ± 0.15 J.lJ.lf and ± 0.0002 ohm, whereas at highest frequencies balance was obtained to within ± 0.01 J.lJ.lf and ± 0.001 ohm.
The condenser was equipped with two sets of three projecting ears spaced at angles of 1200 on its periphery, one set on the top or movable platE' , the other directly below on the frame of the condenser. These ears were used to measure the plate spacing, measurements being made to the nearest 0.0001 in. by means of micrometers. Such measurements were made at the conclusion of electrical studies on each specimen. Tlu·ee set screws mounted in the top plate, equidistant between the ears, permitted resetting the empty condenser to the same spacing measured when the test specimen was in the condenser . The spacings were reproduced to within ± 0.0002 in. at each ear , and the average of the three settings was reproduced to ± O.OOOI in. Measurements on the empty condenser under these conditions were used to determine the air capacitance- assumed equal to the vacuum capacitance. In all measurements the top plate of the condenser, which weighed 15 Ib, was loaded with an additional 20 lb to improve the contact between specimen and plates.
The real part of the dielectric constant, designated as f', was obtained as the ratio of the capaci tance of the condenser containing the specimen to that of the empty condenser with the same plate separation. The power factor , designated as cos c/> , was obtained from the relationship
cos cp = 1/b +(Rp wOp )2,
where Rp is the equivalent parallel resistance of the condenser containing the specimen, Cp it's capacitance, and w the angular frequency. The empty condenser exhibited no losses in this frequency range, therefore all losses observed were associated with the test specimens.
2.2. Test Specimens
Finely ground specimens of kangaroo tail tendon, clll·ome hydraulic-packing leather, and vegetable crust leather were used in suspension studies. All specimens were degreased and washed after an initial grinding and then reground. Specimens were dried by exhaustive evacuation at a pressure of less than 1 mm of mercury for at least 72 Ill'.
Disks 6X in. in diameter of chrome hydraulicpacking leather, vegetable crust leather, and unhaired cowhide 'were split to a uniform thickness of approximately 4 ± 0.02 mm by removing portions of grain and flesh layers on a band-knife splitting machine. The disks were degreased, washed, and dried exhaustively in vacuum.
Initial measurements were made on dry specimens, which were then permitted to adsorb moisture from the air to obtain moisture contents as high as approximately 15 percent. For higher moisture contents specimens were exposed to vapors existing above suitable saturated salt solutions or water. Moisture contents below approximately 10 percent
350
were obtained by short (a few minutes to as much as 1 hI') exposures to conditioned air. Uniform moisture distribution was unlikely under these circumstances, but no appreciable change in capacitance or resistance that might be attributed to ,eedistribution of adsorbed moisture was noted during measurements that required as long a period u S 48 Ill'. Above 10 percent of moisture, exposures to conditioned atmospheres were conducted for a t least 18 Ill". D espite the longer exposures, appreciable variations in both capacitance and resistance were noted in periods of less than 1 hr. Moisture contents were obtained by weighing specimens in a ealed container made of polye thylene film and are
based on the dry weight of the specimen. At low moisture contents specimens gained and at high moisture contents lost moisture during introduction and removal from the condenser. Therefore, ,,,eights were obtained before and after study, and the average of the two weights was taken Lo represent th e moisture con tent during mea urement. In most instances change in weigh t noLed corresponded to less than 0.1 percen t of moisture.
2.3. Effect of Temperature
All measurements below room temperature were made in a double-walled insulated container . The parallel-plate condenser fl,nd its external loading weight were placed in the innermost con tainer, which was then covered. An ice-water bath , or a dry icc-acetone bath was placed in the outer container to obtain the desired low temperature. T emperatures were meas med with a copper-constan tan thermocouple mounted inside the condenser. The reference junction of this thermocouple was maintained at 0° C. :"1easm em ents on specimens were generally made after exposure to the desired temperature for 6 111", and although thermal equilibrium was usually not attained in this time, the change in temperature during the t ime required for measuremen ts was negligible.
3. Results
3 .1. Dielectric Constants of Dry Leather and Collagen Fibers
The results of measurements of dielectric cons tants of leather and collagen fibers by the immer
ion method are given in table 1. Duplicate measurements on each specimen are
designated as run 1 and run 2. Following run 1,
T AB I~E 1. Dielectric constants of dry collagen and leather fibers
Temperature 22.25° O. frequency 3.0 kc
Material RWll I Run2 Avg
I-K-ra-n-ga-ro-o-te-n-dO- U- C-OI-la-ge-n-. . -.-.. -.. -.. -.-.. -.. -.. '1--5'-12-1~ ~ H ydraulie chrome leather ................. 5.37 5.4 1 5.39 Vegetable leather................ ......... 6.20 6. 30 6. 25
specimens were exposed to conditioned air at 72° F and 50-percent relative humidity for 14 days, then redried in vacuum and the dielectric constants redetermined. Data obtained on the second measurement are referred to as run 2. The agreement between these duplicates indicates that the drying technique employed is reasonably reproducible or that very low moistme contents have little effect on the dielectric properties. The data in table 1 were obtained by bracketing the unknown dielectric constants between solutions differing by not more than 0.15 unit in f' . The values given are considered to be accurate to within ± 0.05 unit in €'.
The value for collagen is about the same a the value reported by En"era and Sack [11] on wool- 5.4 at 8 kc- as well as in general accord with data of Kremen [26] (€' = 4.2 for untanned hide, and €' = 4.6 for chrome leather at 11 M c). It is to be noted that chrome leather exhibits a value of €' slightly highet" than that of collagen, but considerably lower than vegetable leather. These data agree with Lhe order reported by Kremen on clll'ome leather and hid e. The values repor ted here and by Kremen are eonsiderably larger than those calculated from the indices of refraction at optical ireq uenci es of approximately 1.5 as ob el'ved by Marriot [30] and Newman [37] . This fact was also mentioned by En'era and Sad [11] in connection with nylon , ilk , and wool.
3.2. Apparent Dielectric Consta nt a nd Power Factor
a . Effect of Moisture
Nleasmements on clll'ome, vegetable, and untanned leather disks of various moisture contents are given in table 2, 3, and 4, while a portion of the data on chrome leather is shown in figures 2 and 3.
The following behavior is noted in the data of tables 2, 3, and 4: €' increa e with increa ing moisture con ten t at all frequencies; €' decreases with increasing frequency at all moisture content , the frequency dependence being least for dry material and greatest for moisture contents of 15 percent or more; cos cf> increases with increased moistUTe content; cos cf> appears to be relatively frequency independent until high moisture levels are reached, that is, 15 percent or more; cos cf> decreases strongly with inereasing frequency at higher moistme leveL .
For moistUTe contents below approximately 15 percent, all measured capacitances and resistances appeared to be independent of t.ime, being reproducible to within 0.1 percent after several hours. At moistUTe contents greater than 15 percent, definite time dependence was noted , the effect being an increased capacitance and in most instances a decreased power factor at a constant frequency with increasing time. Such effects caused no appreciable error in the measured values, because the changes occurring dUTing the hour required for m easurement were generally much less than 1 percent.
h. Direct·Current Resistance
To ascertain the resistivity of the test specimens and the magnitude of corrections to the effective a-c
351

--~--.----------------------------------------------~------~
IZ
'" I-
2 2
19
16
~ 1 3 o o
4
3 1.1\
28.~
26.2'
17.601\. 15.0
9.2 4.9
DRY
I 0 .5
\ \ "
" ~
'" ~ ~ ~ ~ ~ ~ ~
~ ~ ~ ~ ~ f---
2.5 5 10 25 50 100
FREQUENCY, kc
a: o
o. 7
0 .6
0 .6
I- 0.4 o
'" ... a: 0.3 w ~ o CL 0 .2
0 .1
0 .0 0 .5
~ ~ ~ ~
" '" ~ ~ "" ~
~ ~ ~ ~ ~
~ ~ ~ r--..... ~
I ~ ~ ~ ~
--~ r-o.... ~
II>
2 .5 5 10 25 5 0 100
FREQUENC Y, kc
F IGl:RE 3. Effect of moisture on power f actor of chrome leathe)' at 22.3° C.
e, 31.1 per cent H20 ; f) , 28.2 percent H20 ; ,"" 26.2 percent H20 ; 0 , 17.6 per · cent H20 ; e, 15.0 percent H20 ; (), dry.
F IGURE 2. Effect of moi sture on dielectric constant of chome leather at 22.3° C.
resistance of the condenser containing the specimen, d-c resistance measurements were carried out on chrome and vegetable leathers immediately following the dielectric meaSUl'ements. A commercially available megohm bridge containing a guard circuit was used in these studies, all m eaSUl'ements being conducted at room temperatUl'e (20° to 25° C) with an applied voltage of 500 vdc. The results of these measUl'ements, calculated in terms of resistivities, are shown graphically in figUl'e 4. e, 31.1 percent H20; ,"" 28.2 percent H20 ; Ell, 26.2 percent H 20 ; f) , 17.6 percent
H20; e, 15.0 percent H20 ; (), 9.2 percent H 20 ; 0 , 4.9 percent H2U; <D, dry .
TABLE 2. A pparent dielectric constant and power f actO)· of hydraulic-packing chrome-tanned leather at 22.25° C
Dry I
2.63% H 2O 4.91 % H2O 7.28% H2O 9. 23% H20 15.03% H2O Frequency
" cos <P " cos <P " cos <P , cos <P " cos <P " cos <P
----- -----------ki!
0. 75 2. 19 0. 0182 2. 46 0.0110 2. 50 0. 0154 2. 74 0. 0163 2. 94 0. 0226 3. 63 0.0546 1. 5 2. 18 . 0136 2. 45 . 01 .13 2. 49 . 0147 2. 72 . 0174 2. 92 . 0185 3. 59 . 0404 3.0 2. 16 . 0136 2. 44 . 0153 2. 48 . 0148 2. 70 . 0171 2.89 . 0181 3.54 . 0329 6.0 2. 15 . 0140 2. 42 . 0160 2. 47 . 0157 2. 68 . 0173 2.87 . 0177 3. 50 . 0289
12.0 2. 14 . 01 39 2. 40 . 0173 2. 45 . 0167 2. 66 . 0166 2. 84 . 0185 3. 46 . 0265 24. 0 2. 13 . 0140 2. 38 . 0179 2. 43 . 0179 2. 64 . 0187 2. 82 . 0191 3. 43 . 0250 48. 0 2. 11 . 0138 2. 36 . 0187 2. 41 . 0191 2.62 . 0202 2.80 . 0203 3. 3~ . 0252 96. 0 2. 10 . 0132 2. 34 . 0185 2. 39 . 0196 2. 60 . 0208 2. 77 . 0212 3. 35 . 0251
17.56% H2O I 26.2% H 2O 28.2% H20 31.1% H 2O 17.65% H20
" I cos <P " cos <I> " cos <I> " cos <I> " cos <I>
0. 75 4. 11 0. 0990 8. 75 0. 479 13. 74 0. 621 21.00 0.743 4.60 0.1270 1. 5 4. 01 . 0714 7.56 .397 11. 25 . 540 16. 69 . 675 4. 44 . 0918 3. 0 3. 94 . 0538 6. 69 . 319 9. 52 . 455 13.52 . 589 4. 34 . 0650 6.0 3. 87 . 0429 6. 11 . 255 8. 30 . 368 11. 33 . 495 4. 2.\ . 0529
12. 0 3.82 . 0361 5. 71 . 183 7. 44 .289 9. 77 . 407 4. 18 . 0431 24. 0 3. 77 . 0322 5. 41 . 138 6.84 . 221 8. 64 . 323 4. 11 . 0365 48. 0 3. 72 . 0305 5. 19 . 107 6. 41 . 171 7.84 . 254 4. 06 .0338 96. 0 3.68 . 0293 5. 03 . 085 6. 11 . 130 7.30 . 193 4. 01 . 0305
352
1
1
<
J
I

TABLE 3. Apparent dielectric constant and power factor of vegetable tanned crust leather at 22.8°
Dry 2.32% H 20 4.31% H 2O 6.85% H 20 9.98% H 20 12.17% H 20 Frequency
" cos </> " cos <I- " cos <I- " cos <I- " cos <l- I cos <l-
ke 0. 75 2. 12 0. 0095 2. 26 0. 0204 2. 45 0. 0153 2.87 0. 0309 3. fi1 0. 0526 3.84 0. 0972 1. 5 2. 12 . 0151 2. 25 . 0150 2.43 . 01 83 2.84 . 0231 3.56 . 0421 3. 75 .0763 3.0 2. 11 . 0142 2. 24 . 0161 2.42 .0169 2. 82 . 0210 3. 52 . 0335 3.67 . 0538 6.0 2.10 . 0144 2. 23 . 0160 2. 41 . 0168 2. 80 .0204 3. 48 .029·' 3.62 . 0420
12.0 2.09 . 01 41 2.22 .0164 2.39 . 0175 2. 79 . 0201 3. 44 . 0266 3.56 . 0346 24.0 2.07 . 0137 2.20 . 0168 2.37 . OI B2 2. 76 . 0204 3. 41 . 0246 3. 52 . 0297 4B. O 2.06 . 0132 2. 19 . 0173 2.36 . 01 91 2.71 . 0215 3.37 . 0246 3. 48 . 0277 96.0 2. 05 . 01 24 2. 1B . 0169 2.34 . 0192 2. 74 . 0220 3.34 . 0236 3. 47 . 0253
13.67% H 2O 15.3% H 2O 17.B% H 20 22.7% H , O J
25.5% H ,O 27.4% H 2O
" cos </> " J
cos <I- " cos </> " cos <l-I " cos </> " cos </>
-------0. 75 4.19 O. 1432 4.B2 0.2200 6.31 0. 329 10. 36 0.396 14.35 0. 480 15. 40 0.602 1.5 4. 01 . 1042 4.51 . 1642 5.61 . 266 9. 46 .392 12. 80 . 422 14. 12 . 474 3.0 3.90 . 0772 4.30 . 1190 5.09 . 211 7. 95 . 366 10. 88 . 407 12. 62 . 412 6.0 3.81 .0575 4. 15 . 0870 4.84 . 154 6.83 . 318 9. 00 .390 10. 78 .398
12. 0 3. 75 . 0449 4.05 . 0658 4.63 . 113 6. 21 .255 7.65 .344 9. 03
I
. 379 24. 0 3. 70 . 0369 3. 99 .0505 4. 49 . 0824 5. 64 . 191 6. 75 . 280 7. 69 . 331 48. 0 3. 64 . 0325 3. 91 . 041 5 4.3S . 0626 5. 34 . 141 6. 15 . 216 6.76 .272 96. 0 3.60 . 0301 3. 86 . 0343 4. 31 . 0478 5. 14 . 0996 5. 80 . 153 6. 22 . 200
TABLE 4. Appm'ent dielectric cons/ant and power factor of untanned hide at 22.25° C
Dry 2.83% H 2O 5.64% H ,o 8.52% H ,0 11.3% H ,0 Freq uency
J " cos <I- " cos <I- " cos <I- " cos <I- " cos </>
ke 0. 75 1. 91 0. 0132 2.04 0. 0119 2. 23 0. 0182 2. 47 0. 0205 2.79 0.0256 1. 5 1.90 . 0135 2. 03 . 0153 2. 22 . 0180 2. 46 . 0224 2. 76 . 0251 3. 0 1.88 . 0129 2.02 . 0159 2. 21 . OHIO 2. 44 . 0202 2. 73 . 0241 6.0 J. 87 . 0132 2. 00 . 0161 2. 19 . 0182 2. 42 . 0206 2. 71 . 0238
12. 0 J. 86 . 0124 1. 99 . 0164 2. 18 . 0190 2. 40 . 0212 2.68 . 0249 24.0 1. 85 . 0117 1. 97 . 0168 2. 15 .0196 2.37 . 0219 2.65 . 0253 48. 0 1. 84 . 0112 1.00 .017.1 2. 13 . 0208 2.35 . 0234 2.60 . 0267 96. 0 1. 83 .0101 1. 94 . 0163 2. 12 . 0206 2. 33 . 0232 2. 58 . 0248
14.9% H ,0 19.7% H 2O 31.7% H ,O 40.3% H 20
" J
cos <I- " cos </> " cos </> " cos </>
0. 75 3. 27 0. 0261 4.33 0.0757 10. 58 0.578 19. 80 0. 897 1.5 3.24 . 0245 4.24 . 05i2 10. 29 . 428 16. 52 .810 3. 0 3.22 . 0234 4. 17 . 0445 7. 80 .388 13.81 . 707 6. 0 3. 18 . 0236 4. 12 . 0380 6. 94 .309 11 .60 . 593
12. 0 3. 16 ----- 4. 06 . 0335 6. 35 . 235 10. 02 . 478 24.0 3. 12 . 0247 4. 01
I . 0322 5. 95 . 171 8. 86 .367
48. 0 3. 09 . 0265 3.95 . 0328 5. 69 . 126 8. 04 . 274 96. 0 3.05 . 0265 3.90 . 0316 5.51 . 0911 7. 50 . 192
It will be no ted tha t the resistivities are rather high , even at higher moisture contents. The magnitude of these values is such that at room temperature no significant correction for d-c r esisistivity is required, since a-c resistivities were invariably much less than the d-c values. It was also observed that the resistance was independent of t ime at low moisture contents, but at higher moisture levels a time dependent drif t of resistance to higher values was no ted.
thermal equilibrium was generally not attained at reduced temperatlU'es 0 that measurements were conducted with a very slowly decreasing temperature, the actual temperature being mea lU'ed thermoelectrically. Prior to each meaSlU'ement a t a reduced temperature, a set of data was ob tained at room temperature, in order to ascer tain any hysteresis effect resul ting from a previou cooling. In general, measurements were conducted at 00 C before cooling to - 70 0 C, but in some instances this order was reversed because the experimen ts indicated that hyster'esis effects did no t affect the general na tlU'e of the results. The results of these experiments are given in tables 5, 6, and 7, the sets of data ob tained at room temperatlU'e being given in the columns to the left of the succeeding data obtained at reduced temperature
c . Effect of Temperature and Moisture
T o obtain fur ther information on the phenomena responsible for the observed behavior of E' and cos cp at room temperatlU'e, as well as da ta on the temperature dependence of these quantities, meaSlU'ements were made at room temperature and at approximately 0° C and - 70 0 C. .A s noted previously,
353

> I-
> 'I-." . . ." .., ~
0 0
'IL 0
~ I , ~
~ ~ ~
0 -J
18
17
16
15
14
13
12
II
10
9
a o
\ \.
\\ \ \ \ o~ ~\ \~
\ \\HROI\4E
\ ~ VEGETABLE 1\'\
"" '\
~"'\ "-"'\ 0"-r-10 15 20 25 50
1\4015 TU RE. PERCENT
FIG U R E 4. Effect of 1ll0istuTe on d-c l'esistance at 22° C.
0 , Chro me leather: e, " cgelable leat her,
Apparent dielectric constants shown in these tables were obtained by use of the air capacitance of the condenser as measured at room temperature, since it was not feasible to measure the plate separation while the condenser was subjected to low temperat ures. A measure of the error involved in this procedure may be obtained by manipulations of the equation for the capacitance of a parallel plate condenser and use of the coefficients of thermal expansion of brass [17] and leather [47]. For the experim ental quantities involved here such calculations indicate an error of 1.4 percent in capacitance for a temperature change of 100 deg C. The corresponding error in ~/ is also 1.4 percent. As the expansivity of leather in air is probably smaller than the expansivity used in the calcula tion [47], the probable error is expected to be less than 1.4 percent . Such a n error will in no way affect the following conclusions drawn from these data: ~/ decreases with decreasing temperature at all frequencies and moisture contents, and is strongly temperature dependent at high moisture levels; ~/ decreases with increasing frequency at all temperatures and moisture contents; cos ¢ generally decreases with decreasing temperat ure at a fixed frequency for very low and very high moisture contents, being strongly temperature dependent at higher moisture levels.
At intermediate moisture contents cos ¢ may in-
0.5
0 .4
0 .3
a: 0 . 2 o Io '" o. ... I
0.08 a: III ~ o 0.0 Q.
6
0 .04
0.02
0.0 0
~ .....
'" -...... ~
~
~ ~ ~ ~
~
"'" ~ ~~ 23.2; 2 2·
'--' ::---, 23.2 ' 0 °
~ -<r ~ ~74°
1>0. - ~
~ .........
t---o. r---~ 11.6; 0 °. ~ 11.6 ; 23 0
11.6 ~ -74
g .~ ! 2lo· = ~ 0:7; _6S o
2.5 5 10 25 50 100 250
FREQUENCY. kc
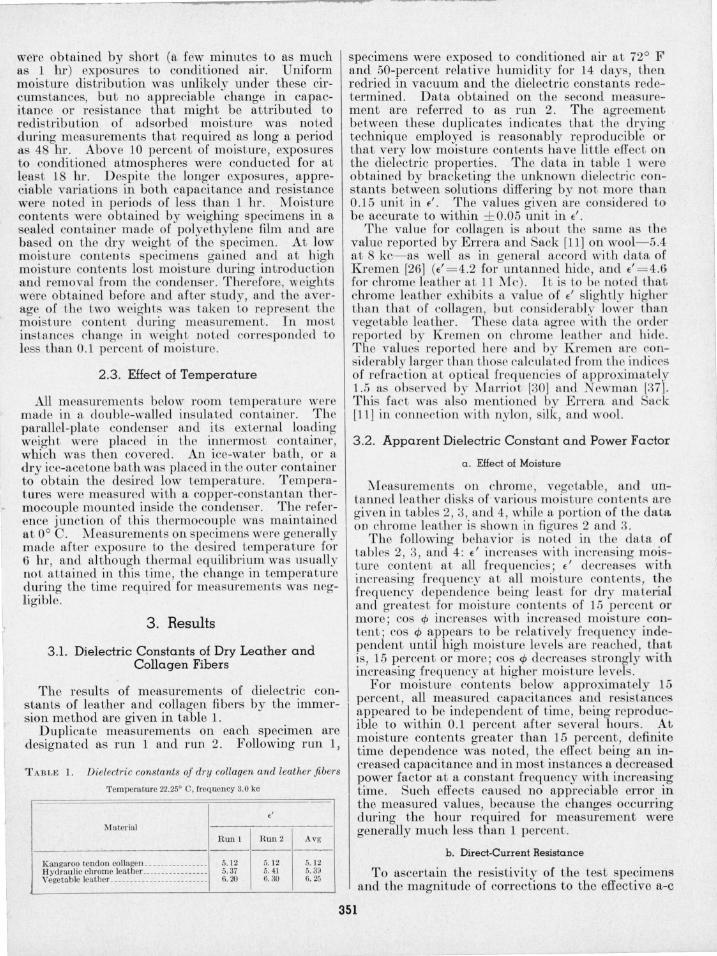
F IGl> RE 5 . Effects of 1ll0istuTe and temperature on dielectric constant of vegetable leather.
23.2 percent II,O: e , 22°C; 'I).O°C; (). - 74° 0 . 0.7 percent H ,O: e ,23°C; 0 . 2°C; (), -68°C.
16
14
~ 12 <I l-V! Z o 10 o
~ a: I- 8 o III ..J III
o 6
4
Z 0 .5
.. \
'" "-"-
~ ~ , ~ ~ ~ N;..
r---
2.5 10
FREQUEN CY. kc
~f--
25 50 100
FIGl>RE 6. EJlects of moisture and tempeTature on power factor of vegetable leather.
23.2 percent H ,O: e , 22°C; ~, O°C; (), - 74°C. 11 .6 percent II,O: e . 23°C; 0, DOC; CD. - 71° C. 0.7 percen t II,O: (), 23° C; e, 2° C; Ell, -68° C.
crease or decrease with decreasing temperature depending on frequency and temperature.
At low temperatures and high moisture contents cos ¢ (as well as ~") exhibits a somewhat broadened but unmistakable absorption maximum for hide and vegetable leathers, and such a maximum would appear to be present in chrome leather at higher moisture contents. Representative data are shown in figures 5 and 6.
354
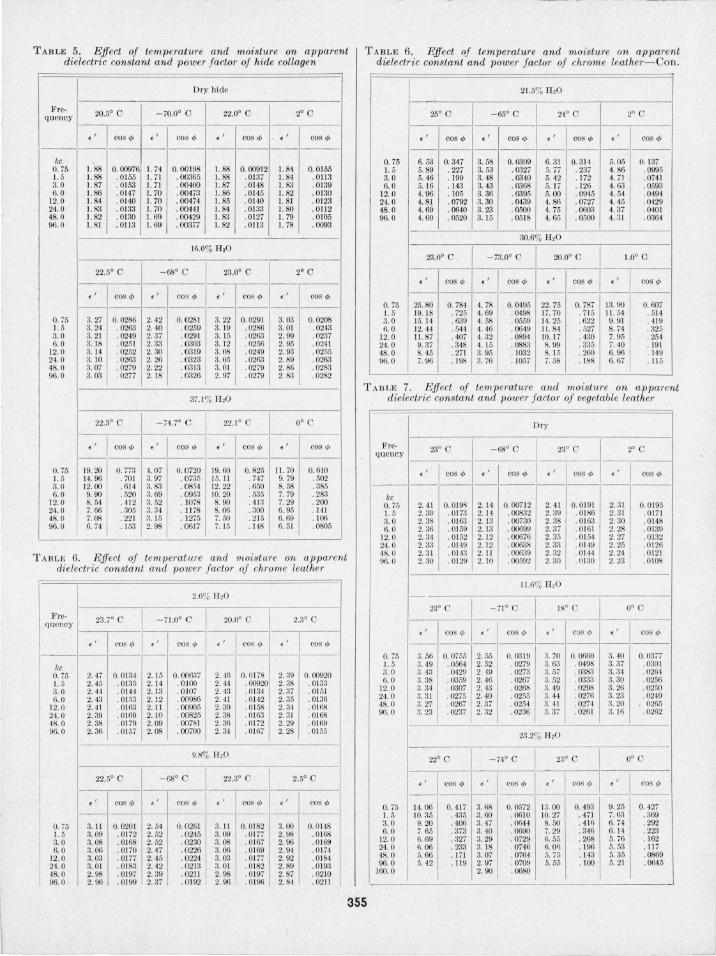
TABLE 5. Effect of temperature and moisture on apparent dielectric constant and power factor oj hide collagen
Dry hide
Fre· 20.5° 0 -70.0° C 22.0° 0 2° C quency
" cos <I> " cos <I> " cos <I> " cos <I>
- - - - - - --- - --- -- - - - - - - - -kc
0. 75 1.88 0. 00976 I. 74 0.00198 1.88 0. 00912 I. 84 0. 0155 1.5 1. 88 . 0155 1.71 . 00365 1. 88 . 0137 I. 84 .0113 3.0 I. 87 . 0153 1.71 . 00400 I. 87 . 0148 I. 83 . 01 39 6.0 I. 86 . 0147 I. 70 . 00473 I. 86 . 0145 1.82 . 0130
12. 0 I. 84 . 0140 I. 70 . 00474 I. 85 . 0140 1.81 . 0123 24.0 1. 83 . 01!l3 1.70 . 00441 I. 84 . 0133 1.80 . 0112 48. 0 I. 82 . 0130 I. 69 . 00429 I. 83 . 0127 I. 79 . 0105 96. 0 I. 81 . 0113 1. 69 . 00377 I. 82 . 0113 I. 78 . 0093
16.0% H 2O
22.5° 0 -68°0 23.0° 0 2° 0
" cos <I> " cos <I> " cos<l> " cos <I>
--------------- -----0. 75 3.27 0.0286 2.42 0. 0281 3.22 0.0291 3. 03 0. 0208 1.5 3. 24 . 026.3 2. 40 . 0259 3. 19 . 0286 3. 01 . 0243 3.0 3.21 . 0249 2. 37 . 0291 3. 15 . 0263 2.99 . 0237 6. 0 3. 18 . 02.>1 2. 33 . 0303 3.12 . 0256 2.95 . 0241
12. 0 3. 14 . 0252 2.30 .0319 3.68 . 0249 2.93 . 0255 24.0 3.10 . 0263 2.26 . 0323 3. 0.5 . 02f>3 2.89 .0263 48. 0 3. 07 . 0279 2.22 . 0313 3.01 . 0279 2. 86 .0283 96. 0 3. 03 . 0277 2. 18 . 0-326 2. 97 . 0279 2. 83 . 0282
37. I% H ,0
22.3° 0 - 74 .7° C 22.1° 0 0° 0
, ' cos <I> , , cos <I> " cos <I> " cos <I>
--------------------0. 75 19. 20 0.773 4.07 0.0720 19. 60 0. 825 II. 70 0. 610 1.5 14 . 96 .701 3.97 . 0735 J5. 11 . 747 9. 79 . 502 3. 0 12.00 . 614 3.83 . 0854 12.22 . 6.50 8. 68 . 385 6. 0 9.90 . 520 3.69 .0953 10.20 . 535 7. 79 . 283
12.0 8.54 . 412 3.52 . ] 078 8. 90 . 41 3 7. 29 .200 24.0 7. 66 .305 3. 34 . 1l78 8. 06 .300 6.95 . 14 1 48.0 7. 08 . 22J 3. 15 . ]275 7.50 . 215 6. 69 . 106 96. 0 6. 74 . 153 2.98 . 0617 7. 15 . 148 6. 51 . 0805
TABLE 6. Effect of temperature and ?noi stuTe on apparent dielecll'ic constant and power factor of chrome leather
2.6% H ,O
Fre- 23.7° 0 - 71.0° C 20.0° 0 2.3° 0 quency
, , cos <I> " cos <I> , , cos <I> , , cos lb
- ----------------------
kc 0.75 2. 47 0. OJ34 2.15 0. 006.37 2. 46 0.0178 2. 39 0. 00920 1. 5 2. 45 .0135 2. 14 . 0100 2. 44 . 00920 2. 38 . 0133 3.0 2. 44 . 0144 2. J3 . 0]07 2. 43 . 0134 2.37 . 0151 6. 0 2.43 . 0J53 2.12 . 00986 2. 41 . 0142 2.35 . 0136
12.0 2'. 41 . 0163 2. Jl . 00905 2. 39 . 0J68 2.34 . 0168 24.0 2. 39 . 0169 2.10 . 00825 2. 38 . 0163 2. 31 . 0J68 48.0 2. 38 . OJ79 2.09 . 00781 2. 36 . 0J72 2. 29 . OJ69 96.0 2.36 . 0157 2.08 . 00700 2. 34 . OJ67 2.28 . 0155
9.8% H , O
22.5° 0 -68° 0 22.3° 0 2.5° 0
" cos <I> , , cos <I> " cos <I> , , cos <I>
--------------------
0. 75 3. 11 0.0201 2. 54 0.0261 3. II 0. 0182 3. 00 0.0148 1.5 3.09 . 0172 2.52 . 0245 3. 09 . 0177 2.98 . 0168 3. 0 3. 68 . 0J68 2.52 . 0230 3.08 . 0167 2. 96 . OJ69 6.0 3.06 . OJ70 2. 47 . 0226 3. 06 . 0169 2.94 . 0174
12.0 3. 03 . 0177 2.45 . 0224 3.03 . 0177 2. 92 . 0184 24. 0 3. 01 . 0J83 2. 42 . 0213 3. 01 . 0182 2. 89 . OJ93 48.0 2.98 . 0197 2. 39 . 0211 2.98 . 0197 2. 87 . 0210 96. 0 2.96 . 0199 2. 37 . 0192 2. 96 . 019" 2.84 . 02 11
TABLE 6. Effect of temperature and moisture on apparent dielectric constant and power factor of chrome leather- Con.
21.5% H 2O
25° 0 -65° 0 21° 0 2° 0
" cos <I> , , cos ¢ " cos <I> " cos <I>
- - ----- - ------------0.75 6.53 0.347 3.58 0.0309 6.31 0.314 5.05 0. 137 1.5 5. 89 . 227 3 . • ').3 . 0327 5.77 . 237 4. 86 . 0995 3.0 0.46 . 199 3.48 . 0340 5. 42 . 172 4. 71 .0741 6.0 5. 16 . 143 3. 43 . 0368 5. 17 . 126 4.63 . 0593
12.0 4.96 . 10,') 3. 36 . 0395 5. 00 . 0945 4. 54 . 0494 24.0 4.81 . 0792 3.30 . 0439 4. 8f> . 0727 4.45 . 0429 48.0 4.69 . 0640 3.23 . 0500 4.75 . 0603 4.37 .0401 96.0 4. 60 . 0520 3.15 . 0518 4. 65 .0500 4. 31 . 0364
3D.6% H,0
23.0° 0 - 73.0° 0 20.0° 0 1.0° 0
, , cos <I> " cos <I> " cos <I> , , cos <I>
--------------- -----O. i5 25.80 0. 784 4.78 0.0495 22. 75 0. 787 13. 90 0. 607 1. 5 19. 18 . 725 4.69 . 0498 17. 70 . 715 I I. 54 .514 3. 0 15. 14 . f>39 4.68 . 0559 14. 25 .622 9. 91 . 419 6.0 12. 44 .544 4. 4() . 0649 I I. 84 . . 527 8. 7'1 . 325
12. 0 11. 87 . 407 4.32 . 089,1 10. 17 . 430 7.95 . 254 24. 0 9. 37 . 348 4. 15 . 0883 8. 99 .335 7. 40 . 191 48. 0 8. 45 . 271 3. 95 . 1032 8. J.i . 260 6. 96 . 149 96.0 7. 96 . 198 3. 76 . 1057 7.58 . 188 6.67 . 11 5
'fA B I~E 7. Effect of temperature and ?no'istw'e on apparent dielectric constant and power Jactor of vegetable leather
Dry
Fre· 23° 0 - 68° 0 n oo 2° 0 Quency
" cos <I> " cos <I> " cos <I> , , cos <I>
-----------------------kc
0.75 2. 41 O. 0 19~ 2. 14 0. 007 12 2. 4 1 0. 01 91 2 . .3 1 0. 0195 1. 5 2. 39 . 0173 2. 14 . 00832 2. 39 . 0186 2.31 . 017 1 3. 0 2. 3S . 0163 2. 13 . 00730 2. 38 .0163 2. 30 . 0148 6. 0 2.36 . 0159 2. 13 . 00699 2.37 .0161 2.28 . 0139
12.0 2. 34 . 0152 2. 12 . 00676 2.3.5 . 0154 2. 27 . 0132 24 . 0 2.33 . 0149 2. 12 .00638 2. 33 . 0149 2. 25 . 0126 48.0 2. 31 . 0143 2. II . 00639 2.32 . 0144 2. 24 . 0121 96. 0 2 . .30 . 0129 2. 10 . 00592 2.30 .01 30 2. 23 . 0108
11.6% F[,O
-23° 0 - 71°0
I 18° 0 0° C
, , cos <I> " cos <I> , , co, <I> , ' cos <I>
--------------------0.75 3. 56 0. 0755 2.55 0. 03 19 3. 70 0. 0660 3. 40 0. 0377 1.5 3.49 . 0564 2.52 . 0279 3. 63 . 0'198 3,37 . 0301 3.0 3. 43 . 0429 2. 49 . 0273 3.57 . 0383 3.34 . 02()4 6. 0 3.38 . 0359 2. 46 . 0267 3. 52 . 0333 3. 30 . 0256
J2.0 3.34 . 0307 2.43 . 0268 3.49 . 0298 3. 26 . 0250 24.0 3.31 . 0275 2.40 . 0255 3.44 . 027() 3. 23 . 0249 48.0 3.27 . 0267 2,37 . 0254 3. 41 . 0274 3. 20 0265 9().0 3. 23 . 0237 2.32 . 0236 3. 37 . 0261 3. 16 . 0262
23.2% H,O
22° 0 - 74° 0 23° 0 0° 0
" cos <I> , ' cos <I> " cos <I> , ' cos <I>
- - ------------------O. i5 14.06 0. 417 3. 68 0. 0572 13. 00 0. 493 9. 25 0. 427 1.5 10. 35 . 435 3.60 . 0610 10. 27 .471 7. 63 . 369 3. 0 9.20 . 406 3. 47 . 0644 8. 50 . 416 6. 74 . 292 6.0 7.65 . 373 3. 40 . 0690 7. 29 . 346 6.14 . 223
12. 0 6.69 . 327 3.29 . 0729 6. 55 . 268 5. 76 . 162 24. 0 6.06 , 233 3. 18 . 0746 6, Or, . 196 5.53 . 117 48.0 5. 66 . 171 3.07 . 0764 5. 75 . 143 5.35 .0869 96. 0 5. 42 . 119 2.97 . 0709 5. 55 . 100 5.21 . 0645
160.0 2.90 . 0680
355

4. Discussion
4.1 Electrical Properties of Collagen and Leather
The data obtained here are quite similar to results that have been reported for other fibrous materials , some of which might not be expected to be electrically comparable. With due consideration to the frequencies involved, values of dielectric constants of leather and collagen fibers are of the same order as values of silk and wool [ll] as previously noted , as well as values on cellulose [7] obtained by Dakin. Earlier values on cellulose [4, 9, 43] are slightly different but of the same general order. The higher values for vegetable leather reported here are to be expected, since the appreciable amount of incorporated vegetable tannin probably has a higher dielectric constant than collagen, as shown by measurements of Knoke [25]. The reported dielectric con- I
stant of dry gelatin, 2.68 at 512 kc [13], appears to be less than might be expected in view of its being derived from collagen.
R esistivity data are likewise similar to results previously reported on cellulose products that have been extensively studied in view of their widespread electrical applications. However, results obtained here for leather exhibit no linear relationship between logarithm of resistance and any simple function of moisture content as has been reported for textiles and cotton [34, 36, 46]. This divergence may be associated with the greater adsorptive capacity of leather for moisture.
Apparant or bulk dielectric constants of moist leather have been reported by Compton [6], who used a bridge method at 1 kc. His experimental values are much larger than those reported here at comparable moisture contents. This fact , together with his extremely high values of dielectric constant- ~' as high as 4980, will be discussed later. Neither Compton nor Kremen [26 ,27] investigated the effects of temperature or frequency on ~' and neither studied power losses, although Compton concluded that resistance measurements made during his measurements showed such little concordance that their use did not seem justified.
The data obtained here are similar in many respects to previous reports of effects of adsorbed vapors on the electrical properties of other porous materials [1,8,22,23,24,31,35,44]. In view of the similarities in results and the characteristics of the materials, the interpretations of the present data will be patterned to some extent along the lines of the conclusions of previous workers [8, 12, 13, 22, 34, 35, 38, 43], who have emphasized th e importance of considering interfacial polarization in electrical measurements on nonhomogeneous materials of this type.
Leath er must possess a large adsorption surface area by virtue of its fibrous structure. This area has been calculated by Kanagy [20] from adsorption data. Since the fibers are composed of submicroscopic fibrils and moisture appears to penetrate the fibers, it would appear that the fibrillar surface area must playa role in these data. The filaments that make up the fibrilslmay also be involved, but quali-
tatively the conclusions reached here will be independent of the units involved. There are probably three phases present in moist leatheI~the leather substrate, which may contain combined or dissolved moisture; a surface layer of adsorbed moisture; and the surrounding air. The interface between any two of these phases is an obvious source of MaxwellWagner polarization effects. The behavior of such types of interfacial polarization has been considered in detail and d eveloped quantitatively for simple systems by other workers [32, 38, 39]. In leather the vast number of these interfaces present, the complexity of the interconnections of the physical matrix, and the unknown conductivities and dielectric constants of the phases involved present a problem that permits no quantitative analysis. The only facts available are that the dielectric constants of the three phases are quite different in bulk form, while the conductivity of the air will be much less than that of either the moist substrate or the adsorbed moisture layer. Wagner [39] has shown that a necessary condition for minimizing interfacial effects is that
where (]" and ~' are conductivity and dielectric constant, respectively, and the subscripts refer to the phases that form the interface. In the present situation it is extremely improbable that such a relationship will hold at the three possible interfaces at all moisture contents studied.
A somewhat different type of polarization, known as electrode polarization, may exist at the discontinuity between sp ecimens and the condenser plates. In the present experiments no differentiation between electrode polarization and the interfacial polarization existing within the specimen is possible, and the electrode polarization will be considered as lumped with the interfacial effects.
The other important type of polarization arises as a result of the numerous permanent dipoles present in the basic protein by virtue of its amino acid composition. These dipoles will represent sources of Debye polarization, an effect that is qualitatively similar to interfacial polarization. The extreme difficulty in distinguishing between these two phenomena has been emphasized previously [32, 38].
The qualitative interpretation of the data in tables 2 to 7 appears to require at least two polarization processes, one being freely operative only at very low frequencies at high moistUTe contents and in all probability associated with interfacial effects, th e other being effective up to much higher frequencies and probably arising from dipolar effects. The relative importance of these two effects is determined by the moisture content of the specimen.
The strong absorption region at low frequencies predominates at moisture contents above approximately 15 percent, except at low temperatures. This dielectric absorption is attributed to interfacial polarization phenomena. The rapid decrease of ~' and cos 4> with increasing frequency and decreasing temperature may be logically attributed to this
356
effect. The dependence of capacitance and resistance on time at a constant frequency is suggestive of charging currents and therefore of polarization at a discontinuity . The data of Compton [6], who worked in this freq uency range, can be interpreted to a large extent as arising from interfacial effects. The specimens used by Compton in all probability had a much lower resistivity than those prepared here. This increased conductivity permits a larger charging current and an apparent increase in dielectric constant [39] . Thus Compton's dielectric constants at comparable moisture contents and frequency vary from at least three to several hundred times the present values. The extremely high values of E' reported by Compton- E' as high as 4980 on chrome leather containing only 26 percent of moisture- can be logically interpreted only on the basis of interfacial effects arising from appreciable conductivity in the test specimens. For the foregoing reasons it is believed that a t high moisture contents the present data ar e ob tained on the descending slope of a large interfacial power absorp tion region that persists to very low frequencies.
At low moisture contents- tha t is, below approximately 15 percent of moisture- the electrical behavior is quite different . In this region i t would appear that the data is obtained in a region between two dielectric absorption maxima, the interfacial region a t low frequencies, which diminishes in impor tance wi th decreased moisture content, and a second dielectric absorption region with a maximum at high frequencies far beyond the experimen tal range of frequency. This second dielectric absorption maximum would account for the increased losses with increasing frequency observed in this moisture range, as well as the increase in loss observed on decreasing the temperature. This lattcr effect arises as a resul t of the analogy between frequency and temperature, a reduction in tempera ture being experimen tally equivalent to increasing the frequency of the measurements or to shifting the dielectric relaxa tion effects to lower frequencies.
At high moisture contents a t - 70 0 C the interfacial effects have virtually disappeared as a result of reduced conductivity at low temperatures [39], but a distinct dielectric absorption maximum in cos 4> appears in two specimens in the experimental frequency range- the corresponding maximum in E" appears for all three specimens. This dielectric absorption maximum is no t observed under similar conditions for dry leather or at low moisture contents, so that the moisture appears to be largely responsible for the observed effect . Since a dielectric absorption maximum has been indicated at high frequencies at room temperature, this maximum may have been shifted to the experimental frequency range by the temperature r eduction. However , since a similar effect is no t observed a t lower moisture contents, it would be necessary to assume that the frequency of the absorption maximum is dependent on moisture conten t . It is also possible that this dielectric absorption maximum is a ttributable to ice, which is known to exhibit such a maximum in this frequency
range, but at a somewhat higher tempera ture [10, 33, 40].
As a result of the foregoing considera tions, the following general picture may be gi ven. In the dry condition in this frequency range, lea ther may be considered to ha ve a dielectric behavior tha t is characterized by a moderate power absorption wi th slight frequency dependence. As the moisture content of the leather increases, two dielectric ab orption maxima-one a t very high , the other a t very low frequencies- appear and increase in magnitude with increasing moisture content. The high-frequency maximum grows the more rapidly a t low moisture contents, and at very low moisture contents largely determines the behavior of the leather . As moisture is added the low frequency, or interfacial effect, grows at an increasing ra te, and in the moisture range 5 to 15 percent, losses due to both types of dielectric absorption are determining factor . In this moisture range the data may be pictured as being taken ill the trough between the two dielectric absorp tion maxima. As the moisture conten t rises abo ve about 15 percen t, the ra te of growth of the interfacial region accelerates tremendously , and at high moisture con ten ts the enormous size of the power absorp tion ari ing from interfacial effects completely o vershadows the malleI' but probably still importan t maximum at higher frcquencie. The source of the low-frequency losses has been attribu ted to in terfacial charging phenomena, and it remain to consider the cau e of the losses at higher frequencies. The high-frequency ab orption may be due to dipolar polarization or to a different type of interfacial phenomenon'. Since dipoles are known to be presen t in the protein, it would seem that the power absorp tion may be due to such causes. The increasing importance of thi ab orption with increasing moi ture con ten t, noted at low moisture con tents but probably OCCUlTing even at high moisture conten ts, may be considered as due to increased mobility of the existing dipole conferred by the imbibed moi ture. The dipoles in the dry material may be though t of as being largely immobilized by the compact molecular structure of dry collagen with correspondingly large restraining forces. Since the compact structure r elaxe in the presence of moisture, these bound dipoles may be freed to some exten t, the degree of freedom increasing with increasing moisture conten t.
The interpretation of the e da ta gi \Ten ill the foregoing implies a somewha t different role of moisture in the low and high-moisture ranges, with a gradual shift of the effect centering at approximately 15 percent of moisture. This behavior i clearly shown by E' and cos 4> in the tabular data. The gradual transition region occurs a t lower moisture conten ts in vegetable leather than in chrome lea ther or in hide, and may be directly rela tr.d to that moisture content range in which the slope of the hea t of adsorption cur ve is undergoing its greatest change [20]. The apparent difference in effects of moisture in the lowand high-moisture range may be considel'pd to b due to the decreased binding energy of the moisture
357
with increasing moistur~ content. Such concepts have been advanced prevIOusly [1 , 35].
This difference in beha vior of moisture in the two moisture ranges may be related to concepts of " bound water" which have been discussed by numerous worker~ [2 , 15, 16, 18, 19], and with particular reference to leather by Compton [6], Kremen [28], and Cheshire and Holmes [5] . These latter workers conclude that between 30 and 50 percent of moisture on a hide substance basis can be considered as bound water. The present studies were conducted principally in the range of moisture contents in which these workers would consider all moisture present to be bound.
The present data show that the moisture present in small amounts produces a markedly different effec t than that present in large quantities. Below a rather ill-defined transition region centering at about 15 percent of moisture, the principal effect is the enhancement of the high-frequency dielectric absorption while interfacial polarization is effected to a rather'small degree. In this range the moisture might be considere~ to be mainly intimately ass~)Ciated with the protem, probably by means of chemlCal forces through hydrogen bonding. R elatively little moisture is therefore available to act electrically as one might expect w~ter to behave. . .
At the higher mOIsture cont~nts t~e effect of .mOl~ture on the high-frequency dlelectn c absorptIOn IS masked by the rapid growth of the interfacial polarization. In this range the principal effect appears to be on the surface of the structural units involved, so tha t conducting layers are rapidly built up to produce the interfacial effects observed. In tIns range the moisture produces electrical results that might be expected of water . . . .
It is possible, therefore, to dIstmgmsh between these two essentially differen t roles of moisture; even in the ranae in which all moistlU'e has been conSIdered to be bo~nd . It must be concluded that there is considerable difference in binding of the so-called bound water.
5. Determination of Moisture in Leather by Electrical Methods
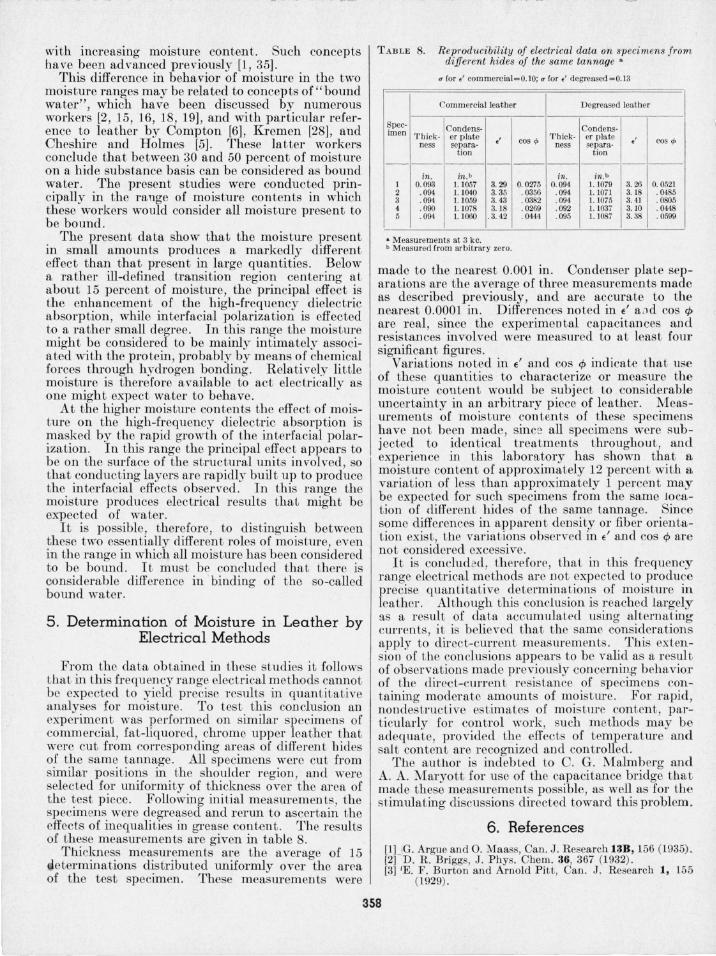
From the data obtain ed in tbese studies it follows that in this frequency range electrical m ethods cannot be expected to yield precise results in quantitative analyses for moisture. To test . t~is concl~ sion an experiment was performed on SImIlar spemmens of comm ercial fa t-liquored , chrome upper leather that were cut fr~m corresponding areas of differen t bides of the same tannage. All specimens were cut from similar positions in the shoulder region , and were selected for uniformity of thickness over the area of the test piece. Following initial measurements, the specimens were degreased and rerun to ascertain the effects of inequalities in grease content. The results of these measuremen ts are given in table 8.
Thickness measurements are the average of 15 determinations distributed uniformly over the area of the test specimen . These measurements were
TABLE 8. Reproducibility of electrical data on specimens from different hides of the same tannage'
(T for. ' commercial= O.1O; (T for, ' degreased=0.13
Commercialleatber
Spec· Condensimen Thick- er p late
ness separa~
tion
in . in,b 1 0. 093 1.1057 2 . 094 1.1040 3 . 094 1.1059 4 . 090 1.1078 5 . 094 1.1060
• Measurements at 3 kc.
3.29 3. 35 3. 43 3. 18
. 3. 42
b Measured from arbitrary zero.
cos <I>
0. 0275 . 0356 . 0382 . 0269 . 0444
Degreased leather
CondcnsThick- er plate
ness separa-tion
in. in.b 0.094 1. 1079
. 094 1. 1071
. 094 1. 1075
. 092 1. 1037
. 095 1. 1087
.' 3. 26 3. 18 3. 41 3. JO 3. 38
cos <I>
0. 0521 . 0485 . 0805 . 0448 . 0599
made t,o the nearest 0.001 in. Condenser plate sep arations are the average of three measurements made as described previously, and are accurate to the nearest 0.0001 in. Differences noted in ~' and cos cJ> are real, since the experimental capacitances and resistances involved were measured to a t least four significant figures . . I • •
Variations noted m ~ and cos rf> mdlCate that use of these quantities to charactm:ize or measyre the moisture content would be subj ect to conSIderable uncertainty in an arbitrary piece of leather. ~easurements of moisture contents of these speCImens have not been made, since all specimens were subjected to identical treatments throughout, and experience in this labora~ory has shown th~t a moisture content of approXImately 12 percent With a variation of less than approximately 1 percent may be expected for such specimens from the same l?Cation of different hides of the same tannage. Smce some differences in apparen t density or fiber orientation exist, the varia tions observed in ~' and cos rf> are not considered excessive.
It is concludCld, therefore, that in this frequency range electrical methods are ~)ot ~xpected to. produ?e precise quantitative ~etermma~IOn.s of mOIsture ill
leather. Although thIS conclUSIon IS ~eached larg:ly as a result of data accumulated usmg alternatmg currents it is believed that the same considerations apply td direct-current measurements .. This extensio n of the conclusions appears to be valId as a resul t of observations made previously concernin.g behavior of the direct-curren t resistance of specimens containing moderate ~mounts of m?isture. For rapid, nondestructive es timates of mOlstm'e con tent, particularly for control work, such methods may be adequate, provided th~ effects of temperature and salt conten t are recogmzed and controlled,
The author is indebted to C. G. Malmberg and A. A. Maryott for use of the capacitance bridge that made these measuremen ts possible, as wel~ as for the stimulating discussions directed toward thIS problem.
6. References [1] (G. Argue and O. Maass, Can. J. Research 13B, 156 (1935) . [2fD. R. Briggs, J . Phys. Chern. 36, 367 (1932) . [3]'E. F . Burton and Arnold Pitt, Can. J . Research 1, 155
1929).
358
[4) A. Campbell, Proc. Roy. Soc. (London) 78A, 196 (1907) . (5) A. Cheshire and N. L. Holmes, J . Int. Soc. Leather
Trades Chem. 26,237 (1942) . [6) E. D. Compton, J . Am. I,eather Chem. Assoc. 39, 74
(1944) . [7) T . W. Dakin, Annual Report 1950; Conference on Elec
trical Insulation Nat. Acad. Sci., Nat. Research Council (March 15, 1951).
[8) T . W. Dakin and R. W. Auxier, Ind. Eng. Chem. 37, 268 (1945).
[9) H. A. DeLuca and W. B. Campbell, Can. J . Research 16,273 (1938).
[10) M . J. Errera, J. Phys. Radium 5, 304 (1924). [11) M. J . Errera and Sack, Ind. Eng. Chem. 35, 712 (1943). (12) H. Fricke and H. J . Curtis, J. Phys. Chem. 41, 729 1937). [13) H . Fricke and E. Parker, J . Phys. Chem. 44, 716 (1940) . [14) S. D . Gardiner , J . Soc. Chem. Ind. 62,75 (1943). (15) R . A. Gortner , Outlines of biochemistry (John Wiley &
Sons, Inc., New York, N . Y. , 1938). [16) W. F . Hampton and J . H. Mennie, Can . J . Research 10,
452 (1934). [17) Handbook of chemistry and physics, 30 ed . (Chemical
Rubber Publishing Co., Cleveland , Ohio). [18) W. R. Horn and J . H . Mennie, Can. J . Research 12,
702 (1935). [19) 1. D. Jones and R. A. Gortner, J . Phys. Chem. 36, 387
(1932) . [20) J . R. Kanagy, J . Research NBS 44, 31 (1950) RP2056. [21) J . R. Kanagy, J . Research NBS 38, 119 (1947) RP1763. [22) G. King, Trans. Faraday Soc. i3, 601 (1947). (23) G. King, Nature 158, 134 (1946). [24) G. T . Kohman , Ind. Eng. Chem. 31, 807 (1939). [25) S. Knoke, Z. Elektrocllem. i3, 749 (1937). [26] S. S. Kremen, Dissertat ion , University --'of Cincinnat i
(1949).
,
)27] S. S. Kre men, J . Am. Leather Chem. Assoc. 4i, 774 (1949) .
[28] S. S. Kremen and R. M. J"o llar, J . Am. Lea ther Chern. Assoc. 46, 34 (1951).
[29] C. G. Malmberg and A. A. Maryott, J . Research NBS 45, 299 (1950) RP2137.
[30] R. H . Marriott, J . Int. Soc. Leather Trades Chem. 19, 133 (1935).
[31] R. McIntosh, H . S. Johnson , N . Hollies, and L . McCleod, Can. J . Research 25B, 566 (1947).
(32) S. O. Morgan , Trans. Electrochem. Soc. 65, 109 (1934). [33] E . J . Murphy, Trans. Electrochem. Soc. 65, 133 (1934). (34) E . J . Murphy, J . Phys. Chern. 33, 200 (1929). [35] E . J. Murphy and H . H . Lowry, J. Phys. Chern . 34, 598
(1930). [36] E. J . Murphy and A. C. Walker, J . Ph ys. Che rn. 32,
1761 (1928). [37] S. B. Newman , private communication. [38] H. H . Race, Trans. Am. Ins t. Elec. Engrs. 52, 682 (1933). [39] H . Schering, Die Isolierstoffe del' Electrotechnik, chapt.
I by K. W. Wagner (Julius Springer, Be rlin , 1924). [40] C. P. Smyth and C. S. Hitchcock, J . Am. Che m. Soc. 5i,
4631 (1932). (41) J . L . Spencer-Smi th , J . Textile Inst. 26, '1'336 (1935). [42] H. Starke, Verhandl. deut. ph .vsik Ges. 15, 69 (1896). [43] W. N. Stoops, J . Am. Chern. Soc. 56, 1480 (1934) . (44) J . Tausz and H . Rumm, Kolloid-Beihefte 39, 58 (1934). [45] I-I. Vollmar, Z. Elektrochem. 50, 150 (1944). [46] A. C. Walker, .T. Text. I nst. 24, T145 (1933). (47) C. E. Weir, J . Research NBS 41, 279 (1948) RP1 924.
WASHINGTON, D ecember 13, 1951.
359