Preliminary analysis of distributed in situ soil moisture measurements
Upload
khangminh22Category
view
0download
0
APPLICATION
OF
SOIL MOISTURE INFORMATION
FOR
OPERATIONAL WATER MANAGEMENT
Michiel Pezij
Graduation committee:Prof. dr. G.P.M.R. Dewulf University of Twente Chairman and secretary
Prof. dr. S.J.M.H. Hulscher University of Twente Promotor
Dr. ir. D.C.M. Augustijn University of Twente Promotor
Dr. D.M.D. Hendriks Deltares Co-promotor
Prof. dr. S.M.M. Kuks University of Twente
Prof. dr. J.C.J. Kwadijk University of Twente
Dr. ir. R. van der Velde University of Twente
Prof. dr. M.F.P. Bierkens Utrecht University
Prof. dr. R. Uijlenhoet Wageningen University
Presented research was carried out at the Water Engineering and Management (WEM)
department, Civil Engineering, Faculty of Engineering Technology, University of Twente,
the Netherlands. This work is part of the OWAS1S research programme (Optimizing
Water Availability with Sentinel-1 Satellites) with project number 13871, which is partly
�nanced by the Netherlands Organisation for Scienti�c Research (NWO). We want to
thank all OWAS1S programme partners for their contribution.
ISBN: 978-90-365-4948-6
DOI: 10.3990/1.9789036549486
Cover: Ruud Morijn and catstyecam
Printed by: Ipskamp Printing
© 2019 M. Pezij, Enschede, The Netherlands. All rights reserved. No parts of this thesis
may be reproduced, stored in a retrieval system or transmitted in any form or by any
means without permission of the author. Alle rechten voorbehouden. Niets uit deze
uitgave mag worden vermenigvuldigd, in enige vorm of op enige wijze, zonder voor-
afgaande schriftelijke toestemming van de auteur.

APPLICATION
OF
SOIL MOISTURE INFORMATION
FOR
OPERATIONAL WATER MANAGEMENT
DISSERTATION
to obtain
the degree of doctor at the University of Twente,
on the authority of the Rector Magni�cus
Prof.dr. T.T.M. Palstra,
on account of the decision of the graduation committee,
to be publicly defended
on Thursday January 30 2020 at 16.45
by
Michiel Pezij
born on August 2 1992
in Almelo, the Netherlands.

This dissertation has been approved by:
Prof. dr. S.J.M.H. Hulscher Promotor
Dr. ir. D.C.M. Augustijn Promotor
Dr. D.M.D. Hendriks Co-promotor

“Soms denk ik uren na en heb ik nog niks op papier,
een andere keer bereik ik precies datzelfde in vijf minuten.”
Herman Finkers

Preface
Na vier jaar en een beetje is mijn proefschrift af. Dit werk beschrijft de toepassing van
bodemvochtinformatie voor waterbeheer. Aan de start van dit promotieonderzoek was
het gebruik van bodemvochtinformatie in Nederlandse waterbeheer beperkt. Echter, re-
centelijke ontwikkelingen zoals de droge zomer van 2018 hebben het belang van bodem-
vochtinformatie benadrukt. Ik hoop dan ook dat ik met dit proefschrift heb bijgedragen
om met bodemvochtgegevens waterbeheer robuust voor de toekomst te maken.
Het onderzoek heeft mij op mooie plekken binnen en buiten Nederland gebracht. Zo
schrijf ik dit voorwoord in San Francisco, waar ik de AGU-conferentie bezoek. Verder
denk ik dan aan zomerscholen op het Italiaanse eiland Capri en in Reading, een work-
shop in Bonn, en conferenties in Wenen. Mede door deze bezoeken vond ik het een
voorrecht om aan een promotieonderzoek te werken. Al staat alleen mijn naam op de
voorkant van dit boekwerk, uiteraard heb ik dit onderzoek niet kunnen uitvoeren zon-
der inbreng van anderen. Dit voorwoord wil ik dan ook graag gebruiken om een aantal
personen te bedanken voor hun hulp en steun in de afgelopen jaren.
Denie, hartelijk bedankt voor je begeleiding. Je gaf me altijd veel vrijheid in het on-
derzoek, maar je was er altijd om de rode draad in zicht te houden. Hoewel ons vaste
wekelijkse bespreekmoment niet echt een vast wekelijks bespreekmoment was, had je
altijd tijd om bij te praten. Niet alleen hadden we goede inhoudelijke discussies, gelukkig
was er ook genoeg ruimte voor humor tijdens deze gesprekken. Dit kon ik altijd erg
waarderen. Heel veel succes met je nieuwe baan als opleidingsdirecteur, ik weet zeker
dat deze functie goed bij je past.
Dimmie, bedankt voor je inzet en waardevolle input tijdens het onderzoek. Je bood me de
kans om als gast bij Deltares aan mijn onderzoek te werken. Voor mij was dit een goede
manier om kennis te maken met de manier van werken bij een niet-academische partij.
7

Ik denk terug aan goede samenwerkingen met je collega’s, onder andere met Albrecht
en Stef, wat uiteindelijk tot een mooie publicatie heeft geleid. Ook de discussies met
verschillende collega’s tijdens ko�e- en lunchpauzes kon ik erg waarderen. Ik kijk dan
ook erg positief terug naar de tijd aan de Princetonlaan en Daltonlaan.
Suzanne, jij bood me in de zomer van 2015 de kans om een promotieonderzoek uit te
voeren. Naast inhoudelijke feedback heb je me erg geholpen met de organisatie rond
het onderzoek. Daarnaast krijg ik de mogelijkheid om na mijn promotieonderzoek aan
de vakgroep verbonden te blijven. Ik hoop dan ook op een goede voortzetting van onze
samenwerking in de toekomst.
Ik wil alle betrokkenen bij het OWAS1S-project bedanken voor de samenwerking. Harm-
Jan, ik heb veel met je uitgevoerd de afgelopen jaren. Wat mij betreft hebben we een
mooie bijdrage aan het project kunnen leveren. Hopelijk gaan we nog een keer moun-
tainbiken in de toekomst . Coleen, thank you very much for your cooperation and
advice on my work. The three of us were a good team in my opinion. I wish you all
the best for the future. Martine en Rogier, bedankt voor jullie input tijdens de project-
meetings. Ook een groot dank aan de medewerking van alle projectpartners (Deltares,
HKV, HydroLogic, Provincie Overijssel, Rijkswaterstaat, STOWA, waterschappen Aa en
Maas, Drents Overijsselse Delta en Vechtstromen en ZLTO).
Heren van HR W-211, bedankt voor de mooie momenten afgelopen jaren. Johan, gelukkig
toch nog iemand met voetbalverstand bij de afdeling. Koen, bedankt voor alle slechte
grappen. Pim, mooi dat je weer helemaal terug bent, onder andere bedankt voor een
mooie tijd in San Francisco. Collega’s bij WEM, hartelijk dank voor de gezelligheid.
Iedereen bedankt voor de ko�emomenten, de lunchwandelingen, de voetbalwedstrijden
van SouthWEMton, �etstochten op de race�ets, de deelnames aan de Batavierenrace en
ik vergeet vast andere activiteiten. Ook wil ik Anke, Dorette, Joke en Monique hartelijk
danken voor hun hulp (en lekkere ko�e).
Last, but not least wil ik me richten op vrienden en familie. De vele borrels, concerten,
Schwalbeweekenden, Schwintersportvakanties, �etsweekenden en andere vakanties boden
me goede a�eiding. Hopelijk gaan we hier mee door in de toekomst.
In het speciaal, Laura, Thijs, mama en papa, bedankt dat jullie er altijd voor me zijn en
dat ik altijd bij jullie terecht kan. Weet dat dit zeer gewaardeerd wordt!
Wat mij rest, is het volgende: ik wens jullie veel plezier bij het lezen van dit werk!
Michiel
8
Summary
Water in the unsaturated part of the soil subsurface is referred to as soil moisture. Soil
moisture and related processes are often considered as key components of the hydrolo-
gical cycle, a�ecting hydrological, meteorological, biological, and biogeochemical pro-
cesses. The dry period in the summer of the year 2018 highlighted the necessity of under-
standing soil moisture dynamics and integrating related information in water manage-
ment approaches. However, the application of soil moisture information in operational
water resources management is limited. One of the reasons is the lack of measurement
data. Recently, the increasing availability of high-resolution soil moisture data retrieved
using remote sensing methods has led to new possibilities for utilization in water man-
agement.
The research aim of this work was to show the potential use of high-resolution soil mois-
ture information for operational water resources management. We followed a research
framework in which the needs of water managers were identi�ed. In addition, we fo-
cused on retrieving accurate soil moisture information on both regional and local spatial
scales. Furthermore, we discussed several applications to integrate the research �ndings
in operational water management.
Firstly, interviews with operational water management experts illustrated that evidence-
based information such as measurement data, system knowledge, meteorological fore-
casts, hydrological model output, and legislation is used for decision-making in Dutch
regional operational water management. It also became clear that the experts consid-
erably depend on experiential information, which leads to opinion-based bypasses in
decision-making. In addition, we found that hydrological models play a minor role in
decision-making in comparison with other evidence-based information sources. We re-
commend that decision-makers should focus on the development of structured methodo-
logies for integrating both evidence-based and experiential information in decision sup-
9

port systems. Such systems should deliver tailor-made information in an understandable
format at the right time. Indicators could be used as tools to deliver such information.
Also, when investing in new technologies, education of water managers is an important
aspect which should be taken into account.
Secondly, we found that the accuracy of root zone soil moisture estimates of a hydro-
logical metamodel can be increased using a data assimilation scheme. Data assimil-
ation schemes allow to merge models with up-to-date observations of current water
system conditions. To implement such a scheme for the unsaturated zone metamodel
MetaSWAP, we developed a data assimilation tool using the open-source framework
OpenDA. A perturbed observations Ensemble Kalman Filter was used to assimilate SMAP
satellite L3 Enhanced observations of surface soil moisture. The surface soil moisture ob-
servations increased the accuracy of regional root zone soil moisture model estimates
in terms of the Root Mean Square Error (RMSE) and bias goodness-of-�t measures. On
local scales, the results largely depend on how well the SMAP data re�ect �eld condi-
tions. Notably, we were able to update model estimates of root zone soil moisture using
observations of surface soil moisture. This �nding increases the value of remote sens-
ing data, as satellite-based soil moisture retrievals generally only provide information
about the top part of the unsaturated zone. We expect that the increasing availability
of high-resolution remotely sensed soil moisture data and developments in data stor-
age and computational environments will lead to an increase in the application of data
assimilation schemes in operational water resources management.
Thirdly, we showed the potential of a novel data-driven method for soil moisture mod-
elling. We found that transfer function-noise (TFN) models can accurately describe soil
moisture conditions. Impulse-response functions are used to describe the response of
soil moisture to stress series such as precipitation and reference crop evapotranspir-
ation. The TFN models were trained using SMAP satellite L3 Enhanced surface soil
moisture data. We found that TFN models produce soil moisture estimates of similar
accuracy as the remote sensing data using the RMSE goodness-of-�t measure. However,
care should be taken when interpreting TFN modelling results in extreme situations due
to the data-driven nature of the method. A sensitivity analysis showed that the TFN
training period considerably a�ects the performance of TFN models in both regular and
extreme periods. Furthermore, the parameters of the impulse-response functions de-
scribe water system characteristics. However, more research is necessary to relate these
parameters to physical phenomena.
Finally, this research provides several recommendations for further research. We recom-
10

mend to continue to study the relationship between the various spatiotemporal scales
covered by soil moisture datasets, to consider additional data assimilation applications
for operational water resources management, and to explore TFN modelling. Speci�c-
ally, we encourage to explore the possibilities of TFN soil moisture modelling for prac-
tical applications, such as short term soil moisture predictions using model ensembles,
data gap �lling, the development of historical soil moisture time series, and satellite
validation studies. Additionally, several improvements for water management are pro-
posed, focusing on the development of structured methodologies for integrating new in-
formation types. Also, the applicability of indicators to create easy-to-interpret inform-
ation for water managers is promising. We challenge both researchers and water man-
agers to continue to invest in these approaches, as the call for optimized, consistent, and
sustainable water management becomes increasingly important in the future.
11


Samenvatting
Water in het onverzadigde deel van de bodem wordt bodemvocht genoemd. Bodem-
vocht en bijbehorende processen zijn belangrijke componenten van de hydrologische
cyclus. Bodemvocht beïnvloedt onder andere hydrologische, meteorologische, biologis-
che, en biochemische processen. De droge periode in de zomer van het jaar 2018 toonde
aan dat het belangrijk is om bodemvochtdynamiek te begrijpen en dergelijke kennis
te integreren in waterbeheer. Echter, het gebruik van bodemvochtinformatie in oper-
ationeel waterbeheer is beperkt, onder andere doordat bodemvochtmetingen beperkt
beschikbaar zijn. Omdat de beschikbaarheid van bodemvochtgegevens verkregen via
satellietobservaties signi�cant stijgt, zijn er nieuwe kansen om bodemvochtinformatie
te gebruiken in waterbeheer.
Het onderzoeksdoel van dit werk was om de potentie van hoge resolutie bodemvochtin-
formatie aan te tonen voor operationeel waterbeheer. We hebben een onderzoekskader
gevolgd waarin onder andere de behoeften van waterbeheerders zijn geïdenti�ceerd.
Daarnaast hebben we gefocust op het verkrijgen van bodemvochtinformatie op zowel re-
gionale als lokale ruimtelijke schalen. Verder hebben we verscheidende toepassingen be-
sproken om de onderzoeksresultaten te integreren in operationeel waterbeheer.
Allereerst, uit interviews met operationele waterbeheerexperts blijkt dat informatie zoals
meetgegevens, systeemkennis, meteorologische voorspellingen, modelberekeningen en
wetgeving wordt gebruikt voor besluitvorming in het Nederlandse regionale operationele
waterbeheer. Daarnaast steunen de experts aanzienlijk op ervaringsgerichte kennis, wat
kan leiden tot suboptimale beslissingen. Verder blijkt dat hydrologische modellering
een relatief kleine rol speelt in besluitvorming vergeleken met andere vormen van in-
formatie. We bevelen aan dat besluitvormers zich moeten richten op het ontwikkelen
van gestructureerde methoden om de verschillende informatietypen te integreren in bij-
voorbeeld beslissingsondersteunende systemen. Op maat gemaakte informatie kan via
13
dergelijke system in een begrijpelijk formaat aangeleverd worden op het juiste moment.
Het gebruik van indicatoren maakt het mogelijk om informatie in een begrijpelijk form-
aat aan te leveren. Tenslotte moet er aandacht besteed worden aan het overbrengen van
nieuwe kennis aan waterbeheerders.
Ten tweede is de nauwkeurigheid van modelsimulaties met betrekking op wortelzone-
bodemvocht vergroot door gebruik te maken van een data-assimilatiemethode. Data-
assimilatiemethoden maken het mogelijk om hydrologische modellen te integreren met
up-to-date observaties van watersysteemcondities. Wij hebben een data-assimilatietool
ontwikkeld voor het onverzadigd zone metamodel MetaSWAP door gebruik te maken
van de open-source OpenDA-software. Het L3 Enhanced oppervlaktebodemvochtproduct
afkomstig van de SMAP-satelliet is geassimileerd door het toepassen van een perturbedobservations Ensemble Kalman Filter. Het integreren van de oppervlaktebodemvochtin-
formatie zorgt er voor dat de nauwkeurigheid van regionale modelsimulaties van wor-
telzonebodemvocht verhoogd wordt. De resultaten op lokale schaal hangen sterk af van
hoe goed de SMAP-satellietobservaties de lokale schaal representeren. De resultaten
laten zien dat het mogelijk is om de nauwkeurigheid van modelsimulaties van diepere
bodemlagen te verhogen gebruikmakend van oppervlaktebodemvochtobservaties. Bodem-
vochtsatellietobservaties leveren over het algemeen informatie over de bovenste paar
centimeter van de bodem. De resultaten van dit onderzoek verhogen daardoor de waarde
van dergelijke satellietobservaties voor waterbeheertoepassingen. Wij verwachten dat
de toenemende beschikbaarheid van bodemvochtsatellietobservaties van hoge resolu-
tie en bijbehorende ontwikkelingen in dataopslag en rekenkracht zullen leiden tot meer
implementaties van data-assimilatiemethoden in operationeel waterbeheer.
Ten derde hebben we de potentie van een innovatieve datagedreven modelleermeth-
ode voor bodemvochtdynamiek aangetoond. Transfer function-noise (TFN) modellen
kunnen accuraat bodemvochtcondities beschrijven. De bodemvochtdynamiek wordt
beschreven door het combineren van neerslag- en verdampingstijdreeksen en impuls-
responsfuncties. De impuls-responsfuncties beschrijven de verandering van bodem-
vocht door respectievelijk neerslag en verdamping. De parameters van deze functies
worden afgeleid uit een optimalisatieprocedure waarbij het SMAP L3 Enhanced op-
pervlaktebodemvochtproduct gebruikt wordt als trainingsdataset. De TFN-modellen
hebben een vergelijkbare nauwkeurigheid als de SMAP-satellietobservaties. Echter di-
ent rekening gehouden te worden met de nauwkeurigheid van de TFN-modellen in ex-
treme situaties door de datagedreven aard van deze aanpak. Een gevoeligheidsanalyse
laat zien dat het selecteren van de juiste trainingsperiode een grote invloed heeft op de
14

nauwkeurig van de TFN-modellen in zowel reguliere als extreme situaties. Daarnaast
kunnen de impuls-responsfuncties gebruikt worden om watersysteemkarakteristieken
af te leiden. Meer onderzoek is nodig om de impuls-responsfuncties te koppelen aan
fysische processen en variabelen.
Tot slot volgen er een aantal aanbevelingen uit dit onderzoek voor vervolgonderzoek.
We adviseren om de relatie tussen de verschillende ruimtelijke en temporele bodem-
vochtschalen verder uit te zoeken. Ook raden we aan om aanvullende toepassingen
van data-assimilatiemethoden voor operationeel waterbeheer te onderzoeken. Verder
raden we aan om de mogelijkheden van TFN-modellering voor bodemvochtsimulaties
verder te verkennen. Voorbeelden zijn verschillende toepassingen voor bodemvocht-
voorspelling op korte termijnen waarbij ensembletechnieken gebruikt kunnen worden
om onzekerheidsschattingen te maken, het vullen van ontbrekende gegevens in tijdser-
ies, het ontwikkelen van historische bodemvochttijdseries en satellietvalidatiestudies.
Daarnaast stellen we een aantal mogelijkheden voor waterbeheer voor. Een belangrijk
aspect is het ontwikkelen van gestructureerde methoden voor het integreren van nieuwe
informatietypen voor besluitvorming. Daarnaast is het aanbieden van indicatoren om
de toepasbaarheid van informatie te verhogen interessant om het gat tussen onderzoek
en praktijk te overbruggen. We dagen zowel onderzoekers als waterbeheerders uit om
te blijven investeren in zowel onderzoek als het toepassen van bovengenoemde meth-
oden, gezien consistent, geoptimaliseerd en duurzaam waterbeheer in toenemende mate
belangrijk wordt in de toekomst.
15

Contents
Preface 7
Summary 9
Samenvatting 13
List of abbreviations 19
List of symbols 21
1 Introduction 231.1 Soil moisture information for water management . . . . . . . . . . . . . 24
1.2 Context . . . . . . . . . . . . . . . . . . . . . . . . . . . . . . . . . . . . . 26
1.3 Relevance . . . . . . . . . . . . . . . . . . . . . . . . . . . . . . . . . . . . 34
1.4 Problem statement . . . . . . . . . . . . . . . . . . . . . . . . . . . . . . . 38
1.5 General research aim and questions . . . . . . . . . . . . . . . . . . . . . 41
1.6 Research methodology . . . . . . . . . . . . . . . . . . . . . . . . . . . . 41
1.7 Dissertation outline . . . . . . . . . . . . . . . . . . . . . . . . . . . . . . 43
2 The role of evidence-based information in regional operational watermanagement in the Netherlands 452.1 Introduction . . . . . . . . . . . . . . . . . . . . . . . . . . . . . . . . . . 46
2.2 Decision-making framework . . . . . . . . . . . . . . . . . . . . . . . . . 48
2.3 Methodology . . . . . . . . . . . . . . . . . . . . . . . . . . . . . . . . . . 50
2.4 Results . . . . . . . . . . . . . . . . . . . . . . . . . . . . . . . . . . . . . 53
2.5 Discussion . . . . . . . . . . . . . . . . . . . . . . . . . . . . . . . . . . . 57
2.6 Conclusion . . . . . . . . . . . . . . . . . . . . . . . . . . . . . . . . . . . 59
17
2.7 Appendix A . . . . . . . . . . . . . . . . . . . . . . . . . . . . . . . . . . 60
3 State updating of root zone soil moisture estimates of an unsaturatedzone metamodel for operational water resources management 633.1 Introduction . . . . . . . . . . . . . . . . . . . . . . . . . . . . . . . . . . 64
3.2 Methodology . . . . . . . . . . . . . . . . . . . . . . . . . . . . . . . . . . 66
3.3 Results . . . . . . . . . . . . . . . . . . . . . . . . . . . . . . . . . . . . . 77
3.4 Discussion . . . . . . . . . . . . . . . . . . . . . . . . . . . . . . . . . . . 83
3.5 Conclusions . . . . . . . . . . . . . . . . . . . . . . . . . . . . . . . . . . 86
3.6 Appendix A . . . . . . . . . . . . . . . . . . . . . . . . . . . . . . . . . . 87
3.7 Appendix B . . . . . . . . . . . . . . . . . . . . . . . . . . . . . . . . . . . 88
4 Applying transfer function-noisemodelling to characterize soilmoisturedynamics 914.1 Introduction . . . . . . . . . . . . . . . . . . . . . . . . . . . . . . . . . . 92
4.2 Methodology . . . . . . . . . . . . . . . . . . . . . . . . . . . . . . . . . . 95
4.3 Results . . . . . . . . . . . . . . . . . . . . . . . . . . . . . . . . . . . . . 103
4.4 Discussion . . . . . . . . . . . . . . . . . . . . . . . . . . . . . . . . . . . 108
4.5 Conclusions . . . . . . . . . . . . . . . . . . . . . . . . . . . . . . . . . . 112
4.6 Appendix A . . . . . . . . . . . . . . . . . . . . . . . . . . . . . . . . . . 114
4.7 Appendix B . . . . . . . . . . . . . . . . . . . . . . . . . . . . . . . . . . . 115
5 Discussion 1175.1 Scienti�c implications . . . . . . . . . . . . . . . . . . . . . . . . . . . . . 118
5.2 Applications for water management . . . . . . . . . . . . . . . . . . . . . 126
5.3 Link to other research areas . . . . . . . . . . . . . . . . . . . . . . . . . 133
6 Conclusions and recommendations 1356.1 Conclusions . . . . . . . . . . . . . . . . . . . . . . . . . . . . . . . . . . 136
6.2 Recommendations . . . . . . . . . . . . . . . . . . . . . . . . . . . . . . . 139
Bibliography 143
About the author 171
List of publications 173
18
List of abbreviations
AHN Actueel Hoogtebestand Nederland (Elevation Map The Netherlands)
AMSR2 Advanced Microwave Scanning Radiometer 2
AMSR-E Advanced Microwave Scanning Radiometer for EOS
ARMA Autoregressive Moving Average
ASCAT Advanced Scatterometer
BOFEK2012 Bodemfysische Eenhedenkaart (Soil Physical Units Map)
BOS Beslissingsondersteunend systeem (decision support system)
CEOS Committee on Earth Observation Satellites
DA Data assimilation
DINOloket Data en Informatie van de Nederlandse Ondergrond (Data and information
of the Dutch subsurface)
DSS Decision Support System
EnKF Ensemble Kalman Filter
ERS European Remote Sensing
ESA European Space Agency
ESA CCI European Space Agency Climate Change Initiative
EVP Explained Variance Percentage
FDR Frequency Domain Re�ectometry
GEO Group on Earth Observations
GEWEX Global Energy and Water Cycle Experiment
HPC High-Performance Computing
H-SAF Satellite Application Facility on Support to Operational Hydrology and Water
Management
19
IT Information technology
IR Impulse-response
ISMN International Soil Moisture Network
ITC Faculty of Geo-Information Science and Earth Observation (International In-
stitute for Geo-Information Science and Earth Observation)
KNMI Koninklijk Nederlands Meteorologisch Instituut (Royal Dutch Meteorological
Institute)
LCW Landelijke Coördinatiecommissie Waterverdeling (Dutch National Commit-
tee for Water Distribution)
LGN Landelijk Grondgebruik Nederland (National Land Use the Netherlands)
LHM Landelijk Hydrologisch Model (National Hydrological Model)
MaaS Model as a Service
NHI Netherlands Hydrological Instrument
NWO Netherlands Organisation for Scienti�c Research
OL Open loop
OWAS1S Optimizing Water Availability with Sentinel-1 Satellites
PIRFICT Prede�ned Impulse Response Function In Continuous Time
REGIS Regionaal Geohydrologisch Informatie Systeem (Regional Geohydrological
Information System)
RMSE Root mean square error
uRMSE Unbiased root mean square error
RQ Research question
SCA-V Single Channel Algorithm at V-polarization
SMAP Soil Moisture Active Passive
SMOS Soil Moisture and Ocean Salinity
SCI Storage Capacity Indicator
SVAT Soil-Vegetation-Atmosphere-Transfer
SWAP Soil-Water-Atmosphere-Plant
SWDI Soil Water De�cit Index
TDR Time Domain Re�ectometry
TFN Transfer function-noise
20

List of symbols
\ Volumetric moisture content [<3 <−3]
F Water volume in a soil volume [<3]
+ Soil volume [<3]
k Pressure head [<]
\ (k ) Volumetric moisture content at pressure headk [<3 <−3]
\r Residual soil moisture content [<3 <−3]
\s Saturated soil moisture content [<3 <−3]
U6 Scale parameter [<−1]
=6 Soil pore size distribution parameter [–]
Hydraulic conductivity [</30~]
I Elevation above a datum [<]
C Time step [30~].
- Model mean state [<3 <−3]
% Model state error covariance matrix [(<3 <−3)2]
\obs
8Observed soil moisture estimates [<3 <−3]
\pred
8Predicted soil moisture estimates [<3 <−3]
# Number of observations [–]
\obsAveraged observed soil moisture estimate [<3 <−3]
\predAveraged predicted soil moisture estimate [<3 <−3]
A Pearson correlation coe�cient [–]
ℎ Observed soil moisture state [<3 <−3]
#BCA4BB Number of stress series [–]
ℎ8 Change in soil moisture state due to a stress series 8 [<3 <−3]
21
3 Baseline soil moisture state [<3 <−3]
=A4B Residual time series [<3 <−3]
'8 Value of a stress series 8 [<<]
Θ8 Impulse-response transfer function of the corresponding stress series 8
B Step response function [<3 <−3]
1 Block response function [<3 <−3]
� Unit step response of the state variable due to an input stress [<3 <−3]
0 Decay rate parameter [30~−1]
= Shape parameter [–]
Γ(=) Gamma function of the form (= − 1)! [–]
h White noise [<3 <−3]
U Decay parameter [30~]
f2ℎ
Variance of the SMAP soil moisture observations [(<3 <−3)2]
f2= Variance of the TFN model residuals [(<3 <−3)2]
�)02C Actual evapotranspiration [<<]
�)A4 5 Makkink reference crop evapotranspiration [<<]
\ 5 2 Soil moisture content at �eld capacity [<3 <−3]
\0FB Available water storage [<3 <−3]
\F? Soil moisture content at wilting point [<3 <−3]
22

CHAPTER 1
Introduction
23

Chapter1
Chapter1
1.1 Soilmoisture information forwatermanagement
Water systems all over the world are a�ected by climate variability and increasing socio-
economic developments. Historically, water management practices in the Netherlands
have been strongly driven by �ood events (for example in 1993 and 1995), drought events
(for example in 1976 and 2003), and socio-economic trends (for example the introduc-
tion of Building with Nature concepts) (Haasnoot and Middelkoop, 2012; PBL, 2012;
De Vriend et al., 2014; Whelchel et al., 2018). The recent drought caused by the 2018
European heatwave had considerable impacts on water management, agriculture, and
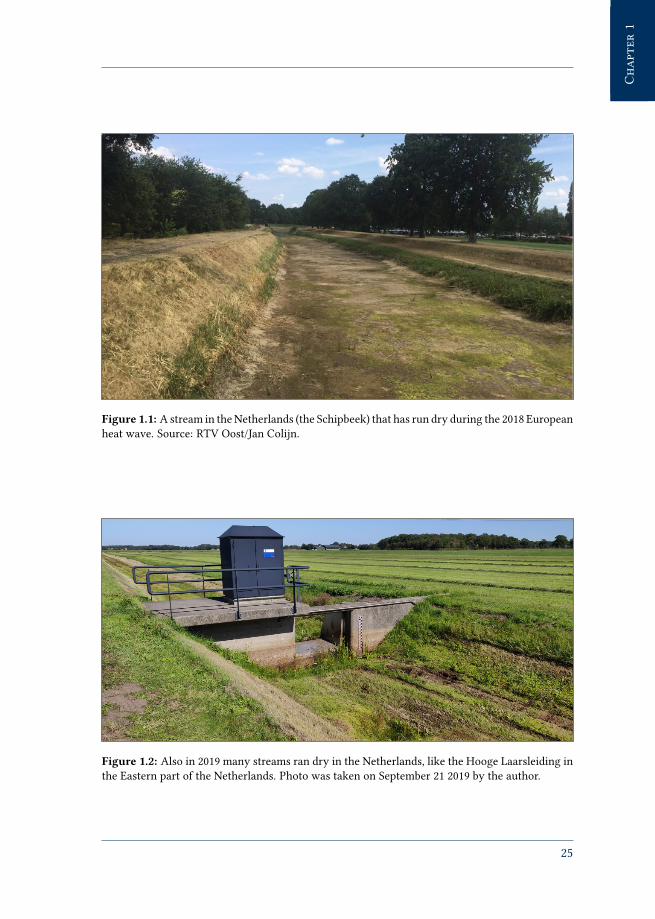
nature reserve protection (Vogel et al., 2019; Arcadis, 2019). Figure 1.1 and Figure 1.2
show surface water systems in the eastern part of the Netherlands which ran dry in
the summer periods of 2018 and 2019. The drought period activated governmental in-
stitutions and water authorities in the Netherlands to re-evaluate management policies.
Hence, the grand challenge for national and regional water managers is to optimize
water availability for di�erent functions according to users’ demands. Among others,
reliable and up-to-date information on the current hydrological conditions is essential
for skilful management of water systems.
Soil moisture is a central component of the hydrological cycle (Vereecken et al., 2008;
Seneviratne et al., 2010; Petropoulos et al., 2015; Zhuo and Han, 2016). Soil moisture
is the water in the unsaturated soil above the groundwater table. Although only ac-
counting for approximately 0.01 – 0.05% of global freshwater resources (UNESCO, 1971;
Shiklomanov, 1993; Dingman, 2002), soil moisture a�ects hydrological, meteorological,
biological, and biogeochemical processes and interacts with the atmosphere, vegetation,
surface water and deeper groundwater layers. For example, the availability of soil mois-
ture a�ects evapotranspiration rates, which in�uence atmospheric processes. Also, ve-
getation growth depends on root water uptake, which is related to the water availability
near root systems. Moreover, the soil saturation degree controls the amount of overland
�ow due to severe precipitation events. Furthermore, soil moisture conditions determine
the recharge rate of groundwater aquifers.
Soil moisture is often considered as the missing link in available hydrological data. While
data on discharges, surface water levels, groundwater levels, precipitation, and evapo-
transpiration are more or less integrated into operational water resources management,
the application of soil moisture data is limited. A main reason is the limited availability
of soil moisture �eld observations (Cassiani et al., 2006). It has long been recognized
that remote sensing data can provide estimates of environmental variables and �uxes
24
Chapter1
Chapter1
Figure 1.1: A stream in the Netherlands (the Schipbeek) that has run dry during the 2018 European
heat wave. Source: RTV Oost/Jan Colijn.
Figure 1.2: Also in 2019 many streams ran dry in the Netherlands, like the Hooge Laarsleiding in
the Eastern part of the Netherlands. Photo was taken on September 21 2019 by the author.
25
Chapter1
Chapter1
(Moradkhani, 2008; Reichle, 2008; Ma et al., 2015; STOWA, 2016; Zhuo and Han, 2016;
Sadeghi et al., 2018). For many years, water managers have been interested in remote
sensing as a source of high-resolution spatially distributed data. While several initiat-
ives have been employed to utilize remotely sensed soil moisture products (e.g. Crow and
Ryu, 2009; Drusch et al., 2009; De Rosnay et al., 2013; Wanders et al., 2014b), operational
application is still limited in water resources management. Recently, the emergence of
high-resolution remotely sensed soil moisture products has lead to new opportunities for
integrating soil moisture information in water management approaches. We de�ne soil
moisture products as soil moisture data retrieved from satellite observations. Sentinel-1
and SMAP are examples of satellites providing high-resolution soil moisture data (En-
tekhabi et al., 2010; Hornacek et al., 2012; Petropoulos et al., 2015; Benninga et al., 2019).
This research focused on the integration of high-resolution soil moisture information
obtained from remote sensing products in operational water resources management.
We studied how to integrate soil moisture information in operational water resources
management using both qualitative and quantitative methods.
This chapter provides contextual information on soil moisture (Section 1.2), the relev-
ance of this study (Section 1.3), the problem statement (Section 1.4), the general research
aim and questions (Section 1.5), and the research methodology (Section 1.6). Section 1.7
gives an outline for the dissertation.
1.2 Context
1.2.1 Subsurface processes
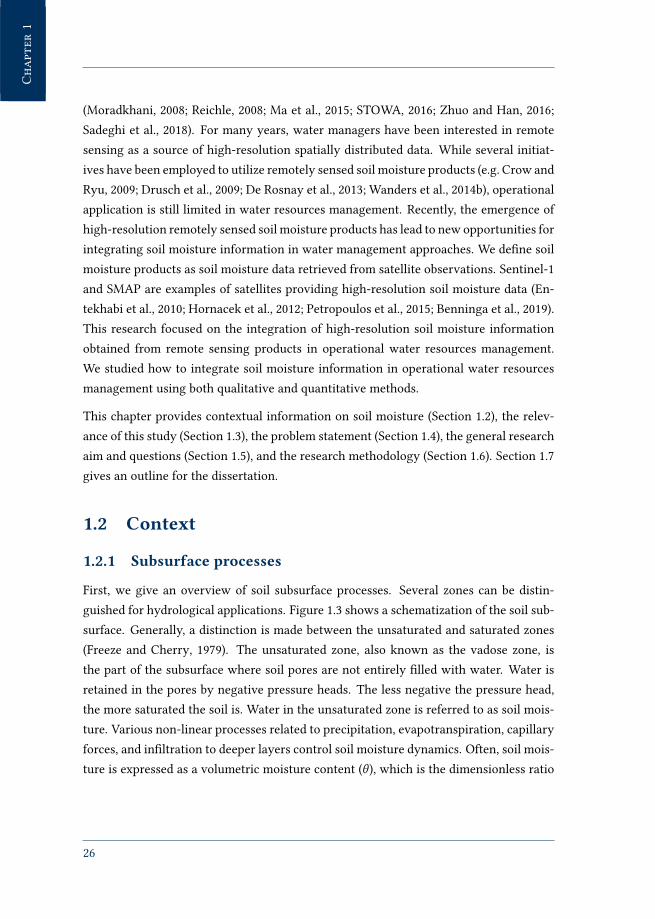
First, we give an overview of soil subsurface processes. Several zones can be distin-
guished for hydrological applications. Figure 1.3 shows a schematization of the soil sub-
surface. Generally, a distinction is made between the unsaturated and saturated zones
(Freeze and Cherry, 1979). The unsaturated zone, also known as the vadose zone, is
the part of the subsurface where soil pores are not entirely �lled with water. Water is
retained in the pores by negative pressure heads. The less negative the pressure head,
the more saturated the soil is. Water in the unsaturated zone is referred to as soil mois-
ture. Various non-linear processes related to precipitation, evapotranspiration, capillary
forces, and in�ltration to deeper layers control soil moisture dynamics. Often, soil mois-
ture is expressed as a volumetric moisture content (\ ), which is the dimensionless ratio
26
Chapter1
Chapter1
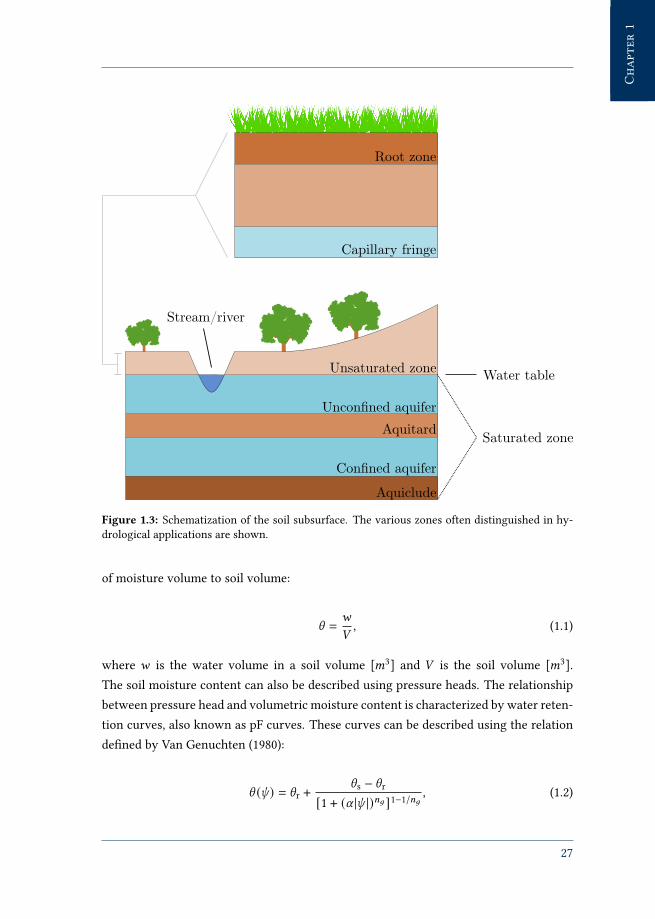
Figure 1.3: Schematization of the soil subsurface. The various zones often distinguished in hy-
drological applications are shown.
of moisture volume to soil volume:
\ =F
+, (1.1)
where F is the water volume in a soil volume [<3] and + is the soil volume [<3
].
The soil moisture content can also be described using pressure heads. The relationship
between pressure head and volumetric moisture content is characterized by water reten-
tion curves, also known as pF curves. These curves can be described using the relation
de�ned by Van Genuchten (1980):
\ (k ) = \r +\s − \r
[1 + (U |k |)=6 ]1−1/=6, (1.2)
27
Chapter1
Chapter1
where k is the pressure head [<], \ (k ) is the volumetric moisture content at pressure
head k [<3 <−3], \r is the residual soil moisture content [<3 <−3], \s is the saturated
soil moisture content [<3<−3], U6 is a scale parameter inversely proportional to the air
entry value [<−1], and =6 is a parameter related to the pore size distribution [–]. These
parameters are soil-speci�c. The Staring series provides the parameters for the soil types
found in the Netherlands (Wösten et al., 2001). The dataset BOFEK2012 provides the
spatial distribution of the Staring series in the Netherlands (Wösten et al., 2013).
Furthermore, Figure 1.3 shows the capillary fringe and root zone within the unsaturated
zone. The capillary fringe forms the transition of the unsaturated zone into the saturated
zone. In this zone, capillary tension causes soil pores to almost completely �ll with
water. The root zone is the part of the unsaturated zone in which vegetation roots can
be found. The depth of the root zone depends on both vegetation and soil type. Root
zone soil moisture is de�ned as the amount of moisture in the root zone. The root zone
and related processes such as root water uptake and evapotranspiration are vital for
hydrological and agricultural applications. The soil porosity, �eld capacity, and wilting
point limits are often associated with the root zone. During a precipitation event, the
soil pores start �lling due to in�ltration of water from the surface. The soil porosity is
the maximum amount of soil volume (or pores) that can be �lled by water. If the soil
moisture content is equal to the soil porosity, the soil is saturated. During and after
a precipitation event, water will drain to deeper layers. After both precipitation and
gravitational drainage have stopped, the soil is at �eld capacity. This situation describes
the maximum amount of water available for vegetation. The soil moisture content at
which vegetation starts to wither is the wilting point. Generally, the soil still contains
water at wilting point, although roots are not able to extract the water.
The saturated zone is the part of the subsurface where soil pores are fully �lled with wa-
ter. Water in the saturated zone is referred to as groundwater. The saturated zone can be
divided into permeable and impermeable layers. Permeable layers are known as aquifers
and typically consist of sand and gravel. An uncon�ned or phreatic aquifer is connected
to the unsaturated zone and allows water to seep from the soil surface to deeper layers
directly. A con�ned aquifer is generally bounded by an impermeable layer which pre-
vents water from seeping into the aquifer. Layers where groundwater �ow is limited due
to soil properties are referred to as aquitards. The soil of aquitards typically consists of
a mix of sand, clay, and silt. A completely impermeable layer is known as an aquiclude
and typically consists of clay. The boundary of the unsaturated and saturated zones is
de�ned by the (ground)water table (or level) in case of an uncon�ned aquifer.
28
Chapter1
Chapter1
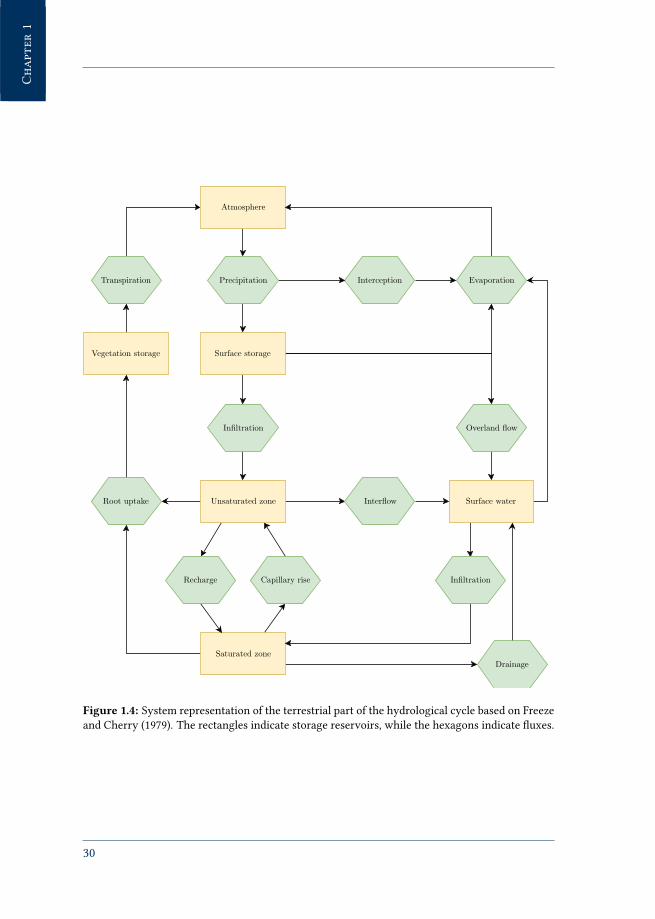
The various meteorological and hydrological processes associated with the subsurface
can be described using the hydrological cycle (Freeze and Cherry, 1979). The hydrolo-
gical cycle describes the circulation of water. Figure 1.4 shows a schematization of the
terrestrial part of the hydrological cycle. Water enters the terrestrial part in the form
of precipitation. Precipitation is intercepted by vegetation cover or temporarily stored
on the surface. Water in the surface storage will either evaporate, in�ltrate in the soil,
or end up as standing water and overland �ow to surface water if the soil in�ltration
capacity is exceeded. The term evapotranspiration describes both transpiration from
vegetation cover and evaporation from bare soil. Transpiration from the saturated zone
occurs in areas where vegetation roots tap in groundwater, for example, in wetlands
(Balugani et al., 2017). Evapotranspiration rates depend, among others, on the avail-
ability of soil moisture. Evapotranspiration reduction can occur in dry periods, which
is a mechanism which reduces evapotranspiration when only low amounts of moisture
are available. The �ow of water from the unsaturated to the saturated zone is known
as percolation or recharge. Vice versa, the �ow of water from the saturated to the un-
saturated zone is known as capillary rise, which can supply water to the unsaturated
zone from deeper layers. Inter�ow and drainage describe lateral unsaturated and satur-
ated �ow to surface water, respectively. As inter�ow does hardly occur in �at regions
like the Netherlands, modelling approaches for these regions often neglect this lateral
process to allow one-dimensional vertical unsaturated �ow assumptions (De Laat, 1980;
Van Walsum and Groenendijk, 2008).
1.2.2 Estimating soil moisture states
The limited availability of soil moisture data is a major reason that soil moisture in-
formation is not frequently used in water management. A particular challenge is that
the direct observation of soil moisture is challenging (Cassiani et al., 2006). A standard
technique of directly observing soil moisture is the gravimetric method, in which a soil
sample of a known volume and weight is dried in an oven at 105◦C (Walker et al., 2004).
The soil moisture content can be derived from the di�erence in soil weight before and
after drying. However, this method is time-consuming, has to be performed in a labor-
atory, and destroys the soil sample (Dobriyal et al., 2012). The latter implies that the
gravimetric method cannot be used for continuous measurements at the same location.
As a consequence, indirect non-destructive methods using converting algorithms have
to be applied. Therefore, we will use the term estimate rather than measure or observe in
the following sections.
29
Chapter1
Chapter1
Surface storage
Unsaturated zone
Saturated zone
Vegetation storage
Surface water
Atmosphere
Transpiration
Drainage
Infiltration
EvaporationInterceptionPrecipitation
Overland flowInfiltration
Root uptake Interflow
Capillary riseRecharge
Figure 1.4: System representation of the terrestrial part of the hydrological cycle based on Freeze
and Cherry (1979). The rectangles indicate storage reservoirs, while the hexagons indicate �uxes.
30
Chapter1
Chapter1
Alternatively, three indirect methods exist for estimating soil moisture states on various
spatiotemporal scales: in situ (Robinson et al., 2008; Dobriyal et al., 2012), remote sensing
(Petropoulos et al., 2015; Srivastava, 2017) and hydrological modelling (Šimůnek et al.,
2003; Ochsner et al., 2013; Vereecken et al., 2008). Generally, in situ methods provide
information on point scales, while remote sensing and modelling methods are applicable
on larger scales. Robinson et al. (2008) and Ochsner et al. (2013) de�ne point estimates on
a spatial scale of ≤ 1<2, while larger-scale estimates have spatial scales of > 1<2
. The
next sections elaborate on the strengths and limitations of the three methods.
In situ
Soil moisture can be estimated by installing sensors in soils at various depths. Electro-
magnetic techniques such as Time Domain Re�ectometry (TDR) and Frequency Domain
Re�ectometry (FDR) are widely used. The moisture content can also be estimated us-
ing neutron probes, cosmic-ray neutron detectors, heat pulse sensors, and tensiomet-
ers. We refer to Walker et al. (2004), Robinson et al. (2008), Dorigo et al. (2011), and
Susha Lekshmi et al. (2014) for an overview of in situ estimation techniques.
Generally, in situ soil moisture estimates are considered accurate, as the sensors can be
calibrated using soil-speci�c calibration procedures (e.g. by applying the gravimetric
method). Furthermore, the estimates can have a high temporal resolution if the sensors
are autonomously monitoring. Also, because the sensors can be installed at various
depths, a higher vertical spatial resolution can be obtained. However, due to the nature
of in situ techniques, the horizontal spatial coverage is typically limited. A dense spa-
tial coverage of point-based in situ estimates is practically impossible due to budget and
other practical limitations. Therefore, the application of in situ techniques for continu-
ous monitoring of soil moisture on catchment scales is regarded as impractical. This
limitation poses a serious challenge, since in situ estimates are generally used for the
validation of remotely sensed soil moisture products, which cover much larger spatial
footprints than the in situ sensors.
A well known hub for accessing in situ soil moisture data is the International Soil Mois-
ture Network (ISMN) (Dorigo et al., 2011). The ISMN is a cooperation of the Global En-
ergy and Water Cycle Experiment (GEWEX), the Group on Earth Observations (GEO),
the Committee on Earth Observation Satellites (CEOS), and the European Space Agency
(ESA). The ISMN can be accessed at https://ismn.geo.tuwien.ac.at/en.
Examples in the Netherlands are the Twente (Dente et al., 2012; Van der Velde, 2018;
Van der Velde et al., 2019) and the Raam (Benninga et al., 2018) soil moisture and tem-
31

Chapter1
Chapter1
53.0°N53.0°N
52.0°N52.0°N
51.0°N51.0°N
2.0°E2.0°E 3.0°E3.0°E 4.0°E4.0°E 5.0°E5.0°E 6.0°E6.0°E 7.0°E7.0°E 8.0°E8.0°E 9.0°E9.0°E
Figure 1.5: Location of the Twente and Raam in situ soil moisture and temperature monitoring
networks in the Netherlands.
perature monitoring networks. The networks are maintained by the ITC faculty of the
University of Twente and Wageningen University & Research. Figure 1.5 shows the loc-
ation of the two networks in the Netherlands.
Remote sensing
Remote sensing provides a means to get spatially distributed information. Soil moisture
information can be retrieved using both multispectral and microwave sensors. How-
ever, multispectral methods show weak relationships to soil moisture in the presence
of vegetation covers (Petropoulos et al., 2015). Also, cloud cover signi�cantly impacts
multispectral soil moisture retrievals. Therefore, multispectral sensors are limitedly used
for soil moisture retrievals. Alternatively, both active and passive microwave sensors
are suitable to capture soil moisture dynamics. Microwave sensors show sensitivity to
soil moisture, particularly in the low frequency range (1–5 GHz) (Du et al., 2000). Active
sensors emit a microwave signal and detect the corresponding backscatter, while passive
sensors observe re�ected or emitted microwave signals from the soil surface. Examples
of satellite sensors providing active soil moisture microwave retrievals are ERS (Naeimi
et al., 2009), ASCAT (Wagner et al., 2013), and Sentinel-1 (Wagner et al., 2009; Benninga
et al., 2019). Examples of satellite sensors providing passive soil moisture microwave re-
32
Chapter1
Chapter1
trievals are AMSR-E, (Njoku et al., 2003; Mladenova et al., 2014), AMSR2 (Imaoka et al.,
2010), SMOS (Kerr et al., 2001), and SMAP (Entekhabi et al., 2010).
Generally, soil moisture estimates from remote sensing sensors represent the upper part
of the unsaturated zone (up to a couple of centimetres depth), because microwave signals
have limited soil penetration depths. Therefore, remote sensing estimates are often re-
ferred to as surface soil moisture. We refer to Petropoulos et al. (2015) for an overview of
surface soil moisture retrievals from remote sensing. The relationship between surface
soil moisture and soil moisture at greater depth is complex, especially in dry periods
(Carranza et al., 2018). Extrapolating surface soil moisture to root zone soil moisture
information is not trivial, as complex non-linear processes concerning dry-down and
hysteresis have to be considered. Currently, no universal method exists for translat-
ing surface to root zone soil moisture information. Several studies show that statistical
methods (e.g. Albergel et al., 2008; Carranza et al., 2018) or hydrological modelling (e.g.
Sabater et al., 2007; Renzullo et al., 2014; Dumedah et al., 2015; Blyverket et al., 2019) can
help in extrapolating surface soil information to deeper layers.
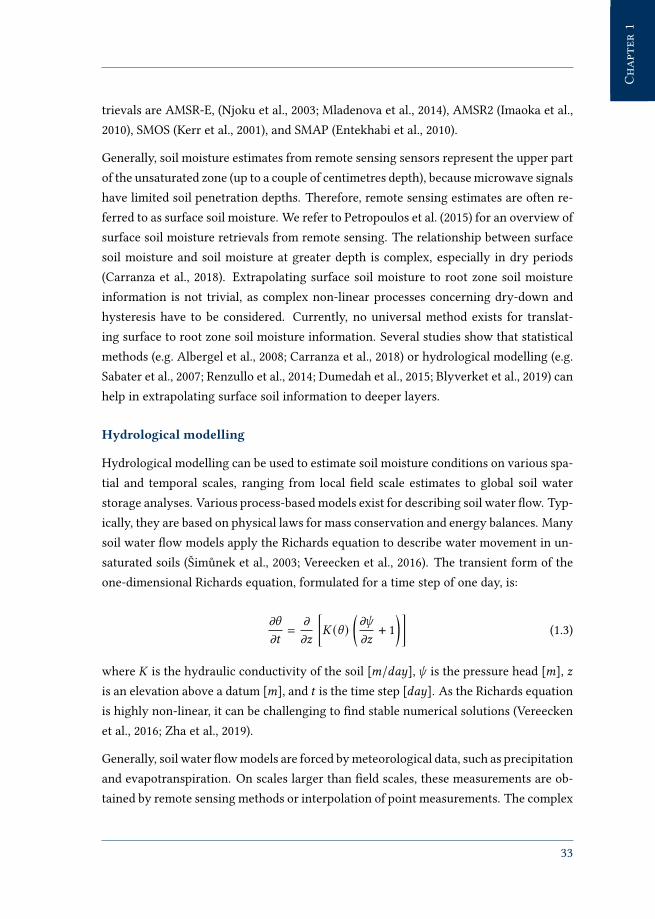
Hydrological modelling
Hydrological modelling can be used to estimate soil moisture conditions on various spa-
tial and temporal scales, ranging from local �eld scale estimates to global soil water
storage analyses. Various process-based models exist for describing soil water �ow. Typ-
ically, they are based on physical laws for mass conservation and energy balances. Many
soil water �ow models apply the Richards equation to describe water movement in un-
saturated soils (Šimůnek et al., 2003; Vereecken et al., 2016). The transient form of the
one-dimensional Richards equation, formulated for a time step of one day, is:
m\
mC=m
mI
[ (\ )
(mk
mI+ 1
)](1.3)
where is the hydraulic conductivity of the soil [</30~],k is the pressure head [<], I
is an elevation above a datum [<], and C is the time step [30~]. As the Richards equation
is highly non-linear, it can be challenging to �nd stable numerical solutions (Vereecken
et al., 2016; Zha et al., 2019).
Generally, soil water �ow models are forced by meteorological data, such as precipitation
and evapotranspiration. On scales larger than �eld scales, these measurements are ob-
tained by remote sensing methods or interpolation of point measurements. The complex
33
Chapter1
Chapter1
structure of the subsurface is implemented using various parametrizations of surface el-
evation, soil type, land use, vegetation type, and other characteristics. Parameter values
are generally obtained by applying calibration approaches using training data. Typic-
ally, these parameter sets are �xed in time. However, hydrological conditions are non-
stationary and vary considerably over time , which means that the optimal parameter set
of a hydrological model di�ers over time (Thirel et al., 2015; Beven, 2016). Furthermore,
the spatial discretization (e.g. model grid size and the resolution of input data) determ-
ines the spatial resolution of the model output. These aspects introduce uncertainties
due to the parametrization of soil physical and land use characteristics.
A distinct advantage of hydrological modelling is that models can o�er information on
similar spatial scales as remote sensing, however on a wider range of temporal scales.
While the temporal scale of remote sensing is related to satellite overpasses, models can
be run using hourly, daily, and other time steps. Furthermore, hydrological models have
the ability to simulate historical and future situations. Additionally, they can be used to
estimate the e�ects of water management measures on hydrological conditions. There-
fore, hydrological modelling is suitable for application in operational settings.
The Netherlands Hydrological Instrument (NHI) is an example of an operational tool for
water management in the Netherlands. NHI is an integrated process-based modelling in-
strument for unsaturated water �ow, groundwater �ow, surface water �ow, and surface
water distribution (De Lange et al., 2014). The instrument is used for decision-making
in operational water management and scenario analyses in the Netherlands. Due to the
operational setting, this instrument is particularly suitable for the research presented in
this dissertation. The NHI model codes and input data are freely available and can be
downloaded atwww.nhi.nu. Chapter 3 provides a detailed description of NHI.
1.3 Relevance
1.3.1 Impact
Soil moisture signi�cantly impacts other hydrological processes (Vereecken et al., 2008;
Seneviratne et al., 2010). For example, soil moisture governs the partitioning of pre-
cipitation into in�ltration and surface runo�, which a�ects groundwater recharge and
stream�ow (Brocca et al., 2010, 2017). Capturing soil moisture dynamics leads to a bet-
ter understanding of drought, �ood and heatwave events (McColl et al., 2017). Spinoni
et al. (2014) estimate that more than two billion people have been a�ected by droughts
34
Chapter1
Chapter1
during the 20th century, causing eleven million deaths globally. Furthermore, Grillakis
(2019) states that understanding the role of soil moisture dynamics in the water cycle,
including the e�ect of climate change on soil moisture, is essential to project and mitig-
ate potential impacts on agriculture. Also, soil moisture variability can lead to increased
CO2 emissions from soils (Kechavarzi et al., 2010) and land subsidence in clayey areas,
wetlands and peatlands (Querner et al., 2012; Pritchard et al., 2015), which can lead to
the destabilization of soils containing construction foundations (Hawkins, 2013).
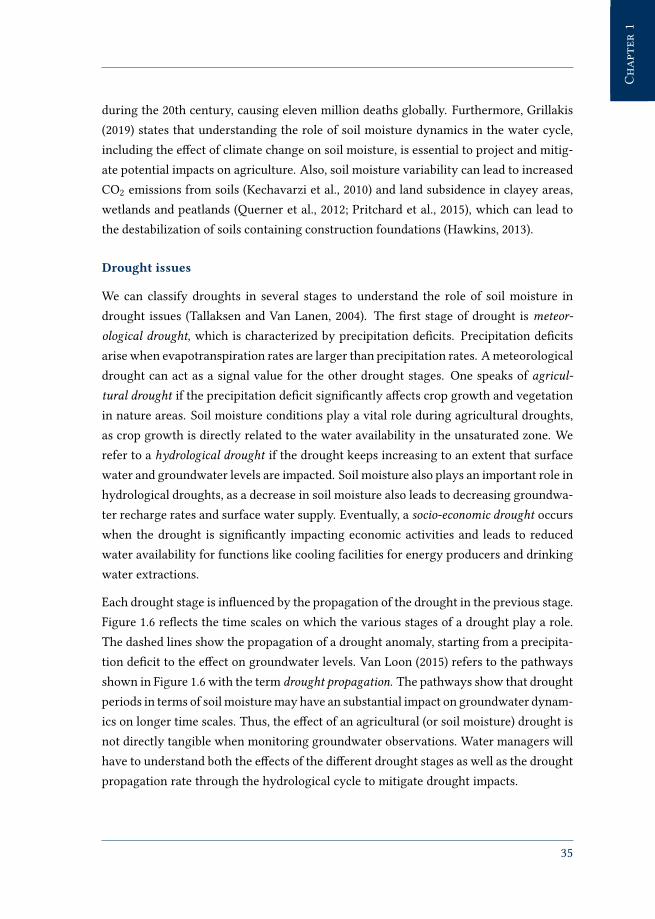
Drought issues
We can classify droughts in several stages to understand the role of soil moisture in
drought issues (Tallaksen and Van Lanen, 2004). The �rst stage of drought is meteor-ological drought, which is characterized by precipitation de�cits. Precipitation de�cits
arise when evapotranspiration rates are larger than precipitation rates. A meteorological
drought can act as a signal value for the other drought stages. One speaks of agricul-tural drought if the precipitation de�cit signi�cantly a�ects crop growth and vegetation
in nature areas. Soil moisture conditions play a vital role during agricultural droughts,
as crop growth is directly related to the water availability in the unsaturated zone. We
refer to a hydrological drought if the drought keeps increasing to an extent that surface
water and groundwater levels are impacted. Soil moisture also plays an important role in
hydrological droughts, as a decrease in soil moisture also leads to decreasing groundwa-
ter recharge rates and surface water supply. Eventually, a socio-economic drought occurs
when the drought is signi�cantly impacting economic activities and leads to reduced
water availability for functions like cooling facilities for energy producers and drinking
water extractions.
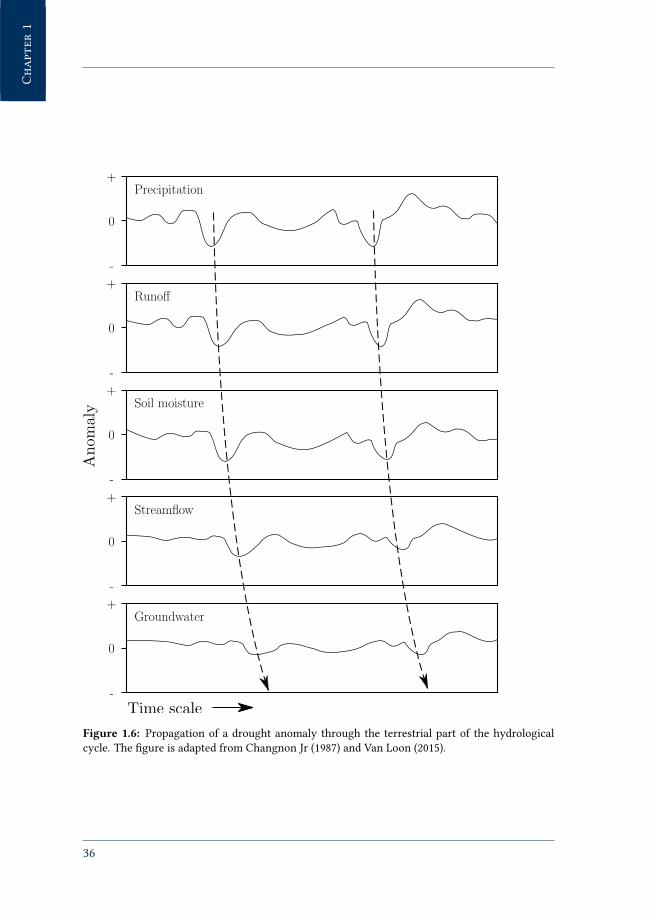
Each drought stage is in�uenced by the propagation of the drought in the previous stage.
Figure 1.6 re�ects the time scales on which the various stages of a drought play a role.
The dashed lines show the propagation of a drought anomaly, starting from a precipita-
tion de�cit to the e�ect on groundwater levels. Van Loon (2015) refers to the pathways
shown in Figure 1.6 with the term drought propagation. The pathways show that drought
periods in terms of soil moisture may have an substantial impact on groundwater dynam-
ics on longer time scales. Thus, the e�ect of an agricultural (or soil moisture) drought is
not directly tangible when monitoring groundwater observations. Water managers will
have to understand both the e�ects of the di�erent drought stages as well as the drought
propagation rate through the hydrological cycle to mitigate drought impacts.
35
Chapter1
Chapter1
Figure 1.6: Propagation of a drought anomaly through the terrestrial part of the hydrological
cycle. The �gure is adapted from Changnon Jr (1987) and Van Loon (2015).
36

Chapter1
Chapter1
Excess water issues
Soil moisture is also an important indicator in excess water situations. The soil mois-
ture content, the soil porosity, and in�ltration rates control how much water can be
stored in soils during extreme precipitation events. Pre-storm soil moisture conditions
partly determine whether precipitation will either in�ltrate to deeper soil layers or lead
to standing water or overland �ow. The accuracy of (�ash) �ood forecasting systems
greatly bene�t if up-to-date information on soil moisture is included (Crow and Ryu,
2009; Brocca et al., 2009, 2010; Tramblay et al., 2010; Sutanudjaja et al., 2014; Naz et al.,
2019). In particular, soil moisture information improves the understanding of �ood peak
heights (Wanders et al., 2014b).
1.3.2 Implications for water management
Several studies have investigated the implementation of soil moisture information in op-
erational water resources management (Wanders et al., 2014b; Kurtz et al., 2017; Deng
et al., 2019; He et al., 2019), meteorological forecasting (Drusch et al., 2009; De Rosnay
et al., 2013), and irrigation management (Brocca et al., 2018). Since soil moisture provides
valuable information for drought and �ood events as described in Section 1.3.1, inform-
ation on soil moisture dynamics is a valuable asset for water managers. For example,
the recent dry period in the summer of 2018 had an enormous impact on water systems
in the Netherlands, as Figure 1.1 and Figure 1.2 illustrate. Figure 1.7 shows the spa-
tially averaged daily soil moisture content for the years 2016–2018 based on data from
the in situ Twente soil moisture monitoring network (Dente et al., 2012; Van der Velde,
2018; Van der Velde et al., 2019); see Figure 1.5 for the location of the network. The
2018 time series clearly shows the impact of the 2018 summer heatwave in the months
July–August. The soil moisture content drops to the lowest levels observed in recent
years. However, it is remarkable that the soil was relatively wet in the spring of 2018
in comparison with 2016 and 2017. So, the soil moisture conditions at the beginning of
a year are not necessarily appropriate indicators for the soil moisture conditions in the
remainder of a year. Other explanatory variables, like meteorological conditions, are
essential to take into account for forecasting purposes.
This example highlights that water managers have to understand historical, present, and
soil moisture conditions. However, the application of soil moisture information in op-
erational water resources management is limited. Bastiaanssen et al. (2001) state that
although the possibilities of soil moisture remote sensing methods have progressed, ac-
cessing, applying, and understanding such information is a challenge for water man-
37

Chapter1
Chapter1
Jan Mar May Jul Sep Nov Jan
Month of year [-]
0.0
0.2
0.4
0.6
Volu
met
ric
mois
ture
conte
nt
[m3m−
3]
2016 2017 2018
Figure 1.7: Spatial average of daily in situ soil moisture over the Twente region at 20 cm soil depth
for the years 2016, 2017, and 2018. Data are retrieved from the Twente soil moisture monitoring
network maintained by ITC (Dente et al., 2012; Van der Velde, 2018; Van der Velde et al., 2019).
agers in the Netherlands. During the drought period of 2018, it became clear that Dutch
water managers still focus on drought indicators based on precipitation de�cit, sur-
face water and groundwater levels, and discharge rates rather than soil moisture condi-
tions. However, evaluations of the 2018 drought period show the importance of incor-
porating soil moisture information in operational water management (Arcadis, 2019;
STOWA, 2019). Several water authorities in the Netherlands are starting studies on
how to include such information in their daily operational management. Recently, sev-
eral initiatives have been launched to study how to integrate soil moisture inform-
ation in operational applications, such as the European projects EartH2Observe (http://www.earth2observe.eu) and IMPREX (http://www.imprex.eu),
OWAS1S by the University of Twente and Wageningen University & Research (http://www.owas1s.nl), OWASIS-NL by HydroLogic (https://business.esa.int/projects/owasis-nl), and the deployment of various high-resolution
soil moisture products by VanderSat (https://www.vandersat.com).
1.4 Problem statement
Based on Sections 1.2 and 1.3, we formulate a problem statement. First, we elabor-
ate on the issues and challenges of integrating new information in operational water
38
Chapter1
Chapter1
management. Next, we discuss the discrepancies between spatiotemporal scales of soil
moisture estimates. These issues lead to the introduction of a research framework in
section 1.6.
Incorporation of new information in water management
Several studies state that the emphasis of information producers should shift from pro-
ducing large amounts of data towards tailor-made information (Seager, 2001; Timmer-
man, 2015; STOWA, 2016). Because the perspectives of scientists and water managers
(or decision-makers) can be very di�erent for various problems, the needs of water man-
agers should be identi�ed (Acreman, 2005; Timmerman, 2015). Due to this science-policy
gap, decision-makers still need to have extensive knowledge for interpretation. The
knowledge centre for Dutch regional water managers (Stichting Toegepast OnderzoekWaterbeheer, STOWA) identi�ed the science-policy gap as one of the main threats for
the application of remote sensing products in operational water management (STOWA,
2016). It is unknown to what extent water managers depend on their experiential (im-
plicit) knowledge in comparison with evidence-based information. Furthermore, to sup-
port robust operational water management, it is essential to have reliable hydrological
models which can evaluate water management optimization measures as well as provide
accurate information on the historical, present and future state of water systems. Water
authorities invest considerably in the development of hydrological models. Reinhard and
Folmer (2009) state that the application of hydrological models in Dutch water manage-
ment is widely accepted. However, the extent to which hydrological models are applied
for decision-making in operational water resources management is unknown and might
not be common practice (Borowski and Hare, 2006; Serrat-Capdevila et al., 2011; Leskens
et al., 2014). Therefore, we want to identify the current role of evidence-based informa-
tion, in particular hydrological models, in operational water management.
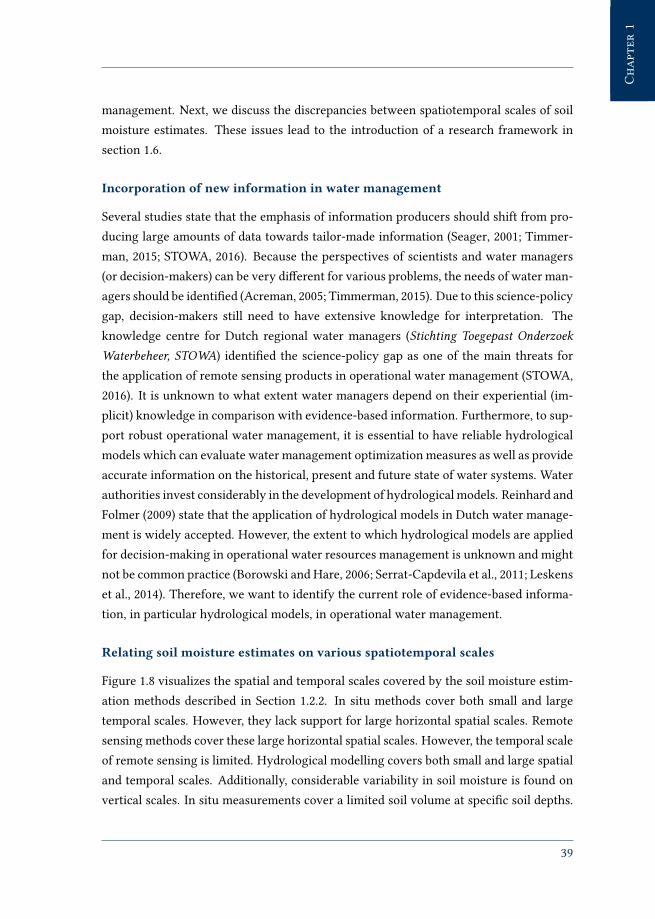
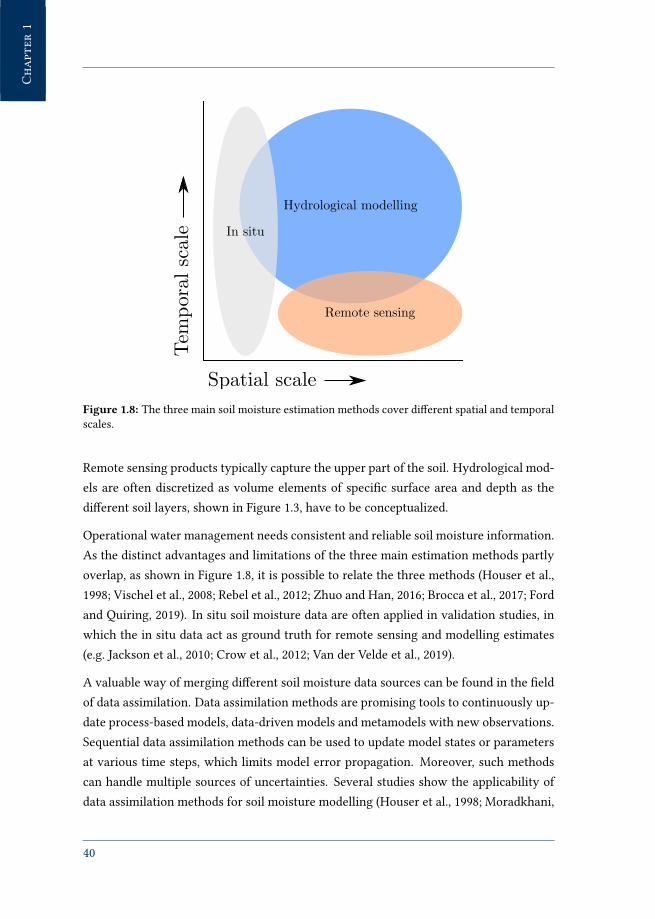
Relating soil moisture estimates on various spatiotemporal scales
Figure 1.8 visualizes the spatial and temporal scales covered by the soil moisture estim-
ation methods described in Section 1.2.2. In situ methods cover both small and large
temporal scales. However, they lack support for large horizontal spatial scales. Remote
sensing methods cover these large horizontal spatial scales. However, the temporal scale
of remote sensing is limited. Hydrological modelling covers both small and large spatial
and temporal scales. Additionally, considerable variability in soil moisture is found on
vertical scales. In situ measurements cover a limited soil volume at speci�c soil depths.
39
Chapter1
Chapter1
Figure 1.8: The three main soil moisture estimation methods cover di�erent spatial and temporal
scales.
Remote sensing products typically capture the upper part of the soil. Hydrological mod-
els are often discretized as volume elements of speci�c surface area and depth as the
di�erent soil layers, shown in Figure 1.3, have to be conceptualized.
Operational water management needs consistent and reliable soil moisture information.
As the distinct advantages and limitations of the three main estimation methods partly
overlap, as shown in Figure 1.8, it is possible to relate the three methods (Houser et al.,
1998; Vischel et al., 2008; Rebel et al., 2012; Zhuo and Han, 2016; Brocca et al., 2017; Ford
and Quiring, 2019). In situ soil moisture data are often applied in validation studies, in
which the in situ data act as ground truth for remote sensing and modelling estimates
(e.g. Jackson et al., 2010; Crow et al., 2012; Van der Velde et al., 2019).
A valuable way of merging di�erent soil moisture data sources can be found in the �eld
of data assimilation. Data assimilation methods are promising tools to continuously up-
date process-based models, data-driven models and metamodels with new observations.
Sequential data assimilation methods can be used to update model states or parameters
at various time steps, which limits model error propagation. Moreover, such methods
can handle multiple sources of uncertainties. Several studies show the applicability of
data assimilation methods for soil moisture modelling (Houser et al., 1998; Moradkhani,
40
Chapter1
Chapter1
2008; Reichle, 2008; Liu et al., 2012). Still, the application of sequential soil moisture
data assimilation in operational settings is limited. Furthermore, it is unclear how the
assimilation of soil moisture a�ects simulations of other hydrological variables, such as
groundwater levels, in integrated hydrological modelling (Brocca et al., 2017).
Innovative modelling approaches
Process-based unsaturated zone models require considerable computational power. Also,
the parametrization of the subsurface in the model is often a rough assumption, since
many parameters cannot be observed directly. Furthermore, it can be challenging to �nd
stable numerical solutions for process-based soil water �ow models (Vereecken et al.,
2016; Zha et al., 2019), as was discussed in Section 1.2.2. The availability of new high-
resolution remote sensing data enables exploring new data-driven and metamodelling
approaches as a replacement of process-based modelling approaches.
1.5 General research aim and questions
The overall aim of this research is to show the potential use of soil moisture information
as part of operational water resources management systems, in particular hydrological
models, using high-resolution remote sensing data. The following research questions
(RQs) are formulated:
RQ1 To what degree are hydrological models currently applied in operational water
management and how can their applicability be increased for operational water
management?
RQ2 To what extent can the assimilation of a high-resolution remotely sensed surface
soil moisture product increase the accuracy of an unsaturated zone hydrological
metamodel?
RQ3 To what extent can data-driven modelling, based on high-resolution remote sens-
ing data, be used to provide up-to-date soil moisture information for operational
water management?
1.6 Research methodology
We developed a research framework to tackle the challenges identi�ed in Section 1.4,
see Figure 1.9. The framework focuses on three aspects: identi�cation, accuracy and
41
Chapter1
Chapter1
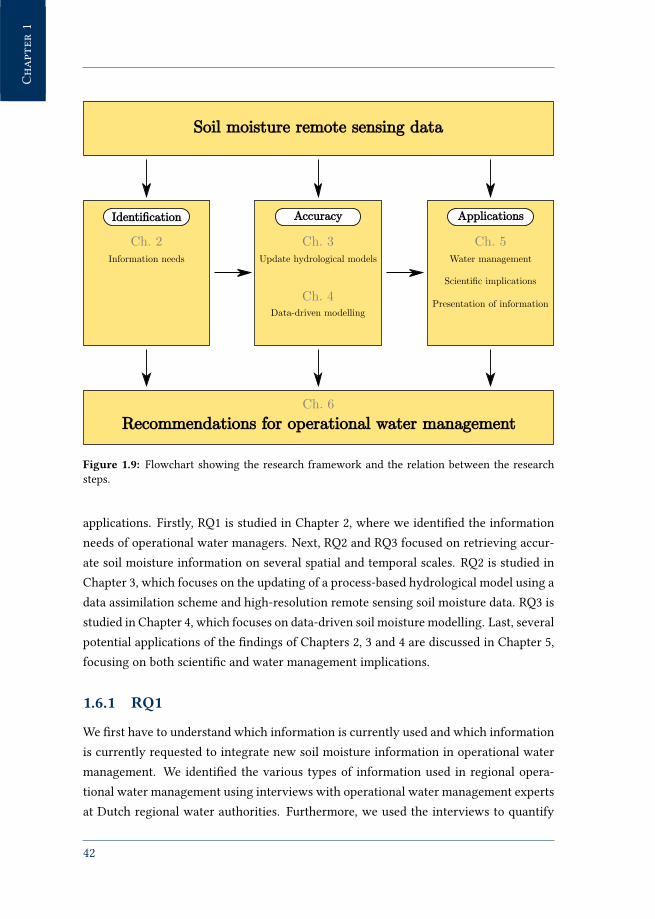
Figure 1.9: Flowchart showing the research framework and the relation between the research
steps.
applications. Firstly, RQ1 is studied in Chapter 2, where we identi�ed the information
needs of operational water managers. Next, RQ2 and RQ3 focused on retrieving accur-
ate soil moisture information on several spatial and temporal scales. RQ2 is studied in
Chapter 3, which focuses on the updating of a process-based hydrological model using a
data assimilation scheme and high-resolution remote sensing soil moisture data. RQ3 is
studied in Chapter 4, which focuses on data-driven soil moisture modelling. Last, several
potential applications of the �ndings of Chapters 2, 3 and 4 are discussed in Chapter 5,
focusing on both scienti�c and water management implications.
1.6.1 RQ1
We �rst have to understand which information is currently used and which information
is currently requested to integrate new soil moisture information in operational water
management. We identi�ed the various types of information used in regional opera-
tional water management using interviews with operational water management experts
at Dutch regional water authorities. Furthermore, we used the interviews to quantify
42

Chapter1
Chapter1
the extent to which operational decisions are based on available information sources,
which we identi�ed as either evidence-based or experiential information. Speci�cally,
we used these results to identify challenges and propose improvements to increase the
application of various information types in operational water resources management,
based on a literature study.
1.6.2 RQ2
The accuracy of hydrological models partly depends on the training dataset used for
model calibration. Data assimilation is a means to incorporate up-to-date information
in the model simulations. We developed an open-source data assimilation tool based
on the OpenDA framework for the unsaturated zone metamodel MetaSWAP as part of
the Netherlands Hydrological Instrument (NHI). The framework is applied to update hy-
drological metamodel simulations by assimilating remotely sensed surface soil moisture
observations obtained from the SMAP satellite. We used a perturbed observations En-
semble Kalman �lter. A particular strength of the applied data assimilation scheme is
the opportunity to update root zone soil moisture estimates using surface soil moisture
observations by de�ning an appropriate error model. In situ soil moisture measurements
were used to validate the results on both regional and local spatial scales.
1.6.3 RQ3
RQ3 focuses on the application of a data-driven method for soil moisture modelling.
We applied transfer function-noise (TFN) modelling using remotely sensed surface soil
moisture observations for retrieving soil moisture conditions. TFN modelling is a statist-
ical time series modelling method to relate observed time series to input stresses using
a linear transformation of impulse-response functions. A distinct advantage of such a
method is that no prior assumptions of system processes are needed. Furthermore, TFN
modelling is much faster than commonly-used process-based modelling tools for unsat-
urated zone dynamics. Again, surface soil moisture observations from the SMAP satellite
were used to train the TFN models and in situ soil moisture measurements were used to
validate the model results.
1.7 Dissertation outline
The structure of the thesis is as follows: Chapter 2 focuses on the current information use
in regional operational water resources management in the Netherlands. Chapter 3 de-
43

Chapter1
Chapter1
scribes a method for integrating remotely sensed surface soil moisture observations and
an integrated process-based hydrological metamodel using a data assimilation scheme.
Chapter 4 elaborates on TFN modelling: a fast and easy-to-construct method for describ-
ing soil moisture dynamics based on remote sensing data. Chapter 5 discusses the results
of the thesis and focuses on the operational application of the various methods studied
in this research. Last, conclusions and recommendations are given in Chapter 6.
44

CHAPTER 2
The role of
evidence-based information
in regional operational water
management in the Netherlands
This chapter is published as:
Pezij, M., Augustijn, D.C.M., Hendriks, D.M.D., and Hulscher, S.J.M.H. (2019) The role of evidence-based in-
formation in regional operational water management in the Netherlands. Environmental Science & Policy, 93,
75-82, doi:10.1016/j.envsci.2018.12.025.
45

Chapter2
Chapter2
Abstract
The integration of evidence-based information in operational water management is es-
sential for robust decision-making. We investigated the current use of experiential and
evidence-based information in Dutch regional operational water management. Inter-
views with operational water managers at regional water authorities in the Nether-
lands reveal that they use both evidence-based and experiential information for decision-
making. While operational water management is shifting towards an evidence-based
approach, experiential information is still important for decision-making. To ful�l the
current information need, the operational water managers indicate they would like to
have access to high-resolution spatial data, value-added products, and tools for com-
munication to stakeholders. We argue that hydrological models are suitable tools to
support these needs. However, while several evidence-based information types are used
by operational water managers, hydrological models are limitedly applied. Hydrological
models are regarded as inaccurate for operational water management at desired spatial
scales. Also, operational water managers often struggle to correctly interpret hydrolo-
gical model output. We propose several means to overcome these problems, including
educating operational water managers to interpret hydrological model output and se-
lecting suitable indicators for evidence-based decision-making.
2.1 Introduction
Densely populated regions like the Netherlands need well-designed operational water
management for coping with varying water availabilities and demands (Haasnoot and
Middelkoop, 2012). Operational water management requires decision-making within
limited time intervals and involve multiple criteria related to for example �ood risk, wa-
ter supply, and navigability (Xu and Tung, 2008). These complex settings are character-
ized by large uncertainties (Ascough et al., 2008). It is challenging to take robust water
management decisions as one has to quantify and assess these uncertainties (Walker
et al., 2003; Warmink et al., 2017). Also, water managers have to operate under regulat-
ory, institutional, political, resources, and other constraints, which limit their capacity
to use new information (Morss et al., 2005).
Water managers generally use several information types for decision-making (Polanyi,
1966; Raymond et al., 2010), e.g. experiential and evidence-based information. Accord-
ing to Raymond et al. (2010), the classi�cation of information is arbitrary, which means
that there are multiple and overlapping ways of de�ning experiential and evidence-
46
Chapter2
Chapter2
based information. Experiential information is linked to personal perspectives, intuition,
emotions, beliefs, know-how, experiences, and values which are not easily articulated
and shared (Timmerman, 2015). Evidence-based information can be described, commu-
nicated, written down and documented (Nonaka and Takeuchi, 1995). Evidence-based
decision-making can help to ensure that untested practices are not widely adopted, be-
cause they have been used previously (Sutherland et al., 2004).
Although evidence-based information can signi�cantly contribute to decision-making
in operational water management (Timmerman and Langaas, 2005), several studies state
that the science-practice gap limits the use of evidence-based information (Ward et al.,
1986; Brown et al., 2015). In other words, evidence-based information does not always
match the needs of operational water managers. Instead, managers rely on experiential
information for decision-making (Pullin et al., 2004). For example, Boogerd et al. (1997)
found that decision-making at regional water authorities in the Netherlands is mainly
based on personal expertise. Although the amount of available evidence-based inform-
ation has greatly increased in recent years, the dissemination of relevant information
for decision-making remains a challenge (OECD, 2014). The science-practice gap has to
be bridged to improve evidence-based decision-making in operational water manage-
ment (Cosgrove and Loucks, 2015; Timmerman, 2015). In this study, we investigated the
present application of experiential and evidence-based information in the Netherlands
and its impact on decision-making in operational water management.
Brown et al. (2015) show that the adoption of a scienti�c framework by operational wa-
ter managers will improve the credibility of evidence-based decision-making. Decision
support systems (DSSs) are designed as supporting frameworks to guide evidence-based
decision-making in operational water management. Hydrological models are often an
integral part of DSSs (Kersten and Mikolajuk, 1999; Zhang et al., 2013). In this chapter,
when we refer to hydrological models, we refer to the application of models in a DSS.
Several studies have shown the potential of hydrological models for decision-making
in operational water management. Hydrological modelling can help in increasing the
understanding of a problem and in de�ning solution objectives (Guswa et al., 2014), in
developing and evaluating promising control measures (Beven and Alcock, 2012), and in
providing con�dence in the solutions proposed (Kurtz et al., 2017). Not only can hydro-
logical models be used to manage and optimize water systems, model output can also be
used to create understanding among stakeholders (Hanington et al., 2017).
However, hydrological model output does not always comply with the needs of decision-
makers. Although approaches such as participatory modelling and indicator-based mod-
47

Chapter2
Chapter2
elling are developed to decrease the science-practice gap, the application of hydrolo-
gical models by operational water managers is not common practice (Borowski and
Hare, 2006; Leskens et al., 2014; Serrat-Capdevila et al., 2011). In contrast, Reinhard and
Folmer (2009) state that the use of hydrological models in Dutch water management is
widely accepted. It is unknown how hydrological models contribute to decision-making
in present-day regional operational water management in the Netherlands.
The aim of this study is to investigate the current role of experiential and evidence-based
information, in particular hydrological models, for decision-making in regional opera-
tional water management in the Netherlands. We used expert interviews to study the
perspective of regional water managers, similar to the studies of Warmink et al. (2011)
and Höllermann and Evers (2017). A step-wise approach is applied; �rst, we studied how
experiential and evidence-based decision-making is integrated in Dutch regional opera-
tional water management. Secondly, we assessed the integration of hydrological models
in evidence-based operational water management.
This chapter is organised as follows: Section 2.2 describes the decision-making frame-
work applied in this study. Section 2.3 introduces the research methodology for the
interviews. Results are presented in section 2.4, and are discussed in section 2.5. Finally,
conclusions are drawn in section 2.6.
2.2 Decision-making framework
We set up a decision-making framework based on Dicks et al. (2014), see Figure 2.1. This
framework is used to analyse interviews with operational water managers to determine
which information they use in the decision-making process. The framework is based on
the following assumptions:
1. Water managers have to evaluate a water system condition.
2. Water managers collect both evidence-based and/or experiential information con-
cerning this condition.
3. Water managers will assess the water system condition using all available inform-
ation.
4. Taking a decision will lead to new water system conditions, which again have to
be evaluated in time.
Dicks et al. (2014) present two bypass routes that, in this case, operational water man-
48

Chapter2
Chapter2
Limited guidance bypassDecisions based on limited studies
Opinion-based bypassDecisions based on experience
1. Water system condition
3. Full assessment
4. Decision
2. Information
Evidence-based
Experiential
Figure 2.1: Decision-making framework and typical bypasses, adapted from Dicks et al. (2014).
agers can take in decision-making. Firstly, water managers who base their decisions on
experiential rather than evidence-based information use the opinion-based bypass. Pul-
lin et al. (2004) described the opinion-based bypass as “relying on the status quo of con-
tinuing with an established but unevaluated practice”. Secondly, water managers who do
not incorporate all available evidence-based information in decision-making use the lim-
ited guidance bypass. Water managers are bound to time and other constraints, which
limits the ability to take all available information into account. These bypasses may lead
to sub-optimal water management decisions. For example, small-scale solutions, such
as locally adapting water levels by raising weir levels, may not have the desired e�ect
on catchment-wide scales.
We categorize the decisions as de�ned in the framework using two aspects that char-
acterize operational water management. These aspects are the situation type and the
situation urgency. Firstly, decisions are made for dry or wet situations. Secondly, the
decision urgency is a re�ection of the severity of the situation. We identify regular day-
to-day decisions and calamity decisions concerning extreme events. This leads to four
decision-making situations:
• Regular-Dry
• Regular-Wet
• Calamity-Dry
• Calamity-Wet
49
Chapter2
Chapter2
Typically, decisions concerning dry periods are considered over a time span of weeks.
Dry periods often occur during summer. Operational water managers have to monitor
and maintain the supply of both surface water and groundwater resources. In regular
situations, operational water managers can deal with droughts by controlling a system
of pumps and weirs to optimize water supply. During calamity situations, water man-
agers focus on limiting water use by prioritizing important functions like drinking water
supply above functions like agriculture, which is a general tendency across the European
Union (Kampragou et al., 2011).
Decisions concerning wet situations are generally taken over a time span of hours to
days. For example, the supply of water regularly exceeds water demand in winter peri-
ods. Decreasing evapotranspiration rates lead to wet soils and shallow groundwater
levels. Often, soils cannot adequately cope with heavy precipitation events during such
periods, which lead to inundations. Operational water managers can control soil water
storage to an extent by adapting surface water levels. Calamity situations like the immin-
ent �ooding of streams and rivers can cause severe damage. Controlling the discharge
capacity of water infrastructure plays a large role during calamities.
2.3 Methodology
We set up a case study for investigating the use of experiential and evidence-based in-
formation for decision-making in regional operational water management.
2.3.1 Study area
We selected six regional water authorities out of a total of twenty-two to incorporate
various water management approaches in the Netherlands. Table 2.1 shows their main
characteristics and Figure 2.2 shows their management areas within the Netherlands. Aa
en Maas and Vechtstromen represent areas within the Netherlands situated above sea
level. These areas mainly consist of sandy soils and are generally free-draining, which
limit the ability to take control measures. Del�and and Zuiderzeeland represent the low-
lying areas within the Netherlands. Most of their management areas lies below sea level
and soils are mainly clayey and peaty. Since the water system of the latter authorities is
well regulated, water managers have several options for control measures. De Stichtse
Rijnlanden and Drents Overijsselse Delta have sandy, clayey, and peaty soils.
50

Chapter2
Chapter2
Table 2.1: Selected regional water authorities. Statistics are obtained from Unie van Waterschap-
pen (2014).
Water authority
Inhabitants
[capita]
Surface area
[ha]
Characteristics
Aa en Maas 743,842 161,007 Elevated sandy soils
Del�and 1,200,000 40,547 Clayey polders
De Stichtse Rijnlanden 750,000 83,021 Elevated sandy soils and peaty polders
Drents Overijsselse Delta 600,000 255,500 Elevated sandy soils and clayey polders
Vechtstromen 800,000 227,045 Elevated sandy soils
Zuiderzeeland 400,000 150,000 Clayey polders
Figure 2.2: Management area of selected regional water authorities in the Netherlands.
51
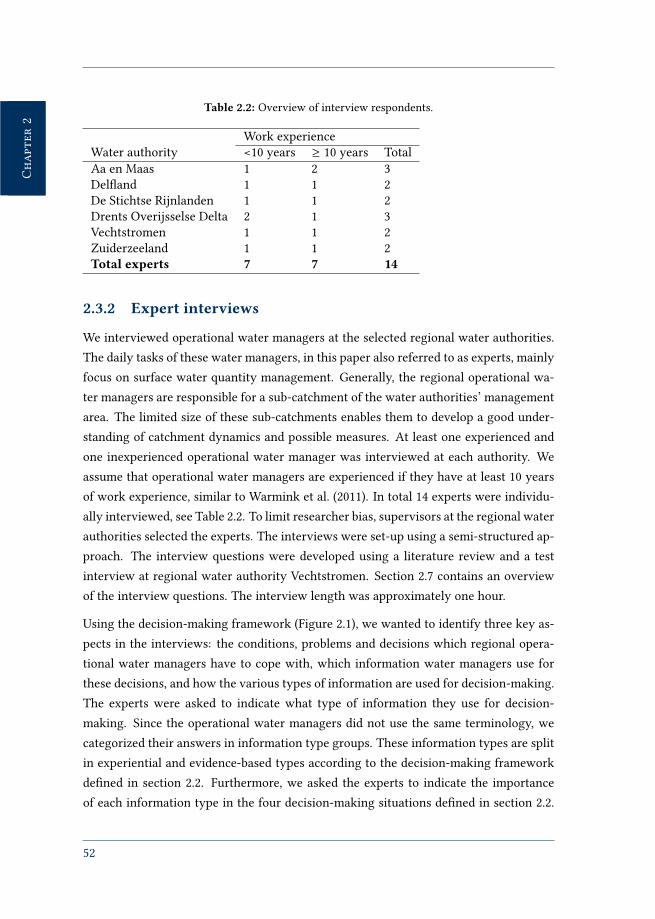
Chapter2
Chapter2
Table 2.2: Overview of interview respondents.
Work experience
Water authority <10 years ≥ 10 years Total
Aa en Maas 1 2 3
Del�and 1 1 2
De Stichtse Rijnlanden 1 1 2
Drents Overijsselse Delta 2 1 3
Vechtstromen 1 1 2
Zuiderzeeland 1 1 2
Total experts 7 7 14
2.3.2 Expert interviews
We interviewed operational water managers at the selected regional water authorities.
The daily tasks of these water managers, in this paper also referred to as experts, mainly
focus on surface water quantity management. Generally, the regional operational wa-
ter managers are responsible for a sub-catchment of the water authorities’ management
area. The limited size of these sub-catchments enables them to develop a good under-
standing of catchment dynamics and possible measures. At least one experienced and
one inexperienced operational water manager was interviewed at each authority. We
assume that operational water managers are experienced if they have at least 10 years
of work experience, similar to Warmink et al. (2011). In total 14 experts were individu-
ally interviewed, see Table 2.2. To limit researcher bias, supervisors at the regional water
authorities selected the experts. The interviews were set-up using a semi-structured ap-
proach. The interview questions were developed using a literature review and a test
interview at regional water authority Vechtstromen. Section 2.7 contains an overview
of the interview questions. The interview length was approximately one hour.
Using the decision-making framework (Figure 2.1), we wanted to identify three key as-
pects in the interviews: the conditions, problems and decisions which regional opera-
tional water managers have to cope with, which information water managers use for
these decisions, and how the various types of information are used for decision-making.
The experts were asked to indicate what type of information they use for decision-
making. Since the operational water managers did not use the same terminology, we
categorized their answers in information type groups. These information types are split
in experiential and evidence-based types according to the decision-making framework
de�ned in section 2.2. Furthermore, we asked the experts to indicate the importance
of each information type in the four decision-making situations de�ned in section 2.2.
52

Chapter2
Chapter2
The experts had to �ll in a Microsoft Excel spreadsheet. A pie chart was updated to
directly show the experts the result of their input. The experts were allowed to adapt
their input until the results visualized in the pie chart �tted their opinion. This method
enabled the experts to re�ect on their input. The results were used to study to what
extent the experts apply experiential and/or evidence-based information for decision-
making. Also, these results indicate whether the experts use all available information
for decision-making, or if they use the limited guidance or opinion-bases bypasses as
de�ned in the decision-making framework. Next, the experts were asked to elaborate
on their opinion of the current application of hydrological models for decision-making
in regional operational water management. They were encouraged to comment on both
positive and negative aspects of hydrological model application. This resulted in the
identi�cation of improvement points for both model developers and operational water
managers. Last, the interview ended with an open question about the information which
operational water managers are currently missing for decision-making. We tried to ac-
tivate experts to not only talk about possible technological developments, but also about
social, institutional, and other developments.
2.4 Results
2.4.1 Information types
Operational water managers use a broad spectrum of information types. We identi�ed
six information types which are typically applied. These types are listed in Table 2.3.
Firstly, water managers typically use measurement data such as precipitation, runo� in
streams, groundwater levels in wells, etc. Next, water managers can use system know-
ledge such as surface elevation, land use, and soil type. Furthermore, meteorological
Table 2.3: Identi�ed information types.
Information type Examples
Measurement data Monitoring of discharge and groundwater levels
System knowledge Surface elevation, land use and soil type data
Meteorological forecasts Precipitation and temperature forecasts
Experience Prior experiences with an encountered situation, such
as the lowering of a weir during wet conditions based
on intuition
Hydrological model (output) Assessment of di�erent water management scenarios
Legislation Water level decrees and other laws
53

Chapter2
Chapter2
forecasts of precipitation and temperature are valuable to make predictions of future
water system states. Also, operational water managers use their expertise and exper-
ience to take decisions. For example, a water manager can take a decision based on
prior experiences with an encountered problem. Such a decision can lead to the opinion-
based bypass (Figure 2.1). In addition, hydrological models are used for decision-making.
While the experts do not directly operate models, they often have access to hydrological
model output in a DSS. Hydrological models typically provide forecasts of hydrological
variables for a speci�c spatial domain, based on meteorological forecasts and other input
data. Last, operational water managers are bound to legislation and institutional policies.
For free-draining areas such as the more elevated sandy areas of Aa en Maas, De Stichtse
Rijnlanden, Drents Overijsselse Delta and Vechtstromen, water managers have to take
into account water level bounds that are pre-described in policy documents. However,
water managers are allowed to diverge from this pre-de�ned set in extreme situations.
Polder areas in the management area of De Stichtse Rijnlanden, Drents Overijsselse Delta
and Zuiderzeeland have much stricter de�ned water level rules which are described in
water level decrees. Water managers are not allowed to diverge from these decrees. The
bound and decrees are de�ned in cooperation with local stakeholders.
2.4.2 Importance of information types
Every expert agrees that they take decisions based on at least several information types.
Figure 2.3 shows the importance of each information type described in Section 2.4.1
in the four decision-making situations (Regular-Dry, Regular-Wet, Calamity-Dry, and
Calamity-Wet). The vertical axis in the �gure represents the importance of an informa-
tion type in each decision-making situation. The importance is de�ned as the contribu-
tion of an individual information type in a speci�c decision-making situation expressed
as a percentage. The error bars represent the sample spread by means of the unbiased
standard deviation. The variability between the experts is limited, indicating conformity
between expert opinions at di�erent regional water authorities.
Operational water managers depend in all decision-making situations mainly on meas-
urement data, system knowledge, meteorological forecasts, and experience. These in-
formation types contribute for more than eighty percent to decision-making. Hydrolo-
gical models and legislation each account for approximately three to eleven percent in
all decision-making situations. Experience is the most important information type in
every situation. Hydrological models form the least important information type, except
for the Calamity-Wet situation, for which legislation is least important.
54

Chapter2
Chapter2
Measurements System knowledge Meteo. forecasts Experience Hydrological models Legislation0
5
10
15
20
25
30Im
porta
nce [%
]Regular - DryRegular - WetCalamity - DryCalamity - Wet
Figure 2.3: Information types used by operational water managers in the four decision-making
situations. the error bars represent the unbiased standard deviation.
The importance of each information type slightly di�ers per decision-making situation.
Experience is the most import in all situations, especially in the Regular-Dry situation.
The importance of measurement data is similar in the Regular-Dry, Regular-Wet, and
Calamity-Dry situations. However, measurement data become slightly less important in
the Calamity-Wet situation. Contrarily, the experts attach less value to system know-
ledge in the Calamity-Dry situation than in the other situations. During dry calamities,
the experts state that groundwater level measurement data become more relevant rel-
ative to system knowledge. Next, while the importance of meteorological conditions is
similar in Calamity-Dry and Calamity-Wet situations, the importance in less in Regular-
Dry and Regular-Wet situations. The contribution of hydrological models is relatively
small, although models become more important in Calamity-Wet situations. The experts
indicate that in those situations models are applied for discharge forecasts. Striking is
the relatively small contribution of legislation. The experts see this information type as a
boundary condition rather than an information source for decision-making. Legislation
is least important in the Calamity-Wet situation, likely because the aim of water man-
agement is to get rid of as much water as possible in such a situation. Legislation tends
to become a more important information source in Regular-Dry situations, as the water
management aim then shift towards maintaining water level bounds and decrees.
55
Chapter2
Chapter2
2.4.3 Application of hydrological models
Figure 2.3 shows that hydrological models are less used for decision-making in regional
operational water management than other information types. Although most experts
see the potential of such tools, they give two reasons why hydrological models are lim-
itedly used. Firstly, the experts consider hydrological model output to be too inaccurate
and uncertain for their applications. Especially for local scale problems, model estim-
ates often do not comply with observations in their opinion. Secondly, several experts
have di�culties interpreting hydrological model output. The interpretation of such data
requires understanding of the processes on which the model is based. The experts of-
ten do not know on which assumptions, input data and forcing hydrological models are
based. Therefore, regional operational water managers tend to ignore model output for
decision-making.
2.4.4 Information needs
The experts suggested various improvements for the provision of information. We iden-
ti�ed three categories:
• Improved understanding of current water system conditions
The experts want access to up-to-date high-resolution spatial information about current
water system conditions. However, they struggle to get a system-wide understanding of
these conditions. For example, they �nd it hard to integrate measurement data to larger
spatial scales. Although the application of remote sensing data and hydrological models
is promising, such data are currently integrated insu�ciently in decision-making.
• Value-added products and triggers
Valuable information should be presented in an adequate way to water managers. Ac-
cording to the experts, information is not always presented to them in the way they
want to. For example, operational water managers are generally not directly interested
in groundwater level or soil moisture data; they rather want to know what the remaining
soil storage capacity is in a wet situation. Also, the experts sometimes have di�culties
interpreting the information provided.
• Tools for communication to stakeholders
Operational water managers have to be able to motivate their decisions to stakeholders.
However, the experts struggle with communicating their decisions to stakeholders like
nature conservation organizations, farmers, industry, etc. These stakeholders can have
56
Chapter2
Chapter2
limited knowledge of water management or fail to overlook the “big picture”. The pro-
vision of proper information should not only contribute to decision-making itself, but
should also play a role in convincing stakeholders to accept decisions.
2.5 Discussion
2.5.1 Experiential versus evidence-based decision-making
Based on the de�nition in Section 2.1, we classify measurement data, system knowledge,
meteorological forecasts, hydrological model output, and legislation as evidence-based
information. Experience is classi�ed as experiential information. Figure 2.3 shows that,
in their perception, experts depend for approximately 75% on evidence-based inform-
ation and for 25% on experiential information. So, while Boogerd et al. (1997) stated
that regional water management in the Netherlands should increase the integration of
evidence-based information, this study shows that operational water management at
the selected regional water management authorities is based on both experiential and
evidence-based information.
Regional operational water managers considerably depend on experiential information
for decision-making. Since there is often no structured way to process the available
evidence-based information, the interpretation and expertise of operational water man-
agers remain important for decision-making. Because the hydrological system includes
many inherent uncertainties, decision-making will probably always partly depend on ex-
periential information. It is important to note that the interpretation of evidence-based
information can di�er per water manager.
One could argue that during regular conditions, operational water management func-
tions su�ciently using the currently applied information. However, the application of
experiential information may lead to the opinion-based bypass (Figure 2.1) and con-
sequently to sub-optimal decisions. Water managers are not able to validate the e�ect-
iveness of measures beforehand. Furthermore, if their decision has the desired e�ect,
no incentive will exist to check whether the decision could be optimized. In addition,
the lack of evidence limits posterior evaluation of experiential-based decisions. Finally,
experiential information is limited to individual operational water managers. This in-
formation will be lost if these managers stop working at the regional water authority.
So, there is a need to capture tacit knowledge as evidence-based information.
Therefore, e�orts should continue to integrate evidence-based with experiential inform-
57

Chapter2
Chapter2
ation for decision-making in regional operational water management in the Netherlands.
Similar advice is given for water management in e.g. Japan (Nakanishi and Black, 2018),
South Africa and Canada, (Wolfe, 2009) and South Korea (Nam and Choi, 2014). Special
focus should be given to the development of structured methodologies for interpreting
evidence-based information. The continuing integration of hydrological models in DSSs
is suitable for structured decision-making and should therefore be encouraged.
2.5.2 Application of hydrological models for operational watermanagement
The results indicate that the importance of hydrological models for decision-making in
regional operational water management is substantially smaller than other evidence-
based information types. However, we consider hydrological models as suitable tools
which can help improving the three aspects identi�ed in Section 2.4.4. Firstly, hydrolo-
gical models can provide up-to-date high-resolution spatial information about current
water system conditions (Wood et al., 2011). Secondly, spatial information from hydro-
logical models can be used to retrieve value-added products interpretable for operational
water managers (Guswa et al., 2014; Kurtz et al., 2017). Thirdly, hydrological models are
suitable tools for deriving information in the form of indicators, which can be used in
the communication with stakeholders (Eden et al., 2016; Hanington et al., 2017).
Unfortunately, a gap exists between what hydrological model developers think models
should provide and what decision-makers demand from models. This gap has both a
social and a technical aspect (Leskens et al., 2014). The social gap concerns the fact that
model users do not see models as determinant tools for decision-making. Figure 2.3 in-
dicates that the experts consider hydrological models less important than other inform-
ation types. Decision-makers simply do not have the means or knowledge to investigate
all possible measures. This is represented as the limited guidance bypass in the decision-
making framework. Also, Section 2.4.3 discusses that the experts often do not have suf-
�cient knowledge to apply hydrological model output in decision-making. Therefore,
one should not underestimate the need to su�ciently educate decision-makers and other
stakeholders on the use and understanding of hydrological model output.
The technical gap relates to the discrepancy between the information deliverd by hy-
drological models and the information decision-makers need. The experts think that
model output generally contains large uncertainties and therefore hydrological models
are inaccurate and unreliable. Although hydrological models should indeed not be seen
58

Chapter2
Chapter2
as perfect representations of reality, they can be applied to identify and quantify uncer-
tainties concerning water management decisions (Refsgaard et al., 2007; Todini, 2007;
Warmink et al., 2010).
Furthermore, the experts indicate that they have a need for a better representation of
information. Focusing on hydrological models, they state that model output is often
di�cult to comprehend for implementation in water management. Several studies a�rm
this statement. Colosimo and Kim (2016) state that decision-makers do not have the
time needed to review which information is available and needed for decision-making,
while Leskens et al. (2014) found that decision-makers tend to discard information which
seems to increase the complexity they already have to deal with. Hanger et al. (2013)
found that decision-makers generally do not have a lack of information, but a need for
better �ltered and accessible information. Therefore, scientists who wish to aid decision-
making must generally not o�er scienti�c knowledge, but rather develop information
that clearly applies to speci�c decision–making settings (Maiello et al., 2015).
One way of properly representing evidence-based information is the selection of suit-
able indicators. Indicators help operational water managers to retrieve system-wide in-
formation on historical, current and future time scales. Indicators have already been
developed for water resources management (Ioris et al., 2008; Juwana et al., 2012), river
management (Richter et al., 1996, 1997; De Girolamo et al., 2017), coastal zone manage-
ment (Diedrich et al., 2010), climate change adaptation (Hanger et al., 2013; Spiller, 2016),
ecosystem management (Guswa et al., 2014), forest management (Carvalho-Santos et al.,
2014), hydropower management (Kumar and Katoch, 2014), urban water system man-
agement (Dizdaroglu, 2015; Spiller, 2016), and agricultural management (Wang et al.,
2015). If suitable indicators are selected, model output can be made more understand-
able for operational water management. Furthermore, easy-to-interpret model output
can be used for communication with stakeholders. Future studies should focus on the
validation of suitable indicators for regional operational water management.
2.6 Conclusion
Regional operational water management in the Netherlands depends on both experi-
ential and evidence-based information for decision-making. We identi�ed by means of
interviews with regional operational water managers that these experts typically use six
information types for decision-making. Measurement data, system knowledge, meteor-
ological forecasts, hydrological models, and legislation are evidence-based information
59

Chapter2
Chapter2
types, while the experience of water managers is experiential information. While the
experts largely depend on evidence-based information for decision-making, the experts
also depend considerably on experiential information. This may lead to opinion-based
bypasses and subsequently to sub-optimal decisions. Operational water managers can
improve the decision-making process by continuing e�orts to integrate evidence-based
information in structured methodologies.
Regional operational water managers depend signi�cantly less on hydrological models
than other evidence-based information types for decision-making. Although hydrolo-
gical models can help in improving the understanding of historic, current, and future wa-
ter system conditions, can help in deriving interpretable information, and can be used
as tools for communication with stakeholders, hydrological models are considered as
unreliable for decision-making. Also, operational water managers often have limited
knowledge to correctly interpret hydrological model output. We have proposed several
means to overcome these issues, for example by increasing e�orts to educate decision-
makers and other stakeholders, and the selection of suitable indicators for evidence-
based decision-making.
Acknowledgments
This work is part of the OWAS1S research programme (Optimizing Water Availability
with Sentinel-1 Satellites) with project number 13871, which is partly �nanced by the
Netherlands Organisation for Scienti�c Research (NWO). We want to thank all OWAS1S
programme partners for their contributions. Furthermore, we want to thank all experts
for their cooperation and time. Finally, we want to thank the various contact persons at
the regional water authorities for arranging the interviews.
2.7 Appendix A
This appendix shows the questions of the semi-structured interviews performed in this
chapter.
1. Do you wish to remain anonymous?
2. What is your function at the regional water authority?
3. How long are you working as [function] at the regional water authority?
4. What are the problems which you have to deal with?
60

Chapter2
Chapter2
5. What are the decisions which you have to make?
6. Who else is involved in taking these decisions?
7. Which information do you use in decision-making?
8. Why do you use this information for decision-making?
9. What do you think of the application of hydrological models in regional opera-
tional water management?
10. Which information do you want to have for decision-making?
61

CHAPTER 3
State updating of root zone soil
moisture estimates of an
unsaturated zone metamodel for
operational water resources
management
This chapter is published as:
Pezij, M., Augustijn, D.C.M., Hendriks, D.M.D., Weerts, A.H., Hummel, S., Van der Velde, R., Hulscher, S.J.M.H.
(2019) State updating of root zone soil moisture estimates of an unsaturated zone metamodel for operational
water resources management. Journal of Hydrology X 4, 100040, doi:10.1016/j.hydroa.2019.100040.
63
Chapter3
Chapter3
Abstract
Combining metamodels with data assimilation schemes allows the incorporation of up-
to-date information in metamodels, o�ering new opportunities for operational water
resources management. We developed a data assimilation scheme for the unsaturated
zone metamodel MetaSWAP using OpenDA, which is an open-source data assimilation
framework. A twin experiment showed the feasibility of applying an Ensemble Kalman
Filter as a data assimilation method for updating metamodels. Furthermore, we assessed
the accuracy of root zone soil moisture model estimates when assimilating the regional
SMAP L3 Enhanced surface soil moisture product. The model accuracy is assessed using
in situ soil moisture measurements collected at 12 locations in the Twente region, the
Netherlands. Although the accuracy of the model estimates does not improve in terms
of correlation coe�cient, the accuracy does improve in terms of Root Mean Square Er-
ror and bias. Therefore, the assimilation of surface soil moisture observations has value
for updating root zone soil moisture model estimates. In addition, the accuracy of the
model estimates improves on both regional and local spatial scales. The increasing avail-
ability of remotely sensed soil moisture data will lead to new possibilities for integrating
metamodelling and data assimilation in operational water resources management. How-
ever, we expect that signi�cant investments in computational capacities are necessary
for e�ective implementation in decision-making.
3.1 Introduction
The application of integrated physically-based hydrological models is increasing in wa-
ter resources management (Guswa et al., 2014; Kurtz et al., 2017). Such modelling tools
are used for water resources management on various spatial and temporal scales. Wa-
ter managers can use model output for decision-making while taking into account un-
certainties of, among others, input data, boundary and initial conditions, and model
structure (Beven and Alcock, 2012). To reduce the uncertainties inherent to integrated
physically-based hydrological modelling, data assimilation schemes are often applied
(Liu et al., 2012; Weerts et al., 2014). Data assimilation aims to �nd an optimal combin-
ation of merging hydrological model state estimates with observations. Several studies
have shown the value of data assimilation schemes for integrated surface-subsurface
modelling (Camporese et al., 2009a,b; Zhang et al., 2016; Botto et al., 2018; Zhao and
Yang, 2018), some speci�cally focusing on operational applications (Hendricks Franssen
et al., 2011; De Rosnay et al., 2013; Kurtz et al., 2017; He et al., 2019).
64
Chapter3
Chapter3
Combining integrated physically-based modelling with data assimilation schemes often
need considerable computational capacities, which limit the application of data assim-
ilation schemes in operational water resources management. Several studies propose
metamodelling as a tool to signi�cantly decrease computation times (Van Walsum and
Groenendijk, 2008; Ratto et al., 2012; Razavi et al., 2012; Fraser et al., 2013; Berends et al.,
2018). Haberlandt (2010) de�nes a metamodel as “a substitute for a complex simula-
tion model consisting of simpli�ed, but often non-linear and dynamic relationships.
Metamodels can be trained using results from simulation experiments with available
process models, expert knowledge and observations if available”. The decrease in com-
putational time is a trade-o�, since metamodels generally have lower accuracies than
the models from which they are derived (Fraser et al., 2013). Metamodels are usually
based on models which are calibrated using training datasets. Such datasets consist of
a speci�c period of hydrological observations. Since physically-based models typically
include parameters which are di�cult to obtain for large spatial domains (Yilmaz et al.,
2010), calibration is an important aspect of hydrological model development (Beven and
Binley, 1992). However, it is practically impossible to monitor hydrological variables
in situ on catchment scales due to time and budget constraints. Remote sensing data
provide a means for monitoring across large spatial domains.
A recent development is the emergence of high-resolution satellite-based surface soil
moisture observations (Petropoulos et al., 2015; Balsamo et al., 2018). Soil moisture is
a key variable in integrated hydrological modelling, since the unsaturated zone relates
atmospheric, land surface and subsurface processes (Brocca et al., 2017). Satellite-based
soil moisture products provide valuable information for hydrological models if they are
used in combination with data assimilation schemes (Houser et al., 1998; Moradkhani,
2008; Reichle, 2008; Liu et al., 2012). Several studies investigated the applicability of
remotely sensed soil moisture data for data assimilation by using data products from
satellites such as AMSR-E (Sahoo et al., 2013; Wanders et al., 2014a,b), ASCAT (Gruber
et al., 2015; Loizu et al., 2018), SMOS (Lievens et al., 2015; Srivastava et al., 2015), H-SAF
(Laiolo et al., 2015), SMAP (Koster et al., 2018; Blyverket et al., 2019), a combination of
AMSR-2 and SMOS (Gevaert et al., 2018) and a combination of Sentinel-1 and SMAP
(Lievens et al., 2017).
Ratto et al. (2012) state that integrating metamodelling with data assimilation schemes
could signi�cantly contribute to the operational use of metamodels and remotely sensed
soil moisture products for decision-making in operational water resources management.
In this study, we use the Netherlands Hydrological Instrument (NHI), a tool used for
65
Chapter3
Chapter3
decision-making in operational water resources management in the Netherlands. NHI
is an integrated physically-based modelling framework developed for hydrological sim-
ulations on several spatial scales (De Lange et al., 2014). A few studies focus on the com-
bination of the unsaturated zone metamodel MetaSWAP as part of NHI and the assim-
ilation of actual evapotranspiration estimates (Schuurmans et al., 2011; Hartanto et al.,
2017), however not on assimilating soil moisture observations. The goal of this study
is to evaluate the applicability of a data assimilation scheme for updating root zone soil
moisture estimates of a metamodel using a regional surface soil moisture product based
on SMAP satellite data (Chan et al., 2018). The main research question is: to what extent
can we increase the accuracy of root zone soil moisture estimates of a metamodel by
assimilating satellite-based regional surface soil moisture observations?
Section 3.2 gives a description of the data assimilation framework, the metamodel, the
data, and the research methodology. Results are shown in section 3.3 and discussed in
section 3.4. Conclusions are drawn in section 3.5. A list of abbreviations can be found in
section 3.6. Finally, the data assimilation theory is found in section 3.7.
3.2 Methodology
3.2.1 Data assimilation framework
We apply a sequential data assimilation scheme that applies statistical uncertainty meas-
ures for assigning weights to both model estimates and observations. Sequential data
assimilation improves the accuracy of model estimates in two ways. Firstly, these meth-
ods update model states, which lead to more accurate model estimates at the update
step. Secondly, the updated model state estimates are used as input for the next mod-
elling time step, which reduces model error propagation. Sequential data assimilation
schemes require calculation of the model mean state - and corresponding model state
error covariance matrix % . Due to the size of % in hydrological model calculations, it
is generally not feasible to explicitly calculate % . An alternative approach is the En-
semble Kalman Filter (EnKF), which is a sequential data assimilation scheme suitable
for high-dimensional systems (Evensen, 1994). The EnKF is a Monte Carlo implement-
ation of Kalman �ltering for non-linear problems. The EnKF uses a sample of evolved
model states to estimate the covariance matrix % . This ensemble of model runs is cre-
ated by perturbing model forcing, parameters and/or states. The model perturbations
should represent total model uncertainty and require the development of an error model.
Among others, Reichle et al. (2002) and Crow and Wood (2003) showed the potential of
66

Chapter3
Chapter3
applying an EnKF in soil moisture modelling. We refer to 3.7 for a description of EnKF
data assimilation theory.
We implemented an EnKF scheme using OpenDA, which is an open-source framework
for implementing data assimilation schemes in hydrological modelling (www.openda.org). Applications of OpenDA can be found in Ridler et al. (2014) and Van Velzen
et al. (2016). OpenDA is a relatively easy-to-implement solution for coupling hydro-
logical models and data assimilation schemes. We coupled this framework with the
unsaturated zone metamodel MetaSWAP (described in section 3.2.2) by means of the
OpenDA black-box wrapper. Implementation of the black-box wrapper does not require
changes in model code and allows for reading and editing of model input and output
�les. The source code of OpenDA, including the MetaSWAP black-box wrapper, is freely
accessible at: https://github.com/OpenDA-Association/OpenDA. For
the remainder of this chapter, we refer to this coupling as MetaSWAP-OpenDA.
3.2.2 Model description
The NHI modelling framework consists of coupled hydrological models for unsaturated
�ow, saturated �ow, and surface water �ow and distribution (De Lange et al., 2014). Fig-
ure 3.1 shows a schematic overview of the models and the coupling between them. The
models are coupled in a modular way, which means that individual models can run in-
dependently. In this research, we use the subsurface part of the Landelijk Hydrologisch
Model (LHM), which is the Dutch national application of NHI. The subsurface part con-
sists of two coupled hydrological models: the metamodel MetaSWAP (Van Walsum and
Groenendijk, 2008) represents unsaturated zone dynamics and MODFLOW-2005 (Har-
baugh et al., 2017) represents saturated zone dynamics. The subsurface part of LHM is
schematized on a rectangular grid with a spatial resolution of 250 < by 250 < and a
simulation time step of one day.
MetaSWAP
The Soil-Vegetation-Atmosphere-Transfer (SVAT) model MetaSWAP computes the ver-
tical transfer of water in a one-dimensional column between the atmosphere and the
saturated zone (Van Walsum and Groenendijk, 2008). MetaSWAP is a metamodel based
on the open-source SWAP model (Van Dam et al., 2008). SWAP solves unsaturated soil
water �ow on �eld scales by applying the Richards equation. MetaSWAP applies a sim-
pli�ed approach in which the one-dimensional partial di�erential Richards equation is
replaced by two ordinary di�erential equations: an equation for vertical variations as-
67

Chapter3
Chapter3
Figure 3.1: Software codes covering the various hydrological domains within the Netherlands
Hydrological Instrument (NHI) (De Lange et al., 2014). The red dashed box indicates the subsurface
part applied in this study.
suming steady state �ow and an equation accounting for variations in time. Steady state
solutions are stored in a database of pre-computed soil saturation pro�les at discrete
intervals of soil moisture conditions and groundwater depths. The unsaturated zone is
discretized into up to 18 vertical aggregation boxes, starting with the root zone and end-
ing with a box extending into the saturated zone. These boxes are linked as reservoirs.
The soil saturation degree of each box is retrieved from the pre-computed database dur-
ing each time step.
MetaSWAP needs several spatial datasets as input. The Actueel Hoogtebestand Neder-
land (AHN) is used as a digital elevation model (Actueel Hoogtebestand Nederland,
2019). The Landelijk Grondgebruik Nederland (LGN) dataset supplies land cover data
(Hazeu, 2014). Precipitation and Makkink reference evapotranspiration rasters obtained
from KNMI data are used as model forcing (KNMI, 2018b,a). The BOFEK2012 dataset sup-
plies soil physical parameters for 72 soil units in the Netherlands (Wösten et al., 2013).
Van Walsum and Van der Bolt (2013) veri�ed the MetaSWAP meta-approach for these
soil units by comparing transpiration output of MetaSWAP with transpiration output of
the SWAP model. The meta-approach leads to faster calculation times in comparison
with SWAP, while the transpiration output of MetaSWAP did not deviate more than 5%
68

Chapter3
Chapter3
from the SWAP output.
The metamodelling concept of MetaSWAP has implications for applying data assimila-
tion procedures. Firstly, vegetation dynamics are parametrized using a pre-de�ned root
zone depth growth pattern. As the root zone depth varies in the growing season, also
the depth of the �rst aggregation box of MetaSWAP varies. Data assimilation results
are therefore only comparable for periods with similar root zone depths, like summer
or winter periods. Secondly, the data assimilation procedure requires a model restart
after each update step. The use of a single precision format in the model restart �les in-
troduces small di�erences in the restarted model run (Van Walsum, 2017). Section 3.4.1
discusses the e�ect of the model restart on model accuracy.
MODFLOW
MODFLOW-2005 is a software package for simulating 3D groundwater �ow (Harbaugh
et al., 2017). The schematization of MODFLOW in LHM consists of seven layers. These
seven aquifers and aquitards represent the hydrogeological layers distinguished in the
Dutch national hydrogeological database REGIS (De Lange et al., 2014). MODFLOW
is coupled to MetaSWAP using a shared state variable (Van Walsum and Veldhuizen,
2011), phreatic groundwater head for MODFLOW and groundwater level for MetaSWAP
respectively. During each time step, groundwater levels are determined by iteration of
MODFLOW and MetaSWAP. The iteration stops when the di�erence in groundwater
head of MODFLOW and MetaSWAP is within a pre-de�ned limit.
Data assimilation for MetaSWAP-MODFLOWmodels
The potential of data assimilation for coupled MetaSWAP-MODFLOW models has been
studied before. Schuurmans et al. (2011) assimilated satellite-based actual evapotranspir-
ation data using a constant gain Kalman �lter to update actual evapotranspiration model
estimates. Furthermore, Hartanto et al. (2017) used satellite-based actual evapotranspir-
ation data in combination with a Particle Filter to improve discharge simulations. Due
to the availability of high-resolution soil moisture observations, we extend the �ndings
of Schuurmans et al. (2011) and Hartanto et al. (2017) by assessing the applicability of
soil moisture observations to update soil moisture states of MetaSWAP.
In the aforementioned studies, the MetaSWAP grid was scaled with a single factor per
time step, therefore not accounting for the spatial distribution of the observations. The
OpenDA framework enables assimilation of multiple observations at various locations.
69
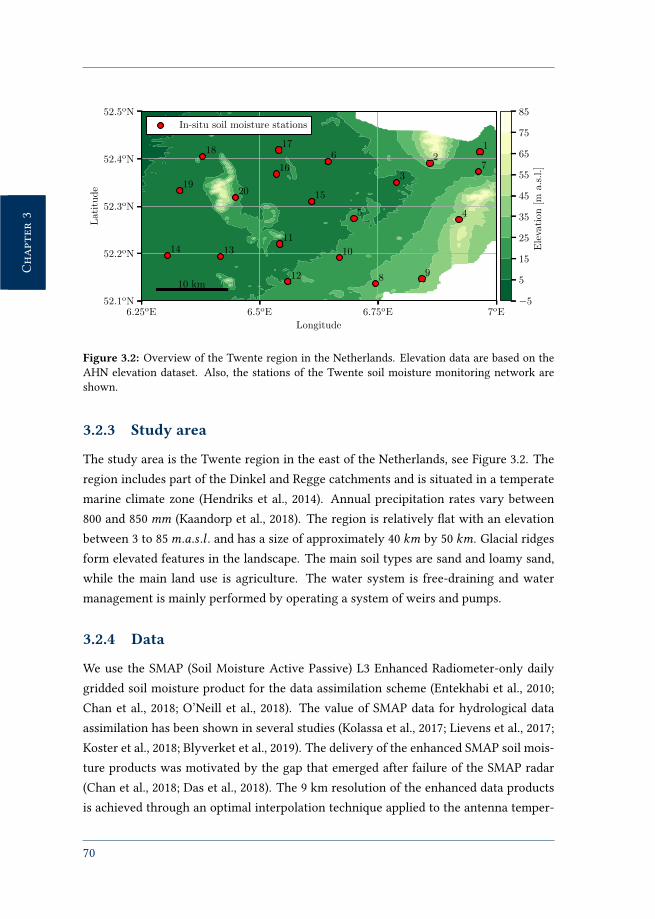
Chapter3
Chapter3
6.25oE 6.5oE 6.75oE 7oE
Longitude
52.1oN
52.2oN
52.3oN
52.4oN
52.5oN
Latitu
de
12
3
45
7
8 9
11
12
1314
15
16
1718
1920
10
6
10 km
In-situ soil moisture stations
−5
5
15
25
35
45
55
65
75
85
Ele
vation
[ma.s
.l.]
Figure 3.2: Overview of the Twente region in the Netherlands. Elevation data are based on the
AHN elevation dataset. Also, the stations of the Twente soil moisture monitoring network are
shown.
3.2.3 Study area
The study area is the Twente region in the east of the Netherlands, see Figure 3.2. The
region includes part of the Dinkel and Regge catchments and is situated in a temperate
marine climate zone (Hendriks et al., 2014). Annual precipitation rates vary between
800 and 850 << (Kaandorp et al., 2018). The region is relatively �at with an elevation
between 3 to 85<.0.B.; . and has a size of approximately 40 :< by 50 :<. Glacial ridges
form elevated features in the landscape. The main soil types are sand and loamy sand,
while the main land use is agriculture. The water system is free-draining and water
management is mainly performed by operating a system of weirs and pumps.
3.2.4 Data
We use the SMAP (Soil Moisture Active Passive) L3 Enhanced Radiometer-only daily
gridded soil moisture product for the data assimilation scheme (Entekhabi et al., 2010;
Chan et al., 2018; O’Neill et al., 2018). The value of SMAP data for hydrological data
assimilation has been shown in several studies (Kolassa et al., 2017; Lievens et al., 2017;
Koster et al., 2018; Blyverket et al., 2019). The delivery of the enhanced SMAP soil mois-
ture products was motivated by the gap that emerged after failure of the SMAP radar
(Chan et al., 2018; Das et al., 2018). The 9 km resolution of the enhanced data products
is achieved through an optimal interpolation technique applied to the antenna temper-
70
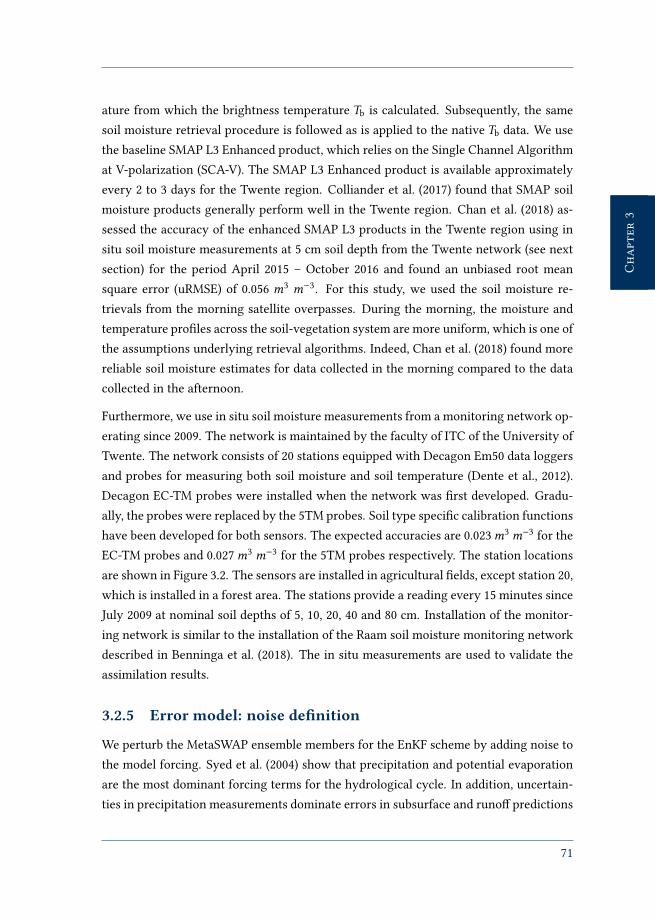
Chapter3
Chapter3
ature from which the brightness temperature )b is calculated. Subsequently, the same
soil moisture retrieval procedure is followed as is applied to the native )b data. We use
the baseline SMAP L3 Enhanced product, which relies on the Single Channel Algorithm
at V-polarization (SCA-V). The SMAP L3 Enhanced product is available approximately
every 2 to 3 days for the Twente region. Colliander et al. (2017) found that SMAP soil
moisture products generally perform well in the Twente region. Chan et al. (2018) as-
sessed the accuracy of the enhanced SMAP L3 products in the Twente region using in
situ soil moisture measurements at 5 cm soil depth from the Twente network (see next
section) for the period April 2015 – October 2016 and found an unbiased root mean
square error (uRMSE) of 0.056 <3 <−3. For this study, we used the soil moisture re-
trievals from the morning satellite overpasses. During the morning, the moisture and
temperature pro�les across the soil-vegetation system are more uniform, which is one of
the assumptions underlying retrieval algorithms. Indeed, Chan et al. (2018) found more
reliable soil moisture estimates for data collected in the morning compared to the data
collected in the afternoon.
Furthermore, we use in situ soil moisture measurements from a monitoring network op-
erating since 2009. The network is maintained by the faculty of ITC of the University of
Twente. The network consists of 20 stations equipped with Decagon Em50 data loggers
and probes for measuring both soil moisture and soil temperature (Dente et al., 2012).
Decagon EC-TM probes were installed when the network was �rst developed. Gradu-
ally, the probes were replaced by the 5TM probes. Soil type speci�c calibration functions
have been developed for both sensors. The expected accuracies are 0.023<3<−3 for the
EC-TM probes and 0.027<3 <−3 for the 5TM probes respectively. The station locations
are shown in Figure 3.2. The sensors are installed in agricultural �elds, except station 20,
which is installed in a forest area. The stations provide a reading every 15 minutes since
July 2009 at nominal soil depths of 5, 10, 20, 40 and 80 cm. Installation of the monitor-
ing network is similar to the installation of the Raam soil moisture monitoring network
described in Benninga et al. (2018). The in situ measurements are used to validate the
assimilation results.
3.2.5 Error model: noise de�nition
We perturb the MetaSWAP ensemble members for the EnKF scheme by adding noise to
the model forcing. Syed et al. (2004) show that precipitation and potential evaporation
are the most dominant forcing terms for the hydrological cycle. In addition, uncertain-
ties in precipitation measurements dominate errors in subsurface and runo� predictions
71
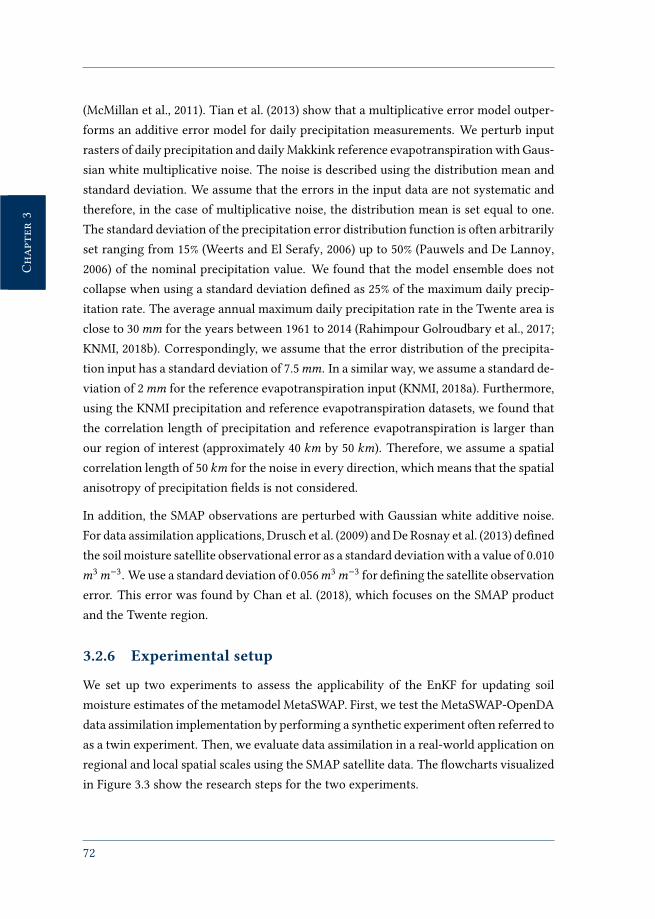
Chapter3
Chapter3
(McMillan et al., 2011). Tian et al. (2013) show that a multiplicative error model outper-
forms an additive error model for daily precipitation measurements. We perturb input
rasters of daily precipitation and daily Makkink reference evapotranspiration with Gaus-
sian white multiplicative noise. The noise is described using the distribution mean and
standard deviation. We assume that the errors in the input data are not systematic and
therefore, in the case of multiplicative noise, the distribution mean is set equal to one.
The standard deviation of the precipitation error distribution function is often arbitrarily
set ranging from 15% (Weerts and El Serafy, 2006) up to 50% (Pauwels and De Lannoy,
2006) of the nominal precipitation value. We found that the model ensemble does not
collapse when using a standard deviation de�ned as 25% of the maximum daily precip-
itation rate. The average annual maximum daily precipitation rate in the Twente area is
close to 30<< for the years between 1961 to 2014 (Rahimpour Golroudbary et al., 2017;
KNMI, 2018b). Correspondingly, we assume that the error distribution of the precipita-
tion input has a standard deviation of 7.5<<. In a similar way, we assume a standard de-
viation of 2<< for the reference evapotranspiration input (KNMI, 2018a). Furthermore,
using the KNMI precipitation and reference evapotranspiration datasets, we found that
the correlation length of precipitation and reference evapotranspiration is larger than
our region of interest (approximately 40 :< by 50 :<). Therefore, we assume a spatial
correlation length of 50 :< for the noise in every direction, which means that the spatial
anisotropy of precipitation �elds is not considered.
In addition, the SMAP observations are perturbed with Gaussian white additive noise.
For data assimilation applications, Drusch et al. (2009) and De Rosnay et al. (2013) de�ned
the soil moisture satellite observational error as a standard deviation with a value of 0.010
<3<−3. We use a standard deviation of 0.056<3<−3 for de�ning the satellite observation
error. This error was found by Chan et al. (2018), which focuses on the SMAP product
and the Twente region.
3.2.6 Experimental setup
We set up two experiments to assess the applicability of the EnKF for updating soil
moisture estimates of the metamodel MetaSWAP. First, we test the MetaSWAP-OpenDA
data assimilation implementation by performing a synthetic experiment often referred to
as a twin experiment. Then, we evaluate data assimilation in a real-world application on
regional and local spatial scales using the SMAP satellite data. The �owcharts visualized
in Figure 3.3 show the research steps for the two experiments.
72
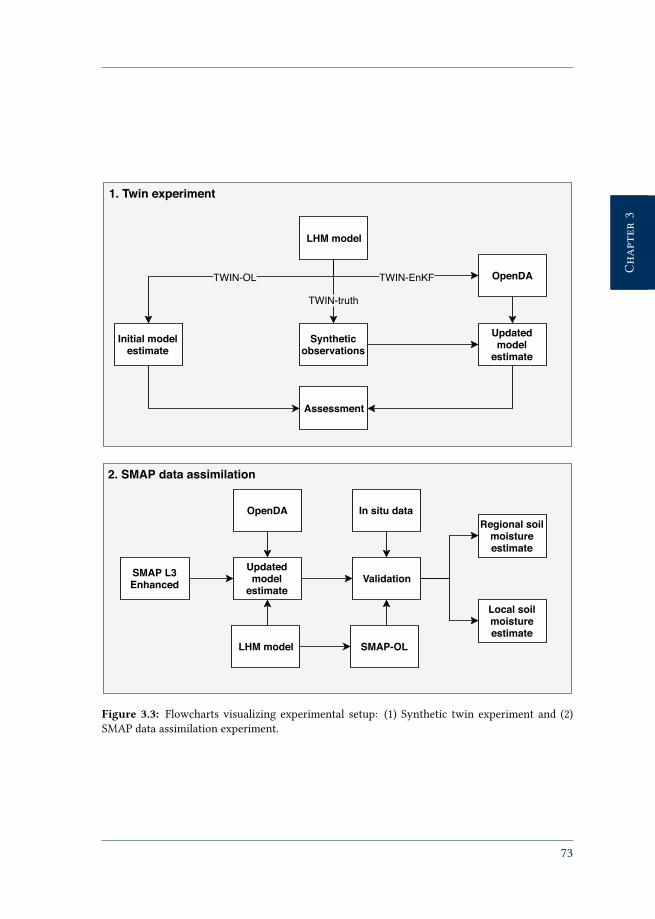
Chapter3
Chapter3
1. Twin experiment
2. SMAP data assimilation
TWIN-truth
TWIN-OL TWIN-EnKF
LHM model
Syntheticobservations
Initial modelestimate
Updatedmodel
estimate
OpenDA
Assessment
LHM model
OpenDARegional soil
moistureestimate
SMAP L3Enhanced
In situ data
Updatedmodel
estimate
Local soilmoistureestimate
Validation
SMAP-OL
Figure 3.3: Flowcharts visualizing experimental setup: (1) Synthetic twin experiment and (2)
SMAP data assimilation experiment.
73
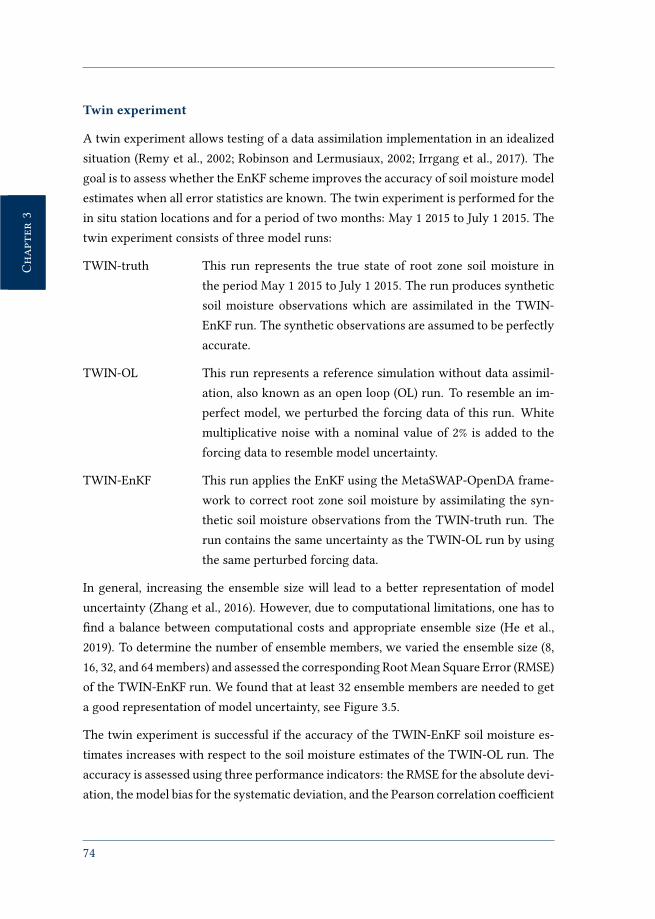
Chapter3
Chapter3
Twin experiment
A twin experiment allows testing of a data assimilation implementation in an idealized
situation (Remy et al., 2002; Robinson and Lermusiaux, 2002; Irrgang et al., 2017). The
goal is to assess whether the EnKF scheme improves the accuracy of soil moisture model
estimates when all error statistics are known. The twin experiment is performed for the
in situ station locations and for a period of two months: May 1 2015 to July 1 2015. The
twin experiment consists of three model runs:
TWIN-truth This run represents the true state of root zone soil moisture in
the period May 1 2015 to July 1 2015. The run produces synthetic
soil moisture observations which are assimilated in the TWIN-
EnKF run. The synthetic observations are assumed to be perfectly
accurate.
TWIN-OL This run represents a reference simulation without data assimil-
ation, also known as an open loop (OL) run. To resemble an im-
perfect model, we perturbed the forcing data of this run. White
multiplicative noise with a nominal value of 2% is added to the
forcing data to resemble model uncertainty.
TWIN-EnKF This run applies the EnKF using the MetaSWAP-OpenDA frame-
work to correct root zone soil moisture by assimilating the syn-
thetic soil moisture observations from the TWIN-truth run. The
run contains the same uncertainty as the TWIN-OL run by using
the same perturbed forcing data.
In general, increasing the ensemble size will lead to a better representation of model
uncertainty (Zhang et al., 2016). However, due to computational limitations, one has to
�nd a balance between computational costs and appropriate ensemble size (He et al.,
2019). To determine the number of ensemble members, we varied the ensemble size (8,
16, 32, and 64 members) and assessed the corresponding Root Mean Square Error (RMSE)
of the TWIN-EnKF run. We found that at least 32 ensemble members are needed to get
a good representation of model uncertainty, see Figure 3.5.
The twin experiment is successful if the accuracy of the TWIN-EnKF soil moisture es-
timates increases with respect to the soil moisture estimates of the TWIN-OL run. The
accuracy is assessed using three performance indicators: the RMSE for the absolute devi-
ation, the model bias for the systematic deviation, and the Pearson correlation coe�cient
74

Chapter3
Chapter3
A for the dynamics. The RMSE is de�ned as:
'"(� =
√√√√ #∑8=1
(\obs
8− \pred
8
)2
#, (3.1)
in which \obs
8 are the observed soil moisture estimates (in this case the synthetic obser-
vations from the TWIN-truth run), \pred
8are the predicted soil moisture estimates (from
the TWIN-OL and TWIN-EnKF runs), and # is the number of observations. The closer
the RMSE is to zero, the more accurate the model predictions are.
Next, the model bias is de�ned as:
�80B =
#∑8=1
(\obs
8 − \pred
8
)#
. (3.2)
Again, the closer the bias is to zero, the less biased the model predictions are.
Last, the Pearson correlation coe�cient A is de�ned as:
A =
#∑8=1
(\obs − \obs
) (\pred − \pred
)√
#∑8=1
(\obs − \obs
)2
√#∑8=1
(\pred − \pred
)2
(3.3)
in which \obsand \pred
are the averaged observed and predicted soil moisture estimates.
The correlation coe�cient A can range between -1 and 1. A value of 1 (-1) indicates a
perfect positive (negative) linear relationship between \obsand \pred
.
Assimilation of SMAP observations
Next, we performed an EnKF data assimilation run with the SMAP L3 Enhanced observa-
tions. An EnKF run is performed for the full year 2016 to capture soil moisture variability
in both wet and dry periods. 32 ensemble members are used to resemble model uncer-
tainty. The ensemble members are initialized with a spin-up period between January 1
2014 and January 1 2016. Furthermore, a deterministic model run without data assimila-
tion is performed. We refer to this run as SMAP-OL to distinguish between this run and
the TWIN-OL run. The updated soil moisture model estimates and the open loop run are
75

Chapter3
Chapter3
validated by evaluating the RMSE, model bias, and correlation coe�cient A performance
indicators using the in situ soil moisture measurements. The in situ measurements are
daily averaged.
Both satellite soil moisture and in situ soil moisture observations are inherently di�erent
with respect to each other. In situ soil moisture measurements contain signi�cant uncer-
tainties related to accuracy, precision, and spatial support (Susha Lekshmi et al., 2014).
These uncertainties limit validation possibilities on local scales. Upscaling in situ meas-
urements to regional averages reduce sampling errors (Cosh et al., 2006; Crow et al.,
2012; Zhao and Yang, 2018). Therefore, we evaluate the results on both regional and
local spatial scales. A typical regional scale is the management area of a regional water
authority, which is approximately the size of the study area. We de�ne �eld scale as a
typical local scale, which is resembled by individual soil moisture monitoring stations.
First, the regional scale applicability of the SMAP L3 Enhanced product for data assimil-
ation is assessed by evaluating the performance indicators for both the in situ data and
the model estimates. The in situ data and model estimates are spatially averaged. We
refer to these results as SMAP-EnKF-AVG. The following twelve stations have a com-
plete data series for the year 2016 and are used for the averaging: 1, 2, 4, 7, 9, 12, 13, 15,
17, 18, 19, 20. The locations are shown in Figure 3.2. Then, the local scale applicability
of the SMAP L3 Enhanced product is assessed by evaluating the performance indicators
for the same stations used for the regional averaging.
As described in section 3.2.2, data assimilation results using the MetaSWAP-model are
only comparable for periods with similar root zone depths. Therefore, we split the year
2016 in a summer and winter period. The length of the summer period depends on the
parametrized vegetation type. The root zone depth of the grass vegetation type varies
between 0.20< in winter and 0.40< in summer. The root zone depth of the maize veget-
ation type varies between 0.10< in winter and 0.40< in summer. The root zone depth of
the forest vegetation type does not vary. To de�ne a summer period for this vegetation
type, we split the year in half. Table 3.1 shows the parametrized vegetation type and
summer period length. Since the �rst aggregation box of MetaSWAP represents the root
zone up to 40 cm depth, we use the in situ measurements at 10 cm depth for the winter
period and the in situ measurements at 20 cm depth for the summer period. Because
the model result is an aggregate of the root zone soil moisture pro�le, we consider the
measurements at these depths representative for the winter and summer periods. Since
the most abundant vegetation type in the list of selected stations is grass, we assume that
the summer period of grass is representative for the regional average results.
76
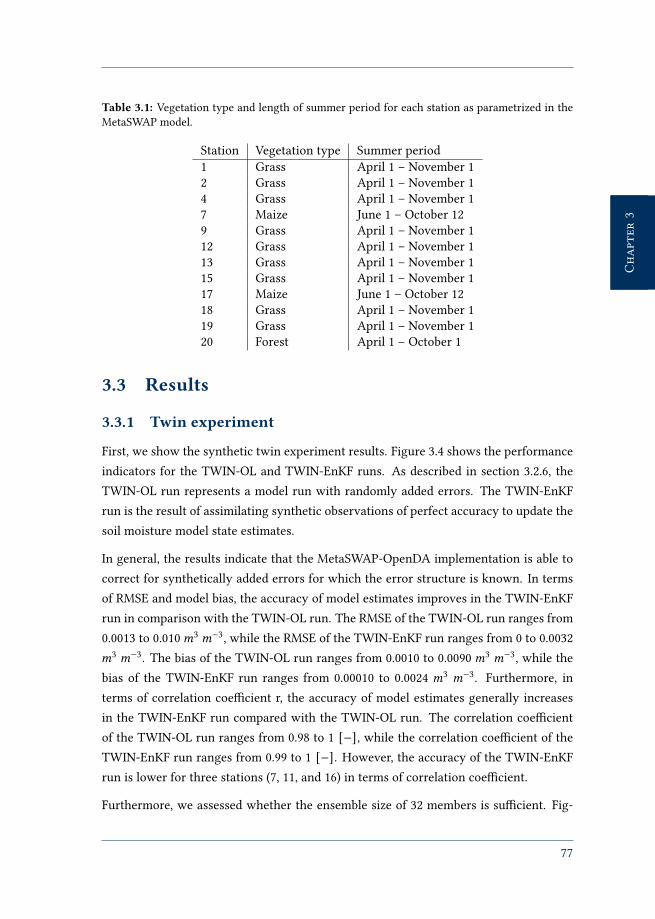
Chapter3
Chapter3
Table 3.1: Vegetation type and length of summer period for each station as parametrized in the
MetaSWAP model.
Station Vegetation type Summer period
1 Grass April 1 – November 1
2 Grass April 1 – November 1
4 Grass April 1 – November 1
7 Maize June 1 – October 12
9 Grass April 1 – November 1
12 Grass April 1 – November 1
13 Grass April 1 – November 1
15 Grass April 1 – November 1
17 Maize June 1 – October 12
18 Grass April 1 – November 1
19 Grass April 1 – November 1
20 Forest April 1 – October 1
3.3 Results
3.3.1 Twin experiment
First, we show the synthetic twin experiment results. Figure 3.4 shows the performance
indicators for the TWIN-OL and TWIN-EnKF runs. As described in section 3.2.6, the
TWIN-OL run represents a model run with randomly added errors. The TWIN-EnKF
run is the result of assimilating synthetic observations of perfect accuracy to update the
soil moisture model state estimates.
In general, the results indicate that the MetaSWAP-OpenDA implementation is able to
correct for synthetically added errors for which the error structure is known. In terms
of RMSE and model bias, the accuracy of model estimates improves in the TWIN-EnKF
run in comparison with the TWIN-OL run. The RMSE of the TWIN-OL run ranges from
0.0013 to 0.010<3<−3, while the RMSE of the TWIN-EnKF run ranges from 0 to 0.0032
<3 <−3. The bias of the TWIN-OL run ranges from 0.0010 to 0.0090<3 <−3, while the
bias of the TWIN-EnKF run ranges from 0.00010 to 0.0024 <3 <−3. Furthermore, in
terms of correlation coe�cient r, the accuracy of model estimates generally increases
in the TWIN-EnKF run compared with the TWIN-OL run. The correlation coe�cient
of the TWIN-OL run ranges from 0.98 to 1 [−], while the correlation coe�cient of the
TWIN-EnKF run ranges from 0.99 to 1 [−]. However, the accuracy of the TWIN-EnKF
run is lower for three stations (7, 11, and 16) in terms of correlation coe�cient.
Furthermore, we assessed whether the ensemble size of 32 members is su�cient. Fig-
77
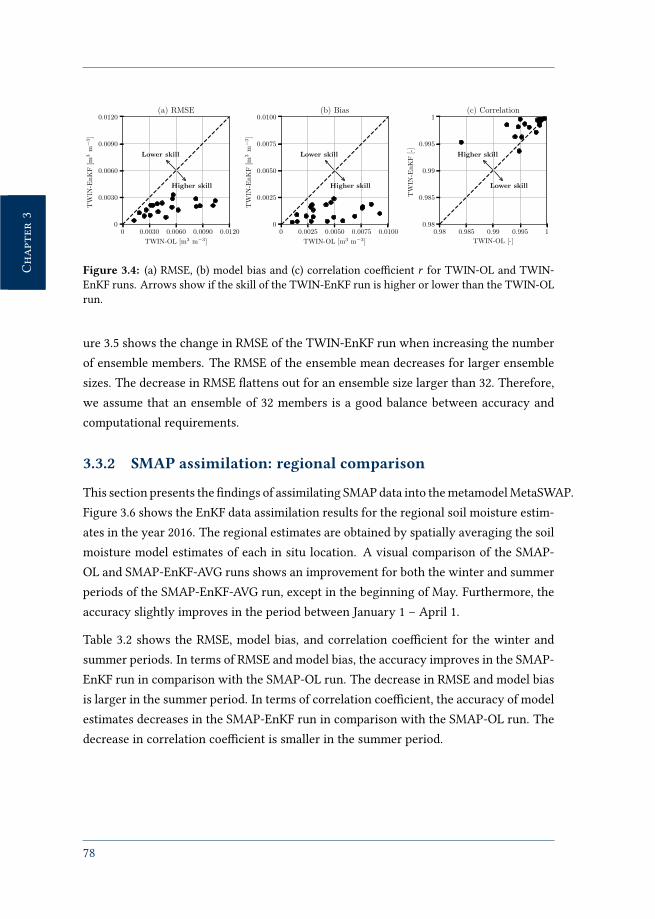
Chapter3
Chapter3
0 0.0030 0.0060 0.0090 0.0120
TWIN-OL [m3 m−3]
0
0.0030
0.0060
0.0090
0.0120
TW
IN-E
nK
F[m
3m
−3]
Lower skill
Higher skill
(a) RMSE
0 0.0025 0.0050 0.0075 0.0100
TWIN-OL [m3 m−3]
0
0.0025
0.0050
0.0075
0.0100
TW
IN-E
nK
F[m
3m
−3]
Lower skill
Higher skill
(b) Bias
0.98 0.985 0.99 0.995 1
TWIN-OL [-]
0.98
0.985
0.99
0.995
1
TW
IN-E
nK
F[-]
Higher skill
Lower skill
(c) Correlation
Figure 3.4: (a) RMSE, (b) model bias and (c) correlation coe�cient A for TWIN-OL and TWIN-
EnKF runs. Arrows show if the skill of the TWIN-EnKF run is higher or lower than the TWIN-OL
run.
ure 3.5 shows the change in RMSE of the TWIN-EnKF run when increasing the number
of ensemble members. The RMSE of the ensemble mean decreases for larger ensemble
sizes. The decrease in RMSE �attens out for an ensemble size larger than 32. Therefore,
we assume that an ensemble of 32 members is a good balance between accuracy and
computational requirements.
3.3.2 SMAP assimilation: regional comparison
This section presents the �ndings of assimilating SMAP data into the metamodel MetaSWAP.
Figure 3.6 shows the EnKF data assimilation results for the regional soil moisture estim-
ates in the year 2016. The regional estimates are obtained by spatially averaging the soil
moisture model estimates of each in situ location. A visual comparison of the SMAP-
OL and SMAP-EnKF-AVG runs shows an improvement for both the winter and summer
periods of the SMAP-EnKF-AVG run, except in the beginning of May. Furthermore, the
accuracy slightly improves in the period between January 1 – April 1.
Table 3.2 shows the RMSE, model bias, and correlation coe�cient for the winter and
summer periods. In terms of RMSE and model bias, the accuracy improves in the SMAP-
EnKF run in comparison with the SMAP-OL run. The decrease in RMSE and model bias
is larger in the summer period. In terms of correlation coe�cient, the accuracy of model
estimates decreases in the SMAP-EnKF run in comparison with the SMAP-OL run. The
decrease in correlation coe�cient is smaller in the summer period.
78
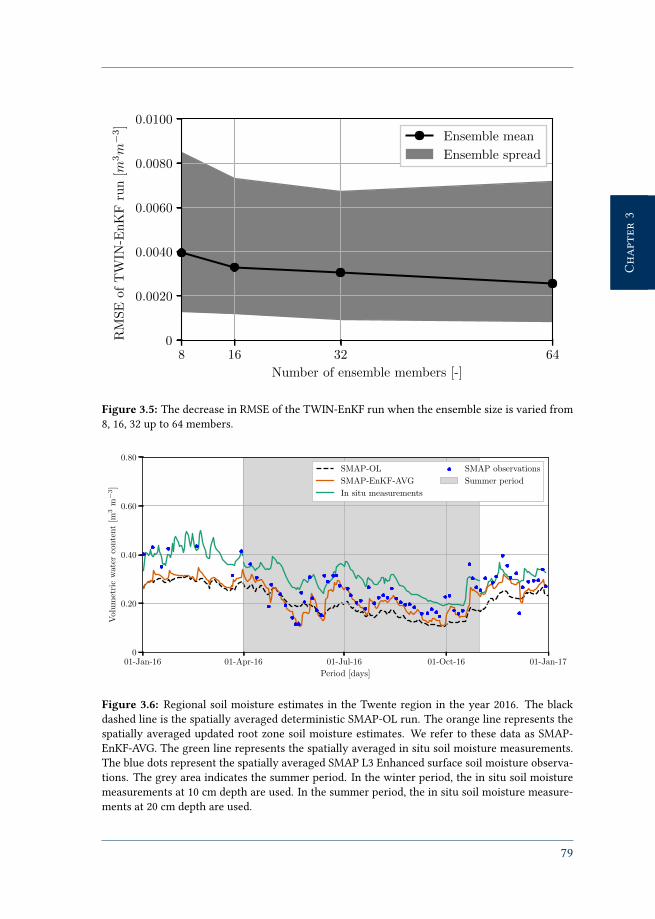
Chapter3
Chapter3
8 16 32 64
Number of ensemble members [-]
0
0.0020
0.0040
0.0060
0.0080
0.0100R
MSE
ofT
WIN
-EnK
Fru
n[m
3m
−3]
Ensemble mean
Ensemble spread
Figure 3.5: The decrease in RMSE of the TWIN-EnKF run when the ensemble size is varied from
8, 16, 32 up to 64 members.
01-Jan-16 01-Apr-16 01-Jul-16 01-Oct-16 01-Jan-17
Period [days]
0
0.20
0.40
0.60
0.80
Vol
um
etri
cw
ater
conte
nt
[m3
m−
3]
SMAP-OL
SMAP-EnKF-AVG
In situ measurements
SMAP observations
Summer period
Figure 3.6: Regional soil moisture estimates in the Twente region in the year 2016. The black
dashed line is the spatially averaged deterministic SMAP-OL run. The orange line represents the
spatially averaged updated root zone soil moisture estimates. We refer to these data as SMAP-
EnKF-AVG. The green line represents the spatially averaged in situ soil moisture measurements.
The blue dots represent the spatially averaged SMAP L3 Enhanced surface soil moisture observa-
tions. The grey area indicates the summer period. In the winter period, the in situ soil moisture
measurements at 10 cm depth are used. In the summer period, the in situ soil moisture measure-
ments at 20 cm depth are used.
79

Chapter3
Chapter3
Table3.2:
RM
SE
,bias,an
dco
rrelatio
nco
e�
cien
tfo
rreg
io
nalan
dlo
calSM
AP
-O
Lan
dSM
AP
-E
nK
Fw
in
ter
an
dsu
mm
er
resu
lts.T
he
statio
nlo
catio
ns
are
fo
un
din
Fig
ure
3.2
.Im
provem
en
ts
in
th
eSM
AP
-E
nK
Fru
nare
in
dicated
by
un
derlin
in
g.
Win
ter
Su
mm
er
SM
AP
-O
LSM
AP
-E
nK
FSM
AP
-O
LSM
AP
-E
nK
F
Statio
nR
MSE
Bias
AR
MSE
Bias
AR
MSE
Bias
AR
MSE
Bias
A
[<3<−3][<
3<−3]
[–
][<
3<−3][<
3<−3]
[–
][<
3<−3][<
3<−3]
[–
][<
3<−3][<
3<−3]
[–
]
Reg
io
nal
0.1
10.1
10.9
40.0
94
0.0
82
0.7
40.1
10.1
10.8
80.0
91
0.0
85
0.8
3
10.1
2-0.0
53
0.5
70.1
2-0.0
57
0.4
30.1
3-0.1
20.7
40.1
2-0.1
00.5
1
20.2
10.1
6-0.8
20.1
60.1
1-0.7
00.0
92
0.0
81
0.7
30.0
71
0.0
52
0.8
2
40.4
80.4
70.5
70.4
60.4
40.3
30.5
80.5
80.5
10.5
50.5
50.4
5
70.0
93
0.0
52
0.7
40.0
89
0.0
54
0.7
90.1
20.1
10.7
60.1
20.1
10.7
0
90.0
40
0.0
22
0.7
70.0
38
-0.0
16
0.6
80.1
20.1
10.6
80.0
78
0.0
55
0.7
4
12
0.1
5-0.0
39
0.8
30.1
5-0.0
47
0.7
60.1
1-0.0
98
0.9
00.1
0-0.0
92
0.7
4
13
0.0
41
0.0
046
0.7
30.0
46
-0.0
39
0.5
00.0
55
0.0
42
0.8
70.0
66
-0.0
25
0.6
1
15
0.0
38
0.0
28
0.7
70.0
28
-0.0
024
0.4
80.0
66
0.0
51
0.7
50.0
50
0.0
15
0.7
1
17
0.0
81
-0.0
30
0.1
80.0
87
-0.0
41
0.1
70.2
60.2
5-0.0
0068
0.1
80.1
70.4
8
18
0.1
20.0
80
0.7
60.1
20.0
69
0.6
30.0
69
-0.0
22
0.4
90.0
67
-0.0
30
0.6
0
19
0.3
90.3
00.8
40.3
90.2
70.7
70.1
20.0
95
0.8
90.1
10.0
49
0.5
3
20
0.1
20.1
20.4
40.0
42
0.0
41
0.7
10.1
80.1
70.6
40.1
40.1
40.6
7
80

Chapter3
Chapter3
3.3.3 SMAP assimilation: local comparison
An overview of the local-scale assimilation results is shown in Table 3.2. For the winter
period, in terms of RMSE, the assimilation increases the accuracy of local soil moisture
estimates for 8 out of 12 stations. In terms of model bias, the assimilation increases
the accuracy for 7 out of 12 stations. In terms of correlation coe�cient, the assimilation
increases the accuracy for 3 out of 12 stations. For the summer period, in terms of RMSE,
the assimilation increases the accuracy of local soil moisture estimates for 10 out of 12
stations. In terms of model bias, the assimilation increases the accuracy for 11 out of 12
stations. In terms of correlation coe�cient, the assimilation increases the accuracy for
5 out of 12 stations. Furthermore, the EnKF corrects the low correlation found during
the summer period in the SMAP-OL run for station 17. However, the EnKF is not able
to correct for the negative correlation found during the winter period in the SMAP-OL
run for station 2.
Next, we focus on local results for two stations: station 9 where the updated estimates
clearly improve, and station 7 for which the accuracy declines. Figure 3.7 shows the
assimilation results for station 9. The accuracy of the model estimates increases in the
EnKF run, similar to the patterns found for the regional soil moisture estimates. In terms
of RMSE and model bias, the accuracy of model estimates improves in both the winter
and summer period. In terms of correlation coe�cient, the accuracy of model estimates
improves in the summer period and declines in the winter period.
Figure 3.8 shows the assimilation results for station 7. Since the parametrized vegetation
type at this station is maize, the length of the summer period is di�erent than for station
9, see Table 3.1. While the accuracy of model estimates slightly improves in terms of
RMSE and correlation coe�cient, the accuracy in terms of model bias declines in the
winter period. Furthermore, the accuracy of model estimates shows no improvement
in terms of RMSE and model bias and a small decline in terms of correlation coe�cient
in the summer period. The EnKF does not signi�cantly a�ect the model estimates. A
possible explanation is that the SMAP L3 Enhanced product does not re�ect local root
zone conditions for this station. A thick clay layer can be found below the root zone at
station 7. In addition, the subsurface of the �eld contains pipes which drain excess water
during wet winter periods.
81
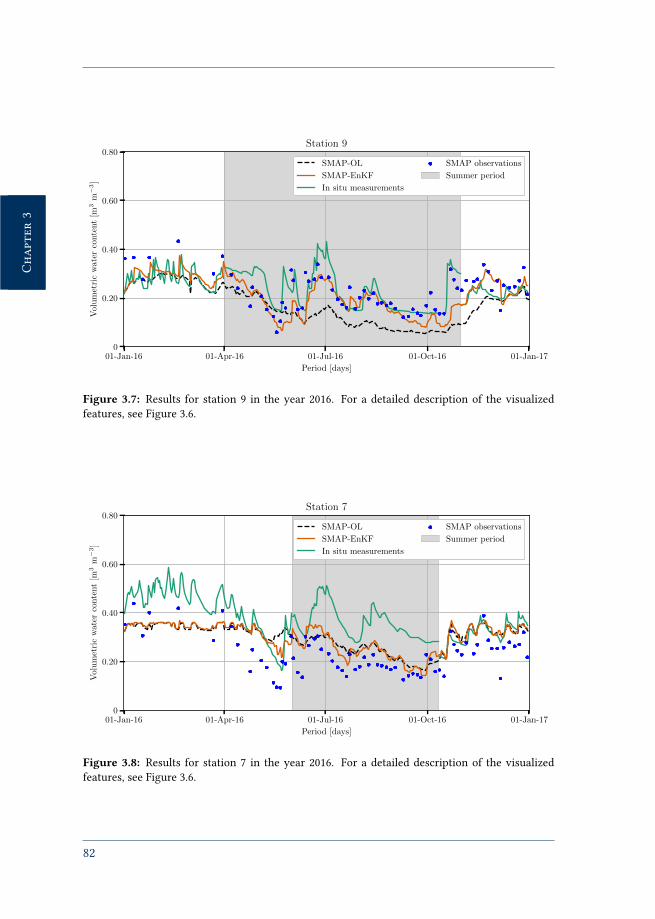
Chapter3
Chapter3
01-Jan-16 01-Apr-16 01-Jul-16 01-Oct-16 01-Jan-17
Period [days]
0
0.20
0.40
0.60
0.80
Vol
um
etri
cw
ater
conte
nt
[m3
m−
3]
Station 9
SMAP-OL
SMAP-EnKF
In situ measurements
SMAP observations
Summer period
Figure 3.7: Results for station 9 in the year 2016. For a detailed description of the visualized
features, see Figure 3.6.
01-Jan-16 01-Apr-16 01-Jul-16 01-Oct-16 01-Jan-17
Period [days]
0
0.20
0.40
0.60
0.80
Vol
um
etri
cw
ater
conte
nt
[m3
m−
3]
Station 7
SMAP-OL
SMAP-EnKF
In situ measurements
SMAP observations
Summer period
Figure 3.8: Results for station 7 in the year 2016. For a detailed description of the visualized
features, see Figure 3.6.
82
Chapter3
Chapter3
3.4 Discussion
3.4.1 Application of data assimilation for metamodelling: twinexperiment
We assessed whether data assimilation can be a tool to integrate soil moisture obser-
vations into unsaturated zone metamodels. The metamodelling concept of MetaSWAP
depends on the database with pre-calculated soil saturation pro�les. Updating this data-
base is a time-consuming process. The twin experiment and SMAP-EnKF runs show
that data assimilation is a good alternative to update the metamodel. The twin exper-
iment indicates that applying an EnKF with perfectly accurate synthetic observations
increases the accuracy of the soil moisture estimates of MetaSWAP and does not lead to
model instabilities or other spurious model behaviour. We conclude that the MetaSWAP-
OpenDA implementation is suitable for assimilating soil moisture observations into the
metamodel MetaSWAP. Also, we found that an ensemble size of 32 members gives a
good representation of model uncertainty. It is important to note that, although Fig-
ure 3.4 shows that the accuracy of soil moisture estimates increases in the TWIN-EnKF
run, also an inherent model uncertainty exists that cannot be mitigated using data as-
similation. The EnKF reduces the RMSE to a lower limit, even when using observations
of perfect accuracy. This inherent uncertainty is among others caused by the restart
procedure of MetaSWAP after each update step, as is described in section 3.2.2.
3.4.2 Application of data assimilation for metamodelling: SMAPexperiment
Table 3.2 shows that the MetaSWAP-OpenDA implementation has value in an exper-
iment with SMAP L3 Enhanced surface soil moisture observations. The accuracy of
model estimates improves on both regional and local scales in terms of RMSE and model
bias. The improvement is larger for the summer period than for the winter period. In
terms of correlation coe�cient, the improvement in accuracy is less distinct. In the
winter period, only three stations show an improvement in correlation coe�cient, in the
summer period, almost half of the stations show an improvement in correlation coe�-
cient. The larger variability of the SMAP surface soil moisture observations with respect
to the in situ root zone measurements might explain the impact of the assimilation on
the correlation coe�cient. Also, the availability of SMAP observations in�uences the ef-
fectiveness of the assimilation. For example, less SMAP observations are available in the
period January 1 2016 – April 1 2016 in comparison with the rest of 2016. Consequently,
83
Chapter3
Chapter3
the model state is less often updated during the SMAP-EnKF run in the period up to
April 1 2016, a�ecting the performance of the EnKF in the de�ned winter period.
3.4.3 Regional versus local spatial scales
The SMAP L3 Enhanced product corresponds well with the in situ measurements on a
regional scale (Chan et al., 2018). Therefore, the accuracy of regional-scale soil moisture
model estimates increase after assimilation of the SMAP L3 Enhanced product in terms
of RMSE and model bias. Data assimilation results on local scales largely depend on how
well the SMAP L3 Enhanced product represents local �eld conditions. We want to stress
that both the in situ measurements and LHM simulations contain uncertainties, e.g.
they might not be representative for local �eld conditions, as explained in section 3.2.6.
New remote sensing products from satellites such as Sentinel-1 are expected to make
the leap from regional to local �eld scales (Balsamo et al., 2018). For example, Bauer-
Marschallinger et al. (2019) developed a high-resolution surface soil moisture product
based on Sentinel-1 satellite data and a change-detection algorithm. The spatial resolu-
tion of this product is 1 :< by 1 :<. We expect that such high-resolution surface soil
moisture products will lead to new possibilities for soil moisture data assimilation in
operational water resources management.
Furthermore, the model bias and correlation coe�cient show that while the EnKF is able
to correct for systematic model errors, the variability of the SMAP L3 Enhanced surface
soil moisture product does not always re�ect dynamics in deeper layers. Carranza et al.
(2018) show a strong vertical variability between soil moisture at 5 and 40 cm depth in
the Twente region. The vertical variability forms a challenge for data assimilation ap-
plications, since most (if not all) remotely sensed soil moisture data concerns surface
soil moisture due to sensor constraints. However, the SMAP-EnKF run shows that a
root zone soil moisture model can be updated by assimilating SMAP surface soil mois-
ture observations. The results in Table 3.2 show that assimilating the 9 :< resolution
surface SMAP L3 Enhanced observations increases the accuracy of local soil moisture
model estimates for more than half of the stations. Thus, the SMAP surface soil mois-
ture product has signi�cant value in data assimilation approaches. Renzullo et al. (2014),
Dumedah et al. (2015), and Blyverket et al. (2019) also show the value of assimilating
satellite-based surface soil moisture observations into a hydrological model to update
root zone soil moisture estimates. We want to accentuate the impact of the SMAP ob-
servation on December 6 2016. This observation signi�cantly impacts the assimilation
run, as visible in Figure 3.6 and Figure 3.7. The in situ measurements do not indicate a
84
Chapter3
Chapter3
steep reduction in soil moisture on that day, so the SMAP observation may be erroneous.
Temperatures dropped below 0◦C on December 6 2016, which probably signi�cantly af-
fected the SMAP reading. Similarly, the SMAP L3 Enhanced product does not re�ect �eld
conditions well during May 2016, signi�cantly a�ecting the assimilation run.
3.4.4 Implications for operationalwater resourcesmanagement
The assimilation of high-resolution remotely sensed soil moisture products leads to new
possibilities for integrated physically-based hydrological models in operational water
resources management. Pezij et al. (2019a) found that hydrological models are currently
not considered by Dutch regional operational water managers as important tools for
decision-making. Among others, regional operational water managers identi�ed model
accuracy as a limiting factor, which limits application. Data assimilation is a tool to
increase the accuracy and hence the application of hydrological modelling in operational
water management.
Yet, combining data assimilation schemes and integrated physically-based modelling for
operational water resources management is currently limited due to, among others, com-
putational requirements (Sun et al., 2016). Even with the application of metamodels
for simulating hydrological processes at �eld scale, high performance computing (HPC)
facilities are often required for e�cient implementation of data assimilation schemes.
Furthermore, the implementation of remote sensing data in operational management re-
quires additional investments in data acquiring, processing and storage facilities. How-
ever, we expect that due to the development of new computational methods, these chal-
lenges become less of an issue in the future (He et al., 2019). For example, Kurtz et al.
(2017) show the potential of combining data assimilation and integrated physically-
based hydrological modelling with cloud computing techniques for operational water re-
sources management. Ma et al. (2015) identi�es several promising tools, such as cluster-
based HPC systems and cloud computing for fast calculations, and parallel �le systems
for big data storage. However, the implementation of such tools requires investments
in computational infrastructure. We expect that in the future research and investments
into these promising new tools will increase, which will help to integrate the application
of data assimilation schemes in operational water resources management.
85

Chapter3
Chapter3
3.5 Conclusions
We assessed the applicability of satellite-based regional-scale surface soil moisture ob-
servations to increase the accuracy of root zone soil moisture estimates of an unsaturated
zone metamodel. This study shows that combining metamodels with data assimilation
schemes allows incorporating new information in metamodels. Therefore, integrating
satellite-based soil moisture observations and hydrological metamodelling lead to new
opportunities for operational water resources management.
A data assimilation scheme was developed for the metamodel MetaSWAP using the
open-source data assimilation framework OpenDA. A synthetic experiment, known as
a twin experiment, showed the value of integrating metamodelling and an Ensemble
Kalman Filter (EnKF) data assimilation scheme. Furthermore, the applicability of the
9 :< resolution SMAP L3 Enhanced surface soil moisture product for the MetaSWAP-
OpenDA framework was assessed for the year 2016. On a regional scale, the updated
root zone soil moisture model estimates show a larger skill in terms of RMSE and model
bias. In terms of correlation coe�cient, the skill of the updated root zone soil mois-
ture model estimates is slightly lower than in the open loop run. The decline is partly
explained by the larger variability of the assimilated surface soil moisture observations
with respect to the in situ root zone soil moisture measurements. On a local scale, sim-
ilar results were found. However, the applicability of the SMAP L3 Enhanced product
on local scales depends on how well the SMAP product represents local �eld conditions.
In addition, we show that the assimilation of surface soil moisture observations leads to
increased accuracy of root zone soil moisture model estimates. The improvement of the
soil moisture model estimates is larger in the summer period than in the winter period
of 2016. The limited availability of SMAP L3 Enhanced soil moisture observations in the
�rst months of 2016 might explain this di�erence. The limited availability is caused by,
among others, freezing of the soil in winter periods.
As a �nal remark, the increasing availability of high-resolution surface soil moisture
products will lead to new opportunities for data assimilation schemes in operational
water resources management. Nevertheless, signi�cant developments and investments
in terms of computation capacities are required for operational application of remote
sensing data in data assimilation schemes. However, recent developments in HPC and
cloud computing are expected to contribute to the integration of data assimilation in
operational water resources management.
86

Chapter3
Chapter3
Acknowledgments
This work is part of the OWAS1S research programme (Optimizing Water Availability
with Sentinel-1 Satellites) with project number 13871, which is partly �nanced by the
Netherlands Organisation for Scienti�c Research (NWO). We want to thank all OWAS1S
programme partners for their contribution. The authors are grateful for the Water Re-
sources Department of the ITC faculty of the University of Twente, the Netherlands, for
sharing the in situ soil moisture data from their monitoring network. Furthermore, we
want to thank Ruud Hurkmans and Erik Pelgrim for their help on the OpenDA imple-
mentation. Last, this work was carried out on the Dutch national e-infrastructure with
the support of SURF Cooperative.
3.6 Appendix A
To improve readability, the acronyms are alphabetically summarized in the following
list:
AHN: Actueel Hoogtebestand Nederland (Elevation Map The Netherlands)
AMSR-2: Advanced Microwave Scanning Radiometer 2
AMSR-E: Advanced Microwave Scanning Radiometer for EOS
ASCAT: Advanced Scatterometer
BOFEK2012: Bodemfysische Eenhedenkaart (Soil Physical Units Map)
DA: data assimilation
EnKF: Ensemble Kalman Filter
HPC: High-Performance Computing
H-SAF: Satellite Application Facility on Support to Operational Hydrology and
Water Management
KNMI: Koninklijk Nederlands Meteorologisch Instituut (Royal Dutch Meteorolo-
gical Institute)
LGN: Landelijk Grondgebruik Nederland (National Land Use the Netherlands)
LHM: Landelijk Hydrologisch Model (National Hydrological Model)
NHI: Netherlands Hydrological Instrument
87
Chapter3
Chapter3
OL: Open Loop
REGIS: Regionaal Geohydrologisch Informatie Systeem (Regional Geohydrological
Information System)
RMSE: Root Mean Square Error
uRMSE: Unbiased Root Mean Square Error
SCA-V: Single Channel Algorithm at V-polarization
SMAP: Soil Moisture Active Passive
SMOS: Soil Moisture and Ocean Salinity
SVAT: Soil-Vegetation-Atmopshere-Transfer
SWAP: Soil-Water-Atmosphere-Plant
3.7 Appendix B
Due to the size of the model state error covariance matrix % in hydrological model pre-
dictions, it is generally not feasible to explicitly calculate % . An alternative approach
is to estimate % using a sample of evolved model states, leading to a lower rank es-
timation of % . This ensemble of model runs is created by perturbing model forcing,
parameters and/or states. The model perturbations ([) have to be de�ned in such a way
that the model ensemble represents total model uncertainty. This method, introduced
by Evensen (1994), is generally known as an Ensemble Kalman Filter (EnKF). We ap-
ply a stochastic (or perturbed observations) EnKF (Burgers et al., 1998; Houtekamer and
Mitchell, 1998).
Applying an EnKF consists of a forecast (f) and analysis step (a). The forecast and ana-
lysis model state ensembles are represented as:
G f =[G f
1, G f
2, ...G f
#
], (3.4)
Ga =[Ga
1, Ga
2, ...Ga
#
], (3.5)
where G fis the forecasted model state, Ga
is the analysis model state, and # is the en-
semble size. The subscript indicates the ensemble member. Model states of each en-
88

Chapter3
Chapter3
semble member are propagated forward in time:
G f
9 =M(Ga
9
)+ [ 9 , (3.6)
whereM is a model operator and [ 9 is the added model noise for ensemble member 9 .
Note that for the �rst forecast step, an initial model state estimate is used instead of the
previous analysis model state. The forecast mean state G fand model state forecast error
covariance matrix % fare:
G f =1
# − 1
#∑9=1
G f
9 , (3.7)
% f =1
# − 1
#∑9=1
(G f
9 − G f
) (G f
9 − G f
)), (3.8)
where) denotes the transpose of a matrix or vector. The mean G fand covariance % f
are
used to calculate the Kalman gain :
= % f�)(�% f�) + '
)−1, (3.9)
where � is a transformation matrix. This matrix is used to transform the observations
to the model state space. ' is a covariance matrix based on perturbed observations and
is de�ned as:
' =1
# − 1
#∑9=1
(3 9 − 3
) (3 9 − 3
)), (3.10)
where 3 9 are perturbed observations (with the addition of noise), which are de�ned
as:
3 9 = ~ + n 9 , (3.11)
where ~ are observations and n8 are perturbations sampled from a normal distribution
89

Chapter3
Chapter3
N with zero mean and variance ':
n8 ∼ N(0, '). (3.12)
Next, the ensemble mean and error covariance matrix (Gaand %a
) are updated:
Ga
9 = Gf
9 + (3 9 − �G f
9
), (3.13)
Ga =1
# − 1
#∑9=1
Ga
9 , (3.14)
%a =1
# − 1
#∑9=1
(Ga
9 − Ga
) (Ga
9 − Ga
)). (3.15)
90

CHAPTER 4
Applying transfer function-noise
modelling to characterize soil
moisture dynamics
This chapter is submitted as:
Pezij, M., Augustijn, D.C.M., Hendriks, D.M.D., Hulscher, S.J.M.H. (submitted) Applying transfer function-noise
modelling to characterize soil moisture dynamics: a data-driven approach using remote sensing data.
91

Chapter4
Chapter4
Abstract
The increasing availability of remotely sensed soil moisture data o�ers new opportun-
ities for data-driven modelling approaches as alternatives for process-based modelling.
This study presents the applicability of transfer function-noise (TFN) modelling for pre-
dicting unsaturated zone conditions. The TFN models in this study are trained using
SMAP L3 Enhanced surface soil moisture data. We found that soil moisture conditions
are accurately represented by TFN models when exponential distributions are used to
de�ne impulse-response functions. Impulse-response functions describe the response of
soil moisture to input stresses. A sensitivity analysis showed the importance of the selec-
ted training period, which should at least cover the full 2016 summer period, including
the growing season and the onset of autumn to correctly estimate the dry summer period
of 2018. The accuracy of the TFN models can be considerably increased by including the
dry summer period of 2018 in the training set. Furthermore, the �tted parameters of
the impulse-response functions provide valuable information in describing spatially dis-
tributed unsaturated zone characteristics such as the total response of soil moisture to a
unit stress of precipitation or evapotranspiration. These characteristics can help water
managers in making robust decisions. Finally, we encourage exploring the possibilities
of TFN soil moisture modelling for water management, as the prediction of soil moisture
conditions is a promising application for operational settings.
4.1 Introduction
Soil moisture is a key component of the hydrological cycle, linking surface and sub-
surface hydrological processes (Entekhabi and Rodriguez-Iturbe, 1994; Vereecken et al.,
2016). Among others, soil moisture governs the partitioning of precipitation into in�lt-
ration and runo�, a�ecting stream�ow and groundwater recharge (Brocca et al., 2010,
2017). Up-to-date information on soil moisture helps e�ective decision-making in oper-
ational water management, e.g. for drought assessments (Grillakis, 2019; Mishra et al.,
2017; Moravec et al., 2019; Sehgal and Sridhar, 2019), �ood predictions (Brocca et al.,
2017; Tramblay et al., 2010) and irrigation management (Brocca et al., 2018; Rai et al.,
2018). The soil moisture drought caused by the 2018 European heat wave signi�cantly
impacted water management and agricultural practices (Vogel et al., 2019), which shows
the importance of retrieving up-to-date soil moisture information.
Generally, three methods exist for estimating soil moisture on various spatiotemporal
scales: in situ (Dobriyal et al., 2012; Susha Lekshmi et al., 2014), remote sensing (Fang and
92
Chapter4
Chapter4
Lakshmi, 2014; Petropoulos et al., 2015; Zhuo and Han, 2016) and hydrological modelling
(Vischel et al., 2008; Zhuo and Han, 2016). In situ soil moisture sensors provide accurate
information on local scales, since soil-speci�c calibration procedures can be performed.
However, in situ sensors typically have limited spatial coverage (Susha Lekshmi et al.,
2014). Remote sensing and hydrological modelling are alternative sources for providing
spatially distributed soil moisture information on larger scales. Remotely sensed soil
moisture information is often retrieved using activate and passive microwave sensors
(Petropoulos et al., 2015). The temporal coverage of remote sensing is limited in com-
parison with in situ methods, as satellite imagery is only available during satellite over-
passes. In addition, only surface soil moisture can be retrieved by remote sensing due
to sensor capabilities (Zhuo and Han, 2016). Furthermore, vegetation dynamics and sur-
face roughness signi�cantly a�ect remote sensing retrievals (Petropoulos et al., 2015;
Benninga et al., 2019).
Hydrological modelling provides a means to estimate soil moisture at various spatiotem-
poral scales (Vereecken et al., 2016; Brocca et al., 2017). The complexity of unsatur-
ated zone models ranges from simple conceptual lumped models to complex integrated
physically-based distributed models. Water managers often regard model accuracy as a
limiting factor for the application of hydrological modelling for decision-making in op-
erational water management, e.g. in the Netherlands (Pezij et al., 2019a). The accuracy
of hydrological models is partly based on which dataset is used for calibration. Data
assimilation can be applied to update model simulations with available observations,
although such schemes often require signi�cant computational power (Liu et al., 2012;
Weerts et al., 2014; Pezij et al., 2019b). Furthermore, process-based unsaturated zone
models are often based on the Richards equation, which is highly non-linear and poses
challenges for numerical solutions (Šimůnek et al., 2003; Vereecken et al., 2016). Further-
more, Richards-based models (e.g. SWAP or Hydrus) are generally developed for local
applications (Van Dam et al., 2008; Šimůnek and van Genuchten, 2008). Signi�cant com-
putational power is required to scale such models to regional applications (Van Walsum
and Groenendijk, 2008). Therefore, the application of Richards-type soil water �ow mod-
els is not trivial in operational water management on catchment scales.
Data-driven modelling methods are suitable alternatives for process-based modelling
(Todini, 2007; Solomatine and Ostfeld, 2008), especially when large amounts of data are
available, such as in the Netherlands. Among others, machine learning methods for
the prediction of soil moisture conditions are promising (Kolassa et al., 2017; Cai et al.,
2019). In this study, we show the applicability of transfer function-noise modelling for
93

Chapter4
Chapter4
describing soil moisture dynamics in the Netherlands.
Transfer function-noise (TFN) modelling is a data-driven method to model an observed
time series by applying a linear transformation of deterministic input series known as
stress series (Von Asmuth et al., 2002). The stress series are transformed using impulse-
response (IR) functions. The IR functions contain information on the response of a wa-
ter system to input stresses such as precipitation. A TFN model is a fast and easy-to-
construct alternative for complex process-based models. TFN modelling does not need
prior assumptions on system characteristics, which is an interesting property since no
model structure is expected to work best everywhere (Peterson and Western, 2014). Fur-
thermore, due to their stochastic nature, TFN models can model system dynamics which
are not well explained by physical laws (Von Asmuth et al., 2002).
The applicability of TFN modelling for groundwater studies has been shown extensively
(Yi and Lee, 2004; Bakker et al., 2007; Manzione et al., 2010; Fabbri et al., 2011; Obergfell
et al., 2013; Sutanudjaja et al., 2013; Peterson and Western, 2014; Zaadnoordijk et al.,
2018; Bakker and Schaars, 2019). Among others, these studies show that TFN modelling
can be used to describe groundwater dynamics. In addition, the IR functions contain
valuable information on groundwater system characteristics, such as response times. A
commonly applied TFN modelling tool for groundwater modelling in the Netherlands is
Menyanthes (Von Asmuth et al., 2012).
The non-linearity of unsaturated zone dynamics can be accounted for by adding a process-
based soil moisture model on top of the TFN modelling approach (Peterson and Western,
2014). Ramirez-Beltran et al. (2008) showed the applicability of transfer functions for
soil moisture modelling using in situ soil moisture measurements as validation data. In
particular, we are interested in the application of TFN modelling as an innovative data-
driven method for explicitly calculating soil moisture dynamics, which has not been
studied before. The availability of new high-resolution remotely sensed soil moisture
data o�ers new opportunities for data-driven modelling methods such as TFN model-
ling (Petropoulos et al., 2015). We address the following research question in this study:
to what extent can transfer function-noise modelling describe and predict soil moisture
dynamics using remotely sensed soil moisture information?
This paper is organised as follows: Section 4.2 describes the research methodology. Sec-
tion 4.3 presents the results, which are discussed in Section 4.4. Finally, conclusions are
drawn in Section 4.5.
94

Chapter4
Chapter4
4.2 Methodology
4.2.1 Transfer function-noise modelling
The approach applied in this study originates from TFN Autoregressive Moving Average
(ARMA) modelling (Box and Jenkins, 1970). TFN models are often applied in hydrolo-
gical applications, since they are fast and yield accurate predictions (Von Asmuth et al.,
2008). TFN modelling is comparable to the Unit Hydrograph approach often applied in
estimating river discharge rates (Sherman, 1932). A general form of a continuous-time
TFN model, formulated for soil moisture dynamics, is (Von Asmuth et al., 2008):
ℎ(C) =#BCA4BB∑8=1
ℎ8 (C) + 3 + =A4B (C), (4.1)
where ℎ(C) is the observed soil moisture state at time C [<3 <−3], #BCA4BB is the number
of stress series which in�uence the soil moisture state [–], ℎ8 (C) is the change in the soil
moisture state due to a stress series 8 at time C [<3 <−3], 3 is the baseline soil moisture
state [<3 <−3], and =A4B (C) is a residual time series [<3 <−3].
ℎ8 (C) is determined by solving a convolution integral in continuous time using impulse-
response (IR) functions (Von Asmuth et al., 2002). IR functions describe the variation
of the soil moisture state due to an individual stress series. The type and shape of the
functions depend on the type of stress and water system characteristics. ℎ8 (C) is de�ned
by the following convolution integral:
ℎ8 (C) =C∫
−∞
'8 (g)Θ8 (C − g)3g, (4.2)
where '8 is the value of a stress series 8 [<<] at time C and Θ8 is an IR transfer function
of the corresponding stress series 8 . To solve Equation 4.2, Θ8 should be known. How-
ever, the IR functions are not known a priori and have to be estimated (Von Asmuth
et al., 2012). The IR functions can be estimated using the Prede�ned Impulse Response
Function In Continuous Time (PIRFICT) method (Von Asmuth et al., 2002; Von Asmuth
and Bierkens, 2005). The PIRFICT method de�nes IR functions as analytical expressions.
Von Asmuth et al. (2002) show that the PIRFICT method overcomes the following lim-
itations of estimating IR functions in regular TFN ARMA models: (1) PIRFICT allows
the use of data with an irregular time interval, and (2) since the distribution of the IR
95
Chapter4
Chapter4
functions has to be de�ned a priori, the order of the IR functions does not have to be
de�ned in a Box-Jenkins model identi�cation procedure (Box and Jenkins, 1970). The
PIRFICT method allows selecting a typical IR function for a speci�c type of input series
(Von Asmuth et al., 2008). We assume that the main drivers of soil moisture dynam-
ics are precipitation (Entekhabi and Rodriguez-Iturbe, 1994; Vereecken et al., 2016) and
evapotranspiration (Syed et al., 2004). Therefore, we use time series of precipitation and
evapotranspiration as stress series for the TFN model.
An IR function can be expressed as a step response function:
B (C) =∫ C
0
Θ(g)3g . (4.3)
A step response function describes the long-term response of soil moisture due to a con-
tinuous unit stress. The soil moisture response due to a unit stress is de�ned as the block
response. The block response can be derived from the step response function:
1 (C) = B (C) − B (C − 1) (4.4)
Von Asmuth et al. (2012) state that, independently of system properties, statistical distri-
butions such as the scaled gamma distribution �t the behaviour of many hydrogeological
systems. The scaled gamma step response function is a commonly applied IR function
for precipitation and evapotranspiration stress series in groundwater TFN modelling
(Von Asmuth et al., 2012). The scaled gamma IR function is de�ned as:
Θ(C) = �C=−14G? (−C/060<)
060<=Γ(=) (4.5)
where � corresponds to the unit step response of the state variable to the input stress
[<3 <−3], 060< is a shape parameter [30~], = is a shape parameter [–], and Γ(=) is the
gamma function of the form (= − 1)! [–]. Typical forms of the gamma block response
function are visualized in Figure 4.1.
Next to the gamma distribution, we studied whether an exponential distribution is a
better representation of the unit response of soil moisture to precipitation and evapo-
transpiration, as we expect that soil moisture shows a fast response to precipitation and
96
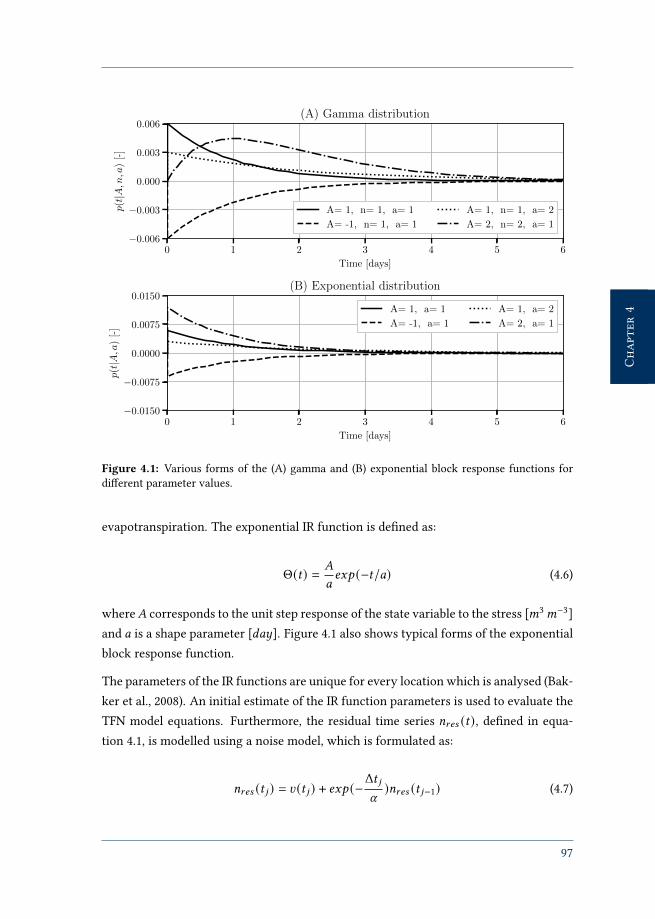
Chapter4
Chapter4
0 1 2 3 4 5 6
Time [days]
−0.006
−0.003
0.000
0.003
0.006p(t|A,n,a
)[-
](A) Gamma distribution
A= 1, n= 1, a= 1
A= -1, n= 1, a= 1
A= 1, n= 1, a= 2
A= 2, n= 2, a= 1
0 1 2 3 4 5 6
Time [days]
−0.0150
−0.0075
0.0000
0.0075
0.0150
p(t|A,a
)[-
]
(B) Exponential distribution
A= 1, a= 1
A= -1, a= 1
A= 1, a= 2
A= 2, a= 1
Figure 4.1: Various forms of the (A) gamma and (B) exponential block response functions for
di�erent parameter values.
evapotranspiration. The exponential IR function is de�ned as:
Θ(C) = �
04G? (−C/0) (4.6)
where� corresponds to the unit step response of the state variable to the stress [<3<−3]
and 0 is a shape parameter [30~]. Figure 4.1 also shows typical forms of the exponential
block response function.
The parameters of the IR functions are unique for every location which is analysed (Bak-
ker et al., 2008). An initial estimate of the IR function parameters is used to evaluate the
TFN model equations. Furthermore, the residual time series =A4B (C), de�ned in equa-
tion 4.1, is modelled using a noise model, which is formulated as:
=A4B (C 9 ) = h (C 9 ) + 4G? (−ΔC 9
U)=A4B (C 9−1) (4.7)
97
Chapter4
Chapter4
where h (C) is white noise resulting from a random process for time step 9 [<3 <−3], U
is a decay parameter [30~], and ΔC is the time step [30~] (Von Asmuth and Bierkens,
2005; Collenteur et al., 2019a). The subscript 9 indicates the day. The noise model allows
the application of a least squares objective function (Peterson and Western, 2014). The
goal of training a TFN model is to �nd optimal parameter sets for the IR functions used
in equations 4.1 and 4.2 by minimizing the objective function. More information on the
parameter estimation procedure and the noise model can be found in Von Asmuth and
Bierkens (2005).
4.2.2 Study area and data
We assessed the extent to which TFN modelling is applicable for soil moisture predictions
in the Twente region in the eastern part of the Netherlands, see Figure 4.2. The study area
is situated in a temperate marine climate zone (Hendriks et al., 2014), has an elevation
ranging between 3 to 85 m.a.s.l. and has a size of approximately 40 :< by 50 :<. The
main soil types are sand and loamy sand (Wösten et al., 2013). The primary land use is
agriculture. Annual precipitation varies between 800 and 850 mm.
We use two types of input stress series: precipitation and Makkink reference crop evapo-
transpiration. Makkink reference crop evapotranspiration (in the following evapotran-
spiration) describes the potential evapotranspiration from a reference surface covered
with grass (Makkink, 1957). Open source precipitation and evapotranspiration data from
the Royal Netherlands Meteorological Institute (KNMI) are used (KNMI, 2018a,b). The
precipitation data are based on radar data which are corrected using KNMI station data
by applying ordinary kriging. The precipitation data have a spatial resolution of 1 :< by
1 :<. The evapotranspiration data are based on extrapolating KNMI station data using
Thin Plate Spline interpolation. The station data are calculated by KNMI using incoming
shortwave radiation and mean daily temperature measurements at the KNMI stations.
The evapotranspiration data have a spatial resolution of 10 :< by 10 :<.
We use the SMAP (Soil Moisture Active Passive) L3 Enhanced radiometer-only daily
gridded soil moisture product to train the TFN models (Entekhabi et al., 2010; Chan
et al., 2018; O’Neill et al., 2018). The surface soil moisture estimates are obtained by pro-
cessing interpolated brightness temperature observations from the SMAP satellite (Das
et al., 2018). In general, SMAP soil moisture products perform well in the Twente region
(Colliander et al., 2017). Chan et al. (2018) found an unbiased root mean square error of
0.056<3 <−3 for the Twente region when assessing the SMAP L3 product using in situ
soil moisture measurements. The SMAP observations are available for the study area
98

Chapter4
Chapter4
3oE 4oE 5oE 6oE 7oE 8oE
Longitude
50oN
51oN
52oN
53oN
54oN
Lat
itu
de
6.25oE 6.5oE 6.75oE 7oE
Longitude
52.1oN
52.2oN
52.3oN
52.4oN
52.5oN
52.6oN
Lat
itu
de
12
3
45
7
8 9
11
12
1314
15
16
1718
19 20
10
6
(A)
(B) In situ soil moisture stations
0.10
0.15
0.20
0.25
0.30
0.35
0.40
Moi
stu
reco
nte
nt
[m3m−
3]
Figure 4.2: (A) Location of the Twente study area in the Netherlands, indicated by the blue rect-
angular shape. (B) Overview of the study area including the station locations of the in situ soil
moisture monitoring network and the footprint of the SMAP L3 Enhanced surface soil moisture
data for September 9 2017.
approximately every 2–3 days and have a spatial resolution of 9 :< by 9 :<. The foot-
print of the SMAP L3 Enhanced product in the Twente region is visualized in Figure 4.2.
We have analysed the SMAP data for the period January 1 2016 – January 1 2019.
Additionally, we use in situ soil moisture measurements from a monitoring network to
assess whether the TFN models can describe soil moisture �eld conditions. The monit-
oring network, operating since 2009, is maintained by the ITC faculty of the University
99

Chapter4
Chapter4
of Twente (Dente et al., 2012; Van der Velde, 2018; Van der Velde et al., 2019). Both volu-
metric moisture content and soil temperature are measured at 20 locations in the Twente
region. The stations cover agricultural �elds, except station 20, which is installed in a
forest area. The station locations are shown in Figure 4.2. The monitoring network con-
sists of Decagon 5TM probes at 5, 10, 20, 40, and 80 cm soil depth and provide a reading
every 15 minutes. We use daily averaged measurements at 5 cm soil depth, since re-
motely sensed soil moisture data are limited to surface soil moisture (Petropoulos et al.,
2015; Benninga et al., 2019). Figure 4.2 provides an overview of the SMAP L3 Enhanced
footprint relative to the in situ locations in the study area. Seventeen pixels provide
information for the 20 stations.
4.2.3 TFN modelling library: Pastas
To set up the TFN models, we use the open source library Pastas (Collenteur et al., 2019b),
which is a Python 3 implementation of the TFN modelling approach described in sec-
tion 4.2.1. A description of Pastas can be found in Collenteur et al. (2019a). In order to
solve equation 4.1, we use a least squares optimization approach to �t the parameters of
the IR functions in Pastas (equations 4.5 and 4.6). More information on the Pastas library
can be found at https://pastas.readthedocs.io.
4.2.4 General work�ow
Figure 4.3 shows the general research work�ow. The work�ow focuses on three main
parts, indicated by the yellow boxes in the �gure. First, the TFN models are set up
and trained using SMAP data (SMAP training). Next, these models are validated using
SMAP data for a di�erent period (SMAP validation). Last, we assess the applicability of
the TFN models for estimating soil moisture on �eld scales using in situ measurements
(Field validation). We will elaborate on each research step. The numbers in the following
sections refer to the steps shown in Figure 4.3.
SMAP training
First, (1) the input datasets, which are described in section 4.2.2, are selected. The data-
sets are split in a (2) training set and a (3) validation set. The training set is used to
train the TFN models by deriving the parameter sets for the IR functions. The validation
set is used to assess the trained TFN model results. We want to use a training period
which covers at least the response time of the hydrological system that we observe. We
used the shape of the IR distributions to estimate the response time, see Section 4.3.3.
100

Chapter4
Chapter4
3. Validation set2. Training set
1. Input data
5. Stress series fortraining4. Observations
7. Pastas trainingobject
9. Parameter set forIR functions
11. Pastas validationobject
10. Stress series forvalidation
12. TFN soilmoisture predictions
15. In situmeasurements
14. SMAPevaluation
13. SMAP validation series
8. Solve using leastsquare optimization
6. Select distributionfor IR functions
16. Field scaleevaluation
SMAP training SMAP validation
Field validation
Figure 4.3: Flowchart visualizing the research steps to set up and validate a TFN model with
SMAP observations and in situ measurements. The individual steps are described in Section 4.2.4.
Especially, we are interested in the predictive capabilities of the TFN model for the dry
summer period of 2018. Therefore, the training set covers the period January 1 2016 –
January 1 2018, while the validation set covers the period January 1 2018 – January 1
2019. Since more SMAP observations are becoming available, the training period can be
continuously extended in an operational setting.
We assessed the in�uence of the training period length by performing a sensitivity ana-
lysis in which both the length and period of training set are varied. The training periods
used for the sensitivity analysis are a summer period (April – October 2016), a winter
period (October 2016 – April 2017), the full year 2016 and the full year 2017. In addition,
we assessed the TFN model capabilities by switching the training and validation period:
January 1 2017 – January 1 2019 for the training set and January 1 2016 – January 1 2017
for the validation set. Section 4.4.1 elaborates on the results of the sensitivity analysis
101

Chapter4
Chapter4
Table 4.1: Combinations of statistical distributions assessed for the IR functions.
Precipitation Evapotranspiration CodeGamma Gamma GGExponential Exponential EEGamma Exponential GEExponential Gamma EG
and the implications for TFN modelling.
The SMAP soil moisture observations of the training set are used as the (4) observational
training dataset for the TFN model. Then, (5) the stress series are de�ned for the training
period. Subsequently, (6) a statistical distribution is de�ned for each stress series. Both
the observations and the stress series are added to a (7) Pastas model object. Next, Pastas
applies (8) a least squares optimization approach to �nd (9) optimal parameter sets for
the precipitation and evapotranspiration IR functions for each in situ location by solving
equation 4.1. These sets are assumed to best �t the SMAP soil moisture observations
for the training period. The sets can subsequently be used to estimate soil moisture
dynamics in the validation period.
We assessed the applicability of two distribution functions to de�ne the IR function of
each stress series: a gamma and an exponential distribution. Table 4.1 lists the combin-
ations. The explained variance percentage (EVP) is calculated to assess the applicability
of each combination. The EVP is de�ned as:
�+% = 100
f2ℎ− f2=f2ℎ
, (4.8)
where f2ℎ
is the variance of the SMAP soil moisture observations [(<3 <−3)2] and f2= is
the variance of the TFN model residuals as de�ned in equation 4.1 [(<3<−3)2] (Von As-
muth et al., 2002). An EVP of 100% indicates a perfect simulation of the observations,
since no residuals exist in that case. As a rule of thumb, one generally accepts the results
of a TFN model if the EVP ≥ 70%.
Additionally, the noise series should not be autocorrelated. Autocorrelation would indic-
ate that the white noise assumption does not hold (Von Asmuth et al., 2002). We use the
Ljung-Box test to determine whether the noise series shows signi�cant autocorrelation
(Ljung and Box, 1978).
102

Chapter4
Chapter4
SMAP validation
Next, we use SMAP observations from the year 2018 to validate the TFN models. We
de�ne (10) the precipitation and evapotranspiration stress series for the period January
1 2018 – January 1 2019. These series are used to (11) set up a Pastas model for the valid-
ation period. The (9) optimized parameter sets from the training set are applied to de�ne
the IR functions. Again, Pastas solves equation 4.1 using the de�ned IR functions, the
optimized parameter sets, and the stress series, resulting in (12) predictions of soil mois-
ture for the validation period. We use (13) the SMAP validation set to (14) assess the TFN
model results using the unbiased Root Mean Square Error (uRMSE), bias, and Pearson
correlation coe�cient. Appendix A provides a de�nition of these error metrics.
Field validation
Furthermore, we are interested in the applicability of the TFN models on �eld scales
compared to the regional scales represented by the SMAP observations. Therefore, we
use (15) in situ soil moisture measurements from the soil moisture monitoring network to
(16) evaluate the TFN model results on �eld scales using the error metrics. The evaluation
is performed for all in situ location for which measurement data is available for the
validation period. The following eleven stations provide data for the 2018 validation
period: 2, 4, 7, 9, 10, 11, 13, 14, 15, 16, and 17.
4.3 Results
4.3.1 Selection of distribution functions
First, we evaluated which combination of statistical distributions leads to the best �t of
the TFN models in terms of EVP. Figure 4.4 shows the spatially averaged EVP for the four
distribution combinations as de�ned in Table 4.1. The GG and GE combinations lead to
TFN models which cannot su�ciently explain soil moisture dynamics. Both the GG and
GE combinations score spatially averaged EVP values lower than 50%. The Exponential-
Exponential (EE) and Exponential-Gamma (EG) combinations show the best model be-
haviour. The EG combination leads to a rejection of the TFN model for one location, i.e.
station 16 (67%). The EVP of the EE combination is consistently larger than 70% for all
stations, exceeding the model acceptance criterion. Since the EE combination consist-
ently shows good accuracy, we use the exponential distribution for both the precipitation
and evapotranspiration IR functions in the remainder of the study.
103
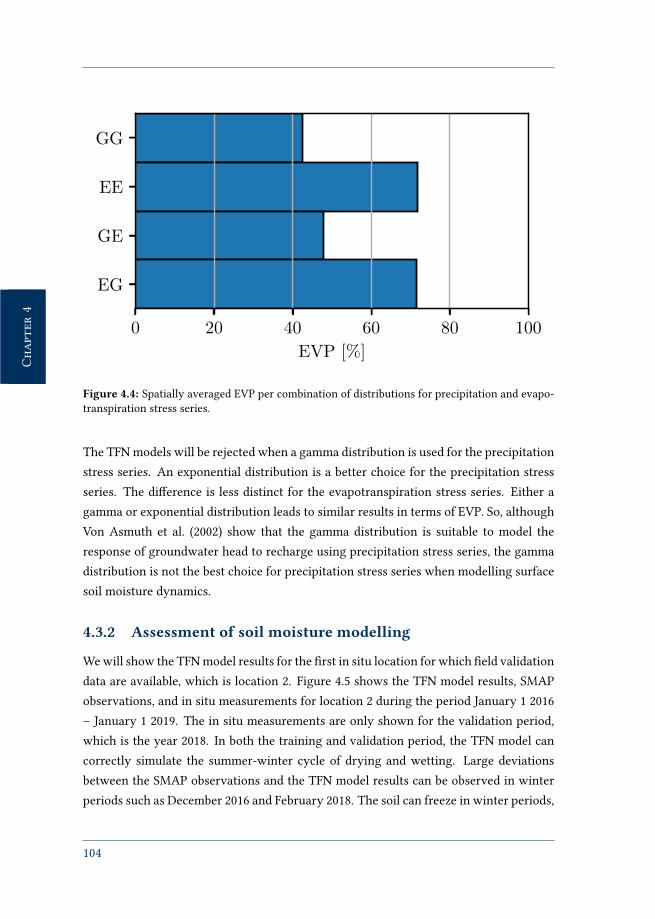
Chapter4
Chapter4
0 20 40 60 80 100
EVP [%]
GG
EE
GE
EG
Figure 4.4: Spatially averaged EVP per combination of distributions for precipitation and evapo-
transpiration stress series.
The TFN models will be rejected when a gamma distribution is used for the precipitation
stress series. An exponential distribution is a better choice for the precipitation stress
series. The di�erence is less distinct for the evapotranspiration stress series. Either a
gamma or exponential distribution leads to similar results in terms of EVP. So, although
Von Asmuth et al. (2002) show that the gamma distribution is suitable to model the
response of groundwater head to recharge using precipitation stress series, the gamma
distribution is not the best choice for precipitation stress series when modelling surface
soil moisture dynamics.
4.3.2 Assessment of soil moisture modelling
We will show the TFN model results for the �rst in situ location for which �eld validation
data are available, which is location 2. Figure 4.5 shows the TFN model results, SMAP
observations, and in situ measurements for location 2 during the period January 1 2016
– January 1 2019. The in situ measurements are only shown for the validation period,
which is the year 2018. In both the training and validation period, the TFN model can
correctly simulate the summer-winter cycle of drying and wetting. Large deviations
between the SMAP observations and the TFN model results can be observed in winter
periods such as December 2016 and February 2018. The soil can freeze in winter periods,
104
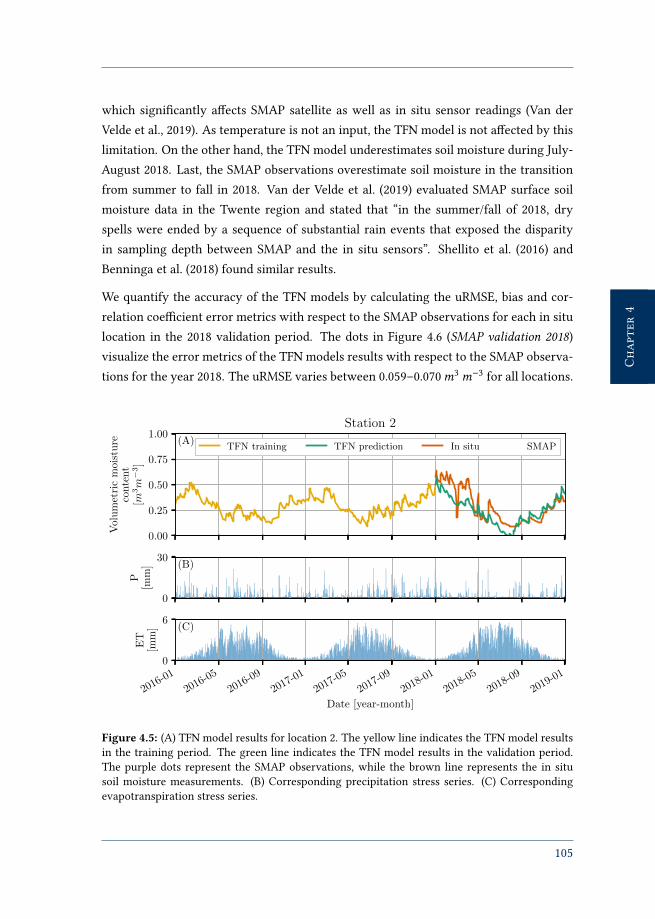
Chapter4
Chapter4
which signi�cantly a�ects SMAP satellite as well as in situ sensor readings (Van der
Velde et al., 2019). As temperature is not an input, the TFN model is not a�ected by this
limitation. On the other hand, the TFN model underestimates soil moisture during July-
August 2018. Last, the SMAP observations overestimate soil moisture in the transition
from summer to fall in 2018. Van der Velde et al. (2019) evaluated SMAP surface soil
moisture data in the Twente region and stated that “in the summer/fall of 2018, dry
spells were ended by a sequence of substantial rain events that exposed the disparity
in sampling depth between SMAP and the in situ sensors”. Shellito et al. (2016) and
Benninga et al. (2018) found similar results.
We quantify the accuracy of the TFN models by calculating the uRMSE, bias and cor-
relation coe�cient error metrics with respect to the SMAP observations for each in situ
location in the 2018 validation period. The dots in Figure 4.6 (SMAP validation 2018)
visualize the error metrics of the TFN models results with respect to the SMAP observa-
tions for the year 2018. The uRMSE varies between 0.059–0.070<3<−3 for all locations.
0.00
0.25
0.50
0.75
1.00
Vol
um
etri
cm
oist
ure
conte
nt
[m3m−
3]
Station 2
TFN training TFN prediction In situ SMAP(A)
0
30
P[m
m] (B)
2016-01
2016-05
2016-09
2017-01
2017-05
2017-09
2018-01
2018-05
2018-09
2019-01
Date [year-month]
0
6
ET
[mm
] (C)
Figure 4.5: (A) TFN model results for location 2. The yellow line indicates the TFN model results
in the training period. The green line indicates the TFN model results in the validation period.
The purple dots represent the SMAP observations, while the brown line represents the in situ
soil moisture measurements. (B) Corresponding precipitation stress series. (C) Corresponding
evapotranspiration stress series.
105
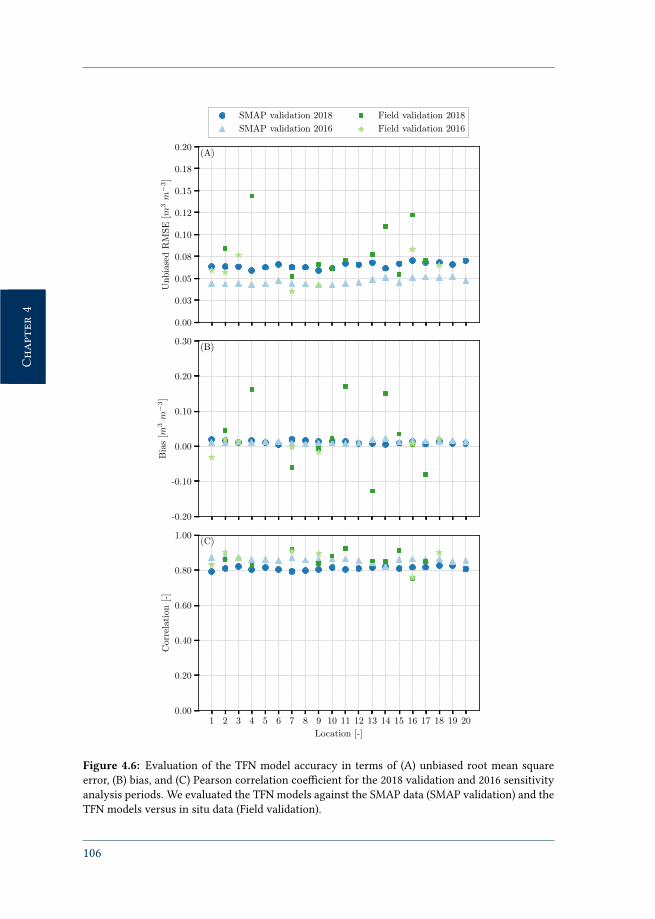
Chapter4
Chapter4
0.00
0.03
0.05
0.08
0.10
0.12
0.15
0.18
0.20
Unb
iase
dR
MS
E[m
3m−
3]
(A)
SMAP validation 2018
SMAP validation 2016
Field validation 2018
Field validation 2016
-0.20
-0.10
0.00
0.10
0.20
0.30
Bia
s[m
3m−
3]
(B)
1 2 3 4 5 6 7 8 9 10 11 12 13 14 15 16 17 18 19 20
Location [-]
0.00
0.20
0.40
0.60
0.80
1.00
Cor
rela
tion
[-]
(C)
Figure 4.6: Evaluation of the TFN model accuracy in terms of (A) unbiased root mean square
error, (B) bias, and (C) Pearson correlation coe�cient for the 2018 validation and 2016 sensitivity
analysis periods. We evaluated the TFN models against the SMAP data (SMAP validation) and the
TFN models versus in situ data (Field validation).
106
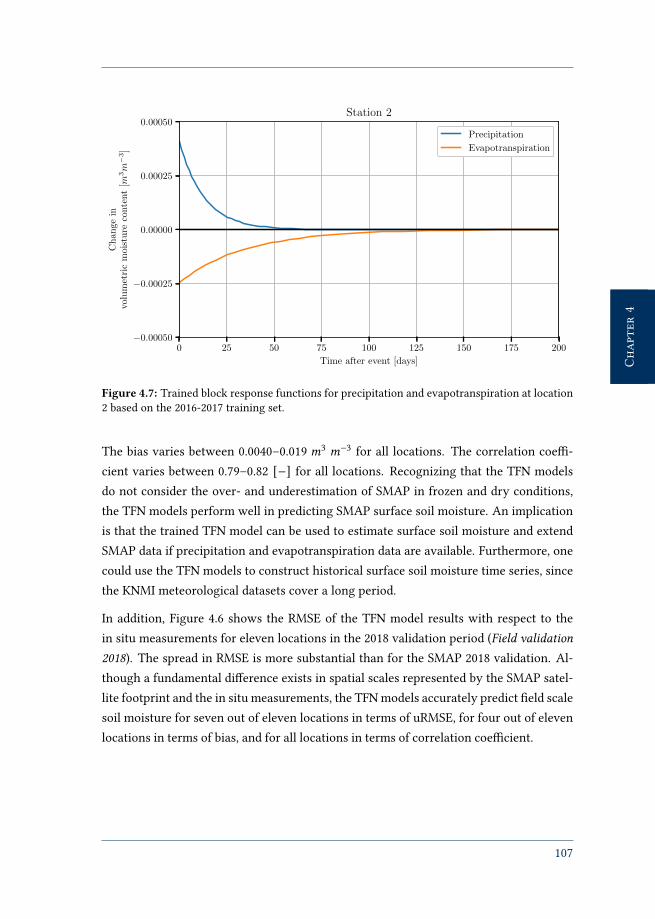
Chapter4
Chapter4
0 25 50 75 100 125 150 175 200
Time after event [days]
−0.00050
−0.00025
0.00000
0.00025
0.00050C
han
ge
invo
lum
etri
cm
ois
ture
conte
nt
[m3m−
3]
Station 2
Precipitation
Evapotranspiration
Figure 4.7: Trained block response functions for precipitation and evapotranspiration at location
2 based on the 2016-2017 training set.
The bias varies between 0.0040–0.019 <3 <−3 for all locations. The correlation coe�-
cient varies between 0.79–0.82 [−] for all locations. Recognizing that the TFN models
do not consider the over- and underestimation of SMAP in frozen and dry conditions,
the TFN models perform well in predicting SMAP surface soil moisture. An implication
is that the trained TFN model can be used to estimate surface soil moisture and extend
SMAP data if precipitation and evapotranspiration data are available. Furthermore, one
could use the TFN models to construct historical surface soil moisture time series, since
the KNMI meteorological datasets cover a long period.
In addition, Figure 4.6 shows the RMSE of the TFN model results with respect to the
in situ measurements for eleven locations in the 2018 validation period (Field validation2018). The spread in RMSE is more substantial than for the SMAP 2018 validation. Al-
though a fundamental di�erence exists in spatial scales represented by the SMAP satel-
lite footprint and the in situ measurements, the TFN models accurately predict �eld scale
soil moisture for seven out of eleven locations in terms of uRMSE, for four out of eleven
locations in terms of bias, and for all locations in terms of correlation coe�cient.
107

Chapter4
Chapter4
4.3.3 Trained IR functions
The IR functions contain valuable information on the soil moisture response to the stress
series. As described in section 4.2.1, the block response function describes the response
of soil moisture to a unit stress of one day. Figure 4.7 shows the trained block response
functions of the precipitation and evapotranspiration stresses for location 2. As expec-
ted, the precipitation stress series has a positive impact on the soil moisture state, while
the evapotranspiration stress series decreases the soil moisture state. Also, the time scale
of the precipitation stress series is smaller than the time scale of the evapotranspiration
stress series. Furthermore, the initial response of soil moisture at day one is much lar-
ger for the precipitation stress series than for the evapotranspiration stress series. Sim-
ilar observations hold for all individual locations. These �ndings are physically reason-
able, since precipitation causes immediate spikes in soil moisture, while drydown due to
evapotranspiration takes place on longer time scales.
In addition, Figure 4.7 shows that the length of the precipitation IR function for location
2 is approximately 75 days, while the evapotranspiration IR function has a length of
approximately 150 days. The length of the IR functions can be interpreted as the system
response to that speci�c stress series. The training period of two year covers this length
multiple times. Therefore, we can conclude that the training period is of su�cient length
to estimate soil moisture dynamics in the Twente region.
4.4 Discussion
4.4.1 Veri�cation of TFN modelling approach
The results show that TFN modelling using the PIRFICT method can be applied to predict
surface soil moisture conditions in the Twente region using SMAP surface soil moisture
remote sensing data as training set. As part of the TFN model veri�cation, we assess
whether the noise series show autocorrelation using the Ljung-Box statistical test (Ljung
and Box, 1978). The autocorrelation is assessed considering a signi�cance level of 0.05
[–]. The Ljung-Box test shows that no signi�cant autocorrelation is observed for all
stations. Therefore, the white noise assumption holds for all stations.
In addition, because of the data-based nature of TFN models, there is a risk in extra-
polating results to situations for which no references are available in the training set
(Von Asmuth et al., 2012). For example, the TFN model of location 2 does not capture
the extremely dry summer period of 2018 well, as seen in Figure 4.5. According to the
108
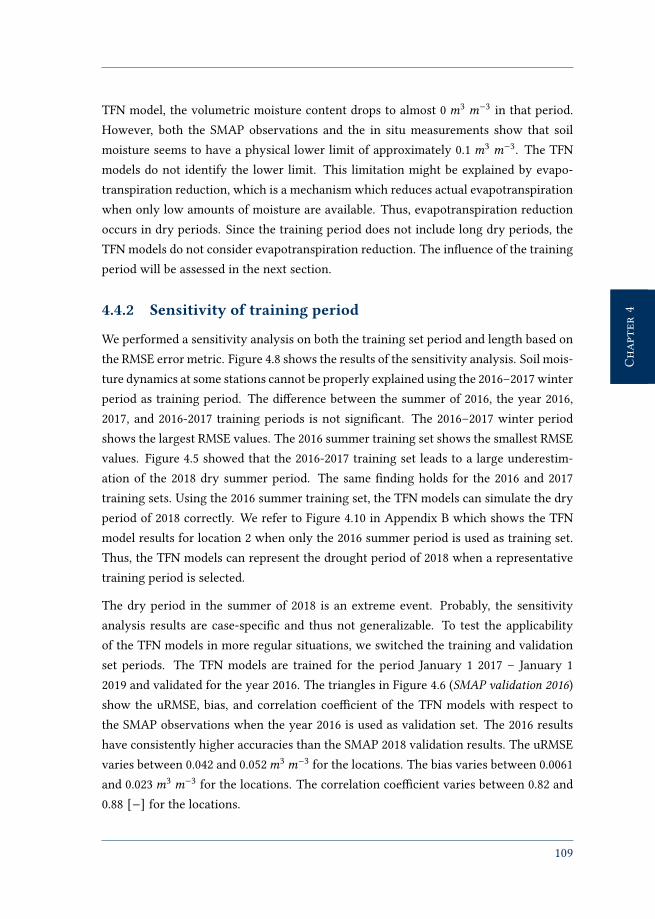
Chapter4
Chapter4
TFN model, the volumetric moisture content drops to almost 0 <3 <−3 in that period.
However, both the SMAP observations and the in situ measurements show that soil
moisture seems to have a physical lower limit of approximately 0.1 <3 <−3. The TFN
models do not identify the lower limit. This limitation might be explained by evapo-
transpiration reduction, which is a mechanism which reduces actual evapotranspiration
when only low amounts of moisture are available. Thus, evapotranspiration reduction
occurs in dry periods. Since the training period does not include long dry periods, the
TFN models do not consider evapotranspiration reduction. The in�uence of the training
period will be assessed in the next section.
4.4.2 Sensitivity of training period
We performed a sensitivity analysis on both the training set period and length based on
the RMSE error metric. Figure 4.8 shows the results of the sensitivity analysis. Soil mois-
ture dynamics at some stations cannot be properly explained using the 2016–2017 winter
period as training period. The di�erence between the summer of 2016, the year 2016,
2017, and 2016-2017 training periods is not signi�cant. The 2016–2017 winter period
shows the largest RMSE values. The 2016 summer training set shows the smallest RMSE
values. Figure 4.5 showed that the 2016-2017 training set leads to a large underestim-
ation of the 2018 dry summer period. The same �nding holds for the 2016 and 2017
training sets. Using the 2016 summer training set, the TFN models can simulate the dry
period of 2018 correctly. We refer to Figure 4.10 in Appendix B which shows the TFN
model results for location 2 when only the 2016 summer period is used as training set.
Thus, the TFN models can represent the drought period of 2018 when a representative
training period is selected.
The dry period in the summer of 2018 is an extreme event. Probably, the sensitivity
analysis results are case-speci�c and thus not generalizable. To test the applicability
of the TFN models in more regular situations, we switched the training and validation
set periods. The TFN models are trained for the period January 1 2017 – January 1
2019 and validated for the year 2016. The triangles in Figure 4.6 (SMAP validation 2016)
show the uRMSE, bias, and correlation coe�cient of the TFN models with respect to
the SMAP observations when the year 2016 is used as validation set. The 2016 results
have consistently higher accuracies than the SMAP 2018 validation results. The uRMSE
varies between 0.042 and 0.052<3<−3 for the locations. The bias varies between 0.0061
and 0.023<3 <−3 for the locations. The correlation coe�cient varies between 0.82 and
0.88 [−] for the locations.
109
Chapter4
Chapter4
Summer2016
Winter2016-2017
2016 2017 2016-20170.00
0.05
0.10
0.15
0.20
0.25
0.30
RM
SE
[m3m−
3]
Figure 4.8: The results of the sensitivity analysis illustrating the e�ect of the training period
length. The box plots show the distribution of the RMSE of the TFN model with respect to the in
situ measurements in the 2018 validation period for di�erent training periods.
Furthermore, the star shapes in Figure 4.6 (Field validation 2016) show the error metrics
of the TFN models with respect to the in situ measurements when the year 2016 is used
as validation set. No apparent change in accuracy is found for the 2016 validation results
on �eld scales, which are represented by the in situ measurements. These results indic-
ate that a training period including the extreme dry summer of 2018 will lead to more
accurate TFN models for drought predictions, especially on spatial scales similar to the
SMAP satellite footprint.
Table 4.2 shows the performance of the soil moisture TFN modelling approach in com-
parison with the SMAP validation studies of Colliander et al. (2017) and Chan et al. (2018),
as well as the data-driven soil moisture modelling approach of Kolassa et al. (2017), who
also used SMAP observations as training data. As these studies applied spatially aver-
aged results for the Twente study area, the TFN model results are also spatially aver-
aged. Especially the TFN model validated for the year 2016 performs well as shown by
the uRMSE, bias, RMSE, and correlation coe�cient error metrics. The comparison with
the data-driven approach by Kolassa et al. (2017) shows that SMAP TFN modelling for
the year 2016 has a similar accuracy.
110

Chapter4
Chapter4
Table 4.2: Spatially averaged error metrics (uRMSE, bias, RMSE, and r) for TFN model results
versus in situ measurements and a comparison with literature. NA indicates error metric is not
available. NumStat is the number of �eld stations included in the analysis.
Source Period uRMSE Bias RMSE r NumStat[<3 <−3] [<3 <−3] [<3 <−3] [-] [-]
TFN versus in situ Jan 2018 - Jan 2019 0.083 0.028 0.12 0.86 11
TFN versus in situ Jan 2016 - Jan 2017 0.060 0.0014 0.063 0.86 7
Colliander et al. (2017) Apr 2015 - Mar 2016 0.044 0.014 0.046 0.92 5
Chan et al. (2018) Apr 2015 - Oct 2016 0.056 -0.0010 0.052 0.90 5
Kolassa et al. (2017) Apr 2016 - Mar 2017 0.057 NA NA 0.70 9
4.4.3 Water system characteristics
Generally, IR functions can provide information on characteristics of the system which
is observed. Among others, these functions describe the unit step response and response
time of groundwater dynamics when a groundwater system is observed (Bakker et al.,
2008; Zaadnoordijk et al., 2018). The exponential distribution applied in this work con-
sists of two parameters: � and 0, see equation 4.6. The parameter � relates to the total
change in soil moisture volume due to a unit stress. A large � indicates a large total
change in volume. The shape parameter 0 is related to the time scale on which a unit
stress a�ects soil moisture. A large 0 indicates a fast response.
Figure 4.9 shows the trained parameters for the precipitation and evapotranspiration IR
functions for all locations based on the 2016–2017 training set. The colours indicate the
station numbering as shown in Figure 4.2. Approximately, the lower numbers are situ-
0.04 0.06 0.08 0.10
Precipitation [m3 m−3]
−0.10
−0.08
−0.06
−0.04
Eva
pot
ran
spir
atio
n[m
3m−
3] (A)
A
0 5 10 15 20
Precipitation [days]
20
25
30
35
40
Eva
pot
ran
spir
atio
n[d
ays]
(B)
a
0
5
10
15
20
Location
nr
[-]
Figure 4.9: Distribution of (A) parameter � and (B) parameter 0 of the precipitation and evapo-
transpiration IR functions. The colourbar represents the 11 stations as shown in Figure 4.2.
111
Chapter4
Chapter4
ated in the eastern part, while the higher numbers are situated in the western part of the
study area. No clear pattern can be found for parameter�, which represents the total soil
moisture change. The total change is probably related to soil physical characteristics and
vegetation dynamics. These features are quite similar for the locations in the study area,
with mainly sandy soils and grass vegetation, which is possibly why we do not observe
distinct di�erences. A valuable addition can be to study whether di�erent IR functions
and corresponding parameters are found in areas with other soil characteristics, such as
peaty or clayey areas, or areas with di�erent vegetation types.
On the other hand, a trend is seen in the spatial distribution of parameter 0, which de-
scribes the time scales of the IR functions. In general, if a large soil moisture response
time to precipitation is found at a speci�c location, the corresponding soil moisture re-
sponse time to evapotranspiration is relatively small and vice versa. The length scale
of the precipitation IR function is larger for locations in the western part of the study
area. A possible explanation is the local variation in precipitation patterns. Also, the
subsurface in the western part of the study area contains thick sand layers. Precipita-
tion in�ltrates relatively easy in sandy layers, which causes a slow response of shallow
moisture. Moraines of clay are found in the eastern part of the study area. Clay lay-
ers have low in�ltration rates, which results in a fast increase of soil moisture content.
However, more research is needed to generalize these �ndings.
Also, one should be careful in relating these parameters to physical processes as the
selection of an IR function is an assumption (Von Asmuth et al., 2012). For example,
Figure 4.7 shows that the time scale of the precipitation IR function is approximately
75 days. To our knowledge, this time scale cannot be directly connected to physical
phenomena. More research on the IR function parameters is needed to increase the
understanding of their physical meaning.
4.5 Conclusions
We studied the applicability of transfer function-noise modelling (TFN) for describing
and predicting soil moisture dynamics. TFN modelling is a fast alternative for process-
based models, taking only seconds to simulate a full year of daily soil moisture condi-
tions. TFN modelling is based on the assumption that soil moisture dynamics can be ex-
plained by linearly transforming precipitation and evapotranspiration stress series using
impulse-response (IR) functions. The SMAP L3 Enhanced surface soil moisture product
is used to train the TFN models. We found that exponential distributions describe the
112
Chapter4
Chapter4
IR functions of both the precipitation and evapotranspiration stress series better than
gamma distributions.
TFN models describe soil moisture conditions well when comparing the TFN model res-
ults with the SMAP observations. In addition, the TFN model results were compared
with in situ soil moisture measurements to assess the �eld scale applicability of TFN
modelling. The accuracy of the TFN models mainly depends on the representation of
the SMAP satellite product for that speci�c spatial scale.
A practical application for operational water management is that the TFN modelling
approach can be used to estimate soil moisture dynamics using predictions of precip-
itation and evapotranspiration. The application is promising if su�cient training data
are available, although one should be careful when interpreting results in extreme situ-
ations, since the TFN models do not consider the physical lower and upper limits of soil
moisture. However, a sensitivity analysis showed that a suitable training period can sig-
ni�cantly increase the TFN model capabilities in both regular and extreme situations.
In addition, the IR function parameters potentially provide valuable information on wa-
ter system characteristics, such as response times of soil moisture to precipitation and
evapotranspiration. However, more research on the physical meaning of the parameters
is needed to understand their applicability. Concluding, we consider the applicability of
TFN modelling for explaining soil moisture dynamics promising and propose to explore
the possibilities of TFN modelling for operationally predicting soil moisture.
Acknowledgements
This work is part of the OWAS1S research programme (Optimizing Water Availability
with Sentinel-1 Satellites) with project number 13871, which is partly �nanced by the
Netherlands Organisation for Scienti�c Research (NWO). We want to thank all OWAS1S
programme partners for their contribution. The research data are freely available at the
4TU.ResearchData repository (doi:10.4121/uuid:ba33fc56-e07b-4547-9630-9b1565d18040).
The authors want to thank the Water Resources department of the ITC faculty of the Uni-
versity of Twente, in particular Rogier van der Velde and Harm-Jan Benninga, for sharing
the in situ soil moisture measurements from their monitoring network. The authors de-
clare that they have no known competing �nancial interests or personal relationships
that could have appeared to in�uence the work reported in this chapter.
113

Chapter4
Chapter4
4.6 Appendix A
The Root Mean Square Error (RMSE) is de�ned as:
'"(� =
√√√√√ #∑9=1
(\>1B9− \?A43
9
)2
#, (4.9)
in which \>1B9 are the SMAP soil moisture measurements for each day 9 [<3 <−3], \?A43
9
are the TFN model results for each day 9 [<3<−3], and # is the number of observations
[–].
The unbiased Root Mean Square Error (uRMSE) is de�ned as:
D'"(� =
√√√√√ #∑9=1
((\>1B9− \>1B
)−
(\?A43
9− \?A43
))2
#, (4.10)
in which \>1B is the arithmetic mean of the SMAP soil moisture measurements [<3<−3]
and \?A43 is arithmetic mean of the TFN model results [<3 <−3].
The bias is de�ned as:
�80B = \>1B − \?A43 . (4.11)
The Pearson correlation coe�cient A is de�ned as:
A =
#∑9=1
((\>1B9 − \>1B
) (\?A43
9− \?A43
))√
#∑9=1
(\>1B9− \>1B
)2
√#∑9=1
(\?A43
9− \?A43
)2
. (4.12)
114

Chapter4
Chapter4
4.7 Appendix B
2016-01
2016-05
2016-09
2017-01
2017-05
2017-09
2018-01
2018-05
2018-09
2019-01
Date [year-month]
0.0
0.1
0.2
0.3
0.4
0.5
0.6
0.7
0.8
Vol
um
etri
cm
oist
ure
conte
nt
[m3m−
3]
Station 2
TFN training TFN prediction In situ SMAP
Figure 4.10: TFN model results for location 2 when the summer 2016 period is used as training
period.
115


CHAPTER 5
Discussion
117
Chapter5
Chapter5
This chapter contains a discussion on the thesis results. First, we elaborate on the sci-
enti�c implications. Next, we show several applications for water management. Last, we
focus on the applicability of the results for other practical and scienti�c areas.
5.1 Scienti�c implications
5.1.1 Spatiotemporal variability of soil moisture
Section 1.4 discussed the spatiotemporal overlap and mismatch between the three main
methods of estimating soil moisture (in situ, remote sensing, and hydrological model-
ling). Each method leads to soil moisture estimates which have to be interpreted on a
di�erent spatiotemporal scale. The three methods can complement each other, although
critical evaluations are needed when applying integral approaches.
Data from the three soil moisture estimation methods were combined in this research
to retrieve more accurate soil moisture estimates. Chapter 3 showed how regional scale
remote sensing estimates can be used to update regional scale hydrological modelling
estimates by applying a perturbed observations EnKF data assimilation scheme, as seen
in Figure 3.6. On a local scale, the impact of the data assimilation scheme largely depends
on the representativeness of the remote sensing estimates concerning the spatial scale.
Chapter 4 showed that remote sensing estimates have value on �eld and local scales,
as the TFN models represent the in situ estimates as visualized in Figures 4.5 and 4.10.
In addition, the data assimilation approach enables to translate surface soil moisture in-
formation to root zone soil moisture information, extending purely statistical methods
(e.g. Albergel et al., 2008; Carranza et al., 2018). Furthermore, the approach integrated
the remote sensing data, which are available every 2–3 days for the Twente study area,
to daily information using the hydrological model. Also, the TFN models have value
in retrieving information on days for which no remote sensing imagery is available. A
more detailed discussion of the possibilities of TFN modelling is given in Section 5.1.3.
We expect that new sources of high-resolution remotely sensed soil moisture informa-
tion, for example from Sentinel-1 satellite retrievals (Bauer-Marschallinger et al., 2019;
Benninga et al., 2019) or combining SMAP and Sentinel-1 retrievals (Das et al., 2019), will
help to increase the e�ectiveness of these methods for relating soil moisture estimates
on both regional and �eld scales.
Substantial biases exist between in situ, remote sensing, and model estimates (both
process-based and TFN). The di�erences in both the horizontal and vertical spatial scales
118
Chapter5
Chapter5
between in situ, remote sensing and hydrological modelling estimates lead to large un-
certainties in hydrological research, validation procedures and practical applications.
For example, the model results of Chapters 3 and 4 are validated using in situ soil mois-
ture estimates, which are valid on point scales. Although not investigated in this re-
search, several other approaches have been proposed to relate the various soil mois-
ture estimation methods. Ford and Quiring (2019) employed various soil moisture com-
parison and veri�cation methods to develop a comprehensive soil moisture validation
framework and assess the �delity of the three estimation methods. Crow and Wood
(2003) applied a model-based approach to upscale in situ estimates to be representative
on a satellite footprint scale. Van der Velde et al. (2019) showed the applicability of a sim-
ilar approach for the validation of a SMAP soil moisture product using the in situ soil
moisture estimates of the Twente network. Another approach is triple collocation ana-
lysis (Scipal et al., 2010; Gruber et al., 2016). Triple collocation analysis can be applied to
estimate the error structure of three soil moisture datasets (e.g. in situ, remote sensing,
and hydrological modelling) and serves as a valuable addition to harmonize the di�er-
ent spatiotemporal scales of the soil moisture estimation methods. Nonetheless, new
methods for in situ soil moisture estimation on �eld scales will have to be developed
and studied to overcome the di�erence in spatiotemporal scales. Future research should
continue to focus on developing methods to relate soil moisture estimates on various
spatiotemporal scales.
One can argue whether the soil moisture modelling assumptions and concepts applied
for point or �eld studies are still valid when moving towards regional, national, and
global studies. For example, the complexity of physical processes which have to be taken
into account di�ers when moving from �eld to larger spatial scales. Special attention is
needed during the development of soil moisture modelling tools to identify the relevant
spatiotemporal scales. Decades of research on process-based unsaturated zone mod-
elling led to complex hydrological models which heavily depend on rather coarse soil
physical and vegetation parametrizations (Vereecken et al., 2016). Chapter 3 and 4 show
that data-driven methods have the potential to integrate soil moisture information on
several spatiotemporal scales. A powerful aspect of many data-driven methods is that,
in general, they often do not need a priori assumptions on system characteristics, which
is an interesting property when studying subsurface processes. Already, data-driven
methods are an important research �eld in soil and hydrological sciences (Remesan and
Mathew, 2015). We expect that the application of these methods will keep growing,
especially with a focus on the integration with process-based modelling.
119
Chapter5
Chapter5
5.1.2 Impact of soil moisture data assimilation on otherhydrological variables
The process-based hydrological modelling framework NHI applied in Chapter 3 consists
of several coupled components related to unsaturated zone (MetaSWAP), saturated zone
(MODFLOW) and surface water dynamics (Mozart and DM). The simulations of each
component a�ect other components, see Figure 3.1. For example, Crow and Ryu (2009),
Alavi et al. (2010), Brocca et al. (2010), Koster et al. (2018), and Naz et al. (2019) showed
that the assimilation of soil moisture data not only increases the accuracy of soil moisture
simulations, but also a�ects evapotranspiration, phreatic groundwater levels, and runo�
simulations. The next sections will describe the e�ect of assimilating SMAP surface soil
moisture observations on other simulated hydrological variables within the LHM model,
such as evapotranspiration and groundwater levels.
Evapotranspiration
Zhang et al. (2016) showed that assimilating soil moisture observations in an integ-
rated hydrological model improves the accuracy of evapotranspiration model estimates.
Evapotranspiration data can help in monitoring the growth and water demand of ve-
getation, which is valuable for agricultural activities. The unsaturated zone metamodel
MetaSWAP within LHM calculates actual evapotranspiration (�)02C ) using Makkink ref-
erence crop evapotranspiration input data (�)A4 5 ). �)02C depends on root extraction
rates, which in turn depend on the availability of soil moisture. The Feddes reduction
curve introduced by Feddes et al. (1978) describes the relation between soil moisture
availability and root extraction rates.
Figure 5.1 shows two �)02C simulations of the unsaturated zone model MetaSWAP for
station 1 of the Twente in situ soil moisture monitoring network (Dente et al., 2012),
based on the simulations described in Chapter 3. Figure 3.2 displays the location of
this station within the Twente study area. Overall, the assimilation of soil moisture
estimates does a�ect the actual evapotranspiration simulations. Small di�erences can
be observed between the open loop and the data assimilation run, as can be seen in the
lower panel. The lower panel shows that the change in �)02C is not strictly positive or
negative, indicating that the model is not correcting for biases in the evapotranspiration
simulations. Remarkable is the large increase of �)02C in the EnKF run around the end of
November. A model artefact causes this peak. The model cannot solve the water balance
terms during that time step and arti�cially adds water via a model variable known as
virtual water creation. Subsequently, the remaining water volume is removed from the
120
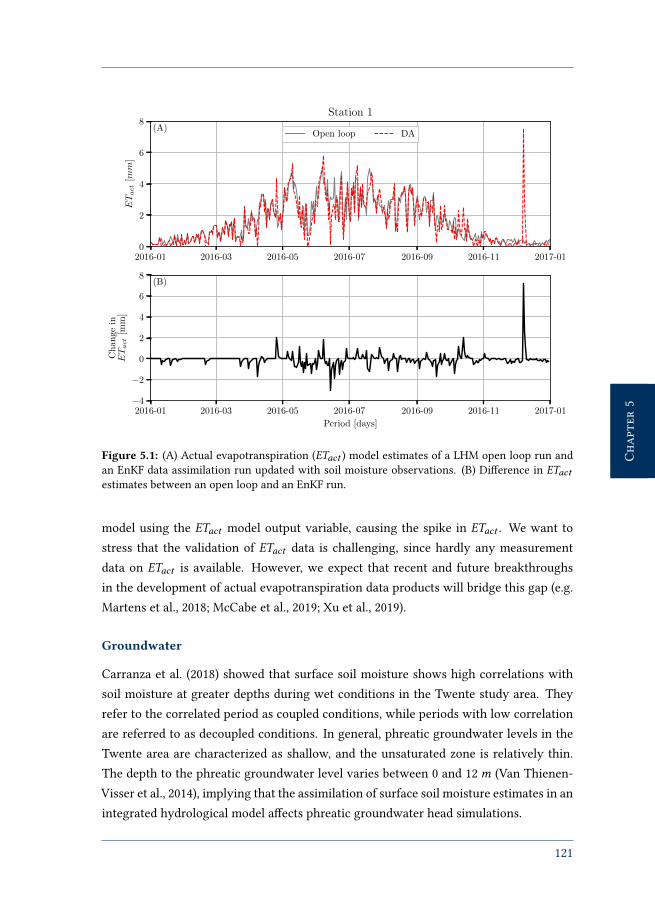
Chapter5
Chapter5
2016-01 2016-03 2016-05 2016-07 2016-09 2016-11 2017-010
2
4
6
8ETact
[mm
]
Station 1
Open loop DA(A)
2016-01 2016-03 2016-05 2016-07 2016-09 2016-11 2017-01
Period [days]
−4
−2
0
2
4
6
8
Ch
ange
inETact
[mm
]
(B)
Figure 5.1: (A) Actual evapotranspiration (�)02C ) model estimates of a LHM open loop run and
an EnKF data assimilation run updated with soil moisture observations. (B) Di�erence in �)02Cestimates between an open loop and an EnKF run.
model using the �)02C model output variable, causing the spike in �)02C . We want to
stress that the validation of �)02C data is challenging, since hardly any measurement
data on �)02C is available. However, we expect that recent and future breakthroughs
in the development of actual evapotranspiration data products will bridge this gap (e.g.
Martens et al., 2018; McCabe et al., 2019; Xu et al., 2019).
Groundwater
Carranza et al. (2018) showed that surface soil moisture shows high correlations with
soil moisture at greater depths during wet conditions in the Twente study area. They
refer to the correlated period as coupled conditions, while periods with low correlation
are referred to as decoupled conditions. In general, phreatic groundwater levels in the
Twente area are characterized as shallow, and the unsaturated zone is relatively thin.
The depth to the phreatic groundwater level varies between 0 and 12< (Van Thienen-
Visser et al., 2014), implying that the assimilation of surface soil moisture estimates in an
integrated hydrological model a�ects phreatic groundwater head simulations.
121

Chapter5
Chapter5
01-Jan-2016 01-Apr-2016 01-Jul-2016 01-Oct-2016 01-Jan-2017
Period [days]
32.00
32.50
33.00
33.50
34.00
34.50
35.00
Gro
un
dw
ater
hea
d[m
+N
AP
]
Station 9
Open loop
EnKF
Groundwater observations
Figure 5.2: Impact of MetaSWAP soil moisture data assimilation on MODFLOW groundwater
simulations for location 9 of the Twente soil moisture monitoring network. The unit of the ground-
water head is m +NAP, which is the height above the Dutch vertical reference datum.
Indeed, the assimilation of soil moisture observations a�ects simulated groundwater
levels due to the coupling of the MetaSWAP metamodel with the MODFLOW model,
as shown in Figure 3.1. Figure 5.2 shows two phreatic groundwater head simulations
of the MODFLOW model within LHM for station 9 of the in situ Twente soil mois-
ture monitoring network, based on the simulations described in Chapter 3. Note that
Figure 3.2 shows the location of this station within the Twente region. The blue line
represents groundwater observations from observation well B34F1353. The groundwa-
ter observations are obtained from DINOloket, the Dutch online database for subsurface
and groundwater data (https://www.dinoloket.nl). The black line shows the
groundwater head estimates of an open loop model run for a grid cell in which the
groundwater well is located. The red line shows the groundwater head estimates when
soil moisture observations are assimilated into the unsaturated zone model MetaSWAP
using the EnKF data assimilation scheme. Initially, the open loop run shows a large bias
with respect to the groundwater head observations. The EnKF run starts to deviate from
the open loop run in February 2016. In general, the accuracy of the EnKF run is higher
than the accuracy of the open loop run in terms of bias. Still, a large bias exists between
the EnKF run and the groundwater head observations.
These results should be interpreted with caution, as one could not expect that increasing
the accuracy of unsaturated zone �uxes would signi�cantly remove biases in groundwa-
122
Chapter5
Chapter5
ter head simulations in short term simulations. Although related, groundwater dynamics
should be studied on much longer time scales than soil moisture dynamics. Therefore, it
would make sense to update both the soil moisture state as well as groundwater heads
in a data assimilation procedure to update phreatic groundwater levels. For example,
Zhang et al. (2016) found that univariate assimilation of either soil moisture or ground-
water head states improves the accuracy of the variable being assimilated, but does not
improve the accuracy of other variables. However, they show that the simultaneous as-
similation of soil moisture and groundwater head into a hydrological model improves the
accuracy of both the soil moisture and groundwater head simulations. Similar �ndings
were found by Camporese et al. (2009b). Moreover, He et al. (2019) show that assimilating
both surface water and groundwater head observations in a process-based hydrological
model increases the accuracy of both surface water and groundwater head simulations.
Although the application of multivariate data assimilation is promising, more research is
required before implementation in operational applications. For example, multivariate
data assimilation can lead to trade-o�s. Botto et al. (2018) shows that assimilating three
related variables (pressure head, soil moisture, and subsurface out�ow) in the CATHY
hydrological model using an EnKF scheme leads to a decrease in accuracy of other hy-
drological variables which were otherwise simulated well.
Outlook
We expect that, due to the increasing availability of hydrological observations, the ap-
plicability of data assimilation schemes for operational water resources management
will increase. Lessons might be learned from the meteorological sciences, as operational
weather forecasting centres already have considerable experience with integrating data
assimilation schemes into operational modelling and forecasting systems. Conversely,
weather centres can learn from the lessons learned in terrestrial data assimilation, as
subsurface processes concerning soil moisture signi�cantly a�ect meteorological pro-
cesses (Drusch et al., 2009; De Rosnay et al., 2013).
Although national water authorities might have su�cient in-house knowledge on data
assimilation schemes, regional water authorities generally lack such knowledge. In addi-
tion, water authorities may not have access to high-capacity computing facilities which
are often needed for data assimilation schemes due to budget constraints. The emergence
of parallel computing abilities (Rajabi et al., 2018) and new cloud computing techniques
o�er solutions for real-time applications (Bürger et al., 2012; Kurtz et al., 2017; Yang et al.,
2017). Also, the Model as a Service (MaaS) concept is promising (Chen et al., 2018). MaaS
123

Chapter5
Chapter5
consists of a set of services which users such as water managers can use to quickly run
pre-built hydrological models which are run on cloud computing services. The MaaS
concept allows users to control model input and concepts and use their data for data
assimilation without having to implement data assimilation schemes themselves. An
example is the eWaterCycle project (https://www.ewatercycle.org), which
is an initiative to work collaboratively with existing hydrological models in one frame-
work. MaaS shows overlap with participatory modelling approaches, which are dis-
cussed in Section 5.2.3.
Last, the previous sections elaborated on the e�ect of soil moisture data assimilation
on updating of model state variables. Although not studied in this work, data assimila-
tion can also be used in parameter calibration studies. Several studies showed the value
of assimilating remotely sensed soil moisture information for calibrating parameters of
hydrological models (Wanders et al., 2014a; Shin et al., 2016; Baldwin et al., 2019). An
interesting application is updating of subsurface model parameters, as we found that
updating of a soil moisture state variable does not directly lead to increased accuracy
of groundwater simulations. Updating subsurface model parameters, such as hydraulic
conductivity, can lead to increased accuracy of groundwater modelling simulations as
shown by, for example, Hendricks Franssen et al. (2011).
5.1.3 Exploring the possibilities of TFN modelling
Since TFN modelling is a data-driven method, the applicability depends on the availabil-
ity of reliable training datasets. However, the sensitivity analysis performed in Chapter 4
shows that soil moisture TFN models already perform quite well using training set with a
length of half a year to one year. This �nding is an interesting property of TFN modelling
as hardly any long-term soil moisture datasets are available, besides the ESA CCI soil
moisture climate records (Gruber et al., 2019). In the following sections, we discuss four
possible TFN modelling applications which are interesting to study in the future.
Predicting soil moisture
The �tted IR functions of the TFN models can provide predictions of surface soil mois-
ture using predictions of precipitation and evapotranspiration. The Dutch meteorolo-
gical institute KNMI provides forecasts of these input variables. One could use ensemble
forecasting methods to include uncertainty aspects in the predictions. The TFN models
are especially suited for ensemble predictions due to the e�ciency and fast calculation
times. Additionally, projections of climate variability on historical time series of precip-
124
Chapter5
Chapter5
itation and evapotranspiration can be used to assess the e�ect of climate change on soil
moisture dynamics by means of scenario analyses. On the other hand, the limitations of
TFN models should be taken into account. Changes in hydrology, land use, and soil type
are not considered due to the data-driven nature of the TFN approach.
Relate IR function parameters to physical phenomena
Chapter 4 elaborates on the spatial variation of the trained IR function parameters. The
variations could not be directly attributed to physical processes and spatial characterist-
ics. However, Bakker et al. (2007) and Bakker et al. (2008) show that the parameters of
IR functions in TFN groundwater modelling can be related to physical processes such as
the change in groundwater head. However, we were not able to relate the IR function
parameters, visualized in Figure 4.9, to physical processes concerning unsaturated zone
dynamics. Therefore, more research into the relationship between the parameters of IR
functions and physical processes is needed.
Fill data gaps
The occurrence of data gaps is inherent in satellite remote sensing studies. These gaps
exist for various reasons: Firstly, data are only available during satellite overpasses. Also,
satellite sensors are prone to malfunctioning. For example, the radiometer sensor of the
SMAP satellite temporarily stopped providing data during the summer of 2019. Lastly,
soil moisture retrievals by satellites are limitedly possible in periods where temperatures
drop below the freezing point, as low temperatures a�ect the di-electric properties of soil
water. The trained TFN models described in Chapter 4 are a means to �ll the data gaps.
Figures 4.5 and 4.10 show that the TFN models accurately predict soil moisture with
respect to the in situ data on days where the SMAP satellite data are not available. Thus,
the TFN models allow estimating soil moisture conditions during these gaps.
In addition, the TFN models can help in constructing historical long-term soil moisture
datasets. One would need long term input data series of precipitation and evapotranspir-
ation for the development of such datasets. Long-term historical time series of precip-
itation and evapotranspiration are available in the Netherlands via the meteorological
institute KNMI. These time series can be used in combination with the trained IR func-
tions to construct historical soil moisture time series. The validity of such soil moisture
time series can be assessed using, for example, long-term ESA CCI soil moisture data
(Gruber et al., 2019).
125

Chapter5
Chapter5
Satellite validation studies
In situ soil moisture data are often used in remote sensing validation studies (Crow et al.,
2012; Dente et al., 2012; Wagner et al., 2013; Colliander et al., 2017; Van der Velde et al.,
2019). However, Figure 1.8 on page 40 shows that substantial di�erences in spatial scale
exist between in situ and remote sensing soil moisture estimates. The IR functions de-
rived in TFN modelling (Section 4.3.3) are interesting tools to identify which in situ data
can be used in the validation procedure, as the IR functions describe the system reaction
to input stresses. In such a study, both the IR functions for in situ and remote sensing
data should be derived. If the IR functions show similar system behaviour, the in situ
data are representative for the remote sensing footprints.
5.2 Applications for water management
We elaborate on various applications of the dissertation �ndings for water management
in the following sections.
5.2.1 Integrating evidence-based and experiential information
Chapter 2 concluded by stressing the need for the development of structured method-
ologies to increase the integration of evidence-based information in operational water
management. The structured methodologies are especially useful in mitigating the use
of the opinion-based and limited guidance bypasses as de�ned in Figure 2.1. For ex-
ample, Schuwirth et al. (2018) combine a multi-criteria decision support framework for
water quality assessments with modelling methods to predict the e�ectiveness of water
management alternatives, using scenario planning to include uncertainties concerning
climate variability and socio-economic developments. This example shows the utility of
structured methodologies for water management applications.
Decision support systems (DSSs) are tools speci�cally developed to integrate evidence-
based information in operational water resources management (Zhang et al., 2013). Al-
though several DSSs (Dutch: BOS, or beslissingsondersteunend systeem) have been de-
veloped in recent years, few examples of implementation in operational water manage-
ment are known (De Kok et al., 2008). For example, Junier and Mostert (2014) evaluated
the development and application of a DSS for the implementation of the Water Frame-
work Directive in the Netherlands. They found that the DSS was not used as much as
it was intended. Similar results were found in Chapter 2. For example, Figure 2.3 on
126

Chapter5
Chapter5
page 55 shows that hydrological models in a DSS setting are not regarded as important
in comparison with other information sources. The interviewed experts indicated that
the trust in a DSS �rmly declines if an individual decision of the DSS leads to suboptimal
water system conditions, independently of the accuracy of the DSS in other situations. In
such (often calamity) situations, the experts rather depend on their experiential under-
standing of the water system. These �ndings are supported by Fabian et al. (2019), who
found that in nature conservation management, experiential information is considered
more important than evidence-based information. We should indeed acknowledge that
hydrological modelling approaches in DSSs are representations of the real world, so
uncertainties exist in the operational application of DSSs. However, water managers
probably overestimate their ability to estimate the e�ects of local measures on catch-
ment and management area scales (Cosgrove and Loucks, 2015; Loucks and Van Beek,
2017). Therefore, structured methodologies can help to �nd a balance in applying both
evidence-based and experiential information for decision-making in operational water
management. The framework shown in Figure 2.1 on page 49 provides a guide to develop
structured methodologies.
It would be helpful to develop a methodology for building trust in DSSs to increase
their applicability. De Kok et al. (2008) state that DSSs can serve several functions: being
library systems, learning tools, discussion instruments and operational decision-making
tools. An interesting aspect would be to use these di�erent functions to increase the trust
in DSSs. Initially, a DSS can be used as a reference work and as a learning tool. Once
water managers are familiar with DSSs, they can move towards operational applications.
Furthermore, the development and integration of hydrological models in DSSs should be
based on the needs of the users, for which participatory modelling approaches should
be used. De Kok et al. (2008) describe this process as appropriate modelling. Section 5.2.3
elaborates on the value of participatory modelling in the context of this research.
5.2.2 Translating data into information
It is not su�cient to only focus on how we can integrate hydrological modelling into
operational water management. Also, we have to focus on general methods for e�ect-
ively translating and presenting information. One way of translating data into rational
information for decision-making is the use of indicators. Indicators are qualitative or
quantitative parameters which o�er spatiotemporal information. Several studies pro-
pose the use of indicators to translate data into applicable and valuable information
(Juwana et al., 2012; Maiello et al., 2015; De Girolamo et al., 2017).
127
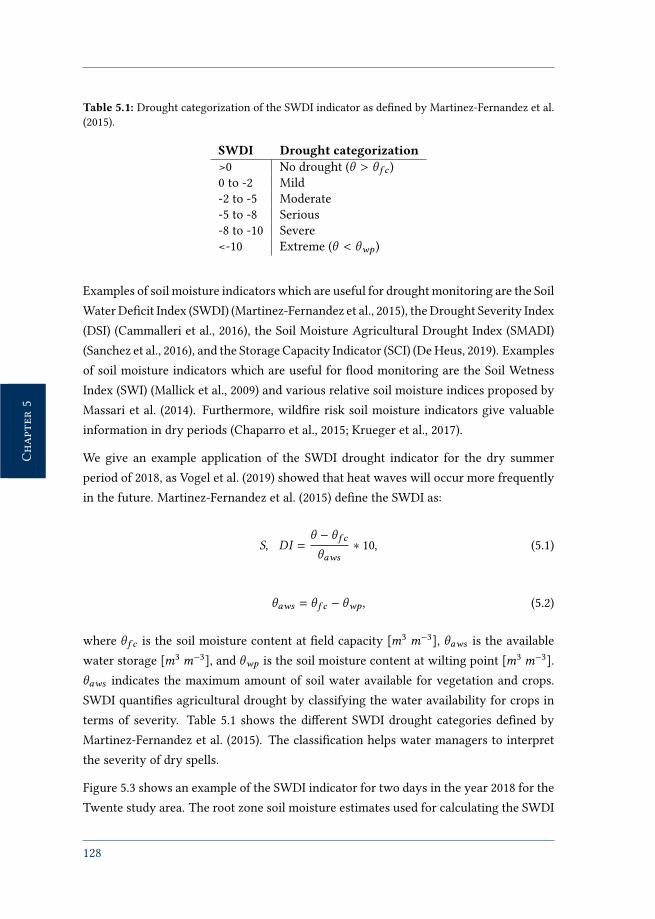
Chapter5
Chapter5
Table 5.1: Drought categorization of the SWDI indicator as de�ned by Martinez-Fernandez et al.
(2015).
SWDI Drought categorization>0 No drought (\ > \ 5 2 )
0 to -2 Mild
-2 to -5 Moderate
-5 to -8 Serious
-8 to -10 Severe
<-10 Extreme (\ < \F? )
Examples of soil moisture indicators which are useful for drought monitoring are the Soil
Water De�cit Index (SWDI) (Martinez-Fernandez et al., 2015), the Drought Severity Index
(DSI) (Cammalleri et al., 2016), the Soil Moisture Agricultural Drought Index (SMADI)
(Sanchez et al., 2016), and the Storage Capacity Indicator (SCI) (De Heus, 2019). Examples
of soil moisture indicators which are useful for �ood monitoring are the Soil Wetness
Index (SWI) (Mallick et al., 2009) and various relative soil moisture indices proposed by
Massari et al. (2014). Furthermore, wild�re risk soil moisture indicators give valuable
information in dry periods (Chaparro et al., 2015; Krueger et al., 2017).
We give an example application of the SWDI drought indicator for the dry summer
period of 2018, as Vogel et al. (2019) showed that heat waves will occur more frequently
in the future. Martinez-Fernandez et al. (2015) de�ne the SWDI as:
(,�� =\ − \ 5 2\0FB
∗ 10, (5.1)
\0FB = \ 5 2 − \F? , (5.2)
where \ 5 2 is the soil moisture content at �eld capacity [<3 <−3], \0FB is the available
water storage [<3 <−3], and \F? is the soil moisture content at wilting point [<3 <−3].
\0FB indicates the maximum amount of soil water available for vegetation and crops.
SWDI quanti�es agricultural drought by classifying the water availability for crops in
terms of severity. Table 5.1 shows the di�erent SWDI drought categories de�ned by
Martinez-Fernandez et al. (2015). The classi�cation helps water managers to interpret
the severity of dry spells.
Figure 5.3 shows an example of the SWDI indicator for two days in the year 2018 for the
Twente study area. The root zone soil moisture estimates used for calculating the SWDI
128
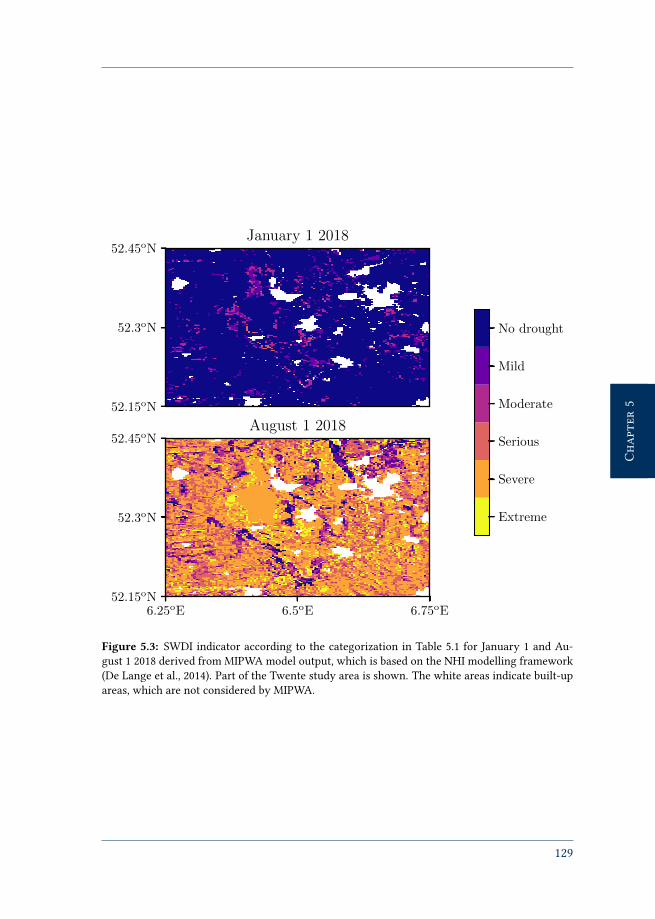
Chapter5
Chapter552.15oN
52.3oN
52.45oNJanuary 1 2018
6.25oE 6.5oE 6.75oE52.15oN
52.3oN
52.45oNAugust 1 2018
Extreme
Severe
Serious
Moderate
Mild
No drought
Figure 5.3: SWDI indicator according to the categorization in Table 5.1 for January 1 and Au-
gust 1 2018 derived from MIPWA model output, which is based on the NHI modelling framework
(De Lange et al., 2014). Part of the Twente study area is shown. The white areas indicate built-up
areas, which are not considered by MIPWA.
129

Chapter5
Chapter5
indicator, using equation 5.1, are obtained from a regional hydrological model (MIPWA),
which is part of the NHI modelling framework (De Lange et al., 2014). The concepts of
MIPWA are similar to the LHM model introduced in Chapter 3. The estimates have a
spatial resolution of 25< by 25<. Van Gurp (2016) assessed the suitability of MIPWA
for soil moisture modelling in the Twente study area. A model description can be found
in Chapter 3 and in Van Gurp (2016).
The upper panel of Figure 5.3 shows the SWDI indicator for January 1 2018, which is
a wet winter period. The lower panel shows the SWDI indicator for August 1 2018,
which is a dry summer period. Analogous to Figure 1.7, the SWDI indicator shows that
severe dry conditions existed during the 2018 summer period. The categories show that
the severity of the agricultural drought varied over the study area from a moderate to
extreme drought. The spatial distribution of the SWDI indicator allows water managers
to identify areas which need special attention. In addition, the temporal variation of the
SWDI indicator can be used to assess the development of a dry spell and the e�ectiveness
of drought measures.
De Heus (2019) validated the usefulness of the SWDI indicator for drought monitoring
in the Twente study area in cooperation with the Dutch regional water authority Vec-
htstromen. The water managers indicated that the SWDI indicator is useful to support
decision-making. In addition, the spatial distribution of SWDI helped the water man-
agers to gain new insights into the spatial variation of drought problems. Finally, the
SWDI indicator was considered as easy-to-use.
5.2.3 Participatory modelling
We discussed in Chapter 2 that water resources managers have di�culties interpreting
the output of hydrological models. As an example, the water managers indicate that they
often do not understand the assumptions behind model conceptualizations, which limits
application of hydrological modelling output. Traditionally, hydrological models are
developed and run by model developers in response to speci�c requests from decision-
makers, which Cash et al. (2006) and Feldman and Ingram (2009) describe as the loading-
dock model of decision support. Model developers prepare models, forecasts or other
information for general use without really understanding the end users’ needs, which is
another example of the science-policy gap, as discussed in Section 1.4.
A proposed method to overcome the science-policy gap regarding hydrological mod-
elling is participatory modelling. Participatory modelling is a process in which water
130

Chapter5
Chapter5
managers are actively involved in model development and simulations (Hanger et al.,
2013; Moeseneder et al., 2015). This approach helps water managers to understand the
various modelling choices, as well as model developers getting a better understanding
of the water managers’ needs. In the following, we will give three examples of particip-
atory modelling approaches which were applied in the context of this dissertation. Last,
we will re�ect on the application of participatory modelling.
Firstly, we applied a participatory modelling approach in Chapter 4. An exploratory
study was conducted in cooperation with the Dutch regional water authority Vechtstro-
men. A student of the University of Twente was positioned at the regional water author-
ity for ten weeks, during which he focused on the development of an initial version of
the TFN models described in Chapter 4. The student worked in close cooperation with
water managers at the regional water authority. The authors of this work supervised the
student. The student and water managers regularly met to discuss the intermediate mod-
elling results. During these meetings, the student presented the recent �ndings, and the
water managers had the opportunity to provide feedback. The �nal results helped the
regional water authority in identifying the possibilities of TFN modelling for application
in operational water management (Rorink, 2019). Furthermore, the student had various
recommendations which helped to improve the work presented in Chapter 4.
Another example is the validation of a new hydrological subsurface model for the Dutch
regional water authority Aa en Maas. This regional water authority shows interest in the
application of soil moisture information to increase water management e�ectiveness. In
this context, an in situ soil moisture and temperature monitoring network consisting of
15 locations was developed and installed in cooperation with members of the OWAS1S
project team early 2016. The network is situated in the Raam catchment, which is located
in the management area of Aa en Maas. The location is shown in Figure 1.5. Benninga
et al. (2018) describe the development and characteristics of the Raam monitoring net-
work. All data from the network are freely available and have already resulted in several
studies concerning soil moisture applications (Droesen, 2017; Martens et al., 2018; Air-
langga and Liu, 2019; Carranza et al., 2019). The development of the network also led
to increasing interest in the forecasting of soil moisture and groundwater conditions by
the regional water authority, which led to the development of a new subsurface model-
ling instrument for Aa en Maas. A student of Wageningen University & Research was
positioned at the regional water authority and at the research institute Deltares where
the modelling instrument is developed. The student used the soil moisture data from
the network to validate model output (Droesen, 2017). Next, the student discussed his
131

Chapter5
Chapter5
�ndings in meetings with water managers from the regional water authority and model
developers. Among others, this led to the selection of di�erent model input data concern-
ing soil physical characteristics. Furthermore, the �ndings of the student contributed to
the research methodology applied in Chapter 3.
Last, the MetaSWAP-OpenDA data assimilation framework applied in Chapter 3 was
developed using a participatory approach. The coupling of the operational hydrological
modelling instrument with the data assimilation framework is a result of a coopera-
tion with a research institute (Deltares), a consultancy �rm (HKV), and the authors of
this work. During meetings with the software developers of the OpenDA framework,
several code requirements were set. Based on these requirements, the software de-
velopers developed new software code which was subsequently tested by the user, who
in turn gave feedback to the software developers. As a �nal product, the MetaSWAP-
OpenDA framework was added to the o�cial release of the OpenDA software (http://www.openda.org/). The source code of the software can be found at https://github.com/OpenDA-Association/OpenDA.
The three examples give a good overview of how participatory modelling approaches
can help to increase the accuracy and applicability of hydrological models in opera-
tional water management. The participatory approach leads to feedback loops between
developers and water managers. Furthermore, the frequent meetings with water man-
agers help them become familiar with the processes and di�erent spatiotemporal scales
concerning soil moisture. In addition, water managers often consider hydrological mod-
els as unreliable for operational water resources management, as was found in Chapter 2.
Participatory modelling will help to increase the trust of water managers in hydrological
modelling approaches. In our opinion, model developers, policy-makers, and water man-
agers should be encouraged to invest in participatory modelling approaches.
Participatory modelling becomes increasingly included in hydrological model develop-
ment. For example, the hydrological models based on the NHI modelling framework,
such as the LHM model used in Chapter 3 and the MIPWA model discussed in Figure 5.3,
have been developed using a participatory approach (De Lange et al., 2014). However,
the people from the water authorities and other participating stakeholder organisations
who help to develop the models are not always the people who have to apply the models
in operational settings. Hence, it is vital that the right people from the water authorities
and stakeholder organisations are involved in the modelling process.
132

Chapter5
Chapter5
5.3 Link to other research areas
Integrating new information in water management
The �ndings of this study show that integrating new information sources in water man-
agement is not just a matter of technical advances. Although the developers of new
information may have su�cient knowledge and experience to develop understandable
forms of information, external forces largely determine if such information is imple-
mented in water management (Junier and Mostert, 2014). Indeed, several studies stress
that the social aspect plays a large role in the integration of new information sources
in water management (e.g. Junier and Mostert, 2014; Leskens et al., 2014). Individually,
the technical and social aspects have been studied extensively. To develop a consistent
framework for integrating new information in water management, we should focus on
integrating both the technical and social aspects. Participatory modelling approaches as
described in Section 5.2.3 show great potential.
Additionally, serious gaming methods allow water managers to become familiar with
new technological advances and simultaneously build trust in new water management
methodologies (Den Haan et al., 2019). Furthermore, the storylines developed within
the Dutch RiverCare project (https://kbase.ncr-web.org/rivercare/storylines-overview) are an interesting development. The storylines can be
used to get an easy-to-interpret overview of new methodologies, results, and applic-
ations of research output, allowing water managers to relate the new �ndings to their
management challenges (Cortes Arevalo et al., 2018). Such methods are also proposed by
Fabian et al. (2019) to increase the application of evidence-based information in nature
conservation management.
Soil moisture data assimilation for meteorological research
The land surface part of operational weather forecast modelling instruments is often
bounded by the unsaturated zone, as the availability of soil moisture in�uences evapo-
transpiration processes. The �ndings of Chapter 3 may help in increasing the accuracy
of meteorological forecasting, as operational assimilation of soil moisture information
can improve both regional and local soil moisture model estimates. Since data assimil-
ation schemes are already extensively used in operational numerical weather forecast-
ing, it should be relatively easy to include soil moisture data assimilation in such sys-
tems (Drusch et al., 2009; De Rosnay et al., 2013). SWM-EVAP is an example of a pro-
ject currently focusing on such applications. More information concerning this project
133
Chapter5
Chapter5
can be found at https://www.knmi.nl/over-het-knmi/nieuws/onderzoek-naar-verdamping-voor-beter-waterbeheer.
Describing physical systems using TFN modelling
TFN modelling is already used for groundwater modelling applications. The �ndings on
TFN models in this research show potential for application in other research �elds. The
development of the PIRFICT method (Von Asmuth et al., 2002; Von Asmuth and Bierkens,
2005) lead to easier-to-implement TFN models, as the model identi�cation stage usually
needed in TFN modelling (Box and Jenkins, 1970) does not have to be performed. As
shown in Chapter 4, TFN models can describe both linear and non-linear systems. In
theory, they can be developed for each process or variable which can be described using
a set of input time series. The in�uence of each input time series on the desired process
or variable has to be described using a relatively simple statistical distribution function.
Furthermore, su�cient training data must be available. As a general rule of thumb, the
training data must at least cover the memory of the observed system.
As TFN models are powerful in the sense that they need limited computational require-
ments, these models have potential in research �elds focusing on hydraulic and mor-
phological systems. Model simulations in these �elds are generally computationally de-
manding, so often idealized modelling approaches (e.g. Campmans et al., 2017; Reef et al.,
2018; Damveld et al., 2019) and meta-modelling or emulation methods (e.g. Berends et al.,
2018; Bomers et al., 2019) are often applied to study system processes. TFN modelling is a
promising extension to these methods, e.g. for predictions and uncertainty assessments
using ensemble methods.
134

CHAPTER 6
Conclusions and recommendations
135
Chapter6
Chapter6
6.1 Conclusions
We answer the research questions, formulated in Section 1.5, in the following section.
Research question 1
To what degree are hydrological models currently applied in operational watermanagement and how can their applicability be increased for operational water
management?
Chapter 2 focused on the current application of experiential and evidence-based inform-
ation in Dutch regional operational water management. A framework was developed to
identify which information is used by regional operational water managers, also referred
to as decision-makers. We found that water managers use evidence-based information
in the form of measurement data, system knowledge, meteorological forecasts, hydro-
logical models, and legislation. However, operational water managers also considerably
depend on experiential information, which may lead to opinion-based bypasses. Further-
more, water managers often take limited guidance bypasses (not taking into account all
available information), as they are limited due to time and budget constraints. In addi-
tion, regional operational water managers often regard evidence-based information in
the form of hydrological models as unreliable for decision-making in operational water
resources management. To improve the applicability of hydrological models, both sci-
entists and decision-makers should focus on several aspects. Decision-makers should
focus on developing structured methodologies for interpreting both evidence-based and
experiential information. Researchers have to focus on delivering the appropriate in-
formation in an understandable format at the right moment in time. Furthermore, edu-
cating decision-makers on hydrological model concepts and assumptions may help to
increase the understanding of the relationship between model results, implications for
water management, and what water managers observe in the �eld. The latter aspect will
also help water managers to understand the inherent uncertainties related to hydrolo-
gical modelling. Participatory approaches, serious gaming, and storylines show great
potential to build trust in new technological advances in hydrological modelling.
Research question 2
To what extent can the assimilation of a high-resolution remotely sensed surface soilmoisture product increase the accuracy of an unsaturated zone hydrological metamodel?
Chapter 3 focused on the utilization of high-resolution remotely sensed soil moisture
136
Chapter6
Chapter6
information for process-based modelling. We found that integrating satellite-based soil
moisture observations and hydrological metamodel simulations using a data assimilation
scheme leads to new opportunities for operational water resources management. The
Bayesian background of data assimilation schemes allows combining the uncertainties
of both the remotely sensing data and soil moisture simulations into a new soil moisture
estimate of larger accuracy. A perturbed observations Ensemble Kalman Filter (EnKF)
was used to assimilate SMAP satellite L3 Enhanced surface soil moisture estimates into
the unsaturated zone metamodel MetaSWAP as part of the Netherlands Hydrological
Instrument (NHI). First, a synthetic experiment, commonly referred to as a twin experi-
ment, showed the value of applying an EnKF data assimilation scheme for state updating
of the MetaSWAP metamodel. Then, a data assimilation run was performed using the
SMAP surface soil moisture product for the year 2016. On a regional scale, the updated
soil moisture model simulations show a larger skill in terms of root mean square error
(RMSE) and model bias. The skill of the updated model simulations slightly decreases
in terms of correlation coe�cient, which can be explained by the larger variability of
the assimilated SMAP observations with respect to the in situ validation data. On a
local scale, the skill of updated soil moisture model simulations mainly depends on how
well the SMAP surface soil moisture observations represent local �eld conditions. A
particular challenge concerning soil moisture remote sensing is that satellite-retrieved
soil moisture is generally limited to the upper part of the soil. The results presented
in Chapter 3 show that the assimilation of surface soil moisture observations has value
in updating root zone soil moisture model simulations. We expect that recent and up-
coming developments in high-performance computing, data storage and data processing
facilities will increase the applicability of data assimilation methods for operational wa-
ter resources management. These developments will help operational water managers
to get an up-to-date overview of water system conditions.
Research question 3
To what extent can data-driven modelling, based on high-resolution remote sensing data,be used to provide up-to-date soil moisture information for operational water
management?
Chapter 4 focused on a novel data-driven method for soil moisture modelling. We stud-
ied the applicability of transfer function-noise (TFN) modelling for explaining soil mois-
ture conditions. We found that exponential distributions can be used to de�ne impulse-
response (IR) functions, which describe the response of soil moisture to precipitation
137

Chapter6
Chapter6
and reference evapotranspiration stress series. The TFN models were able to describe
soil moisture dynamics using the SMAP L3 Enhanced surface soil moisture product as
training data. In terms of RMSE, the TFN models shows similar accuracies with re-
spect to the SMAP data. Also, the TFN models have value on �eld scales if the SMAP
training data is representative for that particular scale. One should note that the avail-
ability of training data has a considerable e�ect on the TFN model results, especially in
extreme situations. A sensitivity analysis on the training period length showed that se-
lecting a suitable training period can positively a�ect the capabilities of the TFN model
in extreme situations. Furthermore, the parameters of the IR functions describe water
system characteristics, although more research is needed to relate the parameters to
physical phenomena. Concluding, TFN models are fast and easy-to-construct alternat-
ives for process-based modelling and can help in retrieving up-to-date information on
water system conditions in water management. Several promising applications of TFN
soil moisture modelling were identi�ed in Chapter 5, such as ensemble predictions of
soil moisture, the reconstruction of historical soil moisture time series, �lling of data
gaps and satellite validation studies.
Synthesis
The general research aim was to show the potential use of soil moisture information
as part of operational water resources management systems, in particular hydrological
models, using high-resolution remote sensing data. Besides the �ndings of Chapter 3
and Chapter 4, we have shown possible applications of in situ, remotely sensed and hy-
drological modelling based soil moisture information for operational water management
in Chapter 5. Furthermore, we have identi�ed several means for the integration of new
information in water management applications. We expect that, in the near future, the
increasing availability of high-resolution soil moisture data and the increasing availabil-
ity of computational power will lead to promising possibilities for research and practical
applications. Therefore, we want to give several recommendations for further research
and water management applications in the next section.
138
Chapter6
Chapter6
6.2 Recommendations
6.2.1 Scienti�c implications
Estimating soil moisture conditions on various spatiotemporal scales
The various applications in this work show the utility of soil moisture information for
hydrological applications. Although the dissertation explored various ways to relate in
situ, remote sensing and hydrological modelling estimates, substantial di�erences exist
between the di�erent spatial and temporal scales of these methods. Therefore, research
should continue to focus on developing new methods to bridge the gap between �eld,
regional, national and global soil moisture scales. Research should focus on which spati-
otemporal scales are needed to solve speci�c issues related to water management. Also,
the relationship between surface soil moisture and deeper soil layers should be extens-
ively studied. As process-based methods are often complex, data-driven methods show
great potential to link these spatiotemporal scales.
Explore potential of multivariate data assimilation
Chapter 3 showed that the univariate assimilation of surface soil moisture estimates into
an unsaturated zone model improved root zone soil moisture simulations. Section 5.1.2
elaborated on the e�ect of the soil moisture assimilation on other hydrological vari-
ables. Increasing the accuracy of soil moisture simulations had a small e�ect on actual
evapotranspiration simulations, and slightly increased the accuracy of phreatic ground-
water level simulations in terms of bias. In particular, multivariate data assimilation ap-
proaches seem promising to update multiple hydrological variables in subsurface mod-
elling. We recommend exploring the assimilation of both soil moisture and groundwater
observations. Moreover, the opportunities of using �eld scale remote sensing soil mois-
ture observations for data assimilation schemes should be studied, as we expect that such
high-resolution estimates will become increasingly available in the near future.
Improve groundwater modelling using model parameter updating
Updating soil moisture state variables did not lead to a signi�cant increase in accuracy
of groundwater simulations. We encourage exploring the value of soil moisture data
assimilation for updating of subsurface model parameters used by the saturated zone
model MODFLOW as part of the NHI hydrological modelling framework. The OpenDA-
MetaSWAP data assimilation framework, developed and introduced in Chapter 3, allows
both updating of model state variables and parameters. In particular, we recommend to
139
Chapter6
Chapter6
explore the value of data assimilation for updating subsurface model parameters such as
hydraulic conductivity, as such parameters are generally not observable.
Explore possibilities of TFN modelling
As TFN models are fast and easy to develop, they form competent alternatives for process-
based models. Section 5.1.3 elaborated on various possible applications of TFN modelling
for soil moisture modelling. In particular, it would be valuable to explore the possibilit-
ies for predicting soil moisture. As TFN models are fast, combining them with ensemble
predictions can help in identifying the uncertainties of soil moisture modelling. Further-
more, the parameters of the IR functions can help water managers to identify regions in
their management area which respond either fast or slow on input stresses like precipita-
tion. Such �ndings would help water managers to adapt water management practices on
a local scale. Also, the IR functions of both satellite and in situ soil moisture data can be
compared. The similarities or di�erences in system responses between the IR functions
provide valuable information on the overlap of spatiotemporal scales between satellite
and in situ data. Next, the SMAP satellite experienced malfunctioning in July 2019. The
TFN models can help in �lling the data gaps caused by the malfunctioning. Similarly,
when long-term datasets of stress series are available, one could develop historical soil
moisture time series. KNMI provides precipitation and crop reference evapotranspira-
tion up to tens of years back in time. The long-term historical soil moisture time series
can be used to study the e�ect of the changing climate on subsurface hydrology.
6.2.2 Practical implications
Develop structured methodologies
To integrate both evidence-based and experiential information in decision-making, we
encourage the development of structured methodologies for operational water resources
management. Structured methodologies will help to take robust and reliable decisions
based on both evidence-based and experiential information. The increasing development
of decision support systems, including hydrological model forecasting applications, are
a good starting point and should be encouraged. We should continue assessing whether
such systems provide the correct information in understandable formats to the right
people by re-identifying the needs of water managers. Furthermore, we should invest
in studies on how we can transfer uncertainty concepts to decision-makers, building
on studies like Walker et al. (2003), Morss et al. (2005), Beven and Alcock (2012), and
Warmink et al. (2017).
140
Chapter6
Chapter6
Collect soil moisture data for operational water management settings
As national and regional water authorities show interest in using soil moisture informa-
tion, we encourage to increase the collection of soil moisture �eld measurements. Such
information would help in interpreting both remote sensing and hydrological model es-
timates and require relatively small investments. For example, the Dutch National Com-
mittee for Water Distribution (Landelijke Coördinatiecommissie Waterverdeling, LCW ),
issues a drought report (droogtemonitor) every month. Soil moisture information is a
valuable addition to this report. We have to create long-term soil moisture datasets with
a length of at least a couple of years to perform anomaly analyses. Also, both process-
based and data-driven modelling methods generally need as much input and validation
data as possible. Furthermore, the increasing availability of long-term in situ soil mois-
ture data would have great value for satellite validation studies and would increase our
understanding of climate change e�ects on the hydrology of the soil subsurface.
Apply new remote sensing data in operational settings
Analogous to the research framework (Figure 1.9), we recommend testing various applic-
ations of soil moisture remote sensing data for operational water management. Dutch
water authorities are already investing in remote sensing by buying tailor-made remote
sensing data. Also, the Netherlands Space O�ce maintains an online database consisting
of already processed remote sensing data which can be freely downloaded and used: https://www.spaceoffice.nl/nl/satellietdataportaal. Addition-
ally, the European Union and ESA developed Copernicus, the European Earth Obser-
vation Programme. A primary aim of Copernicus is the development of the Sentinel
satellite family, which provide satellite data for various applications in the earth sci-
ences. The Sentinel DataHub allows easy access to the Sentinel data: https://scihub.copernicus.eu/dhus. Subsequently, water managers are encouraged to use
the data in their daily practices to discover the utilization possibilities. This work shows
that such remote sensing data have value in data assimilation procedures (Chapter 3)
and data-driven modelling approaches (Chapter 4). We invite water managers to con-
tinue executing such ideas and see great potential in participatory approaches to merge
the knowledge of scientists, businesses, and decision-makers.
Enable easy access of soil moisture data and other relevant datasets
Various initiatives exist to publicly share soil moisture data, like the International Soil
Moisture Network. Both national and regional water authorities should support these
141

initiatives. Furthermore, we encourage the inclusion of relevant datasets, for example,
indicators based on soil moisture data.
Invest in innovative information technology (IT) infrastructure
The increasing availability of high-resolution remote sensing data and hydrological mod-
elling leads to increasing requirements for data storage and processing facilities, high-
capacity computational environments, decision support systems, and many other IT ap-
plications. Water authorities and institutes should not underestimate the need to invest
in required infrastructural developments. As such systems are still quite expensive, it
might be helpful to seek collaborations, e.g. to start national, supranational, or even
global initiatives for developing IT infrastructure.
Educate water managers
During the execution of this research, we often found that operational water managers
in the Netherlands are not very familiar with the concepts of soil moisture processes.
Also, they are often either not familiar with or interested in new scienti�c develop-
ments. Consequently, water managers might take the opinion-based bypass (Figure 2.1),
which leads to sub-optimal decisions. To increase the understanding of water managers
and to inform them about recent developments, water managers must be encouraged to
embrace new technological advances and have to be educated accordingly. New ways
of presenting scienti�c �ndings, like innovative ways of presenting information in de-
cision support systems, can help in educating water managers. Not only researchers,
but also business �rms can help to improve this aspect. Hydrologists, operational water
managers as well as policy makers should be included in this process. Finally, a better
understanding of the physical concepts and processes by water managers would help
the integration of soil moisture information in operational water management.
142

Bibliography
Acreman, M., 2005. Linking science and decision-making: features and experience from environ-
mental river �ow setting. Environmental Modelling & Software 20, 99–109. doi:10.1016/j.envsoft.2003.08.019.
Actueel Hoogtebestand Nederland, 2019. Dataset: Actueel Hoogtebestand Nederland. Retrieved
from http://www.ahn.nl/.
Airlangga, G., Liu, A., 2019. Initial machine learning framework development of agriculture cyber
physical systems. Journal of Physics: Conference Series 1196, 012065. doi:10.1088/1742-6596/1196/1/012065.
Alavi, N., Berg, A.A., Warland, J.S., Parkin, G., Verseghy, D., Bartlett, P., 2010. Evaluating the im-
pact of assimilating soil moisture variability data on latent heat �ux estimation in a land surface
model. Canadian Water Resources Journal 35, 157–172. doi:10.4296/cwrj3502157.
Albergel, C., Rüdiger, C., Pellarin, T., Calvet, J.C., Fritz, N., Froissard, F., Suquia, D., Petitpa, A.,
Piguet, B., Martin, E., 2008. From near-surface to root-zone soil moisture using an exponential
�lter: an assessment of the method based on in-situ observations and model simulations. Hy-
drology and Earth System Sciences 12, 1323–1337. doi:10.5194/hess-12-1323-2008.
Arcadis, 2019. Evaluatie droogte 2018: Waterschap Rijn en IJssel. Technical Report. Arcadis.
Ascough, J.C., Maier, H.R., Ravalico, J.K., Strudley, M.W., 2008. Future research challenges for in-
corporation of uncertainty in environmental and ecological decision-making. Ecological Mod-
elling 219, 383–399. doi:10.1016/j.ecolmodel.2008.07.015.
Bakker, M., Maas, K., Schaars, F., von Asmuth, J.R., 2007. Analytic modeling of groundwater
dynamics with an approximate impulse response function for areal recharge. Advances in
Water Resources 30, 493–504. doi:10.1016/j.advwatres.2006.04.008.
Bakker, M., Maas, K., Von Asmuth, J.R., 2008. Calibration of transient groundwater models using
143

time series analysis and moment matching. Water Resources Research 44. doi:10.1029/2007wr006239.
Bakker, M., Schaars, F., 2019. Solving groundwater �ow problems with time series analysis: You
may not even need another model. Ground Water doi:10.1111/gwat.12927.
Baldwin, D., Manfreda, S., Lin, H., Smithwick, E.A.H., 2019. Estimating root zone soil moisture
across the eastern United States with passive microwave satellite data and a simple hydrologic
model. Remote Sensing 11. doi:10.3390/rs11172013.
Balsamo, G., Agusti-Panareda, A., Albergel, C., Arduini, G., Beljaars, A., Bidlot, J., Bousserez, N.,
Boussetta, S., Brown, A., Buizza, R., Buontempo, C., Chevallier, F., Choulga, M., Cloke, H.,
Cronin, M., Dahoui, M., De Rosnay, P., Dirmeyer, P., Dutra, M., Ek, M., Gentine, P., Hewitt,
H., Keeley, S., Kerr, Y., Kumar, S., Lupu, C., Mahfouf, J.F., McNorton, J., Mecklenburg, S., Mo-
gensen, K., Muñoz-Sabater, J., Orth, R., Rabier, F., Reichle, R., Ruston, B., Pappenberger, F.,
Sandu, I., Seneviratne, S., Tietsche, S., Trigo, I., Uijlenhoet, R., Wedi, N., Woolway, R., Zeng, X.,
2018. Satellite and in situ observations for advancing global earth surface modelling: A review.
Remote Sensing 10, 2038. doi:10.3390/rs10122038.
Balugani, E., Lubczynski, M.W., Reyes-Acosta, L., van der Tol, C., Frances, A.P., Metselaar, K.,
2017. Groundwater and unsaturated zone evaporation and transpiration in a semi-arid open
woodland. Journal of Hydrology 547, 54–66. doi:10.1016/j.jhydrol.2017.01.042.
Bastiaanssen, W., Pelgrum, H., Roerink, G., Soeterik, K., 2001. Soil moisture conditions in the
Netherlands during the summer of 1995 interpreted from satellite measurements, in: Van Dijk,
A., Bos, M.G. (Eds.), GIS and Remote Sensing Techniques in Land- and Water-management.
Springer Netherlands, Dordrecht, pp. 69–86. doi:10.1007/978-94-009-0005-9_6.
Bauer-Marschallinger, B., Freeman, V., Cao, S., Paulik, C., Schau�er, S., Stachl, T., Modanesi, S.,
Massari, C., Ciabatta, L., Brocca, L., Wagner, W., 2019. Toward global soil moisture monitoring
with Sentinel-1: Harnessing assets and overcoming obstacles. IEEE Transactions on Geoscience
and Remote Sensing 57, 520–539. doi:10.1109/tgrs.2018.2858004.
Benninga, H.F., Carranza, C.D.U., Pezij, M., van Santen, P., van der Ploeg, M.J., Augustijn, D.C.M.,
van der Velde, R., 2018. The Raam regional soil moisture monitoring network in the Netherlands.
Earth Syst. Sci. Data 10, 61–79. doi:10.5194/essd-10-61-2018.
Benninga, H.F., Van der Velde, R., Su, Z., 2019. Impacts of radiometric uncertainty and weather-
related surface conditions on soil moisture retrievals with Sentinel-1. Remote Sensing 11.
doi:10.3390/rs11172025.
Berends, K.D., Warmink, J.J., Hulscher, S.J.M.H., 2018. E�cient uncertainty quanti�cation for
impact analysis of human interventions in rivers. Environmental Modelling & Software 107,
50–58. doi:10.1016/j.envsoft.2018.05.021.
144

Beven, K.J., 2016. Facets of uncertainty: epistemic uncertainty, non-stationarity, likelihood, hy-
pothesis testing, and communication. Hydrological Sciences Journal 61, 1652–1665. doi:10.1080/02626667.2015.1031761.
Beven, K.J., Alcock, R.E., 2012. Modelling everything everywhere: a new approach to decision-
making for water management under uncertainty. Freshwater Biology 57, 124–132. doi:10.1111/j.1365-2427.2011.02592.x.
Beven, K.J., Binley, A., 1992. The future of distributed models: Model calibration and uncertainty
prediction. Hydrological Processes 6, 279–298. doi:10.1002/hyp.3360060305.
Blyverket, J., Hamer, P.D., Bertino, L., Albergel, C., Fairbairn, D., Lahoz, W.A., 2019. An evaluation
of the EnKF vs. EnOI and the assimilation of SMAP, SMOS and ESA CCI soil moisture data over
the contiguous US. Remote Sensing 11, 478. doi:10.3390/rs11050478.
Bomers, A., Schielen, R.M.J., Hulscher, S.J.M.H., 2019. Application of a lower-�delity surrogate
hydraulic model for historic �ood reconstruction. Environmental Modelling & Software 117,
223–236. doi:10.1016/j.envsoft.2019.03.019.
Boogerd, A., Groenewegen, P., Hisschemöller, M., 1997. Knowledge utilization in water man-
agement in the Netherlands related to desiccation. JAWRA Journal of the American Water
Resources Association 33, 731–740. doi:10.1111/j.1752-1688.1997.tb04100.x.
Borowski, I., Hare, M., 2006. Exploring the gap between water managers and researchers: di�-
culties of model-based tools to support practical water management. Water Resources Man-
agement 21, 1049–1074. doi:10.1007/s11269-006-9098-z.
Botto, A., Belluco, E., Camporese, M., 2018. Multi-source data assimilation for physically based
hydrological modeling of an experimental hillslope. Hydrol. Earth Syst. Sci. 22, 4251–4266.
doi:10.5194/hess-22-4251-2018.
Box, G.E.P., Jenkins, G.M., 1970. Time series analysis forecasting and control. San Francisco
Holden-Day.
Bürger, C.M., Kollet, S., Schumacher, J., Bösel, D., 2012. Introduction of a web service for cloud com-
puting with the integrated hydrologic simulation platform ParFlow. Computers & Geosciences
48, 334–336. doi:10.1016/j.cageo.2012.01.007.
Brocca, L., Ciabatta, L., Massari, C., Camici, S., Tarpanelli, A., 2017. Soil moisture for hydrological
applications: Open questions and new opportunities. Water 9. doi:10.3390/w9020140.
Brocca, L., Melone, F., Moramarco, T., Singh, V.P., 2009. Assimilation of observed soil moisture
data in storm rainfall-runo� modeling. Journal of Hydrologic Engineering 14, 153–165. doi:10.1061/(Asce)1084-0699(2009)14:2(153).
145

Brocca, L., Melone, F., Moramarco, T., Wagner, W., Naeimi, V., Bartalis, Z., Hasenauer, S., 2010.
Improving runo� prediction through the assimilation of the ASCAT soil moisture product. Hy-
drology and Earth System Sciences 14, 1881–1893. doi:10.5194/hess-14-1881-2010.
Brocca, L., Tarpanelli, A., Filippucci, P., Dorigo, W., Zaussinger, F., Gruber, A., Fernández-Prieto,
D., 2018. How much water is used for irrigation? a new approach exploiting coarse resolu-
tion satellite soil moisture products. International Journal of Applied Earth Observation and
Geoinformation 73, 752–766. doi:10.1016/j.jag.2018.08.023.
Brown, C.M., Lund, J.R., Cai, X.M., Reed, P.M., Zagona, E.A., Ostfeld, A., Hall, J., Characklis,
G.W., Yu, W., Brekke, L., 2015. The future of water resources systems analysis: Toward a sci-
enti�c framework for sustainable water management. Water Resources Research 51, 6110–6124.
doi:10.1002/2015wr017114.
Burgers, G., van Leeuwen, P.J., Evensen, G., 1998. Analysis scheme in the ensemble Kalman
�lter. Monthly Weather Review 126, 1719–1724. doi:10.1175/1520-0493(1998)126<1719:Asitek>2.0.Co;2.
Cai, Y., Zheng, W.G., Zhang, X., Zhangzhong, L.L., Xue, X.Z., 2019. Research on soil moisture
prediction model based on deep learning. Plos One 14. doi:ARTNe021450810.1371/journal.pone.0214508.
Cammalleri, C., Micale, F., Vogt, J., 2016. A novel soil moisture-based drought severity index
(DSi) combining water de�cit magnitude and frequency. Hydrological Processes 30, 289–301.
doi:10.1002/hyp.10578.
Campmans, G.H.P., Roos, P.C., de Vriend, H.J., Hulscher, S.J.M.H., 2017. Modeling the in�uence of
storms on sand wave formation: A linear stability approach. Continental Shelf Research 137,
103–116. doi:10.1016/j.csr.2017.02.002.
Camporese, M., Paniconi, C., Putti, M., Salandin, P., 2009a. Comparison of data assimilation
techniques for a coupled model of surface and subsurface �ow. Vadose Zone Journal 8, 837.
doi:10.2136/vzj2009.0018.
Camporese, M., Paniconi, C., Putti, M., Salandin, P., 2009b. Ensemble Kalman �lter data assimila-
tion for a process-based catchment scale model of surface and subsurface �ow. Water Resources
Research 45. doi:10.1029/2008wr007031.
Carranza, C.D.U., Benninga, H.F., van der Velde, R., van der Ploeg, M.J., 2019. Monitoring ag-
ricultural �eld tra�cability using Sentinel-1. Agricultural Water Management 224, 105698.
doi:10.1016/j.agwat.2019.105698.
Carranza, C.D.U., van der Ploeg, M.J., Torfs, P.J.J.F., 2018. Using lagged dependence to identify (de)
coupled surface and subsurface soil moisture values. Hydrology and Earth System Sciences 22,
2255–2267. doi:10.5194/hess-22-2255-2018.
146
Carvalho-Santos, C., Honrado, J.P., Hein, L., 2014. Hydrological services and the role of forests:
Conceptualization and indicator-based analysis with an illustration at a regional scale. Ecolo-
gical Complexity 20, 69–80. doi:10.1016/j.ecocom.2014.09.001.
Cash, D.W., Borck, J.C., Patt, A.G., 2006. Countering the loading-dock approach to linking science
and decision making. Science, Technology, & Human Values 31, 465–494. doi:10.1177/0162243906287547.
Cassiani, G., Binley, A., Ferre, T., 2006. Unsaturated zone processes, in: Vereecken, H., Binley,
A., Cassiani, G., Revil, A., Titov, K. (Eds.), Applied Hydrogeophysics. Springer, Dordrecht, The
Netherlands. volume 71, pp. 75–116.
Chan, S.K., Bindlish, R., O’Neill, P., Jackson, T., Njoku, E., Dunbar, S., Chaubell, J., Piepmeier, J.,
Yueh, S., Entekhabi, D., Colliander, A., Chen, F., Cosh, M.H., Caldwell, T., Walker, J., Berg, A.,
McNairn, H., Thibeault, M., Martínez-Fernández, J., Uldall, F., Seyfried, M., Bosch, D., Starks, P.,
Holi�eld Collins, C., Prueger, J., van der Velde, R., Asanuma, J., Palecki, M., Small, E.E., Zreda,
M., Calvet, J., Crow, W.T., Kerr, Y., 2018. Development and assessment of the SMAP enhanced
passive soil moisture product. Remote Sensing of Environment 204, 931–941. doi:10.1016/j.rse.2017.08.025.
Changnon Jr, S., 1987. Detecting drought conditions in Illinois. Technical Report. Circular 169.
Chaparro, D., Vall-llossera, M., Piles, M., Camps, A., Rüdiger, C., 2015. Low soil moisture and high
temperatures as indicators for forest �re occurrence and extent across the Iberian Peninsula, in:
2015 IEEE International Geoscience and Remote Sensing Symposium (IGARSS), pp. 3325–3328.
doi:10.1109/IGARSS.2015.7326530.
Chen, C., Chen, D., Yan, Y., Zhang, G., Zhou, Q., Zhou, R., 2018. Integration of numerical model
and cloud computing. Future Generation Computer Systems 79, 396–407. doi:10.1016/j.future.2017.06.007.
Collenteur, R.A., Bakker, M., Caljé, R., Klop, S.A., Schaars, F., 2019a. Pastas: open source software
for the analysis of groundwater time series. Groundwater doi:10.1111/gwat.12925.
Collenteur, R.A., Bakker, M., Caljé, R., Schaars, F., 2019b. Pastas: open-source software for the
analysis of hydrogeological time series. doi:10.5281/zenodo.2560352.
Colliander, A., Jackson, T.J., Bindlish, R., Chan, S., Das, N., Kim, S.B., Cosh, M.H., Dunbar, R.S.,
Dang, L., Pashaian, L., Asanuma, J., Aida, K., Berg, A., Rowlandson, T., Bosch, D., Caldwell,
T., Caylor, K., Goodrich, D., al Jassar, H., Lopez-Baeza, E., Martínez-Fernández, J., González-
Zamora, A., Livingston, S., McNairn, H., Pacheco, A., Moghaddam, M., Montzka, C., Notarnic-
ola, C., Niedrist, G., Pellarin, T., Prueger, J., Pulliainen, J., Rautiainen, K., Ramos, J., Seyfried,
M., Starks, P., Su, Z., Zeng, Y., van der Velde, R., Thibeault, M., Dorigo, W., Vreugdenhil, M.,
Walker, J.P., Wu, X., Monerris, A., O’Neill, P.E., Entekhabi, D., Njoku, E.G., Yueh, S., 2017. Val-
147
idation of SMAP surface soil moisture products with core validation sites. Remote Sensing of
Environment 191, 215–231. doi:10.1016/j.rse.2017.01.021.
Colosimo, M.F., Kim, H., 2016. Incorporating innovative water management science and tech-
nology into water management policy. Energy, Ecology and Environment 1, 45–53. doi:10.1007/s40974-016-0013-z.
Cortes Arevalo, V.J., Verbrugge, L.N.H., Haan, R.J.d., Baart, F., van der Voort, M.C., Hulscher,
S.J.M.H., 2018. Users’ perspectives about the potential usefulness of online storylines to com-
municate river research to a multi-disciplinary audience. Environmental Communication , 1–
17doi:10.1080/17524032.2018.1504098.
Cosgrove, W.J., Loucks, D.P., 2015. Water management: Current and future challenges and
research directions. Water Resources Research 51, 4823–4839. doi:10.1002/2014WR016869.
Cosh, M.H., Jackson, T.J., Starks, P., Heathman, G., 2006. Temporal stability of surface soil moisture
in the Little Washita River watershed and its applications in satellite soil moisture product
validation. Journal of Hydrology 323, 168–177. doi:10.1016/j.jhydrol.2005.08.020.
Crow, W.T., Berg, A.A., Cosh, M.H., Loew, A., Mohanty, B.P., Panciera, R., de Rosnay, P., Ryu, D.,
Walker, J.P., 2012. Upscaling sparse ground-based soil moisture observations for the validation
of coarse-resolution satellite soil moisture products. Reviews of Geophysics 50. doi:10.1029/2011RG000372.
Crow, W.T., Ryu, D., 2009. A new data assimilation approach for improving runo� prediction
using remotely-sensed soil moisture retrievals. Hydrology and Earth System Sciences 13, 1–16.
doi:DOI10.5194/hess-13-1-2009.
Crow, W.T., Wood, E.F., 2003. The assimilation of remotely sensed soil brightness temperature
imagery into a land surface model using Ensemble Kalman �ltering: a case study based on
ESTAR measurements during SGP97. Advances in Water Resources 26, 137–149. doi:10.1016/S0309-1708(02)00088-X.
Damveld, J.H., Roos, P.C., Borsje, B.W., Hulscher, S.J.M.H., 2019. Modelling the two-way coupling
of tidal sand waves and benthic organisms: a linear stability approach. Environmental Fluid
Mechanics doi:10.1007/s10652-019-09673-1.
Das, N.N., Entekhabi, D., Dunbar, R.S., Chaubell, M.J., Colliander, A., Yueh, S., Jagdhuber, T., Chen,
F., Crow, W., O’Neill, P.E., Walker, J.P., Berg, A., Bosch, D.D., Caldwell, T., Cosh, M.H., Collins,
C.H., Lopez-Baeza, E., Thibeault, M., 2019. The SMAP and Copernicus Sentinel 1A/B microwave
active-passive high resolution surface soil moisture product. Remote Sensing of Environment
233, 111380. doi:10.1016/j.rse.2019.111380.
148
Das, N.N., Entekhabi, D., Dunbar, R.S., Colliander, A., Chen, F., Crow, W., Jackson, T.J., Berg, A.,
Bosch, D.D., Caldwell, T., Cosh, M.H., Collins, C.H., Lopez-Baeza, E., Moghaddam, M., Rowland-
son, T., Starks, P.J., Thibeault, M., Walker, J.P., Wu, X., O’Neill, P.E., Yueh, S., Njoku, E.G., 2018.
The SMAP mission combined active-passive soil moisture product at 9 km and 3 km spatial
resolutions. Remote Sensing of Environment 211, 204–217. doi:10.1016/j.rse.2018.04.011.
De Girolamo, A.M., Barca, E., Pappagallo, G., Lo Porto, A., 2017. Simulating ecologically relevant
hydrological indicators in a temporary river system. Agricultural Water Management 180, 194–
204. doi:10.1016/j.agwat.2016.05.034.
De Heus, L.C.A.V., 2019. Exploring the potential of high-resolution soil moisture indicators for
decision-making in regional operational water management. Technical Report. University of
Twente.
De Kok, J.L., Kofalk, S., Berlekamp, J., Hahn, B., Wind, H., 2008. From design to application of a
decision-support system for integrated river-basin management. Water Resources Management
23, 1781–1811. doi:10.1007/s11269-008-9352-7.
De Laat, P.J.M., 1980. Model for unsaturated �ow above a shallow water-table, applied to a regional
sub-surface �ow problem. Ph.D. thesis. Centre for Agricultural Pub. and Documentation.
De Lange, W.J., Prinsen, G.F., Hoogewoud, J.C., Veldhuizen, A.A., Verkaik, J., Oude Essink, G.H.P.,
van Walsum, P.E.V., Delsman, J.R., Hunink, J.C., Massop, H.T.L., Kroon, T., 2014. An operational,
multi-scale, multi-model system for consensus-based, integrated water management and policy
analysis: The Netherlands Hydrological Instrument. Environmental Modelling & Software 59,
98–108. doi:10.1016/j.envsoft.2014.05.009.
De Rosnay, P., Drusch, M., Vasiljevic, D., Balsamo, G., Albergel, C., Isaksen, L., 2013. A simpli�ed
Extended Kalman Filter for the global operational soil moisture analysis at ECMWF. Quarterly
Journal of the Royal Meteorological Society 139, 1199–1213. doi:10.1002/qj.2023.
De Vriend, H., van Koningsveld, M., Aarninkhof, S., 2014. ‘building with nature’: the new Dutch
approach to coastal and river works. Proceedings of the Institution of Civil Engineers - Civil
Engineering 167, 18–24. doi:10.1680/cien.13.00003.
Den Haan, R.J., van Dijk, J., Baart, F., van der Voort, M., Hulscher, S., 2019. How a tangible user
interface contributes to desired learning outcomes of the virtual river serious game, in: Fang,
X. (Ed.), HCI in Games, Springer International Publishing, Cham. pp. 288–306.
Deng, K.A.K., Lamine, S., Pavlides, A., Petropoulos, G.P., Srivastava, P.K., Bao, Y.S., Hristopulos,
D., Anagnostopoulos, V., 2019. Operational soil moisture from ASCAT in support of water
resources management. Remote Sensing 11. doi:10.3390/rs11050579.
149
Dente, L., Su, Z., Wen, J., 2012. Validation of SMOS soil moisture products over the Maqu and
Twente regions. Sensors 12, 9965–86. doi:10.3390/s120809965.
Dicks, L.V., Walsh, J.C., Sutherland, W.J., 2014. Organising evidence for environmental manage-
ment decisions: a ‘4s’ hierarchy. Trends in Ecology & Evolution 29, 607–613. doi:10.1016/j.tree.2014.09.004.
Diedrich, A., Tintore, J., Navines, F., 2010. Balancing science and society through establishing
indicators for integrated coastal zone management in the Balearic Islands. Marine Policy 34,
772–781. doi:10.1016/j.marpol.2010.01.017.
Dingman, S.L., 2002. Physical hydrology. 2nd ed. ed., Prentice Hall, Upper Saddle River, N.J.
Dizdaroglu, D., 2015. Developing micro-level urban ecosystem indicators for sustainability as-
sessment. Environmental Impact Assessment Review 54, 119–124. doi:10.1016/j.eiar.2015.06.004.
Dobriyal, P., Qureshi, A., Badola, R., Hussain, S.A., 2012. A review of the methods available for
estimating soil moisture and its implications for water resource management. Journal of Hy-
drology 458-459, 110–117. doi:10.1016/j.jhydrol.2012.06.021.
Dorigo, W.A., Wagner, W., Hohensinn, R., Hahn, S., Paulik, C., Xaver, A., Gruber, A., Drusch, M.,
Mecklenburg, S., van Oevelen, P., Robock, A., Jackson, T., 2011. The International Soil Moisture
Network: a data hosting facility for global in situ soil moisture measurements. Hydrology and
Earth System Sciences 15, 1675–1698. doi:10.5194/hess-15-1675-2011.
Droesen, J.M., 2017. Exploratory research on modelling soil moisture dynamics in the Raam catch-
ment. Technical Report. Wageningen University and Research.
Drusch, M., Scipal, K., de Rosnay, P., Balsamo, G., Andersson, E., Bougeault, P., Viterbo, P., 2009.
Towards a Kalman Filter based soil moisture analysis system for the operational ECMWF Integ-
rated Forecast System. Geophysical Research Letters 36. doi:10.1029/2009gl037716.
Du, Y., Ulaby, F.T., Dobson, M.C., 2000. Sensitivity to soil moisture by active and passive microwave
sensors. Ieee Transactions on Geoscience and Remote Sensing 38, 105–114. doi:10.1109/36.823905.
Dumedah, G., Walker, J.P., Merlin, O., 2015. Root-zone soil moisture estimation from assimilation
of downscaled Soil Moisture and Ocean Salinity data. Advances in Water Resources 84, 14–22.
doi:10.1016/j.advwatres.2015.07.021.
Eden, S., Megdal, B.S., Shamir, E., Chief, K., Mott Lacroix, K., 2016. Opening the black box: Using
a hydrological model to link stakeholder engagement with groundwater management. Water
8. doi:10.3390/w8050216.
150

Entekhabi, D., Njoku, E.G., O’Neill, P.E., Kellogg, K.H., Crow, W.T., Edelstein, W.N., Entin, J.K.,
Goodman, S.D., Jackson, T.J., Johnson, J., Kimball, J., Piepmeier, J.R., Koster, R.D., Martin, N.,
McDonald, K.C., Moghaddam, M., Moran, S., Reichle, R., Shi, J.C., Spencer, M.W., Thurman, S.W.,
Tsang, L., Van Zyl, J., 2010. The Soil Moisture Active Passive (SMAP) mission. Proceedings of
the IEEE 98, 704–716. doi:10.1109/jproc.2010.2043918.
Entekhabi, D., Rodriguez-Iturbe, I., 1994. Analytical framework for the characterization of the
space-time variability of soil-moisture. Advances in Water Resources 17, 35–45. doi:10.1016/0309-1708(94)90022-1.
Evensen, G., 1994. Sequential data assimilation with a nonlinear quasi-geostrophic model using
Monte Carlo methods to forecast error statistics. Journal of Geophysical Research: Oceans 99,
10143–10162. doi:10.1029/94JC00572.
Fabbri, P., Gaetan, C., Zangheri, P., 2011. Transfer function-noise modelling of an aquifer system
in NE Italy. Hydrological Processes 25, 194–206. doi:10.1002/hyp.7832.
Fabian, Y., Bollmann, K., Brang, P., Heiri, C., Olschewski, R., Rigling, A., Stofer, S., Holderegger, R.,
2019. How to close the science-practice gap in nature conservation? Information sources used
by practitioners. Biological Conservation 235, 93–101. doi:10.1016/j.biocon.2019.04.011.
Fang, B., Lakshmi, V., 2014. Soil moisture at watershed scale: Remote sensing techniques. Journal
of Hydrology 516, 258–272. doi:10.1016/j.jhydrol.2013.12.008.
Feddes, R.A., Kowalik, P.J., Zaradny, H., 1978. Simulation of �eld water use and crop yield. Pudoc,
Wageningen.
Feldman, D.L., Ingram, H.M., 2009. Making science useful to decision makers: Climate forecasts,
water management, and knowledge networks. Weather, Climate, and Society 1, 9–21. doi:10.1175/2009wcas1007.1.
Ford, T.W., Quiring, S.M., 2019. Comparison of contemporary in situ, model, and satellite remote
sensing soil moisture with a focus on drought monitoring. Water Resources Research 55, 1565–
1582. doi:10.1029/2018wr024039.
Fraser, C.E., McIntyre, N., Jackson, B.M., Wheater, H.S., 2013. Upscaling hydrological processes and
land management change impacts using a metamodeling procedure. Water Resources Research
49, 5817–5833. doi:10.1002/wrcr.20432.
Freeze, R.A., Cherry, J.A., 1979. Groundwater. Prentice-Hall, Inc., Englewood Cli�s, New Jersey.
Gevaert, A.I., Renzullo, L.J., van Dijk, A.I.J.M., van der Woerd, H.J., Weerts, A.H., de Jeu, R.A.M.,
2018. Joint assimilation of soil moisture retrieved from multiple passive microwave frequencies
151

increases robustness of soil moisture state estimation. Hydrol. Earth Syst. Sci. 22, 4605–4619.
doi:10.5194/hess-22-4605-2018.
Grillakis, M.G., 2019. Increase in severe and extreme soil moisture droughts for Europe under
climate change. Sci Total Environ 660, 1245–1255. doi:10.1016/j.scitotenv.2019.01.001.
Gruber, A., Crow, W., Dorigo, W., Wagner, W., 2015. The potential of 2D Kalman �ltering for soil
moisture data assimilation. Remote Sensing of Environment 171, 137–148. doi:10.1016/j.rse.2015.10.019.
Gruber, A., Scanlon, T., Van der Schalie, R., Wagner, W., Dorigo, W., 2019. Evolution of the ESA CCI
soil moisture climate data records and their underlying merging methodology. Earth System
Science Data 11, 717–739. doi:10.5194/essd-11-717-2019.
Gruber, A., Su, C.H., Zwieback, S., Crow, W., Dorigo, W., Wagner, W., 2016. Recent advances in
(soil moisture) triple collocation analysis. International Journal of Applied Earth Observation
and Geoinformation 45, 200–211. doi:10.1016/j.jag.2015.09.002.
Guswa, A.J., Brauman, K.A., Brown, C., Hamel, P., Keeler, B.L., Sayre, S.S., 2014. Ecosystem ser-
vices: Challenges and opportunities for hydrologic modeling to support decision making. Water
Resources Research 50, 4535–4544. doi:10.1002/2014wr015497.
Haasnoot, M., Middelkoop, H., 2012. A history of futures: A review of scenario use in water policy
studies in the Netherlands. Environ Sci Policy 19-20, 108–120. doi:10.1016/j.envsci.2012.03.002.
Haberlandt, U., 2010. From hydrological modelling to decision support. Advances in Geosciences
27, 11–19. doi:10.5194/adgeo-27-11-2010.
Hanger, S., Pfenninger, S., Dreyfus, M., Patt, A., 2013. Knowledge and information needs of
adaptation policy-makers: a European study. Regional Environmental Change 13, 91–101.
doi:10.1007/s10113-012-0317-2.
Hanington, P., Toan, T.Q., Tri, V.P.D., Vu, D.N.A., Kiem, A.S., 2017. A hydrological model for
interprovincial water resource planning and management: A case study in the Long Xuyen
Quadrangle, Mekong Delta, Vietnam. Journal of Hydrology 547, 1–9. doi:10.1016/j.jhydrol.2017.01.030.
Harbaugh, A.W., Langevin, C.D., Hughes, J.D., Niswonger, R.N., Konikow, L.F., 2017. MODFLOW-
2005 version 1.12.00, the U.S. Geological Survey modular groundwater model: U.S. Geological
Survey Software Release, 03 February 2017. Technical Report. U.S. Geological Survey. doi:10.5066/F7RF5S7G.
Hartanto, I.M., van der Kwast, J., Alexandridis, T.K., Almeida, W., Song, Y., van Andel, S.J., Solo-
152
matine, D.P., 2017. Data assimilation of satellite-based actual evapotranspiration in a distributed
hydrological model of a controlled water system. International Journal of Applied Earth Ob-
servation and Geoinformation 57, 123–135. doi:10.1016/j.jag.2016.12.015.
Hawkins, A.B., 2013. Some engineering geological e�ects of drought: examples from the UK.
Bulletin of Engineering Geology and the Environment 72, 37–59. doi:10.1007/s10064-013-0458-7.
Hazeu, G.W., 2014. Operational land cover and land use mapping in the Netherlands, in: Manakos,
I., Braun, M. (Eds.), Land Use and Land Cover Mapping in Europe: Practices & Trends. Springer
Netherlands, Dordrecht, pp. 283–296. doi:10.1007/978-94-007-7969-3\_18.
He, X., Lucatero, D., Ridler, M.E., Madsen, H., Kidmose, J., Hole, Ø., Petersen, C., Zheng, C., Refs-
gaard, J.C., 2019. Real-time simulation of surface water and groundwater with data assimilation.
Advances in Water Resources 127, 13–25. doi:10.1016/j.advwatres.2019.03.004.
Hendricks Franssen, H.J., Kaiser, H.P., Kuhlmann, U., Bauser, G., Stau�er, F., Müller, R., Kinzelbach,
W., 2011. Operational real-time modeling with ensemble Kalman �lter of variably saturated
subsurface �ow including stream-aquifer interaction and parameter updating. Water Resources
Research 47. doi:10.1029/2010wr009480.
Hendriks, D.M.D., Kuijper, M.J.M., van Ek, R., 2014. Groundwater impact on environmental �ow
needs of streams in sandy catchments in the Netherlands. Hydrological Sciences Journal 59,
562–577. doi:10.1080/02626667.2014.892601.
Höllermann, B., Evers, M., 2017. Perception and handling of uncertainties in water management—a
study of practitioners’ and scientists’ perspectives on uncertainty in their daily decision-
making. Environmental Science & Policy 71, 9–18. doi:10.1016/j.envsci.2017.02.003.
Hornacek, M., Wagner, W., Sabel, D., Truong, H.L., Snoeij, P., Hahmann, T., Diedrich, E., Doub-
kova, M., 2012. Potential for high resolution systematic global surface soil moisture retrieval
via change detection using Sentinel-1. IEEE Journal of Selected Topics in Applied Earth Obser-
vations and Remote Sensing 5, 1303–1311. doi:10.1109/jstars.2012.2190136.
Houser, P.R., Shuttleworth, W.J., Famiglietti, J.S., Gupta, H.V., Syed, K.H., Goodrich, D.C., 1998.
Integration of soil moisture remote sensing and hydrologic modeling using data assimilation.
Water Resources Research 34, 3405–3420. doi:10.1029/1998wr900001.
Houtekamer, P.L., Mitchell, H.L., 1998. Data assimilation using an ensemble Kalman �lter
technique. Monthly Weather Review 126, 796–811. doi:10.1175/1520-0493(1998)126<0796:Dauaek>2.0.Co;2.
Imaoka, K., Kachi, M., Fujii, H., Murakami, H., Hori, M., Ono, A., Igarashi, T., Nakagawa, K., Oki,
T., Honda, Y., Shimoda, H., 2010. Global change observation mission (gcom) for monitoring
153
carbon, water cycles, and climate change. Proceedings of the Ieee 98, 717–734. doi:10.1109/Jproc.2009.2036869.
Ioris, A.A.R., Hunter, C., Walker, S., 2008. The development and application of water management
sustainability indicators in Brazil and Scotland. Journal of Environmental Management 88,
1190–1201. doi:10.1016/j.jenvman.2007.06.007.
Irrgang, C., Saynisch, J., Thomas, M., 2017. Utilizing oceanic electromagnetic induction to con-
strain an ocean general circulation model: A data assimilation twin experiment. Journal of
Advances in Modeling Earth Systems 9, 1703–1720. doi:10.1002/2017ms000951.
Jackson, T.J., Cosh, M.H., Bindlish, R., Starks, P.J., Bosch, D.D., Seyfried, M., Goodrich, D.C.,
Moran, M.S., Du, J.Y., 2010. Validation of Advanced Microwave Scanning Radiometer soil
moisture products. IEEE Transactions on Geoscience and Remote Sensing 48, 4256–4272.
doi:10.1109/Tgrs.2010.2051035.
Junier, S., Mostert, E., 2014. A decision support system for the implementation of the water frame-
work directive in the Netherlands: Process, validity and useful information. Environmental
Science & Policy 40, 49–56. doi:10.1016/j.envsci.2014.04.004.
Juwana, I., Muttil, N., Perera, B.J.C., 2012. Indicator-based water sustainability assessment - a
review. Science of the Total Environment 438, 357–371. doi:10.1016/j.scitotenv.2012.08.093.
Kaandorp, V.P., Molina-Navarro, E., Andersen, H.E., Bloom�eld, J.P., Kuijper, M.J.M., de Louw,
P.G.B., 2018. A conceptual model for the analysis of multi-stressors in linked groundwa-
ter–surface water systems. Science of The Total Environment 627, 880–895. doi:10.1016/j.scitotenv.2018.01.259.
Kampragou, E., Apostolaki, S., Manoli, E., Froebrich, J., Assimacopoulos, D., 2011. Towards the
harmonization of water-related policies for managing drought risks across the EU. Environ-
mental Science & Policy 14, 815–824. doi:10.1016/j.envsci.2011.04.001.
Kechavarzi, C., Dawson, Q., Bartlett, M., Leeds-Harrison, P.B., 2010. The role of soil moisture,
temperature and nutrient amendment on CO2 e�ux from agricultural peat soil microcosms.
Geoderma 154, 203–210. doi:10.1016/j.geoderma.2009.02.018.
Kerr, Y.H., Waldteufel, P., Wigneron, J.P., Martinuzzi, J.M., Font, J., Berger, M., 2001. Soil moisture
retrieval from space: The Soil Moisture and Ocean Salinity (SMOS) mission. Ieee Transactions
on Geoscience and Remote Sensing 39, 1729–1735. doi:10.1109/36.942551.
Kersten, G.E., Mikolajuk, Z., 1999. Decision support systems for sustainable development: a re-
source book of methods and applications. Kluwer Academic Publishers, Boston.
154

KNMI, 2018a. Dataset: interpolated daily makkink evapotranspiration in the Netherlands. re-
trieved from https://data.knmi.nl/datasets/ev24/2?
KNMI, 2018b. Dataset: interpolated daily precipitation sum in the Netherlands. retrieved from:
https://data.knmi.nl/datasets/rd1/5?
Kolassa, J., Reichle, H.R., Liu, Q., Cosh, M., Bosch, D.D., Caldwell, G.T., Colliander, A., Holi-
�eld Collins, C., Jackson, J.T., Livingston, J.S., Moghaddam, M., Starks, J.P., 2017. Data as-
similation to extract soil moisture information from SMAP observations. Remote Sensing 9.
doi:10.3390/rs9111179.
Koster, R.D., Liu, Q., Mahanama, S.P.P., Reichle, R.H., 2018. Improved hydrological simulation
using SMAP data: Relative impacts of model calibration and data assimilation. Journal of Hy-
drometeorology 19, 727–741. doi:10.1175/JHM-D-17-0228.1.
Krueger, E.S., Ochsner, T.E., Quiring, S.M., Engle, D.M., Carlson, J.D., Twidwell, D., Fuhlendorf,
S.D., 2017. Measured soil moisture is a better predictor of large growing-season wild�res than
the keetch–byram drought index. Soil Science Society of America Journal 81, 490–502. doi:10.2136/sssaj2017.01.0003.
Kumar, D., Katoch, S.S., 2014. Sustainability indicators for run of the river (RoR) hydropower
projects in hydro rich regions of India. Renewable and Sustainable Energy Reviews 35, 101–
108. doi:10.1016/j.rser.2014.03.048.
Kurtz, W., Lapin, A., Schilling, O.S., Tang, Q., Schiller, E., Braun, T., Hunkeler, D., Vereecken, H.,
Sudicky, E., Kropf, P., Hendricks Franssen, H.J., Brunner, P., 2017. Integrating hydrological mod-
elling, data assimilation and cloud computing for real-time management of water resources. En-
vironmental Modelling & Software 93, 418–435. doi:10.1016/j.envsoft.2017.03.011.
Laiolo, P., Gabellani, S., Campo, L., Silvestro, F., Delogu, F., Rudari, R., Pulvirenti, L., Boni,
G., Fascetti, F., Pierdicca, N., Crapolicchio, R., Hasenauer, S., Puca, S., 2015. Impact of
di�erent satellite soil moisture products on the predictions of a continuous distributed hy-
drological model. International Journal of Applied Earth Observation and Geoinformation
doi:10.1016/j.jag.2015.06.002.
Leskens, J.G., Brugnach, M., Hoekstra, A.Y., Schuurmans, W., 2014. Why are decisions in �ood
disaster management so poorly supported by information from �ood models? Environmental
Modelling & Software 53, 53–61. doi:10.1016/j.envsoft.2013.11.003.
Lievens, H., Reichle, R.H., Liu, Q., De Lannoy, G.J.M., Dunbar, R.S., Kim, S.B., Das, N.N., Cosh,
M., Walker, J.P., Wagner, W., 2017. Joint Sentinel-1 and SMAP data assimilation to improve
soil moisture estimates. Geophysical Research Letters 44, 6145–6153. doi:10.1002/2017GL073904.
155
Lievens, H., Tomer, S.K., Al Bitar, A., De Lannoy, G.J.M., Drusch, M., Dumedah, G.,
Hendricks Franssen, H.J., Kerr, Y.H., Martens, B., Pan, M., Roundy, J.K., Vereecken, H., Walker,
J.P., Wood, E.F., Verhoest, N.E.C., Pauwels, V.R.N., 2015. SMOS soil moisture assimilation for
improved hydrologic simulation in the Murray Darling basin, Australia. Remote Sensing of
Environment 168, 146–162. doi:10.1016/j.rse.2015.06.025.
Liu, Y., Weerts, A.H., Clark, M., Hendricks Franssen, H.J., Kumar, S., Moradkhani, H., Seo, D.J.,
Schwanenberg, D., Smith, P., van Dijk, A.I.J.M., van Velzen, N., He, M., Lee, H., Noh, S.J.,
Rakovec, O., Restrepo, P., 2012. Advancing data assimilation in operational hydrologic forecast-
ing: progresses, challenges, and emerging opportunities. Hydrol. Earth Syst. Sci. 16, 3863–3887.
doi:10.5194/hess-16-3863-2012.
Ljung, G.M., Box, G.E.P., 1978. On a measure of lack of �t in time series models. Biometrika 65,
297–303. doi:10.1093/biomet/65.2.297.
Loizu, J., Massari, C., Alvarez-Mozos, J., Tarpanelli, A., Brocca, L., Casali, J., 2018. On the assimil-
ation set-up of ASCAT soil moisture data for improving stream�ow catchment simulation. Ad-
vances in Water Resources 111, 86–104. doi:10.1016/j.advwatres.2017.10.034.
Loucks, D.P., Van Beek, E., 2017. Water resources planning and management: An overview, in:
Loucks, D.P., van Beek, E. (Eds.), Water Resource Systems Planning and Management. Springer
International Publishing, Cham, pp. 1–49. doi:10.1007/978-3-319-44234-1_1.
Ma, Y., Wu, H., Wang, L., Huang, B., Ranjan, R., Zomaya, A., Jie, W., 2015. Remote sensing big data
computing: Challenges and opportunities. Future Generation Computer Systems 51, 47–60.
doi:10.1016/j.future.2014.10.029.
Maiello, A., de Paiva Britto, A.L.N., Mello, Y.R., de Oliveira Barbosa, P.S., 2015. (Un)used and
(un)usable? the role of indicators in local decision-making. A Brazilian case study. Futures 74,
80–92. doi:10.1016/j.futures.2014.11.002.
Makkink, G.F., 1957. Testing the Penman formula by means of lysimeters. Journal of the Institution
of Water Engineers 11, 277–288.
Mallick, K., Bhattacharya, B.K., Patel, N.K., 2009. Estimating volumetric surface moisture content
for cropped soils using a soil wetness index based on surface temperature and NDVI. Agricul-
tural and Forest Meteorology 149, 1327–1342. doi:10.1016/j.agrformet.2009.03.004.
Manzione, R.L., Knotters, M., Heuvelink, G.B.M., Von Asmuth, J.R., Camara, G., 2010. Trans-
fer function-noise modeling and spatial interpolation to evaluate the risk of extreme (shal-
low) water-table levels in the Brazilian Cerrados. Hydrogeology Journal 18, 1927–1937.
doi:10.1007/s10040-010-0654-5.
Martens, B., De Jeu, R.A.M., Verhoest, N.E.C., Schuurmans, H., Kleijer, J., Miralles, D., 2018.
156
Towards estimating land evaporation at �eld scales using GLEAM. Remote Sensing 10.
doi:10.3390/rs10111720.
Martinez-Fernandez, J., Gonzalez-Zamora, A., Sanchez, N., Gumuzzio, A., 2015. A soil water based
index as a suitable agricultural drought indicator. Journal of Hydrology 522, 265–273. doi:10.1016/j.jhydrol.2014.12.051.
Massari, C., Brocca, L., Barbetta, S., Papathanasiou, C., Mimikou, M., Moramarco, T., 2014. Using
globally available soil moisture indicators for �ood modelling in Mediterranean catchments.
Hydrology and Earth System Sciences 18, 839–853. doi:10.5194/hess-18-839-2014.
McCabe, M.F., Miralles, D.G., Holmes, T.R.H., Fisher, J.B., 2019. Advances in the remote sensing of
terrestrial evaporation. Remote Sensing 11. doi:10.3390/rs11091138.
McColl, K.A., Alemohammad, S.H., Akbar, R., Konings, A.G., Yueh, S., Entekhabi, D., 2017. The
global distribution and dynamics of surface soil moisture. Nature Geoscience 10, 100. doi:10.1038/ngeo2868.
McMillan, H., Jackson, B., Clark, M., Kavetski, D., Woods, R., 2011. Rainfall uncertainty in hy-
drological modelling: An evaluation of multiplicative error models. Journal of Hydrology 400,
83–94. doi:10.1016/j.jhydrol.2011.01.026.
Mishra, A., Vu, T., Veettil, A.V., Entekhabi, D., 2017. Drought monitoring with soil moisture active
passive (SMAP) measurements. Journal of Hydrology 552, 620–632. doi:10.1016/j.jhydrol.2017.07.033.
Mladenova, I.E., Jackson, T.J., Njoku, E., Bindlish, R., Chan, S., Cosh, M.H., Holmes, T.R.H., de Jeu,
R.A.M., Jones, L., Kimball, J., Paloscia, S., Santi, E., 2014. Remote monitoring of soil mois-
ture using passive microwave-based techniques — theoretical basis and overview of selected
algorithms for AMSR-E. Remote Sensing of Environment 144, 197–213. doi:10.1016/j.rse.2014.01.013.
Moeseneder, C., Dutra, L., Thebaud, O., Ellis, N., Boschetti, F., Tickell, S., Dichmont, C., de la Mare,
W., Pascual, R., Cannard, T., 2015. A simulation interface designed for improved user interaction
and learning in water quality modelling software. Environmental Modelling & Software 70, 86–
96. doi:10.1016/j.envsoft.2015.04.006.
Moradkhani, H., 2008. Hydrologic remote sensing and land surface data assimilation. Sensors 8,
2986–3004. doi:10.3390/s8052986.
Moravec, V., Markonis, Y., Rakovec, O., Kumar, R., Hanel, M., 2019. A 250-year European drought
inventory derived from ensemble hydrologic modeling. Geophysical Research Letters 46, 5909–
5917. doi:10.1029/2019GL082783.
Morss, R.E., Wilhelmi, O.V., Downton, M.W., Gruntfest, E., 2005. Flood risk, uncertainty, and
157
scienti�c information for decision making: Lessons from an interdisciplinary project. Bulletin of
the American Meteorological Society 86, 1593–1601. doi:10.1175/BAMS-86-11-1593.
Naeimi, V., Scipal, K., Bartalis, Z., Hasenauer, S., Wagner, W., 2009. An improved soil mois-
ture retrieval algorithm for ERS and METOP scatterometer observations. Ieee Transactions
on Geoscience and Remote Sensing 47, 1999–2013. doi:10.1109/Tgrs.2009.2011617.
Nakanishi, H., Black, J., 2018. Implicit and explicit knowledge in �ood evacuations with a case
study of Takamatsu, Japan. International Journal of Disaster Risk Reduction 28, 788–797.
doi:10.1016/j.ijdrr.2018.02.008.
Nam, W.H., Choi, J.Y., 2014. Development of an irrigation vulnerability assessment model in ag-
ricultural reservoirs utilizing probability theory and reliability analysis. Agricultural Water
Management 142, 115–126. doi:10.1016/j.agwat.2014.05.009.
Naz, B.S., Kurtz, W., Montzka, C., Sharples, W., Goergen, K., Keune, J., Gao, H., Springer, A.,
Hendricks Franssen, H.J., Kollet, S., 2019. Improving soil moisture and runo� simulations at
3 km over Europe using land surface data assimilation. Hydrology and Earth System Sciences
23, 277–301. doi:10.5194/hess-23-277-2019.
Njoku, E.G., Jackson, T.J., Lakshmi, V., Chan, T.K., Nghiem, S.V., 2003. Soil moisture retrieval from
AMSR-E. Ieee Transactions on Geoscience and Remote Sensing 41, 215–229. doi:10.1109/Tgrs.2002.808243.
Nonaka, I., Takeuchi, H., 1995. The knowledge creating company: How Japanese companies create
the dynamics of innovation. volume 29. Oxford University Press, Inc, New York. doi:10.1016/S0040-1625(96)00091-1.
Obergfell, C., Bakker, M., Zaadnoordijk, W.J., Maas, K., 2013. Deriving hydrogeological parameters
through time series analysis of groundwater head �uctuations around well �elds. Hydrogeology
Journal 21, 987–999. doi:10.1007/s10040-013-0973-4.
Ochsner, T.E., Cosh, M.H., Cuenca, R.H., Dorigo, W.A., Draper, C.S., Hagimoto, Y., Kerr, Y.H.,
Larson, K.M., Njoku, E.G., Small, E.E., Zreda, M., 2013. State of the art in large-scale soil moisture
monitoring. Soil Science Society of America Journal 77, 1888–1919. doi:10.2136/sssaj2013.03.0093.
OECD, 2014. Water governance in the Netherlands: �t for the future?, in: OECD studies on water.
OECD. doi:10.1787/9789264102637-en.
O’Neill, P.E., Chan, S., Njoku, E.G., Jackson, T., Bindlish, R., 2018. SMAP Enhanced l3 radiometer
global daily 9 km EASE-Grid soil moisture, version 2. doi:10.5067/RFKIZ5QY5ABN.
Pauwels, V.R.N., De Lannoy, G.J.M., 2006. Improvement of modeled soil wetness conditions and
158
turbulent �uxes through the assimilation of observed discharge. Journal of Hydrometeorology
7, 458–477. doi:10.1175/JHM490.1.
PBL, 2012. The e�ects of climate change in the Netherlands: 2012. Policy studies, PBL Environ-
mental Assessment Agency, The Hague.
Peterson, T.J., Western, A.W., 2014. Nonlinear time-series modeling of uncon�ned groundwater
head. Water Resources Research 50, 8330–8355. doi:10.1002/2013wr014800.
Petropoulos, G.P., Ireland, G., Barrett, B., 2015. Surface soil moisture retrievals from remote sens-
ing: Current status, products & future trends. Physics and Chemistry of the Earth 83-84, 36–56.
doi:10.1016/j.pce.2015.02.009.
Pezij, M., Augustijn, D.C.M., Hendriks, D.M.D., Hulscher, S.J.M.H., 2019a. The role of evidence-
based information in regional operational water management in the Netherlands. Environ-
mental Science & Policy 93, 75–82. doi:10.1016/j.envsci.2018.12.025.
Pezij, M., Augustijn, D.C.M., Hendriks, D.M.D., Weerts, A.H., Hummel, S., van der Velde, R.,
Hulscher, S.J.M.H., 2019b. State updating of root zone soil moisture estimates of an unsat-
urated zone metamodel for operational water resources management. Journal of Hydrology X
4, 100040. doi:10.1016/j.hydroa.2019.100040.
Polanyi, M., 1966. The tacit dimension. Routledge & Kegan Paul, London.
Pritchard, O.G., Hallett, S.H., Farewell, T.S., 2015. Probabilistic soil moisture projections to assess
Great Britain’s future clay-related subsidence hazard. Climatic Change 133, 635–650. doi:10.1007/s10584-015-1486-z.
Pullin, A.S., Knight, T.M., Stone, D.A., Charman, K., 2004. Do conservation managers use scienti�c
evidence to support their decision-making? Biological Conservation 119, 245–252. doi:10.1016/j.biocon.2003.11.007.
Querner, E.P., Jansen, P.C., Van den Akker, J.J.H., Kwakernaak, C., 2012. Analysing water level
strategies to reduce soil subsidence in Dutch peat meadows. Journal of Hydrology 446-447,
59–69. doi:10.1016/j.jhydrol.2012.04.029.
Rahimpour Golroudbary, V., Zeng, Y., Mannaerts, C.M., Su, Z., 2017. Detecting the e�ect of urban
land use on extreme precipitation in the Netherlands. Weather and Climate Extremes 17, 36–46.
doi:10.1016/j.wace.2017.07.003.
Rai, D., Kusre, B.C., Bora, P.K., Gajmer, L., 2018. A study on soil moisture model for agricultural
water management under soil moisture stress conditions in Sikkim (India). Sustainable Water
Resources Management doi:10.1007/s40899-018-0298-5.
Rajabi, M.M., Ataie-Ashtiani, B., Simmons, C.T., 2018. Model-data interaction in groundwater
159
studies: Review of methods, applications and future directions. Journal of Hydrology 567, 457–
477. doi:10.1016/j.jhydrol.2018.09.053.
Ramirez-Beltran, N.D., Castro, J.M., Harmsen, E., Vasquez, R., 2008. Stochastic transfer function
model and neural networks to estimate soil moisture. Journal of the American Water Resources
Association 44, 847–865. doi:10.1111/j.1752-1688.2008.00208.x.
Ratto, M., Castelletti, A., Pagano, A., 2012. Emulation techniques for the reduction and sensitiv-
ity analysis of complex environmental models. Environmental Modelling & Software 34, 1–4.
doi:10.1016/j.envsoft.2011.11.003.
Raymond, C.M., Fazey, I., Reed, M.S., Stringer, L.C., Robinson, G.M., Evely, A.C., 2010. Integrat-
ing local and scienti�c knowledge for environmental management. Journal of Environmental
Management 91, 1766–1777. doi:10.1016/j.jenvman.2010.03.023.
Razavi, S., Tolson, B.A., Burn, D.H., 2012. Review of surrogate modeling in water resources. Water
Resources Research 48. doi:10.1029/2011wr011527.
Rebel, K.T., de Jeu, R.A.M., Ciais, P., Viovy, N., Piao, S.L., Kiely, G., Dolman, A.J., 2012. A global ana-
lysis of soil moisture derived from satellite observations and a land surface model. Hydrology
and Earth System Sciences 16, 833–847. doi:10.5194/hess-16-833-2012.
Reef, K.R.G., Lipari, G., Roos, P.C., Hulscher, S.J.M.H., 2018. Time-varying storm surges on
Lorentz’s Wadden Sea networks. Ocean Dynamics 68, 1051–1065. doi:10.1007/s10236-018-1181-5.
Refsgaard, J.C., van der Sluijs, J.P., Højberg, A.L., Vanrolleghem, P.A., 2007. Uncertainty in the
environmental modelling process – a framework and guidance. Environmental Modelling &
Software 22, 1543–1556. doi:10.1016/j.envsoft.2007.02.004.
Reichle, R.H., 2008. Data assimilation methods in the Earth sciences. Advances in Water Resources
31, 1411–1418. doi:10.1016/j.advwatres.2008.01.001.
Reichle, R.H., McLaughlin, D.B., Entekhabi, D., 2002. Hydrologic data assimilation with the
ensemble Kalman �lter. Monthly Weather Review 130, 103–114. doi:10.1175/1520-0493(2002)130<0103:Hdawte>2.0.Co;2.
Reinhard, A.J., Folmer, H., 2009. Water policy in the Netherlands: integrated management in a
densely populated delta. Issues in water resource policy, Resources for the Future, Washington,
DC.
Remesan, R., Mathew, J., 2015. Hydrological data driven modelling: a case study approach.
volume 1 of Earth systems data and models. Springer International Publishing, Switzerland.
doi:10.1007/978-3-319-09235-5.
160
Remy, E., Gaillard, F., Verron, J., 2002. Variational assimilation of ocean tomographic data: Twin
experiments in a quasi-geostrophic model. Quarterly Journal of the Royal Meteorological So-
ciety 128, 1739–1758. doi:10.1256/00359000260247444.
Renzullo, L.J., van Dijk, A.I.J.M., Perraud, J.M., Collins, D., Henderson, B., Jin, H., Smith, A.B.,
McJannet, D.L., 2014. Continental satellite soil moisture data assimilation improves root-
zone moisture analysis for water resources assessment. Journal of Hydrology 519, 2747–2762.
doi:10.1016/j.jhydrol.2014.08.008.
Richter, B.D., Baumgartner, J.V., Powell, J., Braun, D.P., 1996. A method for assessing hydrologic
alteration within ecosystems. Conservation Biology 10, 1163–1174. doi:10.1046/j.1523-1739.1996.10041163.x.
Richter, B.D., Baumgartner, J.V., Wigington, R., Braun, D.P., 1997. How much water does a river
need? Freshwater Biology 37, 231–249. doi:10.1046/j.1365-2427.1997.00153.x.
Ridler, M.E., van Velzen, N., Hummel, S., Sandholt, I., Falk, A.K., Heemink, A., Madsen, H., 2014.
Data assimilation framework: Linking an open data assimilation library (OpenDA) to a widely
adopted model interface (OpenMI). Environmental Modelling & Software 57, 76–89. doi:10.1016/j.envsoft.2014.02.008.
Robinson, A.R., Lermusiaux, P.F.J., 2002. Data assimilation for modeling and predicting coupled
physical-biological interactions in the sea, in: Robinson, A., McCarthy, J., Rothschild, B. (Eds.),
The Sea. John Wiley & Sons, Inc., New York. volume 12, pp. 475–536.
Robinson, D.A., Campbell, C.S., Hopmans, J.W., Hornbuckle, B.K., Jones, S.B., Knight, R., Ogden,
F., Selker, J., Wendroth, O., 2008. Soil moisture measurement for ecological and hydrological
watershed-scale observatories: A review. Vadose Zone Journal 7, 358–389. doi:10.2136/vzj2007.0143.
Rorink, T.J.F.P., 2019. Understanding unsaturated soil water dynamics of the Twente region using
actual evapotranspiration and soil moisture data. BSc. thesis. Technical Report. University of
Twente.
Sabater, J.M., Jarlan, L., Calvet, J.C., Bouyssel, F., De Rosnay, P., 2007. From near-surface to root-
zone soil moisture using di�erent assimilation techniques. Journal of Hydrometeorology 8,
194–206. doi:10.1175/jhm571.1.
Sadeghi, M., Babaeian, E., Ebtehaj, A.M., Jones, S.B., Tuller, M., 2018. Remote sensing of en-
vironmental variables and �uxes, in: Handbook of Environmental Engineering, pp. 249–302.
doi:10.1002/9781119304418.ch9.
Sahoo, A.K., De Lannoy, G.J.M., Reichle, R.H., Houser, P.R., 2013. Assimilation and downscaling of
satellite observed soil moisture over the Little River Experimental Watershed in Georgia, USA.
Advances in Water Resources 52, 19–33. doi:10.1016/j.advwatres.2012.08.007.
161

Sanchez, N., Gonzalez-Zamora, A., Piles, M., Martinez-Fernandez, J., 2016. A new soil moisture
agricultural drought index (SMADI) integrating MODIS and SMOS products: A case of study
over the Iberian Peninsula. Remote Sensing 8, 287. doi:ARTN28710.3390/rs8040287.
Schuurmans, J.M., van Geer, F.C., Bierkens, M.F.P., 2011. Remotely sensed latent heat �uxes for
model error diagnosis: a case study. Hydrol. Earth Syst. Sci. 15, 759–769. doi:10.5194/hess-15-759-2011.
Schuwirth, N., Honti, M., Logar, I., Stamm, C., 2018. Multi-criteria decision analysis for integrated
water quality assessment and management support. Water Research X 1, 100010. doi:10.1016/j.wroa.2018.100010.
Scipal, K., Dorigo, W., De Jeu, R.A.M., 2010. Triple collocation — a new tool to determine the error
structure of global soil moisture products, in: 2010 IEEE International Geoscience and Remote
Sensing Symposium, pp. 4426–4429. doi:10.1109/IGARSS.2010.5652128.
Seager, J., 2001. Perspectives and limitations of indicators in water management. Regional Envir-
onmental Change 2, 85–92. doi:10.1007/s101130100031.
Sehgal, V., Sridhar, V., 2019. Watershed-scale retrospective drought analysis and seasonal forecast-
ing using multi-layer, high-resolution simulated soil moisture for Southeastern U.S. Weather
and Climate Extremes 23, 100191. doi:10.1016/j.wace.2018.100191.
Seneviratne, S.I., Corti, T., Davin, E.L., Hirschi, M., Jaeger, E.B., Lehner, I., Orlowsky, B., Teuling,
A.J., 2010. Investigating soil moisture–climate interactions in a changing climate: A review.
Earth-Science Reviews 99, 125–161. doi:10.1016/j.earscirev.2010.02.004.
Serrat-Capdevila, A., Valdes, J.B., Gupta, H.V., 2011. Decision support systems in water resources
planning and management: Stakeholder participation and the sustainable path to science-based
decision making, in: Jao, C. (Ed.), E�cient Decision Support Systems - Practice and Challenges
From Current to Future. InTech, Rijeka, pp. 423–440. doi:10.5772/16897.
Shellito, P.J., Small, E.E., Colliander, A., Bindlish, R., Cosh, M.H., Berg, A.A., Bosch, D.D., Caldwell,
T.G., Goodrich, D.C., McNairn, H., Prueger, J.H., Starks, P.J., van der Velde, R., Walker, J.P.,
2016. SMAP soil moisture drying more rapid than observed in situ following rainfall events.
Geophysical Research Letters 43, 8068–8075. doi:10.1002/2016gl069946.
Sherman, L.K., 1932. Stream �ow from rainfall by the unit graph method. Engineering News-
Record 108, 501–505.
Shiklomanov, I.A., 1993. World fresh water resources, in: Gleick, P. (Ed.), Water in Crisis: A Guide
to the World’s Fresh Water Resources. Oxford University Press, New York, pp. 13–24.
Shin, Y., Lim, K.J., Park, K., Jung, Y., 2016. Development of dynamic ground water data assimilation
for quantifying soil hydraulic properties from remotely sensed soil moisture. Water 8, 311.
162
Šimůnek, J., van Genuchten, M.T., 2008. Modeling nonequilibrium �ow and transport processes
using HYDRUS. Vadose Zone Journal 7, 782–797. doi:10.2136/vzj2007.0074.
Šimůnek, J., Jarvis, N.J., van Genuchten, M.T., Gärdenäs, A., 2003. Review and comparison of
models for describing non-equilibrium and preferential �ow and transport in the vadose zone.
Journal of Hydrology 272, 14–35. doi:10.1016/s0022-1694(02)00252-4.
Solomatine, D.P., Ostfeld, A., 2008. Data-driven modelling: some past experiences and new ap-
proaches. Journal of Hydroinformatics 10, 3–22. doi:10.2166/hydro.2008.015.
Spiller, M., 2016. Adaptive capacity indicators to assess sustainability of urban water systems –
current application. Science of The Total Environment 569–570, 751–761. doi:10.1016/j.scitotenv.2016.06.088.
Spinoni, J., Naumann, G., Carrao, H., Barbosa, P., Vogt, J., 2014. World drought frequency,
duration, and severity for 1951-2010. International Journal of Climatology 34, 2792–2804.
doi:10.1002/joc.3875.
Srivastava, P.K., 2017. Satellite soil moisture: Review of theory and applications in water resources.
Water Resources Management 31, 3161–3176. doi:10.1007/s11269-017-1722-6.
Srivastava, P.K., Han, D.W., Rico-Ramirez, M.A., O’Neill, P., Islam, T., Gupta, M., Dai, Q., 2015. Per-
formance evaluation of WRF-Noah land surface model estimated soil moisture for hydrological
application: Synergistic evaluation using SMOS retrieved soil moisture. Journal of Hydrology
529, 200–212. doi:10.1016/j.jhydrol.2015.07.041.
STOWA, 2016. Verkenning remote sensing producten voor het waterbeheer. Technical Report.
Stichting Toegepast Onderzoek Waterbeheer (STOWA).
STOWA, 2019. Na de droogte komen de vragen, in: Ter Info. STOWA, Amersfoort. volume 72, pp.
2–5.
Sun, L.Q., Seidou, O., Nistor, I., Liu, K.L., 2016. Review of the Kalman-type hydrological data as-
similation. Hydrological Sciences Journal 61, 2348–2366. doi:10.1080/02626667.2015.1127376.
Susha Lekshmi, S.U., Singh, D.N., Shojaei Baghini, M., 2014. A critical review of soil moisture
measurement. Measurement 54, 92–105. doi:10.1016/j.measurement.2014.04.007.
Sutanudjaja, E.H., van Beek, L.P.H., de Jong, S.M., van Geer, F.C., Bierkens, M.F.P., 2014. Calibrating
a large-extent high-resolution coupled groundwater-land surface model using soil moisture and
discharge data. Water Resources Research 50, 687–705. doi:10.1002/2013wr013807.
Sutanudjaja, E.H., de Jong, S.M., van Geer, F.C., Bierkens, M.F.P., 2013. Using ERS spaceborne
163
microwave soil moisture observations to predict groundwater head in space and time. Remote
Sensing of Environment 138, 172–188. doi:10.1016/j.rse.2013.07.022.
Sutherland, W.J., Pullin, A.S., Dolman, P.M., Knight, T.M., 2004. The need for evidence-based
conservation. Trends in Ecology & Evolution 19, 305–308. doi:10.1016/j.tree.2004.03.018.
Syed, T.H., Lakshmi, V., Paleologos, E., Lohmann, D., Mitchell, K., Famiglietti, J.S., 2004. Analysis
of process controls in land surface hydrological cycle over the continental United States. Journal
of Geophysical Research-Atmospheres 109, n/a–n/a. doi:10.1029/2004jd004640.
Tallaksen, L., Van Lanen, H.A.J., 2004. Hydrological drought. Processes and estimation methods
for stream�ow and groundwater. Developments in water science: 48, Elsevier, Amsterdam.
Thirel, G., Andreassian, V., Perrin, C., Audouy, J.N., Berthet, L., Edwards, P., Folton, N., Furusho, C.,
Kuentz, A., Lerat, J., Lindstrom, G., Martin, E., Mathevet, T., Merz, R., Parajka, J., Ruelland, D.,
Vaze, J., 2015. Hydrology under change: an evaluation protocol to investigate how hydrological
models deal with changing catchments. Hydrological Sciences Journal 60, 1184–1199. doi:10.1080/02626667.2014.967248.
Tian, Y., Hu�man, G.J., Adler, R.F., Tang, L., Sapiano, M., Maggioni, V., Wu, H., 2013. Modeling
errors in daily precipitation measurements: Additive or multiplicative? Geophysical Research
Letters 40, 2060–2065. doi:10.1002/grl.50320.
Timmerman, J.G., 2015. Information needs for water management. CRC Press, Boca Raton, Fla.
Timmerman, J.G., Langaas, S., 2005. Water information: what is it good for? The use of information
in transboundary water management. Regional Environmental Change 5, 177–187. doi:10.1007/s10113-004-0087-6.
Todini, E., 2007. Hydrological catchment modelling: past, present and future. Hydrol. Earth Syst.
Sci. 11, 468–482. doi:10.5194/hess-11-468-2007.
Tramblay, Y., Bouvier, C., Martin, C., Didon-Lescot, J.F., Todorovik, D., Domergue, J.M., 2010.
Assessment of initial soil moisture conditions for event-based rainfall–runo� modelling. Journal
of Hydrology 387, 176–187. doi:10.1016/j.jhydrol.2010.04.006.
UNESCO, 1971. Scienti�c framework of world water balance, in: Nace, R. (Ed.), Technical papers
in hydrology. UNESCO, Paris, pp. 1–26.
Unie van Waterschappen, 2014. Waterschapsspiegel 2014. Unie van Waterschappen, Den Haag.
Van Dam, J.C., Groenendijk, P., Hendriks, R.F.A., Kroes, J.G., 2008. Advances of modeling water
�ow in variably saturated soils with SWAP. Vadose Zone Journal 7, 640–653. doi:10.2136/vzj2007.0060.
164

Van Genuchten, M.T., 1980. A closed-form equation for predicting the hydraulic conductivity of
unsaturated soils. Soil Science Society of America Journal 44, 892–898. doi:10.2136/sssaj1980.03615995004400050002x.
Van Gurp, H., 2016. Soil moisture simulations on a regional level: the ability of groundwater
model MIPWA to replicate soil moisture observations in Twente. MSc. thesis. Technical Report.
University of Twente.
Van Loon, A.F., 2015. Hydrological drought explained. Wiley Interdisciplinary Reviews: Water 2,
359–392. doi:10.1002/wat2.1085.
Van Thienen-Visser, K., Hendriks, D.M.D., Marsman, A., Nepveu, M., Groenenberg, R., Wilden-
borg, T., Van Duijne, H., Den Hartogh, M., Pinkse, T., 2014. Bow-tie risk assessment combining
causes and e�ects applied to gas oil storage in an abandoned salt cavern. Engineering Geology
168, 149–166. doi:10.1016/j.enggeo.2013.11.002.
Van Velzen, N., Altaf, M.U., Verlaan, M., 2016. OpenDA-NEMO framework for ocean data assim-
ilation. Ocean Dynamics 66, 691–702. doi:10.1007/s10236-016-0945-z.
Van Walsum, P.E.V., 2017. SIMGRO 7.3.3.2., Input and output reference manual. Technical Report.
Alterra.
Van Walsum, P.E.V., Van der Bolt, F.J.E., 2013. Sensitivity of the Delta model to evapotranspiration:
exploring structural uncertainties due to evapotranspiration concepts, in: Alterra report 2481.
Alterra Wageningen UR, Wageningen, the Netherlands.
Van Walsum, P.E.V., Groenendijk, P., 2008. Quasi steady-state simulation of the unsaturated zone
in groundwater modeling of lowland regions. Vadose Zone Journal 7, 769. doi:10.2136/vzj2007.0146.
Van Walsum, P.E.V., Veldhuizen, A.A., 2011. Integration of models using shared state variables:
Implementation in the regional hydrologic modelling system SIMGRO. Journal of Hydrology
409, 363–370. doi:10.1016/j.jhydrol.2011.08.036.
Van der Velde, R., 2018. Validation of SMAP L2 passive-only soil moisture products using in situ
measurements collected in Twente, The Netherlands. doi:10.17026/dans-x3c-5cvq.
Van der Velde, R., Colliander, A., Pezij, M., Benninga, H.J.F., Bindlish, R., Chan, S.K., Jackson, T.J.,
Hendriks, D.M.D., Augustijn, D.C.M., Su, Z., 2019. Validation of SMAP L2 passive-only soil
moisture products using in situ measurements collected in Twente, The Netherlands. Hydrol.
Earth Syst. Sci. Discuss. 2019, 1–43. doi:10.5194/hess-2019-471.
Vereecken, H., Huisman, J.A., Bogena, H., Vanderborght, J., Vrugt, J.A., Hopmans, J.W., 2008. On
the value of soil moisture measurements in vadose zone hydrology: A review. Water Resources
Research 44. doi:10.1029/2008wr006829.
165
Vereecken, H., Schnepf, A., Hopmans, J.W., Javaux, M., Or, D., Roose, T., Vanderborght, J.,
Young, M.H., Amelung, W., Aitkenhead, M., Allison, S.D., Assouline, S., Baveye, P., Berli,
M., Brüggemann, N., Finke, P., Flury, M., Gaiser, T., Govers, G., Ghezzehei, T., Hallett, P.,
Hendricks Franssen, H.J., Heppell, J., Horn, R., Huisman, J.A., Jacques, D., Jonard, F., Kollet,
S., Lafolie, F., Lamorski, K., Leitner, D., McBratney, A., Minasny, B., Montzka, C., Nowak, W.,
Pachepsky, Y., Padarian, J., Romano, N., Roth, K., Rothfuss, Y., Rowe, E.C., Schwen, A., Šimůnek,
J., Tiktak, A., Van Dam, J., Van der Zee, S.E.A.T.M., Vogel, H.J., Vrugt, J.A., Wöhling, T., Young,
I.M., 2016. Modeling soil processes: Review, key challenges, and new perspectives. Vadose
Zone Journal 15. doi:10.2136/vzj2015.09.0131.
Vischel, T., Pegram, G.G.S., Sinclair, S., Wagner, W., Bartsch, A., 2008. Comparison of soil moisture
�elds estimated by catchment modelling and remote sensing: a case study in South Africa.
Hydrology and Earth System Sciences 12, 751–767. doi:10.5194/hess-12-751-2008.
Vogel, M.M., Zscheischler, J., Wartenburger, R., Dee, D., Seneviratne, S.I., 2019. Concurrent 2018
hot extremes across Northern Hemisphere due to human-induced climate change. Earth’s Fu-
ture 0. doi:10.1029/2019ef001189.
Von Asmuth, J.R., Bierkens, M.F.P., 2005. Modeling irregularly spaced residual series as a continu-
ous stochastic process. Water Resources Research 41. doi:10.1029/2004wr003726.
Von Asmuth, J.R., Bierkens, M.F.P., Maas, K., 2002. Transfer function-noise modeling in continuous
time using prede�ned impulse response functions. Water Resources Research 38, 23–1–23–12.
doi:10.1029/2001wr001136.
Von Asmuth, J.R., Maas, K., Bakker, M., Petersen, J., 2008. Modeling time series of ground water
head �uctuations subjected to multiple stresses. Ground Water 46, 30–40. doi:10.1111/j.1745-6584.2007.00382.x.
Von Asmuth, J.R., Maas, K., Knotters, M., Bierkens, M.F.P., Bakker, M., Olsthoorn, T.N., Cirkel,
D.G., Leunk, I., Schaars, F., von Asmuth, D.C., 2012. Software for hydrogeologic time series
analysis, interfacing data with physical insight. Environmental Modelling & Software 38, 178–
190. doi:10.1016/j.envsoft.2012.06.003.
Wagner, W., Hahn, S., Kidd, R., Melzer, T., Bartalis, Z., Hasenauer, S., Figa-Saldana, J., de Rosnay, P.,
Jann, A., Schneider, S., Komma, J., Kubu, G., Brugger, K., Aubrecht, C., Zuger, J., Gangkofner, U.,
Kienberger, S., Brocca, L., Wang, Y., Bloschl, G., Eitzinger, J., Steinnocher, K., Zeil, P., Rubel, F.,
2013. The ASCAT soil moisture product: A review of its speci�cations, validation results, and
emerging applications. Meteorologische Zeitschrift 22, 5–33. doi:10.1127/0941-2948/2013/0399.
Wagner, W., Sabel, D., Doubkova, M., Bartsch, A., Pathe, C., 2009. The potential of Sentinel-1 for
monitoring soil moisture with a high spatial resolution at global scale, in: Earth Observation
and Water Cycle Science Symposium, Frascati, Italy. p. 5.
166
Walker, J.P., Willgoose, G.R., Kalma, J.D., 2004. In situ measurement of soil moisture: a comparison
of techniques. Journal of Hydrology 293, 85–99. doi:10.1016/j.jhydrol.2004.01.008.
Walker, W.E., Harremoës, P., Rotmans, J., Van der Sluijs, J.P., Van Asselt, M.B.A., Janssen, P.,
Krayer von Krauss, M.P., 2003. De�ning uncertainty: A conceptual basis for uncertainty man-
agement in model-based decision support. Integrated Assessment 4, 5–17. doi:10.1076/iaij.4.1.5.16466.
Wanders, N., Bierkens, M.F.P., De Jong, S.M., De Roo, A., Karssenberg, D., 2014a. The bene�ts
of using remotely sensed soil moisture in parameter identi�cation of large-scale hydrological
models. Water Resources Research 50, 6874–6891. doi:10.1002/2013wr014639.
Wanders, N., Karssenberg, D., De Roo, A., De Jong, S.M., Bierkens, M.F.P., 2014b. The suitability
of remotely sensed soil moisture for improving operational �ood forecasting. Hydrology and
Earth System Sciences 18, 2343–2357. doi:10.5194/hess-18-2343-2014.
Wang, J., Yang, Y., Huang, J., Chen, K., 2015. Information provision, policy support, and farmers’
adaptive responses against drought: An empirical study in the North China Plain. Ecological
Modelling 318, 275–282. doi:10.1016/j.ecolmodel.2014.12.013.
Ward, R.C., Loftis, J.C., Mcbride, G.B., 1986. The data-rich but information-poor syndrome
in water-quality monitoring. Environmental Management 10, 291–297. doi:10.1007/Bf01867251.
Warmink, J.J., Brugnach, M., Vinke-de Kruijf, J., Schielen, R.M.J., Augustijn, D.C.M., 2017. Cop-
ing with uncertainty in river management: challenges and ways forward. Water Resources
Management 31, 4587–4600. doi:10.1007/s11269-017-1767-6.
Warmink, J.J., Janssen, J.A.E.B., Booij, M.J., Krol, M.S., 2010. Identi�cation and classi�cation of
uncertainties in the application of environmental models. Environmental Modelling & Software
25, 1518–1527. doi:10.1016/j.envsoft.2010.04.011.
Warmink, J.J., Van der Klis, H., Booij, M.J., Hulscher, S.J.M.H., 2011. Identi�cation and quanti�c-
ation of uncertainties in a hydrodynamic river model using expert opinions. Water Resources
Management 25, 601–622. doi:10.1007/s11269-010-9716-7.
Weerts, A.H., El Serafy, G.Y.H., 2006. Particle �ltering and ensemble Kalman �ltering for state
updating with hydrological conceptual rainfall-runo� models. Water Resources Research 42.
doi:10.1029/2005WR004093.
Weerts, A.H., Seo, D.J., Werner, M., Schaake, J., 2014. Operational hydrologic ensemble forecasting,
in: Applied Uncertainty Analysis for Flood Risk Management. Imperial College Press, pp. 387–
406. doi:10.1142/9781848162716\_0015.
167

Whelchel, A.W., Reguero, B.G., Van Wesenbeeck, B., Renaud, F.G., 2018. Advancing disaster risk
reduction through the integration of science, design, and policy into eco-engineering and sev-
eral global resource management processes. International Journal of Disaster Risk Reduction
32, 29–41. doi:10.1016/j.ijdrr.2018.02.030.
Wolfe, S.E., 2009. What’s your story? Practitioners’ tacit knowledge and water demand manage-
ment policies in southern Africa and Canada. Water Policy 11, 489–503. doi:10.2166/wp.2009.059.
Wood, E.F., Roundy, J.K., Troy, T.J., van Beek, L.P.H., Bierkens, M.F.P., Blyth, E., de Roo, A., Döll,
P., Ek, M., Famiglietti, J., Gochis, D., van de Giesen, N., Houser, P., Ja�é, P.R., Kollet, S., Lehner,
B., Lettenmaier, D.P., Peters-Lidard, C., Sivapalan, M., She�eld, J., Wade, A., Whitehead, P.,
2011. Hyperresolution global land surface modeling: Meeting a grand challenge for monitoring
Earth’s terrestrial water. Water Resources Research 47. doi:10.1029/2010WR010090.
Wösten, J.H.M., De Vries, F., Hoogland, T., Massop, H.T.L., Veldhuizen, A.A., Vroon, H., Wesseling,
J., Heijkers, J., Bolman, A., 2013. BOFEK2012, de nieuwe bodemfysische schematisatie van
Nederland. Technical Report. Alterra.
Wösten, J.H.M., Veerman, G.J., Groot, W.J.M., Stolte, J., 2001. Waterretentie- en doorlatendheids-
karakter van boven- en ondergronden in Nederland: de Staringreeks. Technical Report. Alterra.
Xu, T., Guo, Z., Xia, Y., Ferreira, V.G., Liu, S., Wang, K., Yao, Y., Zhang, X., Zhao, C., 2019. Evaluation
of twelve evapotranspiration products from machine learning, remote sensing and land surface
models over conterminous united states. Journal of Hydrology , 124105doi:10.1016/j.jhydrol.2019.124105.
Xu, Y.P., Tung, Y.K., 2008. Decision-making in water management under uncertainty. Water
Resources Management 22, 535–550. doi:10.1007/s11269-007-9176-x.
Yang, C., Yu, M., Hu, F., Jiang, Y., Li, Y., 2017. Utilizing cloud computing to address big geospatial
data challenges. Computers, Environment and Urban Systems 61, 120–128. doi:10.1016/j.compenvurbsys.2016.10.010.
Yi, M.J., Lee, K.K., 2004. Transfer function-noise modelling of irregularly observed groundwater
heads using precipitation data. Journal of Hydrology 288, 272–287. doi:10.1016/j.jhydrol.2003.10.020.
Yilmaz, K.K., Vrugt, J.A., Gupta, H.V., Sorooshian, S., 2010. Model calibration in watershed hydro-
logy, in: Advances in Data-Based Approaches for Hydrologic Modeling and Forecasting. World
Scienti�c Publishing Co. Pte. Ltd., pp. 53–105. doi:10.1142/9789814307987\_0003.
Zaadnoordijk, W.J., Bus, S.A.R., Lourens, A., Berendrecht, W.L., 2018. Automated time series mod-
eling for piezometers in the national database of the Netherlands. Ground Water doi:10.1111/gwat.12819.
168
Zha, Y., Yang, J., Zeng, J., Tso, C.M., Zeng, W., Shi, L., 2019. Review of numerical solution of
richardson–richards equation for variably saturated �ow in soils. Wiley Interdisciplinary Re-
views: Water 6, e1364. doi:10.1002/wat2.1364.
Zhang, D., Madsen, H., Ridler, M.E., Kidmose, J., Jensen, K.H., Refsgaard, J.C., 2016. Multivariate
hydrological data assimilation of soil moisture and groundwater head. Hydrology and Earth
System Sciences 20, 4341–4357. doi:10.5194/hess-20-4341-2016.
Zhang, K., Zargar, A., Achari, G., Islam, M.S., Sadiq, R., 2013. Application of decision support
systems in water management. Environmental Reviews 22, 189–205. doi:10.1139/er-2013-0034.
Zhao, L., Yang, Z.L., 2018. Multi-sensor land data assimilation: Toward a robust global soil moisture
and snow estimation. Remote Sensing of Environment 216, 13–27. doi:10.1016/j.rse.2018.06.033.
Zhuo, L., Han, D.W., 2016. The relevance of soil moisture by remote sensing and hydrological
modelling. 12th International Conference on Hydroinformatics (Hic 2016) - Smart Water for
the Future 154, 1368–1375. doi:10.1016/j.proeng.2016.07.499.
169

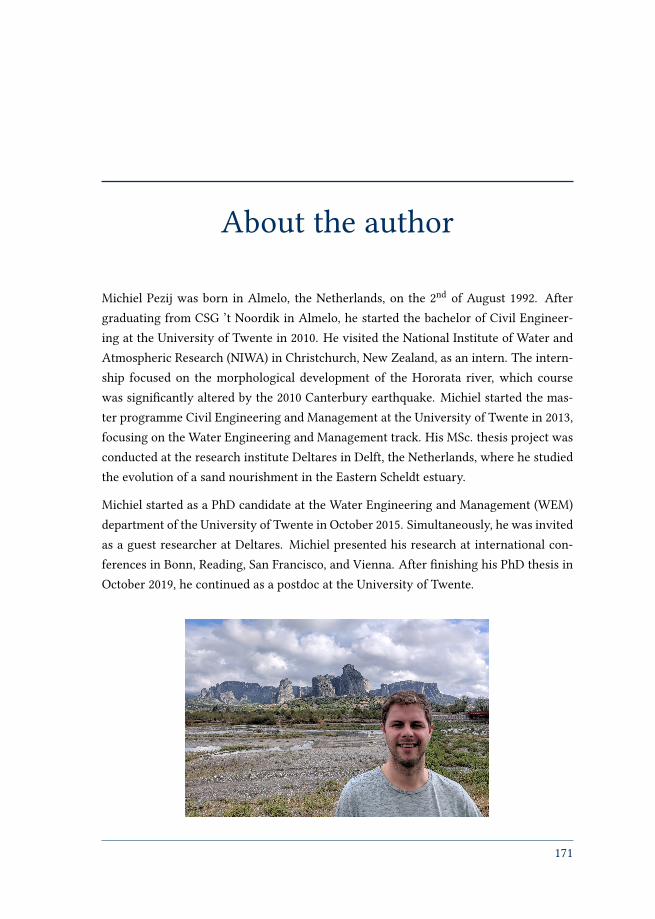
About the author
Michiel Pezij was born in Almelo, the Netherlands, on the 2nd
of August 1992. After
graduating from CSG ’t Noordik in Almelo, he started the bachelor of Civil Engineer-
ing at the University of Twente in 2010. He visited the National Institute of Water and
Atmospheric Research (NIWA) in Christchurch, New Zealand, as an intern. The intern-
ship focused on the morphological development of the Hororata river, which course
was signi�cantly altered by the 2010 Canterbury earthquake. Michiel started the mas-
ter programme Civil Engineering and Management at the University of Twente in 2013,
focusing on the Water Engineering and Management track. His MSc. thesis project was
conducted at the research institute Deltares in Delft, the Netherlands, where he studied
the evolution of a sand nourishment in the Eastern Scheldt estuary.
Michiel started as a PhD candidate at the Water Engineering and Management (WEM)
department of the University of Twente in October 2015. Simultaneously, he was invited
as a guest researcher at Deltares. Michiel presented his research at international con-
ferences in Bonn, Reading, San Francisco, and Vienna. After �nishing his PhD thesis in
October 2019, he continued as a postdoc at the University of Twente.
171

List of publications
Peer-reviewed journal publications
1. Benninga, H.F., Carranza, C.D.U., Pezij, M., Van Santen, P., Van der Ploeg, M.J.,
Augustijn, D.C.M., Van der Velde, R. 2018. The Raam regional soil moisture monit-
oring network in the Netherlands. Earth System Science Data 10, 61-79. doi:10.519
4/essd-10-61-2018.
2. Pezij, M., Augustijn, D.C.M., Hendriks, D.M.D., and Hulscher, S.J.M.H. 2019. The
role of evidence-based information in regional operational water management in
the Netherlands. Environmental Science & Policy 93. 75-82. doi:10.1016/j.envsci.20
18.12.025
3. Pezij, M., Augustijn, D.C.M., Hendriks, D.M.D., Weerts, A.H., Hummel, S., Van
der Velde, R., Hulscher, S.J.M.H. 2019. State updating of root zone soil moisture
estimates of an unsaturated zone metamodel for operational water resources man-
agement. Journal of Hydrology X, 4, 10040. doi:10.1016/j.hydroa.2019.100040
4. Pezij, M., Augustijn, D.C.M., Hendriks, D.M.D., Hulscher, S.J.M.H. Submitted. Ap-
plying transfer function-noise modelling to characterize soil moisture dynamics:
a data-driven approach using remote sensing data.
5. Van der Velde, R., Colliander, A., Pezij, M., Benninga, H. F., Bindlish, R., Chan, S.
K., Jackson, T. J., Hendriks, D. M. D., Augustijn, D. C. M., and Su, Z. 2019. Valida-
tion of SMAP L2 passive-only soil moisture products using in situ measurements
collected in Twente, The Netherlands. Hydrology and Earth System Sciences Dis-
cussions, doi:10.5194/hess-2019-471, in review.
173
Conference abstracts
1. Pezij, M., Augustijn, D.C.M., Hendriks, D.M.D., Hulscher, S.J.M.H. 2016. Optimiz-
ing operational water management with soil moisture data from Sentinel-1 satel-
lites. EGU2016-8226. EGU General Assembly 2016.
2. Pezij, M., Augustijn, D.C.M., Hendriks, D.M.D., Hulscher, S.J.M.H. 2018. Applic-
ation of Sentinel-1 soil moisture information for improving groundwater simula-
tions. EGU2018-4812. EGU General Assembly 2018.
3. Pezij, M., Augustijn, D.C.M., Hendriks, D.M.D., Hulscher, S.J.M.H. 2019. Transfer
Function-Noise Modeling Using Remote Sensing Data to Characterize Soil Mois-
ture Dynamics: a Data-driven Approach. AGU Fall Meeting 2019.
Conference contributions without abstract
1. Pezij, M., Augustijn, D.C.M., Hendriks, D.M.D., Hulscher, S.J.M.H. 2016. Op-
timizing operational water management with a Sentinel-1 satellite soil moisture
product. Workshop on Data Assimilation in Terrestrial Systems 2016. University
of Bonn, Bonn, Germany.
2. Pezij, M., Augustijn, D.C.M., Hendriks, D.M.D., Hulscher, S.J.M.H. 2017. Op-
timizing operational water management with a Sentinel-1 satellite soil moisture
product. Course on advanced data assimilation methods. ECMWF, Reading, United
Kingdom.
3. Pezij, M. 2018. Gebruik van Sentinel-1 bodemvochtinformatie in NHI en FEWS.
Deltares Software Days 2018. Deltares, Delft, the Netherlands.
Datasets
1. Benninga, H.F., Carranza, C.D.U., Pezij, M., Van der Ploeg, M.J., Augustijn, D.C.M.,
Van der Velde, R. 2017. Regional soil moisture monitoring network in the Raam
catchment in the Netherlands. University of Twente. Dataset. doi:10.4121/uuid:241
1bbb8-2161-4f31-985f-7b65b8448bc9.
2. Pezij, M., Augustijn, D.C.M., Hendriks, D.M.D., Hulscher, S.J.M.H. 2019. Data un-
derlying the publication: Applying transfer function-noise modelling to charac-
terize soil moisture dynamics: a data-driven approach using remote sensing data.
Dataset. doi:10.4121/uuid:ba33fc56-e07b-4547-9630-9b1565d18040
174

Professional publications
1. Pezij, M., Benninga, H.F., Carranza, C.D.U., Augustijn, D.C.M., Van der Velde, R.,
Van der Ploeg, M.J. 2016. Bodemvocht uit satellietdata voor optimalisatie water-
beheer. Land + water 56, 7/8, 26-27.
2. Van der Velde, R., Benninga, H.F., Pezij, M., Augustijn, D.C.M., Carranza, C.D.U.,
Van der Ploeg, M.J., Hendriks, D.M.D. 2018. Bodemvocht uit satellietdata: wat kan
de Nederlandse waterbeheerder ermee? H2O 11
175
Copyright © 2022 FDOKUMEN