
Preliminary analysis of distributed in situ soil moisture measurements
7
Preliminary analysis of distributed in situ soil moisture measurements L. Brocca, M. Galli, M. Stelluti To cite this version: L. Brocca, M. Galli, M. Stelluti. Preliminary analysis of distributed in situ soil moisture measurements. Advances in Geosciences, European Geosciences Union (EGU), 2005, 2, pp.81- 86. <hal-00296841> HAL Id: hal-00296841 https://hal.archives-ouvertes.fr/hal-00296841 Submitted on 31 Mar 2005 HAL is a multi-disciplinary open access archive for the deposit and dissemination of sci- entific research documents, whether they are pub- lished or not. The documents may come from teaching and research institutions in France or abroad, or from public or private research centers. L’archive ouverte pluridisciplinaire HAL, est destin´ ee au d´ epˆ ot et ` a la diffusion de documents scientifiques de niveau recherche, publi´ es ou non, ´ emanant des ´ etablissements d’enseignement et de recherche fran¸cais ou ´ etrangers, des laboratoires publics ou priv´ es.
-
Upload
independent -
Category
Documents
-
view
2 -
download
0
Transcript of Preliminary analysis of distributed in situ soil moisture measurements

Preliminary analysis of distributed in situ soil moisture
measurements
L. Brocca, M. Galli, M. Stelluti
To cite this version:
L. Brocca, M. Galli, M. Stelluti. Preliminary analysis of distributed in situ soil moisturemeasurements. Advances in Geosciences, European Geosciences Union (EGU), 2005, 2, pp.81-86. <hal-00296841>
HAL Id: hal-00296841
https://hal.archives-ouvertes.fr/hal-00296841
Submitted on 31 Mar 2005
HAL is a multi-disciplinary open accessarchive for the deposit and dissemination of sci-entific research documents, whether they are pub-lished or not. The documents may come fromteaching and research institutions in France orabroad, or from public or private research centers.
L’archive ouverte pluridisciplinaire HAL, estdestinee au depot et a la diffusion de documentsscientifiques de niveau recherche, publies ou non,emanant des etablissements d’enseignement et derecherche francais ou etrangers, des laboratoirespublics ou prives.

Advances in Geosciences, 2, 81–86, 2005SRef-ID: 1680-7359/adgeo/2005-2-81European Geosciences Union© 2005 Author(s). This work is licensedunder a Creative Commons License.
Advances inGeosciences
Preliminary analysis of distributed in situ soil moisturemeasurements
L. Brocca, M. Galli, and M. Stelluti
National Research Council, IRPI, Via Madonna Alta, 126, Perugia, Italy
Received: 25 November 2004 – Revised: 2 March 2005 – Accepted: 4 March 2005 – Published: 31 March 2005
Abstract. Surface soil moisture content is highly variable inboth space and time. Remote sensing can provide an effec-tive methodology for mapping surface moisture content overlarge areas but ground based measurements are required totest its reliability and to calibrate retrieval algorithms. Re-cently, we had the opportunity to design and perform an ex-periment aimed at jointly acquiring measurements of surfacesoil water content at various locations and remotely sensedhyperspectral data. The area selected for the experiment islocated in central Umbria and it extends for 90 km2. For thearea, detailed lithological and multi-temporal landslide in-ventory maps were available. We identified eight plots wheremeasurements of soil water content were made using a TimeDomain Reflectometer (TDR). The plots range in size from100 m2 to 600 m2, and cover a variety of topographic andmorphological settings. The TDR measurements were con-ducted during four days, on 5 April, 15 April, 2 May and3 May 2004. On 3 May the NERC airborne CASI 2 ac-quired the hyperspectral data. Preliminary analysis concern-ing the matching between the landslides and the soil moisturewere reported. Statistical and geostatistical analysis inves-tigating the spatial-temporal soil moisture distribution wereperformed. These results will be compared with the data ofsurface temperature obtained from the remotely sensed hy-perspectral sensor.
1 Introduction
Quantitative information on soil moisture before and during arainfall event is an important information to forecast the timeand location of shallow landslides (Campbell, 1975; Crostaand Frattini, 2003) and floods (Goodrich et al., 1994). Thisinformation is difficult to obtain, because the classical pointmeasurements techniques (e.g., Time Domain Reflectome-try, gravimetric, geoelectric) are unable to cover large areas.
Correspondence to:L. Brocca([email protected])
To fill this gap, attempts have been made to determine soilmoisture conditions in the upper layer of the soil using re-mote sensing techniques spanning the range of frequenciesfrom optical to microwaves (Pietroniro and Prowse, 2002). Alimitation of remotely sensed data to ascertain soil moisturefrom satellite or airborne sensors lays in the lack of quanti-tative ground measurements of water content (Famiglietti etal., 1999). In May 2004, we performed a campaign aimedat acquiring in situ soil moisture measurements to be corre-lated with remotely sensed hyperspectral data. In this paperwe report on the field measurements, including a preliminaryanalysis of the obtained data.
2 Study area
We performed the experiment in a 90 km2 area in Umbria,Central Italy, located between the towns of Collazzone andTodi. For the area, a detailed lithological map, a multi-temporal landslide inventory map, and a land use map, wereavailable to us. The lithological map and the multi-temporalinventory map were prepared at 1:10 000 scale though exten-sive field studies aided by the interpretation of multiple setsof aerial photographs (Fig. 1). In the area the following rocktypes crop out: (I) alluvial deposit, (II) talus deposit, (III)travertine deposit, (IV) continental deposit, (V) gravel, (VI)sand, (VII) clay, (VIII) layered sandstone and marl, and (IX)layered limestone.
We measured volumetric soil moisture at eight sites (yel-low squares in Fig. 1) using a Time Domain Reflectometer(TDR). At each site, systematic soil moisture measurementswere obtained on square or rectangular plots ranging from100 m2 (10 m×10 m) to 600 m2 (20 m×30 m) in size, andcovering different topographic settings, from flat to slopingterrain. Some of the plots were selected to cross the boundaryof recent landslides. TDR measurements were conducted ongrids of 1×1, 2×2 or 4×4 m. For each plot we obtained from96 to 176 TDR measurements, for a total of 2781 soil mois-ture data. TDR measurements were also made along profiles

82 L. Brocca et al.: Soil moisture measurements
8
Figure 1 – Study area with location of investigated sites. Landslides and lithology are shown.
A) Landslides inventory map. Numbers corresponds to site ID. B) Lithological map: (I)
alluvial deposit, (II) talus deposit, (III) travertine deposit, (IV) continental deposit, (V) gravel,
(VI) sand, (VII) clay, (VIII) layered sandstone and marl, and (IX) layered limestone.
A) B)
Fig. 1. Study area with location of investigated sites. Landslides and lithology are shown. A) Landslides inventory map. Numbers corre-sponds to site ID. B) Lithological map: (I) alluvial deposit, (II) talus deposit, (III) travertine deposit, (IV) continental deposit, (V) gravel,(VI) sand, (VII) clay, (VIII) layered sandstone and marl, and (IX) layered limestone.
joining two plots, or following the local steepest slope. Pro-files were from 100 to 150 m long. Measurements along theprofiles were made every 4 or 5 m. The TDR campaign wasconducted on 5 April, 15 April, 2 May and 3 May 2004. Thiswas a wet period in Umbria. Cumulative rainfall for severalraingauges exceeded 130 mm, larger than the long term aver-age for the period (74.2 mm at the raingauge of Todi).
On 3 May 2004 the NERC airborne CASI-2 hyperspectralsystem was flown over the area. Simultaneously, a LIDARobtained detailed elevation data. The airborne hyperspectraland lidar data are not yet available to us. During the fly,we measured water surface temperature in two small arti-ficial lakes located inside (Fig. 1) and outside of the studyarea. Measurements of water surface temperature will beused to calibrate the remotely-sensed hyperspectral data. Inthe TDR instrument used to measure volumetric soil mois-ture stainless-steel wave guides were 15 cm long and spaced5 cm, encompassing a volume of soil of about 750 cm3. Toprecisely locate the soil moisture measurements, we used twodouble-frequency GPS receivers. GPS measurements wereconducted at a rate of 1 per second.
3 Preliminary analysis
Our preliminary analysis of the available soil moisture dataconsists of: a) comparison between landslides and the soilmoisture maps; b) statistical analysis of the measurements;c) geostatistical analysis of the measurements.
We first compare the spatial (geographic) distribution ofsoil moisture map with the location of existing landslides.For the purpose we prepared soil moisture maps for each site.The maps were obtained through inverse distance weighted(IDW) interpolation of the point TDR measurements. Selec-tion of a simple interpolation method - compared to more so-phisticated interpolation techniques, e.g. Kriging – was madebecause for this work we were interested in matching the soilmoisture patterns with the landslides boundaries.
In Figs. 2, 3, and 4 we show the results for three sites,where soil moisture measurements were made in areas whererecent landslides have occurred. The location of landslideswas known from the interpretation of multiple sets of arealphotographs flown in the period from 1941 to 1997.
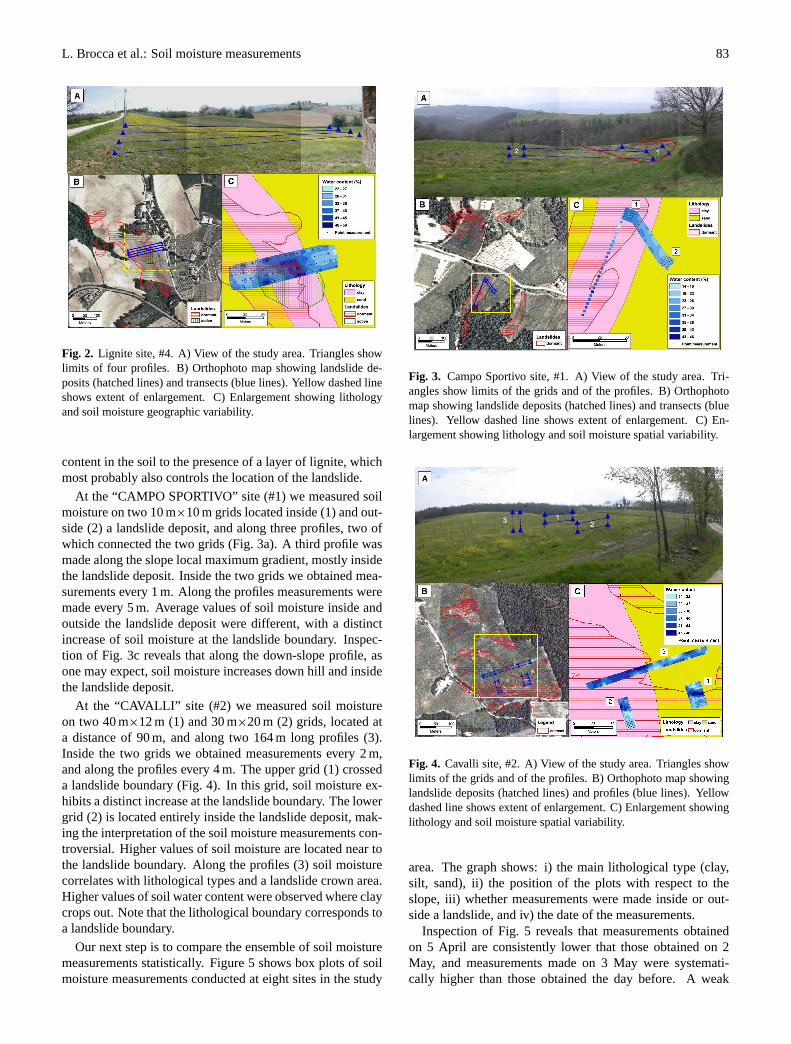
At the “LIGNITE” site (#4) we measured soil moisturealong four profiles, 4 m apart, aligned along the slope localmaximum gradient (Fig. 2). Measurements revealed a centralzone of higher soil moisture content (a “wet” zone), shownin dark blue colours in Fig. 2c. We attribute the higher water
L. Brocca et al.: Soil moisture measurements 83
9
Figure 2 – Lignite site, # 4. A) View of the study area. Triangles show limits of four profiles.
B) Orthophoto map showing landslide deposits (hatched lines) and transects (blue lines).
Yellow dashed line shows extent of enlargement. C) Enlargement showing lithology and soil
moisture geographic variability.
Fig. 2. Lignite site, #4. A) View of the study area. Triangles showlimits of four profiles. B) Orthophoto map showing landslide de-posits (hatched lines) and transects (blue lines). Yellow dashed lineshows extent of enlargement. C) Enlargement showing lithologyand soil moisture geographic variability.
content in the soil to the presence of a layer of lignite, whichmost probably also controls the location of the landslide.
At the “CAMPO SPORTIVO” site (#1) we measured soilmoisture on two 10 m×10 m grids located inside (1) and out-side (2) a landslide deposit, and along three profiles, two ofwhich connected the two grids (Fig. 3a). A third profile wasmade along the slope local maximum gradient, mostly insidethe landslide deposit. Inside the two grids we obtained mea-surements every 1 m. Along the profiles measurements weremade every 5 m. Average values of soil moisture inside andoutside the landslide deposit were different, with a distinctincrease of soil moisture at the landslide boundary. Inspec-tion of Fig. 3c reveals that along the down-slope profile, asone may expect, soil moisture increases down hill and insidethe landslide deposit.
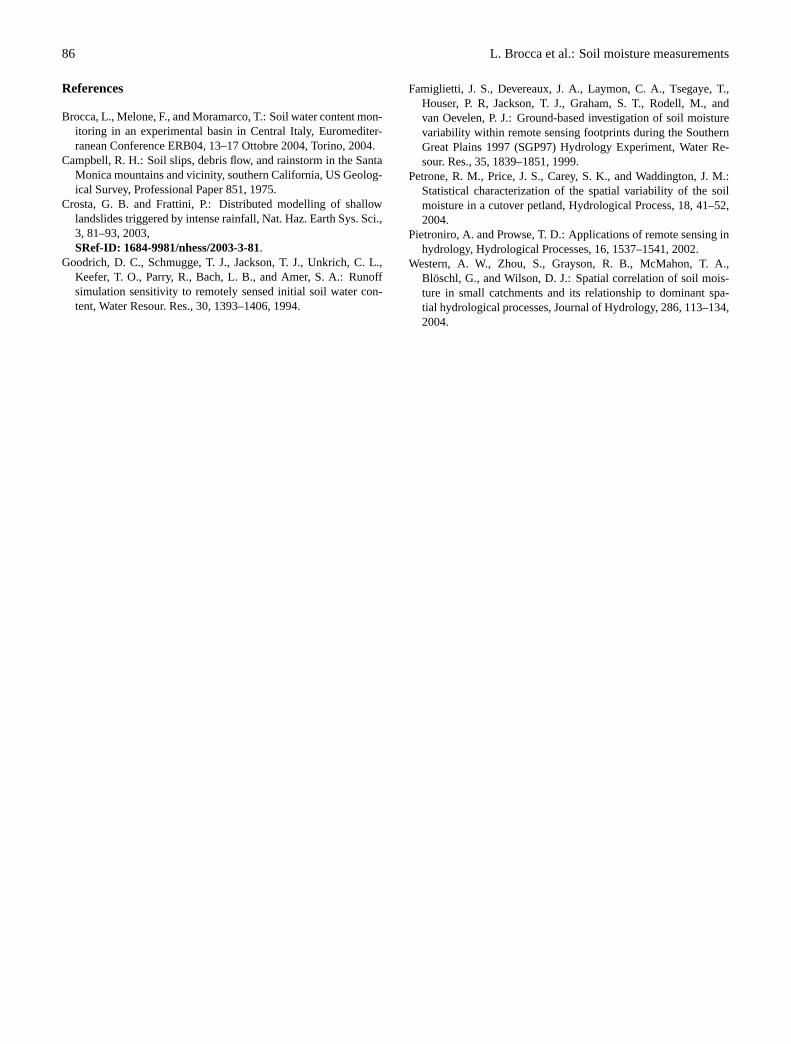
At the “CAVALLI” site (#2) we measured soil moistureon two 40 m×12 m (1) and 30 m×20 m (2) grids, located ata distance of 90 m, and along two 164 m long profiles (3).Inside the two grids we obtained measurements every 2 m,and along the profiles every 4 m. The upper grid (1) crosseda landslide boundary (Fig. 4). In this grid, soil moisture ex-hibits a distinct increase at the landslide boundary. The lowergrid (2) is located entirely inside the landslide deposit, mak-ing the interpretation of the soil moisture measurements con-troversial. Higher values of soil moisture are located near tothe landslide boundary. Along the profiles (3) soil moisturecorrelates with lithological types and a landslide crown area.Higher values of soil water content were observed where claycrops out. Note that the lithological boundary corresponds toa landslide boundary.
Our next step is to compare the ensemble of soil moisturemeasurements statistically. Figure 5 shows box plots of soilmoisture measurements conducted at eight sites in the study
10
Figure 3 – Campo Sportivo site, # 1. A) View of the study area. Triangles show limits of the
grids and of the profiles. B) Orthophoto map showing landslide deposits (hatched lines) and
transects (blue lines). Yellow dashed line shows extent of enlargement. C) Enlargement
showing lithology and soil moisture spatial variability.
Fig. 3. Campo Sportivo site, #1. A) View of the study area. Tri-angles show limits of the grids and of the profiles. B) Orthophotomap showing landslide deposits (hatched lines) and transects (bluelines). Yellow dashed line shows extent of enlargement. C) En-largement showing lithology and soil moisture spatial variability.
11
Figure 4 – Cavalli site, # 2. A) View of the study area. Triangles show limits of the grids and
of the profiles. B) Orthophoto map showing landslide deposits (hatched lines) and profiles
(blue lines). Yellow dashed line shows extent of enlargement. C) Enlargement showing
lithology and soil moisture spatial variability.
Fig. 4. Cavalli site, #2. A) View of the study area. Triangles showlimits of the grids and of the profiles. B) Orthophoto map showinglandslide deposits (hatched lines) and profiles (blue lines). Yellowdashed line shows extent of enlargement. C) Enlargement showinglithology and soil moisture spatial variability.
area. The graph shows: i) the main lithological type (clay,silt, sand), ii) the position of the plots with respect to theslope, iii) whether measurements were made inside or out-side a landslide, and iv) the date of the measurements.
Inspection of Fig. 5 reveals that measurements obtainedon 5 April are consistently lower that those obtained on 2May, and measurements made on 3 May were systemati-cally higher than those obtained the day before. A weak

84 L. Brocca et al.: Soil moisture measurements
12
Figure 5 – Box plot of water content measurements at 10 sites. See Figure 1 for site location.
Figure 6 – Correlation between daily precipitation (histogram, right y axis) and soil moisture
conditions (box plot, left y axis) for 3 sites. See Figure 1 for site location.
Fig. 5. Box plot of water content measurements at 10 sites. See Fig. 1 for site location.
12
Figure 5 – Box plot of water content measurements at 10 sites. See Figure 1 for site location.
Figure 6 – Correlation between daily precipitation (histogram, right y axis) and soil moisture
conditions (box plot, left y axis) for 3 sites. See Figure 1 for site location.
Fig. 6. Correlation between daily precipitation (histogram, right y axis) and soil moisture conditions (box plot, left y axis) for 3 sites. SeeFig. 1 for site location.
correlation exists between lithological types and soil mois-ture, with clay deposits exhibiting higher values. No clearcorrelation exists with the position of the measurements onthe slope. Statistical tests revealed that the measured soilmoisture data do not follow a normal, log-normal or extremevalue (Gumbel) distribution. Coefficient of variation was0.11, in agreement with other field campaigns conducted inCentral Italy (Brocca et al., 2004).
Figure 6 shows box plots of soil moisture measurementsalong with the time series of the daily precipitation at 3 sites.The first set of measurements on 4 April was made after a
relatively dry period, while the other set of measurementswere obtained during or after a wet period. The latter mea-surements are characterized by an higher soil moisture con-tent.
To further explore soil moisture spatial variability, wecomputed variograms for plots exceeding 300 m2 in size(Fig. 7). We obtained a correlation length ranging between10 and 35 m, in agreement with published results for sites notinvolved in slope failures (Petrone et al., 2004; Western et al.,2004).

L. Brocca et al.: Soil moisture measurements 85
13
0
10
20
30
40
50
60
70
80
0 5 10 15 20 25 30lag (m)
vario
gram
(%2 )
N° 2A - 05/04/04
N° 2A - 02/05/04
N° 2B - 02/05/04
N° 3 - 02/05/04
N° 6 - 05/04/04
N° 6 - 02/05/04
N° 6 - 03/05/04
N° 8 - 02/05/04
N° 8 - 03/05/04
Figure 7 – Variograms of measuring plots with area greater than 300 m2. Symbols represent
sample variograms and solid lines the theoretical exponential models.
Figure 8 – Soil moisture maps (Inverse distance weight method) for the “SPELTARA” site (# 6)
and for 3 different dates. A) 5 April 2004, B) 2 May 2004, C) 3 May 2004. Colours indicate
percentage of water in the soil, from 25% (light blue) to 60% (dark blue).
Fig. 7. Variograms of measuring plots with area greater than300 m2. Symbols represent sample variograms and solid lines thetheoretical exponential models.
Finally, Fig. 8 shows the spatial distribution of soil mois-ture for the SPELTARA site (#6). At this site we obtainedrepeated measurements on the same 30 m×10 m grid. Mea-surements were made on 5 April, 2 May and 3 May 2004.Combined analysis of the three maps reveals that the spatialpattern of soil moisture remains similar, even if the absolutevalues of soil moisture change. Determination coefficient (R)between the soil moisture measurements carried out at thesame point varies between 0.7 and 0.8. We obtained similarresults for all the plots for which repeated measurements areavailable.
4 Conclusions
The preliminary analysis of the available soil moisture dataallows us to derive some general conclusion.
We observed a distinct (relative) variation in the valuesof the measured soil moisture at the boundary of existinglandslides. In general, soil moisture exhibits lower valuesinside and outside a landslide deposit, possibly depending onlithology, and higher values at the landslide boundary. Wetentatively explain this by the presence of fractures at theboundary between the stable ground and the landslide. Geo-statistical analysis conducted on the larger test sites revealeda spatial correlation length of soil moisture of about 10–35 mwith an average of 20 m. This is in agreement with measure-ments conducted in northern Umbria (Brocca et al., 2004).Where TDR measurements were repeated two or three times,the absolute values of the measured soil moisture changed,but the geographical trend remained the same. Areas iden-tified as relatively more “wet” or “dry” during one set ofmeasurements remained “wet” and “dry” in the other mea-surements. This is linked mainly to the local soil character-istics and to the presence/absence of landslides boundariesand subordinately to the position on the slope, mainly for themeasurements carried out along profiles. Vegetation at each
13
0
10
20
30
40
50
60
70
80
0 5 10 15 20 25 30lag (m)
vario
gram
(%2 )
N° 2A - 05/04/04
N° 2A - 02/05/04
N° 2B - 02/05/04
N° 3 - 02/05/04
N° 6 - 05/04/04
N° 6 - 02/05/04
N° 6 - 03/05/04
N° 8 - 02/05/04
N° 8 - 03/05/04
Figure 7 – Variograms of measuring plots with area greater than 300 m2. Symbols represent
sample variograms and solid lines the theoretical exponential models.
Figure 8 – Soil moisture maps (Inverse distance weight method) for the “SPELTARA” site (# 6)
and for 3 different dates. A) 5 April 2004, B) 2 May 2004, C) 3 May 2004. Colours indicate
percentage of water in the soil, from 25% (light blue) to 60% (dark blue).
Fig. 8. Soil moisture maps (Inverse distance weight method) for the“SPELTARA” site (#6) and for 3 different dates. A) 5 April 2004,B) 2 May 2004, C) 3 May 2004. Colours indicate percentage ofwater in the soil, from 25% (light blue) to 60% (dark blue).
sites is nearly uniform, and we don’t have information of soilmoisture variability due to the land cover characteristics.
Soil moisture measurements carried out in this study weremostly addressed to the validation of the hyperspectral dataobtained by NERC. To further investigate the correlation be-tween soil moisture in the upper layer of the soil and the pres-ence or absence of landslides, we are designing a new cam-paign of field measurements. In this campaign data will beacquired on much larger grids covering an entire slope, but ata coarser resolution, otherwise higher cost would be required.The aim of the new campaign is to validate the relationshipbetween soil moisture and the boundaries of the landslideshighlighted in this study, for an entire slope. Furthermore,because we observed a temporal persistency of the soil mois-ture temporal pattern, we can use this information, togetherwith the one already available, to compared at a larger scalethe superficial water content and the estimate of ground sur-face temperature obtained from the remotely-sensed hyper-spectral sensor, when this information will become available.
Acknowledgements.We thank the many participants, too numerousto list, that assisted with the data collection. This study would nothave been possible without their efforts.
Edited by: L. FerrarisReviewed by: F. Caparrini and another referee
86 L. Brocca et al.: Soil moisture measurements
References
Brocca, L., Melone, F., and Moramarco, T.: Soil water content mon-itoring in an experimental basin in Central Italy, Euromediter-ranean Conference ERB04, 13–17 Ottobre 2004, Torino, 2004.
Campbell, R. H.: Soil slips, debris flow, and rainstorm in the SantaMonica mountains and vicinity, southern California, US Geolog-ical Survey, Professional Paper 851, 1975.
Crosta, G. B. and Frattini, P.: Distributed modelling of shallowlandslides triggered by intense rainfall, Nat. Haz. Earth Sys. Sci.,3, 81–93, 2003,SRef-ID: 1684-9981/nhess/2003-3-81.
Goodrich, D. C., Schmugge, T. J., Jackson, T. J., Unkrich, C. L.,Keefer, T. O., Parry, R., Bach, L. B., and Amer, S. A.: Runoffsimulation sensitivity to remotely sensed initial soil water con-tent, Water Resour. Res., 30, 1393–1406, 1994.
Famiglietti, J. S., Devereaux, J. A., Laymon, C. A., Tsegaye, T.,Houser, P. R, Jackson, T. J., Graham, S. T., Rodell, M., andvan Oevelen, P. J.: Ground-based investigation of soil moisturevariability within remote sensing footprints during the SouthernGreat Plains 1997 (SGP97) Hydrology Experiment, Water Re-sour. Res., 35, 1839–1851, 1999.
Petrone, R. M., Price, J. S., Carey, S. K., and Waddington, J. M.:Statistical characterization of the spatial variability of the soilmoisture in a cutover petland, Hydrological Process, 18, 41–52,2004.
Pietroniro, A. and Prowse, T. D.: Applications of remote sensing inhydrology, Hydrological Processes, 16, 1537–1541, 2002.
Western, A. W., Zhou, S., Grayson, R. B., McMahon, T. A.,Bloschl, G., and Wilson, D. J.: Spatial correlation of soil mois-ture in small catchments and its relationship to dominant spa-tial hydrological processes, Journal of Hydrology, 286, 113–134,2004.