
Energy, Moisture and Climate · in Buildings - AIVC
245
... ,;(·· '':. \ "'.°· .l' i.J 34} Technical Session II and Ill 3 International CIB W67 Symposium on Energy, Moisture and Climate · in Buildings 3 - 6 September 1990 Rotterdam The Netherlands /Vovem '\I'\. NOVEM (Netherlands Agency for Energy and the Environment) 0 ... Netherlands Ministry of Housing. Physical Planning and Envi- ronment RANI< XEROX Rank Xerox
-
Upload
khangminh22 -
Category
Documents
-
view
0 -
download
0
Transcript of Energy, Moisture and Climate · in Buildings - AIVC

...
("~~ -·· ··
,;(··'':.
\ "'.°·
.l'
(7}:;~·
i.J 34}
Technical Session II and Ill 3
International CIB W67 Symposium on
Energy, Moisture and Climate · in Buildings
3 - 6 September 1990 Rotterdam The Netherlands
/Vovem '\I'\.
NOVEM (Netherlands Agency for Energy and the Environment)
0 ...
Netherlands Ministry of Housing. Physical Planning and Environment
RANI< XEROX Rank Xerox

I r
I ... . -· . · ~ . ...
.. .....
Contents
Preface
Technical Session II: Natural and Mechanical Ventilation
;/II 1
.-(n 2
~ II3
Air permeability of dwelling units D. Beguin and J. Chandellier, France
Short time underground heat storage for ventilation G J. Besler and W. Gryglewicz, Pol~nd
-. Influence of wall roughness on wind pressure distribution and ventilation losses · P. Cernik, Czech & Slovak Federal Republic
/Il4 Temperature efficiency, air change efficiency and ventilation efficiency in an office room with displacement ventilation C.W J. Cox, PhJ. Ham, JM. Kopper and LLM. van Schijndel, Netherlands
)<. Il 5 Humidity controlled ducted ventilation
J(Il6
R.E. Edwards and C. Irwin, United Kingdom
BREVENT - a ventilation model R.P. Hartless, United Kingdom
(·~· ·. S(n 7 Method of rating the average annual performance of domestic air-to-air heat recovery units
r<.',:. ~
yns
J(Il9
LJ AM. Hendriksen, Netherlands
Procedures for calculating ventilation in rooms with open windows ir. J. Hussla.ge, Netherlands
Principle and aim of a natural humidity-controlled ventilation system P. Jardinier and J. Simonnot, France
·><_IT 10 Demand controlled ventilation systems in three Finnish demonstration dwelling houses M. Luoma, J. Laine and R. Kohonen, Finland ·
·-
~-

.. 1
:;.;:;: ;
VII 11 An expert system for the design of ventilation systems Hiroshi Matsumoto and Yasuo Utswni, Japan
y II 12 BREFAN - a diagnostic tool to assess the envelope air leakiness of large buildings · M.DA.E.S. Perera and R.G. Tull, United Kingdom
K II 13 Ventilation aspects of a low energy house H.W. Porter, R. Morgan and J. Rosell, Northern Ireland
(/ II 14 Numerical simulation of thermal convection in a room with natural ventilation caused by buoyancy J. Tsutswni, Japan
x II 15 Evaluating multi-zone air flows using a random search technique ; EB. Tumbuan, GLM. Augenbroe and PA. de Vries, Netherlands
II 16 Thermal characteristics of public buildings Jirl V averka, Czech & Slovak Federal Republic
£,. II 17 Experimental evaluation of a hygroregulating natural ventilation system /--- P. WouzersandL. Vandaele,Belgiwn
, ., .. .
Technical Session ID: Energy_Conservation Measures
ill 1 Energy-saving campaign at the NMB Bank
~m2
~m3
ill4
A. W. Alders, Netherlands
Development of a simple model for predicting the energy consumption of houses in hot maritime climates IM.Al-Naimi andBF. Warren, United Kingdom
Making use of the thermal inertia of the building using thermally open ceilings HM. Bruggema, Netherlands
Room index temperarure and the mergence of the radiative and convective mechanisms M.G. Davies, United Kingdom

I r
I . ' ~·
: · ... •. · .. ·
c= ..
ill 5 Grouping of building envelopes - an energy conservation measure N.K. Garg, India
ill 6 Heat loss to the ground from a building C.E. Hagentoft, Sweden
ill 7 Filled cavity walls: influence of design for workmanship on the hygric and thennal performances H. Hens and J. Lecompte, Belgium
ill 8 Studies of polyurethane-insulated one-family houses using new building components I. Hoglund, S. Ljunggren, G. Ottoson and R. Oman, Sweden
m 9 The thennal performance of the fabric of industrial buildings P J. Jones and G. Powell, United Kingdom
ill 10 A mathematical model of a membraneless ground heat and mass exchanger for design purposes W. Kowalczyk and G J. Besler, Poland
ill 11 Energy conservation ideas for preconditioning of ambient air in (H)V ACsystems W. Kowalczyk, Poland and AJ.Th.M. Wijsman, Netherlands
ill 12 Benefits of adjustable shutters, shading devices and vent windows in passive solar buildings P J. Lute, S.H. Liem and A.H.C. van Paassen, Netherlands
ill 13 Building 2000, a pilot project of the commission's non-nuclear energy r&dprogramme: solar energy applications to buildings C. den Ouden, Netherlands
ill 14 A simplified calculation method of seasonal air-conditioning requirements for residential buildings A. Ozaki, T. Watanabe and T. Sugai, Japan
m 15 Energy conservation in air-conditioning systems: theoretical and experimental approaches RA. Peixoto, MA.S. de Paiva, C.C. Chin, J.F .P. Cespedes and S.R.R. Vernola, Brazil

1·
I
.;.:··
l . (:_·.·
l i......
ill 16 Energy-saving measures for heating of dwellings versus consumer habits and price policy Ladislav Pirsel and Dus an P errti.s, Czech & Slovak Federal Republic
m 17 The reduction in solar heat gain caused by condensation on glazing A.C. Pitts and T. Lam, United Kingdom
m 18 The justification of energy efficient multi-storey commercial building design Graeme Robenson, New Zealand
ill 19 The low-energy dwelling for hot-humid Singapore Suthipuntha Sujarirtanonta, Singapore
ill 20 Some problems of functioning of central heating systems in case of extreme outdoor temperature· J6zsejVajda, Hungary
ill 21 Building-physical aspects of the VROM building's atria P.H. Wapenaar, Netherlands

!:'..'=:°:; .. •
~~! .• :;:
Preface
The primary call for papers for the International Symposium on Energy, Moisture and Climate in Buildings enjoyed an overwhelming response. Over 180 contributions were announced and by September 1989 most of the abstracts were submitted to the scientific secretariat
A Paper Selection Panel, with members from the Executive Committee, screened the abstracts on the sole criterion for acceptance: a significant affinity with the topic of any of the Seminars or Technical Sessions. According to the Panel twenty papers had to be refused on that basis. A few other contributions were allocated to a Seminar or Session different than originally indicated by the authors.
In the course of time several contributions were withdrawn by the authors, mostly for reasons of time-pressure. By the end of April 1990, well after the previously set deadline, 125 final papers had come in. The Paper Selection Panel reviewed all these carefully and selected a number of authors to be invited for oral presentation at the Symposium. It must be emphasized that the criteria for oral presentation should by no means be understood as a standard for the judgement of quality of the contributions. In the selection procedure other, sometimes practical or trivial, reasons have played a . part as well.
I am convinced that all papers included in these Proceedings are of high quality and that each of them include interesting features connected with the topics of the Symposium. Therefore the result of the Symosium will be of considerable imponance to the field of research and practice.
September 1990 Eltjo Tammes Chairman of the International Symposium Committee

r I
. ; ·~·
:, . . ··
(}: ·:
1. INTRODUCTION
AIR PERMEABDJrY OF DWELLING UNITS
D. Beguin, J. Chandellier Centre Scientifique et Technique du Batiment (Scientific and Technical Building Center) Paris, France
II 1
Observations and measurements performed on existing building have made it poWble to demonstrate that in the ventilation of premises, the proportion of "parasite" air infiltration is of the same order of magnitude, sometimes even larger, than the proportion of air change, specific to ventilalion systems. .
"Parasite" air infiltration is due to seal defects in the building envelope. The air change specific to a dwelling unit is provided by ventilation equipment installed to satisfy the occupancy needs of the premises.
Furthermore, the CSTB has initiated a reflection, intended to determine. for all building construction techniques and in particular for dwelling units, the basis which will make it possible :
· - to reduce the air permeability of dwelling units in order to improve occupant comfort and to minimise energy expenses,
- in certain cases, to define diff ercnt air perm.ability levels, - to define the technical arrangements associated with these levels.
2. ANALYSIS METHOD
In order to be as thorough as possible, the study of parasite air infiltrations has been set up based upon the following principle: -.;,. -·•· :· ' .. .... An observer, plated at the center of the room, studies the causes of air infiltrations by ·· '·' · tracing the routing of the air from the inside of the room to outside of the building. ·
:":.;. ;,; , I -~
I © ~ I
<D
Figure 1 : Location of the various categories

..
I \
The observer can be real ; this is the case of the occupant or expert who directly observes the effects of infiltration and can only adopt a curative approach. · But the observer may be virtual ; this is the case of the company or of the main contractor who wishes to know what technical solutions would prevent infiltration problems, thus adopting a preventive approach. The method adopted aims to respond to these two interrogation modes.
So air infiltration can be broken down into four categories according to their locations. ie. undifferentiated part of walls, connections between undifferentiated parts, junctions between undifferentiated parts in walls and inclusions located within these walls and finally, actually within the inclusions (see figure 1). All the possible cases of infiltration are the identified for each category. The parameters taken into account may be the nature of the walls, the type of structure ... but do not bring in a particular building technique. For each case identified in a category, we build up a so called "findings" file which dcscnbcs the problems and the causes of infiltration. At this stage, the various building technologies are integrated into the analysis. The problems desaibed in the "fin.dings" file arc handled in the "solution• files which may be comm.on to several "findings" files.
So we end up wi1h two sets of files : - "findings" files : description of the problem and its various aspects, - "solution• files : solution of the ways and means for solving air infiltration problems.
The purpose of the study is to : - Analyz.e, in the most thorough possible orderly and detailed manner; air infiltration in building structures (category files). - Propose technical measures which can be adopted and specified, supported by quantitative performed both in the laboratory and in existing dwelling units.
.-3.EXAMPLES
c ''Findings" file ~ 11 corresponds to a building technique which is quite usual in France, i.e. that of walls receiving heat insulation instaUed on the inside. In the file we indicate tht variom tcchniqucs for building this type of wall and in particular, the teclmiquc which cm.ploys plaster panel/insulation maLerial heat insulation comp.lmcs, bonded using· an adhesive mortar on a masonry of small elements with a thin, non ventilated. interposed air space. Im f:act. we state that although this air layer is czpected to be non ventilated, substantial air infiltration may appear, in particular at the foot of the lining which, until present, was only scaled by the baseboard, a fairly ineffective solution. -· ·· - '"·'
"Fmdings" file C3-21 is relative to the junction between a f:a~ component (window) and a backing wall or a thin lining wall, eypc plaster panelf JD5Ularion material heat insulation compla. According to the results of the measurements, it is at this cmmcction where a major part of the parasite infiltrations encountered in French dwelling uoits is found. The work on this particular point leads to configurations which arc often compla. ·
::"·

-·
;. ·=·
:- : . .. :·:·-·
.. (~,'-
1
CATEGORY 2 : Connection aroud the outside of the wall
Connection at the floor thin walls/heavy floor
OIAGRAH
Ill(( d I 4 11\""4+-2
vertical section
CZ-11 .
DESCRIPTION
1 : masonry ·· shuttered concrete· heavy or light precast panel framing wa 11 light semi-curtain fayade light panel fayade
2 : panel partition on framing canplex bonded or fastened fixed sandwich
3 : solid slab underslab joists-filler elements
4 : air layer ventilated or not 3 I _I ---- - --- ·-· ··- - -·-
Air infiltration at the baseboard is the results of pressurbing the air layer. According to the wa 11 design, there are two cases .: .' = -~i! '.;_.
... .. ~·:' · ·~ ~
A : The air layer is nonnally ventilated : ,I'
' ..
* Framing wall or wall with aerated air space •' - ~ ~ . -. record S3
* Masonry wa 11, type II r · .. -~·,;_
record S3 .. . .. * Dynamic insulation wall
.. , '··-··~t .... ... .... ;; ~;. :~ · · .... ; :: • · ... record S3 . , ;-,_ .. ..
The air seal can only be set up at the c~nnection ... 1": ·~·-· !
B : The air layer is nonna lly non ventilated : ·: . .;;:.; •. ;"'r; ., .-": 1 - ,,; : ~;.:q ·•rs ;i:
Accidental penetration of air into the air layer may be due to a fault: ~:i:. 'J •-:;~'..i°• '.~i7 -·~ _.-.. ; • ..1 · -;;iJ .... ' t · ·''"' .• Jq~ ... . :.. ..... - -~. • . , • . , . .. ..... "!. ' '1 :~v; -
* In the outside wall seal : On this subject, ,.~~ the 'i:ate~o:ry Cl. -record . based . ~n the technique adopted for the outside wa 11 _:,. .. . ~ · ,~: . ... :~.; c<. 1 , : . ;'.'1:~:..: r ~~-:i
Masonry wall : Masonry of Slllllll elsnents · ·-· ~- ., .. , · t ~ : record Cl-3 Masonry wa 11 : Shuttered concrete ... ,, . .J>:;,~.:-' · ·· · - • - . record Cl-4
Light fai;ades .1
J-.;,, .,. _ .• . :... • ·- · .- ·.record Cl-5 Fa~ades of heavy panels · record Cl-6
• ,.. • '"· .. f' • • • ~ \. • ~ • .. , • ·; - .. ~ ., . .. .. "'.) • : . . _.('. ~ 4
*Connections on. the per1phery of the outside wall : See the other _category C2 records ·F' -
* At the junct;on between inclusions and the outside wall : See the category C3 records Case of envelope components --·- · -----------record C3-11 .. --• ~
-- Case of other inclusions -·· -----·~·- . . ····- , . , .,. .,, , .--.,i .record C3-12· : ... , -: ~f .. ~ ~!. \~J ,;.-J:;i.':"_·· ~(j· . ,1J. .: . ,. _. ~ .. • -

. :
CATEGORY 3 : Wall/Inclusion connections
Connection between thin vertical wall and back wall/envelope component
DIAGRAM
h<l"izontal ~ction
vertical section
2
3
CJ-21
DESCRIPTION
masonry shuttered concrete panel framing wall
panel on framing bonded or fastened complex
fixed part of a component : window, door window, fixed opening sash outside door housing of rolling shutter, closet
The wa 11 ts composed of severa 1 separate layers with vartab le thickness atr layers whose ventilation ts difficult to control. Air infiltration in the connection plane of the fixed part of a canponent at the vertical envelope of the building may cCllle either frcm the outside, or fran one of the variable tickness air layers, existing between t.o layers of different materials.
* In the DTU tt t s specified that the caulk ing must be done In order that the joint between the window and the shellwork provides, over Its whole perl11111ter , a irtightness and watertightness g iven the exposure conditions and tt. · predictable different ial lllDvanent betwen window and shellwork .
The ai r penet ration risk depends up0n : - - ' . - The nature of the materials := t1xed "part-of 'component, envelope wall ltntng el..,..t . - Type of Incorporat ion technique 9!'1 loyed. ~ . .. . . .; _
·,; : · For the probl• wntch concern· us , ·the building of this typa of connection work is •· • canpltcated by the ft.l lttla~r CQllPOS1tton of t he roan envelope •lls. ·
- And the position of the building, I.e . exposure and he tgt of the fac;ade.
Rules relative to executing caulking are reviewed tn : record S31
Special aspects of the probll!ll for handing the connection of a cmponent included tn a •ll containing a lining are covered by ·the : ' record 533
- ~ .. -~.: : :: -~-~ :..~;!. ' ~~ ... " .l ~!: .:~.i ~ ;-: ;
*' DTU : Doc1111ents Techniques Unlf16s (Untf1ed Codes of Practice)
-·--~·--· ... ~
,.

:~· ·.:=.
;;,1,,,
~.r, :'· . ·,~: . .. ~ .. t
( -..
DIAGRAM
horiwital secti!J'l
~ UOOO JOitfRY
ll6TAUATI!n IH RfSET
. ... ,
horiwital secti.111
IJ ,·
..· .. , 1£TAL JODm' ;,._ :
!m'ro'. Il6TIUATICJI UITH SFIJN DIS
~tii:al section
~
Yertic:al secti111
. ... ,
~ 533
~ COMMENTS
Within such a design pattern, the air tightness problem is posed in two ways ; on the one hand. we need to make sure of the airtightness on the joint plane between the inc 1 uded component and the envelope she l lwork of the roan, a problem already covered in record S32, and on the second hand, to prevent both risk of infiltration through an air layer or space in the multi layer wa 11. The origin of such air circulation in spaces inside the wa 11 is often re lated to a seal fault in the wall's outside coats or coverings.
The reconmendations for executing this caulking are included in record 531. The choice of the caulking system depends upon the tyPe of installation of the component and the nature of the materials present.
The types of installation most frequently encountered are insta 1 lat ion in rabbet, surface mounting with splaying on as-cast masonry or on finished bay, surface mounting on the inside in as-cast masonry or on finished bay. 1 n a 11 these approaches, the 1 oads specific to and applied upon the component inserted must be transmitted to the supporting she l1'90rk. The adjacent illustration shows that this installation method requi"s the use of window ledge and dumny jamb lining in order to canp lete the insta llat 1on in the wa 11 layers not located within the plane of the Inclusion.
The air caning fran the air layer can be sealed :
- either by trying to build a caulking, framing the opening of the bay, 1n the plane separating the twa layers of material. This solution is not always practical lf one of the materials is excessively permeable, or 1f the air layer is too thick. It can also make 1t difficult to install a system.
- or by doing twa caulkings, between the ledge, d111111y jamb liner and fixed sash of the canponent , as we 11 as between the ledge, d111111y jamb Uner and the lining structure.
Fmally, "solution" rewrd 533, associated with the abovemcntioned "findings" record, mainly C%plains the various solutions to be applied in the various im~tion cases bnsed upon the type of matcriaJ and installation utilised. A wiser design, particularly with regard to the position of the window with relation to the s.hellwork can make it poSSlble to considerably reduce the risk of seal defect.
4. CONCLUSION
All the results of this study constitute a collection of solutions based upon which the designer can establish an overall approach to working with relation to the building envelope, making it ~le to prevent risk of air infiltration into dwelling units.
All the records will be able to be published in "educational" form and they will contribute to a better dissemination of knowledge of building structure behaviour.
The study undertaken with relation to air permeability problems in dwelling units will be exploited in various ways :
~ :.·~
- Each of the building participants will be able to pick up the clements which arc necessary to them and in this way disseminate specific_ recommendations in an appropriate form.
- In a second phase, the various professions will be arbitrating among the various solutions proposed and will be making choices to better guarantee satisfad:ory overall permeability for the dwelling unit. The analysis method adopted demonstrates that reduction in air volumes resulting from parasite infiltrations docs not entail adopting all the proposed solutions, it rather entails careful selection of solutions which might make it possible to obtain an optimal efficiency both in terms of technology and in terms of cost
The work is now at the final analysis stage. The solutions which we have proposed, from now on, need to be completed, improved and validated by mainly "in situ" measurements on c:xpcrimcntal
_ worksitcs along with qualitative observations conccming feasibility mainly generated from .~ laboratory configurations.
,. - ..
,;
I .
. . ~ ..
: ·•~a

·r
r
·:·. ' • • <.•
::·.
·.
SHORT TI ME UNDERGROUND HEAT S'fORAGE FOR VENTILATION
ABsrRACT
G.J. Besler, W. Gryglewicz Technical University of Wroclaw
Wroclaw, Poland
·II 2
The paper presents the new original concept of u~ilization of the ground for heat storage in ventilation systems. The idea of presented solution is based upon the construction of the Membraneless Heat and Mass Exchanger elaborated at the Technical University of Wroclaw. The mathematical model ox heat transfer within the bed of gravel with air flowing through it is also presented. Results of computer simulation of the system and the results ox experiments are shown on diagrams . Presented system of heat. storage in a bed ox gravel placed under the ground allows to reduce up to 80 % of heat. demands for ventilation in winter. It also makes it. possible t.o cool down t.he air st.ream in summer, covering 100 % of cool demands.
INTRODUCTION
Almost 40 % of the overall. thermal energy product.ion in Poland is . consumed xor heating, air conditioning and domestic hot wa t.er purposes. Development · and wide range application of" energy saving solutions in these systems would allow f"or the signif"icant. reduct.ion of energy consumption. Beside · t.he economical aspect., t.he savings .of the energy are closely connected with - t.he environment. protect.ion. - Reduct.ion o:f the energy consumption may be achieved .. by rationalization of· .. use .. ·~. ox•-· t.he :fuels. utilization of" . the unconventional.. . energy . ·sources and . the certain solutions · on : t.he -.!'ield . of recycling of once produced energy i.e. it.s accumulation.
DESCRIPTION OF THE PROPOSED SYSI'EM
The system of" heat. accumulation under t.he ground may be applied both in ventilating and air heating inst.allat.ions:. It.. allows . f'or effective ut.ili:zat.ion of t.he thermal energy of t.he exhaust. air for preheating or healing of t.he supply air st.ream in winter. Additionally t.he supply air may be cooled down in hot summer days. Application of t.he proposed system makes . possible the . whole year temperature cont.rel inside the ventilated rooms wit.h almost. no add~t.ional
energy consumption connected wi t.h air . treatment..:' The idea of t.he Membraneless Ground Heat. and Mass Exchanger elaborated at t.he Technical University of Wroclaw has been applied for . the construct.ion o:f t.he heat accumulator. ;. ·:,
( -:; Scheme of such heal exchanger is presented in Figure 1. _ ·:~: ·~
a.4 NK XEROX CtlMMllNtr..d TIF <:~aurrF

----.. -<=--- . ?i>
:!:I o,o
FIGURE 1. Scheme of' t.he membranless ground heat. and mass exchanger. 1- accumulative layer, 2- dist.ribut.ing channel, 3- gathering channel, 4- insulation, 5- showering inst.allat.ion, 6- air inlet., 7- covering soil.
The ambient. air is drawn through t.he inlet 6, distributing channel 3 and distribution layer 8 into t.he accumulative bed of' loose mineral particles 1. in which the main heat. transfer process occurs. Aft.er being treated the air is gathered in channel 3 and blown int.o t.he ventilated room. On top of t.he accumulative layer t.he showering installation is placed s. The accumulator is ·t.hen covered with t.he thermal and water insulation 4 and t.he layer of the soil 7. Showering installation is provided due · t.o periodical washing or disinf'ect.ion .of' t.he . bed. However aft.er a f'ew years of' operation. no need 'of such act.ivit.y has arisen. In the system .. of heat st.or age t.he accumulat.i ve layer · is split. into t.wo equaL parts. They are reversely charged wit.h an exhaust. air and di sch.argei:i wi t.h an ambient. air count.er currently in winter making t.he heating of' t.he ambient. air possible. ·--· .. . _ ·- ;· · ,-:-: In summer bot.h parts of' the accumulator are utilized in exchanger mode which enables si gni f' i cant. cooling of' t.he ambient. air . Due t.o . enable t.he i nvest.i gat.i on of' the di f'ferent. accumulators · working in t.he . same .. · condi t.ions t.he mathematical model.. of' it. . has been created and solved by Kowalczyk . C1). The differential. equations and t.he boundary conditions are presented below.
MATI-IEMATICAL MODEL OF 11-IE ACCUMULATOR OF THERMAL ENERGY -· ---:.
It. has been : verified ·experiment.ally C2) . : · t.hat. t.he condi t.1 ons _;_ f'or equivalence of' . t.wo and one phase models given by Vert.mayer and Schaef'er C3) are f'ulfilled !'or t.he gravel bed accumulator , o'f' heat. wit.h .::air st.ream "!'lowing through ' it.; ·- · ~ ~·"·- ·· '· .7:·_., -~.:: , :.r.-o::~_;.,,•." .· .... · · · .. _·.~:
··.·,
··: .. .
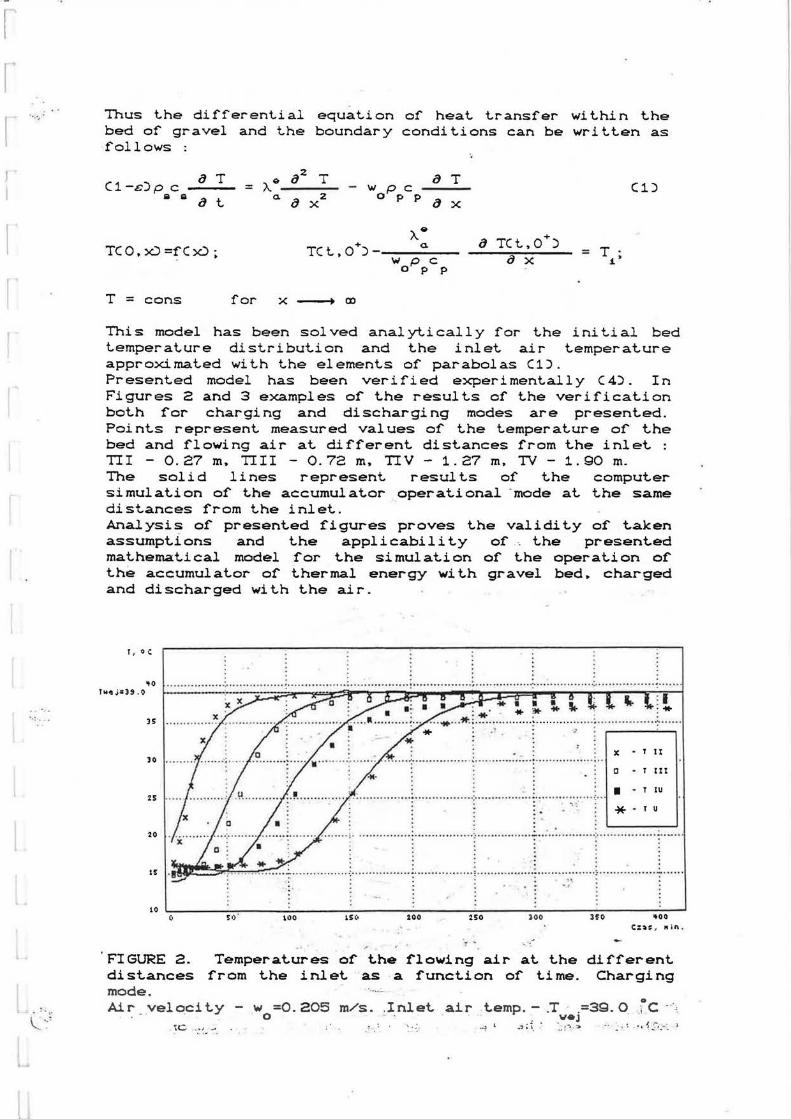
Thus the differential equation of heat transfer within the bed of gravel and the boundary conditions can be written as follows
iJ T 2 T a T C1-c)p c = A.e iJ - 'W pc (1) Q Q iJ t a. iJ x 2 opp ax
A.e iJ TC t, 0+)
TCO,x)=~Cx); TCt.,0+) a = T . w p c a x 1• 0 p p
T = cons for x ----+ (X)
This model has been solved analytically for the initial bed t.emperature distribution and the inlet. air t.emperat.ure approximated wit.ht.he elements of parabolas (1). Presented model has been verified experimentally C4). In Figures Z and 3 examples of the results of the verification both for charging and discharging modes are presented. Points represent measured values of the temperature of' the bed and flowing air at different distances from the inlet : TII - 0. 27 m, TIII - 0. 72 m, TIV - 1. 27 m. TV - 1. 90 m. The solid lines represent. results of the computer simulation of the accumulator operational -mode at the same distances from the inlet. Analysis of presented figures proves the validity of taken assumpt.i ans and the appl i cabi lit. y of -- the pr esent.ed mathematical model for the simulation of the operation of the accumulator of thermal energy with gravel bed~ charged and discharged with the air.
: .. . T' 0 c I
Twot;:39 .O 'tO •.... . . .. . . . ... . •. : • . ••••..• .. ...... ··· · ••• ••· · ·· · · · ······· · · · ·· · ···· : · ··· ·· ·· · · ·· ·· ·· · ~ ···· ·· • ·· · ·· ···· ·:· · · ·· ············ 0:00 ·••·········· · ·~· · · · · · ·
JS
X • T ll ]0
0 • T Ill
2S _.: ........................ .. ..... ....................... ·-··:·"· ·i I T lU ,. . . . * • T U
20
I! 1. &iJD~!: ~-r:~ .. ~.:. .... .. ..... ... ......... .. .... .. .......... ........ ............... :.: ... .. : .. ·:.:··"" ............. ........ .. . .,
10 to> " 100 15(• 200 • :SO lOO HO *00
C:a= , "in ,
FIGURE a. Temperatures of the flowing air at the different distances from the inlet. as a !'unction of lime. Charging mode. "-·-' Air _ _veloci t.y - w
0 =O. 2 05 m/s . . Inlet.
-.c · .. ;, air temp. - _T .=39. o tc '
·-~ l _-; d. .' .. ~~ ~. . . -. L:-. ... :.'

·-·~
,; .. .
r, 0 c
JO
:s
~ "
IS """ " "'ic'"
........ ··: .... .... .. .. ...... ·: .................. ~· ............ .... .
.. .... . . . . . ... .... . . . . . ........ . .. .... . ..... . ... : .. .... .. . ... . 1 x T I I
C • T lit
I T IU
* TU
.... ........ ·: .. ' .... .. ......... :-... ....... . ' .... .. ~· .. · ~ .. ....... . h•~.i=t~ . ; -- --- -·------~: ""-.. a -~--~---·;··--x-~x ~~ :t ~~~ r . I · · t::J t-rtrr
10 0 ~~ 10(• 15' 1) :;oo :4£1j 300 lSi)
CZ~$. "ir. .
FIGURE 3. Temperatures of the flowing air at the different distances from the inlet as a function of time. Discharging mode. Air velocity w =O. 205 m/s. Inlet air temp. - T .=12. 8 °C
0 V•J
RESULTS OF FULL SCALE EX?ERI MENTS AND COMPUTER SI MULA TI ONS
The Membraneless Ground Heat and Mass Exchanger has been first. applied t.en years ago in the ventilat;ing system of the heal t.h-resort. ?al ani ca Zdroj • ?ol and. In · the Figure ·.4, the resul t.s of" i nvesti gati ons and the results. of" computer simulat.ion are presented.
! ...... i
:.- ;~ >~~ .-.:.~ £lt':
~· i. '<-1 . ~.· ...... :.,'_:.'!
FIGURE 4>= Yearly exchanger and the
.....
,., CIQ
J11li-;z-JO~ ~). ~~--- ·
opperating parameters of.the ground heat. results of the computer simulation.
:·
I r I I
L. -9
; .. ·: ::·:· The solid 1 i ne r epr es en ts t.he ambient air temper at. ur e,
dashed line - measured out.let air temperature and t.he dot line - results of computer simulatio~ in cold periods.The calculations have proved, that. up t.o 80~ of heat demands for ventilation in winter can be recycled in t.he system. In summer. in t.he mid european climate t.he whole cool ·demand is covered
.-·:.
( ...
CONCLUSIONS
Presented system of heat accumulation in the gravel bed pl aced under the ground is the e:f:fecti ve t.ool for t.he reduction ot: the consumption of energy in ventilating systems.· It also allows for creating the microclimat.e of" the venti 1 ated rooms throughout. the year with no need of use of energy consuming cooling devices. Applicability o:f this system is practically unlimited. It. can be utilized in small install at..i ons, as: :for instance in single :fami 1 y houses, as well, as in huge industrial ventilation plants. The only limit.at.ions may raise :from the underground infrastructure in the neighbourhood of the . ventilated building and from higher radon concentration. which did not. occurred in the plants which have up till now been built. in Poland.
NOMENCLATIJRE
Symbols
-~ -~ specific heat at. constant. pressure. Jkg K functions of temperature dist.ribut.ion length o:f gravel bed, m
0
c f L T T ~
bed temperature, C - inlet air temperature, °C
t. w
0
t.ime, s overall air velocity,
Greek Symbols
~ ms
& - bed porosity :>..• - ef'fect.ive heat. t.rans:fer coefficient. with air
a.
p
Indexes
f s
~ -j, flow, Wm K
-9 phase density, kgm
:fluid phase solid phase

i;
1·
REFERENCES
C1) Besler G. J. • Gryglewicz W. • Kol~k A .• · Kowalczyk W. , Zasobnikowa akumulacja ciepla w gruncie posadowienia budynku Cetap t.rzeci). Raport nr SPR - 50/'88. Instyt.ut. Inzynierii Chemicznej i Urz~dzen Cieplnych Polilechniki Wroclawskiej. Wroclaw, 1988.
C2) Besler G. J .• Gryglewicz W .• Kolek A .• Kowalczyk . W., Zasobnikowa akumulacja ciepla w gruncie posadowienia budynku Celap drugi). Raport. nr SPR - 51/'87. Instyt.ut Inzynierii Chemicznej i Urz~dzen Cieplnych Polit.echniki Wroclawskiej. Wroclaw, 1987.
C3) Vortmeyer D .• Shae:fer R. J .• Equivalence o:f one- and two-phase models for heat. transfer processes in packed beds: one dimensional theory. Chem.Eng.Sci., 29C1974), 485. ·• ..
C4) Gryglewicz W. , Use of ,rock ventilat.ing syst.ems .. ;. · Ph.D ..
beds for heat. storage in Thesis. - T. U. · of" Wroclaw,
. -- 1989. · .. ':" .' ,, .. . :.'. .c:.
- ......... ... .,. -·-· ... ~ ~· - .. . .: .
.. . .. ... .. ... ...... : ·· ~ ·.·
. .. .... "· ...... . . ~... . .. ' .. ··- :~ \..
·.
"4-0 ·r. .. ...
I 7 ;• - • ~ ·::.., :2~; ~ -:: ~-( .... ~ , :: ~(~ -~;:, • -:-. .:· ~'~ '='~:~ ~ ~ ·• ~ . ...- ~· - ..:: ;.:,,_·-:.;.:::. :. --~ ... :-·'? _;.:.: ..!.::).~IJ '"J;, '·:':'t~!'i.~~:~ , ~ .~~ ':'~' ~. ~·-~ ,,,
' ~1 , .::·~(.: .~~!''-• .. ~ ~'t:: .. C :" i . ~i,:) r. -~ : J· ~ ..;_~ ~;.~ · L •,':-"_. -~~.~~ .. :-~...:."'· .)•-tl(_J
I :!f-::.: '""'\, .f"i. -~ ~:~ •: ! ~:.:~·3 ~) .... ~ ~ Jq :,.1 1: ~- --, -J
~ .~ir..; "" .t-
~T. ., .. .,:.j ~:::a ... ~~ 1 »c:.a ~ L.~ ~rsvo
..:! !<:~ .. ·-1'".t:.'"·~. · ' '*::.:~.:
: , ... ( p?.·:·~ ~.:;~ ~-,~l~ -
~· -.:i- :· .. ·,. ..:~·::==.:-=-:... ·:~~·~a::: !~~:-zr1.s-:J J.t~ tt~ ~::i\~ ·· i.""~::'!'9 ~ '"t·~ .....
~- )l.:-~w . ·,.ic .t"t e-. ...~ """' ; ....,~~ . . .. - ~· _ . .- ,;;r~ i-:tQ-1 , ~-~ '"·-···<:10 · .,;._,_,.,.~
'!Jl<a.i;dq ::> lu l. "'t '.~:a~dq o l !C;l ~·
-Y..·;.:: •• . _,.

r· {
·-: : ""
' \. ~ ... .
( ::.· '--
INFLUENCE OF WALL ROUGHNESS ON WIND PRESSURE DISTRIBUTION ANO VENTILATION LOSSES
P. Cernik Civil'Engineering Faculty, Radlinskeho 11
813 68 Bratislava, Czechoslovakia
1. ABSTRACT
II 3 ..
This paper describes a wind tunnel investigation of wind pressure distribution over a 1:100 scale model of a 12-storey block-type building in open country exposure. Appurtenances attached to one wall of the building included: vertical mullions with different height and spacing, combination of vertical and horizontal mullions and three types of balconies.
Pressure coefficients obtained from the tests were used for the calculation of air exchange rates and associated heat losses from a hypothetical naturally ventilated room or flat situated in various locations in the building. The results are presented in a non-dimensional coefficient of ventilation loss reduction, r
8, which relates the resulting change in ventilation
loss caused y wall roughness, AQ, to ventilation loss from the room or flat, when the building walls are smooth, Qs.
2. INTRODUCTION
The prediction of wind loads and associated ventilation losses of a building is generally difficult and it becomes even more complex when architectural features are ·present. Their functional purpose was mostly explained by sunshine protection . But the roughness of the wall modify the flow regime n~ar the . surface which can influence also the air ·infiltration process, the heat convection, the driven rainfall distribution etc. ·
The pressure coefficients that are given in building codes are primarily intended for wind loading applications and the values quated are the maximum values for particular facade. Adaptation of these pressure coefficients for air infiltration models is not suitable, because where the pressure distribution is nonuniform, the extreme values can differ from the mean value for the facade as much as 50 % (1). However, when the building has different kinds of appurtenances the applitation of these provisions becomes doubtful.
The literature survey indicated that the wind pressure aata amount which is available is still very small in relation to . the wide range of building shapes and their appurtenances which are of common interest. Only a limited number of experimental ~
RANK XEROX COMMUN/CATIE SERVICE
: ..
~ ~~
studies in this field has been made. For instance, Leutheusser (2) reported the effect of mullions and the authors in (3) discussed the effect of balconies and u~iform roughness.
The purpose of the present wind tunnel study is to provide wind pressure data for a rectangular high-rise building equipped with various types of mullions and balconies. The wind pressures obtained in the tests have been used as input data in an analytical model for the calculation of air change rates and corresponding heat losses for a hypothetical room or flat in building as influenced by the facade roughrresess investigated.
A full report of the investigation will be given in (4).
3. EXPERIMENTAL WORK
All measurements in this study were made in the boundary layer wind tunnel located in the Aerodynamics Laboratory of the . National Swedish Institute for Building Research. This tunnel is of the closed-circuit type with a test section 3 m wide, 1.5 m high and 11 m long.
An atmospheric boundary layer over rural terrain was .simulated by means of spires at the upstream end of the test section and 7 m fetch of 40 mm cubes in a regular array with a density of 10 %r The model boundary layer had a height of 1.0 m and a mean velocity profile given by u = z0.16.
The 1:100 scale building model was made of wood with dimensions as shown in Fig. 1. The model was equipped with pressure taps at the centres of all the supposed windows and doors at three different levels.
Two types of appurtenances were rionsidered in the experiments. In the first aeries of tests, .the influence of mullions with vaiious height and spacing wai studied, as indicated in Fig . . l. In the second test series, the frontal wall was equipped wi~h various types of balconies, which are shown .in Fig. 2.
In all test series the wind angle was varied between 0° and 330° in increments of 30°.
4 .. CALCULATION MODEL - .......
Wind pressure coefficients obtained from the wind tunnel tests · h~ve been ~sed for calculation 6f air change rates and associated heat losses for a full scale house as they might be influenced by appurtenances and climatic conditions (wind ~peed _and air temperature). , c • - .., ._
~ ' . . · ... "· ~he air infiltration rate through a leakage opening for steady-state conditions can be expr_es~ed by . - · - , ·
- . .... j "; ~ ~ :•; 7 · .. -..... ~ ~·, ; .

: . - .~ .
1 ·
1 ·
,. '""r, •
( '-:
iJ2.5 a a ROOM: a b c d e f I ~ ~ LI .. -, ,.-, LEVEL· ~ ~ ~ I I I I •
I ---
400 --- \~~PS ~~;TIO:' 3
~ 1173 4-- k-, .. -Jf r-i I
Conf. a {mm) .w {mm) d {mm) r•i r-~ I 2 -.-,- , ., I I I I
L-.J L-.J L-..1 L-.J L-~ M11 15 1.5 2.0 M 12 15 1.5 5.0
M21 30 1.5 2.0 M 22 30 1.5 5.0
.. -, r--~ r-i r-, ~'~ 1-,-.- -,, I I I I 1 HM 22" 30 1.5 5.0
l.-.J L-..J L-.J L-.J L-..1
~ 195
~ 390
~ MOO" o o o ,.,r;,· . "Combination of vertical
and horizontal mullions xxsmooth wall
FIGURE l. Model dimensio~s; Location and dimensions of wall mullions.
h : .. ::. . : . ' . ;
I = A · ;~ .q•-.: ' 1 . 6: . C)_ C47p~ ~ - -~pT))~)0.5 dz (1)
.. .... :yj ~ . - ... . . ·a~d 'th~ coires~ondinci ' he~~ io~s is ~iven by
.! ~. ~ ,~. .._. - · -~ :~~ ~ -; - ~ -~ ·: ; ~ ~: ::· . .::
,, __ · -- "' - ....
... ,., , I 1: ' j .. -* .! 41} t ... 'J .: ,; .-~ :~ t:. J : :; - • O : : . : - : : ;; .J :: - . -#' .... .,.
-.- ·FLAT· ~ - a .. , ~, ·b · · ·,c . :, _, .. d . ,-_ _; " .~ ; :-. ..- 1 . . ~ - - I - _, - - ·· 1 ... ,_ I ~ ·· - - · · 1 · - - - ..:. " "" - - '·" - ., ·.:. : - . - ·. = - ::. · ·
:: ·.i : ~ '":. ::,~ - • ~ ::._~ • .' ::: ~ ' • · ~ ~ ·.:. : ) • .. • # - '- I - ~ ._ .,. - - ... "' -. .. ., • ,-, "'•
LEVEL: - ~ = .:. ~::; .:; .- ~ "L. - - ·- .:..- - ·-
3 r----., r---'T----, .... ----., 11k_! . o ; ~--' ,L- -~ L..c::::::l_J - ~ ....... . B 11 - '· . .. - . . . 15 c:::::J - -;, ·. ·: · .. c::::2 : .3 : - • • l 45 l c:::::::2 c:::::J
c:::::J c:::::J
I i::::::J c=::J r----., r----r----, r----, 2 B 12 _ .. 1c::i._J L- - -' L-c::::::::11 .:;::; - -~ - I I
. ~ · :~ : ::
'.' ,~
' -;,
r ,,? ~ .... _. -
.1 !
c:::::J. : ! ,1.: . . ,_.: ::.: c=:::l I - - - ·- ... c::::J 1 11 ~ • ;-: G _: !" C:::::J ~-=~ l.Ll -· ,'"'; ·-
I~-, -,..---r-=- -i .. r----, _·-.· - ,_:- . .' ---~· :·. _ • l~--' ' ~ L:.. - ..1 - .:L..c:::::::i, - - ;:, ' ; _ _ . _ '. .. _ :
c::::J J ;· r 8 - : c::: C:::::::l :.1 .... ::: ·: _ • • ·-= . . . . B 13 ··· ·
·- . c::::J ~ ">' ~ . I I -~ ':": :::~:~~ - ,: - :- : . R: :. . .. . _, :·. ~
.: f-- ·}' ~. :: '• ::- : ; : •:; 0:' • } I I w ,'. : • • · : • : - ,• : : :; • ~ , -, ;: : •• ~ : : ~ : : • ·• - _; : :=; .:- :: _, ,,. .. ~I " ' !. ,. -. " . "I. \) :> Q n 0 "1 ;3 (; _. ,'l - .: • ,, ·.· :-, - • • I' - - -• - • · - '
-· :., - .... -~-- ~ {.:, :_~ ·-
FIG~~t~~- ~.l~caif on~and~ dimension~~of ~ balconi~~:~ - . ~
.":°"• .. .... .,.,

Q = I) c AT (2)
The analytical calculation model used for the calculation is based on Eq. (1). It is a single-cell model, which is discribed in (4). In this model we propose that any vertical connection between floors does not exist, it means the building is of story-type construction.
To prove the influence of facade elements of air change rates and associated heat losses it was developed a non-dimensional reduction coefficient
rQ = (Qs - Qr)/Qs = ~Q/Qs (3)
The heat loss reduction is a function of the densimetric Froude number
Fr = ( u 2 Te ) I ( g h ~T )
as shown in (5). ·
(4)
Flow calculation for mullions configuration were made for a hypothetical office room with no internal divisions and both exterior walls have the same leakage area and are equipped with mullions. The limited exterior wall area of office room is expressed in Fig. 1, in dimensions 3.0 m wide and 2.8 m high.
Flow calculation for balconies configuration suppose a hypothetical flat with no internal divisions. The exterior walls of the flat have the same leakage area and one of them is equipped with balcony. The limited exterior wall area of the flat is expressed in Fig. 2, in dimensions 7.5 m wide-and 2.8 m high.
The calculation of ventilation losses is based on one average value of wind pressure coefficient for each of envelope walls of the room or flat. The average value ;was calculated from pressure taps which represent averages 'over rectengular areas of supposed windows and doors. -· · ____ __ __ · · -;·
~ -- - -· - ··--- --· ....... .. f"
From all calculations the si tua-tion of wind" ·angle ~-'/3= 90° was excluded, when--:thi.-infiltration· rate i (_~~qu _al to ·zero.
5. RESULTS -____ .. __ ·· ~
... -,,.. ... : - -;·- ~ · ...... ~-- .,,--.· ~
. . ·--------- ... From the large---amount : of results obtained ~;from the calculations a selection of--graphical presentation has _:-been made to · illustrate the influence of mullions and .balconies- on the heat loss reduction as a function of_ the ~e.nsimet_ric _Fr-number and wind angle (see_[igs~~ 3 and 4)~~Whereas=the .:xesults -of all calculations are briefly summarized in_:._th_~=following. -
------ -------:,..~ --· .. . --··---·'
A general observation is that -the ·greatest -·changes of the heat loss reduction coefficient, r 0 , are in the ran~e.of Fr-nu~~~r . 0 < Fr < 10, wh~rE! ;tt)e _ r 0-va.rue reached ; also': l t -· S maximum~ ··-;, -

I [
( · ·· ·=.:.:.:
·.: .. ··
c:=.
ROOM: a 0. 15 ----so·
0.10
I , ..... ___ - -so·-
c
M12 M 22 HM 22
e
so· 13: 30"
' I - a.as ('-----so·
~- - . ..:. . -· - . so· '-0 I I
o· 0.00 ---- o· .\ ---30·
\..r- --. --- a· ,0:30·
-0.05 W-----L---l---...._ ..........
0 5 10 15 20 0 5 10 15 20 0 5 10 15 20
Fr (-I
FIGURE 3. Reduction of ventilation loss, r8, versus Fr-number
for rooms on 3rd level. Building with mulli ns, · wind angles fo = 0,30 and 60°.
At Fr;> 15 are th;~: lJJ ~:~a} u~s nearly · constant :
. ··i >•
0.15. . r
.. ~ - -
0. 10
-I
FLAT: a
T . ._ ~ - ·.J •
B 11 B 12 B 13
...
·~~1...19ms°:1 : Ji
c
. ·~ .. :-! :i .. .
13~ I' • '-----60-/r ..... - _ - - -Jo• l1 l1 ~ . ~ ; 30" 11r:. .
d
.. ~ :- ;.: ...
~ .~ . - ... .. .
~ · o.a·o · ~· ---~---. = ~---;-...,--;-......;...., ------ 0 . ~-·· -· -··-· o· .·-· -·-·-·-30"· ...... _
~gn i: tJ lua no 2;1'·u · . ·. :..:3? .[ <: • n·(DC'. ::; :\
,.. ' ... , ~ ·- · ·· so·' ...... -.·-·-·::-· -. ;:;n ~ , ~ ~..::
-0.05_ .. . . , . . . -1 , ,,, .. , r . . .:·.,o= -~~:s · ~10<'9 '1~·2_0~ ; 9 ·~· .s .. ~ 10 .:1s .. :·20.~o: .. ~ s .. ,. 10 - 15 20 • o• J.i. - 4 *•" i - I , '= ..r. ;.,.J • w...... ~ (,,.,; -· ·~ ._ '- ~ • ..,,J ..-.. • - 1 • o "" • .,. t':) -' • • • "- - • ...... O '
. .., i··· rd ~r4 + .· .-,, .. fi (-) : _;" ··-~· ·~--~ ,._ · .. 9 • c 1 ..:.. u q ;;i u o .. , .. .... r -· . " ·- .. . ~ -~ _,, ' ... ,, . . . ·- . - __, -.. -- ! • • • h r . ' d n ' ·~ - ' . ·- - . - ' . ·- ,.. . ·. • :1 • -,~ • c. ' . •J .;1 .. rW: .·U 2gn.i.u_.!U ~n ... ..,:1UI~ ~ ; .• :; ... ~' .;:j. .... •. . .... .. : ...• -
FIGURE-4..: -:Reduc·tion o·f ,:verit.lration_ 'lOss t·r'. ,1:-v·ersus F"r·-·n·umber for' .flats on -:Jrd ·~teveLt!..B'uflding ·with balcoRies, .wind ·an91.es a. a 6 a 0 · ·" ··" '" , .. ,.- = , 3 0 a n d • , , · · ·. ~ -~ - ·

··.
... ,,_
·:..·
·.· .
Mullion configurations give a maximal reduction of ventilation loss for a room by about 20 %. Increasing the height of mullions and adding horizontal -mullions: increases also the r 0-value. This effect is more pronounced by increasing the wind angle for rooms situated closed to the corner of building. But also the facade with vertical an·a horizontal mullions causes an increasing of ventilation losses (c. 10 %) obviously on the highest floor.
Balconies with side walls have the greatest influence on the r8-value. The maximal reduction of ventilation loss is about
2 %, which was reached for the flat situated on the highest floor of the building. The other balcony configurations cause reduction of ventilation losses in the range of ± 10 %. The balconies on the leeward side does.not influence significantly the r 0-value. . .- ·---~-<.,
- :. ... --- -_ .....
6 : _- NOMENCLATURE
Al c Fr g . h I ~PW ~PT Q
area of leakage openings specific heat of air Froude number. _ - .. :· , .. . . . -acceleration of gravity·.,. ~:~- .-. height of storey · · - · - - ·· -air infiltration rate wind pressure difference thermal pressure difference;. . . ,._ .:: . _ ventilative heat loss (index: ' s' -;,,~ smooth wall, r = rough wall)
~Q reduction of heat loss
m2 kJ/kgK -m/s2
~3/s Pa Pa
kWh/day kWh/day
r heat loss reduction factor T9 external air temperature ; · · K ~T - · external-internal -temperature ···difference ·----·- ·-K.:· · u wind velocity at building height : .· = -- m/s z heig~t above . ground r l :; ..= - - - r m 3 ) . density of a:r ... :' _ ~ .J '.- ;t .3 - · - . _k~/~ . , '
,, • / I
7. i REFERENCES - -- - -- . I - .. ".: - - - - - .... -.\ i I _, ~ . -~ · :· :~ --
( l) " Allen·;--··c :-; Wind pressure data ~equi 'rements for air · :.: . :.. infiltration calciilatfb"ris-.-r~AIC-13;;.,Brac~nel .l (1984)
( 2) Leutheusser, H.J. -, ·· Inf luence--Of t archi·tectura1-·:features on :::·the . static wind loa-dirig ~of--=Eilil d ings:..=Bufld .=.sci :_ 30, NBS . • . -1 - . -1.· - · - .. • ' ... ·~-.:Washington _(1970) ··.: :_: ~ :-_: -:-~. 'fl (.;_-:-- ·-:---=.;.-=---=--.. ] · ~ ~ - :..
(3)-Stathopoulos,· T. e:a.~ .Win~.pr~~~ur~s on buildings with i-·appurtenances; J. Wind Eng. Ind. ! Aerodyn. 2 (1988), ' 2 6 5 - 2 81 ' ' ! ! ' ' ~ .• , .. .,.
( 4}"-cernik ;· · p·; -e :-a. , Thf l ffence ofmullions .,ancr:bafcon-i es .. on-'h: wind pressure and ventilation lo'sse's. Swedfsh Inst : for
Build. Research, Gavle -(19,90), to be published (5) Wiren, B.G., Effects of surrounding buildings on wind ~ :•: :pressure distribution and .:: \!B. IJ.~~la:tio_n, losses.tfor single~~ ·
· ~ · ,f ~mily houses·- s.w.e.di sh ;I_ns~ ~1 l f..Q.:t LB..uilQ..;:,~esearch..' .M85 :_19, ... . Gavle (1985) · .oc;::i Ji"'.:> , ~:. ::. ~. • ..

r
··: ·.•'•
.....
(~<
TEMPERATURE EFFICIENCY, AIR CHANGE EFFICIENCY AND VENTILATION EFFICIENCY IN AN OFFICE ROOM WITH DISPLACEMENT
VENTILATION
C.W.J. Cox, Ph.J. Ham. J.M. Koppers, L.L.M. van Schijndel Depamnent of Indoor Environment TNO, P.O.Box 217, 2600 AE Delft (the Netherlands)
ABSTRACT
II 4
A field study of temperature efficiency, air change efficiency and ventilation efficiency in an office room with a displacement ventilation system has been made. The air change efficiency and the ventilation efficiency have been determined by using a tracer gas (N20) technique. Concentrations have been measured at four heights in the room and in the supply and exhaust air. Air temperatw:es at different positions and heights, air supply temperature, air exhaust temperature, outdoor air temperarure, insolation, surface temperatures and air velocities at different positions in the room have been measured. Temperature efficiency was dependent on the supply air temperarure. The air change efficiency was very much influenced by the balance between supply air flow rate and the exhaust air flow rate. Values for the ventilation efficiency in the breathing zone were almost equal to those for a dilution ventilation system.
INTRODUCTION
Displacement ventilation systems can be characterised by an air supply at floor level, an exhaust at or near the ceiling, a low velocity of the supply air and an air supply temperature a few degrees below room air temperature. With this system two zones, one with relatively low air temperatures and low concentrations of pollutants in the lower occupied zone of the room and one with relatively high air temperatures and high concentrations of pollutants in the upper part of the room are created. As as result a higher temperature efficiency (improved indoor comfort) and a higher air change and ventilation efficiency (improved indoor air quality) can be realised in principle in the occupied zone of a room compared to a room with a dilution ventilation system. The aim of this study will be to determine the performance of a displacement ventilation system in a practical situation. - ;
MATERIALS AND METHODS .,
Temperature effiency (Et) is calculated from the temperature of the exhaust air, the temperature of the supply air and the air temperature in the room as: ·
Et = (Se - Ss) I (Sw - Ss)
with Se : temperature exhaust air (°C) Ss : temperature supply air (°C) Sw : air temperature occupied zone (0 C)
~tis assumed that for a dilution ventilation system (with complete mixing) 0e = Sw, and therefore Et equals 1.
RANK XEROX COMMUN/CATIE SERVICE

:~ :
.,
1.:·
L'
· The contaminant removal efficiency can be characterised by the ventilation efficiency (l]. ·· Ventilation cffiency <Ev) is calculated from the concentrations of a tracer gas in the ex-haust air, in the supply air and in the room as:
Ev= (Ce- Cs) I (Cw-Cs)
with Ce : concentration in exhaust air Cs : concentration in supply air Cw : concentration in occupied zone
(ppm) (ppm) (ppm)
When the tracer gas is introduced directly into the room the concentration in the supply air is equal to 0. The ventilation effiency is then calculated as:
Ev=Ce/Cw
The air renewal process can be described with the so-called transient air change efficiency. To determine the transient air change efficiency a tracer gas decay method can be used. Tracer gas is introduced to the air supply or to the room. When a steady-state situation is reached the supply is stopped. Subsequently the decay of the tracer gas concentration at different heights in the room is registered.
For a dilution ventilation system with complete mixing of the room air the decay of the tracer gas concentration can be described as:
Ct = Co*e·n.L
with Ct = concentration after t sec Co = concentration in steady-state situation
(ppm) (ppm) (s=l) n
t = air change rate, equal to qvN .· =time
qv = supply air flow rate V = volume of the room
This can also be written as: .. • ..
~ :.:.- , ...
~· · ......
~ J , ~
. (s) · (m3/s)
(m3) .- , ..
~ - .......
; •r:J , ..· .. . .... ·-In Ct = In Co - n.t. ~ . ... • 'J " ... - - ~ :·: ~ .. ~ ·;_ :. ·~
. =.·-: .;,. ': . .. _ .. .J - · ·- ·
y •• .. - . . ' ,. • • .. ,1 .~ ...... , '•.
. .. '6 ,
The transient air change-efficiency E<i is now ~efined as: .:i· ,7-... ~ .. ~"·:· : •::-.~_;, .-:·, , .... : } •:
_., . · ... i--~;j-: ~~~·-~ ' ~ :;T.~; . :.::-E°-d = h/n
.. , -· .~ •. :··_;,_:;· ~ .:~. :·· .. , I
with h =measured apparent air change ra~~,es-1) ... : ;· .. ,: ·· , ... T''<<.·::i:::::·; :- -<~ ~- ! ; \-:~!~~~:: ~:~ .. ::.j ...:: .... , p t;' -. ' .. ,,. , ,.,..;.:..""; ., l!i ·- .... . .
'.':.:t.I\:'.-.,'.~, ', .. · ";;.:.-/ ,_ ~· ..

· ··· · DESCRIPTION OF THE OFFICE ROOM
·:·
,·:"'"
The measurements were carried out in the office of BRN Catering in the Dutch city of Capelle aan den IJssel. The measurement room is located on the second floor, beneath the roof. The room (see figure 1) has a floor area of 16.2 m2 and a height of 2.7 m. The window (double glazing) in the outside wall has an area of 3 m2 (width 2.3 m, heigth 1.3 m). The complete building is covered with plates of tinged glass at the outside. Between the double glazing and the exterior glass plate horizontal blinds are mounted. The transmission of solar radiation through the window is 0.4 (blinds up) and 0.2 (blinds down).
The air supply device for the displacement ventilation (width 0.48 m, heigth 0.68 m) is placed in a corner at the outside wall. The bottom of the device is 0.27 m. above floor level. The air exhaust is mounted in the ceiling at 1 m from the rear wall. The supply air temperature is centrally controlled for the entire building and varies from 20°C with an outside temperature of 0°C and below, to 16°C with an outside temperature of 20°C and above. In summer, cooling is only activated when the outside temperature exceeds 20°C.
Supply air and exhaust air flow rates are constant during working hours. InitiallJ' the supply air flow rate was 200 m3 per hour. The exhaust air flow rate was only 92 m per hour. The difference between the supply air flow rate and the exhaust air flow rate was balanced by exfiltration through the crack under the door in the rear wall, through leaks between the air supply duct and the floor and through cracks between the walls and the ceiling. From measurements, it was estimated that 40 m3 per hour ex.filtrated underneath the door, 25 m3 per hour via the leaks between the air supply duct and the floor and 40 m3 per hour through the cracks near the ceiling. To detennine the influence of the disbalance between supply air flow rate and exhaust air flow rate measurements were also carried out with an exhaust air flow rate equal to the supply air flow rate (210 m3 per hour).
The internal heat load during working hours varied from 332 W (20 W/m2) to 532 W (33 W /m2) with contributions from the lighting (70 W), the power supply for the anemometers (12 W), a personal computer (150 W) and one to three persons (100 to 300 W). The heat loss from one person was simulated by a: 100 W lamp in a 10 liter tin. ·
EXPERIMENT AL PROCEDURE
Measurement of air temperatures, globe temperature, surf ace temperatures, air velocities and solar radiation. - ·· - ·
Temperatures were measured using thermocouples. Measurements of the air temperatures in the room were carried out at four heights (0.1 m; 0.6 m; 1.1 m; 1.7 m) at five different positions (labelled southwest, nonhwest, centre, southeast and nonheast, respectively) as shown in figure 1. Also measured were the supply air temperature, the exhaust air temperature, the air temperatures in the adjacent rooms, the temperature in the cavity between the double glazing and the exterior glass plate and the outdoor temperature. ·
The globe temperature was measured at a height of 1.1 m in the centre of the room. Surf ace temperatures of the walls, floor, ceiling and the glass were measured in the centre of each. · - · · · ·
.. ,, ... ·'
;:: ·".-• l ' , j

·'
·~
_, .· ;.
north east
0.70m
nonh west
3.6m
0.7om soUlh east
network for ooncentralion measuremenl
centre
L glass plal~
FIGURE 1. Room with measurement positions.
4.5 m
-. . .,
Thermo-anemometers, omnidirectional and with a time constant of two minutes,_ were used for the measurement of air velocities at 0.1mand0.6 mat position southwest, at 0.1 m, 0.6 m, 1.1 m and 1. 7 m at position centre, and at 0.1 m at position nonheast. Additional measurements of the turbulence intensity of the mean air velocity were carried out with an -omnidirectional thermo-anemometer with a low time-constant (Bruel&Kjaer).
The s0lar radiation was measUred with a pyranometer in the ca~ty benve~n .. the double glazing and the exterior glass plate. · ---- - -
• -·~ ! · - ., ' . ~-.. .... -, .. --~. ••• .... , ..... ~ .... I
- - .l'r • ... •• " •'l..i• * ••" ' • • •
Measurement of the concentrations . . . . ,_ ... -.. - - • • II' • • I '~ ·'" ~ "'
For the measurements of the air change efficiency the tracer gas decay method (stepdown) was used. The length of the duct between the last junction and the air supply device was only 1.5 m. To achieve an acceptable mixing of the tracer gas part of the supply air was extracted from the duct as close to the junction as possible and led via a tube to ~ mixing box where the tracer gas (N 20) was supplied. By means of a fan in the box the air . and"tracer gas were mixed. Via a second tube the air is delivered back to the supply duct~ , The concentrations were sequentially measured at four heights in the room (0.1; 0.6; 1.1 and 1.7 m), in the suppy air duct Gust before the supply device) and the air exhaust.
To determine the mean value of the concentration at each level a network of tu"bes in the shape of an H was constructed. Three ends of the "H" were closed. At the fourth of each "H" end sample tubes were connected that led to the measuring unit Air was sampled through small holes, equally spaced along the length of the tubes of each "H".

.. . • ..... ·
\,': ..
From each "H", from the supply duct and from the air exhaust samples were sucked through tubes into a channel selector and delivered sequentially to a gas analyser (Miran 80, Foxboro Analytical). Every 40 seconds a different sample tube is connected to the gas analyser.
For the measurement of the ventilation efficiency tracer gas was introduced to the room at a constant rate. Concentrations were measured in the same way as described before.
Two personal computers (Hewlett Packard 9816) and two data-acquisition control units (Hewlett Packard 3497 A) were used to control the measurements and to store the measurement data on floppy disc. The measurements were carried out from July 26 to August 10, 1989.
RESULTS AND DISCUSSION
During the measurement period the daily maximum of the outdoor air temperature varied from 17.8 °C to 26.2 °C. Daily global radiation on a horizontal plane varied from 561 J/m2 to 2231 J!m2. On sunny days the air temperature in the cavity reached values up to 50 °C.
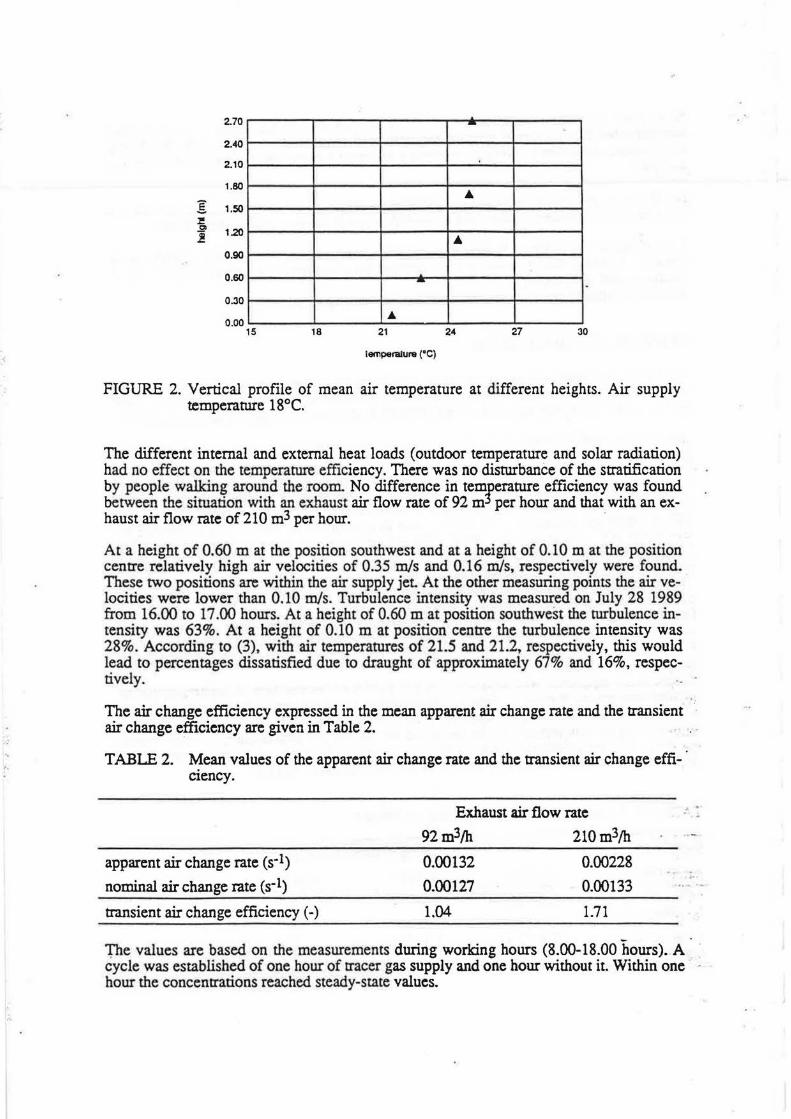
The vertical profile of the room air temperature (mean of five values at each height) is given in figure 2. Due to the low supply air temperature the lowest mean air temperature was found near floor level. Above 1.10 m there was practically no increase of air temperature. The difference between the mean air temperatures at 0.10 m and 1.70 m varied from 3.0 to 3.5°C with a supply air temperature of 18°C. Close to the supply air device this difference increased to 5°C. When cooling was off and the air supply temperature varied from 19 to 22°C this difference was approximately 1°C less. ISO 7730 (2) recommends a maximum temperature difference of 3°C between ankles and head. . . The vertical stratification of the air temperature can be expressed in the mean temperature efficiency for each level (see Table 1). For the levels of 1.10 m and 1.70 m the temperature efficiency was close to unity so there was no improvement for these levels compared. to the use of a dilution ventilation system. For a sitting person the mean temperature efficiency was 1.6, so some improvement was reached. · .. Temperature efficiency was dependent on the supply air temperature. A higher supply air temperature gave a higher efficiency although the air temperature in the room was higher_ ··: This presumably somewhat unexpected result can be explained by the smaller differences between the air temperature in the room and the air supply temperature; in other words, · the divisor in the calculation of the temperature efficiency. This indicates that some caution should be taken when interpreting temperature efficiency values.
TABLE 1. Temperature efficiency at different heights.
Supply air Height above floor (m) ,. ·:· · . . . temperature 0.lOm 0.60m l.lOm 1.70m ... .. . 18°C 2.0- 2.2 1.5 - 1.7 1.1 - 1.2 1.0 - 1.1 (cooling on) -·· .. 19 to 22°C 2.0 - 2.6 1.5 - 2.0 1.2 1.t (cooling off) . .
2.70 - -2.40
2.10
1.80 .... :[ 1.50 ~ Cll 1.20 ! ..
0.90
0.60 -0.30
0.00 ...
15 18 21 24 27 30
temperature ("C)
FIGURE 2. Vertical profile of mean air temperature at different heights. Air supply temperature 18°C.
The different internal and external heat loads (outdoor temperature and solar radiation) had no effect on the temperature efficiency. There was no disturbance of the stratification by people walking around the room. No difference in temperature efficiency was found between the situation with an exhaust air flow rate of 92 m3 per hour and that with an ex-haust air flow rate of 210 m3 per hour. ·
At a height of 0.60 mat the position southwest and at a height of 0.10 mat the position centre relatively high air velocities of 0.35 m/s and 0.16 mis. respectively were found. These two positions are within the air supply jet. At the other measuring points the air velocities were lower than 0.10 m/s. Turbulence intensity was measured on July 28 1989 from 16.00 to 17.00 hours. At a height of 0.60 mat position southwest the turbulence intensity was 63%. At a height of 0.10 mat position centre the turbulence intensity was 28%. According to (3), with air temperatures of 21.5 and 21.2, respectively, this would lead to percentages dissatisfied due to draught of approximately 67% and 16%, respectively.
The air change efficiency expressed in the mean apparent air change rate and the transient air change efficiency arc given in Table 2.
TABLE 2. Mean values of the apparent air change rate and the transient air change efficiency.
apparent air change rate (s-1)
nominal air change rate (s-1)
transient air change efficiency (-)
Exhaust air flow rate
92 m3/h 210 m3/h
0.00132 0.00228
0.00127 0.00133
1.04 1.71
.~~ ..
The values are based on the measurements during working hours (8.00-18.00 hours). A cycle was established of one hour of ttacer gas supply and one hour without it. Within one hour the concentrations reached steady-state values.

r -I
.•
.•. • . ... \:
The highest air change efficiency was found in the situation with the high exhaust air flow rate (210 m3/hour). The mean transient air change efficiency was 1.71. In the situation with the exhaust air flow rate of 92 m3/hour the transient air change efficiency was close to 1. This lower transient air change efficiency was caused by the short-circuiting of the air due to the exfiltrati.on near floor level. The transient air change efficiency was higher in the afternoon than in the morning, This was probably caused by the bigger stratification of the air in the room, due to the lower supply air temperature in the afternoon. No major influences on the air change efficiency caused by the presence of people walk.ing around in the room were found.
For the measurement of the ventilation efficiency tracer gas is introduced directly to the room at different positions. From the results (Table 3) it can be seen that the values for the ventilation efficiency are very much dependent on the position of th1:: source in the room. When the source was placed close to the supply device relatively low values were found. For the breathing zone (1.10 m and 1.70 m) the measured ventilation efficiency was close to unity so no improvement compared to a dilution ventilation system was reached. Walking around in the room had a substantial effect on the concentration distribution for the levels of 0.10 m and 0.60m.
TABLE 3. Mean ventilation efficiency at different heights for different positions of tracer gas supply.
Position supply Height above floor (m) 0.lOm 0.60m l.lOm 1.70m
exhaust air flow rate 92 m3 / h .. . -
height 0.10 m near centre . · ·~ ., - .. 3.0 0.6-0.7 0.6-0.7 . . ,. . .
height 1.10 m near centre ... . ''.) __ 5.6 5.0 . 0.8 . . ; .. - -, • . . .
height 1.10 m, near . -' . . . •. .. . . , e; ,·1
position northwest 2.9 . . . , 2.0 .. . : . - : , 0.9 ·:; ;· ,. ... ...
height 1.10 m, near position northeast 6.0 5.3 - 0.9
height 0.10 m, near position northeast - 1.5 0.9 0.9
height 0.10 m, near position southwest - 1.3 1.2 1.2
height 0.60 m, near position southwest 1.4 - 1.0 1.0
exhaust air flow rate 210 m3 / h
height 1.10 m, near centre no people present 10- 12 8 -10 - 1.1
two people present. walking 4.5 - 5 3.5-4 - 0.9

CONCLUSIONS
A mean air temperature efficiency of 2.1, 1.6, 1.1 and 1.0S for the levels 0.10 m, 0.60 m, 1.10 m and 1. 70 m was found in an office room with a displacement ventilation system. This implies some improvement compared to a dilution ventilation system. Temperature distribution in the room was found to be dependent on the supply air temperature. No effect of the internal heat load, outdoor temperature, insolation, exhaust air flow rate or people walking around was found. The air change efficiency was very much dependent of the balance between supply air flow rate and exhaust air flow rate. A relatively high exfiltration rate near floor level, due to a disbalance between supply air flow rate and exhaust air flow rate, led to a low transient air change efficiency. A high transient air change efficiency was reached when the exfiltration near floor level was limited by balancing supply air flow rate and exhaust air flow rate. When displacement ventilation systems are used care should be taken to avoid exfiltracion near floor level. The values for the ventilation efficiency in the breathing zone were close to unity so no improvement compared to a dilution ventilation system was reached here. The measured values of the ventilation-efficiency were very much dependent on the position of the source in the room.
Acknowledgement
The study reported above has been made possible by grants of ISSO and Nov~m.
References
(l) SkAret E., H.M. Mathisen. Ventilation efficiency part 4. Displacement ventilation in small rooms. Report STF15 A84047 SINTEF, Norway, 1984 . ·
(2) ISO 7730. Moderate thermal environments. Determination of the PMV and PPD indices and specifications of the conditions for thermal comfort. International Organization for Standardization, Geneva, 1984
(3) Fanger, P.O., A.K. Melikow, H. HanZa.wa, J. Ring. Air turbulence and sensation of draught. Energy and Buildings, 12 (1988) 21-39 · ... ··< ~ '· 1 ··- ·
,,:··.
' ..
'i • ••.:: .. ·.:.-.- ... ··
~--- .. ----··--- - - --- ._ ..... ... ..
•! ~·~- "';. .. .~~
.. :- .. :·. ·' ; .:-· ...
. . . • - · ~· i ..
--~ : ~ . : , .- . ~ - I
. \,~ .. r .J_·z;·: : .-n ·~
111j,~:_) ·~ :·~·:
\ • • !t"· :· ~~
_:·:;;,: -~·;·.-•1 , ,. ·;i"'-~:--.r:·; :-~f:-~:·
-~·.·····,r :r .... .:. ..-.'::,:~?:·· · ...... _ _ .... .... •. -t ~

f
I ,•
r ·.;:. .. :,:=
- ~-~:;::
( ':·
HUMIDITY CONTROLLED DUCTED VENTILATION
R E Edwards Department of Building Engineering, UMIST, UK
c Irwin Willan Building Services, Sale, Cheshire, UK
Abstract
A significant increase has been observed in the United Kingdom in recent years in the number of instances of condensation damage in domestic properties. one of the principal causes of this increase has been the progressive reduction in air leakage of dwellings and, indeed, all other types of buildings. In many .cases, draught-stripping has been implemented with no regard to t .he minimum ventilation rates required to avoid condensation problems. The trend at the moment is to attempt to increase purposeprovided ventilation in order that condensation may be controlled.
The cost-effective control of . condensation is a large problem in the United Kingdom, especially for local authorities with large housing stocks. A. possible solution to the problem is passive stack ventilation (PSV), which relies on wind and stack pressure to provide extraction. Previous work by the same authors has shown that such systems can provide sufficient levels of ventilation: however, there is a tendency for simple passive systems to give excessive extraction during periods of low occupant activity and high incident windspeeds.
. . This paper examines the performance of humidity-controlled . mechanically-driven ducted extract systems, in terms of both effectiveness of condensation control and minimisation of energy consumption. On the basis of ~· comparison with data obtained from previous studies-. of .;. simple passive systems, the mechanical systems are shown :· to give a more satisfactory performance.
RANK XEROX COMMUN/CATIE S0
ERVICE
II 5

·.·
.. :·
,. ::,
._;
-::-
··•.
Introduction The energy crisis of the early 1970 's brought energy conservation in buildings sharply into public focus in the United Kingdom. Through changes in building regulations and various codes of practice, a range of energy saving measures became increasingly commonplace in both new and refurbished buildings, and particularly in dwellings. Of these measures, the reduction of air leakage was quickly seized upon as a simple and highly cost-effective means of reducing space-heating energy consumption.
However, in the relentless move towards more airtight buildings, the issue of surface condensation risk was not considered adequately: so much so that by 1986, the Building Research Establishment (1) estimated that approximately 15% of the United Kingdom housing stock was affected by surface condensation and mould growth to varying degrees.
Changes in ventilation provision are not, it must be acknowledged, the sole means of alleviating the risk of condensation: however, the ventilation rate of a dwelling can be quite readily changed, and so attempts to adjust ventilation rate have been the most prevalent means by which condensation control has been attempted. A successful ventilation strategy would satisfy all the following criteria:
(i) it would provide a level of extraction adequate to control condensation;
(ii) the rate of extraction should not be excessive, or else a penalty would be incurred in terms of an unacceptable increase in energy consumption(in cases of high over-extraction, the ventilation strategy could of course make the risk of condensation worse);
(iii) the strategy would be economically priced, easy to install, and require little maintenance; · : :':
(iv) little or no occupant training or scope for occupant adjustment would be required.
The installation of a full mechanical ventilation system would satisfy criteria (i) and (ii), but such systems are currently rather expensive within the United Kingdom, and are therefore likely to find little favour within the next five years at least. The use of simple PSV systems would most certainly satisfy criteria ( i) , (ii) , and (iii) • However, since the performance of such systems is . a · function of internal/external temperature · difference, :i windspeed and wind direction, very little control can be : exerted upon rates of extraction: indeed, it has been J shown ( 2) that in houses with higher background air leakage : rates, extraction of air at a rate over and above that ·; required to control condensation can occur even at low _: windspeeds and internal/external temperature differences.

I ·' .
·, .. ;.·. ·
r. :. : .··
.·· .:.. .. -.... . ,. ..
...,:·:·" \· · :: ~-. .
Excessive ventilation implies that wastage of energy is taking place. If the ventilation rate rises above a certain value for a given set of environmental conditions, then it is possible (3) that the risk of condensation can actually be increased.
Humidity-controlled ducted mechanical systems offer the possibility of fulfilling all four performance criteria. They are economically priced in comparison to full mechanical ventilation systems; the scope for occupant interference can be minimised; the use of a fan means that such a system can be set at a notional extraction rate close to that needed to control condensation;and finally, the provision of humidity-control devices can help to reduce the risk of over-extraction. The purpose of this piece of work was to monitor the performance of humidity controlled ducted mechanical systems installed in a local authority property.
Experimental The house used for the study is shown in figure 1. It is a three-bedroomed house of traditional construction. It differs slightly from the usual practices of house layout in the United Kingdom in that the bathroom is on the ground floor instead of the first floor. The house volume is approximately 185 cubic metres, of which the kitchen and bathroom contribute 21 and 7 cubic metres . respectively. Humidity controlled extraction fan uni ts were selected on the basis of the moisture loads likely to be encountered in the bathroom and kitchen: consequently, the bathroom was fitted with an Aereco type Al21 fan unit, which can operate over a · range of air extraction rates between 5 and 30 cubic metres per hour, whilst the kitchen was fitted with a type Al31 fan unit, which can operate over a range of 15 to 50 cubic metres per hour. A central extract fan, mounted in the roofspace and connected via 25 ~ mm internal diameter flexible ductwork to the kitchen and bathroom extract uni ts, exhausts air to outside via a ridge terminal. All ductwork in the roofspace was . insulated in order to avoid the risk of condensation.
During the monitoring period, the following parameters were recorded using Grant Squirrel data loggers: - ..
( i) (ii) (iii) (iv) (v)
air temperatures in kitchen and bathroom; relative humidities in kitchen and bathroom; external air temperature and relative humidity; air velocities in both extract ducts.
. ·
wind speed and direction.(Windspeeds encountered during the monitoring period did not exceed 5m/s.)
Results and discussion Figure 2. shows variations in duct air velocity, _ internal temperature and internal relative humidity for the bathroom and kitchen respectively. It can be seen that

. · '
for the majority of the monitoring period, internal relative humidities are kept well below 70%, which is generally accepted as the upper limit beyond which condensation problems would be expected. However, it will be noted that at certain times, peaks of relative humidity occur which are well in access of the 70% level. It is questionable whether such peaks constitute a problem which justifies further design modification: if, however, such measures are deemed to be worthwhile, then the humidity controlled fan units could quite easily be exchanged for uni ts which have a manually-operated extraction boost facility built in. The extraction boost is activated by the occupants when the need arises, and is set to cut out after 20 minutes so that there is no danger of it being left on inadvertently.
Comparison of the range of extraction rates attributable to the humidity-controlled systems with those obtained by the use of PSV systems in house of comparable air leakage ( 2) shows that, in addition to providing satisfactory relative humidity control for the majority of the monitored period, the humidity-controlled systems do not exhibit as wide a range of extraction rates as the simple PSV systems, thus implying that the risk of overextraction has been significantly reduced.
Whilst the humidity-controlled systems undoubtedly give a significantly better performance than PSV systems, the latter enjoy a marked advantage in terms of price, being approximately half the .price of a comparable humiditycontrolled system. The choice of installation will, · therefore, not necessarily be based on system performance alone, but will also have include a careful assessment of cost effectiveness.
Conclusions .. i . ~ .
Humidity-controlled mechanical ducted systems have been shown to be an efficient means of condensation control: in particular, the over-ventilation problems associated with . the use of PSV systems are overcome. In circumstances where it is deemed necessary to keep internal relative humidities below 70%, a modified fan unit with an extraction boost facility could be substituted for the standard fan unit.
References
1.
2.
3.
J P Cornish, c H Sanders, J Garratt: Building Research and Practice, Vol 13 No 3 May/June 1986 ppl48-153. R E Edwards, C Irwin: Proceedings of the 9th AIVC Conference, Belgium, 1988. British Standards Institution: BS 5250, 1989.
-:i .. ,• ..
,, .
··:

I I
1~:::::: :
i:· : ..
~ :. ["• .. ,·
Key
r - Duct
L. - wall inlet
r. - Fan lllit
r•• ·::::,: ;.;:
-·· _,.~·
'\ -~·
~ .. ~
I 7,-B ! . . l lUtd\en. !ruj I I __, I : L-
LIVfnQ
Roan
d:
\F '1 L~ l . ~/.'" L-~-~-. i Bath- I J--+ 1 roan ! - I Lcrder j lE_ I ...___. -
Ground floor
rL J \
i~~~ ~ I - I -l -: - ~ ·-· - .. L!_ : i i I -"--Becroan
n---t -... ; I : ·-
j I
i I i· - .. I : . i.
-I - i -·- i , :_ -Bedroan -'. ,_· i j _,,,_;'; .. _J . ::···.' -- I
! X ;. •i ;~-:_ i-~~1 :-.- --~; ·· ·~-:~~-~'. ~0 •
~ .: ~=---~
~F irs't:_;:_.f Toor--:. .. · · :4 .. ~~ -~~~-~-·--=- ~~~7-:·=-~ :·.-_
. ., . ~?. ~
-.J.'.:-
.... .~
-.... ;: ~
FIGURE 1~ ~H°dus·e--f 1 0dr-.:Tans'_c "'-- - ~,-., - ·---=--------, ~ .,-.-.... P _,..,....,. __ o..,.--,.:·---=-
. ··~ l :: -.~· ~;.. •\.!
'--=?. =-- - - :_-· ~ ·--~ --:- .-..::~~~~---=--=·- =-:--:--;:_ ·----~---·· - ~
.~a.
~ ~
.'.I V1

·.-= ,'I • " • I\ .
I
25
70 ' l~ ---~ -- -· ----- 70%rh '. •._; I ' ~ I. ,•,I - ' ' I It\ i I I I • ' ) 1. •• . ;, - · : .~. ' I • I I~ .• •• ; I t • 'I tit : ,' ' i ·C_> ~ , ' . l't 1\ :• J•::i, • t.:\.~I .: .• : \!:,
1•.r..~· ·:• ~.,,.: ·~· i•:.- :• •• '\1 ·~ 1 i ~· !Ii;•; rh 70
2o bo-I
i I'· ~ I • 11
I I • I I • I \ •
t 11 I I 1
• I I I
I I I '• ' ' I I I \ I J , r'; t-! 1" - - Ii- 1:1 -,}-y-i - ~ -::-i-1--:~~ - -1-70°/o rh \;.. • ~ 14 .. '·. \... I I • ... I I A . J,~ ' :, I ..
1 4 l 1} I 1/ \' \I ~ ,/ \,-f '• 1 f (' • 1 ~ • 1 ~ 1 I I 111 ,I '5 ~. I i'\ ,, '• • II ~ 4 I,,
:.. - ~ .: "~· y • ; I { , . - • I • ' I • .i'- I I •, I " I ' .. , , 1 •'
I~ I t r ' " ' ~ ., - .. . t' ... ·-..... digC lm!s
HJ
I ·l ; I - ; - II :: j" \' ~ ~ ~·· ~ 1 '1 '
"h• 1 \ ' · ( , I • . M.
I I I 'V~ l, ' tv'1, " .
Y.rti oc
s
f
..... J ; I h1 I H. ~ L. ~\.- I 0·5-1 ';J. ~
'- \... ' ljf . "' .,,~in \I ,. .I ·ill :· I • : ' I
. '·
e
1:.:;: (i -. I . 71}: I A,· ; >.;·11\ ).' • ) rrllS
~ •• • J I I ,\ ....... _\ l i I l \j~/ .~ \} . \ .,. \.} 1/ . J: til l/ ;r "--1 I > ,· .. \ J"·,,,
S. . ., -· .-. - . -. I I I ... I • I l
· .... 31-Kar-89 11:e2:20. Thie divisions 1 :day
Ii .. 1, . J; ~71~'1. 17""-'l'. '-1. :·· · ....
'~'~>: t• ...
. I !,
I, •
Bathroom
'i"' 17-Ap~-8~ 14: 92: 201 11 ,, d . I, .:::.. I . -.
degC lm!s I c;or,
10
t · , '1•1 1."1u l'I · .'--4 \;- • 1
', · ., • , .. ~ ,)-, '11
•• I ~ h •: 01 J'. I r···· I ,~ ' I \" ,1. " ' ' ' i• ,,_ ~·· f J" ,1 /JI I • o ~ I ' I . . t '-'·I ~ I :. ·: I ' .. "
f, ' . r I l , ~ ~ ' I t'.1v),,.J \~ ·:
1
Lji A .AJ {1\i:\f 11 °c
I y ~ [\ .1.~ \J ~ I \ l.1 " I\ I · · ~ \. nr ..... -.,r,1, . 1
I ·\ h ·· \~ t . m r·"; . ,\ ~· 1; : : 1: ~ '\ f IJ fi, JI )1 !.II I. : \ I /1. ;\ ' I ~. l.~ t, ... -. I I II '1 11 I . '\I ,, ·:1 '. \j \ ' ·- •, I ;, L· I ~ I I 1 I I I ; • 1 ~ • "4, •
I !~·.\ ,,,,~ i;/ \.\' l ' m Is I i·.I ,_f• 1
f I I I I I I l I !I o . . 1 o • .0 I • t ' ' I r I I I ' 17-Apr-89 14:02:2Q, Jl-KaP"89 11:02:20.
· - : JiMe divisions 1 day
,· Kitchen
...
FIGURE2

I I
: · :
("··
II 6
BREVENT - A VENTILATION MODEL
R.P. Hartless Building Research Establishment, Garston, Yatford, \102 7JR, UK.
The Building Research Establishment (BRE) has developed a theoretical model, BREVENT, to predict the ventilation rate for a dwelling represented by a single zone. It can be used to model extract fans, vertical ducts (passive stack ventilation), windows and other openings, and a separate subfloor void. Alternatively, it can function as a model of infiltration only. The uses of BREVENT are numerous, and two of its possible applications are described in this paper: developing simple relationships between the infiltration flow rate of a dwelling and the leakage of its envelope at 50Pa, and calculating the change in radon levels in dwellings in order to assess radon remedial measures.
1. INTRODUCTION
This paper describes a model, BREVENT, for predicting the ventilation rate of a dwelling under specified meteorological conditions, given its leak.age characteristics and the characteristics of its immediate surroundings. BREVENT can be used as a simple single zone model, and is used here to explore the relationship between the typical infiltration rate of a dwelling and the leak.age measured in fan-pressurisation tests. It has been adapted to provide a two-zone model, representing a ventilated subfloor void. The paper uses this to assess the effect of various options for reducing indoor radon levels. Other applications not· · explored in detail here include the evaluation of mechanical and natural' ventilation devices.
2. INFILTRATION MODEL
Air can enter a dwelling through a multitude of paths, cracks around doors and windows for example. The overall airtightness of a dwelling can be measured by ·· the fan-pressurisation method and BRE have produced a recommended procedure for taking such measurements (1). The volume flow rate of air, obtained from a series of pressure differences, can · be fitted to a power law:
.. a = OT ( M> I M>T )n •••• (1)
: I - •
Q is the volume flow rate at an applied pressure differe~ce M>. OT -is the volume . flow rate at an arbitrarily chosen reference pressure difference M>T (in this case 50Pa, following International Convention): it is a
RANK XEROX COMMUN/CATIE SERVICE
-1 ~ ,,
·.

convenient generally 0.6.
measure of the leakiness of a dwelling. The flow exponent, n, lies in the region 0.5 to 0.7, with a mean of approximately
The infiltration flow rate, Ov, of a dwelling is a function of wind speed, U, the difference between internal and external air temperature, 6T, and wind direction. The BREVENT infiltration model represents the dwelling by a single (cuboid) zone of height h, and aims to relate av to OT by including these key variables. This is achieved by extrapolating equation (l) to the lower pressures generated by the wind and temperature difference (stack effect). The other assumptions behind the.model and a full derivation of the flow equations can be found in a paper by Varren and Vebb (2). As part of an IEA task (3) the predictions of the BREVENT infiltration model (as well as several other models) were tested against measurements made in three different houses. Averaged over the three houses, 83% of the BREVENT predictions were within 25% of the measurement .
From this infiltration model Varren (4) proposed a simple equation which relates Ov for a dwelling to meteorological conditions:
Ov = OT{[f32.Fa2.(6T)2n1 + r-r2.Fw2.u4n]}I(
f3 = (p.g.h/.1PT.TI)n y = ( p/ .1PT ) n Fa = Infiltration rate function (stack dominated infiltration) Fw • Infiltration rate function (wind dominated infiltration) p • External air density (kg/m 3 )
g = Acceleration due to gravity (m/s 2 )
TI • Internal temperature (K)
•••• (2)
Fa is a constant for a particular dwelling and is determined by its -shape and the distribution of leakage among the exposed external surfaces; Fw in addition depends upon the surface pressure coefficients which in turn depend upon the shape of the dwelling, its surroundings and · ·the wind direction. Varren and Vebb (2) and Varren (4) show how values of FB and Fw may be calculated. :-) .: - _-;> .. ·:
Using equation (2) and possible to produce an infiltration:
Ov .. (QT/K)
.~-:i-- i . ..
substituting average values for U and 6T it is even simpler expression for estimating average
• .j
'.~:.- ••• (3) · .a.-· ' :.::;.:: \- - _-)~
The divisor, K, is a constant whkh :can be computed for a range of parameters, including dwelling type,. location and density of surrounding buildings. ··•· •. . . . .. ·:. •· ; .. . · ..
. ._ .. -.. ,_, _;_ ~-..... '": ~ -~~· .-: :
Using BREVENT a series of values of K were calculated for a typical UK detached house. An arbitrary OT was distributed around the ·:exposed external surfaces of t~e dwelling on an area-weighted basis. Three different flow exponents were . used: ~ 0.5, '" 0.6 and .o.7.-:;;.!ressure · coefficient data for a series of -surrounding housing densities (defined as the ratio of the plan area · of the . dwelling to the area of the
' ;1 ~ ' " :· ·, • · .. ·.

=: :::: immediate surroundings) were taken from BRE wind tunnel measurements made on housing models. As a first step values for Fa and Fw (averaged over all wind directions) for the house were calculated and these were then used in equation (2) with average UK values for the meteorological data, in this case: Us3.5m/s and 61'212°C (TI=293K). These data represent the winter months when variable openings such as windows and doors are closed and infiltration dominates. The results are given in Table 1.
..
( :: ....
~
Yhen all the results are averaged, K has a value of about nineteen which agrees with the rule that states that the ratio between the average air infiltration and the air leakage measurement of a dwelling.at 50Pa is twenty (5). But there are large variations of Fw with wind direction, housing density and flow exponent. Table 1 is useful in that it gives a range of values of K for predicting Ov from OT for a detached house for a variety of surroundings. This is important when assessing the balance between airtightness (a tighter house will have reduced ventilation heat losses) and indoor air quality.
Repeating this procedure for a semi-detached house again gives an average value for K of nineteen. A similar exercise for a large building represented by a single zone (dimensions: SOm x SOm x SOm) gave a value for K of about ten, although the quantity of data was limited by the lack of suitable pressure coefficient data.
TABLE 1. BREVENT Predictions for a Detached House.
, -· n=0.5
Housing density
(%)* Fw Fa K
0 . 0.12 . 8.1 5
. 0.15 9.9 .;
10 0.12 ,• 11.6 20 0.09 0.26 13.4 25 0.07 14.4 30 0.05
..... .. 15.5 . .
n=0.6
Fw Fa K .
"
0.17 10.8 0.13 . 13.9 . 0.09 17.0 0.06 0.23 20.3 0.05 . 22.0 0.04 . 23.8
n=0.7
Fw Fa .
0.15 0.11 0.07 0.05 0.21 0.04 . .. 0.03
K
14.3 19.1 24.6 30.5 33.5 36.3
*ox density -represents an : : . isolated house, 30% a house in a dense .urban _ . .:.: -~- ... · _ environment. "",, :::-:.·.--
:.s Average value .of K (All n) • ,18.8 ± 8.0 , : . ~
..
::-.
' • ~. ; I • ::. ~ ...
Average value of K (n=0.6) • 18.0 ± 4.5
. . ~
: ;_ I " -- .... .. ·: -. it,_• . ,,,.
....
.. ~ ... . , .
~-
:::.::.... -_ ·' - ............. ' -~ ~- · .,.,·,
... . ... .. ,. .... - .. (....,1 - . •
' ·~ _ , ..
... ; ....... .. - "..../
. ( ·. ,. -. .... ""'.
' .... :_. __ ;·
.. :: .~.-.,'!· .: '•;: .-: =- -~ ~--:1 •• ? ; ~.·;i!.':::·~ .-~ .. ~~ ~.· .. -
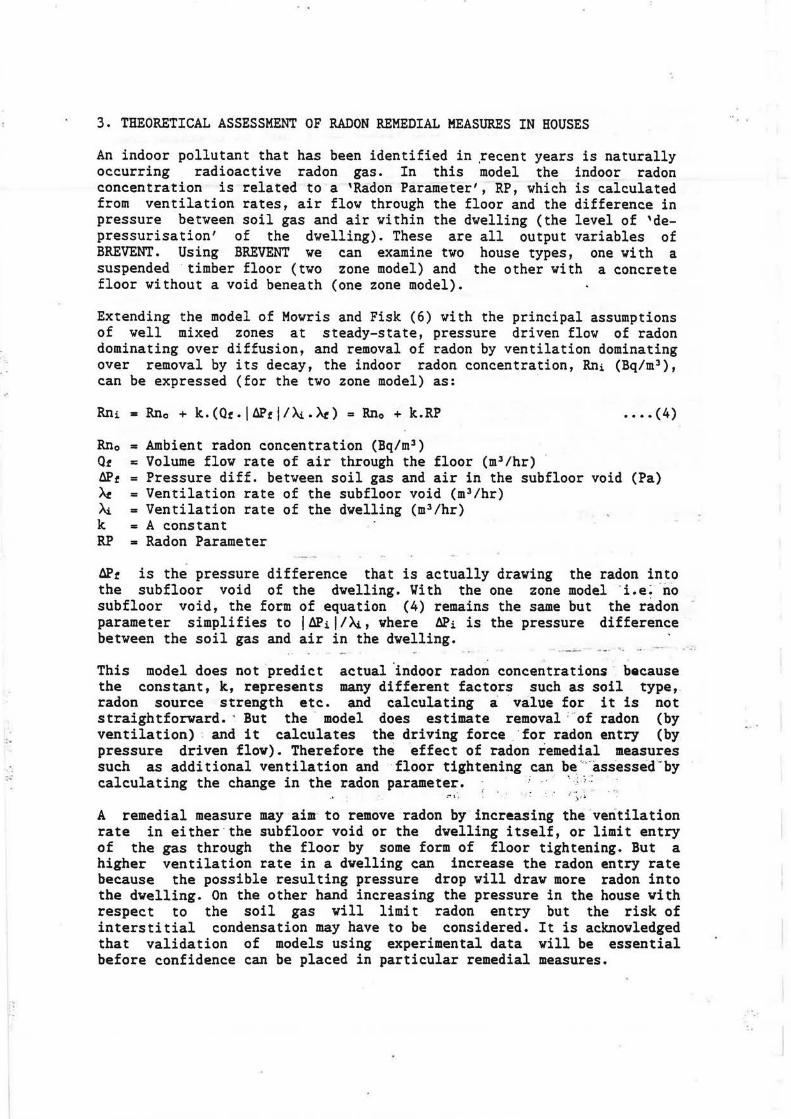
:.:
3. THEORETICAL ASSESSMENT OF RADON REMEDIAL MEASURES IN HOUSES
An indoor pollutant that has been identified in .recent years is naturally occurring radioactive radon gas. In this model the indoor radon concentration is related to a 'Radon Parameter', RP, which is calculated from ventilation rates, air flow through the floor and the difference in pressure between soil gas and air within the dwelling (the level of 'depressurisation' of the dwelling). These are all output variables of BREVENT. Using BREVENT we can examine two house types, one with a suspended timber floor (two zone model) and the other with a concrete floor without a void beneath (one zone model).
Extending the model of Mowris and Fisk (6) with the principal assumptions of well mixed zones at steady-state, pressure driven flow of radon dominating over diffusion, and removal of radon by ventilation dominating over removal by its decay, the indoor radon concentration, Rni (Bq/m 3 ),
can be expressed (for the two zone model) as:
Rni • Rno + k.(Qr.l6Prj/N,.-Xt) = Rno + k.RP •••• ( 4)
Rno • Ambient radon concentration (Bq/m 3 )
Or E Volume flow rate of air through the floor (m 3 /hr) 6Pt = Pressure diff. between soil gas and air in the subfloor void (Pa) >.t = Ventilation rate of the subfloor void (ml/hr) Ai = Ventilation rate of the dwelling (ml/hr) k s A constant RP s Radon Parameter
6Pr is the pressure difference that is actually drawing the radon into the subfloor void of the dwelling. Vith the one zone model -i.e: no subfloor void, the form of equation (4) remains the same but the radon -parameter simplifies to l6Pil/N., where 6Pi is the pressure difference between the soil gas and air in the dwelling.
- - · 1 . - -- ...
This model does not predict actual ·indoor radon concentrations because the constant, k, represents many different factors such as soil type, radon source strength etc. and calculating a value for it is not straightforward. · But the · model does estimate removal : of radon (by ventilation) · and it calculates the driving force ·for radon entry (by pressure driven flow). Therefore the effect of radon remedial measures such as additional ventilation and ·floor tightening can be ·-o·assessed-by calculating the change in the radon parameter. · ·. ~:-.:
)·· ~
A remedial measure may aim- to remove radon by increasing the ventilation rate in either the subfloor void or the dwelling itself, or limit entry of the gas through the floor by some form of floor tightening. But a higher ventilation rate in a dwelling can increase the radon entry rate because the possible resulting pressure drop will draw more radon into the dwelling. On the other hand increasing the pressure in the house with respect to the soil gas will limit radon entry but the risk of interstitial condensation may have to be considered. It is acknowledged that validation of models using experimental data will be essential before confidence can be placed in particular remedial measures.

r
I r
:·
TABLE 2. Radon Parameters for a House with a Suspended Timber Floor
Air brick Floor Area Type
(mm 2 /m) Oi.
200 A 30 B 33
1000 A 27 B 14
3000· A 16 B 5
Housing density
lOi. 20%
82 7S 6S 48
SS 44 30 21
40 23 11 9
*Area recommended by UK Building Regulations for adequate ventilation beneath suspended timber floors to control water vapour.
(All values of RP have been multiplied by 104 .)
TABLE 3. Radon Parameters for a House with an Extract Fan
Envelope leakage at SOPa, 0%
OT (ach) off on
s 411 349 15 137 137
Housing density
10%
off on
274 237 91 86
20%
off
2S6 85
on
230 81
off .. fan off on = fan on ·
For the two zone model (dwelling with a suspended timber floor) two remedial measures were examined: floor tightening with increased natural ventilation of the subfloor void (extra air-bricks), and a powerful subfloor extract fan. The results are given in Table 2. (Air-brick area is mm 2. per metre of wall, floor ··type A is an unsealed timber floor and floor type B is draught-stripped.) The results show that, -in this case, tightening ::the floor and increasing natural ventilation in the· subfloor void will reduce indoor radon levels by a factor of about seven. ·. The floor tightening used here is ,, just simple draught-stripping (sealing skirting gaps); · obviously, : incorporating a · continuous plastic sheet . within the floor construction would be expected further to reduce indoor radon levels. ·' . ,
l ) 4 ... ~i . . ,, ;:-
The second remedial measure, a powerful extract fan situated · in the subfloor void, appeared to be extremely -successful in decreasing indoor radon levels. In. fact the ·fan was able to reverse the direction of the flow through the floor, Ot, so that it was from the dwelling to cthe subfloor ,yoid. · This was ·,true for _ . all -~ wind speeds '.and · temperature differences .· modelled. Therefore, any radon present in the subfloor void cannot be carried up into the dwelling. It is emphasised that· :this result may not be achievable in practice at reasonable flow rates because of leakage into the subfloor space, and that floor heat losses would increase in wintertime. It is intended to compare these predictions

against experimental data within the next phase of the work.
One final remedial measure that was assessed . was house without a ventilated void (single zone). These Table 3. They show that an extract fan, such as kitchen, is not suitable for reducing indoor radon fan will increase the ventilation rate (removing difference between air in the soil and that in the resulting in an increased radon entry rate.
an extract fan in a results are given in might be found in a levels. Although the radon) the pressure
dwelling is increased
4. CONCLUSIONS
BREVENT can be used for predicting infiltration rates in dwellings from pressurisation measurements and for assessing the effectiveness of radon remedial measures. For a house with a suspended timber floor the model predicts that indoor radon levels can be reduced by a factor of seven by tightening the floor and increasing ventilation openings. An extract fan in a dwelling does not appear to reduce indoor levels unless it is situated in a subfloor void.
Many other uses are planned for BREVENT including modelling of passive stack ventilation in dwellings, and it will be used in conjunction with indoor air quality and BRE domestic energy models. BREVENT is in a 'userfriendly' form and makes extensive use of on-line help, error trapping and graphics. Validation exercises carried out so far are encouraging and these include the comparison of predicted subfloor ventilation rates with experimental measurements (7). Further validation exercises are planned.
REFERENCES
(1) Stephen,R.K., Determining the airtightness of buildings by the fanpressurisation method: BRE recommended procedure. BRE Occasional Paper, August 1988.
(2) Varren,P.R. and Vebb,B.C., The relationship between ·tracer gas and pressurisation techniques. Proc. First Air Infiltration Centre Conference "Infiltration measurement techniques". Vindsor, UK. 1980.
(3) Liddament,H. and Allen,C., The validation and comparison of · mathematical models of air infiltration. AIC-TN-11-83, 1983.
(4) Varren,P.R., . A simple method for predicting infiltration rates in housing. Proc. Building Research Scientists CIB V67 Conference.· Dublin, UK. March 1982.
(5) Dubrul,C., 'Inhabitants' behaviour with regard to ventilation. AIC-TN-23-88, 1988. .
(6) Mowris,R.J. and Fisk,V.J., Modelling the effects of exhaust . ventilation on 222Rn entry rates and indoor 222Rn concentrations. · ·· Health Physics, Vol.54, No.5, pp.491-501, Hay 1988. '•: · ·
(7) . Edwards,R.E., Hartless,R.P. and Gaze;A. , · Measurements of subfloor ventilation rates - Comparison with BREVENT. predictions. 11th AIVC Annual Conference, Italy, September 1990 (to be published). ·
. ..._ ~ ~
. · .. ),.I I."!-. , ..
- , .
· ...

I;. -
-: . ....
~,~:~=: ··
METHOD OF RATING THE AVERAGE ANNUAL PERFORMANCE OF DOMESTIC AIR-TO-AIR HEAT RECOVERY UNITS
Hendriksen, L.J.A.M. Netherlands Organization for Applied Scientific Research
TNO Division of Technology for Society Apeldoorn, The Netherlands
SUMMARY
II 7
This paper describes a method of rating the average annual performance of small domestic air-to-air heat recovery units. The main question here is how the average efficiency can be predicted for one year under average indoor and outdoor conditions. A calculation method is developed and the test data required for the calculations are specified. For this purpose the indoor and outdoor conditions over one year are described with aid of basic assumptions. Finally the mer.hod proposed is verified by testing a heat recovery unit in a laboratory. The method is generally applicable but th.is study refers to The Netherlands.
INTRODUCTION
Energy conservation in dwellings has become a more important factor and as a result houses are being built more airtight in order to reduce heat losses. The use of mechanical ventilation in these newer structures is a· must to ensure that humidity, odours and other contaminants do not build up to harmful levels. A solution to indoor pollution, with.out sacrificing all the energy saved, is to install a mechanical ventilation . system ·wb.ich incorporates an air-to-air heat recovery unit. In continuation of ISSO Publication l l: "Heat Recovery Systems" [ l] , , TNO is carrying out a project to develop a method for rating the average annual performance of small domestic air-to-air heat recovery units. This paper deals only with heat recovery from exhaust air. This study is motivated by one of the results of an earlier project [2] which showed the great interest in a project of this nature expressed by heat recovery unit manufacturers and dealers. It is generally held _that comparing the performance of heat recovery units is of great relevance to all parties and will stimulate the development and application of such apparatus. · ... , .. The purpose of this' project -is to: . . : _. . :
describe a· method of calculating the .. average annual :efficiency; - specify the data required for the calculations;
specify the test requirements and procedures for obtaining performance data to be used in the calculations. . _ . ., -. . . ; ... _ , , ·· -·. .... -. :; .~ ::. , .:. __
To verify the method proposed, laboratory tests are carried out .with . one -. . heat recovery unit with a crossflow heat exchanger. This study has not yet been 'completed, so it is possible that some details of the method will.. be optimised in the near future.
RANK XEROX COMMUN/CATIE SERVICE

:•
METHOD OF CALCULATING THE AVERAGE ANNUAL EFFICIENCY
Definitions
The temperature efficiency is defined as the ratio of the temperature change achieved and the theoretical maximum temperature change:
ryT = Tc,o - Tc,i (l) T . - T w,i c,i
where T represents the dry-bulb temperature of the entering and leaving air streams as shown in figure l.
c e
e
old supply air nters from outside
Tc,i
b.aust air exit:S
--
wi r
th much of the heat --IDOVed ._ , - Tw,o
heat ~
T I
fresh supply air preheated by exhaust ai r
~ -Tc,o : Mc,o - ~· .
•. . .
warm exhaust air ' from the house =- · . ---r · ··M...,··RH....r· W,l. ' ,l. ' , ,l. . .
Figure l Schematic diagram and flow stream nomenclature for an air-to-air heat recovery unit
:.- • ... ·:z .; .. -.> .i .:.·.
' :. . ;,_ . r -However, when the mass flow rates in the exhaust and supply air sides are not equal, the efficiency measure can lead to erroneous impressions.'A more adequate ... description of-. the heat recovery unit performance is ' the :·effec-tiveness which. is defined as: -<: .. · ·· ·· · ' - · .. y .. ;,• t:: .:. - ·
~ -;:~-· ... . -~ ; . . .. :. ':"_~:-~ ~ ..... ;"i:f~: :..~·<~ ~· ..... ... .. •• . ~ ~; .- ·#· ·-:- ~~ c . :; . :~:.;.~: .-:.;ll.t· .. ~: ::~=-.,-... ~.> :...: . ~:t: Mc ' . (T . . , -~ T . -; )
.:.. . e'I. .. • , o c , o · c, l. "'- · CT i - T · ') ~,J. w, . c,J.
: ·; ~-.. - ,,., .
; • . , ,. ;., :'·'·'l~~·~ol::JJJ ~:f:~:,;;;7:::·; _ .. ~ .. • ,, ~: : f_:·~ . -.;i~ -·j:_~· .. ) •-
-:._.;. ... -· . )- :\t>1 .::.·f i •. -j :: .••
The .mass flow ··races Mc 0 · and MW. i ·a:re used · as refererice -.i~lues·~- ·be~~use" .. t , ' . '.. . ·-
those are the ma•s flow• ·that encer and leave _on the ·applicacion side (house) (3] • . ~ · - : . . : 1 ' · · · · ,. . · - , ~ . .• ::. >~:.~'.:.:. :.~·-~ : ' . ." - ~ . . , The effectiveness definition reduces to equation . ( n ··wen · the 'mass ~ flow rates are equal on both sides of the heat recovery unit. :·In ' this''~scudy a balanced mass flow 'is regarded and ·therefore · the effectiveiie~"s :3ancf·_-effi-ciency are identical. , .. ~-~-; ·:... .. .J.:·,. ..-.:, :· :;;L ·: :" ··
- ., --·- .....-..,. ,, ,,. ' .. ..- ., .;,-From -equation (1) we can conclude that ry!· depends upon ~Tc i and ' Tw i. From literature and earlier measurements [2] it is known ·~'that' . ry'L '.1also.!depends upon.. the.·mass flow rate M and the humidity of the · exhause~air'r~i ::~ ::···. · . ,. . . . By tescing a heat recovery Un.it in a laboratory the temperature efficiency is determined as a function of the four parameters Tc - i•Tw ~ i_, ·M 'and RHw i·
. :-· .. .. . ' · :· ~ !. ii] ..:,. ... ft - . • \ • .. .
. - •.. - "t•:: .. ' ...... ·.:' •' . = ,_:;~.:. -: '

I
r
, •·. ;.!:.
t: · ..
c·=· .. _,_:
The results are momentary values of the temperature efficiency, belonging to one combination of these four parameters.
The average year temperature efficiency (17T]y is the average· of the momentary efficiencies:
j=k t ( 17!) j
j=l (17T]y = ----
k
.. (3)
where k is the number of time intervals into which a year is divided. Every time interval represents one (17T}j. Because the supply air is preheated in the heat exchanger less energy is needed to heat the supply air to the wanted value Ti. The higher 17!, the less the needed energy. This effect is expressed in the average annual energy efficiency (17E]y:
j~k (l7T) j .M. (Ti-To) .J saved energy j•l
(4) = (17E]y s saveble energy j•k M. (Ti-T0 ),
max. l:
j•l
The main question is under which conditions the heat recovery unit should be tested to get sufficient data to determine for every _time interval of the year the momentary efficiency. The four parameters are related to the indoor and outdoor conditions under which a heat recovery unit in practice operates. Therefore it is necessary to describe the indoor and outdoor conditions during a year. For this pur-pose some -basic assumptions are made. '" ' ·
Assumt>tions .~· "\ t r
a. We suppose conditions average to The Netherlands.
b. The temperatures of the air streams-·entering -·i:he ·- heac--recovery unit are equal to the temperatures inside or outside the ·:house: Tw i • Ti and
-- · - ----·- · · - --~--- -- -- _ _____ ._ --- t Tc,i • To·
• j l~·- •
. c. Dutch outdoor conditions are obtained from: - NEN 5060: "Short reference year for weather conditions 11 [4] or - The representative year 1964/1965. . The benefit of NEN 5060 is that the short reference year is composed of 56 days of 24 hours. The representative year 1964/1965 is a normal year of 365 days. Using NEN 5060 means less computer calculation time. For each hour of these two years the weather conditions are known. Normally NEN 5060 is only used in calculations .concerning energy savings. This study will show if NEN 5060 is applicable in the. calculations of the average year performance. · . , .. , . :1.
. . . ... : . ~ .... d. Because of assumption c. a day is split up in 24 time interV'als of an
hour and the calculations are based on houi·ly values:---·----. .,, ·..:. . .:. . -. : ~ ...... • • • f • • ~ .4 • " • .. 1 ' • .:.. ~ .. .. ~ . .' ·; . .-~ .. ~ .;. . ... . : ~ ~ ~- ~ ' l
... ' "" • r) -: :: : ~ • • : . "- J ·1: : _! • . ..... - :·; · '..\ I L . ., ... .··- - ····· : .. .:: ~- ~i ~ _;, • '": .. ... ::c.:.: . :a-~~~-. "l.- 1:. ~ ~-~~
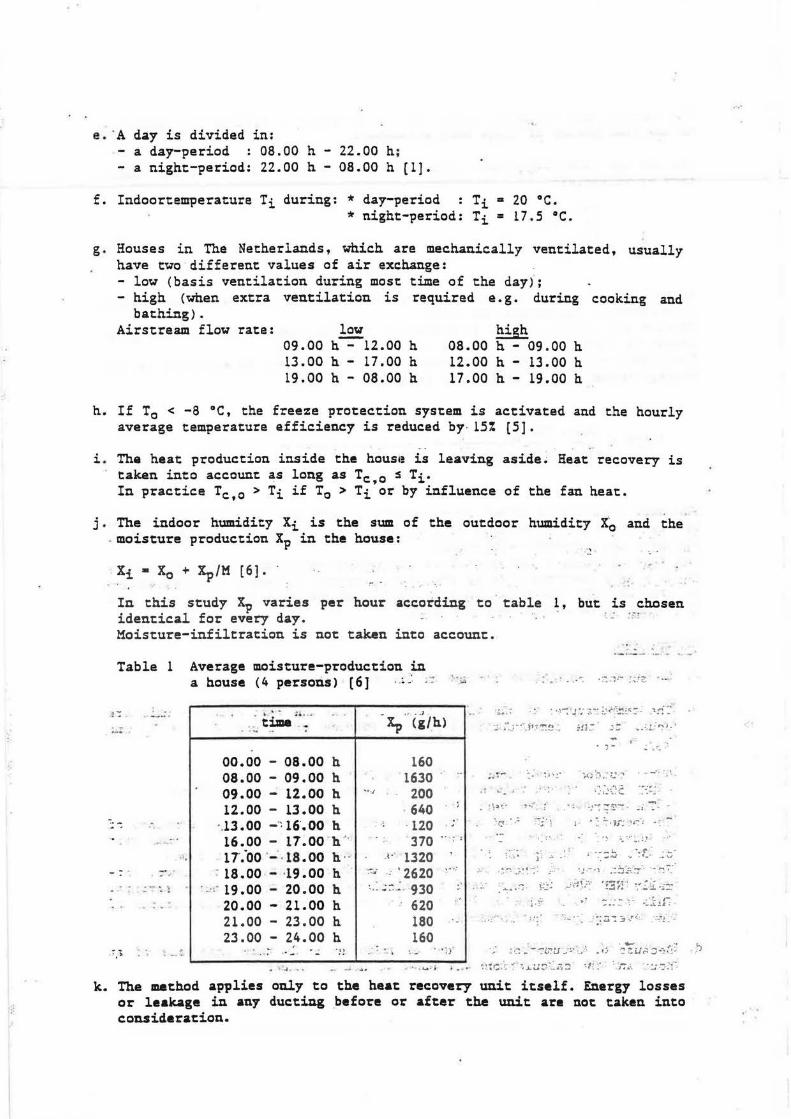
e. ·A day is divided in: - a day-period : 08.00 h - 22.00 h; - a night-period: 22.00 h - 08.00 h (lJ.
f. Indoortemperature Ti during: * day-period : Ti = 20 °C. *night-period: Ti= 17.5 °C.
g. Houses in The Netherlands, which are mechanically ventilated, usually have two different values of air exchange: - low (basis ventilation during most time of the day); - high (when extra ventilation is required e.g. during cooking and
bathing). Airstream flow rate: l~ high
09.00 h - 12.00 h 13.00 h - 17.00 h 19.00 h - 08.00 h
08.00 h - 09.00 h 12.00 h - 13.00 h 17.00 h - 19.00 h
h. If T0 < -8 °C, the freeze protection system is activated and the hourly average temperature efficiency is reduced by· 15% (5].
- · i. The heat production inside the hous1! is leaving aside~ Heat recovery is
taken into account as long as Tc,o s Ti. In practice Tc,o > Ti if T0 > Ti or by influence of the fan heat.
j . The indoor humidity Xi is the sum of the out.door humidity X0 and the . moisture production Xp in the house:
~i • Xo + Xp/M [6] • .
In th~s study Ip varies per hour according to· table ~, but. . ~s -- ~hosen identical for every day. ·· · '· Moisture-infiltration is not taken into account.
Table l
:r: .
·>.
1,,. ...
- ·-- ·-·· .. --.... Average moisture-production in a b.ouse ( 4 persoti.s) [ 6 J · • -·· · - -~ - - -:-: :,: .. ;~tz
. . . \,., : • :L . ·· ' - . - .~ •• J
·- time - , . Ip (g/,h) .. . ..... '""""' .
00.00 - 08.00 h 160 08.00 - 09.00 h 1630 . 09.00 - 12.00 h "' ' . 200 12.00 - 13.00 h 640 . i
·.13.oo -·~16·.oo h .. · 120 ,; 16 • 00 - l 7. 00 h ·. 370 ·· ·:: 17 :oo . -'. t 8 • 00 h .. , .. 1320 ,
7 18.00 · ..; ·19.00 h .. :.. .c • 2620 , .... · -·~- 19.00 - 20.00 h ' .. ;;:-:_ ·930 ..
20.00 - 21.00 h . 620 2 l. 00 - 23 • 00 h 180 -23.00 - 24.00 h 160
' .·. . . ;;· . - ... : ~· - - ·.'! . ' ··-
~ ..... .•. '·~-:·1~,,-~.~.: ;;.<--:-:.!'?:.~;=·· _"l..,'f-: :J ;:_l~·' ''.1 .'!:~ ~ :ti.~ .:: ... ~:..L: ~~.·'
. ~.. .:.
.~ ~:. r;"·
~~ ·• :~ ',.(j ~ . :· ·:: :'
I.-.' :·~;--<~C
,. .. ,-: ~· - :. . __ ,-;:-:ti~'
.. - . :-:.. .
' -- . ·,, .
-·: -··~· :. ::;i_·: j ~ :~ =:.~;: _1 ~! --~-
'~ :. .. •.•• : . ;_'!"
: .. \ . ; : ... ' l' --::b ._ "~t. -~ ~
.\.' . . ~~ ~3-~ '.-;: ..;·· ~J - ·~· --=~~-::!'"-. -~ -;_-... -·"'-· -.;;. g::~ _r.-:~,;-~- -!3~·r ! ...... .: .~ ·i=
i.::.: ... :~_·:!·· ~--~~!1-; -
; .. .:,1·· / ::Zi--: :;,·._P'( . :---:~!.~ -.:
!'-~ .. -~J.:~u .. :~~ .. .. ~·~· ·~:LJc:.~· .. -:"'!'(i~ '.:'1
~ ~-~ ~c~·=. ~ '.",J_:..;~~~~:.j ' ·.1~ :· : ·r:~:, · .::::.~1 ~
k. The met.hod applies only to the heat recovery unit itself. Energy losses or leakage in any ducting _before or aft.er the unit are not taken into consideration.

;::.:
1".-.-
Test"Crocedure
Measurements have shown that in practice occurring temperature, rrT depends only upon the temperature difference between the warm air entering and the cold airstream and not upon the absolute temperatures. So test data must be recorded for one value of Tw,i· In this study Tw,i ~ 20 °C is chosen.
In totally £or 24 different measuring points data are recorded, shown in a matrix in table 2.
Table 2 Matrix of measuring points
Tc,i (°C)
RH.w,i ( 7.) M ( 1.) -s 2 9 16
high 40
' . low
. , high 65
-.- .... low .. - .. .... ...
. • ' high ... . -;:: .:: ~ . ·. 90 : ---- - . ... ....... - ..
. ~ -.,,. .. , . low .. . - - . - .. -
. ..• ··--· 4:: ,-- - · . .. The . test results are presented in · a plot of thermal efficiency versus temperature difference, as in figure 2. For M • high a similar figure can be presented.
x s measuring points -...------ ~---· - -- .~.ca .ti- l lN....-
I 1. I ' -~
...... -.....
"""' ...... : .... ...,.. ---:
'7T
-~ '·: :~ -· ~ . " ~ '
- ~ • : - --- ··11R' · • . - 90• ·-1 . ..... - - ~ - - - ..... - . . ... - ·~ l. - '-.:- .. . . .. - . ·•.. . . . . . ' . .. . ··---- -----------·-· ---- ·-·---- . : ~~ ~-----.-. ___ .... _ --........._ : .~------~ ~------ .... ---~ -· • t •
•,
l1R' • ·• • 65t ~: • ...,,, l.
'RHw,i • 40% ~ .· • - '~ :c
, .
'-"":,) ... ::; _: .:.:=-.. : ; - - -~ :-:-= :::·-·._: !") ";~:: _ (~~ ::: :· :...: :-: .. -~!1~
: :;:,4!!J,;- ""? :'": ·: ~ !! ~ . : ~C-"". . :7, :.. : .. ~ " • • . . .
··:·tF-:: ·:,:3-!-!J .1~·~ : :-: !~,~~· ;· ·,L -: ~ -: --: ~ -.. ..... . - .
""77 .:: ~
. .. -- ·- ~ .... -. ,. -- ...... . ~·:.: :- i:-:i: t;, ::.. ~-: ·.: - £· .. "!~~ ··
• : . ... ...: .• -.'7~£i.:" =~-;~ ·-~ -'.~ ~ ...... : -. !
4 ll 18 25 •c "T • T · - 'Fe i .... . w,i. ' Figure 2 Temperature efficiency versus temperature
,.,diffe_~e~e for _Tw,_i•20 -~C and M~_?..o~--~~!_~>·..:~~ ~-; '":~ -. , : ,_:- ::
~ ..... '==-"! ~
;,_. .. ,;..,rv

··:
:·: ..
Calculations
To determine ryT as an algabraic function of aT for one value of M and ~ . the 4 measuring points of equal RHw,i are curve fitted. In totally we g;~ six algabraic functions. For every hour ryT can be calculated, while for every hour of the regarded year aT (• Tw,i - Tc,il• RHw,i and Mare known. Regarding RHw, i the exact value of ryT is calculated by interpolation between the two surrounding values of RR...r,i· For every hour of the regarded year the efficiency is calculated. The average year efficiency is the average of these calculated hourly values. TNO has developed a computer programme to calculate the average year eff iciencies.
Fan corrections
Because the small fans and fan motors used in heat recovery units typically have a low efficiency, most of the electrical energy consumed by the fans is immediately released as heat. The fan heat will cause an increase in the temperature change of the cold airstream. Therefore it can happen that Tc,o > Tw,i and so ryT > 100%. If Tc,i approaches to Tw,i• ryT gets infinite. The hours in which ryT > 100% are discarded in the calculation of the average year efficiency. The corrected temperature efficiency (ryT)c is calculated by assuming that the fan power is totally conver'ted into heat. ·-- -- ---- -- -This calculated temperature change can be substracted from the actual temperature change of the airstreams. For the heat recovery unit tested in this study, the fans and fan motors were located in the airstreams downstream of the heat exchanger core. Therefore, all of the heat from the cold airstream fan and none of the heat from the hot airstream fan will be added to the cold airstream. The effect of the fan heat on the temperature change of the cold airstream is:
Pven't · - ·- 3.3785 * Pven't -· . .. .. ·- --·· -(aT)f • :a (5)
(Mc_, 0 /3600) * Cpl Mc,o
Mc o • - CTc o - (~T)f - Tc i> (ryT)c = ' ' '
Mw · * CT · - T ·) ,i w,i c,i '
357.85 * Pvent (with ryT and (ryT)c in %) (6) • ryT·-
Mw · * CT · - T ·) ,i w,i c,i
The ref ore the foliowing two average year efficiencies are also calculaud in the TNO-computer programme: * Corrected temperature efficiency ((ryT)c]y.
The temperacure change of the airstreams by the fan heat is subtracted from tb.e measured temper~ture change. -· ·- -- - -- ·· - ---- - ·-· - ---
j•k .t [ (ryT)c)j .M. CTi-T0 ) ):-
. . J•l . * Corrected energy efficiency ( (E)c]y • -n> . k
- ---·- - J~ j•l
·-
M. (Ti-T0 ) ..

f~
··' .-
(·' .: \....:·
In principle [(ryE)c]y is the most important efficiency, because this calculated number shows the real profit of the heat r~covery unit.
RESULTS OF LABORATORY TESTS
TNO has a facility for testing various performance aspects of a residential air heating . system. One can produce simultaneously warm and cold air with temperatures and humidities at choice, representative to the indoor and outdoor environments. The attainable minimum air temperature i~ -10 °C. It is possible to test a whole system or to test one or more components ." One component can be a heat recovery unit. Tests have been performed with a heat recovery unit with a crossflow aluminium core and with fans located in the airstreams downstream of the heat exchanger core. The aim of these tests was to verify whether the 24 measuring points are sufficient for calculating the average annual efficiency in the way proposed. The tests were carried out with one heat recovery unit.
After actually carrying out the tests and calculations, . the following conclusions can be drawn: l. It appears that 4 measuring points are required to determine ryT as an
algebraic function of Tw,i - Tc,i• for one value of M and RH..N,i· 2. The average year performance can be calcu1'ted with data of totally 24·
measuring points, according to table 2. 3. The difference between calculated efficiencies with NEN 5060 and the
representative year 1964/1965 is smaller than 0.5?.. So calculating with NEN 5060 is permitted.
4. The influence of the freeze protection on the calculated average year efficiency is smaller than 0.37. and therefore negligible.
5. In this case the influence of the fan heat is approx 5% on the temperature efficiency and 77. on the energy efficiency. Therefore it is necessary to mention the location of the fans, their power consumption and their influence on temperature and energy efficiency in the test report.
. .. -.
Acknowledgement ··: . ! - ~.. .. .
The study reponcd above has been made possible by grants of ISSO and Novem .
.: .7:. = ~-: -
.. -· ; '
.. -
. .

.;" ;
.. .,.
=~~
Cpl E j,k M Pvent e I'/ ( 17) c (17) k [(17)]y RH T (t..T) f x
indices
w,i w,o c,i c,o i 0 ., p ..... -
.... -t -~} · :
NOMENCLAT!JR.E
specific heat of air at constant pressure energy
kJ'/kg.K w
int:eger number mass flow rate fan power effectiveness efficiency
kg/h w
corrected efficiency efficiency, belonging to ti.me interval k average year efficiency relative humidity temperature temperature change by fan heat absolute humidity
% % % % % % oc oc g/kg
warm exhaust air stream entering heat exchanger warm exhaust air stream exiting heat exchanger cold supply air stream entering heat exchanger cold supply air stream exiting heat exchan.ger indoor outdoor production
REFERENCES -· '
. ~ ·;
. ~ .... -.
[l l. ·rsso-publikation 11: Heat recovery systems. .. ·~ ·'&. ' ~ -.:.. - ..
~~~ ISSO Roturdam 1982 (in Dutch). ;~ · ~ ·~ : ,.. -:-; :·· .. · .·."I ·: · - - · · -
-"'l .... - •• • .... - . . .. '-
[ 21 - Hendriksen, L.J.A.M. Study opdmalisaticn heat recovery units, installed in houses (fase 2)~ TNO-MT/WKT report, Apeldoorn 1988 (in Dutch).
.·
..
[3] Eurovent 10/2. Heat recovery· devices. Methods devices for HVAC systems.
of testi~ heat:;:recovery
Maschinenbau-Verlag GmbH, Frankfurt, .1983 . ... ,, .. .. . ..... . -. ; '~-~~ #~ :~~~ \ • ~ • ..--
[41 NEN 5060: nshort reference year fer weather conditions. UDC 697.13~:551.506:628.85/86, 1983.
[5] Fisk, W.J. et. al. Performance of residential air-to-air heat exchangers during operation with freezing and periodic defrosts~ Lawrence Berkely Laboratory, University of California, 1985.
(6) Wolfs, B.G. Humidity in dwellings. I2-Architecture and Civil technics, no 4, 1986 (in Dutch).

r
;~:.~:· :
~ ~· ..
t~: :· .
PROCEDURES FOR CALCULATING VENTILATION IN ROOMS YITB OPEN VIHDOYS
ABSTRACT
ir. J. Busslage Delft University of Technology
Fae. of Civil Engineering, Building Physics Group Stevinweg 1, 2628 CN Delft
The Netherlands
_II 8
Calculation procedures are presented for air flows in buildings which are caused by the combination of: turbulent air flows at the outside of open windows, temperature differences, the average effect of moving objects and thermal turbulence, and static pressure differences. The last are caused by the mean static wind-pressure differences on the envelope of the building and also by mechanical ventilation systems. Simple formulas, known in the literature, are used to calculate the air flows caused by the individual forces. The total flows can be determined using the formulas and rules of thumb which have been derived from the calculation results. Several types of windows with detailed information on sizes and opening angles are taken into account. The uncertainty of the results, when wind forces are involved, is still large, due to the badly known relation between the wind speed on roof level and near by the windows. Nevertheless, knowledge about the mean, the minimum and maximum values of the total airflows are useful. An easy to use PC-program has been developed to execute the procedures.
1. INTRODUCTION
The project on ventilation was financed by the Dutch Government Building Agency, Dept. Advice and Research, The Hague. There is a need for procedures to determine the ventilation in rooms with · open windows. Up till now calculated summer temperatures in buildings are based on rough estimations on ventilation. The Building Agency intends to introduce standards determining the ventilation used in simulation programs. · Defining ventilation is hard when it concerns a room with several flows to and from the outside and other inner spaces, and possibly provided with a mechanical ventilation system. Rooms with open doors or other openings in inner walls may get more fresh air from inner spaces than through the open window in the room itself. Essential is the air quality in the room, which is related to the temperature and the amounts of HzO, COz and other pollutions~ To determine this air quality one must be able to calculate all the flows. With these considerations in mind the word ventilation will be used in this paper for all types of air flows. Even if the flows and their air properties are known, the air quality in the room may locally vary a lot, due to imperfect mixing. However that subject lies besides the scope of this paper. In the paragraphs 2 up to 5 a summary is given of the theory and the formulas about air flows through openings caused by several individual driving forces. Paragr. 6 describes the calculation principals of correction factors for the flows through vertical and horizontal hinged windows. -· Paragraph 7 is dedicated to the effects of combinations of driving forces. Rules of thumb are presented to determine the total in- and outf lov through an opening. At last we discuss the PC-program and desired further research • . -Besides this short paper one can find more details in tbe full report (1).
RANK XEROX COMMUN/CATIE SERVICE

2. AIR FJ...OW THROUGH AH OPENING
Q = c·A·~pb [m3 /s] 1
The flow through an opening of A m2 can be approximated with formula 1. ~P is the difference of static pressures at both sides of the opening, as can be measured at spots where the velocity is negligible. The power b has a theoretical value of 1 for laminar flow. The value decreases to 0.5 for very turbulent flows as such through windows. The factor c is depends on b. Lit. (2) gives an overview of proposed values of b and c as mentioned in several publications for calculating flows through cracks in building structures. In (JJ is stated that commonly used values for openings like windows are: c=0.827 and b=0.5; for flows through cracks in recent dwellings the values determined by measurement are: c=0.59 and b=0.65; for the combination of cracks and open windows satisfactory values are: c=0.82 and b=0.53. In more detail formula 2 can be used (lit. 2,4/7): Q = Cd·A·{2/p)b.~pb [ma/s] 2
For turbulent flows at windows, doors and ventilation openings, measurements confirm the theory that Cd=0.61 is suitable if T~20°C {6). pis the specific mass of air [kg/m3 ]. Using =1.21 (T=l8°C, 50% rel. moisture) and b=0.5 formula 2 is identical to formula 1 with c=0,78 • The formulas can also be .used to calculate the flow at a cascade of several openings with areas: Al, A2, .... m2 • The effective area A of the cascade can be calculated as follows for two or more openings: A= Al·A2/(Alllb + A2llb)b or: l/Alfb = 1/!11/b + 1/A2llb + ••• 3
3. Ventilation caused by te•perature differences
When the air in a room has a temperature difference AT to the outside, then buoyancy causes a pressure difference 6P which is proportiorial to the verti-cal level difference h : ~P = g·h·p·~T/T [Pa]
4 g is the gravity acceleration (9.81 m/s2 at see level). ·· ~T is the average of the in- and outside temperatures. Together with formulas 1 (or 2) and 3 one can calculate the flow which will occur in two horizontal openings in cascade (see figure la). If one or both openings are not horizontal, then the situation is more complicated because the pressure varies in vertical direction. In §7 . a solution is .given •.. In case of only one not horizontal opening the temperature difference will cause equal flows in and out through the opening. The warmer air passes through the . upper part of the opening and the colder air passes the lower part in opposite direction. The total flow in both directions . caa be approximated by integration across the. opening of the local flow, : calculated with formulas 1
T- t.T It Q
2~1\
h
tQ
.6P/2
T+ t.T 2
.6P/2
FIGURE la. Thermally driven airflows through two openings in cascade.
h
T+~
• ~.1 •·
T-6T 2
- . l
:_1,·.~ t5_
' ;.i ·
: ·1 ~:
FIGURE lb. Thermally driven airflows .. . • i through a window. ; . r: ~ ·. o~.
~ : ~ • t • 1

I I
.·:-=::
... :::·::
(or 2) and 4. For vertical openings like windows and doors the result is:
Q = Cd/3·A· (g·h·~T/T)l/2 [m3 /s] 5
A is the total area of opening; his the height in the opening (see fig.lb).
4. Ventilation caused by static wind pressure
Every wind direction creates a different pattern of pressure levels around a building. This paragraph is dealing with pressure levels which are an average over a period long enough to flatten out turbulence. The pattern is very dependent on the shape of the building. Pressure patterns of some simple shapes are specified in the literature (2,7,8,9). The local pressures at walls and roof are given by coefficients C representing fractions of the static wind pressure:
P = C·lh·fJ·VZ [Pa] 6
V is an average wind speed which can be derived from the local meteorological wind speed with corrections for the roughness of the surrounding area, and for the height of the building. When the building is lower than the mean height of obstacles in the environment, then this mean height is relevant to determine V. Procedures and tables for corrections can be found in lit. (2,7,1) The flows in a building, as a result of the pressure differences on the envelope, can be calculated by solving a set of equations in which the openings in the envelope and between rooms are taken into account. Each equation (formula 1 or 2) relates the pressure difference across an opening to the corresponding flow.
5. Ventilation caused by turbulence
Air turbulence causes fluctuations of the local pressure on the outside of the building. Dependent on the inducement of the eddies, the wavelengths are very various. One may divide the wavelengths in three classes (7,10): 1. Long wavelengths (in relation to the building size) induced by wind around obstacles in the environment and by thermal disturbances. The contribution to the total ventilation is relatively small (4). 2. Wavelengths comparable to the building height are induced by wind and the main shape at the building itself. Around the building the correlation of the fluctuating pressure components varies from zero to one. A theoretical approach (7) shows that the ventilation increases proportional to the turbulence rate. At a rate of 30% the ventilation - through windows increases with 20 and 25% for zero resp. full correlation; the flows through cracks increase with 45 and 60% (compared to a situation of static wind pressure). 3. Short wavelengths are induced by winds in direct contact to the building surface. However the turbulent layer can separate from the surface. Therefore the ~hape and the wind direction are of great influence on the local intensity of these eddies. Eddies with wavelengths comparable to the size of windows may be responsible of the main part of the ventilation in rooms when open windows (in one wall) are the only openings (10). Due to the complexity of the air flow around the building it is not (yet) possible to give an accurate procedure to determine the frequency spectrum of the local flow. For the time being one can use formula 7 to determine the mean in- and outflow through one or more windows in one facade of a for the rest closed room (4).
Q = C·A·V (m3/s] with: c = 0.02 to 0.08 7
Vis the corrected mean windspeed on roof level (§4). -A is the area of opening of the window(s). Coefficient c determines the minimum and maximum values which can be expected on different locations of a normal shaped building (4).,
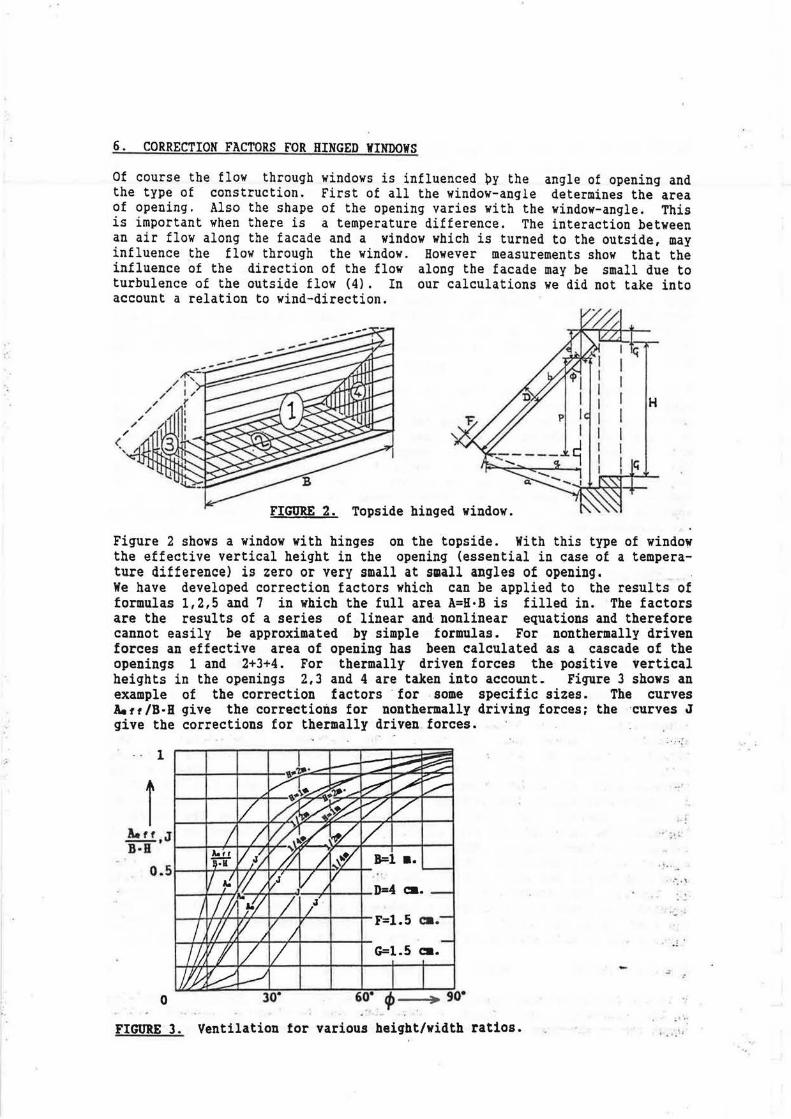
6. CORRECTION FACTORS FOR HINGED WINDOWS
Of course the flow through windows is influenced py the angle of opening and the type of construction. First of all the window-angle determines the area of opening. Also the shape of the opening varies with the window-angle. This is important when there is a temperature difference. The interaction between an air flow along the facade and a window which is turned to the outside, may influence the flow through the window. However measurements show that the in!luence of the direction of the flow along the facade may be small due to turbulence of the outside flow (4) . In our calculations we did not take into account a relation to wind-direction.
G
H
ct
FIGURE 2. Topside hinged window.
Figure 2 shows a window with hinges on the topside. With this type of window the effective vertical height in the opening (essential in case of a temperature difference) is zero or very small at small angles of opening. We have developed correction factors which can be applied to the results of formulas 1,2,5 and 7 in which the full area A=H·B is filled in. The factors are the results of a series of linear and nonlinear equations and therefore cannot easily be approximated by simple formulas. For nonthermally driven forces an effective area of opening has been calculated as a cascade of the openings 1 and 2+3+4. For thermally driven forces the positive vertical heights in the openings 2,3 and 4 are taken into account. Figure 3 shows an example of the correction factors ' for some specific sizes. The curves A.11/B·B give the corrections for nonthermally driving forces~ the ·curves J give the corrections for thermally driven forces.
1
i !• !
A.tt ,JI I / I ,r ,4,<
B • B , ,, 1 ,' l"'J'--+-1L~+1 ~7~-~·47•7'•L- ~l,7''-f~y 0.5 D=4 ca.
: ~ ..
·:· · ..... ,
, .... F=l.5 ca.
G=l.5 ca. ..
I I I 0 JU-
60· "' > go•
FIGURE 3. Ventilation tor various height/width ratios. • • , -... j

... i· . · ·.:,,. ...
1 • • • : ,.
c,:,
.·
In a similar way the correction factors are calculated for vertical hinged windows. With those the curves J are on a much higher level for small angles. To use the correction factors there are three options: 1. Use the computerprogram which we have developed; 2. Use the graphs in (1) for some usual sizes of windows; 3. Implement the calculation procedures (1) in your own programs.
7. AIR FLOW AS A RESULT OF SEVERAL DRIVING FORCES
At a large opening the local pressure may vary across the opening. We assume that it is acceptable to add the local pressures caused by different driving forces and to determine the total flows by integration the local flows (formula 2) across the area of the opening. These calculations are performed tor a vertical square opening and for combinations of three types of pressure patterns: 1. Uniform pressure, caused by static wind pressure around the building, or by a mechanical ventilation system; 2. ThermaJ pressure (figure lb), caused by a constant temperature difference between both sides; 3. Horizontal sine shaped pressure with wavelength equal to the width of the opening, representing a turbulent pressure in front of windows caused by wind and inside rooms due to moving objects. (Abbreviations: Uni, ~T and Tur) In two tables the total in- resp. outflow is printed for a constant uniform pressure and wide variations of the temperature difference and the mean windspeed at rooflevel. These tables may be used for vertical openings in all sizes. The procedures are given to perform the correct scaling (1). Figure 4 is the representation of the first row and column of both tables. Q+ is the flow in the direction of the uniform pressure vector; Q"" is the flow in opposite direction. Striking is the initial descent of the flow, when6T or the windspeed (V) is risen in combination with a constant uniform pressure. This is a result of the quadratic relation between pressure and flow. The results for 6T and Tur are almost the same. If also a stochastic distribution of the sine-amplitude would be incorporated, then it may be expected that Q- will drop . to zero more gradually. Such improvements may be valuable when verification measurements have proved our theorems. Figure 5 shows the results for combinations of a .constant AT and a variable windspeed. Here is no dip. V is determined using the average c=0.04 in formula 7. The flow can be approximated very well with the formula:
Q = (Q4y& + QTur&)1/& 8
Quu1 is the flow caused by only a uniform pressure difference. Q4y is the flow in both directions caused only by a temperature difference. QTur is the flow in both directions caused only by turbulent air flows. These flows can be calculated with the formulas 1,2,5 and 7.
1000 ArH of opening: lxl ma
o· .orr Jhl
I I I I 1 l ,4"111i
0.40 0.18
0.92 0.97
1.9 2.4 ~y [•/•) 6.5 4.0 6. 7 ---.4T [l] 49
FIGURE 4. Airflows through a vertical opening vith a constant uniform pressure difference.
0
Area of opeuil19: lxl ma v I l v ll° ,(?"•(Q6T 6 +0rar' )l /6
l/
'/ v
~ -- .... ---- --- -- -Ir .o- <.AT-6. 7 ll v I I
~ l.-/ I
I I -I
0.40 0.92 2.C --+Y [.,,al 6.5
. ·'' l FIGURE 5. Airflows through a vertical opening vith a constant temperature difference.
'I
..

::
The results differ remarkable from the frequently used formula: Q = (QAT 2 + Qrur 2 ) 1 1 2 which is used in the literature (2,6,11) for calculation of total flows. This formula is correct only when pressures of the same type are combined (only uniform, thermal or turbulent). ' In many situations a larger error-margin is acceptable than might be obtained with use of the tables. This is especially true when wind is mainly responsible for the ventilation. One can use the following rules of thumb of which the results are within 20% deviation from those of the tables: Rule 1: For the combined pressures: direction of the vector puat
If (Q4r Or QTur)) Quai If (Q~r and QTur) < Quat
Rule 2:
pua1 + (p4r and/or PTur) the flow can be determined as follows: then Q- =max. (Q4r and Qrur) = Q •• x.
in opposite
then Q- = Q•ax - (Qua1 - Qmax)/2 if Q->O else Q-=o.
The flow in the same direction as the vector pua1, and directions for combinations of PAT and prur, are equal to separate flows: Qua1, Q4r and Qrur.
the flows in both the largest of the
8. CONCLUSION
To use the calculation procedures in full extend the help of computers can be very useful. An easy to use PC-program has been developed to determine the flows, the fresh air ventilation rates and the COa percentages in a cascade of two rooms separated by a corridor. The user can vary all parameters discussed in this paper. The results are the mean, the minimum and the maximum values to be expected. The program runs as a macro in Lotus l,2,3 and Symphony. We consider to develop a stand alone program with graphic support and with more complicated building models and more window types. Though aware of the fact that the time was to short to study all the relevant literature _and to perform verification measurements, we hope this study contributes to the realization of useful calculation methods. Last year's students are invited to do further theoretical and experimental research on the ·verification of the calculation procedures with combined driving forces, the imperfect mixing at turbulence driven flows through windows, and the frequency spectrum of airflows in front of ·windows on several locations of a building in relation to the wind variables and the environment.
LITERATURE ~ · _,.
(1) l!Usslage, J., llu'elcl!lliDg van de wntilatie in vertreldcm Et gecpe!lde llll!D. Delft lmversity of Tedlnol.cgy, Fae. of Civil EhgineeriJJq, alll.dinq Physics Gmlp, Delft (1990)
(2) Liddament, If.If., Air intiltraticn calculaticn tedmiques - an aiiplicatiai guide. Intern. niergy }q!lrf, Allnl!!lt v, Air infiltratiai and ventilaticn center (1986)
(Jl D'icksal, D.J., Ventilatiai with open vimows. Electr. CWnc::il Research Center, ~t, Olester (1980) (4) warren, P.J., Ventilaticn thl'l:J.l9h openiJqs m C11e vall aily. anld.inq Re9eardl Fstablishe>t, Garstai, Watford,
Ehqland, in: EneE9Y cxnservatim in beating, anlinq and YE!ltilatiDIJ buildinrJs. Ulais:pbere pllllishiIJJ cmporatiaa, Yashinqtm, 1mlm .(1978)
(5) Brown, V.G. and Solvasai, IC.ll., Natural wnWatim thrmJh rectaogul.ar openings in part:itims, Part 1: Vertical partitiais. Int. Jwmal m beat mi lDilSS transfer, nr. 5 Cl.962)
(6) Shaw, B.H., Heat am EIS transfer by natural CXIM!Cticn mi Ctlllb:ined natural cmvectiai mi fma!d airflow tbmlgh large r:ectanqular ~ in a vertical partiticn. Inst. Madl. Fngimer.J Qmfermce, Proc. wl.1111e C.819, Kancbester (1972) _ -
(i) llanda, IC., Wini iDluced natural vent. SWdisb aucil for buildinq re:seardl, Stcddlola um> (8) Akin, R.E. a.o. Average pressure aieillcients for rec:taDqular b1ildjDJ9, Procaed:ilJJS 5th Int. am. vin:l ISllJineerinq, ~ Press, USA (1979)
(9) llowell. J .J. , A vird t1mDel investiqaticn u.siilq ~e l:luildiDIJ 111'.ldels to obtain man surface vj.nd Pt1!SSllI1! aietticients tor air infiltratiai estimates. HRC rep:>rt unt-1A-:IX>9, Naticml re:seard1 mn:il, Canada (1976)
(10) Vrins, E .. Vmtilatie door een ge:Jllelld raam als geYO].q vm turbulente luditst:rmfu.ien. Tedllical thlversity of Eilz!hMn, Fae. of Ardlitecture, sect1a1 FNl), EiMbovm, HL (1986)
(11) Phatt, J.C. e.a., Qlderz.Dek naar de gevolgen van het 1:ipmen vm een raaa op bet binnmlWJlaat van een lra!r~ 00-00 Delft (1980) - ·~ ,,

I : :•~ ~ I '
. ..
•"* •
~ .·
PRINCIPLE AND AIM OF A NATURAL HUMIDITY-CONTROLLED VENTILATION SYSTEM
P. Jardinier and J. Simonnot Societe AERECO Collegien - France
~he aim of the natural humidity-controlled ventilation system AERECO is to improve ventilation in dwellings in existing residential buildings where ventilation ducts coming up to the roof can already be found. This paper intends to explain the purpose of the natural humidity-controlled ventilation system AERECO, why such a solution turned out to be developed, the expectable performing results calculated by the means of an adapted calculation programme in the field of a study that we have worked out for the the French Ministry of Housing.,,) . Such a process is being tested as well on three experimental sites :
II 9
NAMUR (Belgium), SCHIEDAM (The Netherlands) and Les ULIS (France). AERECO, CETIAT, E.D.F. (France) - BBRI (Belgique) and T.N.O. (The Netherlands) are partners in this experiment, on which Messrs P. Wouters and L. Vandaele from BBRI will submit another paper.
Principle and aim of a Natural Humidity-Controlled Ventilation system
In many residential buildings ... as built in Europe, there can be found natural ventilation ducts provided at first for the air renewal of service rooms : kitchens, bathrooms and toilets. But, on the contrary, nothing is provided for the air renewal of main rooms : livingroom, bedrooms. The air quality in dwellings becomes thus highly dependent on the air permeability of the building or on the occupants' behaviour, whether or not they feel like opening · the windows. Refurbishing such buildings with a view to save energy during.the heating season (external thermal insulation, weathertight windows with insulating glazing etc • •. ) often leads to ·reduce air ·infiltrations. ~;~As :~::.a :. consequence, condensation and moisture appear in the main rooms •. -::-Gener8.lly in such a situation, the occupan~s do not know·" how to react and often take unadequate steps that do not correspond to the real need e.g. : - in bedrooms, windows are ··frequently · left open during daytime when there is nobody in, but are closed at night when they should be left ajar because of the presence of the occupants. - to prevent , disturbing cold draughts, windows are less often left opened in winter, when condensation is more likely to appear, than in summer. So, whereas heat losses through the building envelope are lessened and mastered, ; those originated by the air renewal may reach uncontrollable values. Such problems are to be coped with thanks to the natural humidity-controlled process that we are going to explain. This process was indeed developped and based on the results , of .. a study carried out by the Company SERVA. Improving natural ventilation in existing dwellings was the object of this study, as requested by the French Ministry of Housing. Such a study, mainly theoretical, lead us to
RANK XEROX COMMUN/CATIE SERVICE

-.:-:·.
develop computerized calculation models specifically adapted to simulate a natural humidity-controlled ventilation system when brought into operation. These calculations models enabled .to estimate the expectable performance of the process, as shown on the following pages. These results will have to be compared to the measurements results carried out in 60 dwellings, shared between three sites : Les Ulis (France), Namur (Belgium) and Schiedam (The Netherlands) in the field of an experimental study funded by the E. E. C. and worked out by the following partners AERECO, E.D.F., CETIAT (France), BBRI (Belgium) and T.N.O. (The Netherlands). The original measuring methods especially developped on that purpose and the results of the first measurements campaigns will be introduced in another paper by Messrs P. Wouters and L. Vandaele (BBRI).
Presentation of the Natural Humiditiy-Controlled Ventilation process
The outside air flows into the bedrooms and livingroom through humidity-controlled air inlets, the opening section of '11hich varies according to the dwelling humidity. Then, this air goes out of the main rooms towards the kitchen, the bathroom and the toilets. At last, it is exhausted to the outside through humidity-controlled air outlets connected to natural ventilation ducts. On Figure 1 is shown the principle of the air circulation and on the right hand side of it, a common ventilation duct with individual connections of one storey height, as there used to be found in the existing blocks of flats.
· ··:.
·- . - •-":":"'~J - .. KITCHEN
.. -: ... ..: ·
...... . .. '
.t •. :
- -- •,-••· • - ~ - ..... -• .. • ..•• ,..., .. l
- · -_· ,,: • :• •. l . 1
- . -_...._-. ... · ... ...
· · ~ -·-
~.
LIVING
~ ..... . =--...,. : : .• .~"!: :i'.:
.. : "\_:
·- ..=:- ....
BEOROOH ~ii~
f ... ~.
.., BATHROOM ·r
.- '""!
. :: ~ ~ _, / _; . ~' ~
-= •. ;
_-.-t
· BEDROOM . : --?! " .• ... ~, i.~~t
1.. \ ' ; :- · ... : , , •(;:.: :!j " . [~ i ~~
; '
·~ 'J 1 ~· ~
~ ~ .. _, .·
. . fl§..1 . .. -· ""~ .:- ..:
.· -~ .... ,_;-,.;
-~
--
..:- i.
,_ .... . . . ... . e, ::- -::. :
-.-f ' .
• . fl .
~ :: : ...d.' •a. HI\\:" I?• c ...... o\'.I .. - ~ . .: ·~ / = ·-~ : , , ·· ~ ·; '1 ~ :__ :,- j ·-
- . . ~ .
.-;; ·1- ....
, .. ; ; ::-
" ,.• ~ I ~ • •
: ... ' I ~ ~ • 2 •)I .. ·.:
- _: ::. ~: - ~ -·': ~. · ·-:, 1.17-{ •' r··
'."', ~~\ -·! ":"\ ·-.: ~ :~ \ \t\ \) -1l "h\. Q ~ ...... ' t~ .\
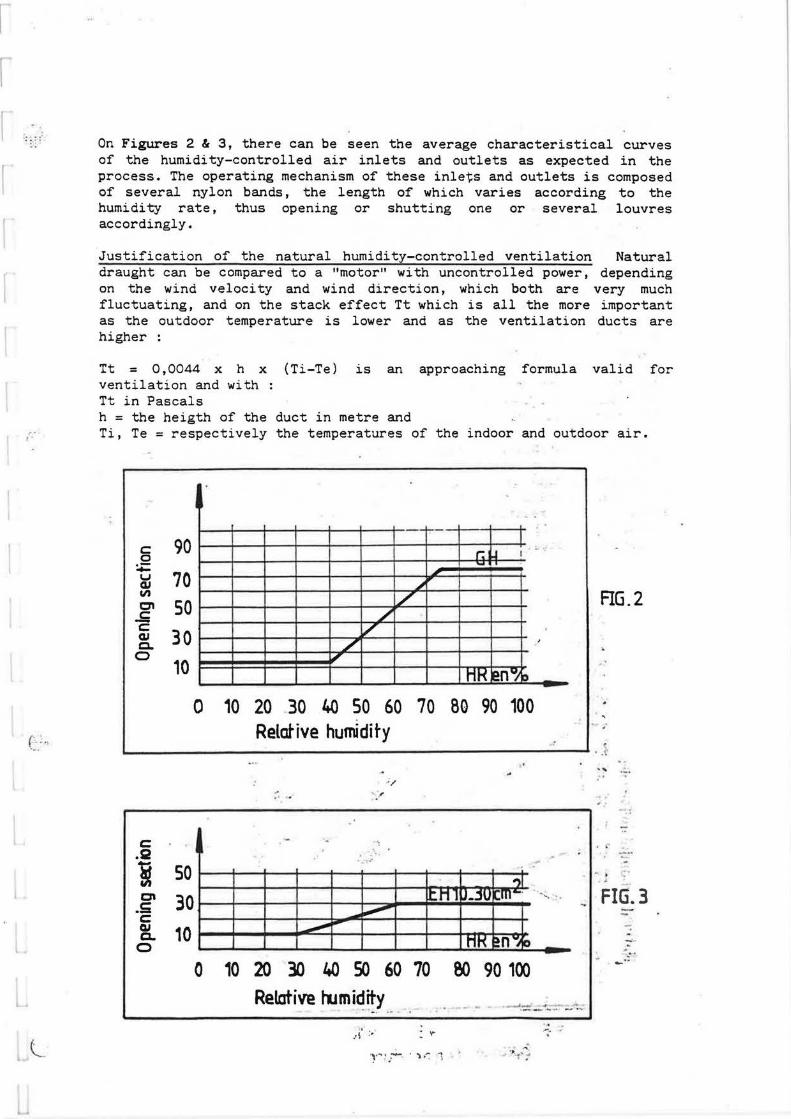
r
I r I
L~ :.~- ~ On Figures 2 & 3, there can be seen the average characteristical curves of the humidity-controlled air inlets and outlets as expected in the process. The operating mechanism of these inlets and outlets is composed of several nylon bands, the length of which varies according to the humidity rate, thus opening or shutting one or several louvres accordingly.
Justification of the natural humidity-controlled ventilation Natural draught can be compared to a "motor" with uncontrolled power, depending on the wind velocity and wind direction, which both are very much fluctuating, and on the stack effect Tt which is all the more important as the outdoor temperature is lower and as the ventilation ducts are higher :
Tt = 0,0044 x h x (Ti-Te) is an approaching formula valid for ventilation and with : Tt in Pascals h = the heigth of the duct in metre and
t: Ti, Te = respectively the temperatures of the indoor and outdoor air .
C··
c 90 0 z u 70 cu en en so ..= c: cu 30 c.
0 10
. . '
·-"";"'"-
r: lJ I - --~
/ /
v /
I.I
HH en~"
0 10 20 .30 40 so 60 70 80 90 100 Relative humidity
.
~ ·'
AG.2
'
L-~~~~~~~~~~~~~~~~~~~~~~~~~~~~~~~--- · .!
c .s:;a
i en
.s c: QI c.
0
so 30 10
'
I • .
L
0
•/
- .. . . •, - . -- .. . .- ,
_;_ --'11.
.c.n l J • .lU '-'!·-· -.... .. -~ _.,,,,,. ....-
MK en"'; ID
10 20 30 40 so 60 70 Relative tlJ_mi~ity
eo 90 100
.,,.i- .k· ·- -__ ... .... _,.. .......
.. Jr: .. . .,. ..... .• .,
·~· ... ~ .. ~· . ~ /': ·1 ~ . . .__~ ......
... !
. ,. ~ . , FIG.3
..... -·

··•
.. ..
The outside air used to renew -the air in the dwellings contains all the less water vapour as it is colder. Consequently, the indoor atmosphere is thus kept all the dryer as the outdoor temperature is lower. Figure 4 highlights the reversed evolution of the outdoor humidity and of the natural draught when the outdoor temperature varies. There can be seen as well, how the ducts height may be of influence. The stippled curves represent the natural drau~ht available in the dwellings respectively of the ground floor, third floor and seventh floor of a .seven-storied building. The graph with a continuous line represents the outdoor humidity. It is thus obvious that natural draught and humidity inversely evolves and it is this fact of capital importance that lead to develop the natural humidity-controlled ventilation system ·AERECO. The purpose of such a process is to stabilize the natural draught effects : the resistance of air inlets and outlets, that get progressively closed when the indoor humidity decreases, is thus counterbalancing the "motor" that accelerates as the outdoor temperature gets colder, and inversely. The natural humidity-controlled ventilation system does not only make up for the natural draught effects but also offers many other advantages, i.e. : - the air distribut i on is better shared between the building storeys. In winter, the stack - effect ·tends -to make the air better circulate in the down storeys than in the upper storeys of a building. Thus the air of the upper storeys contains more humidity than the air of the down storeys. By reacting to these different humidity rates, the humidity-controlled systems tend · to reduce the air flow rates differences between storeys~-
30 2S . 26 24. 22. 20
en i6 18 bf ~ 16 .5 14 . ~
-512 :l IQ 10
. . L.. " ~ - ~ 8
IQ .z 6 ~ 4
2
' ' ' '"- -·
....... ~, ..
·· -··- .:::
'., -:. ...
' ·-· -· · -- - ;-- .-.:., .,:----··-, ____ _
' , ... __ ; ..
' ' '
9 .· .. ~
8 ~-- ·:-'• · ~
... ·.·--· ........... _• .,.
7 -· .. ,\..= : '"e
,. -;: ..... ..... - ·-· . - _____ .'.)_
..... ' 6 ~ ·-------··
' ..... ' ·--- -- .. ·-~-
c
'~a 5 :~ -- - ···- -· ~""" ---· -~-- --.., ) .. ;.-. _, ... ~~- 4 ~ ..... .t.t/1"_<1 ~ • Cii
-..: ,~ ' ~ , _ FIG.4 -~
"'<.'~r ' - .c; .- ., .. T~·· ' -· - 3 _.., ______ .. _ ...... ·:...· 'E - ; "< .J"~~~-nf ... -~, --="""'- .' :--_ =- ~ -~ - ~ 'J - ~ . ···, ;-; - .!.!. ttOQr --. . ~ - , ' • · -.,.l:._ .• _,~ - - - "'1 - ··-- ---- 2 ~ 7 ... ..... ~ i I ~--·~~ - - ~ ~'. ·-· " _,, _ --- -- ••.. ' •;s . . . -,~;t~::- ·':..~- ~---- " - -~ --~
.!\ ~ ._ -- , .. " 1 ... ..; .....:r_-.; __ , ·: · ~·- ·~ ;.}\ )~; ,\;'. .:. . . {'' ' :< 'v
'
:.···.i_:; ~. !, ::..1J; ! - I ;:; .. --·
... ......
<
.... · ·~
~-· :5·-.--·--0·--;5-·--;10 ... - ---·- -."I .. · ..... ~-<o•t·.,.__~....,.,, ..
Outdoor temperdture

.. ... .
.. ..
' ·
- during the heating season, excess ventilation is prevented when the wind blows too much. When dwellings are overventilated because of the wind, the humidity of the air in the dwelling is rapidly exhausted which causes the air inlets and outlets shut progressively. - the air renewal in dwellings is modulated in adequation with the real need in each dwelling. The dwelling humidity depends much on the number of its occupants and on their activities which results in an automatic and adequate opening of the humidity-controlled air inlets and outlets.
Expectable performances To illustrate the interest offered by that solution,- results concerning calculations made on a particular case are explained hereafter : e.g. a pile of 5 dwellings, composed each of 1 li vingroom, 2 bedrooms, 1 kitchen, 1 bathroom and toilets. These dwellings have a double exposure and an air permeability of 100 m3/h/10 pa. Three common ducts measuring 20cm x 20cm are respectively connected to kitchens, bathrooms and toilets. Each main room is equipped with 2 humidity-controlled air inlets, the characteristics of which are shown on Figure 3. Toilets and bathrooms are equipped with humidity-controlled exhaust grilles, the characteristics of which are shown on Fig\.ire 2. Kitchens are equipped with unmovable exhaust grilles of 100 cm2. · In Figure 5, a comparison is drawn· between the ' nu~idi ty-controlled solution and a reference solution. With the latter, unmovable air outlets of 30 cm2 section are replacing htimidi ty-controlled air inlets and unmovable air outlets of '0 75cm2 - section are replacing humidity-controlled exhaust grilles ·to be found in bathrooms and toilets. Curves on Figure 5 represent the total air renewal flows in the dwellings of the first four floors according to the outdoor temperature
4
3
2
1
L..
8 c::
. ... -·
A B c D
·~
Air -flow in m3/h --,~ .
FLG 5
_ .. -~.80 ______ 1)() ---.:-120 ----140----160 --1SO -·200 220 "':;,, .... : :} ~ .... '\ ;3
-ill .J .. : J , ... . ...._

.....
::i
(Te) and taking into account an average wind velocity of 4 m/s. These curves correspond to an average of 3 occupants per dwelling. ·Results as per the humidity-controlled solution remain within the dark area A of the graph when Te varies from -7°C up to '4-13°C. With the r eference solution, the airflows remain identical . to the humidi t y-con t rolled solution when Te = l3°C but they increase as soon as the outdoor temperature gets colder and thus correspond to the respecti ve values of curves B, C, D when Te indicates 6,5°C, 0°C, -7°C. Whereas with the humidity-controlled solution, the average air flow remains at a value of around 100 m3/h, whatever the outdoor temperature is. This value goes up from 100 · m3/h to around 170 m3/h with the reference solution when Te goes from 13°C down to -7°C, which causes an unnecessary· increase of heat losses. With the humidity-controlled solution, air flows go up from 90 to 120 m3/h, from the fourth floor down to the first one, whatever Te is; they go up from 140 m3/h to 210 m3/h with the reference solution when Te = . -7°C, which or i ginates heat losses imbalances .
On Figure 6 is shown .the adequation to the needs when using humidity-controlled natural ventilation with an outdoor temperature of 6°C. The continuous lines represent the results. obtained in dwellings of 3 occupants each. As for the broken ones, the dwellings of the first and third floors are occupied by one person; those of :the second and fourth floors are occupied. by 5 persons. On the third floor there can be seen that the air flow goes from 100 m3/h with three occupants down to 70 m3/h ·with only one oc;upant · and that on the fourth · floor, the air flow automatically goes up from 90 m3/h with three occupants to 110 m3/h with five occupants.
... ,-·
- ....... ,~ ;:;~ -1
4
3
2
'-0 0 -u..
:
.,,. .c_
.·
. .,,. .,,.
---
.. l
: f
/
.-!',~: ~ .. ~ •' ,,..,, ... .. . - . 4~ ~-h;..--..,,.
;,. / ' //
;'
,,,. ....
f F : ti '}
·.7 ~
ri' _, ;~~l FIG.6
......... ·-·· Air .flow in m3/h 1
..... .sAJ<.-1 .._:._._ ...... ---· -· ,.,..~ ...
' .i..).~
,. , .. · · -~~~~~ • ."'\&, c., •. ·~ . : ·•. "~ A ...... , , "' ~
so 60 so 100 120 140
.
.···. I

r
I
#; . • , .
( .. ".
DEMAND CONTROLLED VENTILATION SYSTEMS IN THREE FINNISH DEMONSTRATION DWELLING HOUSES
ABSTRACT
M. Luoma, J. Laine, R. Kohonen Technical Research Centre of Finland Laboratory of Heating ad Ventilation
Espoo, Finland
In this study the multifamily demonstration buildings with demand controlled ventilation systems are discussed. Furthermore, the heating systems together with demand controlled ventilation are looked at.
There are given examples of the centralized supply and exhaust ventilation system, the centralized exhaust ventilation system and the apartment based ventilation system. All the systems are mechanical, natural ventilation is not discussed here. In cold climates natural ventilation, i.e. opening of the windows, can't meet the requirements on good indoor air quality and thermal comfort and leads to poor energy economy. ·
INTRODUCTION
II 10
The air exchange rate of smaller flats dimensioned according to the Finnish Building Code can become unnecessary big. Correspondingly the ventilation rate of some rooms of bigger flats can be insufficient. In such rooms, where the impurity loads . vary plenty (i.e. kitchen and bathroom), ventilation can be unnecessary big for the most of the time, · but however insufficient in the loading situation. , .
. ·· -
In the national research project _concerning residential ventilation the aim · was to .develope ventilation systems, where the occupant · has·· the. possibility to control the air flows according to his own needs (1) .
First, the needed air .flows in different rooms were determined with so called .Monte c'arlo -method (2) on the basis of impurity loads and criteria of accept~ble levels found in the literature . . · · As a . result . the appropriate range of air flows for different rooms and loading situations were got. · .·, . . . o . . . . . ' . ,. In the project the flow technical characteristics of the ventilation systems with variable air flows .were developed, .. too. The aim was to control the air flow rates and p~essure differences both in the basic _and in the loading situation .. ; ~r
·- ,) , ~ • ;. I '
Three categories of ventilation systems for blocks of flats were examined: centralized mechanical supply and exhaust
RANK XEROX COMMUN/CA TIE SERVICE .

: ~
ventilation system; centralized mechanical exhaust ventilation system and apartment based ventilation system. Each ventilation system is presumed to incorporate functional components as: ventilation unit, ductwork, flow controller, terminal devices and control unit.
The increase in the air flows can be achieved either by increasing the total air flow of the apartment or by concentrating the air flow rate of the apartment partially to the desired space. In the paper, the first way is discussed.
Heating of the rooms in a block of flats is usually done with a separate network, i.e. radiator heating system. The behaviour of the room air temperature in the case of increasing the air flows is studied· by calculations. In the mechanical supply and exhaust ventilation system the decrease in the room air temperature can be avoided with the appropriate temperature of the supply air. In the mechanical exhaust ventilation system, where the supply air is unheated, draught problems occur easily. This limits the maximum amount of the increased air flow (3) .
In this paper, the accomplishment of demand controlled ventilation systems is .handled by three examples of demonstration objects,. where the results of the calculations have been: applied. Also the heating system in these objectives'is presented.
CENTRALIZED MECHANICAL SUPPLY AND EXHAUST VENTILATION -~. :
Ventilation , .
In the centralized mechanical ·supply and exhaust ventilation system, there is· a. ventilation unit equipped with heat recovery at the top of the building. The ventilation unit serves several flats. Two supply . air duct ·enters : and one exhaust air duct leaves the apartment for the ventilat i on unit (Figure 1) . ·. ·The s.upply air terminal devices are mounted to bed and living rooms ' and correspondingl y· the exhaust aii terminal devices in the kitchen,: bathroom, toilet, cloak room and sauna.
In order to keep the pressure losses small in the ductwork, the velocities · in the ducts should not exceed the following values ( 4) : ··main duct 4 ml s, branch · duct 3 rn/ s and stub duct 2 m/s. The pressure differential of the terminal devices has to be sufficient (50~100 Pa) and their pressure differential has to form at least · half of the -total pressure loss of the · ductwork.
~ ..:.. . -~ .J •
The desired pressure level' of the ductwork is · · achie~ed by a · constant pressure:adjustment at the~ central ventilation unit. Constant pressure· is kept in the exhaust duct i As the increase in the exhaust air is not big, the supply air flow is kept constant (5).· ·~~J ' - · · ·· · "--. :., . ... _c, .
• _, j ' . ...., ~ . ... ., , • ;,a .0 . •.:t J .... : .. ,,
,,_,·~···"'~ • 4 • 4 . • ·~ ·. --,,. : ... \ "' i ~ ~ :".{\ .... ~ .... -· ' , .:.- .... \ ~
.; •

.. 1
[
:::':· In the demonstration object (Figure 1) that kind of centralized ventilation unit is . located on the top of the building. A constant pressure of 100 Pa is hold in the ducts. The ratio between supply and exhaust air is 0. 8. The occupants are able to increase the air flows in the kitchen and wc. The hollows in the hollow core slabs and elements are used as air ducts.
I ·> -.
.·· . ...
Heating
The exploitation of the building mass for storage of energy as a part of the heating and ventilation system is profitable when combined radiation and ventilation heating is used. The building mass can be heat accumulated by preheating the supply air led into the hollow core structures or by installing electrical heating cables into the hollows. A room-based air terminal device heats the supply air and controls the indoor air temperature (6).
6 ~~
I ~ ~
, . ..
. .~ · .!
·- - -.. ·:-~ :-·· - .
V' SuPl?ly air and heating zone
~ Piping zone
(/ Exhaust air zone · O Supply air and
heating zone · .. _
FIGURE 1. A demonstration building ical supply and. exhaust ventilation
_.. " t ;:.~ 1 :f~· ·: : .:..:~-: wi th central i zed
-~ ..... · ~-::>'/. system. ~ . ..,~~,r,.-' .r
~::-... ~
mechan-
:,,: 1
Monitoring ; ...... ·. ~ --1 J
:; ._.
The ventilation unit and terminal devices a~e t~sted in labo-: ratory. The · operation of the ventilation and heating system is tested under the building phase. . , , ,
• . !
The house will be completed by March 1991 and >the monitoring of one year lenght will start after that. The automatized monitoring_inc).udes the monitoring of temperatures,.-air. -flows, ~r~~~ur~ differentials and use of electricity.
-j .::,~~-~~· ;.:J'f!f: ·. · : ; : .~---~~~~~i1C!~t;.;1b .'\ . .;:, '_} _-.: .. .' . -
Th~ iesults will show how electrically heated~brock~of .flats · operates energy economically and in other res~ects.
u~~~- ~~l~:.~!~tJ.< ... ~ .~:. , )..: . .-1~ -::. ~6 ::c~f. .. , ... ~o J" 1 '. r--
J~i-~~k~~~ ,;~;: ~ ..... -:/ , ~~bi~~E . 3.1:.l·::. -., :J ... · ·_ :1$~l'~~l ·1~ !las~ ::;!:.: .: -
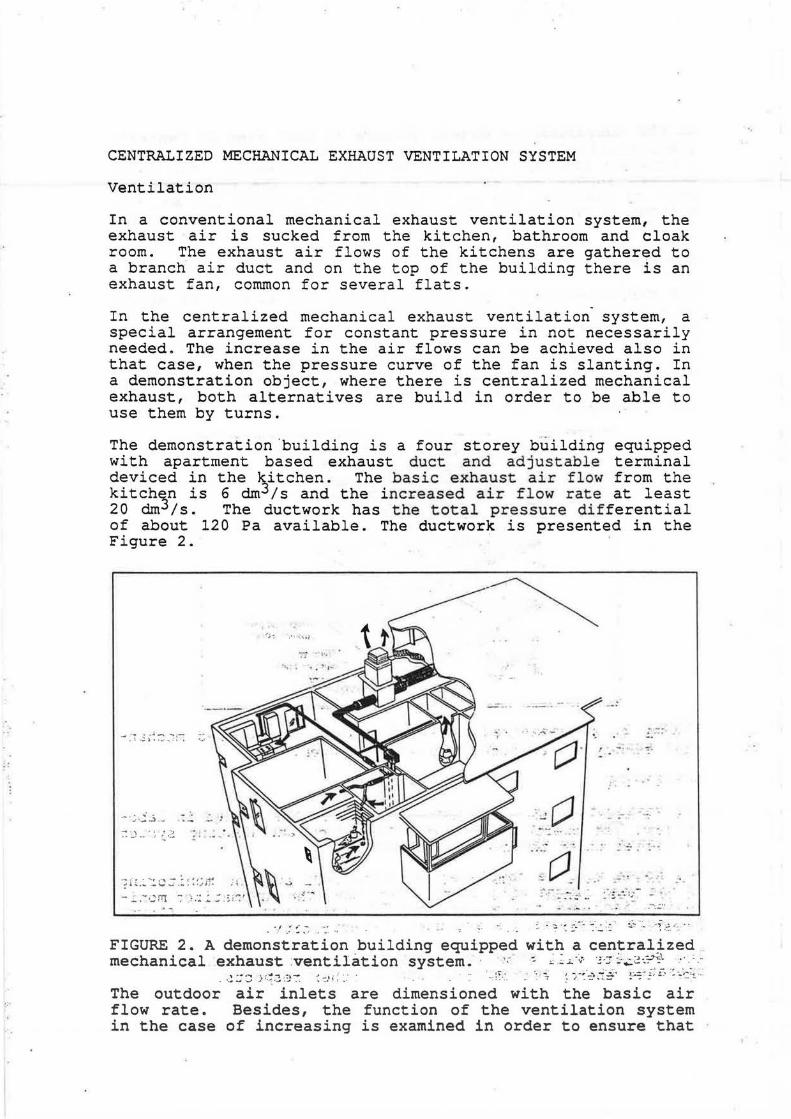
.;
CENTRALIZED MECHANICAL EXHAUST VENTILATION SYSTEM
Ventilation
In a conventional mechanical exhaust ventilation system, the exhaust air is sucked from the kitchen, bathroom and cloak room. The exhaust air flows of the kitchens are gathered to a branch air duct and on the top of the building there is an exhaust fan, common for several flats.
In the centralized mechanical exhaust ventilation system, a special arrangement for constant pressure in not necessarily needed . The increase in the air flows can be achieved also in that case, when the pressure curve of the fan is slanting. In a demonstration object, where there is centralized mechanical exhaust, both alternatives are build in order to be able to use them by turns.
The demonstration ·building is a four storey building equipped with apartment based exhaust duct and adj us t able terminal deviced in the kitchen. The bas i c e xhaust a ir f low from the kitch~n is 6 ctrn3/s and the increased air flow r at e at least 20 drn /s. The ductwork has the total pressure di fferential of about 120 Pa available. The ductwork is presented in the Figure 2. ·
,.~~ :' ·:iii
;; • I'.
.....
- .-! _,; i: ~ -~r-:
- . _:. ,_; _j ..... - •
-:-: :J -- ,: .:·~ -·
"?fL~ ~~c.:-.: '. :~;.j-r. ~:l
- .: .~crn .... -~:~ ~: : ~;::'
.,, ~· ~:
·~
.... Cl
,-... .
, :-- · ... ,.~ -=-
· -..::. .. - ........
:...-· !. ~ ·:97 ·: - . .4 -: ~-:=·· .. .. ~ .._:.· :~ - .. .
.-...::r
. ~ -~ =~-:- ~-- .: :: =-~ ··- -~ :::. ,._ FIGURE 2. A demonstration building equipped with a centralized mechanical exhaust :ventilation system. · ·; ~ . . ~ ~..i...·~r- ~ ·:r ~·.o.:.·::~~~~ , ·.· _' ··
_ -.!:::.:: ) i.:.:;:~-:-: ~-=.i; :· _: .. :r.-. · -~-;. ~- ") -~~ :.:. ~· ~.:..:;-~ ~ : ~~ · --~'-=~ ·--
The outdoor air inlets are dimensioned with the basic air flow rate. Besides, the function of the ventilation system in the case of increasing is examined in order to ensure that

I I {
~ ... .
. -.. ~ I(~;'·
the pressure differential over the building envelope do not exceed 30 Pa. ·
Heating
The heating of the building is done by a traditional radiator network. The heating system is dimensioned with the maximum air flow rate .
. Monitoring
The critical component of this system is the kitchen hood, which will be tested in laboratory.
The house will be ready in March 1990 and monitoring will start after that. The operation of the ventilation system is monitored during one years period. The exhaust air flows, temperatures and sound levels will be measured in different situations and also occupant enquiries will be made.
If the ductwork works well without the constant pressure arrangement, there are good prequisities to begin to build blocks of flats equipped with the demand controlled ventilation with only small changes to the prevailing way of building.
APARTMENT BASED VENTILATION SYSTEMS
Ventilation -· .
In · the apartment based ventilation system, every apartment has a ventilation unit equipped with heat recovery. The -ventilation ·unit is located usually in the bathroom or kitchen.
In Finland used apartment based ventilation systems the occu~ pant has already today the possibility to vary the air flow according to his _: own -needs. : - ~The purpose have been achieved by ~?e- me_ans . _o; several , rotational speeds .on the fan. - - -- :
.. . ·- -: .:· :..: Heating ·:, : ... .. ... ~ ... - .... ·..:. ..... - - . -
Usually there is· · a: radiator heating network separate from the apartment _based --:ventilation -system. If_· the apartment based ventilation system is used also to heating,.the supply air is heated nowadays by electricity in Finland. In the demonstration object the heating coil for the supply air will be connected to the radiator he~_:ting network. ·- . - -- -- :. :~·- . ...
Mon~~or~r:ig .... . . ~· ,;-::.. : 1 ~ •
The ~ st'u'd~f° ". includes the designing. and:.~~-~king .the components. The-· .. :components - will : be tested in laboratory. - In the -- first step~ · the system will be tested in a pilot house during the heating season .

·'
The results will show, wheather an alternative heating system for block of flats can be developed.
SUMMARY
Because the impurity loads in residencies vary, a demand controlled ventilation system is needed. In this study general principles of the accomplishment of ventilation systems with variable air flows have been studied. The goal in the national R&D work is to get well functioning tested solutions which are ready to larger use in the country.
The accomplishment in three demonstration objects have been presented. The first of them is an electrically heated building with mechanical supply and exhaust ventilation system. That kind of system needs arrangement for constant pressure, when the air flows are increased.
A demonst rat ion building wi th mechanical exhaust ventilation system is not far away f rom the prevailing way of building, though the possibi l ity of increasi ng the exhaust air flow in the kitchen makes ~he ventilation system more modern.
Apartment based ventilation systems are also under development. In the demonstration project, the aim is to heat the supply air besides by the heat recovery, also by radiator heating.
In the previous demonstration projects, the target of the project sometimes haven't been achieved, because the system hasn't operated properly. In these new demonstration projects, the critical components are tested in laboratory and the operation of the systems are tested under the building phase.
REFERENCES
( 1) Luoma, M., Kohonen, R., A ventilation concept -for futur·e· dwelling houses . . :- .:9th ... AIVC Conference, Belgium, 12-15. 9 .1988. Proceedings, Vol . l. p.329-342.
(2) Saari, M., Determination of air exchange rates for demand controlled ventilation. An abstract submitted to the 11th AIVC Conference,· Italy, 18-21. 9 .1990. -
( 3) Haikarainen, ·· J. , ·· Room air temperature control in · demand controlled ventilation. An abstract submitted to the 11th AIVC Conference, .Italy, .18-21.9.1990. · . ___ ;,
(4) Laine, J., _Demand controlled air · ductwork. : 10th AIVC Conference, Finland, 25-28.9.1989, Preprints Vol.2.· p.333-347.
(5) Luoma, M., Demand controlled ventilation systems for dwelling houses, Indoor Air '90, 29.7-3.8.1990, Canada . ..
(6) Laine, J., EBES-integrated HVAC and building system. 13th . : IABSE Congress, Finland, 6-10. 6 .1988, Post Congres's Report, ·:- · p . 19 0-191 . 7 . : . . ·" .. . .
- : ~. : . ::-. ·::,:.'!.

I
:-:.
: ::\
II 11
AN EXPERT SYSTEM FOR THE DESIGN OF VENTILATION SYSTEMS
ABSTRACT
Hiroshi Matsumoto Toyohashi University of Technology,
Toyohashi 440,Japan
Yasuo Utsumi Miyagi National College of Technology,
Natori 981-12,Japan
This paper describes a prototype of expert system for the design of ventilation systems, which applies the fuzzy theory to control the carbon dioxide concentration in relatively small buildings and dwellings. This prototype is formulated as a nonlinear constrained optimization problem, coded by PROLOG and FORTRAN77 and operated in a micro-computer, and has a subprogram for ventilation calculation besides ordinary components of expert system. The consultations in the case of two rooms with a central ventilation system gives the optimum parameters to maintain the indoor air quality within a specified range, after several iterations. Data acquisition and presentation, linking subprogram, and further development. are also discussed.
INTRODUCTION
Most of the codes for the ventilation calculation difficult for users to utilize on the design stage(l). the final objective to develop the expert system to Intelligence (AI) is applied, to help the designers to ventilation~
·· i ·
in buildings are This research has
which Artificial plan the building
Existing systems for ventilation planning may be divided into two types. One is the modular structured program which has many modules 'of ventilation calculation, e.g. data input/output, calculation __ of ventilation rate, etc. and the administration part to operate all modules. This system can use the existing program as a library. COMIS(2,3) is one of the cases. The other is a program that has the function which can present the expertise, which is one of the functions of expert system. Some prototypes have been developed in the area of moisture problem(4,5) and the control of energy flow in buildings(6,7).
The system to aid the ventilation planning should be not only able to calculate the ventilation rate but also user-friendly for non-specialist users. Some requisites can be specified as follows, considering so-called conventional programs~ ' ·.· l)Data input: Interactive data input, CAD-input with graphics, and default values are · easy for users to use. ' '· • ~ . •• ~ ' ~ !
2)'Ventilation calculation: The algorithm of ventilation calculation has to be efficient.. · : .. · - ·· · J ·
3)Result output: ·The explanation function of·the result, its 'limitation, and the technical . terms makes the system user-friendly. ' · • •~~ . · :" ·' ''·- o;
R<!NI< 'JfJ:RnY ,.,.,uul/Nlr.LIT"tr: <!'l:.,,,,,..r:

.: ~
4)Recalculation: The user needs several recalculations with partly different input data in the planning process. S)System modification: For expanding and/or embedding the system, the transportability between different systems is needed. 6)Availability of expertise: Expertise is useful to solve the problem in practical means, but the subjective and ambiguous knowledges should be stated clearly. ?)Data base: The default values and the expertise may be stored in the data base with a certain structure.
DESIGN OF VENTILhTION SYSTEMS
The procedure of conventional method to design ventilation systems is generally as follows. At first production rates of contaminants generated in each room are estimated, and ventilation requirements are determined according to their purposes of rooms. Then the rough structure of the ventilation system, such as kind of fans, ductworks and so on, is decided. The next stage is to design it in detail for ductworks, e.g. using the equal friction method, the static regain method and so on. In practice the trial and error method is used in design stage.
The design method described above is enough, as far as mutual ventilation among rooms are ignored, and climate conditions, e.g. wind direction, wind speed and outdoor temperature, are steady. But for the ·case of the residences with several rooms where mutual ventilations can not be ignored, the ventilation models with higher accuracy should be used. Namely the design should be formulated as the optimization problem to minimize the initial costs and running costs and to realize high indoor air quality. In this paper the optimization problem is to obtain appropriate fan size and resistances of each duct _to maintain the prescribed carbon dioxide concentration in rooms, a objective function, at a certain level.
In general basic equations of ventilation model dealed with natural and mechanical ventilation in a multi-room are given as follows:
F ( p, q I~ , f . ) =O - l.
(1)
·-G(q)=O
• I :• ~: (2)
H(q,C)=O ( 3)
where p is the static pressure in rooms, q is the ventilation rates, ~ is the total , resistance coefficient, f. is the kind of fans and C · is the carbon dioxide concentration. A cofistraint is stated as an equation V<Vmax, 'where ,V is the air velocity in ducts and Vmax is the limitation air of velocity. . If ; ; it is possible to _ignore _-mutual and 'natural ventilation. in .. buildings, values of q are given from equation (3) , and then an appropriate fan is easily determined from ventilation rate q with equation (1). As this equation. set generally has · a greater number of unknowns than the number of equations, so that it is ~mpossible-to find unique solutions. Therefore the trial and error procedure should •be adopted to find optimum solutions of resistance coefficients and fan f. by evaluating . carbon . dioxide : concentration, . using - ventilatiofi s imula tioris: This paper .. describe& an expert system to support the above

r
!. " -.:: .
::=:-: procedure in stead of the conventional method, with using AI(artificial intelligence) method.
PROTOTYPE EXPERT SYSTEM FOR VENTILATION DESIGN
Basic Characteristics
There are many types of the expert system such as intelligent finding solution type, trial and error type and optimization type, and the suitable knowledge presentation for each type has been proposed(S). The present basic structure is expected to be developed to the complex trial and error type, which infers and modifies the parameters with using knowledge base in the practical stage and contains the intelligent finding solution type which makes the calculation model and simulates the ventilation.
Before making the full system which is time consuming to be completed, a small prototype which has basic functions is developed, because we can investigate the problems for further developing.
A prototype to be developed is expected to have the basic functions, such as: 1) The system is written as a stand alone program and can be executed at a 16-bit personal computer. The commercial developing tool is not used; 2) Data input is interactive at present, though the window and the mouse make the input much easier; 3) The knowledge is presented with production rule and/or frame, and should be easy to understand and edit; 4) The inference engine is written in Prolog or LISP, and has a forward chaining, fuzzy chaining or frame system; 5) The part of ventilation calculation "is written in FORTRAN or C, and the calculation result is linked as a file;
Architecture of the Prototype
. ~ ~ '
The prototype consists of user interface, inference engine,- knowledge base, ventilation calculation, and the data base as shown in Figure . 1 •
EXPERT
EDITOR
FIGURE 1.
USER
USER INTERFACE
INFERENCE ENGINE
;;
KNOWLEDGE . BASE
DATA BASE
• ~: .. ' •• : •• • ; • .-."' f :.• 1
~:: 1 :.'""
SIMULATION PROGRAM OF
VENTILATION SYSTEM
..: -:1 _ . "' ..
- .... - ~ .
·•
r - ~ .._~ -·=
·• - '
-- ------ -- ·· -
· r :~ .. . ! :~ t. • · .... .. -
! -:
The Structure of the Prototype ___ - _.::..:...._.--~-=.:.:::- -
-

•,· .. !•
Knowledge base represents the expertise and data base which consists of the fixed data such as weather data, regulation, etc. All ·parts are written in Prolog except the ventilation calculation part written in FORTRAN77. As Prolog used here can not be linked with FORTRAN, the files are administrated by the batch file.
Knowledge Base
A method to select an appropriate fan and the rules in knowledge base to infer the optimum resistance coefficient of ducts to optimize the objective function, the prescribed carbon dioxide concentration in rooms, is described.
Appropriate production Resistance system to variables
fan is determined by a forward chaining system using rules considering the average carbon dioxide concentration. coefficients of each duct are estimated by a fuzzy chaining
maintain carbon dioxide concentration in each rooms. Control are inferred by using fuzzy control rules shown in Figure 2
NM
-0.Z5
-400 -zoo
-zoo .. -100 .
zo PM
0 O.Z5
0 200
PB PB:Positive Big PM:Positive Medium ZO:Zero NM:Negative Medium NB:Negative Big
0.5 A'
400 C* (ppm)
·'
• "': ,J "" "_.: . 'l"• ~~•.- I • - '..,.
0 . . 100 . . . ZOO AC (ppm) ' t-< :: --... " -, ~ - ! •• ' ' : - - : ' .·: .
:;.;~o~ ?::· ··:.;·~
.. ... - .. . .:-~ ~.. -; ~ ~~.::: ; .. ~ : ,-, .·; ' --. --~? ~ - -: :- :,:..-.. ! .. FIGURE 2. Five Triangular Fuzzy Numbers
TABLE 1. Fuzzy Control Rules
~c
ti.C NB NM ZO PM PB
I
NB NB NB NM z o~ 'io ·.-. ;- ..... '
NM NB NM NM z o ~z o C* zo NM NM ZO PM-7PM
PM zo zo PM PM .PB PB zo zo PM PB PB
... . .
>
.. ·- --~ .;·_::...- ~ ...... - ::--......... ' ...
---._--~ -. -: ~- 1
--:---!"""'."'·-~ , . . , _____ .....,...
C* :- the difference ·between , -::_[.._._. Copt(prescri~ '~lue) ~ ·
=-- - .. ·.·-:"" - --· .-. ~ : ; · ·' .
···- ·,-.: ·.··· - ·-·
1 ~. - • - - -
'.: ~: 0
•• and c .. :~C :.;. : : ... :·-~_:.re~ >:,-;::-,"
~ C : the difference between
j' I
. \ . .. 1 · the previoU.S ·value 'of C :.~-- . : ~· . - . . - - '• ... . ,., . t: ~-· , ·----__ __:
· ·:--- and the present one · : ··-. --·- -.- ··~ . ~ ~~ .•. -.. -··--:~'
ti. C : the modified parameter ~ ...:·:~ :o. ~~J ~.-~.- -~-;-~~:~ oo!.--ir·~ .~.; {~ ;~ .:: -~

and Table 1. In this table and figure C* is the difference between the prescribed value Capt and the calculated value C, and t:.c is the difference between the previous value and the P!esent one of carbon dioxide ·concentration in rooms. If modified parameters are obtained by a fuzzy chaining, new resistance coefficient is given by:
l; I = ( 1 - a* D.l; ) * l; ( 4)
where a is the accelerated coefficient, 6l; is the modified parameter. The triangular fuzzy numbers are used as a membership function to determine modified parameters using fuzzy control rules.
An Example of Consultation
The model of ventilation calculation and some constants are Figure 3. The model has two rooms and a ventilation system. The rate and the duct resistance are controlled by the inference in set the carbon dioxide concentration of two rooms within the values.
shown in fan flow order to accepted
The wind pressure is specified by a certain meteorological condition and the generation rates of carbon dioxide in rooms are fixed. The rules to estimate fan size are written by production rules in first step, and the fuzzy control rules are used to determine duct resistances in next step. For example if C*=300ppm and t:.C=SO ppm, modified parameter t:.r; =o.2699 is given by fuzzy rules as:
if "C* is PM" and "f:.C is ZO" then "t:.r; is PM"
if "C* is PM" and "f:.C is PM" then "tll; is PM" ..
. ,. if "C* is PB" and "Cle is zo" then "t:.i; ·is PM"
if "C* is PB" and "f:.C is PM" then "M; is PB" .. .....
The . consultation. ~esu.~ ~s are shown in. Table 2: ~ In . the table r; 1 ~s the (' .. -:. resistance · coef~i~=~~= ~ · ~f .due\ 1 ~ r; 2 is _7~a·~;L.~~ .. ~~=~ct 2.~ _An~ .. c1 ,_ .is the
i ··::=:: '
''. ! :::. :: ..... . ., _ ~: -. ._ ; ' !
duct resistance Cl
-uJJ . - ~ :-:: ~ --n . .- , R~m i . ... · LJ ·· e1
. - ~ .
: . :· .• _i. • .. ·•-i!' _:~· - .:::~·:~ ::
·-..... :C'.'.:• ., -: · i: ::,-: ·. •o•-..... ,-•• 'I
outdoor tetlp. : e o=-0. 5 "C .... : ·1 '.temp. of room 1 : e 1=15 "C -.::• temp. of rem 2 : e 2=20 "C
1 - · - ' •• wind-veioci~ :V=3 mis -. : c~ generat.ion rate ...
.. V ·· · -~·- .: · of roe. 1· :O. 045 m3 /h • •wwn · c°'2 gen~ration ·rate · ·
e 0 ... - _-:_ : .;: - . of l'OOll 2 : o. 015 m3 /h - · ·;; -~··:-:.! ·area of openuigs:o.002 m.2
•ind pre.ssure - · . "··:~:·:eoefficient :Cwl=.:o. 4 .. .. ..... ... "Cw2=0 7
• ..:; :-:: .. -I:... . '. ·. ·. , i: '. ; ~ : ~ ~. • · -~ • , 1 '"?. + _ "~:. ! ~ - , ·: .. .-'; . ,~·· .. ·: L. t!'!'-., ~ ." : \ ~ ... ~ . ... ':.i.} ··. -;~:-> ~~A:!!~~'. -r~· ·~ ~'i :. : . · _ :~iJ_;~t.1 ' • :
FIGURE 3. The Model of Ventilation '. r;;~rr:. ~;1"m..:!.{!J~,

.. :,,,··:
TABLE 2. Consultation Results
No. Init. t,: 1 Init. t.: 2 t;:' l.:1 l.:2 C1 (ppm) C2(ppm) Iterations
1 2 2 (1-6 t;: )*' 3.97 31. 96 790. 8 755.0 21 2 2 20 (1-61=)*1= 2.89 29. 42 760.4 750. 7 6 3 2 2 (1-2*61=)*1= 3.59 31. 98 779;6 756.1 15 . 4 2 20 (1-2*L'.l ')* ~ 2.99 29.90 763.2 751. 8 3
carbon dioxide concentration of room 1, c2
is that of room 2. The iteration number depends on the initial values of duct resistance coefficient and the correction equation of the coefficient. All the cases can succeed to keep the carbon dioxide concentration in the region of 750-850 ppm.
CONCLUSION
The prototype has shown that the two steps of inference determine the optimum parameters of the ventilation system after several iterations, where the first step gives the fan size and the second step applies the fuzzy theory to estimate the correction of the duct resistance coefficients. Especially the applicat1ory of fuzzy theory is expected to allow us to control indoor air quality .with considering the sense · of human-beings, that is sometimes ambiguous. For a further· development, the system may need the user interface such as the mouse and the window.
REFERENCES -"'
(1) Feustel:H~E~~-"and _..Ke.ndon,v.M;, Infiit~ation Models for Multicellular ··· Structure~: '- A Literature Review, Energy and Buildings, · Vol.8 (1985)
(2) COMIS Workshop, COMIS newsletter #5, Energy Performance of Buildings Group, Lawrence Berke~ley Labora~ory (1988) .:.:....= ·'~·:""'
(3) COMIS Workshop, COMIS Review, Energy Performance of Buildings Group, -·Lawrence Berkeley :Laboratory -C 1989) - - · · ·-~-- ~ .-· ·_ ~~·- . · ·~--
( 4" Persily I " A.K. ,. ' A ;Pirototype - EXpert• -Sy-;.t~-;-· ·-·f(;~- . oi~g~osing Moisture Problems :·in :Houses, Proceedings of .8th AIVC 1::onference, : :·.vol.8, air Infiltrati.on and Ventilation Centre ( 1987), 198-218 · ·
( 5) Trethowen, H.A., ~ Outline of DAMP - A-KBS Diagnostic. System,· Proceedings ·_-of 8.th .. AIVC - ~onference , vol.8, air Infiltration and Ventilati-on Centr_e· ] 1987), .~4 .1-24 .-2 -=~~- · i ·: ::.~ .;1 • : ::.;c:. -' 1 •• : •
- · · ... .J.•y •• ,\ ~ . • ~ '
(6) Haberl,J.S • . & Claridge,D.E., An Expert System for Building ,Energy
•.•.
· Consumptfon-~.~Arialysis Prototype Results, ASHRAE' Transaction, -·'-'vol. l, (1987); .. 979.:998, ;~ :.: '.: . -- ~ ~':.::· .. .. ·r. ': .. ;: ··. ,•,)
(7) Haberl. J.s.-;"' ·coOriey, K.P., and .s~en, .~E.D., ·~An . Expert __ system ._for • • • ~ ·· • , . ... , -..!I . • ..... · . . r~ . ,,,... '-6' ~ .... ,.. ... 1J· _..
Building "'Energy ·consumption ,. · Analysis;,·'.·Applications · _at-~a University Campus'~ ASHRAE Transaction, ·vaL·1· ( 1988) I .. 1037-1062 r ·"r·:J ... ......... ,._,
(8) S.Akagi, System Design using AI Technique, Corona Publishing (in Japanese) (1988) · _. .. ,;:L.~.-:.~.:i ' · '- .·.+1 .. ·: .. ~· .::;- -
. -·· -. ·--.

(
r
I
1:
BREFAN - A DIAGNOSTIC TOOL TO ASSESS THE ENVELOPE AIR LEAKINESS OF LARGE Bun.DINGS
ABSTRACT
M D A E S Perera and R G Tull Building Research Establishment
Gamon, Walford. Hcrts., WD2 7JR,
U.K.
A major factor in the ventilation of buildings and their energy perfonnaoce is the leakiness of the building envelope. In some circumstances, this adventitious leakage through the building fabric is a source of excessive ventilation which can lead to energy waste and, in some cases, to discomfort.
The air leakiness of the building envelope can be determined by carrying out whole-building leakage tests. BREFAN is a fan 'pressurisatioo' rig designed for such tests in most non-domestic buildings. The measurements so obtained can be used to quantify the variation of air leakage through the fabric as a functioo of the applied pteSSure diffeieotial across the envelope. A 'leakage' index can also be evaluated and used as a diagnostic measure of the constructional quality of the external fabric.
This paper gives results from field measurements in five large buildings in the UK. Measurements in two office buildings show that the extemal envelope of one specifically designed and constructed as a low-energy office (LEO}, is twice as tight as the other built in a more conventional manner. Comparison with buildings tested in North America shows that the LEO is as tight as those.
Measuremems in two old, industrial 'hangar' buildings me compared with one built within the last decade under current UK Building Regulations. Although the leakage index shows the new building to be only half as leaky as the old, comparison with tight Swedish industrial buildings shows that a further fivefold reduction is possible.
Finally, tests in a large Law Court building are briefly described to show bow BREF AN can be used as a diagnostic tool in a more qualitative manner. By depresswising the building, a possible cause for complaints of imufficieot internal beating during cold weather was traced to excessive air leakage through the roof.
{ ~
.. ··:
INTRODUCTION
Adequate ventilation is essential for the health, safety and comfort of the occupants of buildings, but excessive ventilation leads to energy waste and, in some cases, to discomfort. In naturally ventilated buildings, air enters either through purpose-built openings like windows or by uncontrolled leakage (infiltration) through aacks and gaps in the building envelope. It is necessary to have the means to quantify this overall leakage, either to assess the effectiveness of any iemedial meamre (like draugblstripping) in a
II 12
problem building or to wmue the quality of a new one. ·' 1!; · ' ''.)t .. ,.
The Building Research Establishment (BRB) bu developed BREFAN (1), a multi-fan pressurisation syst.eai · designed to quantify the envelope leakage of most large non-domestic buildings like offices and single-celled industrial buildings. The lea.Iciness of the envelope is quantified by sealing ID appropriate nmn~ of these fan units into ID outside doorway and measuring the air flow requUed to rilaintain a set of pressure differences across the building envelope.
RANK XEROX COMMUN/CATIE SERVICE

..
This paper presents results from field measurements in five large UK buildings. Of these, measurements in two office buildings are given to highlight the difference in envelope leakage between a conventional building and one built specifically as a low-energy office. ~Cbe leakiness of bo.tb is then compared with North American office buildings. ·
Measurements from two conventional and older hangar-type industrial buildings are compared with newer buildings built under current UK building regulations. They are also compared with tight Swedish buildings of similar type to indicate the limits to which buildings can be tightened using available construction techniques.
BREFAN can also be used as a tool to qualitatively diagnose and identify individu!ll portions of the building's fabric which are leakier than others. Qualitative as well as quantitative tests in a newly-built law court complex are described.
BREFAN SYSTEM
The system consists of a number of identical fan pressurisation units. Each unit is fully portable and the 762 mm diameter fans are powered from conventional 13 A sockets. Single-phase to three-phase speed coottollers are med which stabilise the fan speeds when m<R than one fan unit is being used. Bach fan is capable of providing a flow rate of S.5 m3 /s against a building envelope presswe difference of SO Pa. Airflow through each fan is meas~d using a conical inlet designed to British Standard BS 848 (2). 'Ibe number of fans used at any time in a building is determined by both tbe leakiness of the building and the maximum pressure difference required between the inside and the outside.
METIIOD OF TESTING AND ANALYSIS
Flexible ducting is used to connect the fan units to 'false' plywood door panels temporarily sealed (Fig 1) into external doorways. It is necessary to keep all outside doon and windows shut and all internal doors open. Tests must be carried out when the outside wind speed is very low. The fans can be manged to either pressurise or depiessurise the building. Flow rates Q m3 /s through the fans are meUured (2) by the conical inlet over a suitable range of building pressure differem:ials, .4P Pa.
Best-fit power-law profiles of the form, ~
Q •KAP- ~; ~~ -~ 'l .
where the coefficient K and the exponent n (0.5 < n <1.0) are comtams, are fitted to the data by transforming the above equation to the fonn, ..,,. .
log,,(Q) • log,,(K) + n log,,(.41')
and fitting a linear regxession line on die tnnsfonned variables. .. .. It is sometimes necessary to compare 1be envelope leakage c:baractmistic:s between buildinp of different · shapes and sizes. Tbe air flow nre ~ (at a specified pressure differential .41') per unit penneable external surface area S of the building has been shown (1) to be a meuure of the coostn1ctiooal quality of the ·· ~
building fabric with respect to air leakage. Although this index is usually evaluated at a 50 Pa pressure differential (3) for dwellings, a lower wget pressure of 2S Pa is used for larger non-domestic buildinp (1).
-.; . ;; ; ~
• I
•: i· :

·:::
!· : :··
fintl: ·~
FIGURE 1. BREFAN fans installed in the LEO building
FIELD MEASUREMENTS
Office buildings
BREFAN pressure tests were carried out in two medimn-sized office buildings at the BRE site in GaISton. One of these is a well-insulated three-storey 'low-energy' office (LEO) incorporating a number of energy saving features. It was mechanically ventilated but the ventilation system is currently disabled to enable assessment of a particular heating system ( 4 ). The building volume is estimated as 5315 m3 and the external surface area at 1750 m1
• The second is a more conventional, naturally ventilated office with estimated volume 6254 m3 and surface area 2195 m1
• Full details of both buildings are given elsewhere (5).
The resulting airflow rates were plotted against the applied pressure differential across the outside wall envelopes for the two buildings together with best-fit power law profiles. Values of 0.412 and 1.388 m3/s per Pa0 for the coefficient K together with 0.58 and 0.51 for the exponent n were obtained for the LEO and conventional building respectively (1,5). With these values, calculations show that at 25 Pa, the LEO building is more than twice as tight as the conventional office building.
Single-celled industrial buildings
BREFAN was used for whole-building pressure tests on a 25-year-old 'hangar' building (known in the UK as a 'Marston' shed) at the BRE site in GaIStoo. The roof and walls of the 4690 m' building are externally clad with corrugated asbestos cement sheeting and lined intemally with plasterboard. The permeable area of the building was estimated as 1400 m2
• Best-fit power law profiles on the measured data (1) gave a coefficient of 2.041 m'/s per Pa" and an exponent of 0.64.
A 35-year-old industrial building in Wales was also pressure tested. The 4955 m' building, of mas;~ coostructioo, bad a permeable external area of 1694 m1
• Best-fit power law profiles gave a coefficient of

3.936 m3/s per Pa" and an exponent of 0.52. The leakage rates Quo (at a pressure differential M') for these two buildings are approximately equal.
Law-court building
Recently, BREFAN was used as a qualitative tool to identify major air leakage routes in the extemal envelope of a Law Coon building. Staff dissatisfaction bad been expressed because some areas were either too bot or too cold, usually depending on the outside air tempemture. ·
This Court is a modem. multicelled, 18000 m3 building with an envelope area of 4750 m1 and is mechanically ventilated With all these ventilation openings to the outside sealed off, BREFAN was used to depressurise the building. With a uniform pressure differential of 12 Pa (approximately equivalent to that setup by a S m/s wind) maintained across the envelope, major entry sites of the cold extemal air were localed simply by using smoke-tubes. It was found that most leakage into the building occmred through specific portions of the roof void with some secondary leakage through cracks along the top edge of most open.able windows.
A similar depressmisalion test to evaluate the overall leakiness of the building fabric was also carried out. During the test. there was no discemible wind. The outside air temperature was about 6•c while the intemal temperatwe was maintained at about 1 "18C iaultin1 in a background 'stack' presswe differential M>., between 2 to 3 Pa. In such instances, when the measuled piessure diffeientials have a steady background component induced either by wind or stack. it is necessary to correct the me.wed data before analysis.
To correct for M>.,, a theoretically-correct quadratic form (6),
MJ m = MJ,, + a.Q + b.Ql
where a and b are constants, was fitted to the measured pressure differential AP,,. and 0.ow rate, Q, dala. Since pressmu, unlike 0.ows, are additive (7), .iP,, can be subtmcted from AP m to give the resulting pressures induced by the fans. Figure 2 shows a plot of the coirected pressure vemJS air flow. A best-fit power law profile was fined to the data neglecting tboae below 1 Pa to minimise experimental fluctuations at the low values. A leakage coefficient of 2.35 m3/s per Pa• and an exponent of 0.77 weie evaluated..
COMPARISON OF ENVELOPE LEAKINESS ' .. , It is meful to compme the le•lciness of lbe buildings described here not only with one- mother but with buildings elsewhere. 'lbe leakage index evaluated at 2S Pa for all tbe9e buildinp is shown in Figure 3. It c:ao be seen that while the pmpose-built I.BO office with a leakage index of S..S m' /s per rr is nearly u tipt as a iepresentative sample of Notth American buildings (1), lbe mme conventional UK office is twice as leaky. The Coon building, ~ staff dissaeisfaoion had been exp1ewd regarding the intemal tbennal environment. could not be tested at 2S PL Extrapolation, however, indicates that this building bas an index of 21 m'/s per m1
, well in excess of values obtained with tbe other office buildinp It should be noted, however, this is indicative only since extrapolation (to 2S Pa) above the meumed region is stridly not valid unless ceJtain conditions ( 1) are meL
The old i.ndmtrial buildings Jive a Jealcage index in excess of 40 m3/s per m2• Compati.soo with lbe leakage
peiformance (1) of a newer one, built to cummt UK Building Replations Staodarm shows (Fi13) dw 1bis can be twice as tipL Compuison with the index obtained from measurements (8) in a relalively new Swedish industrial building shows (Fig 3) that tbeie is scope for further tigbteoing of the builc!in& envelope, ifm1uired.
• ::<r·r

. .. !"· · -
...... ·:·:
'<: :··.
1 4
1 3 l 1 2
0
• .. 11
; 10 ~ a.
g E . 8 "" 0
7 1 • • ../• • II -• 5
j • • 4 /-•• ·• • Cl
I • 3 • • -. .. c :. 2 1 • •
• • .. ,. I ~ • "
0 1• 0 2 4
Int/Ext pressure
FIGURE 2. Pressure test in the Law-Court building
=\.JI : ~ : .. -e -·· .... .. -
50
40
--.::~!Z-: ~ \,.' L: -. :~ .. • .... ;; so
)~:v...:.~-0: 1 .-:tf;1 ~.:...-
• • I ,., .. ,J • • . ~-· .. . .... .... . ·- .
. .,. .. - ··""""' ..... . -le ~~ - . . ; .- - ~--·:-........ ...... .
::i -... 0
~--u .;:, · : ··;.~..;
-. .- .,-:. ':. .. ~~::.L:· ~! . .t.
/_·.
• •/•
1 x p 1 r I me n t a I d at a
but ·I It I I n 1
I " . .
e 8 1 0
dlllerence (Pa)
Wei. h .. :: -
,i~·;r ·q
·::; .. "·.; ... .,_ ':: ·~~: :-../
- 0 · ... .. ~:. •;'1 ~..:L..t.; •· _,. ._.t .... - •
-l ·.4 ..., .. ... '"' -
• . .... 20
~.l ~G :-~~u-;~·'.t'-'- ~
... u
- ~-.:~l •• ··'· ''.10 ... ... a
.: . .{" .:::: 'Tl 0
c
• · :::L~ : : ~ ;,
D u
0 Ill ::
--~.· .... ;;: - ~: .. :.!· . .,.
• ... • • .. c ..• ... u ::i
01 I I Cl II I d g 1 .
. ,. .... -.
. ; ;~ •.! . "t:f'.!1 ... f •. . ... •
lndu1trl1I llldg1.
•. ;<~£-'J::. ! . ..........
. ! .. .. ' I.! ,,./,,
rr.~·,;
. ,, "
•; .-
'""".'1 >1 '1
·t.·:; . FIGURE 3. ·,j, •.Envelope leakage index of buildings :An.<>·: ··· ..

CONCLUSIONS
BREFAN is a fan pressurisation system designed to measure air le~g~ rat.es through the extemal fabric of most non-domestic buildings. Portability, flexibility and the ability to be powered from conventional mains electricity supplies are some of its design advantages. BREFAN tests in office and industrial buildings show bow to do the following:
(a) Characterise the air leakage through the building envelope as a function of the applied pressure differential across the fabric. (b) Obtain an index which is a measwe of the comtructiooal quality of the building fabric and use it to compare the relative leakiness of similar buildings. (c) Identify major air leakage paths in the building's fabric by depressurisiog the buildings.
ACKNOWLEDGEMENTS
Field measurements in two out of the three UK industrial buildings cited in this paper were carried out by University of Wales College of Cardiff under contract to the Building Research &tablislnnent
1be worlc described here bas been carried out as part of the research programme of the Building Research &tablisbment of the Depax1ment of the Environment and tbis paper is published by pennission of the D~tor.
REFERENCES
- -· 1. Perera. MD A E S and Tull, R G, Envelope le~ of large, natunlly ventilated buildings, Proceedings of the 1 Otb AIVC Conference, (1989). · - -- -- --- ----- - - - -- · -
2. British Standards Institute, Fans for general pmposes, Part 1. Methods of testing perfonnance, British Standard BS 848:Part 1:1980, London, BSI, (1980).
3. Wanen, PR and Webb, B C. Ventilation measurement in housing, Proceedings of CBSE Symposium on Natural Ventilation by Design, (1980). .;
> -·· 4. John, R W, W'lllis, ST P and Salvidge, A c;Tbe BRE low energy office~ feedback from performance in use, P!eaented at lbe CBSE Regional Meeting, (Marc:b 1990). -~ -- , •. S. Perera. M D A B S, Stepbent R IC and ~-R.i G, Use of BRBPAN to me1Sme tbe ailtigbtness of noa-domestic buildings, BR.B IP 6/89, (1989). ~§~} ;. : · -
•:! •; -~ -~~1· -: ; . -- ~ 6. Etheridge, D W, Cnct flow equadom and scale effect!, Building a11d Environment. Vol 12, pp 181-89, (1977). ·.1;.~J ; .: - ·- , <~
.· ..T..>l r."'j ~ ~· :: ·>~. " ~ 7. Sinden. F' W, Wmd, tempera111re and natural vem:ilad~ Energy. md Buildinp, Vol 1, pp 275-80, <1911ns>. ·.?. - • ,~ .... __ ·t~,. :_ - -*'" ~ · · ·'!"'- ·· .
... ' t ~ .) ·~·~ • '
8. t.nndio., L, Air leakage in indostDal buildings-"'.-:-:~ resUbi.-:-~g.,-Oi-die-4di- ·Aic· Conference, (1983).
....
r
I r
I I I
I
I
I · .. ·:.;:::
·:.
('·
VENTILATION ASPECTS OF A LOW ENERGY HOUSE
H.W.Porter, R.Morgan, J.Rosell University of Ulster Coleraine, N.Ireland
Abstract
II 13
The paper presents the ventilation and infiltration results obtained from a low energy house in N.Ireland. A mechanical ventilation system with a heat recovery capability is installed in the house, to complement the high thermal insulation levels. The annual energy savings due to heat recovery are calculated, as well as the ventilation and infiltration losses. Ventilation is shown to be sufficient to avoid moisture build up within the house, and provides a pleasant living environment. Also the daily behaviour of the mechanical ventilation system, and the heat recovery system are investigated, showing a larger than anticipated contribution of cooking to heat recovery.
Introduction
The house from which the following ventilation and infiltration results have been taken, was designed and built by a local insulation manufacturer, ' to demonstrate how space heating demands can be reduced by the use of specialist building techniques.
- · .!. '. " "' ,-"', ' '
The house has a nulilber . of innovative energy saving features~ A unique polystyrene based roof, and external polystyrene - . wall insulation, create a highly insulated building . - -·. > ... envelope, around a massive internal structure. Space heating is supplied from an electrically heated water storage boiler to underfloor pipes dowmstairs, and to conventional . .., , .. radiators upstairs. Heat distribution to each room in the · house is individually controlled by a central computer. A . . · mechanical ventilation and heat recovery system, ·· incorporating an air to air heat exchanger was installed to complement the very air-tight and extremely well insulated ·. building. The main living areas have a southerly aspect , ·: to benefit from solar gain, through windows fitted with low ,. -· emissivity glass. Temperatures have been monitored at a .. · ., large number of points over the last two heating seasons' to study the thermal performance of the building structure. !;: ..:·,
RANK XEROX COMMUN/CATIE SERVICE

Fresh air needs.
It was realised that in order to utilize the house's high level of insulation to its full potential, the natural infiltration would have to be kept to a minimum. Before · and during the first heating season the house was pressure · tested several times. The infiltration rate was estimated from the air change rate at 50 Pa, using equation 1.(1)
Qi~£=Qso/20 (h- 1) ( 1 )
Improvements were made to the air tightness until a figure of 0.2 air changes/hour (ac/h) was achieved. This is equivalent to 36 litres/sec (l/s)of fresh air, very near to the low limit for a healthy environment (8 l/s per person (2)). The mechanical ventilation system provides an extra 0.3 ac/h, bringing the total air change rate to 0.5 ac/h. This reduces the risk of condensation, which can become a major problem given the very damp climate in N.Ireland.
Throughout the two year monitoring period, a number of moisture readings were taken in the building fabric, to determine the effectiveness of the ventilation system, and to test for interstitial moisture build-up. Although there was variation in the humidity in the roof and walls, levels never approached the stage at which condensation might occur. Actual moisture levels in the rooms were not continuously monitored, but a combination of lack of condensation and occupier sati sfaction suggests that the ventilation is sufficient.
The mechanical ventilation system
In order to distribute the heat supplied by the underfloor heating system, concentrated in the south side of the house, and any solar gain which enters the house, air extraction- · and input points are designed to bring air from the warmer ···/ south side to the cooler north side (Figure 1). Air is __ ; · - ~ · extracted from northern rooms and passed through the heat 0
· •
exchanger before output through an exhaust duct. The · -~ . ·: replacement fresh air f ram outside is passed through the~=::: -· heat exchanger and released into the south side of the · : J'-: house. However this does not give a homogeneous distribution of air temperatures throughout the house. The thermal mass-·-· of the internal structure means that much of the floor-heat · and solar gain are stored, leading to wall and floor -·:: :.:...:.. ... . -. temperature differences of up to 3°C between the south and ., north sides of the house. This obviously affects the air:. .::. temperatures in the different rooms, which cannot be ~otally equalized by the forced northerly air movement. Heat losses
•. · •

.-
ct·-
FIGURE 1. The mechanical ventilation system.
/ " _,QQ)_
0
/J"-/
Fi = Fresh Qlr Input H1= VClNled rresh Qlr input
Solar ~ H0= Erlnlcted house atr . · . C0= Extnlcted cooker hood Qlr
N ~ Nr PtOVertent
S E0= Exhclust Qlr output
through fabric and infiltration cause a reduction in temperature before the air is extracted, leaving extracted air temperatures l-2°C less than the 17°C average air temperature in the house.
Energy aspects
The mechanical ventilation system is also responsible for quite considerable energy losses from the house. The heat exchanger recovers energy from ·the extracted air stream; comprising air from the living space and also from the cooker hood, (H0 and C0 ), and exchanges it to the incoming fresh air (Fi); as ·shown in figure 1.
~ .J •• ., -J. -~ , . ' '
(1) The energy loss through the ventilation system ~- .. .. .- ;. ;..· ~ ! .
J .. ~--~:_,... - ' l ;
J ~ •, '. ~
The net energy loss rate via the mechanically ventilated air is calculated according to· equation 2. The input air stream .(Hi) includes both the reqpyered energy and the power- - ---- - . consumption of the fans;. · ;_~\( :, ~ : ,-";. · ·:, ·
. . . ~ : · · -· "i ~\,. -· :-· ... f.r
VLs=P. Cp( ( Oco. Teo)+( QH~:.THo)-( QH.:1. • TH.:1.)) ( 2)
This- was 'calcuia.ted •for ho~•rly• ;-~~lues •of outs,ide air o •M -· - · o • -
temperatures over a two month winter period and used to : ... --~--. --·::;-::• .... ... :-.:- - ... -·· -~ -.. , .

produce a regression equation predicting the energy loss due to ventilation over two 191 day heating seasons.
Year 1 Ventilation energy loss=998 kWh Year 2 Ventilation energy loss=933 kWh
These values represent 7.1% and 6.7% of the .yearly energy losses from the house.
(2) The energy loss via infiltration
The infiltration rate of 0.2 ac/h accounts for approximately 130 m3 of household air lost to the outside world every hour. This has to be replaced by the heating of a equivalent amount of generally cooler fresh air. The figure of 0.2 ac/hr quoted earlier was measured within a year of completion, and could have increased since, due to a reduction in air-tightness. Also high wind speeds, the unrecorded openings of outside doors and windows, and the occasional use of an open fire means that this figure must be regarded as a minimum.
The infiltration energy loss rate is given by equation 3:
ILs=Q~n~·P.Cp.(17.0-T.~r) ( 3 )
Year 1 Year 2
Infiltration energy loss=2284 kWh Infiltration energy loss=2184 kWh
These values represent 16.2% and 15.6% of the yearly energy losses from the house. o-- •. -· ·. - ! . ,
L • • ••
( 3 ) The heat. recovery achieved -: ' • -, f • : ~ \ -•· .. . .. ... :;'" ·- · .• .. I ,.•
. , .. ~ . . • - ~ .. . ·• · ... '.-:, ! . . . . ; ! '
Table 1 shows the energy that would be . l~st .thro~gh . - ::. :': · · infiltration and ventilation without heat recovery (A), and the savings due to heat recovery (D). Columns (B) and(C) show the actual energy losses with heat recovery .
.. i
T.ABLE 1 • . E~ergy savings due to heat. recovery. · · •-~ . :: ··'
Year Energy loss Energy loss no recovery infiltration
(A) (B) . : ~
Yr 1 5710 2284 ;' ' Yr 2 5460 2184.
Units: kWh/heating season
Energy loss '· Energy recovered ventilation from ventilation
-(C)- - · .. .., 'D) ··· ".c..- -. ~ · ·· ·. ~ -.~:- .. .._: · . \. -~ :'.::
998 .•- . . 2428 .. -933 · .. ... >_. -23~3 ..... ,~.·.
:: .. ·:
·.·.°'· ..
, .. , .. : 1·
'
These figures translated into percent~ges of total ventilation and infiltration energy, become:Non-recovered ventilation energy loss (C) =17.5% Non-recoverable infiltration energy loss(B) =40.0% Recoverable ventilation energy (D) =42.5%
If the infiltration rate is above 0.2 ac/h, the actual energy saved would remain the same, but the total energy losses via infiltration and ventilation would increase.
The economic assessment of these figures is dependent on local energy supplies and prices. In N.Ireland, the Economy 7 tariff prices energy used during 7 night-time hours at a third of the price of day-time energy. This encourages energy to be stored for use during the day, either using thermal bricks or as in this case water as the storage material. Using the cheaper tariff, the cost savings amount to £54 and £51 for the two years. However because the fans have to run 24 hours a day, the energy used is charged at the higher rate for 17 hours, resulting in annual running costs of £30. Thus the net annual saving attributable to the heat recovery system is only £20-£25. This is not sufficient alone to justify the installation, which in this case cost £1000. However, given the relatively small overall space heating cost, it can account for a sizable amount (20%) of the total energy savings.
Details of the heat exchangers performance.
At different periods during the year, and at different times of the day, the rate of energy exchange from the extracted air (H0 +C 0 ) to the fresh air (F~) varies. Energy is lost · from the extracted air and exchanged to the fresh air which has then gained energy. The main influence upon this exchange is the temperature of the fresh air input, and both the energy lost across the exchanger and the energy gained, · show good correlations with fresh air temperature,(-0.94 and -0.78). The correlation figure of 0.78 for the gained · · · energy, is somewhat dependant on the varying temperature of the cooker hood extracted air '(C0 ). This varies considerably more than the air extracted from the remainder of the house, due to the close proximity of the heated floor, and the influence of cooking activities. During periods when this cooker hood air is at a higher temperature, the energy gain actually exceeds the energy loss. This effect could be accounted for by greater fan speeds selected when cooking, and also by the increased amounts of moisture in the extracted air resulting from cooking. Once this air is

•:''
.·
. ::-:.
=~
. •
.. . -
cooled in the heat exchanger there is a r.elease of latent heat. The majority of this will be absorbed by the fresh air, being the cooler of the two air streams. This is confirmed by the temperature increase in the incoming fresh air into the house.
Conclusions
The inclusion of a mechanical ventilation system in a highly insulated and very air-tight building is a necessity for healthy human habitation. In terms of energy saving, the inclusion of a heat recovery capability would take many years to pay-back its initial cost. The 'problem' is that the N.Ireland climate is too warm for the heat exchanger to work at high efficiencies. However, if a building is built to the high thermal standards and high air tightness that we hope will become the norm in the future, it becomes essential to include a mechanical ventilation system, preferably with heat recovery. The extra capital investment must be considered as an essential ·additional cost in the thermal upgrading of the building. _,,
Nomenclature Qin~= Infiltration rate (h-i) Qs 0 = Air change rate at 50 Pa Oco = Air flow rate in C0 (m3 /s) OHo =Air flow rate in H0 (m3 /s)
·- .... .... . . .
OHo = Air flow rate in H0 (m3 /s) ·:·:\:·· P =Air density (kg/m3
) -
Cp = Specific heat of air (J/kg/K)- :· .... c.
TCo = Temperature of cooker air (C)° .; ; ': .;. ·. TH0 = Temperature of house air ·(C) ~~- :,;~--:; . .. THi = Temperature of warmed fresh air,( C) . -~Tair= Temperature of the outside air JC)-;: ,. o
ILS = Energy loss due to infiltration. (kW). , __ ,_,. VLS = Energy loss due to ventilation (kW l~ .. , . _; '·
·· --:-::~:·:r: .. -: :z i- .:.. -~"·
·~< . __ -: :i =~r ~ ~- ~ -
·:'):; :::: ~~ ..: -: :
. - .1.. .• - ~ .. '.,, - - ... .-~ .:.... ·:~-: .:::· ~... : .. "\ - ~- ,; • 4- .;. •. :...: ... ~~· ':. ...... .- ,;•-;.: •. ·- ·:....i. . :.: ~~'.;'.""'· : ::-":':' ~ ~ .. -.
·-References -3 · -~ ~- -f':'" ~:_; ~' _-1 -.!. .. ~
.~ ... ·, ~ - ...... ~ ~ -~ - : ·; t . ! .. . ·• -~ ;_ ! . . f6 ......
( 1) AIVC Applications Guide 1986 .. ~· ·· ·' ~,;~_: .::~ ~- ~:., ,_ ·.·: .'; ·:·.~ · ·.· .~ _; . .., _,_ - ··~ • . ~ .... !!J - - - • • ,,. .... ..
( 2) CIBS Guide 1986 , ,~. ~-~ ;:f:· • _, 0 0<:- · -:,-: · -~· .,, ·'·.
·. _ .. ;. ·"i-! .. :.., , .......
... --~ _' ~:: ;.; l .
·~::..:._; Ea t-!~ ·.:. ,'.,, - .. ·~ ..,...... ~~··.\~1 <]1 ~ ·:. :..-: ·• ~~~'.:..:
~ ~.:: .: ':;" :s :::" 6 ~ -~ ·1 . _:
'":;-; ·:-~ "':. ··:
. '~- ,_ .. -- :··;1 :·{..;._;;- .· .•
- .. 0 ••• - • • F
. . ..... :·. "!'.s::,~--;· :· _ ..... -- ... .. ...:::; .~~- . ; ..... . -.. ~~·:-:"!'!..':·=: :i ...
- _ .. ..: -: .. , . ~ .... ·-: .... ~ ·~.-.:;:: ;:·~·: ...
·-

I
I ..... · :::-::-
·· : .. ,· •' ' .. ...
J·~:~·
ABSTRACT
NUMERICAL SIMULATION OF THERMAL CONVECTION IN A ROOM WITH NATURAL VENTILATION CAUSED BY BUOYANCY
J. Tsutsumi Tohwa University
Fukuoka, 815 Japan
II 14
The main purpose of this paper is to simulate air flow distribution in a room with natural ventilation caused by buoyancy. The boundary conditions of openings are proposed to express natural ventilation when a simulation area is limited to an indoor space. The simulation model is one room with two openings on a wall and a heater on a floor. Objective air flow is .the thermal convection produced by the heater and natural ventilation induced by the thermal convection. The Large Eddy Sirnulation(LES) is adopted for the turbulence. The results of the numerical simulation are compared with those of a model test to examine their accuracy. The model test is · consisted from air flow visualization and air temperature measurement. The stream line by the numerical simulation corresponds to the visualized flow, while there is a little difference between the temperature distribution by the numerical simulation and that by the model test.
1. INTRODUCTION
The distribution of air flow speed and temperature in a room influence the thermal sensation of occupants. Air distributions have to be simulated to design comfortable and healthy dwelling space. Nowadays, numerical simulation is one of the most useful methods to predict them. Most of ~ numerical . simulations for =indoor-air flow have · solved forced ventilation·.and thermal convection in a room, e.g. (1), (2) ~ ·' ' Though natural ventilation has almost always influences on indoor thermal environment, .. :; there are >. .: few numerical simulations , for natural ventilation(3) • . The indoor air distribution with natural ventilation has to be simulated. ·.The most difficult problem to solve natural ventilation is the boundary condition of openings, since natural ventilation ·. ·is decided by both indoor and outdoor air flows. .., · In this .paper, "the boundary conditions of openings are proposed. They expresses natural ventilation in the case that the simulation area is limited to an indoor space. The indoor air distribution with natural ventilation is simulated. The results of the numerical simulation are compared with those of a model test to examine the accuracy.
2. SIMULATION MODEL >•111•.: z, , · · : •.;.! ; - - .-. """'' .. , ~· I _,
') --.: .. • ' .' . ,. :l•·· -
The simulation model is shown in Fig.1. The experiment model mentioned after has the same geometry as this model. : The vertical section of x-y ··
RANK XEROX COMMUN/CATIE SERVICE.

.. . -.
plane is a constant shape of square. The length of a side of the plane, Lo, is the representative length used for the non-dimensionalization. The horizontal axes are rand z, and the vertical one is y. The model has two openings of which widths are Lo/10 at the upper and the lower end of a wall. The model has a heater of which breadth is Lo/2 at the centre of the floor. The heater produces thermal convection in the model and the temperature difference between inside and outside of the model. Then, the natural convection induces natural ventilation caused by buoyancy. - This is the objective air flow to simulate here.
3. NUMERICAL SIMULATION
3.1 Basic Equations
The indoor air flow in the model is not always regarded as full turbulent flow, since the air flow speed of natural ventilation induced by thermal convection is slow and the opening scale is small. The LES is adopted to simulate such a flow. The LES used hereis the Deardorff-Smagorinsky model(4),(5). The basic equations are as follows:
OUi -Q dXi
.. ... .-. . :..
- ' ..... . - ... . . . . -· . .. . . . ..;'
aui o C , ap a ( 1 ou1 ) ... 0 --+-- u·u ·;---+- v,,.,..,, .. e··+--- +0,2 at oxi 1 ' axi ax; .;)l,N
11 ./Gr" ox; .
ae -o · o ( o0 + 1 -- oe ) ar+ oxi Ceui ~ - ox, xscs axi Pr./Gr" oxi
OUi au; eii- ox;+ axi
"( (ei; )2 ) vscs-~~ [-_Cs·~) '" 2 · .
. _\ · . -: . ~ .-; ;.!":;,·: ~
... · ·~ . :,; ; ~ -~ ·,-;'C .. ; .... ~ ~ r:- .: ........ -, . --· ~ ~ .;. - --
A-CA:r1·A:rz·Ar3) 11~ . . _ , .· r # · • .. ·.·:i J:r~ .-; ~.j ·~;--~.;.- -~ -: ::~ - ~- ·-··:.c:; .:: .
(1)
(2)
(3)
(4)
. (5)
..... . .. . . _ .. _ ....
·~,: :::, (6) :i _ ~ J~:: !-'! . ; _; .:.~.-:;~ _··:··~ ~ J : "."2..r.~ ;~c·:~! 1ri:; ; . .J "Yt .: ~.i ::.=; /·.;,;. .J-~~ .i,; 1:'7_ .·~ ~-: =d-=-~ -:~: t·: ·
where, Ii =cqordinate . axis, -t =time, -Ui•velocity component in. It:- direction, P=pressure ~ 0 =temperature, Oi ; ... Kronecker'. s del ta9 :.VSCS=subgrid 'scale( SGS) eddy _;viscosity c:oefficient, ·_ XS'CS=SGS ,eddy 1diffusion : coefficient:;~ , Axi=grid interval in Xi direction,,~: Cs=Smagorinsky constant, Gr=Grashof -number, Pr=Plandtl . number •. -:All these equations ·.are ·non-dimensionalized 'i by ·: the representative values. ,The representative.;length is mentioned before. The representat;iye : ,speed :is (g{3fl0Lo)112 .:.which :is called the. buoyancy· speed. The represent~tive temperature difference is·:the difference between the heater sur~ace temperature and outdoor :air .temperature.~ 'Gr is found from these representative_yalues •. :-::: ;.'. __ ; Jr. ·; ;i__i: :ro.i:: .~2;; ;.('.._;'-:;_,::' ~' uc;J: :~·<' ·:'-; 0~-;~. ;_ •;
-- -~ .. ~-7 :::,: ''° _·::" ::~,:-~ ~~:.~:· ,.~: ; : ~:~:;:~~~.:~T 9~'5:?~:;:~~~:~±-:~-: .; ·.~ · ~~.;=~~{:;.~' -'' 'f 3.2· B.aun_d.ary-ca~diti~n; :: ~ .;~: -··- · · ~ - - ~ ~; ·::- .. ·;:··3.t .:.:-:-·i.(:nr ::-;, ... :5 -.::~~:. £. ·-· ' :.: ~ :>~ ·; -...:-..:._:"):·1_b(j t ~ 'f :<"
Boundary conditions on openings To define the boundary condi~~ons . on openings, the air flow through t he openings is presumed as -fol!ows:,l)The air flow through the openings is laminar flow. 2)The velocity component perpendicular : , to _._the _opening surf aces ·dose . not · change spatially"' in i-;.this direction. :t3)The velocity components :parallel· to :the- .. opening ·surface are -
"': .. ": ·: '.,_ °"!'"' . ' - :.- '. :: I'-' 1'1 •'.'~'I()~ '! ·~ ~ ':\ ',-:_ ~\ '~- \. ~

I I
.....
~·: :.::::; \:._ .
naughts. These presumptions make the momentum equations as follows:
au __ op +-1- o"ll + a .. u ( .... .... ) at ax ./Gr 0 i} 0;!-
(7)
here, the pressure gradient term is found from the assumption that the pressure gradient is linear in the ducts which are assumed on the outside of the openings. The viscosity terms are calculated as shown in Fig.2. Since the outdoor pressure and temperature are defined as the standard for non-dimensionalization, non-dimensional pressure and temperature outside of the ducts are naughts. The temperature at the ·opening is regarded as the same temperature as the upstream one.
Boundary conditions on walls The velocity component pe~pendicular to the wall is naught. The boundary layer of the velocity components parallel to the wall is assumed to fit the power law. The heat transmission through walls is thought as shown in Fig.3. The outside heat transfer coefficient is set constant. The inside heat transfer . is assumed to be analogous to the velocity boundary layer and to fit the power law with the exponent of 1/n. From these heat flux, following three equations are . found: . ~
CwPw; ( 9~i 1 -9~1)-(q1-q2)M "•i...;. (8)
Cu·Pw i ce~2 1 -e~2)-(qz-q3 )M (9)
CwPw ~ (~~3 1 -eNw3)- (q3-q4)At (10)
where, At=time step interval, Cw,Pui=specific heat, specific gravity of the walls. The superscript means the time step. The new time step temperatures are solved from these equations. The outside heat transfer coefficient is non-dimensionalized as the Nusselt number, Nu-aol.-olf..a.
'• - . r' ; :..-----.- . ~ -;-;·_- : ... ,~ - '~~- -· .. --~ ... ".:"'..:. - •• .- • - - ·.O •· • u ·-
3. 3 Calculation Conditions· --- ---..,~ - .. - ·- .. -"· -~- ·- .... .... -·
The calculation algorism is the MAC method. The calculation poi~ts ~are set on the staggered grid system which divides the simulation area into 20 equally in each direction. The Smagorinsky constant is set 0.1. There are several other parameters in this model. The thermal __ convection is decided by the Grashof number and the Prandtl number.' - The boundary conditions of. the openings need the _length of the ducts whiCh is assumed to be set outside the openings. ~ The exponent of the power law have to be set for the boundary layer of the wall surface. The Nusselt number is necessary for the heat transmission through the walls. These parameters are decided by the model test mentioned after.
. ·' ,'., j _: :.:.~~- \\.,..:. ·.· .. ·r: ~ ... ~": . .. , _ ..... !-- •.
... "' .:;, :~~·~·:r:~~
4. MODEL TEST - - o:,.. · ·~-
·~<'""\'" ~: . ..:-~::.~·~· .. :.~ .1 ~---~r ~,f. ... , ---·--~ ·-·--- ----~- ·· -----··-- ------- ----·
The shapes of the experiment model is:.· shown in Fig. r.. · The represen ta ti ve .~ length, Lo, is 60cm. The• ·experimerit' .. model is made of acrylic' plastic of -. 5mm in thickness. Nichrome wire. is used for·· the heater which is covered ··
~~---~~-~-~~~-~-·
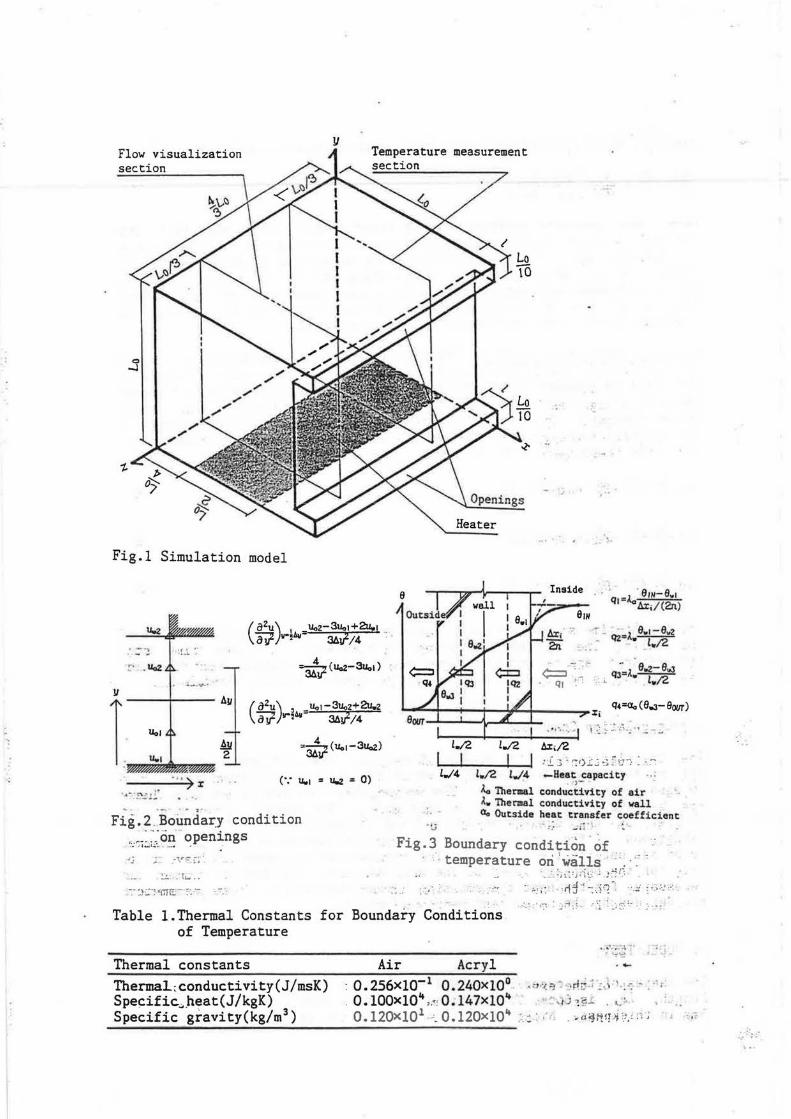
y Flow visualization section
Temperature measurement section
1-
0 ...J
Fig.1 Simulation model
·-·~ - . ::' .u..z
JI
l ~' . u..1
" • ""·:~J.l.
All
All 2
(azu) W v•;Av=u,,2-3u.1+2u..1 St.Jf /4 ·: .
- 4 ( -St.; Uo2-3u..1)
(a2u) di? v-~11.u=u.1-3u.2+2u.2 St.Jf /4
- 4 -St.; (U,,1-3Uo2)
(•: U..1 "' 11-2 .. 0)
Fig.2 . Bounda~y condition "·"_: :):lri " openings .• .- 1~1 ..;. •• _ _. •
·'~ J. _-\.'~. r~,
~~ .• :Tw ..
-- :1.:-·:~- :::--
e
., . ..,
.e
· .
·.
; ' 61H-6w1 Qa =41lxi/(2n.)
91H
_, ·-
- . . e .. 1-e .. 2 - - qz:.1.. L.,/2
- 9..i-8..:J q3=.I.,.~
:: L W
q4 =a.. ( B.:i- BOVT) %j
I I I . ....... 1 '2 ;·c'.i;".,
l./2 l.;2 llx;/2 I I I I , . " . • ·j ...., ._ ~t) !' "'. •• :"! : .· l" T-'\ ~ : .. - . ) -~ --- -~ ... - , ... - ..
L,./2 l./4 -Heat capacity . . )-.I.a Thermal conductivity of air • · .!.,, Thet'!Dal conductivity of wall CJo Outside heat transfer coefficient
L,./4
,; ~o a
Fig.3 Boundary condi~ion.of .-_temperature ori 'wal)s · . ,
;_ .:.: ;~~:;:·1~~- .: J -~;I _:
.. ~-1 ;: .~111~ -: ... )·'.? :. ·· -~· i<;;._!:·'.
.. -· ..
Table I.Thermal Constants for Boundary Conditions of Temperature
-- ~.:: .• 1;t : :;rt"~~ • -.~.i.. ::.::::-~::- :: - --
. .. ~t,; .':.\ -·
7 "':'~
Thermal constants Air Acryl . .. Thermal.:conductivity(J/msK) · 0.256x10- 1 0.240x10° •"' '"< "l '°·' r:!;:: ; .::,, • '.,: -~ :·;, Specific"'heat(J/kgK) . O.lOOxlQit ,.~ · 0.147xlOi+ ~.i..J~?- . ,_. .. Specific gravi ty(kg/m 3 ) 0.120xl01 -·~ 0.12ox1oi+ :: :: : ,-:• . ~<i:'-'Jftir>h.' :·:; ' ·~ i~
·~· ==: .•

l I f
t:: ·~-:;
, . .. :.
(.=.·
by copper plate. The surface temperature of the heater was recognized to be uniform before the real experiment. Inside and outside air is free through two openings. The objective natural ventilation is only caused by buoyancy. The whole experiment system is covered by outer booth to avoid the influence of the air movement around the model. The experiment consists of the visualization of air flow in the model and the measurement of temperature distribution. The air flow is visualized by smoke tracer which is supplied at the speed of almost naught. The visualized space is a vertical section as shown in Fig.I. The section is cut out by a light sheet which is made by a slide projector. The vertical section of temperature measurement is also sho'lin in Fig.I. The measurement points are set on a grid system which divide the section into 10 equally in each axis. The temperatures are measured by C-C thermo couples of O.Imm in diameter. The Plandtl number of the experiment fluid is round 0.7. The opening duct length of the experiment model is 0.1Lo. The exponent of the power law of the boundary layer is assumed I/4. The Nusselt number of the outside surface of the walls is assumed 200. It is equivalent to the heat transfer coefficient of about 8W/ m2K. The Grashof number is controlled by the surface temperature of the heater. The experiment is carried out with the Grashof number of 1xt08 • Thermal constants of air and wall material are shown in Table I.
5. SIMULATION RESULTS
The LES is the time dependent calculation method and it gives instant values of the variables. The simulation results have to be averaged to be compared with the results of the model test. The interval of time step is txio-4 • It is equal to 2.4xto-4 in model scale. The exposure time of the visualization photograph is 2sec. The number of time steps for average should be equivalent to more than 2sec. It is txtO~ in this case. The time average starts after the air flow is regarded as the steady flow. The results of the numerical simulation and the model test are shown in Fig.4. The stream lines by the numerical simulation are compared with the visualization photograph. The temperature distributions are compared each other, though the number of the measurement points is different from that of the calculation points. The stream lines have close resemblance to the visualized flow. The air temperature distributions show a little difference between the numerical simulation and the model test. The difference is thought to be caused by the difference between the measurement and the calculation points, by the averaging time and by the boundary condition of the numerical simulation.
6. CONCLUSIONS ..
The results of the numerical simulation show good · correspondence .with those of the model test. It means that the boundary conditions of · the openings proposed in this paper is reasonable. However, it is a great problem that the thermal convection parameters simulated here are not so large enough as the indoor air flow in full scale. Even if the whole simulation space is larger and the Grashof number becomes greater, the air flow at the openings is not regarded as full turbulence. The LES is the appropriate method for this case. !_ · · ; -

.··
T -\11Y-',,.; ~
II' '/,.-:;...-_ :;::-.::::-- '
....I:.:.171/ ltf, / ;..---....-:::: :::-;-...... ~ -----'//,I Al//, ...., A' . - ' I " I '" 'I .........
/l/ J, 'A'/ I J /I /I ~ \I '\. 1\. I . I I I:! I./ ' I ;-... I I '
l'/l/ :J " I I' I ITT r7 I
i,..i I I I >-' I
\\!\\~\' I J \J\\\\ ' '\ \. '- I J.-. I • ~\.W0."-. .'\ ~ ,) I I -...Z~"'-=~ I 1 I " , / ~ .......... ~,~~'' I I · ~ V
I ..!...'-.""'-~~ , ~ -'I.- 'r" ' ~~ - ~
1 T I 1 ) I- ,
(a) Visualized flow (b) Stream line by numerical simulation
I I I I I I
I I I
1 I
I I I I I I
I,. I I l I ' I I \ I I
:-!. O I I .,11' I I I I I
I Q.2 ........_,
~ . ' ... I I , ..... ...-----·
1 I I 1 ':\. r1'i" ~ - .. ·--;:;::.. 1\!/
(c) temperature by model test (d) Temperature by numerical simulation . ~ . ' ~ . -.
Fig .4 Comparison between the _model test and the numerical simulation·-.. -. ~. ·
- ..... - .1 -,.JI
. , . ... ~ .J ~
: _ . .:,:..: =~~ *
REFERENCES r -~ :~· · n,_..,c- ·· ·:: .. \ ---·-·· ··
}"T.:l; .:;_ - ;~~ -.~ .: ~
(1) Murakami,S., Kato,S.: . Numerical and Experimental Study on Room ~Air Flow - 3-D Predictions Using the k-c Turbulence Model, Building -and Environment, Vol.24, No.1, pp.85-97, 1989 ~.:.~-:·: :
(2) Zohrabian,A.S., Mokhtarzadeh-Dehghan,M.R., Reynolds,A.J.: A Numerical Study of ·Buoyancy-Driven Flows of Mass and Energy in a Stairwell, Proceedings of the 9th AIVC Conference, Vol.2, pp.183-204, 1989 .>• ·-
(3) Tsutsumi,J-I., Katayama,T., Hayashi,T., Zhang,Q., Yoshimizu,H.: Numerical Simulation of Indoor Turbulent Air Flows Caused by ·-'Crossventilation and its model :experiments, Proceedings of the 9th · AIVC .Conference, Vol.2, pp.141-156, 1989 1. ~~
(4) Deardorff.,J.W.: A. Numerical Study of Three-dimensional Turbulent · Channel Flow at Large .Reynolds Numbers, J. of Fluid Mecnanics,
-Vol.41, part 2, pp.453-480; 1969 :za . ~1:0._' "' (S) Smagorinsky,J.S.: General Circulation Experiments with the Primitive
Equations; Part 1 Basic Experiments, Monthly Weather Review;· :VoL91,-.:.: pp.99-164, 1963

r
.. • -·<.
.:· ·· ( .'
EVALUATING HULTI-ZOHE AIR FLOWS USING A RAHDOM SEARCH TECHHIQUE
ABSTRACT
E.H. Tumbuan, G.L.M. Augenbroe, P:A. de Vries Building Physics Group
Faculty of Civil Engineering Delft University of Technology
The Netherlands
This paper deals with the determination of air exchanges between rooms. Emphasis is put on the parameter assessment procedure using a random search technique. Among the relevant topics we discuss the required accuracy of the measurements and to what extent the procedure is applicable. They are of particular importance when models concerning air flow through windows are to be validated. Computer simulations and laboratory experiments using the tracer gas SF 6 were carried out to meet the afore mentioned goals. ·
nrl'B.ODUCTIOH
The use of tracer gases to determine air change rates and interzonal air flow rates has become conman practice (1,2) nowadays. Several measuring systems were developed in the past. . ,. In this paper dealing with the investigation into interzonal air flows, a main emphasis is put on the parameter. assessment procedure by means of a random search technique according to Schwefel and using ·. the tracer gas SF • . . · · ~. · . Re~evant items are the required accuracy of the measurements and to what extent the assessment procedure is applicable.. · -~ · This is of particular importance when reliable air exchange rate data has to be used in temperature and energy calculations. . In the case of air flows through windows induced by wind and temperature (3) one is interested in the total net flow through the opening integrated
II 15
over an appropriate time step. · -' · :, , ._ -. · -'·· ··"' · · · In energy calculation · programs which typically use hourly time steps ·and hourly climatic data, averaged air flow rate values over periods on ·the order of one or two hours are of importance. ;_:. Our procedure for determining the averaged net flows (the unknown parameters in our procedure) starts from the well-known equation for multi-zone flows:
v. 1
v. R~ . F~J
1
1
c. =.~ 1 R ..• c . + F. 1 J= lJ J 1
= volume of room i
wherein:
= air flow rate from room j to room 1
= tracer gas source in room i = tracer gas concentration in room 1
R .. = -.~l B. •• 11 J= lJ
i f:. j
- .. ,-·..---.:· --··-... -.-.... --·-···-.. -- . . ·:· ...
. .·-· ,. ., ... -- ---·.:;....
.. ~ . ~
·- _,,,-,-1 .,
~,,.,J
.. . .. •. •• •• . "'"--~~ . '·;'-··~~ ........... . · . ~·J:"."""/'.. __ .. ........ -:.,... ..
In this model the air in the rooms is assumed to be well~mixed, although perfect mixing seldom occurs. · ' , · · · : . ..
RANK XEROX COMMUN/CATIE SERVICE

-.::-
To account for this imperfect mixing phenomenon, we regard Vi in 1 as additional unknowns (reflecting the so called "effective" volumes) rather than geometrically determined. This implies that the right hand side of equat1on 1, being the tracer gas source, should be significantly different ·from zero in order to supply us with sufficient independent output data to warrant the resolution of all unknowns. Provided we have established an initial · condition, we can now · solve equation l numerically to find:
c. (a;t) l -
a = concentration in room i, calculated by the modei =parameter vector, containing all unknown Vi, Rij•
Having measured
c? (t.) l ]
=measured concentration in the proces at discrete times tj,
we can proceed to find an optimal estimate of the parameters ~ by minimizing the difference between cP and cm:
. Tf p mT p m Min(~) O (£ - £ ) • (£ - £ )dt 2
where the integration over the measurement interval T must effectively be accomplished by numerical integration over discrete time intervals bounded by t j 0 A - - ,
The actual establishment of a can be accomplished by a variety of algorithms. In our research we ;sed a random search technique.
COMPUTER. SIMULATIOHS ' .. • : !:
Prior . to the laboratory experiments computer ·simulations · were carried out to gain insight into the required measuring accuracy. - ·. "; Both systematic and random errors in the concentration and in t he · tracer gas sources were taken into account •. -.· _·: · · · ·· · : - . ·: ·. : - . ~ ~- .'. In case of a single zone, error analysis is ' rather simple.':..."'. ~ . . : ::.• .. .. ·: ·. The solution. of the mass balance takes the form: ·.: · ··: .:.c.:~·-::" ~ .. · : · · ·-
• : • : ~ - '~ :-- .... * A 1 • 'T ·~'!.: ~ •J .. · ...
c(t) = F/R. + exp (-Rt/V)(c - F/R) ' - : :· .. ·. . l ' · :: :· ::; 3 . ~~- : ,;~ ~ :·~":;") . : ... -:: o~_· :· . . =~ · . . "? · ~ . . · - ."! ~_ ~ . -. ~ - ~-~. :) .•
.' ... ...
Assuming uncertainties in F and c error analysis can · be "carried ·.out .. by differentiating equation 2. ·· . . · · · ·• · , · · ' · ·:~~- ;.. ,, Taking this approach for two or more spaces rapidly tends to become too .. . laborious, so the use of computer simulations seems to"be more appropx:~ate . here. ._ ,., ·~· ·. · ....... '· .
. .:. . :·:·--
30 m 3
th 60 m
3th
·~ ·' .. . .. !
~ - • •1 , ...... -30 m
3th
.. . \ .. '. ) . ':.
60 m 3
th ;· i room 1 room2
~' i..f"'(if : · .•, ·."' ·::- ..• i- L,;..•,.. • .J
Fig. l. Air flow rates
,. .,, , .,, . ri. ,. - I . . I !f "'• j -; ..... .. :", .. .! ... --' .. ... . ·- ... ! . . ,, . ' 1 : .........
.· . f ·':
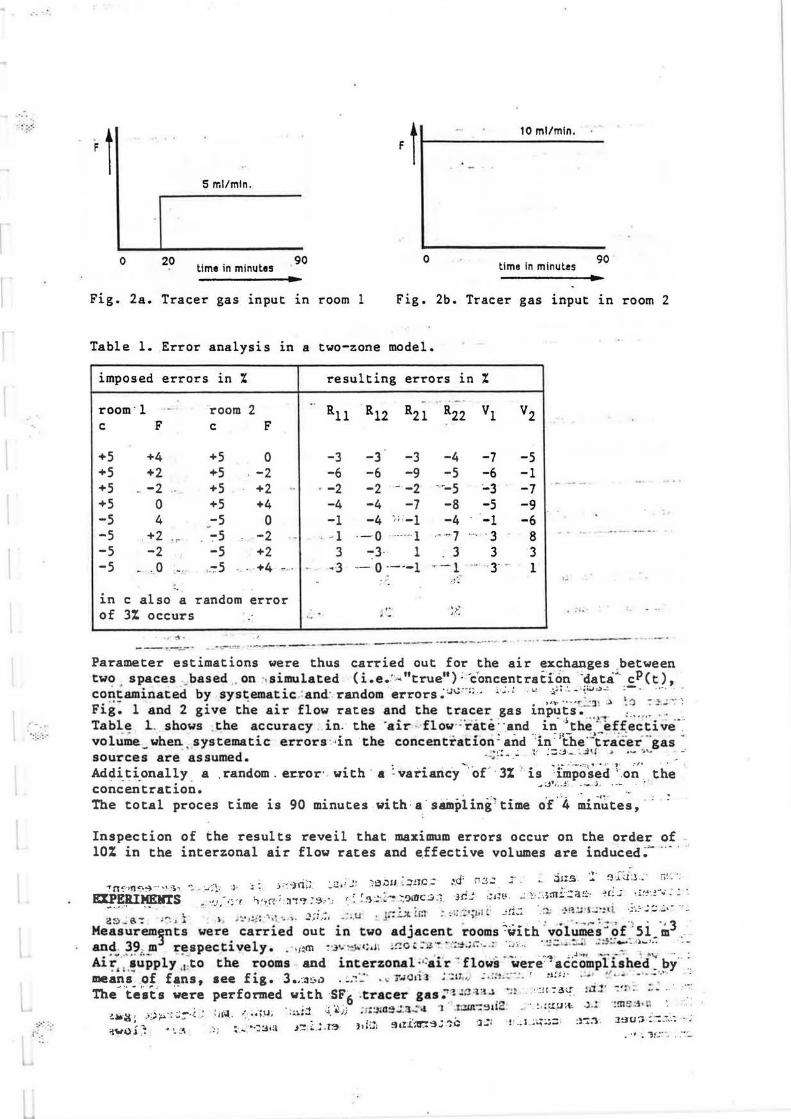
.- ~ .
•,
. ;~::=~
·:;;.:·
:,;:·. ·~· f·_ ••
F t Ft 10 ml/min.
5 ml/min .
0 20 time in minutes
90 0 time in minutes
90
Fig. 2a. Tracer gas input in room 1 Fig. 2b. Tracer gas input in room 2
Table l. Error analysis in a two-zone model.
imposed errors in % resulting errors in % •. - -.. Ru room · l - r oom 2 R12 R21 R22 Vl V2
c F c F
+5 +4 +5 0 -3 -3 -3 -4 -7 -5 +5 +2 +5 ' -2 -6 -6 -9 -5 -6 -1 +5 - -2 .. +5 . +2 .. - -2 -2 -- -2 ---5 --3 -7 +5 0 +5 +4 -4 -4 -7 -8 -5 -9 -5 4 _-5 0 -1 -4 ~ ; -1 -4 . ·-1 -6 -5 +2 .,- - "."5 -2 ·- . -· l ·-0 ------ ·-1 ----·--1 .... . 3 - 8 -5 -2 -5 +2 3 -3- 1 . 3 3 3 -5 - . 0 .. -.,- -~s . . -+4 - . - ~3 - 0 ----1 ~ -1 ·-- 3- - 1
- ,,:· ·-.. in c also a random error . of 3% occurs
,. ... , . - j -
.1',~ ; ..
.. :\· - - ---- - - ---···- ""' .. -· · - ·-· -------- -- ..,- - - - · .. - 4 ;=-"'-~~ • •
Parameter estimations were thus carried out for the air exchanges _between two spaces _. based , on ·. simulated ( i.e .•: .... "true"); ·c"oncentration 'data·- cP(t),
• " • • ·. • 1 • ... .... -. . • • • • ~ \,..! . ;. ~ _. __ =. ;ii.I :.) ...::: :. - - .• •... contaminated by systematic .: and· random errors ....... . .. .. ·· -· · -... : , _ . .. -.
• • •- • ' • • ).I=\'- ' • • I C' " ' !] l :.) .~ ,. ~ . .... . • Fig. 1 and 2 g i ve the air flow rates and the tracer gas inputs ;-:. ; .. .... __ _
.. • • .. - . • - Ji .)..... - .. . .. .. Table l. shows .the accuracy i n . t he ·air flow·· r ate .. _and 1n · t he ··effective _
.. . . . • . . .. ~· . ·:;. ·::r- .:. .. - · · .: · - .. volume. when. systematic errors ·-;1n the concentration · and ·1n · the tracer gas
- .. ' . · ~ · · ,. · 1' ;::~·-- . ... .:HI > · - .._"" -· sources are assumed. ··· -· - -- _ . _ • - . - ...... -·-·:.··;; • • ,. 1:· :-- :I•
Additionally a . random. error· with · a : variaricy ·of<· 3% · is imposed 'on . the conce~tration. _.;,j';;~; - - ; --- -. .
The total proces time is 90 minutes with · a · sainpling1 time o·f ··4 min'~tes, '
Inspection of the results reveil that maximum errors occur on the order of 10% in the interzonal air flow rates and e.ffective volumes are induced~"" .. . ·
a~~~ l, · _":;:- ,:_~ .:~,~:-~~~:~~2' ~'. '.,~, .'~S i7.~~. ::~~~~:.,::; , - ~;~~~~~;{ ;''.::~:.: · Measuremlnts were. carried out in two adja_c~~~. r~om~ ~~-ith_'.y~l~~~;:?!.~,;~!.:: m3 "-and. 39>m res pectively • . · · i~m ~:lv~1;,1 t .:!'!ct. 'e .. ~= ~ r. ·- ·~ ... ,-. . _ ___ ....... ; -·
.~ . .... . . -- - .. .. ... .• J ·"'ti ·- -· .. ... ,.,.- --- -
Ai ~il .aupply ,,;t o the rooms and interzonal .. ~air --: flows _.were·:-, aci:omplishe'd - by" ~-means- _of fans, see fig. 3 .... 3!:.••l • _/ ::_· • , Tw<>1i-l· ; ::u,., : . .;:'!-.~·-.: . ' ~i:n- -~ ·. ~ . • -··_-:··- _ The~ te'at·s ~ere performed with SF6 .tracer gas :' 'L!-C'la ..1 . '! ~ ··:H_-=.d.r.r_ 'a.:!' .. :·:~- ,- · -
. -, ' ' - -0 "' ·• '" "a 'l .l"".JJt- ~':H l2 . "' ~:J .to .J.- . !ti-- .5 • • -~ ' . • .• : · •_..; I : .,\I ,l . ... ··\j " ' :_a;j: ·~. ~ · i) :1:~. ~-.... -~ ... - - •" •, •
::!..»~~ ·':,,P. -· ..... -· j . • - . • . • • · ~ .·• • •••• : . . • ; • · . i ·· - · ·-. · )'."!~ '. .J~u~; :--:._:~·.: ~w•'-(4 ... , .. ~ •, , P,..,,•.,.:!:ti~!l J~ : ..:, _, ;,13 ):):•.4 j ~•?l.~43.., ... .o .J.,.1 • - ... ...,......,_ • :ii . .... ~ . ~ ... .,.. ~ •. "' • • , -.'!f: ~ . ....

:-
-:
..
30 m 3
/h 60 m
3 /h - 30 m
3 /h
(farced) (forced) (forced)
30 m 3
/h 30 m 3
/h
(farced l 60 m 3
I h (farced)
(room 1 ) ( room2) . " (free) (room 1 ) ( room2)
Fig. 3a. Air flows in case l Fig. 3b • . Air flows in case 2
Table 2. Estimated air flow rates and effective volumes for case 1.
Rn R ·- . . - 12 R21 · R22 Vl . V2
m3 /h · -. m3 /h . .
m3/h m3 /h m3/h m3/h
estimated values -52,4 51,6 37,2 -113, 7 50,l 37,5
imposed values -30 30 30 -90 52 39 .. , ~ {geom) {geom)
Table 3. Estimated air flow rates and effective volumes for case- 2
Rn R12 R21 R22 Vl V2
estimated values -36 36 36 -40 51 38 . ' - .
• "
imposed values -30 30 30 -30 52 39 - - ·--·- - -- - -- ··- · · - - ~ _., (geom) · (geom)
~ ..• , .. , ... . . · :..i .... . ~ "'"'. - .. ~ ;. ;:.; . • ;~ -; ~:::} :~ ; . ~ .. ' ~ ~ - .:. -.·· • . ::.~ :.;..fn Concentrat i ons · ·were mea.sured . by ~a infra-red· detector which receives air from the sampling·-points through.:a mul tiplexer. Sampling times were ::c,ri - the
d f 4 . t ·- .. . - _,, . '" or er o minu es. ··vi . ._ . 3 - : .!i i:: >•1"3 J::1·:;:l--:' •·'.' · __ . ·' ••1, J · · · • -' _
Al though . ~egufarly · distri~uted -~asuring_ points ·.in a room showed only sl'1ght 'concentration ~ -differences small .fans - were installed" in the rooms" to approach a perfect · m1~1ng: - . .. ~ - .. :.:~mt. " .3 ~ :; , ->-
Also by gathering the air . of these distributed measuring points a spatial average "is achieved. "'' • I • , '< • • r ~ ' '
Tables 2 and 3 show the obtained. resultso>51;; ;c '. ::~ '~ · :. .,, , .. - · · .• : .. :• -- ·~- -·- -.1 -,".l .. - ·~ .J" •• •
COBcwSIORS : ~ ; • .....;,;; _ .... . . ' ~: ·,.:. _ ~· -: 1
. _.. ·~a..: - ~ ~'-~ · -. -- ~ .ru.J~ : : · .• ;, .:: o\ci :;·.- :. : · ! ••
:;~~ :!"'..!.;. (:.l"J ::~_;: ·~ :_=;•.)!< . : _;.., :L.: ll r.-~~_;:·l'"'~ ~r:;:
.. .,:,·-: - • t - ': !
...
From table 2 and 3 it can be concluded that there is a good agreement between the estimated and the geometrically determined volume, whi'ch· 'wa~':' · expected because of the imposed mixing, but the assessed air flow rates __
h · · l b. d l ·· · · ·1s--- •· .-! s ow a , dis tine t y . iase .resu t .,~-; .: '· ; . .-. :;·.i,~ .-: ::. : ' :c· · . - :. .:.. -n · ' · :~ " :: - _· ·1 • f ...,,. . ..... ,. ··- "' " • ' .. .. • · • ,... Cf'l ( S# - I
The measured tracer gas concentrations however meet the simulated-- results ~ derived from the estimated air flow ratesiand the effective volumes Within an ' accu~acy "~f ·o-he' pe~cent-(no-t shown). This demonstrates· that no befter .:i.: result for the parameter assessment is possible. : ":- .:. · :. : '. »r~.-, : --~'1<:J; . ..-· _, . :'P.··- : r. •
This aeems to support Sherman's statement '(4) that only multi-trace gas techniques are capable co determine the entire matrix of air flows uniquely.

I r-
,:.::·,: Al though the earlier mentioned computer simulations, including error ·· analysis, arouse more promising expectations.
....... _.
1:: . . . \ : ... ..
l ~
L
The investigation will be continued by carefully checking the experimental set-up and by further examining means of statis~ical accuracy. As a next step in the ensuing research a multi-tracer gas approach will be explored by performing two dual experiments sequentially, i.e. by performing: first experiment : source in room 1 second experiment : source in room 2 and performing a parameter estimation based on the outputs of both
· experiments.
REFERENCES
(1) Sinden, F.W. Multi-chamber theory of air infiltration. Building and Environment 13(1978), 21-28.
(2) Afonso, C.F.A. e.a. A single tracer gas method to characterize multiroom air exchanges. Energy and Buildings 9(1986) p. 272-280.
(3) Husslage, J. Procedures for calculating ventilation in rooms with open windows. This congress.
(4) Sherman, M.H. Air infiltration measurements techniques. Lawrence Berkeley Laboratory. August 1989 •

... -·
. . ~ . .. :
'mERMAL CHARACTERISTICS OF PUBLIC BUILDINGS
Ji!-! VaTerka Elektroprojekta Brno, CzechosloTakia
1 • INTRODU: TION
II 16
The aim of th1a paper is to define a method capable to assess enerEa consumption ot the building already at the beginning ot its design and with maximum precision. Statistical methods were used to build a mathematical model representing aa much as possible the real parameters
. ,•-
0~ the object. Precision ot the results corresponds to the number of input data and their weight priority. The data chosen tor the statistical analysis were taken from a set ot ciTil buildings in Czechoslovakia, which - by
their layout and heat losa paraaeters - can be considered as typical for public buildings. '!'he aet consists ot 73
. -objects and 1 t was di Tided into four categories each · -·
' · ~ ~ , ,.4.
having at least 16 objects. · ·. -~ · · ; ''
2. MODEL FORJlULATIOB FOR HEAT COEFFICIENT
.. l.;.i ; ~ . . ' r-The heat coefficient /~/ depends on geometric character-istics of' the building, its layout, and .the qualitatiTe level of' heat parameters of indiTidual structural elements of the outer walls of the building. This knowledge was the starting point for the search of' a suitable regr~aaion f'unctioA .describing the aboTe mentioned relationships~ ···-;i:.): ..
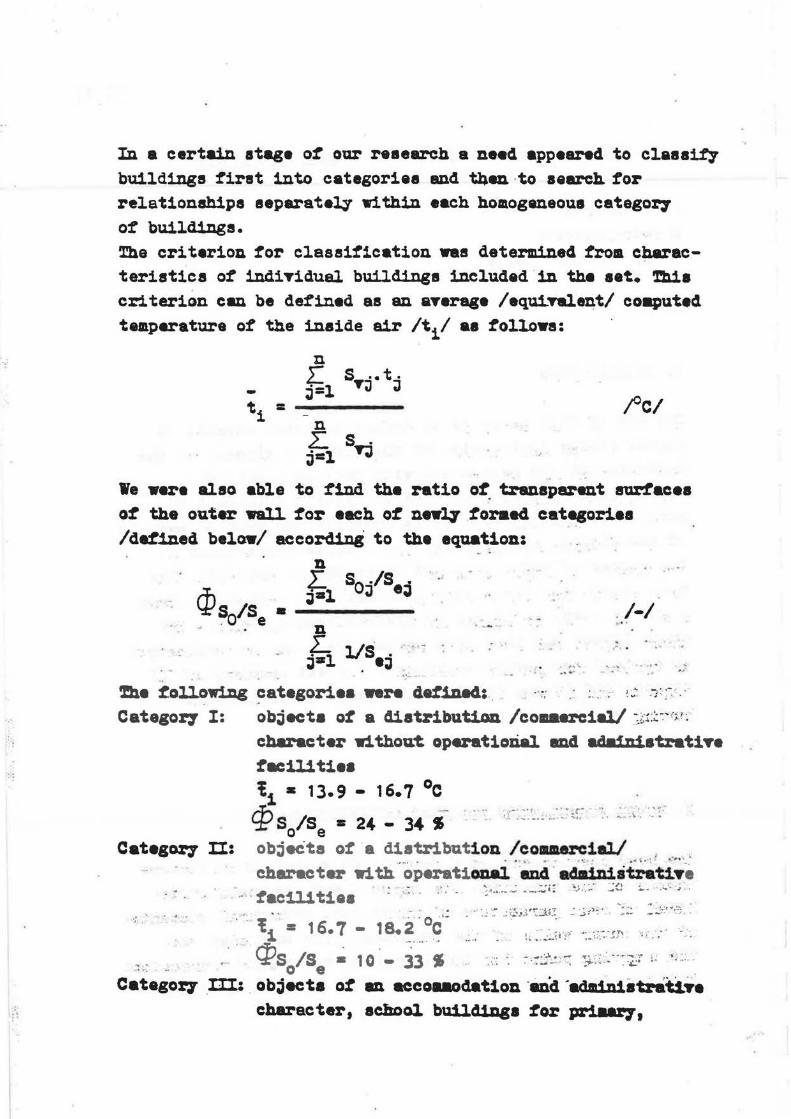
:-:
"
In a certain stage ot our research a need appeared to claaa117 buildings first into categoriea and tl)en ·to search tor relationships separately within each homogeneous catego17 ot buildings. The criterion tor classification was determined trom characteristics ot indiTidual buildings included in th• set. Thia criterion can be defined as an aTerage /•qui.Talent/ coaputed temperature ot the in.aide air /t1/ aa follows:
-t = 1
n ~ s .. tj 4::1 T;J ;J-
n 2: s . ~=l T;J
/°C/
We ••r• also able to find th• ratio ot, transparent aurf'acea ot the outer wall. tor each o~ nnq toraed. catqonea /d~ined below/ accordin8 to the equation:
n
cPs IS f.1 So/Se;I . . 0 e • . . 1-1
11 ~ . . L 11s · ··._,.: . ~-1 . •;J
,"', • ' ' I
"~ ..... ... . ... . .. • ' . t - , ,.·
.. . ~. ~ollowi.Dg ~ategori•• were 4et.1De4:.. ..,,. . . · : .. :·. ~;..: .·.:<: -: ·.·
Categor.r I: ob~ecta of a diauibuti.oll /couercial/ -:l·t~~" {j';
Cat•&0%7 ll:
cbaracter without operat1olial 8114 ecJ•fniatratiT• t.c111t1•• t 1 • 1J.9 - 16.7 OC . m - .. .. .. ···-· . ., .. ' r· - -~ " .·, ... ~ '±" S /S = 24 - 34 S .. ·.. ,,r .... -···"·-- ::.,. :, ~ ... ~: ... ;
o e obj.Cta of a distribution /commercial/ , . ,
•• ••• • • ... • ~ • • • • • • • .1 \ ~ ·t L- .... . • .
cherac tar 1l'i th operational llDcl . ad•i D1 atra:ti.Te .. :tac111tiea : ·- ~ .. ::. :· ... ...: . ...:-~..:;;•: ~;:.;.· ~~ :..-~·-'. ,; ..
. . : ~ ·:~ .:~_'!.l~~it:. _· .-.;~·)-'.-. .::: _ _: .. · ~ .,::; ~ - .. ~ . .. .. .. . .. . 0 ·'• ; . .. . - ti = 1 6. 7 - 1 s. 2 c .. > -· ... . .. "' .- " .• . cp . , -_. ... . "' .... .. ~ - .. .:- ~ c :· ,_, ,, .. ,... . , ,_. .. -. .
• ! . . .. : ......... ....._ . . ,. • · • . - -S 'S • 10 33 Ill ·: ... :- ,;-·.lo.: ; '.'.' -~. ;.:~ - .. ,; : . ... .. .. <: ~ , I - 1fl .••·• • •-" ' ~ ' ~
~~ · - o e Categor.y III: _ ob~ecta o~ an accomaodation ·mid'ad•1n1atrat1.?e
character, achoo1 builcliDB• tor pr1Jlar71

··1
··=_.;'·
secondary, 11nd university education t1 = 18.2 - 19. 1 °c
cJ? S0/S
8 ~ 12 - 29 $
Category IV: buildings ;!or health care and serncea end objects for pre-echool education /kindergartens, nurse17 schools/ ~ = 20.5 - 21.5 OC
C:i:!s0 /se = 23 - 30 $
A consecutiTe model waa developed for objects classified into new categories which can be applied for the determination ot ~ at the tille when geometric parameters and qualitati.T~ level of structural elements /heat tranamittance kl - all considerably in;!J.uenciDg heat state o;! the object - are known.
The depm den~• o:t heat coetticient ~ on ge0atetric and
qualitative parameters of the object /Sc/V/
!he reau1ts of alrea~ mentioned research and the experience gained during different attempts · to tackle the problea haT• made it poaeible to define the aodel that does juati.ce to both shape and masa zoning of the object while at the sea• time it reapeeta the qualitative level of atructuzoe elements. !he relat ionahip between Cln md Sc we wiah to find 1• · . ..... ..
":· ·'·: developed on the baaia o:t the general expression
.. .
<In ·~o • sc!J1 /Wm-Jx-11 . . . /1/
which can be transformed into : :."'.
ln~ =p 0 + f31 J.DSC /2/
where~ 0 • lnct10 md (3 1 ·are unknown coetticienta, that ·~ . determined bJ' least square method :tor each categor.r of objects. nte tightness of the regression is within 5 S level of aigil-1f1cance for categor,y II, tor other categories the tightness ot the regressions fall within 1 $level o:t-signit'ic-ance. ntese levels of significance of the model derived are auft'icient for practical purposes •

The tran~ormed Tal.ue of the outer wall. of the buildillg • s
0.U
0 + S
9.U
8 + S
0.Ue + S
0.U9 . 2 s c a: _ U. Im I 131
sr where the aTerage ve1ue of the heat transmittance of' transparent surfaces of the outer wall of the building /U;/ was calculated from equation
u' = go.so + Ua.sd + uz.sz 0 s + sd + s
0 z
/wm-2r 11· /4/
where S is U is
the surface of' a structure element /m2/ the heat transmittance of' the same element ...
/Wa-~-1; -· ... ·r ... ..... .- -·• ~;
oar- is the reference heat transmittance . /U = 1 .-2x:-1 I
sr _ t _...,
and as for subscripts
.J ~~~ --~ ~·:
p ref'ers to surface aboYe the heated apace 8
e • •
• •
outer roof outer vertical walls w1 thout transparent sarf'acea •'
·~ "i;:> ·~ .: 0 • • outer windowa · .... -~ . . ...~ ~
·•·~· ~ d :· ' . !' " outer doors · , · • · ~ ,.·,; ~;.:~; .. ~ ,ir .;,.,~ ... , z _.,- ·." : " outer rigid glass a~acea · ,· . '.~J _ ;:.~- >:
-~~er aubst itutiDg the definite · •al.ue o't the-reference heat trauamittcce 1n'to equaticm /J/, Olle CBD qualitatiYelT comp• equiTBlent /tranaf'ormed/ SUl!facea of the outer walla~ oi'" 'th•
\~uilding Sc 'With the definite design of . a atruc~al el•ent ·nartng u = 1.0 .-2r1• .. -· . sr . . . · ,.. .. - -.. ,..~ "' .. ...,.. .t· . .. ·: r
The relationship between ln~ and l:A/Sc/V/ within -each·----· \.catego17 waa found b7 statistical methods and the · reaul ting
v~~~a .'?~ 0 . and 1 from equation /2/ are present•~.~ ~-!-h• .i.lt~~~µo~: t~~le. Correlation coetticienta 1n, ~· lae_!i_~~l.mm
~ .. C?t .. ~e . table , demonstrate statistic~ dependence . o~ -~-~~::=-
l :~9~~~ _,..'."ari _&ble lnCJn and l.n/Sc/V/. -'. ;' : > -J~..::~=-" ~ ..) ....:~.: .;. .. ~ ... ..t "J ... ,,,
' ! 4.. .,' 1 4 ......... , ..
.. ~ -· ·-=·• • ... : .. .! -;~:_ }·· - ~·:.::.~~~~T::.,.~.:~~ cz.~.:
!> ' • ..J ; 1 .I ·' , ~ .~ ·:··~ ~:~ ~~:~t;.:::
•! .. ' "'. :.!'~}.::-),..:'~~:·::~;'; ...

r r
I
. ···
.( . \ ....
'.rable 1.
Category f.Jo /31 Correlation coefficient
I 0.58790 0.44331 0.6245 II 1.51443 0.74003 0.5687 Ill 1.81951 0.93513 0.7630
r:v +.12272 0.61561 0.8498
The statistics also yields upper limit of tolerance Ry and
Hpy for Cln• H4 is the upper tolerance lillli t on the T co~idenc.e lnel for the heat coe:ff'1cient of the building
within appropriate category. The ~?' ia the upper tolerance limit on the eonfid_ence leTel r and 1 t yields the Upper
limit for he /100 x p/ percentage ot buildings poasibl.7 f all.ing into each categor,- at any Talue of the independent Tariabies /Sc/V/. It was found suitable tor practica1 purposes ta choose T= 0.90 and depending on actual aituation /Tarioua d•arida ·as for percentage of buildings within the categor;r/ to carry out calculations :tor p = o. 65, o. 76, . o. 90 and 0.95. The waiue ot p = 0.75 appears to be suitable tor practical applications because it approximates reasonabl.7 the ciepeadence o'f ~ on /Sc/V/ •
3. CONCLlJSIDBS
The objectiT.e ot our study was to define a model enabling a prediction o~ heat coe~ic1ent CZn_• lhil• deTelopillg the model we paid a aexiamm attention to the dependence of ~ on geo•etric and qualitatiTe paraaetera o'f etrw:tl.11'!u el .. enta of the outer wal.1. because these eleaenta aubat911.ti~ influence ener87 consumption ~or heating ot public buildings. Froa the heat tranater point o~ Tie• the aGdel 1• o~ general Talue and b7 entering apecU'ic heat equiTalenta int:o 1 t one can compare ~ actual design of a structural. element to a standard one.

=·
1:.
J4ore specifically, we can point out the following adYantages of our heat eoetticient <In: a/ the method mak:ea it possible to determine energr de1L8114a of an object on the 95 $ level of co~idence elrea~ during conceptual stages of architectural design, 1.e. 1n the tiae when onJ.7 the size end the qualitat1Ye characteristics of outer walls ot the building are known; b/ categorizing ci'Yil buildings according to the average /equivalent/ temperature o"r inside air ~1/ does justice to differences among public buildings as for interior co~ort demands and corresponding enerjJ demanda; c/ b7 taking actual geometry and heat transfer coett1c1ents of individual structure elements into numerical eYaluation according to our equations, ~ aubject1Te diatortion o~ . results is eliminated - contrar.y to other eo tar aaed methods for estimation of ener~ 4eaancla of ob~ects. Latter methods most often uae u principal. characteristics o~ : the heat tranami ttance U or the heat resistance R. ~ carr,.iDg out coaparatiTe calculationa for a part of the ••t ot buildings chosen, we were able to proTe that due to doing justice to shape zoning and to corresponding qualitatiTe characteristics the results of calcu1ationa were Ter'7
close to experimental measureaenta. 111• ••• resuit alao ; ~
~ol1owa ~- more p~eciae categorisation ot public bu1141Dga, i.e. from the one which more ezpreaaiTe~ corresponds to reaulta of energy consumption tor heating.
Nomtpelature 'In - hea~ coefficient of ciTil buildi9ga /Wm-Jx-1; t 1 - average /equi.Yalent/ computed temperature of ·the
inside air !°c/ :'!
... s.,, - ground plane surface of heated roou /m2/ . - .. / ti - temperature of inside air of heated room• /'c/ s0 - surface ot transparent surfaces ot the outer .Wall• , :
of the building /a2/ -
s. - surface of the outer Tertieal wall.a of the building . , 2 .. w1 thout transparent a~acee /m I c:·;· 1i,: ''.

1·
I . ·;·-· =~: ·. ~ ·:= · .
I I
i:·: ... ' . ~·
I .... l r; :'.:::,
.i\( __
V - inside apace o~ the object /a3/ , U
0 - average heat tranemittmce of' ou·ter transparent
surfaces /Wm-2~1 / Sc - equiTalent /transformed/ Talue o:f the outer wal1
of the building /m.2/ U
8r- r~ference heat transmittance /Wm-2x-1;
p - qumitile of' normal distribution · y - coti:ridence leTel of' tolerance limit
Ret'erences 1. Regles Th-G 77, Cal.cul du coefiicient G dee logem.enta
• et autre s l.ocaU% d- habitation et du coett1c1e:t G1 des . ..
batimenta autras que 1•• batim.enta dr.~habitation. Paria c~ /1'n7/. 2. · s. ·z.cta, !he ~eory o'! Statistical Interi'erence. I. Wile7, Hew York /1. 971/. ·
....

I r
· ··:·: .,··
J~:··· =~
EXPERIMENT AL EVALUATION OF A HYGROREGULATING NATURAL VENTILATION SYSTEM
ABSTRACT
P. Wouters, L. Vandaele Belgian Building Research Institute
B-1342 Limelette, Belgium
II 17
In the framework of a CEC-DGXVII demonstration project a hygroregulating natural ventilation system is being evaluated in 52 occupied apartments. Therefore a multi purpose automated tracer gas equipment has been developed enabling the detailed monitoring of air flow rates in 60 rooms continuously. In addition the humidity levels, C02 levels and air temperatures are measured as well as the outdoor climate. The first measurement campaigns partly used for evaluation of the measurement system are reported and show an impressive amount of data enabling various types of detailed analysis. The ventilation and air quality parameters of the apartments equipped with the humidity controlled ventilation system are compared with those of the reference apartments.
1. INTRODUCTION
The detailed study of the flow rates in natural ventilated apartments, as well as the air quality in these apartments, is carried out in the framework of the CEC-DGXVII demonstration project "Passive humidity controlled ventilation in existing dwellings". The main intention of this project is the study of the pcssibilities of humidity controlled air inlet and outlet devices in comparison with ordinary inlets and outlets. Therefore, a detailed monitoring programme is running in 3 apartment buildings of which the main features are indicated in table 1. All apartments have a ventilation duct in the kitchen, WC and bathroom. ,. A detailed description as well as the theoretically predicted performance of the humidity controlled inlet and outlet devices is given in ( 1 ). . . - · ··--· - · This paper gives global results of the first measurement campaigns. More refined results will be published later on.
TABLE 1. Characteristics of the monitored buildings
Location Year of Number of Number of apartments monitored
construction floors Reference Humidity controlled
-.. Namur (Belgium) 1978-1982 9 9 9 .. .. Orsay (France) 1969-1973 s 10 10
Schiedam 1965 10 7 7 .. (The Netherlands) . . . ....... .. ..._~- .
.. .. .. ·- .
- . ........ ··---- --··· .. ·····-·-·- --- ··· --

FIGURE 1. The BBRI-MA TE System
2. THE .M"EASURE.M"ENT SYSTEM
The ambition of the project is rather high : a detailed study of the ventilation and air quality in some 20 apartments at the same time. For practical and budgettary reasons, most of the attention is focused on the ventilation ducts. The MA TE-system (Multipurpose Automated Tracergas Equipment) allowing to follow 60 channels automatically (fig. 1) was developed for tlus purpooe. The system determines for each duct : the air temperature (°C), the flow rate (m3 /h), the CO
2-Ievel (ppm), the humidity level (Pa, g/kg). . .
Wind direction and velcx:ity, outdoor air temperature, humidity and co2
-Ievel are also recorded. One complete cycle of all measurements requires some 20 minutes. It is planned to have 3 to 4 measurement campaigns in the 3 buildings, each campaign taking some 3 to 4 weeks or between 6 and 12 months of data. The first complete campaign started in October 1989 and the last campaign is planned for the spring of 1991.
":
NAMUR ORSAY
~ ~ .
. ·J
0 KO Ill K4 116 1U Ill IU llS lf7 ROl ·KD3K<iORCi2R~ llOl llO~llC".1111CllHG4
Kl Kl KS K7 1111 112 H4 H6 II& KOOKD2KDUUi11UllllDOUD211DWGlllGJ
FIG~ 2. Pressurization results Namur and Orsay
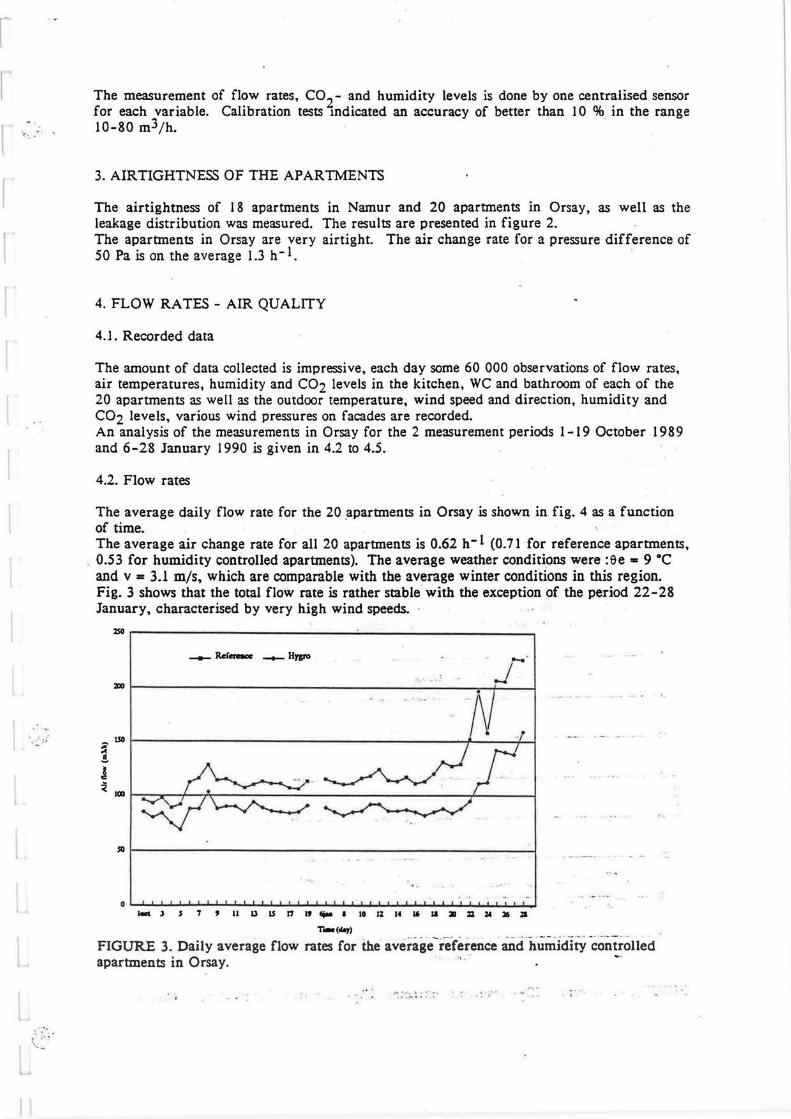
... .. ... .
.• . :_: :•
\.~ '
The measurement of flow rates, co2- and humidity levels is done by one centralised sensor for each variable. Calibration tests mdicated an accuracy of better than 10 % in the range 10-80 m3/h. ·
3. AIRTIGHTNESS OF THE APARTMENTS
The airtightness of 18 apartments in Namur and 20 apartments in Orsay, as well as the leakage distribution was measured. The results are presented in figure 2. The apartments in Orsay are very airtight. The air change rate for a pressure difference of 50 Pa is on the average 1.3 h-1. ·
4. FLOW RA TES - AIR QUALITY
4.1. Recorded data
The amount of data collected is impressive, each day some 60 000 observations of flow rates, air temperatures, humidity and C02 levels in the kitchen, WC and bathroom of each of the 20 apartments as well as the outdoor temperature, wind speed and direction, humidity and C02 levels, various wind pressures on facades are recorded. An analysis of the measurements in Orsay for the 2 measurement periods 1-19 October 1989 and 6-28 January 1990 is given in 4.2 to 4.5.
4.2. Flow rates
The average daily flow rate for the 20 .apartments in Orsay is shown in fig. 4 as a function of time. The average air change rate for all 20 apartments is 0.62 h-1 (0.71 for reference apartments,
. 0.53 for humidity controlled apartments). The average weather conditions were :ee = 9 °C and v = 3.1 m/s, which are comparable with the average winter conditions in this region. Fig. 3 shows that the total flow rate is rather stable with the exception of the period 22-28 January, characterised by very high wind speeds.
2SO r--~~~~~~~~~~~~~~~~;._~~~~~~~~~~~--.
__ Rcresace _ Hypo
lllO - · -
i LSO
.!.
A ~ IOll L~~r--T\
50 r----------------------------------------------------------------~
0 I I I I I I I I I I I f I I I I I I 1 I I I I I I I I I I I I I I I I I I I 1 1 ! I ! ! !
i.tJ S 7 'llDISl11'"""1101Zl41'1.1311:ZZZ421ill
Tiae("'1)
FIGURE 3. Daily average flow rates for the average~reference and hlimidity controlled apartments in Orsay. " •·
.... . .:~:.. ! : :: :· .... , . .. ,
..

;.
·•·
TABLE 2. Minimum, average and maximum daily values for the average of the 10 reference apartments and the l 0 humidity controlled apartments, respectively, Orsay, 1-19 October 1989 and 6-28 January 1990.
MINIMUM AVERAGE MAXIMUM Total air chan~e rate (h - l) 0.50 0.39 0.71 0.53 1.28 . 0.90
x kitchen (m /h) 36 30•) 53 49•) 94 37•) x WC (m3/h) 23 17 37 21 69 35 x bathroom (m3 /h) 26 16 37 24 65 37
Outside temperature (°C) 0.4 9.1 16.0 Wind speed (Trappes) (m/s) 1.4 3.1 8.1
•) Ordinary outlet grilles
According to (2) we propa;e the following model Q = Av2 + Bt.T + C (m3/h) which in our case leads to : Q=69+2.lv2+J.9t.T . (m3/h) The standard deviations are sA = 0,22 (F=9 I), SB = 0.59 (F=l l) and r = 0.86
4.3. co2
-levels
Fig. 4 shows the average C02-Ievels and extracted co2
-quantities for the Orsay apartments. Table 3 gives a summary of the results. · . There is a significant difference in extracted COz-quantities between the reference and the humidity controlled apartments. This is probably due to a difference in occupation pattern. The difference between the highest and lowest average daily values is very large, especially if one knows that the outdoor COz-concentration is 400 ppm. The average COz-level is - as might be expected - strongly correlated with the total air change rate.
- .
700 70
--- Rc£.C02 ---- Hyg.C02 -- Em.Re!. -- Em.HJI.
I: :rn -·.
1 rl
~~ ,/\/~·tr~ I ~ f\j"P' 9 T ~=1 ~ :1 u 300 J~\(\ f\ .. ~!\/\. .
20 200
~~a:~ r~ 100 I a. ,,, - n " ........,_ - " p-A, - p A I 10
0 0 loct J S 7 9 11 13 IS 17 19 6jaa I 10 12 1~ 16 II 20 :ZZ 2' 26 28 .
T&lllCl(U)').
.. . . .....
- ..
..... ,,,
,:-.·4
,t: ': ., --. : · :
FIGURE 4. Average C02-levels and extracted COz-quantitites for the Orsay apartments.
:
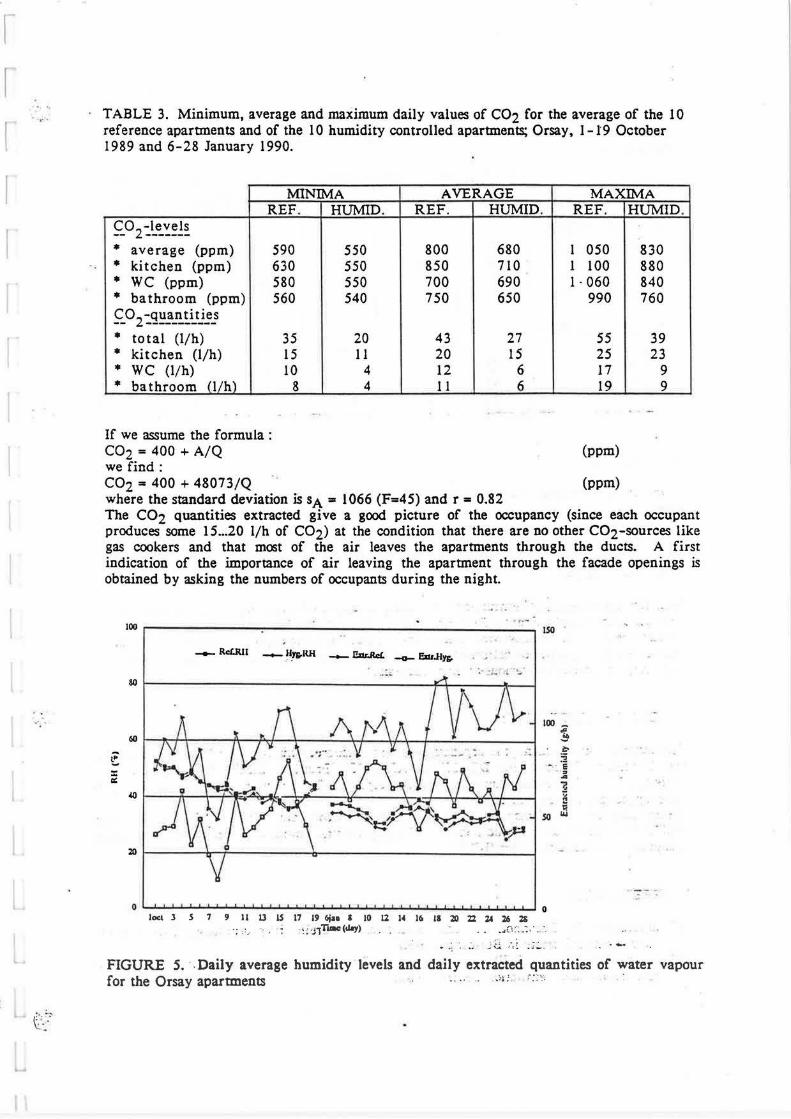
1-
..... ·.
··.·
c ~~
TABLE 3. Minimum, average and maximum daily values of C02 for the average of the 10 reference apartments and of the 10 humidity controlled apartments; Orsay, 1-19 October 1989 and 6-28 January 1990.
MINIMA AVERAGE MAXIMA REF. HUMID. REF. HUMID. REF. HUMID .
CO -levels -- 2-------* average (ppm) 590 550 800 680 I 050 830 * kitchen (ppm) 630 550 850 710 I 100 880 * WC (ppm) 580 550 700 690 I· 060 840 * bathroom (ppm) 560 540 750 650 990 760 CO -quantities -- 2 -----------* total (l/h) 35 20 43 27 55 39 * kitchen (l/h) 15 11 20 15 25 23 * WC (l/h) 10 4 12 6 17 9 * bathroom (l/h) 8 4 11 6 19 9
If we assume the formula : C02 = 400 + A/Q (ppm) we find: C02 = 400 + 48073/Q (ppm) where the standard deviation is sA = 1066 (F=45) and r = 0.82 The C02 quantities extracted give a good picture of the occupancy (since each occupant produces some 15 ... 20 l/h of C02) at the condition that there are no other C02-sources like gas cookers and that most of the air leaves the apartments through the ducts. A first indication of the importance of air leaving the apartment through the facade openings is obtained by asking the numbers of occupants during the night.
t: :c
"
100 ISO
-- Rd.IUI -- Hyi;.IUI - Ellr.R.c£. -o- P.:lir.Hm.
80
60
"°
20 -
100
~ ;::..
- ~ .. ,. .... '1l ::; :! I!
so II.I
0 0 lOCl 3 S 7 9 II 13 IS 11 19 6jaa I 10 12 1' 16 11 20 22 :z.t 26 :ZS
; ,._. -.. ~ - ~;J1Tamc(tlay) ... n .. :.· '. .. : ..
~.: ~ \...O. t I:. • ..: - · - ......
., '
FIGURE 5. . Daily average humidity levels and daily extracted quantities of water vapour for the Orsay apartments ·· -- .. .;i: . ·::•, ·

::
TABLE 4 Minimum, average and maximum daily values for the 10 reference apartments and for the 10 humidity controlled apartments in Orsay, 1-19 October 1989 and 6-28 January 1990.
MINIMA AVERAGE MAXIMA REF. HUMID. REF. HUMID. REF. HUMID.
~~~~!~~~--~~~idi!¥ • average (%) 28 25 38 37 53 52 • kitchen (%) 29 28 39 39 53 54 * WC (%) 26 24 35 34 46 48 • bathroom (%) 28 25 41 37 59 55
~-t.!!-.9_~-~-~~~idi!¥ • total (g) 144 46 273 170 372 238 • kitchen (g) so 30 106 86 153 138 * WC (g) 24 -6 62 31 94 49 * bathroom (g) 65 22
. ' 105 53 139 77
4.4. Humidity
There are no important problems observed due to mould growth or condensation. Fig. 5 shows the average humidity levels and the water vapour quantities evacuated per day. Table 4 summarizes the results.
- 5. CONCLUSIONS . .
Detailed measurements of extraction flow rates and air quality parameters are running in some 52 apartments in France, Belgium and the Netherlands. The results of the first measurement campaign show very interesting results. The first analysis of the measurement data as well as th'e detailed calibration measurements on the measurement system indicates a very large potential for various types of analysis. ____ :_ __ -- --· -·- -------·-- ·-- - -·
·-. 6. ACKNOWLEDGE'MENTS
---- ___ ~ ___ , ____ __ ... _ , __ ,.~ •• - • ••. ·.--:. -- · - --- :.- __ _..... _. -)--·- -- "'1
The authors wish to thank the organisations who sponsored this project : The Commission of the European Communities DG XVII, AERECO . (France), E.D.F. (France), CETIA T (France), TNO (The Netherlands) and BBRl (Belgium). The following persons contributed to the preparation of this publication :- -, - ·::. .. ·· '.'::.-:---· -~ · · - · Messrs. Jardinier and Simonnot (AERECO), Messrs. Nicolas and Niard (EDF), Mr. Gaillard (CETIA T), Messrs. de Gids and Phaff (TNO/MT), Messrs. Bossicard, L'Heureux, Voordecker, Gengoux and Miss De Keyser_(BBRI). _ ---------------· .. -·-- .- . .
7. REFERENCES
(1)
J2)
----··------· --- -· -------- -- - -- . ~ ._. ;: - • :.: .. a:._, ·•:,
Jardinier, P., Simonnot, J., La Ventilation Nanirelle Hygroreglable, CIB Energy, Moisture and Climate in Buildings ( 1990). Liddament, M., Air Infiltration Calculation Techniques - ·An Applications Guide, Air Infiltration and Ventilation Centre (1986). . _ .• : ".:· ·: · .. . . :-: : ,._ ·

·I
;: .. :: ..
l "" . ..
ENERGY-SAVING CAMPAIGN AT THE NMB BANK Despite the fall in energy prices the desired results were achieved.
A.'W. Alders Peutz & Associes B.V.
Molenhoek, The Netherlands
From the beginning of 1983 until the end of 1986 the NMB Bank ran a broadly-based energy-saving campaign in its branches around the Netherlands. The launch of the campaign coincided with the construction of the new head office at Amsterdam. In order to provide an insight into the results of such a campaign, the NOVEM (Dutch Energy and Environment Society) had a survey carried out. The purpose of this survey was to evaluate the results of the energy-saving programme and of the organisation of the entire project. The evaluation survey was rounded off at the end of 1988 (1). The results show that energy consumption fell considerably, as expected (by approx. 30%) . The concept of energy saving may no longer appear so financially attractive from the cost/benefit point of view because of the fall in energy prices. However, the survey showed that, even at 1988 prices, total investments were recovered within a period of less than 6 years.
PROJECT ORGANISATION
The NMB Bank attempted to reduce considerably energy consumption in its branches throughout the country by pursuing a so-called double track policy. This involved, on the one hand, motivating personnel and providing information and, on the other hand, implementing physical energysaving measures.
Personnel motivation and information provision
For the purposes of personnel motivation and information a so-called energy team ("E-team") was conceived. This team was formed by representatives of staff management, the general and technical services and the public relations, suggestion box and technical systems departments.
III 1
The ~E-team" 's a,ctivities included: ·- , .. -
"; ....... FIGURE 1. &69. of a &licker
. . -~ ·.,
-publishing an information bulletin, -distributing stickers (Figure 1), -calling for suggestions for energy-
saving ideas , · · " .!
- dis tributing encouraging pamphlets giving energy-saving options.
::,,.
..

· One contact person per branch was appointed for registering and coordinating energy consumption. This person was given a manual, including consumption registration lists and heating tabl.es .. Every week, either by telex or internal memo, the increase in the number of degree days (including sun and wind correction) was communicated to all the branches. Using the tables in the manual, the contact person was able to see whether the number of degree days achieved and the corresponding gas consumption matched actual consumption. This monitoring made it possible to achieve rapid results of the measures introduced at the branch's own initiative. This helped to make a positive contribution to encouraging energy saving.
Physical energy-savini measures
As well as the general personnel motivation and information measures, the properties belonging to the NMB Bank were considered with a view to taking physical energy-saving measures. To determine possible energysaving provisions the NMB Bank first established the required recovery criteria per component. The basis for this was that provisions must ·be taken in as efficient a way as possible using the following maximum recovery times: Building shell Airconditioning and heating Lighting systems
7 years systems: 4 years
3 years
Another basic premise was that provisions and advice relating to office equipment should not be taken into account, partly because of their low energy consumption (average approx. 6%) . . It was also noted that energy-saving measures involving replacing single glazing by double glazing were also omitted, on the one hand because of their extra long recovery times and, on the other hand, due to problems involved in replacing impact-resistant or even bullet-proof glazing in bank buildings (safety considerations). . : : ~ ·. '
~ !..
METHOD
The most efficient and most frequently used method appeared to be a method based on the diagram shown in Figure 2. The report was standardised and condensed into table, format so that par~ ticular information could be found at identical places in the various reports. This method involved the lowest possible burden on the client's organisation and staff. In this way, uniformity of implementation of .the energy-saving provisions and clarity for those implementing the measures could also be guaranteed. .·~. _
PHYSICAL MEASURES
.:~~;
~~· '~ r.~-.
.,,....
Building shell -\....::- , .... /"'::.~.:::.:. .. ·.;. ~ .... ..: ... ·
.,
To implement the energy-saving measures relating to the building shell, a selection procedure was initiated, in cooperation with the consultant, involving a number of nationally-operating insulating companies. ~·

I 1.::·' _,
r, . . .,.
\:_.:···
,.,_..... of orderw . Pl'(ment ol lrwoi.
•
Client Oimibution ol lnlorm•tion
Consultant Insulation company or
I : l collect dma:
! ~ corwumpllon
! ·-~·*
r-------·' .
·-····· -·-··~--·
.iort blanch
-II• -building .,,..,
.. ir conditioning •nd t..tlng ~· -llQhtlng ..,..,,. -ollic9 equipment
·killcnen equipment
~ -<:amplainll •bout building Ind..,..,,.
·perform•,_ ot -I t.ming baller -ligl'llingi..... .. niso.xipie ilWIMlig•tion ot ...;iy
-11 CONllUCtiorw
fitter
NqURI 19ndef'I .. ... ......... ...... ···i rwport :
-1• j ti.i.nce :
=~-.gy~ng ~ -lllnder9 - • . -dml~ : ~ -dml19C1UR!fot~ :
i.n:lerllw lndumlal 1.---Acl l lmpiemenllltlon IUpel'Mlon ·- -·-' •nd oomp191ion -ofllc:i91 ,.Port ot lmplel!IWlldon -ct.clc lrwoi.-
: .. a f -+ • FIGURE2. wor1c?i.n for lmplem.m&tton of phyelcal energy ... vtng mea8U1'81
.. , .... ,.__. .. -· ,.. '
. . .. , _:, ... ~ -_._. oP ~· ··-~ l ;, i -~t ... L .. ..... :~,.. .;,
~ _: ~:~:,. ~:;;~ ~~: . ; 7-~ . ·-, ., .....,. ...... .aJ.-f ... -•· ...... .
".('
' v. ...,,. ,. :>...- ~ ..
... ·, ~--.. ·, ,.
After evaluating the imp l emen tat ion of several test projects, three insulation companies were selected. In order to be able to work as efficiently as possible, contracts were always placed with these companies' main dealers . The advantages of this were:
good price agreements, - a low number of con
tact people, wider technical knowhow .
The provisions at the buildings which were carried out consisted of: -cavity wall insula
tion, -fitting seam and crack sealing,
- insulating roofs, ·inside or :outside,
-insulating attic floors, -replac~ng sandwich facades,
glass panels
by in
-insulating external floors.
Systems ·· and ~appliances _;·(: .. : ~· ·;·-:;;_~ t ' . :: ,, - , ,,·./· 1: :;_...l ·;.~:.;- ·'. ~ - ~ -~ . - . ~ .. > • - -. .. . ·. ' '
The ~nergy7saVing measures relating-:to _the mechanical (heating, cooling and yentq .. ation) and lighting systems .are in principle carried out by the i~:Jlouse fitters at the various .branches. The system-related provisions ~carried out included:
fitting weather-dependent and/or optimisation controls to the central he~ting boil:er(s) or units, .~:.; _ 12:.:.
fitting timer· switches (night/weekend reduction), - fitting pump switches' piping insulation, thermostatic radiator taps' . r;: - .r _eplacing the .. conventional boiler . by ~a . high or improved performance ~ ..
bo_iler. ,,_~i 31~:~--~~ ·.;::.; · ; 'J..'):;.w~ :~ · < ':- ·: , . ·'
optimising the ventilation air quantities, '~ in~r~ducing· the possibility of night ventilation by external air, r~pl~cing large gas boiler by one or more small electric boilers, · ' ·· 1
replacing ~luorescent strip lights . by fewer thin f'luorescent strip lights, and reducing the number of thin fluorescent strip lights,
- replacing bulbs by low-energy lights, - fitting dimmer switches.
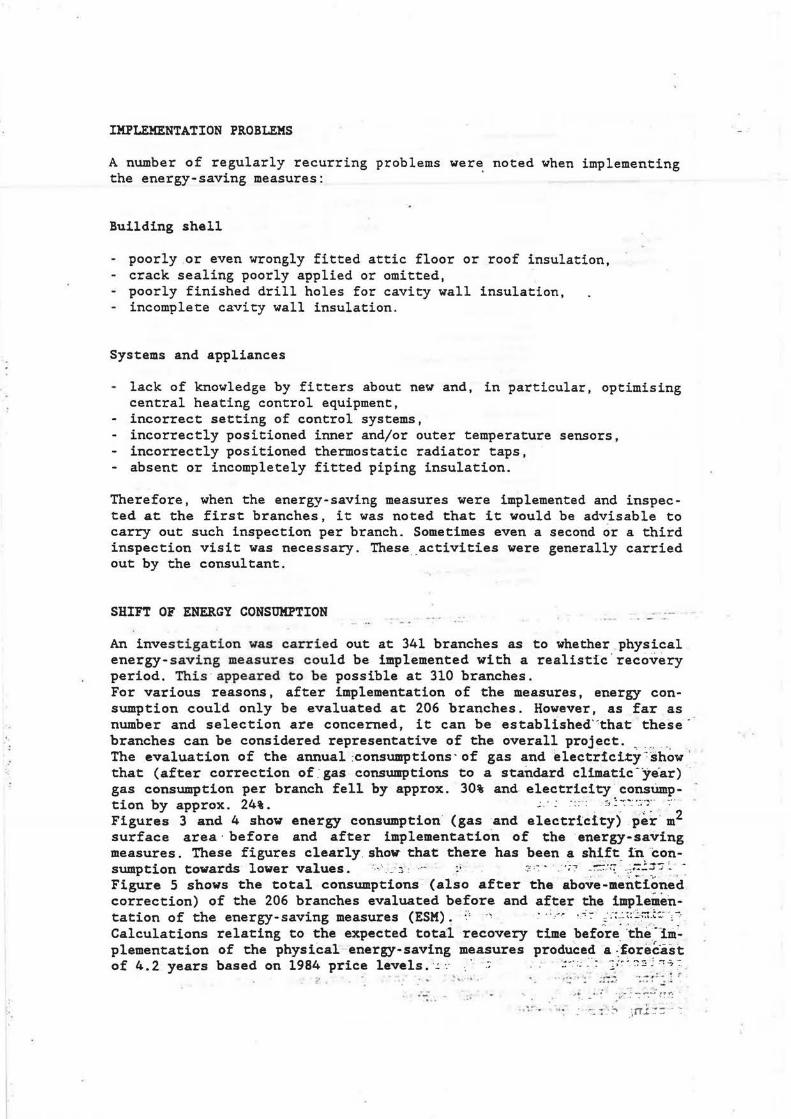
IMPLEMENTATION PROBLEMS
A number of regularly recurring problems were noted when implementing the energy-saving measures: ·
Building shell
- poorly or even wrongly fitted attic floor or roof insulation, - crack sealing poorly applied or omitted, · poorly finished drill holes for cavity wall insulation, - incomplete cavity wall insulation.
Systems and appliances
- lack of knowledge by fitters about new and, in particular, optimising central heating control equipment,
- incorrect setting of control systems, - incorrectly positioned inner and/or outer temperature sensors, - incorrectly positioned thermostatic radiator taps, - absent or incompletely fitted piping insulation.
Therefore, when the energy-saving measures were implemented and inspected at the first branches, it was noted that it would be advisable to carry out such inspection per branch. Sometimes even a second or a third inspection visit was necessary. These __ activities were generally carried out by the consultant.
SHIFT OF ENERGY CONSUMPTION
An investigation wa.s carried out at 341 branches as to whether physical energy-saving measures could be implemented with a realistic.recovery period. This appeared to be possible at 310 branches. For various reasons, after implementation of the measures, energy consumption could only be evaluated at 206 branches. However, as far as number and selection are concerned, it can be established''that these· branches can be considered representative of the overall project. _ ... . . The evaluation of the annual :consumptions· of gas and ~lectrici.ty-:show ' that (after correction of .· gas consumptions to a standard climatic -year) gas consumption per branch fell by approx. 30% and electricity constimp-tion by approx. 24%. ~ · : .. . · . '' ::~·: ·.:?:· : .. Figures 3 and 4 show energy consumption (gas and electricity) per·m2
surface area· before and after implementation of the energy-saving measures. These figures clearly show that there has been a shift in .consumption towards lower values. '· · ·. _ :-. : ... :; ::: · ~ · .: · ;~ -~:q ~ ·:";:!;:r-:; ~ -
Figure 5 shows the total consumptions (also after the above-menti~ned correction) of the 206 branches evaluated before and after the implementation of the energy-saving measures (ESM). :·, ., · .: __ , ,..;:- ;.·:.:.;::'..::-:.t:: ·,-:.
Calculations relating to the expected total recovery time before: ·the"im~ plementation of the physical energy-saving measures produced a:fore~ast of 4.2 years based on 1984 price levels.~ -.- · -~- ·_:·: :" ~ · : -~ ; :'~'".::-:.:; :::
~ .. . ~ .. . . . ·.-:: ··· : ;i:~ ·::: : :.~i~
.:-: .... . . '~-. : -: :..:~: -~ ! !'!
n . . .. . · :-:-.::~'.~ -~n..::~::
["" ::-· ... .
c:_.
ANNUAL GAS CONSUMPTION PER m2 before and eftllr energy-MVtng meuur•
ANNUAL ELECTRICITY CONSUMPTION PER m2 before and eftllr energy-saving meuur•
,20.-~~~~~~~~~~~~~~~~~~~--. IOr-~~---:~~~~~~~~~~~~~~~-...
110
100
IO
IO
( 7U
l I IO
.Q IO '!!
i 40
:IQ
20
10
7U
IO L..
10 :ID 30 40 IO IO 7U IO IO 100 ,,0 120 ,30 140
• b9lalw esw@ -.. ESM ~
~ I ~
FIGURE 3. Annual gu conaumP1lon In m3
per m2 aurt,a~ area
( IO
l I 40
li '!5
~ 30
: :!
., ;1
: ; - ... 11_: . . . -) :':,11 ! '"' . '", I 1" r.
Energy conaumptlon a.toreESM : .: AftMESM
Gaaln m3 .. 2.370.200 - .; : . ::; .1.642.500
Electricity In kWh 8.587.100 6.489.200
:-; .. · . . j:..:; ;......i.-.•!J~~ "'' "'
a eo n ~ 1a ,'° m - m ~ ~
II befol9 ESM @ nr ESM ~
FIGURE 4. Annual electricity consumption In kWh
per m2 aurlace area
Energy-saving
n:r.700
2.-097.900
.. ,
. ~. :: . • .. • .: 11i
' " FIGURE 5. Total year conaump11on In the brMChel 9Vlluated before Mel after
the lntroduc11on of energy-M\lfng meuur- _, ~' , .
~ I · •
. . -: _::. ~ . ~ ~ ~~ H· , ;~ . i! :
.,.
..
The result of· the evaluation of the project gives a recovery time for overall investment costs (including consultants' fees) of 3.6 years, based on 1984 price levels, which is representative for inve~tment decision-making. :.Based on,1988 price levels, the recovery time is 5.8 years. Therefore, the result ;Of the . . energy-saving campaign may be said to be extremely satisfactory, despite the fall in energy prices. ~. · . T,,:
~ ~~ ..... ~L;,.-;n~:4i ·:?i'i 4•rn'. •. :: !'
•-: ...
.....
.....
REMARKS
Some remarks still need to be made concerning the evaluation and implementation of the project.
The lack of sufficient successive annual energy consumption figures meant that the evaluation was carried out using energy consumptions of one year before and one year after the implementation of the energy-saving measures. A little investigation about a few years after the energy campaign showed that personnel motivation and critical following the correct settings of the control equipment are necessary to make sure that the lower energy consumptions are a continuous phenomenon. Control equipment is adjusted too frequently, which is not necessarily a good thing, so that any problems can be solved quickly, for example, room temperature which is too low. This may negate a major proportion of the saving which can be made. The implementation of such a large-scale project as the current one means that the clients' organisation has to be well-suited to the activities to be carried out , such as collecting energy consumption data, building information, etc. The distribution of the correct data strongly influences the speed with which the investigation can · be carried out. ·
- For the sake of completeness it should be mentioned that the costs incurred internally by the NMB organisation for PR, motivation ""and technical support were not included in the evaluation.
- The consultant should be trusted by the contractor as far as his organisation and project planning are concerned. Preferably, the consultant should supervise the entire project, which can guarantee a uniform approach, a continuous assurance of quality and shorter completion time. This latter point is important for limiting the number of buildings where work is being carried out simultaneously, which means that a better overall view can be maintained and the entire company organisation is not overloaded.
- By adopting a large-scale approach to the project, it seems possible to predict results for the total project although various influences produce major positive and negative deviations for individual buil-dings . - -· - ~ ) .
··· -Financial considerations were · the initial concern of the project. Despite the fall in energy prices, the intended results were achieved . The project was justifiably hailed as a success. Although its organisation is suited to a bank, the method used can equally be applied to other large office organisations.
. ' . References : · · · · (1) Adviesbureau Peutz & AssocUs B. V.: Evaluatie energiebesparings
programma gebouwenbestand NMB Bank (Evaluation of energy-saving· programme in NMB Bank buildings) Report numbers E 142-1 and lA, Molenhoek, 19 October 1988 .

I .,. ·.·
.... :.:-·
c·:-. .
DEVELOPMENT OF A SIMPLE MODEL FOR PREDICTING THE ENERGY CONSUMPTION OF HOUSES IN HOT MARITIME CLIMATES
ABSTRACT
I.M. Al-Naimi, B.F. Warren University of Newcastle upon Tyne
Newcastle upon Tyne, NEl 7RU United Kingdom
The paper describes the development of a simple computer model for predicting the annual amount of energy used in air conditioned houses. A steady state energy balance is carried out using mean monthly solar and other weather data, with typical incidental heat gain data based on family size and power ratings of appliances. Fabric and ventilation gains are predicted using house element areas, 'U' values and assumed infiltration rates. Computed cooling loads are converted to energy consumptions using air conditioning system coefficients of performance derived from measured energy consumptions and manufacturers' data. A limited validation of the model has been carried out using six houses about which the energy consumptions were known. Comparisons of predicted and measured energy were favourable.
INTRODUCTION
Much research has been carried out in Europe and the United States on predicting the energy use for controlling the internal environment in buildings. This has been necessary since over recent years costs have risen and ways of reducing them have had to be found. In order to assess the savings attributable to different conservation measures, it has been necessary to develop models for predicting energy use and assessing the value of different design options. ·
III 2
In Europe the energy consumption for heating domestic -buildings : has been·of particular concern, but in the Middle Eastern countries, it .is air conditioning which causes problems of increasing electricity use.
The problem of high energy consumption has become a major local authorities .as well as the people who experience a supplies and the possibility of price rises.
concern shortage
of of ."!
As part of a recently completed Ph.D. thesis, a · simple model ·was developed for predicting the energy consumption of air conditioned houses. The .model is based on data obtained from a range of six houses in the Dammam region of Saudi Arabia . ·
~TROD
;.'\ .
The approach to the problem was to construct a simple steady state heat balance equation which could be used to determine the .. cooling load o.f · a

. ::
typical house. The electricity consumption of the air conditioning system could then be determined if the coefficient of performance (COP) was known. A comparison between this predic~ed energy use and that actually used could then be made. The method was applied to six different houses each having one of two types of cooling system; either a 'split' system or a 'window' system. The houses were surveyed and their electrical energy consumptions obtained to provide the input · data for the model and a basis for the energy use comparison. Unlike models used to predict heating energy consumption, the effect of latent gains was taken into account. The model utilised mean monthly weather data and predicted energy used was on a month by month basis.
The basic equation describing the mean rate of total heat extraction (QT) from the building can be written:
QT QF + QV + QI + QL kW
where QF is the gain through the fabric, Qv the gain due to ventilation, Q1 the incidental internal gain and QL the latent gain due to condensation of moisture.
A brief description of each of the components of QT follows, but it is not possible, within the length of this paper, to fully describe all the detail:
QF, the fabric gain, was determined from the expression, QF - A * U * (TSa - Ti) / 1000 kW for each building element.
Element areas (A) and thermal transmittance values (U) were derived from the house surveys and drawings. TSa, the mean daily sol-air temperature, was determined for walls and roofs using the ·method described in . the CIBSE Guide (Ref 1) for each orientation using the appropriate · mean solar radiation and air temperature (T
0) . · data
applicable to Dammam. The mean internal temperature, Ti, was obtained from the house surveys using a thermo-hygrograph.
The ventilation gain, Qv. was derived using the expression .
Qv 0.33N * V *- (T0 _- Ti)/ 1000 k~ . .· .. ... ··,, -
' . An air change rate (N), of l/h, was assumed to apply to all the houses. · Actual data was not available since no measurements were taken. A figure ~of 1 acjh is, however, commonly used in Europe ' for this type of study. yalU:es . greater than this would not commonly be assumed in situations where the cost of energy is considered important and 1 ac/h is generally sufficient to control odours. The vo lumes of the houses, V, were obtained from the survey measurements or drawings _ when ·· available~ . ·.- - , -· ·· '. · ·-· · n ·
. - ')
, ·: . , :- .. ... -·. ~: it·;,~·
Incidental heat gains Q1 comprised two components, solar · ' gain · through windows (QSOL) and internal gain from lighting, people, domestic appliances and electronic equipment (QINT).
•"'\.• '"•" .. . "
The solar data available consisted of daily and monthly mean global, direct and diffuse .radiation provided by the meteorological station ·at the Kin& Fahad University .Research Ini:;titute of Petroleum and Minerals', ·'· ·

~
:: .) This data was manipulated to obtain the radiation on vertical surfaces for different orientations. The method used was that suggested by Markus and Morris (Ref 2). This information, .in conjunction with the measured window areas and glazing characteristics, was used to determine the solar gains (QSOL).
.. -
. :·:.
Gains from people were estimated using information on the heat output per person (Ref 3), combined with occupation patterns obtained from the house surveys. For each house, a record was made of the number and types of domestic appliances and other electricity consuming equipment. Information on equipment loadings was obtained from the .electricity company (Ref 4) and, by estimating the hours of operation, the energy consumption was calculated.
In an air conditioned house, the refrigeration system controls the humidity by extracting moisture from the air. In order to maintain constant internal conditions, the moisture losses must equal the gains from the various sources. Moisture gains arise from the respiration of people (MP), ventilation (MV) and the activities of bathing (MB), clothes washing (M\J) and food preparation and cooking (MC). For each of these sources, information was obtained on the moisture output (Ref 5) which, for the people, was modified to take into account the occupation pattern derived from the survey. The moisture added by ventilation was determined as the product of ventilation air mass flow (l ac/h) and the difference between internal and external moisture content obtained from thermo-hygrograph and weather records respectively. The sum of moisture · inputs, equal to that extracted, was then factored by the latent heat (2450 kJ(kg) to give the heat extracted by the system. All the gains, QF, ~. QI and OL• were then converted to energy values, kWh, by multiplying by the number of hours in the month.
A computer programme was written to determine QT, the monthly total heat extracted. Checks were built into the programme to ensure that if the total latent heat gain was negative, it was set to zero .
. 35000
30000 ... ..... .
25000
20000 Cooling
Load 15000 kWh -· ·
10000
5000
o...-_,, ...... _.. __ ......, __ .... __ ...,_ __ ...... __ ..... ~~-+---+--..lo~
-5000
JAN FEB MAR APR MAY JUN JUL AUG SEP OCT NOV DEC
FIGURE 1. Monthly cooling requirements
:..•.:..:. "-) :

,.
I.
30 60
~ 20 ~40 g g
c10 c20
0 1 5 9 13 17 21 25 29
0 1 5 9 13 17 21 25 29
January July
FIGURE 2. Examples of maximum, minimum and mean external temperatures in relation to comfort limits 20-2S°C
This situation could arise if the outside moisture content was low enough to produce a negative ventilation moisture gain large enough to offset the positive gains. Also, if the sum of QF, QV and QI was zero or negative, no mechanical cooling was needed, in which case moisture gains were set to zero.
The monthly loads are shown for one of the houses in Fig 1. It can be seen that cooling loads are negative for some parts of the year, i.e. some heating would be required.
For the six houses studied, the model predicted a negative cooling load during the months of January, February and December. This result was further investigated by plotting outside air daily maximum, minimum and mean temperatures for each of these months for comparison with comfort conditions. Fig 2 shows examples of these plots for the months of January and July. For the months in question, external temperatures are generally lower than required for comfort, providing some confirmation that heating may be needed during these months.
Results from the house surveys showed that over 90% of the perceived the 'summer' as the period May to October and indicated the period April to November.
occupants about 55%
For the purposes of further analysis, it was assumed that only the months April to November would be included where a definite cooling requirement existed.
COMPARISON OF PREDICTED AND ACTUAL ENERGY VALUES
In order to .be able to make a comparison between the predicted house cooling loads and the measured energy for cooling, it was necessary, not only to determine the portion of measured electricity consumption used for refrigeration, but also to convert the predicted cooling loads into air conditioning system electrical consumptions.
It was assumed that each house would operate with a 'base' electrical consumption equivalent to the energy used for lighting, . gomestic appliances and electronic equipment. This had already been determined in the assessment of incidental gains and it was therefore only necessary to subtract the figure from the metered consumptions. The remaining energy was assumed to be for · air conditioning.
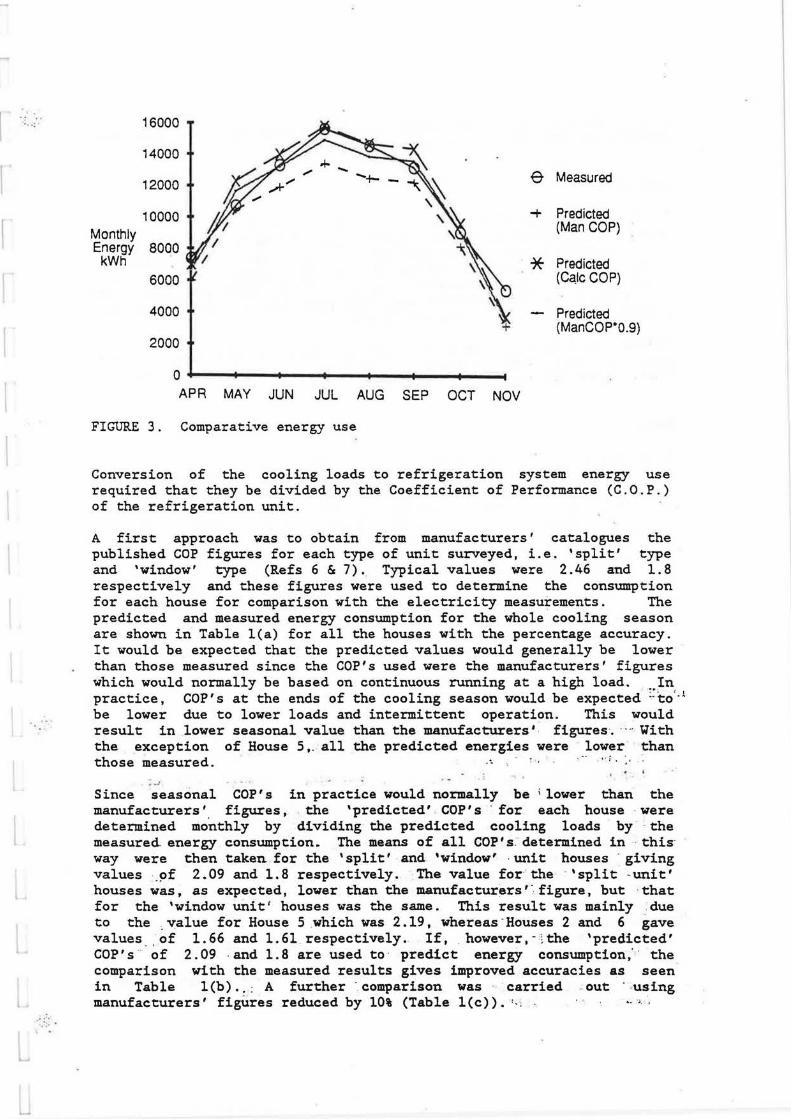
·.:. ~=·:
.=_:::.
16000
14000! /~~ 12000
1 r/ ~-, 6 Measured
10000 /) \ -+ Predicted
Monthly /
" (Man COP)
Energy 8000 kWh
6000 f I '
* Predicted (Ca,lc COP)
4000 - Predicted (ManCOP*0.9)
2000
0 APR MAY JUN JUL AUG SEP OCT NOV
FIGURE 3. Comparative energy use
Conversion of the cooling loads to refrigeration system energy use required that they be divided by the Coefficient of Performance (C.O.P.) of the refrigeration unit.
A first approach was to obtain from manufacturers' catalogues the published COP figures for each type of unit surveyed, i.e. 'split' type and 'window' type (Refs 6 & 7). Typical values were 2.46 and 1.8 respectively and these figures were used to determine the consumption for each house for comparison with the electricity measurements. The predicted and measured energy consumption for the whole cooling season are shown in Table l(a) for all the houses with the percentage accuracy. It would be expected that the predicted values would generally be lower than those measured since the COP's used were the manufacturers' figures which would normally be based on continuous running at a high load . . .. In practice, COP's at the ends of the cooling season would be expected ;.to'.! be lower due to lower loads and intermittent operation. This would result in lower seasonal value than the manufacturers' · figures. · ·-- With the exception of House 5,. all the predicted energies were lower than those measured. -' · .. ..; . . .
: _, Since seasonal COP's in practice would normally be 1 lower than the manufacturers' . figures, . the 'predicted' COP's - for each house were determined monthly by dividing the predicted cooling loads by · the measured energy consumption. The means of all COP's determined in - this· way were then taken for the 'split' and 'window' · unit houses - giving values _pf 2.09 and 1.8 respectively. The value for the · 'split -unit' houses was, as expected, lower than the manufacturers' ~· figure, but -that for the 'window unit' houses was the same. This result was mainly :due to the , value for House 5 which was 2.19, whereas ·Houses 2 and 6 gave values of 1.66 and 1.61 respectively. If, however,-~the 'predicted' COP's of 2.09 . and 1.8 are used to · predict energy consumption,· the comparison with the measured results gives improved accuracies as seen in Table l(b) .. : A further ·comparison was ·carried . out · using manufacturers' fig\ires reduced by 10% (Table l(c)). '· ·- ' ·

:!
';:
Fig 3 shows the predicted energy consumption compared with that for April to November for one of the houses.
CONCLUSIONS
It can be concluded that the energy consumption, predicted by the Model using manufacturers' COP values, gives a good fit to the measured data. The indications are that manufacturers' figures should be reduced by about 10% to allow for seasonal effects. This gives a better fit, although House 5 gives an anomalous result. It is clear that more work is required to validate the model with more houses being used and refinements being made to the COP values.
Further work must also be carried out to assess the sensitivity of the model to variations in design features such as fabric, 'U' values, window sizes and ventilation control.
TABLE 1 .
(a)
(b)
'. ~' ~
. ; ENERGY kWh
Measured Calculated Percentage
Calculated Percentage .:
(c) ~ Calculated .... , Percentage .
HOUSE 1 HOUSE 2 HOUSE 3 HOUSE 4 HOUSE 5 HOUSE 6
89922 78361 -12.8
140518 130482
. - 7 .1
110693 86807 -21.6
91794 : 130482 ~· 101688 + 2 .1 - 7 .1 ' . .;.. 8 .1
87068 - 3.2
.144980 :::' 96452 . .+ 3 . 2 . ' -12 . 9
61613 56414 - 8.4
41629 50184 +20.6
66085 50184 . + 7.3 +20.6
62682 . + 1.7
55760 +33.9.
67224 59465 -11.5
59465 -11.5
66072 - 1. 7
------------------------------------------------------------------------,•. "i.
.,_ ;,i-:: .. ... . ~:. :.v-_• .- ::':~-S:..:. : •• f I .,! . . ·~
REFERENCES -:-;~r·! ; " . • -= _; :"'*' ~--:.·J ... "'_ . .L ... L':! : .: .. --. ::i .. f '""' " ... -. •
. :~ ~;-{ ~; : .,. ";::3 u • .. ; :' -~ .. .. r.;,.'i .· •
·"' ~ ; . ... : :· ., .. 1 · . .... ... . ... r:·· · ··• ·::!"~ - · •"' \ · !'~ .:·. :i ·~"-:-.. .
(l) ,. CIBSE Guide, Yeather and Solar .Data: sot-air temperature and long~ · ..... :wave . loss. •. 1;1 The · Chartered ·,-Institution of /.'Building · Services ·
.'.:':~ I .,. • - _.., J. t
Engineers, 1986, p A2-69 . ·· ·· -(2) Markus, T.A. and Morris, E.N., Building, climate and energy .
•• 1 . Pitman Publishing Limi.ted, · London, U.K.·._.- 1980, p 194. · ".:. · .. (3)..., CIBSE <;;uide, .. Internal Heat gains. The ·Chartered InstitUtion ·of
·<~:i Building.S~rvices Engineers, "-· Section A7, ." ·1986, p A7-3 . .-: . (4) SCECO, Consumer. Tariff Guide. !rSaudi Consolidated Electric ' Company
;:~ · ·. in the Eastern Province, Obeikan Printing Company, 1987 , '·p 4. (5) . ·· CIBSE Guide,. ,_ .; Moisture Transfer.- and CondensatiOn>~ The'· Chartere·d
• .,, : 1 Institution_._;. of ·Building Services Engineers, -: Sect:ion ''AlO, · 1986, -.~. P Al0-14. :, ~-:r - ,,, ·:o:·F ·)m.;. .'!· ~-:·. '. · : .:.-'::: · · i · ..... -.:c::~>:- _· ... .,
(6) ~·:;Sanyo Company, ·Split Units "Specificad.ons and ~'Applications:" air · t,. ,cooled package type,: rair conditioning~·'.:.,;·" Sanyo : Electric ~Trading · . • , 1J .• company,,_Osaka, Japan, SI printed in Japan 1985;· pp 6-7. -~ - · .:·
(7) ., .. Alzamil. ;-iCompany, •·.·Product ·".·Specifications, ··window ·· type .·. units- · ]r1 .: refrigeration system. "; Azamil Refrigeration I~dustrie~.~ Da.nun,~ .. !: ..
Saudi Arabia, 1986,'.p:2. '-::1~•"; • . .... :]·: ··: ·· ~·:;"· ·- ·y ·· ·· · ·
:···- MAKING USE OF THE THERMAL INERTIA OF THE BUILDING USING THERMALLY OPEN CEILINGS
ABSTRACT
ing.H.M. Bruggema Adviesbureau Peutz & Associes B.V.
Molenhoek, the Netherlands
By making strips of suspended ceiling constructions thermally open, the heat capacity of the storey floor above can be used to have a posicive influence on the room temperature. Research carried out in a climate chamber shows that the room temperature can ~e reduced by 1-2 °C or the internal heat load can be increased 5-10 W/m . Based on the research, a · calculation model has been designed, with which the research results can be translated into practical applications. Recommendations are made for constructing thermally open ceilings.
1. INTRODUCTION
In the summer, the use of the thermal inertia of the building can have a positive influence on the climate in a room. The thermal inertia of the building (heat capacity) is capable of stabilising the climate in a room · by absorbing and dissipating heat. In general, modern office buildings · have little thermal inertia or it is not easily thermally accessible. The concrete constructions of floors usually have a layer of carpeting on the top and a suspended ceiling fitted to the underside. Partition walls are often made of light constructions so that the heat capacity in a room can only be "influenced by a heavy fa~ade. ··· If the positive effects of the thermal inertia of the building are to be used, the available heat capacity must be made more accessible. Floor · constructions offer an interesting possibility in this respect. By
III 3
··· making the ceiling construction thermally open, the heat capacity of the ·
.· ........
concrete floor above the ceiling can be utilised. ·: ~ ~-: .. -
2. RESEARCH TO DATE
2.1 Purpose To obtain an understanding of the mechanism of a thermally open ceiling, : .: its yield, necessary provisions and any negative side-effects, .. : laboratory research was ·carried out under contract from the Netherlands .::: Agency for Energy and Environment (NOVEM) . The research was carried out · in two phases. The first phase looked at the ways in which a ceiling· can be manufac- · · tured so that, although the stabilising thermal accumulating effect of the concrete mass above is utilised, any negative consequences are also kept to a minimum . During the second phase the influence of an air-conditioning system on the mechanism of the thermally open ceiling was established: . the effects c'

·.
~~~~
=····-r~~I~~ 11% open ceiling 11% open ceiling 22% open ceiling openings openings openings in 2 str1ps evenly distnbuted in 2 strips
FIGURE 1. 3 examples al ll'lermeJly open ceilings.
2.2 Measuring set-up and method
~ ll'lermelly open
~ nuorescent lumineire
room dimensions: 3.5 x 5.4 m
of air diffusion and air exhaust and the type of air diffuser. The effects of the thermally open ceiling on comfort in the room and the heating-up response under winter conditions were also investigated, together with the effect of the position of the openings in the ceiling.
During the f irsc phase the heat capacity of the floor and walls in the test chamber was blocked using insulating material so that the thermal inertia of the concrete storey floor formed the only relevant heat capacity present in the room. Using a cooling system, both this concrete floor and the ambient air were brought gradually up to the same temperature (reset) . Then , a constant heat flow divided into lighting, simulated sunlight and simulated internal heat load, was supplied to the room for a period of 8 hours, during which both air and surface temperatures were registered in the room at several points. Air velocity and black bulb temperature were also established. In this way, the response of the room to the heat flow supplied can be identified. To achieve the thermally open effect, tiles are removed in strips from the suspended ceilings (mineral tiles and perforated metal plates) over 5, 11, 22, 33, 66 or 100% of the surface area (see Fig~re 1). Variants are also measured, which involves varying ceiling insulation. A heating-up curve for the room is established from the measuring data per. ceiling variant, and these are compared with the curves for entirely open and entirely closed ceilings. In this way the degree of effectiveness of _utilisation of the thermal buffer capacity is determined. Measurements were also taken of acoustical aspects.
During the second phase the practical situation in a standard office was simulated as closely as possible, so that the measuring results give ' a clear indication of .the practical situation. For this purpose, three walls in the climate chamber were finished with a standard plasterboard wall. The remaining wall have a light fa~ade construction with double glazing. The air temperature outside the fa~ade is consistent with a day/night cycle. The room is continuously mechanically ventilated approximately 4 times (including during the night period) with air at 18 ° C. This time, the temperature response principle is also used,. where the heat load consists of: lighting (on/off), simulated sunshine (day/night) and internal heat load caused by people and equipment (on/off). The test setup used in the second phase consists of: the measuring room, an external climate unit, an air-conditioning system, .. the control system and the measuring and processing system (se&- Figure :~ 2) . " · · ~: . . . ~ ~
Under summer conditions the entire setup was stabilised for two days un- . der the conditions of a cool, cloudy summer day (no sunshine, external

• ~ !_ ~ .
-., +-
·o
t·-
~iO'll
:r::x:x:x
t
t
FIGURE 2. Schematic diagram of measurement set-i.!p.
temperature 18 °C) where the internal load and lighting were switched to normal. Then, for a period of 3 days, a hot summer period was simulated. At a number of places both air velocity and air,. black bulb and surface temperatures were registered in the room and at the ceiling plenum. The measurements were taken both from an entirely closed and an entirely open ceiling and from several 11%
open ceilings (openings concentrated in two strips or evenly dis-tributed; see Figure 1). · Two types of air supply devices (lineair slot and swirl diffusers) and two methods of air extraction were investigated (plenum extraction or extraction using the luminaires). Using smoke, an investigation was carried out into the influences of the type of diffuser, the point of extraction and the quantity of ventilation air.
Under winter conditions, the heating-up response of the room was determined in order to find out whether, when using an open ceiling, account has to be taken of a longer heating-up response time. "\Jhen the external temperature is -10 °C and wind speed along the fa~ade is approx. 4 m/s, the heating-up response of the room is measured when a radiator is switched on, when the ceiling is entirely closed and when it is 11% open.
2.3 Conclusions phase I:
if a ceiling construction is opened in strips, there is a good exchange of air between the room and the plenuJn. This convectional heat trans f er by convection forms the most important factor in the utilisati on of the thermal inertia of the building above the suspended ceiling;
- making a ceiling thermally open can have a consi derab l e pos i tive effec t on the temperature response of the room;
- even if the ceiling is only opened over approximately 15% of its surface area, the maximum effect is almost achieved;
- the acoustical consequences for the ·room are marginal with respect to the reverberation time based on a 15% open ceiling. ·
phase II: - even when a mechanical ventilation system is used, the effect of the ther-
mally open ceiling remains intact; .. . - if there is sufficient night ventilation, it is possible to mak~ use 'of the
thermal inertia of the building even over several hot days; . , , .. - evenly distributi ng some of the openings has no significant influence on
effecti veness; ·- ·' ~· · . - when the ceiling is . approx. 11% open, a decrease in room temperature ls

·:-· . ·:.1.
r- ~ I''' I rsnfi"3vy v2YY22~ m
~ ~ ...,._ A.Nil:;'ll-.
FIGURE 3. Air circulat!on using a ttlennally open celling.
~}C0=ysz~ peOOle
~ l --e.o-v-.
achieved of approx. l.s·c under the meas~red conditions, which permits an increase in internal heat load of 5-10 W/m floor area.
3. MECHANISM OF THE THERMALLY OPEN CEILING
The effectiveness of a thermally open ceiling is determined by the extent to which the heat capacity of the concrete construction above the ceiling is used. During the investigation the following was established for a ceiling construction opened in strips.
Night situat:ion: - The room cools down as a result of night ventilation. This means that the
concrete mass of the storey floor is warmer than the ambient air. The fac;ade surface also cools down. If there is an 11% open ceiling in strips, this results in a type of circulation which is particularly influenced by the "cold downdraught" at the fac;ade (see Figure 3A).
Day situation: - Initially when the ·internal heat load is switched on . (8.00 a.m.), the.night
circulation flow is stimulated. - With the increase in surface temperature of the fac;ade and the penetrating
heat from the sun, the updraught at the fac;ade will dominate. - The circulation flow stops and changes direction (10 a.m. - 12 noon), see
Figure 3B. ~ ·
The circulation flow, .where air enters the plenum at the fac;ade, is in-creased and reaches its maximum at about 6-7 p .m. · · :· .·; _,.: , -Circulation is slowly decreased and at about 10 p.m.- 12 midnight the flow once again changes direction. ' . · ·· · .· , ·~
. The ambient air content 'cin the test chamber approx. 53 m3) is circulated _ through the . plenum approximately 12 times. This creates the desired heat
·.-: " ··transfer mechanism between the room and the concrete construction. Heat trans -fer also takes place, although to a lesser extent, by radiation and conduc-
.... . tion. The times given are influenced by facrade direction. ' · "":- 1 ·
·-·
' ::
.. .. -"-.. .-·; ~~. ~-·
4. CALCUIATION MODEL ·. :~!
Based on the measuring results, a calculation model was developed which was initially used to calculate. the thermal response of the measuring room. It calculates the thermal response of a room with a thermally open ceiling (see Figure 4), and for this purpose generates two spaces: the room under the ceiling and the ceili~g p~enum. The heat exchange between ceiling plenum··and room
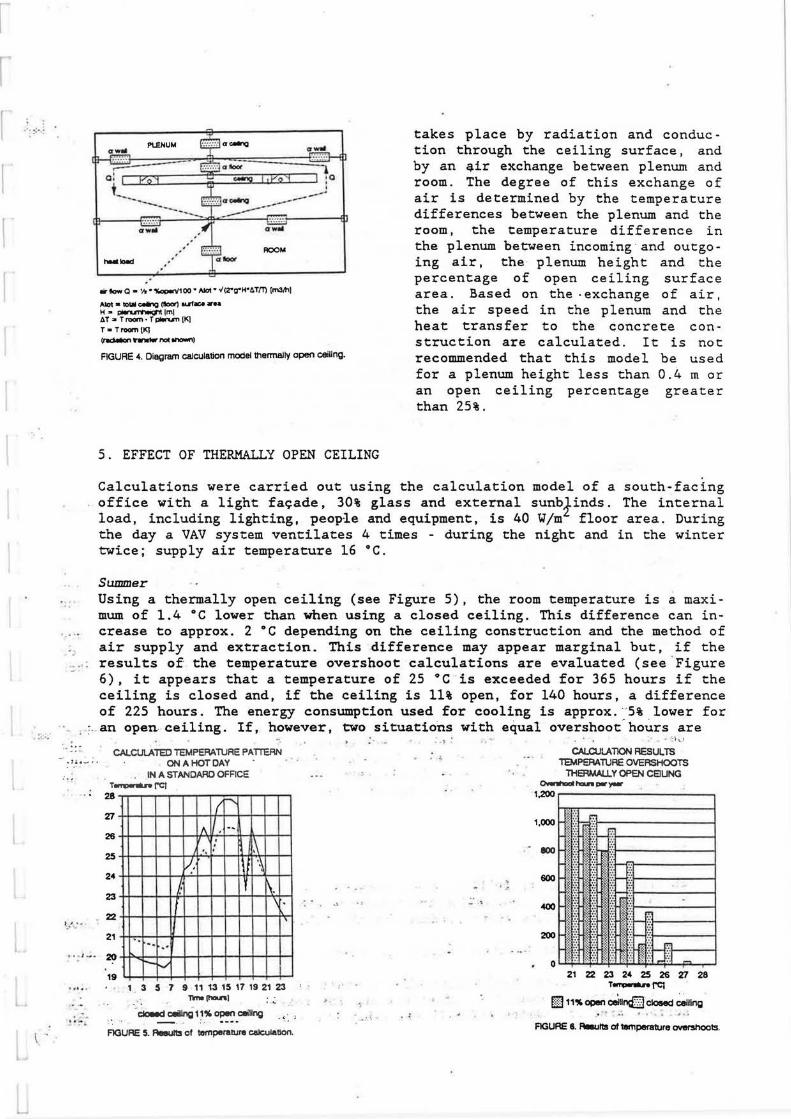
··· :> . .-
·.
• • r.• .
\ -·
twmio.d
w-Q • 'h""-'1100" Aloi" ./(2"a"H"4TfT) (m31"1
Aloi - ...... ceiing (1loor) ou1..,. .... H•~lml 4 T • T ,_,, • T pllruTI {K]
T • T,_,, {K] ~ nrw1or nae,,,_,, FIGURE 4. Diagram calculation model 1t1ermally open ceiling.
5. EFFECT OF THERMALLY OPEN CEILING
takes place by radiation and conduction through the ceiling surface, and by an qir exchange between plenum and room. The degree of this exchange of air is determined by the temperature differences between the plenum and the room, the temperature difference in the plenum between incoming and outgoing air, the plenum height and the percentage of open ceiling surface area. Based on the . exchange of air, the air speed in the plenum and the heat transfer to the concrete construction are calculated. It is not recommended that this model be used for a plenum height less than 0.4 m or an open ceiling percentage greater than 25%.
Calculations were carried out using the calculation model of a south-facing office with a light fa~ade, 30% glass and external sunbfinds. The internal load, including lighting, people and equipment, is 40 Y/m floor area. During the day a VAV system ventilates 4 times - during the night and in the winter twice; supply air temperature 16 °C.
Summer Using a thermally open ceiling (see Figure 5), the room temperature is a maximum of 1.4 °C lower than when using a closed ceiling. This difference can in-
·.··· crease to approx. 2 °C depending on the ceiling construction and the method of air supply and extraction. This .difference may appear marginal but, if the
... . results of the temperature overshoot calculations are evaluated (see .Figure 6), it appears that a temperature of 25 °C is exceeded for 365 hours if the ceiling is closed and, if the ceiling is 11% open, for 140 hours, a difference of 225 hours. The energy consumption used for cooling is approx. "5% lower for an open ceiling. If, however, two situations with equal overshoot.hours are
·'""'-''" : . ~
~.
CALCULATED TEMPERATURE PATI"EAN ONA HOT DAY
. IN A STANDARD OFFICE T..._.,...rc:J
. . • 28 (,....._
l' • ... . ~ ..
, • • J_. ..
...... .
Z1
26
25
24
23
22
21
20
19
A I, ·-". .\
J. I 'i h \. f \ . I \
.. ·- .. -1-../
, 3 5 7 9 ,, 13 15 17 19 21 23 Tlnl{ha&nl
· ~ c:eilJnQ 11% open ceiling . , , - . ·-·· ·•
FIGURE 5. Reeull3 of tempe11111.1re celcula!lon.
·.
, . , . .
. ~
. . ,
··i,..•
CALCULATION RESULTS TEMPERATURE OVERSHOOTS
11-IERMAU.Y OPEN CEILING o-lhDall'lal.n por-
1,200 .--------------.
1,000
IOO
600
'400
200
0 I Vt .. , ''&I .. ' ···T'' 1:::r 1 u.r1 ,, .. , r I I
21 22 23 24 2S 26 Z1 28 T..._....l"Cl
CJ 1i% open ceiunQ3 closed ceiling ~ ' ... -~ . . , .. .
FIGURE 8. Rlaulls of temperature overshoots.

-..
compared with and without an open ceiling, a cooling energy consumption saving of approx. 20% can be achieved. It is also possible to reduce or sometimes even omit the cooling system. It appears from the measurements taken that, if the ceiling is 11% open, approx. 40% of the heat supplied is buffered. As a comparison, if the ceiling is entirely open, approx. 50% of the heat supplied is temporarily stored. An investigation was also carried out into how much additional heat load is permissible if an even te~perature is maintained. This value can vary from approx. 5 to approx. 10 Y/m floor area, depending on the ceiling and the system design.
Winter During normal day/night operation, the temperature in the ceiling cavity will fall only slightly, even if it is a thermally open ceiling. The measurements do not therefore display any clear influence on the heating response of the room. However, it is to be expected that after a weekend, the heating response will be slower since the concrete mass will have cooled down to a greater extent. The calculations show that the use of an open ceiling does not necessarily produce an increase in heating energy consumption .
6. INFLUENCE OF VENTILATION SYSTEMS
The following points must be taken into consideration if an air conditioning system is used in combination with a thermally open ceiling.
Type of air supply device Particularly in the summer, and as a result of the thermally open ceiling, a type of circulation is produced which can lead to local air velocity increases in the room of approx. 5 cm/s. When selecting the type of supply device and air flow direction, account must ?e taken of the fact ~hat the air velocities created by the air diffusers do· not reinforce this circulation and therefore exceed a critical value. The use of diffusers with a single air flow direction (such as · lineair slot diffusers) where~ a downdraught is produced at the back of the room is not recommended. -. " - ·: · : :.:: : .
. ~ .); :.:.. . '. ::·: · Supply air qu"antity and extraction openings . • · · · ..
i i'
.. ,__ .. If the ventilation air is uniformly supplied, the correct choice of supply device can mean that a room can be ventilated up to approx. 6 times. The ex-· traction opening must not be at a ceiling opening; · but appr 'ox _ -o. 5 in. futher above the ceiling. The circulation pattern through the ceiling ·plenum can be disturbed if larger air quantities are used, while extraction is also more
---critical.
----· 7. -ACOUSTICAL ASPECTS
;-·~The suspended ceiling fulfils three functions with respect to acoustics: '. .. --·:.-' · sound absorption: regulating the reverberation . time and noise levels; · - -- -~'"' limiting the no i se level produced by the ventilation system situated above ____ . .. t he ceiling; ..!
--- ,- room-to-room insulation: limiting noise transfer from and . to adjacent ----- . rooms . · · · ·
; ~ Opening the ceiling construction affects these factors. Keasur~ments- sha"w that the reduction in absorption after opening the ceiling over 11% or 22% of its
" surface area is limited and will certainly not: c:ause problems in offices. · The ;,.--CCf•,,:••~., I; :::i'':.';('r• , , ;···,6-: •• _,. .......

·.·· reduction in noise insulation is strongly linked to the type of ceiling. The mineral tile ceiling, which had the highest insulation value of the ceilings examined, shows the greatest reduction. In the lo:wer frequency range (up to approx. 1 kHz) the reduction of an 11% open ce'iling is limited to 1-2 dB, and for a 22% open ceiling to 2-3 dB. Between 1 kHz and 4 kHz this value increases fairly quickly. However, the deterioration at higher frequencies can generally be made up for by using simple provisions in the technical systems.
~-·· -.
, .... ... .
As far as the room-to-room insulation is concerned, it is observed that by opening the ceilings it will be necessary to extend the partition walls to the floor or to fit barriers.
8. GUIDELINES FOR THE APPLICATION OF A THERMALLY OPEN CEILING
Ceiling design A free plenum height of a minimum of 0.4 m, no serious obstruction caused by air ducts, luminaires etc.
- Approx. 15% of the ceiling must be opened; the openings may be optically sealed with grids. Half of these openings must be made along the fa~ade. The other half of the openings can be made at the corridor wall or evenly distributed across the room; the split width must be a minimum of SO mm. Dust accumulation on the ceiling or the release of dust or fibres from the ceiling material must be avoided as far as possible.
Air-conditioning unit - Night ventilation (mechanical and natural) is required to extract overnight
the heat which has accumulated during the day. - The use of diffusers whose air pattern reinforces the ceiling circulation
must be avoided. - The ventilation rate must be a maximum of approx. 6 times the room's air
content. The air extraction opening may not be made in one of the ceiling openings (minimum distance approx. 0.5 m).
- Air must be extracted directly through the luminaires.
Acoustical aspects - Keep in mind any provisions required for reducing the noise from the tech
nical systems. - Extend partition walls to the concrete floor or fit barriers above the par
tition walls.
References
I Adviesbureau Peutz & Associes B.V.: Investigation into the properties related to building physics of thermally open ceilings Report no. E 131-3, Nijmegen, December 1986 (in Dutch)
II Adviesbureau Peutz & Associes B.V.: Investigation into the properties related to building physics of thermally open ceilings in a mechanically ventilated room Report no. E 131-4, Molenhoek, September 1988 (in Dutch)

I r ·-:·:·: · ROOM INDEX TEMPERATURE AND THE MERGENCE OF THE RADIATIVE AND
CONVECTIVE MECHANISMS
M. G. Davies
ABSTRACT
School ct Architecture and Building Engineering, The University, Liverpool L69 3BX, United Kingdom
. III 4
The article reviews the traditional design method for handling long-wave radiation and convection in a room, and outlines a model which avoids the logical difficulties of the earlier model. The new model is based on an optimal <least squares) star representation of radiant exchange, explicit inclusion of emissivity, consideration of the observable effect of a source of longwave radiation, linearisation of fourth power differences of temperature, inclusion of comfort temperature, and an exact circuit theorem to justify the merging of the radiative and convective mechanisms. The approximations necessarily incurred are listed. The model's implications for heat needs are noted.
!'
INTRODUCTION
. The traditional model to express heat exchange in a room is very simple. Room temperature is described by a quantity Ti, not closely defined, but often termed 'air temperature'. All heat input to the room, whether . by radiation or convection, is taken to be input at Ti. Heat is driven from the room by convection and. radiation together to ~ solid surface J,
· area Aj, through the conductance A.1 • <Eh;.+h.,>, between Ti and the surface temperature Tj, <where h,., the radiative coefficient, is about 5. 7 W/mZK at room temperatures, E is a measure of surface emissivity in the enclosure, around 0. 9) and h"' is the convective heat transfer coefficient, . conventionally about · 3 W/m2 K. > . Heat is · ' lost too · by ventilation through a conductance V . say, the product · of air flow rate and
... . volume specific heat, acting between Ti and the ambient temperature of To.
(~·
Ti also acts as a measure of comfort temperature. See Figure 1.
This model is: Ci> simple to understand (ii) easy to handle
:t
T 0
ventilation v
all heat input, convective and radiative
Qa Qr '· t ..
/~T. · 0 ~ the' ·~·oorr{'·a~· •air' temperature, also comfort temperature ambient
· t empera_t ure
. 1
, Aj<Eh +h > r c
-: ~ l #
"represeting a merged radiative and convective flow
T a typical room surface j <with possible conduction losses)
FIGURE 1. The traditional model for room internal heat exchange.
-. ···~

·:
<iii) satisfactory for most plant sizing exercises, ventilation rates and in well insulated buildings.
The model however is not logical however since:
especially for low
(i) it fails to distinguish between radiative input, which has some direct heating effect when it falls upon occupants and furnishings, and convective input which has no such effect, (ii) air temperature as such cannot 'drive' a radiant flow of heat to the walls, Ciii) the model allows a radiant heat input to be 'lost' directly from the enclosure by the ventilation process, without hitting any s·olid surface -an evident impossibility, Civ> the model does not make clear the origin of E: does it depend upon the emissivity of the surface in question alone, or does depend too on the emissivities of the other enclosure surfaces? Is E affected by the enclosure geometry? <v> the model does not provide any more than an vague understanding of what Ti might mean; we do not know how it is related to the real <volume averaged) air temperature Tav, nor to comfort temperature Tc. <Tc is usually taken to composed of half air and half the room radiant temperature but the model defines neither quantity.>
These logical problems were recognised in the 1960' s and attempts were made in France and in the UK . to devise a model which would serve better when ventilation rates were high and and there were large radiant gains.
In the UK, the . concept of 'environmental temperature' tei was evolved, which was based on both air and surface temperatures. · It was intended to serve as a logically based overall or global room temperature. This is a valid aim, but unfortunately the logic used to set up this model was seriously flawed because of an inadequate handling of radiant exchange. The purpose of .this paper is to propose another model for handling room internal heat exchange in a design context. It is very little more complicated than . the traditional model of Figure 1, and is very similar to the environmental temperature model, but avoids the logical difficulties associated with both. It is only possible within ·the space of this article however to state what the_model is and the basic ideas it rests upon: , the author .: has provided more expository accounts elsewhere [ 1, 21 .
2 THE RAD-AIR J«lDEL
The new model, the 'rad-air' model is illustrated in Figure 2. Ambient air temperature, To, the typical surface temperature Tj and the ventilation conductance- ·v all have the same meaning in .the two. figures. The lumped heat flow from the room as a whole to a typical surface is now taken to be driven by the rad-air temperature _Tra. . The volume averaged air temperature Tav ·now drives the ventilation ' heat loss and there is a conductance X <having a numerically large value> between Tav and Tra. ·· E becomes the subscripted variable, EJ. The model rests upon a series of logical transformations and specifable approximations whicfi will be listed. · -·· ., · ; ! ~·;:? ·. -
; ~ - ~
·. .·~
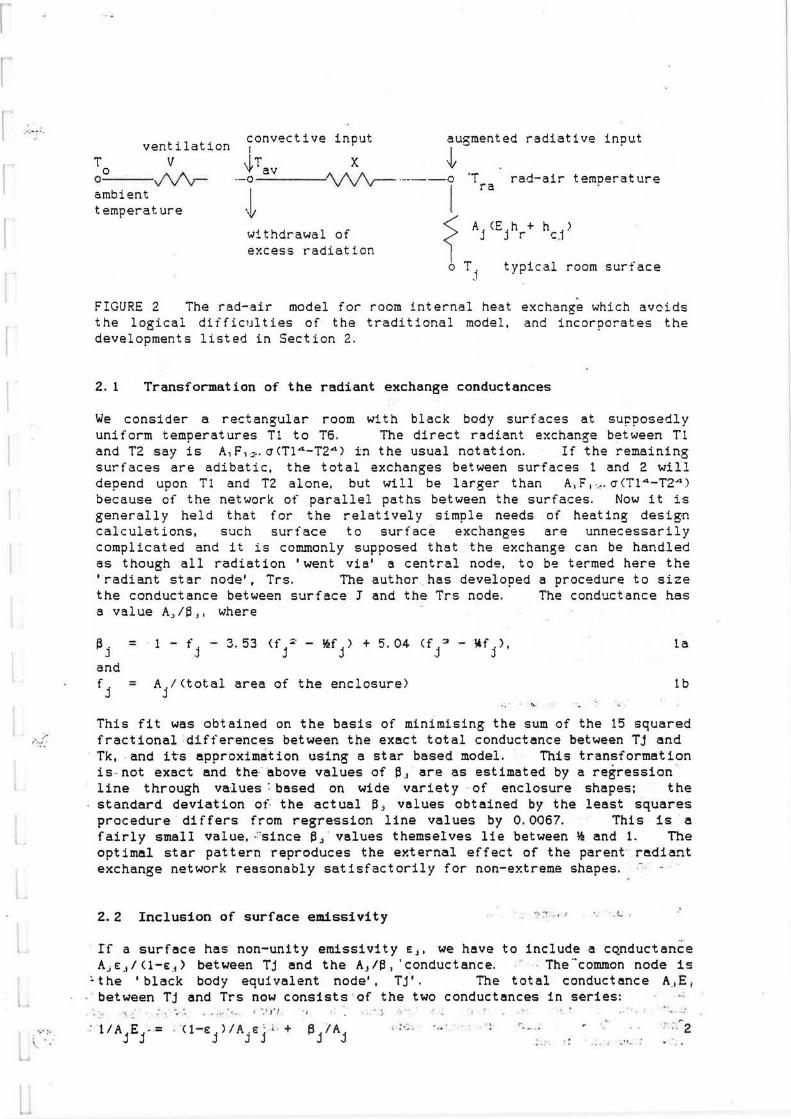
_-:···· ventilation
T V 00 J\l'v-ambient temperature
convective input augmented radiative input
Jr x t --o av A.. A A - -----o 'T rad-air t emoerat ure
. v v v-- I ra .
~ A J <E j hr+ h c.J l
o T. typical room surf ace J
.l e:r.cess radiation withdrawal of
FIGURE 2 The rad-air model for room internal heat exchange which avoids the logical difficulties of the traditional model, and incorpor-ates the developments listed in Section 2.
2. 1 Transformation of the radiant exchange conductances
We consider a rectangular room with black body surfaces at supposedly uniform temperatures Tl to T6. The direct radiant exchange between Tl and T2 say is A,F,~.cr<Tl 4-T24 ) in the usual notation. If the remaining surfaces are adibatic, the total exchanges between surfaces 1 and 2 will depend upon Tl and T2 alone, but will be larger than A,F, .,.cr CT1"'-T2"') because of the network of parallel paths between the surfaces. Now it is generally held that for the relatively simple needs of heating design calculations, such surface to surface exchanges are unnecessarily complicated and it is commonly supposed that the exchange can be handled as though all radiation 'went via' a central node, to be termed here the 'radiant star node', Trs. The author has developed a procedure to size the conductance between surface J and the Trs node. The conductance has a value A, 113;, where
13j = 1 - fj - 3. 53 (fj~ - ~fj) + 5 . 04 (f1~ - ~f . ), ·- J
la
and
fj = Aj/Ctotal area of the enclosure) lb
" This fit was obtained on the basis of minimising the sum of the 15 squared
•./ fractional differences between the exact total conductance between Tj and
.· ... · ;.
\ ..
Tk, . and its approximation using a star based model. This transformation is -not exact and the: ~bove values of ej are as estimated by a re~ression · line through values : based on wide variety · of enclosure shapes; the standard deviation o~ the actual 13j values obtained by the least squares procedure differs from regression line values by 0. 0067. This is a fairly small value, ·''since 13.; · values themselves lie between \'.! and 1. The optimal star pattern reproduces the ey,ternal effect of the parent" radiant exchange network reasonably satisfactorily for non-eY.treme shapes.
2.2 Inclusion of surface emissivity ~~ ·.: ... 1~ :
If a surface has non-unity emissivity e:j, we have to include a c~nductance Aje:.1 /(1-e: .1 ) between TJ and the AJ/13, 'conductance. The ··common node is
~ the 'black body equivalent node', Tj'. The total conductance A_1E 1
. between Tj and Trs now consists·of the two conductances in series:
' . '· ,, . . -.... I •.1 1'}
: l!A E -= · <1-e: >IA e:' · ~ + j j j j j
. ,
e/Aj .. ,
;· :• ..... : . . : - -
: ... z . . .

2.3 Strict handling of incident radiation
A radiant flux which physically falls upon surface A, is to be handled as though totally absorbed at the black body e~uivalent node Tj', <not e.s though part absorbed and part reflected at Tj itself.)
2.4 Approximate handling of incident radiation
The radiant star node Trs is a fictitious concept: we cannot meaningfully 'input' radiant heat there. If however we do, the temperature so genera.tad there <the elevation above wall temperature), proves to be a fair approximation to the volume-averaged observable temperature Trv that is generated within the enclosure due to the presence of a longwave radiant source within the room. <A sensor within the room perceives a higher temperature that that of the walls because of the radiation it intercepts. ) If the radiant source is placed in the middle of the room. Trv tends to be some 14% higher than Trs, <relative to wall temperature); if the source is nee.r the wall, the two temperatures are more nearly the same. Thus Trs, which is physically meaningless but easy to calculate, will be taken as a sufficient estimate of the physically meaningful volume-averaged obsrvable radiant temperature Trv.
2.5 The transformation from Tj'-Tk' to Tj-~k
For 'compatibility with convective and conductive exchange, it is more convenient to eicpress heat flows as driven by temperature differences, rather than by differences of fourth powers. The above conductances, with units of m2 , must then be multiplied by h .. j where h = a. <T 4 -T 4
) I <T -T ) 3 rj j rs j rs Thus the conductance between Tj and Trs becomes AJE .,. h,..j, now with the usual units of WIK
... ··· : t ..
2.6 Two star networks ,.. ;_' • ..: : - • ' .""! ' ~ l r I • .-, :: = c, ~ .. A radiant heat source Qr can, according to the• above. formulation,·._- be ~reated- as though it is input at the 0 star node Trs~ ·from where it is distributed to the enclosure . via the A.,EJ .. h,.; conductances. : ~ -· · Now a .convective input Q .. is routinely . handled as though input at the average
.. ~ir temperature Tav,. from which it is distributed to the enclosure via : convective conductances of type Ajh~J• or is lost by ventilation. - ~ ~ - ·· The
.enclosure ex~hange can therefore be expressed in terms of a radiant and of a convective network. . . This provides a flexible model for room heat exchange.,. -: ,_ . , 3_ . _ : _ .. . • :·::::
2.7 Comfort temperature, Tc .·* ::··· •'; .. :!" - r~
The comfort temperature Tc can be expressed in .. terms of . the two star temperatures mentioned above. Dry resultant _. temperature is given as Tc = . . ~Trs + *Tav •. : ~ :· "" ·· . · , " '"' ·. :; · _. .. ... ·-~~-:·' •:· · .· .. . 4 Since a sensor .registering Tc has a very small area compared · with room surfaces, Tc must be linked to Trs e.nd Tav by very small conductances.
:That is, Tc is a high impedance node. .., <The other enclosure nodes are low impedance nodes. >

· · "".: · ·: ··
:;: : ...
. _::·::::,
2.8 Merging radiative and convective exchanges
It is possible to merge the radiative and convective transfer mechanisms through use of a circuit theorem which is the inverse of Norton's theorem. It is presented in [3]. The theorem demonstrates that the radiant link S <= AjEJhrj> between Trs between Tav and TJ, can be air temperature Tra and Tj.
and Tj, and the convective link C <= A,h .. ,_.) treated as a merged link S+C between the rad
There is the link X = <S+C>·C/S between Tav and Trs. The rad-air node Tra is a linear combination of Trs and Tav:
T ra = T · S rs s + c
T · C +
av 5 + c 5
The air temperature Tav is retained in the rad-air model, but the radiant star node Trs is excluded. The radiant input Q,., previously input at Trs, has now to be handled as an augmented input Q,.·<l+C/5) at Tra together with the withdrawal of the excess Qr·C/5 from Tav. The theorem demonstrates that the v'alues at the principal temperature nodes Tav and Tj remain unaltered, and that Trs can be found from the above equation.
The result is exact if the entire surface of the enclosure is at a uniform temperature (so constituting in effect · a single surface>. If the enclosure consists of two or more surfaces at different temperatures, then . we have a series of conductances. 5,, 5::?... and C,, C::;-... The above result remains rigorously true if C, /5 1 = C:;;.!S,., = . . . <S = !5; and · C = !Cj for use in equation 5).
Comfort temperature Tc cannot be included in a circuit representation of the rad-air model because the model does not incluce Trs, but the value of Tc can be computed from it.
3 · DISCUSSION :"1 ... ... .
If we wish to perform heating and cooling calculations in terms 'of · a single star model - and this is the way in which they have normally been
· carried out - the above series of ~logical ·steps seems essential to justify a model of this kind. ·. =._;··The reasoning· entails· certain approximations however which it is worth summarising:
(i) ·The radiant star' model for radiant exchange, though 'optimal' since it is based on a least squares argument, does not ··exactly reproduce the effect of the surface-surface model for radiant exchange.
(ii) The ~j .values found from the regression formula <equation 1) do not reproduce exactly the values obtained for the rectangular enclosures which served to establish the regression expression.
(iii) The radiant star temperature Trs which is used to estimate the physically meaningful average observable radiant temperature Trv is significantly lower than Trv; Trv depends on the position of the source (and indeed on the characteristics of the sensor). The radiant input to
.Trs is that part of the output which can be intercepted by objects in a room <so the radiant output from the back of a wall-mounted radiator is excluded>; this feature apart, the value of Trs is independent of position of source .

.·
Civ) Since both convective and radiative transfers are roughly proportional to area, the relation C, /S, = C;,/S::· = . . . will normally be near enough true for design purposes. It may not be true for surfaces of low emissivity or where h., .; is exceptionally large.
It may be mentioned that the rad-air concept has been arrived at by an unsymmetrical handling of the Tav, Trs model: Tav retains its existence, but Trs is excluded. This means that losses of he~t from Tav - ventilation losses - can be modelled by the rad-air model. b•.1t losses from Trs - long-wave radiation through an open window - cannot .
The model provides simple expressions for the heat need to maintain given conditions . It can be shown that the total heat need from an internal source of heat to achieve a given comfort temperature Tc can be expressed as
Qa+Qr = <T - T ) <V + L> + CT - T ) CY.!V - Y.!L . <1-cx)/ <1+c0) c o av rs 6
where L = i:CAj. U.1 >. the total conductive heat loss. and ex= rc,n::s .1 . The first right hand term is that given by the traditional model. The second is small by comparison but it demonstrates that both the mean and the difference of the air and radiant temperatures are strictly speaking needed to define the heat need. This comes about since Trs and Tav are specifiable independently: the total heat need must thus depend on two pieces of temperature information. Comfort temperature - , the mean of Trs and Tav - provides one of them: another is needed and is provided by the difference, Trs-Tav.
REFERENCES
1 Davies M. G., Design models to handle radiative and . convective exchange in a room, American Society of Heating, Air-conditioning and Refrigeration Engineers .Transactions, : ,94 Pt 2, , 173-195. 1989 . . ~. . ...
: . t:, . ,- ; -· -.. . . . -2 · ~ _ • Davies .M. G. ,~ ,~Rad-air tempera~JJre - . the global temperature in an enclosure, : Building Services. Engineering .Research and Technology- JO, .. -89-104, 1989. . ~ : !1: . ..:; . ·:· ;:·; : -.··- ·.-'·'· ;r:
:· 3 .. ~--·Davies M.G., A~new- .circuit , theorem?,. - Institution · of Electrical Engineers . Review; .;January 1990, p 8 •. :·-- :: · · :~:: .. :
. ::
--~ . ; ~ ~!.J
'
·~ .. ' ---· ._;.·
: £~ -" -·.-: .._,. , ,~ , • r •
_: r;' ~
..
, :-r·;··..:.: ;~.?. ~"1- G :>·y .. -.... . tt;:
~ - ..:..:.~ ~. -"' .... :~:-:J -~---~ :·1 ·~~:;r~'- -.:
.. ... ~ .:-.-!. ... ~ 1 , :! .!_;:: . ' ~ t '!
!::_· . ... .. .. ~~~:::i:;- , .. ~·
•. : ... :.:.1~ ~: . 1« ~·:~"~~·:., ·~'-: ~ .").. ". ~
. • : r · :·_: · -~ :·'.;: -::,_:-:::J - ~· • "". •" -~~ (; :JI~::. l:; ·"· ;'; • •.J .. "; ,-[ r •• • ·.;
.. ~ .. ': -~ ~ ~ ..; -~ ::!.·.1.,!':- ~~; ,:,~~ .~11 ~ . ,, ...
··=...: ; ... ·,:; .,·· 111·~· -~- ).. l-,f .. u
:_ :_ .. -." -
.'1: •
. .... - ..
0 c .
-. . . . .
' -·~i· • •.
I I f
' •
( ·:,.
III 5
GROUPING OF BUILDING ENVELOPES - AN ENERGY CONSERVATION MEASURE
Dr. N. K. Garg Central Building Research Institute
Roorkee - 247 667, India
Keywords Energy conservation , building envelopes, grouping, simulation.
Abstract
passive measures,
The building envelopes which man has developed so far of ten require mechanical systems involving expensive equipment utilising fuel and electrical energy for thermal comfort. These sophisticated systems (active systems) can not be adopted in several situations when it is difficult to afford and to maintain them. It therefore, becomes imperative to look for passive measures (measures not based on electricity etc.) for thermal comfort in building envelopes. The present paper argues that thermal performance of a single building envelope (of one space) is worst and focuses on assessing the extent to which grouping of building envelopes together is capable of improving the climate of their interior spaces. It quantifies the extent of thermal discomfort as a function of ambient climate and ways of grouping of building envelopes.
Introduction A study has been undertaken with an objective to quantify the contribution of various characteristics of building envelope on· the resultant thermal environment of -its interior spaces. The present paper focuses on the effect of commonly used horizontal and vertical groupings of building envelopes on the thermal discomfort in their ~ interior spaces.
The thermal environment in a reference building envelope is determined, an index of quantification of discomfort is establis8ed and the degree of discomfort is - calculated. Reference ·building envelope is grouped horizontally and verticallr and an attempt is made to quantify, how far the thermal discomfort can be controlled with the help · groupings. Methodology of computer simulation has been adopted for this study. The computer program used, th~ reference building envelope taken up for studying the thermal performance in different situations, the climatic data adopted and the index . of thermal performance evaluation accepted for the study are
- narrated in following paragraphs.
l!J A Al V V ~ t'7 ~ V r,., • • • • 1 r •t I - 61 •Ir: r" ~" •• • - -
The Program Program 'Temper' developed at the Commonwealth Scientific and Industrial Research Organisation (CSI~O)t Australia has been used for this study (1). The program calculates the sensible and latent air conditioning loads for a specified indoor temperature within the building or alternatively, indoor temperature for a specified external thermal environment. It consists of a heat transfer model of a building, which is subjected to specified external climatic environment and an internal loading according to building usage and occupancy. The heat flow through all solid boundaries is calculated by finite - difference method, using the specified climatic and internal load data and full account is taken of the thermal storage effect of the structure of the building (2). The program broadly requires the following input data: (a) Details of building components and their distribution into zones. (b) 24 hourly values of ambient temperature for each day. (c) 24 hourly values of direct radiation for each day. (d) 24 hourly values of diffused radiation for each day. (e) number of day for which simulation is to be done (upto 8 days). (f) Internal loads. ·
There is a catalogue of thermophysical properties of commonly used building materials built into the program (3). With the help of input data (a) it calculates the 'overall h!at transfer co-efficients' for different heat paths and carries out heat transfer calculations with respect to input data (b) to (f). The program has been modified to extend its use to the Indian conditions. A validation study of the modified program conducted at the Bartlett School of Architecture and Planning, University College, London, U.K. (4) has . established its suitability.
The Reference Building Envelope A building may be defined as an organisation of rooms which cooperate with each other for ,different environmental/functional purposes. A judicious organisation of these rooms on the ground can imporve thei~ thermal environment. · ,·Therefore, the building envelope of an isolated room is most crucial from the point of view of its thermal environment. For the ·purpose of this study, therefore, building envelope of an isolated single . . enclosure with fallowing details has been taken as a refere~ce building envelope: Plan dimen~ions of envelope - 3m x 4m Height of .~nvelope - 2.7m . Walls - 230mm traditional brick walls with 15mm cement. plaster
on both sides. . ~ _ Roof ~, lOOmm reinforced .concrete slab + lOOmm brick. layer over
it and 15mm plaster on both sides. Door - lm . x 2m in size, of ,, hardwood,. · of SOmm . average
thickness, in north facing wall. Window - lm x 1.2m, of 6mm plain glass, in south facing wall.~ Floor - lOOmm brick floor over ground, with SOmm concrete
screed. Colour of walls and roof - white Infiltration - zero air change per hour.

I I
.... ·': .. ;:: The Climate
,= .. :.~.: . ·
:,.;:_:_
' .
This study has been limited to summer days in May when the global radiation is maximum in New Delhi, India (Lat.=29 deg N. Long.=77 deg E). The data for New Delhi, recorded by the Metereological Department, India, as compiled by A. Mani (5), has been adopted for this study.
The Index Maximum indoor temperature may be a good index to evaluate the relative thermal performance of building envelopes. However, there may be some situations where the peak value of temperature is not high but its persistence is longer. Therefore, the 24 hourly values of indoor temperature in deg C, above the accepted limit of thermal comfort, 27 deg C (4) have been integrated and the net value of thermal discomfort in 'deg C. hours' has been taken as the basis of comparision.
Strategy of Evaluation In general, there can be sev e ral systems of grouping the building envelopes but two systems, in particular are most commonly followed:
(a) The (like row Reference in Figure
..,
building housing, building I.
envelopes . are grouped horizontally in row each row consisting of about ten envelopes): envelope grouped as per this system is shown
(b) The · building envelopes are grouped on e over the other normally upto four storeys (The National Building Code of· India, permits construction upto four sto rey . for buildings without lifts). The reference .. building env elopes grouped as per this system is_ shown-in Figure II - --·' ·· ::. ·- ·--·- ------ ·
....- - -.-· ..... .... ., , ------·--_.. ................. _,..,. _ ...... ·~·~~....., ....... ....,.. _ . .. , ;
• ·1- - _ .. , ..... ,.....-- _,., · -····~-._._ _ .... _._ ..... ............... . ___ , ,,. -·- ... . ............ -1- _...,.
:"9~~..-~ ... __ · ~~: ·:~-·; ·.i- .. :- •d• ~"-•' -·--~'!\!i.-
l ;. - -
32.5 deg c l' -.- -~ ·ir-·"'·- _____ .. ~- ...... #' ~·•'\_,,. .,. .... _ .. ..
~---~--------- ~ - ...... - ........ ~ .. . -.- [ l&xta1.1111 i'~e"h.r• vli'hou't ,-. --..-~ gr-oup I "'ii • 32. 5 de~ C
-----r ,./
••;, --: '
~. I
' ?1 . ~~7 :;.·' .,, ,..,,..,..~-~.............i:~ ----·- ·-
rt - - T1--.,,--..,1r--_,.j __ ,.I --- · • • •• !:.i :·, ~, . • · ~ ,,·< bl ~ , Si& (ll ! lleX I IWlll "t.-per"eture i n !! ~ ~ ; ~
• • ~ ·1..., '
.: :.a •- :.a :., . .... ...,· :. :. . gr-oup I no : :·, ·~ - . ·' I I I I I I I ._ ._.. · ·· • • • "
I I I I -I s I 6 I 7 I 8 I I I '-Cl ~- - . NI_ 11 21 ;:, I
J 111~ 4
.. , ... . <~~ - .~ .. ~·:r.,
91-- Clsc:ainfarl' In dmg C hrs • . .....
~ ti: ~ ~ :ir ~ ~ ~ ~ bl 111 n I 1MJ• 't-per-e"ture I n
c. ;. ; ;. ' r ;. ' ' c. c;r-ouplno v "'-..J c· 'n I •Ulll -tW11p9r-O"tur"• "'i 'ttiou-t 30.1 deg C cyauping • 30.1 ~ C
FIQE I. Cluentlflartian af Dl·scmfcrt In Har-lzontel ~Ing.
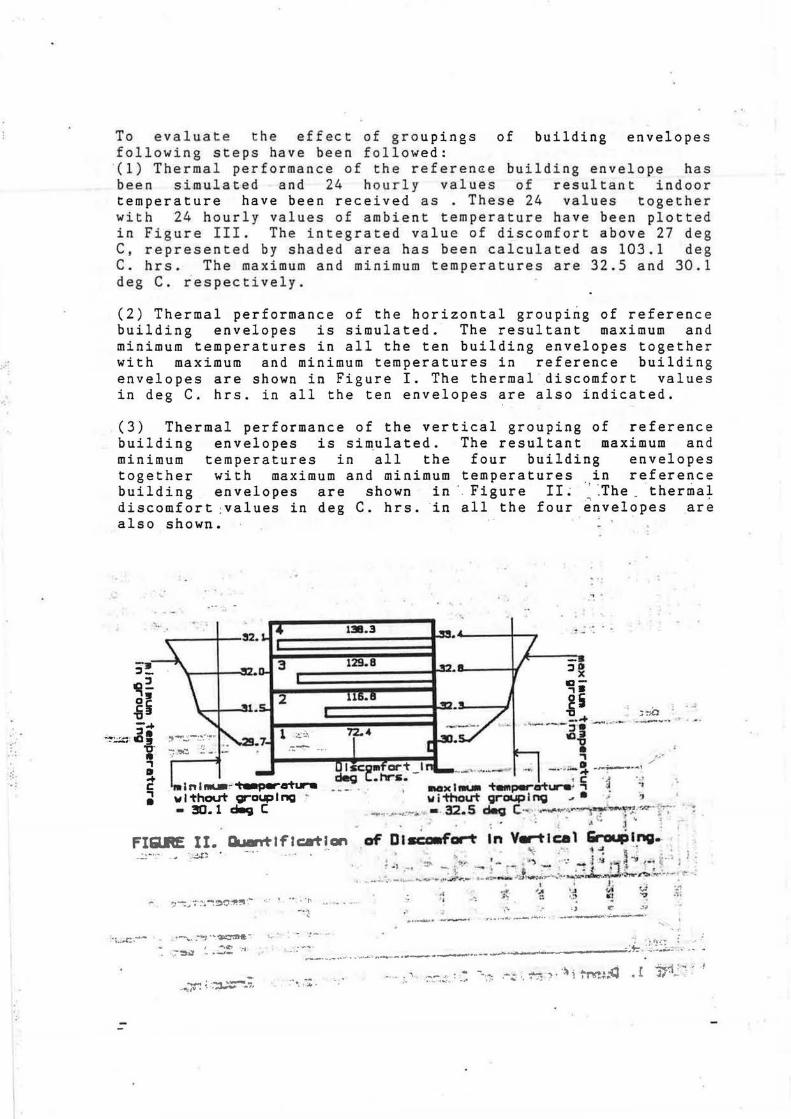
:.•
' ..
::
To evaluate the effect of groupings of building envelopes following steps have been followed: (1) Thermal performance of the referen~e building envelope has been simulated and 24 hourly values of resultant indoor temperature have been received as . These 24 values together with 24 hourly values of ambient temperature have been plotted in Figure III. The integrated value of discomfort above 27 deg C, represented by shaded area has been calculated as 103.1 deg C. hrs. The maximum and minimum temperatures are 32.5 and 30.1 deg C. respectively.
(2) Thermal performance of the horizontal grouping of reference building envelopes is simulated. The resultant maximum and minimum temperatures in all the ten building envelopes together with maximum and minimum temperatures in reference building envelopes are shown in Figure I. The thermal discomfort values in deg C. hrs. in all the ten envelopes are also indicated.
(3) Thermal performance of the vertical grouping of reference building envelopes is si~ulated. The resultant maximum and minimum temperatures in all the four building envelopes together with maximum and minimum temperatures in reference building envelopes are shown in· Figure II~ ., :The thermal discomfort ;values in deg c. hrs. in all the four envelopes are also shown •
-. ~-
~~ o!I
.al -.... ~.
- ···- ID9 ,. __, 'tJ'
• , .. .... c , •
.. :
. '
:5"o x .a-,. 5Z i . . il.... ~~ .. ..... .,_..-.-::l .• _ ... ...... - .
IDi .., f',;
I ic:g11f'ari' _I "'-~~·-~· ··- I .. ;., I """·'"'"' ~ _,.,.w---~· ,,, d9Q l...hrs. , c ·.• ._,
lie)( ·- 't9111!M'"'crl...-.' ., iJ ., w i thcnrt ;roup I~ ... • ;
...,.-:. ·J¥-I .• _,_... ---. .32.5 ~ C·· ··_ ... ~~~""'~·~'f'J:"f~ i~ · ~ • .. i .~ • ~ • # : ~ .. .s l . ~ ,. ~ .
FIEilE II. Dumri'lflc:atlan af Olsc:cmfaM In V.-tlcal lirauplng •. , r~ ' ~ • ~ ,,.·. • , 1~ ft • : 1
- - ,.:!J'.~
., .. "": ... · -: ·;;.~~ti~ ·.- ~ .... . '. fl
-·~
... - · -. .r· • ...,,. ~ - - . " - " ' ' ! I : !!' V. '- ' • ') .. . ~ - .J 1!~;f "'ll , _ , ;:·' . ' •
~ - -.~~. _,:._. ....:~ · ··l - :J;~ ... 1 .. . , ;.~ .,J, ... ~.ur·•,~·~~~ 1 . ;_.~.~.~.-- ' ~ ,:
,, I
.. ___.... . ·--~
' • J• . • ._. Ii' v ·-~ •.:! "! "? .i ; ~ .. ~ ;, IC" .~_ii
,,... .. .... ..,,.. ..... ...->'-';••· ' --~· . .:--·
'"' ).~..C:.~....... ."!---.. ~· .... ~-: ...... .!- . ~
·.7::1'>1 ,_ • .:::: ... • • :-:._ ___ ,. •••• •• ,.~"--.. -·----··-------- --:.~. :~'.:s, :. _ _, -
. .,~ ~ :~i..,:-.. ;: ~·. ~ .4' . . ~ ·.":'.~.:..~'. . ~: .... ,,~ .-..:; .. M ? · ·~ i ~m~;Q • r 1;':1.,'.:: ;

r
f
r
. ·:
· -· !'1
:·:-·: _ .... ·
.···:! ..
Discussion In the horizontal grouping (Figure I), the envelopes on either end of the row remain appreciably wa~m during the day and equally warm during the night, as compared to envelopes located in the middle of the row. The envelope on the west end attains higher temperatures during the day and night hours, as compared to the envelope at the east end of the row. It is interesting to note that the maximum temperatures of all the envelopes grouped together, have considerably reduced from the corresponding value (32.5 deg C.) in the ungrouped situation (Figure III). This confirms the premise stated above in the paper that isolated building envelope is most crucial from the point of its thermal environment.
In reference building envelope which is an isolated envelope, the discomfort is 103.1 deg C. hours. (Fig. 3). This value has significantly reduced (74.1 to 51.8 deg C. hrs) by grouping the envelopes horizontally (Figure I). It indicates remarkable imporvement in the thermal performance of building envelopes.
In the vertical grouping (Figure II), the building envelope in contact with the ground, is considerably cooler during the day as well as night .hours, as compared to the one just above it which stays only marginally cooler from the one over it. The temperatures are much more severe in the upper floors. As compared to the thermal performance of corresponding reference building envelope, the maximum day time temperature in the ground and first floor locations are reduced while those in the upper two floors are increased_ The minimum night time temperatures are slightly reduced in the ground floor but significantly increased on all other floors .
u . l.!I
IU
c . a. ::IC
IU
.... 71.
-25
. . ·
., .•J ., - •
ifwnMll dlsconif'ort repr-Heri"t•d by sheidltd aree • 103. l dee; C. trs
· ' · .:
~ s 7
l • allb : •rrl +e11p ~· pr-Of i 1 e • r-esulten-t 1'..np. _profile
in r-•f'•r91'1Ca bul Tding · - 2 9"WI
1 op9. .-.mrm I iii ii 11111111 Iii Ii 1111111 II II Ill llltl1
1
upper I I 11 I -t of ca111for-fl27-de9
g 11 13 15 17 ·.: l!!I " 21 ~ .. H. 0 U R S >
• , . ( • ""!
FIQft'. III. au.nttflce'tion of Discaafort In R.fm mca Building Env.lope •

The thermal discomfort in the ground floor is reduced from 103.1 to 73.1 deg C. hrs. but in upper floor it is sifnificantly increased (Figure II) .. It indicates that by grouping the envelopes vertically, the discomfort only in the envelope on ground floor is reduced but it is increased in the envelopes on all u~per floors. The contact the building envelope with the ground is, therefore, very important.
Conclusion It may · be concluded that if building envelopes are grouped horizontally in a row, the discomfort in each one 1n the row is reduced considerably. The reduction in discomfort is more in the building envelopes which are in the middle of the row (from 103.1 to 51.8 deg C. hrs.). The reduction in discomfort is mi nim um i n t he bu il di ng e nv el op e located at the west end of the row (fr om 10 3 . 1 t o 74.1 deg C. h rs.). It may also be concluded that if the bu i ld i ng envelopes are grouped vertically, the discom f ort in the bu i lding envelope on ground is reduced (from 103. 1 to 73.1 deg C. hr s .) but the discomfort gradually i ncrea ses i n uppe r fl oors, t he top floor being the worst (d is comfort . from 103.1 to 138.5 deg · C. hrs). The quantification study, therefore, establishes that building envelopes should be grouped horizontally and should not be grouped vertically as far as possible for thermal comfort.
Reference ( 1) N. K. Garg, M. J. Woold ri dg e , J. Longmore. Thermal
Environmenta l Control of Bui l di ngs and TEMPER, Energy
-··· De velopments, Pr oce e dings of Energex 84, Global Energy For um, 14-19 May, 1984, edited -by Fred A.Curtis,· Pergamon Press.
(2) M. J. Wooldridge, Air Conditioning Load Using Computer Program TEMPER, Journal of Australian Institute of Refrigeration, Air Conditioning and Heating, Vol. 27(12), ( 1 9 6 9 ) • .-, . . ,
(3) M. J. Wooldridge, ·user Manual for computer Program TEMPER, CSIRO Division of ·Mechanic.al Engineering, issued - . by Association for Computer Aided ~ Design, ~wMelbourn~. Austrialia, (1975). . . ;. ~~ · .. . ·.-,.-· · ·:::-~· .. ,,: ·
(4) N.K. Gar~; Thermal Environmental . Control ~f Buildings in the ;' Context . ·:- of ·' . India, Ph.D thesis, Faculty ·' of Envi~onmenta~ - Engin!~ring, University Colleg~, Lon~on, U • K .: ; · ( 19 8 4) • : .. :'~ ... . .... . _;: . · .
( 5) ... A. < ?1ani · and S. :: Ran°g'arajan, . Solar Radiation "over ... India, Allied.Publishers, . New Delhi, ' (1982). ,, _,. ''
(6) B. - G~~~~i, Man Climate ~nd Architecture, Applied Science -:. Publi'sh~frs Ltd. :l. Lo.ndon; · (1981), pp. 290. · .. - · · - ·
-~; /- ·~· ~ '£:1 r··:·: '\~
Acknowledgement - - · -'----· - ·: - .. ·- · ... ---- · - .. ... The author 'is thankful to 'Director, CBRI for supporting this s t u d y an d 1
.. t o Ms . Rain a Sa h u f o r her he 1 p in the pr e par a t i on o f. .. . .. ..,... ., .. the manuscript .• ~:·• ..... ,."} .,,__,~·.:---~·· . ,,·: ,.: .:::; ' -- · · .. . .. :-'.~
• . ~.;:;. ! .. ~· . . ...... :·1 ~ ' ;_J ·.: ~ - ..• .. .',J -~ •• ' . • . •
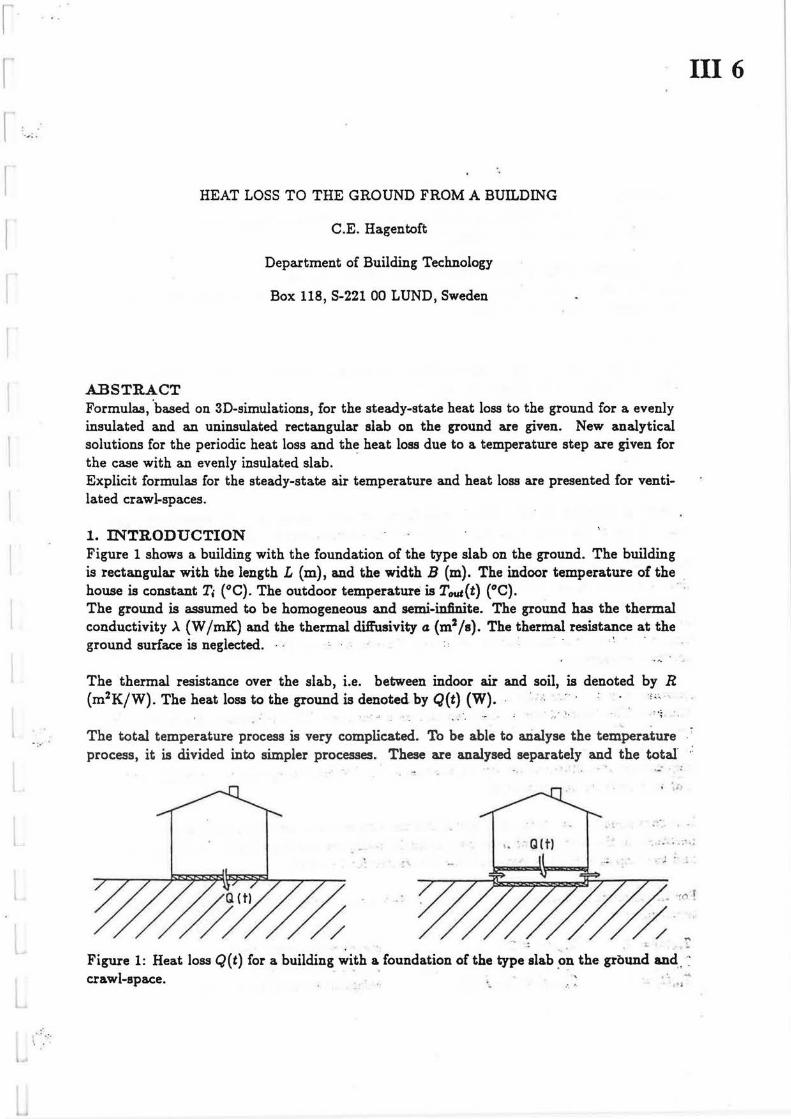
.,,,, . ~
· :··
.•
C:':
HEAT LOSS TO THE GROUND FROM A BUILDING
C.E. Hagentoft
Department of Building Technology
Box 118, S-221 00 LUND, Sweden
ABSTRACT Formulas, 'based on 3D-simulations, for the steady-state heat loss to the ground for a evenly insulated and an uninsulated rectangular slab on the ground are given. New analytical solutions for the periodic heat loss and th~ heat loss due to a. temperature step a.re given for the case with an evenly insulated slab. Explicit formulas for the steady-state air temperature and heat loss are presented for ventilated crawl-spaces.
1. INTRODUCTION Figure 1 shows a building with the foundation of the type slab on the ground. The building is rectangular with the length L (m), and the width B (m). The indoor temperature of the . house is constant Ti (°C). The outdoor temperature is Tout(t) (°C). · The ground is assumed to be homogeneous and semi-infinite. The ground has the thermal conductivity .A (W /mK) and the thermal diffusivity a (m2 /s). The thermal resistance at the ground surface is neglected. · · · · ·' ·
The thermal resistance over the slab, i.e. between indoor air and soil, is denoted by R (m2K/W). The heat loss to the ground is denoted by Q(t) (W). · ' ' ' ·
~ •i .. .
The total temperature process is very complicated. To be able to arialyse the temperature process, it is divided into simpler processes. These are analysed separately and the total.
'f}
... . .. . . ' - !
III 6
// /~ -~ '~' . .
Figure 1: Heat loss Q(t) for a building with a foundation of the type slab _on the ground and,. : crawl-space. · . .·. .· : ·. ·. ,. , ·•

.•
temperature process is then obtained by superposition. The results presented in this paper concern the slab and crawl-space only. Similar results have also been obtained for cellars, [l].
2. SCALING AND SUPERPOSITION TECHNIQUE 'Sea.ling is used to give compact formulas. In the scaling we use the following parameter for the thermal resistance of the slab. ·
d=R·>.. (1)
This parameter will be called the equivalent insulation thickness. A layer of soil with the thickness d gives the thermal resistance R.
An important parameter in the scaling of the periodic temperature process with the time period t0 is:
d -~to o- -1r
(2)
Here do is the periodic penetration depth for an one-dimensional periodic temperature process. At the depth do the amplitude of the periodic temperature is reduced by the factor e-1 .
From the theory of the Fourier series we know that a periodic outdoor temperature with the time period to can be expressed as a series of terms· of the type: Tn · sin(2rtn/to + f n)· Here n is an integer from one up to infinity. The time period t0 is one year. The amplitude of the periodic term with the time period to/n is denoted by Tn, and the phase is fn· To these periodic terms a constant part To is added. This is given by the annual mean value of the outdoor temperature.
.• • t
Another way 'or describing the .outdoo; temperature is by expressing it as a sum of step changes. The temperature is then depicted as a staircase. The components are then of the type: T; '. H(t - t;). Here H(t) is the Heaviside unit step function. It is equal to zero for -· · timE'.s less than zero, and it is equal to one for times larger than zero. The amplitude of the step change that starts at the time t; is equal to T;. For this temperature process the length .;;.i. is introduced in the scaling.
It is convenient to use both the periodic and the step change description of the outdoor temperature, in the study of the heat loss. In the following section the steady-state, the periodic and the step change heat Jo~ problems are treated for the slab.
.. -- - -- ... ~ .... . , -· For the three fundamental temperature processes we have the following indoor and outdoor temperatures:
T;n(t) = T; T;n(t} = 0 T1n(t) = O
T0 u1(t} = To '" ,_ ,··Ta~(t} = T1 · sin{21rt/to)
Tout(t) = T2. H(t)
steady-state component : ·periodic component
•• 1! ....
temperature step component (3) ...
.· · •..
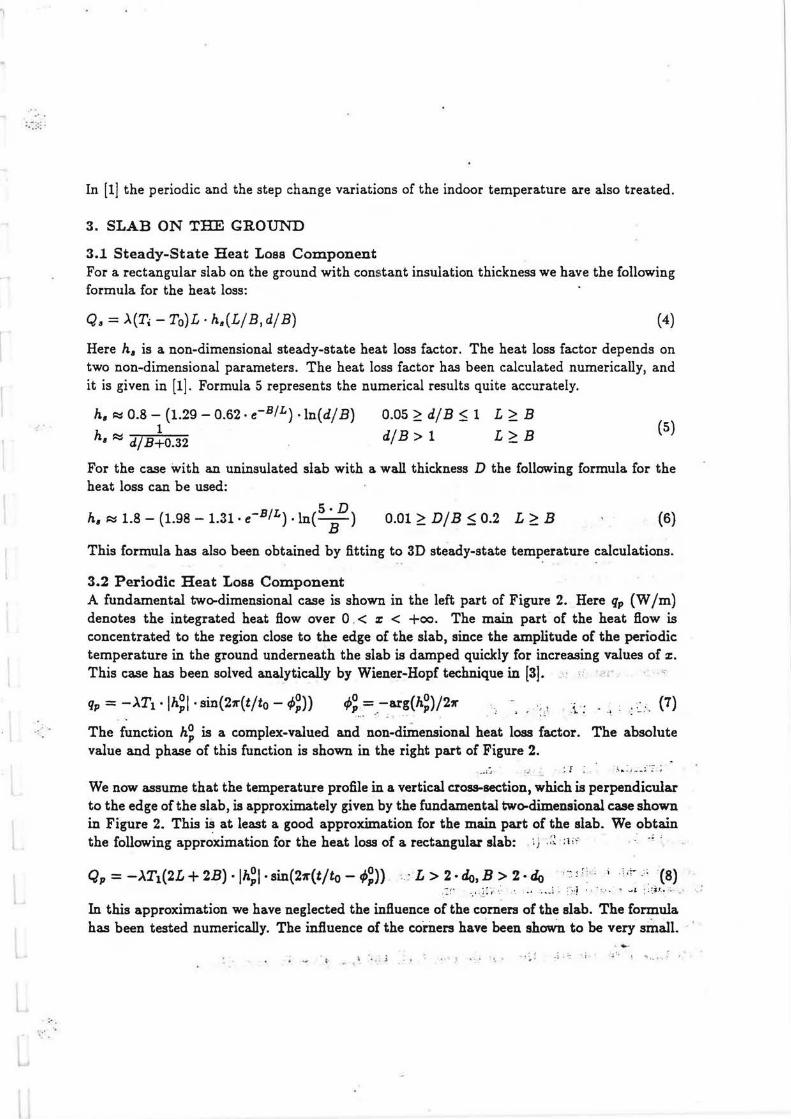
:.:;:; .
{
:· . \ •' ·~
In [lj the periodic a.nd the step cha.nge variations of the indoor temperature are a.Isa treated.
3. SLAB ON THE GROUND
3.1 Steady-State Heat Loss Component For a rectangular slab on the ground with cons:tant insulation thickness we have the following formula for the heat loss:
Q~ =>.(Ti -To)L · h.(L/ B, d/ B) (4)
Here h. is a non-dimensional stea.dy-sta.te heat loss factor. The heat loss factor depends on two non-dimensional para.meters. The hea.t loss factor has been ca.kula.ted numerically, and it is given in [1]. Formula. 5 represents the numerical results quite a.ccura.tely.
h. ~ 0.8 - (1.29 - 0.62 · e-B/L) · ln(d/ B) h ...., 1
•,..., d/B+0.32
0.05 ~ d/ B $ 1 L ~ B d/B > 1 L ~ B
(5)
For the case with an uninsulated sla.b with a. wa.ll thickness D the following formula. for the hea.t loss can be used:
-B/L 5. D h. ~ 1.8 - (1.98 - 1.31 · e ) ·In{-)
B 0.01~D/B$0.2 L ~ B {6)
This formula. has a.lso been obtained by fitting to 30 steady-state temperature calculations. . .
3.2 Periodic Heat Loss Component A fundamental two-dimensional case is shown in the left part of Figure 2. Here qp (W /m) denotes the integrated heat flow over 0 . < z < +oo. The main part of the heat flow is concentrated to the region close to the edge of the slab, since the amplitude of the periodic temperature in the ground underneath the slab is damped quickly for increasing values of :z:. This case has been solved analytically by Wiener-Hopf technique in [3].
qp = -.AT1 · lh~I · sin(21r(t/to - </>~)) <1>0 = -arg(h0)/2"" p .· . p ' ~ .. ..
. ~ . ·'. ·~.: .. (7)
The function h~ is a complex-valued and non-d~ensional heat loss factor. The absolute value and phase of this function is shown in the right part of Figure 2.
_. :., ~
: ! . .. ·'·.; - - ~.
We now assume that the temperature profile in a vertical cross-section, which is perpendicular to the edge of the slab, is approximately given by the fundamental twc:rdimensional case shown in Figure 2. This is at least a good approximation for the main part of the slab. We obtain the following appr~ximation for the heat loss of a rectangular slab: . i) . :~ · :1i"
Q, = -.AT1(2L + 2B) · lh~I · sin(21r(t/to - 4>~)) · .. ~ L > 2 ·do, B > 2 ·do ' ·~ ~ r: · ; .;.-;- _: (8) - ,. ·, • ·~. :·, ·. •• · . .. _i. : · ·~ ,J • ··· ~ · · ' -...L :;:_j r .• ·.-
In this approximation we have neglected the influence of the comers of the slab. The formula has been tested numerically. The influence of the corners hav~ been shown to be very small.
\ .i • * : { .. :) , :: i "4 :; , •• •. , •
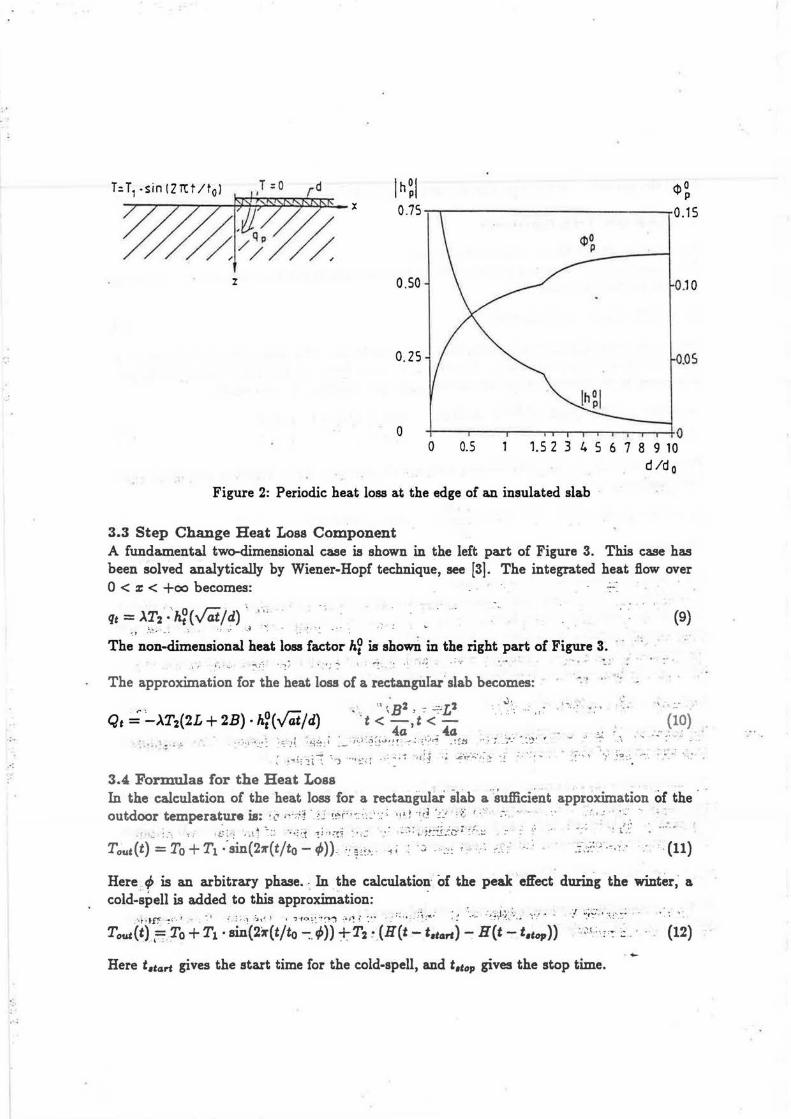
· ty1 i";>K!")NS}rSKp;rs - x lh~I <i>~
7 7 ' ' ' • 0.75 ' 0.15
z 0.50 0.10
0. 25 O.O S
0 ~~-.-~..--~........--.--r--r--r--.--r--r-tO
0 0.5 1.5 2 3 4 5 6 7 8 9 10 d/d 0
Figure 2: Periodic heat loss at the edge of an insulated slab
3.3 Step Change Heat Loss Component A fundamental two-dimensional case is shown in the left part of Figure 3. This case has been solved analytically by Wiener-Hopf technique, see [3]. The integrated heat fl.ow over 0 < :z: < +oo becomes:
qt= >..T2 • h~(v;f./d) ... '· -~ .... .. . . \.•
(9)
The non-dimensional heat loss factor h~ is shoq in the right part of Figure 3~ 1> '\.,, :-- .· ~: . :~ ·' ,.. , 1.;,
The approximation for the heat loss of a rectangular· slab becomes: . ,J " r, .. " \B2 , c :::"L2
Qt= ->..T2(2L + 2B} · h~(..;;.t/d) .t < -,t < -:.• .. ' :. > -:·:•".'.'.: ·,~-,.( ;s~:i -- ;:y _.; :_; ~.~CI~ : ,,:,,.; .(~~:J ·:: ; _;·:· ·_::) · '
~.,£;-!i"1 ~~ •••4~>:r ~I~ ,,f.1 :; ~'it~~' .;~:~ ~i ::._:,~ '
3.4 Formulas for the Heat Loss
. . ' "".·, :. ~',. ·.;4 ',' .:.~
,. . .,, .~ ..... '· (l~)
,; ' -~ ~ .... ~' .,
. ; . .. ? ·~· '°"! ~' .-. • .. ~:
In the calculation of the heat loss for a rectangular slab a "'Sufficient approximation of the . .
outdoo_r ,t-~m,~r~~;~·. ~\~ ·~·;;';~ · ~ ;;., '.:: ' ·~ ~ --:~ ·-"·:; .,:,~ : ·:·(:~~'.:~~~: .. : :~ .-.. ·.: -., . .. : ' ' ·' : ~' :: .....
Tauc(t) =To+ T1 :sin(2,.-(t/to - f>))_ ': ~'.'..<: . -! ; ·:; · ,,: • · · ,._,. .:· . .;::: ·~. '. . · · (11)
Here . t/> is an arbitrary phase .. In the calculation of the peak ·.effect durin.g the winter; a cold-~pell is added to this approximation: ·
: : ·-.... : ~ ·;.~i). :. :... ·:·:' .. ~ / · '.~~- . :~.:: ... ~~ .··f·Jf"f ~-·. f ·· ~I ;_ ;~. ~ :.)\ J) I.,.,,_ .. ~;:;~~~.., .:ol.j"~ I~: • • ._:'•· •: ,·~;"""'"
Taue(t). , To+ T1 · sin(2~(t/to -:, 4>)) f-T2 ~ (H(t - t.can)-: H(t - t.cop)) ·~~~ ~ ·;::' ::. (12)
Here t.ccart gives the start time for the cold-spell, and t1top gives the stop time.

t: ..
(~ ': : ...
h ~ (1:) - '2 1' v fl;#fl'/9'Js6r)N_ X 7 7 7 7
/Tlt;o ~ 9/l}~q;<t( / // //// //
1.0 -r-------------- -1
z
0 0 0.5 1. 0 2.0 3.0 4.0 5.0
i:
Figure 3: Step change heat loss at the edge of an insulated slab.
With the approximation of the outdoor temperature given by (11) we obtain the following heat loss:
Q(t) = ~(Ti - To)L · h,(L/ B, d/ B) - .\T1(2L + 2B) · lh~I · sin(2:ir(t/to - 4>~ - 4>)) · (13)
The acc~in~ated he~t loss E11 (J)···dunng th~ he~ting ~~-~on is also of interest. With the temperature approximation given by (11) we get:
. ...: -.f .... ~·; ·.. ·:"';. '-~ ~- . ;, ·. ~ -~ .. ~~.J. ' .. ,,_, ···.· . . :..
E11 =.\(Ti-To)L·h,(L/B,d/B)·(t•-t11 )+. . · ... '· ' · · · , " -~· ;_ ··
+ .\T1(2L + 2B) · lh~I • ~ • { cos(2""(t•/to.:.: ~~ - 4>)) - cos(2~(t11/to ·- 4>~ - 4>))} (l4
) ;~~t.?-::~-- -· -_, ... :; ~ .. :..:~··:·. ;, .. ~-~~ ·I ~.; .-w\r_,_. _,:~ · ... .'> .. ,..·.~: .. ··.:· .. :\ ~·:-: ~~ ,t · ~::.:· :-.. .'.'! ·~·~'·,:.:;· .. -~_ - :: ;t~·: l. g.;:·_; ,_J . . ,. ..
Here t11 is: _giv~n ~y the start· time of the heating season and ~6 is given by the stop time.£-I ..!}:.a ·:~ : , .· .~ =·::~: -~ .; ..... J .... ; !:J,/ • .::· · .~ :.- ~ 'j ,. .......... ~ - it.~ .1 · '°.1 , ~,! :. t~~ 1 ~ ~... .• >-~· ;.: ' ".J.:~
The peak .~ffeC:t during the winter is calculated with the temperature approximation (12): .. .. "(" ~
Q(t)lmca:i: =.\(Ti -To)L · h.(L/ B, d/ B) + AT1(2L + 2B) · lh~I+ :\:_;. o (v ) (15) - .\T2{2L + 2B) · ~a(t.top - t.eart)/d
4. CRAWL-SPACE The crawl-space temperature can be obtained from energy balances for the air and the ~urfaces inside the crawl-space. The heat loss to the ground is an important part of the energy balances. An analytical model is presented in reference [2J. This model accounts for the heat loss to the ground and the radiation exchange between the horizontal surfaces inside the crawl-space. ...

::·:·
4.1 Steady-State Heat Loss and Temperature Simplified formulas more handy and still accurate can easily be written down for the steadystate case. We will assume that the ventilation rate n (1/s) is constant and that the ventilation air temperature is Tv0. We will denote the volumetric heat capacity of the air by C0 (J/m3K). 'The U-value of the floor, indoor air to crawl-space air, is denoted by U} (W /m2K) and the U-value for the crawl-space walls, outdoor air to crawl-space air, is denoted by U~ (W /m2K). The area of the floor is A (m2) and the height of the walls is H (m). The crawl-space temperature Te' then becomes
T' _ U 1 · Ti + U w • To + Uu • T u0 + Ug · To c - u, + Uw + Uu + Ug
(16)
, where
U1 = A· U} Uw = H · (2L + 2B) · U! Uu = nC0 • A · H Ug = >.L · h,
·(17)
The heat loss through the floor becomes: ·.
Q, =Ur (Ti -T:) .. ·:· (18) .
REFERENCES [1] ··c.E. Hagentoft. Heat losses to the Ground. Slab on the Ground and Cellar; Dept.
of Building Technology. Lund Institute of Technology, Sweden. Report:TVBH-1004, 1988. - ,;:; ' .- -... . '.: .:_ .. ., : :· .,-· . - - , - ,. _-_ ' -· ..
[2] C.E. Hagentoft. An analytical Model for Cr~~l~sp~~ Te~~·~;at~~~ ~dH~~a~ fl~~s. ·Steady-state, Periodic and Step-response Components. Dept. of Building Technol-ogy. Lund Institute of Technology, Sweden. Report:TVBH"'.3012,.1986.. . · i.-•'
' ! ti _ I _1, _I " ·.: ~ ." • I • · ! ,~ ' - . "" •
[3] C.E. Hagentoft, Johan Claesson, Nils-Olof Wallin. Notes on Heat Transfer 1-1985. Heat· Loss at the Edge· of a Thermally insulated Slab on the Ground~- Wiener~Hopf Solution for Periodic and Step change Air Temperature. Dept. of Building Technology. Lund Institute of Technology, Sweden: '·Repoi't:CODEN LUTDVG (TVBH- --7096), 1987. •! '. · ~. ;.- - • -- - • ~ · -:-: · - . . - "
,, •• ;>.. ~ ~ • • ' •• -:..- ~ • • ~ • - -~···
·--· - ---- - ...
--. -~ .... '!.' '\' .\ .:"
-, !•I __ ..;· __ :-~ ~r
•' • ..:. ·~.;;. ~n.; ;td ::"!"!;-;":I ~!~-,.!_:~ ~: ·· .. ~ :';-.• t:.~; ~ :~·:'J: :· ~ ; .. ·~; .... :-· ~; ;l:.: - ~ - ..
... ~ .. ';~·'[ ~-::;;; ~r;\t~;tf ;i/i :f. =:-:°/;fy·~ :\ 'J ,'.C i·~:i Hf·~ ·!·~;1!·. ·-·\'t .. ~~-~~·:
·•.• "!; ·.·:---'.:'1 lC .1..: ••. :.:--~"i~·· ... ,·: .. : .,_~ ... -... ·~· r~ .. ~·~,. .. ~ ~·:~~ -: .. ~'.~!~ .-... ·'" · .,.....
~,;!.,..~) .-r: .. ;.i;·-:~··::-·· :.L; ""J :r .. f.i.._:~; ~- ·" ,':~· ~..: ,...:_;; .'.~-.. ~~~~""":':.:;\ :~·-,L~· - . . ' . ~ .r4- J._ :• ".,·':"·'...;'1. ,~· .-·
·~·· ;~·, ~.

" ;.:
. •,
( .• .; ""··- '
( '>
FILLED CAVITY WALLS: INFLUENCE OF DESIGN AND WORKMANSHIP ON THE HYGJ(IC AND THERMAL PERFORMANCES ·
ABSTRACT
H. Hens, J. Lecompte KULeuven,Laboratorium Bouwfysica
B-3000 Leuven, Belgium
In North- Western Europe, cavity walls are widespread as outside wall solution. Until the energy crisis 0£ 1973, they were not insulated , except in the Nordic countries. Since, cavity filling has turned to normal praxis. However, in Belgium, problems remain, partially as a consequence of a stubborn building tradition, partially as a consequence of architectural fashion, parti.ally as a _consequence of bad workmanship and partially because of poor physical modelling. Are discussed in this paper: thermal bridges, lack of air tightness, stack effects in partially filled cavities and summer condensation.
0. INTRODUCTION
In North- Western Europe, a cavity constructions are Traditionally, they exist of
region with a rainy moderate cold climate, widely used as outside wall solution. (figure 1):
- an outside leaf; - a cavity; ·-- -·· ... :,,, - the inside leaf . ,. . -. - an inside rendering. ~ _... .!. •
'" · .. .. . ; - . ,.) _.!,:;..
The cavity wall acts as 2.-steps rain barrier, _the ;::~htside leaf 'being a . . - . - .
capillar, non watertight rain retarder, the cavity functioning as -~ _ capillar _cut . and pr~ssure equalising _ai~ ... . volume _and_ t~e . inside leaf : gi v~ng air tightness . to _ _- th.e wall, ~ _-acting as loadbearing part, _ ~s -~hermal resistance and capadtance a.a. Weak. point .of the ~ol1:1tion is its rather low thermal resistance (table 1).
Therefore, after the first energy crisis of 1973 and_ more pronounced after the second of 1979, insulating the wall by partially or totally filling .the cavity, became current practice (figure 2) <,1). _, .-.. :
'Cltfowever I . in Belgium ' .: this .·.'f u1~jig :-~~cti vi ~Y, . w~~n ~ t _ )ackeO:_:. hy. a .. real upgrading of the overall physical .knowledge .. ~, a must because of the more
., se_vere ' hygrothermal -constraints in...,_, _.insulat~d constructions' ~ "'iior' . by a . ,.correct translatiOri of_ kriowledge ' to --~~sign; an~_._execu~ion . practic.e .... ~ · ....
.' • . ;. _ :.~ .. ;.;::,,:::)·t·.; ' .. ~ ~····· J l ~;:~ .~ .. ,-;l;Jo-~; .·. : ; ~ (~.~~._--~\z:: ;~· ~<~·~: ::r.:A · · -··:~, ,~::
::. . The con.sequences were and. are: ., ~--::-· ·J -~ : .- ,,, .. , ·-~·, _ .: ., • ! , ') .. '.,.
, - thermal bridge problems (mould, _excessive heat losses); .
--'·· .. ; : -.: [:: -~
~ ; ··- !, -= . . ; • • ·· .i"-. 1 · -· - --: . _, "=• .• , :
· ;.~. sometimes poor air , tightness; ., J .;..- .. i .. u..;"' -1" _. _,, ,; ... ... -~~ , •
·-poor workmanship in .installing the insulation, espedally .in ·partially · • • • '_ 1 \ •·• -t '"'°l ,i. 0 '"' • • " • ~'. • • : - . I • h• 'l', · }. ' •
-0 . filled walls with loss of insulation quality ; .. - . .. . : ... • .. .,• _,J._, •• ' .• ·: ·• L::.·~ .. .: ~ - ·.• _._ "'·~-":,.. •"'.4~ .:.•- · ._ .:. ·;:·J..i.i'.\ jJ . .J . ':J ," :~ .. :; · ~ 4 /~~· ""; •I)~ ·~f,. ·'-
1
RANK XEROX COMMUN/CATIE SERVICE
III 7

·:
:.
FIGURE 1. Traditional cavity wall FIGURE 2. Insulated cavity wall " !
Table 1. Thermal resistance and . U-value of a traditional cavity wall (measured on site and in Hot _Box-Cold Box (1))
section . '•
Hot Box- Cold Box outside leaf: brick,d- 9 cm cavity : 6 cm inside leaf : perforated c -~.
brick' d- 14 . cni ' inside rendering
In situ outside leaf: brick,d- 9 cm cavity : 6 cm inside leaf : brick,d 19 cm inside r~ndering
- ~.;., :; .-_·.-..:: :-: ... ~
R- value m2KjW
··· O .-66
0.63
· U-value ··· W/(m2K)
1.20
?: .......... . .. ....
1.25 ... ~:. . ·~ --------------------------------------------------------
:"\·,; .• J . : · ! ::... · ; ·--= ~r: ; } ~:- , ;;·· :: :£ ·=~·-: 1- -- ~~.· · :·~i :f! .. -~~:-~:.. . <~ 1 ,f ...... ,,,. , ,• •• }. - ·
;: :;'ca . -too'· primitively ''· expiained .!1'""moisture b~i'ance; forgetting . summer . :.::· condensation against the cavity·_ ~side of"the ~ i~side lea!, resulting in ·: ·o,_ a lower early winter insulation.'qual:ity_;: ~; ··· ·~:• · .;~ .. >c. · .· .. .. ' '.:. ·:·· ·: ·
•""'" ·~ ,£· .,.· . · ;~~· : ' , ~ .... _, - :~ ~ ..;.~.._::L').~.lj .~_::..~ .
... .. :;..,
:: l " . . THERMAL BRIDGES ... ... ;;• t ~~ j .§f~:·. ·~ _.~~... .. f:-~ ~ 5 .. Y . ~':·.)~;_J ~ ,:1:
J - i. ~ ...:: a· ::"~_:t- - : :-- -~; :'.=- .. ,.,,_ . ~"' -. ~- ·· . ...;, '~ ~ . . ':':
• :.. .. • ...._;_':'" . "'\ .. ,.::t ,.. c.~ •• ..... ... .J .. , • In the traditional cavity· construction, .. the mayor· · therma1·-bridges - were: lintels above "~indows·, " ,.;ind~w·:·~edg~s, ·. ~~e~~o~d~. :'.!: roo( -.. p~rapets; : . the
" fl '" all . . b 1 .. ' "''""r(fi c;' 3) .... ... ,,.. ., IJ. ...., .;i, ,i . ~ v .. r. AP .,.,, .. .... ... .. ,.. .. · oor-w support, a coru.es·. : gure . -:. •- ·:' · ""' · "- ··· ·y -_ -- -·· · ~ ·: • - • 4o ._ ,- '" " • '-::' .~~ ,.._, ,."° '"' •~ "'f' ''"'-• '"" • ... The impact of these thermally weak points on the . conductive heat losses
was rather · :restricted ·-(Aii" i?lcrease' 'of ~· o:-· to -:13-f compare'd ·: to · the ·1-dimensional result(2)) and the difference in temperature ratio .,. between the coldiest spots and the wall surface harCuy''pronounceCi : "'rn':~fa<:t, "'the whole envelope acts "as "the'rmil. ' brfdge / with tempe .. rature'."t'ratio' s;, as" low as 0.4 to O. 7. One of the consequences experienced coul·d- be~ ·-& ··~oderate
-moUld growth . allover the ·wails .. and i;ehind cupboards'.! _-.J ·o! • fuu: ~t ':.:= , . (r ;::r. • • . .... . -:. · ... &,,~ ..... . , • ,... • .,, .. r t ..:; .., • he-. .... :i-Filling the cavity changes "that ~picture • drastfc.tllly. With the details of ..
~ 2
I. o; · ' '.' ~1~ 3 ;:~ •:., '~i-~• ~l }.~ •1't; "~' • ':° ... ,. ·~·- ~ ~ '1
• ..
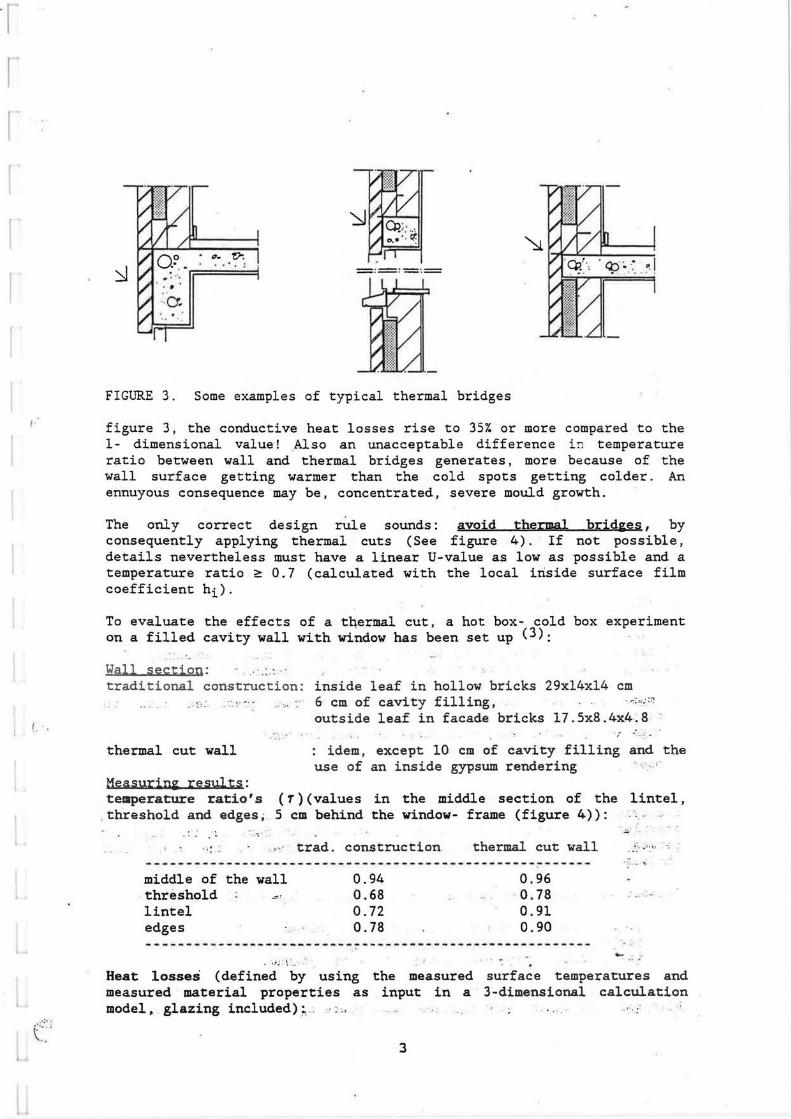
, ..
( .. .
( '
,,_ V: : =====··=
FIGURE 3. Some examples of typical thermal bridges
figure 3, the conductive heat losses rise to 357. or more compared to the 1- dimensional value! Also an unacceptable difference i:: temperature ratio between wall and thermal bridges generates, more because of the wall surface getting warmer than the cold spots getting colder. An ennuyous consequence ·may be, concentrated, severe mould growth.
The only correct design rule sounds: avoid thermal brid&es, by consequently applying thermal cuts (See figure 4). If not possible, details nevertheless must have a linear U-value as law as possible and a temperature ratio~ 0.7 (calculated with the local iriside surface film coefficient hi)·
To evaluate the effects of a thermal cut, a hot box- cold box experiment on a filled cavity wall with window has been set up (3):
Wall section: traditional construction: inside leaf in hollow bricks 29xl4xl4 cm
-- ~< ···· -·· ... : 6 cm of cavity filling, -..:;"; :~
. .: thermal cut wall
Measurjn~ resµlts:
outside leaf in facade bricks 17.Sx8.4x4-.8
: idem, except 10 cm of cavity filling and the use of an inside gypsum rendering
temperature ratio's ( T) (values in the middle section of the lintel, threshold and edges~ . 5 cm behind the window- frame (figure 4)):
_,.
·< .•. trad. construction thermal cut wall •· .. . :. \ ,
------------------- ------------------------------------- - ~- · middle of the wall threshold ..., , lintel edges
0.94 0.68 0.72 0.78
0.96 0.78 0.91 0.90
--------------------------------------------------------. .; ,: ~ -- -
Heat losses (defined by using the measured surface temperatures and measured material properties as input in a 3-dimensional calculation model. glazing included); -· .; ,, .. ; . . -
3

;:·
"t
FIGURE 4. Some examples of correct details, checked in a Hot box- Cold box series of measurements (3).
traditional constr. thermal cut solution
1-dim. w
65 48
3-dim. w
99 48
100 (3D-1D)/1D %
52.3 0
These results confirm the positive effect of a strict ~thermal cut on both the heat loss and the temperature ratio!
2. THE AIR TIGHTNESS OF FILLED CAVITY WALLS - -,
In todays architecture, still a fashion exists to use no fines concrete blocks for the masonry work, omitting any kind of inside rendering . This results in an air open cavity wall·, introducing unexpected problems: ..
.:.- ' _;_ : I a, ;.:~ "• _"'; ,..:-; ·- • • .'•-
much severier interstitial ·condensation than predicted with the diffusion theory (Glaser's method).;· : .. :~-:. };;; , high ventilation rates with excessive heat losses;
, - . increased chance on rain penetration; .; .:··.~ . .::. .. , .:; .: ·:·;:: . .....,. ::: ·• poor acoustical insulation. '. ;. " ~~ •'.!J
~-.:.,.~.:.._~.;...;.;:- ._. _ ........ ; .... :.:;.·~ .. "": ,To get a better knowledge· .• of the air permeance ·of : cavity"walls, ·. a measuring campaign on .in-· and outside leafs and '. insulation layers was sheduled (5) .· Results: see table 2 Striking in fact is the high air permeance of · no fines concrete blocks, compared to the other leaf choices! · - - · · - - · - · ~ ~ - ~"- '"- · ·- -· - · - -- -
.. ~. .. -· L_ .., ·:Y• .. -· ·.~ . ,: • ' -- ; ~ l:.
Suppose now the cavity wall design of figure 5, Ka- 6.39E-s.1p-O.J02.: ~:: 2~_;; ::.:. .. :
outside leaf: concrete blocks,d- 9 cm, joined cavity .; rockwool ·filling, -32 kg/m , .. d-10 cm inside leaf : concrete blocks, d- 14 cm, joined.
·;~~ ':t: ·· :
·-:f~; ._. ;· .. • . .. ,~ · J · ~ ·:~:,.:·-! ~~-~ • -~ ·. / , : .1'; .,.... ~ ·~:_, .".!.LJ ?_:.!: ; ~.·1~ · . . ;~_,, . -.:J~i.::C L-~ :. . . • . :!
[-Interstitial Condensation?(8e- 2.4°C,pe- 679 Pa;81-20°C,p1- 1270Pa) ' '~-.. With only diffusion, condensation takes place against the cavity side ·of
4

I I I
(· .. .... . . . ·.·•
l . ,:':'.
Table 2. Air tightness of maconry walls and insulating layers
Wall Air permeance Ka• a.lpb
m/s
OUTSIDE LEAF d- 9 cm. handmade not joined
joined
a b
bricks 4.5x9xl9 cm S.SE-4
(s-4.4E-4) 0.3SE-4
-0.33 (s-0.06)
-0.19
d- 9 cm. heayy concrete blocks. 1955 k~/ml. no fines joined l.48E-4 -0.12
INSIDE LEAF d- 14 cm. perforated not joined joined plastered
bricks 14xl4x29 27.3E-3 0.23E-4 O.llE-4
-0.41 -0.21 -0.22
·'• - ~- .. _ ..
d- 14 cm. heayy hollow concrete blocks 14x19x39 ()
not joined joined plastered ..
40.3E-4 3.99E-4 O.l2E-4
CAVITY FILLING~. (~- v:olumic mass in .kg/m3 ) air-open insulation, permeability . rock-wool (ka, .. s) , ~ 2.0E-3*VM-1.5 . glass-wool (ka,. .s) · - 4.3E-3*VM-LS_ . .. -. . .. ..
-0.42 . -:; -0.27 -0.24
_,
0.0 .. -- "'-'-' ~ o .o_ ···"'"=' ..... ,
-. ., . · :-· -~-~'=· " J ~ ;-
airtight insulation, air permeability of 1 r.m. joint . ·._ ~ .~:~ : :." 1 . _. -~-!-~·:.f:: ·;..'~ - =.; ...
.. straight joint.:~~ ~:: .. ~-;,J ,-~---. d-40 mm .. lmm. open, .. ; 2. OJE,.4- " !
4.0SE-3 9.20E-3
. .. ) '!. ~ · ~:_:.~.,.~.:<~-~ ... ~.i . . . . . -0 .12 ._i ;; i"i- _.~:''."'.':
· ' - - 4mm open -0 . 46:;. ~::. i'"; :-- ' -,-:
t::J·-:.·:
:··r- -~ ,._ .-' -
9mm open d-100 mm,lmm open
5mm .~pea ,_ ... . lOmm open
·- .......
1. OOE-4 4.lOE-3 1.0lE-3
-0 .50 -0 .06
.:~ .. . -0 .47 J -_- ;;;::-/:~. 7'. :: . • -0.50
. ·>·. r !.!:.~ .. ·::! . . .... -..... •. ·- ·~.,...,. .:. • r . • ,.
• ....i'" -- - •.•
groove and tongue. 12xl5 mm . !: : . . · ,,.,._ ;~; ; :: _ "}:'i:::'.c- ~-.. _ ,,-; .-
d-40 mm,' 2mm ~pen .. ; :···: 9.24E-5 -. . .. '.':'J ,-0.lLli-ff .,.,,~r:.;1:-.· J:f!:.· <, . ~ 6mm~.open ~~~: 1.32E-4 :.;. : - ~-; -0.23 -::_:~;.:·.:·fr~ /,n.-;;:: ~·:: ~ . -~llmm,~pen .:_;_ 6.16E-4 :;.:· ·;::~:: .. ·,,~0.42 . .r~ ,. .. r-fl·v;;~ ,-e.·ef: :".
d-100 .mm,3mm open . ]~~- ;, 8.76E-5 ,,_; :' .. , .• ~:~::: .. :-0~11 2 Jf;'i:f =- ·:="; .. <~ 6 2 09E 4 . 0 29 ' -mm open ·: . . ·. . - . :.:.'1,~:::;;::J-.!" ·- • _· •rol~"- c.-.~,:.- :.-·:"" ... ,--,
::. lOmm open. ::· . 4. 63E-4- .- : -~ ": . , ~· , •. -: .~o. ~9. (,).) ~Yu ·:,, .;.-~ : . .,:(~ ~ ' , .•
' OPEN BUT JOINTS :r' ~ , ; 1.00 .. .
.i j . .. ...,. .~ /. ; ;-~~.;- ~ :~i-::? ~k~ ~.::,>_~ ~/.l _~·
.~, -} ~ j; ..:., :: -0.~47 -:;,~: . . ~~s ~~;---~ ~
- - - - - - - - - - - - - - - - .. - - - - - - - - - - - - - - - - - - - - - - .- ~ - ~ - - ~ ~ ~ -:':". .- - ~~-~£!.·-~-f:IJ. ::!~:·: .~~ -~ . .. ...... ., - . ~ - - _ ··: . :. .t : ~ ~.":!~ .:i~ ... "! " ~ ~ .. '::a -~t' ji·:J .-.:t·::.i
, -. :~\~_; <tf:J'.,;fZ~ dj ~~ -7'.§"S ;Hi.
5

.:
p
IPaJ
E\• 2.''C P, •680 Pa
I t Zl~l ! •
e,.20•c P.. \270 Po
..!!.... p-lire
when "'• ..apo.ollow I• <1iflOA10n •
a:nvoction I
...!?l... p-llrw
dllfusicn
.L, sa1..-ahon pr ..... l9 l1Ql 1l. l
FIGURE 5. Interstitial condensation in a air open wall
the outside leaf, giving the vapour pressure line of figure 5 and some 0.14 l/m2 of condensate on monthly basis (January), t.m., neglegable compared to wetting by drivin~ rain.Introducing the inside-outside stack effect (- air flow of 0. 37 m /(m2h)), the amount rises to :::: 0. 6 l/m2, 4.25 times the diffusion value. Combining the stack effect with a mean wind velocity of 4m/s, interst.i tial condensation at the leward side goes up to 1. 5 l/m2, 10. 3 times the diffusion value! The condensation zone also spreads into the insulation layer. The vapour pressure line in the wall at that moment looks as given in figure 5. The wind pressure difference itselve concentrates over the outside leaf, pressing, when driving rain, at the wind side more water into the cavity.
With stormy weather - wind velocities of some 100 km/h. - the ventilation rate in a dwelling with the given cavity construction may rise, only by air flow through the walls, to:::: 2.7 h-li
If the inside leaf is finished with a gypsum plaster, the air permeance lowers to 1E-5.lp-0.23s/m and all problems mentioned become mariginal. Or, a good air tightness is a prerequisite to have a well functioning filled cavity wall!
3. CONSEQUENCES OF POOR WORKMANSHIP IN· PARTIALLY FILLED WALLS
Partially filling should mean: installing the insulation close against the inside leaf, no open joints between the slabs, a correct closure around window frames, at corners, at the bottom of the cavities .. Practice however shows a different picture: slabs hanging in the middle of the cavity, wide open joints, bad closure etc. Some practioners still believe that a 10% addition to the calculated U-value suffices to include this slovenly workmanship. A thoroughly research has putted them in the wrong (4).Two cases were studied by HB-CB tests and modelling: - the use of air open or air tight insulation slabs, installed with more
or less open joints and more or less close to the inside lear-·or moved to the middle of the cavity;
- the use of air open insulation, installed nicely closed, but more or less away from the inside leaf.
6

r-::· :,
l
150
UcJU
(~)
'40
130
120
110
Wldtft ca.1,., c I "'" """'' H
(mmf 20/U ("'"'!
•0/10
'3/ 7
·~.
ml ~ 1 ;:;: I
1E·l 2E•l l(-l 4E·l SE·l
• jml/N•i
flQ. 11-Mi,.wnil wool ISO 1•111tJ: 1tc1 flir IHb.
JOO
Uc/U
(%1
250
200
l!O
25,25
wridl9' ,.., .. ., C, width c..ily H
1-1 1-1 40 , 10
42" 8
.,. 5
100 C£.1 I I I t t I 41'. 3 I I I I I I ! I j
0 '012W'HIUl20
-··-1......i FIC. IO-Ail'fi1•1 i1U..t.IM11 ISO"'"''·
FIGURE 6. Increase in heat loss through partially filled cavity walls by thermal stack effect. (left case 1, right case 2)
For the result : see figure 5(4)(cavity:80 mm,insulation thickness:50 mm). The figure shows that in the first case,if the joint width between slabs exceeds some 3 mm and the slabs shift to the middle of the cavity, 15 mm of air space being left at both sides, the heat flow may increase with some 285%, compared to correct execution.
In the second case, the increase in heat flow strongly depends of the air permeability of the insulation material and its position in the cavity: if in the middle and rather air open, it may reach z 407..
The cause of this dramatic break in thermal quality lies in the stack effect, resulting in a rotative flow around (if open joints) or through (with air open insulating material) the insulation layer. Curing the problem asks for a very correct execution of the partial fill, realising a closed insulation layer, tighten against the inside leaf. This is only possible if first the inside leaf is erected, than the insulation
.installed and finally the outside leaf build. Expedients are: the use of drilled ties, insulation slabs with a soft back layer, foamed bottom and corner profiles ... a.o.
4. SUMMER CONDENSATION
Interstitial condensation in a filled cavity- wall is normally checked for winter conditions and found to be ··no . problem, ·. except _in some specific cases: climate class 4 buildings (yearly mean inside vapour pressure > 1500 Pa), air tightness of the wall deficient.- Calculations look to the swnml,;!r as to a drying period. ~·- - . - ~ · ·
~ -~~- _:' ~--~ - - _: :-- -~ c- - ••.
However, this summer situation may result, for a _· N.'W'. to S oriented outside leaf wetted by rain and warmed by direct sunshine, in succed water evaporation at the leafs cavity side, diffusion through the filling, with, if vapour open, condensation in it ·; and con<iensation against the inside leaf. This gives there a summer moistening over a limited thickness, without any inside visible consequence, while the heat of evaporation needed is supplied ·by the sun. · 'W'hen however, -"in autumn, the temperature gradient turns from outside-+ inside to inside-+
7
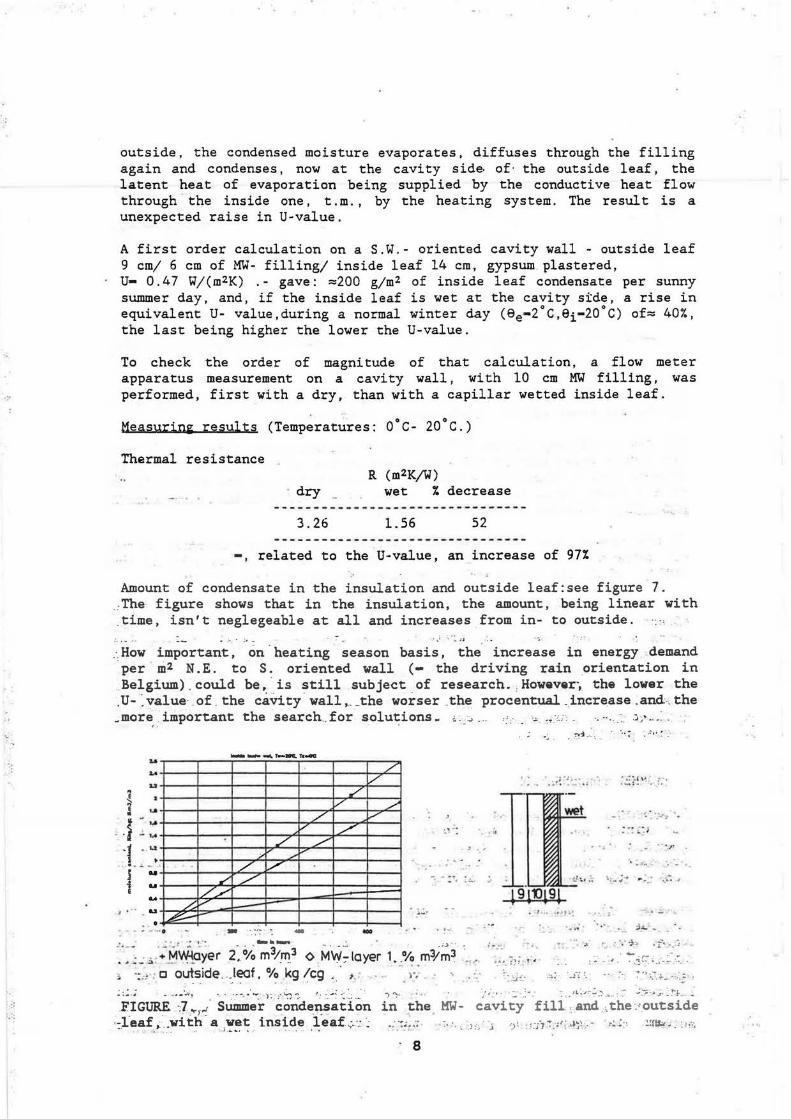
·='
:::
outside, the condensed moisture evaporates, diffuses through the filling again and condenses, now at the cavity side. of· the outside leaf, the latent heat of evaporation being supplied by the conductive heat flow through the inside one, t.m. , by the heating system. The result is a unexpected raise in u-value.
A first order calculation on a S.W.- oriented cavity wall - outside leaf 9 cm/ 6 cm of MW- filling/ inside leaf 14 cm, gypsum. plastered, U- 0.47 W/(m2K) . - gave: =200 g/m2 of inside leaf condensate per sunny summer day, and, if the inside leaf is wet at the cavity stde, a rise in equivalent U- value ,during a normal winter day (9e-2°C,ei-20°C) of= 40%, the last being higher the lower the U-value.
To check the order of magnitude of that calculation, a flow meter apparatus measurement on a cavity wall, with 10 cm MW filling, was performed, first with a dry, than with a capillar wetted inside leaf.
Measurin~ results (Temperatures: 0°C- 20°C.)
Thermal resistance R (m2KjW)
. dry - wet % decrease
3.26 1.56 52
related to the U-value, an increase of 97%
Amount of condensate in the insulation and outside leaf:see figure 7. __ .The figure shows that in the insulation, the amount, being linear with .time, isn't neglegeable at all and increases from in- to outside.
: ~i • : J
:,How important, on · heating season basis, the increase in energy demand per m2 N. E. to S. oriented wall (- the driving rain orientation in
. Belgium) . could be. · is still subject of research. , However; the lower the
.U- -~value · of . the cavity wall,. _the worser .the proc~ntual. i~crease .and. the _more . important the search .. for solutions_ -. ~ ~ ... ,,_. ._, ,. _-,~;, -.··.. .-:i;• .....
.... ...
... ~ s ... t - ... ·t .! l .4
·t ~ ..•. --1
..
...
..... J •• u
. .. ... ....
...._ ...,. -.. r-mc. Tc-oc
/ v
/ ./ /" .... ~
/ v ./ ./
// ,h ,,,,. -~ ,,,e:;.- ~ - -.:·:- -
/ /
v ,,.,, ./
-
/
/
.... ·-·
.: . ,
.... .. .:.. .
. .... ... ,.. ........ ..
·:· :~.:-"' : ;M'v{iciye r 2~ 01~ m3/_~3 <> M-~;layer 1.y~ _m3/;.;,3 . ·: ~ ·:.-: : c outside . .leaf. % kg /cg , - ~. . .. ,-.
... _:. . ~i -'-: · ... ; - ·'•' ...
'4 .: .. ~ ::· ,: :~; .. ~ \· : : ..
~ · ·, ·.:.r-, ..
. ;..: '
. .. , _.... . .... , . . .. . ~ .. . ...
.L......T~ ~. :~ ·,~_,; ... I" ,.._:. .... . I
1911)~91 • • 1 ... . . ..... ,
... :,l._ •
f"'; • • • • . r .. ·- .: .. ._ ... _, =~ f_ , . .. . !":".--·"·
.._ . _:!C:O:.i·-~ ....
·-::i·!_· --~~~. -~-; :_ ~ .. : -. . ; ~, ~:. ~- ··-:-·):-~
.... .. . - ..... ,...t.J, .• •. ·---· ..... : ) ~ ;"~'";. "· ~: .... : ~~ ~. . .. 1 "': · • . •. j; •· .... '."'. ·; .'~~_, ~ ..:_..,__., :-~ ...;:~:,;:.~!";!-....
FIGURE. ) ... 1..; Summer conde~sation in the MW- cavity fill ,_and ,the.•outside
. 1. f ... • th. t l' id 1 f "• ·. • ., ' .. I - " I" '' . ,-. .,. . -~_ea _ ,. .. w1 a ,"!!7 . .. ns .. __ e .. ea.,-... . .. ... ~ .... .-.,.·.i;;'J ·::.· ::i.-n·:'\••:.<··· '··"-' --{IS;.:.;. ;1,-.;
. 8

I.,
···;.;·
.. - :· ~: ..
5. CONCLUSION
The paper shows that constructing a cavity wall with high overall thermal performance, isn't as simple as thought by many practitioners. In fact, not only the cavity must be filled, but also all details, often persisting thermal bridges, have to be redesigned, special attention must go to the air tightness, traditional execution techniques has · to be changed to allow a correct mounting of a partial fill and the moisture behaviour still needs further analysis, beyond the traditional judging methods and perhaps leading to new concepts
6. REFERENCES
(1) Hens, H., De spouwmuur (The cavity wall), Report, National Program Energy, DPWB/SPPS, Brussels (1984), 67pp
(2) Standaert, P., Koudebruggen (Thermal Bridges), Report,National Program Energy, DPWB/SPPS, Leuven (1984)
(3) Knapen, M, Standaert, P., Experimental research on thermal bridges in different outer wall systems, CIB-W40, Holzkirchen meeting (1985), 9pp +fig.
(4) Lecompte, J., De invloed van natuurlijke convectie op de thermische kwaliteit van geisoleerde spouwconstructies (The influence of the stack effect on the thermal quality of insulated cavity constructions), PhD, K.U.Leuven,Laboratorium Bouwfysica(l989),206pp.
(5) Lecompte, J.,Invloed van natuurlijke convectie op het hygrothermisch gedrag van bouwelementen (Influence of stack effects on the hygrothermal behaviour of building parts), reports IWONL/IRSIA, K.U.Leuven, Laboratorium Bouwfysica (1985, 1986)
9
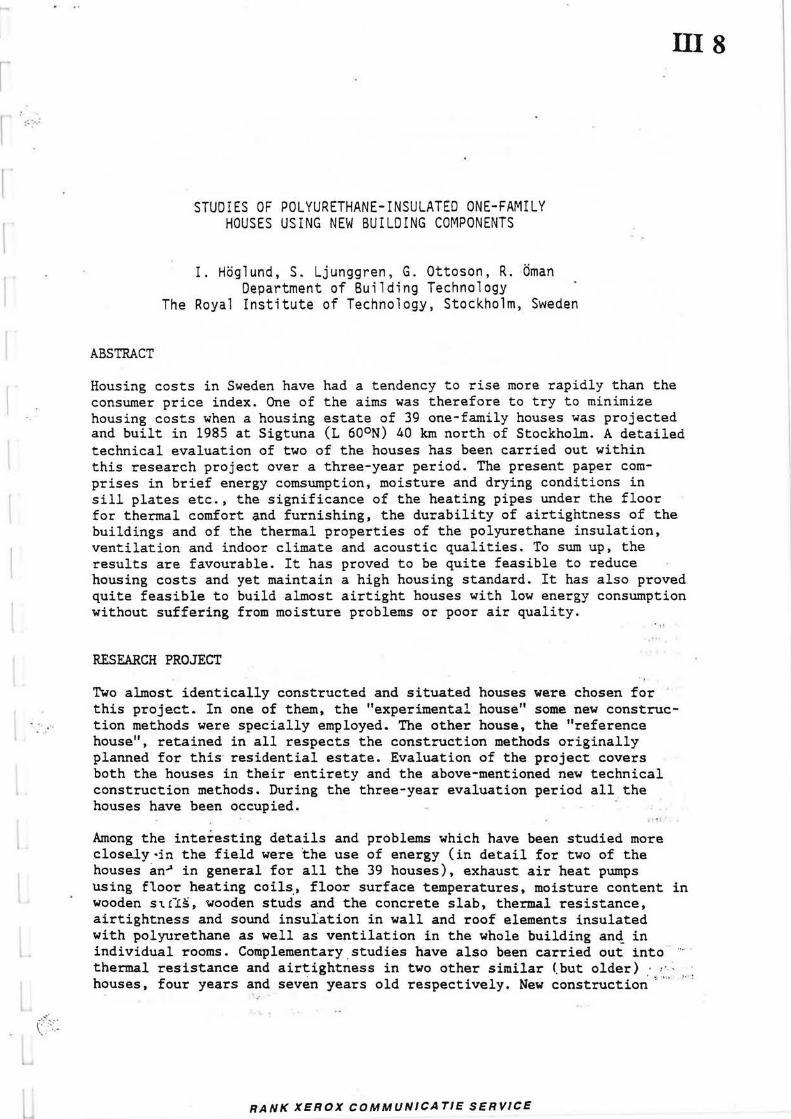
I :: ·.:
(>~~
ABSTRACT
STUDIES OF POLYURETHANE-INSULATED ONE-FAMILY HOUSES USING NEW BUILDING COMPONENTS
I. Hoglund, S. Ljunggren, G. Ottoson, R. Oman Department of Building Technology
The Royal Institute of Technology, Stockholm, Sweden
III 8
Housing costs in Sweden have had a tendency to rise more rapidly than the consumer price index. One of the aims was therefore to try to minimize housing costs when a housing estate of 39 one-family houses was projected and built in 1985 at Sigtuna (L 60°N) 40 km north of Stockholm. A detailed technical evaluation of two of the houses has been carried out within this research project over a three-year period. The present paper comprises in brief energy comsumption, moisture and drying conditions in sill plates etc., the significance of the heating pipes under the floor for thermal comfort and furnishing, the durability of airtightness of the buildings and of the thermal properties of the polyurethane insulation, ventilation and indoor climate and acoustic qualities. To sum up, the results are favourable. It has proved to be quite feasible to reduce housing costs and yet maintain a high housing standard. It has also proved quite feasible to build almost airtight houses with low energy consumption without suffering from moisture problems or poor air quality.
RESEARCH PROJECT
Two almost identically constructed and situated houses were chosen for this project. In one of them, the "experimental house" some new construction methods were specially employed. The other house, the "reference house", retained in all respects the construction methods originally planned for this residential estate. Evaluation of the project covers both the houses in their entirety and the above-mentioned new technical construction methods. During the three-year evaluation period all the houses have been occupied. . . Among the interesting details and problems which have been studied more closely ·in the field were 'the use of energy (in detail for two of the houses an~ in general for all the 39 houses), exhaust air heat pumps using floor heating coils" floor surface temperatures, moisture content in wooden s~!~s, wooden studs and the concrete slab, thermal resistance, airtightness and sound insulation in wall and roof elements insulated with polyurethane as well as ventilation in the whole building an~ in individual rooms. Complementary.studies have also been carried out into thermal resistance and airtightness in two other similar (but older) · ·· ~ houses, four years and seven years old respectively. New construction'' "' , .,
RANK XEROX COMMUNICATIE SERVICE

methods which have been studied in the experimental house are windows containing the new material aerogel, windows with manoeuvrable and transparent low-emission plastic foil and a new joint using a steel sill (allowing ventilation) between the wooden sill 'of the outer wall and the concrete slab. This paper is based primarily on a selection of the results in (1) and (2).
DESCRIPTION OF THE CONSTRUCTION OF THE HOUSES
The houses are two-storeyed, with foundations consisting of a concrete slab placed directly on the ground. A carport and a small, u~heated shed join the houses together, which were thus in this case built as link houses, see Figure 1. The houses are almos~ square in shape with a total floor space of 116 m2. They are designed for four alternative extensions of the ground floor, which can add another 11-16 m2 of floor space. The ceiling height is 2.3 m on both floors, which is somewhat lower than the standard 2.4 m.
The walls and roof consists of prefabricated sandwich elements insulated with polyurethane on a wooden frame. The wall elements are the same length as the sides of the house, i.e. about 8 m. The thickness of insulation is 120 mm for the walls and 195 mm for the roof.
The joints between the wall and roof elements and round the windows etc. are sealed with polyur~thane foam. The windows are triple-glazed, which
,.
... .. u
Concrete 1iles g &. "' "' ... Bar battens 45 x 70 ~ g a g
Counter botttns 19x45cl200 ~ E ! 1 ~ 4.5 board 5! ] ~ u 2!
l5 .. :x g' ., 195 polyurethane ~ ~ -~ ~'ii { 1>9tween 45x195 joist~ :;: ~ 0 ,:: g "' · 3.2 oil- .n.::a:r.:d.:•:..:n:.ed:_-:--t~~i;~:;,.,...,IT"..;._:~ ____ ... ,L...~ ... ~+S!-... hi~T,J~ board -
.• : __ :,r·" i
22 vettical wooden boarding
22. 10 boll ens Ill'\ 9 plasterboard~ .I
120 po\yurethont belw•en 45 x 120 studs mOll c 1200----+1rb""'] 13 plosrerboord-------fft'~'.,j
' I :·:
·"? ~! .: ' , ;
•.:,_:1 ..
,,, • ~ '4
.• .. •;-:: ·· ..
t :-;;...:· ·:t
i .. ' ~"" 0 ~
52 ~ "i -~
. ,.. u
; - :r:; ·· . ; ":. -:.:-.
. f i.t]Uxe. l. The pictur~,·-abov~, •<> · shows the house facades facing
the ·street. The facades aie of vertical wooden boarding.- ozi .. the left, a cross-section of the house construction. The
."! .: ... ~ , :· · .·; ··~-·~;'."'. .;_ ·~ ·.) #1: . _..:.; "! . ~ ! 1~ ~ ~ tE'i
' houses are to a fairly high de~ : gree prefabricated. The foun- ,. -·aa.tion elements, which are .·. -:
. • -· l . • •·. . . . . •.. ..( ~·· ..
j {: .)
Insulated foundation t11m1111 -
r Plastic loom , ot joint (PURI
.. ,.. -~ i·-r § &. ~~ 0 0"' !a :; !!! .a
I
·.- ·, Ieft in position, act as forms for the concrete slab which is
''cast on the spot. These foundation elements consist of a :. ·.
.~ core · of polystyrene foam stir~ · • t"\.. •• . - .
· · · rounded by an outer layer of .. concrete reinforced with steelfibre and glassfibre.
-. ·:. ~'\f ~ ·-·. ,'.. "":. .} . ... , l . ."", ·' -

r ;:::::;_: is the normal standard in Sweden. There is 70 mm of a polystyrene foam
layer under the concrete slab, with 100 mm round the edges.
··~ ..
()
The houses are equipped with mechanical exhaust' air. ventilation, with supply air intakes in the outer walls. An exhaust air heat pump heats a 220 litre water-heater. When house heating is needed, a small pump will circulate water directly from the water-heater through the floor coils (copper tubes) placed in the concrete slab. The heat produced by the exhaust air heat pump is thus used both for hot water and for central heating. In addition the houses have thermostat-controlled electric radiators; in other words, the heating system consists of a combination of direct electric radiators and an exhaust air heat pump. Practically all electricity consumed by the heat pump (as well as the recovered heat) is utilized, which is also confirmed by our results.
EXAMPLES OF RESULTS
Energy Balance
In order to determine in detail the energy consumption in the two houses, readings have been taken every month of a total of 13 different meters (for electricity etc.) in each house. These readings have been corrected with respect to deviations in the outdoor temperature from a normal year. The annual consumption of bought energy indoors is 12,300 kWh per year for the reference house and 13,200 kWh per year for the experimental house (the family in the experimental house kept a higher room temperature and used more hot water). Thus the amount of energy consumed in both houses is low. A computer calculation of the houses' energy balance corresponds closely with the consumption measured. Figure 2 shows the energy balance for the reference house. Of the total energy input for the house (family), 20,900 kWh per year, bought energy accounts for 59 7., while heat recovered from exhaust air, utilized solar heat gain and body heat supplies the remaining 41 %.
The exhaust air heat pump contributes largely to the low consumption of · -· · energy. The amount of energy retrieved from the exhaust air is about 5,400 and 6,800 kWh.per year respectively. The heat pump's coefficient of ; performance _is 2.2 in the reference house and 2.4 in the experimental- ~: ~~.: · house. The families' hot water requirements are provided for in both "-· ~.'.'! :. houses entirely by the heat pump. However, the greater part of the energy produced by the heat pump is used for the floor heating coils: 7,900 and 8,800 kWh per year respectively. This means that the floor heating coils account for ayer 60 % of the energy provided for heating, while the · ., electric radiators use less than 40 7.. ...
Of the 39 houses, 14 have extensions of 11 to 16 mZ, which makes the average floor space for all 39 houses 120.5 m2. During a normal year the place _ has the mean outdoor temperature 5.5°C and 4110 degree-days (assuming that the indoor temperature is raised to 17°C until the outdoor temperature ' · exceeds llOC). The average (and the mean) of all energy bought and used i .:
indoors (heating, hot water and household electricity) in all the. houses : · (values corrected for a normal year based on two years' readings) is· :,' ,,..,_:.;, : 14,500 kWh per year or 121 kWh/m2 per year (52,300 MJ per year or 434 MJ/m2 per year). However, the differences between the various households (houses) are considerable. If the lowest consumption (8,800) is compared
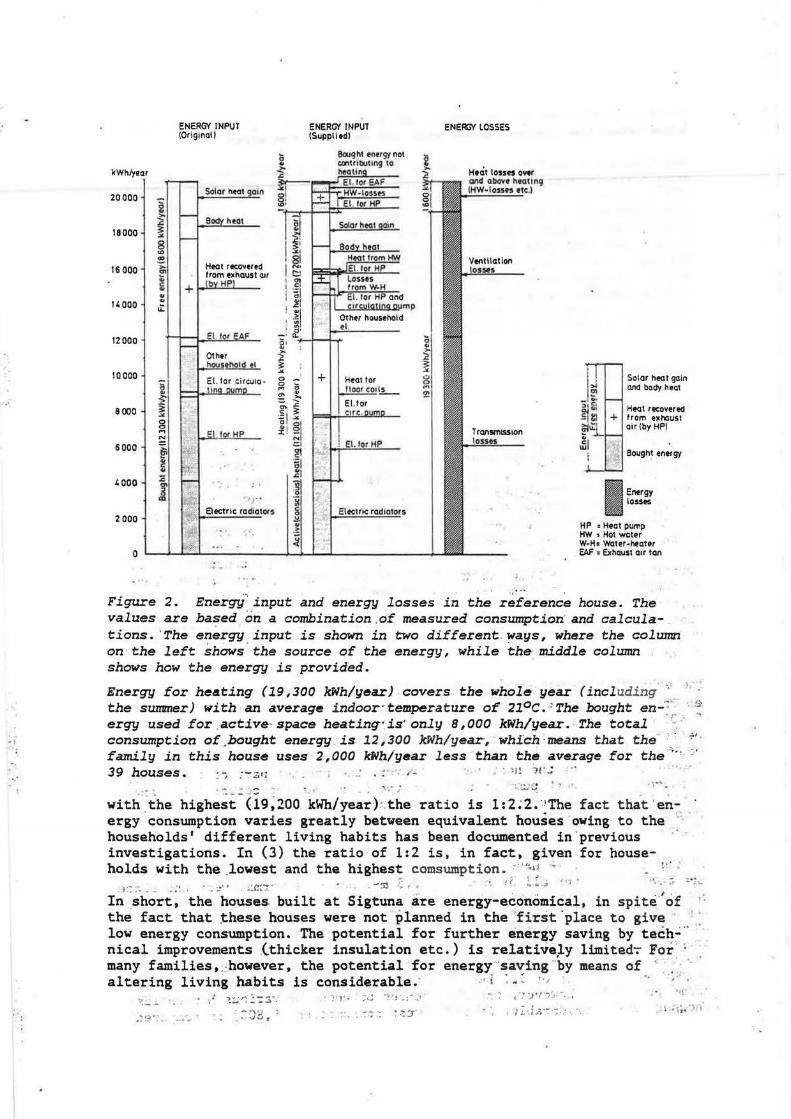
. ,
ENERGY INPUT ENERGY INPUT ENERGY LOSSES !Original) !Supplied)
8wg h1 enugy not contr ibuung to ,..
Hecit losses o.,., kWh/year t- +
heatin 2 El, tor EAF ~ and above heat ing
20 000, -=I I I Solar h@Gt gain HW- losus IHW-losus ttc.)
2 Et. tor HP
~ 18000 ~ 3:
.>< I ~I 8 "' "' I 81 I • Ventilation
16 000; >. H@Gt racoverrd I No 10556 ~ from exhaust air !::l .. b HP gi c + .. ' =1 .. I O
14000 ~ .. I <II
u: ! -;1 I ' ~"~Yl!lll!l9 l!!Jmp
I · ~I Other household 1 :g, el .
12000 , ~ - · Cl.. c; , .. Other ~ household el ~
10 000 ~ ...
El. tor ci rcula- 0 - + Heat tor 0 I J ~ ,.,,, ,~, "" 0 CJ
l lin m ,., Ci lloor coils ,.,
01 and body heat
"' .. -- !?? = ~ El.tor - ~l
~ "'.t:: " ' ~, Hl!<lt recovered 8 000 ~ c ~ Cite . um .>I.
"i ~ti + from extaust 0 U:i air lby HPI 0 .. , 0 .., I I r HP ::c. -
"' !'- N
6000, "i f ¥ ; _ El.for HP
~ .!:. I I j); j Bought energy
·:,x; ' 0 u ..
;;; -<: 4000 ~ en ~- . ' '' ~ I ~ -~
.. I Energy ') ". ~ losses
-~~ Electric radlat0ts c Electri<: radiators ~
2 000, 0 .!.!
~ ..
' HP = Heat pump .. HW = Hot water W-H= Water-heater
0 CAF = Exhaust air fan
. - ..
Figure 2. Energy" input and energy losses in the r~ference house. The values are based on a combination.of measured consumption and calculations. 'The energy input is shown in two different . ways, where the column on the left shaws.the source of the energy, while the middle column shows how the energy is provided.
Energy for he.sting (19 ,300 kWh/year) . covers the whole year (incl uding- '' ) · the summer) with an average indoor: temperature of 21°c. : The 'bought en--=·- · . f:; ergy used for .active· space heating· is' only 8 ,000 kWh/year. -The total ·,~ ·' consumption of _bought ene.rgy . is 12,300 kWh/year, which ·means that the- - ' :;.i •
family in this house uses 2,000 kWh/year less than the average for the o.; __ : ·
39 houses. : -, :":""-3'1 , · .: • ; · ·: . ·: · · • • •;! '1t'_; . .. .. -
0 , ..... ~ '\ :.~; •:,r.:.,.·c t': • A ... .. ...
with. the highe~t - (ig~zoo kWh/yea~)-. the ratio is 1:2~2 ~-·The fact tha·t ·e~ergy -consumption varies greatly between equivalent houses ·owing to the ' households' different living habits has been documented in .previous investigations. In (3) the ratio of 1:2 is, in fact, given for house-holds with the _lowest and the highest comsumption. 'u;,! ~ • ?' ' :
:l:::~.-- .:· . ·. ·.:"' _::m-:::- - - . ~:n -~, , .. !f :. ~ . .; .. ,. ... ~ :;. : ·.;.....
In short, the houses. built at Sigtuna are energy-economical, in spite· of '· the fact that these houses were not planned in the 'first.place to give :
low energy consumption. The potential for further energy saving by tech..; ·· nical improvements {thicker insulation etc.) is relative)..y limited-;- For ' ~ , many families,_-however, the potential for energy ·saving-·by means of < , ••
altering living habits is considerable; ·' ! : ~ : ' ' 1 •· · , .. ·
?, _ __ •• : ~:.;'~ ~-::;·. • ~·J'. ;,J .,., .;:· --~ ~ '~ ·;:~~~~:·:~~;.·· ·, · ~ ~ \.;·i;:.)J)' .. ; ~~ ·.: .... . ... .... . -~·., ~
' - · -· '.J;:, • :· •. -:-·-:: ~ : -?:-~

I • ' .. :....-. ( ·::c···
Thermal Resistance and Airtightness
With the use of polyurethane foam (polyurethane insulation) very low thermal conductivity values can be achieved, tnanks to the use of another gas than air in the cells of the material. Usually (as in the Sigtuna houses) CFCl3 (CFC-11) is used, which has a thermal conductivity of about 0.008 W/m·°C, i.e. about 1/3 of the value for still air. Using polyurethane foam makes it possible to have walls with the same thermal resistance much thinner than with mineral wool insulation. In the future, however, certain CFCs, including CFCl3, will probably be completely banned because of their environmental effects and replaced with oth~r gases.
Thermal resistance and airtightness were determined for the two Sigtuna houses and two other similar houses which were four and seven years old when the measurements were made (1985-86). In every case the thermal conductivity refers to 110-170 mm of polyurethane foam in prefabricated wall elements between 9 or 13 mm sheets of plasterboard. The wall element joints etc. are made almost airtight with urethane foam.
The thermal conductivity determined lies within the range 0.018-0.022 W/m· 0 c. This low value (after up to seven years) suggests that the thermal conductivity of polyurethane foam deteriorates in practice very slowly due to gas diffusion. Another study (4) draws similar conclusions.
The air leakage rate in the four houses was 0.3-1.4 air changes/h at 50 Pa pressure difference. All the houses easily meet the requirements of the Swedish Code of Practice, ~3. 0 air changes/h. The very good airtightness in the seven-year-old house (0.3 airchanges/h) indicates that the building envelope, including insulated joints between the various building elements, can hardly have aged to a noticeable degree as far as airtightness is concerned after seven years'.
Ventilation and the Indoor Climate
The Sigtuna houses have mechanical exhaust air ventilation with supply air intakes in the outer walls. The total projected exhaust air flow rate is 162 m3/h, which corresponds to 0.64 air changes per hour. The total ~ exhaust air flow rate was determined to be on average 12 7. lower in the -reference house and 22 7. lower in the experimental house compared with :; the projected value. In practice there are often large deviations from -· the projected air flow, · for which reason the Sigtuna house results are .. -not surprising. However, a review _and adjustment of the ventilation sys~ tem seems to be warranted. Moreover, tracer gas measurements show that the air change for the whole house as well as the individual rooms is relatively constant regardless of wind and outdoor temperature, which is one favourable effect of the exhaust air ventilation system in combina- --· tion with the good airtightness of the houses. . _ . --. _ , . ... .
Exhaust air ventilation leads to an underpressure of about 12 and 8 Pa on average in the reference and the experimental house respectively for the .• projected exhaust air flow. The underpressure varies more or less with ·-_:; ·_ the total airtightness of the buildings (including the' supply air in-·,,· :: · . takes), the exhaust air flow, . the thermals (chimney effect) and the wind. · At an outdoor temperature of -20°c and 20°c indoors the thermals make a · pressure gradient of 1. 9 Pa/ m or on average 4. 8 _,P,a between the _upper and -.,::
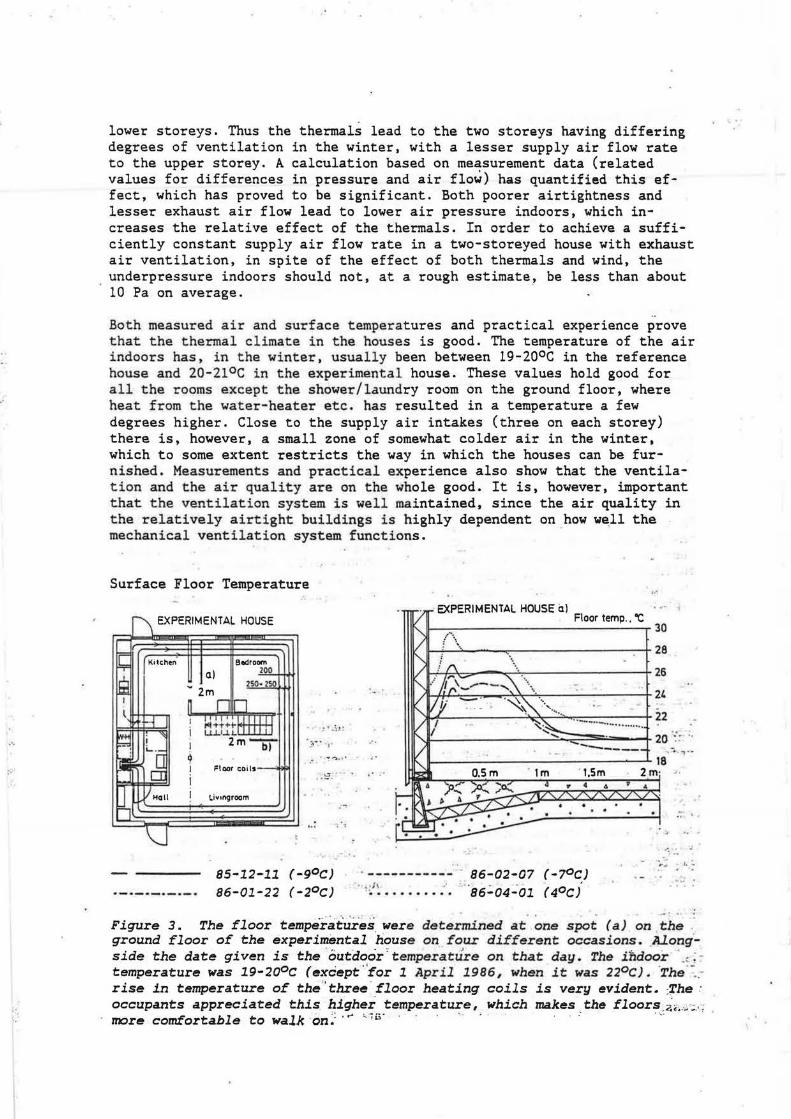
.·
:·
lower storeys. Thus the thermals lead to the two storeys having differing degrees of ventilation in the winter, with a lesser supply air flow rate to the upper storey. A calculation based on measurement data (related values for differences in pressure and air flow) has quantified this effect, which has proved to be significant. Both poorer airtightness and lesser exhaust air flow lead to lower air pressure indoors, which increases the relative effect of the thermals. In order to achieve a sufficiently constant supply air flow rate in a two-storeyed house with exhaust air ventilation, in spite of the effect of both thermals and wind, the underpressure indoors should not, at a rough estimate, be less than about 10 Pa on average.
Both measured air and surface temperatures and practical experience prove that the thermal cl imate in the houses is good. The temperature of the air indoors has, i n t he winter, usually been between 19-20°C in the reference house and 20-21°c in the experimental house. These values hold good for all the r ooms except the shower/laundry room on the ground floor, where heat f rom the water-heater etc. has resulted in a temperature a few degrees higher. Close to the supply air intakes (three on each storey) there is, however, a small zone of somewhat colder air in the winter, which to some extent restricts the way in which the houses can be furnished. Measurements and practical experience also show that the ventilation and the a i r quality are on the whole good. It is, however, important that t he ventilat i on system is well maintained, since the air quality in the rel atively a i r tight buildings is highly dependent on how well the mechanical ventil ation system funct i ons.
Surf ace Floor Temperature
EXPERIMENTAL HOUSE
Bod room a) 12.Q. ~
! • • ~ ! ~
I ;-: . .,. ~ .. . ~~.1 ·
i Floor co i ls
i :·~~.~
LiY1ngroom
-; 't
. '•
85-12-11 (-90C)
86-01-22 (-20C)
EXPERIMENTAL HOUSE al Floor temp .. 'C
~~~~~~~~~~~~~~~30
... ~ I
(\, 28
ILG~....--.;~~------::--r 2s -: '· 2L
·- 2.2 ··- -···-···-......... . (t _ ___ .s:~:::=:::::t 20 ·~· ~ · ..
. ----------- . 86-02-07 (-70C) • ' ~1 ~ •••••••• · '. , .. s6:..04~01 r 4ocJ
.-: : ~
;, .. ~
- ... -· .. ,.__ ,, ..
Figure 3. The floor temper::it.t.ires. were det ermined at one spot (a) on the ground floor of the experimental house on four different occasions • . Al.ong·side the date given is the outdoor : temperature on that day. The i ndoor . -~ : -temperature was 19-20°c (except ''for 1 April 1986, when it was 22°cJ. ·The ·-.,_ r ise in temperature of the 'three _floor heating coils is very evident. :The · occupants appreciated this higher temperature, which makes the floors ~ •• ,. ; .. :
: • ... ' -"". . . ~ .
more comfortable to walk on:·· .. '"'

r-t~· :· :··
r
c<·. ~
Figure 3 shows examples of the surf ace floor temperature in the experimental house on four different winter days when the floor heating coils were in use. Measurements were taken at every dm 0-2 m away from the outer wall. It is generally true to say that houses with a 'concrete slab directly on the ground and without floor heating often have a relatively low floor temperature just inside the outer walls on the ground floor because of thermal bridge effects, in spite of a relatively well-insulated construction. Thanks to the floor heating coils there is in the Sigtuna houses, in contrast, a higher temperature which is very favourable from the 'point of view of comfort and which makes it easier to make use of (furnish) the floor space right up to the outer walls. The rise in temperature inside the construction is also normally advantageous in order to a~oid moisture problems.
Moisture in Walls and the Concrete Slab
The risk of biological attacks on wood materials (rot, mould etc.) is to a large extent dependent on the moisture content. With a moisture content of less than about 15 7. the risk is minimal. Just after the wall elements had been erected (March 1985) the moisture content was 20-29 7. in the pressure-impretnated wooden sills of the outer walls. The time it took for the wood to dry out to the average moisture content of 15 7. was 6 months for the reference house and 2.5 months for the experimental house. The rate of drying is shown in Figure 4. The shorter time it took for the experimental house to dry out is mainly explained by the placing of a steel sill (of corrugated stainless steel) between the wooden sill and the concrete slab, while the reference house had the conventional construction generally used in the estate of polyurethane foam between the wooden sill and the concrete. A short drying-out period reduces the risk of attacks of mould etc.
The inner wall sills dried very quickly from, in some cases, a very high level of moisture. The outer wall studs have throughout the period had moisture content (at the measuring points) of between 8 and 12 7.. The wall elements are. thanks to the polyurethane foam, airtight themselves, which meant that no plastic film was used on the outer walls in this case. The dry outer wall studs and the relatively good airtightness of the ·~; . . ;·'. houses indicate that the construction functions well without plastic film, which is also confirmed by laboratory experiments by (6). As far as the : concrete foundation slabs are concerned, both measurements and practical experience show that the concrete slab was sufficiently dry (with a · · moisture content corresponding to a relative humidity of <90 7.) to avoid damage to, for example, the plastic floor covering.
!~~
Measurements of the air humidity show that the increase in moisture is relatively low, often about 2-3 g/m3 in the wet rooms and 1-2 g/m3 in the other rooms. This means that the relative humidity is fairly low indoors, and usually 20-40 7. in the wintertime.
• /
\ ...
• '~ • t""' .
"11 ..r:··~
;:.'?! • r • .• . .:..·- .,; . -;.;
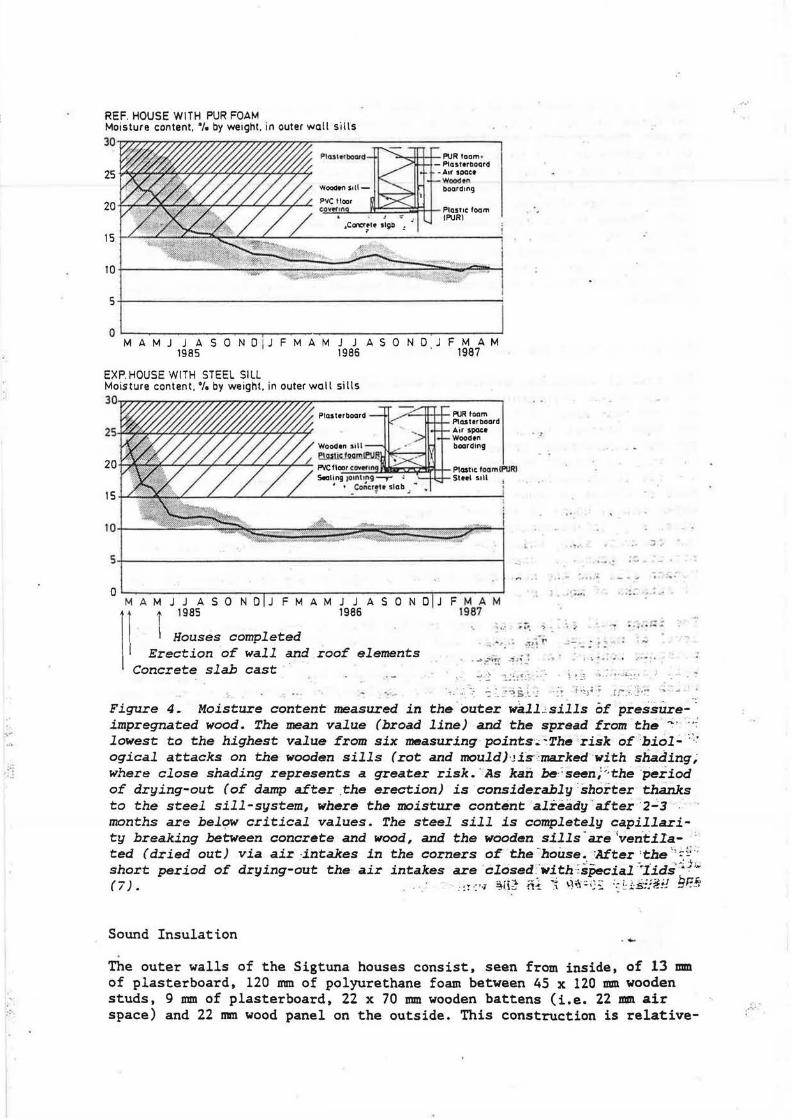
~-
,:J
.;·
REF. HOUSE WITH PUR FOAM Moisture content. •1. by weight. in outer wall sills 30"'7:.,-,,..,'7?'"7'"'M'"7-rr7"7">'77"7"T:,....,.,"T7",...,...,~~~~~~~~~~~~
25 ~"6m<~t:.1!'9'·v·v~/·Vs,,</s.rs<s·
20
15 1-/~
I -·--'<l;,;~''.'":4'~.r ,._,, . ~ ,;·$:.<.~-,.,, ...... I 10 " .-... - L • • • . - N,z:""i!', I
S +-~~~~~~~~~~~~~~~~~~~~~---i
0'----.-.--~~.--~---..--~--~~~~~~--.-.--.--.--~
MAM J J AS 0 N Di J FM AM J J AS 0 ND J FM AM 1985 1986 . 1987
EXP. HOUSE WITH STEEL Sl LL Moisture content, •1. by weight, in outer wall sills
30o>>>>>>J>>>>>>>>>>>>>>>>>>>>> I
25 1V~_l"4<4.r4.r4r4r4r4r4r4r4r4r4c4r
20
15
10 I ""'
./I' II I I PIJR loam Plasterboard Air space Woodtn boarding
>11rc..,..1ngNt;i sz:V!Jri j Plostio loamlPuR) - - SIMI sill
5-i-~~~~~~~~~~~~~~~~~~~~~~
a ..._~~~~~~~~~~~~~~~~~-.-~~~ ........... MA M J J AS 0 N DIJ FM AM J J AS 0 N DjJ FM AM
..
r I
i 1985 1986 1987 - -
I Houses completed ·. ~ ... _ '·· . .. ;, .1: .,._, •• ~""rtl
Erection of wall and - - - · Concrete slab cast
roor elements • ~:-... ''!! ., :'~ -·
~ -~ .:~~; ! ~7:
... ... 11• 1;
1:.·•I •\
. ~ .. J.,
. ~ :: ~ ' · . ! .- I o - • •
.. ' ,... ~ ~ .. ... ~ ...
.; - -- . ~: . -. : • • i • ···: : .
~ ~~: ,,. ,. _· ..:. ..... :·
·:··· - ~- ... --:: -: ;.~~ ·~s .~ .. ·: - ~~ ~-~r•·.~ r;~.<'i~~ · ..... . , ~ ~ · .. Figure 4~ Moisture content measured in th& outer walLsills of pressiixe- · impregnated wood. The mean value (broad line) and the spread from the ~ , :.; lowest to the highest value from six measuring points·;;.·The risk of 'biol- ··> ogical attacks on the wooden sills (rot and mould)·Jis·:marked with shading; where close shading represents a greater risk. · As kan be:; seen; ~:the ·period of drying-out (of damp after .the erection) is considerably :shoiter thanks to the steel sill-system, where the moisture content already ·after 2.;;3 .. months are bel~w critical values. The steel sill is completely capillarity breaking between concrete and wood, and the wooden sills-are'ventila- ' ted (dried out) via air -intakes in the corners of the .. hoi.zse. 'After ' the '·::-~; :,
. _, - . .. .. : .;. short period of drying-out the air intakes are closed :-.with :sj;ecial ~lids·~ ·#
- .,,•~ ---- -~ · ,, .. _ _,_ . ' ' '"2' / '-r::.:. (I). . :r ·:'·l ~1. \:t {H :1 q • .1-•_;~ ": ': :.::s::?.:!- ':!•~ ...
Sound Insulation --The outer walls of the Sigtuna houses consist, seen from inside, of 13 lllD
of plasterboard, 120 mm of polyurethane foam between 45 x 120 mm wooden studs, 9 mm of plasterboard, 22 x 70 mm wooden battens (i.e. 22 mm air space) and 22 mm wood panel on the outside. This construction is relative- :····
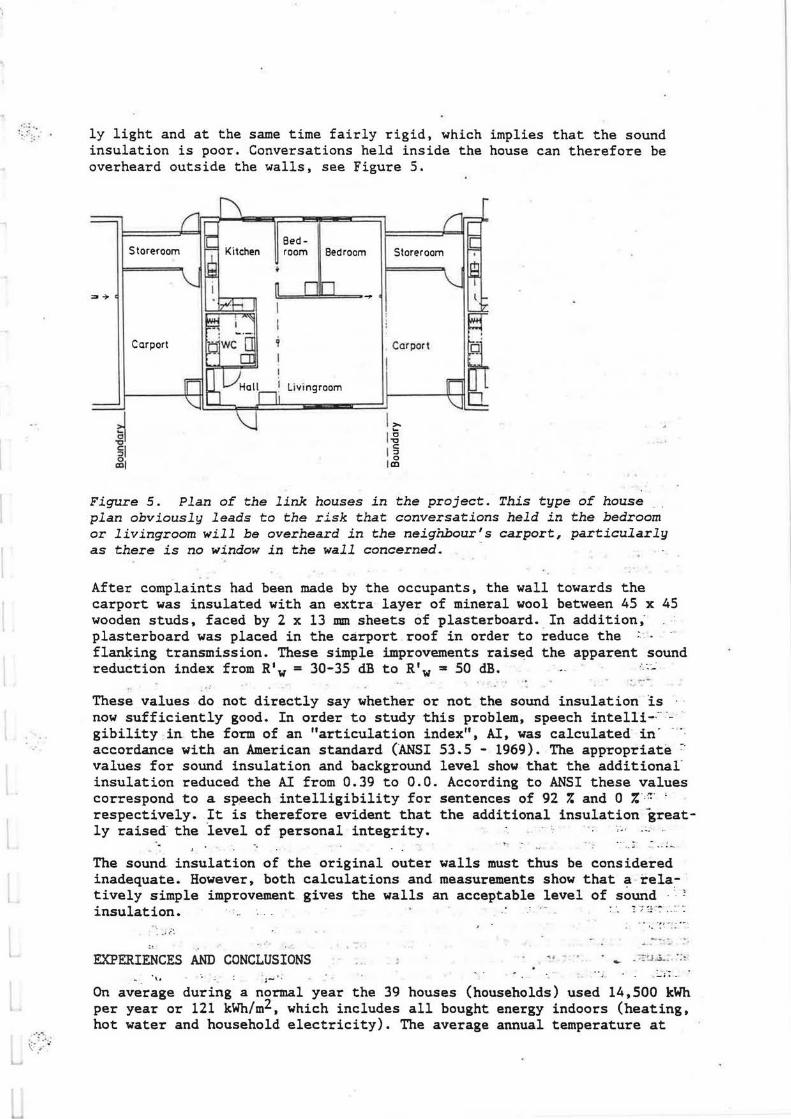
:;\'. ly light and at the same time fairly rigid, which implies that the sound insulation is poor. Conversations held inside the house can therefore be overheard outside the walls, see Figure 5.
,•
··---(c / :,:
=-~
~ "C
§I .gl
Storeroom
Carport
Bed-room II Bedroom
n ' '"' ' ~
Living room
Carport
I>-1.g 1§
0 la:i
Figure 5. Plan of the link houses in the project. This type of house plan obviously leads to the risk that conversations held in the bedroom or livingroom will be overheard in the neighbour's carport, particularly as there is no window in the wall concerned. ·
After complaints had been made by the occupants, the wall towards the carport was insulated with an extra layer of mineral wool between 45 x 45 wooden studs, faced by 2 x 13 mm sheets of plasterboard. In addition, plasterboard was placed in the carport roof in order to reduce the : -flanking transmission. These simple improvements raised the apparent sound reduction index from R'w = 30-35 dB to R'w = 50 dB. · ·· ·
These values do not directly say whether or not the sound insulation is now sufficiently good. In order to study this problem, speech intelli-·· ·_ gibility in the form of an "articulation index", AI, was calculated in· accordance with an American standard (ANSI 53.S - 1969). The appropriate ~· values for sound insulation and background level show that the additional· insulation reduced the AI from 0.39 to 0.0. According to ANSI these values correspond to a speech intelligibility for sentences of 92 7. and 0 % , ~ · ' respectively. It is therefore evident that the additional insulation great-ly raised- the 'level of personal integrity. ,.. .:.· ·
__ ; ..._
The sound insulation of the original outer walls must thus be considered inadequate. However, both calculations and measurements show that ~ relatively simple improvement gives the walls an acceptable level of sound insulation. ··•.. · ·· :·. : ;::".' .. : ·;
. , ! , • ~ r .
. . ; ~:~
~ - ....
EXPERIENCES AND CONCLUSIONS ~ - ..... p • ;.-'.J ~ .... · : :
" . ;_; . -
On average during a normal year the 39 houses (households) used 14,500 kWh per year or 121 kWh/m2, which includes all bought energy indoors (heating, hot water and household electricity). The average annual temperature at

:-
this location is 5.S°C. Exhaust air heat pumps contribute greatly to the low level of energy consumption. When comparing the households with the lowest and the highest energy consumptions, however, the ratio is 1:2.2, although the differences between the technical quality of the house are relatively small. The fact that the consumption of energy varies greatly between equivalent houses as a result of the occupants' different living habits is thus confirmed (and quantified) in this study. The houses themselves are so energy-economical that the potential in economic terms for further energy saving by means of technical improvements (thicker insulation etc.) is relatively limited, but at the same time relatively high by means of altering living habits for many families.
The determined coefficient of thermal conductivity of the polyurethane foam insulation in walls and roofs lies within the range of 0.018-0.022 W/m·°C. These low values (after up to seven years) indicate that the deterioration in the thermal conductivity of polyurethane foam in practice takes place very slowly.
The air leakage rate in four different polyurethane-insulated houses was found to be 0.3-1.4 air changes/h at 50 Pa. The extremely good airtightness for a seven-year-old house (0.3 air changes/h) indicates that the building envelope including the joints between the various house elements, can hardly have aged noticeably as far as airtightness is concerned over a period of seven years.
One problem connected with PUR-insulated constructions is, however, that they are light and at the same time relatively rigid. This implies that the sound insulation will be poor if improvements are not made.
Houses with a concrete slab directly on the ground and without floor heating of ten have a low floor temperature close to the outer walls of the ground floor because of thermal bridge effects, in spite of a well-insulated construction. Thanks to the underfloor heating coils there is, in contrast, a raised temperature in these houses, which is very advantageous from the point of view of comfort. The fact that the thermal climate in other respects is also good is shown by the measured air and surf ace temperatures and by practical experience. No damage or problems caused by moisture have been noted in these two houses. Measurements also show that critical constructions are sufficiently dry and that the air humidity indoors is relatively low.
The mechanical system of exhaust air ventilation gives a relatively constant air change rate, but the exhaust air flow rate in these two ·houses was on average somewhat lower than the projected values. :The exhaust air ventilation system gives for the projected exhaust air flow about 12 and 8 Pa underpressure respectively on average in the two houses. A combination of measurements and calculations, however, shows that the effect of the thermals (chimney effect) is considerable, so that the two storeys in the winter have different levels of ventilation, with a lesser supply air flow rate to the upper storey. In order to achieve a sufficiently constant flow of air in a two-storied house ventilated by an exhaust air system, in spite of the effect of the thermals and of the - =-:~-wind, the underpressure indoors should not, at a rough estimate, be less than about 10 Pa on average. - .. ....
; ~ ... ,.
.. :.,. · · . ·~ .. . . · ~ ·· ""

i· '• To sum up, the results are favourable. It has been proved possible to build relatively simple, economical, well-insulated and airtight houses which have a low energy consumption. At the same time problems connected with e.g. moisture, mould and poor air quality, i.e. problems associated with so-called sick buildings, have been avoided.
REFERENCES
(1) Hoglund, I., Ottoson, G. & Oman, R., Sigtunaprojektet - byggfysikaliska, energitekniska och produktionstekniska studier av PUR-isolerade smahus med nya byggnadskomponenter. Department of Building Technology, The Royal Institute of Technology. Working Report. Stockholm 1990.
(2) Hoglund, I., Ottoson, G. & Oman, R., The Energy Balance in Houses Insulated with Polyurethane. CIB W67 Workshop "Second Generation of Low-Energy Buildings in Different Climates". Stuttgart,, June 1990.
(3) Lundstrom, E., Occupant Influence on Energy Consumption in SingleFamily Dwellings. Swedish Council for Building Research. Document D5:1986. Stockholm 1986.
(4) Isberg, J., Sandwichelement av uretancellplast. Ytskiktets inverkan pa forandringen av varmemotstand med tiden. Swedish Council for Building Research. Report R69:1989. Stockholm 1989.
(5) Larsson, L-E., Sandwich Panels with Foamed Polyurethane Insulation. CIB W67 Workshop "New Opportunities for Energy Conservation in Buildings", September 1987. Department of Building Technology, The Royal Institute of Technology. Bulletin No. 153. Stockholm 1988.
(6) Larsson, L-E., Sandwichelement av uretancellplast. Fuktvandringsforsok pa laboratoriet vid varierande klimatforhallanden. Division of Building Construction, Chalmers Institute of Technology. Publication 81:4. Goteborg 1981.
(7) Hoglund, I. & Hyppel, A., New Effective Methods for Clearing Mould t: . . from Sills. CIB W67 Symposium "Energy, Moisture, Climate in Build
ings". Rotterdam, September 1990 •
.. · ( .. ,

I
I I r
i
·._· .. ~ ::
C'·
THE THERMAL PERFORMANCE OF THE FABRIC OF INDUSTRIAL BUILDINGS
ABSTRACT
P . J. Jones and G. Powell. Welsh School Of Architecture
University Of Wales College Of Cardiff. P.O Box25
Cardiff CFl 3XE U.K.
III 9
In the UK, building regulations have successively required higher levels of thermal insulation for both domestic and industrial buildings. However there is growing evidence to suggest that in practice the thermal performance of the fabric of modem buildings fails to meet the design intentions. Thie can be either due to the problems arising through poor design or through poor workmanship during construction. This paper describes results from the monitoring of the thermal performance of a range of industrial buildings, of both cladding and masonry construction. Heat flow measurements in walls and roofs have shown that the fabric heat loss can be greater by up to 22% compared with that predicted using design U-values. Analysis of working drawings has indicated that structural interference can cause a further increase in fabric heat loss of up to 23%. Poor workmanship has resulted in areas of missing insulation which bas been estimated to increase the average fabric heat loss further by up to 26%. This paper summarises the accumulation of these effects and shows that the average U-values in practice are typically between 38% and 51 % higher than design U-value predictions. The paper suggests some guide-lines for improvements in the design and construction of industrial buildings in terms of the thermal performance of the fabric.
KEYWORDS
Low Energy Factories, U-values, Fabric Heat Loss, Measurement,. Construction.
RANK XEROX COMMUN/CATIE SERVICE

..
·~ 1
1.0 INTRODUCTION
In recent years in the UK the minimum requirement levels for thermal insulation in industrial building!! have been increased. The most recent changes call for U-values of 0.45 W/m2K in the walls and roof (1). However, there is a growing concern, substantiated by research (2), that such improvements in fabric performance are not fully achieved in practice. This could be due to a combination of a number of factors, namely;
- materials when combined in a construction not performing in accordance with design data. - the influence of structure and other cold bridging effects. . - workmanship problems resulting in missing or under-performing areas of insulation.
In combination, these factors can result in effective U-value performance considerably in excess of the design value .
The magnitude of the problem has been assessed as part of an experimental programme carried out on three types of construction, based on the following strategy. Firstly, a thermography survey was performed on each of the construction types. The immediate results of the survey were used to choose a representative position in each construction where. the fabric appeared to performing correctly. Heat flux measurements were performed at these positions to establish a measured U-value. The effects of structural influences (cladding rails and spacers, masonry returns) were then considered. An average construction U-value was then calculated based on the measured elemental U-value and the structural influences. The results of the thermography survey were then analysed to determine the area of defective insulation arising through workmanship problems. These considerations modified the average construction U-value still further, resulting in the 'as-built' U-value.
The paper discusses these relative effects using examples of cladding wall, cladding roof and masonry diaphragm wall constructions as described in Figure 1 below.
FIGURE 1. The test constructions
80mm Insulation (Nominal)
Metal cladding construction (U-value • 0.45 W/m2K)
80mm Insulation
Internal
~ ~ External
Masonry Diaphragm Construction (U-value = 0.35 W/m2K)

~·:: .
··=· \
2.0 DESIGN U-VALUE
The design U-values for the three constructions shown in Figure 1 were calculated in accordance with the CIBSE Guide (3) to be 0.45 W/m2K, 0.45.W/m2K, and 0.35 W/m2K for the cladding wall, cladding roof and masonry diaphragm wall constructions respectively. The Uvalue thus calculated can be termed the elemental U-value, and it does not take into account any structural influences (cladding rails, spacers and masonry returns) that may be present in the finished construction.
3.0 MEASURED U-VALUES
The first stage of the investigation was to measure the elemental U-value and to compare it with the design value.
The measurement method consisted of placing heat flux sensors within each of the test constructions and monitoring the heat flux together with the internal and external air temperatures . The sensors were positioned in a representative area of fabric after consideration of the results from a thermography survey performed in each test building (refer to section 5.0). The heat flux sensors used were TNO WS31. The accuracy of their calibration was 5%. For the cladding wall and cladding roof constructions the heat flux sensors were fixed to the cavity side of the inner sheet using clear adhesive tape. Silicone grease was smeared onto the face of the heat flux disc to promote thermal contact between the heat flux sensor and the cladding (4). Care was taken not to disturb the glass fibre quilt insulation. In the case of the masonry diaphragm wall construction, the disc was attached to the cavity side of the inner leaf (blockwork) using silicone putty. A small correction was applied to the measured heat flow to allow for the lower efficiency of the thermal contact (4). Thermistors were used to measure the air temperatures. These were individually calibrated and had an accuracy of 0.2 ·c. ·
The heat flux sensors were monitored every ten seconds and a thirty minute average was computed and then stored on a data logger. The air temperatures were recorded every half hour. The measurements were carried out over the heating season (October to May).
The measured elemental U-values obtained were 0.55 W/m2K, 0.49 W/m2K and 0.39 W/m2K for the cladding wall, cladding roof and masonry wall constructions respectively.
·.- ' ... The differences between design U-values and the measured elemental U-values were ·· considered to be some way due to the under-performance of materials used, eg. perhaps to some extent due to air infiltration through the low-density insulation.
4.0 STRUCTURAL INFLUENCES
In order to assign an average U-value over the whole construction, structural influences, eg; · cladding fixing rails, masonry returns need to be taken into account. This can be achieved -using an area weighted U-value calculation (5). The elemental U-value is known from above. · -The average construction U-value, taking account of structural influences, can be calculated using the relative area of structural cold bridging as a proportion of the total fabric area. This e
value can be termed the average construction U-value and it is the measured elemental Uvalue moderated by the theoretically estimated effect of structural cold bridging.
This is a simplistic treatment of the problem. Recent evidence (q, 7) suggests that such · structural cold bridging may transmit a greater amount of heat than their relative area would suggest, and this is the subject of a current research programme by the authors. · ,

In the cladding wall and cladding roof constructions the structural influences are in the form of metal spacers. With reference to the working drawings, the effective bridging area of the metal spacers was estimated to be 1 % of the total wall/roof a~ea.
In the masonry diaphragm wall construction the cold bridging was in the form of masonry returns, i.e. brick or blockwork spanning the cavity for structural strength. It was estimated that this bridging area was 9% of the total wall area.
These considerations modified the measured elemental U-values, yielding average construction U-values of 0.60 W/m2K, 0.54 W/m2K and 0.48 W/m2K for the cladding wall, cladding roof and masonry wall constructions respectively.
5.0 WORKMANSffiP
The effects of workmanship manifest themselves in the quality of the construction and in particular the standard to which the insulation has been installed. The most suitable method for checking the installation of insulation is a thermographic survey.
A thermographic survey is able to detect the variation of surface temperature which might arise due to missing or poorly performing insulation (8). All objects emit heat energy (ie. infrared radiation), the amount being dependent on the surface temperatme of the object in question. 'Thermography' is the term used to describe the process of making this heat energy visible and capable of interpretation. In a thermographic survey, an infra-red camera is used to scan the surfaces of a building. The camera has the ability to produce a 1ive' heat energy picture, that can be viewed through a screen and simultaneously saved onto video tape. The picture appears in greyscale. The differences in tones of grey correspond to differences in surface temperature across the surface being viewed. Surface temperature differences of the order of 0.2 ·c can be identified. The infra-red camera is therefore an ideal tool for locating changes in surface temperature that result from lack of insulation. Differences in surface temperature are more pronounced on the internal surfaces. Therefore the surveys are usually carried out from the inside, looking out. This also allows the roof to be surveyed without the need for aerial equipment.
A therm.ographic survey was used in each of the building investigated to assess the standard of installation of insulation in the wall and roof constructions, and to identify and record any potentially defective areas. The construction of representative defective areas was investigated by the process of local deconstruction, and as a result all identified defects were attributed to areas of missing insulation.
It was found that there was approximately 1 %, 5% and 1 % missing insulation in the cladding wall, cladding roof and masonry wall constructions respectively.
The U-values of the defective areas of each of the test constructions (ie. the inner and outer leaf with an air cavity between) were calculated to be 2.78 W/m2K, 3.23 W/m2K and 1.607 W/m2K for the cladding wall, cladding roof and masonry wall constructions respectively. The area weighted average U-value for each construction, taking account of missing areas of -insulation was, calculated to be 0.62 W/m2K, 0.68 W/m2K and 0.49 W/mZK. for the cladding -wall, cladding roof and masonry wall constructions respectively. These have been termed the 'as built' U-values.
6.0 DISCUSSION
The previous sections have used a series of techniques to derive an average 'as-built' U-value for the constructions investigated. This process has illustrated how the U-value performance

::-.··:
..
c:·:·
can be degraded at every stage from design, selection of materials and finally the construction process itself. The results have been swnmarised in Table 1 and Figure 2. The percentage increase of the as-built U-value over the design elem~ntal value is shown for each construction in brackets in Table 1.
Table 1. Summary ofresults (percentage increases in brackets(%)
Construction Type --
Elemental U-values (W/m2K) Structural As-Built U-value (W/m2K)
Design Measured U-value (W/m2K)
Cladding Wall 0.45 0.55 (22) 0.60 (33) 0.62 (38)
Cladding Roof . 0.45 0.49 (9) 0.54 (20) 0.68 (51)
' Masonry Wall 0.35 0.39 (11) 0.48 (37) 0.49 (40)
.. ·-• ,
FIGURE 2. Elemental, structural and as-built U-values for each construction.
·. T 0.7
0.6
·. 0.5
~ N
: - .... .. -. ~ .e 0.4 ~ · · -·· ~
«I
j 0.3 ::::i
0.2
, , l:JH~i"!~,~·Jq, :~r=~,···~,o.~:
0.0
as-built structural
.·
measured elemental
design elemental · ·
-·' .. J · • .._ ... ::-.'c,'..1 :... i' \ .
·;~(.•, ·- _.; ~ J 'i .:~:.;,~~ •• ..
-,~-;-_: .:. :_ : .-... ::. . .i.:·· ...... ~. ;;
....... • J•
Cladding Cladding Masonry ~ . .. _ .. .. ,, Wall Roof Wall
:.. _ ·r.;:7a:..:...;··1·~~;~ ~~-f~ .--~~ ..... : t. t . : ~ -.
The increases between design and 'as-built' U-values ranged from 38% -to 51 %, the average
being43%. • .. ~/:iji_mJ :·:,~~ ,h;~ . .. ; ' .. ·,~o··. :-~~"!": ·"· ·; ~~2;;_<,:~~----:~.'. ;~:.\~-i Measured elemental U-values were between 10 to 20% higher than their design values. Structural cold_ ,bridging .was most noticeable in the masoriry diaphragm' wall whilst workmanshii>i>roblems were most prevalent in the cladding roof. - .- -· ·- : -
:~·~, .. :'.{. •f! :.~ . ;r_:.:: · ~ .. · ~-:~~t'".~-~.r~,;;I . ~~;,~~·::·~~liq : , ~: ... . ,.
r.1n-[.) ~;t:lH; _a
~· ~~lr- ; ~ ~.1~~-~!,~ :·-~4-" :;.,~, ... r:! (i ·r ···:
•:"fl~~1Jr:Ef:.. ~·f~: ::.....:;ir ' ~.:of .. _.].7~. 1J:~·.·~ ·
,,
. :01
· . ·. 'i 't'.., ~ ·~ ~ ·:a:• " ';<:·:';!'!: ';~-·~! ....... :
' ' ,f(: :::~- .! ' \ ~r :j ~~\. ~ ~·)i!:·:-~• ~:iH':. ..... -~
; ·r ·~ . i{.i ; '"">-~.:J~~r5 ~f. 1~) • ·! ,,_~~:ed:..J

. ·
7.0 CONCLUSIONS
The U-value performance of the industrial buildin~ constructions investigated have been estimated to exceed design U-values by up to 50%. ·
The main problems identified in the study have been:
- the under-performing of materials when combined in a construction, possibly due to compression of insulation and air infiltration through the construction. Designers should ensure that they use good quality materials and pay attention to detailing to avoid excessive compression of insulation and excessive ventilation of the construction.
- the effect of structural cold bridging. Designers should specify thermal barriers wherever possible.
- the poor quality of workmanship on-site. Large areas of missing insulation quickly cancel out the benefits of well inS'ulated buildings. The application of thermography has been identified as an important tool in the construction indu1~try. It can be used as a quality control check before a newly constructed building is accepted.
The results presented in this paper may be considered to be a co.nservative estimate of the Uvalue performance in practice and in many buildings there may be even further increases from the design U-value performance. Recent work by the authors and others has indicated :
- Cases of high rates of air infiltration through low density insulation reducing the performance of the insulation.
-Amplified heat loss through structural cold bridging especially through metal spacers.
-Areas of missing insulation up to 20% of the total wall/roof area.
Clearly there is now an urgent need to bring the thermal perforinance of industrial constructions in line with design U-value performance.
8.0 ACKNOWLEDGEMENTS
This work is a result of a demonstration project to investigate the energy performance of industrial buildings, financed by The Welsh Development Agency and BRECSU .
9.0 REFERENCES ....
(1)
(2)
(3)
(4)
(5)
(6)
Approved Document Ll. Conservation of Fuel and Power. The Building Regulations 1990,5 . . Jones, P.J. and Powell G., Low Energy Factory Development. A denion8tration of the design, construction and performance oflow-energy factories. Ed. Smith W., Techwrite. Building Research Energy Conservation Unit Report, . . . Watford (1989) 9 '" · :, ·' · ' , · ' ·: ' ·~:~ .. ,..,\" :;':1-r::··=- c , . ~ . . . . . . . . .. .
CIBSE Guide A3, Chartered Institute Of Building Services Engineers, London (1986). -A3-4 ,. .. \, ... . :· ,~:. ·~ · :.1.~ : , .• -~ --• .-·:·~ 1'
Siviour, J.B. and Mcintyre, D.A, U-value meters in theory and practice. Building Services Engineering Research and Technology. Vol. 3 No. 2 1982. 61-69. -CIBSE Guide A3, Chartered Institute Of Building Services Engineers, London (1986). A3-9 Burberry P, Cold Bridges Construction, Calculation, Architects Joum.o.l 27 January
I'

l I
~ -· ;;.;:"
""· ·4:
I
L
\ . L(:_ ... :
L
(7)
(8)
1988. 59-65. Coates, D.T., How Green Was My Spacer, Roofing, Cladding and Insulation January 1990. 33-35 Jones P.J. and O'Sullivan, P.E.,.Ground Based Thennography Surveys For Investigating the Design Of Better Insulated Buildings, C.l.B. Conference 1986 -Advancing Building Technology, Washington (1986) vol 7, 3236-3244.

1·
.·· ···: -·:·
: .. :·;
(=···,
A MATHEMATICAL MODEL OF A MEMBRANELESS GROUND HEAT AND MASS EXCHANGER
FOR DESIGN PURPOSES
* W. Kowalczyk , G.J. Besler Institute of Chemical Engineering and Heating Equipment Technical University of Wroc~aw Norwida 4/6, 50-373 Wroc~aw, Poland
ABSTRACT
III 10
A mathematical model of heat and mass transfer in a membraneless ground exchanger is presented. The model is applicable to the most interesting case when air of the temperature above water melting point is flowing through the exchanger. It presents one-dimensional distribution of temperature, water vapor concentration and moisture content in the bed region as well as two-dimensional distribution of temperature and water content in the surrounding ground, at any time of the process. Performed verification has shown good accuracy of the model for design purposes. Comparison of the data calculated from the model and those obtained from the experimental investigations of 3 ground exchangers at the Technical University of Wroclaw are presented graphically.
INTRODUCTION ,
Rational _design of a membraneless ground heat and mass exchanger should be based on · 'foreseeing its transient operation. The former 3 mathematical models of the exchanger,_ presented successively in reports (l,2,3), differed - only in level of detail ,. whereas the same phenomena were taken into account. It was shown (4) that they all had an accuracy insuffic-ient. for the design needs. ~ - -- ·, ·· ·
• . _, ~ ·.: ~ - ;·· :.J ·'-" ·: , ;, ;. ._
The mathematical model, as presented in this paper, of heat and mass transfer in a membraneless ground exchanger ·:was developed and veryfied in the thesis (4). It consists of differential equations of . heat and mass transport with. appropriate. initial-boundary conditions. The model describes the most interesting case when air with a temperature above water melting point is flowing through the exchanger.
J
' . -... ~
* .. .. - ... --. presently at the Institute of Applied Physics TPD-TNO: : . •.
P.O.Box 155, 2600 AD Delft, The Netherlands ...
RANK XEROX COMMUN/CATIE SERVICE

FIGURE 1. Schematic diagram of a membraneless ground heat and mass exchanger
CHARACTERISTCS OF A MEMBRANELESS GROUND EXCHANGER
A membrane 1 ess ground heat and mass exchanger i.s used for air treatment in ventilation or air-conditioning systems. The basic advantage of the exchanger is the ability to keep the temperature of the conditioned air on a beneficial - level. i.e. in summer time the ambient air is cooled down so it . may be directly used to ventilate rooms, and therefore a cooling unit may be eliminated from the system. In ·winter time the · air may be preheated or ,more ·efficiently. the exchan·g·er - inay be used to regenerate heat from the exhaust air .
. ·5 ~:lo : . r .~ ~~ ~ :: .:~ t'"f ~ ... ~· · ~ ·: ,
A membraneless ground heat -. and mass exchanger - (Fig- ~l) . is designed as a bed of natural material (e.g.· gravel) ·placed directly in ground. The ambient air is drawn in through · the inlet 7 to the distributing duct 4. Then it flows through the large diameter stone layer 2 and uniformly supplies the bed 1 . Basic treatment of the air takes place · in · the ~ bed 1 region. Direct contact of the bed with the surrounding ground facilitates heat and mass exchange between these regions. After conditionig, the air flows through the large diameter stone layer 3 to the collector 5. The air collector is connected to the suction side of the fan. The heat and moisture insulation 6 preserves the bed 1 from--· impurit-ies~and reduces unwanted influence of transient 1: atmospheric conditions on the bed region with the adjacent ground -layers. The spraying installation is mainly provided for periodic rinsing and disinfection of the bed.

-f
[
[
I I
.. ..
,:
·/ ·:··
A MODEL OF HEAT AND MASS TRANSFER IN THE MEMBRANELESS GROUND EXCHANGER
The heat and mass exchange in the membraneless ground exchanger is considerably complicated due to the non-stationary and three-dimensional character of the process, heterogeneity of the region contributing in the process (bed + ground) as well as diversity of the phenomena influencing parameters of the flowing air. Some of these problems are discussed in the paper (5).
In the thesis (4) the phenomena influencing the process of air conditioning in the membraneless ground exchanger were identified and a mathematical model of the exchanger through which air with a temperature above water melting point is flowing, was developed.
The following assumptions were made to formulate the model: 1. Plug flow of the air through the bed is assumed 2. Accumulation in the air is neglected 3. Water movement over the bed is neglected 4. The ground region is reduced to the layers directly
adjacent to the bed 5. Perfect transversal mixing of the flowing air is assumed 6. Resistance of heat and water vapor mass transfer from air
to the ground is neglected 7. Water vapor mass transfer in the ground is neglected 8. Constant sorption properties of the bed and ground ' are
assumed and sorption histeresis is neglected 9. Constant pressure as well as constant thermo-physical
properties of all the phases are assumed.
With the specified assumptions, the three.-dimensi~nal process· in the exchanger bed and the surrounding ground is reduced in such a way that the transport of heat and mass may be described by one-dimensional (0 < x < L) equations in the bed region and by two-dimensional (0 < x < L, 0 < .. y < L. )
.. . .· g equations in the ground region: transport of heat in the solid phase of the bed
a T Cl-c)p c • • a.a[T -T ) · + r(3c1[x-X(T )p(W)] Cl.l)
s • - . p • •
' - ' bdlance of water mass on the bed .. ~
aw · . Cl:_c)p
9 _. = f'1a[x-xcT.>p<W>] with W ~ W
9 lo. l ( 1. 2)
transport of water vapor mass in the air . -· ·- . ~ ... :" ·:.:::-..J
a x o = -p w + f1a [xcT >PCW>-x] +
P 0 a x • . ~-" ..
a v -, :· -2A+B P D (V) (t~x~9l ~
AB "' g lJ Y _ :.....: ( 1 . 3 ) . . .:
•b •
_: 1 - I ; . .•. ~

heat transport in the air a T
+ a.a ( T 9 -T P J 0 = -p w c p
+ p 0 p 8 x
2A+B [ aT iJ v
(t.x.DJ] + AB A. 9 (t,x,0) - rp D CV) ( 1. 4)
g a Y v 9 iJ y
heat transport in the ground iJ T [ iJ
2
T iJ2
T ] 9 =a g + g ( 1. 5)
a t 9 a x 2 a y 2
water mass transport in the ground iJ v
= -0- [o <Vl
iJ v ] + -0
- [o <VJ iJ v ] ( 1. 6) a t a x 9 a x a Y g lJ y
The above equations, completed with initial-boundary conditions. constitute membraneless ground exchanger.
the the
appropriate model of the
VERIFICATION OF THE MODEL
The model was solved using finite difference method (4). algorithm developed was used to perform simulations for data obtained from experimental investigations of a group
The the of
3 ground exchangers at the Technical University of Wroc%aw in the period from 1987.06.23 to 1987.08.01.
For the simulated period. the maximum absolute value IATI ma.x
of the difference between the temperature predicted with the model and that measured. was 3.l·c. For the relative humidity the maximum absolute difference. was IAf'I . = 21%. Maximum
ma.x .
average absolute differences were respectively IATI. r -1 : 1 ~c. and .. IA"l.,.=8%. Such an accuracy of the model is satisfactory
:· for the design needs. ., - - . : ·i -~
The temperature and relative humidity of the air. as predicted with the model. at the outlet of the investigated exchangers in the period from 1987.07.05 to 1987.07.10, are presented in Fig.2. For comparison. the data measured at the outlet and at the inlet of the exchangers are also presented.
CONCLUSIONS - . . The presented model of heat and mass transfer in . a membraneless ground exchanger through which air with a temperature above water melting point is flowing. describes the process with an accuracy satisfactory for the design needs. Presently the model is the only one fulfilling such requirements. It accounts for all important subprocesses and can be especially useful for optimum design of the exchanger.

~ -
;
v ·
I L
a) exchanger wl: AxBxL=0.7x0.7x5.0 m; w =0.11 m/s 0 .... r "' · ~ . "' . ~ =· '" :g c'21\:J( c:?' 0. ~
.c--:-:= : . t <j ae
40 : : . 20 : : :
T, •c O • 40
30
20 ~ .<;>~ ,r::;J ~? ~ : : ~ . C . . ~ ...-.... . 10 . ' . ~
0
•10 • :o •30
o.. • 3' '---,-,-o-,-o,--'--,-,-o-;o-.--'--,-,-0-10-1---,..,;"'0"'1..,o"'e ---,..,,-0-,-0,---,-,0-1_1_0_..;.. O•trHiu o.-24. o. ·24. o.·24. o.·24, o.-2« . 0.-24.
b) exchanger w2: AxBxL-1.0xl.Ox5.0 m: w -0.11 m/s 0 .... r - . . 100 : .c= :
:g <?<5' C7 40 • 3
20 ; : 0 • 3
T • •c T • :
4C/f Q ~. V 2""SC3.-: v . : : . . . . . , 3 . . ' .
.• 40
;;:o ~ .<;> Q .r '>.;,, / '- , 2!!!0 zcc: • <F ~ ; . ~
;o
10
0
·10
-:o •30
Do "3' '---,.,.,,~0"'1""0"",---,.,,,,-o,-o-.---,,.,,,...0""1"'0""1---. ""'e""1"'0"'1"'01,,.---.,,,1=-0"'1"'0"'"'---,.,,,..0"'1"'"1""0--·':: ~ O•er••h~ o.-24 •• : :·: o.·24. ·: _ o.·24. 0.-2•. · o.·H. o.-~•.
f, . ... ~ . - ~ - -
c) .exchanger w3: AxBxL-2.0x2.0x5.0 m; w .:0 : 11 .m/s . .. . , .• '. ·· , . 0 . . . - : ..
, l ·~; - ~~ '.-.' . : ~ FI 'l . .. . : _· . : .. J = ::- : . ., ·'? - ; ,- : . •• · : •. . : :.:_ ;.. ~~
<.· ····'"' " ·::,c" •::~ - · o~: , ·: ... . ,,,-",. ,.. ... ,·· , •o c=:>. . , : : . ,_. -~ . , ..... · ... ; , . .... ,_ . , • . '40 • • : : : •. - - : .. : - :"'" ·
' • .., I )" ' .. ._ 20 = "" ' : ' ~ • ·; •:-·"": --• -: • • -• : -•' -: ('tT::. ··:- > .:·· ·T.:C 4:1 .. ·1 :. -.. • · ~ :- •-: .: . : ~ _··· . - ~-- -:: . ·=t
\ I '~ ' ~ ' ... ' ... • -4.,. -, ; ~:~L.:-·.'· :t..- 1 ~ ... ~~-: ',;· :---- .........
.: ... ..,.·- --· . ~ j - ~ .'•• . : r
::> ·.-... , .. ,.. ... ,. - '. ·i.. .v .• _ ~ ~·'1
30 - .. ::. : -:. - ...... - .... ·-
20 J ~~ <::::;; -< "-..; " c > - . . : .• ; r<J .<J . <J zrii?>O <::::::o--: . . : 10 . . . , : '.'- : <:::;: ~
0
•10
•20 -~ .:. ::- - -
... .... : :
·--7' : . - ._· - -
... : ~
.. ·- . ..
. : --. -- --- _ ... - .. --.....
!\'": ;·:·: -1 ~.-~~ :
-:o -,; er -· : .. D.tr ·l~ •1010' 17070• 1:'0701 970101 t1010" 170710
..... . " O•or ut.• ::::: ,..: o. ·z4 , ·· o.-24. - : :"""0.·24. -'...,; ~ o.·2•. , -:. 0.:2•~ •. o.·z•. ::;.. - ~ ~ •• "': : : · t '4 :-_ ·- =- ;::.
FIGURE 2. c · Parameters ·of the ' ambient ifr ~ cd.~tted 1 £ne {. at the exchanger outlet (bold~'line) ·and pred.:lcted with tne model Csolid:iine> for the 'period from .. 1987.07.05 . to 1987.07.10. A group of 3 ground exchangers at the Technicai .. University of WrocS:aw

..
.:·
SYMBOLS
A.B,L - height2width,length of the bed (m); a - thermal diffusivity (m s- 1
); c - constant pressure specific heat (J kg- 1 K- 1
); D (V) - coefficient of water diffusion in ground 2 -1 9 .
(m s ); L - thickness of the accounted ground layer 9
adjacent to the bed walls (m); r - heat of eva porat ion o f -1 0
water (J kg ); T - temperature ( C); t - t i me (s); V volumetric water content in ground (m3 wa t er m- 3 ground); W -
-1 moisture content of the bed (kg water kg d.m.); W s l ~t
-1 (kg water kg d.m.); static water hold-up on the bed w 0
superficial velocity (m s- 1); X - air humidity ratio (kg kg- 1
d.a.) ; X(T) - saturated air humidity ratio (kg kg- 1 d.a.); x.y - cartesian coordinates (m) Greek symbols ~ - heat transfer coeff idient from air to the bed particle surface (W m- 2 K- 1
); ~ - mass transfer coefficient from air -2 -1 to the bed particle surface (kg m . s . ); c ~ bed porosity;
~(W) - relative humidity of air in equlibrium with the bed of moisture content W; A - molecular thermal conductivity (W m- 1
-1 . -3 K ); o - mass density (kg m ); c - specific area of the bed 2 -'3 (m m )
Subscripts g - ground; p - air;- s - bed sol id phase; w - water ·
REFERENCES
(1)
(2)
( 3)
(4)
(5)
"' '
Besler--G.J .. , .Gryglewicz_, W.,. .. Kolek - A., . Kowalczyk W., Malecki W. 'et al.: Introductory model of a membrane less ground heat and mass exchanger as well as design and realization of laboratory facility. -Report TU Wroclaw, I-13, SPR 22/82, Wroclaw 1982.(in polish) Besler G.J., Gryglewicz W., Kolek A., Kowalczyk W., Malecki W • . et __ .al. :. Numerical modeling of a membraneless ground "-''he'af and , . mass~ --~~_-exchanger.· . · : ~ experimenta 1 inest igat.i.ons._of graye l_be_ds as ___ we 11 __ a_s · design of a group of ground exchangers. Report TU Wroclaw, I-13, SPR 17/83, Wroclaw 1983.(in polish) Besler G.J., __ Gryg1ewicz W., ·· Kolek . A., Kowalczyk W., Marecki .... .. - W. -- et ··. aC·:·-~· -· -- ·pi lot-scale experimental investigations and construction of a group of ground exchangers. Report TU Wroclaw, I-13, SPR 38/84, Wroclaw 1984. (in polish) Kowalczyk W.: A mathematical model of heat and transfer-in.a- membraneless -ground exchanger working a ventilation system. ,:·Report TU Wroclaw>··~I-13, 55/88, Wroclaw 1988. (doctor's thesis, in polish)
mass for SPR
Kcl ek A .• _ Kowalczyk W.: .. ,Mathematical . . modeling ·of . · a membrane 1 ess ground heat -exchanger. Proc . Conf . .. "Mass and Heat -Transfer. .. · iri Process: · Engineering'.', _. Mi~dzyg6rze, Sept. 26_:.30; 1986. PWr • . Wrocl.aw 1986 : pp.80-91. . · .. . ;._··· - _ .. .. ~· · : , ".. . 'f"-'. . .
-;.i ·: -. ". _, :_,

I
····· . ..
ENERGY CONSERVATION IDEAS FOR PRECONDITIONING OF AMBIENT AIR
IN (H)VAC-SYSTEMS '.
w. Kowalczyk • Institute of Chemical Engineering and Heating Equipment Technical University of Wroclaw Norwida 4/6, 50-373 Wroclaw, Poland
A.J.Th.M. Wijsman Institute of Applied Physics TPD-TNO P.O. Box 155, 2600 AD Delft, The Netherlands
ABSTRACT
III 11
Energy conservation ideas for preconditioning of ambient air in ( H) VAC-systems are presented. The concepts are based on energy storage acting as a buffer, and use variations in ambient air temperature to collect cool or heat. In the paper, attention is paid to the use of daily variations in ambient air temperature; the use of seasonal variations is only mentioned. Performance estimations of the (H)VAC-systems with the implemented concepts are presented graphically. The results show effective operation of such systems.
INTRODUCTION
(H)VAC-systems take fresh air from ambient to satisfy indoor air quality requirements. Great expenses are spent for energy (for heating and especially for cooling) to bring the intake air at the required condition.
The temperature of the ambient air is not constant but shows daily (and also seasonal) variations, being high in the daytime ( summertime) and low in the nighttime (wintertime) . Accounting for this, energy conservation in the . (H)VAC-system may be attained by implementing heat storage as a buff er to collect cool from the intake air at night (winter), for air cooling during a day (summer). A water .tank seems to be the most . convenient storage for daily buffering; for seasonal buffering - an aquifer or DUCT-system. ·· ., ·.
In the paper, attention is paid to the use of daily variations of ambient air temperature; the use of seasonal variations is only mentioned. Daily buffering concepts are primarily thought for air cooling in (H)VAC-systems during summer time. Their idea is based on short term storage where cool, collected in night, is used for high temperature ambient air cooling. This means that the utmost advantage of these concepts can be taken in systems either operating continuously or coupled with night building cooling. ·
• presently at the Institute of Applied Physics TPD-TNO
RANK XEROX COMMUNICA TIE SERVICE

: ~.
heat exchanger
____ :~::------=~~~~-·---1, ~=~, 1----·=~~~~=-water tank T •
Twtin
pump Twtout •~~~~~~~--..... -
l l_
FIGURE 1. Scheme of a coil-tank buffer system
A COIL-TANK BUFFER SYSTEM
A coil-tank buffer system (Fig.l) consists of an air-to-water heat exchanger (coil) and a heat storage (water tank). Continuous operation of the system is possible because the phase time between the lowest and the highest temperature of the ambient air is approximately equal half a day. This gives in consequence a rather simple configuration. That system may be only used in summer time. .,
Example of an approximate operation of the coil-tank system during hot summer day is presented in Fig.2. The water tank is assumed to be a perfect storage with no mixing. As shown in the figure, the outlet air temperature Tdbout is close to 20 c.
When (H)VAC- system is extended by a coil-tank buffering as drawn in Fig •. 1, then the supply temperature is changed from the· ambient air temperature Tdbin to the temperature Tdbout. Supply air with a temperature Tdbout as calculated can then be directly used for ventilation · purposes. In such a case, ·a cooling unit may be eliminated from the system. Generally,-. energr supply for direct air cooling as well as coolirig unit capacity can be reduced.
. . -·
~ " ..
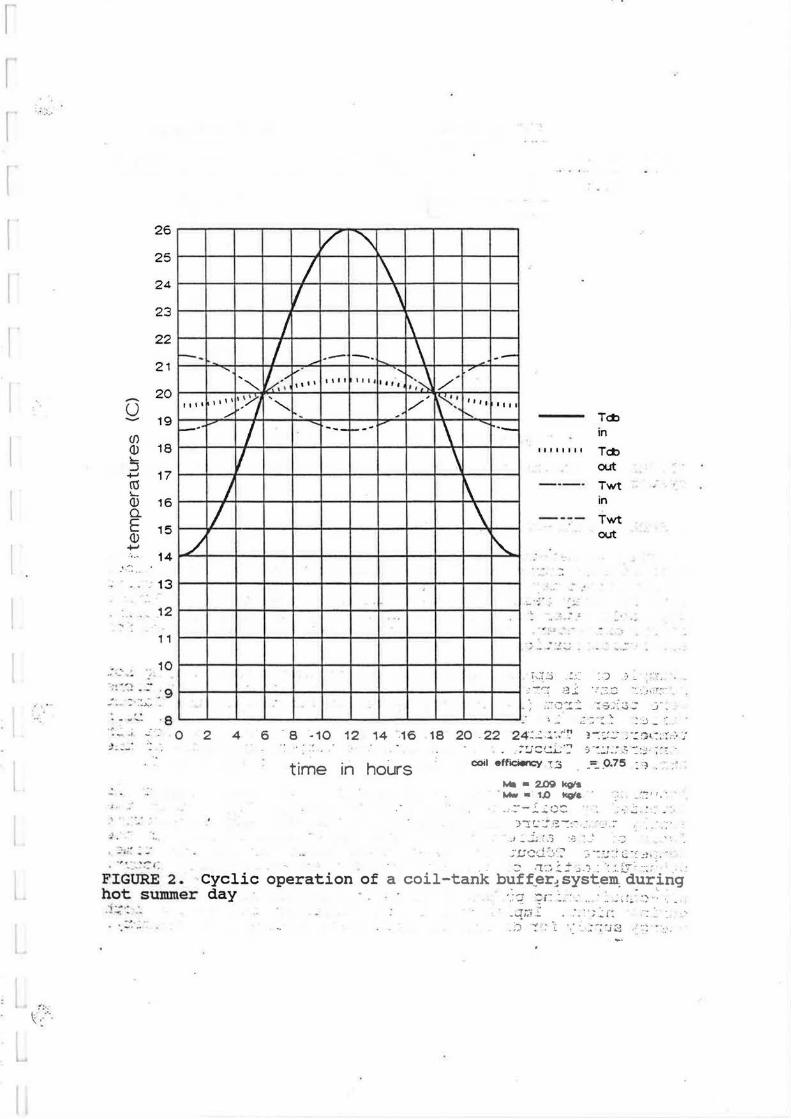
.::: ..
. , .
:':•. ~ .:··.
26
25
24
23
22 --21 "
- 20 u - 19 (/)
OJ 18 I.-:J +-' 17 ro I.-
OJ 16 Q. E 15 OJ
+-'
'""' 1111 '''' '-\1 /
-·· I I
) I
/ .· .. - 14
·' -~~ .. 13
_12 .., , , ,
:: .,:· .! . 10 --: .... ,, , " -~- . ~ -~ -:_ : 9 -. .., · ... ,,.,,
., ·- .. · 8
0 2 4 ::_ .. _
• ..:·:.f' .. -
v ""'\ I \
I \ I \
I .- -- \ 7/_,,, v ....
~~J ,,, ' l \It ~ It I I .. ,, // , ,
'""" __ ,,,,.,,,, \"-', . \ •,
- ,....-- \ ---\
' ' -
---,,.
,, '• •111
r-.... .... f-._
\ \
\..
11111111
----
----
- . - .,, : .. ~ ....... ;-
... ,.. ., ... . # ...... -
~ ... . ~ .:)
TctJ in
TctJ out
Twt , in
Twt out
::J •. : .
,-r": .:;_;.: ·;;-~·.:.;::; ··-· . .:1 :.r::·
'- :.·~ ::.:r~~ -~ ::&.:·:~:: ]" ~ ... , - • ::' \. " .. ~ . ·--' -. .:.. -·~ ......
6 8 -10 12 14 -16 18 20 -22 24·~..::. .: ·. ~' ; !' -)-::: .::.~ ~ -:. ;)t_:~: ::" . ·-) ~"
. :!J::c:i...;':' ·-;; -::.:~.~ ~:; -~: .. .:- : :·~
time in hours eoil effic:*lcy c .3 .=::. _0.75 : '~
"4a - 2m ke>'• . ...... - 1.0 ~& -- ' .- ....... -- ....... ~-
)'"!L' ~· . ~-::-: ..
~j ~ .1.4 :: a ·_-; . _
- ~.: ~ r · ...
;·..ucd·::_.,~:' -~ -:.::::~~ c ·:-: :!, _· .. . . , ... :. ~ ::r : . . .. . :: :1:-_,.:__:- ·.;.:_~ ·:.~. ~'..-:~:< · ~
FIGURE 2. cyclic operation of a coil-tank buff_er-!system; duririg hot summer day · ·.: q :;r: :. -: _, .. :. ~, :: ·: .;: " _ ~-. ~ ... _ ... .qi.'f_.:. :.: ;_;_(:
. :.) "'!' ; I . : : ~ ,..~ ~J ~~ ,.,.,_.,.

a..; _
~ -
:!
spray washer heat exchanger
air Tdbin > Tdbout Tdbout ___________ ., __ >
_ __________ ., _____ _ __., ___ _ Twbin >
winter ------ T &
T &
water tank Twtout Twtin
T~outlpumi j I >
Twtin .. pump
.---EJ l (- night operation ~) (- day operation ~)
FIGURE 3. Scheme of a spray washer-coil-tank-2 pumps buffer system
A SPRAY WASHER-COIL-TANK-2 PUMPS BUFFER SYSTEM
A spray washer-coil-tank-2 pumps buffer system· (Fig.3) uses additionally spray washer for evaporative cooling. It is based on a switched day/night operation. During night water is cooled down by spray washer and then stored in a water tank. During day, cold water from the tarik is used for ambient air cooling in the exchanger. In winter, spray washer alone may be used for air humidification. · · ·
Example of an approximate operation of that system during hot summer day is presented in Fig.4. The efficiency definitions were taken from (1). During day outlet air telnperature Tdbout varies from 14 to--16 ·C, -·· and is lower than the .. wet bulb temperature Twbin of the ambient air. During night outlet air temperature Tdbout is lower than the temperature Tdbin'of the ambient air, and reaches the minimum value of about 10 c.
Assuming the existing ( H) VAC-system with spray washer is extended by coil-tank buffering as shown in Fig.3, then the supply temperature is changed from the wet bulb temperature Twbin of the ambient air to the temperature Tdbout. As the temperature Tdbout is lower than Twbin during day time, dehumidification of the air should then additionally occur. Supply air of such parameters could be suitable both for direct air-conditioning purposes during day and for building cooling during night. Implementation of buffering can reduce both energy supply for direct air cooling and cooling unit capacity.

·1
( /
·' ..
26
25
24
23
22
21
- 20 0 - 19
• Cf) 18 Q)
~
:::J 17 ~
ro ~
Q) 16 . Q.
E 15 -Q)
- ~ 14
' - ·.· 13
.. - 12 J
11
10
9
8
v I
11 I
I I/ ,
J ,
I , ,
I/ , II
_j _-:: t- j . .,, """---
1/ - , . '1, . , - ,
/ - I : J;.. '•,
I I
: /,4 \ \
\ - I/ • ' I \
- . ' / I \
.. I , \
' \' 1/ •. " ~·" ' .. .. _
I I
, "
'\ \
\
... ' .
I' \ ..
\ 1
---
'' ,, \
\
,
I , II
,.1 .
1\ \ \ \ \
~- .. ~~ .\__ - \
-,, ' --,'' -\ -) I\ :_ ~
I
\ \ -I I . . -
I/ ,\ -\ --\ \ -\ \ ,. . I
\ '• "·-. \
\
" '
Tel:> in
---- Twb in
I I I I I I I I Tel:> out
Twt in
~
~ • l
' ~ :: ~ · "
..... . - - :,
Twt
J~ 'l 3.:J -~i·.;.~ 0 2 4 6 8 10 12 14 16 18 20 22 24 i_: 3,:~- { -
time in hours
~i ~~:! . -- ---, .,..... . -
coil effici9nc:y - • " , .. • 0.75 -i.r eoo11ng ~ •- 0.7S tunicifyii'Q effic:Mn:y .. ,= 0.75
Mii - 2.09 kO'• ....... •: .~.o '"8ls
-i ~~ ~; 1~.1 .: 'I'
. .
FIGURE 4. Cyclic operation of a spray washer-coil-tank~.2:_ pumps buffer system during hot summer day ·- . ·
.... , .,,: • 'ti ,# : "i ·- J: ·4·. ~;_-.: . ;r n :. ~ ·) s. , .- , .. .
. ;1~1. , .-, ·: ·~ , :,~ ._;: ~:· . ; ._ l '! '\ :J ~ 1°"1' ' -::-~ .• .e.:.. : .. - ~ l-:, -~ ~(; ··,~. : •
• ~!.ff£. . :!' ~ t .. 1o
~
•;:
.. ::
,,
CONCLUSIONS
Short term buffering for preconditionin9 of ambient air could be only used in summer time, so that it is primarily devoted for cooling purposes. Long term buffering extends its operation over the whole year and gives the possibility for air heating in winter and air cooling in summer time. Both short term- and long term buffering are discussed more detailed in the report ( 2 ) .
The proposals, as presented in this paper, _of energy conservation measures for preconditioning of ambient air in (H)VAC-systems can reduce the energy consumption. Costeffectiveness analysis should give final judgement. However, prior to that analysis, a promising forecast can be given when taking into account the following aspects.
The climate of the middleeuropean countries is relatively close to the human thermal comfort conditions. Especially the number of hot days, when cooling is necessary to keep room temperature at the lower level than outside, is small over a year. If there are not very high comfort requirements then (H)VAC-systems for residential purposes could be restricted only to keep room temperature while leaving humidity uncontrolled.
In that case buffering could completely substitute the conventional cooling unit in the (H)VAC-system. For short term buffering, investment costs mi9ht then be comparable with the conventional system while running costs (for pumping) are lower. In this view systems with short term buffering replacing the cooling unit, strongly seem to be cost-effective with regard to the conventional ones.
For further .investigation, a feasibility study could cover such questions like energy savings, size of the buffer system and finally cost-effectiveness analysis.
SYMBOLS
Ma - mass flow rate of air Mw - mass flow rate of water Tdbin - dry bulb temperature of ambient air Tdbm - intermediate dry bulb temperature Tdbout - dry bulb temperature of preconditioned air Tswin - water temperature at the inlet of spray washer Twbin - wet bulb temperature of ambient air Twtin - water temperature at the inlet of water tank Twtout - water temperature at the outlet of water tank
REFERENCES
(1)
(2)
Kang T. s. , Maclaine-cross I. L. : High performance, solid dessicant, open cooling cycles. ASME Journal of Solar Energy Engineering, Vol.111, 1989. pp.176-183.Kowalczyk w., Wijsman A.J.Th.M.: Energy conservation ideas for preconditioning of ambient air in (H)VACsystems. Report TPD-TNO, 914.429-II, Delft 1989.
.··· ··

r . , Benefits of Adjustab1e Shutters, Shading Devices and Vent Windows
in Passive So1ar Bui1dings
Abstract
P.J. Lute S.H. Liem
A.H.C. van Paassen
TU-Delft Laboratory of Refrigeration and Indoor Climate Technology
Mekelweg 2 2628 CD Delft
The Netherlands
III 12
Passive solar building are developed to take advantage of the solar heat to reduce the cost of heating. This is obtained by windows with large glass areas in the facade of the building. This idea has some disadvantages. The large window area gives large transmission losses and during warm periods of the year overheating can occur.
These disadvantages can be overcome by adding extra window components to the building, like a shutter, shading devices and vent windows. In order to study the capabilities of the building and the yarious components a computer simulation is developed. This paper shows the results, energy consumption and overheating, of simulations with different buildings and components.
Introduction
Passive solar buildings are developed to take advantage of the solar heat to reduce the costs of heating during the heating season. This can be realized by windows with a large glass area in the south facing facades. The idea is very simple. The large window allows large amounts of solar radiation to enter the room, which contribute to the indoor temperature of the room by heating the walls and eventually lower the energy contribution of the heating installation. ~ ·
The idea can have some s<?rne disad- . ~nsmlsslof.sun ~ vantages. The large window area ~;1J~ gives large transmission losses, ........... : which are proportional to the tempe- : '." · ·· · ·.... : rature difference between the indoor and outdoor temperature and . the window area. It depends on the type of window, and the type of outdoor climate if the difference between the heat gain by solar radiation and the heat loss caused by transmission is positive or not. It is not obvious for a certain type of building situated in a certain type of climate whether this is the case or not. (1)
•wnlng ~:. '!~~. blinds windows · shutter
n PIP: n
.... · ..... .
heating
CONTROL SYSTEM
Another disadvantage of admitting large .solar heat fluxes into the building is the overheating during warm periods. The large window allows the solar radiation in large amounts, but because of the relative small transmission loss during warm periods the indoor temperature will easily increase.
The transmission heat loss and the overheating can be reduced by adding extra passive window components to the building. These components are a rolling shutter to provide extra isolation of the building at night during heating periods to reduce the transmission loss. An awning is applied to reduce the admittance of solar radiation to prevent overheating during warm periods. And ventilating windows are applied to obtain free cooling
_ .. ,·:_. with outdoor air when overheating occurs. (::
RANK XEROX COMMUN/CATIE SERVICE

A control system is necessary, that positions all these components and let them cooperate together to obtain an acceptable indoor temperature. It is for instance necessary to prevent the windows to open while the heater supplies heat to the room. The control system is for instance also necessary to prevent the shutter from closing while the next day cooling will be necessary. It will be clear from the examples that the control system can not only exist of traditional controllers (P or PI controllers) to position the components according to the needs, but also must incorporate some kind of logical schedule to select the components that will or will not be used to control the indoor temperature. (2)
The study, that is described in this paper, will deal with the.benefits of passive solar buildings and additional components as main point of interest. The control system is therefore kept as simple as possible. 4 thermal models are developed and used for this study. Models of buildings with light interior walls and heavy interior walls are made. Each model has two types of windows with 40 and 80 % of glass area of the facade. Temperatures and energy consumption of these 4 models with components, mentioned before, are calculated and compared in order to find out the capabilities and limits of the different types of buildings and components.
The thermal models include a detailed description of the walls and the radiation heat exchange between walls and window. Also detailed absorption and emission of long wave radiation in the window is taken into account. The solar radiation that hits the facade of the building is accurately calculated from the horizontal solar radiation from the weather data sets. (1) The behaviour of the awning and the ventilation by the windows is treated separately from the thermal building model. (4) (5) The rolling shutter is incorporated in the thermal model of ~he building.
To show the effect of the outdoor climate on passive solar buildings two types of climates are chosen. The TRY (Test Reference Year) of Carpentras in the south of France represents a warm climate. And the TRY of Uccle in Belgium represents a moderate climate (comparable ,with the Dutch climate).
Building modal
The dynamics of a building are caused mainly by the dynamics of the walls of the building and the heat capacity of the room air volume. The response of the wall temperature to input signals can be approximated by a set of first order differ~~tial equations for each wall.
Two types of room.s, a light and a heavy room, are calculated. for t .he simulations described in this paper. The size, volume and total wall area . of both rooms is the same. The only difference between the light and heavy room is the interior walls. The light room has interior walls consisting of one layer of 2 cm plasterboard. The heavy room has interior walls consisting of one layer of 10 cm concrete with 1 om of plaster on each side of the wall. All other walls (floor, ceiling and exterior) are the same. The admitted solar radiation by the window is supposed to spread equally over the walls.
Windows with two different window areas are used for each of the rooms. One window is 40% of the facade area and one window is 80%. Both windows consist of double glazing with au-value of 3 W/m2 K. Only static behaviour of the window is considered. The window is described as a set of linear , equations giving the relations between the interiors window temperature and all other temperatures, like outdoor temperature, indoor air and wall temperatures and the solar radiation. The rolling shutter alters the static behaviour of the window. Therefore two sets of static equations are obtained, one set without shutter and one set with shutter. .... The first order differential equatic>ns, that describe the wall behaviour and the set of equations for the window are combined into one large set of first ·Order differential equations by calculating the heat balance of the room. The heat conduction coefficient~1 between the wall surf aces and the room air are fixed at 3 W/m1 K. The complete model of the room air tempera ture is reduced to a convenient order (4 to 6 depending on the dynamic
-.

·.·
.·:.':
... : ·
!. ,·,::
properties of the room model) and written in Jordan normal form for simulation convenience (3) .
The reduced model of the room is characterized as:
with
F G H
9aux qsi To T.
l.
i • FA + G.u.
Ti ... ~6 l .u. - [~a~ Tsi
0
Matrix with eigenvalues of the reduced room model Command matrix
• Observation matrix
... Auxiliary (convection) heat supplied to the = Solar radiation reaching the window surface
Outdoor temperature Interior air temperature
room (W] [W /m2
]
[ oc] [ oc]
(1)
The awning is of an unusual type. It is exactly horizontal with a maximum swing equal to the height of the window. The model of the awning is developed by (4) and is given by a reduction factor Fd of the solar radiation q that hits the vertical surface of the building. (1) The solar radiatign that reaches the room window becomes:
qsi = Fd(x) qsv [W/m2 ] (2)
q = Solar radiation on vertical surface [W/m' ) sv . . . (0 1) x = Awning position -
The e~ergy flow caused by an open window ~ is added to the auxiliary heating Q in the input vector .u.. There are four ventilation windows situat~ax in each corner of the total window. They .can be opened 2 by 2 (upper or lower windows) or all 4 together. , -"· ·
The calculation of the cooling power of the ventilation Q is: v
Q • cl» (a ) (T - T.) v v w 0 l. [W] .. "':':-' .-- ,.~.-
aw• Window opening angle [Rad.]
- - (3) -
The calculation of ventilation air flow cl» ·thi::cn1°gh the windows is based ·on the research of ( 5) . . . ...~ ·' .,
. ' Control. system
The control system selects and positions the components into such a position that a comfortable indoor temperature is maintained in the room. · Two . . indoor temperature set points are used. A low set point'for heating situations TSPH and a high .set point for cooling situations TSPC . . If the indoor temperature is between these two set points the control system puts all components. in a neutral position and the indoor temperature is not con-trolled. . · · ··" · ·. ,. · · ~ · - .• . ' . - .. . . ~ -· . '
"The control .system operates in different modes when the building is occupied and when the building is not occupied (at night) .
If the building is not occupied the control system takes the followiflg.ac-tions: · · .... · 1. The shutter is closed if there has been no cooling during-the previous
day and the sun has not risen. ·· 2. If the indoor temperature rises above TSPC two actions can be taken:
i . .. If the sun has already risen the awning is put in its maximum position.

·.
ii. The windows are controlled by a proportional controller in order to keep the indoor temperature at TSPC.
3. The start up time of the heater is calculated, based on the indoor temperature and the current time. At the beginning of the occupation period the start up time is checked for the condition if the lower set point TSPH is reached and if necessary the start up time is adjusted.
If the building is occupied the control system takes the following actions: 1. If the indoor temperature is lower than TSPH, the indoor temperature is
co.ntrolled wi th the heater by a PI-controller. 2. If the indoor temperature is higher than TSPC two action.s can be taken:
i. If the solar radiation is higher than a minimum value SRMIN the awning is put in its maximum position.
ii. The windows are controlled by a proportional controller in order to keep the indoor temperature at TSPC.
3. The shutter is opened. 4. In case the indoor temperature is lower than TSPC, the windows are put
into a minimum position to provide a minimum amount of fresh air.
The maximum available heating power is bound inversely proportional to the outdoor temperature. The maximum window position is bound proportional to the outdoor temperature.
The awning control is on/off control between its zero. and maximum position. The maximum position is equal to the height of the window.
BUILDING SIMULATOR WMlh• do9 dale a. tlm•
3 I IQ ht
eflllcl al .n.dlng d..nc-OU1doorlllmw.
dynMllc i;;oorl bullcllng i=:;P· _ lllCldll ,--T"-.... .-1'-1.'~.-
I I I I I I I
,- wtr:!!I~ .1'0.!i'.!!l'l. - - - - - -11 -·-.. I !J!+BY
• Y•CX I
: ;-t~ll!!N~.!!C!! ~~~~II!!: - - - - -r ---- - I I I
I I
I I
I I I I t I I I I
I I I I I I I I ": l ~ : .. I I ----------- -------I I ' '- ___________ : CONTROL SYSTEM : ________ •
0 '------------- ---------~
Agure 1. Building simulator and control system
Simul.ations and simul.ation results
..
:r : ~
) .... . ;'": ·-~ ,
. , .. , ~- , .:.r ~. .. . - . -""'ft ~--
~: ...... ..:;~
.
' ~-· - -~ .. ·: :~ ;=-
--. .; # - - ..> -
:c .::~~~·
m .. ·, .• ~1~
~- ' ; ...,, • - ".J
. ':;....,: :~ _·_;.,. --· .,)( ··'·
~ :a 4'!' _ ·- •. , '. .: ' - •
With the desc.ribed building and component models and the. describ~d - control system simulations have been carried out to investigate: the capabilities and limitations of the complete system as shown in figure 1. Ali simulations are done with the following constant factors:
Occupation period Foreground Minimum window Maximum window Facade orientation Maximum radiator SRMIN TSl?H
~ :1,::: .'."! •• r. :· ., ··,· ~·> . .._.,..... . •: -: ; ~·-~ ~ ·• ··~· · . .: ·.· ·:·· . '.-. ... ::'..; 7:00 h to 22:00 h
bitumen and gravel 5 Degrees (Minimum 35 Degrees
(Reflection ! )
South 1200 w. 250 W/m2
21 °C
supply of fresh air t) .;·J '!.;;~ ... L40 LSO H40 HBO
•light room with 40%·qlass •light room with 80% glass. •heavy_ room with 40% glass • heavy .. room .with :eot·"glass
I .. ·
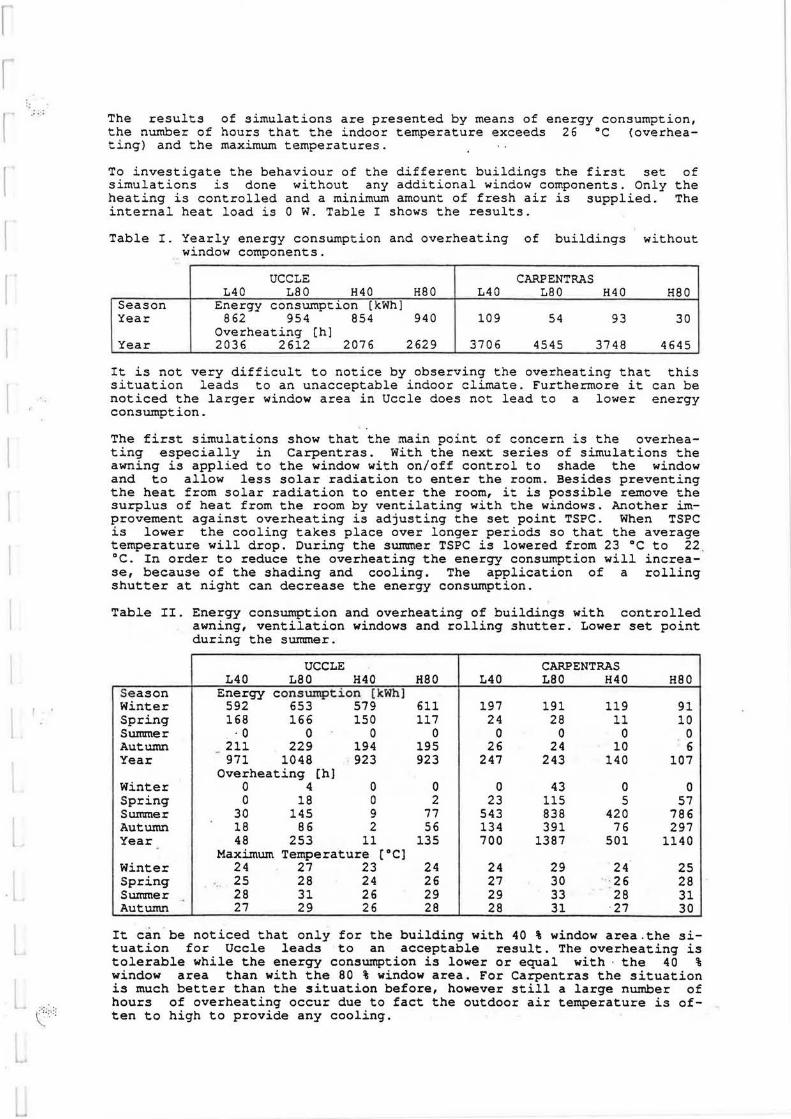
:: .....
('-'''
The results of simulations are presented by means of energy consumption, the number of hours that the indoor temperature exceeds 26 °C (overheating) and the maximum temperatures.
To investigate the behaviour of the different buildings the first set of simulations is done without any additional window components. Only the heating is controlled and a minimum amount of fresh air is supplied. The internal heat load is 0 W. Table I shows the results.
Table I. Yearly energy consumption and overheating of buildings without window components.
UCCLE CARPENTRAS L40 LBO H40 HBO L40 LBO H40 HBO
Season Energy consumption [kWh] Year 862 954 854 940 109 54 93 30
Overheating [h] Year 2036 2612 2076 2629 3706 4545 3748 4645
It is not very difficult to notice by observing the overheating that this situation leads to an unacceptable indoor climate. Furthermore it can be noticed the larger window area in Uccle does not lead to a lower energy consumption.
The first simulations show that the main point of concern is the overheating especially in Carpentras. With the next series of simulations the awning is applied to the window with on/off control to shade the window and to allow less solar radiation to enter the room. Besides preventing the heat from solar radiation to enter the room, it is possible remove the surplus of heat from the room by ventilating with the windows. Another improvement against overheating is adjusting the set point TSPC. When TSPC is lower the cooling takes place over longer periods so that the average temperature will drop. During the summer TSPC is lowered from 23 °C to 22 °C. In order to reduce the overheating the energy consumption will increase, because of the shading and cooling. The application of a rolling shutter at night can decrease the energy consumption.
Table II. Energy consumption and overheating of buildings with controlled awning, ventilation windows and rolling shutter. Lower set point during the summer.
UC CLE CARPENTRAS L40 L80 H40 HBO L40 L80 H40 H80
Season Energy consumption (kWh) Winter 592 653 579 611 197 191 119 91 Spring 168 166 150 117 24 28 11 10 Summer ·O 0 0 0 0 0 0 0 Autumn 211 229 194 195 26 24 10 6 -Year 971 1048 923 923 247 243 140 107
Overheating [h) Winter 0 4 0 0 0 43 0 0 Spring 0 18 0 2 23 115 5 57 Summer 30 145 9 77 543 838 420 786 Autumn 18 86 2 56 134 391 76 297 Year 4B 253 11 135 700 1387 501 1140 .
Maximum Temperature [°C] Winter 24 27 23 24 24 29 24 25 Spring . . 25 28 24 26 27 ' 30 ·: 26 28 Summer . 28 31 26 29 29 33 28 31 Autumn 27 29 26 28 28 31 · 27 30
It can be noticed that only for the building with 40 % window area.the situation for Uccle leads to an acceptable result. The overheating is tolerable while the energy consumption is lower or equal with · the 40 % window area than with the 80 % window area. For Carpentras the situation is much better than the situation before, however still a large number of hours of overheating occur due to fact the outdoor air temperature is often to high to provide any cooling.
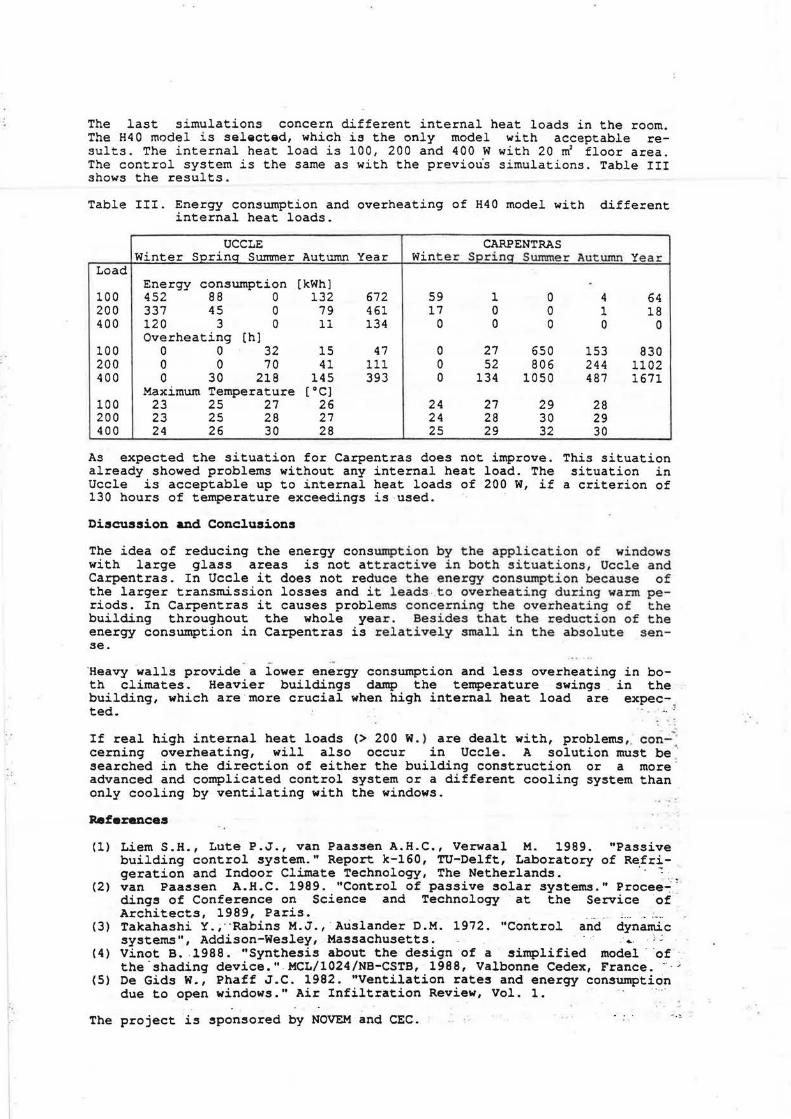
The last simulations concern different internal heat loads in the room. The H40 model is selected, which is the only model with acceptable results. The internal heat load is 100, 200 and 400 W with 20 m2 floor area. The control system is the same as with the previous simulations. Table III shows the results.
Table III. Energy consumption and overheating of H40 model with different internal heat loads.
UC CLE CARP ENT RAS Winter Serina Summer Autumn Year Winter Sprinq Swmner Autumn Yea r
Load Energy consumption (kWh)
100 452 88 0 132 672 59 1 0 200 337 45 0 79 461 17 0 0 400 120 3 0 11 134 0 0 0
Overheating (h) 100 0 0 32 15 47 0 27 650 200 0 0 70 41 111 0 52 806 400 0 30 218 145 393 0 134 1050
Maximum Temperature [°CJ 100 23 25 27 26 24 27 29 200 23 25 28 27 24 28 30 400 24 26 30 28 25 29 32
As expected the situation for Carpentras does not improve. already showed problems without any internal heat load. The Uccle is acceptable up to internal heat loads of 200 W, if 130 hours of temperature exceedings is used.
Discussion and Conclusions
4 64 1 18 0 0
153 830 244 1102 487 1671
28 29 30
This situation situation in
a criterion of
The idea of reducing the energy consumption by the application of windows with large glass areas is not attractive in both situations, Uccle and Carpentras. In Uccle it does not reduce the energy consumption because of the larger transmission losses and it leads .to overheating during warm periods. In Carpentras it causes problems concerning the overheating of the building throughout the whole year. Besides that the reduction of the energy consumption in Carpentras is relatively small in the absolute sense.
'Heavy walls provide a lower energy consumption and less overheating in both climates. Heavier buildings damp the temperature swings in the building, which are more crucial when high internal heat load are expec-ted. - ~
If real high internal heat loads (> 200 W.) are dealt with, problems, . con-~ cerning overheating, will also occur in Uccle. A solution must be · searched in the direction of either the building construction or a more advanced and complicated control system or a different cooling system than only cooling by ventilating with the windows.
References
(1) Liem S.H., Lute P.J., van Paassen A.H.C., Verwaal M. 1989. "Passive building control system." Report k-160, TU-Delft, Laboratory of Refri-geration and Indoor Climate Technology, The Netherlands. · ~ . .
(2) van Paassen A.H.C. 1989. "Control of passive solar systems." Procee~ · dings of Conference on Science and Technology at the Service of Architects, 1989, Paris. . __ ... _ : __
(3) Takahashi Y., "Rabins M. J., -Auslander D .M. 1972. "Control and dynamic systems", Addison-We5ley, Ma5sachusetts. · ... : ~
(4) Vinot B. 1988. "Synthe5is about the design of a simplified model · of the-shading device." MCL/1024/NB-CSTB, 1988, Valbonne Cedex, France.- _;
(5) De Gids W., Phaff J.C. 1982. "Ventilation rates and energy consumption due to open windows." Air Infiltration Review, Vol. 1. . _.
The project is sponsored by NOVEM and CEC.

,_
· .'~
\ ·.·:
III 13
BUILDING 2000, A PILOT PROJECT OF THE COMMISSION'S NON-NUCLEAR ENERGY R&D-PROGRAMME : .
SOLAR ENERGY APPLICATIONS TO BUILDINGS
C. den Ouden TU-Delft, Faculty of Civil Engineering
P.O. Box 5048, 2600 GA Delft, The Netherlands
ABSTRACT
The main aim of the project "Building 2000" is to stimulate the use of passive solar technologies for the design and construction of buildings. Within "Building 2000" a call for proposals was published inviting companies, developers and authorities which plan to construct a nondomestic building with a high multiplication value e.q. office building, hotel, school, hospital etc. to participate in this pilot project. In case the plans for such buildings were open for the inclusion of passive solar features, other energy efficient measures such as using innovative controls and modern daylighting features which save energy and can improve human comfort, a possibility for design assistance from the Commission is offered to benefit from build-up experience within the sub-programme "Solar Energy Applications to Buildings". 35 proposals were selected to participate in this pilot project "Building 2000". It is expected that by offering support in the form of the provision of design packages or by free consultations of Design Support Units having close liaisori with European Experts on the various fields (Passive Solar, Daylighting, etc.), the buildings designed under this pilot programme will become an example for multiplication in the near future.
1. INTRODUCTION
Within the third four-year R&D-programme (1986-1989) of the Commission of the European Communities in the field of "Solar Energy Applications to Buildings" a number of concerted actions are in progress; for details see (1). Within these concerted actions several European R&D-teams collaborate on R&D-topics like:
1. Passive Solar Urban Design, 2. Modelling and simplified design tools, 3- Testing of
Passive Solar Components, 4. Control Systems for Passive Solar Buildings/Houses, 5. Comfort/Air Flow Studies, 6. Daylighting.
A need for technology transfer from these R&D activities to the d~sign -. practitioners ha_s already been identified during the 'second four-year R&Dprogranune (1981-1985) by initiating the project Monitor, see (2) and (3) ~
and intensified by initiating the projects Solinfo and Archisol; see (4).
RANK XEROX COMMUN/CATIE SERVICE

·._.
.. :·
. ;
This sub-progranune "Building 2000" aims to sti~ulate the use of Passive Solar Buildings in Europe by encouraging design teams of larger nondomestic buildings to design their future buildings with the help of builtup experience by the Experts of the European Passive Solar Research Community. It is to be expected that by bringing together the design teams of these buildings and the European Passive Solar Experts the technology transfer will be encouraged. In this paper a review is given of the category of buildings participating within the 'Building 2000' progranune, the possibilities of design support from the R&D-community to the Design teams, the workplan and organisation of Building 2000 and the expected results from Building 2000, final products, brochures, etc.
2. PROJECTS PARTICIPATING IN THE PILOT PROJECT BUILDING 2000
Within Building 2000 in total 35 projects are participating. These are all projects in the design phase of which the probability of realisation is already secured or almost certain. The total cost for the realisation of these future buildings is approximately 140 Million ECU. The variety in building types reflects the built environment of Europe since there are schools (7), office buildings (3), public buildings (6), hotels and holiday complexes (6), laboratory and university buildings (8) and sport and educational centres (5) represented.
It is to be expected that when all these buildings are commisioned, their average yearly energy consumption - compared with traditional buildings without passive solar and energy conscious measures - will be significantly reduced (30 - 50%). In tables 1 & 2 a review of the buildings (types, countries, estimated building costs and floor area) is given. See for more details 5 and 6.
Table 1. Det•i ls Pl'r building c.1u90ry , .... l. O•Ulll tiff ...,uci•CI"' '--'""'
~
I no. I floor UH (_.) I coot (!QJ) I I ,..,_,,., I ..... i~U i UH..,,., "I I
I T- of bul ldlnt I I ! 1 t l I J I ' : 5 I • I
I Schaola I 7 I 1 , 011,aoo I 16,090,ooo I I • I I I I I 1 11 i I I I I I I I I I I I I I
I . • I I I•! l ll fl I Offtco buildi,.o I l I 42,500 I 41 ,s5o,ooo I I I I I I I : I l · I I I I I I c ' I I I I I 11 1
I N>11c tiuildi,.a I 6 I 15,500 I 12, 150,000 I I I I I I I I I I . I 11 I I I I I I I I " I ~ I I - I I I I I I I I I I
I llo<ol• & hol tday- I 6 I 24,000 I 22,96l,ooo I . I .. • I l I I • I I 1 1 I
,.
. !.
I ClllllDlUH I I I I I I r I I I I I
I I I I I I .. • I • I I 1 • r • 1 I
I L-.uory & I a I 51,400 I u,m,ooo I I I I I I I I r I '" I I I 111 I I I
I 1.1niwrsitv I I I I I I I I I I I I
I I · I I I I ... I I t I I I I I I
I ._, ' oduca•t-1 I 5 I. 7,900 I s,044,000 I I I I I I I I r I . . 11 I I• I 1 1 I I I nntrH I I I I r rer. JS 1• i •1•1•1•1> i
.. ,....,.., ··~· Z • Otfln -.u.1,.. J •"'81.te ~I..._ " ........... .,,_ .... ,.~ .... -.. ....... ,"' t •_..I .... 1 19-4 ci-c ....
~
- - . 3. THE ORGANISATION OF BUILDING 2000
For the realisation of one of its important objectives, namely the inclusion of passive solar measures and energy consciousness in actual designs during the various design phases of a number (35) of large non~ domestic buildings, there is a need for an effective organisational ' structure. In figure 3.1 a schematic representation is given of the Building 2000 organisational structure • ..

·-
i o '" 0
~ -·
· -·: ·:.
, ·:·
\.:: =·: .. . •·
From ~igure 3.1 one can see that -under the guidance of the Commissions' Technical Steering Committee - the role of the Coordinator and the Regional Liaison Agents, within the pilot project Building 2000, is essential. The task of the Regional Liaison agents is to investigate, for a number of Building 2000 projects in their region, the need for design support. The design (advice) support should be in line with the general objectives of the Building 2000 programme, which means that the support to be given by European Experts or National Design Support Experts has to be with regard to passive solar and related topics. The Liaison Agent will have to define, together with the Building 2000 project teams, the need for design (advice) support. In principle three different types of design (advice) · support activities are possible:
-, ...... J,l ten-CIC r ..- 1 ... itf In• lullGI"' 20CIG .,,.,.,111Ul-I ll"'CCW•
; ere 1 .__.
: ttcn1uc•I u • .,.,,., 1
! CO-IUH· I
! c-"''"° -u10I'! ~ ·-'• r---: C~·<mo1u11~ ! or '"""""'•1 1 ... 1
1 ~1 1. ,...,.,,,, , , , __ _ ~ .... -l...,.tl
j 1. l a11D1t c-111.1UOOG I
~-'------11 , _
I ,.--....., ~ I 11000 I I, .... I
? -··"'' 1 I l <On tM I 1 1 '----'
,.. .. 1 z. n. u.n •• u.11.1...-
r--1 I Z000 j , ,...,KC 1' I .___._
a. The consultation of an individual European Passive Solar Expert or a National Design Support Expert on Passive Solar and related topics. Note: Si nce several of the participating projects are already in the detailed design phase this seems to be the only effective way to improve the design on certain component detailing and/or minor .changes in the passive solar and daylighting aspects already integrated in the design concept. · ': . b. To carry out a small case-study by a recognised Design Support Unit having experience· with certain passive · solar/ daylighting design tools. In this case-study a sensi ti vi ty analysis · for .·certain design ·parameters to be subject for change could be made so' as to build up to the selection of the final size· of these ·parameters. · · · "-· ., '~ '. ·~ ; · ·· ·· :• ... ' " ~ ·· '. · Note: , This seems to be of value 'for· those· projects in which the pre.liminary design ·phase has not yet been concluded. : .. · · ·· · ;- · ... .. . .. ~ c. To conduct a more detailed modelling study. In several Building 2000 projects detailed simulation models ·might have to be used to provide answers on specific design aspects ', such as air movements · in atria, -approaches to ·passive· cooling, etc: : ·.'. -: '' Notes: .-, . 1· )
- When these requirements are ' identified to the coordinator he will contact the right modelling expert to conduct a more detailed study on a subject preferably of use to a group of similar Building 2000 projects.' · ·..; ::: · - Further detailing of the Building 2000 projects has to proceed and may not or may seldom directly profit ·'from the results of such 'horiz.ontal' -studies; however it is to be expecte'd that ' the results of these s..tudies will be . of value for future designs·,' especially when the resultS'''·are ,, translated into design guidelines and simplified design tools · are ' developed from these 'horizontal'-studies. : t -_; .;r; ; " ·•: ·' . : . <£; "! ·; . •
. : rn ,:;

; ..
....
Aft~r defining the design (advice) support by the ~egional Liaison Agent for the Building 2000 projects in his Region he' will communicate this need to the Building 2000 coordinator. After approval by the coordinator (who will consult the Technical Steering Committee) the support activities (a, b and/or c) can start. The Liaison Agent and the coordinator have to keep the contact with the Building 2000 project teams and the involved experts, design support units; and the modelling experts in order to ensure a correct follow-up of the design (advi~e) support activities as described under a, b and c.
4. TIMESCHEDULE OF BUILDING 2000
This concerted action has officially started on 1.1.1988 and will last 36 months till 31.12.1990. In figure 4.1 the number of working meetings within Building 2000 is given. On top of these meetings a large number of individual meetings between the Regional Liaison Agents and the participating Project Design Teams will be held. Also meetings of the coordinator and various experts have been and will be planned.
5. FINAL PRODUCTS OF BUILDING 2000 - . ·;< 1 ! -
~ ivur-ir 4.1 It.view of 11.rious ..er:ings pl~ In a.zooo
I I 1··· ··· i·············B············B···········l·········I····
I I I I I I • i· ···•· I ········•····•············•···········•·········•····
I I I I I I w i·· ·•· •V••······· ····W········ ···· l···········W•········!····
1 I I I I I
.1.in FeO Men Apr Mey JU'I Jul Aug Sap Ocr: Mav Dec J9" F•ta "'"
1998 1989
l I i ·····l··········•··· ···l·····--·l····-··•••••••••I•••••• ••
I l I I I • i·····•·················•·······•·················•········
I I I I l W i ··········•············W···•···l·················j····•·••
l I I I I
Apr H-v Jun Jul Aug s~ Oct llov Dec JM ,. Mdl Apt" ... ., JU'I
198'1 1990
I.I • Woritsftop/Pl1n11iry Mfft i"' A • CoardinHOr" • Techni c•• st .. ,.;ng C-i tt"
I • Coordin.c:ar • TKJ\ntgl St..,.int c-iu .. • bpen • Re,ianal Liaison A9ent1
As can be concluded from the planned activities described in paragraph 3, several design (advice) support :_actions will be carried out within the 36-months' period of this Building ~000 . pilot project. The results and , . conclusions of these support actions-_will have to be reported and .::~ ; :
_summarised in the _coordinators'\ f;inal._ report to the Commission. __ It :is - ·~ -
therefore to be expected that the results of the effectiveness. of __ ~ - .. .. ~ · individual expert consultations . shall become known as seen __ from the· point of view of the design teams within_ Building 2000 (= conclusions from -:: support activity mentioned in 3 .. _under_point a.). Also the results and conclusions out of the support .activity b __ (= evaluations from the yarious case studies), and the spin-off_, in ,.~e several Building 2000 projects for which these case-studies have been prepared will be reported both by the Design Support Units who have to carry out these case studies, and the coordinator, when evaluating these!_results. Furthermore ~he results and conclusions from the activities._ descr~ed in paragraph 3.c will , be- - :~ ::
reported. This will be the responsibility _ of the modelling expert who_ will have . to ._report his findings to the ,_coordinator. Finally _it is foreseen in the Building 2000 pilot project ~at , .a , coherent documentationset of all the projects participating in "Building-. 2000" will be prepared and, ~~~ely ... . distributed in order to ensure_the , realisation of more and better passive
;solar buildings in the future. In :figure 5.1 a schematic review of the planned final products, resulting from the Building 2000 pilot project,, is presented.
f·.··

I -·.::-_;
c>
,....,,..s.1scn-r1er ... •-•''•,..lllll'-.c11
I lirpN"U11 - I'"'""'' ... ' ! 1-"UO ..
j l•Jllfft (gr,1wlUC•- I I Cn·.••1t1•• n I 1--..11i,.....,.. I I I I 1 '"*"'""""'11
' u ... -... I I H• .,.,.. h Kl. I I '"par. l: acc. b ' I ! I I I 1.-•1',]:acl. c I (apert I Gn1'" U- I IOnt.,.SloOIOl"I I I j , ... ,_, Ll.lllCI"' I I ~it I On• .. H .. I 1--111,..., .. ,, I"....," I I I I
• I. /•
' 1"11UW"• I ''°"""'"' I I lrou'llW• I lroc'"""• I lroc/IUl'e I I I I I I i r ''•r•t 1 I '"•1..c1 ~ I I ~ .... I -a .. an I "''•i•t l5 I I l : I i I I 1-------"-' 11----------~ I • zooa I 1 zooa I I I lOOO I I ZGCO I I 2:1:0 I
'-------.1...J•-------~--~
I kutdi"" 2000 I I''"-',.,,.,., 1 , . I I · I I ·
I
6. PROGRESS OF WORK UPTIL APRIL 1990
,,,,..,,., 6.J. ,,-..: ....... 11 1990
111119rUO °" ! I •~1111 .. t : hvortOI .,..
• ...... , UflM.llUll- ! t , ....... a.II," i I_,,,,..-· I t j 11\ortUnUI' ll~lft
'" 11o9r. l: ice. 1 I '" """'· l: ICt, II I ] I I I '"NI'. l1 acc. c
110. of r1aoru: I ... 11 ''°""" ; I : i i ••·of,...,. ..
12 ~ JO I I
"'•U 11.au fOI" tr~"-t U
f-------~11·..,...---------~ i lrouure I Irk-• I I lrouur1 l lroc""'" I lroc-• I I I I I I I I I ''•JKI I I lln1.cc .t I I ~ .. °" l ..... 141 .. I llro1-c1 n I
I I I I I I II •
112000 !•ZOGG I !•ZDOO 112000 I • zooa ~-------11~·~-.-----~---~
J 1u1 ,,.,,.. zooa i ,,,,_.,.~,I
I l n.•l•l• [ •J...-lf'llG
I
During the period between the start of Building 2000 (officially 1.1.1988, but effectively since May 1988)· and April 1990 a wide range of Design Support activities has been carried out for almost all Building 2000 projects (only a few projects were delayed and, therefore, design support was not useful) .
All three indicated possibilities of design support in paragraph 3, namely: a. individual consultation between design team and selected European
. ·and/or national experts; · b. small case studies by recognised Design Support Units, experienced
with certain passive solar/daylighting design tools; c. detailed modelling studies for groups of similar Building 2000
projects; · have been exploited by the design teams. Moreover, several other activities were organised during the last period of 18 months •.
·-. J ,--:
At this ·moment, April 1990, the situation with respect to the preparation of the final products of Building 2000 as schematically shown in figure 5, can be summarized as presented in figure 6.1. In this figure an overview is presented of the number of reports already finalized and the number of draft texts for the various brochures received so far.
7. CONCLUSIONS
Building 2000 is a pilot project of the Commission's R&D-progranune 'Solar Energy Applications to Buildings', with the purpose of encouraging the adoption of solar architecture in large buildings currently in the planning stage. There was an enthousiastic response of project teams, responsible for the design of 35 large buildings with a total construction budget of more than 140 Million ECU, including schools, office buildings, hotels and holiday complexes, university buildings, public buildings and sport and educational centres.

:· ~-
The willingness to improve their building concepts by collaborating with R&D-experts was encouraging for the Commissions'' action in this field. It is to be expected that the design aids and simulation tools, daylighting concepts, comfort criteria, etc. under development in the Commission's R&Dprogramme can be tested on its practical value. Moreover the feed back from the design practitioners will allow the Commission to refocus emphasis in the R&D- programme on more practical and possibly less theoretical problems and approaches. It can also be expected that alternative design aids currently being developed in other European groups shall become better known. This will result in better exchange of information between the actual design practitioners and the European R&D-community. A coherent information set (series of brochures) of the participating Building 2000 projects will be prepared and widely distributed in order to ensure the realisation of more and better passive solar buildings in the future. Within Building 2000 "Science and Technology at the Service of Architecture" became real practice. This was not only realised by the various support activities initiated by Building 2000, but also by the active exchange of ideas by architects and design team members with R&Dworkers during the four workshops held between May 1988 and September 1989.
References: . (1) Steemers, T.C. Solar Energy Applications to Buildings and Solar
Radiation Data. Proceedings of the EC Contractors' Meeting, 13 and 14 November 1986. Published by D. Reidel Publishing Company for the CEC.
(2) Turrent, D. Godoy, R. and Ferraro, R. 'Performance Monitoring of .: · Solar Heating Systems in Dwellings' Dec. 1981 ECD Landen
(3) Turrent, D. 'Project Monitor: Aims and Objectives I Proceedings of the 1987 European Conference on Architecture, p.483-486 edited by W. Palz, CEC and Published by H.S. Stephens & Associates
(4) Lewis, J. Owen 'SPREADING THE CREED OF ENERGY EFFICIENCY IN EUROPE' Proceedings of the 1987 European Conferences on Architecture, , p.622-626, edited by w. Palz, CEC and Published by H.S. Stephens
'"'-·-: - . & Associates. · '·~ (5) den Ouden, c. "Building 2000, Newsletter", published by EGM _ . :
engineering bv, Dordrecht, The Netherlands. :(6) ... den OUden, c·. "Building 2000, proceedings of the Euroforum New_
·. ". :r:. Energies", an international congress held in Saarbrucken, . . -. ::. - : . F.R. Germany 1988, vol. 1, pp.143-146, published by H.S. Stephens
& Associates. ,:. .
::s ... .. :: ~
J..: _. -~ :-... . ~
.;::z -: -- .
.,,. .. -. .: ,,, -
!
I
. ...
.··· ·
.. =·; ! .
A SIMPLIFIED CALCULATION METHOD OF SEASONAL AIR-CONDITIONING REQUIREMENTS FOR RESIDENTIAL BUil.DINGS
ABSTRACT
A.Ozaki*, T.Watanabe **, T.Sugai* * Department of Architecture, Fukuoka University
8-19-1 Nanakuma, Jyonan-ku, Fukuoka-sh! 814-01, Japan ** Department of Architecture, Kyushu University
6-10-1 Hakozaki, Higashl-ku, Fukuoka-shi 812, Japan
III 14
The international standard has been announced by ISO in connection with a simplified calculation method of space heating requirements for residential buildings. The ISO method has some problems to be improved, for example, the negligence of basic factors is one of them. Then the new calculation method was proposed, which is different from the ISO method in taking effects of nocturnal radiation and of solar radiation at opaque member. In this paper, the space heating requirements obtained by an exact simulation method and those by the ISO and · new methods were compared. In addition to the comparison of heating requirements, the advisability for the application of the ISO and new methods to the calculation of space cooling requirements were discussed. The result showed that errors of the new method were smaller than those of the ISO method. ·
1. INTRODUCTION A large number of calculating methods have already been proposed
regarding space heating and cooling requirements of residential buildings to forecast energy consumption, to decide energy consumption rationalization as a criterion, and to forecast and evaluate energy saving techniques. The International Organization for Standardization (ISO) has announced the space heating requirement calculation standard (referred to as the ISO method in the following) of residential buildings, and Japan is required to study it.
The ISO method has several problems, namely, accuracy of mean internal temperature calculating formula, a method to decide the active thermal capacity and advisability of applying it to cooling requirement calculations. This paper studies these points and describes the calculation accuracy of using the ISO method in Japan whose climatic conditions, residential building specifications and living customs, etc. differ, and discusses several improvements to be made.
2. ISO METHOD Fig. 1 shows the calculation flow of the ISO method.
2.1 Basic Formula for Space Beating Requirement calculation The monthly cumulative heating requirement Q 1>. mOf residential buildings
for each m month is calculated using the following steady formula. µ,,.{<I>a.m+<I>,,m) ()
Q1>.m=24·H:l: {(Or ... -80.d)- H .l 1
where H is the specific heat loss. The daily mean value ls used for the outside air temperature Bo, whereas monthly mean values are used for the other parameters. L ( } pos means Jlntegration of only positive definite values in a day unit for each month. ·
2.2 The Utilization Factor The utilization factor is the proportion contributing to the reduction of
heating requirement of total heat gains <I> g(=<I>s+<I> ,)and non-steady effects to
RANK XEROX COMMUN/CATIE SERVICE

heat gain calculations are taken into consideration. Using the utilization factorµ. , heat requirement q h can be expressed ·by the following formula.
Qh=<I>1-µ.<I>g (2) where <I> 1 is the heat loss for the entire buildings. The utilization factor can be expressed approximately by Eq.(3).
µ. ~ 1 - exp (-<I> 1/<l>g) (3) 2.3 Mean Internal Temperature
The monthly mean internal temperature 8 r. m used in Eq.(l) becomes the design internal temperature 8 set in all-day air conditioning. In intermittent air conditioning, however, it will become a value lower than 8 " o" 8 r . m when heating is stopped during the night is estimated by the following procedures.
The monthly mean internal temperature 8 r. m can be calculated by convergence calculations using Eq.(3) and the following equations.
M .Um•<I>g 8 r, m= 8 set - {a 24 - /3 H ( () set_ () a, m)} ( 8 •• t - 8 o, m) (4)
a=~ {O. 8764-0.1053~ + ~ (7. 697x10- 5 ~ -1.102 x 10⁻²) I (5)
H H .B=v<0.414-o.o94v) (6}
where M ls the period during which heating ls stopped and is 6 < M < 14 (hours). The active thermal capacity C ls the thermal capacity of walls contributing to heat storage and can be calculated using the effective thickness d 1 , of each material i used in walls and Eq.(7).
C = ~ c 1 p 1 d 1 A 1 (7) I
3. IMPROVEMENT OF ISO METHOD · The heat q 1 through opaque member i and the heat q j' through transparent
member j can be calculated using the following equations respectively. 8st . esi . (}
q i =Ki A I ( 8 r - 8 a __ a . J i +-a E I) • 8 t ' . t i .
. e s 1 • ( } qj'=KjA1(8r-8a+a.jE1)-111Ad 1 9
The heat requirement Q h of the entire building can be expressed by the following equation based on Eqs.(8) and (9), ventilation amount V and internal heat gains <I> t. ·.
Q = H { ( 8 . - 8 ) <I>.+ <I> t <I> SW- <I> ·1 ,, ·. · .. ·.
h r a H . . H ~ · .. · l' • · . ..
· .H, <I> s ~ - <I> sw and <I>. can be expressed by the following equations.·
· , u
H=I::K 1A 1+r:K;A1+0.29V " ' i J
<I>s ='I:111AJJ j j
· as 1
<I> sw= f K 1 A 1 a , 1 J 1 ·:·, : - e sj ea l .~..; <I>. -'I:KjA1--E;+I:K1A1--E 1
J a,1 1 . at,
.,
(10}
(11)
(12)
(13}
. (14)
Using the daily mean value for the outside air temperature e o and monthly mean values for the other -·parameters and by introducing the utilization factor p. m in Eq.(10), the heating requirement Q h. m in each month m can be expressed by Eq.(15). - - - . . -~
" Q =24HI:{(8 -() ) #m(<I> •. ,.+<I>, , .,) 1
<I>aw,m-<I>e.m} .... (15) -' I\, ., r, m a. d H • H P ~ • , ,
Thus, Eq.(15) can be considered as a calculating method improving the ISO method to take effects of nocturnal radiation and of solar radiation at ~paque member. : ·

r
I l
. '
r.
.;:: > ..
4. CALCULATION OF SPACE HEATING REQUIREMENT 4.1 Calculation Model
Fig. 2 and Table 1 present a calculation mqdel and the wall composition. The calculation model is a single room of a high-floor type with an opening facing southward. The wall composition consists of three types as follows; Type 1: non-adiabatic, Type 2: externally adiabatic, and Type 3: internally adiabatic.
4.2 Calculation Conditions 1) The calculation areas are Sapporo(43°03'N,141° 20'E), Tokyo(35°41 'N,
139°46'E) .and Fukuoka(33°35'N,130~23'E) in Japan. 2) The calculation periods are October to May for Sapporo and November to
April for Tokyo and Fukuoka. 3) The heating durations are 10 hours (6:00 to 16:00) and 18 hours (6:00
to 24:00). The design internal temperature is set at 22 °C constant. 4) The effective thickness of each member is only first layer from the
inside surface for the roofs and floors. Three effective thicknesses are considered for the walls; Case 1: first layer (finishing material) + second layer, Case 2: first layer + second layer + concrete 5cm and Case 3: first layer + second layer + concrete lOcm. Table 2 presents the specific heat loss of the room models for Types l to 3 and active thermal capacities of the room models for Cases 1 to 3.
5) The non-steady calculation program "PSSP" is used as the exact methoq to verify the ISO method 11
•
4.3 Accuracy of Basic Formula The utilization factor JJ. m of Eq.(3) is calculated using the monthly mean
internal temperature er. m calculated by the exact method ." Next, space heating requirements are calculated substituting the er ... and JJ. m in the basic formula (1) and improved formula (15) of the ISO method and compared with the results obtained by the exact method. Table 3 presents the space heating requirements by the exact, ISO and improved ISO methods. The errors by the ISO and improved ISO methods are approximately 16 and 17% maximum with Type 1 (non-adiabatic). The maximum errors are approximately ±5% for Type 2 and Type 3 (externally- and internally-adiabatic). The space heating requirement errors in accurately calculating mean internal temperature are approximately -5 to 16% and less than approximately 17% with the ISO and improved ISO methods. Compared with the ISO method, the error ranges of the improved ISO method are small and are positive definite errors. Even when an accurate mean internal temperature is used, the ISO method sometimes estimates the space heating requirement on the risk side, while the improved ISO method tends to estimate a slightly safe side. 4.4 Calculation Results
Table 4 and 5 present the calculation results of Case 1 to 3 by the ISO and improved ISO methods. In all the calculations, the space heating requirement increases in the order of Case l, 2 and 3. This can be expressed by the small · coefficient a in Eq.(5) as the active thermal capacity increases to increase the mean internal temperature by Eq.(4). Comparing the space heating requirement of Case 1 to 3 regarding the difference in heating duration, the differences are large in 10-bour air conditioning compared with 18-hour air conditioning with all the walls. This ls particularly prominent with the non-adiabatic model. In the mean internal temperature calculation formula (4), the proportion occupied by term aM/24 increases as the heating duration shortens, increasing effects of the active thermal· capacity on the mean internal temperature. For this reason, the variation of heating requirement increases by the difference in the active thermal capacity if the specific heat loss ls large.
Figs. 3 and 4 show the monthly mean internal temperatures and monthly -

•.·
••• 4
·, •:
integrated heating requirement in Tokyo by the exact and ISO methods for the Type 2 (externally-adiabatic) model. Comparing the space heating requirements of Cases 1 to 3 in accordance Wlth the difference in heating duration, the errors with the exact method are small in Cases 3 and 2 for 10- and 18-hour air conditioning respectively. The errors ln January when the monthly integrated heating requirement becomes maximum are approximately 3% in both cases. The active thermal capacity in the mean in tern al temperature calculation formula (4) has to be estimated in a large value if the heating duration is set short.
Figs. 5 and 6 show the monthly mean internal temperature and monthly integrated heating requirement by the exact, ISO and improved ISO methods for Type 3 (internally adiabatic) with Case 1 in Tokyo. In 18-hour air conditioning, the monthly mean internal temperatures by the ISO and improved ISO methods are nearly the same as those by the exact method. Nevertheless, the errors of monthly integrated heating requirement with the exact method are -7 to 15% for the ISO method and 1 to 13% for the improved ISO method, indicating that the improved ISO method calculates more accurately. In 10-hour air conditioning, the monthly mean internal temperatures by the ISO and improved ISO methods are 1 to 2 ·c lower than that by the exact method. The errors of monthly integrated heating requirement with the exact method are approximately -27 and -17% maximum. In both cases, the errors are larger than those in 18-hour air conditioning. However, the improved ISO method has smaller error variation compared with that of the ISO method. The monthly mean internal temperature by Eq.(4) tends to be estlmated low with a model that has a small active thermal capacity as in internally adiabatic if the heating duration is short. The monthly integrated heating requirement is estimated on the risk side.
5. CALCULATION OF SPACE COOLING REQUIREMENT The ISO method ls intended for calculations of space heating
requirements. Whether or not the ISO and 'improved ISO methods can be applied to space cooling requirement calculations is studied below.
5.1 Calculation Conditions 1) The cooling perlods are May to October. The cooling durations are 10
hours (8:00 to 18:00), 15 hours (8:00 to 23:00) and 24 hours. 2) The design internal temperature of 26 ·c ls used as internal temperature
in the space cooling requirement calculations by the ISO and improved ISO methods. ·
5.2 Calculation Results _ Table 6 presents the space coollng requirements by the· exact, ISO and
Improved ISO methods. The space cooling requirement by the improved ISO method is approximately 22% larger than that by the ISO method. This difference may be attributed to nocturnal radiation and insolatlon of opaque members because the design internal temperature ls used as the internal temperature 8 r• Setting the internal temperature 8 r at 8 SU means cooling 24 hours a day. Comparing 24-hour cooling by the exact method and them, the errors by the improved ISO method are approximately -3 and -12% with the externally- and internally-adiabatic models. The errors by the ISO method are approximately -20 and -28% with them. If the ISO method ls· applied to calculations of space cooling requirements, thermal requirements are estimated greatly on the risk side.
6. CONCLUSION This paper has outlined the calculation method of space heating
requirement for residential buildings by the ISO and has proposed the I.
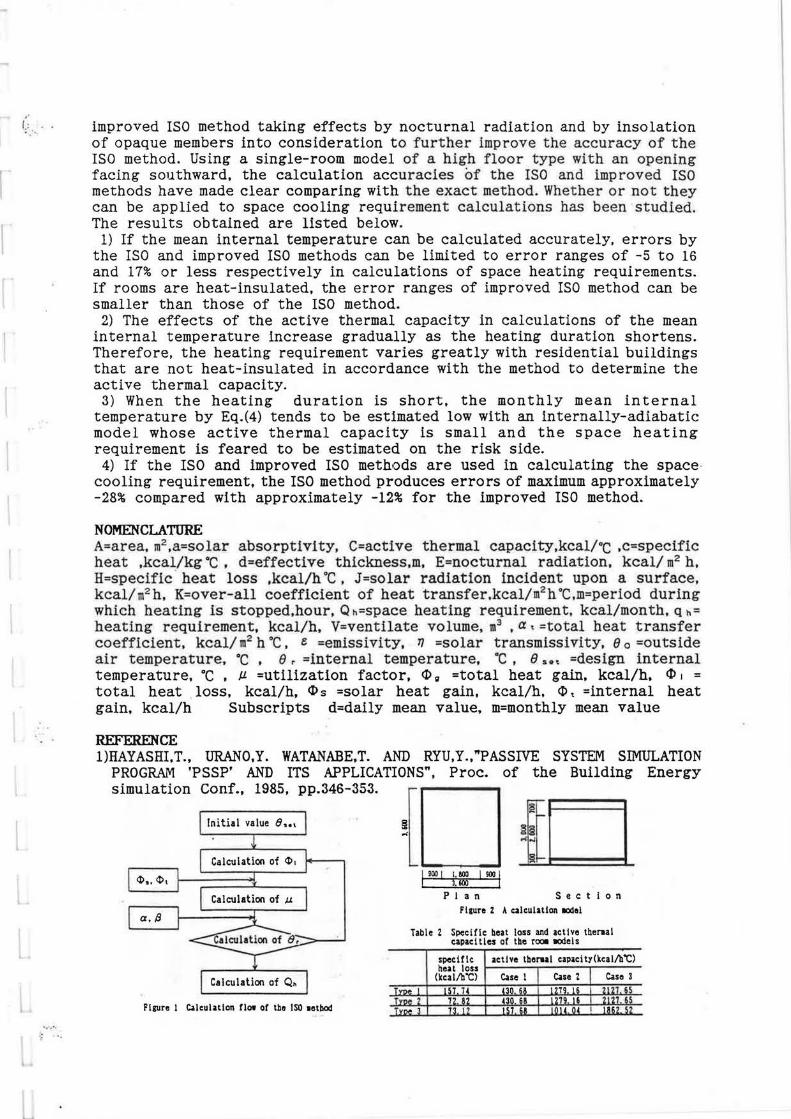
" f,:._: · · improved ISO method taking effects by nocturnal radiation and by insolation · of opaque members into consideration to further improve the accuracy of the
ISO method. Using a single-room model of a h igh floor type with an opening facing southward, the calculation accuracies of t he ISO and improved ISO methods have made clear comparing with the exact method. Whether or not they can be applied to space cooling requirement calculations has been studied. The results obtained are listed below.
1) If the mean internal temperature can be calculated accurately, errors by the ISO and improved ISO methods can be limited to error ranges of -5 to 16 and 17% or less respectively in calculations of space heating requirements. If rooms are heat-insulated, the error ranges of improved ISO method can be smaller than those of the ISO method.
2) The effects of the active thermal capacity in calculations of the mean internal temperature increase gradually as the heating duration shortens. Therefore, the heating requirement varies greatly with residential buildings that are not heat-insulated in accordance with the method to determine the active thermal capacity.
3) When the heating duration is short, the monthly mean internal temperature by Eq.(4) tends to be estimated low with an internally-adiabatic model whose active thermal capacity is small and the space heating requirement is feared to be estimated on the risk side.
4) If the ISO and improved ISO methods are used in calculating the spacecooling requirement, the ISO method produces errors of maximum approximately -28% compared with approximately -12% for the improved ISO method.
NOMENCLATURE A=area, m2 ,a=solar absorptivity, C=active thermal capacity,kcal/ 0c ,c=specific heat ,kcal/kg °C , d=effective thickness,m, E=nocturnal radiation, kcal/ m2 h, H=specific · heat loss ,kcal/h ·c . J=solar radiation incident upon a surface, kcal/m2 h, K=over-all coefficient of heat transfer,kcal/m2 h ·c.m=period during which heating is stopped.hour, Q h=space heating requirement, kcal/month, q h= heating requirement, kcal/h, V=ventilate volume, m3
• a• =total heat transfer coefficient, kcal/m2 h °C. e =emissivity, TJ =solar transmissivity, 8 o =outside air temperature. ·c . 8 r =internal temperature. °C ' 8 set =design internal temperature, °C • µ. =utilization factor, t1>" =total heat gain, kcal/h, t1> 1 = total heat . loss, kcal/h, tl>s =solar heat gain, kcal/h, <I>, =internal heat gain, kcal/h Subscripts d=daily mean value, m=monthly mean value
REFERENCE l)HAYASHI.T., URANO,Y. WATANABE,T. AND RYU,Y.,"PASSIVE SYSTEM SIMULATION
PROGRAM 'PSSP' AND ITS APPLICATIONS", Proc. of the Building Energy simulation Conf., 1985, pp.346-353.
Initial value e •• ,
Calculation of <l>,
<l>.,<l>,
Calculation of µ.
a. I'
Calculation of Cl.
Figure 1 Calculation flow of the ISO method
{0 I 900 I I. BOO I 900 I
l.600 PI an
~~ "~L
Section
Flgun Z A alculallon IOdel
Table 2 Specific beat loss and active tbernt capacities at tbe rooa llOdels
specific active tber-al capacity(kcal/b"C) neat loss
(kcal/b"C) Case I Case t Case 3

. ; ·
... • •• i
Table 3 Accurac:r of basic fol'llula
10-hour air condltlonln1 18-hour air condlt ion Ing
T:rpe l T:rpe Z T:rpe 3 Type l Type 2 Type 3 Exat 1101. 0 U 06. l 33 6 9 ll~R7 . 0 m 3 5293 2
Sapporo ISO ... 7 7 U l7 9 .. I 7 5. m ft s3ss 1
~Droved ISO SW. 7 (487 5 3 I . ' 8 sz 0 s 25 0 ;xa t 3RSQ q " 9 1 '' 0 ' ,,
Tokyo ISO 4188 l l 939 6 3 7 SU 9 ' 53 mn.nvod ISO H03 2 I 2055. I 1 5 6&5 2 l 13 ont 3603 S I 1875. 9 1 s· 1 3 466 5 U7
Fukuoka ISO HM s I ins. 2 I 1 • 599! 2 ms 3 1 ~ I 9 I mo r ovl?d I SO 4209. 1 I I 963. I 1:70. 3 6015. 9 7\? fl 6 ; 355 7
unit : Meal/per iod Table 4 Space heating requirements b:r the ISO method
Table l Wall co.1>0si ti on
-· hll ec.o.ilicn lldcllal I ~ilim •Uri1l1 (a) Ooc.ol1"'h'C)
ru a. <l> @ <D lbrur 0.015
\ ~~ C%11io ... 1 0.150
rut · , ~ in c:aicrel.c 13> lbrur 0.015 l.IJZ . ,. ,..., © Plultr O. OOJ
Sapporo I ~m ! I ~ ~:!· ! I !!~~ - ' I !!! .. ~ I m0~· ! ! :~~: · ~ I ?m· ~
Tokyo Type 1
<D lbrur 0.015 (j) C2>C2>®0Zi <2i lnsul1tl<>1 0.050
OJl~ll• 11teri1I Wal 1 13> No ... 1 0.150 o.m
concrete
Fukuoka I ...,d;:ic ! I~~~~- ~ I itoct . ~ I H:! ·u I jH'lu . v ! f :)8~ · ~ I fi !2· '
© lbrt.r 0.015 Type 2 <l>Plutu 0.DDJ
Table S Space heating requ irements by the improved ISO 1etbod <D lort.r 0.015
Q) C2> 13>© <21-1 0.150 OJ\U in ccnc:rtll 13> lnsul1U<>1 Q.050 0. 7l4
uterial © Plullr 0.003
Type 3
10-bour ajr conditioning 18-hour air condi t lonlnc
Type l I Type 2 I T:rpe 3 I Type 1 I Type Z I T:rpe 3 0 ··• Olli. o 1 uos. 1 I ma. 9 I 113a1. o J m1. f :Ls2u 2
s 76. 6 530 Sapporo 5789. 6 56 3 5
m--2!!__ Q) lo.Ur Q.035 <2i lnsul1U111 Q.050
:'.L2 11tarill a.'1JO Roof 13> HorMI 0.117
® ccnc:rtll «1>=;::m= ©Air_.
<l>Ph....i Q.001
6148 . 3 s in~
~xa t I mu l Z03U Lmu I mo.T I m u I 2ff1 Tokyo
3603. 8 I 1315. 9 I lto7 . • I mu I t466. s I 22&1 o ••
case 1 I 3326. 9 I 1301 . 2 I 131C018213. 6 I Z56L 3 I zs7L Case Z I m 4. S I la!Z.9 I l&Sl. ? I SGH. 3 I ?8 11. 1 I 2735 ~ .. A 3 I mu I mo.o I mu I 716!.0 I mu 1 2m
<D In Q) Pl,_.j II.DIS <21Alr•-=:ammmm: <21-l Q.110
Floo r i~ cone rt lo II.HI © lnsul1tlm Q.050 «1>--- 11llri1I "'l
Fukuoka ~!liX+H~..;-1-+~+~~4-~~'-'!-~~+-H;~+
Table 6 Space cooling requirements un i 1 : Ilea I/ period
<I> lort.r Q.015
<D Tokyo Op en-
II (j)T...,._t Q.003 S.571
Fukuoka I !m f I ~~~- u ! ~~~ · ~ I ~H· J I '.~H I gu
ZS l 5 lnl&m.1' tuoer1wrt • Cuc. IL l'MUlli rt<•.d ,...., l I tucl ;
O C- 1 DC.Ue l :;; .c. c....z mc.... 15 ;,i.
e2o~ ~-~19 C..l s ~ '-....,.,~~ .:: ~
~IS ~ .. Q,
~10 ...
" " ' . ~ 2 -; ...
" I._
5t 1 EWI I CS!! QA 1 rm I Em 11e1 10 : 1 I 1 2 I 2 3 I (llOn th) ~
Fl111re 3 Monthly aean internal temperatures and eonthl:r ,:: integrated heatin& requireoients for T:rpe Z lodel
25
bo I ~ " ~ 15
" Q, . u 10 ...
5
in Tokyo (10-bour air condi tioninil 2
lotu .. 1 l-""'" • b.Kl 0 C...• l A C.- l X C- J l l - II ~~
•~blclt olr u.tnlurt
Jim IV
"'-.. /
........ '
/
II 12
, Jllol!Jlr .... 1.-1
I luct atue 1 me... r 19CIM l
n :
6. ,ll.
s ~ ~. . -" " l E " er
" I ._ .. 0-=
• (110nlh) -;; Fl111re 4 llonthl1 aoan Internal t-ratures and aontbly
Integrated hoatlnc requirments for TYJ>O Z lode! In Tokyo (IS-hour air condl lion incl
" "'
Ins r1 ...
..
25 lnllm1 \aD'trtl.tlrc tut i l'll nw1rtw'll 1 'i
~~l ~ ~· 6 ~ µ20 .. ;;1s
= " :10
"
.C.~1-e<llSO mt-131 "'.:. S:
~ol~=~- ~· ,.•: ·~ -:... ... 1: .. 1!: " .,.
I"
5t I W I K€l J§! I W I Iii I W ·10 ;
11 12 1 2 3 1 (aonlb) = ....
Figure S llonthly aean Internal tmpentures and aontbl:r ;-integrated boat inc requirmenu for T:rpe 3 model.., wl th Cue l in Tokyo (10-bollr air condl tlonind 2
25
I p20
" EIS = " :10 ....
5
101111111 i-nwro • !Mct 0 llilA I-~
--- -~ ~talde ain-nbl~
""" ~·
I I"-.. I/~
--~
Ii ,, s• ,ll.
11uu .. ""'1.-1.1· 5 ~ ~ I luc\
~ -
D ISi m 1.- isa
,,A - •-v~ m
·-"'· " 3 ! 1 'i: .,. " I._ ..
o!: 1 I 12 I 2 l \(moo lb) :
Fi111re 6 Monthly aean Internal tmpentures and llOlltbly ,:l inte&rated hoatinc requir-IS for T1Pll 3 model with Case l in Tokyo US-hour air coadl llonin&)

::·:·· .. ·:·.·
I
( .
ENERGY CONSERVATION IN AIR-CONDITIONING SYSTEMS
THEORETICAL AND EXPERIMENTAL APPROACHES
R.A. Peixoto, M.A.S. de Paiva, C.C. Chin J.F.P. Cespedes, S.R.R. Vertiola
Institute de Pesquisas Tecnologicas CEP 05508, Cx.Post.al 7141 - Sao Paulo - Brazil
1. ABSTRACT
Energy conservation in building HVAC systems has received significant. at.tent.ion in recent. years due to t.he increasing need of' energy saving. A methodology for energy analysis has been developed and applied in an existing building. In order t.o test. some energy conservation measures and to obtain t.he necessary data, the performance of the HVAC system was analysed during four months. A continuous dat.a acquisition of' pressure, temperature, flow and power expenditure was implemented. A mathematical model for HVAC system simulation and energy analysis was developed. The results of the measured performance dat.a and the simulation program allowed the computation of the attainable energy and cost. savings that could be obtained.
2. INTRODUCTION
Telecommunications Company of Sao Paulo CTELESP) presents a tot.al energy consumption of 18 GW:h/mont.h that. costs US$ 1 million/month. The HVAC systems are installed in 'its 148 telephonic buildings. This paper presents a research work developed aj ming energy savings in these systems. The main features of' ·'the work are descr·ibed next.; ·The whole analysis has been referred . t.o . a st.andard "'operational . conch ti 'ori mat.hemat.ically simulated for a period of' o~e year.
: ~ . . . . . . ~ ' . . ~ ..
.....
3. MEASUREMENTS . ,. ' .... . . .
The performa"nce of' t.he · HVAC system of a t.ypical t.en-:fl oor
III 15
t.elephonic building was observed during four months. A tot.al 140 variables were moni t.or ed. In t.hi s case, t.he HVAC is a liquid chilled system consist.ing of three reciprocating wat.er chillers' Cone st.and-by) · wit.h wat.er cooled · condensers· and 1, 050 kW ·or tot.al capaci°t.y; t.wo f'an-coils :by f'loor served by ·· · a two-pipe • ·wat.er-dist.ribut.ion syst.em · for cooling and ·1
dehumidifying; !'our pumps of chilled wat.er; !'our pumps !'or .· condenser cooling wat.er and t.hree cooling towers. · ~ · · · The subsyst.ems monitored were: t.wo chillers, " !'an-coils and spaces of' t.hree typical · f'loors and the cooling t.owers. In order t.o collect. more in:format.ions of' .t.he syst.em
: \ :..'. ; f .. ~· . . t ~ •
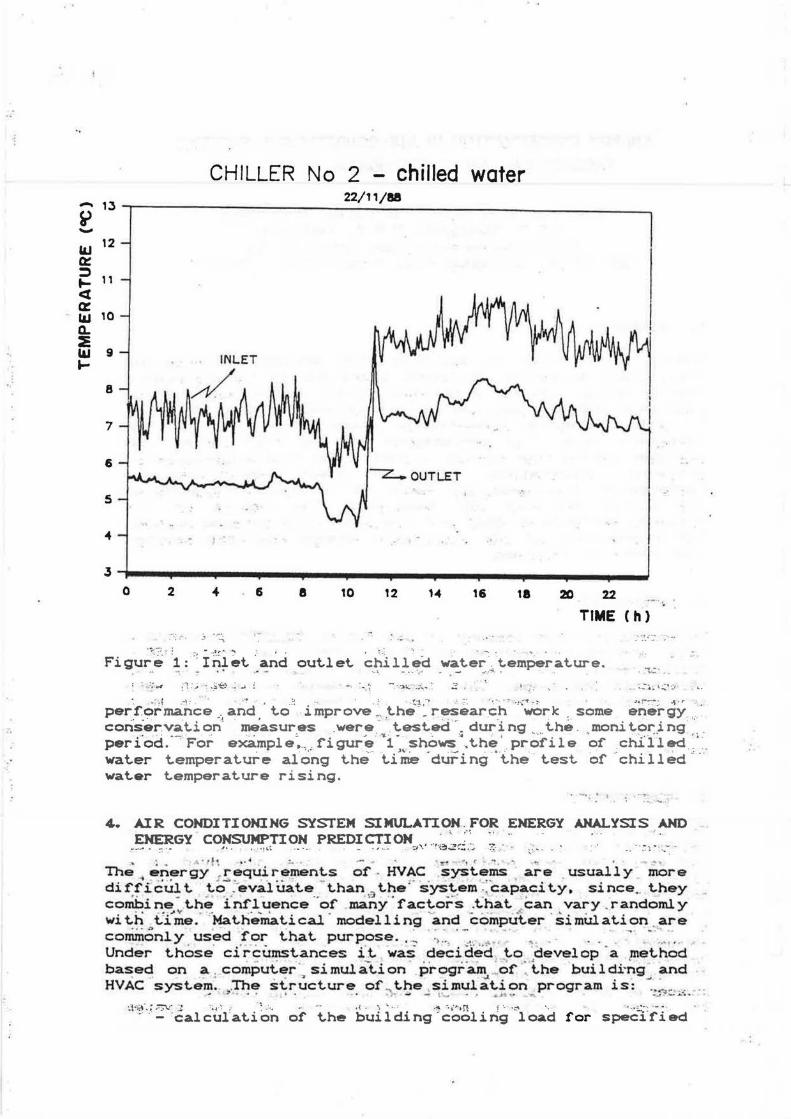
CHILLER No 2 - chilled water - 13
22/11/88
Sr> -l&J 12 ~ ~ .... 11 ct C% l&J 10 a.. ~ l&J .... 9
8
7
6
s
.. J
0 2 .. . 6 8 10 12 1 .. 16 18 20 22 .... .. '<!
TIME Ch) . ·; ~,._' :-, ---~ _' '.' .... .._~ ..
Figu;~ ;1: ': :i -~i~t. : a~ci out.let. ~hilled wat.er .. t.emperat.ure. .. -. - . . .... - ·-;. - ... ... . . - _.,..~ . .. . ~-= ~ .. _=:,,,.1 {t-> : .. _;;e .; ~ ! ..;.~ . ~ - ~ --,,-.:, ~;;, .. .. ··-- . .. _ · ~ \~· ·:1
. - ~i :1 - :.~ . -I .?-! .. . . ~ . . - !.'.1;·~ ., .. ... ·::~ -~ ., .. ,..:-... • . .,.... .
performance_. and t.o improve-· t.he · _research work . some energy -cons"er.vat.i onl me'asur_es .were_·' t.est.ed- .. during .... t.he. ,moni t.or:.i ng ". peri°od."...., For example:_" figure~i- _shows".t.he ' profile of clulled :·
• • . I .•.• ' '"' - .·- . ·" · • • • ,_
water t.emperat.ure along t.he t.ime during t.he t.est. of chilled wat.er t.emperat.ure rising.
• • ~1 -.., a ' I ~ • • .,...
4.. AIR CONDITIONING SYSTEM SIMUL.AilON. FOR ENERGY ANALYSIS AND ENERGY CONSUMPTION PREDICTION . .. :·' ,. " .
.. __.. =-- .. .I• • . ... !,\. .. • .. . - - .. ··- ~'\' •'!~~~::.: .. ~.:.. -~- : . . • ,.-' ... '\•t f • •• • :... - .. _ _.. ...... t .. .. ... .
The .,. energy ~ require.~nt.s of - HVAC syst.ems are . usually more di t:~ i cu~ t.. }~"".:~eval ua t.e .. - t.han '~ t.~e .. s'ys_~_em ·~cap~ci t. y. si nee_ t.hey combine .t.he influence of .many fact.ors .t.hat. ,can vary . randomly
• • - .,. ~ "" •. • •• ... • • - ·- • -- ..,.-s. • " .. wi t.h t..i me. Ma t.hema t.i cal modelling and com put.er si mul at.ion . are
••• ..:> · - - • .. • • • - · .. • • •• - - ·-"' ·~
commonly . us~d .fr::r_ that. purp.ose .. :- '> ··· :!'- .. ~- ... _ • • _ .... ..
Under t.hose cir cumst.ances i :t. was decided, _t.o .develop a .met.hod based on a . comput:er ' simula-t.ion .. progr'a.in ~of :."t..he building and
• • • ~ ..I. • .,,,
HVAC syst.em ... .. The st.ruct.ure of ..,. t.})e ,simulat.i on program is: ·~.-:.- ... · _ .. .. ,_.. .. . . . . ~ ... ,,. - - t.·- . . _ _,.,. , .. . -. . .... ':!' ......... .... ~1;";t-\ ·~:.0"\.··] --~,- ~ .. ·: ..... .. ··- .i. :. ..... : ~ -.ll';•n ~··.· ·::" . ··-.-:::--··-· -
. - ·calculation of t.he building -cooling load for speci.!'ied

r-·
I l
operational and climatic conditions; - simulation of t.he system steady-state performance;
this consists of two kinds of simultaneous equations: the module equations (mathematical models of t.he equipments and subsystems) and the interconnecting equations;
- calculation of the energy requirements of each individual equipment and the tot.al energy requirement of the system;
- computation of t.he HVAC system energy requirement during the period of one year, considering the frequency of operational variations.
The results of the program were compared to the experiment.al data obtained [3J. Excellent agreement between them was observed.
5. ANALYSIS OF ENERGY CONSERVATION MEASURES
The main measures analysed follow.
5.1. Ventilation Reduction And Enthalpy Control
Venti i ati on is the outdoor air which .is intentionally introduced int.a the building. When ventilat.io.n is great.er than the recommended values there is an energy loss. On t.he ct.her hand, there are some periods where t.he enthalpy of t.he out.door air is smaller t.han t.he return air and in t.his sit.uat.ion the vent.ilat.ion flow must. be maximized. Using the experiment.al data. the simulation program and t.he' climatic data for Sao Paulo cit.y, t.he est.imat.ed energy saving whit.h this measure was 10.5 ~.
~1' ,_:::··; :": .
5. 2: Opt.iini.zat.ion · Of' The Use Of' Chilled ·wat.er And Condenser ···,: Cooling Wat.er Puinps · ... · ··· -· · · · ... ·
[:::·:.:· 'c·
Th~ two-pi.pe wat.er-dist.ribut.ion s)'st.em wit.h t.hree.;,.way valves is charaC't.erized by constant. wat.er flow. even during t.he periods where t.he cooling l cad is small . This ' const.i tut.es an inefficiency of' t.he system·. The control of ' t.he wat.er f'low based on t.he . act.ual cooling load can reduce signif'icant.ly t.he pumping power. In t.he HVAC system monitored 30 Y. of' t.he t.ot.al energy consumption is spent. for wat.er pumping. The est.imat.ed energy saving due t.o ·t.hat. cont.rel could reach 14~ 5 Y. of'· t.he t.ot.al energy consumpti°on. · · · ' · ·- --~.,, . ,.~, · -.:· - '.~ ~: :-.:· This value was obt.ai ned using t.he same procedures described in sect.ion 5.1. The simulat.ion of' t.he system considered t.he fan-coil capacities . This analysis determined a relat.ionship bet.ween cooling load and water f'low as shown in figure "2.. The curve shows t.he minimum water flow t.hat. does not. cause damage t.o t.he operat.ion of t..he fan-coils. Based on t.he curve of' figure 2 it. is possible t.o inst.all a water pump cont.rel.

:_-~
. -:
,;'.
.·.:
-; 10 r-----------------------' G ~ - 60 :!: 0 ~ 50
a:: · ~ 40
:!: Q 30 &&a ..J ..J ~ 20 (J
10
o-+-----r--.,---,.-~-r--r-.,.----,-...,--,--...,..-"T"".....,-~ 160 200 240 280 320 360 400 440
COOLING LOAD (KW)
Figure • 2: Minimum chilled wat.er :flow versus t.ot.al building cooling load.
··.-· ; :.:, .
5. 3.· .: Opt.imizat.ion"'or The Chilled Wat.er Temperat..Ur-e Set.-Point . . -· · -·· •\-.. . ... ,,.
The ;~~r ~Y c~~s~pt:Co~ oi- ·'t.he chi i l er depends o~ t.he chi 11 ed wat.er t.emperat.ure set.-point. for a given cooling' load.--'When ·· t.his t.emperat.ure increases. t.he coefficient. of per:formance of t.he~..;..,.chiller,,; .• _also .• .:;;ncr.eases . ~nd_ . ,t.he - energy consumption reduces. The ·normal. value of set.-point. used in ' t.he analysed .. syst.em is 7 °C. · ... · · · " · · · · . . ~. -- ·~ . The_ limit.at.ion . t.o t.emperat.ure increasing is t.he _reduct.ion in __ t.he : _fan-coil capaci t.ies : · The . relat.ionship bel'Ween ~c.hflled · wat.er . t.emperat._µre : and fan:-coil capaci t.y was ,det.ermined_" for each :floor . ... Figure 3 shows . t.he seventh floor curve~ .. _ ...... Wit.h_ t.his information •. and ·a siini.lar anal-ysis used in 'sect.ion 5. 2. ·. _it. ~was possible t.o det.ern\ine an annual .chilled · wat.er · t.emperat.~re pro:file which.~causes)'lo problems t.o· t.he operat.ion o:f ~rt.he .:.!'an-!=oils. •That.. t.emperat.ure profile i's·. presen~ed in t.able 1.· The est.imat.ed energy. saving due t.o. t.his measure was
- . _ _ ,._ - - ·~ ., . -:~ .:;:,. : • ~ , ~ · ; ·.· # ......
1 . 5 Ye. - . . ~ ,_ . . .. .... "·- ... .....
-·~·.'" ~ .,_ ~.t\_.i ::.; _.., .~.:.: .. - ..... - - . .. r... .·-.... . ~ . ' ---- ' . . ·.-.. -- -- - ... •"--..I .. ... - ... ..... - · . . · ,;: :. -.:. .. ·· ..: ; .1 .... •• : . . -
·:- ' .-:: n :. , _;: -: I , ..; g - · . ;. . -. '"'°" - ; ~ ., ·._: :_~ ,. _;. • •
" ... . -- .J • : ' : ;,_ :..: ..... ~.: , .
,; .,; ....Lii·;;. _.,;,.:: ·~ :.:.; L: Jii .:..; ~ .,; ;.' :. ; ':)C . .., '..;.t, • • ; , ~~ •• 1,! ... :H2 t<~ .... : .... ·~ : t .~~ ""!"i
··-i . ) ~ ... -·-· .. ! .... ~ -~ .;, : .- .. ..... . , . '> '_,_ ,_, ~ .. /.
. .. '. ; : -~ ~ ·· ~ ..
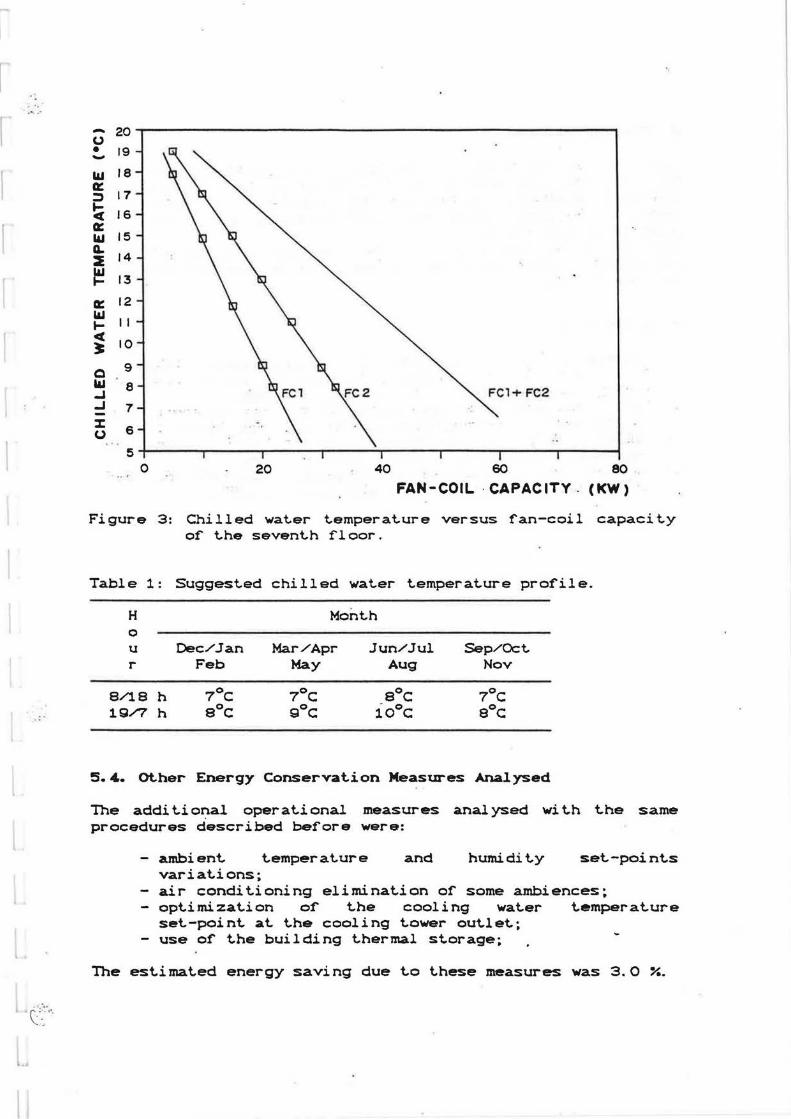
l I I
c::"··
- 20 CJ • 19 -II.I 18 a: :::> 17
~ 16 a: II.I 15 Q. ~ 14
~ 13
a: 12 II.I ~ 11 ct ~ 10
Q 9
II.I 8 ..J ..J 7 -%: CJ 6
... 5
0 20 40 60 80
FAN-COIL ·CAPACITY. (KW)
Figure 3: Chilled water temperat.ure versus fan-coil capacit.y of t.he sevent.h floor.
Table 1: Suggest.ad chilled wat.er t.emperat.ure profile.
H Mont.h 0
u Dec/Jan Mar/Apr Jun/Jul Sep/Oct. r Feb May Aug Nov
8/18 h 7°C 7°C s0 c 7°C 1Gl/7 h s 0 c 9°C :1o0 c 8°C
5.4. Ot.her Energy Conservation Measures Analysed
The addit.ional operat.ional measures analysed wit.h t.he same procedures described before were:
- ambient t.emperat.ure and humidit.y set.-point.s variat.ions;
- air condit.ioning eliminat.ion of some ambiences; - opt.imizat,ion of t.he cooling wat.er t.emperat.ure
set.-point. at. t.he cooling t.ower out.let; - use of t.he building t.hermal st.orage;
The est.imat.ed energy saving due t.o t.hese measures was 3.0 ~-

. :~.
·=
· ·:: .
• •!,
i.,! '
5. CONCLUSION
Each one of t.he measures described in t.hi s paper has been det.ailed !'or implement.at.ion. TELES? is going t.o choose a building. probably t.he one that. was monit.ored, t.o apply t.he measures analysed. Aft.er that., this building will be used as a demonst.rat.ion case. The est.imat.ed pot.ent.ial of' t.ot.al energy savings in all t.elephonic cent.er buildings is nearly 30 %. corresponding t.o USS 100,000/mont.h.
7. REFERENCES
Cl) C2::>
C3)
(4.)
C5)
ASHRAE Handbook - Fundament.als. At.lant.a, ASHRAE. 1985. PITA, E.G. Air condit.ioning principles and syst.ems: an energy approach. - New York, John Wiley. 1981. IPT. Avaliacao e racionalizacao do consume de energia em edificios-sede de cent.rais t.elef'onicas. Sao Paulo. 1989. KNEBEL, D. E. Simplified energy analysis using t.he modi!'ied bin · met.hod. At.lant.a, ASHRAE. · 1983. -· · Carrier Air Condi t.ioning Company. Handbook of air condit.ioning syst.em design. McGraw-Hill. 1965.
,:-· . ~ .. '
;~
..:
"..,'i 11:.- ...
I ;·· · ' ... ... .... . , .. .
., '.
-·~ .-
..• M4.;.~~· '1. -:?, ' •
---.. ·- ·--·--- --------.....: - . - - ..:.:._ ,_ .... _ . _ •• :....-..! --::..:... :......=.-· --=--- - ·-- -- ·----. - -
...! ' -1 , . .: .
L •• ~
- J • .. ~ ..;-_, ' =-~ -1
---·--.:...·.-.:---==---;_':,;._... .... ---·-· _______ :.:. ~-----·- ..
::;-..:-~ • ::·;· - <;..:, : ; • -~-; .:...~>~ ·~···'!" -.~ · .. , "\i. .-,·~ ...
.: .. -. , .. . ·;tii:-._ ..... '::'1L : ~· _ ... 1G_'" • ... ,, ,',). ~- ·- .. · ·-~ : .. -,
'. ,.\ •• I ·= ·_. •., ~::._c: • •• ~ :{~• ~,,~·, I , .
~./(~ .z..cc - ... ;r;; _:.! I _ "1~1!:..F~ :>-.;; ~r::r··:~ .. =-~; .:.' . · ·'=:-• __
:· ·~· - : :;.•..:->..~ ·;;' •
: ~?'!..:_··.:.: - jl ..:. ._ .. _.,: - "'.:J•"f: : -: i: . · .. ·-· ~ 1 .-... . :.:: :u.-:-~· • .~ ,!,
9 .,;~; ~::;, _.,~_;".}'"i"~-; : . ~. .J.-- .... . ~ *I - • • _;: !.r!" : - !!
~ ., _; .. :.~~·::. -::.:~ " ~ _J ~t."' __ :. .• .;, .~:" - · =>~- .. . .. ~?it: .. ... •:. :i.i\1 -:·. ·:.'~· .. ~· .. _ ... _. _~~ · -.f1 ~ . ~ :~:: =': .. 1: .. ...
; ~ •) ·z .. ':·~~-" ·-:·~:.1 --:._ -.~.=:;~ !'·:~· ; · ·_:-;.;' -; .. ~. :: ~- : :. 's.:::1 .-:. ·..:1r .. .... _ .. _;~:- } ·~: t1 ·~ .:-_ ..

'··
(.:.:_
ENERGY-SAVING MEASURES FOR HEATING OF DWELLINGS VERSUS COSTUMER HABITS AND PRICE POLICY
Ladislav Pirsel Slovak Academy of Sciences, Bratislava
Czech & Slovak Federal Republic
Dusan Petras Civil Engineering Faculty, Slovak Technical University
Bratislava, Czech & Slovak Federal Republic
1. ABSTRACT
Czecho-Slovakia like other countries makes many efforts to save energy in buildings. Due to climatic conditions the performance of buildings, especially their heating, represents one of the biggest energy consumers in our country.
III 16
Therefore the goverment launched official programms to promote the reduction of energy consumption of the so called s~andard flat which is a hypothetical unit consisting of 200 m living space and represents a measure to compare energy consumption of different buildings. on the other hand there is a disproportion between the costs to produce heat and the price of heat which is paid by the consumers. This approxi- · mately 100 % difference between the costs and price was until ' now settled by govermental dotations which represented the · social aspect of our state policy. However, such great difference and dotations lead to uneffective heat consumption, bad energy saving motivation of tenants and to an unadequate warm thermal comfort during the heating season. In such conditions neither lower U-values of enveloping constructions nor control equipment is able to guarantee signf icant energy-savings.
; ~= The paper presents investigation results which document the·aforementioned problems. A representative sample of flats ; was observed in the city Bratislava (around 400 000 inhabi- -tants) supplied with energy from district heating systems. : Temperatures, energy consumption, subjective thermal sensations, clothing and ventilation habits were recorded. It was found in flats with energy-saving measures that the mean indoor air ,temperatures are higher, clothing is lighter and ventilation is longer and more frequent than previously · . ., expected. The actual energy consumption of the specific flat ··' : was higher and corresponded with the former findings. It can be claimed, that due to a too social price policy unmotivated costumer habits made impossible radical energy-savings inspite of progressive constructions and heating systems.
RANK XEROX COMMUN/CATIE SERVICE

·:-, ..
-:·
·.:
2. INTRODUCTION
Energy consumption in nonproductive sphere makes 1/3 of all produced energy in developed countries nowadays. We can appoint this consumption with enough accuracy as the inevitable part of runnig a building. The greater part of this energy consumption takes place in dwellings which are presumably the single sector of world's energy consumption where the largest potential possiblities for energy conservation exist. Heating plays the key role in energy consumption as far as it represents approx. 65 to 80 % of the total operational energy consumption in dwellings [2].
Therefore it is very important to define energy-saving measures for dwellings' heating .. On the other hand these energy-saving measure must not contradict to prior requirements on users' thermal comfort.
3. ENERGY-SAVING MEASURES FOR HEATING OF DWELLINGS
Providing heat is a very important part of fuel-energetic economy of our country where almost 40 % of primary energetic sources are consumed. That is why former local and group heating systems (in principle decentralysed heating) was turned into central or district heating. Nowadays the district heating represents as much as 50 % of all heating systems and supplies with heat almost 1 mil. of flats what is around 20 % of their total amount [1]. We can claim that one of the ways to economize heat in dwellings is to apply district heating systems. This way it is possible to save 5 to 20 % of fuel but as well working powers and to improve the ecology.
The majority of industrially developed countries consumes about 30 % of the total energy consumption in dwellings. According to the bill No. 162/78 issued by the Goverment committee3 the heating consumption of the specific standard flat -(200 m of enclosed space) should be 9.3 MWh/flat/year (33. 5 GJ/flat/year). This value was set for -15 ·c outdoor and 20 °c indoor air temperature [4]. Evenly ~istributed over the entire inner volume it represents 26 W/~ (required U-value~ for vertical outside walls 0.9 W/m .K, roofs 0.5 W/m .K). However, before the latest building code's novelization the u-values were essentially higher (60 % of valid values). On the other hand energy-saving ought not to interfere with following thermal comfort parametres:
a. required mean globe temperature should be at least 18 ·c from 8 a.m. to 9 p.m.,
b. diurnal globe temperature drop between 10 p.m. to 6 a.m. must be less than 3 •c (but the globe temperature not less than 16 °C) in occupied spaces or less than 5 ·c in other spaces,

I ,~
I !
··: ;.••
~:'. ·· · .
"
c. temperature difference of the same two randomly choosen rooms situated among bottom and top floors must not be more than 3 K.
It is obvious that the most important technical equipment to enable energy-savings in heating of dwellings is to apply control systems for central heat-source, heat-exchanger station and for users at each of the heaters as well.
4. CONSUMER HABITS AND PRICE POLICY
Immense efforts the world in consumption and technical means:
were made during the last decade throughout moderate zones in order to reduce energyto secure healthy indoor environment by
a. saving energy by lower U-values of enveloping conctructions (as shown in chapter 2) and by reducing the ventilation rate to a hygienic minimum,
b. eliminating all negative influences from diverse chemical substances issuing from soil, building materials, technical appliances, furnishings and human activities.
Effective price policy is another measure to cut energyconsumption. At the first sight someone could be convinced that technical measures are prior to fiscal and price policy measures. our country could be taken as a very good example what is happening when radical technical measures are combined with a week price policy.
After completing our investigations about the actual state of indoor-climate in dwellings, we made two times with a time delay of two years in Bratislava - a town of about 400 ooo inhabitants, we could claim that humans tend to rise their comfort whenever it is possible and when .not stimulated by . finacial means. They do not bother whether it is reasonable and necessary from the physiological viewpoint or not. They even accept higher health risks, when unaware of them, to reach more comfortable conditions. It means that humans are not able to discover with their senses health hazards and are exposed to the danger of the well-known "frog syndrome" (not being able to notice the limit when noxes are handed in small doses). On the other hand people are stingy concerning run~ nig costs and they cut them down and economize when these excceed a special limit.
Irrespective of soarig prices of fuel on world market in last decades the price of heat for communal purposes did not rise dramtically in our country and the absolute difference between costs to produce heat and its price was be~omming greater and greater. Thus this difference was balanced out by govermental subventions. This fact was considered for the social aspect of our price policy and somehow degraded the sense fa~ thrift of our people. The administration was prob-
( -:';. ably convinced that technical measures themselves will result \.

:·
in significant energy-savings. However, the surpise was immense when despite of costly technical measures set by a new buiding code (1977) the outcome was .not· so significant.
5. RESULTS
Our investigations originally started as a part of a thermal comfort research and were not specially focused on energy tradeoffs . of buildings. Inasmuch as we monitored at the same time indoor temperatures, clothing, ventilation frequency and duration, subjective thermal sensations, presence of controlling and measuring devices and recorded the age of the buildings as an indicator for U-values (in Czecho-Slovakia block of flats were errected during different periods with particular U-values and hence the age of a building is a good indication for insulation of enveloping constructions) and some other supporting facts the cross analysis of gathered data revealed indoor-climate tendencies in dwellings and tenants' attitude to energy-savings. Almost all buildings were supplied with heat by district heating and the rest at least by an other kind of communal heating (i.e. central heating). The structure of the monitored sample was choosen by statistical means in order to be representative with respect to the age and locality. Subjective thermal sensations were determined by a preference scale as an answer to the question: Does the momentary temperature satisfy you? (-2: it could be a great deal higher; -1: it could be a little higher; .o: yes, it is just right; +l: it could be a little lower; +2: it could be a great deal lower). The results of this kind of voting are designated as PMV (-). Measurements of indoor air temperature t. ("C) were taken in living rooms and bedrooms. The mean va±ues for all monitored dwellings were for living rooms t. = 22.7 ·c, PMV = -0.21, for bedrooms t. = 22.1 ·c, PMV = -0.15. In almost 70 % of cases the subjec~s evaluated the momentary thermal state to be typical for the heating season. About 31 % were dressed in light summer clothing and approx. only 18 % wore typical winter clothing. There were more dissatisfied due to cool (24 %) than due to warm discom-f art ( 6 % ) • About 69 % ventilated 3 or more times a day and · 31 % each time longer than 1 h. Indoor air temperatures in living rooms rose continually from 21.7 ·c in dwellings built until 1945 to 23.5 •c·in those built after 1981. Almost the same is the fact in bedrooms (from 21. s ·c to 23. 5 °C). The mean thermal.preference behaves the same way and rose in living rooms from -0.53 to 0.11. Similar in bedrooms from -0.40 to 0.26. !hermal resista~ce of dressed clothing decreased from 0.127 m .K/W to 0.102 m .K/W and in the newest dwellings . more than the half (53 %) wore light summer clothing during : , the heating season. More than 80 % of the newest dwellings : were equiped with thermostatic valves on radiators but ~ . tenants used them only rarely and were very satified. with ·.:· summer conditions in their flats during winter-time.
·: .-r -JI -.. -

;: ..
-.. ::·.
(·~::
6. CONCLUSIONS
Compared with the old buildings the newest ones had almost 4-times lower U-values, modern double-glazed windows, controlling equipment and central heating, however an essential part of potential energy-savings was exhausted by an unadequate "summer comfort" in heated dwellings. For this fact is almost with a certainty the unappropriate and week price policy to blame. Immense subventions were literally blown through the chimney and unavoidable lost for ever. The original social aspect of govermental subventions acte~ in fact against the living standard and were counterproductive. All, not only socially week, were subvenced and waste of energy was apraised. This acted against developing new technologies, because waste of energy was cheaper, and blocked great funds to be used in R & D activities. The unnecessary air pollution from furnaces to produce heat for overheating should not be forgotten. Therefore, a strict price policy with a high price for heat and govermental subventions for energy conservation measures is to be applied. These are the lessons to be learned · from the Czecho-Slovak experiment carried out during last 13 years.
7. REFERENCES
[1] Petras, D.: Subjective evaluation of thermal comfort ant its relation to energy consumption for heating of dwellings, Proc. of the 4th Int. Conf. INDOOR AIR '87, Berlin {west) 1987, Vol. 3, pp. 487-490
[2] Petras, D.: Energy consumption, thermal comfort and economy of dwellings heated by district heating in Czecho-Slovakia, Proc. of the 2nd World Congress CLIMA 2000, Sarajevo, Vol. 2, pp. 209-214
[3] Petras, D.: Beheizung der Wohngebaude aus zentralen Warmeversorgungsstemen in der CSSR - energetische und okonomische Aspekte, 9th Int. Symposium INTERKLIMA '87, Zagreb 1987, 6 pp.
[4] Petras, D.: Energiebedarf von Wohngebauden bei Anwendung progressiver Heizsysteme, 3 Weimerer Symposium zur energetisch-okonimschen Bewertung von Bauelementen, Bauerz~ugnissen und Bauprozessen, Weimar 1988, pp. 45-47
[5] Pirsel, L.: A Czechoslovak ssurvey about ventilation habits in dwellings, Proc. of the Int. Conf. Present and Future of IAQ, Elsevier Sc. Pub., Amsterdam 1989, pp. 321-328

·1
I f
~- .-
. : .. ~
......
( \·:
ABSTRACT
THE REDUCTION IN SOLAR HEAT GAIN CAUSED BY CONDENSATION ON GLAZING
· A.C. Pitts and T. Lam Building Science Unit
School of Architectural Studies University of Sheffield.
SHEFFIELD S10 2TN UK
·11117
Buildings are increasingly designed with energy efficiency in mind. Passive solar design features may help to achieve this aim. Such features however, use substantial amounts of glazing and calculation of solar transmission through the glazing is important for environmental assessment and control. Little information exists on the effects of condensation on glazing solar radiation transmission, thus prompting the experimental investigation described herein. Four glazing types were tested and in each case a reduction in transmission was observed. The effect increases as the angle of incidence of solar· radiation becomes shallower.
KEYWORDS: Condensation; Glazing; Solar Radiation Transmission.
INTRODUCTION •. , -
In recent years both improved energy efficiency and high levels of thermal comfort have been sought in buildings. Some of the techniques" employed to meet these aims have been classified as . "passive solar design" .. One of the principal characteristics of buildings so designed, ls the use of substantial areas of glazing to permit · admission of solar radiation. "Direct Gain" windows and ._: ,.-· "Attached Sunspace" conservatories clearly exhibit such a characteristic. .. - - . .. - · -
The transmission of solar radiation by glazing is affected by such . features as; glazing material type; angle of incidence; number of layers of glazing; and shading devices •. The effect of these features can normally . be calculated. Information for such calculations is ... ·· available from glazing manufacturers and in various design manuals· ( 1). . . . .. . .
Q <! Al v y ,: Q n r r. ,, u ~ .. " Al ,, .. <! TI C' c: C' D v I ,. .,.
· ~ ·
;:-:
. ::~:=~;
An additional influence on solar transmission which is often neglected is that caused by moisture condensation on glazing surfaces. This condensation often occurs during cool or cold periods which may well be accompanied by clear skies. At these times solar heat gain can make an important contribution to build ing heating requirements. The normal expectation is that condensation early in the morning will evaporate later in the day, but any reduction in heat gain whilst it exists may have a significant impact on the cumulative solar heat gain and the benefits derived.
Some current research work at the University of Sheffield (2) is being directed towards the control of internal environments in passive solar buildings. Problems have been encountered when attempting to account for condensation effects, with no design data being available. As a result an experimental investigation was instigated to analyse the effect of condensation on solar radiation transmission.
EXPERIMENTAL INVESTIGATION
A laboratory based investigation was chosen in order to allow control of influencing variables. In the tests the sun was simulated by an array of Philips Quartz Halogen Oichroic Mirror Lamps (Type 13117). The lamps were cooled when in use by an adjacent fan and control of output was allowed by varying the voltage supply.
Measurement of solar radiation intensity was performed by a Kipp and Zonen Pyranometer (Type CM11) attached to a recording voltmeter. Various ranges of intensity were used in the tests and comparisons . were made to gauge if this had an effect (which~~ did not). Tests using maximum intensities of 400, 500 and 800 Wm were used.
The whole experimental rig was located in a darkened laboratory and was surrounded additionally by a matt black screen to prevent ingress of other sources of light. · · The samples of glazing were loca~ed .. between the solar lamp array and the pyranometer. Figure 1 shows a schematic diagram of the arrangement. . '. -t:.
Four types of glazing materials were used in the tests : Standard 3mm glass; standard 6mm glass; 6mm heat rejecting glass (Pilkingtons Spectrafloat); and Jmm plastic acrylic sheet.
A number of' tests were performed with the glazing perpendicular_ to the radiation and these were complemented by tests with the glazing at angles of 15°, 30°, 45°, 60° and 75° (angle between radiation and~- normal to the glazing surface) .

.·.·:
i._.. •· .·.·
(>i
FIGURE 1
FAN IS><::?I
~ SOLAR LAMPS
GLAZING SAMPLE
PYRANOMETER
Schematic diagram of test rig
SCREEN
"Condensation" was provided by two means. In the first, moist air was directed onto the cooled glazing surface to produce a "misting" effect. In the second, a water spray was used to produce a layer of fine droplets on the glazing. Problems encountered in achieving a uniform layer by the second method meant th:at it was not used in the angled glazing tests. ··
RESULTS
The surface finish of the plastic acrylic sheet deteriorated rapidly during the course of the tests so a completely consistent set of results could not be obtained for this material. The general indication was of an additional 4% reduction in transmission caused by the condensation. In some test runs for the acrylic sheet using larger quantities of moisture, the water layer increased the transmission. This effect seemed to be due to water affecting the way in which __ the. damaged surface .of the.material acted, resulting in improved ·transmission. Further tests are required to investigate this phenomenon. ·
.. 'l • ·.; . .. "" -· ... . .. . . ~
- - _ .. __ ,. . - ·- ·-- ...... - ·-. - . ... ·---.......

The results for the glasses are most easily shown in diagramatic form. Figures 2, 3 and 4 refer to 3mm standard, 6mm standard and 6mm heat rejecting glass respectively. (The results shown in the diagrams are for the first "misting" form of condensation).
All the glasses exhibit a reduction in transmission of 2 to 3% when the angle of incidence of the radiation is within about 30° of the normal. The effect increases to about 7% when the radiation is at an angle of 75°. --
Since the transmission of the heat rejecting glass is lower initially, the extra reduction caused by the condensation can form a very significant proportion of that expected to be transmitted.
Some slight variations in effect could be detected when using "sprayed" rather than "mist" condensation but not significantly different from the results shown . .. ·
1.0
0.8
... ·.···
... PROPORTION O. 6 SOLAR, '. ·::: RADIATION TRANSMITTED
'"' . : ,.:_:·::.-'- ·
f=::- -!.---..!.__ """WITHOUT CONDENSATION -,
' ' WITH CONDENSATibN...
"' . I
· ·· "'" :;:~ I
\ \
\
' \ ' \
\ . \
0.4 ' . 4. - ::_; : , '-' ••
' ..... """-. - . ::-~.:...~'!£ ·· - -~---.. ~-·
~ 1 ' ...
v. ) ::. . : ~~'
~-:' ! :: ... : .., ~.~:: _,.. ;_=:
- -:~ I ~--.:~.;-· ~ ., ..:;£~---.~: _ .. - ... ,...,:. _;
-·:·;..:'
-· - : : _:_ ~: ·.~-r: .:·: .. :· : _-:''"
... ~-"''"".'.'i"o. 2 . :'~:i·~:: :;:·-; ~r: ~:~; ..
~'"·::.:.~~: ~· .'( " ".o;'
-...... >~ ·-:.:i _ ... ,
-~:.-~ :: - -~!3 ; ;.~~~-) ... 7~.:~:...:r..:<.:~.. ;"! ., J.:.·· -~ .. -.. ' ._, .. _.,. ..!. • Y~-~ 1·:f~.:J~:v;:; 3· ~~~"!i: -3,~ .~. ·=· 7'~-~ :1';l_;: ' . >:-~: ;': .... :} ~- .... ~ ;~~:o ?. t~~-1
•I • ··. :.. ::",.:-.~~ -:~:~ ::;:;1... .!\, · • - .;.·::;._r~ ~~ .'~- ~--;~~-;: .. 5 '.;.;: .... ) :i..: .. ·ri' :c:'.: :
I . : ~ ., - • ._. ~ '; ~-~~. '": ~ ·:~·~; .... ~~.:-::-: ·~ ~:~: ,f_: ..... ;"\,""
:,:; .. - : .. -:: .... - ~ .. { :"c' v:; ;,...,·_ .. :. ~- ~ :r.
. ...... "' -•. [~ ,, .7 ' 2. -_~,. .. 0
r-.. T," L-~ ' -~ - "J :•~!j~::_:?<.\ '"'·_..; ..
--·• . .. ~ .. ' .-~ :. ' -· ~-. '-~ .... ~ , .. ·. ··~-
. :::- .. . ~ .. ~ ... i : ~ . 0 : ,~~,, -15 30 ·. - . 45 . ,,.. .. 66 .. 4 • ••
75
ANGLE OF INCIDENCE (FROM NORMAL)
FIGURE 2 3mm Standard glass

·.::·.
I
(-;_:= · ..
(,.
CONCLUSIONS
The presence of condensation on glazing does cause a reduction in solar radiation transmission. The reduction increases as the angle of incidence becomes shallower and ranges as a percentage of the expected transmission from 2% (3mm standard glass - normal incidence) to 13% (6mm heat rejecting glass - 75° to the normal incidence). ·
As a result of these tests it is suggested that modified figures be available in design guides to allow for reduced solar heat gains at times when condensation is predicted though at this stage more detailed data is required.
Further work is required to investigate a wider range of glazing and also to check on the significance of the amount/form of condensation on solar transmission. The influence of shading devices and other window modifying equipment must also be investigated.
PROPORTION SOLAR RADIATION TRANSMITTED
1.0
o.s
0.6
·l
0.4
··· - ·:· 0.2
0
. ..:. .. ~ -·WITHOUT CONDENSATION
........... • 'J ............ _ . . -.. · ~ - ... _.__,
... WITH CONDENSATION ',, ... ,
... ' ' .. ' ...
; '
----- -~--:-)<> __ . __ ..,.~ ·----,__... .. ~-~
,.,:_
; • • ~ • 4 • .;
) ,. ~·-f • -~ :-;:, i '.:~d • • • : j ~
-- --·-: ··---- - .. ~.- - -~.·-. --
0 15 30 45 60 75 ANGLE OF INCIDENCE (FROM NORMAL)
FIGURE 3 6mm Standard glass

:.
REFERENCES
1. American Society of Heating Refrigerating and Air Conditioning Engineers : Handbook - Fundamentals Volume, ASHRAE (1985).
2. : Pitts, A.C. and Patronis, J., Improved Sunspace Environments Using Climate Prediction and Intelligent Controls in Energy and Buildings for Temperature Climates (Proceedings PLEA '88) p.435.
1.0
0.8
PROPORTION SOLAR RADIATION 0. 6 TRANSMITTED f )f ,_ . WITHOUT CONDENSATION ---:-.... ----...----L ~ - ~ --· WIT~ CONDENSATION - ... <
0.4
0.2
0
0
,;. '\'' - : : ·-:: • ~ • . ! '
-~-..
15 30 45
~ j ' ' ' ·' ' '•
60 :' 75
ANGLE OF INCIDENCE (FROM NORMAL)
FIGURE 4 6mm Heat rejecting glass _ _..._ • ........,.._ ..... ,_..,_ . .,.,,_..-:~ ·~··1"'-·~·-"1!:r"'•· ._ .._.,,_•:··~ •• .-._K...~ ...... ;-..;.\.;..~u
;. ~ ii ..
) <°1 t.~
, J ·:·iii .. )~~ -~h_;·r·~; .-1: .. ~··t~1~~ :;·~~;:.
: "'t:1i>:~r_ ··, :f~~r:•.-1 .._, _;
. ' . , ,.1 .; :· ·
___ .;;:..._ _ ~
·,
··-•r-:;

·r III 18
r:.'·:- THE JUSTIFICATION OF ENERGY EFFICIENT MULTISTOREY COMMERCIAL BUILDING DESIGN
.....
(;_: . ·.
Graeme Robertson
Deparonent of Architecture University of Auckland Auckland New Zealand
Kevwords: Energy, Commercial Buildings, Economic Efficiency, Worker Efficiency, Temperate Climate
Abstract The first energy crisis of 1973 proposed a plethora of buildings, both commercial and residential, designed to be energy efficient using passive solar techniques. Often rJlese designs were based on scenario involving soaring energy costs - a situation that, based on current world oil prices, is still some time away. The energy efficient commercial buildings designed were invariably relatively expensive and contrary to the thrust of post modernist architectural design. Few successful examples evolved.
In New Zealand, a temperate climate country in the South Pacific, the lessons to be learnt from the first energy crisis were slow to be assimilated. Energy efficient commercial buildings have been slow to evolve.
This paper briefly explores possible energy efficient techniques appropriate for commercial buildings in a temperate climate country such as New ZealaJJd. The likely cost effectiveness is discussed both in terms of energy efficiency and worker efficiency.
This paper suggests that a better method of justifying these possible design solutions lies in the increased output of the workers and not in the possible energy savings. ·
True environmenrally connected high comfort office buildings are pcmible both economically and architecturally.
lntroductjon World wide, the first energy crisis of 1973 instigated energy efficient commercial buildings which were invariably relatively expensive and contrary to the thrust of contemporary architectural design theories. Few really successful examples evolved - unsuccessful in tenns of developer and owner economics, without · substantial external subsidy or a greatly increased ".Ost of energy. . . . i"· •.
. . . . ,·
In New Z".ealand reaction to the 1973 'crisis' has been slow even though the country was highly dependent on overseas supplies of oil. Electricity generation from hydro sources is the dominant energy source.for , . ~ -. · · commercial buildings with three factors impacting on the nalUI'e of this energy use: ··
(a) Change in eleclricity generation (P J.) (1.) ... .. ti . :
Hy~ Geo Coal Oil Gas Others Total "
1974 54.132 4.697 4.606 7.004 0.660 0.078 71.178 .. 1988 80.526 4.259 2.099 0.020 18.252 0.000 105.158
Table 1 This shows a reduction in oil as an electricity generator and an improvement in the use of gas and hydro.
'•;...j l• ...
RANK XEROX COMMUN/CATIE SERVICE

·:·
(b) A move during the last five years to reduce the government involvement in electricity generation as much as possible by 'privatising' the industry. Electricity is now being marketed strongly in New Zealand to produce increased profits with the result that energy conservation is not seen as relevant Certainly, Government believes that energy conservation is for the private individual to consider and not a concern of Central Government When the total economy is only growing at 0.8%/annum we see electricity consumption rising by up to 8%/annum(2>.
(c) Proposed changes to the Building Code Legislation where a National Building Code (3) is about to be introduced concerning itself only with health and safety - a true market forces code - ignoring aspects such as energy conservation, will further reduce the demand for energy conservation skills in the design and operation of commercial buildings.
While these minor changes, predominantly of a political nature have been taking place, energy conservation via energy management techniques has occured. Typically savings of 10-25% have been reported by introducing fairly standard management methods normally with minimal capital expendilllre involved and little or no change in comfort standards.
A reasonably typical improvement in the use of energy in a recent office tower is shown in Table 2(4). This improvement has been brought about by introducing supervisory monitoring with computer control.
January July Annual
1988 51.1 68.6
440.7
Table 2 HY AC energy consumption MJ/m2
1989 (after improvements) 42.0 46.1 288.3
The need to design buildings to conserve energy is certainly not seen as a necessary factor in New L.ealand at present Even the current growing awareness of the possible results of the greenhouse effect and subsequent global warming are wilikely to produce a significantly changed situation in most climatic zones. Certainly the colder and temperate climatic zones are likely to see liale change in energy use in commercial buildings although temperate climates may see a significant increase in energy use to produce.adequate cooling.
To continue to argue to design professionals and the developeIS of commercial buildings that an 'Energy Efficient' option is desirable is less than justifiable. The economic basis is just not sustainable at the present time as possible savings from energy efficiency contribute such a minor part to the total running costs of a typical tenant company and is a relatively small factor in the costs of the building owner.
This need for a better argumem for justification developed into a swdy of22 Auckland office buildings .~ ·· · during 1988 and 1989. The preliminary results suggest that savings in labour costs attributable to a more . . efficient environment (environmentally connected natural environment) are of critical importance and do in- .. '·' fact suggest a building fonn quite different from the norm. : ·• : :,,1,;'. ' ,
Tenant Comparative Costs . .. In terms of the dollar outlay over the 40 year life cycle of an office building it is generally recognised (5) (6) that 2-3% is spent on the initial costs of the building and equipment., 6-8% on maintenance and replacement and 90-92% is generally spent on personnel salaries and direct benefits. These figures are quoted universally, they have been tested in the current Auckland study (7) with some results at variance to a slight degree (Table 3).
a) The 40 year life cycle used in the quoted swdies is irrelevant in the current scene with a 10-15 year ' , ~ -·;· economic life being often used - with the result being an even greater emphasis on the reduction of · · · ·· · capital costs and annual costs (energy costs) being even less critical.
b) The figure for personnel salaries seems to fit better in the 80-87% range than the higher percentages quoted in American studies particularly.

I • •
··: ·
( >
c) Because of the vast range of leasing agreements the maintenance and replacement component along with running costs (including energy costs} is difficult to define precisely but fits within the 5-8% range.
cl) Energy costs typically make up between 0.3% and 2-2% of annual costs of running an Auckland CBDoffice.
Component % Personnel Costs (Salaries and direct benefits)
Leasing costs (or Capital replacement in case of owner occupied space)
Air conditioning/heating maintenance
Lifts Oeaning Building maintenance
Energy
Other
80-87
1.5-8
0.5.5
3-4 2-5
0.5-2.5
0.3-2.2
1.5-8.5
Table 3 Auckland CBD Office Annual Costs (Tenants)
Owuer Comparatjye Costs
Notes Depending on the nature of the business, size and sr.atus/efficiency. The variability of procedures is immense which with factors such as quality, position, age, size etc produces an imprecise pattern. This figure varies widely because of the non-existence, nature and age of planL
The variability of leasing agreements is a factor with the inclusion of external maintenance costs as a tenant responsibility being a growing trend. Generally this is an electricity cost although 2 cases involved an LPG input. This figure includes aspects of fue, offic equipment.communication,nues and insurances. It was difficult to compare like with like. ·
To obtain a full picture of a commercial building's energy use one must also investigate the position of the building owner as often, depending upon the lease arrangements, there may be costs associated with common areas etc. .. -. ., A recent swdy in Auckland of 20 buildings (8) totalling 206, 364 m2, for the 1987-88 year, suggests mat the total expenditure for energy usage in common areas, including electricity for air-conditioning, lifts. ·,, :-. escalators and common area lighting, amounts to on average just NZ$10.09/m2. The total income for the building averagedNZ$199.05 i.e., 5.07%. •., - · : .. ..
- • • ._ ~ • ~ • - ' > • • • ~.
Therefore, from these fi~s. it is dimcult to e~pect the oW:Oers of the commercial buildings to be .. , · ~ ". • particularly interested in energy saving. if. to achieve those savings, significant capital expenditure is _,. involved. _·_ , ., . . : ..
Quite clearly the as.rumption that energy efficiency is in itself a desirable aim in the design and production of commercial buildings is faulty. To go to extreme lengths by introducing changes to the typical building in tenns of fonn, external design treabncnts. daylighting. lWl1ra.l ventilation etc for energy efficient/cost · · saving reasons cannot be justified even at no extra capital cost. particularly in a climate as moderate as that of Auckland, New Zealand. . . ·
\ ..... ·. -~1, _· _-: ~ ~ .:· :.~~- • •• ~ • ., ,~: .:.1. '. : ...
Productjyity and Satjsfactjop . 1/
Productivity is a broad concept which includes not only employees' work perfonnance but also associated organisational costs such as employee turnover, absenteeism, lard.in~. required overtime, vandalism, ··.: grievances and mental and physical health. Historically, much or the research (9) (I 0) on productivity has relied on using measures of employee satisfaction as indicators of productivity. ·. :
; _ • s ~ ...J. ,. • ;,. • ~J. . . :- ~ - · • • ., --..
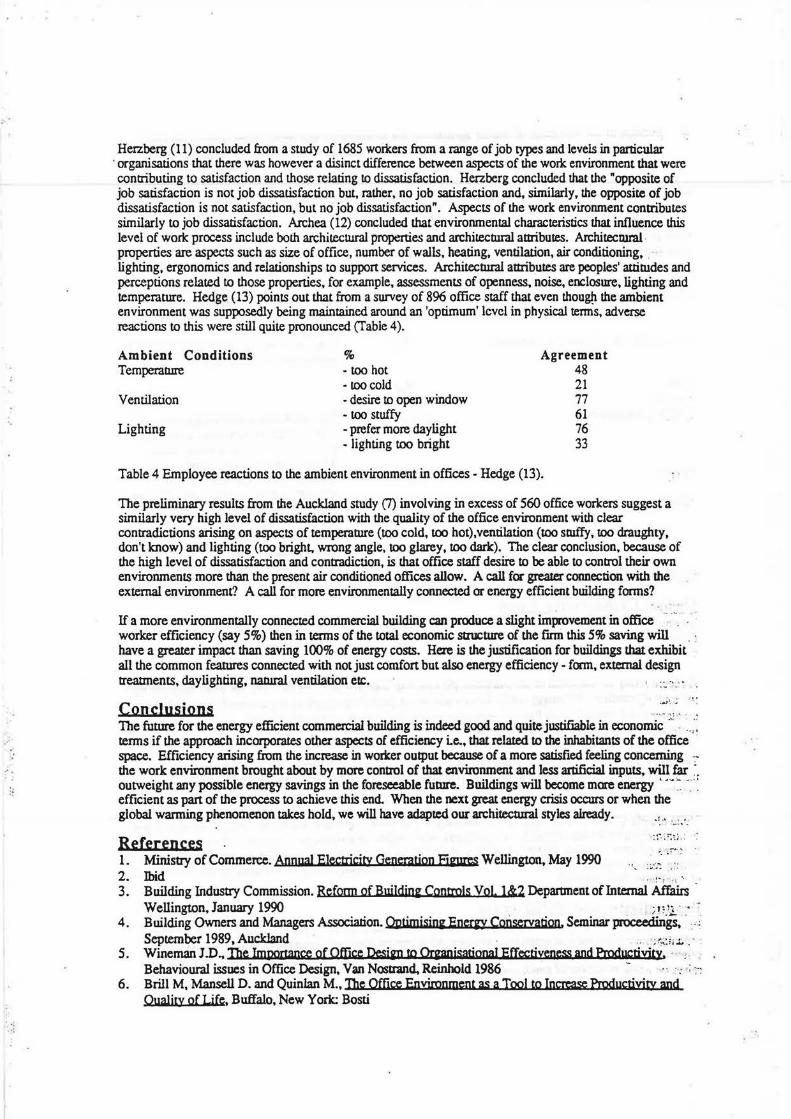
:· ·
.. ,
::
:::
Herzberg (11) concluded from a study of 1685 workers from a range of job types and levels in particular · organisations that there was however a disinct difference between aspects of the work environment that were contributing to satisfaction and those relating to dissatisfaction. Herzberg concluded that the "opposite of job satisfaction is not job dissatisfaction but, rather, no job satisfaction and, similarly, the opposite of job dissatisfaction is not satisfaction, but no job dissatisfaction". Aspects of the work environment contributes similarly to job dissatisfaction. Archea (12) concluded that environmental characteristics that influence this level of work process include both architectural properties and architectural attributes. Architecmral . properties are aspects such as size of office, number of walls, heating, ventilation, air conditioning, . lighting, ergonomics and relationships to support services. Architectural attributes are peoples' attitudes and perceptions related to those properties, for example, assessments of openness, noise, enclosure, lighting and temperature. Hedge (13) points out that from a survey of 896 office staff that even thoug!i the ambient environment was supposedly being maintained around an 'optimum' level in physical tenns, adverse reactions to this were still quite pronounced (Table 4).
Ambient Conditions Temperatme
Ventilation
Lighting
% ·too hot ·too cold • desire to open window • too stuffy • prefer more daylight • lighting too bright
Agreement 48 21 77 61 76 33
Table 4 Employee reactions to the ambient environment in offices • Hedge (13).
The preliminary results from the Auckland study \1) involving in excess of 560 office workers suggest a similarly very high level of dissatisfaction with the quality of the office environment with clear contradictions arising on aspects of temperature (too cold, too hot), ventilation (too stuffy, too draughty, don't know) and lighting (too bright, wrong angle, too glarey, too dark). The clear conclusion, because of the high level of dissatisfaction and contradiction, is that office staff desire to be able to control their own environments more than the present air conditioned offices allow. A call for greater connection with the external environment? A call for more environmentally connected or energy efficient building forms?
If a more environmentally connected commercial building can produce a slight improvement in office worker efficiency (say 5%) then in terms of the total economic structure of the finn this 5% saving will have a greater impact than saving 100% of energy costs. He.re is the justification for buildings that exhibit all the common features connected with not just comfort but also energy efficiency • form, external design treatments, daylighting, natural ventilation etc.
Conclusjons -- --~·:,;. ': The future for the energy efficient commercial building is indeed good and quite justifiable in economic ... . . . .', tenns if the approach incorporates other aspects of efficiency Le., that related to the inhabitants of the office · space. Efficiency arising from the increase in worlcer output because of a more satisfied feeling concerning ·.the work environment brought about by more control of that environment and less artificial inputs, will far ~ . outweight any possible energy savings in the foreseeable future. Buildings will become more energy ' ·- ~ - ·: efficient as part of the process to achieve this end. When the next great energy crisis occurs or when the global warming phenomenon takes hold, we will have adapted our architectural styles already.
..! ·' ·-~ •• _
References : ~'"; ~ ~: ~ i
1. Ministry of Commerce. Annual Electricity Generatipn EiJU'CS Wellington, May 1990 ., .,.2 ". 2. Ibid --:~, -·. ' 3. Building Industry Commission. RefOTID of Buildjni Controls Vol. 1&2 Deparunent of Internal Affairs
Wellington, January 1990 . ~ '')' · • 4. Building Owners and Managers Association. Oj!timjsjoi Ener&Y C0Dservation. Seminar prOceedings, - .. :
September 1989,Auckland . ,. ;t.;:;;;r. ·
5. Wineman ] .D., The Importance pf Office Desj~ to Or:pnjsatipnaJ Effectiyepes., and Productiyjt.v. . Behavioural issues in Office Design, Van Nosttand, Reinhold 1986 - ·· .·: . ·.-:
6. Brill M, Mansell D. and Quinlan M., The Office £nyironmeut as a Tool to Increase Productiyity and OuaUty pfLjfe, Buffalo, New York: Bosti

-r-,~
[·~ { .. .
·• =~- =
(,-:. ::
c,:.:,
7. Robertson G., Eneri:Y Desiw. Commercial Buildings. Proceedings Australia N.Z. Solar Energy Society, Buildings Group Conference, Hobart 1989
8. Verwer P., 0,peratjng Perfonnance Handbcok - Office BuildinKe5 Auckland CBD 1987-88, Building Owners and Managers Association of New :zealand, Auckland Br.inch
9. Lawler E.E. and Porter L.W ., The Effect of Performance on Job Satisfaction, Industrial Relations 7, 1967
10. Locke, Job Satisfaction and Per{onnance, Organisational Behaviour and Human Perfonnance 5, i97o 11. Herzberg F., One More Time: How do you motivate emDloyees?, Concepts and Controversy in
Organisational Behaviour, Good Year Publishing, 1976 12. Archea S., The Place of Architectural Factors in BehavjouraJ Theories of Privacy, Journal of Social
Issues 33, 1977 13. Hedge A., The Impact of Desiiw on Employee Reactions to their Offices, Behavioural Issues in Office
Design, van Nosttand Reinhold, 1986

-I \
·-;.!::
I . -.·
c-·
ABSTRA~
THE LOW-ENERGY DWELLING FOR BOT-HUMID SINGAPORE
Suthipuntha Sujarittanonta, Ph.D. School of Architecture
National University of Singapore Kent Ridge, Singapore 0511
·11119
An experimental low-energy house has been built on the National University of Singapore Campus to investigate into various low-energy design strategies. The finding have shown that these sterategies have good potential in enhancing thermal comfort within the building and conserving energy which is normally used for providing thermal comfort in hot humid climate. The features which shows potential in enhancing comfort in hot-humid climate include Solar induced ventilation, venturi effect ventilation, radiant/evaporative cooling, dynamic thermal mass and ground . contact heat sink. Findings of an on going research into the performance of passive coolings systems and the potential thermal benefit from the narrow diurnal temperature variation which is the characteristic of Singapore hot-humid equatorial climate is discussed.
Ili'XRODUC'rIOH
In order to study the performance and thermal comfort that could be achieved in the Hot-Humid climate with minimal energy, An Experimental House was built at the National University of Singapore campus utilizing the passive design approaches to maintain an indoor condition that is
· comfortable for the occupant over a wide range of climatic conditions outside. .Interaction between the external climate and the internal space result in a two-way flow of energy across this barrier which should be designed to control unfavourable energy flow. The approach is fundamentally determined by the human response to comfort, and is an ° attempt to work with, rather than against, the external climate. The appropriateness of a passive design strategy are determined by the analysis of climatic data and the requirements for human comfort. - -"'
SIHGAPORB Cl.I~
:-
e • -- ; .. :.
The Republic of Singapore consists of the island of Singapore and some smaller islands within its territorial waters. It is situated in the equatorial belt between latitudes 1 Degree 9 Minute North and 1 Degree 29 North and longitudes 103 Degree 38 Minute East to 104 Degree 6 Minute East. Because of Singapore's island maritime climate, the amount of cloudpresent in the sky is high (an average of 6 parts or more on · a 0-8 scale). Hence atmospheric absorption, which depends partly on state the of the sky (cloudiness), water vapour and suspended particles, ,, -
- 1 -

:·
·:·. '·'• ...
j:
reduces the direct solar radiation intensity substantially and results in a high percentage of diffuse radiation.
Sunshine Hours
The average sunshine hours in Singapore are 5.6 hours per day. On the whole, only 30 to 48\ of the possible sunshine hours is experienced. The period with the longest duration of sunshine is from February to July, with an average sunshine of 6 hours per day.
Solar Radiation
The monthly average of the daily total solar radiation varies from 3.81 kWh/Sq.m/d in December to 4.96 kWh/Sq.m/d in March. The annual mean daily total radiation is about 4.46 kWh/Sq.m/d which prevails for 66.5\ of the days. The year to year variation of the monthly mean radiation is about 10 to 15%. The daily mean hourly intensities of total solar radiation for each month at mid-day are between 550 and 700 W/Sq.m/h and the distribution pattern of radiation flux throughout the day is generally symmetrical with respect to noon time. During exceptionally clear sky conditions, instantaneous total radiation intensities reach as high as 1100 Wh/Sq.m/h at mid day hours. The diffuse radiation forms a fairly large proportion of the total solar radiation. Also, diffuse radiation is predictable throughout the year as the amount of cloud present variea very little. On average days, daily diffuse radiation varies from 1.5 to 2.4 kWh/Sq.m/d which forms 35 to 45\ of the daily total radiation.
Air ~•aperature
The air temperatures in Singapore are generally lower than that in other cities in the region with a tempered mean maximum and minimum temperature range due to its island maritime climate. The hottest period of the year is in March with the annual mean maximum temperature of 30 Degree C. The cooler period is between November and January, during the North~ eastern monsoon period when most of the rainfalls are in the late afternoon. The annual mean average temperature in Singapore is 26.7 Degree c. The diurnal temperature range is from 7 to 8 Degree c and the annual temperature range is 3 Degree c.
Buai.dity
The annual ~aily average relative humidity is 84.5\. The most humid period is in December with the highest 24 hour mean relative humidity of 87\. The lowest 24 hour mean relative humidity of 83\ occurs in July. The daily pattern of relative humidity ranges from 90\ which occurs -in the early morning before sun rise to 75\ in the afternoon.
Precipitation
Singapore recei~es substantial rainfall yearly. The mean annual rainfall recorded was approximately 2372.7 mm, with the highest and lowest of
2 -
...

r .;; ::~· around 3452. 4 mm and 1492. 8 mm respectively. The daily highest rainfall
in 1984 was 514.4 mm.
DESIGN CRI'XERIA OF THE EXPERIMENTAL LOW-ENERGY HOUSE
One of the requirements was that the house should incorporate all appropriate passive cooling methods, as well as the installation of active solar cooling systems for further study. A hybrid house design was required with consequential design problems. In order to explore an
· appropriate solution in view of Singapore's high land cost another design criteria was to adopt minimum space standards for the dwelling, so that it can be built on a smaller site. The total floor area of the house was reduced to 40.30 Sq.m. This reduction in room size also minimized the cooling load of the Solar air-conditioner. It was achieved the smallest possible interior spaces without sacrificing comfort by overlapping most of the living spaces and sharing the internal circulation paths as much as possible.
Timber structure was chosen because of its low cost and the ease of construction. The concrete floor slab functions as a floating foundation as well as a heat sink. To minimize heat gain through the house envelope, the external walls were made of 100 mm thick precast glassfibre reinforced concrete (GRC) panels with polystyrene cores. These wall panels have good thermal insulation. Prefabrication techniques were used. The plan of the house was based on the modular size of ll typical panels. other variations in planning were made possible by using different combinations of the wall panels. Inside surfaces were covered with the infrared reflective wall paper with low emissivity characteristics to reduce the radiant component of heat transfer to the room. Sixty percent of the roof area was covered by flat-plate solar collectors. The remaining part which functions as a passive solar collector for the solar induced ventilation system, was painted matt black to absorb solar heat. The heat absorbed by this passive collector will dissipate by thermal convection and is mostly confined in the air plenum under the roof. The excess heat radiated from the plenum was intercepted by the polyurethane ceiling panels below. Ceiling were removable and supported by aluminum frames. This construction provides easy access to the solar induced ventilation air plenum above the ceiling and allows for different types of ceiling panels for testing purpose. The solar heat gains through roof were further reduced to a minimum by providing ventilation to the space between the roof and the ceiling through the eave under the roof overhangs.
Sun-Shading D•~ices
To avoid sun penetration through the windows into the living spaces, the solar geometry at Singapore was studied for the proper design of sunshades. The computer program called 'SOLPRO' was used to compute the solar eye views of the Experimental House and analyze the design of the sunshading and solar induced ventilation chimney. The design was later verified by heliodon using a 1:50 scale model. :
- 3 -

.·
Passive Cooling Systeas
The passive cooling methods which shows potential in enhancing comfort in hot-humid climate were incorporated in the Experimental House to achieve the internal thermal comfort. These passive cooling systems were designed as integral parts of the house. The systems to be discussed are as follows:
1. Solar induced ventilation: A solar induced ventilation system was incorporated into the walls and the roof of the living/dining room. The black corrugated steel roof of 8.40 Sq.m surface area functioned as a passive solar collector. An air plenum under the roof is connected to the floor level air inlets via two GRC air ducts at the south side and central living room walls. There were 5 floor inlets with a total opening area of 1.28 Sq.m.Each inlet was fitted with an control vane which can be adjusted to control the air flow patterns inside the house.
2. Venturi effect ventilation: Two venturi effect ventilation systems were incorporated as follows: The first system, which functioned on the pressure differential principle, was integrated into the west window of the living/dining room. Couple with the two horizontally sliding insulating shutters the window sashes were also function as aerodynamic vanes for the venturi effect ventilation. By arranging the positions of window sashes in relation to the external shutters, the venturi shape could be formed to create a negative pressure zone which would induced better ventilation. The second system was incorporated into the top of the solar induced ventilation chimney. By designing the chimney in a triangular shape roof fin with its slope facing the windward side to deflect the prevailing wind upwards, thus creating a low pressure area behind the chimney outlet, drawing out the air inside the house through the chimney. This system supplements the solar induced ventilation system in windy conditions.
2. Radiant and evaporative cooling: This cooling system were designed to incorporate into the roof of the bedroom. The roof pond was located directly above the sleeping area. A galvanized steel tray was used to give better thermal transfer with the sleeping space underneath. This galvanized steel roof pond was designed as an open pond to collect rain water which is abundant in Singapore. The depth of water in the roof pond is 300 mm and can be drained or refilled to vary the thermal mass and alter the 'thermal time lag' of the pond, hence, · _ acting as 'dynamic thermal mass'. The pond can be filled with cooler· ' · water from outside sources for extra cooling. Its thermal characteristic was controlled by adjusting three rotatable insulated vanes. To increase the evaporative cooling action, the prevailinq wind was directed upwards to pass over the pond by a wind deflector. Water in the roof pond was cooled by 3 processes:convection, radiation and evaporation.
3. J?ynaaic thermal aass: The dynamic thermal mass for the bedroom was combined with the radiant cooling system which utilized rain water in the roof pond. Because of its high thermal capacity (4.4 times greater· · than that of concrete) and the ease of varying th~ mass by· simply draining or filling, water was chosen as the thermal mass.
- 4 -
..

r-·
I .. · .··~:,.~- .
.... : .. · .. ·
( '. · ..
4. The ground contact heat •ink: This system utilized the cooler and more stable underground temperature for cooling purposes. The bedroom was buried deep into the earth to the window sill level. The earth that covers the bedroom walls protect the walls from solar radiation and provide more contact surface area to optimize heat transfer between the bedroom wall,floor and the surrounding earth. The sleeping platform and walls in contact with the earth act as a large heat sink and loose heat to the surrounding sub soil. Normally the cooling effect of the mass is rarely noticeable and the difference between the earth temperature and ambient air is not sufficient to cool the room or the inhabitant. By utilizing the conductive heat transfer process utilizing direct contact between the occupant's body and the heat sink, the efficiency of this cooling system is greatly increased. This method of heat transfer would be best suited for a bedroom. The concrete mass is used as a bed. A water mattress (water bed) placed on top of this platform would provide a direct thermal linkage between the occupant's body, the concrete mass and the earth. This passive cooling system meets the needs and lifestyle of the Singaporean rather well as the air-conditioning in the residential sector was used mainly in bedrooms during sleep. The design of the Low-Energy House, appraisal of the passive cooling system performance and the temperature profiles, will be presented in colour slides during the conference.
References (1) Sujarittanonta, s., The Possibilities of Low-Energy Dwelling For
Singapore. Ph.D Thesis, Singapore (1986) (2) Lim, .B.P., Rao, K.R. & Sujarittanonta, s., Limitation and Prospects
of Solar Energy Utilization in an Urban Area of the Hot Humid Zone, Seminar paper, Bangkok, Thailand. (1979)
- 5 -

r
[ ·: ; .:.
~ . •'
c.:
III 20
SOME PROBLEI:IS OF FUNCTIONING OF CE!-J'TR_i1L HEATING SYS·!'EMS IN CiiSE OF EXTREl·!iE OUTDOOR TEMPER_.'.:,.TURE
-~E s·~RJ1C':'
Jc5zsef Vajda 7-echnical College "Pollack Mih.8.~ 11
7624 F~cs, Boszorkiny St. 2. FurHGARY
Outdoor temperature, when being lower than the standard according to which heating systems are calibrated, may call forth the sinking of the indoor temperature of heated rooms under the prescribed value. In the dissertation the author anal;yses this temperature drop and in case of sectional radiator gives numerical example on · the changing of the temperature of the returning heating water and the indoor temperature, furthermore on the required spare capacity of the boiler. He examines even the danger of moisture condensing and moulding in function of the changing of the outdoox and indoor state of air.
INTRODUCTION
In the southern zone of Rungary central heating systems are calibrated for -ll°C /262 K/ outdoor temperature according to the National Standard /1/. Considering the meteorological data of on~ the last few decades we learn that even much colder days occur - through rarely but with certainty we · may expect similar also in the future. To.what point will the indoor temperature of our room in this case decrease and will the mould appear_ on the wall are immediatelJ .two important questions brought up. It is the examination of the set bf eouations - the heat loss of the room / the radiator's dissi~atiori of heat· / the cooling of the heating water - what gives the answer.
?ROCEDURE · ~ '
.,, .. -, ..
According to Zold /2/ the heat loss of the heated room . is. a random variable that isn't nronortional with the outdoor ' temperature because of other factors as the indoor trans- -·-' mission energy-stream, radiafion heat-gain, · the indoor thermal load and the fluctuation of the stored heat, indepen- . dent of the outdoor temperature, influencing the hea~- loss L : 9f the room.· To expre~s sharply the cooling of the room in , . function of the outdoor temperature-drop, however, -we will ~ examine only the effect of . the outdoor transmission energy- · stream and : the infiltration he.at . requirement changing what_ - ·
' " ~ ' I ., • - J • . • • ~ ~··
- ••.. , v ....... '"' v ,.. """' •.•• . .. . • - .. - • - - - - •.. - -

, . :,
:·
,.
can be taken in direkt ratio to the indoor and outdoor ternnerature difference. in compliance with the above-mentioned· know set of equatibns of the heat loss of the room, the radiator's dissipation of heat and the cooling of the heating wat~r, as compared to the dimensioning standard state:
i e - m K / t . - t I t t )+F Ko/t io-t eo/ - tmo =
m c /tf -tb I ffioco/tfo-tbo/
/1/
If we examine the set of equations, it is apparent that the cooling of the room can be restricted through the increasing of the mass flow of the heating water. Supposing that K=~ and c=~ and initating the followine relation:
tfo-ti · '
ln b.tm tf -tb tbo-ti
.. . /2/ = t t . tf -ti A tmo fo- bo
ln tb ':"ti -
the onlJ way to solve the explicit set of equations /1/ i s the use of the following transformation after ~oln~~ . /J/:
tf - tb =At
t f - t : =iY. .· _:. ··~·: . . . i _f ~,:: - 0 ~ :...:
•• • .J
tb "q... "• ·'··"' . . • . . 7 .
ti = v f .. :-,,At < ~ -~ · - ...
Lo: , '°'
r • - -
-. ... ..,. ~ . -·· . - . ---
. -- ~
.. ' ...
·-~· ... .. , , . ... ... 3 L: '~··. :-_-:
... . 1-l .-~ · . ' . ·- . - - ..
·,·1e solved ·the ·:."equ.ation· set /1/ for ·:·tv~-_o ;auie·r.e.nt. ~-c-a;es .. _:<"~ /Ifl=mo · -and m=l,'2' mo/ ·what means 'that ... ~_e calculated .tlie -value of ti~ and t., in' "case 'of the .outdoo'r ·t.emp'erature :.lowered . un-.. der· tee> =-~l ·~ ; : In :both. cases we :calc.u_lated with t;~~=2a:~c, ~-~ tf =t40 =9o C and t.,0 =_70 C end with :the value .of M=o ,JJ what . means the use o:f the heat transfer exponent ·of ·a ·-sect'ional ra.diator. The condition m=m. applicated in the first case means that : in case of the sinking of the outdoor temperature doesn't occur hidraulicsl intervention in:to the heating system •. -. ., ... • ~ccording to the m=l,2 m. condition p f the second .. caife: we' - . can· increase :the·: mass ·flow_ .of. the .. heating water .. rtith. ·20 :-.'percent ·what's. generellJ r ·ealisable _~through : changing_ up· ~the ·:· . heating circul~tion , pump . to a h1gher , .~ tage an~/or .~~~ing". a . ., .
. ~ - ' ... ·--· . _:· ... -· . . . - -.- .. .. ... "' ... ..... .... "' • . ,, . ..:_ ... _ .. _ •• ,_ · · . ·~.1•- '4 -·-· spare···pump. · ~ .. _ ... ~ .... .. . , .. ... .. . .. : . .. . ·~ . _ ........ .: . ... ,,. . . The 9urves ta.=f/te / _·and tr =f/te / .J'{._hich ·are . _approxim~ }.iv~ . linear and valid .for both the above~mentioned . ¢2ses are: i:irese:nted . on :f.ig·; _).·~-:.· and Fig.· 2. Ba s'ea : upon Fig. 2., . it 'oan · be laid ·down as a ~ fa~t that e~g. if -~he . outdoor . temperature · is . ~.= ~15 ·c ·-then·~"in· : ·case" ·af rh=rh. "the · t~mperature ·of the' room _ _.

r· I
I•::•: .. ~ I·;·:·.,.
l
lJ
L
... \. : . .. · ..
t;_::: ... .L .··
I
tb I .9. c·1.) (DC) Go
73 1,09
1,08
12 l 1.01
~ ,_ --- ....... .-.:.:----------- --...... t
' . b -
' 1,06 JI
71 i 1,05
1,04
70 ! 1,03
1,02
69 i 1,01
-16 -15
' ' Q "'<1i°"o , . ~
.........
-14 -13 -12 . ... -11
m•1,_2 mo m. mo
te c•c)
FIGURE 1. The characteristic curves of the returnin[. watertemperature and the spare capacity of the boiler in functi-on of the ~utdoor temperature ,.
t1
c•c > .. . '~~ -·
' · .. · ..
.. ,.. ... ./ 20 + . - - . .. ,.,. ,. ~ ' <· . / ~
. .. · ~ ., . . ~;;~~: ~~~~~ '.~· -~~~. ,;~/ . . ;· __ ·_ - ~-~ .:_: .... :·1
• l' - • - .... ·~ • . ./. 19 + :=.. ·.-. . <".. . J ,.;· : """ • :z. ":' ~.,-.
-,, ~"~~~:,;~~~;:/ ~'" ~~- ;~t:~,t~Y~_f L:_,;;1~2~" .. 17 -.... ;..:. ·..:..··:.;. --- J(7~~···1·~~~:'·:.~~:.~::~ ~ _;~~=~·-~.; ::~! ~~~·c: · '• ~~.:~
: ~:;.: _ ... Yj .:4~l C~· ) ··: -~_'.:rrt.- . - :-...:.: -: = !) ~ -~ ·~ _; ~-~-
"."16. - 15 -14 -13 -12 -11 te (DC)
. ~ '
... ~ ~ .. ~ ·: ,,. ~= .; : ·1r~· ~:1 - :.:::<- ; .. : :.: :r r -~ ·: ·.; :~:r-(·~·.s~·r : :~.-.::· :.~·'3r£~c· -~-,-~; :...;,, -~~ .. ~-::.: 1 :.. ··- ; .. '
FIGURE 2 .. ... ·The· ·changing of 1 the indoor temperature in .funct i on .. of ~he .. <?u t°q~or . . ~emp.era~ure .. -."?: "·~.'!·.· :·;1?,.;Q~.:i:oY. ~ai;Z;: ;,~,~~'. ~-·~. -... : =- ·~ .. 1 ~ .-:': ·"' -· ·~ ··~rr~~ t~ .. -, ..,:: ~ ... ~(t · :. :· ~;: :. ·:-'J J -~ ~.: ·. ::::•::~-.: :.:·) ...... ~·· ?· .:.. :: .. -~ ··: 1o -__ :.~ ~ I::· :.~~o''\ ~:-~ ! ~ :~.~··i,11(, -~_;1 ~,1:-\ ,\;_: · ; '•. "~II-;" • • : : ·: - ·~·- ~ '",...~::~r-• .-.. : • .. .: fr.~ ~·'·:~ :,. 0
''"'
w1ll·~f'3ll~from,:2.o :C. -•to ;17,.5 c, :in -:case_: of -m=l,2 m.only .. to 18,2 ~C ;.~so ::_t_ll:r:C>Ugh.;:the .desc:ribed ,,_hidrauliQal inte:t:Y_e~tion we are eble to mode:rate .the decrease .of. the .indoor 1tempe:ra-ture. "- · · .-. ·· · · · .. · ..... · ~ · ·--- · · ·· Of course to execute this method we must own spare boile:r capacity, in compliance with the grown heat loss of the
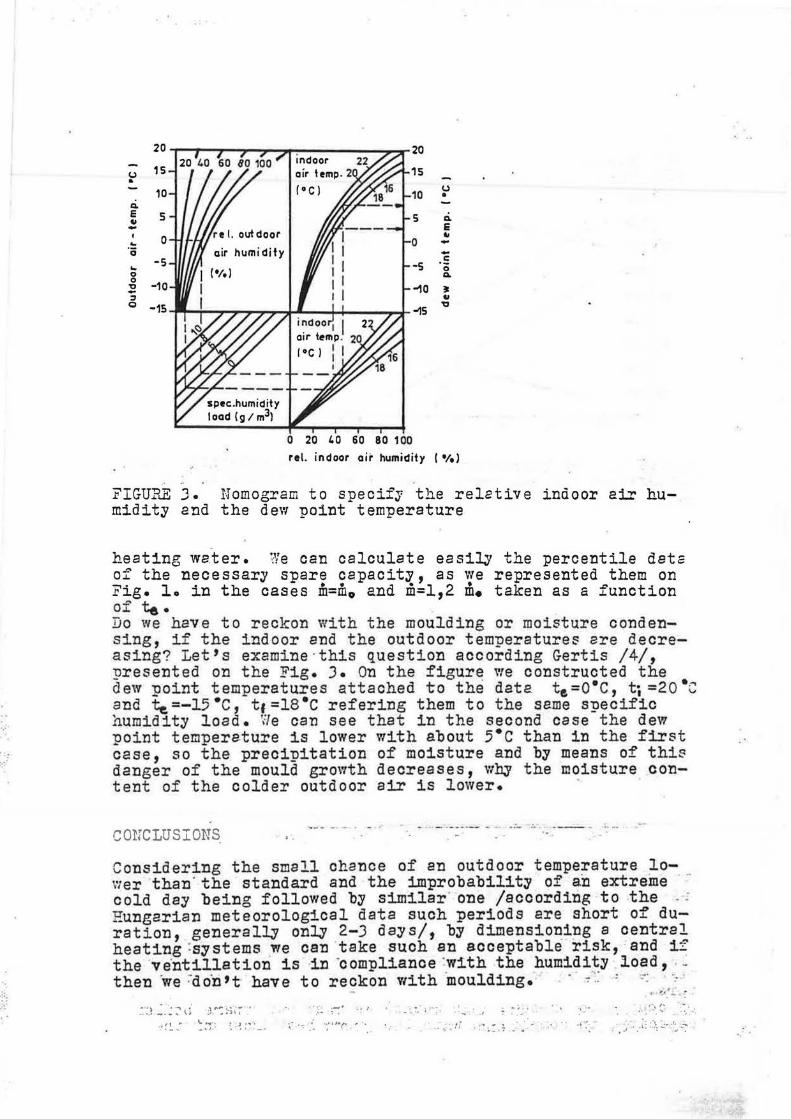
:-:·
~ :~·:=: . ;~
20 20
15 20 40 60 80 100
<..> is •
10 10 u •
Q. -e s 5 Q. " .. E
' 0 "' ... 0 .. ·s ..
-s -s ·= ... 0 0 Q. 0
-10 ~ -10 ~ ~ " Q -1s ~5
'a
0 20 40 60 80 100
rel. indoor air humidity ( •/.)
FIGURE J. Nomogram to specify the relative indoor air humidity and the dew point temperature
heating water. We can calculate easilJ.r the percentile data of the necessary spare capacity, as we represented them on Fig. lo in the cases m=m 9 and m=l,2 m. taken as a function of te. Do we have to reckon with the moulding or moisture condensing, if the indoor and the outdoor temperatures are decreasing? Let's examine · this question according Gertis /4/, ~resented on the Fig. J. On the figure we constructed the dew point temperatures attached to the data t~=o•c, ti =2o•c and te.=-15•c, t1=1s•c refering them to the same specific humidity load. 'ile can see that in the second case the dew point tempere.ture is lower with about 5•c than in the first case, so the precipitation of moisture and by means of thi~ danger of the mould growth decreases, why the moisture content of the colder outdoor air is lower.
cmrcLUSIONS.
Considering the small chance of en outdoor temperature lov1er than · the standard and the improbability of an extreme cold dey being followed by similar· one /according to .the -Eungarian meteorological data such periods are short of duration, generalJ..3 only 2-J days/, by dimensioning a central heating :systems ~e can ·take such en acceptable risk, and if the ·ve·ntilletion is -in ·compliance :with the humidit3 l.oed, . ~ then ··we :·ao·n't have to reckon Vlith 'moulding.- · -: ·:: = -: ·: . ,, ,_ ..
::.? .:.~·:' \i ·:)"':~;,·;-- .. ·. ·-• _;I .. ... : ~ . - ~ 7, :- ·. ~ .J - ' .:._ : ' ~:~. ~~ :_~, · ...
.. ~~ .. ~ ~~~~· : .-~ :, ' - . ~- '--: : ·~•ll•r. . .. . : r ._ ,, ~: ; . • . ,; . • j .. •.• : :·.\ ::- -~~ -~

.·~:.· · =·
__ ,_,. 1TOL3:FCLL:'UR.E
...... :; .
'·.,··
(~''.
-r~ • -- . t : "" :
building-dependent characteristic temperature overtemnerature
Ll : he2t tr~nsfer ex~onent m : mass flow of the-heat carrier agent ~ : specific heat of the heat carrier agent ~ : boiler capacit~
Indexes:
0 . standard dimensioning stage . e . environmental . i . indoor . f : forward b . backward . m : mean
REFERENCES
/1/ KSZ-04 140/J-87 tpUletek ~s eplilethatirol6 szerkezetek hotechnikai szamitasai. Flitesi hoszliksegletszamitas. /Fiungarical National Standard/
/2/ Z~ld, A., Determination of Design Heat Load Data. lOt~ Conference on Heating, Ventilating and ~ir Conditioning, Budapest /1984/ 517-528.
/J/ };; olnar, z.-Csokeyai, I., FUt otest hoteljesitmeny jellege a hohordozo tomegaram-valtozasanak fliggvenyeben. ~puletgepeszet, iQCIX. /1980/ 4. .
/4/ Erhorn, H.-Gertis, K., Mindestwarrneschutz oder/und !.f::indestluftwechsel. Gesundheits-Ingenieur 107 /1986/ 1. 12-14, 71-76 •

r r-
r.
··.·
c:·'·
III 21
BUILDING-PHYSICAL ASPECTS OF THE V.R.O.M. BUILDING'S ATRIA.
1. INTRODUCTION
Ir. P.H. Yapenaar Adviesbureau Peutz & Associes BV
The Hague, the Netherlands.
The design by the architect Jan Hoogstad of the new V.R.O.M. Ministry (Dutch Ministry of Housing, Physical Planning and the Environment) in The Hague, which is currently under construction, is characterised by a double comb structure, where the spaces between the "teeth" of the comb are covered with glass in such a way that eight atria are created (see Figure 1). As a result, virtually all the office rooms in the building will look out on to these atria, and only indirectly through these atria to the outside surrounding area. These atria will serve as a natural buffer for the building walls, so that the external climate, which from a townplanning-physical point of view has rather unfavourable effects, will affect the internal climate to a lesser degree. This mainly concerns strong winds and FIGllllE l. Combseruc.oire VROK-building vith a acria
traffic noise which, at this par-· ticular location, are such that the programme of requirements, stating that the building should be fitted with functionally openable windows, are difficult to fulfil. The following report will, in particular, discuss the way in which the intermediate/buffer climate · in the atria is created, and the various building-physical effects of this climate on the atria and on the off ice rooms adjoining the atria. A distinction can basically be made between two relevant climate periods:
1. the winter period; efforts are· being made to make maximum use of .. the solar energy which enters the building by integrating the atria ~n the installation design of the building as a whole. As a result~·/. the···' climate in the aria during working hours will not fall below 10-12 •c. In the event of extremely low external air temperatures, the risk of surface condensation on the ·glass external walls, which obst.ru~ts· : the view, must be kept to a minimum. / .·u
,.:;
2. the summer period; when the excess solar energy entering. the atria should be effecti~ely removed.
RANK XEROX COMMUN/CATIE SERVICE
.,
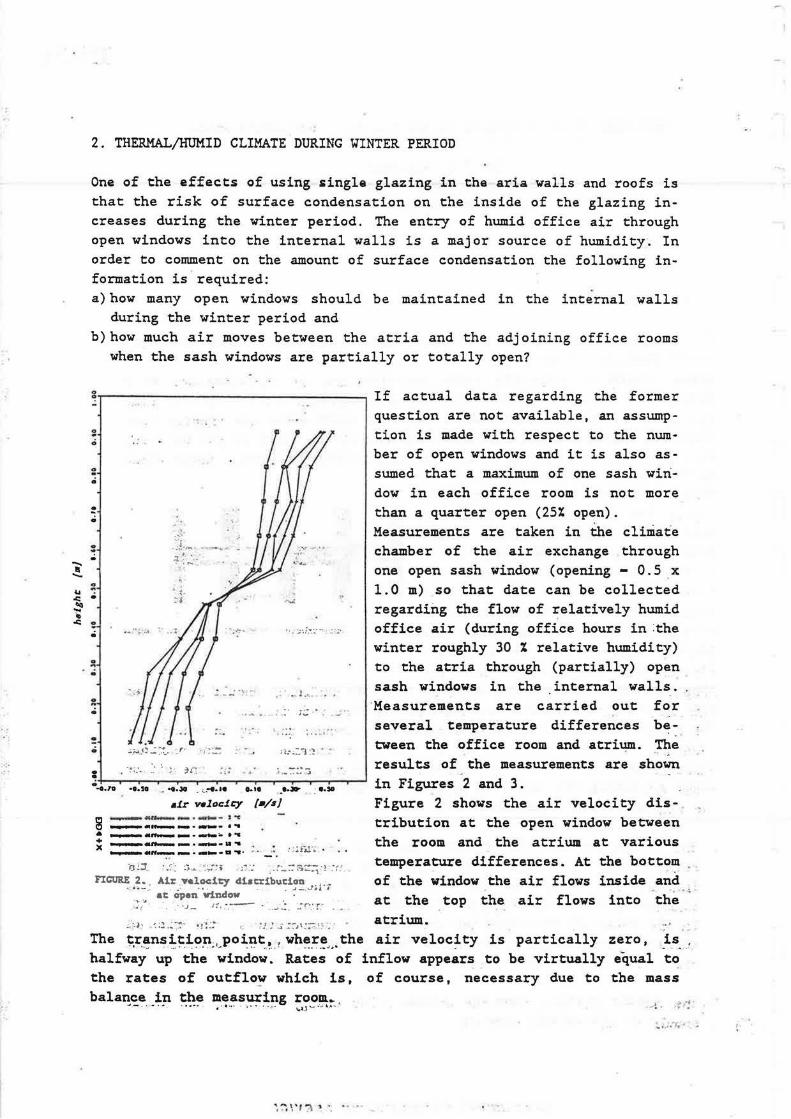
-.. l!I ..._
.. ~ ~ .. ~
2. THERMAL/HUMID CLIMATE DURING WINTER PERIOD
One of the effects of using single glazing in the aria walls and roofs is that the risk of surface condensation on the inside of the glazing increases during the winter period. The entry of humid office air through open windows into the internal walls is a major source of humidity. In order to comment on the amount of surface condensation the following information is . required: a) how many open windows should be maintained in the internal walls
during the winter period and b)how much air moves between the atria and the adjoining office rooms
when the sash windows are partially or totally open?
g -
:: 0
:: . ! 0
.J.·
: . .. ~:.~·p-. · ;,r:·~ ·• _:4
.. ft • :;-J -!.
• · - ,-1 ;..~~'~ .. ~·7 .. . -·'·-~ ,:.:.:·
it • ... · -· - ~,.., __ ! _ .. .
" • ..... . .. '~ -
. • ··j:--= .;._~.J~ ...: ~~-- r· - , ;i:-;;:-}"J ~~ . ..
. '!
·~::. ; ·. ~c . _ ... ....
_..: .... ...... .., •-0 .. 10 -o.sa . -o.JO . '--·--·•• 0.10 _.... . ..•
•ir v.locit:y {•/sj l:J ~.,........-- . -t- - l '"I: 0 ~ .. .._ .... _.... .... a -.-- .. ...._. __ ....._,_ t-c
+ x ..,.._......_ - •_._.II ..
......-,,..n_..., ... ._.a-.· · ·· _ . : .:;fi,l."·; •
iJ ::r . . . -...... -.:.···---..... ,. ..... •':""' .. _. t·_ ~a-=:-;.:~ :: :· FIGURE 2., Air velocity dbtribuciou •. , ..•
···•-" at cipen"Yindov · · ~--~" ' .:;·;'~. . ·J_ it,.-_-- ___ ·:.:_ -.:i:-~.~r~ .
If actual data regarding the former question are not available, an assumption is made with respect to the number of open windows and it is also assumed that a maximum of one sash window in each office room is not more than a quarter open (25% open). Measurements are taken in the cliniat·e chamber of the air exchange through one open sash window (opening - 0.5 _x 1.0 m) so that date can be collected regarding the flow of ~elatively humid office air (during office hours in :the winter roughly 30 % relative humidity) to the atria through (partially) open sash windows in the . internal walls ..
"Measurements are carried out for several temperature differences be~
tween the office room and atrit.µn. The . . results of the measurements are shown in Figures 2 and 3. Figure 2 shows the air velocity dis - . tribution at the open window between the room and the atrium at various temperature differences. At the bottom of the window the air flows inside and at the top the air flows into ·the -"
_ .-~. 1 ., ~;::.~~- ~f::: ~ . .r: . .i :-:~i::.~:-~_·;- atrium. The ~rans ition, point. , where the air velocity is partically zero, is • •-..... ..,·· -· .... __. • '- .•.. - .•• _..,,,,.i. .
halfway up the window. Rates of inflow appears to be virtually equal to the rates of outflo~ which is, of course, necessary due to the mass balance in the measuring room.,
_., - . ' - • .. . • --· •. ···- -••• ' ..• • \,ol_, .._, .·, ..... ~ ...-! • -? .. !
...... .. ...... ' .- ~ ·
". '"'i , .. , ~ ~ • • H

'<'.;:·
1 ··
' , . ..
t:".:···
(~::
t. ........
Figure 3 shows the rates determined in this way, depending on the temper~ture difference between the room and atrium. It is apparent form the pattern ~f the measuring points that, from a mathematical point of view, the rate is virtually proportional to the root of the temperature difference between the office room and atrium.
. !
I ..... I ~-
"'11 I .._ !
:ii t
~ I ., I :J ;
~: ... i
I !
• ~
I I
........ ~·-~·· ..
• " .. 'l)A'"
"di.. lfP
". - k:fs· ...;;.~~ . II o1t:b9 e . ~.- a
r -~ e .. e"-• ..... , Ill
•• ?..~
~oa• . . . . . . ........
•• I ,. .. •
'1
l. t' •
·~
. "'
~- . . .. .... J,• t.,.. a.... a.- , __ I • . !. .... I,.,.. II . .. I f t ... ; .. • .. I .. ... ' '°"'"';;'~'~••• teaperatuurdJ.ff11rence roo111 - •trJ.ua r CJ
FIGURE 3. Air exchange through an open window depending the .... ,, - .. --...... ...----.... temperature difference between room and atri1.111.
-It has been de~fd;d~to'" f~;d.:-~~~ -f;_es~_-_afr -n~c~~s-~cy···f_o_~---~!ie" oJ"_~~ce block via the atria 'to''the ~air-conditioning chambers -to -limit -the ---risk of surface condensation as a result of the above mentioned ,entry of .humid office air into the atria, and to limit the moisture production of the greenery '" in the atria~ If this air is . first· pre-heated using ·:that· heat recovered':from the "dfscharged office · air;· the atria will not become too cold and a rela~ively:-suiall amount of energy is necessary to be :able to guarantee a part:icular minimum temperature in the- atria: : ;'::1!}j-:;-::~:·';!.:; ~:. ~ " 6
· ·
The effect of using the·:atria in this way as suction plenums: is ·twofold: a) to ·increase ·'the ·:afr temperature 1 in ' the atria which 'will ·cause · an increase :' in the·~·inner :surface ·temperature-. -·of ·the atrium ·walls °and roofs and ··
b) so:·that the1
flow of relatively dry 'fresh :air makes the precipitation temperature of ·the ·atrium -~ir decrease: ·,; _i,~,; ;-:1;}1: '1'.f '':;-;~ ~i': :;:': -:: ;_;_,.;
The combined·-result '·of these two effects is that· the number of' condensation hours -is estimated at a maximum 'of ·approximately. lO'if the~atrium has the assumed number~of·'open-:-windows 'and ·1e:1s '.an '· average . winter,"
which, for the time being, is considered acceptable.
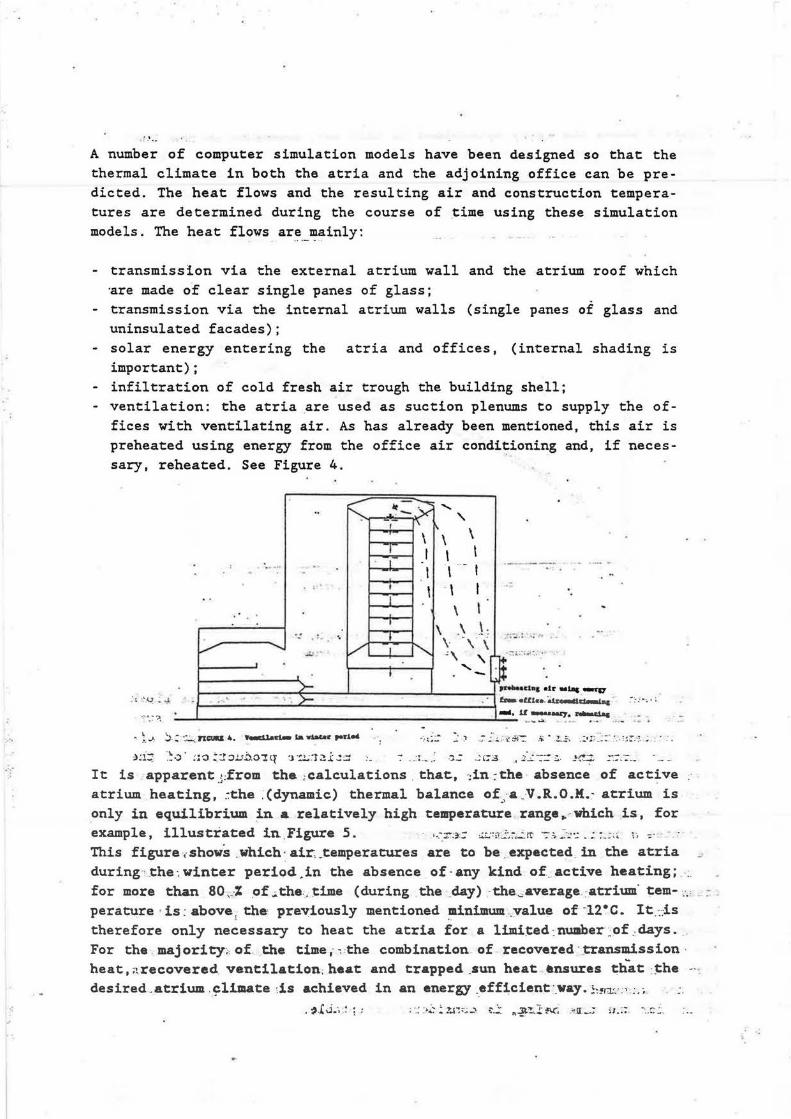
.-··
~···
·:
A number of computer simulation models have been designed so that the thermal climate in both the atria and the adjoining office can be predicted. The beat flows and the resulting air and construction temperatures are determined during the course of .time using these simulation
models. The beat flows ar~.-~ainly:
- transmission via the external atrium wall and the atrium roof which ·are made of clear single panes of glass;
- transmission via the internal atrium walls (single panes of glass and uninsulated facades); solar energy entering the atria and offices, (internal shading is important); infiltration of cold fresh air trough the building shell; ventilation: the atria ~re used as suction plenums to supply the offices with ventilating air. As has already been mentioned, this air is preheated using energy from the office air conditioning and, if necessary, reheated. See Figure 4.
.....
' \ \ \ I I I I I - I I -I I
\ I
\ \ \ . \- .,. \ :;:.. .: .. . ,
,,£; "\ ,.21 :';L;,:r~:; •· : ··
>:.·•_:"';
,_cles •Ir •ill& ~
11--_-_,- .. -~-~- "."", -. ~s------1.·----:--.... •---71\ i-,.u1 ... au--.. -. · · · . -. u-8&17.~ :.....--1----------:----"'-:-- __ ..._ . ·- ·- ···- ·- .
. t ~.~ ~ ..J.
• ~- ... , j . ~ -~ nc:uu "· l'..U.- la -r ,.r1• - .. ::=- :: :'t -; ~ .;. ;. ~8i--= .;:. • z_;~ .:•:? ~~:~ : .. ~.~: .. ;:. ,,
:>~i~. ·. ~·~· ~:-:.~_:r:'l.!..~ilo:tq :i·.:!.,;:1~..i:..!::= :· ~ 7 .:L_,~ .~.; . .:4;3 , .~.:.:. --::::,. . }.~~- :;:.--:.__
It is apparent .i:from the. ;calculations _ that, -~in : the absence of act~ve atrium heating, .:the . (dynamic) thermal balance of~;a _V .R.O.M.~ atrium is only in equilibrium in a relatively high temperature range~ · which is, for
example, illustrated in .Figure 5. . . .-_-::;,:: ~:.;:;.J::-• ...".rt' ·-:-_,,;-:.. .. .:.::_:, , 1. -= ·•
This figure.- shows _which · air:. _temperatures are to be . expected_ in the atria ~
during· the: winter period .in the absence of · any kind of_ active heating; .. for more than 80 "-% of ,.the:, time (during the _day) -the"'average ~atrium- tem- _,, -perature , is: above
1 the· previously mentioned ~inimum ._value of -ire. It::-.is
therefore only necessary to heat the atria for a limited : number· ~ of _,days. _ For the majority; of the time1 ~the combination of recovered ·_transmission· heat, ;1recovered. ventilation; heat and trapped _sun heat •nsures th'"a.t :the desired.atrium .~limate :is achieved in an energy _efficient·_way. ~~~ra::•.' :.~
. , .!J.; : ; ' ; .:.)~':"~?.r~ ~..:-~ ~.:. f\~~1Ni· ~ 11_; ~1.:; .... c .: ..

(;·.
... c :',.
In order to assess the total energy consumption of the building with respect to heating, a comparison has been made with a reference building which has a well-insulated building shell and the same comb structure, but no atria. Figure 6 illustrated the proportion of energy consumed for heating compared with the energy consumed to heat the reference building for each minimum temperature to be maintained in the atria. It is apparent that, for example, ·when the minimum atrium air temperature is 12°C, only 82 % of the reference building's heating energy is consumed.
{
. : . : : .; .... ~ ..
c: • .. . .... .;
. ,
;. Pi I
l: or1•nC.cJ.on •t.r1,,_ ,1oueh I·
I ~ 2: orJ•nc~cJ.on •U1um north
I _,
I l · ... . i·.: ~;·.~
,.,
0 0
~.-~~~~~~~~~~~~~-
....
.. 0
.... 0
.. 0 .. -!: -.. .. 0 ~ <> 0 •
'5 g ~ -~ ...
.
· • ·1
-----------------.• :r
... -.. I •-"'!"-•• . ~· J ~ .. 0 .. 0 ~ "' .. 0 ... .. ..
~-~'),_ . ~: ... .; . ·... . ~ I 0 . .., ~ :: ~ 0 ~
%
. .. ~
! , ..
ncuu ~.
, ...
Q .. ... 0 • 0 ... .. 0 .. -::
··--··· . .
i/ '.
' . I I l - ! : . 7.00 ·- ·r - · - ;._ •
t.Oo - - ti-.oo- : 1J.oa .... . .... u ... . .... ..... ···- Jl.M ......._ , . e..,,.r•tur• 111 •al-MJr~••per•ruz-• Jn ~U1,_ re/ ,·' --- ~ , .. . _; · .......... ;
> - - ·- - ----J I •' ·'I .
1s.aa
.. . IHulta of C•llJl<lraeue• ""rabooc. 1n villce~pez:~--~~ ~:.....S....z:u ."-"!.'8...,cio_~~!~ .r••p•cC.!"" __ d>e raference building
- - --- - ---- ·- _clependin1.-.l:be •1nimm 1:Uipe1:&1:L11:• 1n 1:11• aa:i.a.
In the laboratory, temperatures and air· veloc'itie's·..-are·"measured in a scale model of an atrium. Efforts have been made to find an ideal way of propelling' the ,;,entilating·· air into.- the atrium ·so" that·: there '"is good temperature distribution·,i.·.-:-and: that downdraught·:&nd-~ surface :·condensati.on-·on "
the atrium.Walls''and roof are·'restricted as much· as~possible'.- ·:.-L•.r -~::;;-: 1 .:~· '..
Tests have shown that the most uniform temperature ·distribution-. is :·· ;~· achieved =·if 'all·'.'the ventilating· ~air is ·propelled '.:into the- atrium· at ·
'd 1 -1 • r ~.· i ~ .. ~.- 'I,. .~.: ·-.-.., • !•r. '6\ .. .-. "' .. t ~I':\. . ';-..., !.. · ... i"'f J .. ·~r ·, ., . groun .·eve . . (,S .• >:l.:::. :J."" --1 ·'L . ,._.\.'l .--. '"a!H ....... ,_ • .r~u 9r_, .. i •. , , .r ... ~ ........ ~,.-
At low-··extern~l: temperatures the air flow-: into the ·.atrium -is -:·mainly characterised by a cold downdraught along the ·external:.•atrium:wall '·(1.5 m/s) and a slight updraught along the internal walls. The air velocity at ground level in the atrium reached a maximum of approx. 0.5 m/s, which is totally acceptable for a traffic zone.

..
The surface temperature of the model's external wall appeared to be lower than that of the roof. If condensation is form~d, this first occurs on the wall and not on the roof surface where it rolls off.
3. THERMAL CLIMATE DURING SUMMER PERIOD
During the s1lmmer period the solar energy, which enters trough the glass roof and external walls, should be effectively removed so that the climate is comfortable and not too hot. Clear glass was chosen to allow more daylight into the building and ensure a better view from the offices. Natural ventilation, based on the principle of thermal draught, appears to be an adequate way of controlling the climate in the building. For this purpose, ventilation openings, which can be closed, are made in the external atrium walls and the roof (figure 7) . The fresh air flows in through wall openings near the floor (south atrium 50 m2 , north atrium 25 m2), it is then warmed slightly and will therefore immediately rise. The ventilating -air then -leaves ·the atrium through the openings in the roof (approx. 220 m2). Dynamic computer simulation calculations have also been carried out in order to predict the therma_l climate in the atria during the summer period.
-- . ~·· , .. r'...... I A\ \ I
I \ . \
+ ~·~ ... .
I I I I . I j \. I
- ' • I \ \ I ---· I - -- - - - \ I
• .J .: j - - · -----· ; \ _..\. _! _ -
.• . /' ....., • , . -· -. / I '-.... \ · \ \ • _,,..., ~ •• "JO. ••. - ,,_., \ 'fl_.
' ""' ' I -1".';1' ' •l 1--.- .-.-.-.. - .-,-"- .""-)- .,. "' ·
,, .. . )- .
.. ·' .... . ·;. : ~ • • :• .""I ...
!1.JSi :_·:::1 ,..,"'""'-~' io.t&, .1~.. ·~", •.. ,..,..,, '.t ,,, :~: • .1;"' ...
; ~.a tl1' ..
nGUU 1. •ouc•l -il•U-. '" •au 111 -r·pui..t .;. ,._J ..... ..... . :-.. : 'r";'::· - '-',_. ~ · = .: . ... - !:.",
:: --: '"G.1'1 :~,0; :I.C . ~:-r..:: ·~ .:~ ) :. _.. • .!;:.; .:. -: ~~ ; •1 ~··· :." .J '·, .r'
It is appare~t _from Figure· 8 that the air temperature near the floor : in the atrium is _ approx~·- ::1:.:~C. higher than .the air temperature- .outside. The difference near the _.roof ;in, the atrium is approx. : 2-J•c between. the. _in-•. ternal~and extemaL::temperatures. -~ :...: :.; :;·.:,'"' ::.'. ::-. :i::J :-:•4•} :·;; ~''M
Measurements : taken in.~he laboratory scale. model .have confirmed.these calculations, and the air flow was also monitored more closely. The· air· .. flow ~S7.characterised.byia constant updraught (approx.-)0.20 11/sLthrough the entire :atrium .cross~section. _· · •. · -~uc;.:-:·:,;,: · '.::, · ~ •> .; :. :<!' ..":-t:.::::·t:r; .
~:.:. r(::~:..)o..C~J'I ·:l:..l J:;!: .:._:~A~l . ' ~ .. . ·• JJ!.. - ~1 :~~JLJS~:..:-;q.:.; : ... ;j_; - ! U ..'r. :i~~ · .. -
.!.;_: (!~1 .. -:\.: ~ \ ;J :~ •• J .. ::C"..;{i:"!'..l • .:.. : . : ~· •. :-1: j :; .: i . : .. -.J~~ .!!.:t-Z: :.!- \d~ ;;:! ~.:,rt ""·~~:: ~':·~-~i -
.. -:. . ~~~.:~~== 3 ~ ·:: ·t 1~\ ... ;a.:~~~·::-.:::.~

r~
r
r
. ,
r:::.:.::
\)' . .......
~ ~ ~ .. g. .. ..
~ »
{J••,l•-' ·· 1 ........ ·~:----... '-;- ~ 30
:JO ~ • • ,...11.-1 ~ ..... ·"/ .•. , • , ..............
•-u--•• / \ •• . ·...... . ~
< ........ L-==----------'-----:7 ... . ' "··~ 20 20~~:__-~-~ ....
15 -- 15
:z 10 12 14 • 11 20 10 24 22 4 ,. .
ao1111mc [hour}
FICURE 8, CALCUL\TED TE'.MPERA'?URE 'PATTERN ON A VARM SUNNY DAY
IN A SOUTH ATRIUK
10
4. CONCLUSION
As is apparent from this paper, the design of the new V.R.O.M. Ministry with atria is acceptable from a townplanning-physical point of view. By constructing atria the programme of requirements, which states, that the windows should be functionally openable, can to a large· extent be fulfilled. Taking into ~ccount the traffic noise nuisance a~d wind on the new Ministry site in relation to the height of the building, the requirements would not or only just have been fulfilled if there were no atria. It should also be noted that atria, or any rooms with large glass surfaces in walls and/or roofs, should be judged in particular on their
c:·. building-physical qualities. These aspects should also be assessed early .•· · on in the design process so that building-physical can be avoided.
C .... ,,
:;: .·