Spatial effects in real networks: Measures, null models, and applications
Upload
independentCategory
view
0download
0
RESEARCH ARTICLE
Myc-Induced Liver Tumors in TransgenicZebrafish Can Regress in tp53 Null MutationLili Sun1, Anh Tuan Nguyen1¤, Jan M. Spitsbergen2, Zhiyuan Gong1*
1Department of Biological Sciences, National University of Singapore, Singapore, Singapore, 2Departmentof Microbiology and Marine and Freshwater Biomedical Sciences Center, Oregon State University, Corvallis,Oregon, United States of America
¤ Current address: Institute of Cell and Molecular Biology, Singapore, 138673, Singapore* [email protected]
AbstractHepatocellular carcinoma (HCC) is currently one of the top lethal cancers with an increasing
trend. Deregulation of MYC in HCC is frequently detected and always correlated with poor
prognosis. As the zebrafish genome contains two differentially expressed zebrafishmycorthologs,myca andmycb, it remains unclear about the oncogenicity of the two zebrafish
myc genes. In the present study, we developed two transgenic zebrafish lines to over-
expressmyca andmycb respectively in the liver using a mifepristone-inducible system and
found that both myc genes were oncogenic. Moreover, the transgenic expression ofmycain hepatocytes caused robust liver tumors with several distinct phenotypes of variable se-
verity. ~5% ofmyca transgenic fish developing multinodular HCC with cirrhosis after
8 months of inducedmyca expression. Apoptosis was also observed withmyca expression;introduction of homozygous tp53-/- mutation into themyca transgenic fish reduced apopto-
sis and accelerated tumor progression. The malignant status of hepatocytes was depen-
dent on continued expression ofmyca; withdrawal of the mifepristone inducer resulted in a
rapid regression of liver tumors, and the tumor regression occurred even in the tp53-/- muta-
tion background. Thus, our data demonstrated the robust oncogenicity of zebrafishmycaand the requirement of sustained Myc overexpression for maintenance of the liver tumor
phenotype in this transgenic model. Furthermore, tumor regression is independent of the
function of Tp53.
IntroductionHepatocellular carcinoma (HCC), malignancy of hepatocytes, is the most common primaryliver cancer in Central/Southeast Asia and sub-Saharan Africa [1]. As a deadly tumor with thetraits of late-stage diagnosis, poor therapeutic response and bleak prognosis, it is a research hotspot for oncologists and other scientists. In humans, HCC is associated with multiple risk fac-tors, such as hepatitis virus infection, aflatoxin, alcohol abuse, and non-alcoholic steatohepati-tis, which ultimately increase genome instability and transform hepatocytes into a neoplasticstate by cumulative mutations. Myc, a transcription factor which is estimated to regulate the
PLOSONE | DOI:10.1371/journal.pone.0117249 January 22, 2015 1 / 17
a11111
OPEN ACCESS
Citation: Sun L, Nguyen AT, Spitsbergen JM, Gong Z(2015) Myc-Induced Liver Tumors in TransgenicZebrafish Can Regress in tp53 Null Mutation. PLoSONE 10(1): e0117249. doi:10.1371/journal.pone.0117249
Academic Editor: Chun-Ming Wong, University ofHong Kong, HONG KONG
Received: August 21, 2014
Accepted: December 20, 2014
Published: January 22, 2015
Copyright: © 2015 Sun et al. This is an open accessarticle distributed under the terms of the CreativeCommons Attribution License, which permitsunrestricted use, distribution, and reproduction in anymedium, provided the original author and source arecredited.
Data Availability Statement: All relevant data arewithin the paper and its Supporting Information files.
Funding: This work was supported by a grant fromNational Medical Research Council of Singapore. Thefunder had no role in study design, data collectionand analysis, decision to publish, or preparation ofthe manuscript.
Competing Interests: Zhiyuan Gong is currently anacademic editor of PLoS ONE; this does not alter theauthors’ adherence to all the PLoS ONE policies onsharing data and materials.
expression of about 15% of cellular genes, is well known for its participation in many malignantconversions [2].MYC gene amplification has also been frequently detected in human HCCand is especially related to advanced HCC cases [3, 4].
To understand the fundamental mechanisms underlying cancer for developing effectivetherapies, it is important to investigate tumor biology in animal models [5]. The zebrafish(Danio rerio) has now emerged as a promising animal model for cancers because of its smallsize, high fertility, well developed experimental resources and tools, and low maintenance costs[6]. As vertebrate species, both zebrafish and human have many conserved anatomical struc-tures and homologous organs with similar physiological functions. Zebrafish can develop awide spectrum of tumors in almost every tissue, which greatly resemble human malignanciesin both histological characteristics and gene expression profiles [7–10]. Our previous study re-vealed that transgenic expression of mouseMyc in zebrafish lead to liver tumors [11] and an-other study also reported liver hyperplasia in medaka caused by transgenic expression of aquite divergent medaka myc gene [12]; however, so far no study has documented the oncoge-nicity of zebrafishmyc. Due to the whole genome duplication occurred during fish evolutionfollowing divergence of the teleost and tetrapod lineages, the zebrafish genome contains twomyc genes orthologous to humanMYC, i.e.myca andmycb [13]. In this study we generatedtwo zebrafish transgenic lines with induciblemyca andmycb expression, respectively, andfound that bothmyc paralogs were oncogenic in hepatocytes. Especially, overexpression ofmyca resulted in high grade HCC with histological traits similar to human HCC cases and in-troducing tp53 null mutation to the transgenic fish accelerated liver tumor progression. Fur-thermore, the tumor status was addicted to constant overexpression ofmyca and suppressionof transgenicmyca expression by removal of the chemical inducer resulted in rapid tumor re-gression even in the tp53-/- background.
Results
Bothmyca andmycb are oncogenicTo investigate the oncogenicity of the two zebrafishmyc paralogs, two effector transgenic zeb-rafish lines carrying GFP fusedmyca andmycb, respectively, were generated. They were thencrossed with the liver-driver line [14] to obtain two double transgenic lines, named mycAGand mycBG respectively for GFP fused myca and mycb. The constructs used for these trans-genic lines are illustrated in S1 Fig. and the transgenic system has been described previously forliver-specifically inducible krasv12 expression [14] based on the mifepristone inducible LexPRsystem [15].
To examine the effects of myc gene expression, mycAG and mycBG fish were induced withmifepristone of different concentrations from 1 month postfertilization (mpf) and sacrificed at2 month post-induction (mpi) or 3 mpf. The expression of transgenicmycAG andmycBG wasincreased with mifepristone concentrations, as manifested by the increased GFP fluorescencein Fig. 1C2–C7 as well as by RT-qPCR (S2A Fig.). Moreover, the overexpression of mycAGand mycBG resulted in overgrowth of liver (Fig. 1, B2–B7), as illustrated by GFP expression(Fig. 1, C2–C7) and also as evident from the enlarged belly (Fig. 1, A2–A7), compared to theliver in the Driver control that had only GFP expression in the liver (Fig. 1, A1, B1, C1 and S1Fig.). Significant liver overgrowth was observed even in the case of weak expression with 0.005μMmifepristone. Notably, the tumor size of the mycAG transgenic fish was significantly largerthan that of the mycBG fish while the body length was much smaller, indicating a highertumor burden in the mycAG fish.
Histological examination of mifepristone-induced Driver control fish showed that GFP ex-pression has no impact on normal liver architecture and histology (Fig. 1, D1). In contrast, the
Myc-Induced Liver Tumors in Transgenic Zebrafish
PLOS ONE | DOI:10.1371/journal.pone.0117249 January 22, 2015 2 / 17
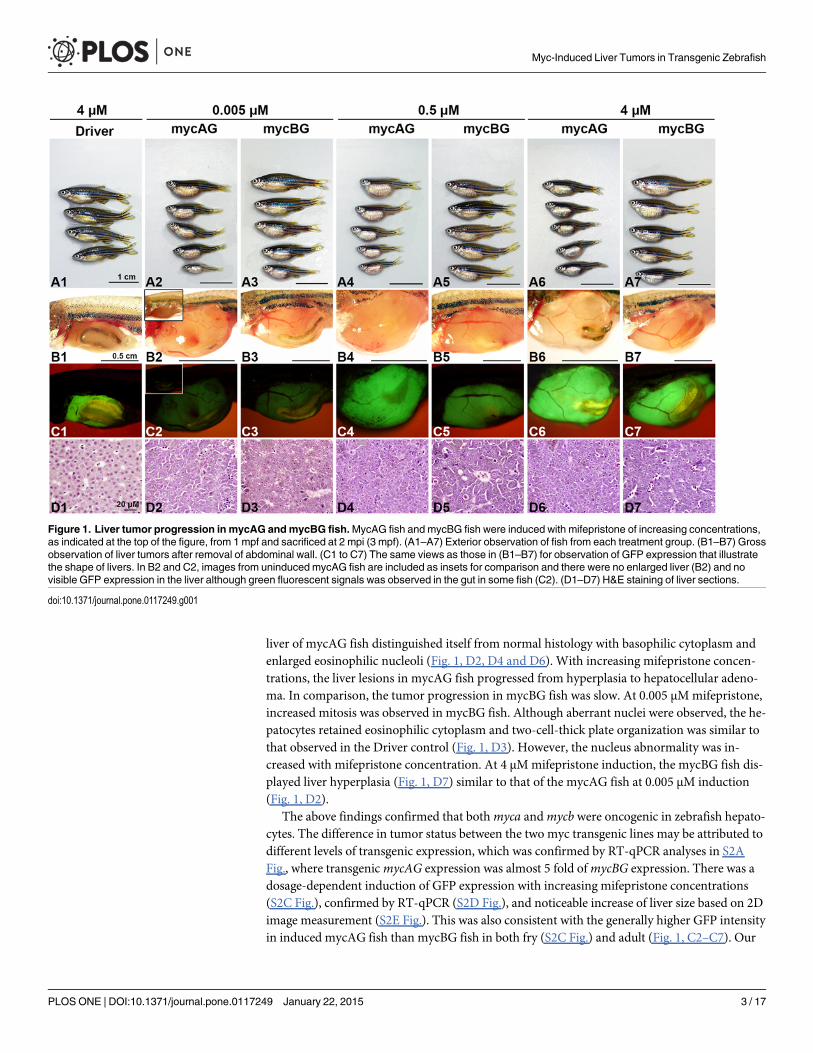
liver of mycAG fish distinguished itself from normal histology with basophilic cytoplasm andenlarged eosinophilic nucleoli (Fig. 1, D2, D4 and D6). With increasing mifepristone concen-trations, the liver lesions in mycAG fish progressed from hyperplasia to hepatocellular adeno-ma. In comparison, the tumor progression in mycBG fish was slow. At 0.005 μMmifepristone,increased mitosis was observed in mycBG fish. Although aberrant nuclei were observed, the he-patocytes retained eosinophilic cytoplasm and two-cell-thick plate organization was similar tothat observed in the Driver control (Fig. 1, D3). However, the nucleus abnormality was in-creased with mifepristone concentration. At 4 μMmifepristone induction, the mycBG fish dis-played liver hyperplasia (Fig. 1, D7) similar to that of the mycAG fish at 0.005 μM induction(Fig. 1, D2).
The above findings confirmed that bothmyca andmycb were oncogenic in zebrafish hepato-cytes. The difference in tumor status between the two myc transgenic lines may be attributed todifferent levels of transgenic expression, which was confirmed by RT-qPCR analyses in S2AFig., where transgenicmycAG expression was almost 5 fold ofmycBG expression. There was adosage-dependent induction of GFP expression with increasing mifepristone concentrations(S2C Fig.), confirmed by RT-qPCR (S2D Fig.), and noticeable increase of liver size based on 2Dimage measurement (S2E Fig.). This was also consistent with the generally higher GFP intensityin induced mycAG fish than mycBG fish in both fry (S2C Fig.) and adult (Fig. 1, C2–C7). Our
Figure 1. Liver tumor progression in mycAG andmycBG fish.MycAG fish and mycBG fish were induced with mifepristone of increasing concentrations,as indicated at the top of the figure, from 1 mpf and sacrificed at 2 mpi (3 mpf). (A1–A7) Exterior observation of fish from each treatment group. (B1–B7) Grossobservation of liver tumors after removal of abdominal wall. (C1 to C7) The same views as those in (B1–B7) for observation of GFP expression that illustratethe shape of livers. In B2 and C2, images from uninduced mycAG fish are included as insets for comparison and there were no enlarged liver (B2) and novisible GFP expression in the liver although green fluorescent signals was observed in the gut in some fish (C2). (D1–D7) H&E staining of liver sections.
doi:10.1371/journal.pone.0117249.g001
Myc-Induced Liver Tumors in Transgenic Zebrafish
PLOS ONE | DOI:10.1371/journal.pone.0117249 January 22, 2015 3 / 17
RT-qPCR data also confirmed that bothmycAG andmycBG expression were much higher thanendogenousmyca andmycb expression (S2A Fig.). Nuclear localization of both mycAG andmycBG fusion proteins were observed and these Myc-localized nuclei were significantly largerthan these in the wild type and Driver controls, indicating pathological changes of these cells(S2B Fig.). Collectively, these observations suggest a correlation of severity of neoplasia with thelevel of myc mRNA expression.
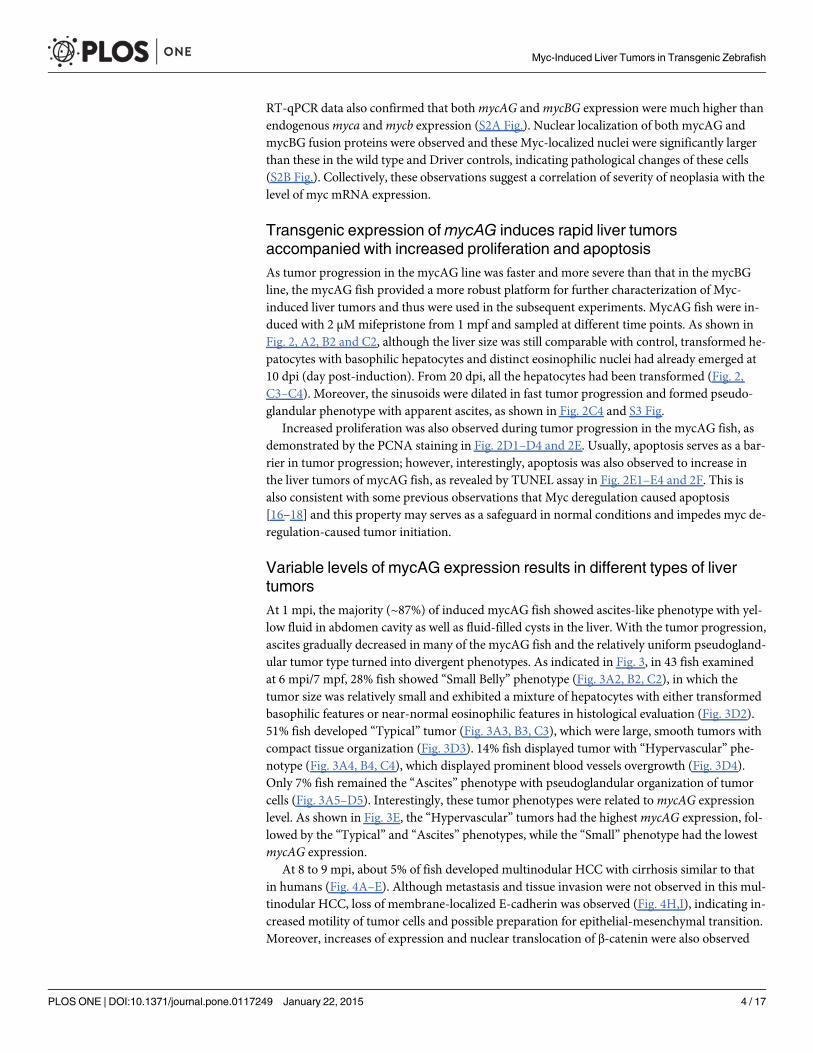
Transgenic expression ofmycAG induces rapid liver tumorsaccompanied with increased proliferation and apoptosisAs tumor progression in the mycAG line was faster and more severe than that in the mycBGline, the mycAG fish provided a more robust platform for further characterization of Myc-induced liver tumors and thus were used in the subsequent experiments. MycAG fish were in-duced with 2 μMmifepristone from 1 mpf and sampled at different time points. As shown inFig. 2, A2, B2 and C2, although the liver size was still comparable with control, transformed he-patocytes with basophilic hepatocytes and distinct eosinophilic nuclei had already emerged at10 dpi (day post-induction). From 20 dpi, all the hepatocytes had been transformed (Fig. 2,C3–C4). Moreover, the sinusoids were dilated in fast tumor progression and formed pseudo-glandular phenotype with apparent ascites, as shown in Fig. 2C4 and S3 Fig.
Increased proliferation was also observed during tumor progression in the mycAG fish, asdemonstrated by the PCNA staining in Fig. 2D1–D4 and 2E. Usually, apoptosis serves as a bar-rier in tumor progression; however, interestingly, apoptosis was also observed to increase inthe liver tumors of mycAG fish, as revealed by TUNEL assay in Fig. 2E1–E4 and 2F. This isalso consistent with some previous observations that Myc deregulation caused apoptosis[16–18] and this property may serves as a safeguard in normal conditions and impedes myc de-regulation-caused tumor initiation.
Variable levels of mycAG expression results in different types of livertumorsAt 1 mpi, the majority (~87%) of induced mycAG fish showed ascites-like phenotype with yel-low fluid in abdomen cavity as well as fluid-filled cysts in the liver. With the tumor progression,ascites gradually decreased in many of the mycAG fish and the relatively uniform pseudogland-ular tumor type turned into divergent phenotypes. As indicated in Fig. 3, in 43 fish examinedat 6 mpi/7 mpf, 28% fish showed “Small Belly” phenotype (Fig. 3A2, B2, C2), in which thetumor size was relatively small and exhibited a mixture of hepatocytes with either transformedbasophilic features or near-normal eosinophilic features in histological evaluation (Fig. 3D2).51% fish developed “Typical” tumor (Fig. 3A3, B3, C3), which were large, smooth tumors withcompact tissue organization (Fig. 3D3). 14% fish displayed tumor with “Hypervascular” phe-notype (Fig. 3A4, B4, C4), which displayed prominent blood vessels overgrowth (Fig. 3D4).Only 7% fish remained the “Ascites” phenotype with pseudoglandular organization of tumorcells (Fig. 3A5–D5). Interestingly, these tumor phenotypes were related tomycAG expressionlevel. As shown in Fig. 3E, the “Hypervascular” tumors had the highestmycAG expression, fol-lowed by the “Typical” and “Ascites” phenotypes, while the “Small” phenotype had the lowestmycAG expression.
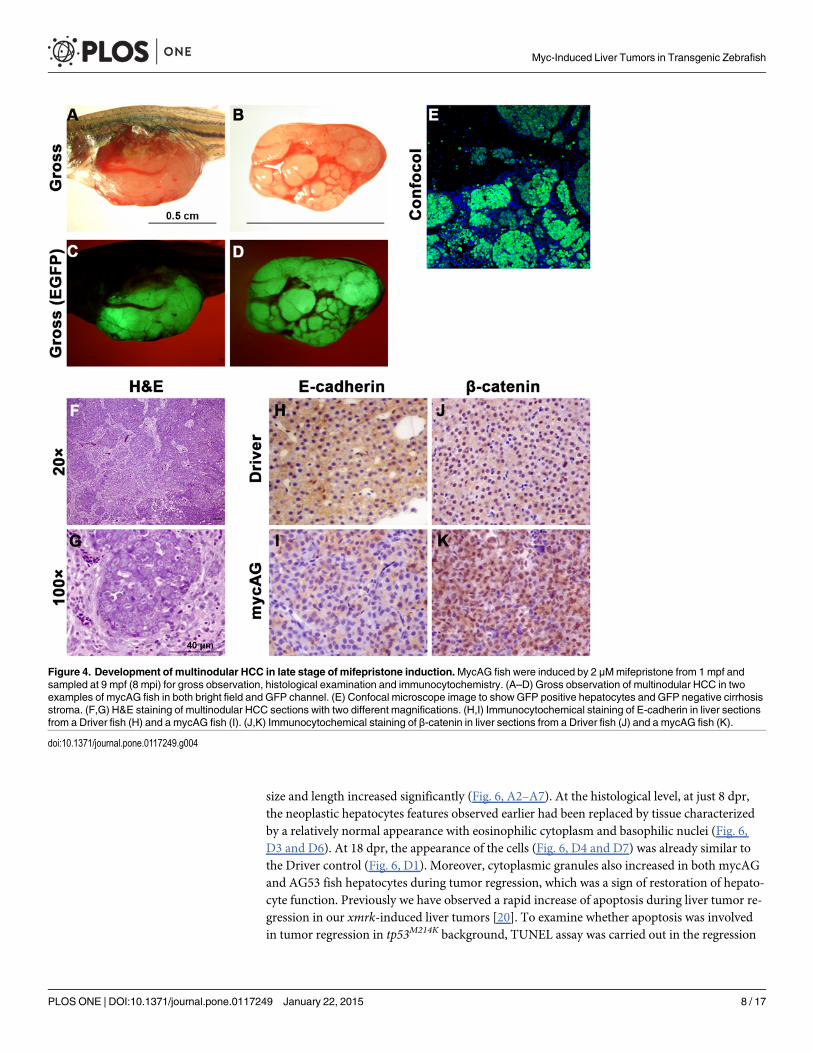
At 8 to 9 mpi, about 5% of fish developed multinodular HCC with cirrhosis similar to thatin humans (Fig. 4A–E). Although metastasis and tissue invasion were not observed in this mul-tinodular HCC, loss of membrane-localized E-cadherin was observed (Fig. 4H,I), indicating in-creased motility of tumor cells and possible preparation for epithelial-mesenchymal transition.Moreover, increases of expression and nuclear translocation of β-catenin were also observed
Myc-Induced Liver Tumors in Transgenic Zebrafish
PLOS ONE | DOI:10.1371/journal.pone.0117249 January 22, 2015 4 / 17
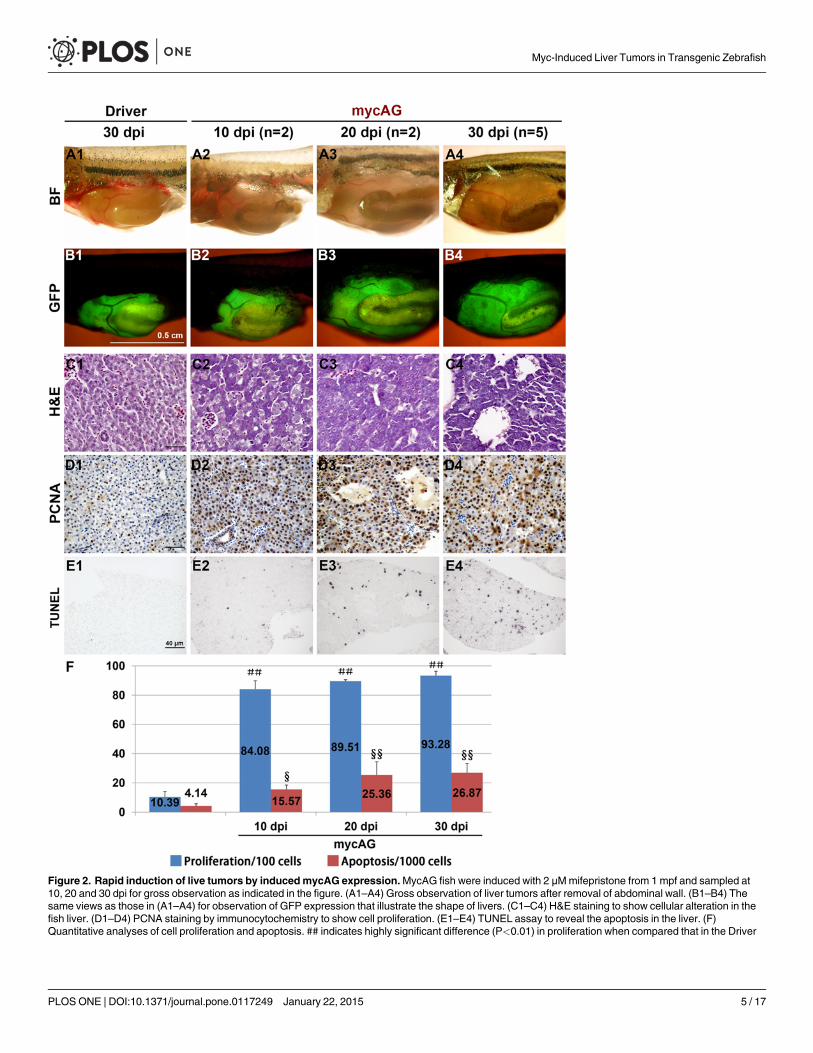
Figure 2. Rapid induction of live tumors by inducedmycAG expression.MycAG fish were induced with 2 μMmifepristone from 1 mpf and sampled at10, 20 and 30 dpi for gross observation as indicated in the figure. (A1–A4) Gross observation of liver tumors after removal of abdominal wall. (B1–B4) Thesame views as those in (A1–A4) for observation of GFP expression that illustrate the shape of livers. (C1–C4) H&E staining to show cellular alteration in thefish liver. (D1–D4) PCNA staining by immunocytochemistry to show cell proliferation. (E1–E4) TUNEL assay to reveal the apoptosis in the liver. (F)Quantitative analyses of cell proliferation and apoptosis. ## indicates highly significant difference (P<0.01) in proliferation when compared that in the Driver
Myc-Induced Liver Tumors in Transgenic Zebrafish
PLOS ONE | DOI:10.1371/journal.pone.0117249 January 22, 2015 5 / 17
(Fig. 4J,K), suggesting that another oncogenic signaling pathway, Wnt, had been activated inthe multinodular HCC.
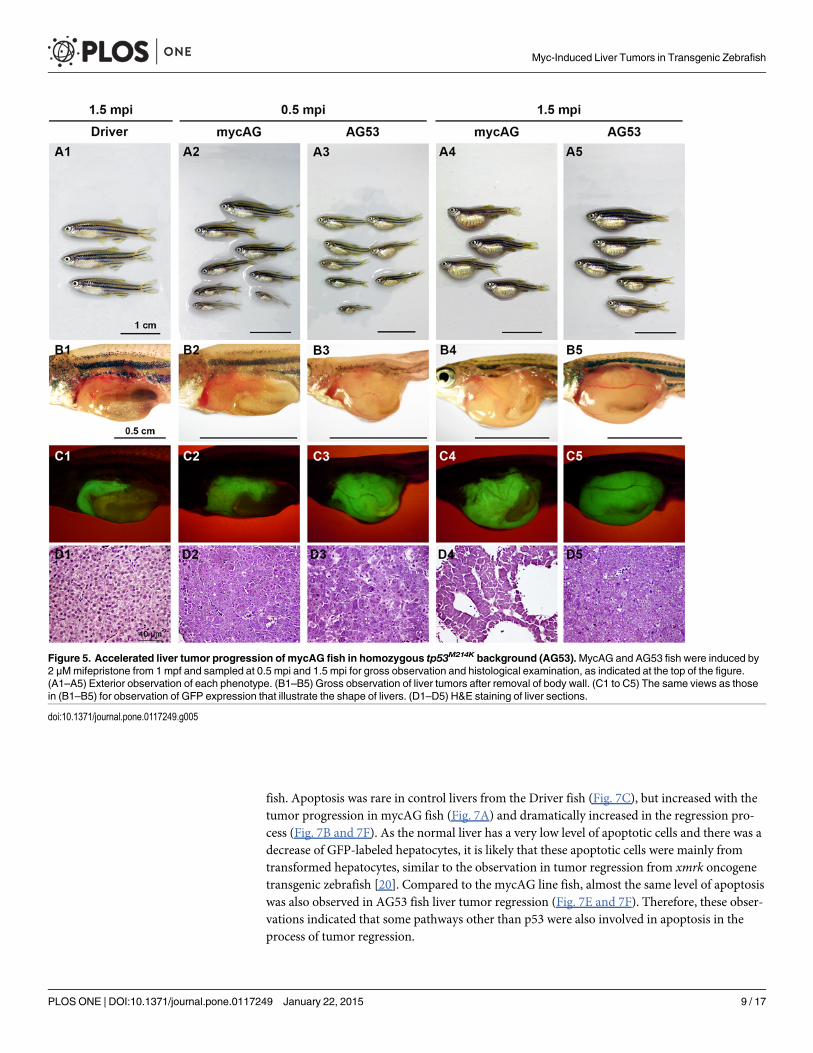
Homozygous tp53M214K mutation promotes tumor progression in mycAGfishTp53 is a major tumor suppressor genes and its mutation has been detected in a majority ofhuman cancers [19]. To test the effect of tp53mutation on tumor progression in mycAG fish,we introduced a tp53M214K homozygous mutation into this mycAG transgenic fish and namedthis new line as AG53. Apparently, tp53M214K homozygous mutation significantly promotedtumor progression in both adult (Fig. 5) and larval stages (S4A Fig.). As shown in Fig. 5, thesignificant enlargement of belly of AG53 fish could be grossly observed as early as 0.5 mpiwhen the mycAG fish had no apparent gross changes. The body size of AG53 fish was also sig-nificantly smaller than mycAG fish, which may suggest a more serious tumor burden in AG53fish. Differences were also manifested in histology, as shown in Fig. 5D1–D5. Although bothAG53 and mycAG fish were still similar in the features of basophilic cytoplasm, enlarged nucleiand prominent eosinophilic nucleoli, the fast tumor progression in AG53 fish resulted in firmand compact tumor type rather than the pseudoglandular tumor with ascites in mycAG fish at1.5 mpi.
To investigate the effect of tp53M214K mutation, we first examined the levels of transgenicmycAG and endogenousmyca expression in the Driver control, mycAG and AG53 fish, andfound both mRNAs were not affected by the mutation in AG53 fish (S4B Fig.). As many studieshave demonstrated that TP53 pathway plays an important role in Myc-caused apoptosis [18],the effect of tp53M214K mutation on apoptosis was also examined. Apoptosis in the liver wassignificantly reduced in AG53 fish when compared to that in the mycAG fish; however, it wasstill higher than that in the Driver control that rarely had apoptosis signals (S4C Fig.). This ob-servation suggested that tp53M214K mutation only blocked part of Myc-caused apoptosis, and/or that some apoptosis pathways other than Tp53 may also be activated bymyca expression intumor progression. Collectively, these observations suggest that the acceleration of tumor pro-gression in tp53M214K mutation was at least partially aided by the suppression of apoptosis.
Tumor state is dependent of sustained overexpression of transgenicmycAGOne of the important features of the LexPR inducible expression system is the feasibility of in-activation of transgenic expression by withdrawal of mifepristone [14]. To investigate the effectof suppression of transgenic mycAG expression in both mycAG and AG53 fish, mifepristonetreatment was stopped at 6 mpi/7 mpf. As shown in Fig. 6E, the mRNA expression of transgen-icmycAG in the liver greatly decreased within 8 days of mifepristone withdrawal (8 dpr, daypost-regression). At 18 dpr,mycAG level was comparable to the endogenousmyca expressionin the control fish liver. Consistently, GFP signal also faded away rapidly (Fig. 6, C2–C7). Onlyvery faint GFP was observed in mycAG and AG53 fish liver at 8 dpr (Fig. 6, C3 and C5) and es-sentially no GFP could be detected at 18 dpr (Fig. 6, C4 and C7).
At 6 mpi, the AG53 liver tumor had a uniform tumor type with early HCC traits, while thetumor histologic features in mycAG line fish were divergent, as mentioned earlier. With the re-moval of mifepristone, the tumors shrunk fast in both mycAG and AG53 fish, while the body
control at 30 dpi; § and §§, indicate significant (P<0.05) and highly significant (P<0.01) difference respectively in apoptosis when compared to that in theDriver control at 30 dpi.
doi:10.1371/journal.pone.0117249.g002
Myc-Induced Liver Tumors in Transgenic Zebrafish
PLOS ONE | DOI:10.1371/journal.pone.0117249 January 22, 2015 6 / 17
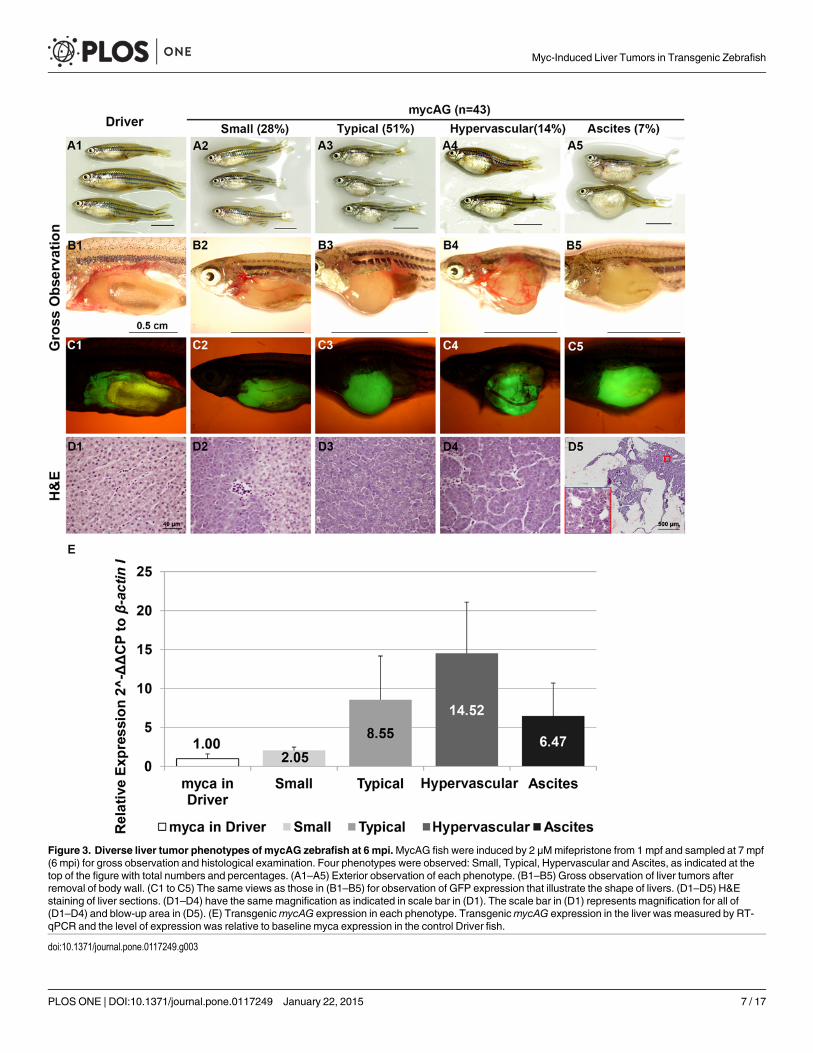
Figure 3. Diverse liver tumor phenotypes of mycAG zebrafish at 6 mpi.MycAG fish were induced by 2 μMmifepristone from 1 mpf and sampled at 7 mpf(6 mpi) for gross observation and histological examination. Four phenotypes were observed: Small, Typical, Hypervascular and Ascites, as indicated at thetop of the figure with total numbers and percentages. (A1–A5) Exterior observation of each phenotype. (B1–B5) Gross observation of liver tumors afterremoval of body wall. (C1 to C5) The same views as those in (B1–B5) for observation of GFP expression that illustrate the shape of livers. (D1–D5) H&Estaining of liver sections. (D1–D4) have the same magnification as indicated in scale bar in (D1). The scale bar in (D1) represents magnification for all of(D1–D4) and blow-up area in (D5). (E) TransgenicmycAG expression in each phenotype. TransgenicmycAG expression in the liver was measured by RT-qPCR and the level of expression was relative to baseline myca expression in the control Driver fish.
doi:10.1371/journal.pone.0117249.g003
Myc-Induced Liver Tumors in Transgenic Zebrafish
PLOS ONE | DOI:10.1371/journal.pone.0117249 January 22, 2015 7 / 17
size and length increased significantly (Fig. 6, A2–A7). At the histological level, at just 8 dpr,the neoplastic hepatocytes features observed earlier had been replaced by tissue characterizedby a relatively normal appearance with eosinophilic cytoplasm and basophilic nuclei (Fig. 6,D3 and D6). At 18 dpr, the appearance of the cells (Fig. 6, D4 and D7) was already similar tothe Driver control (Fig. 6, D1). Moreover, cytoplasmic granules also increased in both mycAGand AG53 fish hepatocytes during tumor regression, which was a sign of restoration of hepato-cyte function. Previously we have observed a rapid increase of apoptosis during liver tumor re-gression in our xmrk-induced liver tumors [20]. To examine whether apoptosis was involvedin tumor regression in tp53M214K background, TUNEL assay was carried out in the regression
Figure 4. Development of multinodular HCC in late stage of mifepristone induction.MycAG fish were induced by 2 μMmifepristone from 1 mpf andsampled at 9 mpf (8 mpi) for gross observation, histological examination and immunocytochemistry. (A–D) Gross observation of multinodular HCC in twoexamples of mycAG fish in both bright field and GFP channel. (E) Confocal microscope image to showGFP positive hepatocytes and GFP negative cirrhosisstroma. (F,G) H&E staining of multinodular HCC sections with two different magnifications. (H,I) Immunocytochemical staining of E-cadherin in liver sectionsfrom a Driver fish (H) and a mycAG fish (I). (J,K) Immunocytochemical staining of β-catenin in liver sections from a Driver fish (J) and a mycAG fish (K).
doi:10.1371/journal.pone.0117249.g004
Myc-Induced Liver Tumors in Transgenic Zebrafish
PLOS ONE | DOI:10.1371/journal.pone.0117249 January 22, 2015 8 / 17
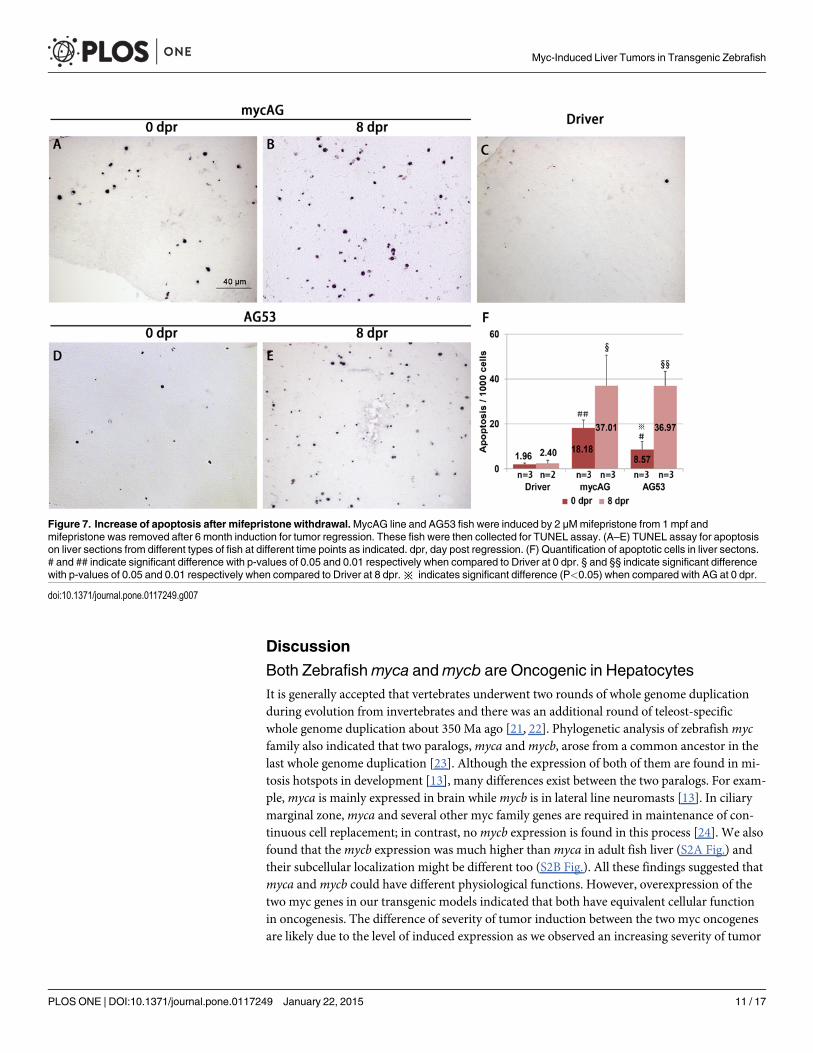
fish. Apoptosis was rare in control livers from the Driver fish (Fig. 7C), but increased with thetumor progression in mycAG fish (Fig. 7A) and dramatically increased in the regression pro-cess (Fig. 7B and 7F). As the normal liver has a very low level of apoptotic cells and there was adecrease of GFP-labeled hepatocytes, it is likely that these apoptotic cells were mainly fromtransformed hepatocytes, similar to the observation in tumor regression from xmrk oncogenetransgenic zebrafish [20]. Compared to the mycAG line fish, almost the same level of apoptosiswas also observed in AG53 fish liver tumor regression (Fig. 7E and 7F). Therefore, these obser-vations indicated that some pathways other than p53 were also involved in apoptosis in theprocess of tumor regression.
Figure 5. Accelerated liver tumor progression of mycAG fish in homozygous tp53M214K background (AG53).MycAG and AG53 fish were induced by2 μMmifepristone from 1 mpf and sampled at 0.5 mpi and 1.5 mpi for gross observation and histological examination, as indicated at the top of the figure.(A1–A5) Exterior observation of each phenotype. (B1–B5) Gross observation of liver tumors after removal of body wall. (C1 to C5) The same views as thosein (B1–B5) for observation of GFP expression that illustrate the shape of livers. (D1–D5) H&E staining of liver sections.
doi:10.1371/journal.pone.0117249.g005
Myc-Induced Liver Tumors in Transgenic Zebrafish
PLOS ONE | DOI:10.1371/journal.pone.0117249 January 22, 2015 9 / 17
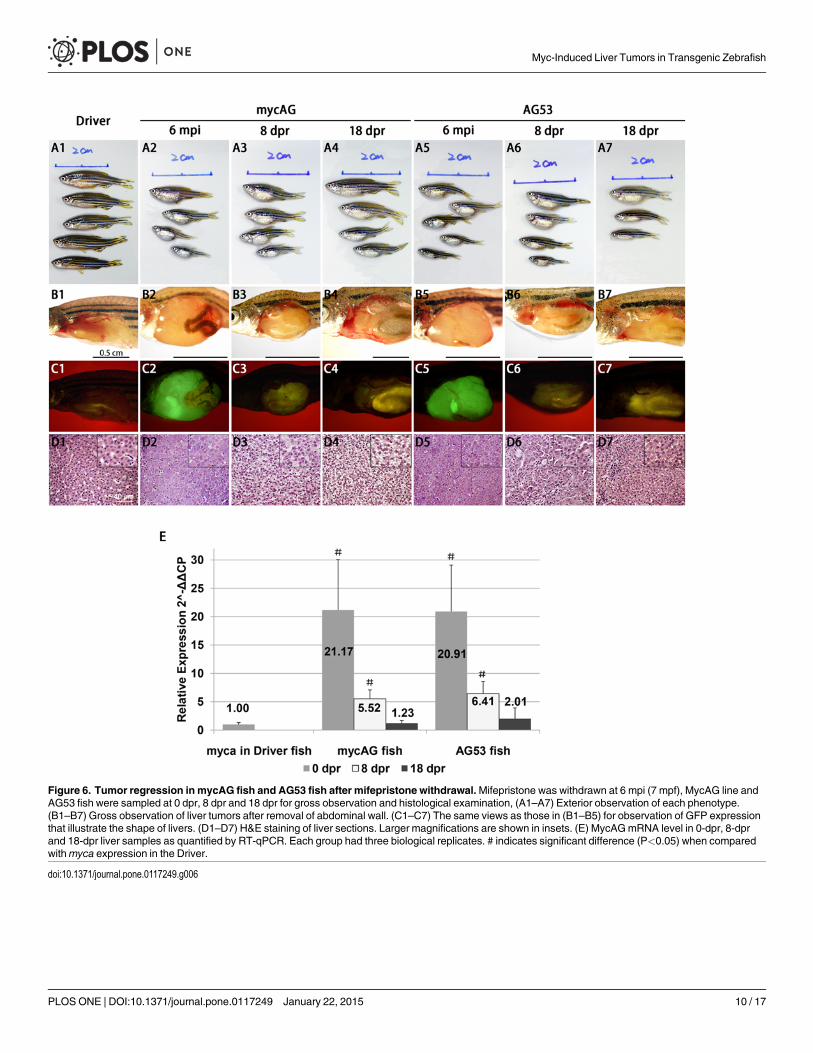
Figure 6. Tumor regression in mycAG fish and AG53 fish after mifepristone withdrawal.Mifepristone was withdrawn at 6 mpi (7 mpf), MycAG line andAG53 fish were sampled at 0 dpr, 8 dpr and 18 dpr for gross observation and histological examination, (A1–A7) Exterior observation of each phenotype.(B1–B7) Gross observation of liver tumors after removal of abdominal wall. (C1–C7) The same views as those in (B1–B5) for observation of GFP expressionthat illustrate the shape of livers. (D1–D7) H&E staining of liver sections. Larger magnifications are shown in insets. (E) MycAGmRNA level in 0-dpr, 8-dprand 18-dpr liver samples as quantified by RT-qPCR. Each group had three biological replicates. # indicates significant difference (P<0.05) when comparedwithmyca expression in the Driver.
doi:10.1371/journal.pone.0117249.g006
Myc-Induced Liver Tumors in Transgenic Zebrafish
PLOS ONE | DOI:10.1371/journal.pone.0117249 January 22, 2015 10 / 17
Discussion
Both Zebrafishmyca andmycb are Oncogenic in HepatocytesIt is generally accepted that vertebrates underwent two rounds of whole genome duplicationduring evolution from invertebrates and there was an additional round of teleost-specificwhole genome duplication about 350 Ma ago [21, 22]. Phylogenetic analysis of zebrafishmycfamily also indicated that two paralogs,myca andmycb, arose from a common ancestor in thelast whole genome duplication [23]. Although the expression of both of them are found in mi-tosis hotspots in development [13], many differences exist between the two paralogs. For exam-ple,myca is mainly expressed in brain whilemycb is in lateral line neuromasts [13]. In ciliarymarginal zone,myca and several other myc family genes are required in maintenance of con-tinuous cell replacement; in contrast, nomycb expression is found in this process [24]. We alsofound that themycb expression was much higher thanmyca in adult fish liver (S2A Fig.) andtheir subcellular localization might be different too (S2B Fig.). All these findings suggested thatmyca andmycb could have different physiological functions. However, overexpression of thetwo myc genes in our transgenic models indicated that both have equivalent cellular functionin oncogenesis. The difference of severity of tumor induction between the two myc oncogenesare likely due to the level of induced expression as we observed an increasing severity of tumor
Figure 7. Increase of apoptosis after mifepristone withdrawal.MycAG line and AG53 fish were induced by 2 μMmifepristone from 1 mpf andmifepristone was removed after 6 month induction for tumor regression. These fish were then collected for TUNEL assay. (A–E) TUNEL assay for apoptosison liver sections from different types of fish at different time points as indicated. dpr, day post regression. (F) Quantification of apoptotic cells in liver sectons.# and ## indicate significant difference with p-values of 0.05 and 0.01 respectively when compared to Driver at 0 dpr. § and §§ indicate significant differencewith p-values of 0.05 and 0.01 respectively when compared to Driver at 8 dpr.※ indicates significant difference (P<0.05) when compared with AG at 0 dpr.
doi:10.1371/journal.pone.0117249.g007
Myc-Induced Liver Tumors in Transgenic Zebrafish
PLOS ONE | DOI:10.1371/journal.pone.0117249 January 22, 2015 11 / 17
progression from both mycAG and mycBG transgenic lines with increased mifepristone induc-er, although the possibility thatmyca is more potent in ongogenesis thanmycb could not becompletely ruled out. It is also interesting to note that endogenousmycb expression was muchlower in induced mycAG fish than those in induced mycBG and Driver fish (S1A Fig.); thiscould be due to a negative feedback control of endogenous myc expression by high level oftransgenic myc expression.
In the present study, we also found an apparent dosage-dependent induction of transgenicmyc expression, which in turn caused an increasing tumor severity (Fig. 1). A long time of in-duction (up to 8 months) with 2 μMmifepristone caused essentially 100% mycAG fish to growliver tumors, among which, 5% of them had been confirmed to have multimodular HCC phe-notype. The rest fish also showed some other malignant traits or signs of serious liver damage(Fig. 3). For example, ascites itself is an important clinical syndrome in late stage human livercancer, and at the histological level, the compact hepatocytes organization in the “Typical” phe-notype and neo-anginogenesis in the “Hypervascular” phenotype are also important propertiesin human HCC. Therefore, though not confirmed as HCC, these induced mycAG fish didshow the deterioration and transition into malignant status.
Liver tumor progression in mycAG fish is accelerated by suppression ofapoptosis with tp53M214K MutationIt seems that different levels of mycAG expression also resulted in different tumor types, al-though all the mycAG fish exhibited similar phenotypes at the early tumor stage (before 1mpi), such as pseudoglandular tissue pattern and ascites (S3 and S4 Figs.). It was apparent thatsustained high level expression ofmyca was necessary in the development of advanced neo-plasms in later stages. Myc provoked apoptosis has been observed in many studies [18] and wealso observed increased apoptosis in the liver tumor of mycAG fish (Fig. 2C1–C4). However,HCC was still developed in our model eventually, suggesting that the oncogenicity of mycAGfish is robust enough to overcome the apoptosis effect and to maintain the progression of ma-lignant status. Moreover, it has also been found that in some tumor models, attenuating apo-ptosis is necessary for successful malignant transformation [25, 26]. In this project we observedthat introducing a tp53M214K homozygous mutation which significantly suppressed apoptosiscould accelerate liver tumor progression.
Liver tumor regression does not require Tp53Reversible neoplasms have been reported in antisense-treated human cancer cell lines and ani-mal cancer models with conditional oncogene expression [27], including our previously re-ported transgenic zebrafish models with inducible expression of Xiphophorus xmrk oncogeneand mouseMyc respectively [11, 20]. This phenomenon, i.e. malignant status dependency onsustained activation of a specific oncogene, is named “oncogene addiction” [27]. Addiction toMyc has also been reported in several previous studies. For example, in a tet-off mice acute my-eloid leukemia model, introduction of doxycycline lead to suppression of transgenicMYC ex-pression and caused regression of the tumor [28]. Similarly, in a Myc-induced mouse HCCmodel, inactivation of transgenic Myc also caused rapid tumor regression with increased apo-ptosis [29]. However, not all the tumors could regress after the elimination of the original onco-genic factor, especially when additional oncogenic mutations have occurred, which isessentially in all cases in human cancers. For example, the mammary adenocarcinoma in amouse model established byMYC overexpression could not regress after abolishingMYC ex-pression because of a secondary spontaneous activating mutation in Kras [30].
Myc-Induced Liver Tumors in Transgenic Zebrafish
PLOS ONE | DOI:10.1371/journal.pone.0117249 January 22, 2015 12 / 17
In the mycAG and AG53 transgenic zebrafish reported here, inactivation of mycAG expres-sion after removal of mifepristone resulted in rapid tumor regression in both groups of fishand all the hepatocytes were reverted to a normal appearance histologically (Fig. 6). While it isanticipated for a rise of apoptosis in mycAG fish during tumor regression, which is consistentwith several previous reports [20, 28], it is unusual to observe a similar increase of apoptosis inAG53 fish. TP53 is a well-known tumor suppressor gene and a common function of Tp53 is toinduce apoptosis of damaged or tumorigenic cells for elimination [19]. It has been previouslyreported for a Myc transgenic mouse model with hematopoietic tumors that tumor regressionby inactivation of transgenic Myc requires Tp53 as only incomplete tumor regression was ob-served when Tp53 is lost [31]. In our AG53 fish model, although the homozygous tp53M214K
mutation could largely abolish apoptosis in the tumor progression stage (S4C Fig.), but itseems that there was no effect during tumor regression. These observations suggested that themalignant status of hepatocytes is addicted to sustained overexpression of zebrafishmyca buttumor regression does not require the presence of Tp53. Since similar levels of apoptosis wereobserved in both mycAg and AG53 fish during the initial stage of tumor regression, it is likelythat apoptosis during tumor regression is independent of the Tp53 pathway.
Material and Method
Generation of mycAG, mycBG and AG53 transgenic fishThis study involving zebrafish was carried out in strict accordance with the recommendationsin the Guide for the Care and Use of Laboratory Animals of the National Institutes of Health.The protocol was approved by the Institutional Animal Care and Use Committee (IACUC) ofthe National University of Singapore (Protocol Number: 096/12). All surgery was performedunder sodium pentobarbital anesthesia, and all efforts were made to minimize suffering. TheLiver-Driver line, Tg(fabp10:LexPR; LexA:EGFP), was generated in a previous study [14]. TwoEffector lines, Tg(cryB:mCherry; LexA:EGFP-myca) and Tg(cryB:mCherry; LexA:EGFP-mycb),were generated in the present study using constructs depicted in S1 Fig. Both transgenic lineswere identified by visualization of mCherry expression in lens under the cryB promoter. To en-hance genome integration, the Ac/Ds transposon system was adopted [32], in which, a DNAconstruct was co-injected with in vitro transcribed transposase mRNA into zebrafish embryosat the 1–2 cell stage. The injected embryos were then raised for founder screening and trans-genic F1 were confirmed by mCherry expression. From the F1 generation, both effector lineswere maintained by crossing with the liver-driver fish and double transgenic fish were selectedbased on mCherry expression in the lens (Effector) and constitutive GFP expression in theliver (Driver). Multiplemyca andmycb effector transgenic lines were generated and they allgenerated obvious liver tumors in early stages (S2F Fig.); in this study, we followed only onetransgenic line each of these myc genes and the double transgenic fish were named mycAGand mycBG accordingly in this report.
The mycAG fish with tp53M214K homozygous mutation were generated by crossing mycAGfish with a tp53M214K homozygous mutant fish [33]. The heterozygous offspring were raised byincrossing and homozygosity for tp53M214K was selected by genotyping with PCR primer as in-dicated in S1 Table [34]. The mycAG fish were then maintained in homozygous tp53M214K,named AG53, by incrossing for experiments.
Mifepristone treatmentMifepristone (RU-486, Sigma-Aldrich #M8046) was first dissolved in ethanol and diluted infish water for the final concentrations. The treatment was conducted in petri dishes or 6-L
Myc-Induced Liver Tumors in Transgenic Zebrafish
PLOS ONE | DOI:10.1371/journal.pone.0117249 January 22, 2015 13 / 17
tanks at a density of ~50 larvae or ~25 adult per dish or tank, respectively. The water with mi-fepristone was topped up every 3–4 days and totally changed every two weeks.
Reverse transcription-quantitative PCR (RT-qPCR)Total RNA was extracted using TRIzol (Invitrogen #15596–018) and reverse-transcribed intocDNA. To distinguish the endogenousmyca andmycbmRNAs from the transgenicmycAGandmycBGmRNAs,myca andmycb primers were targeted at the coding region and 30 un-translated regions whilemycAG andmycBG primers at the myc coding region and the GFP re-gion. β-actin was used as an inner control. The primer sequences are presented in S1 Table.
Paraffin section and histological analysesFish samples were fixed in 10% neutral buffered formalin solution (Sigma, #HT5012). After de-hydration and embedding with paraffin, sectioning was performed using a Leica microtome,and all the samples were sectioned sagittally at a thickness of 4 μm. For ordinary observation,the samples were stained with Hematoxylin (Sigma, #51275) and Eosin (Sigma, #HT110232).For immunohistochemistry, the primary antibodies used were PCNA (AnaSpec Inc. #55421),β-catenin (Abcam, #ab32572) and E-cadherin (Abcam, #ab1416). After washes with phosphatebuffered saline (PBS) with 0.1% Tween 20 (PBST) and incubation with appropriate secondaryantibody from the Dako Kit set (DAKO, Denmark, #346811), color was developed by using theLiquid DAB & Substrate Chromogen system (DAKO, #346811). The slides were also conter-stained with 5 μg/ml DAPI (40, 6-Diamidine-20-phenylindole dihydrochloride) to facilitatenucleus observation.
TUNEL assayTUNEL assay was conducted with ApopTag Plus In Situ Apoptosis Fluorescein Detection Kit(Chemicon international, #S7111). After rehydration and treatment with 20 μg/ml proteinaseK in PBS at room temperature, the sections were treated with TDT enzyme and incubated withalkaline phosphate-conjugated Anti-DIG. Next the slides were balanced in pH 9.5 buffer (0.1M Tris-HCl/50 mMMgcl2/ 10 mMNaCl/0.1% Tween 20) and finally the signal colors were de-veloped using nitro-blue tetrazolium/5-bromo-4-chloro-30-indolyphosphate in pH 9.5 buffer.
Statistical analysesT-test was used for all assays in the present studies, including cell counting in DOPI, PCNAand TUNEL staining, measurement of 2D liver size and RT-qPCR. Statistical significance wasindicted in figure legends.
Supporting InformationS1 Fig. Schematic representation of DNA constructs used in the mifepristone-inducible ex-pression system. The mifepristone inducible expression system has been described previously[14, 15]. The Driver construct consists of a chimeric LexPR transcription activator under theliver-specific fabp10a promoter. The driver construct also contains an EGFP effector transcrip-tion unit under the LexA operator. Two effector constructs for expression ofmyca andmycbunder the LexA operator were also made. The effector constructs also contain an mCherry re-porter gene under a lens-specific crybb promoter for identification of effector fish. Both thedriver and effector constructs are flanked with transposon Ds elements for improving of effi-ciency of genome insertion [32].(PDF)
Myc-Induced Liver Tumors in Transgenic Zebrafish
PLOS ONE | DOI:10.1371/journal.pone.0117249 January 22, 2015 14 / 17
S2 Fig. Effects ofmycAG andmycBG expression in zebrafish liver. (A) Expression of trans-genicmycAG andmycBG in comparison with expression of endogenousmyca andmycb genes.Liver RNA from 1 mpi (2 mpf) fish treated with 2 μMmifepristone were analysed by RT-qPCRand expression values are relative to the level of endogenousmycamRNA, which is arbitrarilyset as 1. (B) Subcellular localization of mycAG and mycBG fusion proteins. Fish were all treatedwith 2 μMmifepristone and liver tissues were collected at 1 mpi (2 mpf) for cryosection. GFPsignal was recorded by confocal microscope with the same exposure time. Nuclei were stainedby DAPI and recorded in the blue channel. Wild type liver was used as a negative control.(C) Dosage-dependent effect of mifepristone induction on GFP or Myc-GFP expression andliver size in Driver, mycAG and mycBG larvae. These transgenic fish were induced with mifep-ristone at different concentrations from 3 dpf and photographed at 8 dpi (5 dpi). (D) Dosage-dependent increase ofmycAG andmycBG expression as measured by RT-qPCR. (E) Quantifi-cation of liver size based on 2D images at 4 μMmifepristone. Size of liver of larvae was mea-sured according to GFP signal area. # and ## indicate significant difference with p-valuesof 0.05 and 0.01 respectively when compared with the liver size in the Driver. (F) Induction ofliver tumors from other mycAG transgenic families. Representative fish from three othermycAG transgenic families are shown with gross observations of liver tumors (upperpanels) and GFP expression (lower panels) to illustrate the liver tissues as described inFig. 1B and 1C.(TIF)
S3 Fig. Ascites in mycAG zebrafish.MycAG fish were induced by 2 μMmifepristone from1 mpf and sampled at 7 mpf (6 mpi) for gross observation and histological examination. (A)Gross observation of the mycAG fish with ascites phenotype in monotone background. (B)Gross observation of the same fish in (A) under a dark background to show transparent belly.(C) H&E staining of the fish presented in (A,B). (D, E) Isolated liver tumor from anothermycAG fish with ascites for GFP view (D) and for view in a dark background to show transpar-ent, foam-like structure (E). Liquid was observed in cysts in the liver. (F) H&E staining of theliver tumor presented in (C,D).(PDF)
S4 Fig. Reduction of apoptosis and acceleration of liver tumor progression in mifepris-tone-induced mycAG fish with tp53M214K mutation (AG50). (A) Comparison of liver size be-tween mycAG and AG53 larvae. Larvae were induced with 2 μMmifepristone from 3 dpf andphotographed at 5 dpi (8 dpf). Liver size was measured based on 2D GFP images as previouslydescribed [35]. ## and # indicate significant difference with p-values of 0.01 and 0.05 respec-tively when compared with the liver size in the Driver53 (Driver fish in tp53M214K mutationbackground). §§ and § indicate significant difference with p-values of 0.01 and 0.05 respective-ly when compared with the liver size in the Driver. ++ indicates significant difference (P<
0.01) when compared with the liver size in AG53. (B) Induction ofmycAG expression inmycAG and AG53 fish. Total RNA was extracted from 5 dpi/8 dpf larvae treated with 2 μMmi-fepristone for RT-qPCR analyses. Each group has three biological replicates and there was nosignificant effect on induction ofmycAGmRNA by tp53M214K mutation. # indicates the expres-sion differences when compared to endogenousmyca expression in Driver fish (p< 0.05). (C)Apoptosis in AG53 and mycAG fish livers. Liver sections from 2 mpi (3 mpf) driver, mycAgand AG50 fish were used for TUNEL staining. Each group has 3 to 4 biological replicates andapoptosis was counted and represented in column. ##, indicates the difference in proliferationwhen compared with Driver is significant (P< 0.01). §§ indicates significant difference be-tween mycAG and AG50 fish (P< 0.01).(PDF)
Myc-Induced Liver Tumors in Transgenic Zebrafish
PLOS ONE | DOI:10.1371/journal.pone.0117249 January 22, 2015 15 / 17
S1 Table. Primer Sequences Used in PCR.(DOCX)
AcknowledgmentsWe thank Drs. Serguei Parinov and Alexander Emelyanov for initial guidance of the projectand Mr. Hankun Li for assistance in preparation of illustrations.
Author ContributionsConceived and designed the experiments: LS ATN ZG. Performed the experiments: LS ATN.Analyzed the data: LS JMS. Contributed reagents/materials/analysis tools: LS ATN JMS. Wrotethe paper: LS JMS ZG.
References1. El-Serag HB (2012) Epidemiology of viral hepatitis and hepatocellular carcinoma. Gastroenterology
142: 1264–1273 e1261. doi: 10.1053/j.gastro.2011.12.061 PMID: 22537432
2. Eilers M, Eisenman RN (2008) Myc’s broad reach. Genes Dev 22: 2755–2766. doi: 10.1101/gad.1712408 PMID: 18923074
3. Wang Y, Wu MC, Sham JS, ZhangW, WuWQ, et al. (2002) Prognostic significance of c-myc and AIB1amplification in hepatocellular carcinoma. A broad survey using high-throughput tissue microarray.Cancer 95: 2346–2352. doi: 10.1002/cncr.10963 PMID: 12436441
4. Takahashi Y, Kawate S, Watanabe M, Fukushima J, Mori S, et al. (2007) Amplification of c-myc and cy-clin D1 genes in primary and metastatic carcinomas of the liver. Pathol Int 57: 437–442. doi: 10.1111/j.1440-1827.2007.02120.x PMID: 17587243
5. Ruggeri BA, Camp F, Miknyoczki S (2014) Animal models of disease: pre-clinical animal models of can-cer and their applications and utility in drug discovery. Biochem Pharmacol 87: 150–161. doi: 10.1016/j.bcp.2013.06.020 PMID: 23817077
6. White R, Rose K, Zon L (2013) Zebrafish cancer: the state of the art and the path forward. Nat Rev Can-cer 13: 624–636. doi: 10.1038/nrc3589 PMID: 23969693
7. Lam SH, Wu YL, Vega VB, Miller LD, Spitsbergen J, et al. (2006) Conservation of gene expression sig-natures between zebrafish and human liver tumors and tumor progression. Nat Biotechnol 24: 73–75.doi: 10.1038/nbt1169 PMID: 16327811
8. Spitsbergen JM, Buhler DR, Peterson TS (2012) Neoplasia and neoplasm-associated lesions in labora-tory colonies of zebrafish emphasizing key influences of diet and aquaculture system design. ILAR J53: 114–125. doi: 10.1093/ilar.53.2.114 PMID: 23382343
9. Spitsbergen JM, Tsai HW, Reddy A, Miller T, Arbogast D, et al. (2000) Neoplasia in zebrafish (Daniorerio) treated with N-methyl-N’-nitro-N-nitrosoguanidine by three exposure routes at different develop-mental stages. Toxicol Pathol 28: 716–725. doi: 10.1177/019262330002800512 PMID: 11026608
10. Spitsbergen JM, Tsai HW, Reddy A, Miller T, Arbogast D, et al. (2000) Neoplasia in zebrafish (Daniorerio) treated with 7,12-dimethylbenz[a]anthracene by two exposure routes at different developmentalstages. Toxicol Pathol 28: 705–715. doi: 10.1177/019262330002800512 PMID: 11026607
11. Li Z, ZhengW, Wang Z, Zeng Z, Zhan H, et al. (2013) A transgenic zebrafish liver tumor model with in-ducible Myc expression reveals conservedMyc signatures with mammalian liver tumors. Dis ModelMech 6: 414–423. doi: 10.1242/dmm.010462 PMID: 23038063
12. Menescal LA, Schmidt C, Liedtke D, Schartl M (2012) Liver hyperplasia after tamoxifen induction ofMyc in a transgenic medaka model. Dis Model Mech 5: 492–502. doi: 10.1242/dmm.008730 PMID:22422827
13. Meijer AH, van der Sar AM, Cunha C, Lamers GE, Laplante MA, et al. (2008) Identification and real-time imaging of a myc-expressing neutrophil population involved in inflammation and mycobacterialgranuloma formation in zebrafish. Dev Comp Immunol 32: 36–49. doi: 10.1016/j.dci.2007.04.003PMID: 17553562
14. Nguyen AT, Emelyanov A, Koh CH, Spitsbergen JM, Parinov S, et al. (2012) An inducible kras(V12)transgenic zebrafish model for liver tumorigenesis and chemical drug screening. Dis Model Mech 5:63–72. doi: 10.1242/dmm.008367 PMID: 21903676
Myc-Induced Liver Tumors in Transgenic Zebrafish
PLOS ONE | DOI:10.1371/journal.pone.0117249 January 22, 2015 16 / 17
15. Emelyanov A, Parinov S (2008) Mifepristone-inducible LexPR system to drive and control gene expres-sion in transgenic zebrafish. Dev Biol 320: 113–121. doi: 10.1016/j.ydbio.2008.04.042 PMID:18544450
16. Thompson EB (1998) The many roles of c-Myc in apoptosis. Annu Rev Physiol 60: 575–600. doi: 10.1146/annurev.physiol.60.1.575 PMID: 9558477
17. Nilsson JA, Cleveland JL (2003) Myc pathways provoking cell suicide and cancer. Oncogene 22:9007–9021. doi: 10.1038/sj.onc.1207261 PMID: 14663479
18. Hoffman B, Liebermann DA (2008) Apoptotic signaling by c-MYC. Oncogene 27: 6462–6472. doi: 10.1038/onc.2008.312 PMID: 18955973
19. Brady CA, Attardi LD (2010) p53 at a glance. J Cell Sci 123: 2527–2532. doi: 10.1242/jcs.064501PMID: 20940128
20. Li Z, Huang X, Zhan H, Zeng Z, Li C, et al. (2012) Inducible and repressable oncogene-addicted hepa-tocellular carcinoma in Tet-on xmrk transgenic zebrafish. J Hepatol 56: 419–425. doi: 10.1016/j.jhep.2011.07.025 PMID: 21888874
21. Christoffels A, Koh EG, Chia JM, Brenner S, Aparicio S, et al. (2004) Fugu genome analysis providesevidence for a whole-genome duplication early during the evolution of ray-finned fishes. Mol Biol Evol21: 1146–1151. doi: 10.1093/molbev/msh114 PMID: 15014147
22. Jaillon O, Aury JM, Brunet F, Petit JL, Stange-Thomann N, et al. (2004) Genome duplication in the tele-ost fish Tetraodon nigroviridis reveals the early vertebrate proto-karyotype. Nature 431: 946–957. doi:10.1038/nature03025 PMID: 15496914
23. Marandel L, Labbe C, Bobe J, Le Bail PY (2012) Evolutionary history of c-myc in teleosts and character-ization of the duplicated c-myca genes in goldfish embryos. Mol Reprod Dev 79: 85–96. doi: 10.1002/mrd.22004 PMID: 22213278
24. Xue XY, Harris WA (2012) Using myc genes to search for stem cells in the ciliary margin of the Xenopusretina. Dev Neurobiol 72: 475–490. doi: 10.1002/dneu.20887 PMID: 21465669
25. Beverly LJ, Varmus HE (2009) MYC-induced myeloid leukemogenesis is accelerated by all six mem-bers of the antiapoptotic BCL family. Oncogene 28: 1274–1279. doi: 10.1038/onc.2008.466 PMID:19137012
26. Loosveld M, Bonnet M, Gon S, Montpellier B, Quilichini B, et al. (2014) MYC fails to efficiently shapemalignant transformation in T-cell acute lymphoblastic leukemia. Genes Chromosomes Cancer 53:52–66. doi: 10.1002/gcc.22117 PMID: 24249258
27. Weinstein IB (2002) Cancer. Addiction to oncogenes–the Achilles heal of cancer. Science 297: 63–64.doi: 10.1126/science.1073096 PMID: 12098689
28. Felsher DW, Bishop JM (1999) Reversible tumorigenesis by MYC in hematopoietic lineages. Mol Cell4: 199–207. doi: 10.1016/S1097-2765(00)80367-6 PMID: 10488335
29. Shachaf CM, Kopelman AM, Arvanitis C, Karlsson A, Beer S, et al. (2004) MYC inactivation uncoverspluripotent differentiation and tumour dormancy in hepatocellular cancer. Nature 431: 1112–1117. doi:10.1038/nature03043 PMID: 15475948
30. D’Cruz CM, Gunther EJ, Boxer RB, Hartman JL, Sintasath L, et al. (2001) c-MYC induces mammary tu-morigenesis by means of a preferred pathway involving spontaneous Kras2 mutations. Nat Med 7:235–239. doi: 10.1038/84691 PMID: 11175856
31. Giuriato S, Ryeom S, Fan AC, Bachireddy P, Lynch RC, et al. (2006) Sustained regression of tumorsupon MYC inactivation requires p53 or thrombospondin-1 to reverse the angiogenic switch. Proc NatlAcad Sci U S A 103: 16266–16271. doi: 10.1073/pnas.0608017103 PMID: 17056717
32. Emelyanov A, Gao Y, Naqvi NI, Parinov S (2006) Trans-kingdom transposition of the maize dissocia-tion element. Genetics 174: 1095–1104. doi: 10.1534/genetics.106.061184 PMID: 16951067
33. Berghmans S, Murphey RD, Wienholds E, Neuberg D, Kutok JL, et al. (2005) tp53 mutant zebrafish de-velop malignant peripheral nerve sheath tumors. Proc Natl Acad Sci U S A 102: 407–412. doi: 10.1073/pnas.0406252102 PMID: 15630097
34. Berghmans S, Jette C, Langenau D, Hsu K, Stewart R, et al. (2005) Making waves in cancer research:new models in the zebrafish. Biotechniques 39: 227–237. doi: 10.2144/05392RV02 PMID: 16116796
35. Huang XQ, Zhou L, Gong ZY (2012) Liver tumor models in transgenic zebrafish: an alternative in vivoapproach to study hepatocarcinogenes. Future Oncology 8: 21–28. doi: 10.2217/fon.11.137 PMID:22149032
Myc-Induced Liver Tumors in Transgenic Zebrafish
PLOS ONE | DOI:10.1371/journal.pone.0117249 January 22, 2015 17 / 17
Copyright © 2022 FDOKUMEN