In vivo analysis of oligodendrocyte lineage development in postnatal FGF2 null mice
13
In Vivo Analysis of Oligodendrocyte Lineage Development in Postnatal FGF2 Null Mice JOSHUA C. MURTIE, 1 YONG-XING ZHOU, 2 TUAN Q. LE, 2 AND REGINA C. ARMSTRONG 1,2,3 * 1 Program in Molecular and Cell Biology, Uniformed Services University of the Health Sciences, Bethesda, Maryland 2 Department of Anatomy, Physiology, and Genetics, Uniformed Services University of the Health Sciences, Bethesda, Maryland 3 Program in Neuroscience, Uniformed Services University of the Health Sciences, Bethesda, Maryland KEY WORDS oligodendrocyte; progenitor; fibroblast growth factor; lineage; retrovirus ABSTRACT Analysis of fibroblast growth factor 2 null (FGF2 / ) and wild-type (FGF2 / ) mice was used to interpret the potential in vivo role of endogenous FGF2 on oligodendrocyte lineage cell (OLC) responses during oligodendrogenesis and myelin- ation. In wild-type mouse spinal cord, FGF2 levels increased approximately threefold between the first and second postnatal weeks, a period corresponding with the peak of oligodendrogenesis. Absence of this developmental FGF2 elevation in FGF2 / mice eliminated the transient overproduction of oligodendrocytes that is known to occur at the peak of oligodendrogenesis in wild-type mice. Absence of FGF2 did not affect oligodendrocyte progenitor (OP) density or proliferation, based on BrdU incorporation, and also did not alter survival, based on TUNEL analysis. To examine OLC differenti- ation in vivo, retrovirus encoding-enhanced green fluorescent protein (GFP) was injected into the spinal cord to heritably label endogenous cycling cells in the white matter at postnatal day 7 and then identify the generated cells at postnatal day 28. Phenotypes of cells expressing GFP were identified by morphology and immunolabeling, using CC1 for oligodendrocytes and NG2 combined with platelet-derived growth factor receptor for OPs. Within the population of GFP-labeled cells, the proportion of oligodendrocytes was higher in FGF2 / mice, indicating that endogenous FGF2 inhibited OLC differentiation in wild-type mice. Furthermore, in FGF2 / mice fewer cells appeared to be generated from an initial retrovirus-labeled cell, consistent with more frequent differentiation into post-mitotic oligodendrocytes. This in vivo analysis demonstrates that the predominant role of endogenous FGF2 on OLCs in development is inhibition of differentiation. © 2004 Wiley-Liss, Inc. INTRODUCTION During development, growth factors regulate prolif- eration, differentiation, and survival of neural stem cells and progenitors to coordinate the formation of CNS structures. The generation of oligodendrocytes is an excellent example of cellular interactions regulated by growth factor signaling (Calver et al., 1998; Frutti- ger et al., 1999; Ye et al., 2002). Among the growth factors that may regulate OLC responses during the myelination period in postnatal development, FGF2 has been implicated as having multiple effects that vary depending on the stage of differentiation within the lineage progression. Specifically, in vitro studies have shown that FGF2 can enhance proliferation and Grant sponsor: NIH; Grant number: NS39293. Joshua C. Murtie is currently at Children’s Hospital, Boston, MA. *Correspondence to: Regina C. Armstrong, Department of Anatomy, Physiol- ogy, and Genetics, Uniformed Services University of the Health Sciences, 4301 Jones Bridge Road, Bethesda, MD 20814-4799. E-mail: [email protected] Received 12 August 2004; Accepted 1 October 2004 DOI 10.1002/glia.20142 Published online 1 December 2004 in Wiley InterScience (www.interscience. wiley.com). GLIA 49:542–554 (2005) © 2004 Wiley-Liss, Inc.
-
Upload
independent -
Category
Documents
-
view
2 -
download
0
Transcript of In vivo analysis of oligodendrocyte lineage development in postnatal FGF2 null mice
In Vivo Analysis of OligodendrocyteLineage Development in Postnatal
FGF2 Null MiceJOSHUA C. MURTIE,1 YONG-XING ZHOU,2 TUAN Q. LE,2
AND REGINA C. ARMSTRONG1,2,3*1Program in Molecular and Cell Biology, Uniformed Services University of the Health Sciences,
Bethesda, Maryland2Department of Anatomy, Physiology, and Genetics, Uniformed Services University of the
Health Sciences, Bethesda, Maryland3Program in Neuroscience, Uniformed Services University of the Health Sciences,
Bethesda, Maryland
KEY WORDS oligodendrocyte; progenitor; fibroblast growth factor; lineage; retrovirus
ABSTRACT Analysis of fibroblast growth factor 2 null (FGF2�/�) and wild-type(FGF2�/�) mice was used to interpret the potential in vivo role of endogenous FGF2 onoligodendrocyte lineage cell (OLC) responses during oligodendrogenesis and myelin-ation. In wild-type mouse spinal cord, FGF2 levels increased approximately threefoldbetween the first and second postnatal weeks, a period corresponding with the peak ofoligodendrogenesis. Absence of this developmental FGF2 elevation in FGF2�/� miceeliminated the transient overproduction of oligodendrocytes that is known to occur atthe peak of oligodendrogenesis in wild-type mice. Absence of FGF2 did not affectoligodendrocyte progenitor (OP) density or proliferation, based on BrdU incorporation,and also did not alter survival, based on TUNEL analysis. To examine OLC differenti-ation in vivo, retrovirus encoding-enhanced green fluorescent protein (GFP) was injectedinto the spinal cord to heritably label endogenous cycling cells in the white matter atpostnatal day 7 and then identify the generated cells at postnatal day 28. Phenotypes ofcells expressing GFP were identified by morphology and immunolabeling, using CC1 foroligodendrocytes and NG2 combined with platelet-derived growth factor � receptor forOPs. Within the population of GFP-labeled cells, the proportion of oligodendrocytes washigher in FGF2�/� mice, indicating that endogenous FGF2 inhibited OLC differentiationin wild-type mice. Furthermore, in FGF2�/� mice fewer cells appeared to be generatedfrom an initial retrovirus-labeled cell, consistent with more frequent differentiation intopost-mitotic oligodendrocytes. This in vivo analysis demonstrates that the predominantrole of endogenous FGF2 on OLCs in development is inhibition of differentiation.© 2004 Wiley-Liss, Inc.
INTRODUCTION
During development, growth factors regulate prolif-eration, differentiation, and survival of neural stemcells and progenitors to coordinate the formation ofCNS structures. The generation of oligodendrocytes isan excellent example of cellular interactions regulatedby growth factor signaling (Calver et al., 1998; Frutti-ger et al., 1999; Ye et al., 2002). Among the growthfactors that may regulate OLC responses during themyelination period in postnatal development, FGF2has been implicated as having multiple effects that
vary depending on the stage of differentiation withinthe lineage progression. Specifically, in vitro studieshave shown that FGF2 can enhance proliferation and
Grant sponsor: NIH; Grant number: NS39293.Joshua C. Murtie is currently at Children’s Hospital, Boston, MA.
*Correspondence to: Regina C. Armstrong, Department of Anatomy, Physiol-ogy, and Genetics, Uniformed Services University of the Health Sciences, 4301Jones Bridge Road, Bethesda, MD 20814-4799. E-mail: [email protected]
Received 12 August 2004; Accepted 1 October 2004
DOI 10.1002/glia.20142
Published online 1 December 2004 in Wiley InterScience (www.interscience.wiley.com).
GLIA 49:542–554 (2005)
© 2004 Wiley-Liss, Inc.
migration of early stage OPs while inhibiting differen-tiation of cells at later stages in the lineage (McKinnonet al., 1990; Bansal and Pfeiffer, 1997; Decker et al.,2000; Jiang et al., 2001).
These differential FGF2 effects may be the result ofvarying expression profiles for the high-affinity FGFreceptors (FGFRs). In developing OLCs analyzed invitro, FGFR1 is expressed at all oligodendrocyte lin-eage stages. In contrast, FGFR3 is most abundant inlate progenitors, and FGFR2 increases during terminaldifferentiation to mature oligodendrocytes (Bansal etal., 1996). FGFR3 signaling has been interpreted aspromoting OLC differentiation since during develop-ment FGFR3 null mice show decreased oligodendrocytepopulations relative to wild-type mice, without detect-able changes in OLC proliferation or survival (Oh etal., 2003). This in vivo effect would be in contrast to thein vitro effect of FGF2 on OLC differentiation. There-fore, either FGF2 acts differently in vivo than in vitroand/or FGFR types other than FGFR3 may be prefer-entially activated by FGF2. Indeed, FGF2 is a poorligand for FGFR3, including the IgIIIc splice variantexpressed by oligodendrocytes, and other FGF familymembers would be predicted as more optimal ligands(Ornitz and Leder, 1992; Lin et al., 1997; Chellaiah etal., 1999).
To interpret the role of endogenous FGF2 duringoligodendrogenesis more specifically, the current studyanalyzes OLC responses in wild-type and FGF2 null(FGF2�/�) mice. Mice with FGF2 deletion do not ex-hibit gross phenotypic abnormalities (Dono et al., 1998;Ortega et al., 1998; Zhou et al., 1998). Subtle defects inthe CNS development of FGF2�/� mice have been re-ported as reduced proliferation during cortical neuro-genesis (Vaccarino et al., 1999). We used early postna-tal spinal cord as a model system for in vivo analysis ofoligodendrocyte generation in wild-type and FGF2�/�
mice. We show that in wild-type mice FGF2 levelsincrease dramatically before the peak of oligodendro-cyte production during spinal cord development. Elim-ination of this FGF2 elevation in FGF2�/� mice doesnot effect OLC proliferation or survival. However,FGF2�/� mice do not exhibit the transient overproduc-tion of oligodendrocytes that appears to be a componentof normal oligodendrogenesis before matching the finalnumber of oligodendrocytes to axonal availability. Im-portantly, using retroviral lineage tracing and clusteranalysis, we reveal a predominant role of FGF2 as aninhibitor of OLC terminal differentiation that modu-lates oligodendrocyte generation during development.
MATERIALS AND METHODSAnimals
Mice were bred and maintained in the USUHS ani-mal housing facility and all procedures were performedin accordance with guidelines of the National Insti-tutes of Health, the USUHS Institutional Animal Careand Use Committee, and the Society for Neuroscience.
FGF2 knockout (FGF2�/�) mice and wild-type(FGF2�/�) mice, of the same 129 Sv-Ev:Black Swiss ge-netic background, were obtained from breeding heterozy-gous pairs (generously provided by Dr. Doetschman, Uni-versity of Cincinnati). The FGF2 knockout was generatedby a targeted deletion replacing a 0.5-kb portion of theFGF2 gene including 121 bp of the promoter and theentire first exon with an Hprt mini-gene (Zhou et al.,1998). Mice were genotyped using polymerase chain re-action (PCR) analysis of tail DNA to identify wild-typeFGF2 and the targeted allele, as described in Zhou et al.(1998). FGF2�/� mice do not have detectable full-lengthor truncated FGF2 mRNA transcripts or protein (Zhou etal., 1998).
Tissue Preparation and HistopathologicalAnalysis
Mice were perfused with 4% paraformaldehyde; spi-nal cords were then dissected before overnight postfix-ation in 4% paraformaldehyde (Redwine and Arm-strong, 1998). Segments of spinal cord werecryoprotected and embedded in OCT compound for im-munostaining, in situ hybridization, and TUNELstaining. Myelination was evaluated by immunohisto-chemistry (see below) or in 7-�m paraffin sections us-ing either toluidine blue staining or Luxol fast bluewith periodic acid-Schiff (PAS) reaction (Mason et al.,2001; Armstrong et al., 2002).
Kinetic RT-PCR
After euthanasia, spinal cords were rapidly removedand homogenized. RNA was isolated using Stat-60(TEL-TEST, Friendswood, TX). For each mouse, 2 �gtotal RNA was reverse transcribed using random hex-amer primers. According to the methods detailed forthe ABI PRISM 7700 TaqMan System (PE AppliedBiosystems, Foster City, CA), mouse FGF2 primers(forward primer CCCACCAGGCCACTTCAA from nu-cleotide 60; reverse primer TCTCTCTTCTGCTTG-GAGGTTGTAGTT from nucleotide 204) were designedto flank an intervening FGF2 probe (CCCAAGCG-GCTCTACTGCAAGAACG from nucleotide 82) thatwas labeled with a fluorochrome (6-FAM) on the 5� end,as well as a fluorescence quencher (TAMRA) on the3� end (Messersmith et al., 2000). The total RNA valuesand RT reaction efficiency was normalized by measur-ing 18S rRNA for each sample in parallel. Full-lengthmurine FGF2 plasmid cDNA was used to generate thestandard curve.
Western Blots
Spinal cords were rapidly removed and homogenizedin protein lysis buffer (1� phosphate-buffered saline[PBS], 2% sodium dodecyl sulfate [SDS], 1% Nonidet
543FGF2 INHIBITS OLC DIFFERENTIATION IN VIVO
P-40 [NP-40], 0.5% Na deoxycholate). Spinal cord ho-mogenates were incubated with protease inhibitors for30 min at 4°C under constant rotation and then centri-fuged at 15,000 rpm for 20 min at 4°C, before affinitypurification by overnight incubation at 4°C with pre-washed heparin-Sepharose CL-6B (Pharmacia Biotech,Sweden). Proteins were solubilized from the heparin-Sepharose beads by the addition of 2� Laemmli samplebuffer and incubation at 65°C for 20 min. Human re-combinant FGF2 (18 kD; R&D Systems, Minneapolis,MN) was used as a positive control. Homogenates fromFGF2�/� mice were used as a negative control.
Eluates were electrophoresed in a 14% Tris-glycinegel. Kaleidoscope Standards (Bio-Rad, Hercules, CA)and proteins were transferred to an Immobilon-PPVDF membrane (Millipore, Bedford, MA). Beforetransfer, the membrane was wetted in 100% methanolfor 15 s, washed in water for 2 min, and equilibrated intransfer buffer for more than 1 min. The gel was alsoequilibrated in transfer buffer for more than 1 min.Proteins were transferred at 16 volts for 90 min intransfer buffer. After washing the membrane in twobrief rinses of distilled water, nonspecific binding wasblocked by incubating at room temperature with3% nonfat milk (Bio-Rad) in 1� PBS without Mg2� andCa2� for 30 min. The blocking solution was replacedwith the same buffer containing anti-FGF2 antibody(monoclonal anti-human fibroblast growth factor-basic,clone FB-8; Sigma, St. Louis, MO; 1:200 dilution), andthe membrane incubated overnight at 4°C with gentleagitation. The membrane was washed in distilled wa-ter twice and incubated with anti-mouse Ig conjugatedto horseradish peroxidase (Amersham Pharmacia Bio-tech, UK; 1:3,000 dilution) at room temperature for 1 h.Blots were rinsed in PBS with 0.05% Tween 20 twice,and washed an additional 3 times in PBS with 0.05%Tween 20 for 10 min each. Immunolabeled proteinbands were detected with enhanced chemiluminescent(ECL) reagent (Pierce, Rockford, IL) and exposure toBioMax film (Kodak, Rochester, NY). FGF2 proteinlevels were quantified using Metamorph image analy-sis software (Universal Imaging, West Chester, PA)and normalized to actin loading controls.
In Situ Hybridization
In situ hybridization and preparation of digoxigenin-labeled riboprobes were performed as previously de-tailed (Redwine and Armstrong, 1998; Messersmith etal., 2000). Antisense riboprobes were used to detectmRNA transcripts for proteolipid protein (PLP; a giftfrom Dr. Lynn Hudson; National Institutes of Health;Hudson et al., 1987) and platelet-derived growth fac-tor-� receptor (PDGF�R; gift from Dr. Bill Richardson;University College London; Fruttiger et al., 1999). Thedigoxigenin-labeled riboprobes were hybridized to15-�m cryosections of brain or spinal cord tissues.Digoxigenin was detected with an alkaline phospha-tase-conjugated sheep anti-digoxigenin antibody (Boe-
hringer-Mannheim, Indianapolis, IN), followed by re-action with NBT/BCIP substrate (DAKO, Carpinteria,CA).
BrdU Incorporation and Detection
Male mouse pups were injected intraperitoneallywith 200 mg/kg bromodeoxyuridine (BrdU; Sigma, St.Louis, MO) one of two different experimental para-digms. A short terminal BrdU pulse (injections at 4 hand 2 h before sacrifice; Redwine and Armstrong, 1998)was used to detect actively cycling cells without anintervening period for subsequent differentiation to oc-cur. A long-term BrdU administration protocol (Cam-eron and McKay, 2001) was used to analyze the totalproliferative response at P7–P15. Each mouse was in-jected twice (12 h between injections) on P7, P9, P11,and P13. BrdU injections were given on alternate daysto avoid concerns of potentially harmful effects fromhigh levels of BrdU incorporation.
In situ hybridization combined with BrdU detectionwas carried out as detailed previously (Redwine andArmstrong, 1998). After in situ hybridization, sectionswere treated with HCl and then incubated overnightwith a monoclonal anti-BrdU antibody directly conju-gated with horseradish peroxidase (diluted 1:15;Boehringer Mannheim). Peroxidase activity was de-tected by incubation with 3, 3�-diaminobenzidine(DAB; Vector Laboratories, Burlingame, CA).
Apoptosis
P7 and P15 mouse spinal cord tissues were analyzedfor cells undergoing apoptosis. Cryosections (15 �m)were processed using a modified TUNEL assay (Ap-opTag Plus peroxidase in situ apoptosis detection kit;Intergen, Purchase, NY). The 3�-OH DNA ends, gener-ated by DNA fragmentation typically observed withapoptotic cells, were labeled with digoxigenin-dUTPusing terminal deoxynucleotidyl transferase (TdT).The digoxigenin tag was then detected with an anti-digoxigenin antibody conjugated with peroxidase toyield a dark brown reaction product with DAB sub-strate. The sections were lightly counterstained withmethyl green to detect nuclei.
Immunohistochemistry
To identify OPs in situ, 15-�m cryosections wereimmunostained for NG2 and PDGF�R (Messersmith etal., 2000; Armstrong et al., 2002). Primary antibodiesused were rabbit polyclonal anti-NG2 antibody (1:500;gift from Dr. William Stallcup, La Jolla, CA) and ratmonoclonal anti-PDGF�R antibody (APA5 used at1:200; Pharmingen, San Diego, CA). Donkey anti-rab-bit IgG F(ab�)
2fragment conjugated with Cy3 (Jackson
ImmunoResearch, West Grove, PA) was used to detect
544 MURTIE ET AL.
NG2, while the PDGF�R was detected with biotinyl-ated donkey anti-rat IgG F(ab�)2 fragment (JacksonImmunoResearch), followed by coumarin tyramide am-plification (New England Nuclear, Boston, MA). Addi-tional sections were immunostained for NG2 and alsostained with DAPI (Sigma) to detect nuclei and identifyOPs undergoing mitosis.
Mature oligodendrocytes were identified with CC1,which immunostains oligodendrocyte cell bodies with-out labeling myelin (Fuss et al., 2000). The CC1 anti-body (Oncogene Research Products, Cambridge, MA)was detected with donkey anti-mouse IgG F(ab�)2 frag-ment conjugated with Cy3 (Jackson ImmunoResearch).The CC1 immunostaining conditions were previouslytested to ensure that CC1 did not label astrocytes orNG2-labeled cells (Messersmith et al., 2000).
Myelin was immunostained with monoclonal anti-body 8-18C5, which recognizes myelin oligodendrocyteglycoprotein (MOG; hybridoma cells provided byDr. Minetta Gardinier; University of Iowa, Iowa City,IA) (Linnington et al., 1984).
Retrovirus Production
A 293 cell line stably transfected with pNIT-greenfluorescent protein (GFP), a replication-incompetentretroviral expression vector encoding GFP, (providedby Dr. Fred Gage; Salk Institute, La Jolla, CA; Palmeret al., 1999) was transiently transfected with pMD.G(plasmid containing the vesicular stomatitis virus gly-coprotein) and cultured for 2 days. Virion-containingsupernatants were concentrated 100-fold by centrifu-gation at 50,000g at 4°C for 150 min. Viral pellets werereconstituted in Hanks balanced salt solution to a finalconcentration of 100� the original volume. Titers,which were typically about 105 cfu/ml, were deter-mined by GFP expression after infection of NIH 3T3cells with serial dilutions of concentrated virus.
Surgery and Retrovirus Injection
P7 male mouse pups were placed on cooling blocksand anesthetized with isoflurane, using the ADS 1000anesthesia delivery system (Engler Engineering; Hi-aleah, FL) with a mouse anesthesia mask (StoeltingPhysiology Research Instruments; Wood Dale, IL). Par-tial laminectomy was performed to expose the L5 spi-nal cord through the intervertebral space. A range ofviral titers (10, 30, or 60 cfu in 1.0 �l) was injected intothe dorsal column through a pulled glass pipette (outerdiameter �50 �m) mounted on a Hamilton syringe at arate of 0.2 �m per min (Levison et al., 1999). Aftersurgery, the wounds were closed with a single woundclip and the pups were returned to their mother.
Retroviral Lineage Tracing
Mice injected with NIT-GFP retrovirus at P7 weretranscardially perfused on P28 with 3% paraformalde-hyde in 0.1 M phosphate buffer, followed by fixationovernight at 4°C in 3% paraformaldehyde solution. Tis-sues were cryoprotected in 30% sucrose overnight at4°C after overnight fixation. Cryoprotected tissue wasthen embedded in OCT compound and stored at �80°C.Tissues were sectioned and immunostained for celltype-specific markers.
Retroviral Cluster Analysis
Spinal cord tissue from mice injected with retrovirus(NIT-GFP) at P7 and perfused on P28 was longitudi-nally sectioned at 100 �m intervals on a Vibratome.Serial sections were structurally aligned on a gelatin-coated slide so that cells belonging to a single clonecould be counted across multiple sections. A range ofviral titers was injected using the same 3-week lineagetracing period (P7–P28). Clusters were counted to val-idate the working definition of a cluster as a cohort ofcells that was likely to have been generated from asingle retrovirus infected cell. Within a section, cellswere assigned to the same cluster if they were sepa-rated from an adjacent cell by less than a field of viewat 40� magnification (X,Y distance of 330 �m). Be-tween sections, cells were assigned to a cluster if theX,Y separation was within a field of view relative toany cell on an adjacent section. This analysis demon-strated the number of clusters per animal corre-sponded with increased virus titer (R2 � 0.99).
Imaging, Quantification, and StatisticalAnalysis
Images of immunostaining and in situ hybridizationresults were captured with a Spot 2 digital camera onan Olympus IX-70 microscope. Fluorescence channelswere imaged singly or in combination using narrowbandpass filter sets for Cy3, FITC/GFP, and AMCA ora triple bandpass filter (Chroma Technologies, Brattle-boro, VT). Images were prepared as panels using AdobePhotoshop. Immunofluorescence signal intensitywithin a given area was quantified from digital imagesusing Metamorph Software (Universal Imaging, WestChester, PA) to select the region of interest and calcu-late the average pixel intensity of the region.
For quantification of cell density, entire 15 �m-thicktransverse sections of spinal cord were sampled. Alllabeled cells within each section were counted and thearea was measured to determine cells/mm2. Each cat-egory analyzed included three or more tissue sectionsper mouse and three or more mice per condition. Spe-cific numbers of animals per sample are noted in thetext and/or figure legends. Unpaired Student’s t-testswere used to identify significant differences between
545FGF2 INHIBITS OLC DIFFERENTIATION IN VIVO
genotypes and/or treatments. The significance of pro-portions generated in lineage tracing was tested usingthe �2 statistical test. The Wilcoxon ranked-sums testwas used to determine statistical significance of clusteranalysis in the developing spinal cord.
RESULTSDevelopmental Elevation of FGF2 in the
Normal Spinal Cord
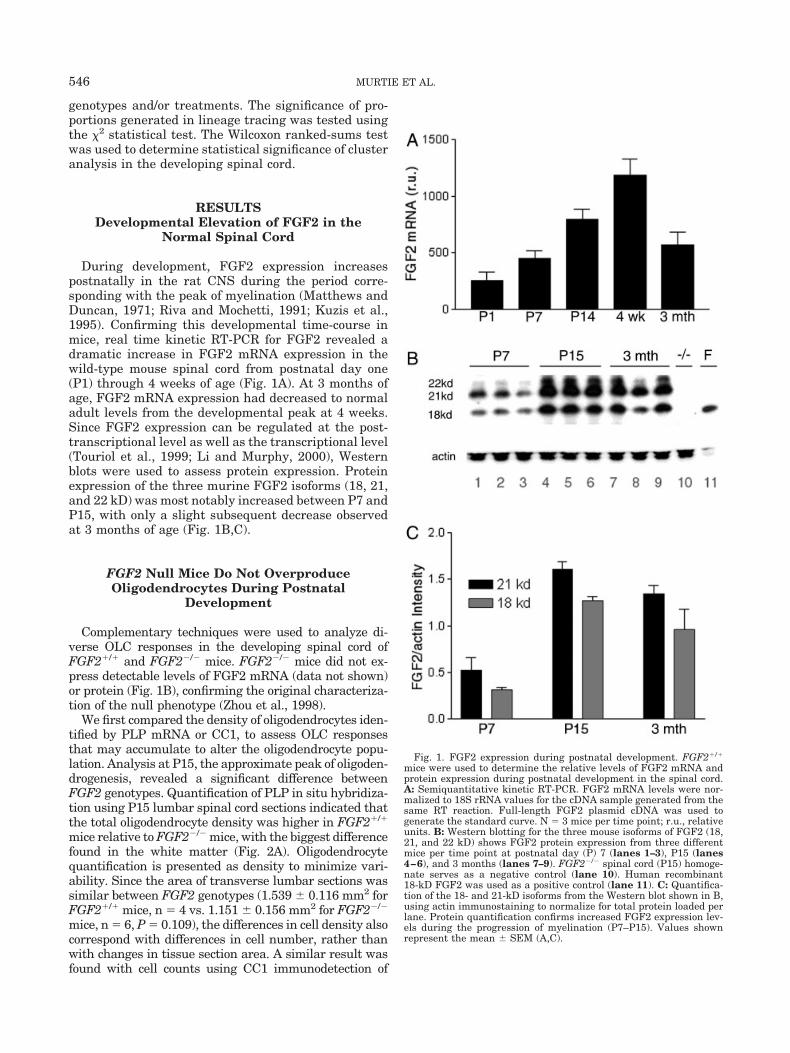
During development, FGF2 expression increasespostnatally in the rat CNS during the period corre-sponding with the peak of myelination (Matthews andDuncan, 1971; Riva and Mochetti, 1991; Kuzis et al.,1995). Confirming this developmental time-course inmice, real time kinetic RT-PCR for FGF2 revealed adramatic increase in FGF2 mRNA expression in thewild-type mouse spinal cord from postnatal day one(P1) through 4 weeks of age (Fig. 1A). At 3 months ofage, FGF2 mRNA expression had decreased to normaladult levels from the developmental peak at 4 weeks.Since FGF2 expression can be regulated at the post-transcriptional level as well as the transcriptional level(Touriol et al., 1999; Li and Murphy, 2000), Westernblots were used to assess protein expression. Proteinexpression of the three murine FGF2 isoforms (18, 21,and 22 kD) was most notably increased between P7 andP15, with only a slight subsequent decrease observedat 3 months of age (Fig. 1B,C).
FGF2 Null Mice Do Not OverproduceOligodendrocytes During Postnatal
Development
Complementary techniques were used to analyze di-verse OLC responses in the developing spinal cord ofFGF2�/� and FGF2�/� mice. FGF2�/� mice did not ex-press detectable levels of FGF2 mRNA (data not shown)or protein (Fig. 1B), confirming the original characteriza-tion of the null phenotype (Zhou et al., 1998).
We first compared the density of oligodendrocytes iden-tified by PLP mRNA or CC1, to assess OLC responsesthat may accumulate to alter the oligodendrocyte popu-lation. Analysis at P15, the approximate peak of oligoden-drogenesis, revealed a significant difference betweenFGF2 genotypes. Quantification of PLP in situ hybridiza-tion using P15 lumbar spinal cord sections indicated thatthe total oligodendrocyte density was higher in FGF2�/�
mice relative to FGF2�/� mice, with the biggest differencefound in the white matter (Fig. 2A). Oligodendrocytequantification is presented as density to minimize vari-ability. Since the area of transverse lumbar sections wassimilar between FGF2 genotypes (1.539 0.116 mm2 forFGF2�/� mice, n � 4 vs. 1.151 0.156 mm2 for FGF2�/�
mice, n � 6, P � 0.109), the differences in cell density alsocorrespond with differences in cell number, rather thanwith changes in tissue section area. A similar result wasfound with cell counts using CC1 immunodetection of
Fig. 1. FGF2 expression during postnatal development. FGF2�/�
mice were used to determine the relative levels of FGF2 mRNA andprotein expression during postnatal development in the spinal cord.A: Semiquantitative kinetic RT-PCR. FGF2 mRNA levels were nor-malized to 18S rRNA values for the cDNA sample generated from thesame RT reaction. Full-length FGF2 plasmid cDNA was used togenerate the standard curve. N � 3 mice per time point; r.u., relativeunits. B: Western blotting for the three mouse isoforms of FGF2 (18,21, and 22 kD) shows FGF2 protein expression from three differentmice per time point at postnatal day (P) 7 (lanes 1–3), P15 (lanes4–6), and 3 months (lanes 7–9). FGF2�/� spinal cord (P15) homoge-nate serves as a negative control (lane 10). Human recombinant18-kD FGF2 was used as a positive control (lane 11). C: Quantifica-tion of the 18- and 21-kD isoforms from the Western blot shown in B,using actin immunostaining to normalize for total protein loaded perlane. Protein quantification confirms increased FGF2 expression lev-els during the progression of myelination (P7–P15). Values shownrepresent the mean SEM (A,C).
546 MURTIE ET AL.
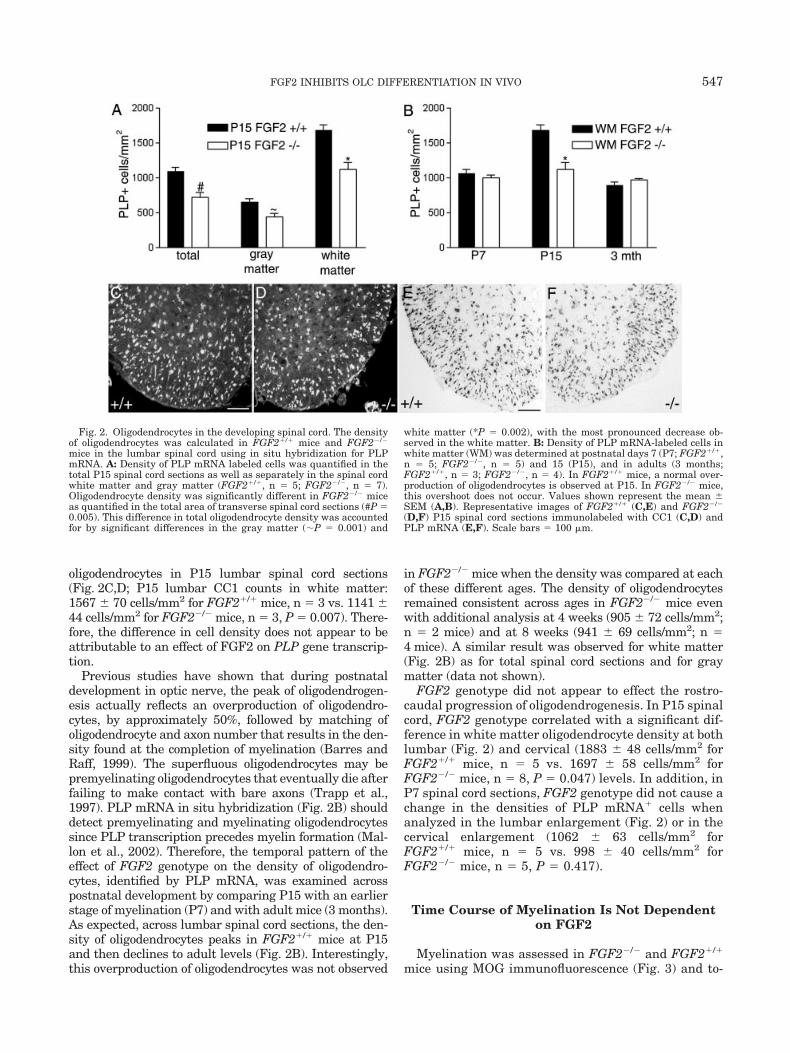
oligodendrocytes in P15 lumbar spinal cord sections(Fig. 2C,D; P15 lumbar CC1 counts in white matter:1567 70 cells/mm2 for FGF2�/� mice, n � 3 vs. 1141 44 cells/mm2 for FGF2�/� mice, n � 3, P � 0.007). There-fore, the difference in cell density does not appear to beattributable to an effect of FGF2 on PLP gene transcrip-tion.
Previous studies have shown that during postnataldevelopment in optic nerve, the peak of oligodendrogen-esis actually reflects an overproduction of oligodendro-cytes, by approximately 50%, followed by matching ofoligodendrocyte and axon number that results in the den-sity found at the completion of myelination (Barres andRaff, 1999). The superfluous oligodendrocytes may bepremyelinating oligodendrocytes that eventually die afterfailing to make contact with bare axons (Trapp et al.,1997). PLP mRNA in situ hybridization (Fig. 2B) shoulddetect premyelinating and myelinating oligodendrocytessince PLP transcription precedes myelin formation (Mal-lon et al., 2002). Therefore, the temporal pattern of theeffect of FGF2 genotype on the density of oligodendro-cytes, identified by PLP mRNA, was examined acrosspostnatal development by comparing P15 with an earlierstage of myelination (P7) and with adult mice (3 months).As expected, across lumbar spinal cord sections, the den-sity of oligodendrocytes peaks in FGF2�/� mice at P15and then declines to adult levels (Fig. 2B). Interestingly,this overproduction of oligodendrocytes was not observed
in FGF2�/� mice when the density was compared at eachof these different ages. The density of oligodendrocytesremained consistent across ages in FGF2�/� mice evenwith additional analysis at 4 weeks (905 72 cells/mm2;n � 2 mice) and at 8 weeks (941 69 cells/mm2; n �4 mice). A similar result was observed for white matter(Fig. 2B) as for total spinal cord sections and for graymatter (data not shown).
FGF2 genotype did not appear to effect the rostro-caudal progression of oligodendrogenesis. In P15 spinalcord, FGF2 genotype correlated with a significant dif-ference in white matter oligodendrocyte density at bothlumbar (Fig. 2) and cervical (1883 48 cells/mm2 forFGF2�/� mice, n � 5 vs. 1697 58 cells/mm2 forFGF2�/� mice, n � 8, P � 0.047) levels. In addition, inP7 spinal cord sections, FGF2 genotype did not cause achange in the densities of PLP mRNA� cells whenanalyzed in the lumbar enlargement (Fig. 2) or in thecervical enlargement (1062 63 cells/mm2 forFGF2�/� mice, n � 5 vs. 998 40 cells/mm2 forFGF2�/� mice, n � 5, P � 0.417).
Time Course of Myelination Is Not Dependenton FGF2
Myelination was assessed in FGF2�/� and FGF2�/�
mice using MOG immunofluorescence (Fig. 3) and to-
Fig. 2. Oligodendrocytes in the developing spinal cord. The densityof oligodendrocytes was calculated in FGF2�/� mice and FGF2�/�
mice in the lumbar spinal cord using in situ hybridization for PLPmRNA. A: Density of PLP mRNA labeled cells was quantified in thetotal P15 spinal cord sections as well as separately in the spinal cordwhite matter and gray matter (FGF2�/�, n � 5; FGF2�/�, n � 7).Oligodendrocyte density was significantly different in FGF2�/� miceas quantified in the total area of transverse spinal cord sections (#P �0.005). This difference in total oligodendrocyte density was accountedfor by significant differences in the gray matter (P � 0.001) and
white matter (*P � 0.002), with the most pronounced decrease ob-served in the white matter. B: Density of PLP mRNA-labeled cells inwhite matter (WM) was determined at postnatal days 7 (P7; FGF2�/�,n � 5; FGF2�/�, n � 5) and 15 (P15), and in adults (3 months;FGF2�/�, n � 3; FGF2�/�, n � 4). In FGF2�/� mice, a normal over-production of oligodendrocytes is observed at P15. In FGF2�/� mice,this overshoot does not occur. Values shown represent the mean SEM (A,B). Representative images of FGF2�/� (C,E) and FGF2�/�
(D,F) P15 spinal cord sections immunolabeled with CC1 (C,D) andPLP mRNA (E,F). Scale bars � 100 �m.
547FGF2 INHIBITS OLC DIFFERENTIATION IN VIVO
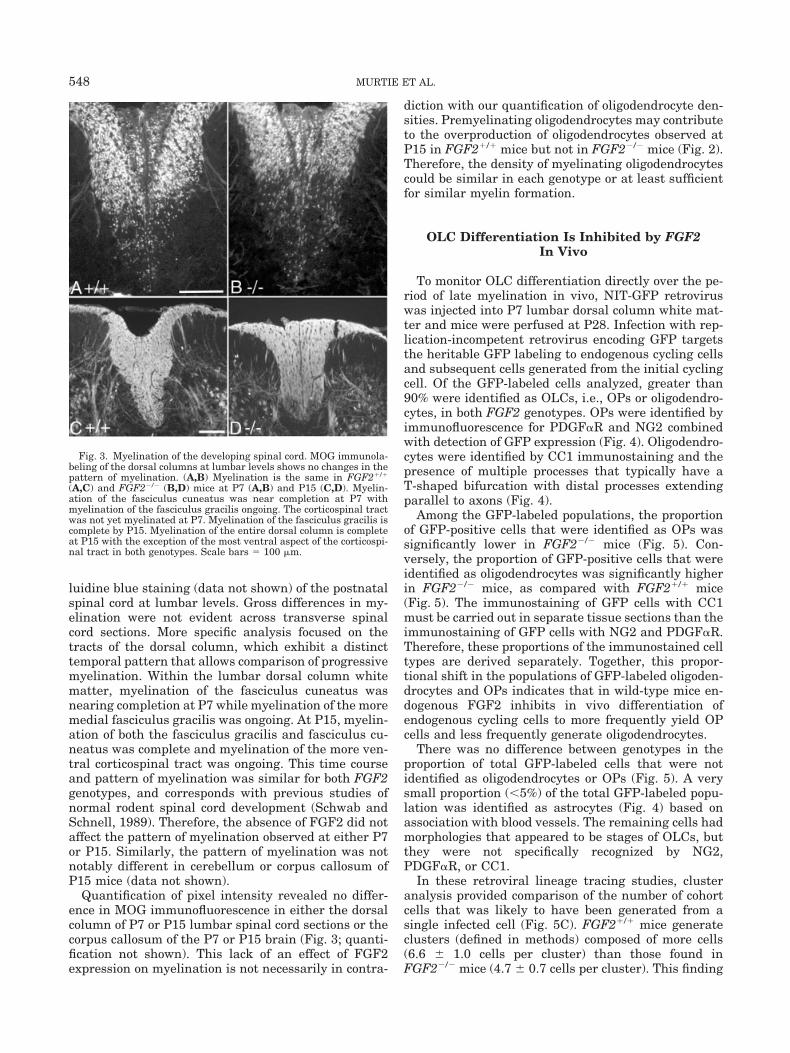
luidine blue staining (data not shown) of the postnatalspinal cord at lumbar levels. Gross differences in my-elination were not evident across transverse spinalcord sections. More specific analysis focused on thetracts of the dorsal column, which exhibit a distincttemporal pattern that allows comparison of progressivemyelination. Within the lumbar dorsal column whitematter, myelination of the fasciculus cuneatus wasnearing completion at P7 while myelination of the moremedial fasciculus gracilis was ongoing. At P15, myelin-ation of both the fasciculus gracilis and fasciculus cu-neatus was complete and myelination of the more ven-tral corticospinal tract was ongoing. This time courseand pattern of myelination was similar for both FGF2genotypes, and corresponds with previous studies ofnormal rodent spinal cord development (Schwab andSchnell, 1989). Therefore, the absence of FGF2 did notaffect the pattern of myelination observed at either P7or P15. Similarly, the pattern of myelination was notnotably different in cerebellum or corpus callosum ofP15 mice (data not shown).
Quantification of pixel intensity revealed no differ-ence in MOG immunofluorescence in either the dorsalcolumn of P7 or P15 lumbar spinal cord sections or thecorpus callosum of the P7 or P15 brain (Fig. 3; quanti-fication not shown). This lack of an effect of FGF2expression on myelination is not necessarily in contra-
diction with our quantification of oligodendrocyte den-sities. Premyelinating oligodendrocytes may contributeto the overproduction of oligodendrocytes observed atP15 in FGF2�/� mice but not in FGF2�/� mice (Fig. 2).Therefore, the density of myelinating oligodendrocytescould be similar in each genotype or at least sufficientfor similar myelin formation.
OLC Differentiation Is Inhibited by FGF2In Vivo
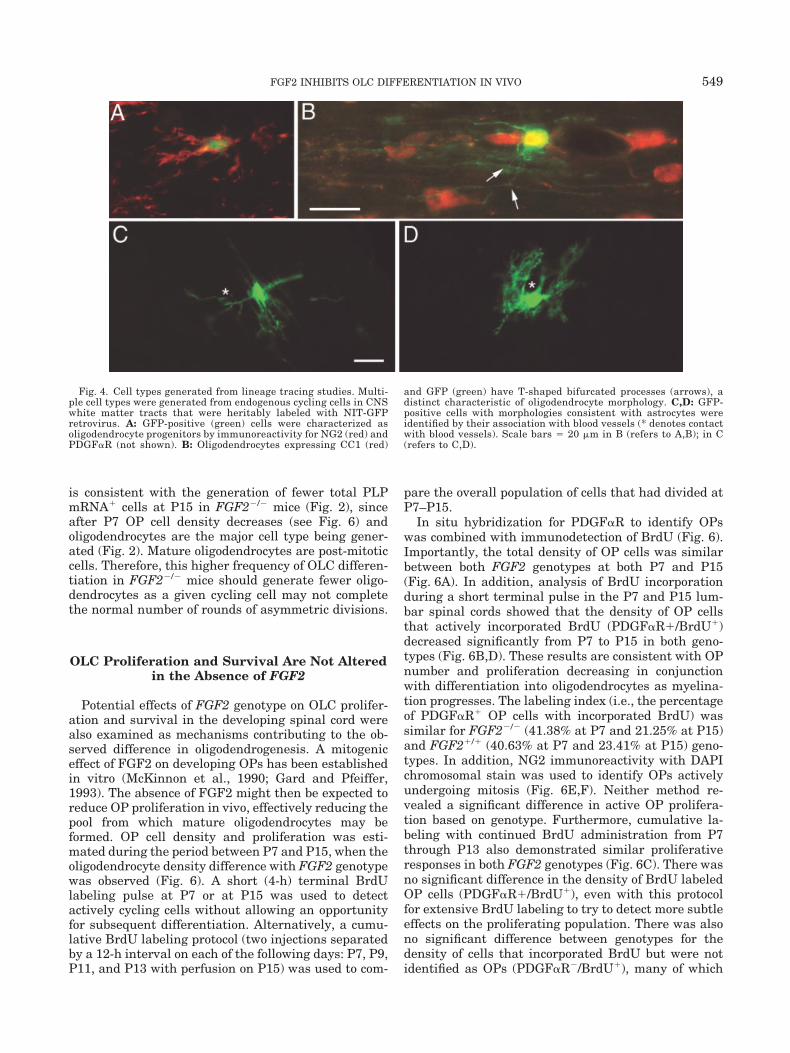
To monitor OLC differentiation directly over the pe-riod of late myelination in vivo, NIT-GFP retroviruswas injected into P7 lumbar dorsal column white mat-ter and mice were perfused at P28. Infection with rep-lication-incompetent retrovirus encoding GFP targetsthe heritable GFP labeling to endogenous cycling cellsand subsequent cells generated from the initial cyclingcell. Of the GFP-labeled cells analyzed, greater than90% were identified as OLCs, i.e., OPs or oligodendro-cytes, in both FGF2 genotypes. OPs were identified byimmunofluorescence for PDGF�R and NG2 combinedwith detection of GFP expression (Fig. 4). Oligodendro-cytes were identified by CC1 immunostaining and thepresence of multiple processes that typically have aT-shaped bifurcation with distal processes extendingparallel to axons (Fig. 4).
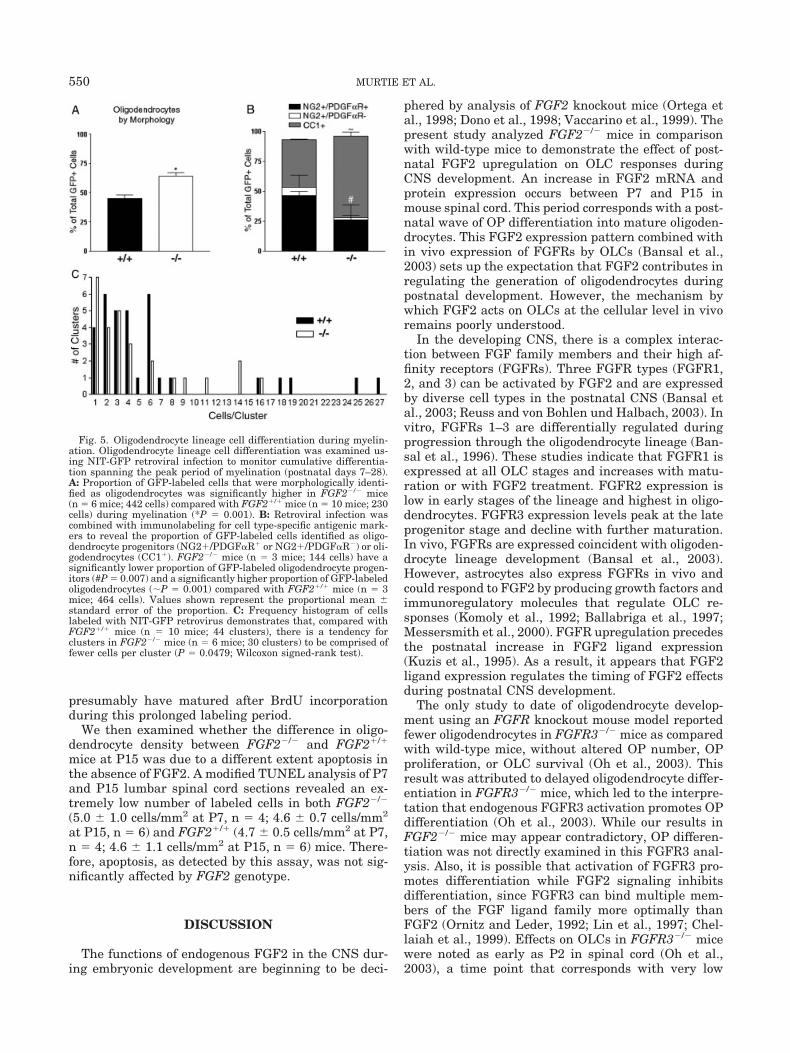
Among the GFP-labeled populations, the proportionof GFP-positive cells that were identified as OPs wassignificantly lower in FGF2�/� mice (Fig. 5). Con-versely, the proportion of GFP-positive cells that wereidentified as oligodendrocytes was significantly higherin FGF2�/� mice, as compared with FGF2�/� mice(Fig. 5). The immunostaining of GFP cells with CC1must be carried out in separate tissue sections than theimmunostaining of GFP cells with NG2 and PDGF�R.Therefore, these proportions of the immunostained celltypes are derived separately. Together, this propor-tional shift in the populations of GFP-labeled oligoden-drocytes and OPs indicates that in wild-type mice en-dogenous FGF2 inhibits in vivo differentiation ofendogenous cycling cells to more frequently yield OPcells and less frequently generate oligodendrocytes.
There was no difference between genotypes in theproportion of total GFP-labeled cells that were notidentified as oligodendrocytes or OPs (Fig. 5). A verysmall proportion (�5%) of the total GFP-labeled popu-lation was identified as astrocytes (Fig. 4) based onassociation with blood vessels. The remaining cells hadmorphologies that appeared to be stages of OLCs, butthey were not specifically recognized by NG2,PDGF�R, or CC1.
In these retroviral lineage tracing studies, clusteranalysis provided comparison of the number of cohortcells that was likely to have been generated from asingle infected cell (Fig. 5C). FGF2�/� mice generateclusters (defined in methods) composed of more cells(6.6 1.0 cells per cluster) than those found inFGF2�/� mice (4.7 0.7 cells per cluster). This finding
Fig. 3. Myelination of the developing spinal cord. MOG immunola-beling of the dorsal columns at lumbar levels shows no changes in thepattern of myelination. (A,B) Myelination is the same in FGF2�/�
(A,C) and FGF2�/� (B,D) mice at P7 (A,B) and P15 (C,D). Myelin-ation of the fasciculus cuneatus was near completion at P7 withmyelination of the fasciculus gracilis ongoing. The corticospinal tractwas not yet myelinated at P7. Myelination of the fasciculus gracilis iscomplete by P15. Myelination of the entire dorsal column is completeat P15 with the exception of the most ventral aspect of the corticospi-nal tract in both genotypes. Scale bars � 100 �m.
548 MURTIE ET AL.
is consistent with the generation of fewer total PLPmRNA� cells at P15 in FGF2�/� mice (Fig. 2), sinceafter P7 OP cell density decreases (see Fig. 6) andoligodendrocytes are the major cell type being gener-ated (Fig. 2). Mature oligodendrocytes are post-mitoticcells. Therefore, this higher frequency of OLC differen-tiation in FGF2�/� mice should generate fewer oligo-dendrocytes as a given cycling cell may not completethe normal number of rounds of asymmetric divisions.
OLC Proliferation and Survival Are Not Alteredin the Absence of FGF2
Potential effects of FGF2 genotype on OLC prolifer-ation and survival in the developing spinal cord werealso examined as mechanisms contributing to the ob-served difference in oligodendrogenesis. A mitogeniceffect of FGF2 on developing OPs has been establishedin vitro (McKinnon et al., 1990; Gard and Pfeiffer,1993). The absence of FGF2 might then be expected toreduce OP proliferation in vivo, effectively reducing thepool from which mature oligodendrocytes may beformed. OP cell density and proliferation was esti-mated during the period between P7 and P15, when theoligodendrocyte density difference with FGF2 genotypewas observed (Fig. 6). A short (4-h) terminal BrdUlabeling pulse at P7 or at P15 was used to detectactively cycling cells without allowing an opportunityfor subsequent differentiation. Alternatively, a cumu-lative BrdU labeling protocol (two injections separatedby a 12-h interval on each of the following days: P7, P9,P11, and P13 with perfusion on P15) was used to com-
pare the overall population of cells that had divided atP7–P15.
In situ hybridization for PDGF�R to identify OPswas combined with immunodetection of BrdU (Fig. 6).Importantly, the total density of OP cells was similarbetween both FGF2 genotypes at both P7 and P15(Fig. 6A). In addition, analysis of BrdU incorporationduring a short terminal pulse in the P7 and P15 lum-bar spinal cords showed that the density of OP cellsthat actively incorporated BrdU (PDGF�R�/BrdU�)decreased significantly from P7 to P15 in both geno-types (Fig. 6B,D). These results are consistent with OPnumber and proliferation decreasing in conjunctionwith differentiation into oligodendrocytes as myelina-tion progresses. The labeling index (i.e., the percentageof PDGF�R� OP cells with incorporated BrdU) wassimilar for FGF2�/� (41.38% at P7 and 21.25% at P15)and FGF2�/� (40.63% at P7 and 23.41% at P15) geno-types. In addition, NG2 immunoreactivity with DAPIchromosomal stain was used to identify OPs activelyundergoing mitosis (Fig. 6E,F). Neither method re-vealed a significant difference in active OP prolifera-tion based on genotype. Furthermore, cumulative la-beling with continued BrdU administration from P7through P13 also demonstrated similar proliferativeresponses in both FGF2 genotypes (Fig. 6C). There wasno significant difference in the density of BrdU labeledOP cells (PDGF�R�/BrdU�), even with this protocolfor extensive BrdU labeling to try to detect more subtleeffects on the proliferating population. There was alsono significant difference between genotypes for thedensity of cells that incorporated BrdU but were notidentified as OPs (PDGF�R�/BrdU�), many of which
Fig. 4. Cell types generated from lineage tracing studies. Multi-ple cell types were generated from endogenous cycling cells in CNSwhite matter tracts that were heritably labeled with NIT-GFPretrovirus. A: GFP-positive (green) cells were characterized asoligodendrocyte progenitors by immunoreactivity for NG2 (red) andPDGF�R (not shown). B: Oligodendrocytes expressing CC1 (red)
and GFP (green) have T-shaped bifurcated processes (arrows), adistinct characteristic of oligodendrocyte morphology. C,D: GFP-positive cells with morphologies consistent with astrocytes wereidentified by their association with blood vessels (* denotes contactwith blood vessels). Scale bars � 20 �m in B (refers to A,B); in C(refers to C,D).
549FGF2 INHIBITS OLC DIFFERENTIATION IN VIVO
presumably have matured after BrdU incorporationduring this prolonged labeling period.
We then examined whether the difference in oligo-dendrocyte density between FGF2�/� and FGF2�/�
mice at P15 was due to a different extent apoptosis inthe absence of FGF2. A modified TUNEL analysis of P7and P15 lumbar spinal cord sections revealed an ex-tremely low number of labeled cells in both FGF2�/�
(5.0 1.0 cells/mm2 at P7, n � 4; 4.6 0.7 cells/mm2
at P15, n � 6) and FGF2�/� (4.7 0.5 cells/mm2 at P7,n � 4; 4.6 1.1 cells/mm2 at P15, n � 6) mice. There-fore, apoptosis, as detected by this assay, was not sig-nificantly affected by FGF2 genotype.
DISCUSSION
The functions of endogenous FGF2 in the CNS dur-ing embryonic development are beginning to be deci-
phered by analysis of FGF2 knockout mice (Ortega etal., 1998; Dono et al., 1998; Vaccarino et al., 1999). Thepresent study analyzed FGF2�/� mice in comparisonwith wild-type mice to demonstrate the effect of post-natal FGF2 upregulation on OLC responses duringCNS development. An increase in FGF2 mRNA andprotein expression occurs between P7 and P15 inmouse spinal cord. This period corresponds with a post-natal wave of OP differentiation into mature oligoden-drocytes. This FGF2 expression pattern combined within vivo expression of FGFRs by OLCs (Bansal et al.,2003) sets up the expectation that FGF2 contributes inregulating the generation of oligodendrocytes duringpostnatal development. However, the mechanism bywhich FGF2 acts on OLCs at the cellular level in vivoremains poorly understood.
In the developing CNS, there is a complex interac-tion between FGF family members and their high af-finity receptors (FGFRs). Three FGFR types (FGFR1,2, and 3) can be activated by FGF2 and are expressedby diverse cell types in the postnatal CNS (Bansal etal., 2003; Reuss and von Bohlen und Halbach, 2003). Invitro, FGFRs 1–3 are differentially regulated duringprogression through the oligodendrocyte lineage (Ban-sal et al., 1996). These studies indicate that FGFR1 isexpressed at all OLC stages and increases with matu-ration or with FGF2 treatment. FGFR2 expression islow in early stages of the lineage and highest in oligo-dendrocytes. FGFR3 expression levels peak at the lateprogenitor stage and decline with further maturation.In vivo, FGFRs are expressed coincident with oligoden-drocyte lineage development (Bansal et al., 2003).However, astrocytes also express FGFRs in vivo andcould respond to FGF2 by producing growth factors andimmunoregulatory molecules that regulate OLC re-sponses (Komoly et al., 1992; Ballabriga et al., 1997;Messersmith et al., 2000). FGFR upregulation precedesthe postnatal increase in FGF2 ligand expression(Kuzis et al., 1995). As a result, it appears that FGF2ligand expression regulates the timing of FGF2 effectsduring postnatal CNS development.
The only study to date of oligodendrocyte develop-ment using an FGFR knockout mouse model reportedfewer oligodendrocytes in FGFR3�/� mice as comparedwith wild-type mice, without altered OP number, OPproliferation, or OLC survival (Oh et al., 2003). Thisresult was attributed to delayed oligodendrocyte differ-entiation in FGFR3�/� mice, which led to the interpre-tation that endogenous FGFR3 activation promotes OPdifferentiation (Oh et al., 2003). While our results inFGF2�/� mice may appear contradictory, OP differen-tiation was not directly examined in this FGFR3 anal-ysis. Also, it is possible that activation of FGFR3 pro-motes differentiation while FGF2 signaling inhibitsdifferentiation, since FGFR3 can bind multiple mem-bers of the FGF ligand family more optimally thanFGF2 (Ornitz and Leder, 1992; Lin et al., 1997; Chel-laiah et al., 1999). Effects on OLCs in FGFR3�/� micewere noted as early as P2 in spinal cord (Oh et al.,2003), a time point that corresponds with very low
Fig. 5. Oligodendrocyte lineage cell differentiation during myelin-ation. Oligodendrocyte lineage cell differentiation was examined us-ing NIT-GFP retroviral infection to monitor cumulative differentia-tion spanning the peak period of myelination (postnatal days 7–28).A: Proportion of GFP-labeled cells that were morphologically identi-fied as oligodendrocytes was significantly higher in FGF2�/� mice(n � 6 mice; 442 cells) compared with FGF2�/� mice (n � 10 mice; 230cells) during myelination (*P � 0.001). B: Retroviral infection wascombined with immunolabeling for cell type-specific antigenic mark-ers to reveal the proportion of GFP-labeled cells identified as oligo-dendrocyte progenitors (NG2�/PDGF�R� or NG2�/PDGF�R�) or oli-godendrocytes (CC1�). FGF2�/� mice (n � 3 mice; 144 cells) have asignificantly lower proportion of GFP-labeled oligodendrocyte progen-itors (#P � 0.007) and a significantly higher proportion of GFP-labeledoligodendrocytes (P � 0.001) compared with FGF2�/� mice (n � 3mice; 464 cells). Values shown represent the proportional mean standard error of the proportion. C: Frequency histogram of cellslabeled with NIT-GFP retrovirus demonstrates that, compared withFGF2�/� mice (n � 10 mice; 44 clusters), there is a tendency forclusters in FGF2�/� mice (n � 6 mice; 30 clusters) to be comprised offewer cells per cluster (P � 0.0479; Wilcoxon signed-rank test).
550 MURTIE ET AL.
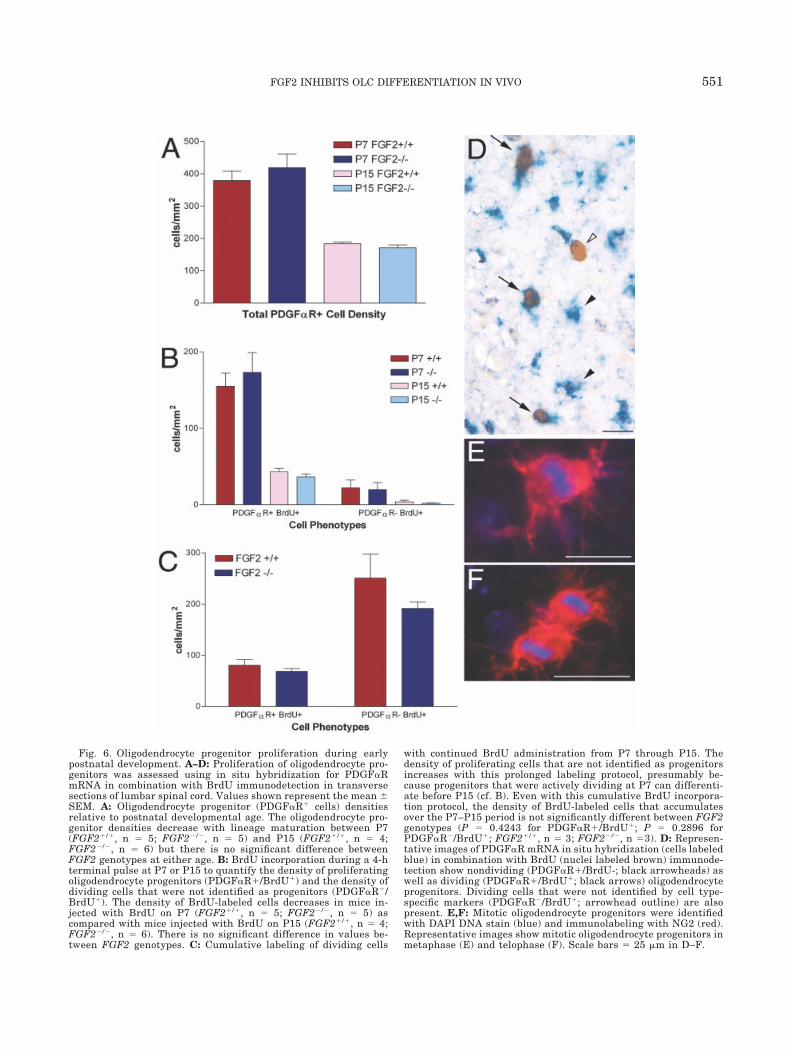
Fig. 6. Oligodendrocyte progenitor proliferation during earlypostnatal development. A–D: Proliferation of oligodendrocyte pro-genitors was assessed using in situ hybridization for PDGF�RmRNA in combination with BrdU immunodetection in transversesections of lumbar spinal cord. Values shown represent the mean SEM. A: Oligodendrocyte progenitor (PDGF�R� cells) densitiesrelative to postnatal developmental age. The oligodendrocyte pro-genitor densities decrease with lineage maturation between P7(FGF2�/�, n � 5; FGF2�/�, n � 5) and P15 (FGF2�/�, n � 4;FGF2�/�, n � 6) but there is no significant difference betweenFGF2 genotypes at either age. B: BrdU incorporation during a 4-hterminal pulse at P7 or P15 to quantify the density of proliferatingoligodendrocyte progenitors (PDGF�R�/BrdU�) and the density ofdividing cells that were not identified as progenitors (PDGF�R�/BrdU�). The density of BrdU-labeled cells decreases in mice in-jected with BrdU on P7 (FGF2�/�, n � 5; FGF2�/�, n � 5) ascompared with mice injected with BrdU on P15 (FGF2�/�, n � 4;FGF2�/�, n � 6). There is no significant difference in values be-tween FGF2 genotypes. C: Cumulative labeling of dividing cells
with continued BrdU administration from P7 through P15. Thedensity of proliferating cells that are not identified as progenitorsincreases with this prolonged labeling protocol, presumably be-cause progenitors that were actively dividing at P7 can differenti-ate before P15 (cf. B). Even with this cumulative BrdU incorpora-tion protocol, the density of BrdU-labeled cells that accumulatesover the P7–P15 period is not significantly different between FGF2genotypes (P � 0.4243 for PDGF�R�/BrdU�; P � 0.2896 forPDGF�R�/BrdU�; FGF2�/�, n � 3; FGF2�/�, n �3). D: Represen-tative images of PDGF�R mRNA in situ hybridization (cells labeledblue) in combination with BrdU (nuclei labeled brown) immunode-tection show nondividing (PDGF�R�/BrdU-; black arrowheads) aswell as dividing (PDGF�R�/BrdU�; black arrows) oligodendrocyteprogenitors. Dividing cells that were not identified by cell type-specific markers (PDGF�R�/BrdU�; arrowhead outline) are alsopresent. E,F: Mitotic oligodendrocyte progenitors were identifiedwith DAPI DNA stain (blue) and immunolabeling with NG2 (red).Representative images show mitotic oligodendrocyte progenitors inmetaphase (E) and telophase (F). Scale bars � 25 �m in D–F.
551FGF2 INHIBITS OLC DIFFERENTIATION IN VIVO
relative levels of FGF2 expression (present study).Therefore, the effects on early oligodendrocyte develop-ment in FGFR3 null mice might reflect a loss of signal-ing from an FGF family ligand other than FGF2.
FGF2 inhibition of OP differentiation is well charac-terized in vitro (McKinnon et al., 1990; Bansal andPfeiffer, 1997; Decker et al., 2000; Jiang et al., 2001).However, in vivo the lack of overproduction of oligoden-drocytes observed at P15 in FGF2�/� mice could intheory result from a positive or negative effect on dif-ferentiation, depending on the stage affected withinthe lineage, and/or from an effect on OLC proliferationor survival. Lineage tracing with replication-incompe-tent retroviral infection has allowed us to analyze dif-ferentiation in vivo by observing cumulative effects onthe fate of newly generated cells. We show that absenceof FGF2 promotes OLC differentiation during myelina-tion in postnatal development. Specifically, GFP-labeledcells were more frequently NG2/PDGF�R�positive pro-genitor cells and less frequently matured to the oligoden-drocyte stage in the absence of FGF2. Thus, the presenceof endogenous FGF2 in wild-type mice is interpreted asinhibiting OLC differentiation.
FGF2 inhibition of OLC differentiation was observedwithout significant effects in proliferation or survivalassays during development in the current study andduring remyelination in our previous work (Armstronget al., 2002). Differences in oligodendrocyte densitywithout a corresponding change in the OP populationmay appear somewhat surprising, but was similarlyfound in FGFR3�/� mice (Oh et al., 2003), as previouslydiscussed. In the current study, proliferation assaysdid not show significant differences related to FGF2genotype. Since these BrdU labeling protocols assaythe proportion of actively dividing OPs (short terminalpulse) and the proportion that divided between P7 andP15 (cumulative labeling), these findings indicate thatthe lack of oligodendrocyte overproduction in FGF2�/�
mice is not likely to be a specific FGF2 effect on OPproliferation rate. Indeed, the BrdU labeling index inOP cells was similar in FGF2�/� and FGF2�/� mice.This finding appears in contrast to in vitro reports ofFGF2 as an OP mitogen, but this effect is promoted byFGF2 inhibition of OP differentiation, which preventsprogression to a postmitotic stage. In addition, thisdiscrepancy may reflect the potential differences be-tween the available concentrations of FGF2 in eachcontext or that in vitro insulin-like growth factor Isignaling, via high insulin levels, could synergize withFGF2 for cell cycle progression (Frederick and Wood,2004). However, our analysis of retrovirally labeled cellclusters indicated that fewer cells were generated inFGF2�/� mice as compared with FGF2�/� mice. Thisfinding is consistent with our cell density and prolifer-ation data given that a cycling cell could have thepotential to undergo several rounds of cell divisionbetween P7 and P28. In the absence of FGF2 inhibitionof differentiation, a cycling cell may be more likely toterminally differentiate and therefore may undergofewer rounds of cell division. Since OPs can divide
asymmetrically to generate an oligodendrocyte and areplacement OP, a change in the number of rounds ofcell division can change oligodendrocyte density morethan OP density, particularly during the period exam-ined. Further detailed analysis would be needed toidentify a genotypic difference in symmetric versusasymmetric divisions and in the number of rounds ofcell division before exit from the cell cycle.
Our finding that the OP population size does notappear to be influenced by FGF2 expression (Fig. 6A) isconsistent with previous studies indicating OP popula-tion size is dependent on PDGF signaling during bothdevelopment (Calver et al., 1998) and remyelination(Woodruff et al., 2004). The population of BrdU-labeledcells that were not identified as OPs by PDGF�R ex-pression also was not affected by FGF2 genotype inboth our short and long labeling protocols in spinalcord. Previous work (Vaccarino et al., 1999) has dem-onstrated an effect of FGF2 genotype on proliferation ofneural stem cells in germinal zones at embryonicstages of development, as compared with spinal cordduring the myelination period examined in the currentstudy. Therefore, in the spinal cord, if similar differ-ences occur in neural stem cells at earlier stages ofdevelopment, these appear to be overcome by postnatalday 7. At later stages of development and into adultages, more extensive analysis of additional anatomicalregions would be needed to address potential mitogeniceffects of FGF2 on neural stem cells that continue toproliferate in sites that were not examined here, suchas the subventricular zone.
A subtle differential effect of FGF2 genotype on cellsurvival could also contribute to the oligodendrocytedensities observed; but relatively few apoptotic cellswere identified in our analyses in development or inremyelination (current study and Armstrong et al.,2002). After the examined P15 time point of spinal corddevelopment, a greater extent of cell death is likely tooccur in wild-type mice to compensate for initial over-production of oligodendrocytes. Previous analysis ofnormal development has shown that approximately50% of newly generated or premyelinating oligodendro-cytes are produced in excess and then die due to failureto contact axons and myelinate (Barres et al., 1992).Overproduction of neurons and glial cells in CNS de-velopment may allow selective cell survival that is de-pendent on the appropriate cell-cell interactions andcorresponding availability of trophic factors (Barres etal., 1992; Burek and Oppenheim, 1996). However, theFGF2�/� mice do not appear to overproduce oligoden-drocytes during development. Therefore, the FGF2�/�
mice may be useful for determining how matching ofoligodendrocyte cell number to axon number can occurin the absence of the normal overproduction and celldeath. Also, overproduction of cells may provide a kindof safety factor during progression to the appropriatecell number and, if so, then the oligodendrocyte popu-lation in FGF2�/� mice may reveal this effect by in-creased vulnerability in the presence of detrimentalconditions.
552 MURTIE ET AL.
In vitro studies have shown that FGF2 can stimulateOLC migration (McKinnon et al., 1993; Simpson andArmstrong, 1999; Decker et al., 2000). However, themajority of OLC developmental migration occurs be-fore maximal FGF2 expression. In addition, there wasno rostrocaudal effect of FGF2 genotype on oligoden-drocyte density at P7 in the cervical or lumbar spinalcord white matter or gray matter (Fig. 2B, and data notshown). Therefore, it is unlikely that the absence ofFGF2 had a profound effect on the normal migrationpatterns of OLCs in vivo that could account for thegenotypic differences observed at P15.
The predominant effect of FGF2 as inhibiting OLCdifferentiation appears to be the same in development(current study) as in remyelination (Armstrong et al.,2002; Murtie et al., submitted). Surprisingly, the cu-mulative result on the oligodendrocyte population den-sity is opposite in each in vivo context. During devel-opment, FGF2�/� mice do not undergo the normaloverproduction of oligodendrocytes at the peak of my-elination (current study). During early remyelination,the absence of FGF2 increased oligodendrocyte densityrelative to values in wild-type mice (Armstrong et al.,2002). These results may reflect the interaction ofFGF2 with the combination of signals that regulateoligodendrocyte population density in vivo during de-velopment and remyelination. For example, during latepostnatal development, oligodendrocyte number be-comes less dependent on soluble mitogens, such asPDGF, so that axonal signals regulate the final oligo-dendrocyte density in vivo (Trapp et al., 1997; Calver etal., 1998; Barres and Raff, 1999). The current studyexamines the postnatal period of FGF2 upregulationthat corresponds with ongoing myelination (P7), pro-gressing through the peak of myelination (P15), andcompletion of myelination (P28 and 3 months of age).During demyelination, FGF2 is upregulated as axonsare stripped of myelin and then progressively remyeli-nate. In response to demyelination, OP cells may un-dergo a more synchronous wave of symmetrical prolif-eration for rapid amplification and then rapiddifferentiation would be promoted by removal of FGF2.In this case, FGF2 inhibition of OLC differentiationmay have a detrimental effect on the oligodendrocytedensity during remyelination. Indeed, in this remyeli-nation context, a prolonged period of multiple cycles ofasymmetrical cell divisions may be less desirable rela-tive to the normal developmental time course in whichdifferent tracts must be myelinated at distinct ages.
The current study indicates a significant inhibitoryeffect of endogenous FGF2 on OLC differentiation inthe context of complex developmental signals in vivo. Itis possible that the observed effects result from theeffects of other FGF family members that may be up-regulated as compensation for the absence of FGF2during development. However, we do not consider thisscenario highly likely since initial studies in theseFGF2�/� mice indicated that the FGF family membersexamined (FGF1, FGF4, and FGF5) were not upregu-lated (Zhou et al., 1998). Endogenous FGF2 is likely to
function as one of many molecules that interact toregulate OLC differentiation and orchestrate the gen-eration of oligodendrocytes during normal develop-ment.
ACKNOWLEDGMENTS
The authors thank Dr. Thomas Doetschman for pro-viding breeding pairs of the FGF2 knockout mice, Drs.William Stallcup and Minetta Gardinier for antibodies,Dr. Fred Gage for providing pNIT-GFP 293 cell andpMD.G plasmid, Dr. Steve Levison for advice on theretroviral lineage tracing, and Drs. Lynn Hudson andWilliam Richardson for plasmids. We appreciate thecomments of Adam Vana, Dr. Jun Yoshino, Dr. SusanHaynes, Dr. Chris Reid, and Dr. Diane Borst.
REFERENCES
Armstrong RC, Le TQ, Frost EE, Borke RC, Vana AC. 2002. Absenceof fibroblast growth factor 2 promotes oligodendroglial repopulationof demyelinated white matter. J Neurosci 22:8574–8585.
Ballabriga J, Pozas E, Planas AM, Ferrer I. 1997. bFGF and FGFR-3immunoreactivity in the rat brain following systemic kainic acidadministration at convulsant doses: localization of bFGF andFGFR-3 in reactive astrocytes, and FGFR-3 in reactive microglia.Brain Res 752:315–318.
Bansal R, Pfeiffer SE. 1997. Regulation of oligodendrocyte differenti-ation by fibroblast growth factors. Adv Exp Med Biol 429:69–77.
Bansal R, Kumar M, Murray K, Morrison RS, Pfeiffer SE. 1996.Regulation of FGF receptors in the oligodendrocyte lineage. MolCell Neurosci 7:263–275.
Bansal R, Lakhina V, Remedios R, Tole S. 2003. Expression of FGFreceptors 1, 2, 3 in the embryonic and postnatal mouse brain com-pared with PDGFRalpha, Olig2 and Plp/dm20: implications foroligodendrocyte development. Dev Neurosci 25:83–95.
Barres BA, Raff MC. 1999. Axonal control of oligodendrocyte devel-opment. J Cell Biol 147:1123–1128.
Barres BA, Hart IK, Coles HS, Burne JF, Voyvodic JT, RichardsonWD, Raff MC. 1992. Cell death and control of cell survival in theoligodendrocyte lineage. Cell 70:31–46.
Burek MJ, Oppenheim RW. 1996. Programmed cell death in thedeveloping nervous system. Brain Pathol 6:427–446.
Calver AR, Hall AC, Yu WP, Walsh FS, Heath JK, Betsholtz C,Richardson WD. 1998. Oligodendrocyte population dynamics andthe role of PDGF in vivo. Neuron 20:869–882.
Cameron H, McKay R. 2001. Adult neurogenesis produces a large poolof new granule cells in the dentate gyrus. J Comp Neurol 435:406–417.
Chellaiah A, Yuan W, Chellaiah M, Ornitz DM. 1999. Mapping ligandbinding domains in chimeric fibroblast growth factor receptor mol-ecules. J Biol Chem 274:34785–34794.
Decker L, Avellana-Adalid V, Nait-Oumesmar B, Durbec P, Baron-Van Evercooren A. 2000. Oligodendrocyte precursor migration anddifferentiation: combined effects of PSA residues, growth factors,and substrates. Mol Cell Neurosci 16:422–439.
Dono R, Texido G, Dussel R, Ehmke H, Zeller R. 1998. Impairedcerebral cortex development and blood pressure regulation in FGF-2-deficient mice. EMBO J 17:4213–4225.
Frederick TJ, Wood TL. 2004. IGF-I and FGF-2 coordinately enhancecyclin D1 and cyclin E-cdk2 association and activity to promote G1progression in oligodendrocyte progenitor cells. Mol Cell Neurosci25:480–492.
Fruttiger M, Karlsson L, Hall AC, Abramsson A, Calver AR, BostromH, Willetts K, Bertold CH, Heath JK, Betsholtz C, Richardson WD.1999. Defective oligodendrocyte development and severe hypomy-elination in PDGF-A knockout mice. Development 126:457–467.
Fuss B, Mallon B, Phan T, Ohlemeyer C, Kirchhoff F, Nishiyama A,Macklin WB. 2000. Purification and analysis of in vivo-differenti-ated oligodendrocytes expressing the green fluorescent protein. DevBiol 218:259–274.
553FGF2 INHIBITS OLC DIFFERENTIATION IN VIVO
Gard AL, Pfeiffer SE. 1993. Glial cell mitogens bFGF and PDGFdifferentially regulate development of O4�GalC� oligodendrocyteprogenitors. Dev Biol 159:618–630.
Gensert JM, Goldman JE. 1996. In vivo characterization of endoge-nous proliferating cells in adult rat subcortical white matter. Glia17:39–51.
Hinks GL, Franklin RJ. 1999. Distinctive patterns of PDGF-A, FGF-2,IGF-I, and TGF-beta1 gene expression during remyelination ofexperimentally-induced spinal cord demyelination. Mol Cell Neuro-sci 14:153–168.
Hudson LD, Berndt JA, Puckett C, Kozak CA, Lazzarini RA. 1987.Aberrant splicing of proteolipid protein mRNA in the dysmyelinat-ing jimpy mutant mouse. Proc Natl Acad Sci USA 84:1454–1458.
Jiang F, Frederick TJ, Wood TL. 2001. IGF-I synergizes with FGF-2to stimulate oligodendrocyte progenitor entry into the cell cycle.Dev Biol 232:414–423.
Komoly S, Hudson LD, Webster HD, Bondy CA. 1992. Insulin-likegrowth factor I gene expression is induced in astrocytes duringexperimental demyelination. Proc Natl Acad Sci USA 89:1894–1898.
Kuzis K, Reed S, Cherry NJ, Woodward WR, Eckenstein FP. 1995.Developmental time course of acidic and basic fibroblast growthfactors’ expression in distinct cellular populations of the rat centralnervous system. J Comp Neurol 358:142–153.
Levison SW, Young GM, Goldman JE. 1999. Cycling cells in the adultrat neocortex preferentially generate oligodendroglia. J NeurosciRes 57:435–446.
Li AW, Murphy PR. 2000. Expression of alternatively spliced FGF-2antisense RNA transcripts in the central nervous system: regula-tion of FGF-2 mRNA translation. Mol Cell Endocrinol 170:233–242.
Lin HY, Kaplow J, Jaye M, Hayman MJ. 1997. Ligand-binding spec-ificity of human fibroblast growth factor receptor-3 IIIc. FEBS Let-ters 411:389–392.
Linnington C, Webb M, Woodhams PL. 1984. A novel myelin-associ-ated glycoprotein defined by a mouse monoclonal antibody. J Neu-roimmunol 6:387–396.
Liu X, Mashour GA, Webster HF, Kurtz A. 1998. Basic FGF and FGFreceptor 1 are expressed in microglia during experimental autoim-mune encephalomyelitis: temporally distinct expression of midkineand pleiotrophin. Glia 24:390–397.
Mallon BS, Shick HE, Kidd GJ, Macklin WB. 2002. Proteolipid pro-moter activity distinguishes two populations of NG2-positive cellsthroughout neonatal cortical development. J Neurosci 22:876–885.
Mason JL, Langaman C, Morell P, Suzuki K, Matsushima GK. 2001.Episodic demyelination and subsequent remyelination within themurine central nervous system: changes in axonal calibre. Neuro-pathol Appl Neurobiol 27:50–58.
Matthews MA, Duncan D. 1971. A quantitative study of morphologi-cal changes accompanying the initiation and progress of myelinproduction in the dorsal funiculus of the rat spinal cord. J CompNeurol 142:1–22.
McKinnon RD, Matsui T, Dubois-Dalcq M, Aaronson SA. 1990. FGFmodulates the PDGF-driven pathway of oligodendrocyte develop-ment. Neuron 5:603–614.
McKinnon RD, Smith C, Behar T, Smith T, Dubois-Dalcq M. 1993.Distinct effects of bFGF and PDGF on oligodendrocyte progenitorcells. Glia 7:245–254.
Messersmith DJ, Murtie JC, Le TQ, Frost EE, Armstrong RC. 2000.Fibroblast growth factor 2 (FGF2) and FGF receptor expression inan experimental demyelinating disease with extensive remyelina-tion. J Neurosci Res 62:241–256.
Oh LY, Denninger A, Colvin JS, Vyas A, Tole S, Ornitz DM, Bansal R.2003. Fibroblast growth factor receptor 3 signaling regulates theonset of oligodendrocyte terminal differentiation. J Neurosci 23:883–894.
Ornitz DM, Leder P. 1992. Ligand specificity and heparin dependenceof fibroblast growth factor receptors 1 and 3. J Biol Chem 267:16305–16311.
Ortega S, Ittmann M, Tsang SH, Ehrlich M, Basilico C. 1998. Neuro-nal defects and delayed wound healing in mice lacking fibroblastgrowth factor 2. Proc Natl Acad Sci USA 95:5672–5677.
Palmer TD, Markakis EA, Willhoite AR, Safar F, Gage FH. 1999.Fibroblast growth factor-2 activates a latent neurogenic program inneural stem cells from diverse regions of the adult CNS. J Neurosci19:8487–8497.
Raine CS, Wu E. 1993. Multiple sclerosis: remyelination in acutelesions. J Neuropathol Exp Neurol 52:199–204.
Redwine JM, Armstrong RC. 1998. In vivo proliferation of oligoden-drocyte progenitors expressing PDGFalphaR during early remyeli-nation. J Neurobiol 37:413–428.
Reuss B, von Bohlen und Halbach O. 2003. Fibroblast growth factorsand their receptors in the central nervous system. Cell Tissue Res.313:139–157.
Riva MA, Mocchetti I. 1991. Developmental expression of the basicfibroblast growth factor gene in rat brain. Brain Res Dev Brain Res62:45–50.
Schwab ME, Schnell L. 1989. Region-specific appearance of myelinconstituents in the developing rat spinal cord. J Neurocytol 18:161–169.
Simpson PB, Armstrong RC. 1999. Intracellular signals and cytoskel-etal elements involved in oligodendrocyte progenitor migration.Glia 26:22–35.
Touriol C, Morillon A, Gensac MC, Prats H, Prats AC. 1999. Expres-sion of human fibroblast growth factor 2 mRNA is post-transcrip-tionally controlled by a unique destabilizing element present in the3�-untranslated region between alternative polyadenylation sites.J Biol Chem 274:21402–21408.
Trapp BD, Nishiyama A, Cheng D, Macklin W. 1997. Differentiationand death of premyelinating oligodendrocytes in developing rodentbrain. J Cell Biol 137:459–468.
Vaccarino FM, Schwartz ML, Raballo R, Rhee J, Lyn-Cook R. 1999.Fibroblast growth factor signaling regulates growth and morpho-genesis at multiple steps during brain development. Curr Top DevBiol 46:179–200.
Woodruff RH, Fruttiger M, Richardson WD, Franklin RJ. 2004. Plate-let-derived growth factor regulates oligodendrocyte progenitornumbers in adult CNS and their response following demyelination.Mol Cell Neurosci 25:252–262.
Ye P, Li L, Richards RG, DiAugustine RP, D’Ercole AJ. 2002. Myeli-nation is altered in insulin-like growth factor-I null mutant mice.J Neurosci 22:6041–6051.
Zhou M, Sutliff RL, Paul RJ, Lorenz JN, Hoying JB, HaudenschildCC, Yin M, Coffin JD, Kong L, Kranias EG and others. 1998.Fibroblast growth factor 2 control of vascular tone. Nat Med 4:201–207.
554 MURTIE ET AL.