Trpm5 Null Mice Respond to Bitter, Sweet, and Umami Compounds

Testing the null of cointegration with structural breaks
Josep Lluís Carrion-i-Silvestre�
Anàlisi Quantitativa Regional
Parc Cientí�c de Barcelona
Universitat de Barcelona
Andreu Sansó
Departament of Economics
Universitat de les Illes Balears
June 2005
Abstract
In this paper we propose an LM-Type statistic to test the null hypothesis of cointegration
allowing for the possibility of a structural break, in both the deterministic and the cointe-
gration vector. Our proposal focuses on the presence of endogenous regressors and analyses
which estimation method provides better results. The test has been designed to be used
as a complement to the usual non-cointegration tests in order to obtain stronger evidence
of cointegration. We consider the cases of known and unknown break date. In the latter
case, we show that minimizing the SSR results in a super-consistent estimator of the break
fraction. Finally, the behaviour of the tests is studied through Monte Carlo experiments.
JEL classi�cation: C12, C22
Keywords: cointegration, structural break, KPSS test
1 Introduction
Cointegration has made a great contribution in the �eld of economics and has given rise to a huge
amount of theoretical and applied research. Since Granger (1981) and Engle and Granger (1987)
�We would like to thank Pierre Perron, the editor, Anindya Banerjee, and two anonymous referees for helpfulcomments. Corresponding author: Av. Diagonal, 690. 08034 Barcelona. Tel: +34 934021826, Fax: +34934021821, E-mail: [email protected] The authors gratefully acknowledge the �nancial support of the Ministeriode Ciencia y Tecnología SEJ2004-05052/ECON and SEC2001-3672.
1

de�ned the concept, several methods have been proposed in the econometric literature to test
the stationarity of a linear combination of non-stationary time series. Most of these procedures
specify the null hypothesis of no cointegration against the alternative hypothesis of cointegration.
However, this speci�cation has been criticised in Engle and Granger (1987), Phillips and Ouliaris
(1990) and Engle and Yoo (1991), where it is argued that the natural speci�cation to test should
be the null hypothesis of cointegration rather than the null hypothesis of lack of cointegration.
Papers such as Hansen (1992b), Leybourne and McCabe (1993), Harris and Inder (1994), Shin
(1994) and McCabe, Leybourne and Shin (1997) have addressed this question, reversing these
hypotheses and designing tests for the null hypothesis of cointegration.
In fact, the de�nition of cointegration cannot be disassociated from the long-run. The prop-
erty of cointegration implies that a set of variables moves jointly de�ning an equilibrium relation-
ship, which means that it has to be tested using time series covering long periods. Practitioners
have to bear in mind that the larger the sample period covering the time series, more likely it
is that there will be a structural change. As shown by Perron (1989), this possibility changes
the distribution of the standard unit root tests since the speci�cation for the deterministic com-
ponent of the time series needs to be modi�ed. In these terms, the de�nition of cointegration
under consideration falls into the classi�cation of deterministic and stochastic cointegration of
Park (1990). Perron�s proposal was generalized to the cointegration tests of Engle and Granger
(1987) and Phillips and Ouliaris (1990) by Gregory and Hansen (1996a, 1996b). They modify
the usual procedures specifying a regime and trend shift model as the most general formulation.
Departing from this general speci�cation it is possible to obtain other simpli�ed models that
account for a level shift, with and without a time trend. One important thing to bear in mind is
that the Gregory-Hansen tests detect regime-shift as well as stable cointegration relationships.
Thus, the rejection of the null hypothesis of these tests does not entangle the instability of the
cointegration relationship. In order to discern between these situations they suggest applying
instability tests such as the ones in Hansen (1992b). However, this concern can be also addressed
through the application of stationarity tests including structural breaks.
There have been some approximations in the literature to analyse cointegration with struc-
tural breaks. To this end, Hao (1996) generalizes the test of Kwiatkowski, Phillips, Schmidt and
Shin (1992) to allow for a structural break that shifts the independent term of the cointegrating
2

vector. In a recent paper, Bartley, Lee and Strazicich (2001) also deal with the KPSS cointegra-
tion test but include a shift in the mean and in the trend of the deterministic elements of the
cointegrating relationship. Finally, Busetti (2002) adopts a multivariate framework when testing
the stationarity of a set of variables allowing for one structural break. In brief, he extends the
multivariate Nyblom and Harvey (2000) and Kwiatkowski et al. (1992) test statistic for those
situations in which the time trend is a¤ected by a structural break that shifts the level and/or
the slope of the variables. Hence, assuming the date of the break to be known, his proposal
is designed to test the breaking-stationarity hypothesis for a set of variables at once, although
avoiding the presence of endogenous regressors. Moreover, the test can also be used to determine
the dimension of the cointegration space, i.e. the number of cointegrating relationships among
the variables.
In the present paper we extend the test of the null hypothesis of cointegration to allow for
a structural break in both the parameters of the deterministic component and the parameters
of the stochastic component. Our proposal generalizes the previous contributions and develops
a test for cointegration around a break-cointegrating relationship. For instance, this approach
is di¤erent from the one in Busetti (2002) since, �rstly, we are primarily interested on the
estimation of the cointegration relationship under structural breaks as in Gregory and Hansen
(1996a) and, secondly, we account for the presence of endogenous regressors. Throughout the
paper we highlight the di¤erences that can be established between these above contributions and
the ones proposed here. The break point is estimated through the minimisation of the sum of
squared residuals, for which the rates of convergence of the estimated break fraction parameter
are derived.
In section 2 we present the models and test statistics and derive their asymptotic distribution
under two assumptions: (i) that the stochastic regressors are strictly exogenous and (ii) that the
break point is assumed to be known. In section 3 we relax the �rst assumption and consider
e¢ cient estimators of the cointegrating vector. Section 4 deals with the estimation of the break
point. Section 5 shows the consistency of the test statistics proposed in section 2. Section 6
analyses the performance of the tests in �nite samples. Finally, section 7 concludes. All the
proofs of the Theorems are presented together in the Appendix.
3
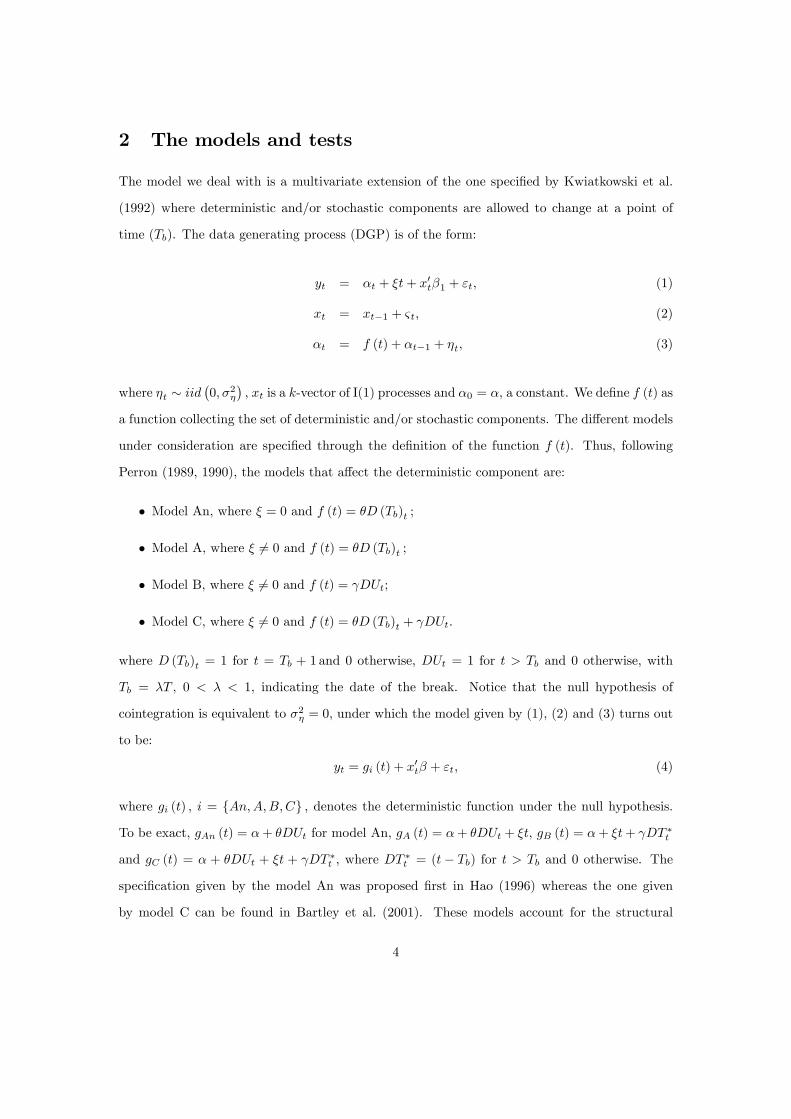
2 The models and tests
The model we deal with is a multivariate extension of the one speci�ed by Kwiatkowski et al.
(1992) where deterministic and/or stochastic components are allowed to change at a point of
time (Tb). The data generating process (DGP) is of the form:
yt = �t + �t+ x0t�1 + "t; (1)
xt = xt�1 + &t; (2)
�t = f (t) + �t�1 + �t; (3)
where �t � iid�0; �2�
�; xt is a k-vector of I(1) processes and �0 = �, a constant. We de�ne f (t) as
a function collecting the set of deterministic and/or stochastic components. The di¤erent models
under consideration are speci�ed through the de�nition of the function f (t). Thus, following
Perron (1989, 1990), the models that a¤ect the deterministic component are:
� Model An, where � = 0 and f (t) = �D (Tb)t ;
� Model A, where � 6= 0 and f (t) = �D (Tb)t ;
� Model B, where � 6= 0 and f (t) = DUt;
� Model C, where � 6= 0 and f (t) = �D (Tb)t + DUt.
where D (Tb)t = 1 for t = Tb + 1 and 0 otherwise, DUt = 1 for t > Tb and 0 otherwise, with
Tb = �T , 0 < � < 1, indicating the date of the break. Notice that the null hypothesis of
cointegration is equivalent to �2� = 0, under which the model given by (1), (2) and (3) turns out
to be:
yt = gi (t) + x0t� + "t; (4)
where gi (t) ; i = fAn;A;B;Cg ; denotes the deterministic function under the null hypothesis.
To be exact, gAn (t) = �+ �DUt for model An, gA (t) = �+ �DUt + �t, gB (t) = �+ �t+ DT �t
and gC (t) = � + �DUt + �t + DT�t , where DT
�t = (t� Tb) for t > Tb and 0 otherwise. The
speci�cation given by the model An was proposed �rst in Hao (1996) whereas the one given
by model C can be found in Bartley et al. (2001). These models account for the structural
4

break e¤ect shifting the deterministic part of the long-run relationship, although they assume
that the cointegrating vector remains unchanged �see Gabriel, Da Silva and Nunes (2003) for an
application to the long-run money demand for Portugal. The speci�cation given for Model An
accounts for a level shift without a time trend, while Model A contains a trend and allows for
a break in level. Model B captures a change in the slope of the time trend but not in the level,
whereas Model C accounts for both level and slope shifts.
It is possible to introduce the dummy variables in a way that a¤ect the cointegrating vector.
In this case, we have allowed for two di¤erent e¤ects:
� Model D, where � = 0 and f (t) = �D (Tb)t + x0t�2D (Tb)t;
� Model E, where � 6= 0 and f (t) = �D (Tb)t + DUt + x0t�2D (Tb)t.
Hence, under the null hypothesis, the model described by (1), (2) and (3) reduces to:
yt = gi (t) + x0t�1 + x
0t�2DUt + "t; (5)
i = fD;Eg with gD (t) = �+ �DUt for model D and gE (t) = �+ �t+ �DUt + DT �t for model
E. Now, the speci�cation allows for a structural break that not only shifts the deterministic
component but also changes the cointegrating vector. Thus, in some situations, practitioners
would be interested in modelling a cointegration relationship that at a point in time might
has shifted from one long-run path to another one �see, for instance, the modellisation of the
aggregate consumption function in Hansen (1992b) and the estimation of the long-run money
demand for the US in Gregory and Hansen (1996a). The di¤erence between Models D and E is
the time trend �Model D does not consider a time trend while Model E does. Notice that under
the alternative hypothesis that �2� > 0; (yt; x0t)0 will not be cointegrated.
As for the disturbance terms of the model, let us assume that the long-run variance matrix
of #t = ("t; & 0t; �t)0 is given by:
a =
266664!21 0
22
0 �2�
377775 ;
5

a block diagonal matrix which ensures, on the one hand, that "t and �t, and, on the other
hand, that "t and & 0t, are mutually uncorrelated. The assumption of no correlation between the
disturbance terms of (1) and (2) introduces the restriction that xt is strictly exogenous �see
Gonzalo (1994). Section 3 shows how to proceed when this is not the case.
The (LM-type) statistic to test the null hypothesis of cointegration against the alternative of
no cointegration is given by:
SCi (�) = T�2!�21
TXt=1
S2i;t; (6)
where � = Tb=T , Si;t =Pt
j=1 ei;j , fei;tgTt=1, are the OLS estimated residuals driven from (4) or
(5), depending on the model, and !21 denotes a consistent estimator of the long-run variance of
f"i;tgTt=1 ; i = fAn;A;B;C;D;Eg. The long-run variance can be estimated in a non-parametric
way using the Bartlett Kernel. However, it should be noticed that the use of the standard
automatic bandwidth selection methods leads to an inconsistent test. In order to avoid the in-
consistency Kurozumi (2002) suggest to apply a modi�ed version of the Andrews�data dependent
procedure, which can be also applied in this framework. The asymptotic distribution of (6) is
stated in the following Theorem.
Theorem 1 Let fytgTt=1 be generated by (1), (2) and (3), and let �t =Pt
i=1 ("i; &0i)0 satisfy the
multivariate invariance principle of Phillips and Durlauf (1986). If Tb = �T (0 < � < 1) and as
T !1; Tb !1, so � remains constant, under the null hypothesis of cointegration��2� = 0
�:
SCi (�)) �2Z 1
0
V 2k;i (b1) db1 + (1� �)2Z 1
0
V 2k;i (b2) db2;
for i = fAn;A;B;C;D;Eg ; where ) denotes weak convergence and Vk;i (�) are functions of
Wiener process shown in the Appendix.
The proof of Theorem 1 and the expressions for Vk;E (b1) and Vk;E (b2) can be found in the
Appendix. The expressions for Vk;i (b1) and Vk;i (b1) ; fi = An, A, B, C, Dg are omitted although
they are particular cases of the latter. Notice that the test is performed using the upper tail of
the distribution so that the null hypothesis of cointegration is rejected when SCi (�) > critical
value, i = fAn;A;B;C;D;Eg. Two remarks are in order. First, the asymptotic distribution
of Theorem 1 can be expressed as a weighted sum of two independent functionals of Wiener
6

processes. As pointed out in Lee and Strazicich (2001) and Kurozumi (2002) for the univariate
KPSS test with one structural break, the symmetry of the distribution around � = 0:5 is given
by the fact that we can interchange � and (1� �) in the asymptotic distribution and obtain the
same result. Second, notice that the asymptotic distributions of Theorem 1 depend both on k;
the number of elements of xt that involves the speci�cation, and on � = Tb/T; the break fraction
parameter. Therefore, they depend on the nuisance parameter �. The econometric literature has
addressed this concern in two di¤erent ways. First, in some cases, the date of the break can be
assumed to be known and, hence, exogenous with respect to the model, so the break fraction does
not need to be estimated �see Busetti (2002). This situation might be suitable, for instance, for
many German macroeconomic time series for which the reuni�cation process of 1990 had caused
a shift in the deterministic part of the time series �see Lütkepohl, Muller and Saikkonen (1999).
Hence, it seems desirable to have a set of critical values that assumes the date of the break to be
exogenous. Critical values computed using 20,000 replications through direct simulation of the
Wiener processes for up to �ve values of the break fraction, � = f0:1; 0:2; : : : ; 0:5g, and for up to
four stochastic regressors, k = f1; 2; 3; 4g, are shown in Tables 1 and 2.1
Up to now we have focused on those situations for which the date of the break is presumed to
be known. Notwithstanding, sometimes the information about an event that might have caused a
break is not su¢ ciently clear. In this situation, a second approach to deal with the dependency of
the asymptotic distributions on the nuisance parameter � is required and this parameter requires
to be estimated. The procedures that can be applied to do so are considered in Section 4.
3 Non strictly exogenous regressors
The previous analysis has been based on the assumption that xt is strictly exogenous, although
this assumption may be very restrictive in practice. When this is the case, the asymptotic results
1As mentioned above, Bartley et al. (2001) analyse the speci�cations that correspond to models A and C, forwhich they compute the corresponding critical value sets. However, there is no mention anywhere of the factthat the asymptotic distribution of the test depends on k, as it does �see Theorem 1. Actually, if we comparetheir critical values sets with ours we see that theirs are almost equivalent to the ones computed here for k = 1.Practitioners should be aware that a size distortion problem (underrejection of the null hypothesis) is expectedwhen using their critical values for those models with k > 1.
7

Table 1: Asymptotic critical values for the models An, A, B and CModel An Model A
� = 0:1 � = 0:2 � = 0:3 � = 0:4 � = 0:5 � = 0:1 � = 0:2 � = 0:3 � = 0:4 � = 0:5k = 1 k = 1
90% 0.1932 0.1583 0.1395 0.1281 0.1256 0.0827 0.0736 0.0747 0.0821 0.084095% 0.2582 0.2087 0.1855 0.1632 0.1553 0.1028 0.0885 0.0907 0.1021 0.106097.5% 0.3367 0.2676 0.2341 0.1991 0.1855 0.1228 0.1054 0.1062 0.1229 0.131599% 0.4546 0.3543 0.2948 0.2503 0.2287 0.1537 0.1305 0.1251 0.1508 0.1642
k = 2 k = 290% 0.1336 0.1157 0.1079 0.1020 0.1029 0.0700 0.0630 0.0650 0.0690 0.069395% 0.1796 0.1557 0.1400 0.1306 0.1292 0.0865 0.0759 0.0774 0.0852 0.085897.5% 0.2325 0.2007 0.1759 0.1622 0.1557 0.1033 0.0891 0.0909 0.1023 0.103799% 0.3116 0.2631 0.2259 0.2035 0.1903 0.1273 0.1095 0.1083 0.1254 0.1348
k = 3 k = 390% 0.1007 0.0907 0.0856 0.0847 0.0840 0.0594 0.0554 0.0571 0.0581 0.058495% 0.1319 0.1179 0.1094 0.1063 0.1051 0.0728 0.0670 0.0692 0.0712 0.072597.5% 0.1670 0.1490 0.1338 0.1276 0.1271 0.0871 0.0784 0.0803 0.0843 0.087799% 0.2238 0.1989 0.1773 0.1602 0.1594 0.1064 0.0941 0.0971 0.1035 0.1103
k = 4 k = 490% 0.0799 0.0738 0.0712 0.0704 0.0706 0.0507 0.0490 0.0501 0.0509 0.051095% 0.1037 0.0924 0.0873 0.0878 0.0874 0.0616 0.0588 0.0606 0.0617 0.062197.5% 0.1304 0.1151 0.1091 0.1073 0.1056 0.0729 0.0691 0.0724 0.0728 0.074199% 0.1754 0.1502 0.1385 0.1365 0.1350 0.0898 0.0846 0.0864 0.0886 0.0938
Model B Model C� = 0:1 � = 0:2 � = 0:3 � = 0:4 � = 0:5 � = 0:1 � = 0:2 � = 0:3 � = 0:4 � = 0:5
k = 1 k = 190% 0.0842 0.0747 0.0663 0.0614 0.0604 0.0802 0.0661 0.0559 0.0493 0.048495% 0.1059 0.0919 0.0809 0.0730 0.0729 0.1000 0.0813 0.0673 0.0579 0.056297.5% 0.1280 0.1102 0.0973 0.0863 0.0844 0.1200 0.0973 0.0802 0.0669 0.064599% 0.1578 0.1313 0.1197 0.1039 0.1013 0.1470 0.1208 0.0967 0.0799 0.0746
k = 2 k = 290% 0.0723 0.0632 0.0579 0.0542 0.0533 0.0667 0.0567 0.0487 0.0450 0.043095% 0.0892 0.0775 0.0694 0.0651 0.0639 0.0828 0.0696 0.0583 0.0530 0.049897.5% 0.1069 0.0925 0.0825 0.0761 0.0752 0.0998 0.0824 0.0687 0.0614 0.057499% 0.1314 0.1161 0.1019 0.0940 0.0903 0.1235 0.1010 0.0843 0.0731 0.0680
k = 3 k = 390% 0.0602 0.0536 0.0507 0.0475 0.0470 0.0563 0.0493 0.0430 0.0403 0.039395% 0.0740 0.0657 0.0613 0.0575 0.0561 0.0688 0.0602 0.0518 0.0476 0.046397.5% 0.0884 0.0784 0.0724 0.0675 0.0663 0.0819 0.0716 0.0616 0.0551 0.052799% 0.1106 0.0969 0.0888 0.0805 0.0788 0.1023 0.0887 0.0754 0.0657 0.0618
k = 4 k = 490% 0.0523 0.0472 0.0443 0.0429 0.0421 0.0491 0.0428 0.0389 0.0368 0.035995% 0.0638 0.0574 0.0529 0.0511 0.0498 0.0603 0.0510 0.0464 0.0431 0.041597.5% 0.0757 0.0684 0.0626 0.0596 0.0578 0.0714 0.0614 0.0544 0.0495 0.047499% 0.0921 0.0834 0.0756 0.0711 0.0699 0.0871 0.0748 0.0659 0.0592 0.0559Note: Percentage points of the asymptotic distribution are based on n = 20; 000 replications using partial sums of" � iidN (0; 1) random variables of T = 2; 000 observations to approximate the Wiener process. � denotes the breakfraction and k is the number of stochastic regressors in the model.
8

Table 2: Asymptotic critical values for the models D and EModel D Model E
� = 0:1 � = 0:2 � = 0:3 � = 0:4 � = 0:5 � = 0:1 � = 0:2 � = 0:3 � = 0:4 � = 0:5k = 1 k = 1
90% 0.1908 0.1547 0.1265 0.1098 0.1044 0.0808 0.0654 0.0538 0.0463 0.043695% 0.2560 0.2067 0.1670 0.1395 0.1309 0.1004 0.0804 0.0659 0.0552 0.051297.5% 0.3295 0.2631 0.2098 0.1729 0.1603 0.1205 0.0974 0.0784 0.0645 0.058799% 0.4463 0.3449 0.2699 0.2224 0.1941 0.1480 0.1223 0.0960 0.0763 0.0681
k = 2 k = 290% 0.1319 0.1087 0.0885 0.0760 0.0735 0.0671 0.0540 0.0448 0.0387 0.036395% 0.1759 0.1459 0.1163 0.0969 0.0922 0.0832 0.0661 0.0544 0.0462 0.042397.5% 0.2288 0.1873 0.1485 0.1198 0.1123 0.0994 0.0790 0.0639 0.0534 0.048899% 0.3068 0.2510 0.1942 0.1578 0.1419 0.1218 0.0980 0.0795 0.0641 0.0574
k = 3 k = 390% 0.0983 0.0803 0.0664 0.0572 0.0542 0.0561 0.0457 0.0375 0.0323 0.030995% 0.1286 0.1049 0.0851 0.0721 0.0672 0.0696 0.0559 0.0454 0.0379 0.036097.5% 0.1638 0.1363 0.1079 0.0883 0.0819 0.0828 0.0658 0.0542 0.0444 0.040699% 0.2307 0.1816 0.1425 0.1145 0.1039 0.1040 0.0821 0.0660 0.0529 0.0474
k = 4 k = 490% 0.0772 0.0616 0.0512 0.0451 0.0423 0.0484 0.0391 0.0326 0.0282 0.026695% 0.0981 0.0791 0.0648 0.0548 0.0514 0.0597 0.0476 0.0393 0.0329 0.030897.5% 0.1225 0.1002 0.0806 0.0658 0.0613 0.0719 0.0572 0.0463 0.0379 0.035399% 0.1579 0.1312 0.1048 0.0852 0.0766 0.0899 0.0703 0.0570 0.0454 0.0411Note: Percentage points of the asymptotic distribution are based on n = 20; 000 replications using partial sums of" � iidN (0; 1) random variables of T = 2; 000 observations to approximate the Wiener process. � denotes the breakfraction and k is the number of stochastic regressors in the model.
9

obtained in the previous section no longer hold, because the estimation of the vector of cointe-
gration is not e¢ cient and the limiting distribution depends on nuisance parameters. However,
several methods such as those of Phillips and Hansen (1990), Saikkonen (1991) and Stock and
Watson (1993), which are asymptotically equivalent, can be applied to obtain an e¢ cient esti-
mation of the vector of cointegration. In this paper we use the Dynamic OLS estimator of Stock
and Watson (1993).2 The steps that have to be taken to test the null hypothesis of cointegration
in this framework are:
1. Estimate
yt = gi (t) + x0t� +
kXj=�k
�x0t j + "t (7)
if i = fAn;A;B;Cg ; or
yt = gi (t) + x0t�1 + x
0t�2DUt +
kXj=�k
�x0t j + "t; (8)
when i = fD;Eg and store the estimated residuals fei;tg ; i = fAn;A;B;C;D;Eg ;
2. Compute the test statistic as:
SC+i (�) = T�2!�21
TXt=1
�S+i;t�2;
where !21 is a consistent estimation of the long-run variance of f"tg using ei;t and S+i;t =Ptj=1 ei;t; i = fAn;A;B;C;D;Eg.
The asymptotics concerning the test statistics are given in the following Theorem.
Theorem 2 Let fytgTt=1 be generated by (1), (2) and (3), and let �t =Pt
i=1 ("i; &0i)0 satisfy the
multivariate invariance principle of Phillips and Durlauf (1986) with log-run variance matrix
. If Tb = �T (0 < � < 1) and as T ! 1; Tb ! 1, so � remains constant, under the null
hypothesis of cointegration:
SC+i (�)) �2Z 1
0
V 2k;i (b1) db1 + (1� �)2Z 1
0
V 2k;i (b2) db2;
2We also tried the Fully Modi�ed estimator of Phillips and Hansen (1990) but yielded poor results in simulationexperiments.
10

i = fAn;A;B;C;D;Eg ; being Vk;i (�) the same functions de�ned in Theorem 1.
The proof can be found in Carrion-i-Silvestre and Sansó (2001). Theorem 2 states that, after
endogeneity is accounted for the asymptotic distributions of the test statistics are the same as
those assuming that xt is strictly exogenous and, hence, the critical values presented in Tables 1
and 2 can be used.
4 Unknown date of the break
In previous sections we have implicitly assumed that the date of the break was known a priori.
However, the break point often has to be estimated in empirical applications. The approach
followed in this paper is based on the analysis in Bai (1994, 1997) and Kurozumi (2002), and
estimates the break point as the date that minimises the sequence of the sum of squared residuals.
In fact, this is also the approach in Bartley et al. (2001), since they select the break point as
the argument that minimizes the sequence of the Bayesian Information Criterion (BIC) that
is obtained when computing the test for all possible break points. Furthermore, the dynamic
optimization algorithm in Bai and Perron (1998, 2003) can also be applied to minimise the sum
of squared residuals. After the break point is estimated, we can proceed to the computation of
the test assuming it as if it were known. Formally speaking,
~Tb = argmin�2�
[SSR (�)] ; (9)
where SSR (�) is the sum of the squared residuals of (4) or (5), depending on the model, and �
denotes a closed subset of the interval (0; 1), that, in order to minimise the lost of information,
we de�ne it as � = [2=T; (T � 1) =T ]. We denote the tests that are computed using this strategy
as SCi�~��and SC+i
�~��, i = fAn;A;B;C;D;Eg. As shown in the following Theorem, the
application of this approach leads to a consistent estimate of the break fraction parameter.
Theorem 3 Let fytgTt=1 be generated by (1), (2) and (3) with �2� = 0 and either � 6= 0 or 6= 0
depending on the model, where f�tgTt=1 satis�es the multivariate invariance principle of Phillips
11

and Durlauf (1986). If ~Tb = argmint2(1;T ) [SSR (�)] then, as T !1,
~�p! �;
and
P�T���~�� � ��� � C� � �;
for arbitrary � > 0 and C > 0;wherep! denotes convergence in probability.
The proof is shown in the Appendix. Note that the result in Theorem 3 holds irrespective
of the magnitude of the shifts. More interestingly, the estimation of the break fraction is T -
consistent. Then, we can proceed to perform the hypothesis testing assuming the estimated
break fraction as if it were known and, hence, using the critical values reported in Tables 1 and
2.
5 Consistency
The consistency of the test statistics against the alternative hypothesis of no cointegration is
shown by deriving their asymptotic distribution under the alternative, and showing that the test
statistics diverges. In the following theorem we state the limiting distribution of the tests under
the alternative hypothesis.
Theorem 4 Let fytg be generated by 1, 2 and 3 with �2� > 0; and where f�tgTt=1 satis�es the
multivariate invariance principle of Phillips and Durlauf (1986). If Tb = �T (0 < � < 1) and as
T !1; Tb !1, so � remains constant:
SCi (�) = Op (T=l) ;
i = fAn;A;B;C;D;Eg ; where l is the bandwidth of the spectral window used to estimate the
long run variance of "t.
The proof follows from Kwiatkowski et al. (1992) and is omitted in order to save space,
although it can be found in Carrion-i-Silvestre and Sansó (2001). Theorem 4 shows that under
12

the alternative hypothesis the tests diverge at rate Op (T=l). This conclusion has also been
reached in Harris and Inder (1994) and Shin (1994) for cointegration test without structural
breaks. Two remarks are in order. First, the results given in theorem 4 are valid regardless of
the assumption of strictly exogenous stochastic regressors. Second, the rate of divergence of the
statistics depends on the spectral bandwidth that is used, so we expect lag parameter selection
to in�uence the power of the test statistics. Therefore, we conclude that the test is consistent
when there is no cointegration.
6 Finite sample performance
The DGP that is used in this Section to assess the �nite sample performance of the test statistic
is similar to the ones speci�ed by Banerjee, Dolado, Hendry and Smith (1986), Gonzalo (1994),
Gregory and Hansen (1996a) and McCabe et al. (1997), among others, and is given by the
triangular system representation of the CI(1, 1) process:
yt � g (t)� �txt = zt; zt = �zt�1 + �t + ezt ;
a1yt � a2xt = wt; wt = wt�1 + ewt ;
�t = �t�1 + �t ;0BBBB@ezt
ewt
�t
1CCCCA � iid N
2666640BBBB@0
0
0
1CCCCA ;0BBBB@1 �� 0
�� �2 0
0 0 �2�
1CCCCA377775 ;
with j�j < 1. This DGP allows us to analyse how the test statistics behave under di¤erent
situations. First, under the null hypothesis of cointegration, �2� = 0, � accounts for the presence
of correlation in the error of the cointegrating regression. Second, the DGP will be under the
alternative of no cointegration when �2� > 0. Third, � denotes the correlation between fewtg
and feztg. Fourth, g (t) represents the deterministic component of the long-run equilibrium
relationship. In this simulation experiment we have considered the model D so that gD (t) =
�+�DUt. Finally, when a1 = 0; xt will be strictly exogenous. On the other hand, when a1 6= 0; xt
is no longer strictly exogenous. It should also be noticed that the vector of parameter associated
13

to stochastic regressors depends on time, so �t = �1 for t � Tb and �t = �2 for t > Tb.
We consider the parameter space (a1, a2, �, �, �t, �, �, �, �; �2�) where a1 ={0, 1}, a2 = �1,
� = 1, � = {0.5, 1}, �t = (�1; �2) = {(2, 1), (2, 4)}, � ={0.25, 0.5, 0.75}, � ={0, 0.5}, � ={0.25,
0.33, 0.5, 1, 2}, � ={-0.5, 0, 0.5} and �2� ={0, 0.001, 0.01, 0.1}. The sample size is set to T = 200
and an amount of n = 1; 000 replications of the DGP are carried out for each parameterisation.
Using this speci�cation we have analysed the �nite sample performance of our proposal in two
stages. First, we focus on the situation that the break point is assumed to be known. Second,
we address the estimation of the date of the break shading light on the ability of the procedure
for dating the structural break. This is of special interest, because the cointegration testing
requires a consistent estimate of the break point. At this point, we proceed to the analysis of
the empirical size and power of the test using the estimation method of the date of the break
that o¤ers better results. That is the reason why we decided to carry out the simulations using
the parametric correction instead of the non-parametric one. The number of leads and lags has
been selected using the BIC information criterion with an initial value of 4 leads and lags. In
addition, to avoid the inconsistency on the estimation of the long-run covariance matrix we have
followed Kurozumi (2002), and estimate it using the Bartlett kernel with the modi�ed automatic
lag length selection Andrews� procedure. In brief, Kurozumi (2002) proposes estimating the
bandwidth for the Bartlett kernel as:
l = min
8<:1:1447
4a2T
(1 + a)2(1� a)2
!1=3; 1:1447
4k2T
(1 + k)2(1� k)2
!1=39=; ;where a is the estimate of the autoregressive parameter that produces Andrews method. The
simulations that he carries out suggest to use k = 0:7 or k = 0:8 as values that keep a compromise
between the empirical size and power of the test �here we use k = 0:8. The GAUSS codes that
have been used in the simulations are available upon request.
6.1 The break point is assumed to be known
The simulation results for � = 0:5; strictly exogenous regressor (a1 = 0), � = 0:5 and �t = (2; 1)
are summarized in Table 3. Qualitatively similar results are obtained for the other values of �;
for �t = (2; 4) and � = 1, so they are omitted in order to save space, although the complete set of
14

results is available from the authors upon request. Also, the rejections frequencies for � = �0:5
are similar to those of � = 0:5, so we only report the last ones.
When xt is strictly exogenous (a1 = 0) and there is no serial correlation of the error in
the cointegrating regression (� = 0) there are no serious problems of size distortion, regardless
of the break point position, the magnitude of the structural break and the covariance between
disturbance terms of the model. When there is autocorrelation (� = 0:5) the tests su¤ers certain
size distortion problems. Note also, that the oversize of SC+D (�) is lower than that of SCD (�).
As can be seen in Table 3, if xt is no longer strictly exogenous (a1 6= 0) the discrepancy between
empirical and nominal size increases, though as the signal-to-noise ratio grows the size distortion
tends to decrease. As expected, in this situation the SC+D (�) test generally outperforms SCD (�).
Hence, the SC+D (�) statistic has better size than SCD (�) in all the scenarios considered.
Table 3: Empirical size for test SCD with known break datePanel A: strictly exog. reg. Panel B: non strictly exog. reg.
(a1 = 0) (a1 = 1)SCD (�) SC+D (�) SCD (�) SC+D (�)
� �n � 0 0:5 0 0:5 0 0:5 0 0:50 0:25 0.054 0.087 0.052 0.082 0.965 0.783 0.137 0.191
0:33 0.058 0.103 0.056 0.100 0.963 0.752 0.130 0.1680:5 0.048 0.086 0.045 0.081 0.935 0.676 0.121 0.1551 0.058 0.088 0.051 0.087 0.768 0.451 0.102 0.1392 0.072 0.095 0.066 0.094 0.493 0.270 0.077 0.104
0:5 0:25 0.086 0.138 0.056 0.100 0.965 0.759 0.124 0.1390:33 0.082 0.142 0.050 0.097 0.957 0.662 0.131 0.1340:5 0.090 0.154 0.058 0.092 0.895 0.502 0.099 0.1001 0.076 0.140 0.052 0.084 0.561 0.238 0.068 0.0872 0.086 0.146 0.048 0.097 0.214 0.127 0.073 0.082
DGP: yt � gD (t)� �txt = zt; zt = �zt�1 + ezt ; a1yt � a2xt = wt;wt = wt�1 + ewt ; gD (t) =� + �DUt; � = 0:5;�t = (2; 1); ezt � iidN (0; 1) ; ewt � iidN
�0; �2
�;E (eztewt) = ��;T =
200; Tb = [�T ] ;� = 0:5;n = 1; 000 replications; 5% nominal size
Next, we consider the power of the statistics when the break date is known. The DGP is as
the previous one, but with �2� ={0.001, 0.01, 0.1}. This set of values is the same as in McCabe
et al. (1997). Table 4 reports the rejection frequencies for � = 0:5. Similar results were obtained
for other break fractions and values of the rest of the parameters. The SCD (�) statistic has a
very high power when a1 = 1 which can be explained by the size distortion that shows in this
situation. Except for this case, the power attained by the tests is slightly smaller than the one
15

obtained by McCabe et al. (1997), were they assume that there is no break in the cointegration
relationship, weak exogeneity and used a parametric approach to deal with the serial correlation.
Table 4: Empirical power for test SCD with known break datePanel A: strictly exogenous regressors (a1 = 0)
� = 0:5;�t = (2; 1) � = 1;�t = (2; 4)�2� SCD (�) SC+D (�) SCD (�) SC+D (�)0:001 0.169 0.162 0.161 0.1530:01 0.600 0.588 0.612 0.5950:1 0.830 0.82 0.788 0.773Panel B: non strictly exogenous regressors (a1 = 1)
� = 0:5;�t = (2; 1) � = 1;�t = (2; 4)�2� SCD (�) SC+D (�) SCD (�) SC+D (�)0:001 0.778 0.178 0.794 0.3230:01 0.858 0.506 0.886 0.6250:1 0.828 0.619 0.821 0.652
DGP: yt � gD (t) � �txt = zt; zt = �t + ezt ; a1yt � a2xt = wt;wt = wt�1 + ewt ;�t =
�t�1 + �t; gD (t) = �+ �DUt; � = 0:5;�t = (2; 1); ezt � iidN (0; 1) ; ewt � iidN�0; �2
�; �t �
iidN�0; �2�
�;E (eztewt) = ��;�
2 = 1; � = 1;T = 200; Tb = [�T ] ;� = 0:5;n = 1; 000 replica-tions; 5% nominal size
6.2 The break point is estimated
In this subsection we analyse the �nite sample performance of the test statistic when the break
point is estimated using the procedure described in Section 4, see expression (9). We use the
notation ~T+b when the estimator is based on (8). We start considering the estimation of the
break date. As shown in Table 5, the estimators based on the minimization of the sum of the
squared residuals, ~Tb and ~T+b ; usually locate correctly the break fraction and the error, if any,
tends to be small. A similar picture was obtained for other values of the parameters of the DGP.
Let us consider the size of the statistics. Panel A in Table 6 reports the results assuming
strictly exogenous regressors, while panel B presents the empirical size when the stochastic
regressors are not strictly exogenous. These rejection frequencies are very similar to those of
Table 3 were the break fraction were known. Even the slight size distortion observed for the
SC+ statistic seems to be smaller in Table 6. Hence, we may conclude that estimation the break
date with (9) and then using this break date to compute the test statistic has a very little impact
on the size of the test. As in the case of known break date, the statistic SC+D outperforms SCD
in all the scenarios.
16

Table 5: Frequencies of correct detection of the unknown break datePanel A: strictly exogenous regressors (a1 = 0)
� = 0:5;�t = (2; 1) � = 1;�t = (2; 4)
� ~Tb ~T+b~Tb ~T+b
0.1 0.78 (0.03) 0.78 (0.04) 0.95 (0.00) 0.95 (0.00)0.25 0.85 (0.02) 0.85 (0.02) 0.96 (0.00) 0.95 (0.00)0.5 0.87 (0.02) 0.87 (0.02) 0.98 (0.00) 0.98 (0.00)0.75 0.91 (0.01) 0.92 (0.01) 0.97 (0.00) 0.97 (0.00)0.9 0.90 (0.01) 0.89 (0.01) 0.98 (0.00) 0.98 (0.00)Panel B: non strictly exogenous regressors (a1 = 1)
� = 0:5;�t = (2; 1) � = 1;�t = (2; 4)
� ~Tb ~T+b~Tb ~T+b
0.1 0.26 (0.53) 0.24 (0.32) 0.55 (0.28) 0.33 (0.09)0.25 0.42 (0.34) 0.30 (0.24) 0.69 (0.16) 0.49 (0.07)0.5 0.52 (0.26) 0.44 (0.15) 0.80 (0.09) 0.72 (0.04)0.75 0.57 (0.27) 0.54 (0.16) 0.82 (0.10) 0.78 (0.05)0.9 0.43 (0.44) 0.48 (0.18) 0.72 (0.19) 0.62 (0.07)
NOTE: Frequencies of correct location of the date break and frecuencies of location errors bigger than 5 between brackets.DGP: yt�gD (t)��txt = zt; zt = �zt�1+ezt ; a1yt�a2xt = wt;wt = wt�1+ewt ; gD (t) = �+�DUt; � = 0:5;�t = (2; 1); ezt �iidN (0; 1) ; ewt � iidN
�0; �2
�;E (eztewt) = ��;T = 200; Tb = [�T ] ;n = 1; 000 replications;
Table 6: Empirical size for test SCD with unknown break datePanel A: strictly exog. reg. Panel B: non strictly exog. reg.
(a1 = 0) (a1 = 1)
SCD
�e�� SC+D
�e�� SCD
�e�� SC+D
�e��� �n � 0 0:5 0 0:5 0 0:5 0 0:50 0:25 0.051 0.088 0.053 0.085 0.812 0.262 0.115 0.136
0:33 0.056 0.082 0.053 0.078 0.855 0.624 0.115 0.1230:5 0.061 0.093 0.056 0.084 0.827 0.606 0.091 0.1191 0.063 0.079 0.056 0.077 0.737 0.557 0.101 0.0972 0.034 0.109 0.039 0.112 0.476 0.395 0.085 0.097
0:5 0:25 0.075 0.144 0.050 0.095 0.836 0.575 0.110 0.1200:33 0.085 0.135 0.044 0.085 0.849 0.576 0.106 0.1280:5 0.085 0.143 0.055 0.094 0.784 0.436 0.093 0.1071 0.106 0.122 0.059 0.072 0.507 0.238 0.065 0.0782 0.097 0.145 0.062 0.091 0.212 0.133 0.064 0.082
DGP: yt � gD (t)� �txt = zt; zt = �zt�1 + ezt ; a1yt � a2xt = wt;wt = wt�1 + ewt ; gD (t) =� + �DUt; � = 0:5;�t = (2; 1); ezt � iidN (0; 1) ; ewt � iidN
�0; �2
�;E (eztewt) = ��;T =
200; Tb = [�T ] ;� = 0:5;n = 1; 000 replications; 5% nominal size
17

Regarding the empirical power of the test, Table 7 shows the rejection frequencies in di¤erent
situations. Comparing these results with those of Table 4, when the regressors are strictly
exogenous (a1 = 0, Panel A), the �gures are very similar, whereas for non strictly exogenous
regressors, the statistics based on the estimation of the break fraction has a slight reduction in
power.
Table 7: Empirical power for test SCD with unknown break datePanel A: strictly exogenous regressors (a1 = 0)
� = 0:5;�t = (2; 1) � = 1;�t = (2; 4)
�2� SCD
�e�� SC+D
�e�� SCD
�e�� SC+D
�e��0:001 0.156 0.150 0.162 0.1600:01 0.591 0.586 0.599 0.5830:1 0.791 0.762 0.821 0.808Panel B: non strictly exogenous regressors (a1 = 1)
� = 0:5;�t = (2; 1) � = 1;�t = (2; 4)
�2� SCD
�e�� SC+D
�e�� SCD
�e�� SC+D
�e��0:001 0.740 0.235 0.783 0.1990:01 0.761 0.578 0.849 0.5820:1 0.673 0.651 0.740 0.724
DGP: yt � gD (t) � �txt = zt; zt = �t + ezt ; a1yt � a2xt = wt;wt = wt�1 + ewt ;�t =
�t�1 + �t; gD (t) = �+ �DUt; � = 0:5;�t = (2; 1); ezt � iidN (0; 1) ; ewt � iidN�0; �2
�; �t �
iidN�0; �2�
�;E (eztewt) = ��;�
2 = 1; � = 1;T = 200; Tb = [�T ] ;� = 0:5;n = 1; 000 replica-tions; 5% nominal size
Finally, in simulations not reported here, we �nd that the size and the power of SCD�e��
and SC+D�e�� were similar to those of the previous tables when there were no structural break,
that is � = 0 and � constant for all the sample.
To sum up, the main conclusion that arises from these simulation experiments is that the
estimation of the break date minimising the SSR has little e¤ect on the performance of the
test statistics. The statistics SC+ have, in general, a correct size with small size distortions for
correlated errors, which is a common feature of all the statistics of this class. In terms of size, this
statistic outperforms SC in all the scenarios considered, especially when the regressors are not
strictly exogenous. So, we recommend using the SC+ statistic. The test has also an adequate
power, which is only slightly reduced when the break date has to be estimated. Hence, the test
statistics presented in this paper can be seen as complementary tools for no cointegration tests
with structural breaks and their use is recommended in empirical research.
18

7 Conclusions
This paper has focused on testing the null hypothesis of cointegration allowing for one structural
break. Our approach can be understood as a complementary method to ensure the presence of
cointegration around a break-cointegrating relationship. The test statistic used in the paper is a
multivariate extension of the KPSS test, which was �rst proposed in Harris and Inder (1994) and
Shin (1994) to test the null hypothesis of cointegration. We considered six di¤erent possibilities of
structural break and two di¤erent situations depending on the properties of the set of stochastic
regressors: when they are strictly exogenous they are not. In this last case, we suggest using the
DOLS estimation of Stock and Watson (1993).
The paper has distinguished two di¤erent situations depending on whether the break point is
known or unknown. The estimation of the break point bases on the minimisation of the sum of
the squared residuals, which provides T -consistent estimates of the break fraction. Monte Carlo
experiments show that the statistics that correct for the presence of endogenous regressors has
good size and power properties irrespective of whether they are strictly or non-strictly exogenous
regressors. Hence, we recommend using this test in empirical applications as a complement of
non-cointegration tests with structural breaks.
19

A Mathematical Appendix
In this Appendix we outline the proof of the Theorems that have been proposed during the
paper, although a more detailed exposition can be found in the working paper of this article �see
Carrion-i-Silvestre and Sansó (2001). Some intermediate results are required beforehand. We
use the following lemmas throughout.
Lemma 1 The assumption of multivariate invariance principle of Phillips and Durlauf (1986)
states that in the limit f�tgTt=1, �t =
Pti=1 ("i; &
0i)0, converges to:
264 T�1=2!�11Pt
i=1 "i
T�1=222
�1=222
Pti=1 &i
375)264 W11 (r)
W2k (r)
375 =W (r) ; t=T � r < (t+ 1)/T
t = 1; :::; T , where ) denotes weak convergence of the associated probability measures and W (r)
is the (k + 1)-vector of standard Wiener processes de�ned on C [0; 1]k+1 with
= limT!1
T�1E��T �
0T
�=
264 !21 !12
!21 22
375as the covariance matrix.
Proof: see Phillips and Durlauf (1986).
Lemma 2 Let fxtgTt=1 be generated by (2) and f�tgTt=1 a (k + 1)-vector of stochastic processes
that satis�es the multivariate invariance principle of Phillips and Durlauf (1986). Therefore, it
can be shown that T�3=2PT
t=1 xt ) 1=222
R 10W2k (r) dr; T�3=2
PTt=1 xtDUt )
1=222
R 1�W2k (r) dr;
T�1PT
t=1 xt"t ) !11=222
R 10W2k (r) dW11 (r)+�21; T�2
PTt=1 xtx
0t )
�1=222
R 10W2k (r)W
02k (r) dr
�1=222
where W (r) is the (k + 1)-vector of unit Wiener processes de�ned in lemma 1 and �21 denotes
the correlation between the components of �t.
Proof: see Perron (1989), Park and Phillips (1988), Phillips (1988) and Hansen (1992a).
For short we denote the integrals involving Brownian motions such asR 1�W2k (r) dr by
R 1�W2k,
and the stochastic integrals such asR 10W2k (r) dW11 (r) by
R 10W2kdW11.
20

A.1 Proof of Theorem 1
Here we only sketch the proof of Theorem 1 for model E �the most general model considered in
the paper�since the proof for the other models follows the same reasoning and are particular
cases for it. The OLS estimated residuals of (5) can be computed as et = "t�zt (z0z)�1 z0", where
zt = [1, DUt, t, DT �t , x0t, x
0tDUt] is the (T � (2k + 4))-matrix of regressors. Let P = diag(T�1=2,
T�1=2, T�3=2, T�3=2, T�1, ..., T�1) and A = diag(1, 1, 1, 1, �1=222 , �1=222 ) be scaling ((2k+4)
� (2k+4))-matrices. Hence, the partial sum processes St =Pt
j=1 ej can be computed from:
T�1=2!�11 St = T�1=2!�11
tXj=1
"j � T�1=2!�11tX
j=1
zjPA (A0Pz0zPA)
�1A0Pz0":
It is straightforward to see that, at the limit, the cross-product matrix A0Pz0zPA converges in
distribution to a (6� 6)-symmetric matrix, A0Pz0zPA ) H, with elements given by: h11 = 1,
h12 = h22 = (1� �), h13 = 1=2, h14 = h24 = (1� �)2 =2, h15 =R 10W 02k, h16 = h25 = h26 =R 1
�W 02k, h23 =
�1� �2
�=2, h33 = 1=3, h34 =
�2� 3�+ �3
�=6, h35 =
R 10rW 0
2k, h36 =R 1�rW 0
2k,
h44 = (1� �)3 =3, h45 = h46 =R 1�(r � �)W 0
2k, h55 =R 10W2kW
02k, h56 = h66 =
R 1�W2kW
02k.
Moreover, the product between matrix regressors and disturbance term " converges to the (6� 1)-
vector J , Pz0" ) J , with elements given by: J1 = !1W11 (1), J2 = !1 (W11 (1)�W11 (�)),
J3 = !1
�R 10rdW11
�, J4 = !1
�R 1�rdW11 � � (W11 (1)�W11 (�))
�, J5 = !1
1=222
R 10W2kdW11,
J6 = !11=222
R 1�W2kdW11. The partial sum process of matrix regressors converges to:
T�1=2tX
j=1
zjPA )
8><>: K1 for t � Tb
K2 for t > Tb;
whereK1 = [r 0 r2
2 0R r0W 02k 0] andK2 = [r (r � �) r2
2(r��)2
2
R r0W 02k
R r�W 02k].
Using these results, for t � Tb we have that at the limit the partial sum process converges to:
T�1=2!�11 St )
8><>: Lk;E1 (r; �) for t � Tb
Lk;E2 (r; �) for t > Tb;
21

where Lk;E1 (r; �) =W11 (r)�K1H�1J and Lk;E2 (r; �) =W11 (r)�K2H
�1J . Appealing to the
Continuous Mapping Theorem (CMT), we obtain:
SCE (�) = T�2!�21
264 TbXt=1
0@ tXj=1
ej
1A2
+
TXt=Tb+1
0@ tXj=1
ej
1A2375
)Z �
0
Lk;E1 (r; �)2dr +
Z 1
�
Lk;E2 (r; �)2dr;
where !21 is a consistent estimate of the long-run variance of fetg : The symmetry of the as-
ymptotic distribution is shown in the companion working paper in Carrion-i-Silvestre and Sansó
(2001). Thus, after some algebra manipulations the limiting distribution can be equivalently
expressed as
�2Z 1
0
V 2k;E (b1) db1 + (1� �)2Z 1
0
V 2k;E (b2) db2;
where Vk;E (�) are the residuals from the projection of a standard Wiener process onto the sub-
space generated by the deterministic regressors (properly rescaled) and theW2k (�), and Vk;E (b1)
and Vk;E (b2) are independent.
A.2 Proof of Theorem 3
This proof follows similar arguments in Bai (1997), Bai and Perron (1998) and Perron and Zhu
(2004). The OLS residuals can be written as:
et = "t � zt (�) � + zt (�)�
= "t � zt (�) (z0 (�) z (�))�1 z0 (�) "
��zt (�) (z
0 (�) z (�))�1z0 (�) z (�)� zt (�)
��;
where � 2 (0; 1) denotes the true break fraction and � 2 (0; 1). We can write
22

SSR (�)� SSR (�) = ��0d0 (�) z (�)P (Pz0 (�) z (�)P )�1 Pz0 (�) d (�)�
+�0d0 (�) d (�)�
+2"0z (�)P (Pz0 (�) z (�)P )�1Pz0 (�) d (�)� 2"0d (�)
= �0d0 (�)Md (�)� � 2"0Md (�) (A.1)
� Q (�)� 2G (�)
where d (�) = z (�)� z (�) and M = I � z (�)P (Pz0 (�) z (�)P )�1 Pz0 (�) :
Lemma 3 Given that M is a idempotent matrix we have
0 � Q (�) � �0d0 (�) d (�)�
=
8>>>><>>>>:j�� � jO (T ) for models An and A
j�� � jO�T 3�for models B,C and E
Op�T 2�
for model D
and that the probability orders of Q (�) and �0d0 (�) d (�)� are the same. Morevover, for large
samples
G (�) =
8>>>><>>>>:Op�T 1=2
�for models An and A
Op�T 3=2
�for models B, C and E
Op (T ) for model D
:
Proof. The probability orders are obtained by direct calculations and presented in a summarised
way as:
�0d0 (�) d (�)� =
8>>>><>>>>:�2 j�� � jT for models An and A
2 13T3 j�� � j
��� + �2 + �2
�+Op
�T 2�for models B, C and E
�22P[�T ]
[�T ] x2t + op
�T 2�
for model D
:
23

Now we have the elements to proof Theorem 3. From (A.1) and Lemma 3
T�j (SSR (�)� SSR (�)) = T�jQ (�) + op (1) : (A.2)
where j = 1 for models An and A, j = 3 for models B, C and E and, j = 2 for model D. Next,
given the properties of projections,
T�jSSR�~��� T�jSSR (�) (A.3)
Let us suppose that ~�9p � . Then, according to (A.2) for large T we need
T�jQ�~��� 0
but, T�jQ�~��> 0 when ~� 6= � . Hence, there is a contradiction with inequality (A.3) so that
the only way in which it can be satis�ed is ~�!p � .
To establish the convergence rate we �rst de�ne the sets
V� = fTk : jTk � Tbj < �Tg
for � 2 (0; 1) and
V� (C) = fTk : jTk � Tbj < �T; jTk � Tbj > Cg
for C > 0; so V� (C) � V�. Note that SSR�~��� SSR (�) with probability 1. Next, note that
given results of Lemma
P
�min
�T2V�(C)
SSR (�)� SSR (�)j�� � jT � 0
�< �
for small � > 0 provided thatSSR (�)� SSR (�)
j�� � jT > 0
on V� (C) with large probability and that the term Q (�) in (A.1) dominates G (�) for large
samples. This proves the Theorem.
24

References
Bai, J., 1994. Least Squares Estimation of a Shift in Linear Processes, Journal of Time Series
Analysis, 15, 453�472.
, 1997. Estimation of a Change Point in Multiple Regression Models, Review of Economics
and Statistics, pp. 551�563.
and P. Perron, 1998. Estimating and Testing Linear Models with Multiple Structural
Changes, Econometrica, 66 1, 47�78.
and , 2003. Computation and Analysis of Multiple Structural Change Models, Journal
of Applied Econometrics, 18, 1�22.
Banerjee, A., J. J. Dolado, D. F. Hendry and G. W. Smith, 1986. Exploring Equilibrium Re-
lationships in Econometrics through Static Models: Some Monte Carlo Evidence, Oxford
Bulletin of Economics and Statistics, 48, 253�277.
Bartley, W. A., J. Lee and M. C. Strazicich, 2001. Testing the Null of Cointegration in the
Presence of a Structural Break, Economics Letters, 73 3, 315�323.
Busetti, F., 2002. Testing for (Common) Stochastic Trends in the Presence of Structural Breaks,
Journal of Forecasting, 21, 81�105.
Carrion-i-Silvestre, J. L. and A. Sansó, 2001. Testing the Null of Cointegration with Struc-
tural Breaks, Department of Econometrics, Statistics and Spanish Economy. University of
Barcelona.
Engle, R. F. and C. W. J. Granger, 1987. Cointegration and Error Correction: Representation,
Estimation, and Testing, Econometrica, 55, 251�276.
and S. Yoo, Cointegrated Economic Time Series: An Overview with New Results, in R. F.
Engle and C. W. J. Granger, eds., Long-Run Economic Relationships, Oxford University
Press, 1991.
25

Gabriel, V., A. Da Silva and L. Nunes, 2003. Instability in Cointegration Regressions: A Brief
Review with an Application to Money Demand in Portugal, Applied Economics, 35, 893�
900.
Gonzalo, J., 1994. Five Alternative Methods of Estimating Long-Run Equilibrium Relationships,
Journal of Econometrics, 60, 203�233.
Granger, C. W. J., 1981. Some Propierties of Time Series Data and their Use in Econometric
Model Speci�cation, Journal of Econometrics, 16, 121�130.
Gregory, A. W. and B. E. Hansen, 1996. Residual-based Tests for Cointegration in Models with
Regime Shifts, Journal of Econometrics, 70, 99�126.
and , 1996. Tests for Cointegration in Models with Regime and Trend Shifts, Oxford
Bulletin of Economics and Statistics, 58, 3, 555�560.
Hansen, B. E., 1992. Convergence to Stochastic Integrals for Dependent Heterogeneous
Processes, Econometric Theory, 8, 489�500.
, 1992. Testing for Parameter Instability in Regressions with I(1) Processes, Journal of
Business & Economic Statistics, 10, 321�335.
Hao, K., 1996. Testing for Structural Change in Cointegrated Regression Models: some Com-
parisons and Generalisations, Econometric Reviews, 15, 4, 401�429.
Harris, D. and B. Inder, A Test of the Null Hypothesis of Cointegration, in Colin P. Hargreaves,
ed., Nonstationary Time Series Analysis and Cointegration, Oxford University Press, 1994.
chapter 5, pp. 133�152.
Kurozumi, E., 2002. Testing for Stationarity with a Break, Journal of Econometrics, 108,
63�99.
Kwiatkowski, D., P. C. B. Phillips, P. J. Schmidt and Y. Shin, 1992. Testing the Null Hypothesis
of Stationarity Against the Alternative of a Unit Root: How Sure are We that Economic
Time Series Have a Unit Root, Journal of Econometrics, 54, 159�178.
26

Lee, J. and M. Strazicich, 2001. Testing the Null of Stationarity in the Presence of One Structural
Break, Applied Economics Letters, 8, 377�382.
Leybourne, S. J. and B. P. M. McCabe, 1993. A Simple Test for Cointegration, Oxford Bulletin
of Economics and Statistics, 55, 2, 97�103.
Lütkepohl, H., C. Muller and P. Saikkonen, Unit Root Tests for Time Series with a Structural
Break When the Break Point is Known, Technical Report SFB. 373 33/99, Institut für
Statistik und Ökonometrie. Humboldt University 1999.
McCabe, B. P. M., S. J. Leybourne and Y. Shin, 1997. A Parametric Approach to Testing the
Null of Cointegration, Journal of Time Series Analysis, 18, 4, 395�413.
Nyblom, J. and A. C. Harvey, 2000. Tests of Common Stochastic Trends, Econometric Theory,
16, 176�199.
Park, J. Y., Testing for Unit Roots and Cointegration by Variable Addition, in T. B. Fomby
and G. F. Rhodes, eds., Advances in Econometrics: Co-Integration, Spurious Regressions
and Unit Roots, Jai Press Inc, 1990.
and P. C. B. Phillips, 1988. Statistical Inference in Regressions with Integrated Processes:
Part 1, Econometric Theory, 4, 468�498.
Perron, P., 1989. The Great Crash, the Oil Price Shock and the Unit Root Hypothesis, Econo-
metrica, 57, 6, 1361�1401.
, 1990. Testing for a Unit Root in a Time Series with a Changing Mean, Journal of Business
& Economic Statistics, 8, 2, 153�162.
and X. Zhu, 2004. Structural Breaks with Deterministic and Strochastic Trends, Journal
of Econometrics, p. Forthcoming.
Phillips, P. C. B., 1988. Multiple Regression with Integrated Time Series, Contemporary Math-
ematics, 80, 79�105.
and B. Hansen, 1990. Statistical Inference in Instrumental Variables Regression with I(1)
Processes, Review of Economic Studies, 57, 99�125.
27
and S. N. Durlauf, 1986. Multiple Time Series Regression with Integrated Processes,
Review of Economic Studies, 53, 473�496.
and S. Ouliaris, 1990. Asymptotic Properties of Residual Based Tests for Cointegration,
Econometrica, 58, 165�193.
Saikkonen, P., 1991. Asymptotically E¢ cient Estimation of Cointegration Regression, Econo-
metric Theory, 7, 1�21.
Shin, Y., 1994. A Residual-based Test of the Null of Cointegration against the Alternative of no
Cointegration, Econometric Theory, 10, 91�115.
Stock, J. H. and M. W. Watson, 1993. A Simple Estimator of Cointegrating Vectors in Higher
Order Integrated Systems, Econometrica, 61, 4, 783�820.
28
Copyright © 2022 FDOKUMEN