commercial short holiday breaks in scotland : an analysis of ...
472
COMMERCIAL SHORT HOLIDAY BREAKS IN SCOTLAND : AN ANALYSIS OF MARKET STRUCTURE, SUPPLIER STRATEGIES AND PERFORMANCE DAVID A EDGAR A thesis submitted in partial fulfilment of the requirements ofNapier University for the degree of Doctorate of Philosophy. May 1997
-
Upload
khangminh22 -
Category
Documents
-
view
2 -
download
0
Transcript of commercial short holiday breaks in scotland : an analysis of ...
COMMERCIAL SHORT HOLIDAY BREAKS IN SCOTLAND :
AN ANALYSIS OF MARKET STRUCTURE, SUPPLIER
STRATEGIES AND PERFORMANCE
DAVID A EDGAR
A thesis submitted in partial fulfilment of the requirements ofNapier University for the degree of
Doctorate of Philosophy.
May 1997
SYNOPSIS
Hospitality and tourism environments are widely regarded as complex and dynamic in
nature. This combined with the need for commercial organisations to improve
performance places considerable emphasis on the need for approaches to
understanding market and organisation dynamics.
This research proposes an approach to analysing and understanding the dimensions of
markets and the interface with organisations to allow optimum performance. It uses the
commercial short holiday break (CSHB) market in Scotland as a contextual base, and
reflects an industrial economics approach which encompasses identification of market
structure, competitive strategies and company performance, to explore activity in the area
and propose approaches to analysing dynamic and complex markets.
Commercial short holiday breaks (CSHB) are widely recognised as a growth market for
hotels. What is often not documented is that such growth is at the expense of other
market sectors, fuelling mature market conditions and requiring increasingly
sophisticated marketing strategies to gain and sustain market share and thus improve
performance.
To date, little has been published on how hotel companies compete in CSHB markets or
what performance differences result as a consequence of different strategies and market
conditions. Therefore through an extensive literature review (of the limited data available)
and the construction of a database of hotel groups containing the 30 largest hotel groups
operating in Scotland, an indication of the market structure was formed. To confirm initial
findings and provide more detailed data on strategies adopted in the market, structured
telephone interviews were conducted with key suppliers. The interviews revealed strategic
groups with two main categories of strategy : predator strategies for gaining market share
and secondly defender strategies for protecting market share. To establish how strategy
affects corporate performance, further interviews were conducted at the corporate level
and then in recognition of the multi-site nature of hotel operations, interviews were also
conducted at unit level for six key short break providing companies. The findings indicate
that there are bilateral "associations" between the market structure, the strategy adopted
and the resulting performance. Having constructed a model based upon the findings, it
appears to be the case that results hold true between both the corporate (industry)
relationships and the unit (market) level relationships, making the model a significant
contribution to knowledge.
. . ll

ACKNOWLEDGEMENTS
Over the past four years a number of people have assisted me in a variety of ways. I
wish to pay them homage.
Firstly many thanks to all the managers and executives of the sample companies for
their tireless and co-operative assistance.
Much gratitude is owed to the Scottish Tourist Board for the initial research funding
and to Professor David Litteljohn for applying for and securing the funds.
Thank you to the staff of the department of Hospitality and Tourism Management for
their continual interest and support, particularly Sandra Watson, Myrtle Allardyce and
Dr Andy Frew for their assistance with administration and motivational support.
Many thanks to family and friends who's inquisitive nature often made me review and
question my ideas.
I also wish to acknowledge the assistance of Lynn Jones from Edinburgh Tourist
Board Research Department for her sound advice and assistance in proof reading and
piloting questionnaires, and to my supervisory team for "keeping me on the ball".
On a more personal level my absolute gratitude to my director of studies, Professor
David Litteljohn for his continual support, sound advice, and fresh approach - an
excellent director and never a dictator - thank you !
Last but by no means least, thanks to my wife, Val, who has suffered my bad tempers
and supported me both financially and morally every step of the way and to my two
sons, Andrew and Steven, to whom I dedicate this work, for ensuring sleepless nights
with which to write up.
. .. lll

DECLARATION
While registered as a candidate for the degree for which
submission is hereby made I have not been a registered
candidate for another award of any degree awarding body. No
material contained within this thesis has been used in any
submission for an academic award.
David A Edgar
NAPIER UNIVERSITY
May 1997
. lV
Synopsis
Acknowledgements
Declaration
Contents
List of Tables
List of Figures
List of Appendices
Glossary
Thesis Structure
PART I: METHODOLOGY
CONTENTS
··········································
··········································
Chapter 1 Research Methodology and Research Design
1.1 Research Overview 1.2 Litertaure Review- Strategic Management Research 1.3 The Industry Context 1.4 Research Approach 1.5 Research Aims and Objectives 1.6 Methods Adopted 1. 7 Chapter Summary
PART II: THE HOSPITALITY ENVIRONMENT 1980-1991
Chapter 2 Tourism in the UK
2.1 Introduction 2.2 Nature of Tourism Service 2.3 The Tourism Mix 2.4 Statistical Problems 2.5 Nature of Tourism Demand 2.6 Nature of Tourism Supply 2.7 Chapter Summary
Chapter 3 The Hotel Industry in the UK
3 .1 Introduction 3.2 The Value of the Hotel Industry 3.3 Nature of the Hotel Industry
v
Page
I
11
lli
IV
Vlli
X
XIV
XV
1
6
60
81
3 .4 Hotel Industry Demand 3.5 Hotel Industry Supply 3. 6 Changes in the Hotel Industry 3. 7 The Scotland Perspective 3.8 Chapter Summary
Chapter 4 The Nature of Hotel Units ···································· 105
4.1 Introduction 4.2 The Industry- Market Gap 4.3 Hotel Units- The Price Approach 4.4 The Role of Yield Management: A Decision Tool 4.5 Alternative Yield Methods 4.6 Chapter Summary
Chapter 5 Short Breaks - A Logical Progression 129
5.1 Introduction 5.2 Defining Short Breaks 5.3 The Short Break Market : An Attractive Progression 5.4 The Short Break Market : An Evolution 5.5 The Size of the Short Break Market 5.6 The Value of the Short Break Market 5. 7 Short Breaks and Hotel Accommodation 5.8 The Growth of Short Breaks 5. 9 Short Breaks : A Segmented Market 5.10 The Short Break Market Structure 5 .11 The Future for Short Breaks 5.12 Chapter Summary
PART III: IMPLEMENTING METHODS
Chapter 6 Implementing Research Methods 156
6.1 Introduction 6.2 Research Questions 6.3 Research Objectives 6.4 Definition of Commercial Short Holiday Breaks 6.5 Research Methods 6.6 Implementing the Research Framework 6.7 Chapter Summary
. Vl
PART IV: FINDINGS AND ANALYSIS
Chapter 7 Structure of CSHB Markets ··························· 175
7.1 Introduction 7.2 Theoretical Foundations 7.3 The CSHB Market Macro Structure in Scotland 7.4 The CSHB Market Micro Structure : Hotel Sample 7.5 Key CSHB Market Structure Variable for Hotel Groups (Scotland) 7.6 Chapter Summary
Chapter 8 CSHB Strategies and Competitive Advantage .......................... 217
8.1 Introduction 8.2 Theoretical Foundations 8.3 Competitive Advantage and CSHB Strategy : An Overview 8.4 CSHB Strategies Adopted 8.5 Strategic Groups and Strategic Space 8.6 CSHB Strategy - Structure Relationships 8.7 Chapter Summary
Chapter 9 Performance in the CSHB Market .................................... 260
9.1 Introduction 9.2 Theoretical Foundations 9.3 Measures ofPerformance 9.4 Hotel Group Financial Performance 9.5 Hotel Group Non-Financial Performance 9.6 Summary of Performance Measures 9.7 Chapter Summary
PART V: CONCLUSIONS AND CRITIQUE
Chapter 10 Summary Discussion: Developing a CSHB Performance Model- a Contribution to Knowledge .................................... 275
10.1 Introduction 10.2 The Structure-Strategy-Performance Analysis Framework 10.3 The Structure-Strategy-Performance Analysis Framework Applied :
Industry Level 10.4 The Structure-Strategy-Performance Analysis Framework Applied :
CSHB Market Level 10.5 Desire to Move in Strategic Space 10.6 Model ofEnhanced CSHB Performance 10.7 Summary of Contributions to Knowledge 10.8 Chapter Summary
.. Vll

Chapter 11 Methodology Critique and Further Research ............................ 319
11.1 Introduction 11.2 Critical Review of Methodology 11.3 Areas for Further Research 11.4 Chapter Summary
Bibliography
Appendices
... Vlll
338
349
LIST OF TABLES
PARTI:METHODOLOGY
Chapter 1 Research Methodology and Research Design (None)
PART II: THE HOSPITALITY ENVIRONMENT
Chapter 2 Tourism in the UK
2.5.1a Volume and Value ofUK Tourism Segments 1991
Chapter 3 The Hotel Industry
3.4a Hotel Revenues by Market Source 1991 3.4b UK Hotel Groups Pic Segment Mix 1991 3.5a Structure of UK Hotel Industry 1991 3.5b UK Hotels Over Three Star Market Level 1991 3.5c Hotel Groups in the UK 1991 3.5.2a Level of Service - Hotel Groups Pic 1993/4 3.5.3a Ten Largest Hotel Groups in the UK 1991 3.7.1a Breakdown of Market Segment Spend % 1991 3.7.2a Registered Hotels in Scotland 1991 3.7.2b Ten Largest Hotel Groups Operating in Scotland 1991
Chapter 4 The Nature of Hotel Units
4.3.5a Cost Comparisons UK - Scotland 199112 4.5.1a Sales Volume - Price Cut relationships
Chapter 5 Short Breaks - A Logical Progression (None)
PART III: IMPLEMENTING METHODS
Chapter 6 Implementing the Research Methods
Page
68
85 86 90 90 90 92 93 96 97 98
116 120
6.5.2a 6.5.2b 6.5.2c
Database Sample : Hotel Groups Operating in Scotland 1991 159 Sample of20 Hotel Groups Operating in Scotland 1991 159 Changes in Database Sample of 20 160
. lX
6.5.2d 6.5.4a 6.5.4b
Regional Divisions of Scotland Interview Response Rate Changes in Phase I Sample
PART IV: FINDINGS AND ANALYSIS
Chapter 7 Structure of CSHB Markets
7.4.3a Ranking of Day When CSHB are A vai1able 7.5.1a Hotel Groups UK CSHB Market Scope 1991 7.5.2a Size of Hotel Groups by Concentration Ratios - Scotland 1991 7.5.3a No. Sources of Competitive Advantage- Hotel Groups 1991
Chapter 8 CSHB Strategies and Competitive Advantage
8.3.2a Summary of Hotel Group Prime CSHB Strategies 8.4a CSHB Prime Strategies 8.4.2a Value of CSHB Commission 1991 8.4.2b Number of CSHB Brands and Segments - Hotel Groups 1991 8.4.3a Prime Strategies Summarised 8.5a Prime Strategies of Hotel Groups 8.6.1a Legend of Hotel Group Codes
Chapter 9 Performance in the CSHB Market
9.4.1a Industry Level Performance 9.4.2a Market Level Performance 9.5a Competitive Identity 9.6a Performance Measures
PART V: CONCLUSIONS AND CRITIQUE
161 163 164
195 209 210 211
224 228 235 236 243 245 247
266 267 268 269
Chapter 10 Summary Discussion: Developing a CSHB Performance Model- a Contribution to Knowledge
10.3a 10.3.1a 10.4a
Summary of Hotel Group Structure, Strategy, Performance Summary of Industry Performance Strategies Summary of Hotel Group Structure, Strategy, CSHB Market Performance
Chapter 11 Methodology Critique and Further Research
(None)
X
278 295
298
LIST OF FIGURES
PARTI:METHODOLOGY
Chapter 1 Research Foundations and Design
1.2.1a The Four Stages in the Evolution of Strategic Planning 1.2.1b Philips' Four Phases of Strategic Management 1.2.1c Summary of Evolution of Strategic Management 1.2.1c Summary ofEvolution of Strategic Management (Cont..) 1.2.1d Evolution of Strategic Management Research 1.2.2a Paradigms of Strategic Management Research 1.2.2b Paradigms of Strategic Thought 1.2.3a Research in Hospitality Strategic Management 1.2.3a Research in Hospitality Strategic Management (Cont..) 1.4.1a General Research Approach 1.6a Research Methods 1.6.1a Market Analysis and Segmentation Model 1.6.1 b Initial Research Model - Stage I 1.6.1c Industrial Economics Approach 1.6.1d Developing Research Framework - Stage 2 1.6.1e Developed Research Framework- End result 1.6.2a Interview Phases
PART II: THE HOSPITALITY ENVIRONMENT
Chapter 2 Tourism in the UK
2.2a 2.3a 2.5.1a 2.5.1b 2.5.2a 2.5.2b 2.5.3a/b
Intangibility - Simultaneity Continuum Tourism Core and Peripheral Needs Inbound International Tourism Trips and Nights 1981-1991 Inbound International Tourism Spend 1981-1991 Inbound International Tourism- Scotland 1981-1991 Inbound International Tourism Spend- Scotland 1981-1991 Breakdown of Tourism Spend UK and Scotland 1991
Chapter 3 The Hotel Industry
3.3.la The Concept of Hospitality Groups 3.4a Hotel Demand Sales Mix 1991 3.4b Demand for Hotels Plc 1980-2000 3.5.2a Hotel Group Affiliations 1991/2 3.7.2a Hotel Occupancy in Scotland 1981-1991
. Xl
Page
7 8 1 1 12 14 16 17 19 20 24 31 34 34 35 36 37 38
61 62 67 67 71 72 73
82 87 88 91 99
Chapter 4 The Nature of Hotel Units
4.3.1a Pricing Decision Framework 4.3.1b Demand Curve 4.3.1c Price Elasticity of Tourism Demand 4.3.3a Cost Dynamics - Fixed Costs 4.3.3b Cost Dynamics- Stepped and Gradual Fixed Costs 4.3.3c Cost Dynamics - Variable Costs 4.3.3d Cost Dynamics - Break Even 4.3.4a Hotel Cost Relationships 4.3.4b Departmental Contributions 4.5.la Maximising Revenues from Existing Demand
Chapter 5 Short Breaks - A Logical Progression
5.5.la Breakdown of Scotland and UK Tourism Trips 1991 5.5.lb Breakdown of Tourism Trips in Commercial Accommodation 5.5.2a Breakdown of Scotland and UK Tourism Nights 1991 5.5.2b Breakdown of Tourism Nights in Commercial Accommodation 5.6.1a Breakdown of Tourism Spend: Type of Accommodation- UK 5.6.1b Breakdown of Tourism Spend: Accommodation- Scotland 5.7a Short Break Spend per Trip by Type of Accommodation 1991 5.7b Short Break Spend per Night by Type of Accommodation 1991 5.8.1a Growth of UK Short Holiday Market 1980- 1991 5.8.lb Growth in Spend of UK Short Holiday Market 1980 - 1991 5.8.lc Growth in Spend per Trip I Night of Short Holidays 1983 - 1991 5.8.2a The UK Holiday Market Trips and Nights 1980- 1991 5.8.2b UK Domestic Holiday Spend 1983- 1991 5.9a Components of a Short Break 5.10a Industry Structure Model 5.10b UK Short Break Market Structure
PART III: IMPLEMENTING METHODS
Chapter 6
6.5.3a 6.5.3b 6.5.3c 6.5.3d 6.5.3e 6.5.3f 6.5.3g 6.6a
Implementing Research Methods
Map of Scotland Division Phase I Questionnaire Sample Questionnaire Sample by Location Questionnaire Sample by Hotel Group Questionnaire Sample by Rooms in Primary Locations Questionnaire Sample by Rooms in Secondary Locations Questionnaire Sample by Rooms in Tertiary Locations Research Framework
.. Xll
106 107 108 Ill 112 112 113 113 114 120
134 134 135 135 136 137 138 139 140 141 141 142 143 144 146 147
161 164 166 167 167 168 168 170
PART IV: FINDINGS AND ANALYSIS
Chapter 7 Structure of CSHB Markets
7.3.la CSHB Industry Structure 177 7.3.lb CSHB Market Structure - Hotel Groups 178 7.3.3a CSHB Distribution Channels 184 7.4.la Hotel Markets Targeted 1991 186 7.4.1 b Average Split of Hotel Market Supply Occupancy 1991 186 7.4.1c Expanded Hotel Markets Targeted 1991 187 7.4.2a Hotel Group Ownership Structure in Scotland 1991 188 7.4.2b Market Share of Hotel Units in Scotland 1991 189 7.4.2c Market Share of CSHB Revenue in Scotland 1991 189 7.4.2d Hotel Group Sample Rooms and Units by Location - Scotland 1991 190 7.4.2e Hotel Group Sample Market Level - Scotland 1991 191 7.4.2f Hotel Group Sample Market Level by Location - Scotland 1991 191 7.4.2g Average CSHB Tariffby Location- Scotland 1991 192 7.4.3a Why CSHBs are Offered by Hotel Groups 199112 193 7.4.3b Number of Months CSHBs are Available 199112 194 7.4.3c Supply and Demand for CSHBs 1991 194 7.4.4a CSHB Markets Targeted 199112 196 7.4.4b CSHB Markets Identified as Greatest Growth Areas 1991/2 197 7.4.4c CSHB Markets Identified as Greatest Future Potential 1991/2 198 7.4.4d Hotel Group Identified Need for Change 1991 - 2000 199 7.4.5a Contribution ofCSHBs 1991 200 7.4.5b Price Sensitivity of CSHB Markets 202 7.4.5c Department Revenue Generation- CSHBs 1991/2 202 7.4.6a Identified CSHB Competitors 1991 203 7.4.6b Identified Hotel Group Competition 1991 204 7.4.6c Identified Barriers to CSHB Market Entry 1991/2 205 7.4.7a Involvement in the CSHB Market 206 7.4.7b Organisation Linkages- Hotel Groups, CSHB Market 1991/2 207 7.4.7c Importance of Linkages to Hotel Groups 208
Chapter 8 CSHB Strategies and Competitive Advantage
8.3.1a Areas of Competitive Advantage - Hotel Groups 1991/2 221
8.3.1b No. Sources of Competitive Advantage - Hotel Groups Scotland 222
8.3.2a CSHB Marketing Strategies Adopted 1991/2 223
8.3.2b Benefits of High Perceived Quality 224
8.3.3a Value Chain Linkages 225
8.3.3b Managing Complexity 226
8.4.1a Setting Prices in the CSHB Market 1991/2 229
8.4.1b CSHB After sales Activities by Hotel Groups 1991/2 230
8.4.2a CSHB Distribution Channels 'Y' 1 --'
8.4.2b Importance of Distribution Channels 231
8.4.2c No. CSHB Distribution Channels Used by Hotel Groups Scotland 232
8.4.2d Methods of Allocating CSHB Hotel Group Brochures 2"'~"' .).)
Xlll
8.4.2e Short Break Operators Brochure Usage 1991/2 8.4.2f Value CSHB Commission and Market Segments - Scotland 1991 8.4.2g CSHB Theme Supply, Demand and Revenue Generation- Scotland 8.4.2h Importance ofCSHB Package Components 1991/2 8.4.2i Brochure Production Budget of Hotel Groups - Scotland 1991 8.4.3a CSHB Strategies and Market Complexity 8.6.la Market Scope - CSHB Strategy 8.6.2a Group Size - CSHB Strategy 8.6.3a Sources of Competitive Advantage - CSHB Strategy
Chapter 9 Performance in the CSHB Market
(None)
PART V: CONCLUSIONS AND CRITIQUE
Chapter 10 Summary Discussion: Developing a CSHB Performance Model- a Contribution to Knowledge
10.2.4a Relationship Between Structure, Strategy and Performance 10.3.1a Structure - Strategy - ROCE 10.3.2a Structure - Strategy - Gearing 10.3.3a Structure - Strategy - Profitability 10.3.5a Determinants of Strategic Capability 10.4.1a Structure - Strategy - CSHB Revenue 1 0.4.2a Structure - Strategy - Peer Competitive Identity 10.6a Model of Enhanced CSHB Performance - Strategic Space
Chapter 11 Methodology Critique and Further Research
(None)
. XIV
234 ,,., -_.))
238 239 241 242 247 248 249
276 279 285 290 296 300 305 309
LIST OF APPENDICES
PAGE
Appendix I Profile of Hotel Group Sample ........................................ 352
Appendix II Phase I Questionnaire Sample . . . ....... ......... ...... .. .. ... .. . . .. . . 362
Appendix III Phase II Questionnaire Sample . . . . . . . . . .. . . . . . . . . . . . . . . . . . . . . . . . . . . . . . 3 79
Appendix IV Phase III Questionnaire Sample ........................................ 385
Appendix V Testing the Model : A Multi-Site Unit Perspective .............. 397
XV

GLOSSARY
ATB- Area Tourist Board
BTS -British Travel Survey (to 1989)
Competitive Advantage- The means of providing "added value" by one organisation over others.
CSHB- Commercial short holiday break(s) (as per research definition)
CSO - Central Statistics Office
FAME - Financial Analysis Made Easy CD-ROM package.
GDP - Gross Domestic Product
Gearing - Level of debt to equity ratio of organisations
Goldemail - Short Break Operator company
HCTC- Hotel and Catering Training Council
IPS - International Passenger Survey
P AIT - Profit After Interest and Tax
Rack Rate - Published hotel bedroom rate, including VAT and service charge.
Rainbow - Short Break Operator company
ROCE - Return on Capital Employed
SBO - Short Break Operator
Superbreaks - Short Break Operator company
UK Hotels Plc - UK Hotel Companies quoted on the stock exchange.
UKTS -United Kingdom Tourism Survey (From 1989)
VFR- Visiting Friends and Relatives
. XVI

THESIS STRUCTURE
I) THESIS STRUCTURE
The thesis is organised in five parts, reflecting the achievement of the identified aims
and objectives of the research. Part I explains the research approach and
methodology. Part II provides an overview of the hospitality and hotel environment
identifying the research problem, and justifying the focus of the research on hotels,
Scotland and the short break market. Part III explains how the methodology was
implemented. Part IV presents the findings of the research and provides an analysis
of those findings, and Part V forms the conclusion and contributions to knowledge, as
well as providing a critique of the research methodology and highlighting areas
warranting further research.
The chapters within each of the five parts are shown in figure 1, overleaf.
Page 1
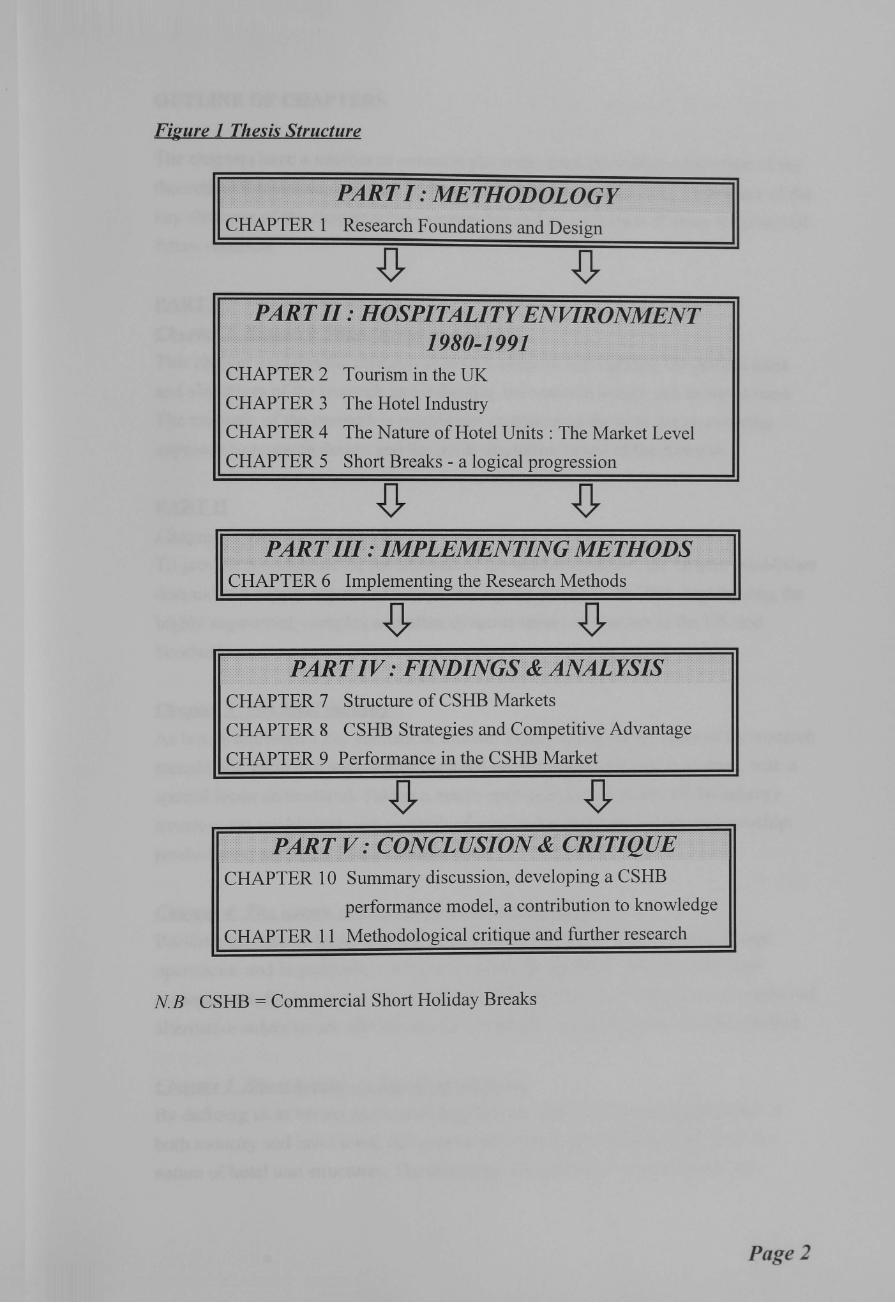
Figure 1 Thesis Structure
........ i>.AR··· r;tT .T . • M: ·· E .. · r·rroino~ToG· .r:t:~ .... J.> .l • / ... ·.·· . n.1 :v L Y CHAPTER 1 Research Foundations and Design
.. · .. PJ4JJ.'t11: 1IO$P1.TALITY·ENVIRONMENT .. . .·· .. . 1980~1991
CHAPTER 2 Tourism in the UK
CHAPTER 3 The Hotel Industry
CHAPTER 4 The Nature of Hotel Units: The Market Level
CHAPTER 5 Short Breaks - a logical progression
.................. PJ4/Jltt .. 1.11: 11fiitldE.MENf£ING .. MEtiions CHAPTER 6 Implementing the Research Methods
! :i 1!2:fll.tlZ~f7)£ f?lNiiil\fdS; (£ .. f4N/liJ¥sls ... CHAPTER 7 Structure of CSHB Markets
CHAPTER 8 CSHB Strategies and Competitive Advantage
CHAPTER 9 Performance in the CSHB Market
<.:. >... 1!J4~T; 1 J;j ! (JtiJV;i!Ji1tJS10N& cliJJ':tiQliE . CHAPTER 10 Summary discussion, developing a CSHB
performance model, a contribution to knowledge
CHAPTER 11 Methodological critique and further research
N B CSHB = Commercial Short Holiday Breaks
Pagel

OUTLINE OF CHAPTERS
The chapters have a number of common elements. Each provides an overview of the
theoretical foundations relevant to the specific area of investigation, a summary of the
key elements of the chapter where appropriate and an indication of areas for potential future research.
PART I
Chapter 1 Research Foundations and Design This chapter explains the research approach adopted, highlighting the general aims
and objectives of the research and indicating the research design and methods used.
The rationale of the research is established emphasising the need for an evolving
approach to research design and the multi-discipline nature of the research.
PART II
Chapter 2 Tourism in the UK To provide foundations for the analysis of the market structure, the chapter establishes
demand and supply aspects of tourism during the period 1980-1991, highlighting the
highly segmented, complex and often dynamic nature of tourism in the UK and
Scotland.
Chapter 3 The hotel industrv As hotels represent a key element of tourism supply and form the basis of the research
sample, the value and structure of the hotel industry in the UK are examined, with a
special focus on Scotland. Taking a macro approach, key elements of the industry
structure are established with particular focus on the changing nature of ownership;
product mix; and hotel group concentration.
Chapter 4 The nature ofhotel units : The market level Building on chapter three, through an understanding of the nature of micro hotel
operations, and in particular a focus on pricing; profitability; costing; and yield
management, the key issues facing individual hotel units are established. A number of
alternative solutions are offered and the conditions facilitating short breaks clarified.
Chapter 5 Short breaks - a logical progression By defining short breaks and examining their growth in value and market share at
both industry and hotel level, this chapter shows that short breaks result from the
nature of hotel unit structures. The changing characteristics of short breaks are
Page3

established from demand and supply perspectives and an indication of the highly
segmented nature of the market is established through a model of industry structure.
The culmination of growth and value of the market, and the identifiable lack of
market knowledge form the basis behind the rationale for research in the area -
identifying the research problem.
PART III Chapter 6 Implementing the Research Methods
Having identified the evolution of the research design and methods adopted in Part I,
and the background to the research area in Part II, this chapter establishes how the
methods were implemented, explaining the focus on hotel groups in Scotland. The
implementation of the initial segmentation model and industrial economics approach
are explained. A sequential approach is adopted representing chronological
developments and reflecting the maturation of the research process.
PART IV Chapter 7 Structure of CSHB markets
Through primary and secondary research, and adopting a supply and demand side
approach, the structure of the Commercial Short Holiday Break (CSHB) market in
Scotland is established. This involves determining consumer profiles (demand),
industry (supply) developments and structural variables, and their implications on
structure- strategy relationships.
Chapter 8 CSHB strategies and competitive advantage
This chapter identifies the main forms of competition in the CSHB market before
focusing on the most prominent strategies used to. gain market share in Scotland and
highlighting areas of competitive advantage through the concept of strategic groups
and strategy - structure linkages. Through introducing the concept of strategic groups
and establishing hotel group dominance, the highly monopolistic competition
conditions of the market are established and foundations laid for further analysis.
Chapter 9 Performance in the CSHB market
Corporate level performance is examined in terms of financial and non-financial
measures and linked to the strategy adopted by the organisation.
Unit level performance is explored in Appendix V where the performance
enhancement model is tested and comparisons drawn between unit (market)
corporate (industry) level operations.
Page4

PARTV
Chapter 10 Summary discussion. developing a CSHB performance model. a contribution to knowledge The relationships between market structure-strategy-performance are established
within the context of CSHBs in Scotland. Areas of key contribution to knowledge are
highlighted and the potential for further research developments explained.
Based upon the findings of the research and the work of previous chapters, a CSHB
performance model is constructed and explained.
Chapter 11 Methodological critique andfurther research The methodology adopted is critically evaluated in light of research experiences and
findings and industry developments. Alternative approaches and refinements to the
research are suggested, and areas of further research are highlighted.
Before focusing on the nature of the research problem, the first chapter provides a
grounding for the research, establishing the rationale of approach, context of research
and initial methods adopted, before later chapters identify the research problem, apply
the research design and methods and draw conclusions from the findings.
Page5
PART I
METHODOLOGY
PAaE
CHAPTER! RESEARCH METHODOLOGY AND RESEARCH DESIGN 6

CHAPTER ONE
RESEARCH METHODOLOGY AND RESEARCH DESIGN
1.1 RESEARCH OVERVIEW
Short break markets have grown rapidly in size, value and sophistication since the
1960's. They are now a valuable market to Scottish tourism in terms of contribution to
hotel fixed costs, reduced seasonality, and high supplementary spend. In 1990, they
accounted for £87.5M, 70% of all short holiday spend (United Kingdom Tourism
Survey- UKTS 1991).
The research explores the nature and strategic development of Commercial Short
Holiday Breaks (CSHB) within Scottish tourism. In particular it aims to analyse the
marketing strategies employed by major companies in the field, through an
examination of market segmentation, corporate and unit level activities, and linkages
between market structure, competitive strategies and company performance.
This chapter describes the research methodology, providing a literature review of
developments in the field of strategic management, determining the context of the
research, research approach, aims and objectives and methods adopted, before Part II
details the research question and Part III provides details of how the methods were
implemented.
1.2 LITERATURE REVIEW- STRATEGIC MANAGEMENT RESEARCH
The purpose of this section is to determine how the study of strategic management has
evolved and relate this to current approaches used in hospitality strategic
management. The process is intended to identify where this research can contribute
towards the body of knowledge in strategic management.
As strategic management research focuses on the relationship among strategy,
environment, leadership/organisation, and performance (Summer et al 1990), and each
of the four constructs are multidimensional, the conceptual challenge and complexity
of research in the area is considerable.
Page 6
1.2.1 Strategic Management Research : The State Of The Art
"The field of strategic management has emerged from being a pre-theoretic case study
based capstone integrative course, into a reasonably distinct subdiscipline in
management studies. A substantial body of knowledge has accumulated over the past
two decades which directly or indirectly addresses issues related to strategy
formulation and implementation in organisations. The future of strategic management
as a viable academic subdiscipline will depend on the scientific quality and practical
usefulness of research that is generated in the field" (Shrivastava 1987).
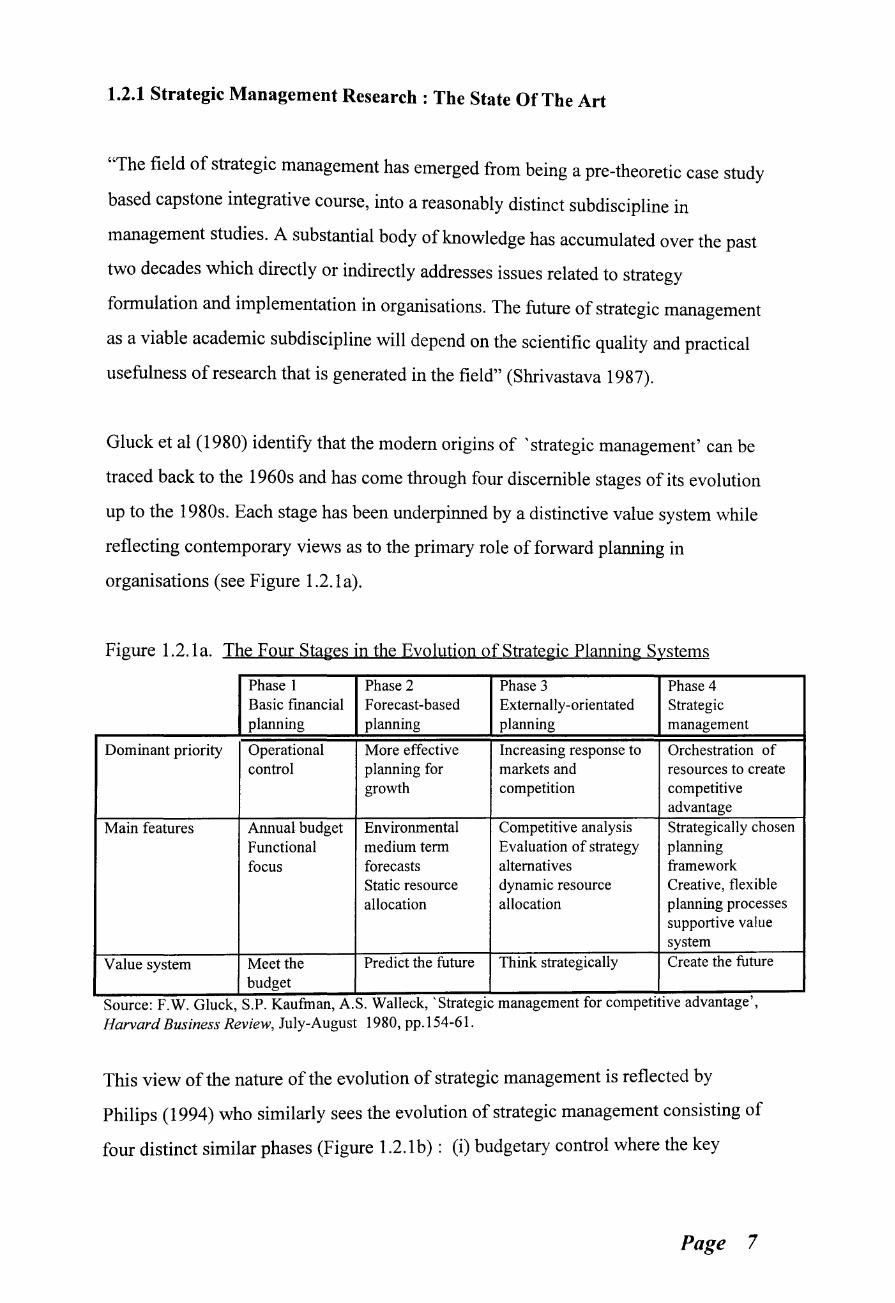
Gluck et al (1980) identify that the modem origins of 'strategic management' can be
traced back to the 1960s and has come through four discernible stages of its evolution
up to the 1980s. Each stage has been underpinned by a distinctive value system while
reflecting contemporary views as to the primary role of forward planning in
organisations (see Figure 1.2.1a).
Figure 1.2.1 a. The Four Stages in the Evolution of Strategic Planning Systems
Phase 1 Phase 2 Phase 3 Phase 4 Basic fmancial Forecast-based Externally-orientated Strategic planning planning planning management
Dominant priority Operational More effective Increasing response to Orchestration of control planning for markets and resources to create
growth competition competitive advantage
Main features Annual budget Environmental Competitive analysis Strategically chosen Functional medium term Evaluation of strategy planning focus forecasts alternatives framework
Static resource dynamic resource Creative, flexible allocation allocation planning processes
supportive value system
Value system Meet the Predict the future Think strategically Create the future budget
.. , Source: F.W. Gluck, S.P. Kaufman, A.S. Walleck, Strategic management for competitive advantage , Harvard Business Review, July-August 1980, pp.154-61.
This view of the nature of the evolution of strategic management is reflected by
Philips ( 1994) who similarly sees the evolution of strategic management consisting of
four distinct similar phases (Figure 1.2.1 b) : (i) budgetary control where the key
Page 7
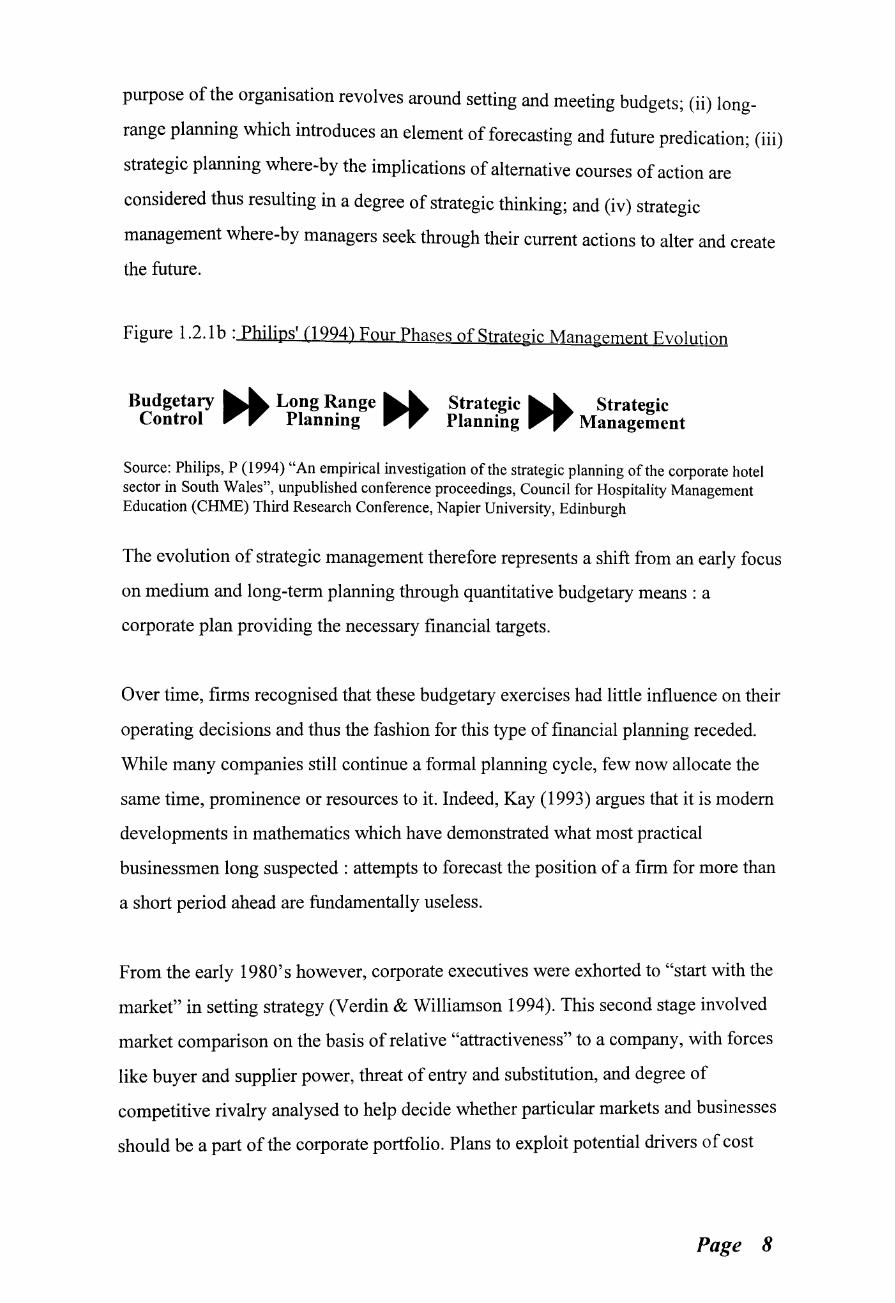
purpose of the organisation revolves around setting and meeting budgets; (ii) long
range planning which introduces an element of forecasting and future predication; (iii)
strategic planning where-by the implications of alternative courses of action are
considered thus resulting in a degree of strategic thinking; and (iv) strategic
management where-by managers seek through their current actions to alter and create
the future.
Figure 1.2.1 b :Philips' (1994) Four Phases of Strategic Management Evolution
Budgetary ............ Long Range ............ Strategic ............ Strategic Control III""J"" Planning III""J"" Planning III""J"" Management
Source: Philips, P (1994) "An empirical investigation ofthe strategic planning ofthe corporate hotel sector in South Wales", unpublished conference proceedings, Council for Hospitality Management Education (CHME) Third Research Conference, Napier University, Edinburgh
The evolution of strategic management therefore represents a shift from an early focus
on medium and long-term planning through quantitative budgetary means: a
corporate plan providing the necessary financial targets.
Over time, firms recognised that these budgetary exercises had little influence on their
operating decisions and thus the fashion for this type of financial planning receded.
While many companies still continue a formal planning cycle, few now allocate the
same time, prominence or resources to it. Indeed, Kay (1993) argues that it is modem
developments in mathematics which have demonstrated what most practical
businessmen long suspected : attempts to forecast the position of a firm for more than
a short period ahead are fundamentally useless.
From the early 1980's however, corporate executives were exhorted to "start with the
market" in setting strategy (Verdin & Williamson 1994). This second stage involved
market comparison on the basis of relative "attractiveness" to a company, with forces
like buyer and supplier power, threat of entry and substitution, and degree of
competitive rivalry analysed to help decide whether particular markets and businesses
should be a part of the corporate portfolio. Plans to exploit potential drivers of cost
Page 8
advantage like scale and sources of differentiation e.g. quality, became the focus of
strategic direction.
Recognition of weaknesses in this approach lead to a third stage of study. Major
weaknesses related to the use of systematised analysis of existing markets, applying
similar tools to particular markets leading to similar conclusions by all players about
how to compete. Profitless "me too" strategies could emerge. The third stage therefore
looked beyond standard formulae applied to existing markets, emphasising ideas like
"strategic intent" and "expeditionary marketing". Articulation on strategy based on
futuristic market visions came into vogue. However, in the 1990's (stage 4) research
in the area is moving away from the external regulation and influences upon
organisations towards a focus in self assessment of the firms distinctive capabilities.
This evolution in the study of strategic management reflects the growth in interest and
research effort and the changing perceptions of the strategy problem over time. This is
reflected in figure 1.2.1 c which provides a comprehensive review of the development
of strategic management research and practice.
Figure 1.2.1 c highlights the key issues and authors influencing the evolution of
strategic management research to the current form it adopts today, from its birth in the
1960s representing·a focus on budgetary control and forecasting, with associated
issues reflecting (i) enhancing the efficiency of administrative processes and (ii)
organisation structure. The 1970s represented a transitional stage where strategic
management became more recognised academically and building the "science" base
of the field. The result was the development of contingency and scenario building
techniques. As such, modelling and case study approaches to research became ala
mode with greater awareness of technological and logistical developments forming the
focus of research.
The 1980s represent a further development stage. The increasing intemationalisation
and globalisation of industry, markets and competition resulted in a greater focus
upon environmental issues. This, combined with its developing rigour and the use of
Page 9
multi-disciplinary approaches, resulted in a greater degree of economic theory and
increased sophistication and rig our of methods. Throughout this period, the
positioning school of strategy became increasingly prominent with the belief that
different market structures may offer a range of lucrative rewards if the strategy is
appropriate. This basic concept evolved fundamentally from the industrial economics
school and the industrial organisation disciplines - the industrial economics paradigm.
Such developments facilitated theory building in what was a relatively under
theorised field.
The 1990s have witnessed a maturation of the strategic management field with a
greater awareness of the internal capabilities of organisations and the increasing
globalisation of markets. While many principles developed through theory building in
the 1980s remain prominent, the nature of research has become focused upon the
organisations resources and capabilities. The questions of why some organisations
perform more effectively than others is still addressed but from a micro as opposed to
macro perspective.
Page 10
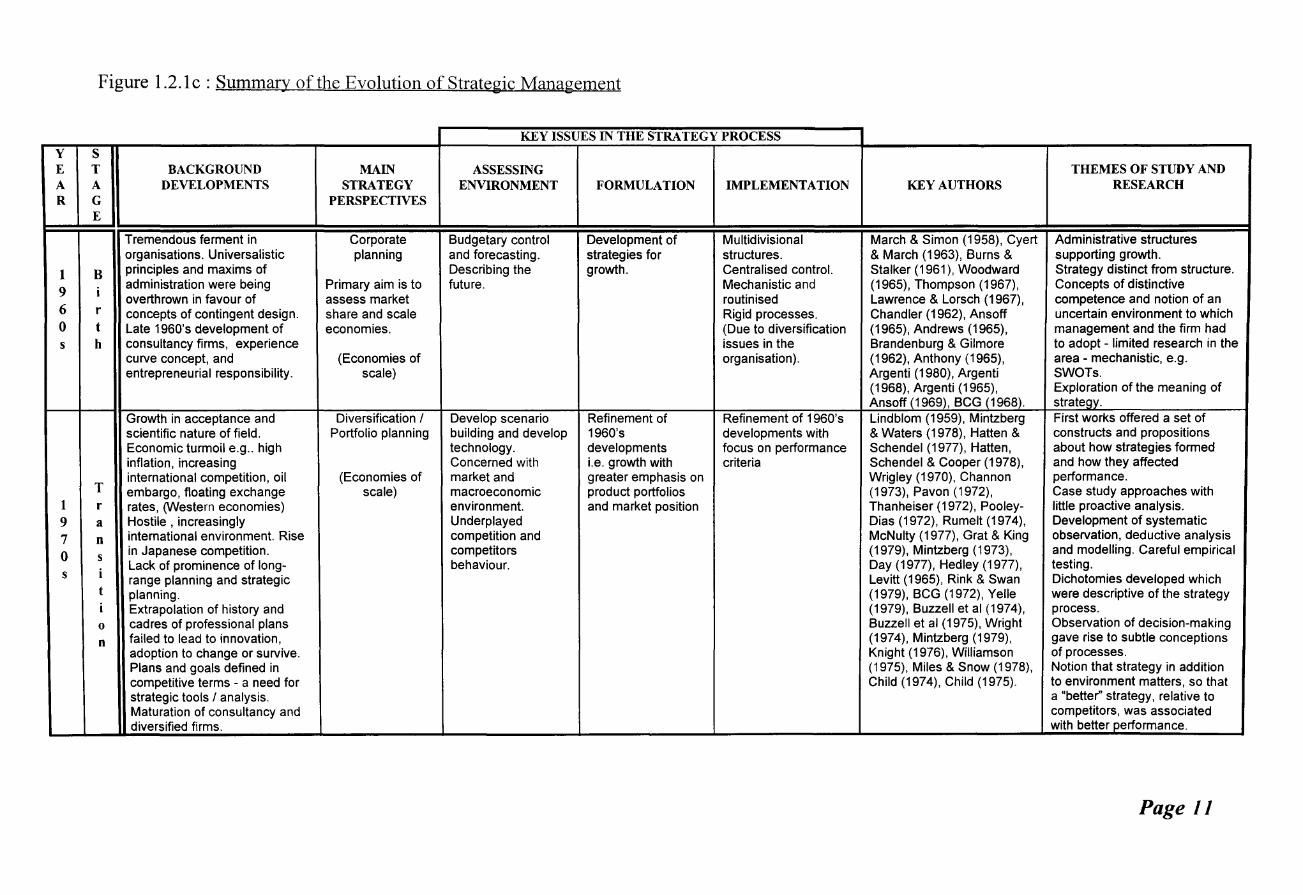
Figure 1.2.1 c : Summary of the Evolution of Strategic Management
KEY ISSUES IN THE STRATEGY PROCESS y s E T BACKGROUND MAIN ASSESSING THEMES OF STUDY AND A A DEVELOPMENTS STRATEGY ENVIRONMENT FORMULATION IMPLEMENTATION KEY AUTHORS RESEARCH R G PERSPECTIVES
E
Tremendous ferment in Corporate Budgetary control Development of Multidivisional March & Simon (1958), Cyert Administrative structures organisations. Universalistic planning and forecasting. strategies for structures. & March (1963), Burns & supporting growth.
1 B principles and maxims of Describing the growth. Centralised control. Stalker (1961 ), Woodward Strategy distinct from structure.
9 i administration were being Primary aim is to future. Mechanistic and (1965), Thompson (1967), Concepts of distinctive overthrown in favour of assess market routinised Lawrence & Lorsch (1967), competence and notion of an
6 r concepts of contingent design. share and scale Rigid processes. Chandler (1962), Ansoff uncertain environment to which 0 t Late 1960's development of economies. (Due to diversification (1965), Andrews (1965), management and the firm had s h consultancy firms, experience issues in the Brandenburg & Gilmore to adopt - limited research in the
curve concept, and (Economies of organisation). (1962), Anthony (1965), area- mechanistic, e.g. entrepreneurial responsibility. scale) Argenti (1980), Argenti SWOTs.
(1968), Argenti (1965), Exploration of the meaning of Ansoff (1969), BCG (1968). strategy.
Growth in acceptance and Diversification I Develop scenario Refinement of Refinement of 1960's Lindblom (1959), Mintzberg First works offered a set of scientific nature of field. Portfolio planning building and develop 1960's developments with & Waters (1978), Hatten & constructs and propositions Economic turmoil e.g .. high technology. developments focus on performance Schendel (1977), Hatten, about how strategies formed inflation, increasing Concerned with i.e. growth with criteria Schendel & Cooper (1978), and how they affected international competition, oil (Economies of market and greater emphasis on Wrigley (1970), Channon performance.
T embargo, floating exchange scale) macroeconomic product portfolios (1973), Pavon (1972), Case study approaches with 1 r rates, (Western economies) environment. and market position Thanheiser (1972), Pooley- little proactive analysis. 9 a Hostile , increasingly Underplayed Dias (1972), Rumelt (1974), Development of systematic
7 n international environment. Rise competition and McNulty (1977), Grat & King observation, deductive analysis
0 s in Japanese competition. competitors (1979), Mintzberg (1973), and modelling. Careful empirical
i Lack of prominence of long- behaviour. Day (1977), Hedley (1977), testing.
s range planning and strategic Levitt (1965), Rink & Swan Dichotomies developed which t planning. (1979), BCG (1972), Yelle were descriptive of the strategy i Extrapolation of history and (1979), Buzzell et al (1974), process. 0 cadres of professional plans Buzzell et al (1975), Wright Observation of decision-making
n failed to lead to innovation, (1974), Mintzberg (1979), gave rise to subtle conceptions adoption to change or survive. Knight (1976), Williamson of processes. Plans and goals defined in (1975), Miles & Snow (1978), Notion that strategy in addition competitive terms - a need for Child (1974), Child (1975). to environment matters, so that strategic tools I analysis. a "better" strategy, relative to Maturation of consultancy and competitors, was associated diversified firms. with better performance.
Page 11
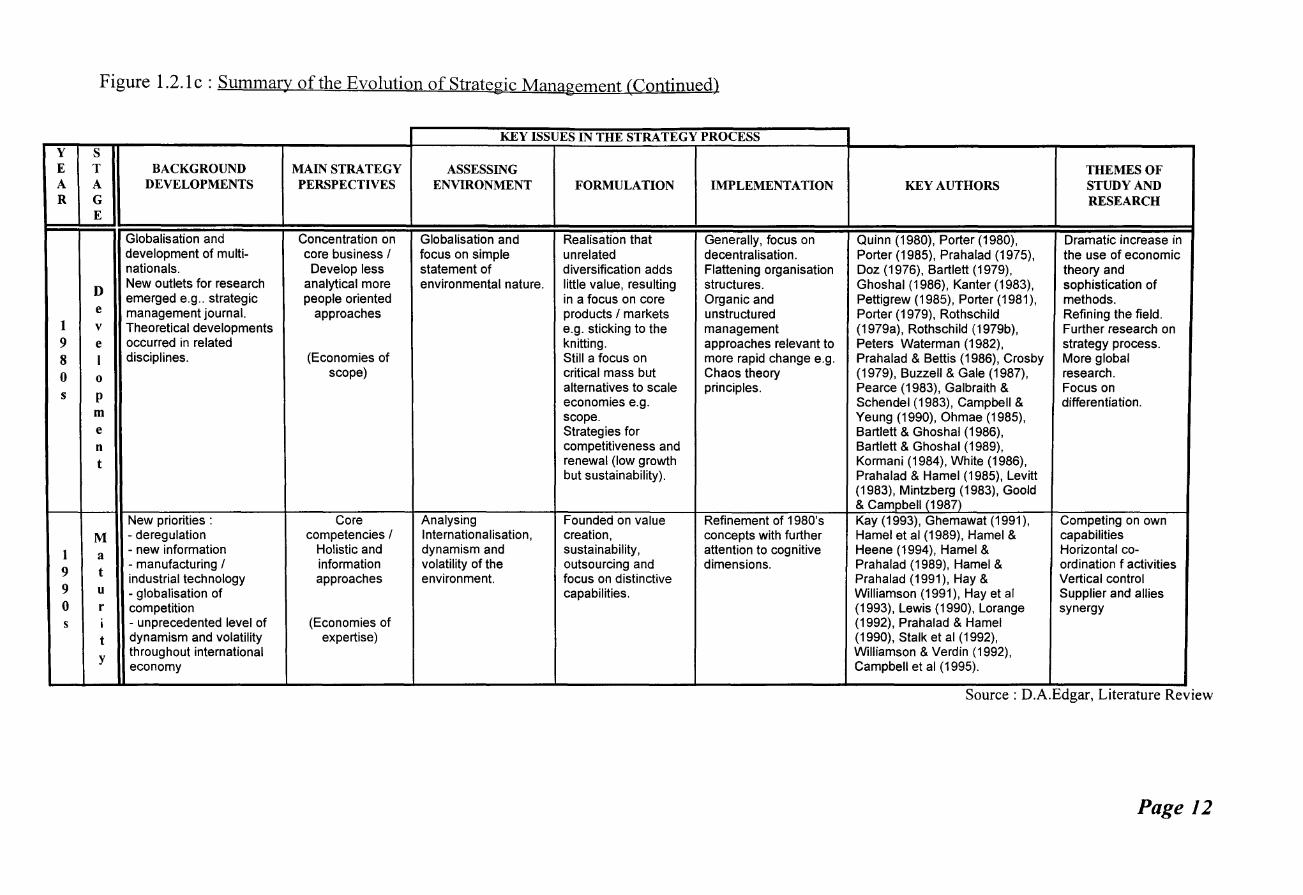
Figure 1.2.1 c : Summary of the Evolution of Strategic Management (Continued)
KEY ISSUES IN THE STRATEGY PROCESS y s E T BACKGROUND MAIN STRATEGY ASSESSING THEMES OF A A DEVELOPMENTS PERSPECTIVES ENVIRONMENT FORMULATION IMPLEMENTATION KEY AUTHORS STUDY AND R G RESEARCH
E
Globalisation and Concentration on Globalisation and Realisation that Generally, focus on Quinn (1980), Porter (1980), Dramatic increase in development of multi- core business I focus on simple unrelated decentralisation. Porter (1985), Prahalad (1975), the use of economic nationals. Develop less statement of diversification adds Flattening organisation Doz (1976), Bartlett (1979), theory and
D New outlets for research analytical more environmental nature. little value, resulting structures. Ghoshal (1986), Kanter (1983), sophistication of emerged e.g .. strategic people oriented in a focus on core Organic and Pettigrew (1985), Porter (1981), methods.
e management journal. approaches products I markets unstructured Porter (1979), Rothschild Refining the field. 1 v Theoretical developments e.g. sticking to the management (1979a), Rothschild (1979b), Further research on 9 e occurred in related knitting. approaches relevant to Peters Waterman (1982), strategy process. 8 I disciplines. (Economies of Still a focus on more rapid change e.g. Prahalad & Bettis (1986), Crosby More global
0 0 scope) critical mass but Chaos theory (1979), Buzzell & Gale (1987), research. alternatives to scale principles. Pearce (1983), Galbraith & Focus on s p economies e.g. Schendel (1983), Campbell & differentiation.
m scope. Yeung (1990), Ohmae (1985), e Strategies for Bartlett & Ghoshal (1986), n competitiveness and Bartlett & Ghoshal (1989),
t renewal (low growth Kormani (1984), White (1986), but sustainability). Prahalad & Hamel (1985), Levitt
(1983), Mintzberg (1983), Goold & Campbell (1987)
New priorities : Core Analysing Founded on value Refinement of 1980's Kay (1993), Ghemawat (1991 ), Competing on own
M -deregulation competencies I I nternationalisation, creation, concepts with further Hamel et al (1989), Hamel & capabilities
1 a - new information Holistic and dynamism and sustainability, attention to cognitive Heene (1994), Hamel & Horizontal co-
9 t - manufacturing I information volatility of the outsourcing and dimensions. Prahalad (1989), Hamel & ordination f activities industrial technology approaches environment. focus on distinctive Prahalad (1991 ), Hay & Vertical control
9 u - globalisation of capabilities. Williamson (1991), Hay et al Supplier and allies 0 r competition (1993), Lewis (1990), Lorange synergy s i - unprecedented level of (Economies of (1992), Prahalad & Hamel
t dynamism and volatility expertise) (1990), Stalk et al (1992),
y throughout international Williamson & Verdin (1992), economy Campbell et al (1995).
Source: D.A.Edgar, Literature Revtew
Page 12

The shifts in strategic management focus therefore appear to have evolved from :
• changes in the operating environment of firms
• shifts in the economy base from manufacturing to service
economies
• flattening organisation structures
• shifts towards responsibility and entrepreneurship
Environments of the 1990's are widely regarded as more turbulent, unpredictable and
dynamic than previous decades (Ansoff 1991, 1994, Jain 1993, Feltenstein 1992,
Cummings 1993). As such, different environmental challenges will require different
strategic responses and, as a consequence, different planning approaches. Strategic
planning therefore requires greater flexibility than previously envisaged. Making
strategic planning flexible has been a central theme in the transmutation of strategic
planning into its present variety, forming a platform for current debate e.g. Mintzberg
(1994) argues that flexible strategic planning is an oxymoron, whilst Ansoffviews it
as essential to future development.
While Gluck et al (1980) and Philips (1994) identified four phases to evolution, it may
be more useful to consider the evolution of strategic thinking as a shift in research
emphasis. Such an approach is suggested in figure 1.2.1 d. This shows the shift in
emphasis of research in the strategy field based upon the commonly accepted
interrelated and interacting components of strategic planning- strategic analysis,
choice/decision making, and implementation (Morden 1993), and changes in research
themes as identified in figure 1.2.1 c.
In parallel with earlier stages of strategic management evolution, the research focus
was essentially quantitative in nature with particular application to the strategic
decision making element of the process and reflecting a focus on budgeting and
planning. The research focus shifts in line with the general evolution of strategic
thinking to be more environmentally aware and as such provides greater focus on
strategic analysis. In phase 3, the cognitive elements of strategy come to the fore,
Page 13

essentially representing research into the strategy implementation process while the
current stage of thinking represents a more holistic approach to understanding and
research in strategic thinking.
The overall result has been a shift from product oriented approaches to a more holistic
understanding of the nature of strategic management research (see figure 1.2.1d),
perhaps representing a shift from manufacturing bases to service oriented
organisations.
Figure 1.2.1 d : An Evolution Of Strategic Management By Shifting Research Emphasis
.................. ~(E~v·o~lu~t~io·n~) ........................ ~ Phase 1
Strategic Analysis
Strategic Choice & Decision Making
Strategic Implementation
Quantitative Methods and
Applied technology
Phase 2
Strategic Analysis
Strategic Choice & Decision Making
Strategic Implementation
RESEARCH FOCUS Environmental
Issues and Scanning Units
Phase 3
Strategic Analysis
Strategic Choice & Decision Making
Strategic Implementation
Organisation Dynamics and
Cognitive Dimensions
Phase 4
Holistic Approach
Concepts of: Core Competence Resource Based Values Parenting
Source: Edgar, D.A; Taylor, S (1996) "Hospitality strategic research: From slipstream to mainstream", CHME Research Conference, Nottingham Trent University, Nottingham, April
While recognising that the issues identified are not exclusive, the figure illustrates
how the emphasis of research has shifted over time and therefore highlights
developments in the field : it reinforces the shift away from strategy and strategic
planning frameworks, which have proven inappropriate or impractical (Campbell,
Goold & Alexander 1995, Fahey & King 1977, Stub bart 1982, Mintz berg 1994 ), to
approaches based on the organisation's core competence i.e. resource based
capabilities (Hamel & Prahalad 1990) and organisation purpose. Indeed, Bartlett and
Ghoshal (1994) assert that ''purpose- not strategy- is the reason an organisation
exists. It's definition and articulation must be top management's first responsibility".
Page 14
In line with such shifts of emphasis, the research approaches have softened to be more
qualitative in nature focusing more on such elements as cognitive issues (Dutton,
Fahey, Narayanan 1983, Huff 1990, Mason & Mitroff 1981, Porac & Thomas 1990)
away from an interest in strategy content (Hambrick 1983a, Jauch, Osborn & Glueck
1980, Miller & Friesen 1983), strategy process and environment (Mintzberg 1973,
Miller & Friesen 1978, 1984, Grinyer, Al-Bazzaz & Ardekani 1980), or even broad
dimensions of strategy (Miller 1986, Hambrick 1983b, Dess & Davis 1984).
These shifts in emphasis and approach have resulted in greater interest in research
focusing on the internal cognitive issues of organisations such as concepts of
organisation vision (Larwood et al 1995) and comparisons of international and inter
cultural dimensions of strategy (Houlden 1995, Earley & Singh 1995), the former
emphasising :
" ... while there are some detailed cultural differences in the way that strategies are
developed in different countries, strategic planning is at a similar stage of
development in most industrialised countries" (Houlden 1995).
As such, the evolution of strategic management will influence and be influenced by
the context of the research and the paradigms of strategic management. The
implication of such developments are that developments in strategic management
research and application of strategic management principles will vary by context,
purpose and orientation. Hence, when applying strategic management research to the
hospitality industry and markets it is necessary to determine the evident paradigms of
strategic thought to allow a more holistic understanding of strategic contributions to
the hospitality industry, and identification of most appropriate paradigms relative to
the research approach.
Page 15

1.2.2 Paradigms Of Strategic Management Research
Paradigms of strategic management research reflect the stages of evolution and a shift
from quantitative/objective to qualitative/subjective perspectives of organisational
development. The implications of such developments are that the exploration of topics
per se are not adequate enough to advance knowledge in a "contextual field such as
hospitality" and that an awareness of the underlying paradigms is of considerably
more value.
Joyce and Woods ( 1996) express the paradigms of strategic management research as
shifting from modernist to new modernist schools. This shift is shown in figure
1.2.2a.
Figure 1.2.2a : Paradigms of Strategic Management Research
DIMENSIONS II MODERNIST POSTMODERNIST NEW MODERNIST
Top management role Decision-making elite Back successful initiatives Responsible for by lower levels of intellectual leadership managers
Successful change Programmable Discoverable Based on foresight and experiment
Expectations about those To be committed to To show diversity, To have their own at lower levels proposals and to difference and agendas, but agendas that
implement strategic spontaneity/empowerment can be included in overall plan strategy
Attitude to planning Planning is core activity Proactive planning is Planning is emergent impossible
Attitude to chance events Need to plan for Require chaotic action in Chance events can be flexibility response opportunities
Organisational Operational Anti-hierarchy, culture Organisational readiness, requirements management to be support for informality commitment and
shaped by strategy competence, which have to be developed
Source: Joyce, P; Woods, A (1996) "Essential strategic management: From modernism to pragmatism", Butterworth Heinemann, Oxford.
As the paradigm shifts, the school of thought reflects the need for greater flexibility,
attention to cognitive dynamics and a need to develop sustainability in strategy
development. Such developments are not universal in nature and different researchers
with different contexts are represented at different stages of the paradigms. The result
is a range of paradigms in existence with varying participation from researchers
depending upon the context of their study.
Page 16
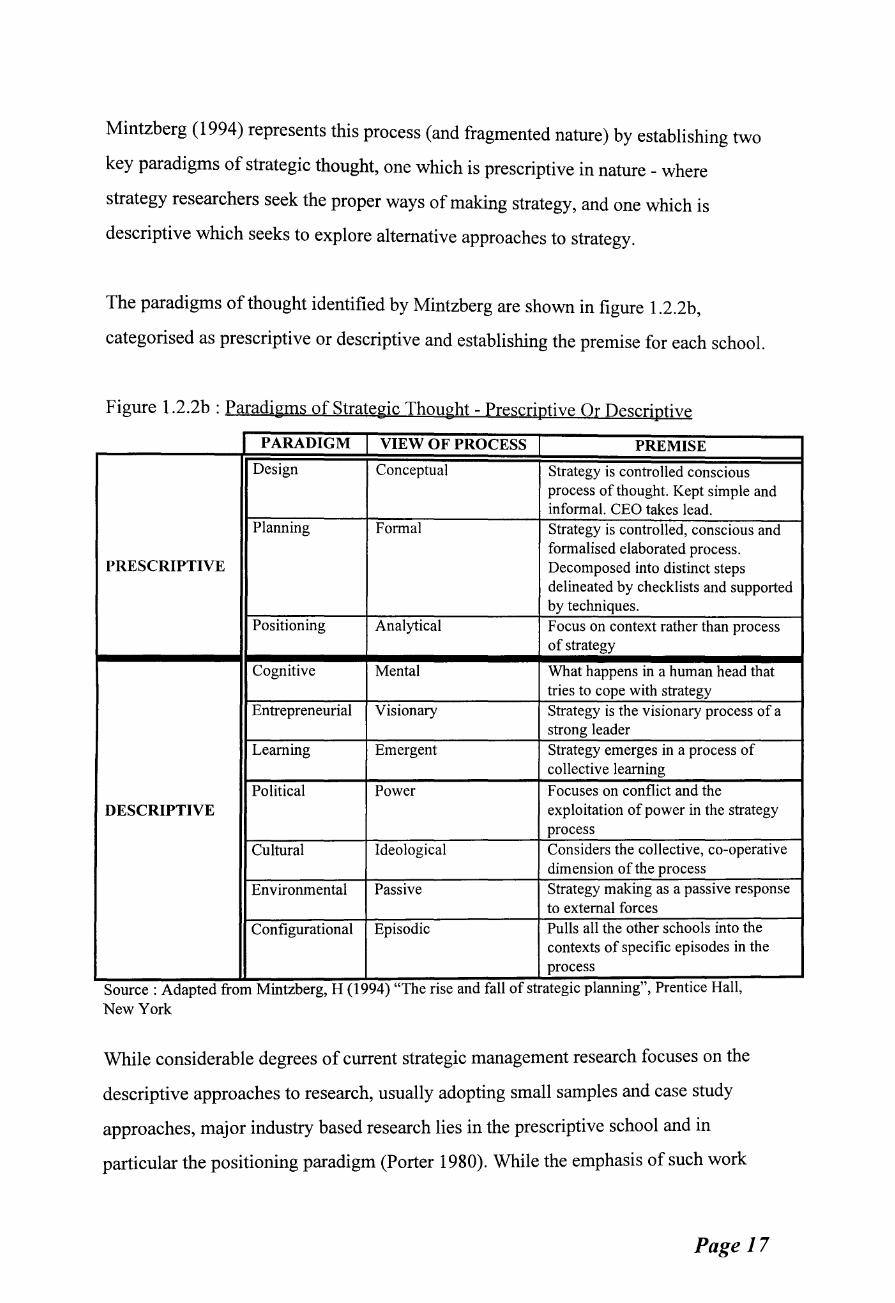
Mintz berg ( 1994) represents this process (and fragmented nature) by establishing two
key paradigms of strategic thought, one which is prescriptive in nature - where
strategy researchers seek the proper ways of making strategy, and one which is
descriptive which seeks to explore alternative approaches to strategy.
The paradigms of thought identified by Mintzberg are shown in figure 1.2.2b,
categorised as prescriptive or descriptive and establishing the premise for each school.
Figure 1.2.2b : Paradigms of Strategic Thought - Prescriptive Or Descriptive
PARADIGM VIEW OF PROCESS PREMISE
Design Conceptual Strategy is controlled conscious process ofthought. Kept simple and informal. CEO takes lead.
Planning Formal Strategy is controlled, conscious and formalised elaborated process.
PRESCRIPTIVE Decomposed into distinct steps delineated by checklists and supported by techniques.
Positioning Analytical Focus on context rather than process of strategy
Cognitive Mental What happens in a human head that tries to cope with strategy
Entrepreneurial Visionary Strategy is the visionary process of a strong leader
Learning Emergent Strategy emerges in a process of collective learning
Political Power Focuses on conflict and the DESCRIPTIVE exploitation of power in the strategy
process Cultural Ideological Considers the collective, co-operative
dimension of the process Environmental Passive Strategy making as a passive response
to external forces
Configurational Episodic Pulls all the other schools into the contexts of specific episodes in the process
" Source: Adapted from Mmtzberg, H (1994) "The nse and fall of strategic plannmg , Prentice Hall, New York
While considerable degrees of current strategic management research focuses on the
descriptive approaches to research, usually adopting small samples and case study
approaches, major industry based research lies in the prescriptive school and in
particular the positioning paradigm (Porter 1980). While the emphasis of such work
Page 17
may be positioning school based, many writers delve into the other paradigms to
allow greater understanding of concepts and issues. This raises a case for developing
general frameworks of analysis founded on one school e.g. positioning through
structure-conduct-performance and testing such frameworks from adapting principles
from another school, perhaps core-competence issues e.g. building theory from a
prescriptive manner and developing and refining the theory in a descriptive manner.
This research attempts to do this through developing an industry based theory at
company level and testing and developing the theory from the unit perspective. As
such, a multi-paradigm approach to the research process is adopted. The research
identifies a need to adopt such mixed approaches to allow analysis of the dynamics of
the industry founded on a "positioning" platform within an industry context.
While this section has explored the generic strategic management research to date, the
next section provides an analysis of the nature of strategic management research in the
hospitality industry context and determines the stage of evolution of strategic
management in this context. The boundaries of the research are established and areas
of potential contribution to mainstream and hospitality context fields are established.
1.2.3 Strategic Management Research In Hospitality
The nature of hospitality strategic management can be seen to be under-researched,
and under-theorised, while delineation of research and developments in strategic
management are relatively clear. The explanation for this may, in part, lie in the
recency of strategic management focus in the hospitality field (Wren 1987), resulting
in research lagging behind the mainstream field by some two generations (Edgar &
Taylor 1996). Some researchers into hospitality strategic management have therefore
called for a more mainstream approach (Taylor & Edgar 1995) by suggesting that
research be pursued from a more interdisciplinary basis than hitherto and that a
broader range of methodological approaches be adopted. Identifying the need to build
and borrow theory to allow research into hospitality operations is critical.
Page 18
To resolve such problems some writers have articulated a case for a contextual
approach to the study ofhospitality management (Dann 1991, Wood 1983). While
such a contextual approach is an advance it is not a solution. The fact remains that the
field must be developed and matured. This can only be achieved through theorising at
industry level and testing and refining such theory. As such, researchers in the
hospitality field have been overly concerned with contextualising concepts and not
advancing the mainstream thinking of the core discipline - strategic management. This
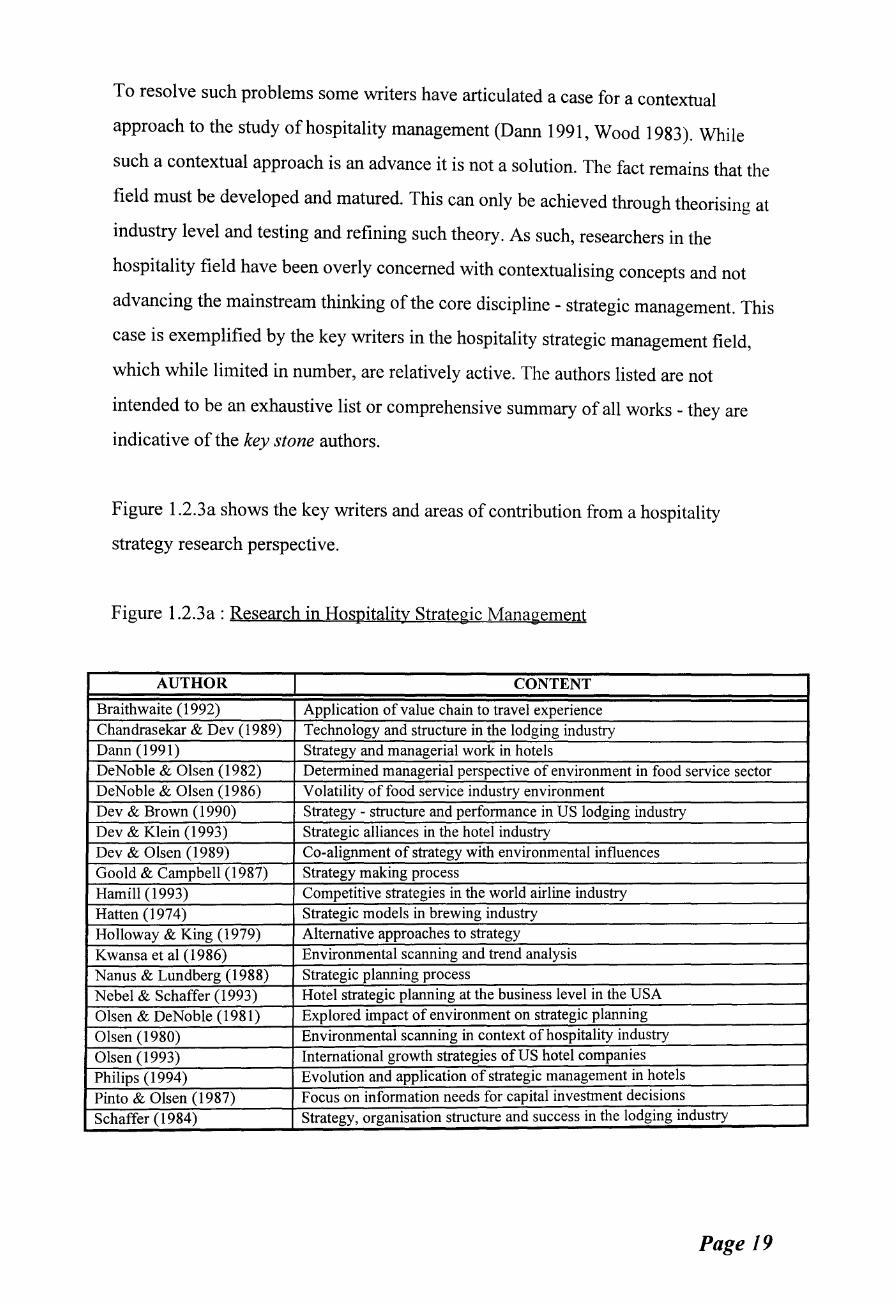
case is exemplified by the key writers in the hospitality strategic management field,
which while limited in number, are relatively active. The authors listed are not
intended to be an exhaustive list or comprehensive summary of all works - they are
indicative of the key stone authors.
Figure 1.2.3a shows the key writers and areas of contribution from a hospitality
strategy research perspective.
Figure 1.2.3a : Research in Hospitality Strategic Management
AUTHOR CONTENT Braithwaite (1992) Application of value chain to travel experience Chandrasekar & Dev (1989) Technology and structure in the lodging industry Dann (1991) Strategy and managerial work in hotels DeNoble & Olsen (1982) Determined managerial perspective of environment in food service sector DeNoble & Olsen (1986) Volatility of food service industry environment Dev & Brown (1990) Strategy - structure and performance in US lodging industry Dev & Klein (1993) Strategic alliances in the hotel industry Dev & Olsen (1989) Co-alignment of strategy with environmental influences Goold & Campbell (1987) Strategy making process Hamill (1993) Competitive strategies in the world airline industry Hatten (197 4) Strategic models in brewing industry Holloway & King (1979) Alternative approaches to strategy
Kwansa et al (1986) Environmental scanning and trend analysis Nanus & Lundberg (1988) Strategic planning process Nebel & Schaffer (1993) Hotel strategic planning at the business level in the USA
Olsen & DeNoble (1981) Explored impact of environment on strategic planning
Olsen (1980) Environmental scanning in context ofhospitality industry
Olsen (1993) International growth strategies of US hotel companies
Philips ( 1994) Evolution and application of strategic management in hotels
Pinto & Olsen (1987) Focus on information needs for capital investment decisions
Schaffer (1984) Strategy, organisation structure and success in the lodging industry
Page 19
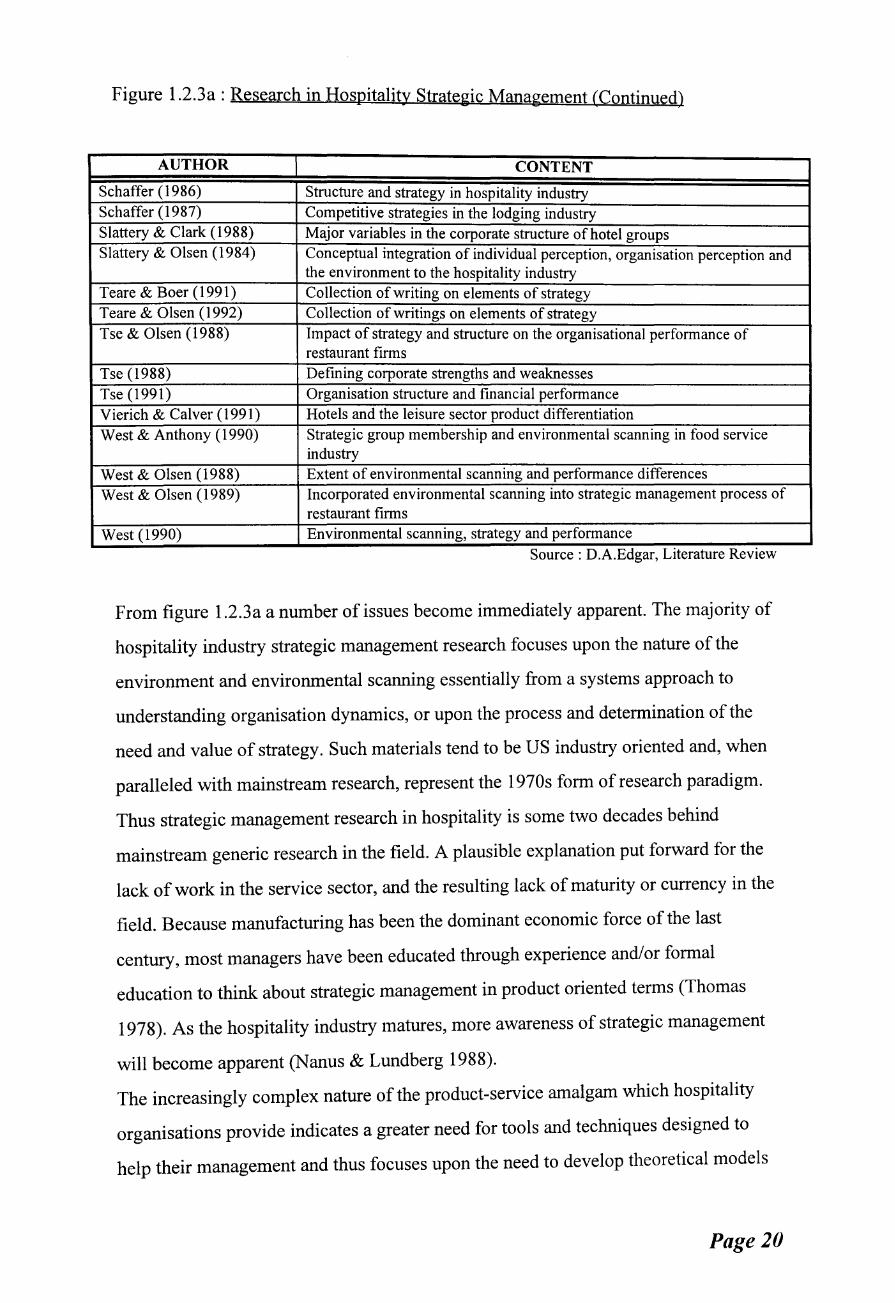
Figure 1.2.3a: Research in Hospitality Strategic Management (Continued)
AUTHOR CONTENT Schaffer ( 1986) Structure and strategy in hospitality industry Schaffer (1987) Competitive strategies in the lodging industry Slattery & Clark (1988) Major variables in the corporate structure of hotel groups Slattery & Olsen (1984) Conceptual integration of individual perception, organisation perception and
the environment to the hospitality industry Teare & Boer (1991) Collection of writing on elements of strategy Teare & Olsen (1992) Collection of writings on elements of strategy Tse & Olsen (1988) Impact of strategy and structure on the organisational performance of
restaurant firms Tse (1988) Defming corporate strengths and weaknesses Tse (1991) Organisation structure and financial performance Vierich & Calver (1991) Hotels and the leisure sector product differentiation West & Anthony (1990) Strategic group membership and environmental scanning in food service
industry West & Olsen (1988) Extent of environmental scanning and performance differences West & Olsen (1989) Incorporated environmental scanning into strategic management process of
restaurant firms West (1990) Environmental scanning, strategy and performance
Source: D.A.Edgar, Literature Review
From figure 1.2.3a a number of issues become immediately apparent. The majority of
hospitality industry strategic management research focuses upon the nature of the
environment and environmental scanning essentially from a systems approach to
understanding organisation dynamics, or upon the process and determination of the
need and value of strategy. Such materials tend to be US industry oriented and, when
paralleled with mainstream research, represent the 1970s form of research paradigm.
Thus strategic management research in hospitality is some two decades behind
mainstream generic research in the field. A plausible explanation put forward for the
lack of work in the service sector, and the resulting lack of maturity or currency in the
field. Because manufacturing has been the dominant economic force of the last
century, most managers have been educated through experience and/or formal
education to think about strategic management in product oriented terms (Thomas
1978). As the hospitality industry matures, more awareness of strategic management
will become apparent (Nanus & Lundberg 1988).
The increasingly complex nature of the product-service amalgam which hospitality
organisations provide indicates a greater need for tools and techniques designed to
help their management and thus focuses upon the need to develop theoretical models
Page 20

of market and organisation developments. Therefore for firms in the maturing
hospitality industry to survive and grow, they will have to depend upon their ability to
strategically align themselves with the dynamics of the industry and select appropriate
strategies to create defensible competitive positions. Thus it is necessary to develop
strategic approaches and strategic management research into developing markets and
industries.
From this perspective the positioning school of strategy provides major opportunities
to develop and theories an under-theorised hospitality field. Following the
development of theory from a positioning perspective allows a unit analysis to test
and develop theory from a competence dimension.
This conclusion assumes that the greater the level of understanding of hospitality
strategic management the greater will be the potential for contributions to both a
mainstream understanding of strategy and the position of hospitality strategic
management within the discipline. Framing hospitality strategic management research
within a contextual setting therefore facilitates an approach to the research that
attempts to bridge the philosophies of positioning and core competencies through
multiple methods and industry context as a tool, thus building a theory of dynamic
market analysis.
The development of such an approach implies a framework for the research based on
the foundations of the positioning school or the industrial economics paradigm. The
implications and issues associated with such an approach will be addressed later (see
chapter 11).
The next section considers the industry context of hospitality and consequent
implications on developments on hospitality research in general and the specific
research of this work.
Page 21
1.3 THE INDUSTRY CONTEXT
The competitive environment of the tourism industry is widely recognised as being
complex, dynamic and highly segmented (Daft 1989). Growth and competition in the
industry imply that market share is no longer assured. This results in suppliers
competing directly with one another in the same locations in an industry that has often
relied upon location as a core source of competitive advantage (Dev 1990).
As hospitality and tourism suppliers are dependant upon their environments for
resources (Aldrich 1979, Pfeffer & Salancik 1978) they often attempt to manage their
inter-dependency to gain and maintain market share, by developing and maintaining
appropriate strategies (Thompson 1967, Hoffer & Schendel 1978). Suppliers therefore
often use product differentiation marketing together with strategies that target growth
in new markets, high value for money, or develop new brands (Olsen 1993).
Implications flowing from such market approaches on hotels are considerable.
From the supply perspective key issues of globalisation, oversupply (Kelly 1994,
Hennessey 1992, Salomon 1992), rationalisation (Scarpa 1993), plummeting property
prices (Rushmore 1994), recession (Garter 1991, Arbel & Woods 1991) and the need
for greater flexibility and cost awareness have resulted in a highly dynamic and
competitive market. This, combined with an emphasis on suppliers adopting and
implementing strategies and techniques that optimise their specific situation (Cravens
& Shipp 1991) either through demand strategies i.e. product development and
extending product life cycles (Brown 1990, Davis 1989) or through supply strategies
i.e. a better understanding of return on investment philosophies (Feiretag 1992, Rock
1992) the importance of marginal and contribution pricing, ( Arenberg 1991) has
resulted in distinct structural changes. Such changes include a more widespread use of
alternative ownership patterns including franchising (Lyons 1991, Seid 1992) and
management contracting (Eyster 1993), highly segmented markets, elements of
protectionism, and a wide range of strategies for various markets, culminating in a
highly complex supplier environment.
From the demand perspective, social and demographic changes combined with greater
exposure to markets and the likelihood of more experienced consumers influences the
demand for hospitality and tourism services in the UK (Stone 1990, Teare 1989),
making consumers more aware; discerning; and demanding. The manager must
therefore capitalise upon the differences in the customer population by using a
segmentation and targeting system (Crawford-Welch 1990) to identify unique
Page 22
customer segments (Lyons 1993) within the capabilities of the organisation (Berry et
al 1991, Lancaster & Ratchford 1990). This results in a wide range of niche segments
targeted by a range of suppliers, causing a hospitality and tourism industry that is
highly segmented, highly fragmented, dynamic and complex.
While the issues highlighted in this section are examined in detail and further focused
in terms of the UK short break market in later sections, the general implications upon
the research and the context within which the research is placed implies a need for a
degree of flexibility and multi or inter-disciplinarity (Taylor & Edgar 1995). As such,
an evolving and inter-related approach to the research is required. The next section
extends this theme to determine the research approach adopted.
1.4 RESEARCH APPROACH
This research deals with the strategic behaviour of hotels : in particular behaviour in
relation to a development of one hotel market segment - Commercial Short Holiday
Breaks. It explores corporate activity, and the relationship between the decision
making centre of hotel organisations, the effectiveness of strategic decisions and the
geographically dispersed nature of its hotel units. The research approach is determined
at two levels. Firstly the overall research approach, secondly the discipline specific
research approach.
1.4.1 General Research Approach
Blaxter et al (1996) identifies common viewpoints on the nature of research. They
postulate that research is either :
• presented as a fixed, linear series of stages, with a clear start and end,
typified by what may be termed traditional scientific research;
• a more complicated presentation of a linear view, allowing for slightly
different routes to be taken through the process at particular stages;
• or a cyclical process, analogous to the more general process of learning.
Page 23
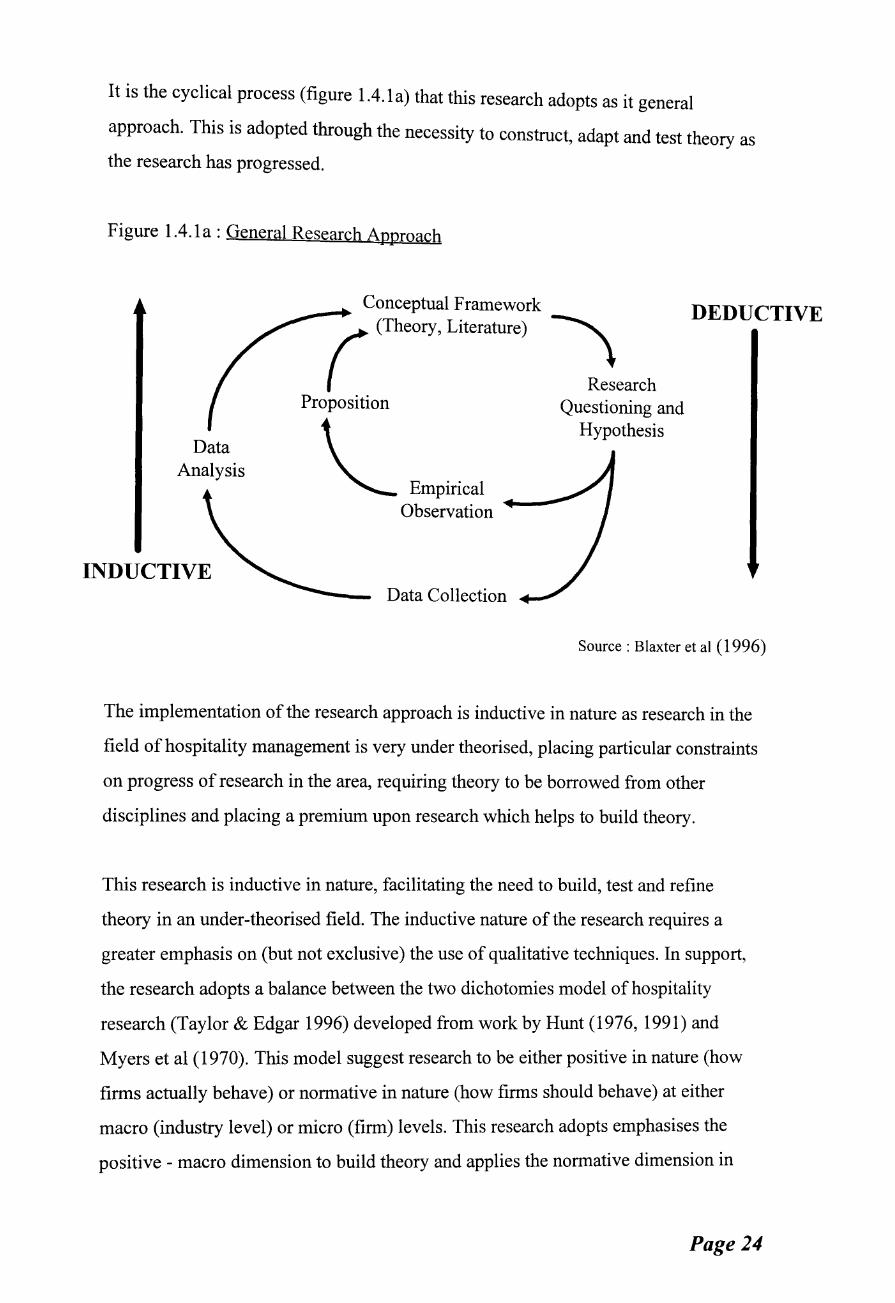
It is the cyclical process (figure 1.4.1a) that this research adopts as it general
approach. This is adopted through the necessity to construct, adapt and test theory as
the research has progressed.
Figure 1.4.1a: General Research Approach
Data Analysis
INDUCTIVE
Conceptual Framework
(
(Theory, Literature) \
Research Proposition Questioning and
\ Hypothesis
"'-- Empirical Observation
Data Collection
DEDUCTIVE
Source : Blaxter et al ( 1996)
The implementation of the research approach is inductive in nature as research in the
field of hospitality management is very under theorised, placing particular constraints
on progress of research in the area, requiring theory to be borrowed from other
disciplines and placing a premium upon research which helps to build theory.
This research is inductive in nature, facilitating the need to build, test and refine
theory in an under-theorised field. The inductive nature of the research requires a
greater emphasis on (but not exclusive) the use of qualitative techniques. In support,
the research adopts a balance between the two dichotomies model of hospitality
research (Taylor & Edgar 1996) developed from work by Hunt (1976, 1991) and
Myers et al (1970). This model suggest research to be either positive in nature (how
firms actually behave) or normative in nature (how firms should behave) at either
macro (industry level) or micro (firm) levels. This research adopts emphasises the
positive - macro dimension to build theory and applies the normative dimension in
Page 24

drawing conclusions as to strategic direction of hotel companies. Finally, to test
theory, a micro dimension is adopted applying the theory that has been constructed.
This research therefore provides an analysis at all levels by exploring how firms
behave at the industry level and constructing a theory of how firms should behave at
industry level before testing this theory at firm level.
In fully appreciating the research approach it is useful to refer to work by Bilton et al
(1986) who identifies four aspects of investigation and understanding.
Ontology (concern with being) and epistemology (concerned with knowing) are
determined as "reality" being constituted of phenomena which can be causally linked
and provide a degree of meaningful association. While empirical evidence is sought
and the elements of the resulting phenomena are observable, the qualitative nature of
the inductive approach implies that the empirical results (in essence deductive) may
be difficult to observe and certainly the research process and results will not be
exactly replicable.
The methodology adopted can be viewed on three levels. (i) The logic of discovery -
discovery is through observational constructs that allow construction of a hypothesis
about causal relationships between variables. This hypothesis emerges in latter
sections of the research, representing the evolving nature of the research design. (ii)
The logic of validation - the research seeks to understand the dynamics of competition
within the market through using quantitative and qualitative evidence and techniques,
followed by constructing a hypothesis and then testing the hypothesis at unit level.
(iii) Logic of explanation - causal relations are established and explained in attempts
at forming meaningful intelligible descriptions of how organisations interact with
their competitive environment and markets.
Methods. The methods adopted reflect the balance of qualitative and quantitative
techniques and the need to use multiple sources of data (Todd 1979). Semi-structured
telephone and personal interviews are used, constructing empirically based databases
Page 25
and constructing a theoretical framework to allow understanding of strategic and
market dynamics. Methods are discussed in more detail in section 1.6.
While this section has explored the general philosophy behind the research approach,
the next section focuses upon specific research approaches employed in hospitality
research.
1.4.2 Hospitality Research Approach
Van Doren et al ( 1994) in exploring the maturity and nature of tourism research
established that "despite the global volume and economic aspects of tourism, the
research literature relating to this field of study presents a relatively brief and
disjointed history. Before the 1970s, there was little cohesive presentation of tourism
research". These researchers identify that in recent years there has been considerable
debate as to the maturity of tourism as an academic discipline. A focal point of such
discussion concerns the extent and development of tourism research literature.
Sheldon ( 1991) refers to tourism as a maturing field of study and cites research as
important for extending knowledge of the tourism phenomena, and by contributing to
the field academic stature - an important consideration for a maturing field.
Hospitality management research on the other hand despite considerable progress
having made in recent years, in terms of both quantity and quality of research, the
field has yet to reach a state of maturity (Taylor & Edgar 1996) yet this is still an area
of contention (Litteljohn 1990). As a result, sources of hospitality research are varied
and of differing standards with a clear need for developing industry relevant
approaches and construction of theoretical models borrowed and adopted from other
disciplines. The stance generally adopted is that hospitality research is essentially the
scholarship of integration (Shaw & Nightingale 1995). This reflects its
interdisciplinary or multidiscipinary base and the scholarship of application or, as
reflected in much current hospitality research, what might be described as the
scholarship of contextualisation or "the hospitality paradigm" (Jones 1996).
Page 26
The previous section established that as hospitality organisations become more
exposed to environmental change - specifically intensifying international competition,
rapid technological changes, globalization, and shorter product life cycles- they are
forced to adapt and respond (Thompson 1967) through the formulation and
implementation of strategies.
It has been suggested that such adaptation often requires a focus on environmental
scanning (Olsen 1980, O'Connell & Zimmerman 1979, Dev & Olsen 1989, West &
Olsen 1989); organisation flexibility; market dynamics (Peters 1987); coping with
demand/supply disequilibrium (Bhide 1986) e.g. seasonality. These types of forces,
combined with the effects of a more concentrated industry structure ensure that
organisations face more complex, dynamic and competitive environments (Slattery &
Olsen 1984, Terpstra 1985). The result is a need for high quality information to allow
decision-making, as opposed to a reliance on a traditional business rationale
(Buchholz 1982). To allow this, a flexible approach to research must be adopted,
which highlights the relevance of theory and illustrates its value through application
to industry (Slattery 1983, Reuland et al1985). These requirements mean that
researching in hospitality may require the application of methodologies not yet used
in hospitality and, more radically, the development of new ones.
In seeking such an approach it is useful to refer to the work ofLitteljohn (1990).
Litteljohn identifies three paradigms for hospitality research: the natural and
physical sciences approach - researching tangible elements of hospitality utilising a
specific established discipline base (e.g. production elements, design). The other two
approaches deal more with developing industry relevant approaches from social
science traditions of management theory. The hospitality management approach
which builds on conditions which define hospitality situations encouraging an
interdisciplinary approach yet focusing on the characteristics of hospitality provision;
a particular problem is identified and analysed within a particular industry setting. The
emphasis is on the operation and as necessary environmental influences.
The hospitality studies approach shares the intention of the second but is less
prescriptive - it emphasises a need for evaluation within an industrial setting founded
Page 27
on relevance to industry in light of changing environments, and by utilising a range of
sociological disciplines as and when appropriate, it draws on social sciences for
methodologies to reflect the nature of the problem of the investigation.
The approach adopted in this research project is the hospitality studies approach.
This allows a strategic level analysis of the industry through exploration of corporate
activity in relation to performance, marketing, and environmental fit (Slattery 1983,
Nailon 1982).
This research however extends the approach to reflect a shift from the traditional
evolutionary and historic base, often associated with industrial organisation type
research (Jacobson 1992) to a more dynamic industry and environment related
approach. This is achieved by applying Austrian economic principles of process as
opposed to static interaction, combined with Industrial Economics essentially through
introducing a multi-site market perspective to the research. The approach recognises the
disequilibrium in market conditions, heterogeneity in profitability and performance, and
acknowledges the existence of "unobservable success factors" such as invisible assets
(Itami & Roehl 1987) which are likely to have a lasting impact on performance (Winter
1987, Reed & DeFillippi 1990) but are difficult if not impossible to analyse.
As demand and the evolutionary aspects of the market are deemed to be of
background importance, the research provides an overview of each in the introductory
chapters before undertaking the supply side analysis comprising industrial economics,
market segmentation theory, and multi-site/corporate dimensions.
It is the author's view that such an approach to theory building, and the resulting
findings and model testing contribute significantly to the advancement of knowledge
in the field of hospitality and strategic management research, and expose areas for
further research. In addition, the research will contribute to a much discussed but little
researched area of hospitality- the dynamics between resource allocators (the centre)
and hotel units, in this case within a marketing, planning and financial performance
setting.
Page 28

1.5 RESEARCH AIMS AND OBJECTIVES
A review of available literature and analysis of market structure revealed that despite
the considerable value of the short break market to Scotland and the UK. Little was
known of the nature of short break provision and nothing known of the nature of
corporate activity or related performance in the market.
Therefore, the aims of the research are to :
analyse the nature and methods of provision of Commercial Short Holiday Breaks (CSHBs) in Scotland, with particular emphasis on the strategic dimensions of corporate ventures and resulting performance, and to provide a model for enhancing performance at corporate and unit level.
To achieve the aims the research encompasses the following objectives. To:
(i) determine the underlying nature of the tourism industry in the UK and
Scotland;
(ii) determine the general underlying structure of the hotel industry in
Scotland, relative to the cost structure of hotels and market
segmentation;
(iii) establish the nature of growth and value of CSHBs;
(iv) provide a demand profile of short break takers;
(v) identify and analyse the competitive strategies employed by CSHB
suppliers using an Industrial Economics framework (F .M Scherer 1980);
(vi) assess major strategies with regard to providing and distributing CSHBs
in segmented markets;
(vii) evaluate the linkages occurring between CSHB strategies adopted and
performance, exposing areas of competitive advantage and suggesting a
model for enhancing performance at corporate (industry) and unit
(market) levels.
While these are the aims and objectives of the research, the next section determines
how these will be achieved by providing an outline of the methods adopted.
Page 29
1.6 METHODS ADOPTED
This section provides an overview of the research methods used, providing a
definition of commercial short holiday breaks, and a summary of each method used.
Details of implementing the methods are found in Chapter 6.
The main approach used combines principles of Industrial Economics with writings
on strategic management, in particular, concepts of strategic groups, to identify
potential areas of enhanced performance and to allow further analysis of such areas.
Adopting an Industrial Economics approach necessitates an understanding of the
CSHB market structure, dynamics of strategies adopted and identification of resulting
performance. The methodology therefore provides an integrative and multi
disciplinary framework applied to the CSHB market in Scotland.
As the research concentrates on commercial centred activities, and for reasons
established in Chapter 5, Commercial Short Holiday Breaks (CSHB) are defined as:
Hotel packages of one to three nights which for a single price together with
accommodation include one or more of the following : meals; transport;
entertainment; or a programme of activities.
This definition allows use of secondary sources (UKTS 1991) for Scottish market
background, and primary sources for more detail of supplier provision. As hotels
account for 78% of all spend in the CSHB market in Scotland (UKTS 1991)
compared to other forms of accommodation, and as the definition is compatible with
that of the E.C. Package Travel Directive (1992) definition, it is suitable for the
purposes of the research.
The initial research is based on an analysis of the structure of the industry and
development of the market through an appraisal of market segmentation theory and
current supplier strategies. Figure 1.6a shows the development of methods used.
Page 30
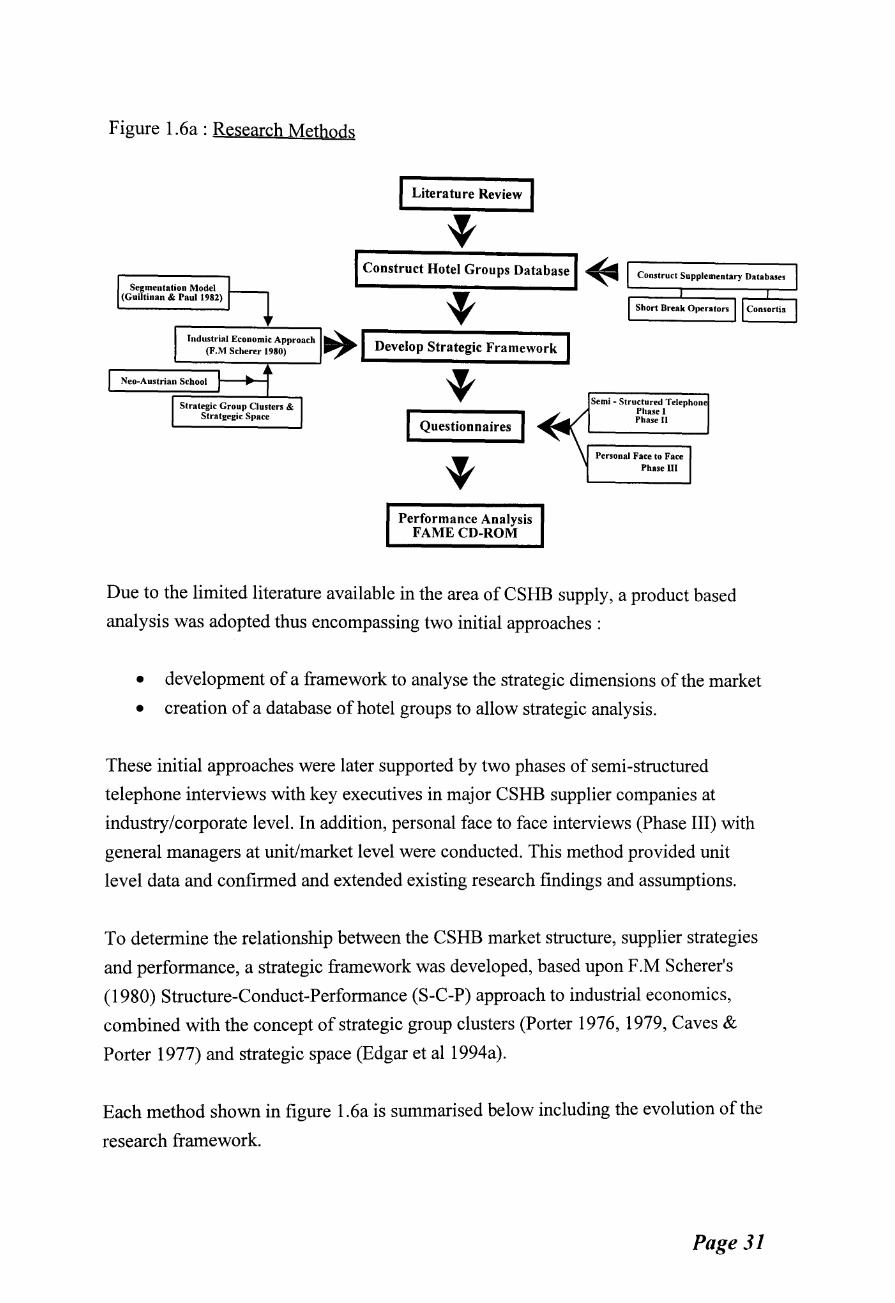
Figure 1.6a : Research Methods
Segmentation Model (Guiltinan & Paull982)
Literature Review
Develop Strategic Framework
Questionnaires
Performance Analysis FAME CD-ROM
Semi- Structured Telephon Phase I Phase II
Personal Face to Face Phase UI
Due to the limited literature available in the area of CSHB supply, a product based
analysis was adopted thus encompassing two initial approaches :
• development of a framework to analyse the strategic dimensions of the market
• creation of a database of hotel groups to allow strategic analysis.
These initial approaches were later supported by two phases of semi-structured
telephone interviews with key executives in major CSHB supplier companies at
industry/corporate level. In addition, personal face to face interviews (Phase Ill) with
general managers at unit/market level were conducted. This method provided unit
level data and confirmed and extended existing research findings and assumptions.
To determine the relationship between the CSHB market structure, supplier strategies
and performance, a strategic framework was developed, based upon F .M Scherer's
(1980) Structure-Conduct-Performance (S-C-P) approach to industrial economics,
combined with the concept of strategic group clusters (Porter 197 6, 1979, Caves &
Porter 1977) and strategic space (Edgar et al 1994a).
Each method shown in figure 1.6a is summarised below including the evolution of the
research framework.
Page 31

1.6.1 Information Sources and Frameworks
(i) Literature Review
The review of literature on CSHB revealed little systematic study on the subject. Most
coverage was in the form of newspaper and trade press articles, conference papers,
government publications, and industrial research documents. Therefore, to provide
information, a database was constructed from primary data drawn from company
literature, group brochures and company accounts. To simplify the complex nature of
the research, a general literature review of strategic management literature was
provided at the start of the thesis with relevant literature being determined at the
commencement of each specific section.
(ii) Hotel Groups Database
A computerised database was constructed containing the 3 0 largest hotel groups in
Scotland determined by room capacity (1991), geographical, price, size and grading
variables. This allowed estimates of CSHB value in financial terms to be established
across a range of variables.
Scotland was divided into seven regions for CSHB analysis. Boundaries were
determined by Area Tourist Board (ATB) coverage. The division enabled location
differences in CSHB provision throughout Scotland to be explored more fully by
accommodating differing demand patterns, (i.e. seasonality) supplier environments
(i.e. Industry structure), and allowing cross comparisons to be made of companies,
regions, and CSHB market segments.
(iii) Supplementary Databases
The initial database was later supported by two other databases.
• Short Break Operators (SBOs) database, containing financial and
portfolio information on specialist SBO companies e.g. Rainbow,
analysed by the seven regions of Scotland.
• Consortia database, providing data specifically related to CSHB
accommodation offered by consortia e.g. Best Western, in the UK and
Scotland.
The primary purpose of these databases was to allow cross-referencing where
required, and provide a competitive dimension to supplier analysis.
Page32
In addition, continual environmental scanning (Wet & Olsen 1989) took place to track
company/environmental changes, recognising the dynamic nature of environments.
(iv) The Research Framework
The research framework implemented represents an evolutionary development of the
research process.
Having established the highly segmented nature of the tourism, hotel, and CSHB
markets, the research programme sought to establish a suitable research framework
that would accommodate the segmented nature of demand while providing a supply
perspective. It was therefore necessary to establish a framework that was not only
suitable to the research programme but had a high degree of usefulness (Shrivastava
1987, Camerer 1985) making contribution to both industry and academic knowledge.
Having evaluated a wide range of approaches and models it was found that most were
econometric, (Morley 1991, Witt & Witt 1990) statistical or quantitative in nature
(Grazer & Stiff 1987, Archer 1978, Barry & O'Hagan 1972, Papadopoulos & Witt
1985, Reid & Anderleck 1989, Pfeifer & Bodily 1990, Downey & Ireland 1979,
Martin & Witt 1989) or demand oriented (Uysal & Crompton 1984, Jafari 1987), with
no inclusion of important CSHB market variables such as segmentation or marketing
dimensions (Witt & Martin 1987). As such, none were suited specifically to the nature
of the research. It thus became evident that a multi-variant and inter-disciplinary
approach (Belk 1986, Holbrook 1987, Riddick, DeShriver, Weissinger 1984, Lutz
1987) was required essentially mixing qualitative and quantitative approaches (Jick
1979, Silverman 1985) and evolving and developing the framework as the research
progressed (Stokes & Miller 1975, McLellan 1980, Kidder & Judd 1986, Babbie
1989). Such a framework reflected the inductive nature of the research and allowed an
under-theorised field to develop contextually based theories. What was required was a
framework that combined the nature of services (Bitran & Lojo 1993) and hospitality
and tourism research (Ritchie & Goeldner 1987, Veal1992, Litteljohn 1990) with the
nature of marketing and strategic management - specifically - industrial organisations
research (West & Olsen 1989, Chandrasekar & Dev 1989, Anderson 1986, Bagozzi
1984, Hudson & Ozanne 1988).
Initial literature surveys pointed to the value of using a market segmentation model to
analyse CSHB markets; the Guiltinan and Paul market analysis and segmentation
model (1982) combines qualitative and quantitative data into a framework compatible
with supplier strategy analysis, shown in figure 1.6.1 a.
Page 33

Figure 1.6.1a: Market Analysis and Segmentation Model
Define the relevant ..... Diagnose the r-+ Define market -+ Describe market r+ Analyse competitors market ..... buying process segments segments position
J ~
~ rr+ Decision-making purpose of segmentation ~
, ~ ,
I Implications :
+ : Implications I MARKETING STRATEGIES
AND PROGRAMS
Source : Guiltinan & Paul (1982)
For the research needs, the Guiltinan and Paul model provided a starting point from
which to begin analysis, forcing the need for definitions to be established, thus reducing
the complexity of the market. Using the Guiltinan and Paul model as a guide, the initial
research model was constructed as shown in figure 1.6.1 b.
Figure 1.6.1 b :Initial Research Model- Stage 1
- Define Market and Determine Market Structure
• Identify Demand Characteristics
- Identify Supply Characteristics ...... .......
~ Competitive Analysis
Strategy Analysis """"' "''IIII
This model shows the key areas of analysis to be (i) market definition, and structure, (ii)
demand characteristics, (iii) supply characteristics, (iv) competitive analysis, and (v)
strategy analysis.
Page34
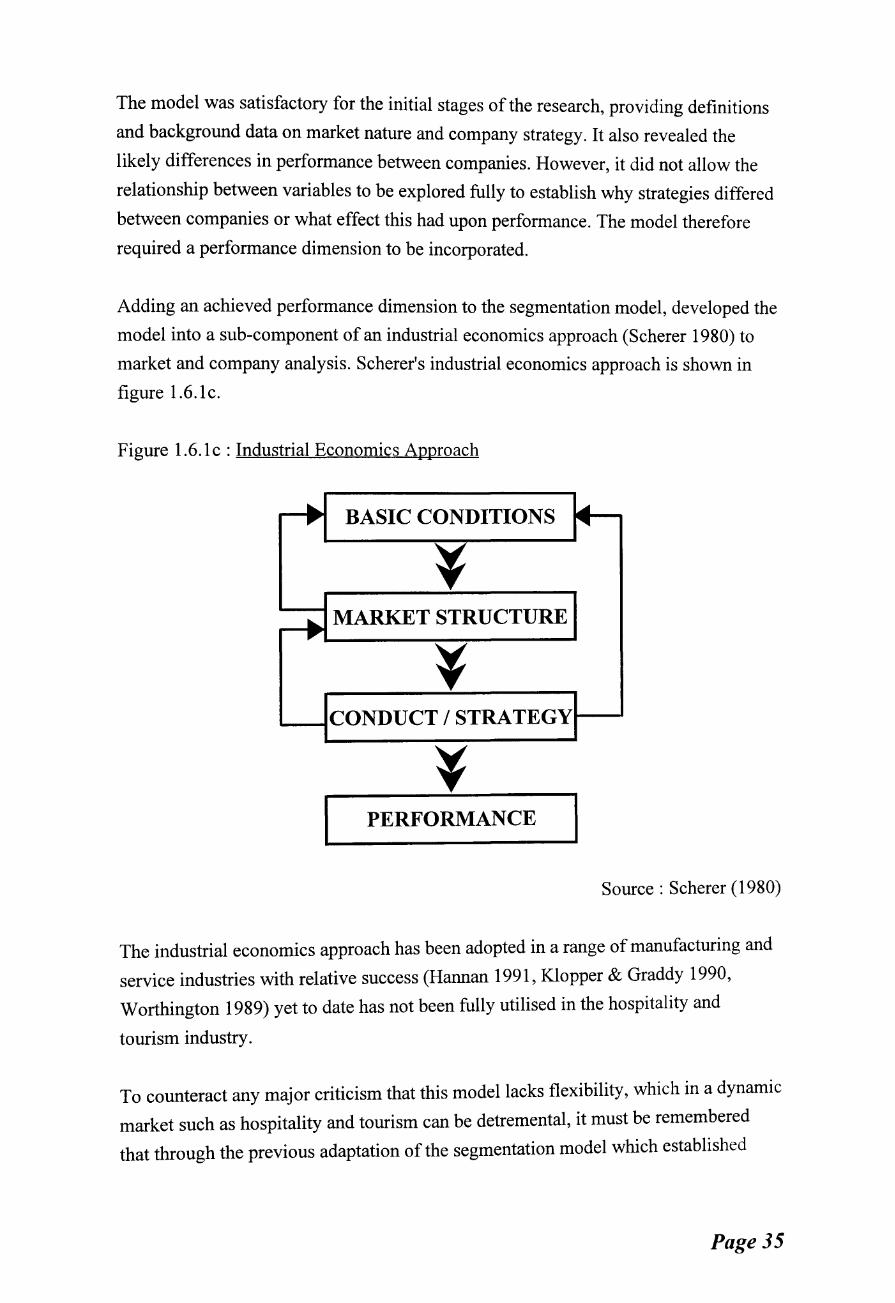
The model was satisfactory for the initial stages of the research, providing definitions
and background data on market nature and company strategy. It also revealed the
likely differences in performance between companies. However, it did not allow the
relationship between variables to be explored fully to establish why strategies differed
between companies or what effect this had upon performance. The model therefore
required a performance dimension to be incorporated.
Adding an achieved performance dimension to the segmentation model, developed the
model into a sub-component of an industrial economics approach (Scherer 1980) to
market and company analysis. Scherer's industrial economics approach is shown in
figure 1.6.1c.
Figure 1.6.1 c : Industrial Economics Approach
..... BASIC CONDITIONS l...t ,..
I~
~f ..... MARKET STRUCTURE ,...
~ CONDUCT/STRATEGY
PERFORMANCE
Source : Scherer (1980)
The industrial economics approach has been adopted in a range of manufacturing and
service industries with relative success (Hannan 1991, Klopper & Graddy 1990,
Worthington 1989) yet to date has not been fully utilised in the hospitality and
tourism industry.
To counteract any major criticism that this model lacks flexibility, which in a dynamic
market such as hospitality and tourism can be detremental, it must be remembered
that through the previous adaptation of the segmentation model which established
Page35

relevant background factors, a more Neo-Austrian approach (Reekie 1989, Jacobson
1992, Kirzner 1976, Stata 1989) develops.
Thus the methodology and underlying research rationale provides the necessary
grounding, placed within a process type framework, and permits the flexibility
inherent in the situation researched.
It can be seen that the initial work undertaken, through adopting a segmentation
theory approach has been encompassed within Scherer's model as shown in figure
1.6.1d.
Figure 1.6.1d: Developing Research Framework- Stage 2
I DEFINITIONS I
¥ I DEMAND I~~ MARKET STRUCTURE ~I SUPPLY ,..
¥ STRATEGY & COMPETITIVE ADVANTAGE
PERFORMANCE
To further allow analysis of the linkages between structure, conduct/strategy and
performance the concept of strategic group clusters (Caves & Porter 1977) was used
in combination with the notion of strategic space. This forms a further development in
the research framework at industry level. In addition a multi-site perspective was
added in the form of a case study (Appendix V) to allow comparative analysis at unit
as well as industry level and between unit and corporate perceptions and to test the
Page 36

findings ofthe model. These developments are shown in figure 1.6.1e and represent
the current completed research framework used.
Figure 1.6.1 e : Developed Research Framework - End Result
I DEFINITIONS I
~ I DEMAND I~------- MARKET STRUCTURE ~I SUPPLY I
Ill"'
~ STRATEGY & COMPETITIVE ADVANTAGE
PERFORMANCE
CORPORATE (Industry)
UNIT (Market)
Using principles of strategic clusters and strategic space
The research framework can therefore be seen as an evolving process which, by its
nature, allows application to a range of hospitality and tourism environments. The
implementation of the framework is discussed in Chapter 6.
Page37
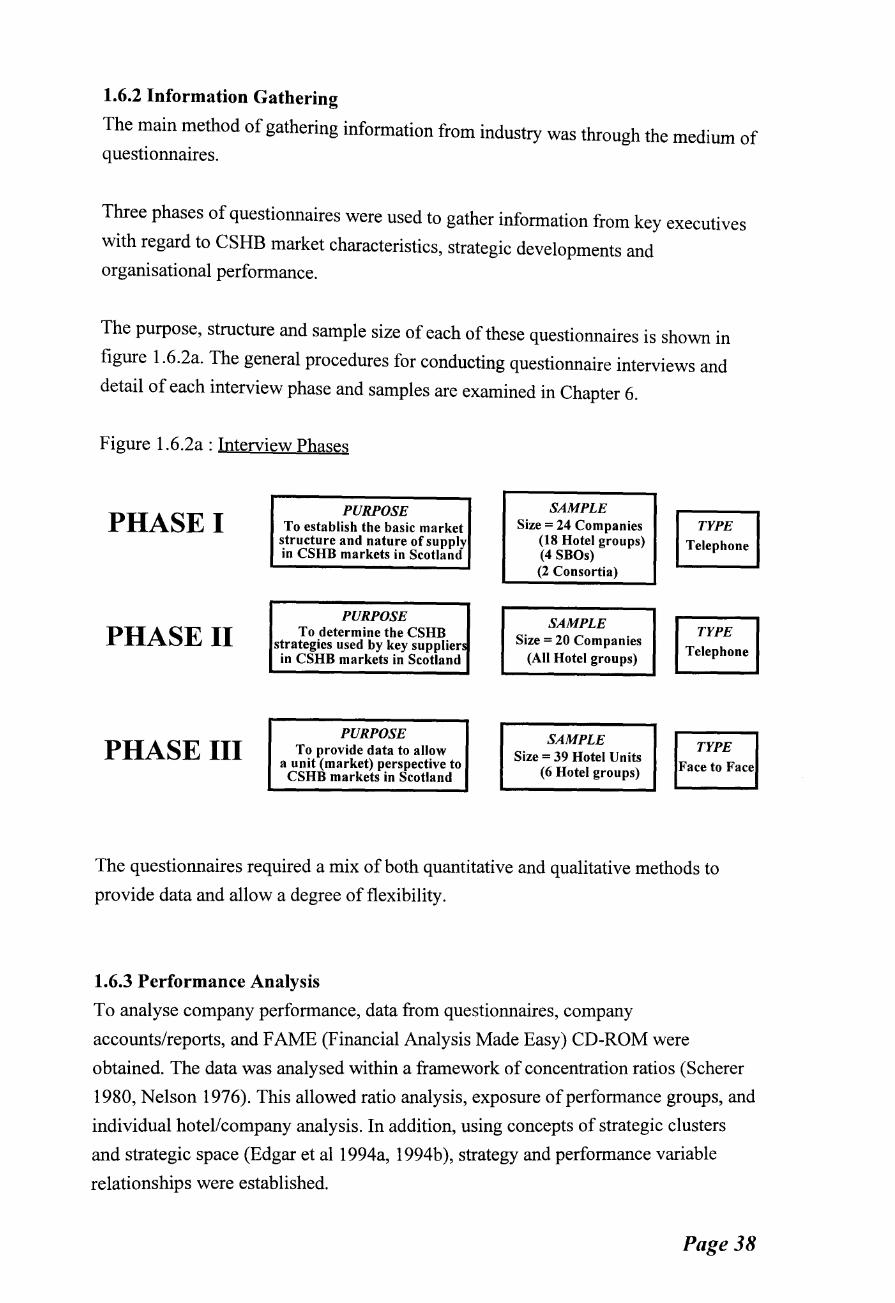
1.6.2 Information Gathering
The main method of gathering information from industry was through the medium of questionnaires.
Three phases of questionnaires were used to gather information from key executives
with regard to CSHB market characteristics, strategic developments and organisational performance.
The purpose, structure and sample size of each of these questionnaires is shown in
figure 1.6.2a. The general procedures for conducting questionnaire interviews and
detail of each interview phase and samples are examined in Chapter 6.
Figure 1.6.2a : Interview Phases
PHASE I
PHASE II
PHASE III
PURPOSE To establish the basic market
structure and nature of supply in CSHB markets in Scotland
PURPOSE To determine the CSHB
strategies used by key supplien in CSHB markets in Scotland
PURPOSE To provide data to allow
a unit (market) perspective to CSHB markets in Scotland
SAMPLE Size= 24 Companies
(18 Hotel groups) (4 SBOs) (2 Consortia)
SAMPLE Size= 20 Companies
(All Hotel groups)
SAMPLE Size= 39 Hotel Units
(6 Hotel groups)
TYPE Telephone
TYPE Telephone
TYPE Face to Face
The questionnaires required a mix of both quantitative and qualitative methods to
provide data and allow a degree of flexibility.
1.6.3 Performance Analysis
To analyse company performance, data from questionnaires, company
accounts/reports, and FAME (Financial Analysis Made Easy) CD-ROM were
obtained. The data was analysed within a framework of concentration ratios (Scherer
1980, Nelson 1976). This allowed ratio analysis, exposure of performance groups, and
individual hotel/company analysis. In addition, using concepts of strategic clusters
and strategic space (Edgar et al 1994a, 1994b ), strategy and performance variable
relationships were established.
Page 38
Performance was measured on two levels, (i) financial performance including
variables of return on capital employed (ROCE), gearing, revenue, and profitability,
(ii) non-financial performance in terms of peer competitive identity e.g. market
strength.
Page39
1.6 CHAPTER SUMMARY
This chapter has established the research context and approach, highlighting the need
for an evolving and developing form of research reflected in both aims and methods.
The aims of the research can be seen to be to :
analyse the nature and methods of provision of Commercial Short Holiday Breaks (CSHBs) in Scotland, with particular emphasis on the strategic dimensions of corporate ventures and resulting performance, and to provide a model for enhancing performance at corporate and unit level.
The methods combine qualitative and quantitative techniques through application of a
research framework devolved from a combination of segmentation theory, industrial
economics and neo-Austrian economics and applied through the use of a
computerised database, semi-structured telephone, personal face to face interviews
and analysis of secondary data.
The next section, Part II, and inclusive chapters provides a comprehensive review of
the nature of hospitality and tourism environments, hotel operations and the growth of
short break markets before determining the research problem. Part III then provides
detail of how the research methods and design were implemented.
Page 40
REFERENCES
Abell, D.F; Hmmond, J.S (1979) "Strategic market planning", Prentice Hall,
Englewood Cliffs, N.J
Ackoff, R.L (1970) "A concept of corporate planning", Wiley, New York
Aguilar, F.J (1967) "Scanning the business environment",. MacMillan, New York
Alderich, H.E (1979) "Organisations and environments", Prentice Hall Englewood Cliffs, N.J
Allison, G.T (1970) "Essence of decision", Little Brown, Boston
Anderson, C.R; Paine, F.T (1975) "Managerial perceptions and strategic behaviour",
Academy of Management Journal, 18( 4) pp 811-823
Anderson, P.F (1986) "On method in consumer research: A critical relativist
perspective", Journal ofConsumer Research, 13 September pp 155-173
Andrews, K.R ( 1971) "The concept of corporate strategy", Dow Jones Irwin,
Homewood, Ill
Andrews, K.R (1980) "The concept of corporate strategy", Irwin, Homewood, Ill
Andrews, S.K; Learned, E; Christensen, C.R; Guth, W (1965) "Business policy : Text
and cases", Irwin, Homewood, Ill
Ansoff, H.I (1965) "Corporate strategy", McGraw Hill, New York
Ansoff, H.I (1969) "Corporate strategy", McGraw-Hill, New York
Ansoff, H.I (1977) "The state of practice in planning systems", Sloan Management Review, winter pp 1-24
Ansoff, H.I (1991) "Critique of Henry Mintzberg's The Design School:
Reconsidering the basic premises of strategic management", Strategic Management Journal12 pp 449-461
Ansoff, H.I (1994) "Comments on Hem:y Mintzberg's rethinking strategic planning",
Long Range Planning, 27(3) pp 31-32
Ansoff, I (1965) "Corporate strategy: An analytical approach to business policy for
growth and expansion", McGraw-Hill, New York
Anthony, R.N (1965) "Planning and control systems : A framework for analysis",
Division of Research, Harvard Business School
Arbel, A; Woods, R.H (1991) "Inflation and hotels: The cost of following a faulty
routine", The Cornell HRA Quarterly, 31(4) pp 66-75
Archer, B.H (1978) "Demand forecasting in tourism", Bangor Occasional Papers in
Economics, University of Wales 9
Arenberg, Y (1991) "Service capacity. demand fluctuations. and economic
behaviour", American Economist, 35(1) pp 52-55
Argenti, J (1965) "Corporate planning", Allen and Unwin, New York
Page 41
Argenti, J (1968) "Corporate planning: A practical guide", Allen and Unwin, New
York
Argenti, J (1980) "Practical corporate planning", Allen and Unwin, New York
Argyris, C.D; Schon, D.A (1978) "Organisational learning: A theory of action
perception", Addison Wesley, Reading MA
Axelrod, R (1976) "Structure of decision: The cognitive map of political elites",
Princeton University Press, Princeton, NJ
Babbie, E (1989) "The practice of social research", Wadaworth Publishing
Company, New York
Bagozzi, R.P (1984) "A prospectus for theory construction in marketing", Journal of Marketing, 48 Winter pp 11-29
Barney, J (1991) "Firm resources and sustained competitive advantage", Journal of Marketing, 17(1) pp 99-120
Barry, K; O'Hagan, J (1972) "An econometric study of British tourist expenditure in
Ireland", Economic and Social review, 3(2) January pp 143-161
Bartlett, C.A (1979) "Multinational structural evolution : The changing decision
environment in international divisions", Unpublished Dissertation, Harvard
Business School
Bartlett, C.A; Ghoshal, S (1986) "Tap your subsidiaries for global reach", Harvard Business Review, Nov/Dec pp 87-94
Bartlett; C.A; Ghoshal, S (1989) "Managing across borders : The transnational
solution", Harvard Business School Press, Boston
Bartlett, C.A; Ghoshal, S (1994) "Changing the role of top management: Beyond
strategy to purpose", Harvard Business Review, Nov-Dec pp 79-88
BCG (1968) "Perspectives on experience", Boston Consulting Group, Mass
BCG (1972) "Perspectives on experience", Boston Consulting Group, Mass
Belk, R. W (1986) "What should ACR want to be when it grows up", Advances in Consumer Research, 13 pp 423-424
Berry, W.L; Bozarth, C.C; Hill, T.J, Klompmaker, J.E (1991) "Factory focus:
segmenting markets from an operations perspective", Journal of Operations Management, 10(3) pp 363-387
Bhide, A. (1986) "Hustle as strategy", Harvard Business Review, 64(5) pp 59-65
Bitran, G.R; Lojo, M (1993) "A framework for analysing service operations",
European Management Journal, 11(3) Sept. pp 271-282
Boddewyn, J.J; Halbrich, M.B; Perry, A.C (1986), "Service multi-nationals:
conceptualisation, measurement and theory", Journal of International Business
Studies, Fall pp 41-57
Page 42
Bourgeois, L.J (1980) "Strategy and environment : A conceptual integration",
Academy of Management review, 5, pp 25-40
Bourgeois, L.J; Brodwin, D.R (1984) "Strategic implementation: 5 approaches to an
elusive phenomenon", Strategic Management Journal, 5 pp 42-64
Bower, J.L (1970) "Managing the resource allocation process", Irwin, Homewood, Ill
Braithwaite, R (1992) "Value chain assessment of the travel experience", Cornell HRAQ, 33(5) pp 41-49
Brandendurg, R.G; Gilmore, F.E (1962) "Anatomy of corporate planning", Harvard Business Review, Nov /Dec, pp 61-69
Brown, S (1990) "Hotel workout specialists seeing more business; strong
management crucial in troubled markets", National Real Estate Investor, 32(2) pp 81-92
Buchholz, R.A (1982) "Business environment and public policy", Prentice Hall,
Englewood Cliffs
Burgess, C; Hampton, A; Price, L; Roper, A (1995) "International hotel groups : what
makes them successful", International Journal of Contemporary Hospitality Management, 7(2/3) pp 74-80
Bums, T; Stalker, E (1961) "The management of innovation", Tavistock, London
Buzzell, R.D; Gale, B. T (1987) "The PIMS principles - Linking strategy to
performance", Free Press, New York
Buzzell, R.D; Gale, B.T; Sultan, R (1975) "Market share- a key to profitability",
Harvard Business Review, Jan/Feb pp 97-106
Buzzell, R.D; Heaney, D.F; Schoeffer, S (1974) "Impact of strategic planning on
profit performance", Harvard Business Review, 52(2) pp 137-145
Camerer, C (1985)"Redirecting research in business policy and strategy", Strategic Management Journal, 6 pp 1-15
Camillus, J.C; Grant, J.M (1980) "Operational planning; the integration of
programming and budgeting", Academy of Management Review, 5 pp 369-379
Campbell, A; Goold, M; Alexander, M (1995) "Corporate strategy: The quest for
parenting advantage", Harvard Business Review, 73(2) pp 120-133
Campbell, A; Yeung, S (1990) "Do you need a mission statement ?"Economist
Publications, London
Carter, R ( 1971) "The behavioural theory of the firm and top-level corporate
decisions", Administrative Science Quarterly, 16 pp 413-429
Caves, R (1972) "American industry: Structure conduct. performance", Prentice Hall,
Englewood Cliffs, NJ
Caves, R; Porter, M.E (1977) "From entry barriers to mobility barriers", Quarterly
Journal of Economics, 91 May pp 241-261
Page 43
Chandler, A.D (1962) "Strategy and structure", MIT Press, Mass
Chandler, A.D (1962) "Strategy and structure : chapters in the history of the industrial
enterprise", MIT Press, Cambridge, Mass
Chandler, A.D; Daems, H (1980) "Managerial hierarchies : Comparative perspectives
on the rise of the modem industrial enterprise", Harvard University Press,
Cambridge, Mass
Chandrasekar, V; Dev, C.S (1989) "A framework for analyzing technology and
structure in the lodging industry", International Journal of Hospitality Management, 8(3) pp 237-245
Channon, D (1974) "Strategy and structure of British enterprise", Unpublished
Doctoral Dissertation, Graduate School of Business, Harvard University
Channon, D.F (1973) "The strategy and structure of British enterprise", MacMillan,
London
Channon, D; Jalland, M (1978) "Multinational strategic planning", MacMillan, New
York
Child, J (1974) "Part I :Management and organisation factors associated with
company performance", Journal of Management Studies, 11 Oct pp 175-189
Child, J ( 197 5) "Part II : A contingency analysis", Journal of Management Studies, 12
Feb pp 175-189
Christensen, C.R; Andrews, K.R; Bower, J.L; Hammermesh, G; Porter, M.E (1982)
"Business Policy: text and cases", Irwin, Homewood, Ill
Conley, P (1970) "Experience curves as a planning tool", IEEE Spectrum, 7 pp 63-68
Cosier, R.A; Alpn, J.C (1980) "A critical view of dialectical inquiry as a tool in
strategic planning", Strategic Management Journal, 1 pp 343-356
Cowell, D.W (1983) "International marketing of services", The Service Industries Journal, 3(3) pp 308-328
Cravens, D.W; Shipp, S.H (1991) "Market driven strategies for competitive
advantage", Business Horizons, 34(1) pp 53-61
Crawford-Welch, S ( 1990) "Market segmentation in the hospitality industry",
Hospitality Research Journal, 14(2) pp 295-308
Crosby, P.B (1979) "Quality is free: The art of making quality certain", McGraw-
Hill, New York
Cummings, S (1993) "Briefcase: The first strategists", Long Range Planning, 26(3)
pp 133-135
Cyert, R; March, J.G (1963) "A behavioural theory ofthe firm", Prentice Hall,
Englewood Cliffs
Daft, R.L (1989) "Organisation theory and design", West Publishing St. Paul
Page44
Dalkey, N; Helmer, D (1963) "An experimental application of the delphi method to
the use of experts", Management Science, 9(3) pp 4 5 8-464
Dann, T.D ( 1991) "Strategy and managerial work in hotels", International Journal of Contemporary Hospitality Management, 3(2) pp 23-25
Davis, J.C (1989) "Globalisation ofhotel market is going strong: segmentation is
meeting the needs ofthe 1990's", National Real Estate Investor, 31(13) pp
59-76
Day, E.S (1977) "Diagnosing the product :portfolio", Journal of Marketing, 41 pp 29-
38
Day, G.S (1981) "Strategic market analysis and definition- an integrated approach",
Strategic Management Journal, 2 pp 281-299
DeNoble, A.F; Olsen, M (1982) "The relationship between the strategic planning
process and the service delivery system", The Practice of Hospitality
Management, Pizam et al (Eds), AVI Publishing, Westport, Conn
DeNoble, A.F; Olsen, M (1986) "The food service industry environment: Market
volatility analysis", FlU Hospitality Review, 4(2) pp 89-100
Dess, G; Davis, P (1984) "Porter's generic strategies as determinants of strategic
group membership and performance", The Academy of Management Journal 26 pp 467-488
Dev, C.S (1990) "Marketing practices of hotel chains", The Cornell HRA Quarterly, November pp 54-63
Dev, C.S; Brown, J.R (1990) "Marketing strategy, vertical structure and performance
in the lodging industry :A contingency approach", International Journal of Hospitality Management, 9(3) pp 269-282
Dev, C.S; Klein, S (1993) "Strategic alliances in the hotel industry", Cornell HRAQ, 34(1) pp 42-45
Dev, C.S; Olsen, M (1989) "Environmental uncertainty~ business strategy and
financial :performance : An empirical study of the US lodging industry",
Hospitality Education and Research Journal, 13(3) pp 171-186
Downey, K.H; Ireland, D.R (1979) "Quantitative versus qualitative : environmental
assessment in organizational studies", Administrative Science Quarterly, Doyle, p (1994) "Setting business objectives and measuring performance", European
Management Journal, 12(2) pp 123-132
Doz, Y (1976) "National policies and multinational management", Unpublished
Doctoral Dissertation, Harvard Business School
Doz, y (1980) "Strategic management in multinational companies", Sloan Management Review, Winter pp 27-46
Page45
Dror, Y (1974) "Policy sciences : Some global perspectives", Policy Sciences, pp 83-
87
Drucker, P.F (1974) "Management: Tasks~ responsibilities. practices", Harper &
Row, New York
Drucker, P.F (1982) "The changing world of the executive", Truman Talley, New
York
Duncan, R.B (1972) "Characteristics of organisational environments and perceived
environmental uncertainty", Administrative Science Quarterly, 17 pp 313-327
Duncan, R.B; Weiss, A (1978) "Organisational learning implications for organisation
design", In Straw, B (ed) "Research in organisational behaviour", JAI Press,
Greenwich pp 75-123
Dundas, K.N.M; Richardson, P.R (1979) "Business policy and the concept of market
failure" Queens University
Dunning, J.H (1980) "Towards an eclectic theory of International production",
Journal of International Business Studies, Spring/Summer pp 9-31
Dunning, J.H; McQueen, M (1981) "The eclectic theory of International production:
A case study of the International hotel industry", Managerial and Decision Economics, 2( 4)
Dutton, J.E; Fahey, L; Narayanan, V.K (1983) "Towards understanding strategic issue
diagnosis", Strategic Management Journal, 4 pp 307-324
Edgar, D.A; Taylor, S (1996) "Strategic management research in hospitality : From
slipstream to mainstream ?". 5th Annual Hospitality Research Conference,
CHME, Nottingham, April
Edgar, D; Litteljohn, D.L; Allardyce, M.L (1994a) "Strategic group clusters and
strategic space : The case of the short break market", International Journal of Contemporary Hospitality Management, 6(5) pp 20-26
Edgar, D; Litteljohn, D.L; Allardyce, M.L; Wanhill, S.R.C (1994b) "Commercial
short holiday breaks :market structure. competitive strategy and performance"
Tourism State of The Art, Wiley & Sons, London, pp 323-342
Eramilli, M.K (1989) "Entry mode choice in service industries", International Marketing Review, 7(5) pp 50-62
Eyster, J.J (1993) "Hotel management contracts under fire and change: A
perspective", Real Estate Finance Journal, 8( 4) pp 3 7-46
Fahey, L; King, W (1977) "Environmental scanning in corporate planning", Business
Horizons, August pp 61-71
Feiertag, H (1992) "Discounting rates does more harm than good", Hotel & Motel
Management, 207(18) pp 14
Page 46
Feltenstein, T (1992) "Strategic planning for the 1990's : Exploiting the inevitable",
Cornell HRAQ, 33(3) pp 50-54
Galbraith, C; Schendel, D (1985) "An empirical analysis of strategy types", Strategic Management Journal, 4 pp153-173
Galbraith, J.R; Nathanson, D (1978) "Strategy implementation The role of structure
and process", West Publishing, St. Paul MN
Garter, L.N (1991) "Managing for survival", Small Business Reports, 16(5) pp 16-
19
Ghoshal, S (1986) "The innovative multinational : A differentiated network of
organisational roles and management processes", Unpublished Doctoral
Dissertation, Harvard Business School
Go, F (1989) "International hotel industry- capitalising on change", Tourism Management, September pp 195-200
Go, F; Pine, R (1995) "Globalization strategy in the hotel industry", Routledge,
London
Goold, M; Campbell, A (1987) "Many best ways to make strategy", Harvard Business Review, Nov/Dec pp 70-76
Goold, M; Campbell, A (1987) "Strategies and style", Basil Blackwell
Grant, J.H; King, W.R (1979) "Strategy formulation: analytical and normative", in
Hofer, C.W; Schendel, D.E "Strategic management", Little Brown, New York
Grinyer, P.H; AI Bazazz, S; Yasai-Ardekani, M (1986) "Towards a contingency
theory of corporate planning : Findings in 48 UK companies", Strategic Management Journal, Jan/Feb pp 3-28
Grinyer, P; Al-Bazzaz, S; Ardekani, M (1980) "Strategy~ structure~ the environment.
and financial performance in 48 UK companies", The Academy of Management Journal, 23( 4) pp 193-220
Guiltinan, J.P; Paul, G.W (1982) "Marketing management", McGraw-Hill New
York pp 76
Hambrick, D (1983a) "Some tests of the effectiveness and functional attributes of
Miles and Snow's strategic types", The Academy of Management Journal,
26(2) pp 5-26 Hambrick, D (1983b) "High profit strategies in mature industrial-product based units",
The Academy of Management Journal, 26 pp 687-707
Hambrick, D.C; MacMillan, I.C; Day, D.L (1982) "Strategic attributes and
performance in the BCG matrix - a PIMS-based analysis of industrial product
businesses", Academy of Management Journal, 25, pp 510-531
Hamel, G; Prahalad C.K (1990) "The core competence of the corporation", Harvard Business Review, May-June
Page47

Hamel, G; Prahalad, C.K (1989) "Strategic intent", Harvard Business Review, May
June pp 63-76
Hamel, G; Prahalad, C.K (1994) "Competing for the future", Harvard Business School
Press, Boston
Hamermesh, R.G (1986) "Making strategy work : How senior managers produce
results", John Wiley, Chichester
Hamill, J ( 1993) "Competitive strategies in the world airline industry", European Management Journal, 11(3) pp 332-341
Hannan, T .H (1991) "Foundations of the structure - conduct - performance paradigm
in banking", Journal of Money, Credit and Banking, 23( 1) pp 68-84
Harrigan, K.R (1980) "Strategies for declining industries", Lexington Books,
Lexington Ma
Hatten, K.J (1974) "Strategic models in the brewing industry", Unpublished Doctoral
Dissertation, Purdue University
Hatten, K.J; Schendel, D.E (1977) "Heterogeneity within an industry: Firm conduct
in the US Brewing industry: 1952-1971", Journal of Industrial Economics, 26
pp 97-113
Hatten, K.J; Schendel, D.E; Cooper, A.C (1978) "A strategic model of the US
Brewing industry : 1952-1971 ",Academy of Management Journal, 21( 4) pp
592-610
Hedley, B (1977) "Strategy and the business portfolio", Long Range Planning, Feb
pp 9-15
Henderson, B.D (1979) "Henderson on corporate strategy", Abt Books, Cambridge
MA
Hennessey, S.F (1992) "The 1992 Hotel market: Modest improvement", The Cornell HRA Quarterly, 33(2) pp 20-25
Hofer, C.W; Schendel, D (1978) "Strategy formulation: Analytical concepts", West
Publishing, St.Paul MN Holbrook, M.B (1986) "A note on sadomasochism in the review process: I hate when
that happens", Journal of Marketing, Summer pp 104-108
Holloway, C; King, W.R (1979) "Evaluating alternative approaches to strategic
planning", Long Range Planning, 12 August pp 74
Horsburgh, S (1991) "Resources in the International Hotel Industry: A framework for
analysis", International Journal of Contemporary Hospitality Management,
3( 4) pp 30-36 Houlden, B.T (1995) "How corporate planning adapts and survives", Long Range
Planning, 28(4) pp 99-108
Hrebiniak, L.G; Joyce, W.F (1984) "Implementing strategy", MacMillan, New York
Page 48
Hudson, L.A; Ozanne, J.L (1988) "Alternative ways of seeking knowledge in
consumer research", Journal of Consumer Research, 14 March pp 18-25
Huff, A. S ( 1990) "Mapping strategic thought", Wiley, Chichester
Itami, H; Roehl, T.W (1987) "Mobilising invisible assets", Cambridge, Harvard
University Press
Jacobson, R (1992) "The Austrian school of strategy", Academy of Management Review, 17( 4), pp 782-807
Jafari, J (1987) "Tourism models- the sociocultural aspects", Tourism Management, June pp 151-159
Jain, (1993) "Marketing planning and strategy", 4th Edition, South-Western
Publishing Co, Cincinnati, Ohio
Jauch, L; Osborn, R; Glueck, W (1980) "Short terms financial success in large
business organisations", Strategic Management Journal, 1 pp 49-63
Jelinek, M (1979) "Institutionalising innovations :A study of organisational learning
systems", Praeger, New York
Jick, T.D (1979) "Mixing qualitative and quantitative methods : triangulation in
action", Administrative Science Quarterly, December 24 pp 602-611
Kanter, R.M (1983) "The change masters", Simon and Schuster, New York
Karmani, A (1984) "Generic competitive strategies- an analytical approach",
Strategic Management Journal, 5( 4) pp 367-380
Kay, J (1993) "Foundations of corporate success : How business strategies add value",
Oxford University Press, Oxford
Keenan, M; White, L (1982) "Mergers and acquisitions", Heath & Camp, Lexington,
MA
Kelly, H.F (1994) "The hotel market", National Real Estate Investor, 36(1) pp 27-
30
Kidder, L.H; Judd, C.M (1986) "Research methods in social relations", CBS
Publishing, New York
King, W.R (1978) "Information for strategic planning: An analysis", Information and
Management, 1 pp 59-66
King, W.R; Cleland, D.I (1978) "Strategic planning and policy", Charter, New York
Kirzner, I.M (1976) "On the method of Austrian economics", Foundations of Modern Austrian Economics, Kansas, Sheed & Ward pp 40-51
Knight, K (1976) "Matrix organisation- a review", Journal of Management Studies,
May pp 20-32 Kwnasa, F; Dev, C; Ishak, N.K; Meyer, M.K; Olsen, M.D; Robichaud, R; Saleem, N;
West, J.J (1986) "An analysis of major trends and their impact potential
affecting the hospitality industries as identified by the method of content
Page49
analysis", Annual Conference of the Council on Hotel, Restaurant and
Institution Education, pp 168-193
Lancaster, K; Ratchford, B. T (1990) "The economies of product variety : a survey:
marketing applications of the economics of product variety", Marketing Science, 9(3) pp 189-211
Larwood, L; Falbe, C.M; Kringer, M.P; Meising, P (1995) "Structure and meaning of
organisational vision", Academy of Management Journal, 38(3) pp 740-769
Lawrence, P.R; Lorsch, J.W (1967) "Organisation and environment: Managing
differentiation and integration", Division of research, Harvard Business School
Leavy, B ( 1996) "Key processes in strategy : Theories and themes", Thomson
Business Press, London
Leontiades, M (1983) "Policy~ strategy and implementation", Random House, New
York
Levitt, T (1965) "Exploit the product life cycle" Harvard Business Review, Nov/Dec
pp 81-94
Levitt, T (1983) "The globalisation of markets", Harvard Business Review, 1
May/June pp 92-102
Lewis, J.D (1990) "Partnerships for profit : structuring and managing strategic
alliances", Free Press, New York
Lindblom, C.E (1959) "The science of muddling through", Public Administrative review, 19, pp 79-88
Lippman, S.A; Rumelt, R.P (1982) "Uncertain imitability : An analysis of inter firm
differences in efficiency under competition", Bell Journal of Economics, 23,
pp 418-438
Litteljohn, D (1985) "Towards an economic analysis of trans/multinational hotel
companies", International Journal of Hospitality Management, 4(4) pp 157-
165
Litteljohn, D.L (1990) "Hospitality research : Philosophies and progress", In
"Managing and marketing services in the 1990's", edited by Teare, R;
Moutinho, L; Morgan, N Cassell, London Chapter 14 pp 209-228
Litteljohn, D; Beattie, R (1992) "The European hotel industry : corporate structures
and expansion strategies", Tourism Management, March pp 27-33
Litteljohn, D; Slattery, P (1993) "Macro analysis techniques: an appraisal of Europe's
main markets", International Journal of Contemporary Hospitality Management, 3(4) pp 6-13
Lorange, p (1980) "Corporate planning an executive view", Prentice Hall, Englewood
Cliffs, Ill
Page 50
Lorange, P (1982) "Implementation of strategic planning", Prentice Hall, Englewood
Cliffs, Ill
Lorange, P; Roos, J; Bronn, P.S (1992) "Building successful strategic alliances", Long Range Planning, 25(4) pp 10-17
Lutz, R.J ( 1987) "Statement of review philosophy", Journal of Consumer Research, 13 June pp 24-32
Lyons, F (1993) "Using segmentation analysis", Credit World, 81(5) pp 36-37
Lyons, M.P (1991) "Joint-ventures as strategic choice- a literature review", Long Range Planning, 24(4) pp 130-144
MacMillan, I (1978) "Strategy formulation- political concepts", West Publishing, St
PaulMN
MacMillan, I; Hambrick, D.C; Day, D.L (1982) "The product portfolio and
profitability - a PIMS based analysis of industrial product businesses",
Academy of Management Journal, 25 pp 733-755
March, J.G; Simon, H.A (1958) "Organisations", John Wiley, New York
Martin, C.A; Witt, S.F (1989) "Forecasting tourism demand: a comparison of the
accuracy of several quantitative methods", International Journal of Forecasting, 5(1) pp 7-19
Mason, R., Mitroff, I (1981) "Challenging strategic planning assumptions", Wiley,
New York
Mason, R.O (1969) "A dialectical approach to strategic planning", Management Science, 15(8) pp 403-414
McLellan, R (1980) "Research", Parks and Recreation, 15(7) pp 18-20
McNulty, C (1977) "Scenario development for corporate planning", Futures, 9 April
pp 128-138
Miles, R.E; Snow, C.C (1978) "Organisation strategy, structure and process",
McGraw-Hill, New York
Miller, D (1986) "Configurations of strategy and structure towards a synthesis",
Strategic Management Journal, 7 pp 233-249
Miller, D; Friersen, P.H (1978) "Archetypes of strategy formulation", Management
Science, 24 pp 921-933
Miller, D; Friersen, P.H (1984) "A longitudinal study of the corporate life cycles",
Management Science, 30 pp 1161-1183
Miller, D; Friesen, P.H (1983) "Strategy making and environment : the third link",
Strategic Management Journal4 pp 221-135
Mills, P.K; Moberg, D.J (1982) "Perspectives on the technology of service
operations", Academy of Management Review, 7 pp 467-478
Page 51
Mintzberg, H (1973) "Strategy making in three modes", California Management Review, 16(2) pp 44-53
Mintzberg, H (1979) "The structure of organisations", Prentice-Hall, New York
Mintzberg, H (1983) "Power in and around organisations", Prentice Hall, New York
Mintzberg, H (1987) "Crafting strategy", Harvard Business review, July/August pp 74
Mintz berg, H ( 1990) "Strategy formulation - schools of thought", in Frederickson, J
"Perspectives on strategic management", Ballingor, Boston
Mintzberg, H (1994) "The rise and fall of strategic planning", Prentice Hall, New
York
Mintzberg, H (1994) "Rethinking strategic planning Part I: Pitfalls and fallacies",
Long Range Planning 27(3) pp 12-21
Mintzberg, H; Raisinghani, D; Theoret, A (1976) "The structure of unstructured
decision processes", Administrative Science Quarterly, 21 pp 246-276
Mintzberg, H; Waters, J.A (1978) "Patterns in strategy formation", Management Science, 24 pp 934-948
Mitroff, I.I; Mason, R.O (1982) "Business policy and metaphysics: Some
philosophical considerations", Academy of Management Review, 4 pp 1-12
Montgomery, C (1979) "Diversification= market structure and firm performance: An
extension ofRumelt's work", Unpublished Doctoral Dissertation, Purdue
University
Morden, T (1993) "Business strategy and planning", McGraw-Hill, London
Morley, C (1991) "Modeling international tourism demand: model specification and
structure", Journal ofTravel Research, 30(1) Summer pp 40-44
Murray, E.A (1978) "Strategic choice as a negotiated outcome", Management Science, 24(9) pp 960-971
Nailon, P. (1982) "Theory in hospitality management", International Journal of Hospitality Management, 1(3) pp 135-143
Nanus, B; Lundberg, C (1988) "In QUEST of strategic planning", Cornell HRAQ, Aug, pp 18
Narayanan, V.K; Fahey, L (1982) "The micro-politics of strategy formulation",
Academy of Management Review, 7, pp 25-34
Nelson, R (1976) "Goldschimd= Mann and Weston's industrial concentration: the
new learning", Bell Journal of Economics 7 pp 729-732
O'Connell, J.O; Zimmerman, J.W (1979) "Scanning the international environment",
California Management Review 22 (2) pp 15-23
Ohmae, K (1985) "Triad power: The coming shape of global competition", Free
Press, New York
Page 52

0 lsen, M ( 1980) "The importance of the environment to the food service and lodging
manager", Journal of Hospitality Education, Winter pp 35-45
Olsen, M.D (1980) "The importance of the environment to the food service and
lodging manager", Journal of Hospitality Education, winter pp 35-45
Olsen, M.D (1993) "International growth strategies of major US hotel companies",
EIU Travel and Tourism Analyst, 3 pp 51-64
Olsen, M.D (1993) "International growth strategies ofUS hotel companies", Travel and Tourism Analyst, 3 pp 51-64
Olsen, M; DeNoble, A.F (1981) "Strategic planning in dynamic lines", Cornell HRAQ, 21(4) pp 75-80
Oster, S (1990) "Modem competitive analysis", Oxford University Press, Oxford
Papadopoulos, S.I; Witt, S.F (1985) "A marketing analysis of foreign tourism in
Greece", 2nd World Marketing Congress Proceedings University of Stirling
August pp 682-693
Pavan, R.J (1972) "Strategy and structure of Italian enterprise", Unpublished Doctoral
Dissertation, Harvard Business School
Pearce, J.A (1983)" Selecting among alternative grand strategies", California Management Review, 14(3) pp 23-31
Pearce, J.A; Robinson, R.B (1988) "Strategic management : Strategy formulation and
implementation", Irwin, Homewood, Ill
Peters, T. (1987) "Thriving on Chaos: Handbook for a management revolution.",
Guild Publishing, London
Peters, T.S; Waterman, R.M (1982) "In search of excellence", Harper and Row,
London Pettigrew, A.M (1973) "The politics of organisational decision making", Tavistock,
London Pettigrew, A.M (1985) "The awakening Giant", Basil Blackwell, Oxford
Pfeffer, J; Salancik, G.R (1978) "The external control of organisations", Harpers and
Row, New York Pfeifer, P.E; Bodily, S.E (1990) "A test of space- time ARMA modelling and
forecasting ofhotel data", Journal of Forecasting, 9 pp 255-272
Phillips, p ( 1994) "An empirical investigation of the strategic planning practices of
the corporate hotel sector in South Wales", unpublished conference
proceedings, Council for Hospitality Management Education (CHME) Third
Research Conference, Napier University, Edinburgh
Pinto, E.S; Olsen, M (1987) "The information needs of finance executives in the
hospitality industry", Hospitality Education and Research Journal, 11(2) PP
181-190
Page 53

Pooley-Dias, G (1972) "Strategy and structure of French Enterprise", Doctoral
Dissertation, Harvard University
Porac, J; Thomas, H (1990) "Taxonomic mental models in competitor definitions",
The Academy of Management Review, 15 pp 224-240
Porter, M.E (1976) "lnterbrand choice, strategy and bilateral market power", Harvrad
University Press, Cambridge, Massechussetts
Porter, M.E (1979) "How competitive forces shape strategy", Harvard Business Review, March/April pp 137-145
Porter, M.E (1979) "The structure within industries and companies performance",
Review of Economics and Statistics, 61 May pp 214-227
Porter, M.E (1980) "Competitive advantage: Creating and sustaining superior
performance", Free Press, New York
Porter, M.E (1981) "The contributions of industrial organisation to strategic
management", Academy of Management review, 4 pp 609-620
Porter, M.E (1996) "What is strategy?", Harvard Business Review, Nov/Dec, pp 61-
78
Post, J.E (1978) "Corporate behaviour and social change", Reston, Reston, VA
Prahalad, C.K (1975) "The strategy process in a multinational corporation",
Unpublished Doctoral Dissertation, Harvard Business School
Prahalad, C.K; Bettis, R.A (1986) "The dominant logic: A new linkage between
diversity and performance", Strategic Management Journal, 7(6) pp 485-502
Prahalad, C.K; Hamel, G (1985) "Strategic intent", Harvard Business Review,
May/June pp 63-76
Prahalad, C.K; Hamel, G (1990) "The core competence of the corporation", Harvard Business Review, May-June pp 71-91
Preston, L.E ( 197 5) "Corporation and society : The search for a paradigm", Journal of Economic Literature, 13(2), pp 434-453
Quinn, J.B (1980) "Strategies for change: Logical incrementalism", Irwin,
Homewood, Ill Radford, K.J (1978) "Information systems for strategic decisions", Retson, Toronto
Reed, R; DeFillippi, R. (1990) "Causal ambiguity, barriers to imitation and
sustainable competitive advantage", Academy of Management Review, 15 pp
88-102 Reekie, W.D (1989) "Industrial economics : A critical introduction to corporate
enterprise in Europe and America" Edward Elgar Publications Ltd. Aldershot
Reid, L.J; Anderleck, K.L (1989) "Statistical analyses use in tourism research",
Journal ofTravel Research, Fall pp 21-24
Page 54
Reuland, R; Chaudry, J; Pagel, A (1985) "Research in the field of hospitality",
International Journal of Hospitality Management, 4(4) pp 141-148
Rhenman, E (1973) "Organisation theory for long range planning", Wiley, New York
Rink, D.R; Swan, J.E (1979) "Product life cycle research: A literature review",
Journal of Business Research, Sept. pp 219-242
Ritchie, R.B; Goeldner, C.R (1987) "TraveL tourism and hospitality research", John
Wiley & Sons London
Rock, S (1992) "London's luxury blues", Director, 45(7) pp 65-71
Rothschild, W.E (1979a) "Competitor analysis", Management Review, July, pp 22-
28, 37-39
Rothschild, W.E (1979b) "Competitor analysis- the missing link in strategy",
McKinsey Quarterly, Autumn, pp 42-53
Rumelt, R.P (1974) "Strategy~ structure and economic performance", Boston:
Division of Research, Harvard Business School
Rumelt, R.P (1979) "Evaluation of strategy :Theory and models", In Schendel, D;
Hofer, C.W (eds) "Strategic management", Little, brown, Boston MA pp 196-
211
Rumelt, R.P; Schendel, D.E; Teece, D.J (1994) "Fundamental issues in strategy : a
research agenda", Harvard Business School Press, Boston
Rushmore, S (1994) "An overview of the hotel industry: Past~ present. and future",
Real Estate Finance Journal, 9(4) pp 5-14
Sal oman, A (1992) "Hospitality industry battles quality questions~ discounting",
National Real Estate Investor, 34(13) pp 26-49
Scarpa, J (1993) "Hotel market segment report", Restaurant Business, 92(2) pp
108-116
Schaffer, J.D (1984) "Strategy~ organisation structure and success in the lodging
industry", International Journal of Hospitality Management, 3( 4) pp 159-165
Schaffer, J.D (1986) "Structure and strategy : Two sides of success", Cornell HRAQ, Feb pp 76-81
Schendel, D; Patton, G.R (1978) "A simultaneous equation model of corporate
strategy", Management Science, 24( 5) pp 1611-1621
Scherer, F.M (1980) "Industrial market structure and economic performance", 2nd
Edition, Rand McNally, New York
Schoeffler, S (1977) "Cross-sectional study of strategy~ structure and performance :
Aspects of the PIMS program", In Thorelli, H (ed) "Strategy and structure equal performance", Indiana University Press, Bloomington, IN
Seid, M.H ( 1992) "Franchising's changing landscape", Franchising World, 24( 6) PP
8-11
Page 55
Sethi, P (1982) "Up against the corporate wall", Prentice Hall, Englewood Cliffs, Ill
Shelp, R.K ( 1981) "Beyond industrialisation : Ascendancy of the global service
economy", Praeger Publishers, New York
Shrivastava, P (1983) "A typology of organisational learning systems'\ Journal of Management Studies, 20 pp 7-29
Shrivastava, P. (1987) "Rigor and practical usefulness of research in strategic
management", Strategic Management Journal, 8( 5) pp 77-92
Silverman, D (1985) "Qualitative methodology and sociology", Gower Publishing
Company, London
Slattery, P. ( 1983) "Social scientific methodology and hospitality management",
International Journal of Hospitality Management, 2(1) pp 914
Slattery, P; Clarke, A (1988) "Major variables in the corporate structure of hotel
groups", International Journal of Hospitality Management, 7(2) pp 120
Slattery, P; Johnson, S.M (1993) "Hotel chains in Europe", Travel and Tourism Analyst, 1 pp 65-80
Slattery, P; Olsen, M.D (1984) "Hospitality organisations and their environments",
International Journal of Hospitality Management, 3(6) pp 55-61
Stacey, R.D "Strategic management and organisation dynamics", Pitman, London
Stalk, G; Evans, P, Shulman, L.E (1992) "Competing on capabilities : The new rules
of corporate strategy", Harvard Business Review, March-April, pp 57-69
Stata, R (1989) "Organisational learning: the key to management learning", Sloan Management Review 30(3) pp 63-74
Steiner, G (1979) "Contingent theories of strategy and strategic management" , in
Hofer, C.W; Schendel, D.E "Strategic management", Little Brown, New York
Steiner, G.A (1969) "Top management planning", MacMillan, New York
Steiner, P.O (1975) "Mergers. motives, effects. policies", University ofMichigan
Press, Ann Abor, MI
Stokes, C.S; Miller, M.K (1975) "A methodological review of research in rural
sociology since 1965", Rural Sociology, 40(4) pp 21-30
Stone, M (1990) "Marketing strategies for leisure services", Long Range Planning,
23(5) pp 76-90
Stopford, J; Wells, L (1972) "Managing the multinational enterprise", Longmans,
London Stubbart, C (1982) "Are environmental scanning units effective?", Long Range
Planning, 15 pp 139-145
Summer, C.E; Bettis, R.A; Duhaime, I.H; Grant, J.H; Hambrick; D.C; Snow, C.C;
Zeithaml, C.P (1990) "Doctoral education in the field of business policy and
strategy", Journal of Management, 16 pp 361-398
Page 56
Tarrant, C. (1989) "UK hotel industry- market restructuring and the need to respond
to customer demands", Tourism Management, 10(3) pp 187-191
Taylor, S; Edgar, D (1995) "Hospitality Research: The emperors new clothes?",
IAHMS Hospitality Research Conference, Gothenburg, Sweden, October
Teare, R (1989) "The hospitality industry in the 1990's : some critical developments",
Marketing Intelligence and Planning, 7(9) pp 48-49
Teare, R; Armistead, C (1995) "Services management: New directions. new
perspectives", Cassell, London
Teare, R; Boer, A (1991) "Strategic hospitality management: Theory and practice for
the 1990s", Cassell, London, pp 9-33
Teare, R; Olsen, M (1992) "International hospitality management : Corporate strategy
in practice", Pitman Publishing, London
Teece, D.J (1986) "Profiting from technological innovation: Implications for
integration~ collaboration. licensing and public policy", Research Policy, 15
pp 285-305
Terpstra, V (1987) "International marketing" 4th Edition, Dryden Press, New York
Terpstra, V. (1985) "The changing environment of international marketing",
International Marketing Review, Autumn
Thanheiser, H (1972) "Strategy and structure of German enterprise", Unpublished
Doctoral Dissertation, Harvard Business School
Thomas, D (1978) "Strategy is different in service businesses", Harvard Business Review, July/Aug, pp 29-36
Thompson, J.A (1967) "Organisations in action", McGraw Hill, New York
Tilles, S (1963) "How to evaluate corporate strategy" Harvard Business Review, 41( 4)
pp 111-121
Tse, E (1988) "Defining corporate strengths and weaknesses : Is it essential for
successful strategy implementation?", Hospitality Education and Research
Journal, 12(2) pp 76-72
Tse, E (1991) "An empirical analysis of organisational structure and financial
performance in the restaurant industry", International Journal of Hospitality
Management, 10(1) pp 59-72 Tse, E; Olsen, M.D (1988) "The impact of strategy and structure on the organisational
performance of restaurant firms", Hospitality Education and Research
Journal, 12(2) pp 265-276 Turoff, M (1970) "The design of a policy delhpi", Journal of Technological
forecasting and social change, 2, pp 125-137
UKTS (1991) "United Kingdom Tourist Statistics 1990", BTA
ETB/STB/WTB/NITB, London
Page 57
Uysal, M; Crompton, J.L (1984) "Determinants of demand for international tourist
flows to Turkey", Tourism Management, 5(4) December pp 288-297
Veal, A.J (1992) "Research methods for leisure and tourism: a practical guide",
Verdin, P; Williamson, P (1994) "Successful strategy: Stargazing or self
examination", European Management Journal, 12(1), pp 10-19
West, J .J ( 1990) "Strategy. environmental scanning and firm performance : An
integration of content and process in the foodservice industry", Hospitality Research Journal, 14(1) pp 87-100
West, J.J; Olsen, M (1988) "Environmental scanning and its effect upon firm
performance :An exploratory study of the food service industry", Hospitality Education and research Journal, 12(2) pp 127-136
West, J.J; Olsen, M (1989) "Environmental scanning. industry structure and strategy
making : Concepts and research in the hospitality industry", International Journal of Hospitality Management, 8( 4) pp 283-298
White, R.E (1986) "Generic business strategies. organisational context and
performance: An empirical investigation", Strategic Management Journal7 pp 217-231
Williamson, D.E (1975) "Markets and Hierarchies: Analysis and antitrust
implications", Free Press, New York
Williamson, O.E (1979) "Transaction cost economies: The governance of contractual
relations", Journal of Law and Economics, pp 233-261
Williamson, P.J (1992) "Age~ experience and corporate synergy: When are they
sources of business unit advantage ?", British Journal of Management, 3( 4) pp
221-236
Wind, Y; Mahajan, V (1981) "Designing product and business portfolios", Harvard Business Review, 59(2) pp 155-165
Winter, S.E (1987) "Knowledge and competence as strategic assets", In D.Teece
"The competitive challenge : strategies for industrial innovation and renewal"
pp 159-184 Cambridge Bullinger
Wise, B (1993) "Hotel chains in the Asia Pacific Rim", Travel and Tourism Analyst, 4
pp 57-73
Witt, C.A; Witt, S.F (1990) "Appraising an econometric forecasting model", Journal
ofTravel Research, 28(3) pp 30-34
Witt, S.F; Martin, A.M (1987) "International tourism- demand models- inclusion of
marketing variables", Tourism Management, March 8(1) pp 33-40
Wood, R.C (1983) "Theory. management. and hospitality: A response to Philip
Nail on", International Journal of Hospitality Management, 2(2) pp 103-104
Page 58
Woodward, J (1965) "Industrial organisation: Theory and practice", Oxford
University Press, Oxford
Worthington, P .R (1989) "On the distinction between structure and conduct :
adjustment costs~ concentration. and price behaviour", Journal of Industrial Economics, 38(2) pp 235-238
Wren, D.A (1987) "management history: Issues and ideas for teaching and research",
Journal of Management, 13, pp 339-350
Wright, P; Kroll, M; Kedia, B; Pringle, C (1990) "Strategic profiles. market share and
business performance", Industrial Management, 32(3) pp 23-28
Wright, R (1974) "A system for managing diversity", A.D.Little
Wrigley, L (1970) "Divisional autonomy and diversification" Unpublished Doctoral
Dissertation, Harvard Business School
Yelle, L.E (1979) "The learning curve: Historical review and comprehensive survey",
Decision Science, 10 pp 302-328
Page 59

PART II
THE HOSPITALITY ENVIRONMENT 1980-1991
PAaE cHAPTER2
TOURISM IN THE UK 60
cHAPTER3 THE HOTEL INDUSTRY 81
cHAPTER4 THE NATURE OF HOTEL UNITS 105
CHAPTERS SHORT BREAKS -A LOGICAL PROGRESSION 129

CHAPTER TWO
TOURISM IN THE UK
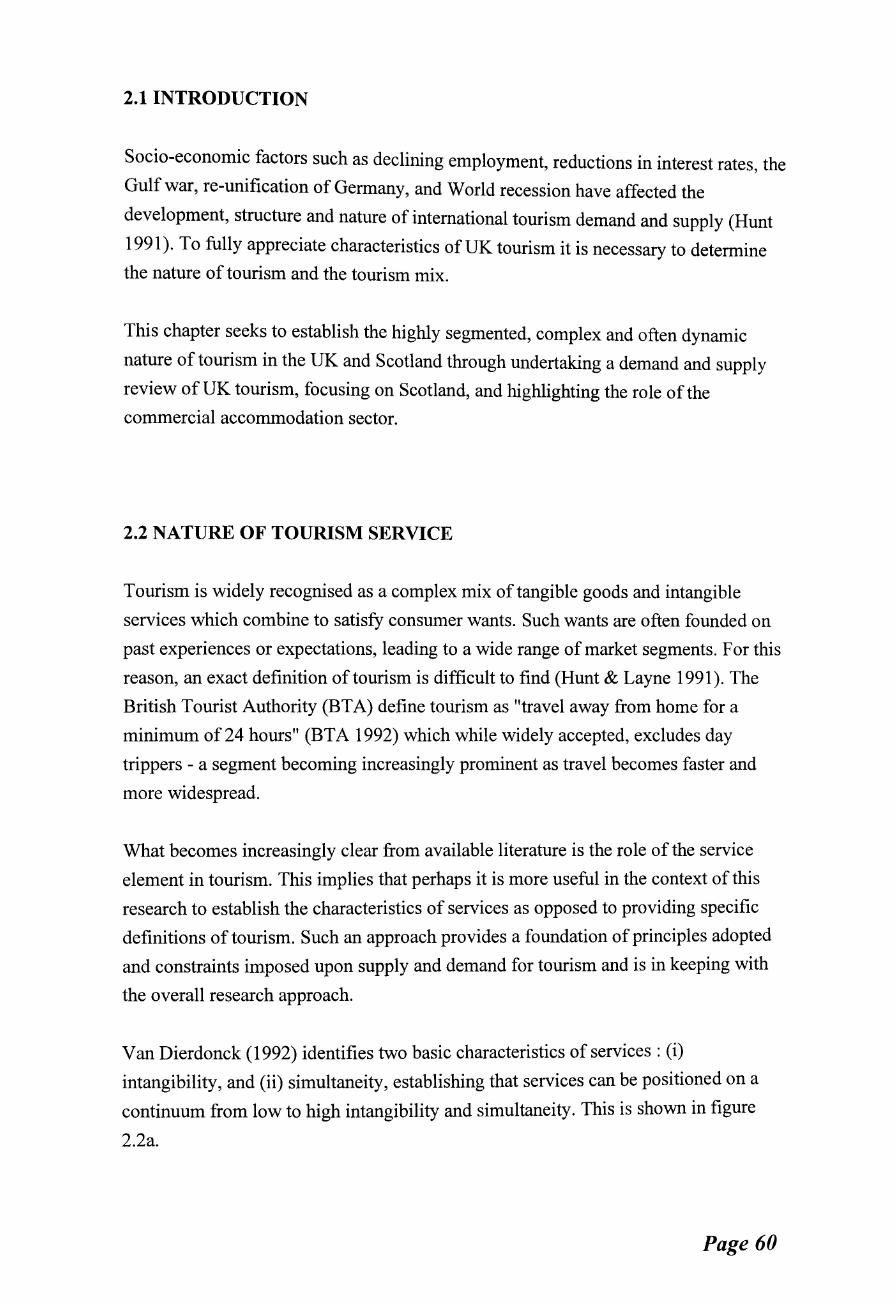
2.1 INTRODUCTION
Socio-economic factors such as declining employment, reductions in interest rates, the
Gulf war, re-unification of Germany, and World recession have affected the
development, structure and nature of international tourism demand and supply (Hunt
1991 ). To fully appreciate characteristics of UK tourism it is necessary to determine
the nature of tourism and the tourism mix.
This chapter seeks to establish the highly segmented, complex and often dynamic
nature of tourism in the UK and Scotland through undertaking a demand and supply
review of UK tourism, focusing on Scotland, and highlighting the role of the
commercial accommodation sector.
2.2 NATURE OF TOURISM SERVICE
Tourism is widely recognised as a complex mix of tangible goods and intangible
services which combine to satisfy consumer wants. Such wants are often founded on
past experiences or expectations, leading to a wide range of market segments. For this
reason, an exact definition of tourism is difficult to find (Hunt & Layne 1991). The
British Tourist Authority (BTA) define tourism as "travel away from home for a
minimum of 24 hours" (BTA 1992) which while widely accepted, excludes day
trippers - a segment becoming increasingly prominent as travel becomes faster and
more widespread.
What becomes increasingly clear from available literature is the role of the service
element in tourism. This implies that perhaps it is more useful in the context of this
research to establish the characteristics of services as opposed to providing specific
definitions of tourism. Such an approach provides a foundation of principles adopted
and constraints imposed upon supply and demand for tourism and is in keeping with
the overall research approach.
Van Dierdonck (1992) identifies two basic characteristics of services : (i)
intangibility, and (ii) simultaneity, establishing that services can be positioned on a
continuum from low to high intangibility and simultaneity. This is shown in figure
2.2a.
Page 60
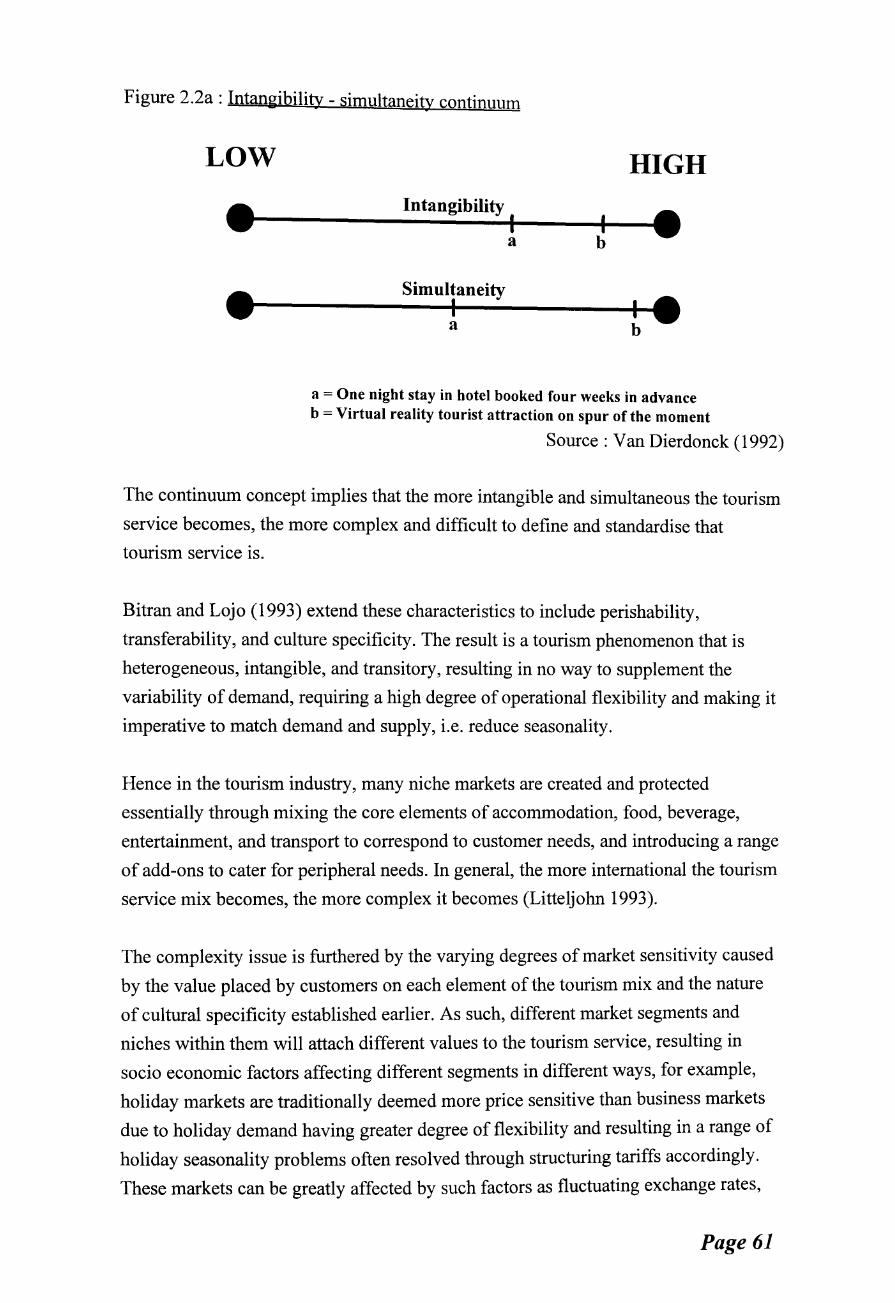
Figure 2.2a: Intangibility- simultaneity continuum
LOW HIGH
• Intangibility
~------~~~~~--+~~· a b
Simultaneity ·~------~~~------~1 •
a b
a = One night stay in hotel booked four weeks in advance b =Virtual reality tourist attraction on spur of the moment
Source: Van Dierdonck (1992)
The continuum concept implies that the more intangible and simultaneous the tourism
service becomes, the more complex and difficult to define and standardise that
tourism service is.
Bitran and Lojo (1993) extend these characteristics to include perishability,
transferability, and culture specificity. The result is a tourism phenomenon that is
heterogeneous, intangible, and transitory, resulting in no way to supplement the
variability of demand, requiring a high degree of operational flexibility and making it
imperative to match demand and supply, i.e. reduce seasonality.
Hence in the tourism industry, many niche markets are created and protected
essentially through mixing the core elements of accommodation, food, beverage,
entertainment, and transport to correspond to customer needs, and introducing a range
of add-ons to cater for peripheral needs. In general, the more international the tourism
service mix becomes, the more complex it becomes (Litteljohn 1993).
The complexity issue is furthered by the varying degrees of market sensitivity caused
by the value placed by customers on each element of the tourism mix and the nature
of cultural specificity established earlier. As such, different market segments and
niches within them will attach different values to the tourism service, resulting in
socio economic factors affecting different segments in different ways, for example,
holiday markets are traditionally deemed more price sensitive than business markets
due to holiday demand having greater degree of flexibility and resulting in a range of
holiday seasonality problems often resolved through structuring tariffs accordingly.
These markets can be greatly affected by such factors as fluctuating exchange rates,
Page 61
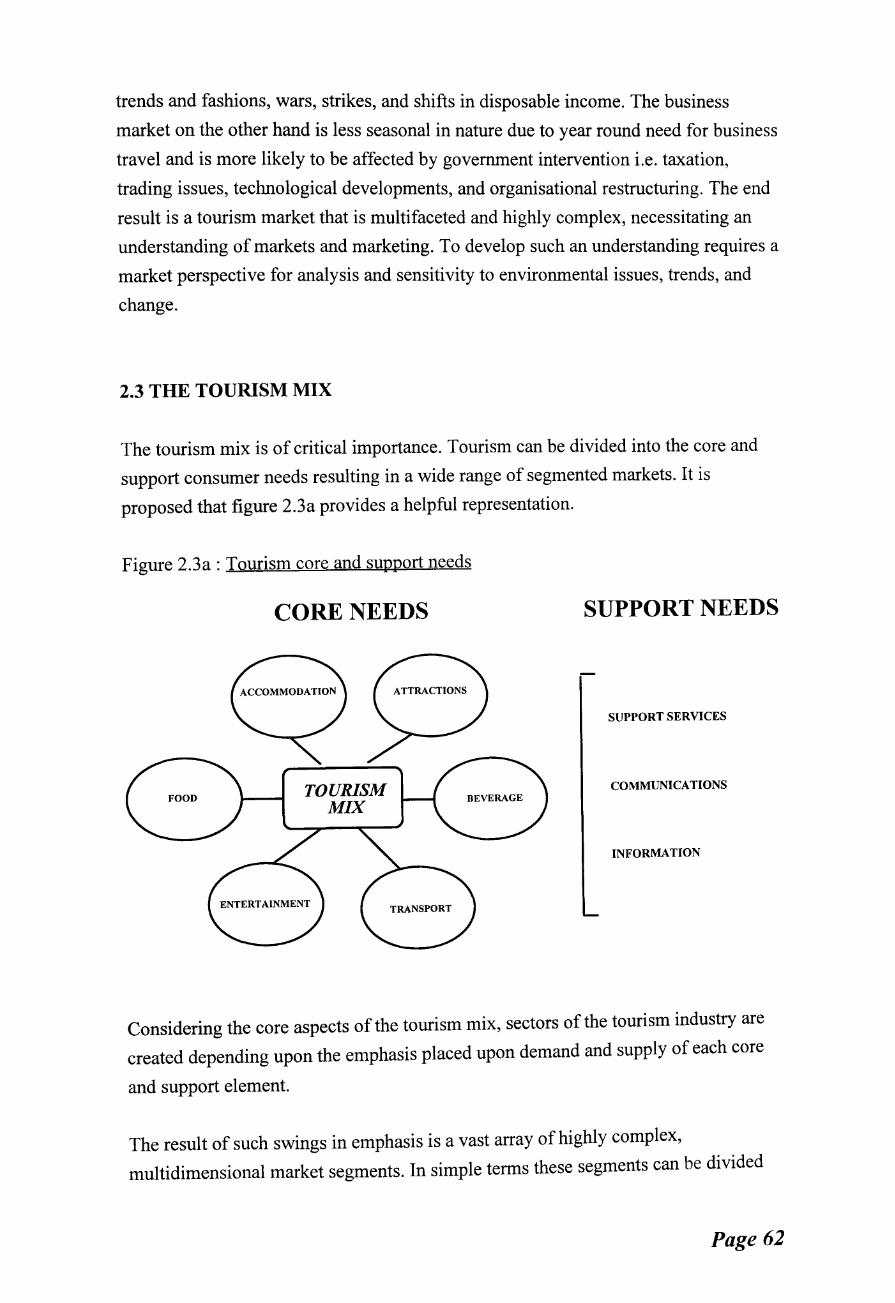
trends and fashions, wars, strikes, and shifts in disposable income. The business
market on the other hand is less seasonal in nature due to year round need for business
travel and is more likely to be affected by government intervention i.e. taxation,
trading issues, technological developments, and organisational restructuring. The end
result is a tourism market that is multifaceted and highly complex, necessitating an
understanding of markets and marketing. To develop such an understanding requires a
market perspective for analysis and sensitivity to environmental issues, trends, and
change.
2.3 THE TOURISM MIX
The tourism mix is of critical importance. Tourism can be divided into the core and
support consumer needs resulting in a wide range of segmented markets. It is
proposed that figure 2.3a provides a helpful representation.
Figure 2.3a: Tourism core and support needs
CORE NEEDS
TOURISM MIX
SUPPORT NEEDS
SUPPORT SERVICES
COMMUNICATIONS
INFORMATION
Considering the core aspects of the tourism mix, sectors of the tourism industry are
created depending upon the emphasis placed upon demand and supply of each core
and support element.
The result of such swings in emphasis is a vast array of highly complex,
multidimensional market segments. In simple terms these segments can be divided
Page 62
into four broad categories : (i) business, (ii) holiday, (iii) VFR (visiting friends and
relatives), and (iv) other, which includes educational trips, exhibitions etc. Each
segment is subject to one of three broad categories of origin segmentation: (a)
domestic markets, (b) inbound international, and (c) outbound international, each
origin being susceptible to different levels of sensitivity and reacting differently to
environmental changes.
If one considers the changing boundaries between market segments and the variety
and accuracy of measurement criteria used in tourism, it is evident that if such
markets are to be researched, focused efforts are required to clarify and simplify units
of analysis. To add to these research problems, there is considerable doubt over the
validity of statistical sources available for analysis - an area examined next.
2.4 STATISTICAL PROBLEMS
There is much debate over the accuracy of tourism statistics (MacKay Consultants
1991, Weber 1991, Reid & Andereck 1989, Lohmann 1991) with areas of most
concern being expressed by Weber (1991), as problems of(i) reliability of statistical
data on tourist flows, expenditure and other characteristics; (ii) general need for
standardisation and comparability of data; (iii) availability of statistical data; and (iv)
research problems due to the nature of tourist decision making process, measurement
characteristics, research instruments analysis, and forecasting methods not adapted to
tourism conditions. These points are reiterated by many researchers both in
conversation and writing and have formed the topic of many research group
discussions. On a domestic level the problems in the UK are essentially due to
changing definitions, methods of data collection and changes to the sample selection.
Probably the most evident of such changes has been the move from the British
Tourism Survey (BTS) to the UK Tourism Survey (UKTS) research base in 1989 and
previously, alterations to data collection methods in 1986. Add to this the range of
statistical sources, which are often not comparable i.e. tourist boards; local enterprise
companies; government publications; market research companies; market analysts
etc., and the problems of selecting and utilising data are amplified.
These difficulties are made considerably worse when the international dimension is
introduced, every country having a range of, or no statistics available, different
Page 63

sample sizes, frequencies, measurement techniques, and levels of accessibility. The
task of comparing such statistics is nearly impossible.
These issues, combined with the huge cost of conducting a valid sample survey of
demand, imply a need for caution when adopting statistical sources.
This research adopts a supply side approach to obtaining primary market and
company data. Such an approach allows greater confidence in results and accepts
supply led dynamics to market development - allowing an element of proactive
response. Simultaneously secondary data is adopted as a control frame, to attempt to
compare the findings of a number of studies and establish short break background
data. To provide general background information as to the nature of UK and Scotland
tourism markets, UKTS data is adopted.
The UKTS is produced by the national tourist boards in association with NOP Travel
and Leisure of MAl Research Limited, London, and presents statistical information
on the volume and value of tourism undertaken by the resident population of the UK.
Each month, personal interviews are conducted with a random sample of UK adults
aged 15+, resulting in a total of 82,125 interviews which are computer weighted to a
constant profile. (UKTS 1991 ).
Data is split into TRIPS, "at least one night away from home, and no more than 60
nights", NIGHTS, "number of nights spent away from home on tourism trips", and
SPEND, "expenditure incurred on all tourism trips away from home by all persons on
all nights". Additionally, data is provided on a range of dimensions from purpose of
trips to mode of transport, time of year, and accommodation used. As this provides a
UK perspective of tourism demand, to allow some indication of the value of tourism
entering and leaving the UK i.e. inbound and outbound tourism, figures from the
International Passenger Survey (IPS) are used.
While these surveys are by no means comprehensive they do represent the two most
regular and respected sources available in the UK. They allow confirmation and
comparison of data with other less regular surveys to provide an indication of the UK
tourism demand and supply structures. They do however impose a number of
implications upon the nature and development of the research.
Page 64
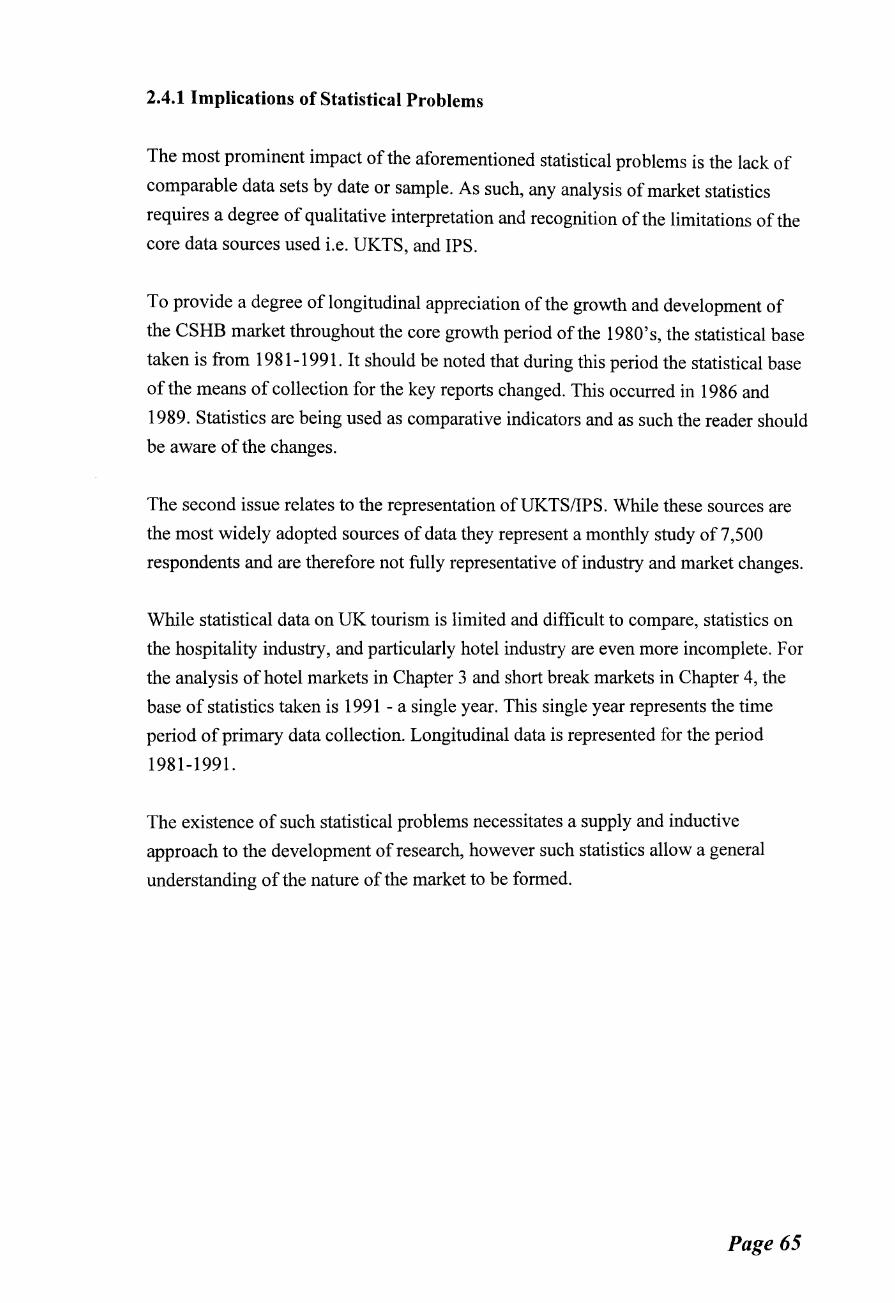
2.4.1 Implications of Statistical Problems
The most prominent impact of the aforementioned statistical problems is the lack of
comparable data sets by date or sample. As such, any analysis of market statistics
requires a degree of qualitative interpretation and recognition of the limitations of the
core data sources used i.e. UKTS, and IPS.
To provide a degree of longitudinal appreciation ofthe growth and development of
the CSHB market throughout the core growth period of the 1980's, the statistical base
taken is from 19 81-1991. It should be noted that during this period the statistical base
of the means of collection for the key reports changed. This occurred in 1986 and
1989. Statistics are being used as comparative indicators and as such the reader should
be aware of the changes.
The second issue relates to the representation ofUKTS/IPS. While these sources are
the most widely adopted sources of data they represent a monthly study of 7,500
respondents and are therefore not fully representative of industry and market changes.
While statistical data on UK tourism is limited and difficult to compare, statistics on
the hospitality industry, and particularly hotel industry are even more incomplete. For
the analysis of hotel markets in Chapter 3 and short break markets in Chapter 4, the
base of statistics taken is 1991 - a single year. This single year represents the time
period of primary data collection. Longitudinal data is represented for the period
1981-1991.
The existence of such statistical problems necessitates a supply and inductive
approach to the development of research, however such statistics allow a general
understanding of the nature of the market to be formed.
Page 65

2.5 NATURE OF TOURISM DEMAND
The nature of tourism (2.2) and the tourism mix (2.3) sections identified the
foundations of a highly segmented and complex tourism environment. In attempting
to simplify the environment to allow analysis, statistics from the UKTS were adopted.
This section seeks to provide a background to the value and volume of various
segments of tourism to the UK and Scottish economy. Following an overview of the
value of tourism to the UK, the broad segments of tourism, as identified in 2.3 are
examined.
2.5.1 UK Tourism
Tourism is of key value to the UK economy, representing 4.8% GDP in 1991
(£22,645 million)(ETB 1993, CSO 1991). These figures represent front line value i.e.
directly attributable to the tourism industry. In addition consideration of
supplementary spend should be made i.e. the spend by the tourist in local amenities,
transport, communication etc. Tourism is therefore a major contribution to the UK
economy.
Such wealth can be generated from within the country through domestic tourism, or
from outwith the country, from inbound international tourism. Figure 2.5.1a shows
the growth of trips and nights of inbound tourism to the UK from 1981 to 1991.
Figure 2.5.1b indicates the growth in monetary terms of tourism to the UK. Both
figures indicate reductions in tourism activity in 1986 and 1991. Such developments
are probably the result of threats of terrorism and the Gulf War, and indicate a
slowing of growth due to exchange rate changes and the world recession, highlighting
the susceptibility of tourism markets to changes in the environment.
Page 66
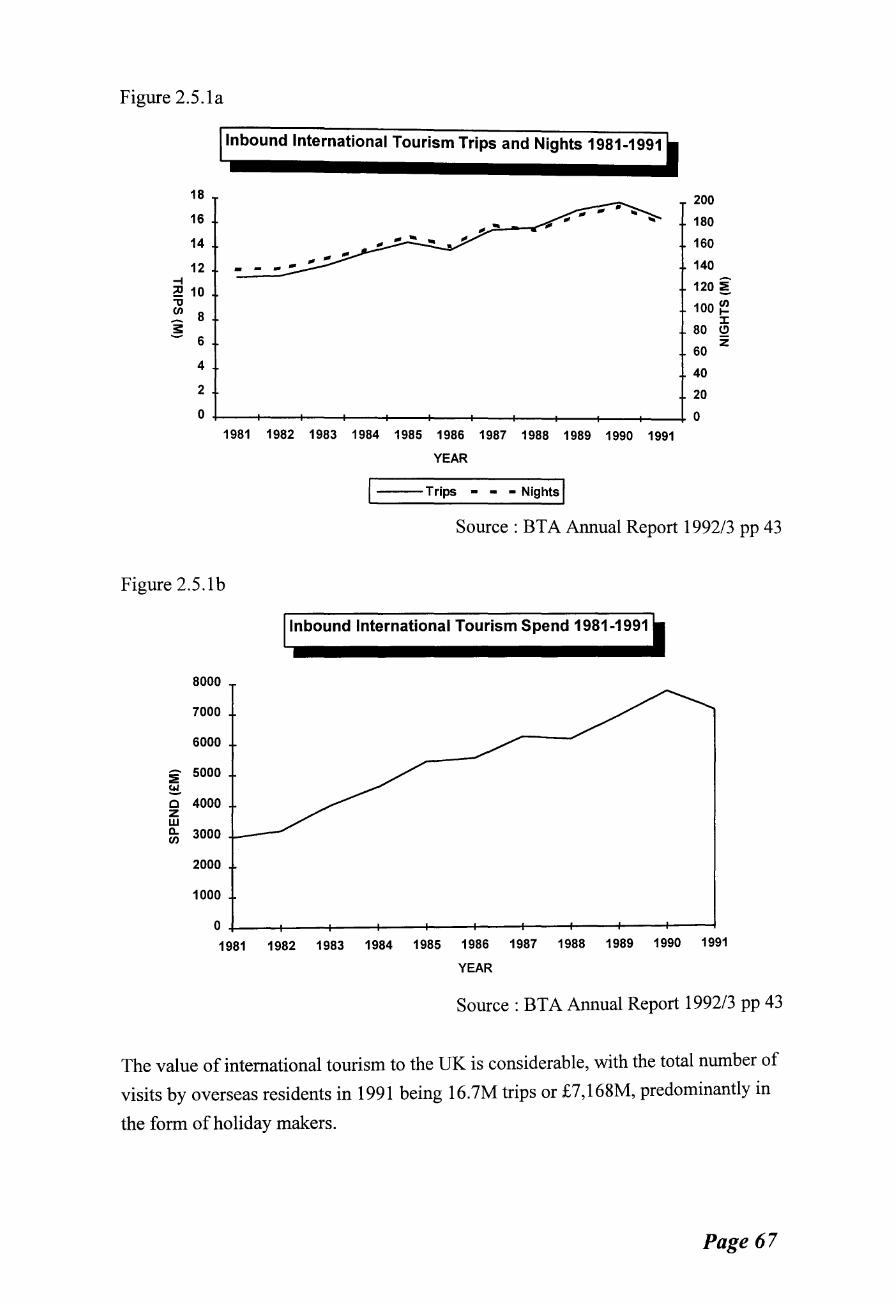
Figure 2.5.1a
Inbound International Tourism Trips and Nights 1981-1991
18
16
14
12 -1 ~ 10
200
180
160
140
120 ~ 100 ~ "tt
en 8 -~
6
4
2
0
J: 80 ~
z 60
40
20
~--~~---+---+--~--~--+---~~---+--~0 1981 1982 1983 1984 1985 1986 1987 1988 1989 1990 1991
YEAR
---Trips • • • Nights I Source: BTA Annual Report 1992/3 pp 43
Figure 2.5.1b
8000
7000
6000
S? 5000 ~ 0 4000 z w c.. 3000 UJ
2000
1000
0
1981
Inbound International Tourism Spend 1981-1991
1982 1983 1984 1985 1986 1987 1988 1989 1990 1991
YEAR
Source: BTA Annual Report 1992/3 pp 43
The value of international tourism to the UK is considerable, with the total number of
visits by overseas residents in 1991 being 16.7M trips or £7,168M, predominantly in
the form of holiday makers.
Page 67

However, considering the value of tourism leaving the UK. Visits abroad by UK
residents totalled 30.8M trips, and £9,951M spend, resulting in a balance of payments
deficit on travel of (£2,565M) (IPS 1994). This is worrying for the UK tourism sector
as domestic tourism shrinks in real terms (CHK 1991), a case worsening in 1992 and
resulting in increasing competition between UK based tourism suppliers. e.g. hotels.
Focusing on the domestic market. In 1991 UK families are estimated to have taken
more than 94.4M trips, lasting for a total of 395.6M nights and incurring expenditure
of £10,470M (UKTS 1991). While such an holistic view of domestic tourism provides
an indication of overall volume and value. To determine the structure of market
demand, it is useful to adopt a segmentation approach, identifying areas of the market
by purpose of visit and location i.e. Scotland.
Segmentation can be undertaken in a number of ways, as established in section 2.4.
For the purposes of this section, segments are examined by the purpose of tourism.
These segments are therefore holiday, business, VFR and other purpose. The volume
and value of each segment in 1991 is shown in table 2.5.1a.
Table 2.5.1a: Volume and value ofUK tourism segments 1991
TRIPS NIGHTS SPEND
M % M % M(£) %
All Tourism in UK 94.4 100 395.6 100 10470 100
All Holidays 58.3 62 295.9 75 7750 74
Holiday 1-3 Nights 26.1 28 53.8 14 1740 17
Holiday 4 +Nights 32.2 34 242.1 61 6010 57
Business 10.2 11 26.7 7 1440 14
V.F.R 20.8 22 55.6 14 820 8
Other Purpose 5.1 5 17.4 4 460 4
Source : UKTS 1991
(i) Holidays
Holidays are split into two distinct segments : holidays of 1-3 nights, and holidays of
4 or more nights. Such segments are commonly termed short and long holidays
respectively. Each type ofholiday has subtle differences.
Page 68

Long holidays tend to be more valuable in terms of volume and spend, having a
greater propensity to stay in commercial accommodation and booking well in
advance, yet displaying highly seasonal tendencies in terms of destination of holiday
and time oftravel (UKTS 1991, Beioley 1991).
Short holidays; on the other hand, tend to be of a more spontaneous nature, less
seasonal, and higher spend per night, often characterised by the higher income groups
and representing the additional holiday market (UKTS 1991).
The result of these trends is that the traditional two week holiday at seaside, country,
or touring has shrunk, some operators estimate by a third since 1980 (Hoseasons
1992). The trend towards such additional holiday taking is highlighted by Goulding
(1992) who shows that the number of households taking more than one holiday per
year has been increasing marginally over the past twenty years, the proportion of
adults taking two or more holidays per annum having increased by around 15%. Such
changes are essentially due to structural changes in the UK economy, i.e. leisure time,
disposable income, and general socio-economic factors (Middleton 1987), and are
likely to influence supplier patterns in UK tourism.
Combined with these characteristics is the range and diversity of holiday types,
ranging from activity holidays to cultural breaks and from the much publicised growth
of package holidays (Ryan 1991, Heape 1987) to the newly recognised need for
flexibility in holiday provision. The overall result is a holiday market that reflects the
complexities and characteristics of the overall tourism industry and provides a myriad
of complexities and segments of its own, often closely linked to and susceptible to
environmental changes.
(ii) Business Markets
As with holiday markets, a range of segments are identified within the business
market, including conferences, transient business, training sessions, and incentive
travel. This market represents another dimension to the increasingly complex nature
of the tourism mix. For the purposes of this section a holistic approach is taken and
the term business markets is used to include the full range of business segments.
Business markets are a distinct market segment. The business tourist is likely to be a
25-45 year old professional, travelling all year round, independently, booking on the
spur of the moment and staying in a hotel, usually for 1-3 nights (Hanks et al 1992).
In attempts to model the dynamics of this market, Slattery (1990) introduced the
Page 69
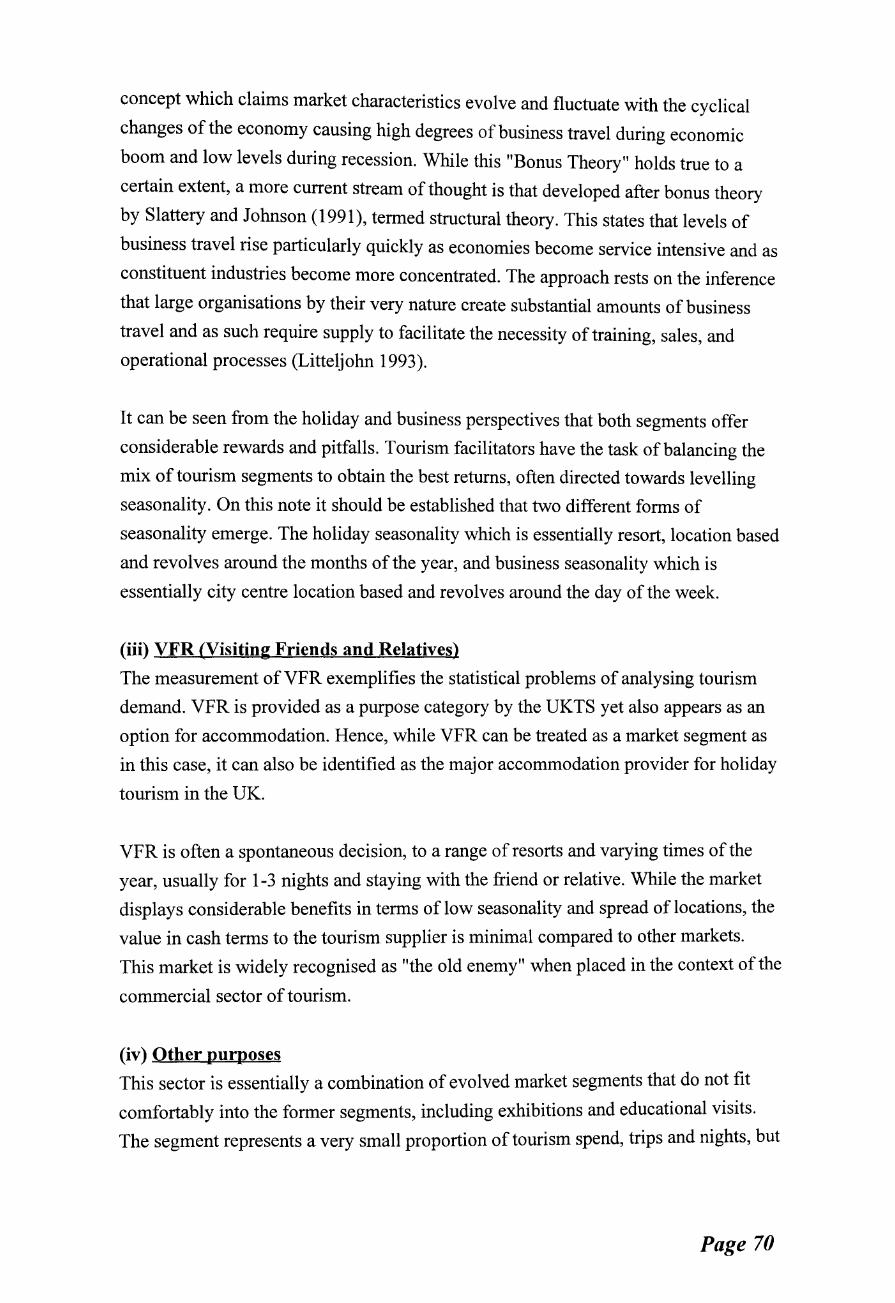
concept which claims market characteristics evolve and fluctuate with the cyclical
changes of the economy causing high degrees of business travel during economic
boom and low levels during recession. While this "Bonus Theory" holds true to a
certain extent, a more current stream of thought is that developed after bonus theory
by Slattery and Johnson (1991), termed structural theory. This states that levels of
business travel rise particularly quickly as economies become service intensive and as
constituent industries become more concentrated. The approach rests on the inference
that large organisations by their very nature create substantial amounts of business
travel and as such require supply to facilitate the necessity of training, sales, and
operational processes (Litteljohn 1993).
It can be seen from the holiday and business perspectives that both segments offer
considerable rewards and pitfalls. Tourism facilitators have the task of balancing the
mix of tourism segments to obtain the best returns, often directed towards levelling
seasonality. On this note it should be established that two different forms of
seasonality emerge. The holiday seasonality which is essentially resort, location based
and revolves around the months of the year, and business seasonality which is
essentially city centre location based and revolves around the day of the week.
(iii) VFR (Visiting Friends and Relatives)
The measurement ofVFR exemplifies the statistical problems of analysing tourism
demand. VFR is provided as a purpose category by the UKTS yet also appears as an
option for accommodation. Hence, while VFR can be treated as a market segment as
in this case, it can also be identified as the major accommodation provider for holiday
tourism in the UK.
VFR is often a spontaneous decision, to a range of resorts and varying times of the
year, usually for 1-3 nights and staying with the friend or relative. While the market
displays considerable benefits in terms of low seasonality and spread of locations, the
value in cash terms to the tourism supplier is minimal compared to other markets.
This market is widely recognised as "the old enemy" when placed in the context of the
commercial sector of tourism.
(iv) Other purposes
This sector is essentially a combination of evolved market segments that do not fit
comfortably into the former segments, including exhibitions and educational visits.
The segment represents a very small proportion of tourism spend, trips and nights, but
Page 70
has been included to emphasise the vast degree of segmentation occurring in tourism
markets and the resulting complexity.
Having established the broad market segments of UK tourism by purpose, the next
section establishes the place of tourism within the Scottish economy. The study
focuses on Scotland as a sample base due to a combination of STB funding
commitments, containing the sample area but more so, due to the value of CSHB to
the Scottish economy. Scotland thus becomes the geographic dimension for the
research and influences the sample selection, and necessitates an understanding of the
background environment.
2.5.2 Scotland Tourism
"Tourism is key to the Scottish economy" (Litteljohn & Goulding 1994). In 1991
tourism in Scotland generated £ 1190M from domestic sources, approximately 9% of
GDP (Ibid 1994) and accounting for 171, 000 jobs, 8% of Scottish employment (STB
1994).
British tourism trips in Scotland in 1991 accounted for 68% of all tourism expenditure
in Scotland, 65% of which came from England (figure 2.5.2a). Inbound international
tourism to Scotland in 1991 represented 1.6M visits and £50 1M (figure 2.5.2b).
Figure 2.5.2a
1.8
1.6
1.4
-1 1.2 :;o
1 =ij CJ)
0.8 -3: 0.6 -0.4
0.2
0
Inbound International Tourism Trips and Nights : Scotland 1981-1991
-~ -~ .. .. .. ---• - • • ---
1981 1982 1983 1984 1985 1986 1987 1988 1989 1990 1991
YEAR
--Trips • • • Nights I
18
16
14
12 ~ 10 en
1-8 :X:
(!)
6 z 4
2
0
Source : IPS/Equiv (1981-1991)
Page 71
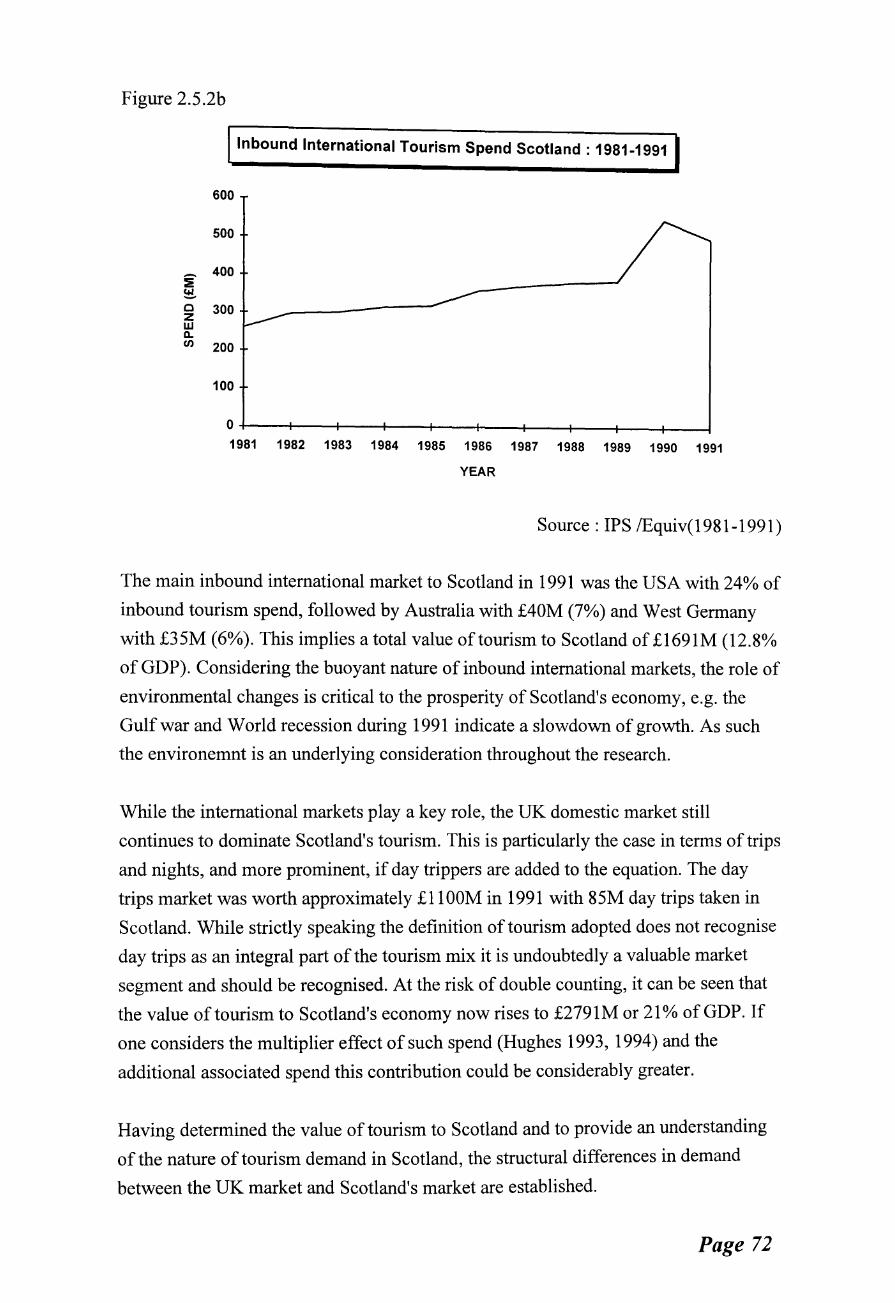
Figure 2.5.2b
~ c..l -0 z w a. Cl)
I Inbound International Tourism Spend Scotland : 1981-1991
600
500
400
300
200
100
0+---~---+--~----~--~--~---+--~----~~ 1981 1982 1983 1984 1985 1986 1987 1988 1989 1990 1991
YEAR
Source : IPS /Equiv(1981-1991)
The main inbound international market to Scotland in 1991 was the USA with 24% of
inbound tourism spend, followed by Australia with £40M (7%) and West Germany
with £35M (6%). This implies a total value of tourism to Scotland of £1691M (12.8%
of GDP). Considering the buoyant nature of inbound international markets, the role of
environmental changes is critical to the prosperity of Scotland's economy, e.g. the
Gulf war and World recession during 1991 indicate a slowdown of growth. As such
the environemnt is an underlying consideration throughout the research.
While the international markets play a key role, the UK domestic market still
continues to dominate Scotland's tourism. This is particularly the case in terms of trips
and nights, and more prominent, if day trippers are added to the equation. The day
trips market was worth approximately £1100M in 1991 with 85M day trips taken in
Scotland. While strictly speaking the definition of tourism adopted does not recognise
day trips as an integral part of the tourism mix it is undoubtedly a valuable market
segment and should be recognised. At the risk of double counting, it can be seen that
the value of tourism to Scotland's economy now rises to £2791M or 21% of GDP. If
one considers the multiplier effect of such spend (Hughes 1993, 1994) and the
additional associated spend this contribution could be considerably greater.
Having determined the value of tourism to Scotland and to provide an understanding
of the nature of tourism demand in Scotland, the structural differences in demand
between the UK market and Scotland's market are established.
Page 72
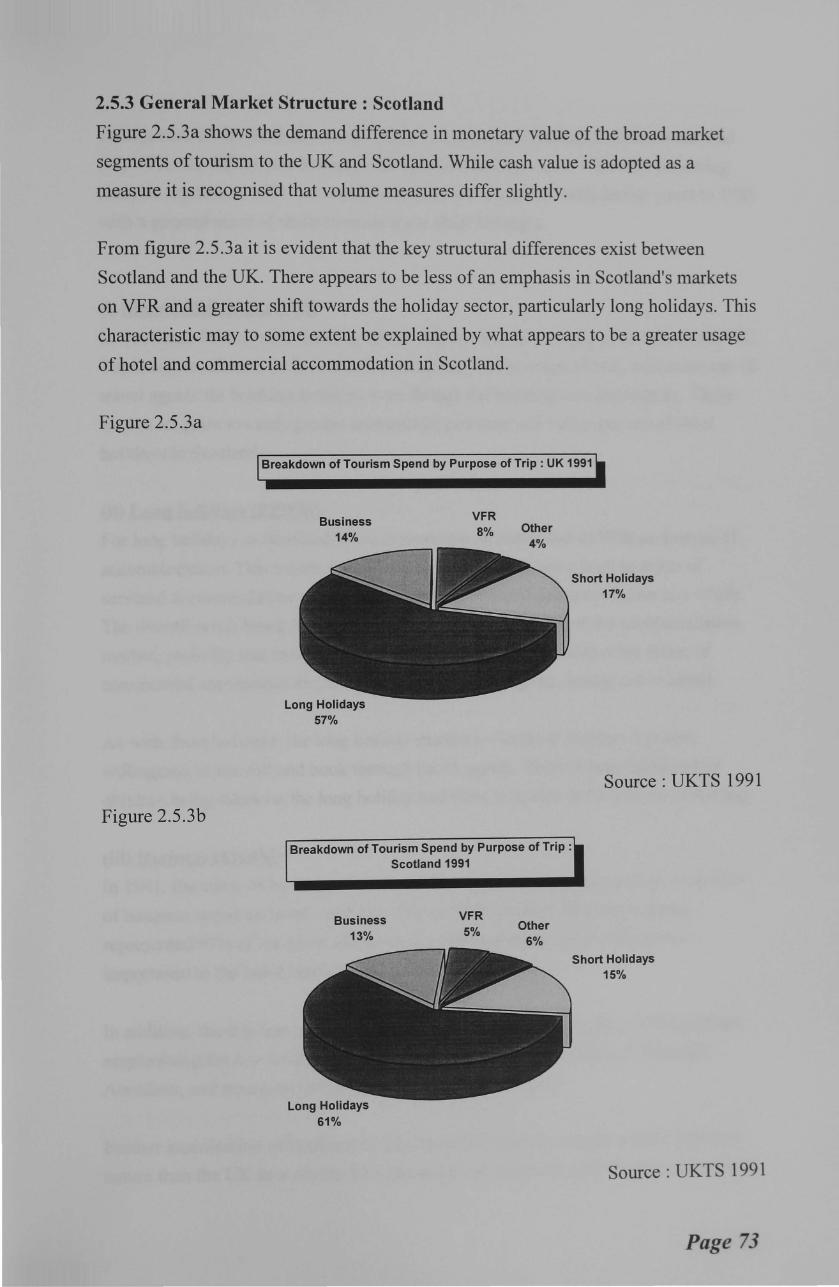
2.5.3 General Market Structure : Scotland
Figure 2.5 .3a shows the demand difference in monetary value of the broad market
segments of tourism to the UK and Scotland. While cash value is adopted as a
measure it is recognised that volume measures differ slightly.
From figure 2.5.3a it is evident that the key structural differences exist between
Scotland and the UK. There appears to be less of an emphasis in Scotland's markets
on VFR and a greater shift towards the holiday sector, particularly long holidays. This
characteristic may to some extent be explained by what appears to be a greater usage
of hotel and commercial accommodation in Scotland.
Figure 2.5.3a
Figure 2.5.3b
Breakdown of Tourism Spend by Purpose of Trip : UK 1991
Business 14%
Long Holidays 57%
VFR S% Other
4%
Breakdown of Tourism Spend by Purpose of Trip :
Business 13%
Long Holidays 61%
Scotland 1991
VFR 5% Other
6%
Short Holidays 17%
Source : UKTS 1991
Short Holidays 15%
Source : UKTS 1991
Page 73

Taking each of the three key broad market segments, (i) holidays, (ii) business, and
(iii) VFR, the differences between UK and Scotland are clear. While the following
analysis represents 1991, the trends identified are consistent with earlier years to 1981
with a general trend of shifts towards more short holidays.
(i) Short holidays (£175M)
In Scotland, 53% of short holiday takers will use a hotel, compared to 43% in the UK.
There is less reliance on the car and considerably more usage of rail, with more use of
travel agents for booking holidays even though the bookings are last minute. These
factors all point towards greater commercial potential and value (per se) of short
holidays in Scotland.
(ii) Long holidays (£725M)
For long holidays in Scotland, there is more use of hotels and ofVFR as sources of
accommodation. This results in the long holiday market being high in terms of
serviced accommodation yet lower in using commercial accommodation as a whole.
The overall result being hotels maintain a considerable share of the accommodation
market, probably due to the structure of supply in Scotland, with other forms of
commercial accommodation i.e. caravan sites, camping etc., losing out to hotels.
As with short holidays, the long holiday market to Scotland displays a greater
willingness to use rail and book through travel agents. There is less likelihood of
children being taken on the long holiday and there is double the incidence of touring.
(iii) Business (£160M)
In 1991, the value of business travel to hotels in Scotland was paramount, with 85%
of business spend on hotels, and only 2% on VFR. In total, business markets
represented 91% of spend on all serviced accommodation, emphasising their
importance to the hotel business and Scotland as a whole.
In addition, there is less use ofthe car (34%), and more use of plane (49o/o) perhaps
emphasising the key locations in Scotland for business of Glasgow, Edinburgh,
Aberdeen, and emerging Dundee all with their own airports.
Further examination of Scotland's business travel markets, reveals a more seasonal
nature than the UK as a whole. This has major implications upon the two main forms
Page 74

of supply - airports, and hotels, and with further emerging competition from purpose
built conference centres represents an area warranting further investigation as a
separate study.
(iv) VFR (£55M)
There is little difference in the VFR markets between Scotland and the UK '
essentially using the same forms of accommodation. The main difference appears to
be the mode of transport with the train being used more in Scotland, more likelihood
of booking via a travel agent, and the stay is likely to be considerably longer at over
18 nights.
1.5.4 Summary of Key Elements
The overall pattern of holiday making has become much more complex during recent
years, and will become increasingly complex into the 1990's (Euromonitor 1987),
with the tourism mix being the key element to understanding the nature of tourism's
segmented markets.
To allow the environment to be simplified and therefore analysed, the focus of this
research is on Scotland's tourism market. In providing such focus, it has been
necessary to distinguishing between UK and Scotland demand traits. It became
evident that tourism in Scotland varies from that of the UK in a number of key areas.
(i) there is a greater emphasis in Scotland on commercial and serviced
accommodation, particularly hotels.
(ii) there is a greater willingness or perhaps need to use public transport and as
such there are a number of environmental issues associated with such
transport, i.e. rail strikes, terrorism, etc. Transport being potentially
environmental sensitive may therefore have a knock on effect on
Scotland's tourism, particularly international inbound tourism.
(iii) perhaps due to the touring factor in Scotland, the destinations i.e. resort,
city centres etc. tend to be less seasonal than the UK as a whole.
This section has examined the differences between tourism in the UK and Scotland in
an attempt to provide a contextual grounding for the research. This grounding can be
Page 75
expanded in later chapters to provide a research definition of commercial short
holiday breaks (CSHB) and focus on the key market characteristics.
Having examined the demand side of tourism in the UK and Scotland the next section
provides an indication of supply before Chapter 3 focuses on the hotel industry supply in more detail.
2.6 NATURE OF TOURISM SUPPLY
As tourism demand can be characterised by highly segmented and complex markets, tourism
supply can also be seen as complex in that it must satisfy the wants of the demand segments,
often attempting to understand, mix and match segments. The result is a supply that is both
fragmented and multi-variant in nature i.e. as different elements of the tourism mix are
satisfied by different elements of supply, the varying emphasis on provision to any core
element will result in a range of supply structures.
Take for example a holiday camp and a city centre hotel, while both provide the same
core elements, the mix of tourism provision is different and essentially differentiated
through perceived elements such as value for money, quality, status etc. This
provision or supply developed to satisfy the tourist need can be termed the touristic
infrastructure and can essentially be found on two levels, (i) Primary supply, and (ii)
Supplementary supply.
2.6.1 Primary Supply
This term relates to the core elements of supply. Included in this category would be
(a) accommodation, (b) food, covering restaurants of all kinds, (c) beverage including
bars, clubs, cafes, wine bars, etc. (d) retail and distribution, including travel agents,
and tour operators, (e) transport, ranging from rail, road, air, and sea and (f)
entertainment including attractions, clubs, museums, etc. All these forms of supply
will in some way be integrated depending upon the demands of the consumer and as
such evolve differing levels of service, cost, intangibility, continuity and customer
intimacy.
2.6.2 Supplementary Supply
In this context, supplementary supply represents the provision of additional goods or
services the consumer may desire and are often not counted in the value of the tourist.
These would include generation of wealth at local level in terms of sign painting,
landscaping, local shops and stores, roads and building maintenance etc. and as such
Page 76
add a totally new dimension to the concept of tourism supply. This increases
complexity of understanding and analysis, giving rise to the need to appreciate all the
elements of tourism supply and to focus on those elements most accessible and
accurately measured, essentially the front line supply, and particularly the
accommodation sector which by tourism definition is a common element.
2.6.3 Changing Touristic Infrastructure
The touristic infrastructure (supply) in the UK and Scotland is changing. Expanding
domestic and international markets for tourism services have stimulated growth,
competition, and product innovation (Teare 1989). This has resulted in closer
integration of the core elements of the tourism mix as firms seek to identify core and
peripheral markets for their products more precisely. The outcome of these activities
and the intensification of competition, has resulted in an emphasis on product
branding (Connell 1992) and more focus on globalisation and international trade
(Teare 1989, Beattie 1993). The result, is a highly segmented, complex and
fragmented market with segments maturing and developing at different rates and
suppliers attempting to obtain the best mix of these segments either in an ad hoc
manner or to a predetermined plan.
It is the research of such supplier developments that offers considerable potential for
contributions to knowledge.
2.6.4 A Summary of Key Elements of Supply
Considering both forms of supply, it can be seen that the complexities of segmented
markets make analysis considerably difficult, however the prominence of the hotel as
a key element in tourism supply and demand is obvious. This would imply that the
hotel industry is a valuable base for market analysis. This argument is strengthened if
one considers that hotels, especially full service hotels, will often offer a wide range
of services to cater for a range of guest requirements (Chanrasekar & Dev 1989) using
a range of strategies to maximise guest satisfaction, e.g. joint ventures with local
attractions. Chapter 3 provides an overview of the hotel industry in the UK and
Scotland, highlighting key characteristics and establishing the additional complexities
of adding non-residentiallocal markets to the tourism mix.
Page 77
2.7 CHAPTER SUMMARY
This chapter has provided a foundation to the background of tourism markets in the
UK and Scotland. Focus has been on demand with key elements of supply being
highlighted. It has established that despite its immense value to the UK economy,
tourism in general is difficult to define, requiring an understanding of the nature of the
market as opposed to specific definitions.
·Demand appears to be highly segmented and therefore complex. The changing nature
of the elements of the tourism mix and the dynamic nature of the socio-economic
environment have considerable multiplier effects, making some segments more
sensitive than others to a range of issues.
It has been established that for convenience and analysis, tourism demand can be
divided into four broad categories (i) holidays (ii) business, (iii) VFR and (iv) other
purposes. Each segment has distinct characteristics which vary between locations,
seasons, days of the week and even within segments or sub-segments.
From the supply side, the touristic infrastructure is fragmented and often value created
is not directly attributed to tourism. The key form of supply is the hotel where
suppliers will attempt to accommodate a combination of tourism segments to
minimise seasonality.
In conclusion, it can be seen that tourism in the UK and Scotland is highly complex
and requires considerable focus to allow market analysis. Such focus may be location
based, market based, or supplier based. This research represents a focus on Scotland,
hotel supply and CSHB markets. As hotels represent the most evident market
supplier, the next chapter examines the nature of the hotel industry in the UK and
Scotland. Chapter 4 then focuses on the characteristics of the individual hotel at
market level and establishing how such characteristics link to the development of the
short break market outlined in Chapter 5. The result is a focus on both the hotel
industry and the location of Scotland to construct an approach and model applicable
to a range of complex markets and locations.
Page 78

REFERENCES
Beattie, R (1993) "Internationalisation trends in the European hospitality industry",
MPhil. Thesis Napier University
Beioley, S (1991) "Short Holidays", Insights, ETBIBTA, September, B29-B38
Bitran, G.R; Lojo, M (1993) "A framework for analyzing service operations",
European Management Journal, 11(3) September pp 271-282
BTA (1992) "Annual report 1992/3 ", British Tourist Authority London
Connell, J ( 1992) "Branding hotel portfolios", International Journal of Hospitality Management, 4(1) pp 26-32
Davidson, R (1989) "Tourism", Pitman London pp 1-25
ETB ( 1993) "Tourism by UK residents in 1992", Insights September F 11-F 17
Euromonitor (1987) "Short break holidays", Market Research Great Britain,
Euromonitor Publ. 26 April
Goulding, P (1992) "Britain's leisure industry", Jordan & Son Ltd, pp 23-31
Heape, R (1987) "Inclusive tours - an untapped market", Tourism Management, June pp 169-170
Hoseasons (1992) "Holiday Survey", Travel GEL No. 164 June pp 6
Hunt, J (1991) "Prospects for international tourism 1992", EIUTravel & Tourism Analyst, 6 pp 77-93
Hunt, J.D; Layne, D. (1991) "Evolution of Travel and Tourism Terminology and
Definitions", Journal ofTravel Research, 29(4) pp 7-11
IPS (1994) "International Tourism to the UK", Insights January BTA pp F27-F31
Jafari, J (1987) "Tourism models: the socio-cultural aspects", Tourism Management, June pp 151-159
Litteljohn, D.L (1993) in "The international hospitality industry : organisation and
operation issues", Editors Jones, P & Pizam, A. Pitman London pp 87
Litteljohn, D.L; Goulding, P (1994) "International tourism reports : Scotland", EIU Travel and Tourism, 2 pp 62-81
Lohmann, M (1991) "Evolution of short breaks", The Tourist Review, 2 pp 14-22
MacKay Consultants (1991) "Tourism commentary: The mythical boom", MacKay
Consultants, Inverness October
Middleton, V.T.C (1987) "Marketing holidays to Wales- responding to market
changes", The Tourist Review 2 pp 27-30
Reid, L.J; Andereck, K.L (1989) "Statistical analyses use in Tourism Research",
Journal ofTravel Research, Fall pp 21-24
Ryan, C (1991) "UK package holiday industry", Tourism Management, March PP
76-77
Page 79
Smith, C.J (1987) "Developments in the European inclusive travel business",
Tourism Management, June pp 160-163
Teare, R (1989) "The hospitality industry in the 1990's : some critical developments".
Marketing Intelligence and Planning, 7(9) pp 48-49
UKTS (1991) "UK Tourist Statistics 1991 ", ETB I STB I WTB I NITB London
Van Dierdonck, R (1992) "Success strategies in a service economy", European Management Journal, 10(3) September pp 365-373
Weber, S (1991) "Problem areas and sources of errors in tourism demand research",
The Tourist Review, 3 pp 18-22
Page 80

CHAPTER THREE
THE HOTEL INDUSTRY INTHEUK
3.1 INTRODUCTION
This chapter establishes the value and structure of the hotel industry in the UK and
Scotland. A macro hospitality approach is adopted, determining the nature of demand
and supply within the hotel industry and the changing nature of ownership, product
mix, hotel group concentration, and the need to appreciate the multi-site nature of
hotels through focus at unit level.
3.2 THE VALUE OF THE HOTEL INDUSTRY
The value and growth of tourism in the UK has been established. A key segment of
tourism supply is the accommodation sector, or more precisely the hotel industry. The
Central Statistics Office (CSO 1990) estimated that total hotel turnover in the UK in
1990 was £6.2bn, 1.3% ofGDP, while Walker (1993) values the hotel sector at
£12bn, 2.5% ofGDP. This, combined with the 241,900 (23% of all tourism
employment) employed within the industry emphasises the importance of hotels to the
UK tourism industry.
While a specific value of the hotel industry is difficult to determine due to the range
of definitions of hotel used (HCTC 1990, Harrison & Johnson 1992) and the means of
measurement adopted, the overall importance of the industry as a subject for market
analysis is clear.
3.3 NATURE OF THE HOTEL INDUSTRY
A number of authors (Litteljohn 1985, Olsen 1989; 1991; 1993, Slattery 1991; 1993,
Beattie 1993, and Beattie & Litteljohn 1992) have aided in a general understanding of
the hotel industry world-wide. They have determined the heterogeneous nature of
hotels, evaluated the growth and structural changes in the hotel industry, and
attempted to quantify developments in the industry. From such works, it can be
established that the market for and supply of hotels are far from homogeneous, as
guest have a wide range of needs, both residential and non-residential. In addition,
hoteliers have a wide range of physical and intangible characteristics and strategies
used to meet these needs, resulting in a highly fragmented and segmented industry.
Page 81
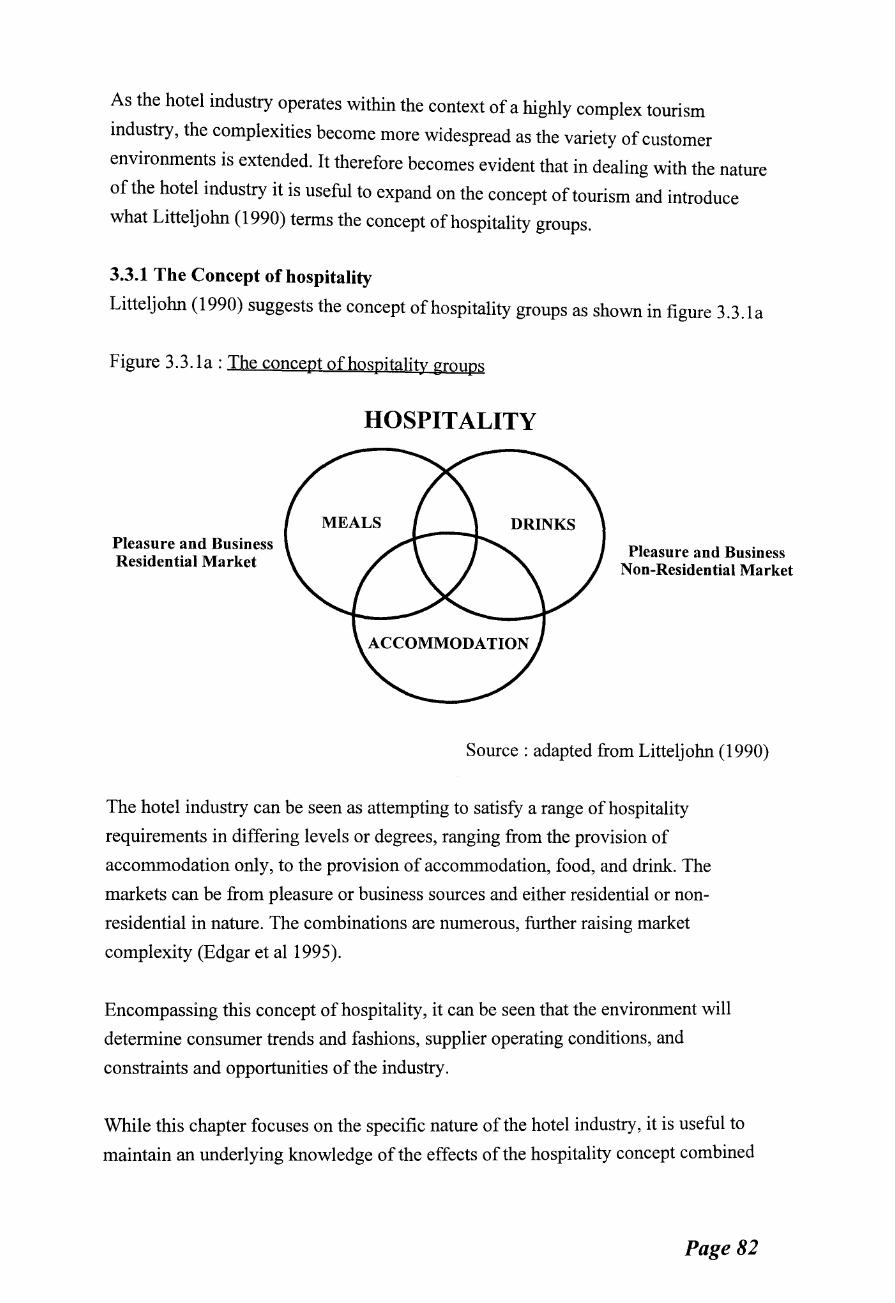
As the hotel industry operates within the context of a highly complex tourism
industry, the complexities become more widespread as the variety of customer
environments is extended. It therefore becomes evident that in dealing with the nature
of the hotel industry it is useful to expand on the concept of tourism and introduce
what Litteljohn (1990) terms the concept ofhospitality groups.
3.3.1 The Concept of hospitality
Litteljohn (1990) suggests the concept ofhospitality groups as shown in figure 3.3.la
Figure 3.3.1a: The concept of hospitality groups
Pleasure and Business Residential Market
HOSPITALITY
MEALS
Pleasure and Business Non-Residential Market
Source : adapted from Litteljohn (1990)
The hotel industry can be seen as attempting to satisfy a range of hospitality
requirements in differing levels or degrees, ranging from the provision of
accommodation only, to the provision of accommodation, food, and drink. The
markets can be from pleasure or business sources and either residential or non
residential in nature. The combinations are numerous, further raising market
complexity (Edgar et al 1995).
Encompassing this concept of hospitality, it can be seen that the environment will
determine consumer trends and fashions, supplier operating conditions, and
constraints and opportunities of the industry.
While this chapter focuses on the specific nature of the hotel industry, it is useful to
maintain an underlying knowledge of the effects of the hospitality concept combined
Page 82

with the environment. As such the environment is briefly discussed, before focusing
on the key elements of demand and supply of hotels.
3.3.2 The role of the Environment
The environment plays a critical role in the hospitality and hotel industry, affecting
demand and supply in a variety of ways. Often such interactions are composed of a
complex myriad of socio-economic, political, technological, and legal issues ranging
from recession to the E.C package travel directive. Such environmental elements can
be referred to as internal, where specific issues within the organisation affect the
organisation directly, or external, which are often uncontrollable issues affecting
organisations in the industry.
The topic of this section is the external environment. The external environment can be
further divided into the general environment - affecting all organisations in an
industry, or the specific environment- issues directly related to specific suppliers
within the industry.
The external environment is composed of a range of often uncontrollable factors.
Such factors, usually socio-economic and technology-based have had a considerable
effect upon the UK hotel industry over the last decade (Olsen & Merna 1993(b )).
Vierich and Calver (1991) and Gordon (1993) identified that the hotel industry is
affected considerably by a conspiracy of economic factors ranging from inflation, to
unemployment. Indeed, Slattery ( 1991) states, "the state of an economy is, other
things remaining equal, the prime cyclical factor which determines the level of hotel
demand, but due to the inherent complexity of the hotel and its markets the effects are
not uniform". Hanks et al (1992) focused on demand, explaining that the guest
purchase decision is made upon circumstances of time, place and purpose of trip.
The hotel industry today faces a combination of environmental led problems such as
over-building (Dempsey 1991), excess capacity, cut-throat competition, discerning
business and leisure travel, declining occupancy rates, reduced profitability, severe
short term liquidity problems and an increased number of business failures and
bankruptcies, all the result of a prolonged economic recession and the desire for
growth (Olsen & Merna 1993(b), Dev & Klein 1993).
Indeed, to understand the investment potential of hotels, operators must be aware of
many forces that affect the value and operating environment of their properties, as the
Page 83
supply and demand relationship affected by the environment is an important factor in
the creation of profits. (Rushmore 1994)
Therefore, if organisations are to operate effectively they need to scan the
environment (Zhao & Merna 1993) to identify areas of potential threat or opportunity
at both corporate and unit levels.
The environment therefore plays a critical role in the evolution and future
development of the hospitality industry, and in particular the hotel industry
(Hennessey 1992). As such throughout this section reference shall be made to past
environmental events such as the Gulf war, World recession, and exchange rates.
However, the reader should also consider the on-going effect that environmental
expectancy may have upon the industry and potential developments in demand and
supply.
3.4 HOTEL INDUSTRY DEMAND
Hotel demand can be seen to be highly segmented and complex. The market for the
hotel room is anything but homogeneous, and is not simply catered for by
rejuvenating old products (Knipp & Matlof 1993) as hotel guests have a wide range of
ever changing needs.
In its purest form hotel markets are split into two broad segments, business travellers
and leisure travellers, each with varying characteristics and values.
3.4.1 Business Travellers According to Hanks et al (1992), the business traveller is usually unwilling to make
advance commitments, tends to desire high quality, is destination and location
inflexible, is prestige conscious and stays for a shorter duration, often making them
price inelastic and less price sensitive.
For most city hotels, the commercial traveller represents almost all of the mid week
business, (Orkin 1990) meaning a focus on business markets may result in weekend
seasonality problems.
Page 84
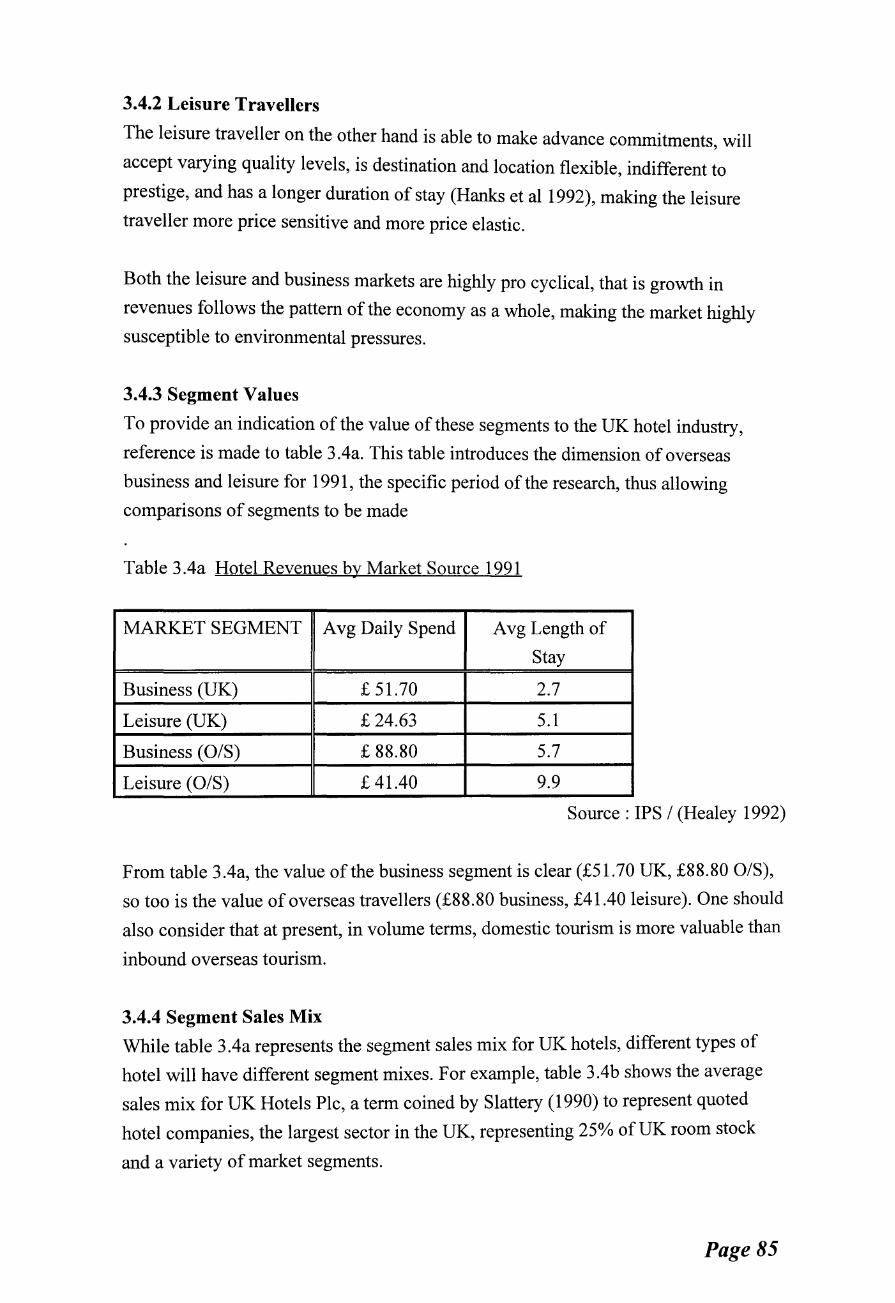
3.4.2 Leisure Travellers
The leisure traveller on the other hand is able to make advance commitments will '
accept varying quality levels, is destination and location flexible, indifferent to
prestige, and has a longer duration of stay (Hanks et al 1992), making the leisure
traveller more price sensitive and more price elastic.
Both the leisure and business markets are highly pro cyclical, that is growth in
revenues follows the pattern of the economy as a whole, making the market highly
susceptible to environmental pressures.
3.4.3 Segment Values
To provide an indication of the value of these segments to the UK hotel industry,
reference is made to table 3 .4a. This table introduces the dimension of overseas
business and leisure for 1991, the specific period of the research, thus allowing
comparisons of segments to be made
Table 3.4a Hotel Revenues by Market Source 1991
MARKET SEGMENT Avg Daily Spend A vg Length of
Stay
Business (UK) £ 51.70 2.7
Leisure (UK) £24.63 5.1
Business (0/S) £88.80 5.7
Leisure (0/S) £41.40 9.9
Source : IPS I (Healey 1992)
From table 3.4a, the value of the business segment is clear (£51.70 UK, £88.80 0/S),
so too is the value of overseas travellers (£88.80 business, £41.40 leisure). One should
also consider that at present, in volume terms, domestic tourism is more valuable than
inbound overseas tourism.
3.4.4 Segment Sales Mix
While table 3.4a represents the segment sales mix for UK hotels, different types of
hotel will have different segment mixes. For example, table 3.4b shows the average
sales mix for UK Hotels Pic, a term coined by Slattery (1990) to represent quoted
hotel companies, the largest sector in the UK, representing 25% of UK room stock
and a variety of market segments.
Page 85
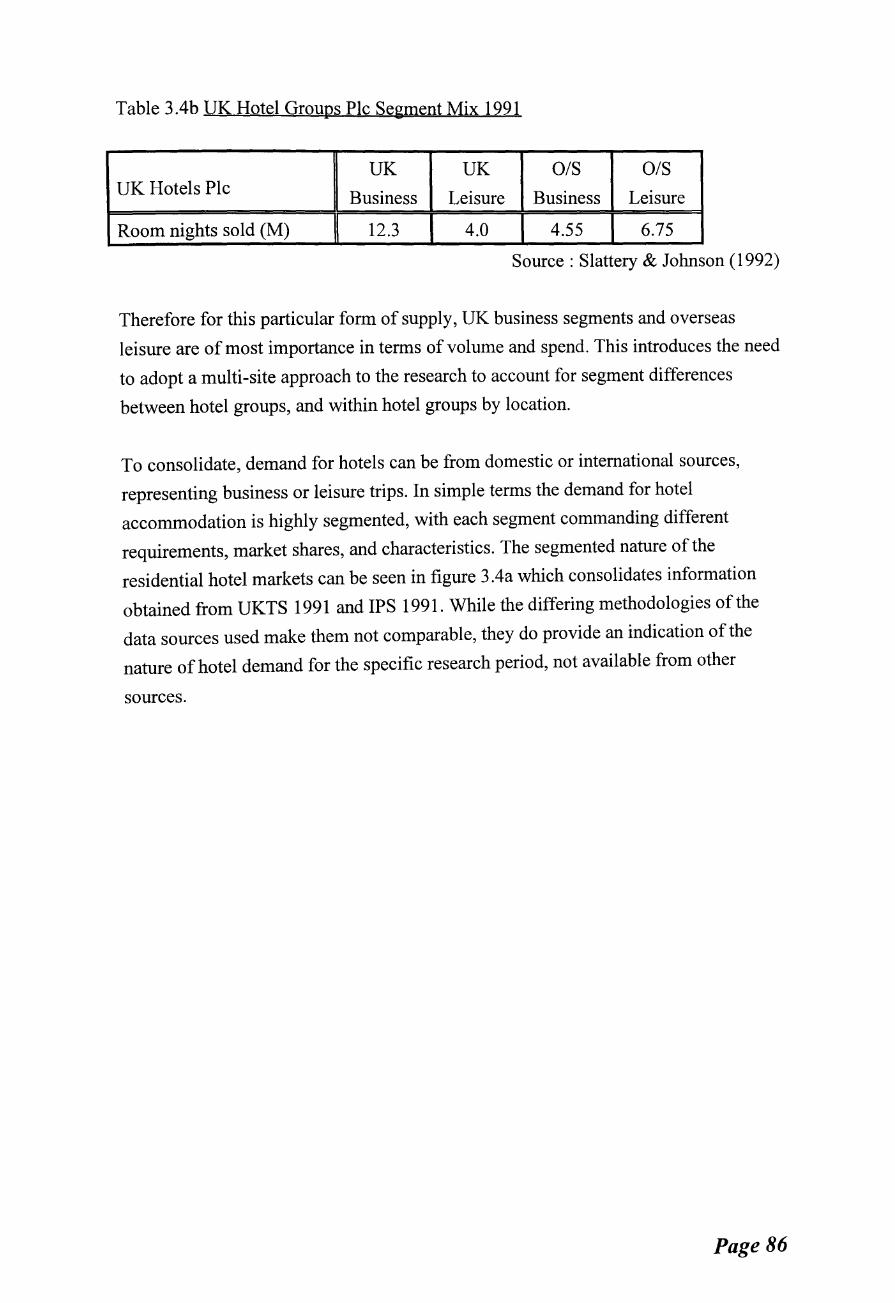
Table 3.4b UK Hotel Groups Plc Segment Mix 1991
UK UK 0/S 0/S UK Hotels Plc Business Leisure Business Leisure
Room nights sold (M) 12.3 4.0 4.55 6.75
Source : Slattery & Johnson (1992)
Therefore for this particular form of supply, UK business segments and overseas
leisure are of most importance in terms of volume and spend. This introduces the need
to adopt a multi-site approach to the research to account for segment differences
between hotel groups, and within hotel groups by location.
To consolidate, demand for hotels can be from domestic or international sources,
representing business or leisure trips. In simple terms the demand for hotel
accommodation is highly segmented, with each segment commanding different
requirements, market shares, and characteristics. The segmented nature of the
residential hotel markets can be seen in figure 3 .4a which consolidates information
obtained from UKTS 1991 and IPS 1991. While the differing methodologies of the
data sources used make them not comparable, they do provide an indication of the
nature of hotel demand for the specific research period, not available from other
sources.
Page 86

Figure 3.4a: Hotel Demand Sales Mix 1991
TOTAL DEMAND FOR HOTEL ACCOMMODATION (TRIPS)
100°/o (26.7million)
Domestic Demand International
78°/o Demand 22%)
I I I l Leisure Business Lcixurc J ( Bu•in~•
16o/o 6o/o 53°/o 25°/o I
Holiday 9%
Holiday VFR
47°/o 5%
I I Other
:VFR 2%
Short Long 2% 22% 25°/o Other
0 4Yo
Source : UKTS 1991 and IPS 1991
This figure provides an overview of demand for all hotels in the UK. While UK
Hotels Plc (Slattery 1990) and other hotels have a shared reliance on business markets
in the UK, more emphasis is placed by UK Hotels Pic on higher spend international
leisure markets. The implications of such developments are that UK leisure markets
will become more fragmented as the majority of smaller, non Pies fight for market
share.
3.4.5 Segmentation - The Hospitality Concept
The complexities of analysis are furthered by considering the nature of demand from
the perspective of the hospitality concept, that is the nature of hotel departments.
From this perspective, demand can be for food, accommodation, or drink, or a mixture
of the three. This adds a new dimension in that the demand can be residential or non
residential, and introduces a number of additional market segments, such as the
restaurant, bars, banqueting, and leisure centres, all of which can and will be
influenced by the environment. While non-residential markets are not examined in
depth, they should be recognised as they are one of the most underdeveloped sectors
by hotels (Slattery 1991 ), and least researched. As such, this sector provides
opportunities for further research and requires recognition of the potential
Page 87
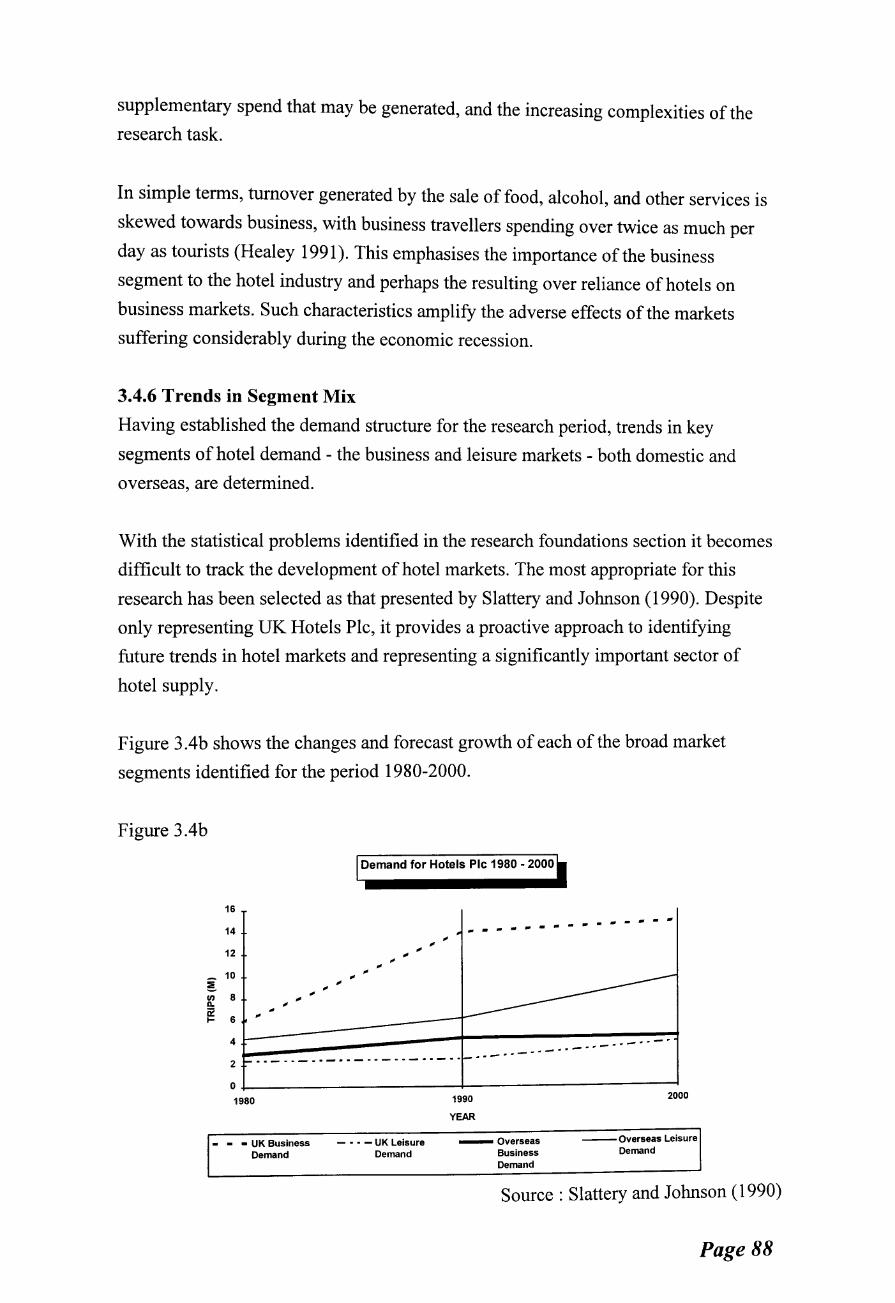
supplementary spend that may be generated, and the increasing complexities of the research task.
In simple terms, turnover generated by the sale of food, alcohol, and other services is
skewed towards business, with business travellers spending over twice as much per
day as tourists (Healey 1991). This emphasises the importance of the business
segment to the hotel industry and perhaps the resulting over reliance of hotels on
business markets. Such characteristics amplify the adverse effects of the markets
suffering considerably during the economic recession.
3.4.6 Trends in Segment Mix
Having established the demand structure for the research period, trends in key
segments of hotel demand - the business and leisure markets - both domestic and
overseas, are determined.
With the statistical problems identified in the research foundations section it becomes
difficult to track the development of hotel markets. The most appropriate for this
research has been selected as that presented by Slattery and Johnson (1990). Despite
only representing UK Hotels Plc, it provides a proactive approach to identifying
future trends in hotel markets and representing a significantly important sector of
hotel supply.
Figure 3 .4b shows the changes and forecast growth of each of the broad market
segments identified for the period 1980-2000.
Figure 3.4b
16
14
12
- 10 ::!. II) 8 D.
~ 6 .. "' "' "'
"' "'
Demand for Hotels Pic 1980 - 2000
"' "' "' "'
-- ---- -- -. ---- -
4[::::::::::~---------t~~~~~~~~-~--~-~-- .. -- . .. 4- .. . . - ... -··-----·-··-------·----2
• - • UK Business - • • - UK Leisure Demand Demand
1990
YEAR
-overseas Business Demand
Overseas Leisure Demand
Source : Slattery and Johnson (1990)
Page 88
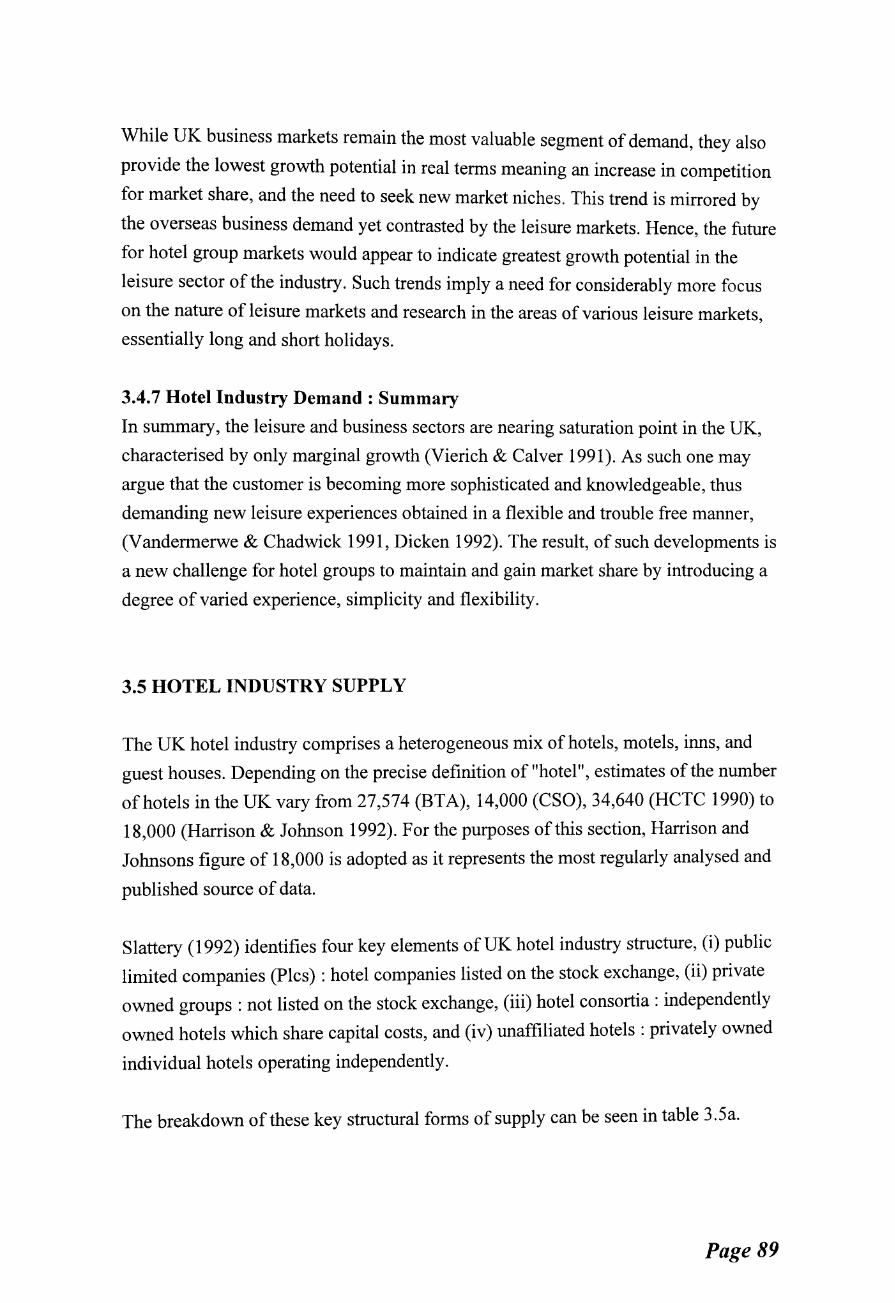
While UK business markets remain the most valuable segment of demand, they also
provide the lowest growth potential in real terms meaning an increase in competition
for market share, and the need to seek new market niches. This trend is mirrored by
the overseas business demand yet contrasted by the leisure markets. Hence, the future
for hotel group markets would appear to indicate greatest growth potential in the
leisure sector of the industry. Such trends imply a need for considerably more focus
on the nature of leisure markets and research in the areas of various leisure markets '
essentially long and short holidays.
3.4. 7 Hotel Industry Demand : Summary
In summary, the leisure and business sectors are nearing saturation point in the UK,
characterised by only marginal growth (Vierich & Calver 1991). As such one may
argue that the customer is becoming more sophisticated and knowledgeable, thus
demanding new leisure experiences obtained in a flexible and trouble free manner,
(V andermerwe & Chadwick 1991, Dicken 1992). The result, of such developments is
a new challenge for hotel groups to maintain and gain market share by introducing a
degree of varied experience, simplicity and flexibility.
3.5 HOTEL INDUSTRY SUPPLY
The UK hotel industry comprises a heterogeneous mix of hotels, motels, inns, and
guest houses. Depending on the precise definition of "hotel", estimates of the number
ofhotels in the UK vary from 27,574 (BTA), 14,000 (CSO), 34,640 (HCTC 1990) to
18,000 (Harrison & Johnson 1992). For the purposes of this section, Harrison and
Johnsons figure of 18,000 is adopted as it represents the most regularly analysed and
published source of data.
Slattery (1992) identifies four key elements ofUK hotel industry structure, (i) public
limited companies (Pies) : hotel companies listed on the stock exchange, (ii) private
owned groups :not listed on the stock exchange, (iii) hotel consortia: independently
owned hotels which share capital costs, and (iv) unaffiliated hotels :privately owned
individual hotels operating independently.
The breakdown of these key structural forms of supply can be seen in table 3.5a.
Page 89
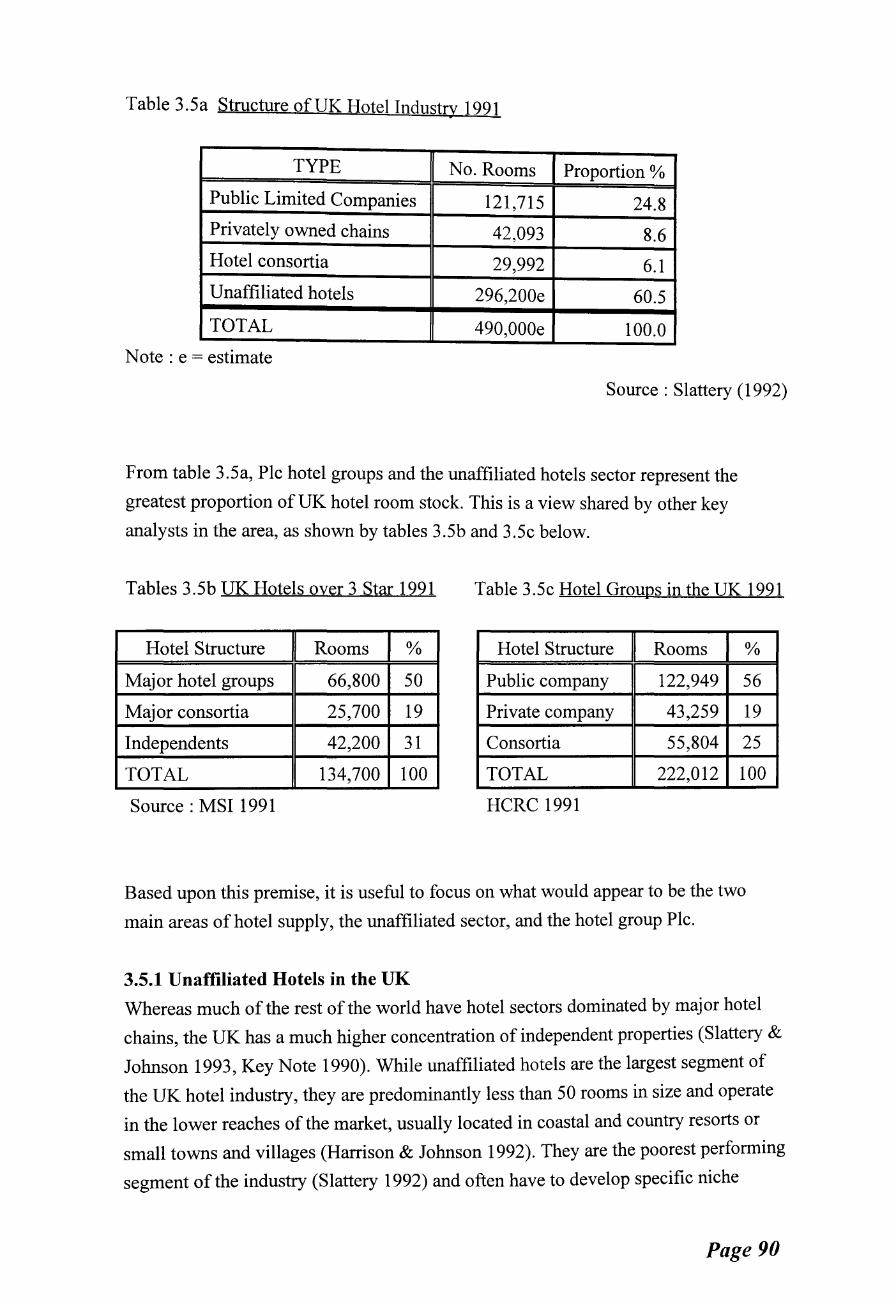
Table 3.5a Structure of UK Hotel Industry 1991
TYPE No. Rooms Proportion %
Public Limited Companies 121,715 24.8
Privately owned chains 42,093 8.6
Hotel consortia 29,992 6.1
Unaffiliated hotels 296,200e 60.5
TOTAL 490,000e 100.0
Note : e = estimate
Source : Slattery (1992)
From table 3.5a, Plc hotel groups and the unaffiliated hotels sector represent the
greatest proportion of UK hotel room stock. This is a view shared by other key
analysts in the area, as shown by tables 3.5b and 3.5c below.
Tables 3.5b UK Hotels over 3 Star 1991 Table 3.5c Hotel Groups in the UK 1991
Hotel Structure Rooms % Hotel Structure Rooms %
Major hotel groups 66,800 50 Public company 122,949 56
Major consortia 25,700 19 Private company 43,259 19
Independents 42,200 31 Consortia 55,804 25
TOTAL 134,700 100 TOTAL 222,012 100
Source : MSI 1991 HCRC 1991
Based upon this premise, it is useful to focus on what would appear to be the two
main areas of hotel supply, the unaffiliated sector, and the hotel group Pic.
3.5.1 Unaffiliated Hotels in the UK
Whereas much of the rest of the world have hotel sectors dominated by major hotel
chains, the UK has a much higher concentration of independent properties (Slattery &
Johnson 1993, Key Note 1990). While unaffiliated hotels are the largest segment of
the UK hotel industry, they are predominantly less than 50 rooms in size and operate
in the lower reaches of the market, usually located in coastal and country resorts or
small towns and villages (Harrison & Johnson 1992). They are the poorest performing
segment of the industry (Slattery 1992) and often have to develop specific niche
Page 90
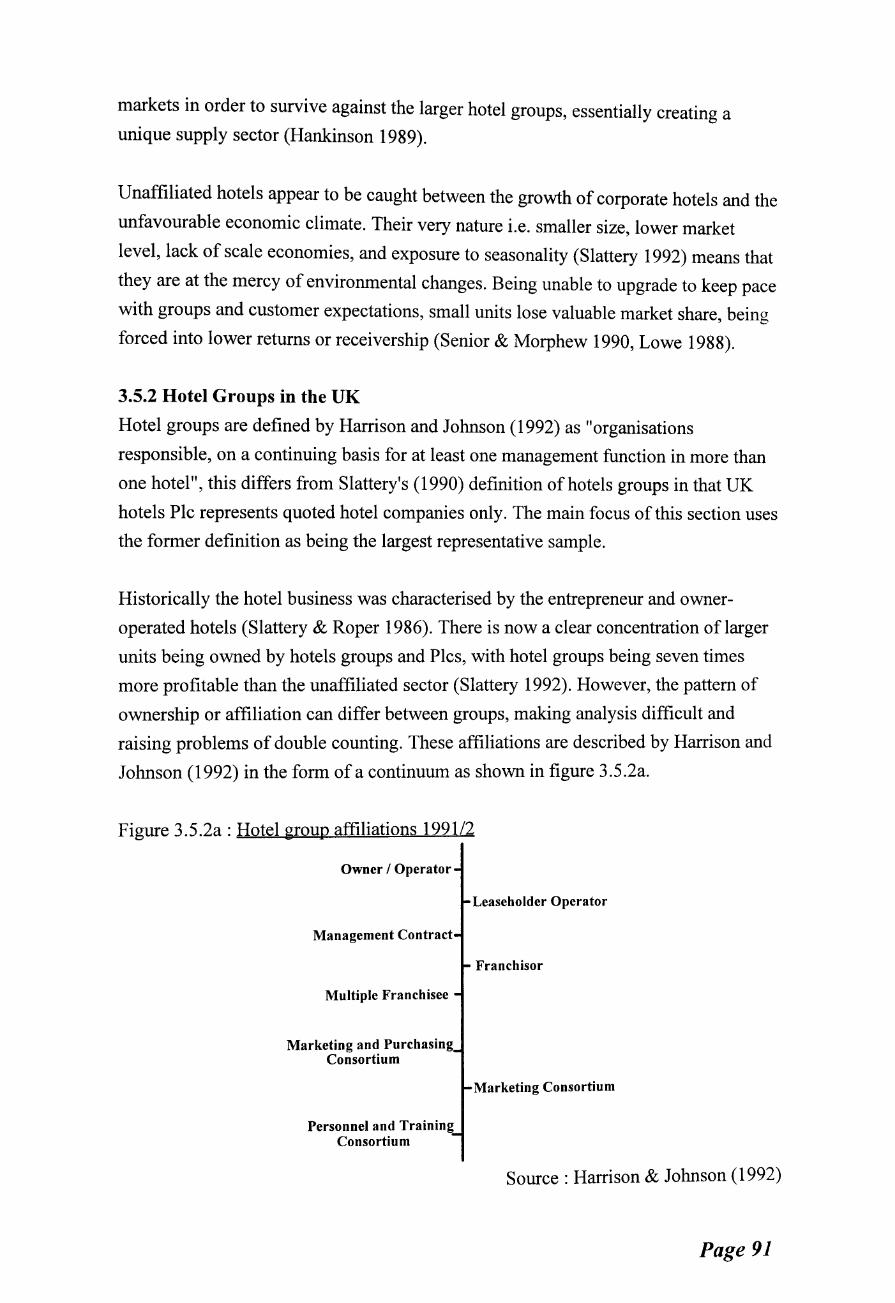
markets in order to survive against the larger hotel groups, essentially creating a
unique supply sector (Hankinson 1989).
Unaffiliated hotels appear to be caught between the growth of corporate hotels and the
unfavourable economic climate. Their very nature i.e. smaller size, lower market
level, lack of scale economies, and exposure to seasonality (Slattery 1992) means that
they are at the mercy of environmental changes. Being unable to upgrade to keep pace
with groups and customer expectations, small units lose valuable market share, being
forced into lower returns or receivership (Senior & Morphew 1990, Lowe 1988).
3.5.2 Hotel Groups in the UK
Hotel groups are defined by Harrison and Johnson (1992) as "organisations
responsible, on a continuing basis for at least one management function in more than
one hotel", this differs from Slattery's (1990) definition ofhotels groups in that UK
hotels Plc represents quoted hotel companies only. The main focus of this section uses
the former definition as being the largest representative sample.
Historically the hotel business was characterised by the entrepreneur and owner
operated hotels (Slattery & Roper 1986). There is now a clear concentration of larger
units being owned by hotels groups and Plcs, with hotel groups being seven times
more profitable than the unaffiliated sector (Slattery 1992). However, the pattern of
ownership or affiliation can differ between groups, making analysis difficult and
raising problems of double counting. These affiliations are described by Harrison and
Johnson (1992) in the form of a continuum as shown in figure 3.5.2a.
Figure 3.5.2a : Hotel group affiliations 1991/2
Owner I Operator
Management Contract
Multiple Franchisee
Marketing and Purchasing Consortium
Personnel and Training Consortium
Leaseholder Operator
Franchisor
Marketing Consortium
Source : Harrison & Johnson (1992)
Page 91
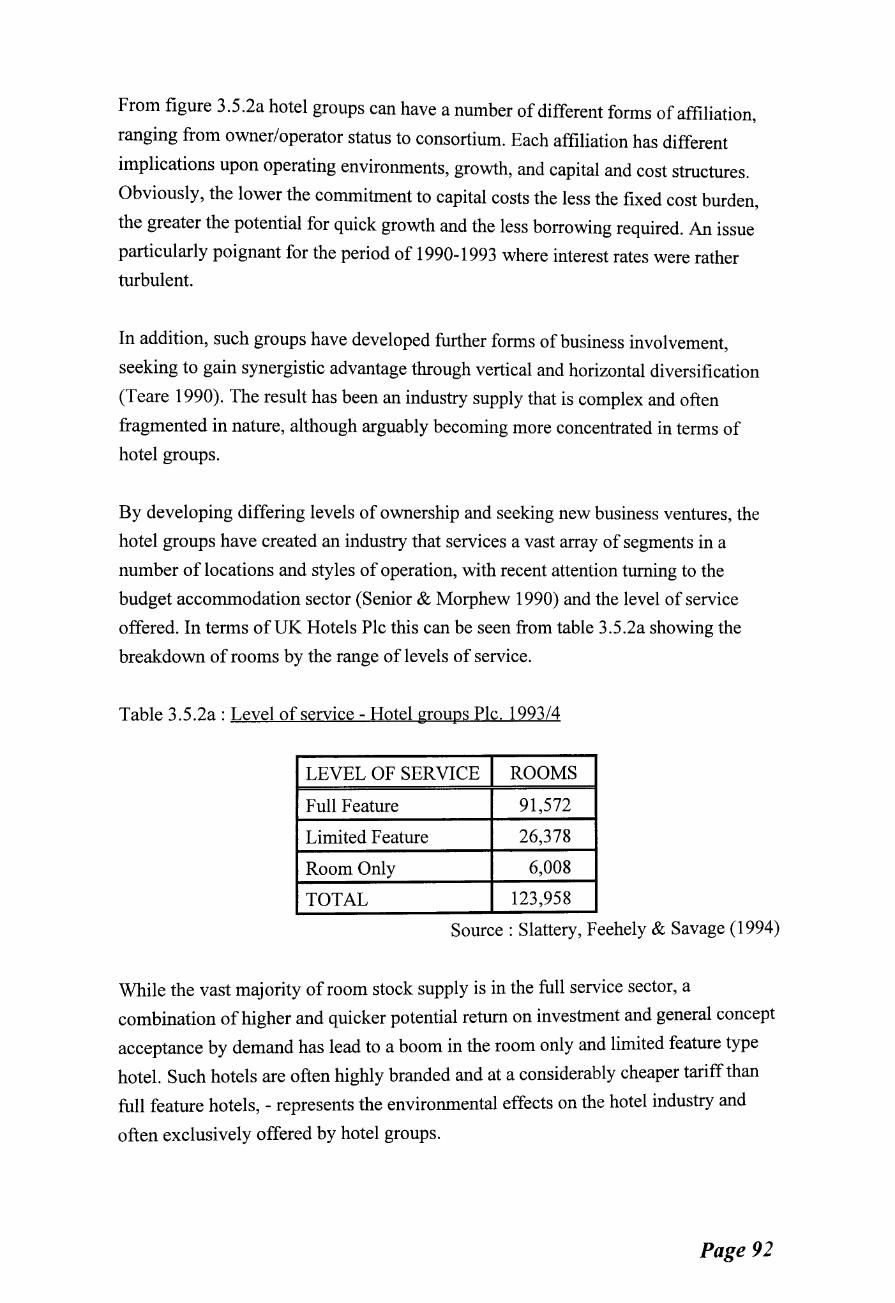
From figure 3.5 .2a hotel groups can have a number of different forms of affiliation '
ranging from owner/operator status to consortium. Each affiliation has different
implications upon operating environments, growth, and capital and cost structures.
Obviously, the lower the commitment to capital costs the less the fixed cost burden,
the greater the potential for quick growth and the less borrowing required. An issue
particularly poignant for the period of 1990-1993 where interest rates were rather
turbulent.
In addition, such groups have developed further forms of business involvement,
seeking to gain synergistic advantage through vertical and horizontal diversification
(Teare 1990). The result has been an industry supply that is complex and often
fragmented in nature, although arguably becoming more concentrated in terms of
hotel groups.
By developing differing levels of ownership and seeking new business ventures, the
hotel groups have created an industry that services a vast array of segments in a
number of locations and styles of operation, with recent attention turning to the
budget accommodation sector (Senior & Morphew 1990) and the level of service
offered. In terms of UK Hotels Plc this can be seen from table 3.5.2a showing the
breakdown of rooms by the range of levels of service.
Table 3.5.2a: Level of service- Hotel groups Plc. 1993/4
LEVEL OF SERVICE ROOMS
Full Feature 91,572
Limited Feature 26,378
Room Only 6,008
TOTAL 123,958
Source: Slattery, Feehely & Savage (1994)
While the vast majority of room stock supply is in the full service sector, a
combination of higher and quicker potential return on investment and general concept
acceptance by demand has lead to a boom in the room only and limited feature type
hotel. Such hotels are often highly branded and at a considerably cheaper tariff than
full feature hotels, - represents the environmental effects on the hotel industry and
often exclusively offered by hotel groups.
Page 92
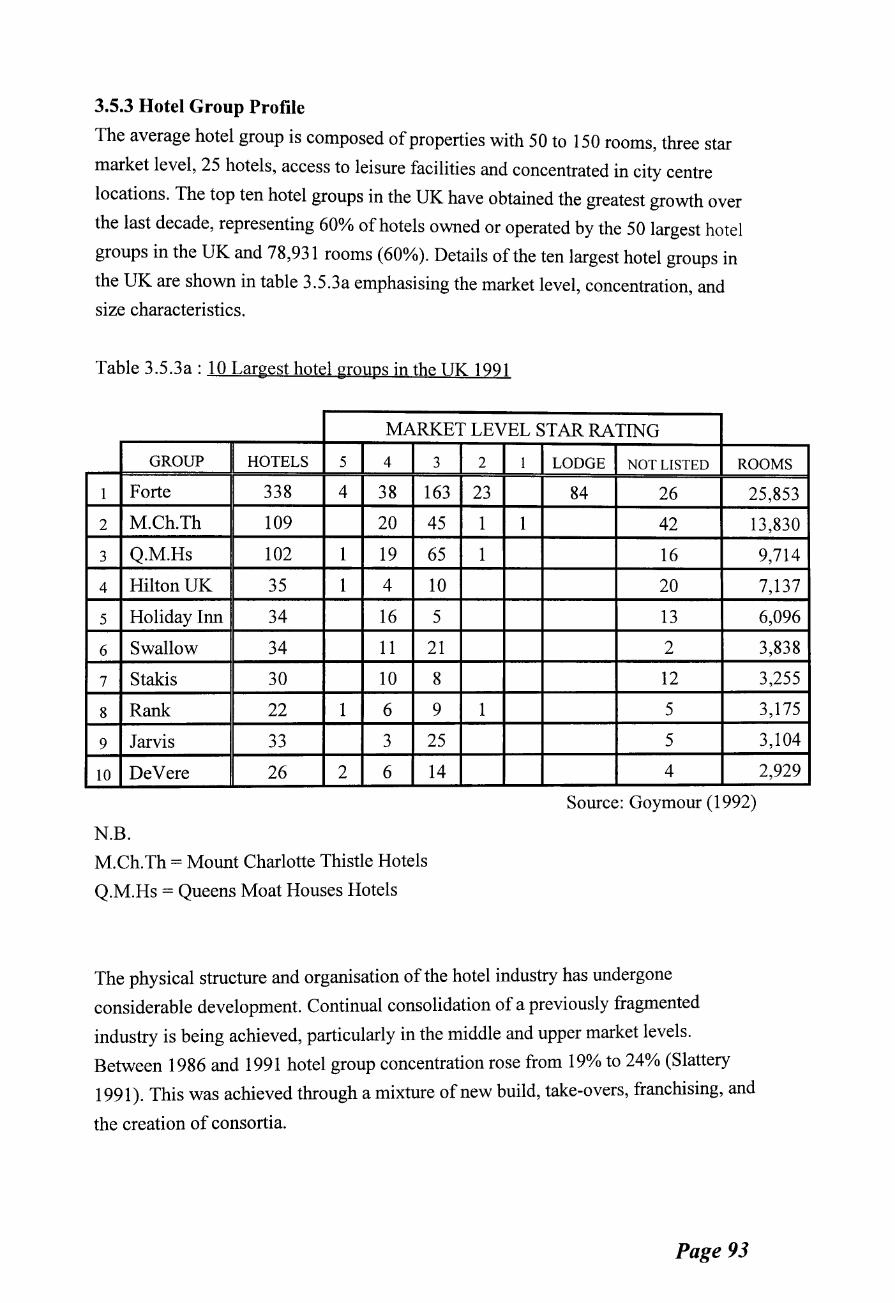
3.5.3 Hotel Group Profile
The average hotel group is composed of properties with 50 to 150 rooms, three star
market level, 25 hotels, access to leisure facilities and concentrated in city centre
locations. The top ten hotel groups in the UK have obtained the greatest growth over
the last decade, representing 60% of hotels owned or operated by the 50 largest hotel
groups in the UK and 78,931 rooms (60%). Details of the ten largest hotel groups in
the UK are shown in table 3.5.3a emphasising the market level, concentration, and
size characteristics.
Table 3.5.3a: 10 Largest hotel groups in the UK 1991
MARKET LEVEL STAR RATING
GROUP HOTELS 5 4 3 2 1 LODGE NOT LISTED ROOMS
1 Forte 338 4 38 163 23 84 26 25,853
2 M.Ch.Th 109 20 45 1 1 42 13,830
3 Q.M.Hs 102 1 19
4 Hilton UK 35 1 4
5 Holiday Inn 34 16
6 Swallow 34 11
7 Stakis 30 10
8 Rank 22 1 6
9 Jarvis 33 3
10 DeVere 26 2 6
N.B.
M.Ch.Th =Mount Charlotte Thistle Hotels
Q.M.Hs =Queens Moat Houses Hotels
65 1 16
10 20
5 13
21 2
8 12
9 1 5
25 5
14 4
Source: Goymour (1992)
The physical structure and organisation of the hotel industry has undergone
considerable development. Continual consolidation of a previously fragmented
industry is being achieved, particularly in the middle and upper market levels.
Between 1986 and 1991 hotel group concentration rose from 19% to 24% (Slattery
1991). This was achieved through a mixture of new build, take-overs, franchising, and
the creation of consortia.
Page 93
9,714
7,137
6,096
3,838
3,255
3,175
3,104
2,929
3.5.4 Hotel Group Developments
The real effects of consolidation have been felt at the higher market levels of the
larger, most prominently appointed hotels, where the corporate hotel is now much
more common than the unaffiliated. (Tarrant 1989).
Many hotel groups are rationalising their portfolios and, as a result, real competition
is emerging in many key locations. These linked processes of competition and growth
have encouraged product branding, market segmentation and the development of new
products such as room only accommodation and short breaks, making competing for
market share increasingly difficult for the independent operator. ( 0 lsen 1993, Tarrant 1989).
In recent times, a number of authors have focused on oversupply in the hotel industry
as accounting for poor occupancy rates, (Senior & Morphew 1990), and low returns
on investment (Olsen & Merna 1993(a), Arnold 1994). The cumulative result being an
estimated 5% of the industry's room stock in receivership (Gordon 1993). This places
a greater focus on the need for analysis of hotel markets and strategies used to gain
market share either from the perspective of the hotel groups or the independent
operator.
3.6 CHANGES IN THE HOTEL INDUSTRY
To appreciate the dynamic nature of the industry, it is useful to clarify some of the key
environment driven developments to date.
Litteljohn (1993a) identified that to the year 2000 hospitality managers would "need
to adapt and change in line with market demands for quality and value for money, and
increased organisational attention will have to be given to profitability and
professionalism." Bearing this in mind and under the restrictions and influences of
uncertain environmental change the potential changes to the industry can only be
speculative, with a focus on operational and strategic issues. However, a number of
developments or changes can be recognised, if not fully analysed.
Over the past several decades, the hotel industry has evolved from one in which the
asset owner had responsibility for operating the facility to one where the operator
usually has no equity position at all in the asset. This separation of ownership and
operating responsibility has flourished during the past 20 years (Rainsford &
Page 94
Johnstone 1994) and is likely to continue in the form of franchising, management
contracts and leasing. Such developments imply a growth in hotel groups and an
increased awareness of branding and associated sophisticated marketing strategies
both within the framework of an increasingly dynamic industry.
The industry is undergoing a process of rationalisation and concentration, with
increasingly powerful hotel groups restructuring their portfolios and repositioning
their top end hotels more forcibly in the premium market (Healey 1992). The main
threat being to smaller hotel groups. These major chains are moving upmarket, raising
consumer expectations and not only offering an enhanced product range but locking
in customers via computerised reservations systems in a way that could gradually
exclude smaller groups and independents. Such outcomes squeeze the smaller
operators for market share and force them to seek new niches, one of which may be
the development of leisure markets, such as short holiday breaks (Vi erich & Calver
1991). Linked to this, the smaller unaffiliated hotel sector will continue to shrink
forcing strategic alliances (Slattery 1992) and further receiverships.
A final point here, and one that although not the context of this research, warrants
further investigation is the relationship of cost and price structures. E.I.U (1992) claim
that as the hotel industry is developing it will be increasingly affected by different
cost structures around the world, and that in turn will dictate that segmentation in the
hotel industry is likely to increase.
These considerations have direct and indirect affects upon the future structure of the
hotel industry and the nature of demand. The likelihood is that the hotel industry of
the future will be more consolidated, highly branded, and focused on segments. In
essence the industry will be characterised by the large hotel groups, and driven by
performance levels (McGee 1993). Such developments highlight the need to analyse
strategic developments of hotel groups in the segmented market place.
To provide focus in the research, the location of Scotland has been highlighted as a
key area of short break development. As such, it becomes useful to highlight the
structure of the hotel market in Scotland as a key research parameter.
Page 95
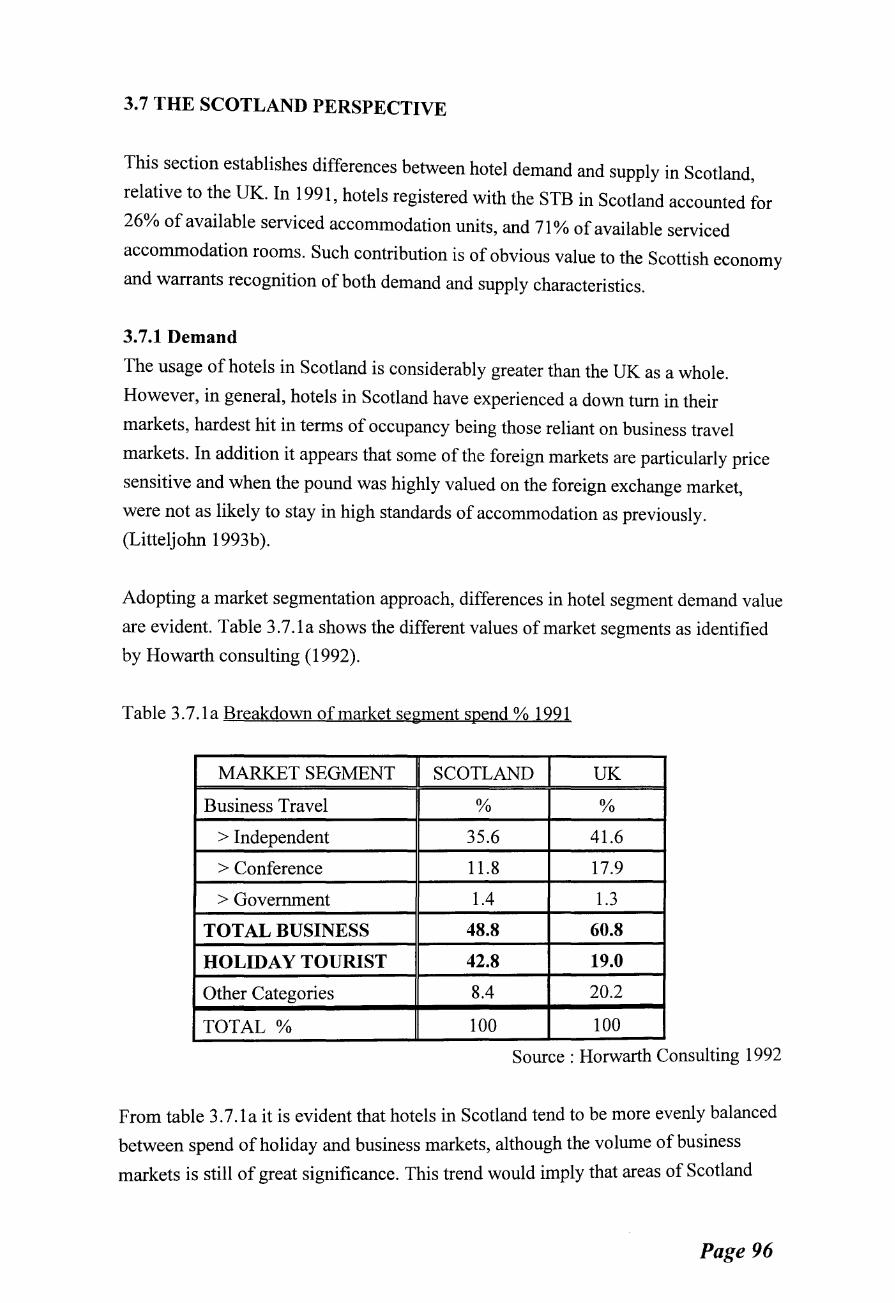
3. 7 THE SCOTLAND PERSPECTIVE
This section establishes differences between hotel demand and supply in Scotland,
relative to the UK. In 1991, hotels registered with the STB in Scotland accounted for
26% of available serviced accommodation units, and 71% of available serviced
accommodation rooms. Such contribution is of obvious value to the Scottish economy
and warrants recognition of both demand and supply characteristics.
3.7.1 Demand
The usage of hotels in Scotland is considerably greater than the UK as a whole.
However, in general, hotels in Scotland have experienced a down tum in their
markets, hardest hit in terms of occupancy being those reliant on business travel
markets. In addition it appears that some of the foreign markets are particularly price
sensitive and when the pound was highly valued on the foreign exchange market,
were not as likely to stay in high standards of accommodation as previously.
(Litteljohn 1993b ).
Adopting a market segmentation approach, differences in hotel segment demand value
are evident. Table 3.7.la shows the different values of market segments as identified
by Howarth consulting (1992).
Table 3.7.1a Breakdown of market segment spend% 1991
MARKET SEGMENT SCOTLAND UK
Business Travel % %
> Independent 35.6 41.6
> Conference 11.8 17.9
>Government 1.4 1.3
TOTAL BUSINESS 48.8 60.8
HOLIDAY TOURIST 42.8 19.0
Other Categories 8.4 20.2
TOTAL% 100 100
Source : Horwarth Consulting 1992
From table 3. 7.1 a it is evident that hotels in Scotland tend to be more evenly balanced
between spend ofholiday and business markets, although the volume of business
markets is still of great significance. This trend would imply that areas of Scotland
Page 96
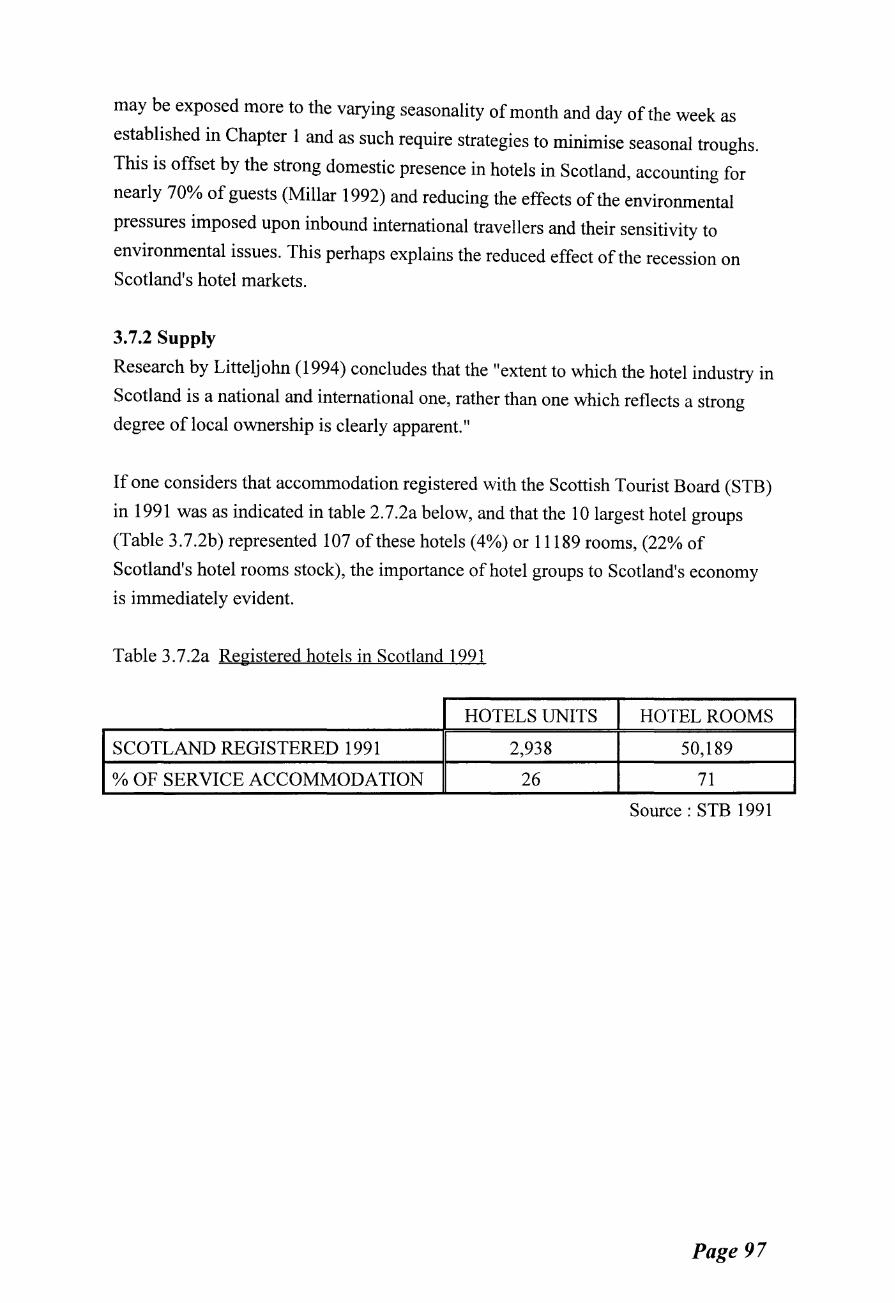
may be exposed more to the varying seasonality of month and day of the week as
established in Chapter 1 and as such require strategies to minimise seasonal troughs.
This is offset by the strong domestic presence in hotels in Scotland, accounting for
nearly 70% of guests (Millar 1992) and reducing the effects of the environmental
pressures imposed upon inbound international travellers and their sensitivity to
environmental issues. This perhaps explains the reduced effect of the recession on Scotland's hotel markets.
3.7.2 Supply
Research by Litteljohn (1994) concludes that the "extent to which the hotel industry in
Scotland is a national and international one, rather than one which reflects a strong
degree of local ownership is clearly apparent."
If one considers that accommodation registered with the Scottish Tourist Board (STB)
in 1991 was as indicated in table 2.7.2a below, and that the 10 largest hotel groups
(Table 3.7.2b) represented 107 of these hotels (4%) or 11189 rooms, (22% of
Scotland's hotel rooms stock), the importance of hotel groups to Scotland's economy
is immediately evident.
Table 3.7.2a Registered hotels in Scotland 1991
HOTELS UNITS HOTEL ROOMS
SCOTLAND REGISTERED 1991 2,938 50,189
%OF SERVICE ACCOMMODATION 26 71
Source : STB 1991
Page 97
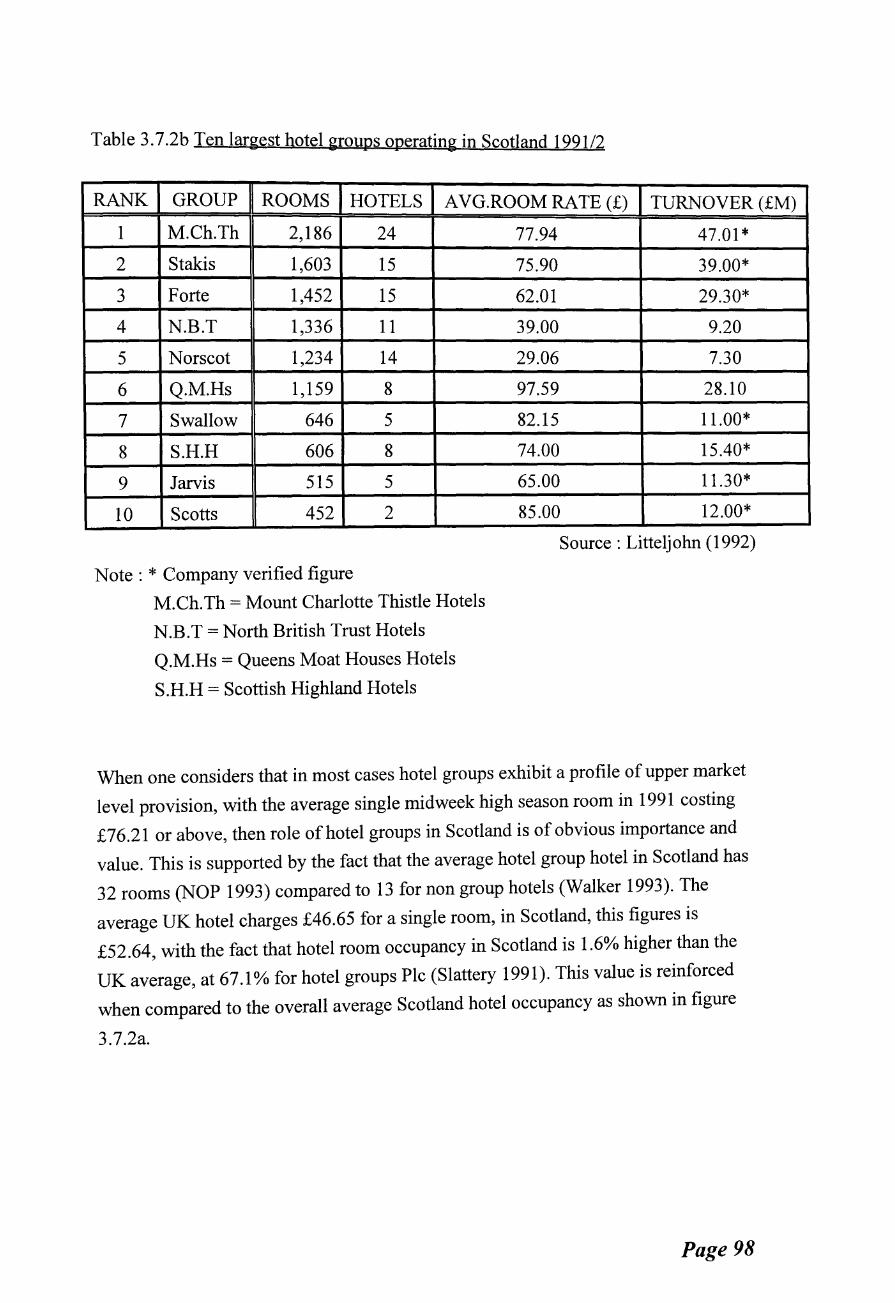
Table 3. 7.2b Ten largest hotel groups operating in Scotland 199112
RANK GROUP ROOMS HOTELS AVG.ROOM RATE(£) TURNOVER (£M)
1 M.Ch.Th 2,186 24 77.94 47.01 *
2 Stakis 1,603 15 75.90 39.00*
3 Forte 1,452 15 62.01 29.30*
4 N.B.T 1,336 11 39.00 9.20
5 Norscot 1,234 14 29.06 7.30
6 Q.M.Hs 1,159 8 97.59 28.10
7 Swallow 646 5 82.15 11.00*
8 S.H.H 606 8 74.00 15.40*
9 Jarvis 515 5 65.00 11.30*
10 Scotts 452 2 85.00 12.00*
Source: Litteljohn (1992)
Note : * Company verified figure
M.Ch.Th =Mount Charlotte Thistle Hotels
N.B.T =North British Trust Hotels
Q .M.Hs = Queens Moat Houses Hotels
S .H.H = Scottish Highland Hotels
When one considers that in most cases hotel groups exhibit a profile of upper market
level provision, with the average single midweek high season room in 1991 costing
£76.21 or above, then role of hotel groups in Scotland is of obvious importance and
value. This is supported by the fact that the average hotel group hotel in Scotland has
32 rooms (NOP 1993) compared to 13 for non group hotels (Walker 1993). The
average UK hotel charges £46.65 for a single room, in Scotland, this figures is
£52.64, with the fact that hotel room occupancy in Scotland is 1.6% higher than the
UK average, at 67.1% for hotel groups Plc (Slattery 1991). This value is reinforced
when compared to the overall average Scotland hotel occupancy as shown in figure
3.7.2a.
Page 98
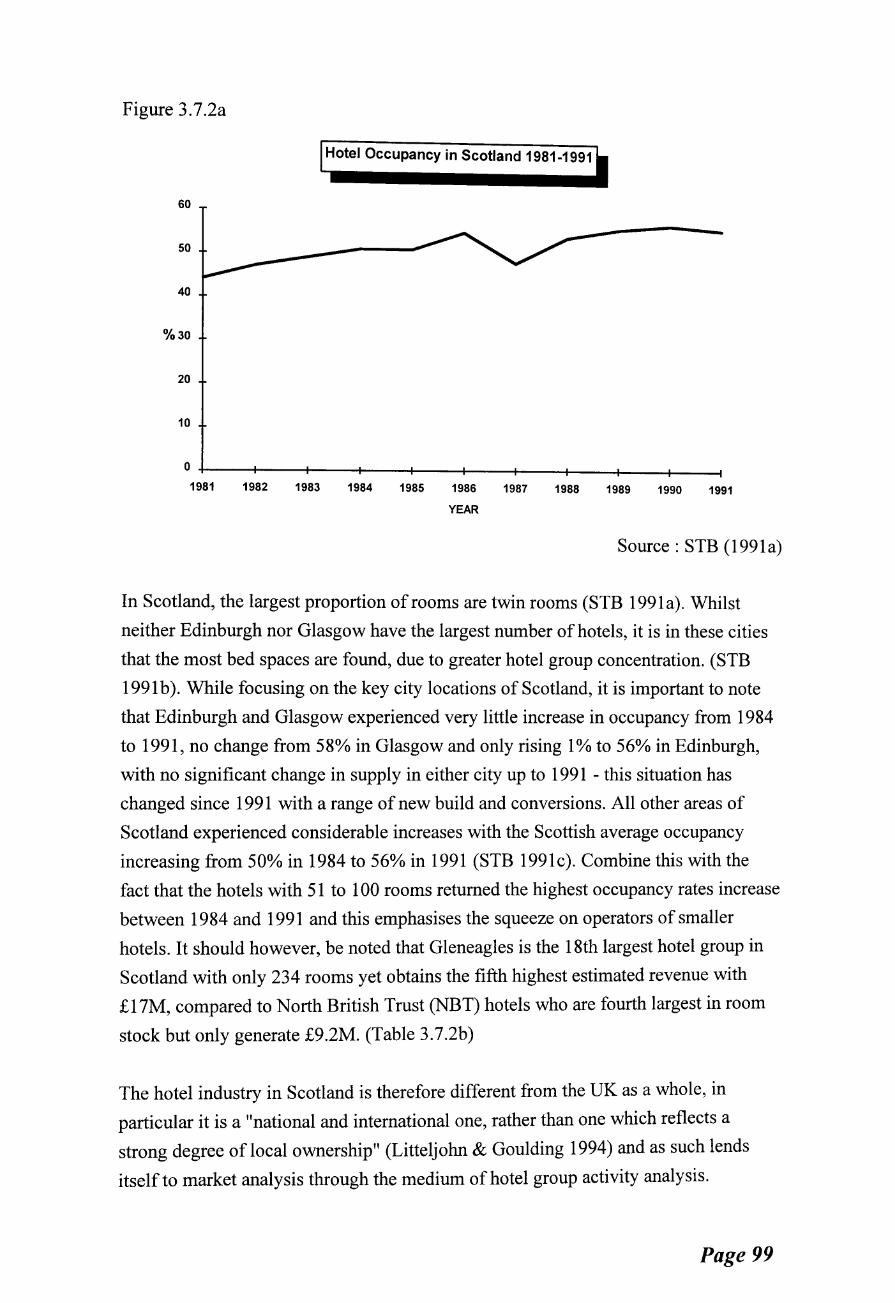
Figure 3.7.2a
Hotel Occupancy in Scotland 1981-1991
1981 1982 1983 1984 1985 1986 1987 1988 1989 1990 1991
YEAR
Source: STB (1991a)
In Scotland, the largest proportion of rooms are twin rooms (STB 1991a). Whilst
neither Edinburgh nor Glasgow have the largest number of hotels, it is in these cities
that the most bed spaces are found, due to greater hotel group concentration. (STB
1991b). While focusing on the key city locations of Scotland, it is important to note
that Edinburgh and Glasgow experienced very little increase in occupancy from 1984
to 1991, no change from 58% in Glasgow and only rising 1% to 56% in Edinburgh,
with no significant change in supply in either city up to 1991 -this situation has
changed since 1991 with a range of new build and conversions. All other areas of
Scotland experienced considerable increases with the Scottish average occupancy
increasing from 50% in 1984 to 56% in 1991 (STB 1991c). Combine this with the
fact that the hotels with 51 to 1 00 rooms returned the highest occupancy rates increase
between 1984 and 1991 and this emphasises the squeeze on operators of smaller
hotels. It should however, be noted that Gleneagles is the 18th largest hotel group in
Scotland with only 234 rooms yet obtains the fifth highest estimated revenue with
£17M, compared to North British Trust (NBT) hotels who are fourth largest in room
stock but only generate £9.2M. (Table 3.7.2b)
The hotel industry in Scotland is therefore different from the UK as a whole, in
particular it is a "national and international one, rather than one which reflects a
strong degree of local ownership" (Litteljohn & Goulding 1994) and as such lends
itself to market analysis through the medium of hotel group activity analysis.
Page 99
3.8 CHAPTER SUMMARY
This chapter has established the value of adopting hotel groups as a research sample, particularly for Scotland.
From the demand analysis this chapter has highlighted the growing importance of
leisure markets to hotel groups in the UK and the need to research such markets to
understand their value, nature and general contribution to hotels. Having emphasised
the highly segmented nature of the tourism industry through determining a hotels role
in tourism and the segmented and complex nature of their markets, the importance of
seasonality and the value of hotel markets as an area for investigation were
established.
The supply perspective established the hotel industry to be fragmented and dynamic
in nature with a prominent and important role to play in tourism supply, particularly
to Scotland. In addition, the effects of environmental changes have been determined,
establishing the need to understand strategic developments within segmented markets
and highlighting the implications of differing ownership patterns in hotel groups.
The focus of this chapter has been upon the nature of the hotel industry and the
corporate hotel group. While adopting such an holistic approach provides the driving
force behind the formulation of supplier strategies and the shapers of the industry
supply, it neglects the implementation issues. Such issues can only fully be
appreciated at unit or market level. The next chapter therefore examines the hotel unit,
establishing issues common to all hotel units at market level by examining the cost
structure of hotels through a pricing policy framework and an introduction to the
concepts of yield management. This provides some indication of the implementation
issues and highlights the role of short breaks at unit level relative to cost and revenue
structures.
Page 100
REFERENCES
Arnold, D (1994) "Profits and prices: a lodging analysis", The Cornell HRAQ, February 35(1) pp 30-33
Beattie, R (1993) "Internationalisation trends in the European hospitality industry"
MPhil Thesis, Napier University Edinburgh
Beattie, R: Litteljohn, D.L (1992) "The European hotel industry : corporate structures
and expansion strategies", Tourism Management, March pp 27-33
Dempsey, D (1991) "Financing trends in the hotel industry", Real Estate Finance, 7(4) Winter pp 74-76
Dev, C.S; Klein, S (1993) "Strategic alliances in the hotel industry", The Cornell HRAQ, February 34(1) pp 42-45
Dicken, P (1992) "Global shift", 2nd Edition Paul Chapman Publishing London
E.I.U (1992) "International hotel prices and cost structures", EIU Travel and Tourism Analyst, 5 pp 66-83
Edgar, D; Chrichton, E (1995) "Managing complexity for competitive advantage: an
I. T perspective", International Journal of Contemporary Hospitality Management, 7 (2/3) pp 12-18
Gordon, R. (1993)(a) "The phase three blues", Caterer and Hotelkeeper, 11 March
pp25
Gordon, R (1993) "Long-term outlook bright for the UK hotel industry", Caterer and Hotelkeeper, 1 July pp 21
Goymour, D (1992) "Growing for gold", Caterer and Hotelkeeper, 9 April pp 42-44
Hankinson, A (1989) "Small hotels in Britain: Investment and survival", The Cornell HRAQ, November 30(3) pp 80-82
Hanks, R.D; Cross, R.G; Noland, R.P (1992) "Discounting in the hotel industry: a
new approach", The Cornell HRAQ, 33(1) pp 15-23
Harrison, L; Johnson, K (1992) "UK hotel groups directory", Hotel & Catering
Research Centre, Huddersfield University. Cassell
Healey, N (1992) "The medium-term outlook for the UK hotel industry", Hospitality,
October pp 14-16
Hennessey, S.F (1992) "The 1992 Hotel Market: modest improvement", The Cornell HRAQ, April 33(2) pp 20-25
Horwarth & Horwarth (1987) "World-wide Hotel Industry", Horwarth and Horwarth
International New York
Horwarth Consulting (1992) "The UK Hotel industry", Horwarth Consulting Limited,
London
Page 101

Key Note (1990) "Hotels: A market sector overview", Key Note Publications Ltd. Ed.6 London
Knipp, H; Matlof, R (1993) "Hotel expansion through conversions", Real Estate Finance Journal, 8(4) Spring pp 33-36
Litteljohn, D.L (1990) "Mount Charlotte climb to the top", Scottish Business Insider, March pp 72-7 4
Litteljohn, D.L (1985) "Towards an economic analysis of trans/multi national hotel
companies", International Journal of Hospitality Management, 4(4) pp 157-165
Litteljohn, D.L (1994) "Competitive strategies in Scotland's hotel industry- industry
trends and public policy perspectives", Unpublished paper presented at
CHME, Napier University, Edinburgh
Litteljohn, D.L (1993a) "The role ofhotel groups in Scotland's tourism industry",
Unpublished paper presented at CHME, Manchester Metropolitan University
Litteljohn, D.L (1993b) in "The international hospitality industry : Organisational and
operational issues"~ edited by Jones, P; Pizam, A Pitman London pp 3
Litteljohn, D.L (1990) "Hospitality research: philosophies and progress", in
"Managing and marketing services in the 1990's" edited by Teare, R;
Moutinho, L; Morgan, N Cassell London pp 226
Litteljohn, D.L; Goulding, P (1994) "International Tourism Reports: Scotland", EIU Travel and Tourism Analyst, 2 pp 63-81
Lowe, A (1988) " Small hotels survival - an inductive approach", International Journal of Hospitality Management, 7(3) pp 197-223
M.S.I (1991) "Databrief: Short Break Holidays", Marketing Strategies for Industry,
London
McGee, R (1993) "Remaking the hospitality industry", Association Management, 45(1) January pp 42-51
Millar, B (1992) "In times of gloom there's still good news for the hotel lobby", The Scotsman, Tuesday 15 September pp 25
N.O.P (1993) "Market Report 1993", Hotel and Restaurant Magazine, November
pp 15-30
Olsen, M.D (1991) "Structural changes: The international hospitality industry and
firm", International Journal of Hospitality Management, 3( 4)
Olsen, M.D; Merna, K.M (1993) "The changing character of the multinational
hospitality firm", in "The international hospitality industry" Jones, P; Pizam,
A Pitman London pp 120(a) pp 89(b)
Olsen, M.D (1993) "International growth strategies of major US hotel companies",
EIU Travel and Tourism Analyst, 3 pp 51-64
Page 102
Orkin, E.B ( 1990) "Strategies for managing transient rates", The Cornell HRA Q, February pp 34-39
Rains ford, P; Johnstone, D ( 1994) "Selecting and monitoring hotel operating
companies", Real Estate Finance Journal, 9(4) Spring pp 30-37
Rushmore, S (1991) "An overview of the hotel industry: past. present and future",
Real Estate Finance Journal, 9(4) Spring pp 5-14
Senior, M; Morphew, R (1990) "Competitive strategies in the budget hotel sector",
International Journal of Contemporary Hospitality Management, 2(3) pp 2-9
Slattery, P (1992) "Unaffiliated hotels in the UK", EIU Travel and Tourism Analyst, 1 pp 90-102
Slattery, P (1993) "Hotel Branding in the 1990's", EIU Travel and Tourism Analyst, 1 pp 23-35
Slattery, P; Litteljohn, D.L (1991) "The structure of Europe's economies and demand
for hotel accommodation", EIU Travel and Tourism Analyst, 4
Slattery, P (1991) "Quoted Hotel Companies: The world markets", Klienwort Benson
Securities Limited, Feb pp 20-46
Slattery, P; Roper, A (1986) "UK hotel groups directory 1986/7'', Huddersfield
Polytechnic Cassell pp 12
Slattery, P; Johnson, S.M (1993) "Hotel chains in Europe", EIUTravel and Tourism Analyst, 1 pp 65-80
Slattery, P; Johnson, S.M (1990) "The Decade Review", Kleinwort Benson Securities
Ltd January pp 34
Slattery, P; Feehely, G; Savage, M (1994) "Quoted Hotel Companies: The World
Markets 1994", Kleinwort Benson Securities Ltd March pp 17
Slattery, P; Johnson, S.M (1992) "Quoted Hotel Companies: The European Markets",
Kleinwort Benson Securities Ltd February
STB (1991) "Hotel occupancy in Scotland 1984-1991", Scottish Tourist Board
Edinburgh
STB (1991)(a) "Tourism in Scotland", Scottish Tourist Board, Edinburgh
STB (1991)(b) "The supply oftourist accommodation in Scotland 1990", Scottish
Tourist Board, Edinburgh
Tarrant, C (1989) "UK hotel industry - market restructuring and the need to respond to
customer demands", Tourism Management, September 10(3) pp 187-191
Teare, R. (1991) "Developing hotels in Europe: some reflections on progress and
prospects", International Journal of Contemporary Hospitality Management, 3( 4) pp 19-24
Teare, R (1989) "The hospitality industry in the 1990's : some critical developments".
Marketing Intelligence and Planning, 7(9) pp 48-49
Page 103
Teare, R (1990) "International Journal of Contemporary Hospitality Management",
Marketing Intelligence and Planning, 8(5) pp 12-14
Vandermerwe, S; Chadwick, M (1991) "Intemationalisation of services", in "services
marketing", editor Lovelock, C Prentice Hall London
Vierich, W; Calver, S (1991) "Hotels and the leisure sector : a product differentiation
strategy for the 1990's", International Journal of Contemporary Hospitality Management, 3(3) pp 10
Walker, C (1993) "The hospitality industry in the 1990's", Insights November Dl3-
Dl9
Page 104

CHAPTER FOUR
THE NATURE OF HOTEL UNITS: THE MARKET
LEVEL
4.1 INTRODUCTION
An industry is composed of a profusion of individual operating units, either in
collection or as unaffiliated units. Understanding the nature of individual hotel
operations, in particular pricing; profitability; costing and yield management, allows
an appreciation of issues pertaining to enhancing performance and efficiency of operations.
This chapter addresses such key issues facing hotel units within the context of
contemporary hospitality environments. The chapter begins by establishing the need
for an understanding of hotel unit structures in parallel with industry analysis before
adopting a pricing framework to examine the nature of hotel costs, revenue and profit.
4.2 THE INDUSTRY- MARKET GAP
Previous chapters highlighted the highly segmented and complex nature of the
tourism and hotel industry.
However, any industry is in effect a reflection of a multitude of individual businesses
operating either independently or as a group. The research approach has highlighted
the holistic or industrial aspects of the tourism and hotel industries. In order to fully
appreciate the nature of hotel operations, their markets, strategic options, and
underlying industry structure, it is necessary to examine hotels at the market level, i.e.
individual hotel units.
Hotel groups, while contributing to the composition of the industry also represent a
collection of individual hotels. While such hotels have similar corporate
characteristics, they are subject to different market level forces, resulting in each hotel
having an underlying structure different from that of other hotels in the group. It
would prove an almost impossible task to analyse every hotel within the industry.
This section seeks to emphasise the need to appreciate the nature of the hotel unit in
understanding and examining markets from an industry perspective.
The importance of unit level multi-site characteristics is further developed in
Appendix V where having taken an industry perspective to construct a performance
enhancement model the model is tested at the unit level.
Page 105
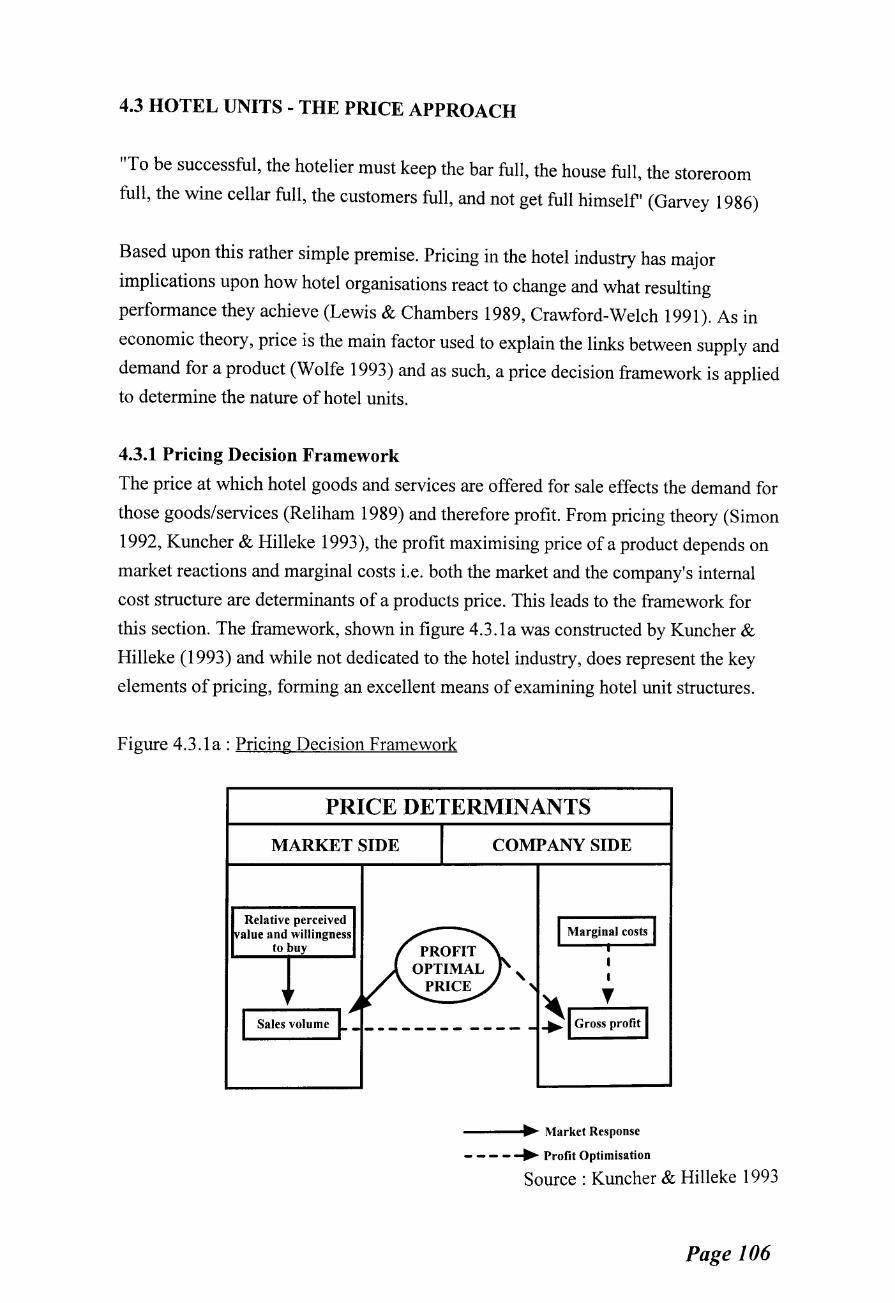
4.3 HOTEL UNITS - THE PRICE APPROACH
"To be successful, the hotelier must keep the bar full, the house full, the storeroom
full, the wine cellar full, the customers full, and not get full himself' (Garvey 1986)
Based upon this rather simple premise. Pricing in the hotel industry has major
implications upon how hotel organisations react to change and what resulting
performance they achieve (Lewis & Chambers 1989, Crawford-Welch 1991). As in
economic theory, price is the main factor used to explain the links between supply and
demand for a product (Wolfe 1993) and as such, a price decision framework is applied
to determine the nature of hotel units.
4.3.1 Pricing Decision Framework
The price at which hotel goods and services are offered for sale effects the demand for
those goods/services (Reliham 1989) and therefore profit. From pricing theory (Simon
1992, Kuncher & Hilleke 1993), the profit maximising price of a product depends on
market reactions and marginal costs i.e. both the market and the company's internal
cost structure are determinants of a products price. This leads to the framework for
this section. The framework, shown in figure 4.3.1a was constructed by Kuncher &
Hill eke ( 1993) and while not dedicated to the hotel industry, does represent the key
elements of pricing, forming an excellent means of examining hotel unit structures.
Figure 4.3.1a: Pricing Decision Framework
PRICE DETERMINANTS
MARKET SIDE
Relative perceived alue and willingness
to buy
Sales volume ~
COMPANY SIDE
'
----1 .... ~ Market Response
- -- -+ Profit Optimisation
Source: Kuncher & Hilleke 1993
Page 106
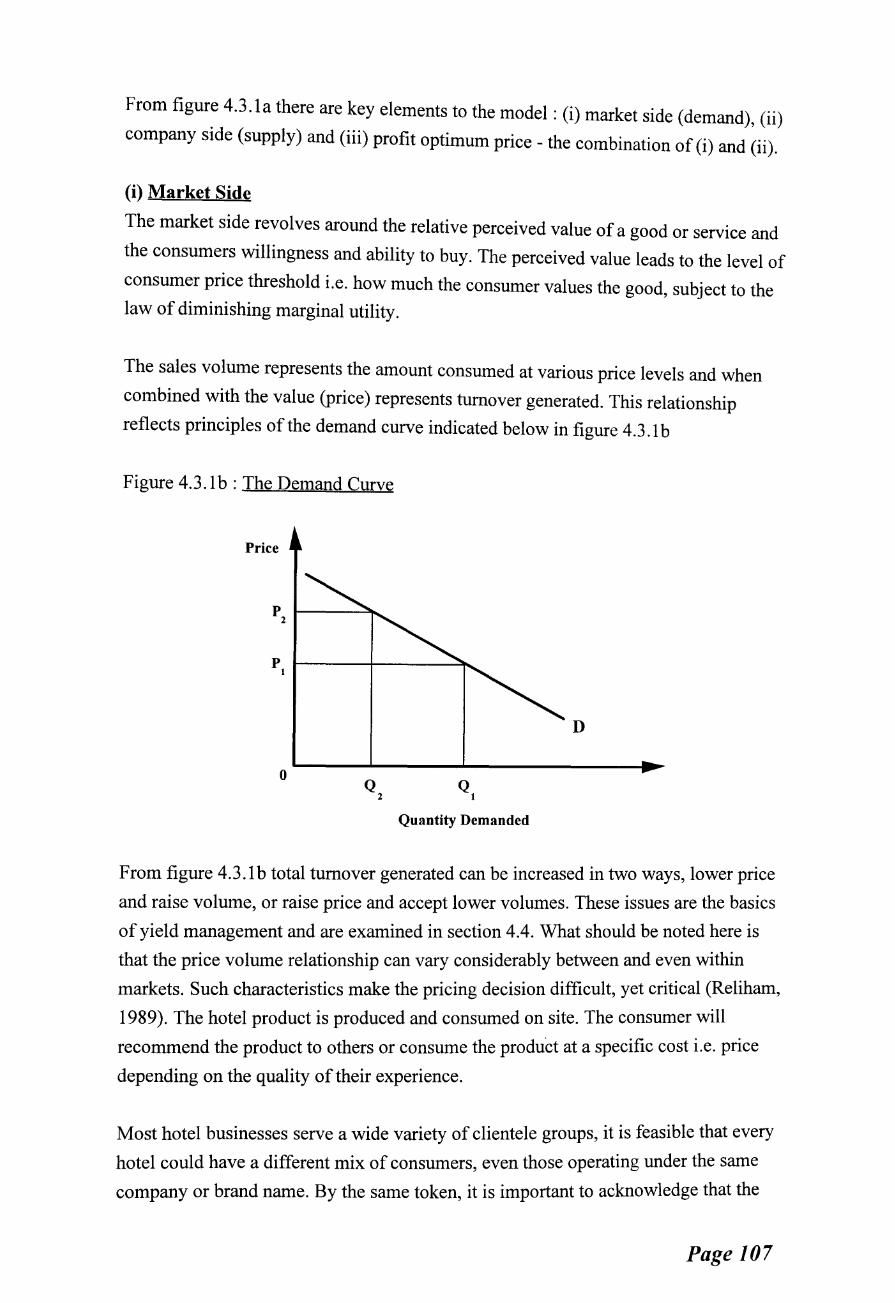
From figure 4.3.1a there are key elements to the model : (i) market side (demand), (ii)
company side (supply) and (iii) profit optimum price- the combination of (i) and (ii).
(i) Market Side
The market side revolves around the relative perceived value of a good or service and
the consumers willingness and ability to buy. The perceived value leads to the level of
consumer price threshold i.e. how much the consumer values the good, subject to the law of diminishing marginal utility.
The sales volume represents the amount consumed at various price levels and when
combined with the value (price) represents turnover generated. This relationship
reflects principles of the demand curve indicated below in figure 4.3 .1 b
Figure 4.3 .1 b : The Demand Curve
D
0 Q Q
2 1
Quantity Demanded
From figure 4.3.1 b total turnover generated can be increased in two ways, lower price
and raise volume, or raise price and accept lower volumes. These issues are the basics
of yield management and are examined in section 4.4. What should be noted here is
that the price volume relationship can vary considerably between and even within
markets. Such characteristics make the pricing decision difficult, yet critical (Reliham,
1989). The hotel product is produced and consumed on site. The consumer will
recommend the product to others or consume the product at a specific cost i.e. price
depending on the quality of their experience.
Most hotel businesses serve a wide variety of clientele groups, it is feasible that every
hotel could have a different mix of consumers, even those operating under the same
company or brand name. By the same token, it is important to acknowledge that the
Page 107

same consumer can fall into different target market categories. The corporate business
traveller during the week becomes a leisure traveller when on holiday or at weekends.
Different occasions find the same consumer having different expectations and needs
(Buttle 1986). This is shown in figure 4.3.lc, where the business market is depicted as
price inelastic i.e. a percentage rise in price is greater than the percentage fall in
quantity demanded. In the leisure market where demand is more elastic in nature the
percentage change in price is less than the percentage change in quantity demanded,
meaning if price is raised or lowered, demand levels alter considerably (Hanks et al 1992).
Figure 4.3.1c: Price Elasticity ofHotel Demand
D- Leisure
0 Q2 Q2 Ql Ql (Leisure) (Business) (Leisure)
Quantity Demanded
A hotel has a mixture of business and leisure markets, all with varying degrees of
elasticity as shown in figure 4.3.lc. The pricing decision becomes critical to ensure
price insensitive consumers i.e. highly inelastic, pay full tariff and do not trade down,
and that a price is reached where less of the price sensitive consumers are attracted.
This, combined with the nature of environments and the problems of seasonal markets
makes an understanding of the nature of hotel units is essential in determining
strategic direction.
(ii) Company Side
From the company side, the emphasis shifts to being more operational in nature and
focuses on the nature of marginal costs. Marginal costs are the incremental cost per
unit added to production or sales. The marginal cost is therefore the cost of selling one
extra bed night or one extra meal and is essentially the difference in variable cost
between each incremental sale. The marginal cost relationship leads to gross profit in
Page 108
that the greater the difference between marginal cost and revenue, once fixed costs are
covered, the greater the gross profit. The nature of hotel unit costs warrants more
detailed analysis and is therefore examined in the next section of this chapter.
Before determining in more detail the nature of costs, the profitability element of the
pricing framework is clarified and the most commonly adopted pricing methods identified.
(iii) Profit Optimal Price
After basic survival, profit is the primary goal of any commercial organisation.
The level of profit obtained can be expressed as :
Profit= Total Revenue- Total Costs
Total revenue is composed of the price of a good/service multiplied by the quantity of
the good/service sold. Total cost is represented by all costs associated with the
good/service.
To increase profit, revenue could be increased, either by increasing price, quantity
sold, or both. However, the impact of price changes on profitability depends on,
among other things, price elasticity (Orkin 1990), income elasticity, and the
possibility of substituting the good or service. It will also depend on supply variables
such as the relative competitive position ofthe company (Ardel & Woods 1991,
N orr bin 1993)
Alternatively to raise profits, costs can be reduced either in terms of (i) fixed costs
such as alternative forms of ownership, or in terms of (ii) semi-fixed i.e. reducing full
time staffing levels, or the (iii) variable cost i.e. cheaper food or smaller portions. The
danger when reducing costs is a reduction in quality, as the market side established
the price and revenue generated are dependent upon the consumers perceived value
and willingness to pay. Based on this premise, the most attractive way to raise profit
would be to increase revenue while operating at maximum efficiency.
How to maximise room rates and supplementary spend are therefore one of the
biggest day-to-day challenges facing the hotel unit. The over-supply of hotel rooms in
many markets (Fine 1993) combined with generally poor economic conditions forces
many managers to price their products as low as possible in attempts to raise volume
Page 109
and therefore profit. These concepts are discussed further in the yield management section of this chapter.
4.3.2 Methods of Pricing Hotel Rooms
It is clearly evident that the pricing technique used will have major implications on
how well the hotel can adapt to changing environmental and economic conditions.
Crawford-Welch ( 1991) classifies pricing into one of four categories (a) Cost pricing,
based on methods such as cost plus mark-up, contribution or break even, (b)
Competitive pricing based on meeting local competition, (c) Market demand pricing
and (d) Customer pricing techniques, based upon customer expectations and cognitive
ISSUeS.
The most commonly used methods of pricing, reflects the product driven approach to
pricing by hotels. Room rates are determined by a combination of location, view,
square footage and appointment (Orkin 1990) revolving around cost pricing
techniques. The three most evident methods appear to be (i) "rule of thumb", the rack
rate is calculated by charging £1 per night per £1000 construction costs, (ii) the
Hubbart formula, average room rate is calculated by totalling the undistributed
expenses with the required return and the rooms operating expenses, less the net
income from other departments, then dividing the whole lot by the number of room
nights, and (iii) the marginal costing method, where the average room rate is
calculated by adding the required return to total costs and dividing by the expected
number of room nights.
While in simple, less dynamic and less segmented markets such pricing methods
prove effective, a more demand driven strategy is required for modem hotel
operations (Orkin 1990). This leads to the notion of examining the nature of hotel
costs in more detail before focusing on yield management and alternative demand
driven approaches to enhancing hotel performance.
4.3.3 The Nature of Hotel Costs
The nature of hotel costs is of key importance to the means of pricing and therefore to
operational performance. In order to determine the nature of costs in the hotel unit it is
necessary to establish the types and elements of costs that exist i.e. the cost dynamics.
Having achieved this, comparisons of cost structures in the UK and Scotland can be
drawn.
Page 110
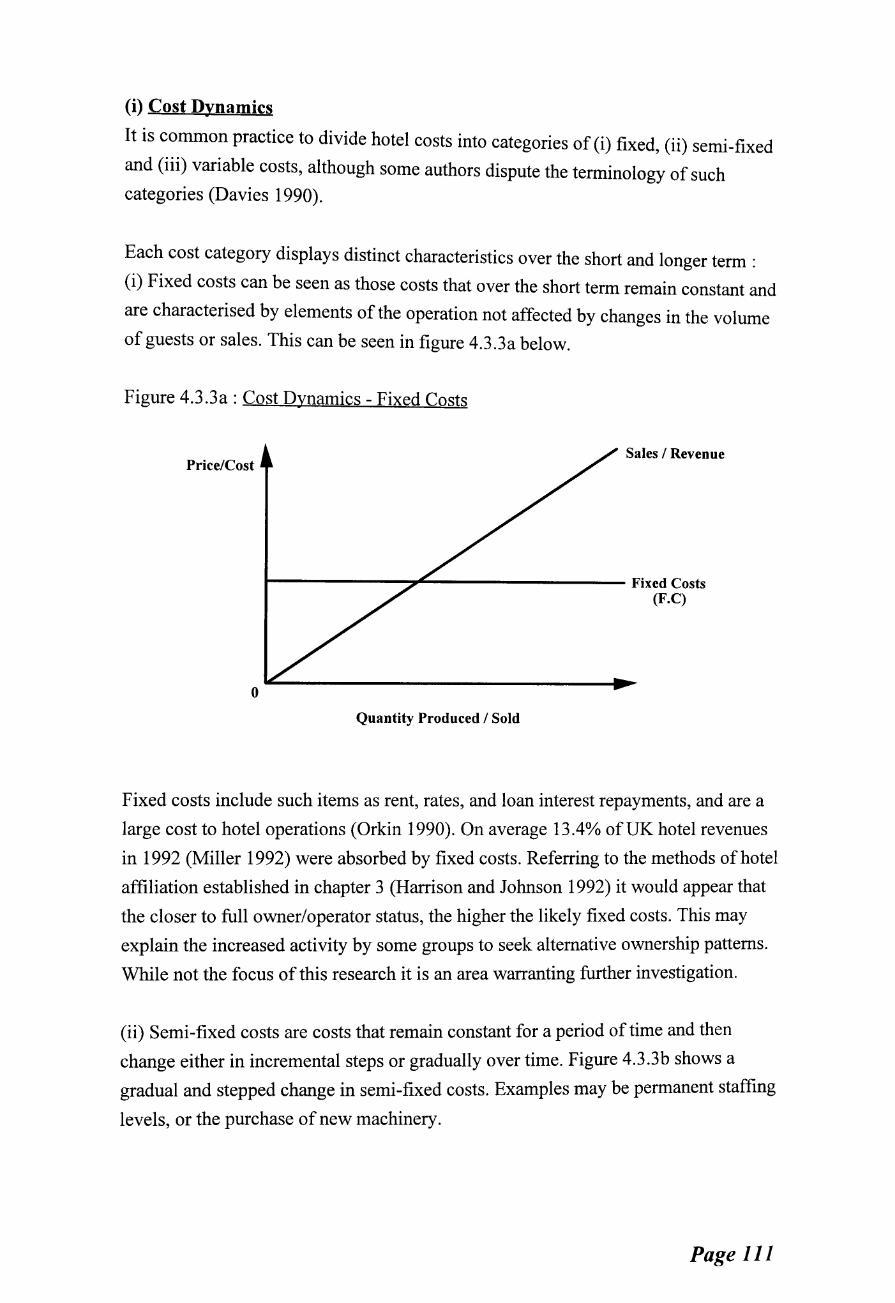
(i) Cost Dynamics
It is common practice to divide hotel costs into categories of (i) fixed, (ii) semi-fixed
and (iii) variable costs, although some authors dispute the terminology of such categories (Davies 1990).
Each cost category displays distinct characteristics over the short and longer term :
(i) Fixed costs can be seen as those costs that over the short term remain constant and
are characterised by elements of the operation not affected by changes in the volume
of guests or sales. This can be seen in figure 4.3.3a below.
Figure 4.3 .3a : Cost Dynamics - Fixed Costs
Sales I Revenue Price/Cost
t--------::Jf'---------- Fixed Costs (F.C)
0
Quantity Produced I Sold
Fixed costs include such items as rent, rates, and loan interest repayments, and are a
large cost to hotel operations (Orkin 1990). On average 13.4% ofUK hotel revenues
in 1992 (Miller 1992) were absorbed by fixed costs. Referring to the methods of hotel
affiliation established in chapter 3 (Harrison and Johnson 1992) it would appear that
the closer to full owner/operator status, the higher the likely fixed costs. This may
explain the increased activity by some groups to seek alternative ownership patterns.
While not the focus of this research it is an area warranting further investigation.
(ii) Semi-fixed costs are costs that remain constant for a period of time and then
change either in incremental steps or gradually over time. Figure 4.3.3b shows a
gradual and stepped change in semi-fixed costs. Examples may be permanent staffing
levels, or the purchase of new machinery.
Page 111
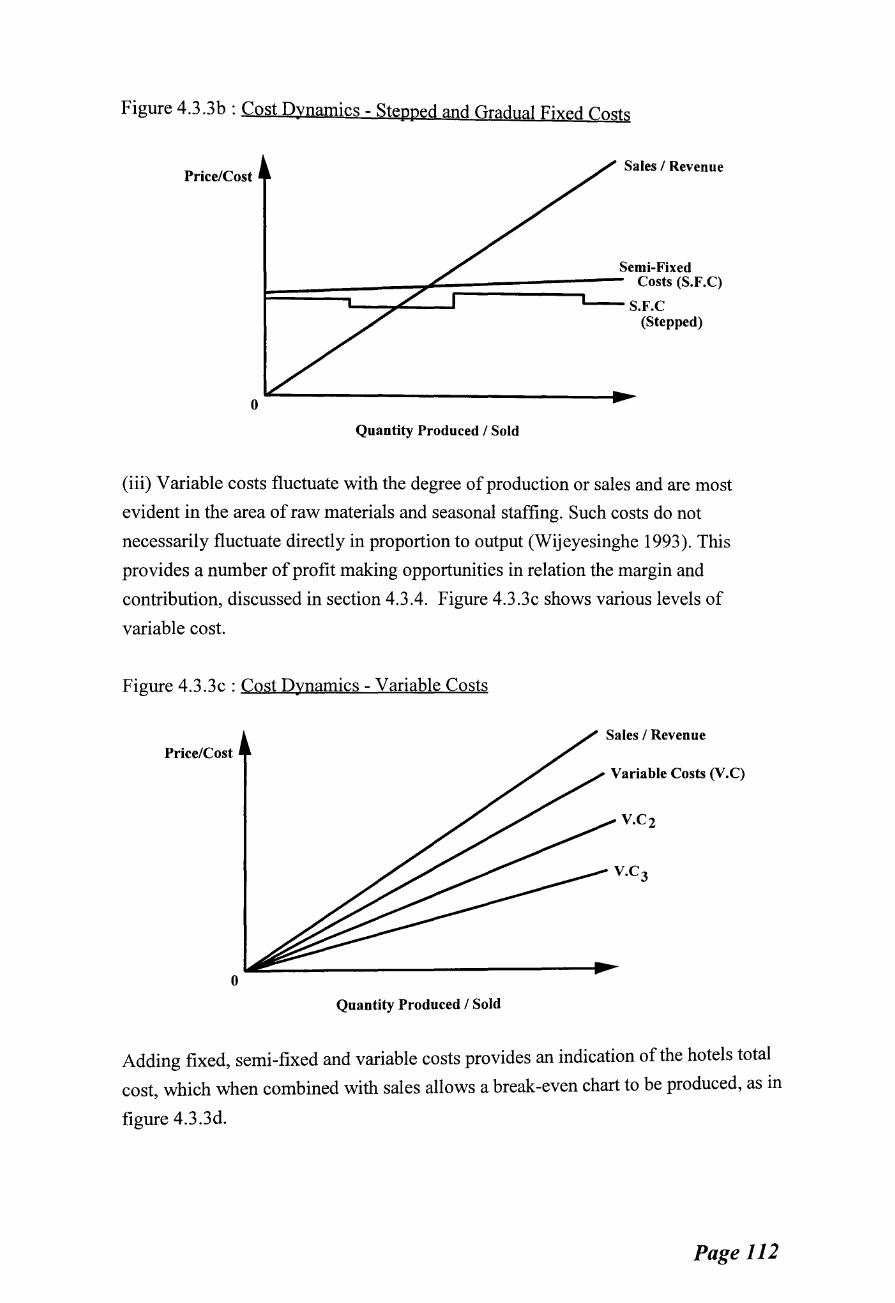
Figure 4.3.3b: Cost Dynamics- Stepped and Gradual Fixed Costs
Price/Cost Sales I Revenue
0
Quantity Produced I Sold
(iii) Variable costs fluctuate with the degree of production or sales and are most
evident in the area of raw materials and seasonal staffing. Such costs do not
necessarily fluctuate directly in proportion to output (Wijeyesinghe 1993). This
provides a number of profit making opportunities in relation the margin and
contribution, discussed in section 4.3.4. Figure 4.3.3c shows various levels of
variable cost.
Figure 4.3.3c: Cost Dynamics- Variable Costs
Sales I Revenue Price/Cost
Variable Costs (V.C)
0
Quantity Produced I Sold
Adding fixed, semi-fixed and variable costs provides an indication of the hotels total
cost which when combined with sales allows a break -even chart to be produced, as in '
figure 4.3 .3d.
Page 112

Figure 4.3.3d: Cost Dynamics- Break Even
Price/Cost
-Margin of Safety-
Sales I Revenue
Total Cost (incl. S.F.C)
v.c
0 Break Even Quantity
Quantity Produced I Sold
The break even chart illustrates that profit is made above the intersection of sales and
total costs and that the margin of safety i.e. reduction in sales revenue or increase in
operating costs, is to the right of this point. As such calculations often represent one
point in time, despite providing useful information on an holistic level they should not
be treated in isolation, i.e. basic profit or loss does not provide sufficient detail of
individual units of sale. Hence it is necessary to examine the elements of hotel cost.
4.3.4 Elements of Hotel Costs
Kotas and Davis (1976) provide a simplistic breakdown of the relationship of hotel
costs relative to sales and profitability. Figure 4.3.4a shows this break down.
Figure 4.3.4a: Hotel Cost Relationships
TOTAL COSTS
84°/o
-
-
(a) Materials
40%
(b) Labour 24%
(c) Overheads 20%
(d) Net Profit
16%
SALES 100°/o
Source: Kotas & Davis (1976)
From figure 4.3.4a the relationship between costs, sales, and profitability is clearly
evident. Sales can be seen to represent all costs plus profit or similarly profit can be
Page 113

seen as sales less costs. While this relationship is acceptable when adopting an holistic
approach to a hotels cost-profit relationship, it neglects to account for the complex
package that makes up the sales structure of a hotel, as established in Chapter 2.
Included in the total sales for the hotel unit are room revenues, catering, telephone,
services, etc. The result is that when related to costs, the margins will vary throughout
the hotel and thus the contribution that each department achieves will vary. This is shown in figure 4.3.4b.
Figure 4.3.4b: Departmental Contribution
COSTS ASSOCIATED WITH ...
Rooms
Food
Drink
Services
Based upon the former, probably the two most important cost elements in
understanding the nature of hotels are the concepts of marginal costing and
contribution. These in effect expose the nature of hotel costs and revenue structures,
through accounting for the high fixed cost base and the importance of covering
variable costs relative to seasonality and elasticity of demand.
(i) Marginal Costing
Much has been written from a technical perspective regarding benefits of marginal
costing and marginal income (Bonnisseau & Cornet 1990, Vohra 1992, Kelly &
Gopalan 1992, Naish 1990). This section seeks to simplify the concept of marginal
costing in relation to hotel operations.
Marginal costing can be defined as "the increase or reduction in total cost, at a given
volume of output, resulting from an increase or reduction of one unit of output"
(Boardman 1978). Marginal revenue is the additional revenue obtained from
Page 114
producing one extra unit of output. Marginal income is the profit or difference
between the marginal revenue and marginal cost.
The theory is, that for a short period, additional sales can be added to the normal sales
volume profitably even at prices too low to cover a proportionate share of fixed
overhead (Boardman 1978). This is because the hotel overheads have been met by
previous sales so as long as the remaining rooms sold cover the variable cost of
offering those rooms then additional profit is being made.
Marginal costing and marginal income can thus be very useful tools for the unit
manager and form the basis of many hotel strategies, ranging from packaging, to short
break markets.
(ii) Contribution
The difference between the selling price per unit of additional sales, and the marginal
cost of those sales, is the contribution per unit to fixed expenses, and profit, generally
referred to simply as the "contribution". If the selling price is greater than the
marginal cost, identified earlier, then there will be a contribution to profit from
additional sales, however, if the marginal cost is greater than the selling price the
extra business will result in a loss. (Boardman 1978, Hughes 1989)
In a period when losses are being made due to high fixed expenses a positive
contribution may reduce the loss without actually resulting in a profit. This can be
essential for survival and is well worth striving for during slack periods of demand.
Marginal income techniques and contribution may appear similar. The methods
represent two inverted approaches. Marginal income ensures the hotels fixed and
variable costs have been covered by the existing volume of output before allowing
additional units of output. As additional output represents additional variable cost
only, as long as the variable cost is covered, profits are made.
The contribution concept attempts to at least cover variable costs and go some way to
contribute to fixed costs and hopefully profit. Obviously, the most desirable method
for hotel units is the marginal income approach, this is where yield management can
be of benefit.
Before focusing on yield management techniques, to provide a contextual view of the
nature of hotel unit costs, comparisons are drawn between cost structures of hotels
Page 115
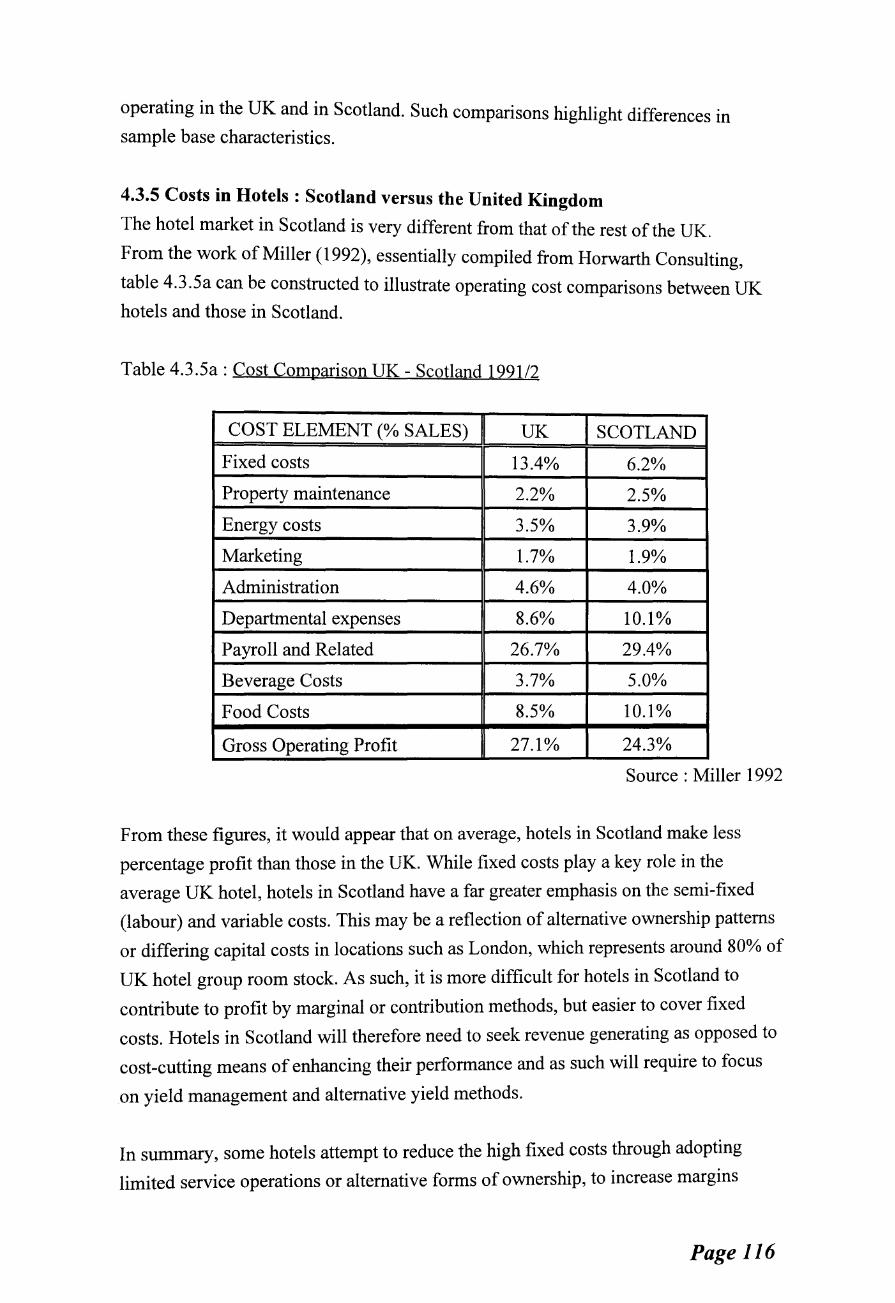
operating in the UK and in Scotland. Such comparisons highlight differences in sample base characteristics.
4.3.5 Costs in Hotels: Scotland versus the United Kingdom
The hotel market in Scotland is very different from that of the rest of the UK.
From the work of Miller (1992), essentially compiled from Horwarth Consulting,
table 4.3.5a can be constructed to illustrate operating cost comparisons between UK
hotels and those in Scotland.
Table 4.3.5a: Cost Comparison UK- Scotland 1991/2
COST ELEMENT (% SALES) UK SCOTLAND
Fixed costs 13.4% 6.2%
Property maintenance 2.2% 2.5%
Energy costs 3.5% 3.9%
Marketing 1.7% 1.9%
Administration 4.6% 4.0%
Departmental expenses 8.6% 10.1%
Payroll and Related 26.7% 29.4o/o
Beverage Costs 3.7% 5.0%
Food Costs 8.5% 10.1%
Gross Operating Profit 27.1% 24.3%
Source : Miller 1992
From these figures, it would appear that on average, hotels in Scotland make less
percentage profit than those in the UK. While fixed costs play a key role in the
average UK hotel, hotels in Scotland have a far greater emphasis on the semi-fixed
(labour) and variable costs. This may be a reflection of alternative ownership patterns
or differing capital costs in locations such as London, which represents around 80% of
UK hotel group room stock. As such, it is more difficult for hotels in Scotland to
contribute to profit by marginal or contribution methods, but easier to cover fixed
costs. Hotels in Scotland will therefore need to seek revenue generating as opposed to
cost-cutting means of enhancing their performance and as such will require to focus
on yield management and alternative yield methods.
In summary, some hotels attempt to reduce the high fixed costs through adopting
limited service operations or alternative forms of ownership, to increase margins
Page 116

through lower cost and greater volume e.g. Travelodge or management contracting
respectively. The majority of hotels are subject to high fixed costs making
contribution and therefore marginal costing important (Orkin 1990).
Hence, in the short run, the hotel will be interested in covering the variable or prime
(Davies 1990) costs in order to stay in business. Any contribution made to the fixed or
supplementary cost is a bonus, whether producing profit or reducing losses. Hence
yield management becomes of particular importance, especially for hotels operating in
Scotland where gross operating profits are lower and costs more variable in nature.
4.4 THE ROLE OF YIELD MANAGEMENT : A DECISION TOOL
The management of capacity, or yield management has been identified as one strategy
that can be adopted by hoteliers in order to balance demand and supply (Jones &
Lockwood 1989). It is a technique which focuses management decision-making on
the maximisation of returns from the sale of the central hotel product :
accommodation (Brotherton & Mooney 1992). Indeed a survey by NOP (1993)
established that filling rooms was the number one priority of 88% of UK hotels.
Focusing management attention on the basic principles of pricing and controlling
inventories, yield management has proven a useful tool for maximising revenues
(Reliham 1989), particularly in the airline industry, where its roots lie (James 1987,
Larsen 1988, Williams 1987, Carter 1988, Kimes 1989).
To a great extent, development and application in the hotel sector is still at an
evolutionary stage of development (Donaghy et al 1994, IHA 1992) with debate
concerning the applicability of the concept to the hotel industry (Verchere 1993) and
in particular the segmented nature of hotel markets (Dunn & Brooks 1990).
Airlines and hotels are similar in that they both operate with fixed capacity and
perishable inventories. However, Kimes (1988) and Orkin (1988) have drawn
attention to some specific problems existing in hotels and not airlines, namely : the
lack of a distinct rate structure; multiple night stays; multiplier effects; and
decentralisation of information.
Hanks et al (1992), establishes that hotels provide ideal conditions for implementing
yield management, as they display low variable costs; high fixed costs; perishable
Page 117
inventories; variable patterns of demand; an ability to forecast future patterns of
demand; and an ability to segment customers on their varying needs, behaviour, and
willingness to pay. Whatever the argument, the underlying principles of yield
management are simple - to maximise revenue and optimise profit.
In hotels, the most commonly adopted measure of the effectiveness of practices and
policies applied to maximise revenue is the realised revenue divided by the revenue
potential. This can be applied to room, restaurant or bar sales.
Perhaps the most prominent measure is that of room sales. In this area many
combinations of occupancy and average room rate could generate equal revenue and
yield percentages. However, not all these combinations are necessarily equally
beneficial for overall profitability. A combination of lower occupancy and higher
rates, or vice-versa may be equally desirable due to lower room servicing costs of the
former or higher potential food and beverage revenues related to the latter (Jones &
Lockwood 1989). Hence, while yield management's primary focus is often regarded
as the maximisation of sales revenue (Orkin 1988) it is a "concept of further extension
in terms of the development of an optimum business mix to maintain profitable
product - market alignment".
The application of yield management within a hotel environment is therefore
essentially an attempt to enhance a hotel's ability to operate a flexible, adaptive and
predictive market response strategy which seeks to match variable market conditions
with the selection of products offered, i.e. segmented markets. Yield management
should therefore be viewed simply as the practice of optimising profits from the sale
of perishable assets, it is "not a computer system (although computer systems can be
used to support it) nor a set of mathematical techniques. It is an approach to
increasing revenues and improving service by responding to current demand."
(Lieberman 1993)
The next section determines the methods by which hotels attempt to "increase
revenues and improve service by responding to demand" and in the process maximise
profitability.
Page 118
4.5 ALTERNATIVE YIELD METHODS
Yield management is the revenue generation side of the profitability equation. A
number of yield strategies have emerged over the last decade, the most prominent
being discounting, segmentation, packaging, differentiation through value added,
repositioning and offering short breaks. These strategies are often adopted in some
form of mix.
4.5.1 Discounting
Discounting is the term given to hotel rooms that are offered for sale at rates below
the published room rate. Although the practice of discounting is widespread, it may
not be the most profitable way to fill rooms (Egan & Haynes 1992). One may expect
that the hotel industry would apply structured and logical rules for discounting, this is
generally not the case (Hanks et al 1992, Rice 1993). Hotels in different locations
have different levels of discounts, with discounts varying widely throughout the year
(Carrol11986). Usually, the degree of discounting varies according to property size
and hotel location. The larger the property the higher the room rates and discounting
percentage. Rates in most cities, which have the most expensive hotels also show
above average discounting (MacGill1992). Walker (1993) established that
discounting may be a feasible option for large hotel groups to gain market share, as
"in tough economic times the high price player can cut rate to hold occupancy, a move
the low price operator cannot counter by suddenly adding more upscale facilities." In
addition, MacGill (1992) identifies that by using discounting strategies to get people
into the hotel, profit levels have been maintained essentially due to additional
supplementary spend i.e. contribution.
Discounting seems to be a feasible option for larger hotel groups, but it is certainly
not a viable one. Discounting is damaging to the bottom line. The relationship
between pricing strategies and bottom line results has been shown to be quite
intricate, with discounting not producing favourable profit results (Hanks et al 1992).
It could, however, be argued that the very nature of demand and the demand curve,
force hotels to discount to satisfy as many guests as possible and maximise revenues
from existing demand, shown in figure 4.5.1a.
Page 119
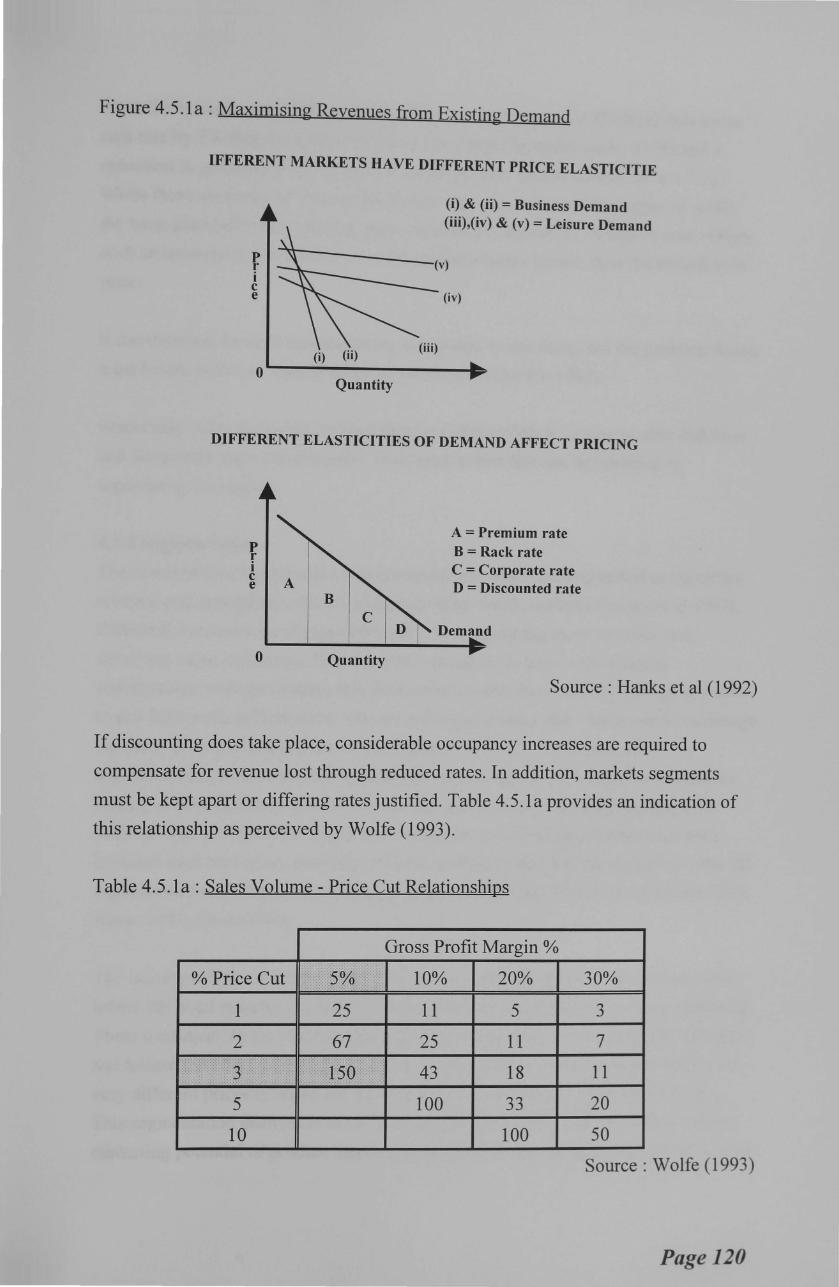
Figure 4.5.1a: Maximising Revenues from Existing Demand
IFFERENT MARKETS HAVE DIFFERENT PRICE ELASTICITIE
p r i c e
(i) & (ii) = Business Demand (iii),(iv) & (v) = Leisure Demand
(iv)
(i) (ii) o~--~-------------4~
Quantity
DIFFERENT ELASTICITIES OF DEMAND AFFECT PRICING
f i ~ A
B
0 Quantity
A = Premium rate B =Rack rate C = Corporate rate D = Discounted rate
Source : Hanks et al (1992)
If discounting does take place, considerable occupancy increases are required to
compensate for revenue lost through reduced rates. In addition, markets segments
must be kept apart or differing rates justified. Table 4.5.1a provides an indication of
this relationship as perceived by Wolfe (1993).
Table 4.5.1a: Sales Volume- Price Cut Relationships
Gross Profit Margin%
%Price Cut I> ~% .. • I > >.J>· J .. > ...... 10% 20o/o 30%
1 25 11 5 3
2 67 25 11 7 ' <>:<. r .· ... , .... >iso ..
43 18 11
5 100 33 20
10 100 50
Source : Wolfe (1993)
Page 120

From the example provided by Wolfe (1993) it can be seen that if a hotel cuts room
rack rate by 3% then the number of rooms sold must be increased by 150% and a
reduction in gross profit of 5% must be expected (see shaded area of table 4.5.1a).
While there are many environmental factors that will influence the degree of profit,
the basic premise is that reducing price requires an increase in volume of sales. Often.
such an increase in sales will need to be proportionately greater than the reduction in pnce.
It can therefore be seen that improving occupancy is one thing, but the problem facing
most hotels is how to rebuild achieved room rates (Gordon 1993).
Essentially, what is needed, as identified by Orkin (1990) is "a way to offer full rates
and discounted rates concurrently." To a great extent this can be achieved by
segmenting the market.
4.5.2 Segmentation
The economics of supply and demand require that hotels are segmented to maximise
revenue and attempt to cover the properties large fixed cost base (Hanks et al 1992).
Different customers are charged different prices, capturing more revenue, and
satisfying more customers. The key to the concept is to have a meaningful
segmentation strategy in place that differentiates customers who are willing and able
to pay higher prices from those who are willing to change their behaviour in exchange
for lower price points (Reliham 1989, Hanks et al1992). As such, market
segmentation allows improved product pricing through the development of separate
pricing structures (Berry et al 1991) and through products especially designed for
different market segments. Single businesses can serve multiple market segments,
however such businesses must ensure hotel operations are flexible enough to meet the
expectations of different users throughout the week (Teare, Davies & McGeary 1989,
Russo 1991, Quain 1992).
The incompatibility of different market segments was identified by the airlines long
before the hotel industry recognised the issue either as a problem or as an opportunity.
These incompatibilities become most apparent between the key segments of business
and leisure travellers who might occupy the same seat (or hotel room) but have paid
very different prices in return for forfeiting certain degrees of flexibility or choice.
This segmentation phenomenon has been stimulated by recognition of the increased
marketing potential of product branding aimed at specific markets, resulting in a hotel
Page 121
market that is highly sophisticated (EIU 1991) and with the key companies using a
combination of segmentation strategies and techniques to keep segments apart.
4.5.3 Packaging
What appear to be bargain rate packages can be used as a strategy to generate
substantial new business from markets unwilling to pay rack rate. The success of such
packages appears to hinge on the means by which items are "bundled" together
(Guiltinan 1987) in an attempt to "tangiblise the intangible" (Buttle 1986). Often
these items would be of little value to the full rate payer or would add more perceived
value to the product as a package as opposed to individually. This may be achieved
through ease of purchase or value in cash retail terms (Orkin 1990), examples include
"complementary" bottles of wine, chocolates, or flowers for a honeymoon couple, or
the use of a leisure centre or typing facilities for a business traveller.
4.5.4 Differentiation Through Value Added
"Goods manufacturers seek competitive advantage through features that may be
visually or measurably identified, cosmetically implied or rhetorically claimed by
reference to real or suggested hidden attributes that promise distinction from
competitive goods" (Levitt 1980). Therefore in the highly competitive hotel market,
the level and quality of service delivered is the key differential attribute (Lovelock
1991). This is commonly achieved through differentiation of physical facilities,
market level, and more recently possession ofBS5750 as an indication of raised
quality.
4.5.5 Repositioning
The intention here is simply to recognise that the industry has had to focus on
maximising returns from existing products rather than developing new ones. Thus
making an under performing hotel respond to market dynamics may involve a total
market repositioning (Bohan & Cahill 1992) or possibly even the decision to close
during certain times of the year (Cahill 1987).
4.5.6 Offering Short Breaks
Short breaks are to a great extent a function of the nature of hotel operations cost
structure, environmental change, and the off-peak/seasonality drive for demand. They
are widely recognised as a key growth market for hotels and have distinct market
characteristics essentially evolving from the off peak weekend break to a market in
their own right. Major city centre hotels had targeted the business market which
meant high occupancy percentages between Monday and Thursday. Additional
Page 122
revenue was therefore sought, and by using an attractive pricing policy the short break
market evolved (Davies 1990). Short breaks are economically worthwhile as long as
variable costs are met. In reality, many short breaks provide the opportunity to secure
considerable additional revenue and to contribute significantly to profits. Senior and
Morphew (1990) identified that the survival of traditional operators will require them
to extend their horizons and move from short-term tactics :pricing and product
augmentation; to long-term strategies. The provision of short breaks provides such a
strategy. Hence, as customers become more sophisticated in manipulating the current
pricing system of hotels, hotels will eventually be forced to modify their pricing
structure (Hanks et al 1992) and can react by combining the key elements of yield
management through the provision of short breaks. This raises the need for suppliers
to understand the dynamics of the short break market and means of optimising returns
from such markets.
4.5. 7 Yield Management Summary
Yield management methods combined with information technology (I. T) therefore
allow highly complex decisions to be made with regard to capacity management and
thus make information more manageable. The application of such methods facilitates
maximisation of returns based upon the underlying cost and revenue structures and as
such provides varying degrees of performance/survival depending upon the methods
selected and how they are implemented.
This research focuses on the yield method of short breaks, which in essence represents
a combination of a number of yield strategies and thus warrants further investigation.
Page 123
4.6 CHAPTER SUMMARY
This chapter has, through the application of a pricing decision framework, and
understanding of the nature of micro hotel operations, established key issues facing
hotel units and potential response strategies.
Concepts of the pricing decision have been examined from both the market (demand)
and costing (supply) dimensions, highlighting the nature of hotel operations and the
need to maximise returns (profitability).
The differences between the UK and Scotland hotel markets have been reinforced at
unit level, and the highly complex and segmented nature of hotels emphasised. A
range of alternative yield management strategies have been determined and their
relevance to hotel operations explained.
The chapter has established that often the cost structure particularly the high fixed
costs, and the importance of margins, contribution and the nature of hotel demand,
affect the type of strategies adopted by hotels. Exploring the range of strategies, a key,
and potentially highly profitable strategy has emerged- the provision and
development of the short break markets. The short break market is a strategy
combining the strengths of many of the yield methods and is relatively accessible to
all hotel operations either independent or part of a group. This area of short break
provision is relatively unresearched yet appears to be of considerable importance to
the UK hotel industry, and Scotland in particular. This area therefore warrants more
detailed investigation.
The next chapter will focus on the evolution, volume and value of short breaks and
through demand and supply analysis establish the structure of the short break market
in the UK.
Page 124
REFERENCES
Arbel, A; Woods, R.H ( 1991) "Inflation and hotels : the cost of following a faulty
routine", The Cornell HRAQ, February 31(4) pp 66-75
Arnold, D (1994) "Profits and prices: a lodging analysis", Cornell HRAQ, 35(1) pp 30-33
Berry, W.L (1991) "Factory focus: segmenting markets from an operators
perspective", Journal of Operations Management, 10(3) August pp 363-387
Boardman, R.D (1978) "Hotel and catering - costing and budgets", 3rd Edition
Heinemann London pp 15 3
Bohan, G; Cahill, M (1992) "Determining the feasibility ofhotel market
repositioning", Real Estate Review, Spring 22(1) pp 63-7 4
Bonnisseau, J; Comet, B (1990) "Existence of marginal cost pricing equilibria : the
nonsmooth case", International Economic Review, August 31(3) pp 685-
708
Brotherton, B; Mooney, S (1992) "Yield management", International Journal of Hospitality Management 11(1) pp 23-32
Buttle, F (1986) "Hotel and food service marketing : a managerial approach", Cassell
London
Cahill, M (1987) "Seasonal resorts: the offseason challenge", The Cornell HRAQ, August pp 86-95
Carroll, J.D (1986) "Discounting hotel rack rates", The Cornell HRAQ, August pp
13
Carter, R (1988) "Screen Dreams", The Business Traveller, April pp 33-35
Crawford-Welch, S (1991) "Strategic Hospitality Management- Theory and Practice
for the 1990's", Teare, R; Boer, A Cassell pp 182
Davies, B (1990) "The economics of short breaks", International Journal of Hospitality Management, 9(2) pp 103-106
Davis, J (1989) "Globalization ofhotel market is going strong: segmentation is
meeting the needs of the 1990's", National Real Estate Investor, December
31(13) pp 59-76
Dev, C.S (1990) "Marketing practices of hotel chains", The Cornell HRAQ, November pp 54-63
Dunn, K.D; Brooks, D.E (1990) "Profit analysis: beyond yield management",
Cornell HRAQ, 31(3) pp 80-90
E.I.U (1991) "Special Report", No 1180
Page125
Egan, P; Haynes J (1992) "The anatomy of a failure : A hotel", Real Estate Review , Spring 22(1) pp 75-79
Fine, M (1993) "The tough work of rate management", Lodging Hospitality, January 49(1) pp 34
Garvey, J (1986) "Outlook and opportunities in market segmentation", in "The
practice of hospitality management" Lewis, R.C; Beggs, T; Shaw, M AVI
Publishing Company Inc. Connecticut pp 451-455
Gordon, R (1993) "Long term outlook bright for the UK hotel industry", Caterer & Hotelkeeper, 1 July pp 21
Guiltinan, J (1987) "The price bundling of services", Journal of Marketing, April 51 pp 74-85
Hanks, R.D; Cross, R.G; Noland, R.P (1992) "Discounting in the hotel industry: a
new approach", The Cornell HRAQ, February pp 15-23
Harrison, L; Johnson, K (1992) "UK Hotel groups directory", Hotel & Catering
Research Centre, Huddersfield Univ Cassell
Horwarth Consulting (1992), "The UK Hotel Industry", Horwarth Consulting
Limited, London
Hughes, H.L (1989) "Economic for hotel and catering students", Stanley Thomas,
London
I.H.A (1992) "Yield revenue management", International Hotel Association
Congress, Bangkok pp 1-52
James, G.W (1987) "Fares must yield to the market", Airline Business, January pp
16-19
Jones, P; Lockwood, A (1989) "The management of hotel operations", Cassell
London
Jones, P ( 1993) "Managing capacity", in "The international hospitality industry :
Organisational and operational issues" edited by Jones, P; Pizam, A Pitman
London pp 148
Jones, P; Lockwood, A (1989) "Approaches to the measurement of accommodation
performance", International Journal Contemorary Hospitality Management Launch Conference Proceedings April vol.2 pp 45-56
Jones, P; Hamilton, D (1992) "Yield management : putting people in the big picture",
The Cornell HRAQ, February 33(1) pp 89-95
Kelly, T; Gopalan, R (1992) "Managing for profit", LIMRAs' Market Facts,
November 11(6) pp 47-50
Kimes, S.E (1989) "The basics ofyield management", The Cornell HRAQ, 30(3) PP
14-19
Page 126

Kotas, R; Davis, B (1976) "Food cost control", International Textbook Company Ltd. London
Kuncher, E; Hilleke, K (1993) "Value pricing through conjoint measurement: a
practical approach", European Management Journal, September 11(3) pp 283-290
Larsen, T.D (1988) "Yield management and your passengers", ASTA Agency
Magazine, June pp 46-48
Levitt, T (1980) "Marketing success through differentiation of anything", Harvard Business Review, January/February pp 73
Lewis, R.C; Chambers, R.E (1989) "Marketing leadership in hospitality : foundations
and practices", Von Nostrand Reinhold New York pp 353-387
Lieberman, W.H (1993) "Debunking the myths of yield management", The Cornell HRAQ, February 34(1) pp 34-41
Lovelock, A ( 1991) "Services marketing", 2nd Edition Prentice Hall London
MacGill, J (1992) "Desolation Row", Scottish Business Insider, September pp 45-
48
Millar, B (1992) "In times of gloom there's still good news for the hotel lobby", The Scotsman, Tuesday 15 September pp 25
N.O.P (1993) "Market Report 1993", Hotel and Restaurant Magazine, November
pp 15-30
Naish, H (1990) "The near optimality of mark-up pricing", Economic Inquiry, July
28(3) pp 555-585
Norrbin, S.C (1993) "The relationship between price and marginal cost in US
industry: a contradiction", Journal of Political Economy, 101(6) pp 1149-
1164
Orkin, E.B (1988) "Boosting your bottom line with yield management", The Cornell HRAQ, 28(4) pp 52-56
Orkin, E.B (1990) "Strategies for managing transient rates", The Cornell HRAQ, February pp 34-39
Quain, W.J (1992) "Analyzing sales mix profitability", The Cornell HRAQ, April
pp 57-62
Reliham, W.J (1989) "The yield management approach to hotel room pricing", The Cornell HRAQ, May 30(1) pp 40-45
Rice, F (1993) "Why hotel rates won't take off- yet", Fortune, October 4 128(8)
pp 124-128
Russo, J.A (1991) "Variance analysis: evaluating hotel room sales", The Cornell HRAQ, February 31( 4) pp 60-65
Page 127
Senior, M; Morphew, R (1990) "Competitive strate~ies in the bud~et hotel sector",
International Journal of Contemporary Hospitality Management, 2(3) pp 2-9
Teare, R; Davies, M; McGeary, B (1989) "The operational challenge ofhotel short
breaks", Journal ofContemporary Hospitality Management, 1(1) pp 19-23
Verchere, I (1993) "Airlines try the flexible approach on seats", The European, 17-
23 December pp 24
Vohra, R (1992) "Marginal cost pricing under bounded marginal returns",
Econometrica, July 60(4) pp 859-876
Walker, B.H (1993) "What's ahead: a strategic look at lodging trends", The Cornell HRAQ, October 34(5) pp 28-34
Wijeyesinghe, B (1993) "Breakin~ even", Hospitality, February pp 16-17
Williams, I (1987) "Dark science brings boost to airline profits", Sunday Times 27
November pp 94
Wolfe, A (1993) "How to profit from premium priced brands", Marketing Business,
June pp 28-32
Woodward, H.N (1976) "Management strategies for small companies", Harvard Business Review, January/February No.761 pp 63-74
Page 128

CHAPTER FIVE
SHORT BREAKS -A LOGICAL PROGRESSION
5.1 INTRODUCTION
This chapter seeks to provide a grounding for the analysis of strategies and
performance enhancement of companies in the short break market, determining the
highly segmented nature of the market.
To do this, short breaks are defined, before providing an indication of why short
breaks are offered. An evolutionary review of market development to date is
undertaken, followed by and examination of the value, volume and growth of the
short break market in the UK and Scotland. The value of the market to hotels and
particularly hotel groups is then established. The segmented nature of the short break
market is highlighted and a model of the short break market structure is presented.
Foundations for Chapter 7 are laid, where the specific structure of Commercial Short
Holiday Break (CSHB) markets are examined and demand and supply profiles
established.
5.2 DEFINING SHORT BREAKS
Despite the fact that the short break phenomenon is not new, and not restricted to the
UK (Loverseed 1992, Cockerell 1989, Potier & Cockerell 1992), there is still no
standardised definition for short break, short holiday, short holiday break, short break
holiday, or bargain break.
A short break is essentially characterised by the duration of stay (Lohmann 1991 ), and
the form of accommodation used (BTA 1989).
5.2.1 Duration of Stay
Since the 1940's short holidays have been termed "trips of up to three nights away
from home, primarily for holiday purposes" (Beioley 1991). While this duration of
stay is the most commonly accepted for defining short break holidays, (BTA 1989,
UKTS 1991, Law 1991(a); 1990, Beioley 1991, Bailey 1989, Davies 1990) a more
current stream of thinking is that short breaks are actually characterised by duration of
stay of one to four or five nights (Schidhauser 1992, Mew Research 1994).
These new definitions of short break holiday while adding to the incomparability of
data sources do not fully establish why definitions have changed and may in effect
represent the changing nature of the short break market from an off peak market to a
Page129
recognised market in its own right. As most secondary data is in the one to three night
format, and considering the supply side nature of the research, it is deemed that the
duration of stay adopted for definition purposes should be stays of one to three nights duration.
5.2.2 Form of Accommodation Used
The vast majority of short break holidays utilise friends and relatives (VFR) lodging
for accommodation, however, the revenue value of this supply sector is minimal when
compared to commercial accommodation. This difference in type of accommodation
i.e. commercial or non-commercial forms the essential difference between the short
holiday and the short break. Short holidays are commonly referred to as all holidays
of duration one to three nights (BTA 1989, Beioley 1991, Bailey 1989) in all types of
accommodation, while short breaks are referred to as holidays of one to three nights
taken in commercial accommodation. Some definitions specifying the type of
accommodation as hotels (MSI 1991, Davies 1990), hotels and guest houses
(Euromonitor 1989) or simply paid-for accommodation (Bailey 1989, Beioley 1991,
MEW Research 1994).
Definitions of short breaks or short break holidays therefore vary considerably study
to study, as such any analysis requires a clarity of definition to establish the exact
parameters being examined either by location, time period, form of accommodation or
product offering. This section uses sources of information encompassing a range of
short break and short holiday definitions to provide background information from
limited secondary data sources. The definition of a short break adopted for the
purposes of the research is one that specifies accommodation, time period, and
activity and as such uses the term COMMERCIAL SHORT HOLIDAY BREAK
(CSHB).
Former chapters established the importance of the hotel as a source of
accommodation. The concept of packaging goods and services to help raise perceived
value was established in Chapter 3. These characteristics, combined with the
commonly accepted time period of one to three nights allows the following definition
of CSHB to be adopted for the research project :
"Hotel packages of one to three nights which for a single price together with accommodation include one or more of the following : meals; transport; entertainment; or a programme of activities. "
Page 130
This definition has been adopted and used in various pieces of the author's work.
(Edgar 1992(a), 1992(b), 1993, 1994, 1995, Edgar & Litteljohn 1994, Edgar et al 1994, Crichton & Edgar 1995)
5.3 THE SHORT BREAK MARKET: AN ATTRACTIVE PROGRESSION
The cost structure of hotels means that, like airlines, marginal pricing can be an
important strategy to boost occupancy and increase profitability. Because hotels,
being property based businesses have high levels of fixed to variable costs, marginal
changes in occupancy may produce significant differences in profitability.
This explains significant levels of discounting at certain times where occupancy may
be low. Increased profitability may be gained from contribution to fixed costs which
would otherwise be lost, or by encouraging the lower rated customer to increase
consumption of supplementary hotel services such as meals, or by a combination.
Low occupancy may be related to the location of particular units, meaning that hotels
in resorts would require to fill certain months that were off peak, while city centre
hotels may require to fill beds during weekends. This differing seasonality results in a
wider spread of available seasons for short breaks, as well as providing a higher
standard of accommodation, especially in city centre locations. In addition, it gives
rise to the concept of opportunity cost whereby developing in one market the operator
must forsake another, these costs must be carefully considered, and the factors of
production (land, labour, and capital) correctly balanced for the selected market.
This reflects the logical progression of short breaks from a supply perspective i.e. cost
driven. From a demand oriented approach short breaks are a logical progression in
that they allow a marketing emphasis, identifying major price and activity segment
differences, and forming a means of further segmenting and branding hospitality and
tourism markets.
From both progression approaches, the basic resource, a hotel, its services, location
and tourism attractions conferred upon it are the same, what may change are the
design and timing of the breaks, and the marketing methods used. To fully appreciate
the nature of the short break market requires an understanding of the evolution of
short breaks, an appreciation of the value, volume and growth of the market, and a
model of industry structure, laying foundations for a structural analysis of the market
relative to hotel groups.
Page 131
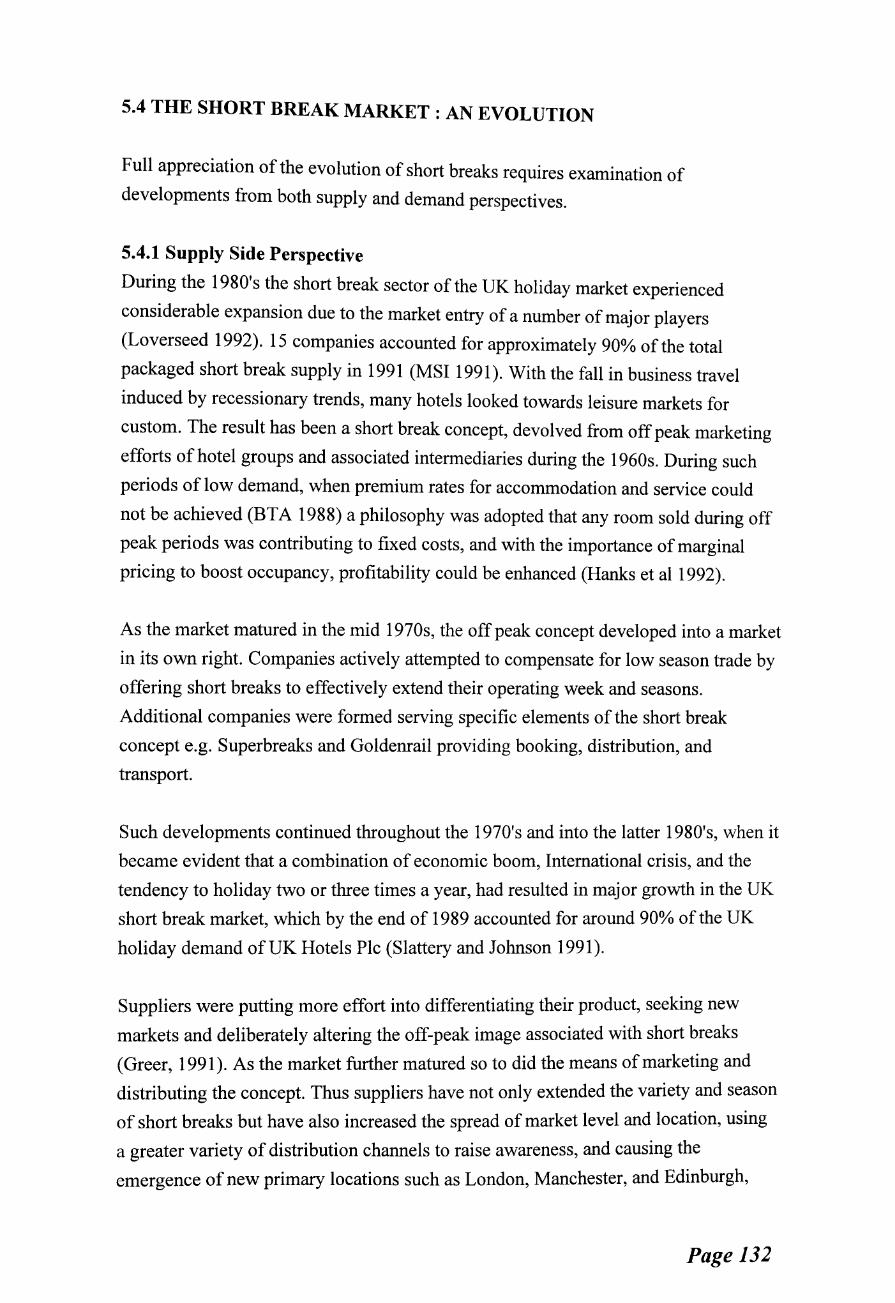
5.4 THE SHORT BREAK MARKET :AN EVOLUTION
Full appreciation of the evolution of short breaks requires examination of
developments from both supply and demand perspectives.
5.4.1 Supply Side Perspective
During the 1980's the short break sector of the UK holiday market experienced
considerable expansion due to the market entry of a number of major players
(Loverseed 1992). 15 companies accounted for approximately 90% of the total
packaged short break supply in 1991 (MSI 1991 ). With the fall in business travel
induced by recessionary trends, many hotels looked towards leisure markets for
custom. The result has been a short break concept, devolved from off peak marketing
efforts of hotel groups and associated intermediaries during the 1960s. During such
periods of low demand, when premium rates for accommodation and service could
not be achieved (BTA 1988) a philosophy was adopted that any room sold during off
peak periods was contributing to fixed costs, and with the importance of marginal
pricing to boost occupancy, profitability could be enhanced (Hanks et al1992).
As the market matured in the mid 1970s, the off peak concept developed into a market
in its own right. Companies actively attempted to compensate for low season trade by
offering short breaks to effectively extend their operating week and seasons.
Additional companies were formed serving specific elements of the short break
concept e.g. Superbreaks and Goldenrail providing booking, distribution, and
transport.
Such developments continued throughout the 1970's and into the latter 1980's, when it
became evident that a combination of economic boom, International crisis, and the
tendency to holiday two or three times a year, had resulted in major growth in the UK
short break market, which by the end of 1989 accounted for around 90% of the UK
holiday demand ofUK Hotels Pic (Slattery and Johnson 1991).
Suppliers were putting more effort into differentiating their product, seeking new
markets and deliberately altering the off-peak image associated with short breaks
(Greer, 1991). As the market further matured so to did the means of marketing and
distributing the concept. Thus suppliers have not only extended the variety and season
of short breaks but have also increased the spread of market level and location, using
a greater variety of distribution channels to raise awareness, and causing the
emergence of new primary locations such as London, Manchester, and Edinburgh,
Page132
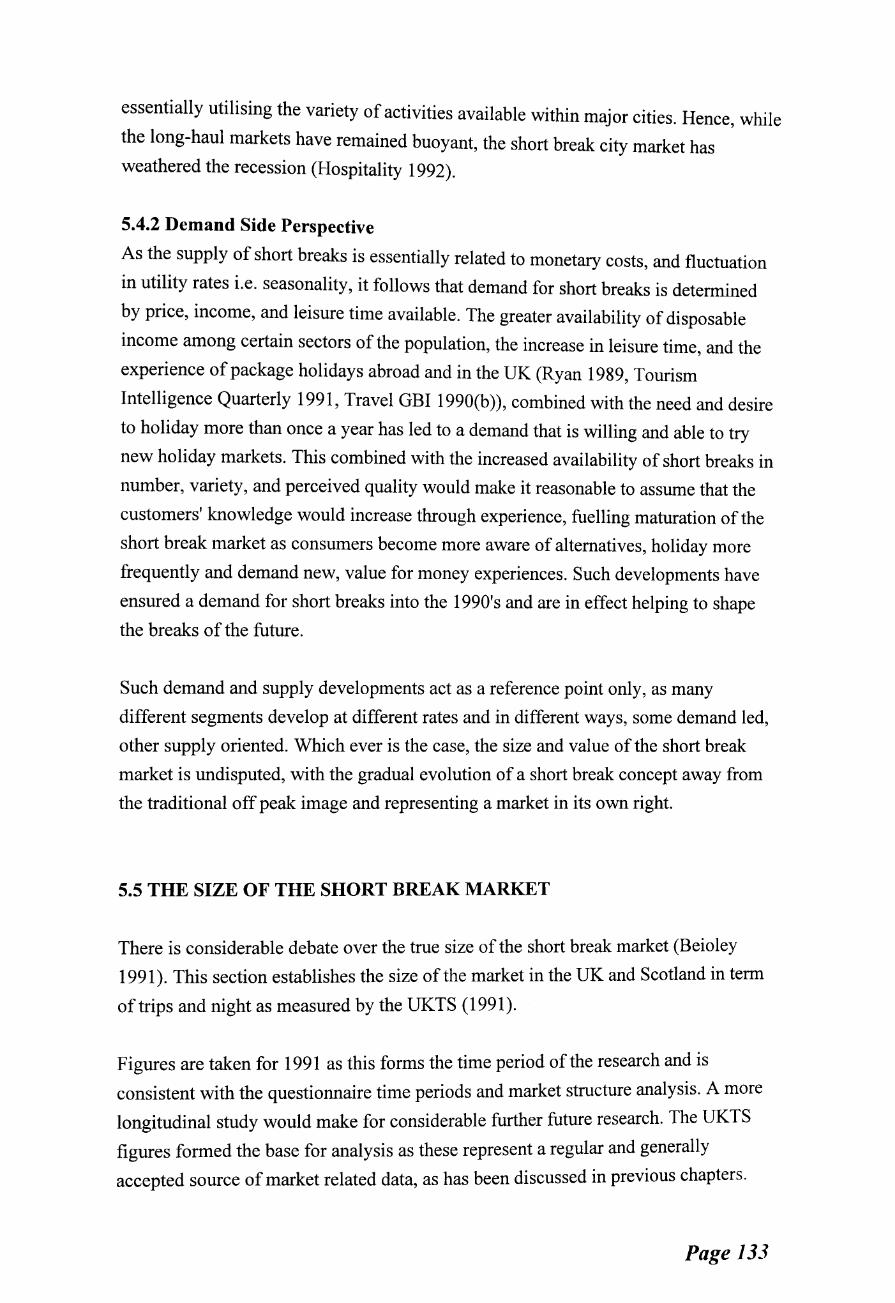
essentially utilising the variety of activities available within major cities. Hence, while
the long-haul markets have remained buoyant, the short break city market has
weathered the recession (Hospitality 1992).
5.4.2 Demand Side Perspective
As the supply of short breaks is essentially related to monetary costs, and fluctuation
in utility rates i.e. seasonality, it follows that demand for short breaks is determined
by price, income, and leisure time available. The greater availability of disposable
income among certain sectors of the population, the increase in leisure time, and the
experience of package holidays abroad and in the UK (Ryan 1989, Tourism
Intelligence Quarterly 1991, Travel GBI 1990(b) ), combined with the need and desire
to holiday more than once a year has led to a demand that is willing and able to try
new holiday markets. This combined with the increased availability of short breaks in
number, variety, and perceived quality would make it reasonable to assume that the
customers' knowledge would increase through experience, fuelling maturation of the
short break market as consumers become more aware of alternatives, holiday more
frequently and demand new, value for money experiences. Such developments have
ensured a demand for short breaks into the 1990's and are in effect helping to shape
the breaks of the future.
Such demand and supply developments act as a reference point only, as many
different segments develop at different rates and in different ways, some demand led,
other supply oriented. Which ever is the case, the size and value of the short break
market is undisputed, with the gradual evolution of a short break concept away from
the traditional off peak image and representing a market in its own right.
5.5 THE SIZE OF THE SHORT BREAK MARKET
There is considerable debate over the true size of the short break market (Beioley
1991). This section establishes the size of the market in the UK and Scotland in term
oftrips and night as measured by the UKTS (1991).
Figures are taken for 1991 as this forms the time period of the research and is
consistent with the questionnaire time periods and market structure analysis. A more
longitudinal study would make for considerable further future research. The UKTS
figures formed the base for analysis as these represent a regular and generally
accepted source of market related data, as has been discussed in previous chapters.
Page 133
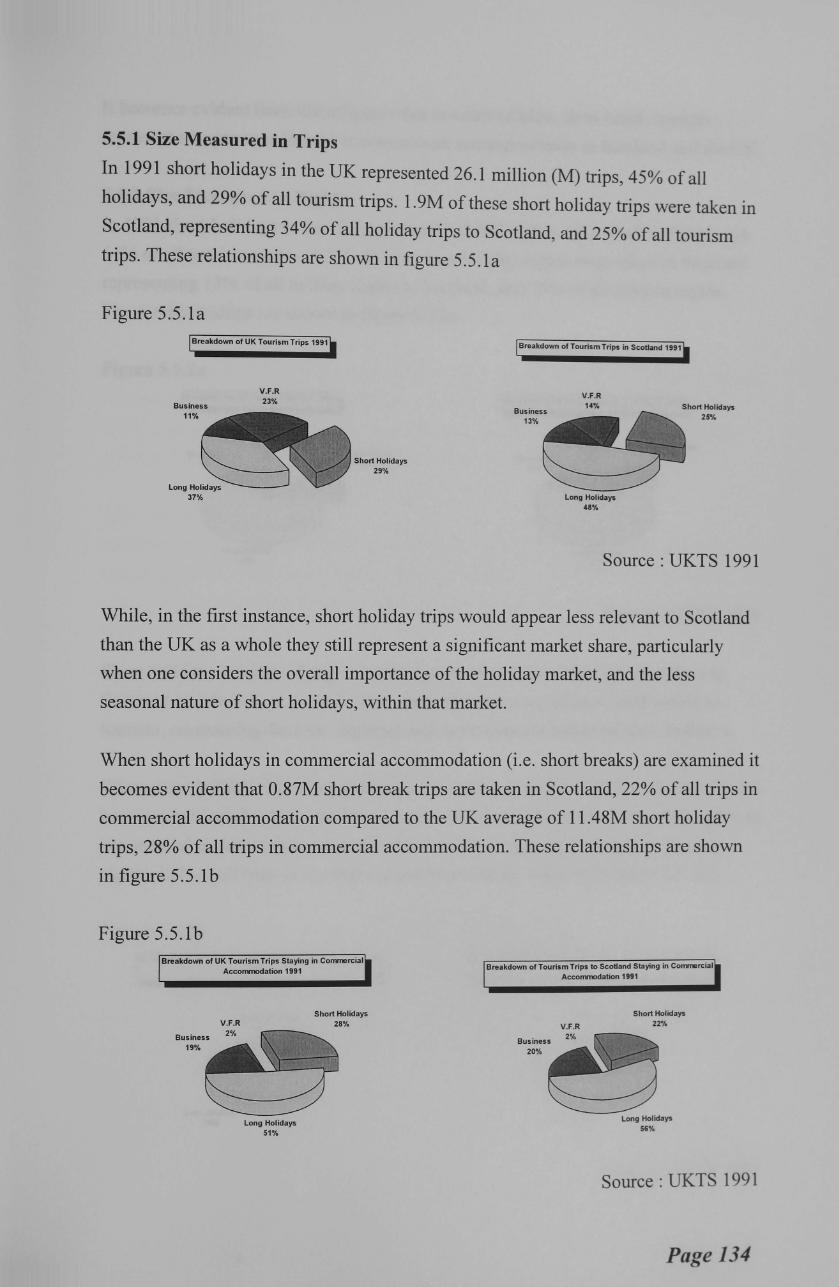
5.5.1 Size Measured in Trips
In 1991 short holidays in the UK represented 26.1 million (M) trips, 45% of all
holidays, and 29% of all tourism trips. 1.9M of these short holiday trips were taken in
Scotland, representing 34% of all holiday trips to Scotland, and 25% of all tourism
trips. These relationships are shown in figure 5.5.1a
Figure 5.5.1a Breakdown of UK Tourism Trips 1991
Business 11%
V.F.R 23%
Short Holidays 29%
Breakdown of Tourism Trips in Scotland 1991
Business 13%
V.F.R 14%
Long Holidays 48'1.
Short Holidays 25%
Source : UKTS 1991
While, in the first instance, short holiday trips would appear less relevant to Scotland
than the UK as a whole they still represent a significant market share, particularly
when one considers the overall importance of the holiday market, and the less
seasonal nature of short holidays, within that market.
When short holidays in commercial accommodation (i.e. short breaks) are examined it
becomes evident that 0.87M short break trips are taken in Scotland, 22% of all trips in
commercial accommodation compared to the UK average of 11.48M short holiday
trips, 28% of all trips in commercial accommodation. These relationships are shown
in figure 5.5.1 b
Figure 5.5.1b Breakdown of UK Tourism Trips Staying in Convnercial
Acconvnodalion 1991
Business 19%
V.F.R
Long Holidays 51%
Short Holidays 28%
Breakdown of Tourism Trips to ScoUand Staying in Conwnercial Acconvnodation 1991
Business 20%
V.F.R
Short Holidays 22%
Long Holidays 56%
Source : UKTS 1991
Page 134

It becomes evident from these figures that in terms of trips, short break markets
represent a major contribution to commercial accommodation in Scotland and the UK.
5.5.2 Size Measured in Nights
In 1991 short holidays in the UK represented 53. 8M nights, 18% of all holidays, and
14% of all tourism nights. 4.3M of these short holiday nights were taken in Scotland
representing 13 o/o of all holiday nights to Scotland, and 10% of all tourism nights.
These relationships are shown in figure 5.5.2a
Figure 5.5.2a Breakdown of UK Tourism Nights in 1991
Business V.F.R 15%
Long Holidays 64%
Short Holidays 14%
Breakdown of UK Tourism Nights In Scotland 1991
Business V.F.R
Long Holidays 69%
Short Holidays 10'/,
Source : UKTS 1991
Short holidays in terms of nights would appear less relevant than long holidays to
Scotland and the UK as a whole. They still represent a significant contribution to
tourism, considering the short nightage and more frequent nature of short holidays.
When short holidays in commercial accommodation (i.e. short breaks) are examined it
becomes evident that 2M short break nights are taken in Scotland, 10% of all nights in
commercial accommodation compared to the UK average of 24.2M short holiday
nights, 12% of all trips in commercial accommodation. (Shown in figure 5.5 .2b ).
Figure 5.5.2b Breakdown of UK Tourism Nights in Conmercial Acconmodation
1991
Long Holidays 76%
Short Holidays 13%
Breakdown of UK Tourism Nights in Conmercial Accoi'TitlC.Kiation in Scotland 1991
Business V.F.R
Long Holidays 78.6%
Short Holidays 10'/.
Source : UKTS 1991
Page 135
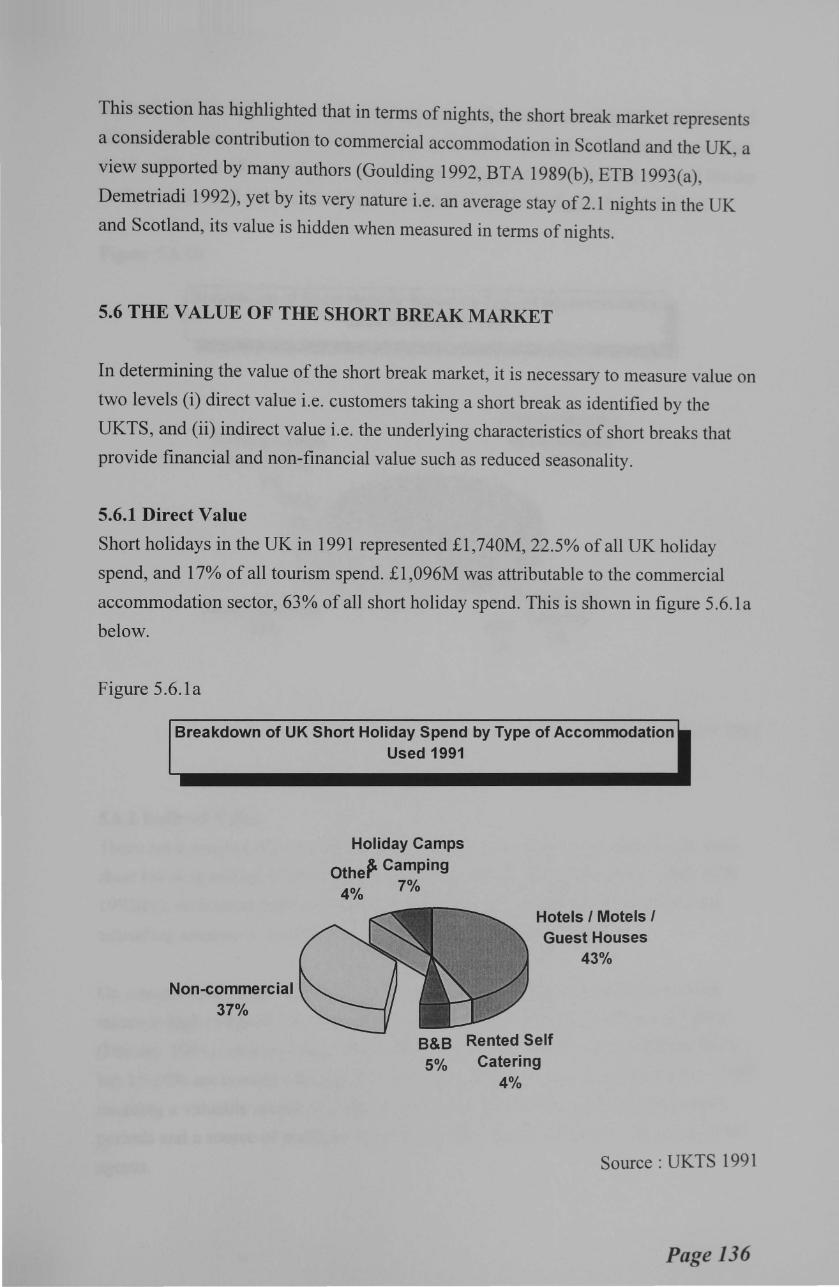
This section has highlighted that in terms of nights, the short break market represents
a considerable contribution to commercial accommodation in Scotland and the UK a '
view supported by many authors (Goulding 1992, BTA 1989(b), ETB 1993(a),
Demetriadi 1992), yet by its very nature i.e. an average stay of 2.1 nights in the UK
and Scotland, its value is hidden when measured in terms of nights.
5.6 THE VALUE OF THE SHORT BREAK MARKET
In determining the value of the short break market, it is necessary to measure value on
two levels (i) direct value i.e. customers taking a short break as identified by the
UKTS, and (ii) indirect value i.e. the underlying characteristics of short breaks that
provide financial and non-financial value such as reduced seasonality.
5.6.1 Direct Value
Short holidays in the UK in 1991 represented £1,7 40M, 22.5% of all UK holiday
spend, and 17% of all tourism spend. £1,096M was attributable to the commercial
accommodation sector, 63% of all short holiday spend. This is shown in figure 5.6.la
below.
Figure 5.6.1a
Breakdown of UK Short Holiday Spend by Type of Accommodation Used 1991
Non-commercial 37%
Holiday Camps
Othe~ Camping
4% 7%
8&8
Hotels I Motels I Guest Houses
43%
5% Catering 4%
Source : UKTS 1991
Page 136

In Scot~and, the value of short holidays is also evident, representing 15% (£175M) of
all toun_s~ spend, or 19. 5o/o of all holiday spend. The commercial sector representing
£119 m1lhon or 68% of all short holiday spend. Again, the importance of short breaks
to the commercial sector, this time in Scotland is shown in figure 5.6.1 b below.
Figure 5.6.lb
Breakdown of Short Holiday Spend by Type of Accommodation Used in Scotland 1991
Holiday Camps & Camping
1% Other ,r-......:~· .
Non-commercial 32%
Hotels I Motels I Guest Houses
53%
B&B Catering
5% 5%
Source : UKTS 1991
5.6.2 Indirect Value There are a number of areas where indirect value is created. On a macro level, most
short break spending, 83% is retained in Britain (BTA 1989, Hoseasons 1992, ETB
1993 (b)), with short breaks being less of an "off peak" phenomenon and therefore
extending seasons of operators and destinations (Euromonitor 1987).
On a micro level, there is general agreement that the average spend of short break
takers is high compared to other sectors (BT A 1989). Booking lead times are short
(Beioley 1991), with less than 19% booked 3 months before departure (Hunt 1991)
but 15-20o/o are booked with short break operators through travel agents (Bailey 1989)
meaning a valuable source of additional revenue during what may have been slack
periods and a source of multiple revenue for other intermediaries involved e.g. travel
agents.
Page 137
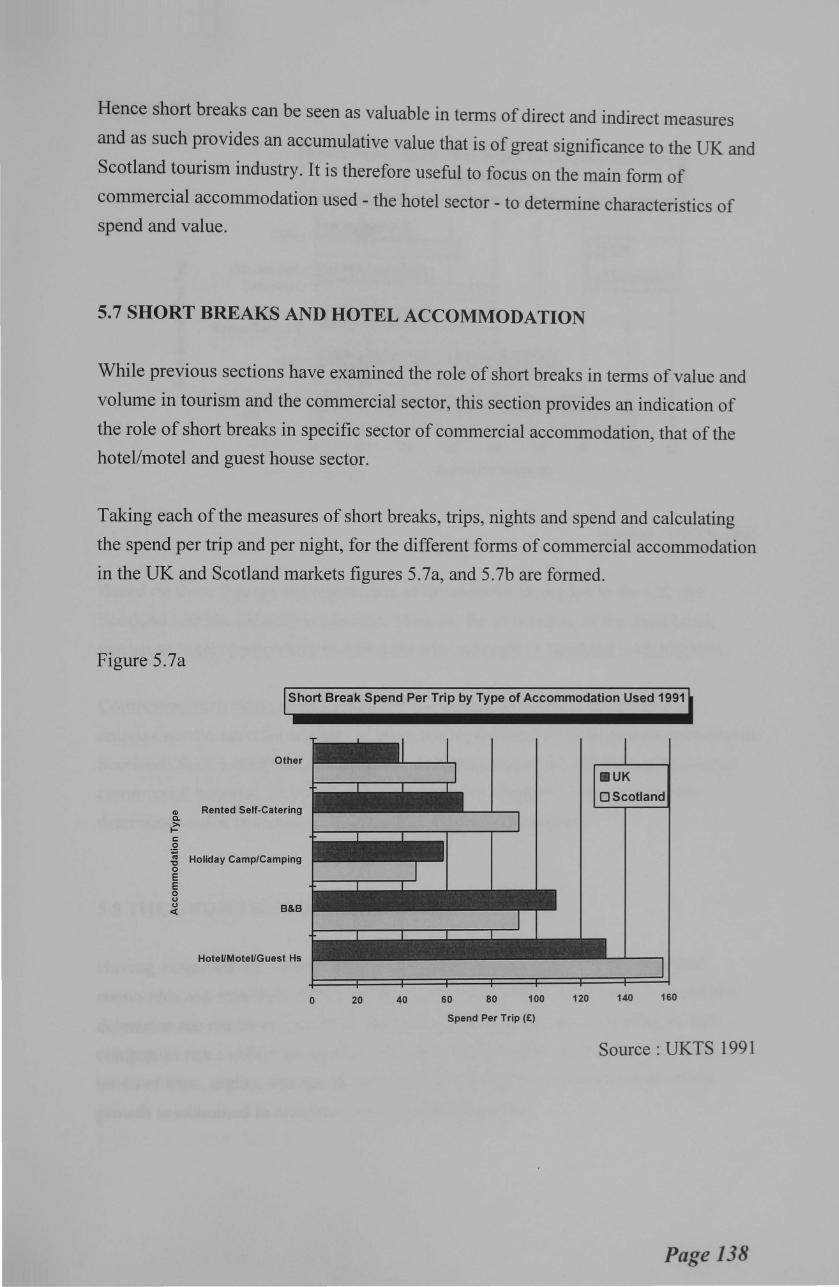
Hence short breaks can be seen as valuable in terms of direct and indirect measures
and as such provides an accumulative value that is of great significance to the UK and
Scotland tourism industry. It is therefore useful to focus on the main form of
commercial accommodation used - the hotel sector - to determine characteristics of spend and value.
5.7 SHORT BREAKS AND HOTEL ACCOMMODATION
While previous sections have examined the role of short breaks in terms of value and
volume in tourism and the commercial sector, this section provides an indication of
the role of short breaks in specific sector of commercial accommodation, that of the
hotel/motel and guest house sector.
Taking each of the measures of short breaks, trips, nights and spend and calculating
the spend per trip and per night, for the different forms of commercial accommodation
in the UK and Scotland markets figures 5.7a, and 5.7b are formed.
Figure 5.7a
Short Break Spend Per Trip by Type of Accommodation Used 1991
C1) c. >. 1-c:
~
Other
Rented Self-Catering
~ Holiday Camp/Camping 0 E E 0 0
~ 8&8
Hotel/Motel/Guest Hs
0 20 40
•uK OScotland
60 80 1 00 120 140 160
Spend Per Trip (£)
Source : UKTS 1991
Page 138
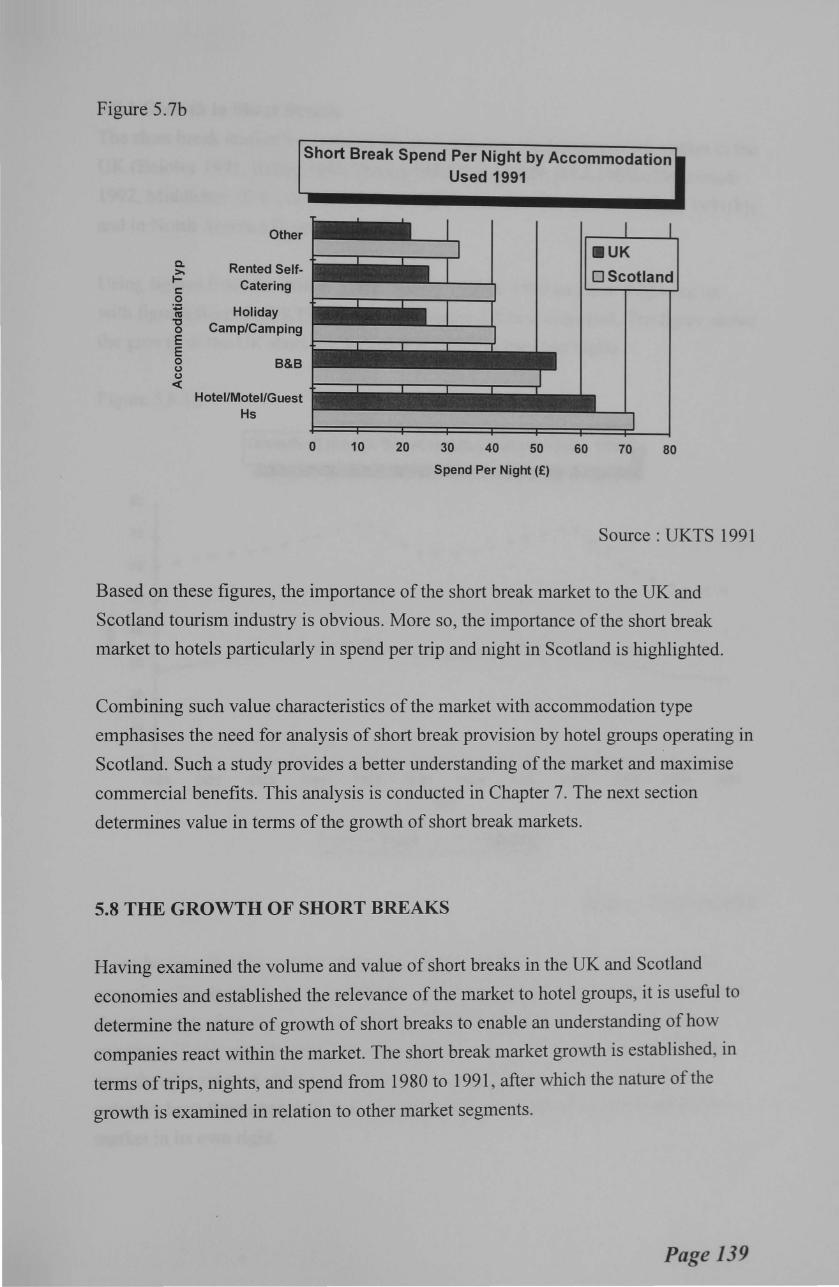
Figure 5.7b
Other
a. Rented Self->-1-
Catering s:::: 0
:o; Holiday IV "C Camp/Camping 0 E E 0 B&B 0 0 <(
Hotel/Motel/Guest Hs
Short Break Spend Per Night by Accommodation Used 1991
0 10 20 30 40 50
Spend Per Night(£)
60
.UK
OScotland
70 80
Source : UKTS 1991
Based on these figures, the importance of the short break market to the UK and
Scotland tourism industry is obvious. More so, the importance of the short break
market to hotels particularly in spend per trip and night in Scotland is highlighted.
Combining such value characteristics of the market with accommodation type
emphasises the need for analysis of short break provision by hotel groups operating in
Scotland. Such a study provides a better understanding of the market and maximise
commercial benefits. This analysis is conducted in Chapter 7. The next section
determines value in terms of the growth of short break markets.
5.8 THE GROWTH OF SHORT BREAKS
Having examined the volume and value of short breaks in the UK and Scotland
economies and established the relevance of the market to hotel groups, it is useful to
determine the nature of growth of short breaks to enable an understanding of how
companies react within the market. The short break market growth is established, in
terms of trips, nights, and spend from 1980 to 1991, after which the nature of the
growth is examined in relation to other market segments.
Page 139

5.8.1 Growth in Short Breaks
The short break market has been widely recognised as the fastest growth market in the
UK (Beioley 1991, Bailey 1989, Davies 1990, Teare 1989, BTA 1990b, Demetriadi
1992, Middleton 1991 ), in Europe (Potier & Cockerell 1992, EIU 1992, Law 1991 (b))
and in North America (Loverseed, 1992).
Using figures from the British Travel Survey 1980 to 1989 and then following on
with figures from the UKTS 1989 to 1991 figure 5.8.1a is compiled. The figure shows
the growth of the UK short break market in terms of trips and nights.
Figure 5.8.1a
Growth of the UK Short Holiday Market 1980 - 1991
80
,_ ,_ ' ,. ' 70 ,_ ,_ ' ., ,_ ., '
,_ ' ., ,. ,_ ., - ., ~ - - .,
' 60 • ' ... ... ... ---50
t:: .2 40 :§
30
20
10
0
1980 1981 1982 1983 1984 1985 1986 1987 1988 1989 1990 1991
Year
Trips -Nights!
Source : UKTS & BTS
It can be seen that the growth of the short break market in the UK (which reflects
growth in Scotland) has been consistent, reflecting patterns of boom and recession in
the economy, often in an inverse manner. While the market may appear a little
unsettled, if one considers the growth in spend as shown in figure 5.8.1 bit can be
seen that the value of short breaks has grown steadily year on year even when
volumes have fluctuated, essentially representing an acceptance of short breaks as a
market in its own right.
Page 140
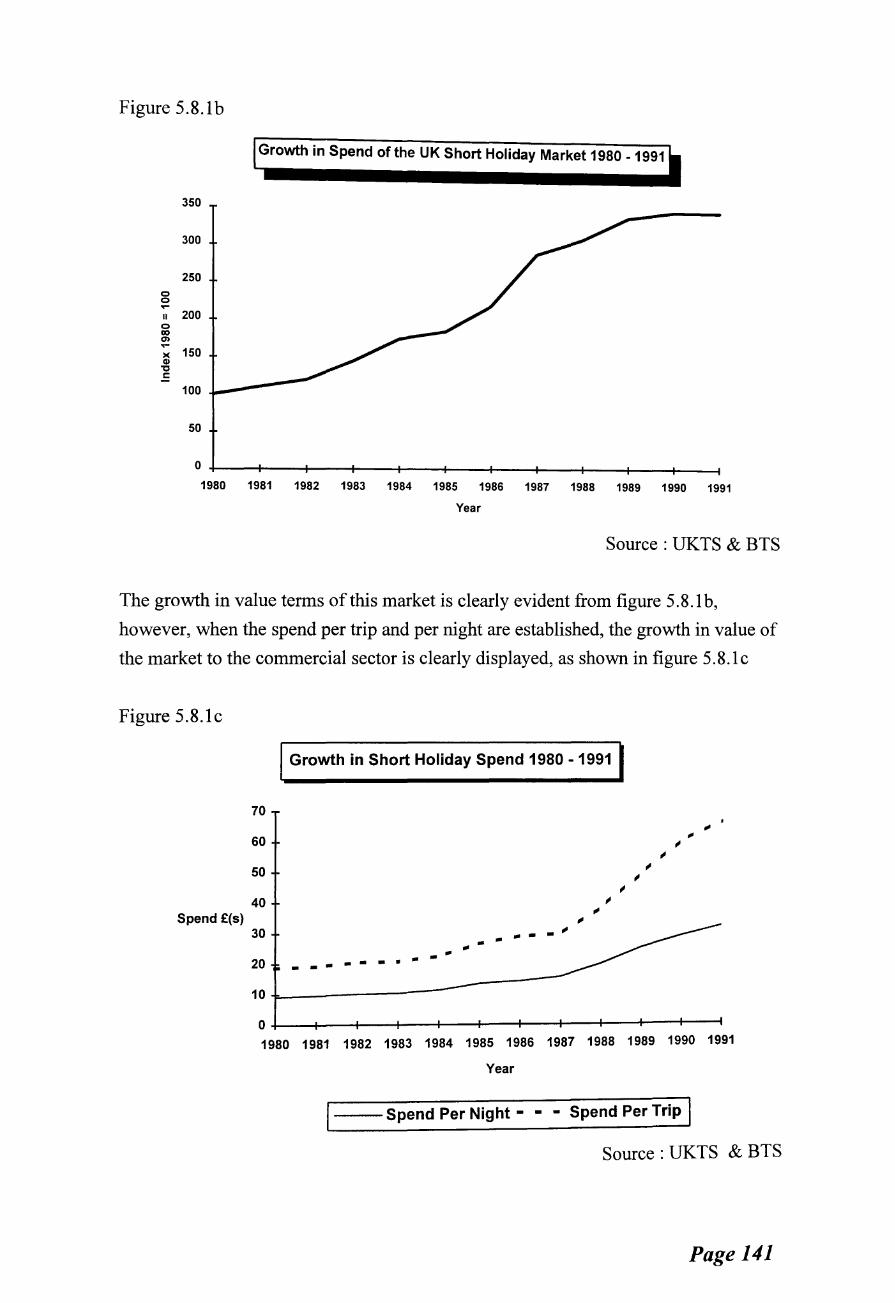
Figure 5.8.1 b
Growth in Spend of the UK Short Holiday Market 1980 - 1991
350
300
250 0 0 .... II 200 0 co 0) .... )( 150 Ill
1:1 .= 100
50
1980 1981 1982 1983 1984 1985 1986 1987 1988 1989 1990 1991
Year
Source : UKTS & BTS
The growth in value terms of this market is clearly evident from figure 5. 8.1 b,
however, when the spend per trip and per night are established, the growth in value of
the market to the commercial sector is clearly displayed, as shown in figure 5.8.1c
Figure 5.8.1c
I Growth in Short Holiday Spend 1980-1991 I 70
60
50
40 Spend £(s)
30
20 ----. .. .. .. -.. 10~----------------
- .. --~ .. -
0+---~--~--~~~~--~---+---+--~--~~
1980 1981 1982 1983 1984 1985 1986 1987 1988 1989 1990 1991
Year
--Spend Per Night • • - Spend Per Trip I Source : UKTS & BTS
Page 141

Such growth surely emphasises the importance of the short break market to
commercial accommodation providers, particularly if one considers the commercial
accommodation providers share of short break spend, and hotels share of commercial accommodation spend.
5.8.2 Nature of Short Break Growth
While the growth in volume and value of short breaks in the UK and Scotland are
clearly evident the nature of that growth is to a great extent hidden and unclear. By
adding the dimension of long holidays, the other element of holiday tourism, figure
5.8.2a and 5.8.2b are formed. Data is indexed to 1980.
Figure 5.8.2a
0 0 .... II
0 CIO en .... >< C1l
"0 r:::
140
120
100
80
60
40
20
0
The UK Holiday Market Trips and Nights 1980 -1991
1980 1981 1982 1983 1984 1985 1986 1987 1988 1989 1990 1991
Year
.....-------.,Short Holiday ~-.1 _ __,1 Short Holiday ---A - Long Holiday e Long Holiday Trips Nights Trips Nights
Source : UKTS & BTS
While short holidays indicated a decline in growth during certain periods of economic
activity, it can be seen that long holidays also reflect decline in growth. This indicates
that the total domestic holiday market had been in a state of decline, probably due to
the boom in package holidays abroad (Ryan 1989,1991 , Quiroga 1990, Pearce 1987)
and the economic climate of the time.
Page142

However, when the spend per trip and per night are analysed (figure 5.8.2b) the
considerable growth in spend indicated by the short break market has in essence been
at the expense of the long holiday market and in fact does not represent organic
growth but a shift in market share. This would appear to indicate that the short break
market in the UK is growing in a mature holiday market through growth in market
share, implying that operators in the market will essential be subject to conditions that
reflect a high degree of monopolistic competition (Chamberlin 1962).
As no research has been undertaken into the nature of short break provision this is an
area that warrants further investigation to highlight implications upon the nature of
competition and strategic activity within the UK short break market.
Figure 5.8.2b
UK Domestic Holiday Spend 1980 - 1991
350
300 r --r--r-
0 250 0 ..... .-,..__ II
200 M CIO Ql ..... 150 >< Q) "0 100 1:
~ ~ ~ .... ~- ' .--,__ ~ ,.
~~ .. r--- .... ,~ ~ 41r""
• 50
0
1980 1981 1982 1983 1984 1985 1986 1987 1988 1989 1990 1991
Year
._ _ __,Short Holiday Spend Per Night ._____.Short Holiday Spend Per Trip
-. • Long Holiday Spend Per Night • Long Holiday Spend Per Trip
Source: UKTS & BTS
As growth in the short break market has been at the expense of other market
segments, to gain such growth and appeal to a range of consumers, the market has
developed a wide range of market segments. To understand the dynamics of the
market the range of segments must be further investigated.
Page 143
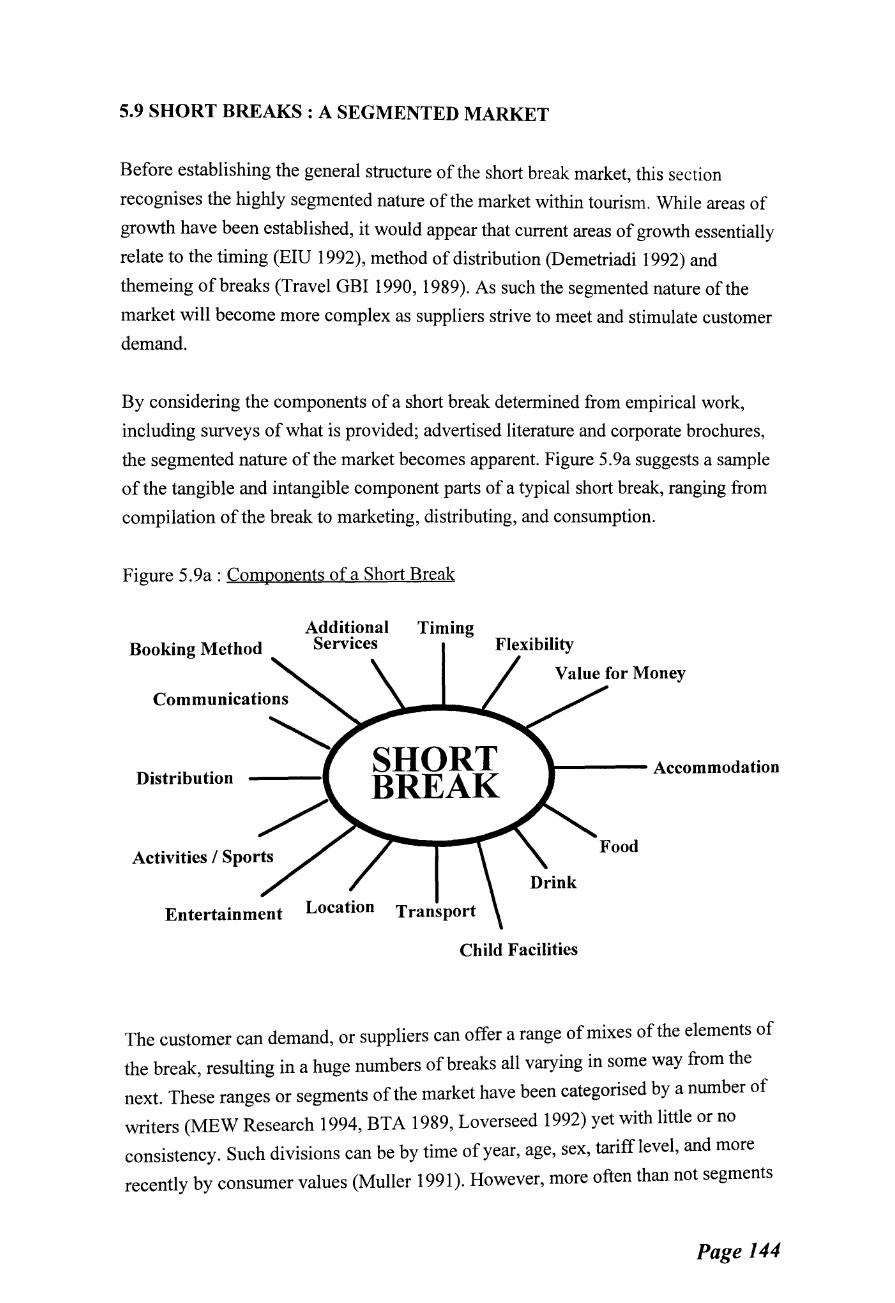
5.9 SHORT BREAKS : A SEGMENTED MARKET
Before establishing the general structure of the short break market, this section
recognises the highly segmented nature of the market within tourism. While areas of
growth have been established, it would appear that current areas of growth essentially
relate to the timing (EIU 1992), method of distribution (Demetriadi 1992) and
themeing of breaks (Travel GBI 1990, 1989). As such the segmented nature of the
market will become more complex as suppliers strive to meet and stimulate customer
demand.
By considering the components of a short break determined from empirical work,
including surveys of what is provided; advertised literature and corporate brochures,
the segmented nature of the market becomes apparent. Figure 5.9a suggests a sample
of the tangible and intangible component parts of a typical short break, ranging from
compilation of the break to marketing, distributing, and consumption.
Figure 5.9a: Components of a Short Break
Booking Method
Communications
Additional Services
Timing Flexibility
Distribution SHORT BREAK
..,.. ____ Accommodation
Activities I Sports
Entertainment Location Transport
Child Facilities
The customer can demand, or suppliers can offer a range of mixes of the elements of
the break, resulting in a huge numbers of breaks all varying in some way from the
next. These ranges or segments of the market have been categorised by a number of
writers (MEW Research 1994, BTA 1989, Loverseed 1992) yet with little or no
consistency. Such divisions can be by time of year, age, sex, tariff level, and more
recently by consumer values (Muller 1991). However, more often than not segments
Page 144
are determined by activity, meaning a number of guests travelling as a party may be
members of different target segments, or individual guests may change segments by the day or even the hour.
The most evident market segments in the UK short break market as identified by hotel
companies (Edgar 1993) are (i) Dinner, Bed and Breakfast, (ii) Bed and Breakfast
Only, (iii) Special Interest, (iv) Romance or Luxury, (v) Rail or Transport Inclusive,
(vi) Festive, (vii) Activity I sport and (viii) Other, including various local and seasonal
events and breaks that are mixtures of the former segments i.e. a rail inclusive
heritage and golf break.
The difficulty of classifying the short break market into clearly defined segments is
obvious, even more difficult than for general hotel market segments (Connell, 1992,
Slattery 1991). The difficulties are made even more intense as packaging of short
breaks becomes increasingly important as a means of raising perceived value for
customers (MSI 1991 ), or where inflexible organisations attempt to offer packages in
part (Teare 1989) resulting in many fragmented market segments, each segment
having different profiles and requirements (MEW Research 1994).
If, as Litteljohn and Goulding (1994) claim, "companies wishing to retain or expand
market share in the domestic holiday market (they) must nurture new packages which
appeal to short stay markets over a relatively wide range of market segments" then the
segmentation of the short break market will become more widespread and complex,
perhaps only being consolidated by the dominance of hotel groups (Trinity Research
1989). Such characteristics lend themselves to a need for understanding the market
conditions and the strategic dimensions of the market. Such a need makes this
research not only a considerable contribution to academic and industrial knowledge
but also of practical usefulness for operators in the market.
5.10 THE SHORT BREAK MARKET STRUCTURE
To establish the nature of the short break market structure in the UK and allow more
detailed analysis in later chapters, a commonly used and widely accepted model for
displaying industry structure constructed by Porter (1979) is adopted.
Porter suggests "competitive strategies must grow out of a sophisticated
understanding ofthe structure of the industry and how it is changing." There are five
Page 145

~ompetitive fo~ces which determine how profitable an industry is through the
Influence th~~ Infer upon costs incurred, prices charged, and investment required, and
thus determining competitive effectiveness within the industry, or market in the case of short breaks.
Figure 5.1 Oa shows the five forces identified by Porter.
Figure 5.1 Oa : Industry Structure Model
NEW ENTRANTS
I SUPPLIERS I ~ (II I BUYERS
SUBSTITUTES
Source : M.E Porter (1979)
Suppliers represent the main providers of the good or service within an industry or
market.
Buyers indicates the key market segments buying the good or services offered by
suppliers either in raw form or with value added.
New entrants and substitutes represent competitors. Competitors are either in the form
of organisations with the capability and willingness to enter the market, or
organisations offering an alternative good or service with similar benefits to that
offered by other organisations within the industry or market.
Page 146

The cumulative force of all four forces leads to competitive rivalry and how firms compete against each other.
When Porters' model is applied to the UK short break market figure 5.1 Ob is formed.
Figure 5.10b: UK Short Break Market Structure
SUPPLIERS Hotel Groups Unaffiliated Hotels Consortia Short Break Operators Supplementary Supply
NEW ENTRANTS Other "SUPPLIERS"
SUBSTITUTES Accommodation Location I Destination Activity Holiday Type Booking Method
BUYERS Dinner, Bed & Breakfast Bed & Breakfast Only Rail I Transport Inclusive Activity I Sport Romance I Luxury Festive Special Interest Other Segments
Source : adapted from M.E Porter (1979)
From figure 5.10b it can be seen that the main suppliers in the short break market can
be identified as hotel groups, unaffiliated hotels, consortia, short break operators
(SBO) e.g. Goldenrail, and supplementary supply such as car hire companies, airlines,
travel agents, or destination marketing agencies e.g. STB, ATBs.
Buyers can be seen to represent the key short break market segments as established
earlier.
New entrant are identified as "other suppliers" representing organisations in the
"suppliers" category which are not already operating in the short break market but
could challenge the physical provision of any element of the short break or could be
of a more intangible nature by challenging the form of distribution for short breaks.
Page 147
Substitutes can be represented by areas of substitution either in type of
accommodation, location, activity, holiday type, or booking method.
This model provides a simplified structure of the provision of short breaks which shall
be developed in later chapters to represent the market structure specific to hotel
groups, hotel groups being the most prominent supplier and short breaks being of
most importance to hotel groups.
The next section provides an indication of the perceived future for short breaks before
Part II establishes how the research methodology was applied.
5.11 THE FUTURE FOR SHORT BREAKS
From research, there is general agreement that short breaks will continue to grow into
the future. As may be expected there are a variety of reasons for such growth. The
BTA (1989) suggests growth will occur but will require a segmented marketing
approach, while Beioley (1991 ), Cockerell (1989) and Davies (1990) believe external
socio-economic factors will dictate and shape the future of the short break market,
causing consumers to demand greater flexibility; value for money; and choice.
Godfrey (1992) on the other hand sees the increasing intervention of destination
marketing through area tourist boards as a driving force for short breaks.
Some researchers have warned that growth into the future will be slower due to down
market drift and anti-inflationary measures (Bailey 1989), while internationally in
some Germanic countries there appears to be no end to the quantitative developments
(Lohmann 1991) yet in other European countries a plateau is being reached (Potier &
Cockerell1992, Lohmann 1991, Law 1990, 1991b, EIU 1992c).
To best understand the current and future developments of the CSHB market, it is
useful to refer to the work of Copper ( 1994) and the concept of the product lifecycle.
Cooper highlights that "In such a rapidly changing industry as tourism, commentators
struggle to derive generalisations of change and to seek patterns to explain the
evolution of tourism in all its forms", as a solution Cooper suggests an adaptation of
the product lifecycle. While Butler (1980) pioneered the product lifecycle approach in
tourism studies, many authors have developed his assertions (Brown 1987; Goodall
1992; Cooper 1992; Cooper & Jackson 1989).
Page 148

In terms of the CSHB market in Scotland, considerable growth and development
occurred between 1980-1991 resulting in a current stage of fragmented and wide
ranging segments. A number of segments are seen to be attempting to rejuvenate
themselves while others are still experiencing considerable growth. As such,
activity/sport and luxury markets are reaching stages of development and
consolidation while off peak markets are falling into a state of stagnation and decline.
In addition, different forms of accommodation provision and locations are at different
stages on the product lifecycle, making analysis difficult and highlighting the complex
nature of the market. What is clear is that the commercial sector is becoming
increasingly mature and sophisticates in its facilitation of the market and requires a
more structured and strategic approach to the market. this research is attempting to
contribute to such an approach.
Whatever the prospects, there is general agreement that short breaks are now a market
in their own right and are here to stay. Such recognition implies a need for
information about the market and makes short breaks an excellent "subject" for
research modelling.
Page 149
5.12 CHAPTER SUMMARY
This chapter has established that the CSHB market in Scotland is an area of
considerable interest, growth and currency. Despite considerable statistical problems
imposing constraints upon the process of the research, the content and potential areas
of research provide many opportunities to develop and progress a theorisation of
elements of the field - in this case the strategic dynamics element in particular.
Through understanding the dynamics of the industry and the CSHB market,
comparisons between organisations can be drawn and considerable contributions to
academic understanding of the hospitality organisation/market interface gained.
An analysis of the nature, volume and value of short breaks as a natural progression
for hotel groups in the pursuit of additional revenue and profitability, in this chapter
has established that short breaks are indeed indisputably one of the most valuable and
highly recognised growth markets in the developed tourism industry. It has, however,
been established that such growth is in terms of market share and not organic, which
has major implications on the smaller operators and makes the strategic dimensions of
the market increasing prominent.
Hence from a demand perspective, short breaks offer the customer a range of
affordable experiences, often flexible in nature and with a high perceived value.
While, from the supply perspective, short breaks are an excellent means of
contributing to fixed costs, extending seasons, and gaining ancillary spend.
These characteristics in their simplest form lead to the highly segmented, competitive
and dynamic market place present today, with constant strategy and product
developments, the nature of which are unresearched. Such development require
research to contribute to knowledge in the field to allow an understanding of the
market and organisation dynamics, and assist in management decision-making.
There is undoubtedly a lack of supply side analysis to the short break market, yet the
value of the market is obvious, particularly to hotel groups. This poses the question as
to how such groups organise themselves to compete in what appears to be a highly
segmented and complex short break market that is itself a part of the myriad of
tourism. Further more how do such strategies affect the performance of groups in the
market ? How is the market structured at hotel group level ? What role do hotel
groups play in shaping the short break market ? and indeed is the corporate
Page 150
perspective of short break activity different from that at unit or market level in what
appears to be a market displaying tendencies of monopolistic competition ?
These questions raised could form the basis of many areas of valid investigative
research. The research represented in this thesis seeks to establish through an analysis
of the nature of Commercial Short Holiday Breaks (CSHBs) provision in Scotland
what competitive strategies are employed by major suppliers, assessing such
strategies and evaluating any linkages occurring between CSHB strategies adopted
and performance achieved, exposing areas of competitive advantage and suggesting a
model for enhancing performance at corporate and unit levels.
As the research concentrates on commercial centred activities. CSHBs are defined as
"Hotel packages of one to three nights which for a single price together with accommodation include one or more of the following : meals; transport; entertainment; or a programme of activities. " allowing use of secondary sources for
Scottish market background, and primary sources for more detail of supplier provision
and performance. As hotels account for 78% of all spend in the CSHB market
compared to other forms of accommodation (MSI 1991) the definition is suitable for
the purposes of this research.
The research this far has highlighted that tourism markets are highly complex,
dynamic and fragmented. One element of the market; the CSHB sector appears to
offer considerable rewards for operators yet is unresearched. By developing an
understanding of the dynamics of strategy in the market and resulting performance
organisations should be able to position themselves to enhance returns.
Hotel groups have a prominent role in Scotland's commercial tourism sector and
appear to hold a prominent position within the CSHB market - which by definition
focuses on hotel activity. The inference is that through an analysis and
conceptualisation of hotel group activity in the CSHB market in Scotland valuable
academic and industrial contributions can be made to knowledge.
Part III consolidates the research problem and indicates how the methods were
implemented, providing details of data collection and sample size.
Page 151
REFERENCES
Bailey, J (1989) "Short holidays", Insights ETB I BTA B1-B7
Beioley, S (1991) "Short holidays", Insights, September B29-B38
Brown, S ( 1987) "Institutional change in retailing : a review and synthesis", European Journal of Marketing, 21(6) pp 5-36
BTA (1989) "The short break market", BTA I ETB November
BTA (1989)(b) "Holiday making in the British Isles", Insights, A1-9-A1-15
BTA (1990) "Holidays", Insights, 6 A127-A132, B61-B70
BTA (1990)(b) "British Holiday Intentions 1990", BTA I ETB
Butler, R.W (1980) "The concept of the tourist area cycle of evolution: implications
fo management of resources", Canadian Geographer, 24 pp 5-12
Chamberlin, E.H (1962) "Theory of monopolistic competition", Harvard Univ.
Press, (first ed. 1932) London
Cockerell, N (1989) "The short break market in Europe", EIU Travel and Tourism Analyst, 5 pp 41-55
Connell, J (1992) "Branding hotel portfolios", International Journal of Hospitality Management, 4(1) pp 26-32
Cooper, C (1992) "The lifecycle concept and startegic planning for coastal resorts",
Built Environment, 18(1) pp 57-66
Cooper, C (1994) "The destination lifecycle: an update", in "Tourism State of the Art", Seaton, T ( ed), Wiley & Sons, Chichester
Cooper, C; Jackson, S (1989) "Destination lifecycle : The Isle of Man case study",
Annals ofTourism Reserach, 16(3) pp 377
Crawford, P (1992) "Short breaks in Scotland", Glasgow Herald, Tuesday 23 June
pp25
Crichton, E; Edgar, D (1995) "Managing market complexity for competitive
advantage: an I.T perspective", International Journal of Contemporary Hospitality Management, 1(213) pp 12-19
Davies, B (1990) "The economics of short breaks", International Journal of Hospitality Management, 9(2) pp 103-106
Demetriadi, J (1992) "Taking a break", Hospitality, June pp 10-15
Edgar, D (1992)(a) "Commercial short holiday break markets in Scotland",
Unpublished report for the STB, Napier Polytechnic March
Edgar, D (1992)(b) "A model for analysing the commercial short holiday break
market in Scotland", CHME Research Conference proceedings, Birmingham
Polytechnic April
Page 152
Edgar, D (1993) "Commercial short holiday breaks:- an analysis of market provision
and supplier strategies in Scotland", CHME Research Conference proceedings
Manchester Metropolitan University, April
Edgar, D (1995) "The strategic gap- A short break multi-site perspective",
Productivity Strategies for Service, Editor Johns, N (in print) Cassells
Edgar, D; Litteljohn, D.L (1994) "Strategic clusters and strategic space :the case of
the UK short break market", International Journal of Contemporary Hospitality Management, 6(5) pp 20-26
Edgar, D; Litteljohn, D.L; Allardyce, M; Wanhill, S (1994) "Commercial short
holiday breaks :The relationship between market structure. competitive
advantage~ and performance", Tourism State of The Art, John Wiley & Sons
pp 323-342
EIU (1991) "UK visitor forecasts to 1995", Travel Industry Monitor, November 20
pp 8
EIU (1992) "Travel Industry Monitor", March 24 pp 2-3
EIU (1992)(b) "Short breaks still growing", EIU Travel Industry Monitor, March
24 pp 2-4
EIU (1992)( c) "The French short break domestic leisure market 1991 ", EIU Travel Industry Monitor, October 31 pp 3
ETB (1993) "Tourism by UK residents in 1992", Insights, September Fll-F17
ETB (1993)(b) "Holiday tourism ofUK residents in 1992", Insights, July Fl-F9
Euromonitor (1987) "Short break holidays", Market Research G.B, Euromonitor
Publ. Ltd April Vo126 pp 15-22
Godfrey, K (1992) "In search of identity", Caterer & Hotelkeeper, 6 April pp 56-
57
Goodall, B (1992) "Coastal resorts : development and redevelopment", Built Environment, 18(1) pp 5-11
Goulding, P (1992) "Britain's Leisure Industry", Jordan and Sons Ltd Bristol pp 23
Greer, S (1991) "Off peak targeting", Leisure Management, 11(5) May pp 32-33
Hoseasons (1992) "Hoseasons Holiday Survey", Travel GBI, June 164 pp 6
Hunt, J (1991) "Prospects for International tourism 1992", EIU Travel and Tourism
Analyst, 6 pp 77-93
Hunt, S.D (1976) "Marketing theory : conceptual foundations of research in
marketing", Grid, Columbus, OH
Law, J (1990) "Short breaks", Travel Trade Gazette, No. 1931 November PP 27-
30
Law, J (1991)(a) "UK short breaks", Travel Trade Gazette, No. 1950 March PP
51-55
Page 153
Law, J (1991)(b) "European short breaks", Travel Trade Gazette, No. 1956 May pp 43-49
Litteljohn, D.L; Goulding P (1994) "International Tourism Reports: Scotland", EIU Travel and Tourism Analyst, 2 pp 62-81
Lohmann, M (1991) "Evolution ofshortbreak holidays", Tourist Review, 2 pp 14-22
Loverseed, H (1992) "The North American short break market", EIU Travel and Tourism Analyst, 4 pp 48-65
MEW Research (1994) "Short break destination choice", Insights, January A77-A94
Middleton, V.T.C (1987) "Marketing holidays to wales- responding to market
changes", Tourist Review, 2 pp 27-30
Middleton, V.T.C (1991) "British tourism: market prospects for the next 12 months",
Insights, 4 A71-A76
MSI (1991) "Databrief: Short break holidays", Marketing Strategies for Industry London
Muller, T.E (1991) "Using personal values to define segments", International Marketing Review, 8(1) pp 57-70
Pearce, D.G (1987) "Special patterns of package tourism in Europe", Annals of Travel Research, 14(2) pp 183-201
Porter, M.E (1979) "The structure within industries' and companies' performance",
Review of Economics and Statistics, 61 pp 214-227
Potier, F; Cockerell, N (1992), "The European International short break market",
EIU Travel and Tourism Analyst, 5 pp 45-65
Quiroga, I (1990) "Characteristics of package tours in Europe", Annals ofTourism Research, 17(2) pp 185-207
Ryan, C (1989) "Trends past and present in the package holiday industry", Service Industry Journal, 9( 1) pp 61-78
Ryan, C (1991) "UK package holiday industry", Tourism Management, March
12(1) pp 76-77
Schidhauser, H (1992) "The distinction between short and long holidays", Tourist Review, 2 pp 10-17
Slattery, P (1991) "Hotel branding in the 1990's", EIU Travel and Tourism Analyst, 1 pp 23-35
Slattery, P; Johnson, S (1991) "Quoted Hotel Companies: The World Market",
Kleinwort Benson Securities Limited February London
Teare, R (1989) "The operational challenge ofhotel short breaks", Contemporary Journal of Hospitality Management, 1(1) pp 22-24
Page 154

Tourism Intelligence Quarterly (1990) "The British on Holiday 1990", Tourism Intelligence Quarterly 12(4) pp 53-65
Travel GBI (1989) "Christmas and winter breaks", Travel GBI, No.132 October
pp 8-10
Travel GBI (1990) "Christmas and winter breaks", Travel GBJ, No.144 October
pp 20-21
Travel GBI (1990) "Short breaks- the crystal ball gazers are right", Travel GBJ, November pp 22
Travel GBI (1990)(b) "UK Package Holidays", Travel GBJ, No.145 November pp
12-13
Trinity Research (1989) "The short break package holiday market", Trinity Research
Ltd. London
TTG (1991) "Travel Trade Gazette UK", Travel Trade Gazette, 24 October pp 21
UKTS (1991) "The UK tourist statistics 1991", ETB I STB I WTB INITB London
Page 155
PART III
IMPLEMENTING METHODS
CHAPTER6 IMPLEMENTING THE
PAGE
RESEARCH METHODS 156
CHAPTER SIX
IMPLEMENTING RESEARCH METHODS
6.1 INTRODUCTION
This chapter establishes how the research design and methods were implemented to
research CSHB market provision strategies in Scotland. The aims and objectives of
the research are determined, the methods used explained, and elements of
implementing the research framework examined.
6.2 RESEARCH QUESTIONS
Chapters 2 to 5 raised a number of key issues or questions with regard to CSHB
markets and supply which when investigated will contribute to industry and academic
knowledge.
The key questions raised were: (i) what is the CSHB market structure in Scotland?
(ii) how do hotel groups organise themselves in the highly segmented and complex
CSHB markets ? (iii) what role do hotel groups play in shaping short break markets ?
(iv) does the way hotel groups organise themselves influence their performance in the
CSHB market? (v) is the corporate perspective of short break activity different from
that at unit level ?
In attempts to answer these questions, this research focuses on a framework that
allows analysis of the issues of the nature of CSHB supply, supplier strategies, and
resulting market performance.
The justification for such a focus lies in the principles of industrial economics and
forms the foundation of work by many respected strategic gurus and models -
organisations must perform in order to survive, how they organise themselves and
their resources i.e. their conduct, will influence their performance. Hence an
understanding ofthe market structure-strategy-performance linkages ofCSHB
markets will provide considerable contributions to knowledge and allow further
analysis of how organisations may reposition themselves to enhance their
performance and ensure survival.
More importantly, the research will allow an approach to be developed that allows
application across market segments and industry boundaries thus advancing
knowledge and in the case of the CSHB market, providing a model of enhanced
market performance.
Page 156
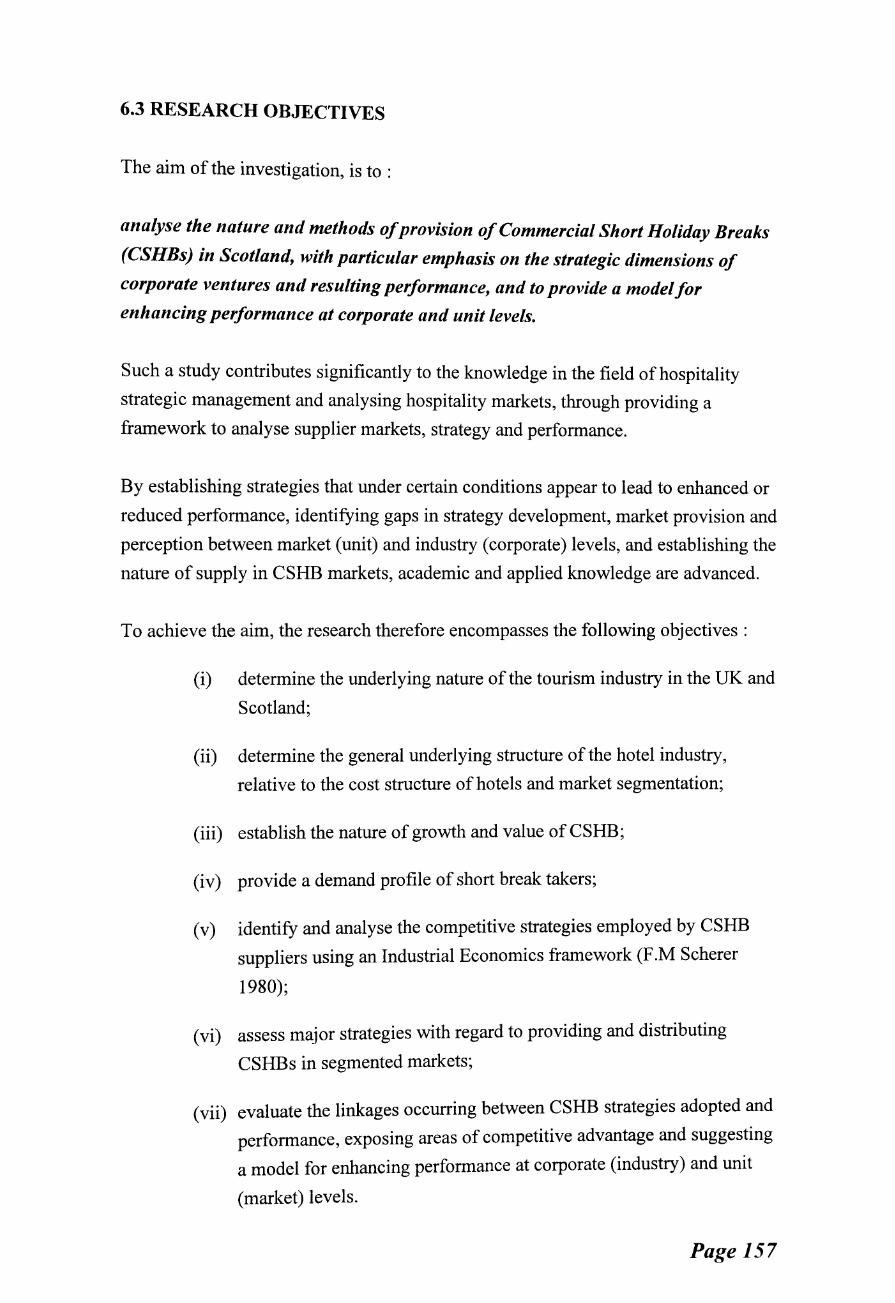
6.3 RESEARCH OBJECTIVES
The aim of the investigation, is to :
analyse the nature and methods of provision of Commercial Short Holiday Breaks (CSHBs) in Scotland, with particular emphasis on the strategic dimensions of corporate ventures and resulting performance, and to provide a model for enhancing performance at corporate and unit levels.
Such a study contributes significantly to the knowledge in the field of hospitality
strategic management and analysing hospitality markets, through providing a
framework to analyse supplier markets, strategy and performance.
By establishing strategies that under certain conditions appear to lead to enhanced or
reduced performance, identifying gaps in strategy development, market provision and
perception between market (unit) and industry (corporate) levels, and establishing the
nature of supply in CSHB markets, academic and applied knowledge are advanced.
To achieve the aim, the research therefore encompasses the following objectives :
(i) determine the underlying nature of the tourism industry in the UK and
Scotland;
(ii) determine the general underlying structure of the hotel industry,
relative to the cost structure of hotels and market segmentation;
(iii) establish the nature of growth and value of CSHB;
(iv) provide a demand profile of short break takers;
(v) identify and analyse the competitive strategies employed by CSHB
suppliers using an Industrial Economics framework (F .M Scherer
1980);
(vi) assess major strategies with regard to providing and distributing
CSHBs in segmented markets;
(vii) evaluate the linkages occurring between CSHB strategies adopted and
performance, exposing areas of competitive advantage and suggesting
a model for enhancing performance at corporate (industry) and unit
(market) levels.
Page 157

6.4 DEFINITION OF COMMERCIAL SHORT HOLIDAY BREAKS
As the research concentrates on commercial centred activities, and for the reasons
established in Chapter 5, Commercial Short Holiday Breaks (CSHB) are defined as:
"Hotel packages of one to three nights which for a single price together with
accommodation include one or more of the following : meals; transport;
entertainment; or a programme of activities." (Edgar & Litteljohn 1994, Edgar et al 1994)
6.5 RESEARCH METHODS
Chapter 1, section 1.5 provided an overview of the research methods adopted. This
section provides further detail of the methods and issues relative to their
implementation.
6.5.1 Literature Review
The review of literature on CSHBs revealed little systematic study on the subject.
Most coverage was in the form of newspaper and trade press articles, conference
papers, government publications, and industrial research documents. Therefore a
database had to be constructed from primary data drawn from company literature,
group brochures and company accounts.
6.5.2 Hotel Groups Database
A database was constructed containing the 3 0 largest hotel groups in Scotland (31%
of all registered STB room stock) determined by room capacity (1991 ), geographical,
price, size and standard variables. This allowed estimates of CSHB value in financial
terms across a range of structural variables.
(i) Database : Sample selection
The importance of hotel groups to the Scottish economy has been established in
previous chapters. As the research focuses on CSHB in Scotland and considering the
impracticalities of surveying the entire hotel or commercial accommodation industry,
the database sample contained the 30 largest hotel groups (by room stock) operating
in Scotland, indicated in table 6.5.2a below.
Page 158
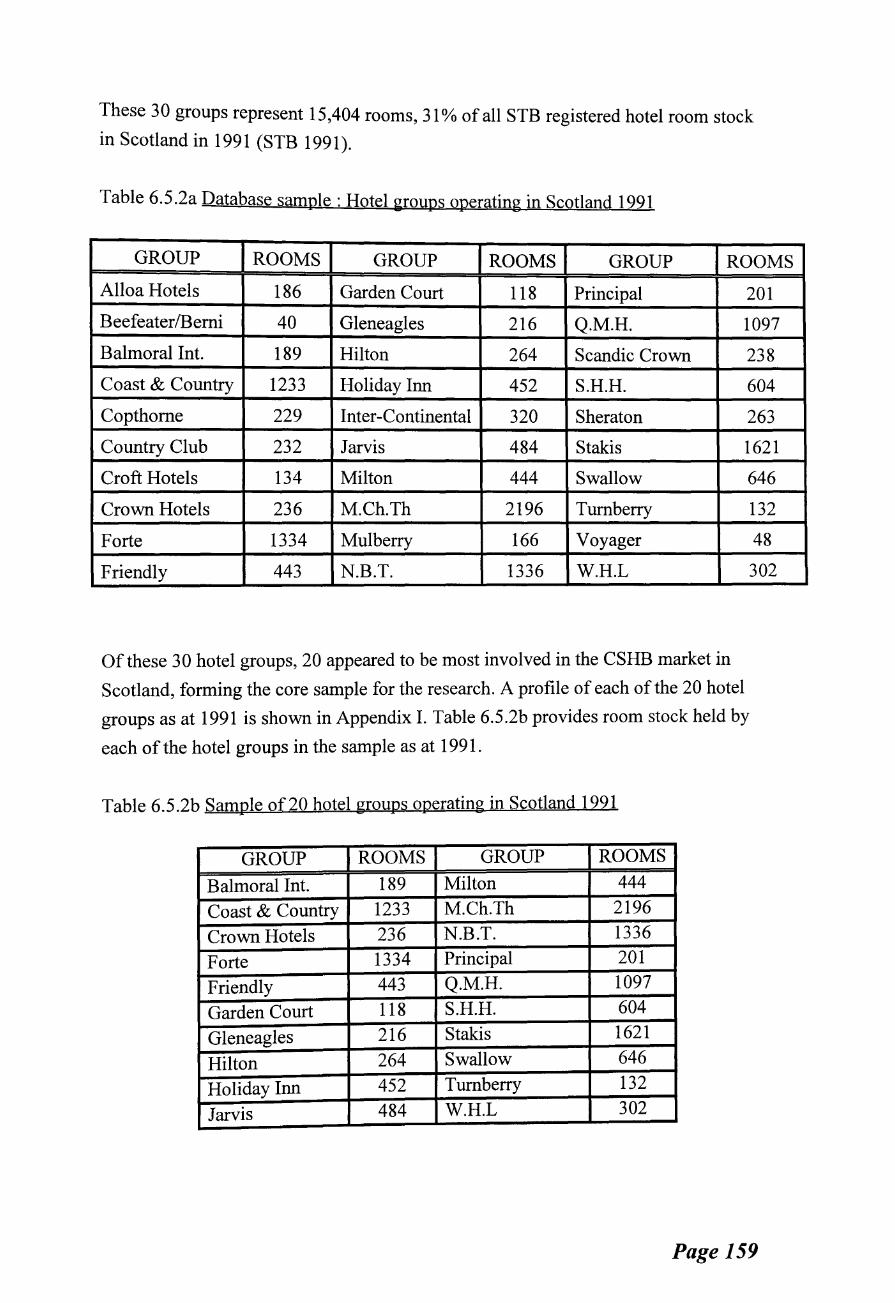
These 30 groups represent 15,404 rooms, 31 o/o of all STB registered hotel room stock
in Scotland in 1991 (STB 1991).
Table 6.5.2a Database sample :Hotel groups operating in Scotland 1991
GROUP ROOMS GROUP ROOMS GROUP ROOMS
Alloa Hotels 186 Garden Court 118 Principal 201
Beefeater /Berni 40 Gleneagles 216 Q.M.H. 1097
Balmoral Int. 189 Hilton 264 Scandic Crown 238
Coast & Country 1233 Holiday Inn 452 S.H.H. 604
Copthome 229 Inter-Continental 320 Sheraton 263
Country Club 232 Jarvis 484 Stakis 1621
Croft Hotels 134 Milton 444 Swallow 646
Crown Hotels 236 M.Ch.Th 2196 Turn berry 132
Forte 1334 Mulberry 166 Voyager 48
Friendly 443 N.B.T. 1336 W.H.L 302
Of these 30 hotel groups, 20 appeared to be most involved in the CSHB market in
Scotland, forming the core sample for the research. A profile of each of the 20 hotel
groups as at 1991 is shown in Appendix I. Table 6.5.2b provides room stock held by
each of the hotel groups in the sample as at 1991.
Table 6.5.2b Sample of20 hotel groups operating in Scotland 1991
GROUP ROOMS GROUP ROOMS
Balmoral Int. 189 Milton 444
Coast & Country 1233 M.Ch.Th 2196
Crown Hotels 236 N.B.T. 1336
Forte 1334 Principal 201
Friendly 443 Q.M.H. 1097
Garden Court 118 S.H.H. 604
Gleneagles 216 Stakis 1621
Hilton 264 Swallow 646
Holiday Inn 452 Turn berry 132
Jarvis 484 W.H.L 302
Page 159
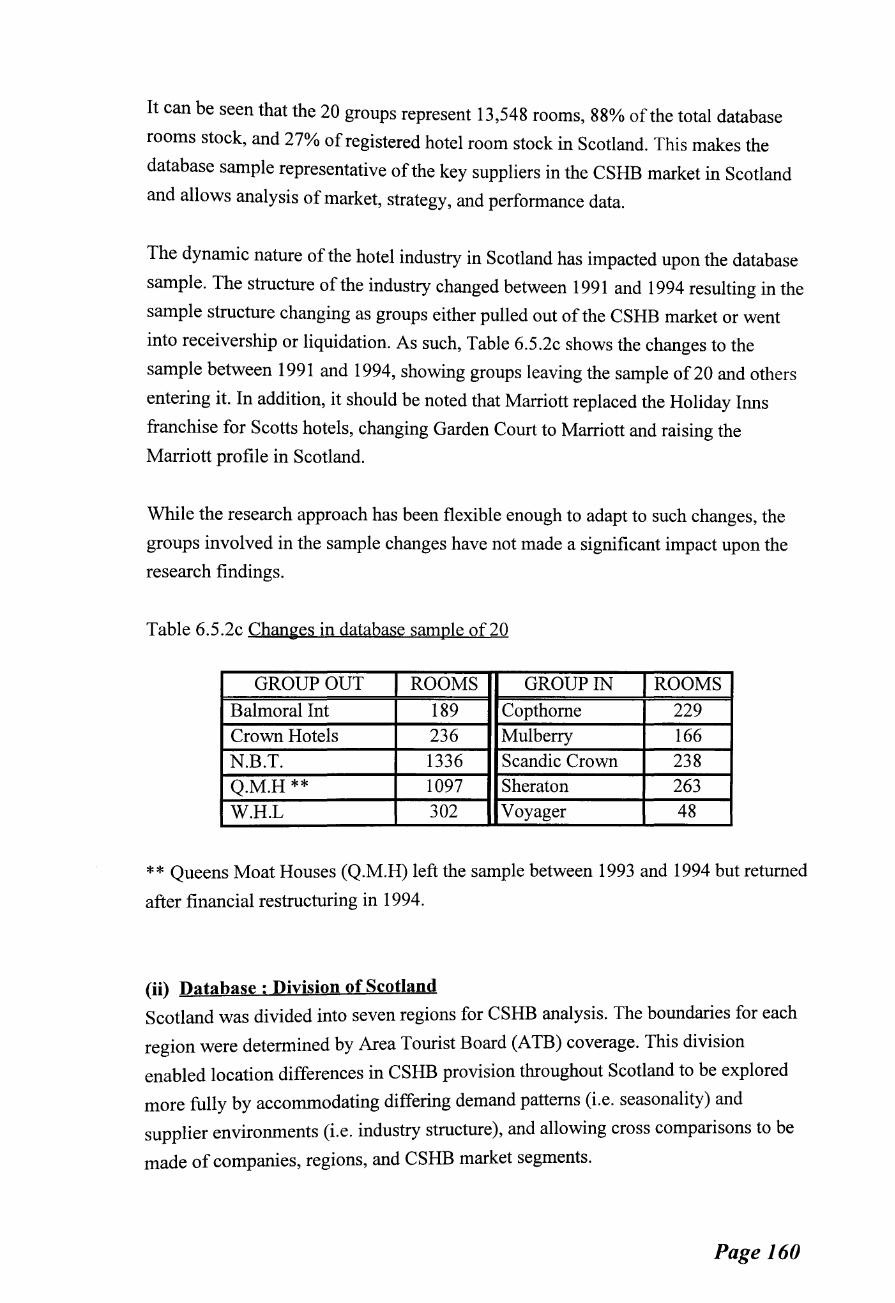
It can be seen that the 20 groups represent 13,548 rooms, 88% of the total database
rooms stock, and 27% of registered hotel room stock in Scotland. This makes the
database sample representative of the key suppliers in the CSHB market in Scotland
and allows analysis of market, strategy, and performance data.
The dynamic nature of the hotel industry in Scotland has impacted upon the database
sample. The structure of the industry changed between 1991 and 1994 resulting in the
sample structure changing as groups either pulled out of the CSHB market or went
into receivership or liquidation. As such, Table 6.5.2c shows the changes to the
sample between 1991 and 1994, showing groups leaving the sample of20 and others
entering it. In addition, it should be noted that Marriott replaced the Holiday Inns
franchise for Scotts hotels, changing Garden Court to Marriott and raising the
Marriott profile in Scotland.
While the research approach has been flexible enough to adapt to such changes, the
groups involved in the sample changes have not made a significant impact upon the
research findings.
Table 6.5.2c Changes in database sample of20
GROUP OUT ROOMS GROUP IN ROOMS
Balmoral Int 189 Copthorne 229 Crown Hotels 236 Mulberry 166
N.B.T. 1336 Scandic Crown 238 Q.M.H ** 1097 Sheraton 263
W.H.L 302 Voyager 48
**Queens Moat Houses (Q.M.H) left the sample between 1993 and 1994 but returned
after financial restructuring in 1994.
(ii) Database : Division of Scotland
Scotland was divided into seven regions for CSHB analysis. The boundaries for each
region were determined by Area Tourist Board (ATB) coverage. This division
enabled location differences in CSHB provision throughout Scotland to be explored
more fully by accommodating differing demand patterns (i.e. seasonality) and
supplier environments (i.e. industry structure), and allowing cross comparisons to be
made of companies, regions, and CSHB market segments.
Page 160
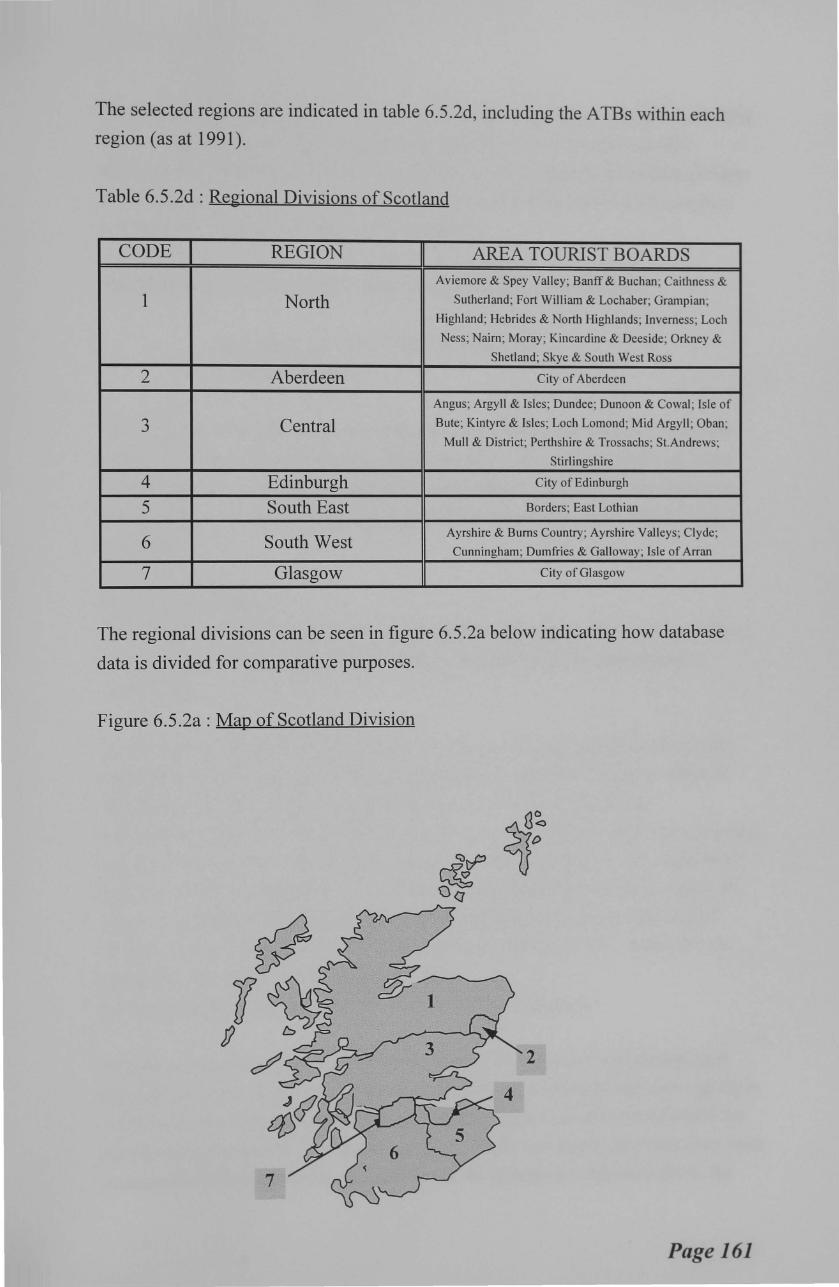
The selected regions are indicated in table 6.5.2d, including the ATBs within each
region (as at 1991).
Table 6.5.2d : Regional Divisions of Scotland
CODE REGION AREA TOURIST BOARDS Aviemore & Spey Valley; Banff & Buchan; Caithness &
1 North Sutherland; Fort William & Lochaber; Grampian;
Highland; Hebrides & North Highlands; Inverness ; Loch
Ness; Nairn; Moray; Kincardine & Deeside; Orkney &
Shetland; Skye & South West Ross
2 Aberdeen City of Aberdeen
Angus; Argyll & Isles; Dundee; Dunoon & Cowal ; Isle of
3 Central Bute; Kintyre & Isles ; Loch Lomond; Mid Argyll ; Oban;
Mull & District; Perthshire & Trossachs; St.Andrews;
Stirlingshire
4 Edinburgh City of Edinburgh
5 South East Borders; East Lothian
6 South West Ayrshire & Bums Country; Ayrshire Valleys ; Clyde;
Cunningham; Dumfries & Galloway; Isle of Arran
7 Glasgow City of Glasgow
The regional divisions can be seen in figure 6.5.2a below indicating how database
data is divided for comparative purposes.
Figure 6.5.2a : Map of Scotland Division
Page 161
Previously this approach had not been taken in analysing supply in Scotland resulting
in a shortage of regional data (MacKay Consulting 1991 ), however since this
approach was applied and submitted in a report for the Scottish Tourist Board (Edgar
1992) figures have begun to be divided by regions of Scotland for UKTS statistics '
and therefore regional data figures should improve.
The initial hotel groups database was supported by two other databases :
• short break operators (SBO) database, and
• consortia database.
The purpose of these databases was to allow cross referencing where required, and
provide a competitive dimension to supplier analysis. While the prime focus of the
research has been hotel group dynamics these databases indicated developments on
the periphery of supply, indicating two very different markets warranting their own
investigation.
6.5.3 Questionnaires
Three phases of questionnaires were used to gather information from key executives
with regard to market characteristics, strategy developments and organisational
performance.
In constructing the questionnaire a series of informal focus group discussions were
undertaken with key executives of two organisations. These focus groups allowed
clarification of terminology adopted and types of questions to be posed.
Before implementing the questionnaires, they were subjected to a three phase piloting
process. The first level of pilot was undertaken at academic level by the supervisory
team. Following amendments, the second pilot was applied and comments received
from L.Jones (Edinburgh Marketing Research Manager- now Edinburgh Tourist
Board). Having undertaken further amendments the third pilot was constructed and
tested on one of the focus group organisations.
Having made final amendments, the interviews were conducted.
Telephone interviews were used in phases I and II. This method was selected as it
allowed focus of sample on exact persons responsible for strategic decision-making in
CSHB markets. This maximised control over targeting the sample and enhanced the
confidence in the results. This method allowed people who might otherwise have been
inaccessible to be interviewed. As time was of the essence for such executives, the
Page 162
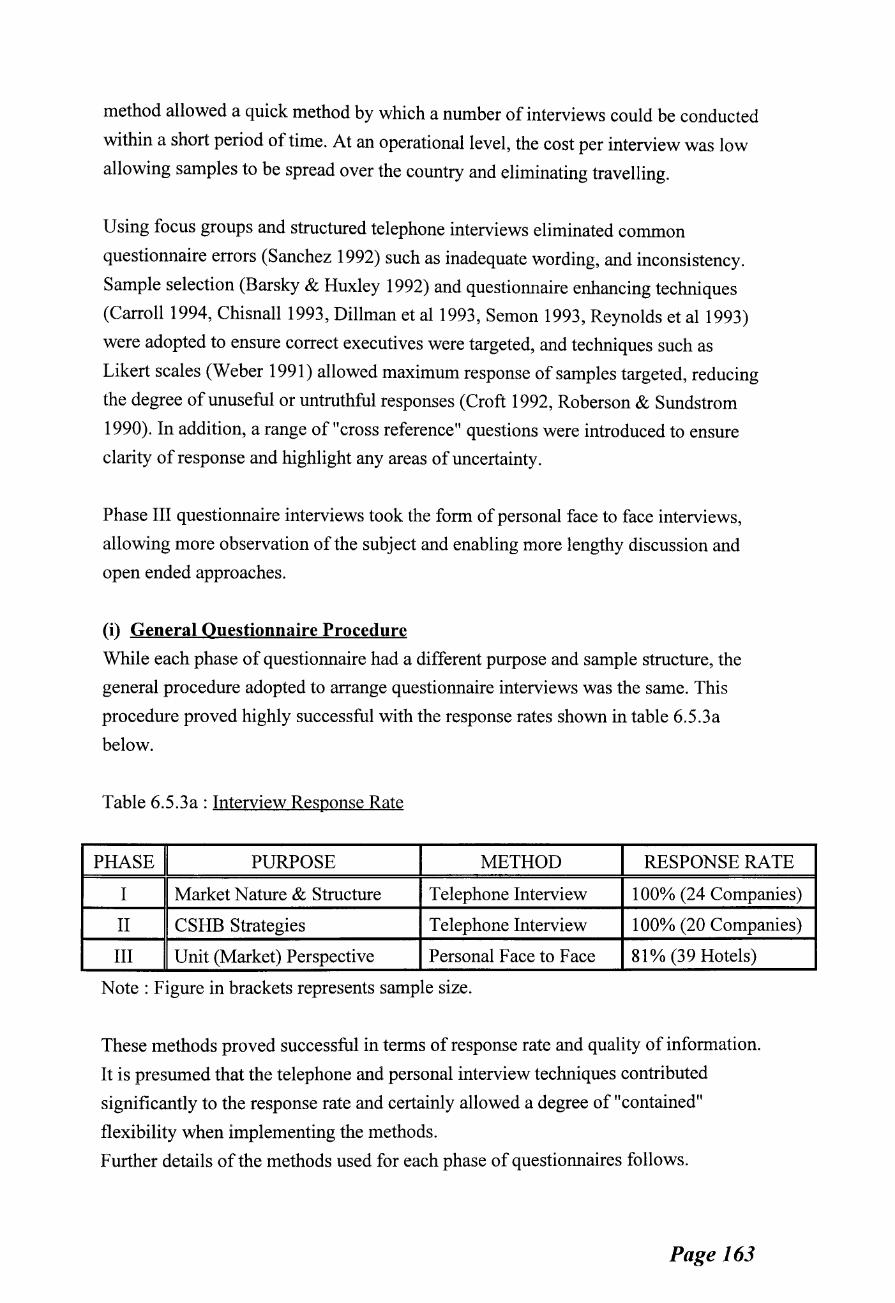
method allowed a quick method by which a number of interviews could be conducted
within a short period of time. At an operational level, the cost per interview was low
allowing samples to be spread over the country and eliminating travelling.
Using focus groups and structured telephone interviews eliminated common
questionnaire errors (Sanchez 1992) such as inadequate wording, and inconsistency.
Sample selection (Barsky & Huxley 1992) and questionnaire enhancing techniques
(Carroll1994, Chisnall1993, Dillman et al1993, Semon 1993, Reynolds et al1993)
were adopted to ensure correct executives were targeted, and techniques such as
Likert scales (Weber 1991) allowed maximum response of samples targeted, reducing
the degree ofunuseful or untruthful responses (Croft 1992, Roberson & Sundstrom
1990). In addition, a range of "cross reference" questions were introduced to ensure
clarity of response and highlight any areas of uncertainty.
Phase III questionnaire interviews took the form of personal face to face interviews,
allowing more observation of the subject and enabling more lengthy discussion and
open ended approaches.
(i) General Questionnaire Procedure
While each phase of questionnaire had a different purpose and sample structure, the
general procedure adopted to arrange questionnaire interviews was the same. This
procedure proved highly successful with the response rates shown in table 6.5.3a
below.
Table 6.5.3a : Interview Response Rate
PHASE PURPOSE METHOD RESPONSE RATE
I Market Nature & Structure Telephone Interview 100% (24 Companies)
II CSHB Strategies Telephone Interview 100% (20 Companies)
III Unit (Market) Perspective Personal Face to Face 81% (39 Hotels)
Note :Figure in brackets represents sample size.
These methods proved successful in terms of response rate and quality of information.
It is presumed that the telephone and personal interview techniques contributed
significantly to the response rate and certainly allowed a degree of "contained"
flexibility when implementing the methods.
Further details of the methods used for each phase of questionnaires follows.
Page 163
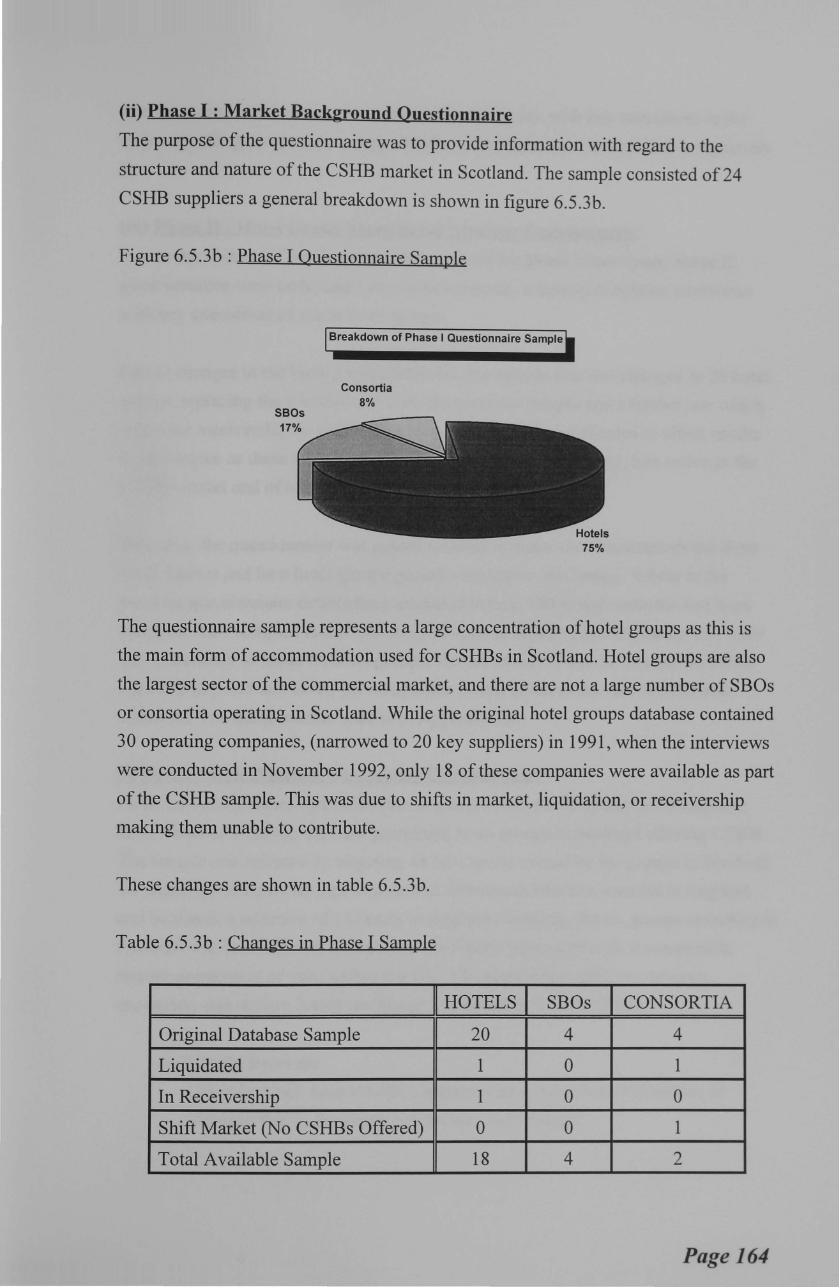
(ii) Phase I : Market Background Questionnaire
The purpose of the questionnaire was to provide information with regard to the
structure and nature of the CSHB market in Scotland. The sample consisted of 24
CSHB suppliers a general breakdown is shown in figure 6.5.3b.
Figure 6.5.3b : Phase I Questionnaire Sample
Breakdown of Phase I Questionnaire Sample
Consortia 8%
75%
The questionnaire sample represents a large concentration of hotel groups as this is
the main form of accommodation used for CSHBs in Scotland. Hotel groups are also
the largest sector of the commercial market, and there are not a large number of SBOs
or consortia operating in Scotland. While the original hotel groups database contained
30 operating companies, (narrowed to 20 key suppliers) in 1991, when the interviews
were conducted in November 1992, only 18 ofthese companies were available as part
of the CSHB sample. This was due to shifts in market, liquidation, or receivership
making them unable to contribute.
These changes are shown in table 6.5.3b.
Table 6.5.3b : Changes in Phase I Sample
HOTELS SBOs CONSORTIA
Original Database Sample 20 4 4
Liquidated 1 0 1
In Receivership 1 0 0
Shift Market (No CSHBs Offered) 0 0 1
Total Available Sample 18 4 2
Page 164
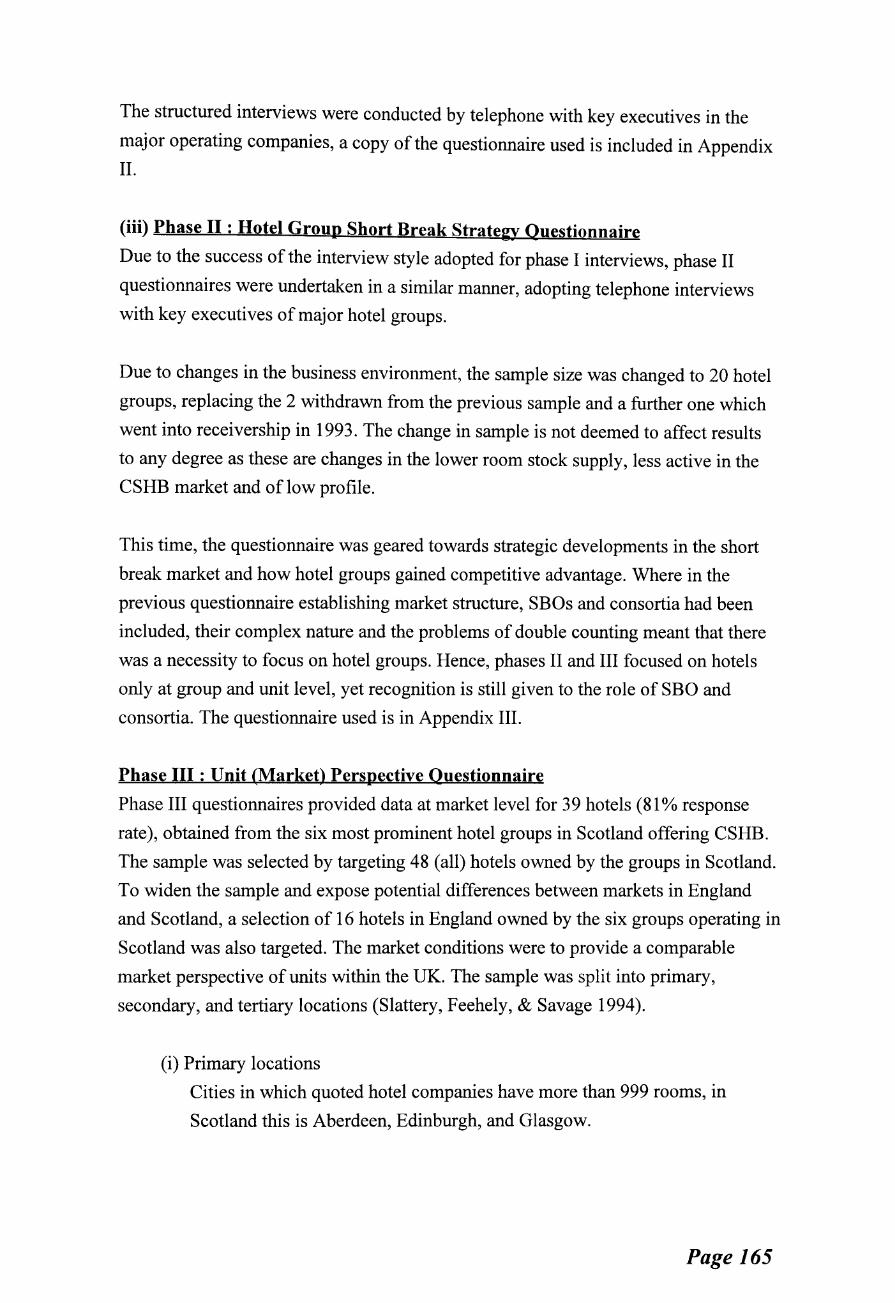
The structured interviews were conducted by telephone with key executives in the
major operating companies, a copy of the questionnaire used is included in Appendix
II.
(iii) Phase II : Hotel Group Short Break Strategy Questionnaire
Due to the success of the interview style adopted for phase I interviews, phase II
questionnaires were undertaken in a similar manner, adopting telephone interviews
with key executives of major hotel groups.
Due to changes in the business environment, the sample size was changed to 20 hotel
groups, replacing the 2 withdrawn from the previous sample and a further one which
went into receivership in 1993. The change in sample is not deemed to affect results
to any degree as these are changes in the lower room stock supply, less active in the
CSHB market and of low profile.
This time, the questionnaire was geared towards strategic developments in the short
break market and how hotel groups gained competitive advantage. Where in the
previous questionnaire establishing market structure, SBOs and consortia had been
included, their complex nature and the problems of double counting meant that there
was a necessity to focus on hotel groups. Hence, phases II and III focused on hotels
only at group and unit level, yet recognition is still given to the role of SBO and
consortia. The questionnaire used is in Appendix III.
Phase III: Unit (Market) Perspective Questionnaire
Phase III questionnaires provided data at market level for 39 hotels (81% response
rate), obtained from the six most prominent hotel groups in Scotland offering CSHB.
The sample was selected by targeting 48 (all) hotels owned by the groups in Scotland.
To widen the sample and expose potential differences between markets in England
and Scotland, a selection of 16 hotels in England owned by the six groups operating in
Scotland was also targeted. The market conditions were to provide a comparable
market perspective of units within the UK. The sample was split into primary,
secondary, and tertiary locations (Slattery, Feehely, & Savage 1994).
(i) Primary locations
Cities in which quoted hotel companies have more than 999 rooms, in
Scotland this is Aberdeen, Edinburgh, and Glasgow.
Page 165

(ii) Secondary locations
Towns and cities in which quoted hotel companies have more than 199
rooms but less than 999.
(iii) Tertiary locations
Sites, villages, towns, and cities in which quoted hotel companies have less
than 199 rooms.
The sample split by location is shown in figure 6.5.3c
Figure 6.5.3c
Figure 6.5.3c
Breakdown of Questionnaire Sample by Location - Hotel Units
Secondary 54%
Tertiary 18%
Primary 28%
Breakdown of Questionnaire Sample by Location - Hotel Rooms
Secondary 51%
Tertiary 10%
Primary 39%
The sample may appear to be skewed towards primary and secondary locations. This
reflects the nature of hotel group provision as a whole as is therefore valid.
Page 166
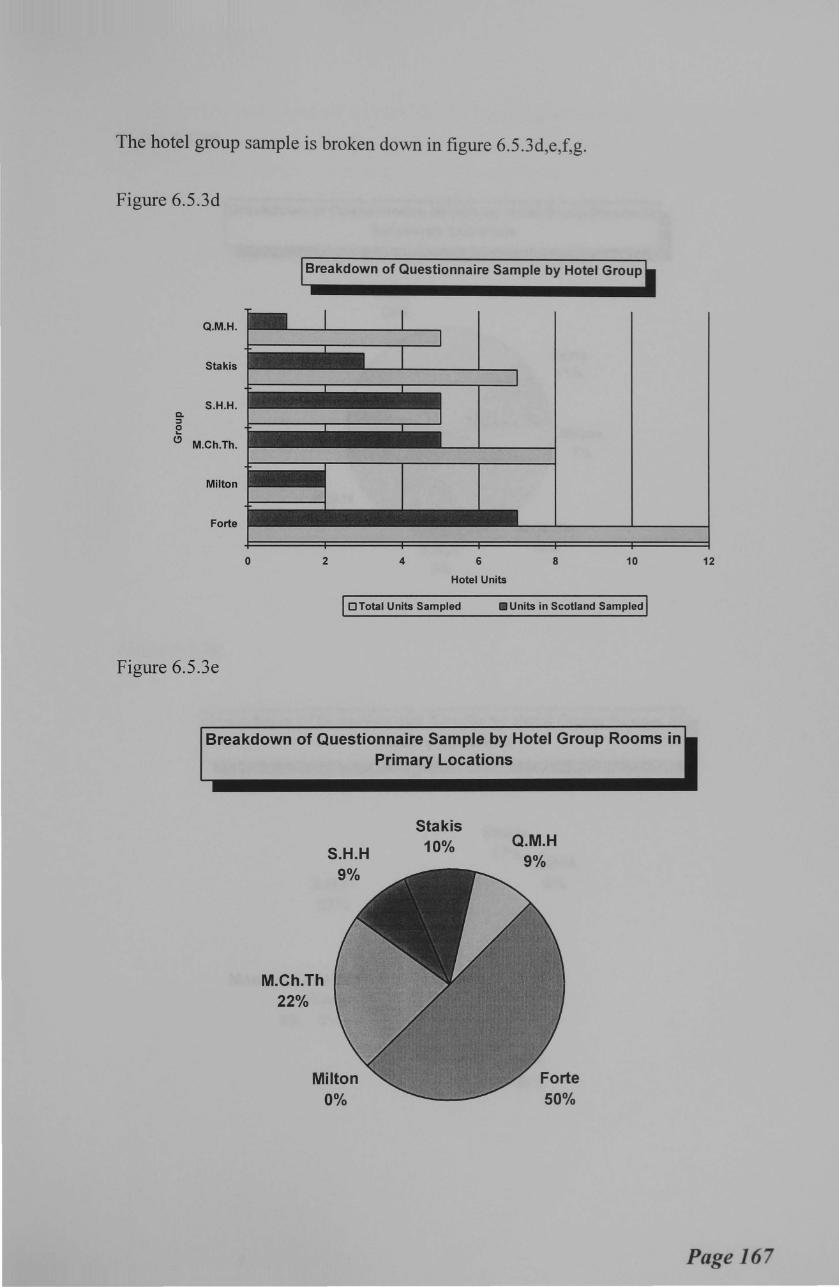
The hotel group sample is broken down in figure 6.5.3d,e,f,g.
Figure 6.5.3d
Q.M.H.
Stakis
S.H.H. a. ::I 0 ..
(!) M.Ch.Th.
Milton
Forte
Figure 6.5.3e
0
Breakdown of Questionnaire Sample by Hotel Group
2 4 6
Hotel Units
8 10
OTotal Units Sampled II Units in Scotland Sampled
Breakdown of Questionnaire Sample by Hotel Group Rooms in Primary Locations
M.Ch.Th 22%
S.H.H
Stakis 10% Q.M.H
9%
12
Page 167

Figure 6.5.3f
Figure 6.5.3g
Breakdown of Questionnaire Sample by Hotel Group Rooms in I Secondary Locations
Q.M.H. 34%
11%
S.H.H. 19% 3%
Milton 7%
Breakdown of Questionnaire Sample by Hotel Group Rooms in Tertiary Locations
S.H.H. 27%
Mount Charlotte Milton
0% 0%
Stakis
17% Q.M.H.
0%
56%
Page 168

The interviews were conducted face to face with hotel general managers. This enabled
market based information to be gathered providing a multi site perspective to the
research, allowing market and industry comparisons to be drawn, and eliminating
problems associated with telephone interviews.
A sample of the questionnaire is found in Appendix IV.
Page 169
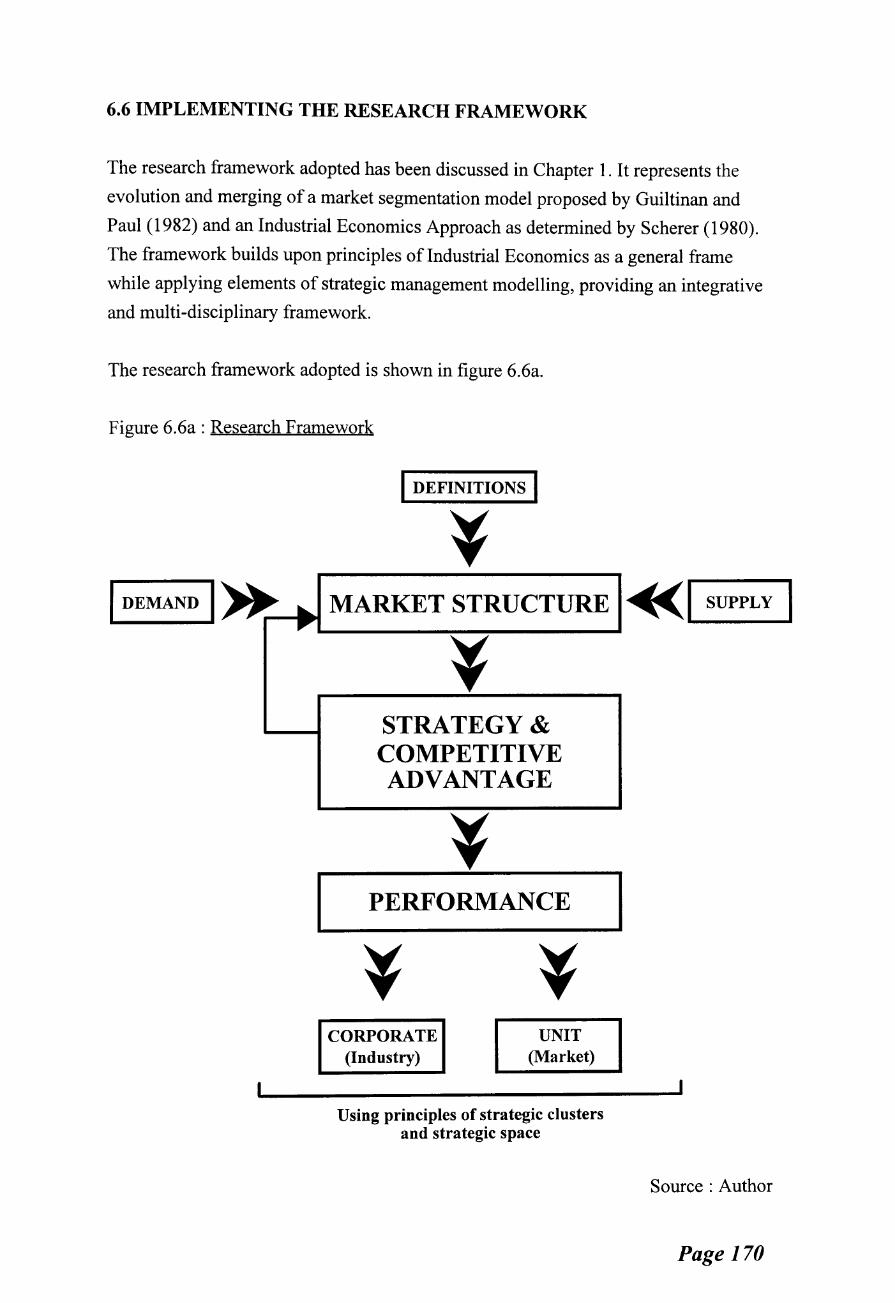
6.6 IMPLEMENTING THE RESEARCH FRAMEWORK
The research framework adopted has been discussed in Chapter 1. It represents the
evolution and merging of a market segmentation model proposed by Guiltinan and
Paul (1982) and an Industrial Economics Approach as determined by Scherer (1980).
The framework builds upon principles of Industrial Economics as a general frame
while applying elements of strategic management modelling, providing an integrative
and multi-disciplinary framework.
The research framework adopted is shown in figure 6.6a.
Figure 6.6a: Research Framework
I DEFINITIONS I
¥ I DEMAND I~----... MARKET STRUCTURE ~I SUPPLY I ,...
¥ STRATEGY & COMPETITIVE ADVANTAGE
PERFORMANCE
CORPORATE (Industry)
UNIT (Market)
Using principles of strategic clusters and strategic space
Source : Author
Page 170
An extensive literature review allowed general background information with regard to
definitions, demand and supply characteristics to be formed.
While literature was limited and variable in quality, it did provide a foundation for the
research. Having posed the research question and established the research aims and
objectives, the research framework consisted of three key elements:
(i) market structure for CSHB in Scotland is determined through a mix of
qualitative and quantitative data obtained via the literature review, database results
and phase I questionnaires.
(ii) strategy and competitive advantage is determined via phase II questionnaires to
determine strategies adopted and then the implementation of strategic group
theory to analyse the corporate dynamics of strategy in CSHB markets.
(iii) performance is analysed at corporate level through the results of phase III
questionnaires and data from financial reports, essentially adopting principles of
triangulation to cross reference qualitative and quantitative data.
Following the construction of a performance enhancement model at corporate level, a
multi-site approach is adopted to test the model at unit level across a range of
locations, essentially through the use of phase III questionnaires. The results of the
multi-site analysis are presented in Appendix V- "Testing the model".
Page 171

6.7 CHAPTER SUMMARY
This chapter has clarified the research questions asked and from such questions
formulated the research aim. Research objectives have been set and the definition of
CSHB established.
It has been established that the key contribution to knowledge of the research will be
in the field of hospitality strategic management and analysis of hospitality markets
and that a framework will be constructed to explore the nature of market structure
strategy-performance relationships in markets.
Research methods have been clarified with particular focus on the hotel groups
database construction, and questionnaire design and implementation. A mixture of
qualitative and quantitative approaches have been adopted within the context of the
research framework, representing an evolution of a market segmentation model and
Industrial Economics approach.
The rationale for questionnaire technique has been determined and detail provided as
to sample size and response rates.
Particular focus was on the environmental influences upon the database and
questionnaire samples, and the effects upon such organisations resulting in a changing
sample base.
The research framework adopted was explained and the stages of application
highlighted. The framework is applied in three stages (i) structure of CSHB markets
in Scotland, (ii) CSHB strategies and competitive advantage, and (iii) performance in
the CSHB market.
In Part III these three stages are applied to CSHB markets in Scotland.
In Part IV linkages between structure, strategy and performance are established,
constructing a performance enhancement model, providing a critical review of the
methodology adopted and highlighting areas of contribution to knowledge and further
research.
Page 172
REFERENCES
Barsky, J.D; Huxley, S.J (1992) "A customer- survey tool: Using the quality
sample", Cornell HRA Quarterly, 33(6) pp 18-25
Carroll, S (1994) "Questionnaire design affects response rate", Marketing News, 28(1) pp 14, 23
Chisnall, P.M (1993) "Questionnaire design. interviewing and attitude measurement",
Journal of Market Research Society, 35(4) October pp 392
Croft, R (1992) "How to minimise the problem of untruthful response", Business Marketing Digest, 17(3) pp 17-23
Dillman, D.A; Sinclair, M.D; Clark, J.R (1993) "Effects of questionnaire length.
respondent - friendly design= and a difficult question on response rates for
occupant - addressed census mail surveys", Public Opinion Quarterly, 57(3)
Fall pp 289-304
Edgar, D (1992) "Commercial short holiday breaks in Scotland"= Report for the
Scottish Tourist Board, March/April
Edgar, D; Litteljohn, D.L (1994) "Strategic group clusters and strategic space: the
case of the UK short break market", International Journal of Contemporary Hospitality Management, 6(5) pp 20-26
Edgar, D; Litteljohn, D.L; Allardyce, M.L; Wanhill, S.R.C (1994) "Commercial short
holiday breaks :market structure= competitive strategy and performance",
Tourism State of the Art, Wiley & Sons London pp 323-342
MacKay Consultants (1991) "Tourism commentary: the mythical boom", MacKay
Consultants, Inverness October
Reynolds, N; Diamantopoulous, A; Schlegelmilch, B (1993) "Pretesting in
questionnaire design : a review of literature and suggestions for further
research", Journal of Market Research Society, 35(2) April pp 171-182
Roberson, M.T; Sunderstrom, E (1990) "Questionnaire design. return rates= and
response favorableness in an employee attitude questionnaire", Journal of Applied Psychology, 75(3) pp 354-357
Sanchez, M.E (1992) "Effects of questionnaire design on the quality of survey data",
Public Opinion Quartely, 56(2) Summer pp 206-217
Scherer, F .M (1980) "Industrial market structure and economic performance", 2nd
Edition Rand McNally
Semon, T.T (1993) "Three options designed to fight non-response", Marketing News, 27(17) August pA19
Page 173
Slattery, P; Feehely, G; Savage, M (1994) "Quoted hotel companies: the World
markets 1994", Klein wort Benson Securities Ltd, 8 pp 14-15
Page 174
PARTlY
FINDINGS & ANALYSIS
CHAPTER7 STRUCTURE OF CSHB MARKETS
CHAPTERS
PAaE
175
CSHB STRATEGIES AND COMPETITIVE ADVANTAGE 217
cHAPTER9 PERFORMANCE IN THE CSHB MARKET 260

CHAPTER SEVEN
STRUCTURE OF CSHB MARKETS IN SCOTLAND
7.1 INTRODUCTION
Previous chapters have established that the competitive environment for hospitality
and tourism suppliers, of which CSHB form a part are increasingly dynamic,
complex, and aggressive. Through applying Porter's industry structure model (1979),
this chapter seeks to establish the structure of the CSHB markets. As the market is
complex, making analysis and dissemination of results difficult, a macro and micro
structure approach are adopted. The macro structure establishes holistic industry and
hotel group perspectives to CSHB market structures, while the micro structure
through focusing on the questionnaire results (Phase I and II) and database sample of
20 groups operating in Scotland establishes the CSHB market structure of the research
sample.
From the structural analysis, three key structural variables: market scope (i.e.
segments), market size (i.e. group concentration) and sources of competitive
advantage are identified as of key relevance to the market structure, highlighting these
elements for further analysis in later chapters.
7.2 THEORETICAL FOUNDATIONS
The concept of structure from the research framework, has noticeably been employed
in the development of many strategy and business typologies.
Structure, as with the environment, can relate to industry (Porter 1980, 1985, 1987,
West & Olsen 1989) or operational/administrative level (Thomas 1980, Fahy et al
1981, Jain 1984, Lenz & Engledow 1986, Walker & Ruekert 1987). This research
adopts Porter's view that the structure of the industry within which a firm competes is
a key factor of the firm's environment and therefore the firm's performance (Porter
1980, 1985). Hence, the structure element ofthe research framework concentrates on
industry structure as opposed to individual organisation structures.
Adopting this approach allows an understanding of the operating environment within
which firms must compete, displays the constraints or opportunities which present
themselves to the firm, shapes strategic direction, and ultimately determines
organisational structure (Miller 1987, Jacobson 1992, Lawrence & Lorsch 1967,
Miles & Snow 1978, Khandwalla 1977). Thus by adopting an industry approach to
structure the effects of the core non-controllable (Ackoff 1970, Hatten, Schendel &
Page 175
Cooper 1978) elements of the market (i.e. its environment, and company responses)
are accounted for, as opposed to just the resulting organisation structures. This is a
view much supported by Johnson and Thomas (1987) who claim a knowledge of
industry structure and evolution can help in the identification of key strategic
dimensions and strategic positions influencing the strategy decisions of member
compan1es.
While the research recognises that organisation structures of today will in effect form
the industry structure of tomorrow (Dev & Brown 1990, Hatten & Hatten 1987,
Newman 1978, Oster 1982, Rumelt 1982, Lewis & Chambers 1989), the time scale of
research was not adequate to fully investigate the effects of changing organisation
structures on industry structures relative to CSHB markets. This may be one key area
for future research. For an operational/administrative level analysis of hotel
organisations structure-performance links, the reader is referred to a PhD Dissertation
by Ping-Fu Wang, Manchester Metropolitan University 1993, "Business strategy,
organisation structure and performance", work by Schaffer (1984) and by Belkaoui
and Pavlik (1992) in relation to ownership structure.
Having determined the need to examine CSHB structure on an industry basis the
question arises as to what constitutes an industry. McGee (1985) recognises that "the
industry as conventionally understood produces a range of different products all of
which are not close substitutes, and with a variety of technical production processes."
This begs the question as to where boundaries of an industry should be drawn. McGee
suggests two key criteria for this purpose, (i) market criterion, representing the
collection of firms which produce "products that are sufficiently similar as to be close
substitutes in the eye ofthe buyer", and (ii) technological criterion, where industry is
represented by firms adopting similar production processes. For the purposes of
examining CSHB structure, the market criterion approach is adopted, exposing key
elements of the market, namely the nature of market provision and supplier strategies.
The industrial economics approach framework is adapted to account for the
development of generic business strategies which McWilliams & Smart (1993) claim
are the function of specific industry structure characteristics. While this provides a
grounding to CSHB structure, the research does not focus solely on market structure,
as the result may focus on the wrong level of analysis (Barney, Me Williams & Turk
1989, Jacobsen 1988, Barney & Hoskisson 1990) and cause the dynamics of
competition and strategic developments to be diluted. The approach adopted allows
greater focus on the methods adopted and the developments of suppliers.
Page 176
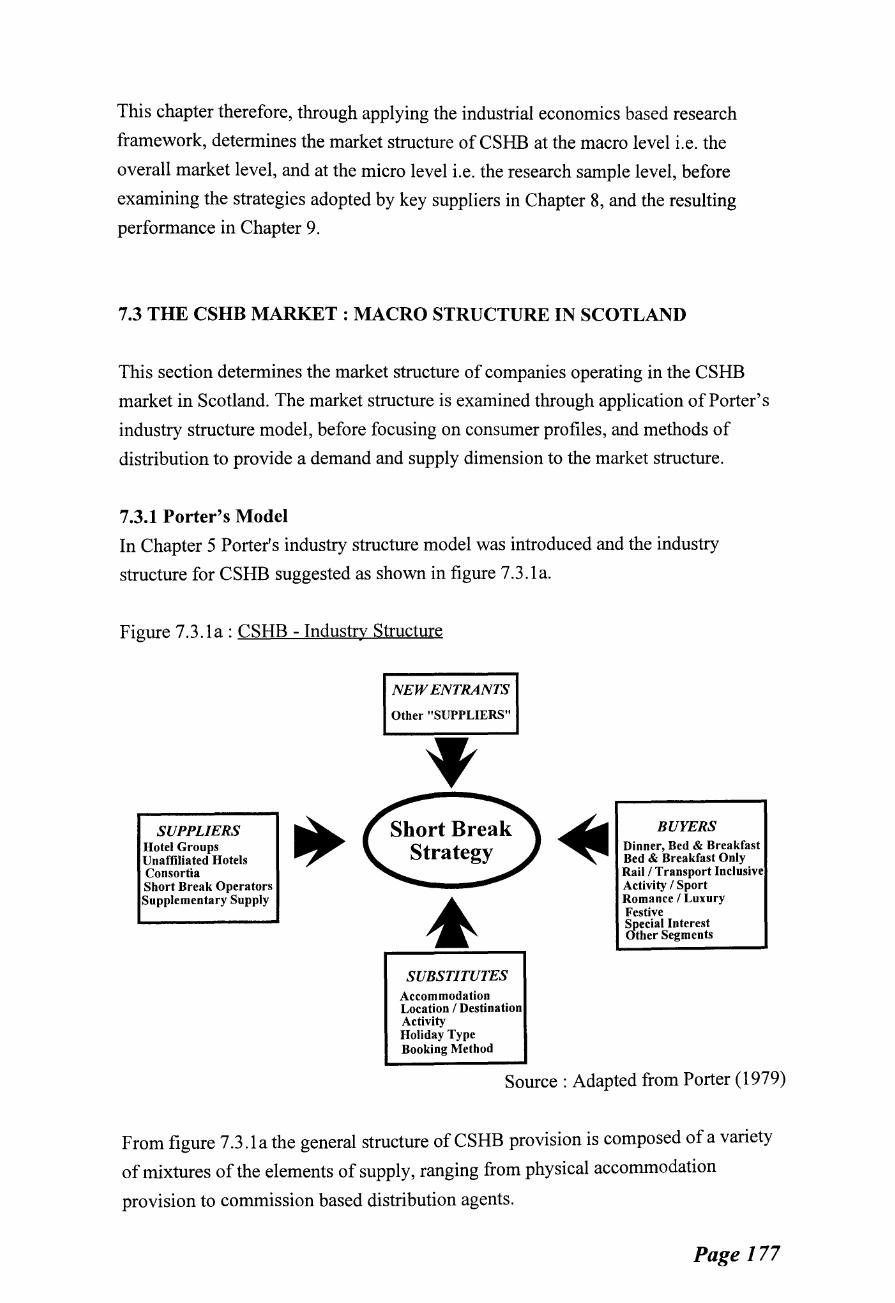
This chapter therefore, through applying the industrial economics based research
framework, determines the market structure of CSHB at the macro level i.e. the
overall market level, and at the micro level i.e. the research sample level, before
examining the strategies adopted by key suppliers in Chapter 8, and the resulting
performance in Chapter 9.
7.3 THE CSHB MARKET : MACRO STRUCTURE IN SCOTLAND
This section determines the market structure of companies operating in the CSHB
market in Scotland. The market structure is examined through application of Porter's
industry structure model, before focusing on consumer profiles, and methods of
distribution to provide a demand and supply dimension to the market structure.
7.3.1 Porter's Model
In Chapter 5 Porter's industry structure model was introduced and the industry
structure for CSHB suggested as shown in figure 7.3 .1 a.
Figure 7.3.1a : CSHB -Industry Structure
SUPPLIERS Hotel Groups Unaffiliated Hotels Consortia Short Break Operators Supplementary Supply
NEW ENTRANTS Other "SUPPLIERS"
SUBSTITUTES Accommodation Location I Destination Activity Holiday Type Booking Method
BUYERS Dinner, Bed & Breakfast Bed & Breakfast Only Rail I Transport Inclusive Activity I Sport Romance I Luxury Festive Special Interest Other Segments
Source : Adapted from Porter ( 1979)
From figure 7.3 .1 a the general structure of CSHB provision is composed of a variety
of mixtures of the elements of supply, ranging from physical accommodation
provision to commission based distribution agents.
Page 177
The suppliers can be divided into four types of supply :
• corporate hotel group/chains :usually large, often public quoted
companies who issue specialist brochures for CSHB;
• hotel consortia: organisation often used by small privately owned
hotels to gain marketing and purchasing economies;
• short break operators (SBO) : specialist intermediaries that do not own
hotels but obtain revenue by brochure inclusion fees and commission,
often used by hotel groups to supplement distribution;
• destination marketing : organisations designed to market a particular
location areas, thus providing valuable spin-off benefits for all local
trade as well as direct marketing members.
While the holistic view of competition is useful to establish the general feel for the
CSHB market structure. Focusing on the individual components of hotel group
provision establishes a more detailed and focused perspective of the CSHB market
structure facing hotel groups. This is shown in figure 7.3 .1 b.
Page 178
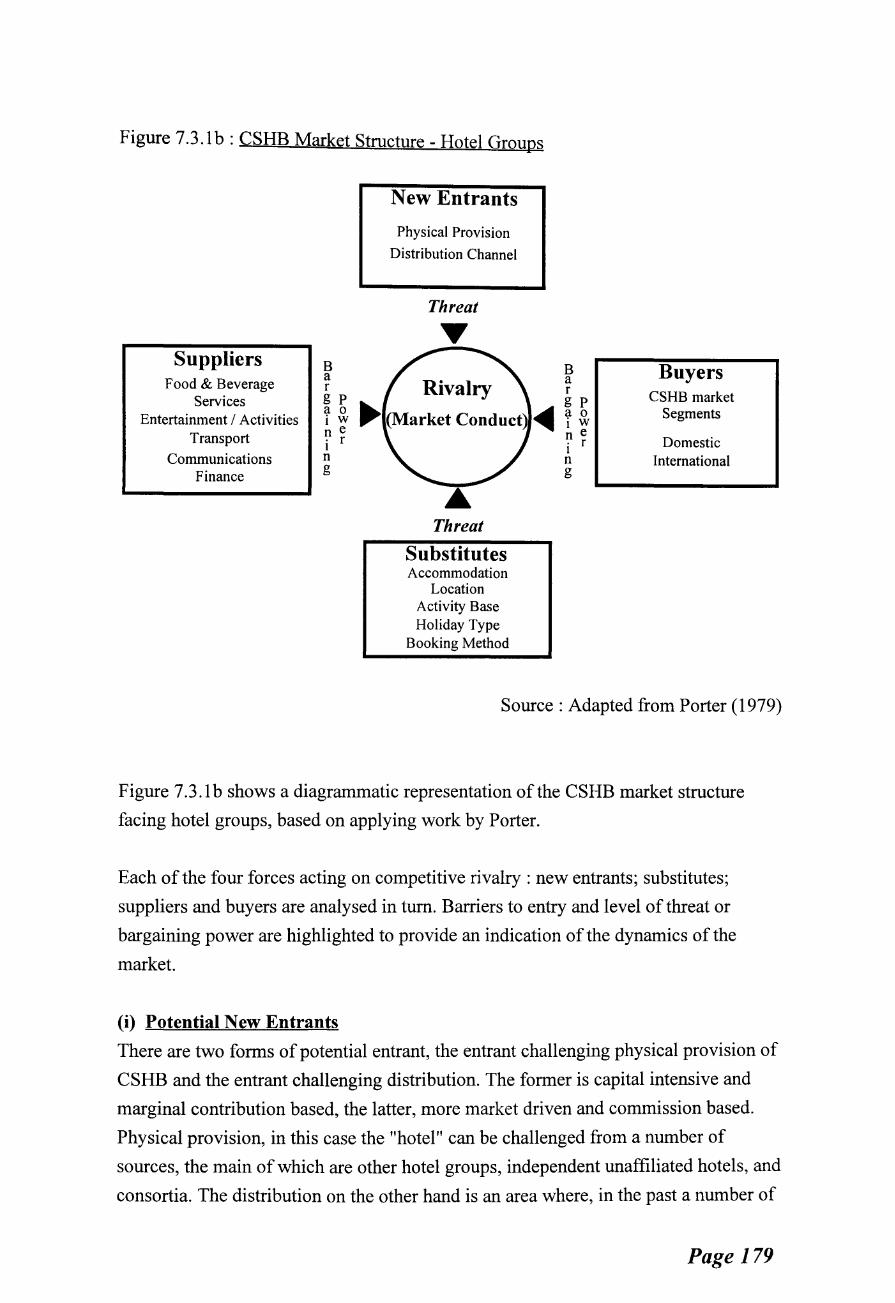
Figure 7.3.1 b: CSHB Market Structure- Hotel Groups
Suppliers Food & Beverage
Services Entertainment I Activities
Transport
Communications Finance
B a r g p a o iW n e i r n g
New Entrants
Physical Provision
Distribution Channel
Threat
Threat Substitutes Accommodation
Location Activity Base Holiday Type
Booking Method
B a r g p a o iW n e i r n g
Buyers CSHB market
Segments
Domestic International
Source : Adapted from Porter (1979)
Figure 7.3 .1 b shows a diagrammatic representation of the CSHB market structure
facing hotel groups, based on applying work by Porter.
Each of the four forces acting on competitive rivalry : new entrants; substitutes;
suppliers and buyers are analysed in tum. Barriers to entry and level of threat or
bargaining power are highlighted to provide an indication of the dynamics of the
market.
(i) Potential New Entrants
There are two forms of potential entrant, the entrant challenging physical provision of
CSHB and the entrant challenging distribution. The former is capital intensive and
marginal contribution based, the latter, more market driven and commission based.
Physical provision, in this case the "hotel" can be challenged from a number of
sources, the main of which are other hotel groups, independent unaffiliated hotels, and
consortia. The distribution on the other hand is an area where, in the past a number of
Page 179
operators have attempted to enter the market, some successfully e.g. Goldenrail,
Superbreaks, P&O others not successfully Stardust, and Camelot. Such operators are
agents working for commission and include short break operators, travel/transport
companies, and handling agents.
While the basic concept of a CSHB is easily replicated by any hotel based
organisation the viability and levels of awareness generated by such organisations is
highly dependant upon the size, or critical mass the organisation can achieve, as such
Corporate hotel groups are therefore ideally positioned to enter the market, while
unaffiliated independents are less able to enter the market in a feasible or recognisable
manner, and as such tum to consortia to gain the mass required.
These characteristics have helped fuel the distribution entrants who, once established
are able to operate in a more cost effective, less labour intensive manner. They are
therefore able to allocate a greater majority of expenditure on promoting and
distributing branded concepts, in attempts to raise barriers to entry and hinder new
entrants attempting to overcome start-up cost.
Barriers to Entry
It has been established that CSHB are potentially very lucrative, providing not only an
additional market in a maturing holiday industry but also compensating for markets
lost or lagging. Therefore to gain additional, and/or protect existing market share,
operators create and raise barriers to entry.
In the CSHB market barriers to entry are clearly evident, often forming the basis of
suppliers' competitive strategy. The most evident barriers to emerge since the 1980's
relate to location, market level, facilities/differentiation, and size. These act as barriers
for both physical providers and distributors. The barriers are essentially the key
competitive strategies ofthe 1960s to 1980's suggesting that perhaps the strategies of
the 1980's and 1990's may become the barriers to entry of the future.
Page 180
(ii) Substitutes
Substitutes are evident in the "prime functions" of CSHB provision : accommodation,
location, activity base, holiday type and booking method.
Accommodation -
In substituting accommodation, a number of alternatives to hotels exist,
including caravans, VFR, and campsites. In addition, the level of
accommodation can be changed, i.e. trading down. These threats of
substitution are very high, however, as CSHB demand shifts more to cities,
and fully serviced accommodation packages are promoted, barriers to entry are
raised, reducing market attractiveness and discouraging substitutes.
Location-
As hotels are fixed in location they are under considerable threat if consumers
substitute location e.g. city/resort, national/international.
Activity Base -
Activities can be substituted, i.e. local attractions offering what may have been
part of a commissionable hotel package at a cheaper price, or customers taking
advantage of the basic hotel B&B package and making their own
entertainment.
Holiday Type -
Trends and disposable income are the key instigators in substituting holiday
type, with consumers deciding to try different types of holiday or fewer longer
holidays.
Booking Method -
Booking methods are closely linked to distribution and commission. Methods
include via travel agents, direct with hotels, through consortia, and through
short break operators. With commission ranging from 0- 30% this can be a
costly area of substitution.
Substitutes can therefore be related to the physical properties of the hotel or are
representative of the consumer/producer interface (distribution).
Barriers to entry
Barriers to entry vary considerably from company to company and segment to
segment. The main barriers are similar to new entrants, with the addition of specific
strategies directed towards increasing market share. These include raising expected
standards, increasing group size, creating brand loyalty, relocating breaks from resorts
Page 181
to cities, packaging, and introducing "flexible breaks". The type of barrier and the
effectiveness of such barriers is dependant upon how well the organisation is able to
monitor and adapt to the environment. As a result hotel groups use environmental
complexity created via segmentation to raise barriers to entry and thus deter entrants
and substitutes.
(iii) Suppliers
Suppliers take a number of forms, essentially constituting the component parts of any
hotel or CSHB product. As hotels are reliant to varying degrees upon the provision of
food and beverages, accommodation and support services, suppliers to hotels in these
areas will have varying market powers, depending upon areas of hotel supply reliance.
In addition to hotel suppliers, CSHB markets require additional categories of supply
such as finance, entertainment/activities, and communications, e.g. booking methods.
The former combine to constitute the supply of a CSHB segment(s). Each CSHB
segment displays differing market characteristics which combine with the physical
location and provision of "hotel" facilities and will ultimately determine the suppliers
bargaining power in the market segment.
(iv) Buyers
CSHB consumers are "Buyers" which are predominantly domestic/pleasure oriented.
There are however clear elements of international inbound demand, differences in
price sensitivity/elasticity, and basic resource requirements. Such differences occur by
segment and can often vary within segments making the buyer behaviour highly
complex and influencing determinants of bargaining power infinitely.
(v) Competitive Rivalry
The four forces identified (i-iv) act upon the market creating distinct areas of
competitive rivalry. Such rivalry is clearly identified in the type of strategies used by
hotel companies to gain competitive advantage. An understanding of the dynamics of
strategy in the markets provides considerable contributions to knowledge in the field
and therefore forms the basis of the market conduct section (Chapter 8).
Application of Porter's model provides an understanding of the foundations of the
CSHB market structure for hotel groups. The research highlighted two areas require
further clarification to highlight the nature of the market structure of CSHB, (a) the
nature of buyers i.e. a consumer profile, and (b) the means of distribution.
Page 182
7 .3.2 Consumer Profiles
While CSHB markets have been established, (although only recently recognised) as
highly segmented (MEW Research 1994) and complex markets, they do appear to
exhibit a number of common characteristics.
Motives for taking CSHB differ from long holidays (Lohmann 1989), usually being
the result of a trigger e.g. celebration (BTA 1990) or a need to "get away from it all"
(MSI 1991). The CSHB is often booked in the month oftravel (Hunt 1991) and
through a travel agent (Beioley 1991 ). Transport is mainly by car, and length of stay
around 2.1 nights (UKTS 1991).
CSHB takers are predominantly from socio-economic groups ABC1 (BTA 1989,
MEW 1994, Demetriadi 1992), few trips involve children (Middleton 1987) but most
are taken by couples (Bailey 1989) and in the age group 25 to 45 (BTA 1990).
The implications of this demand profile are that as CSHB become more competitive
and widespread, it is likely that customers will become better informed and more
familiar with CSHB. This could result in a more elastic form of demand and therefore
a supply that will attempt to compete more in terms of brand loyalty.
The demand appears to be more varied, taking more frequent breaks to experience
new things or places, aware and responsive to the value for money offered by
companies. While holidays may be classed as an essential commodity, the type and
spend involved with holidays is greatly dependant upon economic and social
environmental factors e.g. unemployment, fashions etc. With such developments
comes the need for strategic information relating to supply and competitive activity,
highlighting the research as an area requiring further investigation to contribute to
industry and educational knowledge and reinforcing the need to establish linkages
between market structure, competitive strategies and performance.
7 .3.3 Methods of Distribution
A key element of the CSHB market structure is the form of distribution. As
distribution forms one of the strategies adopted by suppliers it is examined in more
detail in Chapter 8.
Figure 7.3.3a illustrates in simple terms the various distribution channels a hotel or
hotel group may utilise in reaching its target market or markets.
Page 183
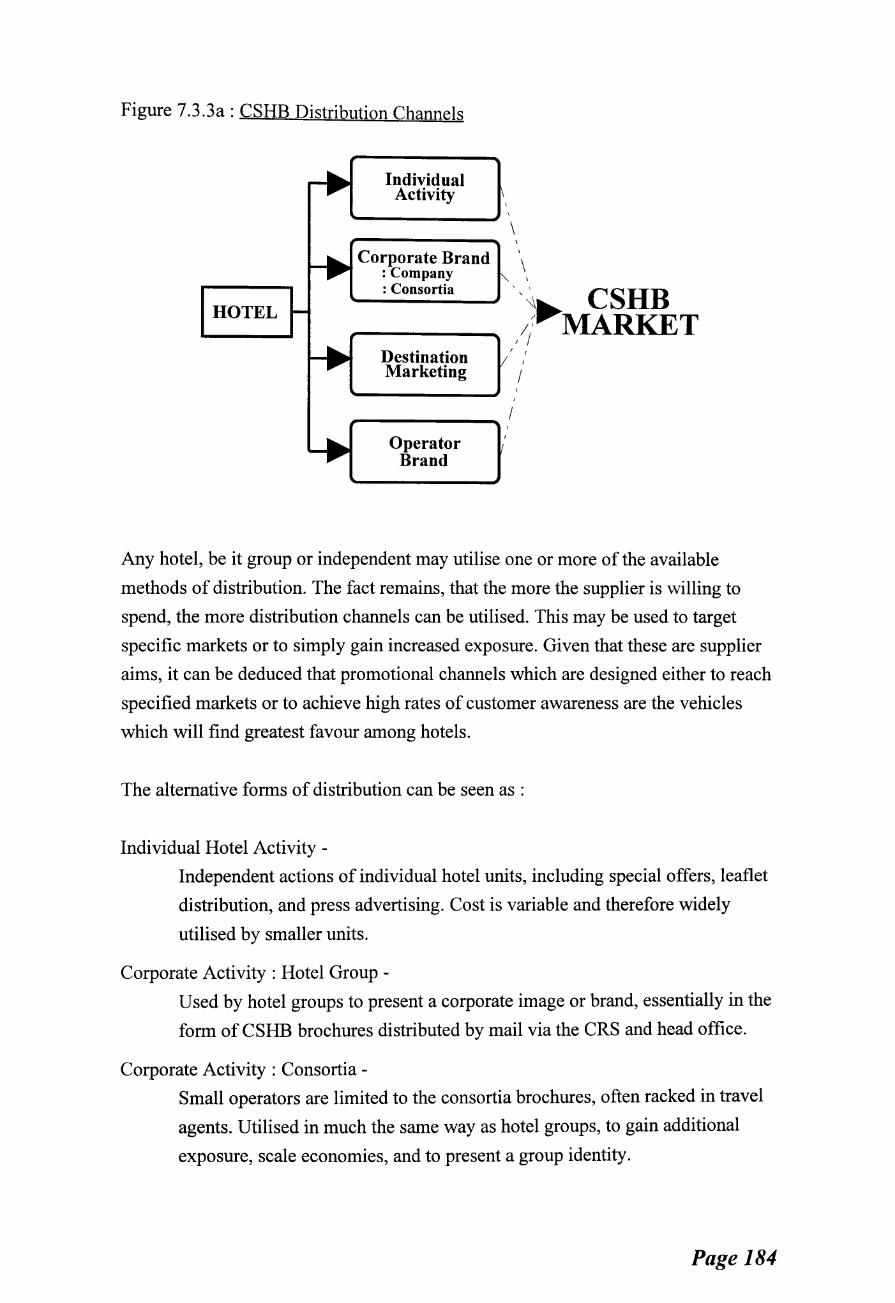
Figure 7.3 .3a : CSHB Distribution Channels
....... Individual Ill"""" Activity
....... Corporate Brand
....... :Company :Consortia
HOTEL -....... Destination Ill"""" Marketing
........ Operator Jill"""" Brand
II I
I
""
l!
\
\ I
',~ ......... CSHB ;;'........-MARKET / I
/ I
I I
I
I!
Any hotel, be it group or independent may utilise one or more of the available
methods of distribution. The fact remains, that the more the supplier is willing to
spend, the more distribution channels can be utilised. This may be used to target
specific markets or to simply gain increased exposure. Given that these are supplier
aims, it can be deduced that promotional channels which are designed either to reach
specified markets or to achieve high rates of customer awareness are the vehicles
which will find greatest favour among hotels.
The alternative forms of distribution can be seen as :
Individual Hotel Activity -
Independent actions of individual hotel units, including special offers, leaflet
distribution, and press advertising. Cost is variable and therefore widely
utilised by smaller units.
Corporate Activity : Hotel Group -
Used by hotel groups to present a corporate image or brand, essentially in the
form of CSHB brochures distributed by mail via the CRS and head office.
Corporate Activity : Consortia -
Small operators are limited to the consortia brochures, often racked in travel
agents. Utilised in much the same way as hotel groups, to gain additional
exposure, scale economies, and to present a group identity.
Page 184
Destination Marketing -
This distribution benefits both independent operators and hotel groups. There
are a number of forms, ranging from area tourist boards, to local authorities.
The aim of the organisation is to market an area, through the use of local
facilities, including hotels, resulting in many direct and indirect benefits.
Operator Brand-
This refers to Short Break Operator brochures used almost entirely by hotel
groups, due to the commission, and associated charges. They have good travel
agent racking, and brand by operator name e.g. Superbreaks.
It would appear that independent suppliers are likely to emphasise individual activity
and destination marketing, as these would be the levels of sophistication and cost that
would be compatible with such operators. Hotel groups are likely to adopt a number
of forms of distribution, placing different emphasise on each and using each for a
different purpose. These issues are further discussed in Chapter 8 where distribution is
introduced as a form of CSHB strategy.
Having established an holistic view of CSHB market structure, the next section
determines the structure of the CSHB represented by the sample of 20 hotel groups,
drawing on data from the hotel groups database and questionnaires phase I and II.
7.4 THE CSHB MARKET : MICRO STRUCTURE (HOTEL SAMPLE)
This section examines (i) the consumer profile of the sample hotel groups,
establishing the breakdown of hotel group business for the sample in terms of general
market segments. This is followed by an examination of (ii) supplier characteristics,
determining hotel group market dominance, hotel group ownership, and operating
details, (iii) seasonality, establishing when short breaks are made available, (iv)
market analysis providing data on room nights sold, market shares, and segments
targeted, (v) revenue and cost analysis, establishing value of CSHB to the groups, and
price sensitivity of markets, (vi) competition, providing detail of the nature of
competition, areas of competitive advantage and barriers to entry, and finally (vii)
organisation issues, providing an indication of the areas of organisational linkages,
and determining the underlying philosophy of groups in the market in terms of work
by Miles and Snow (1979) relating to strategic typologies.
Page 185
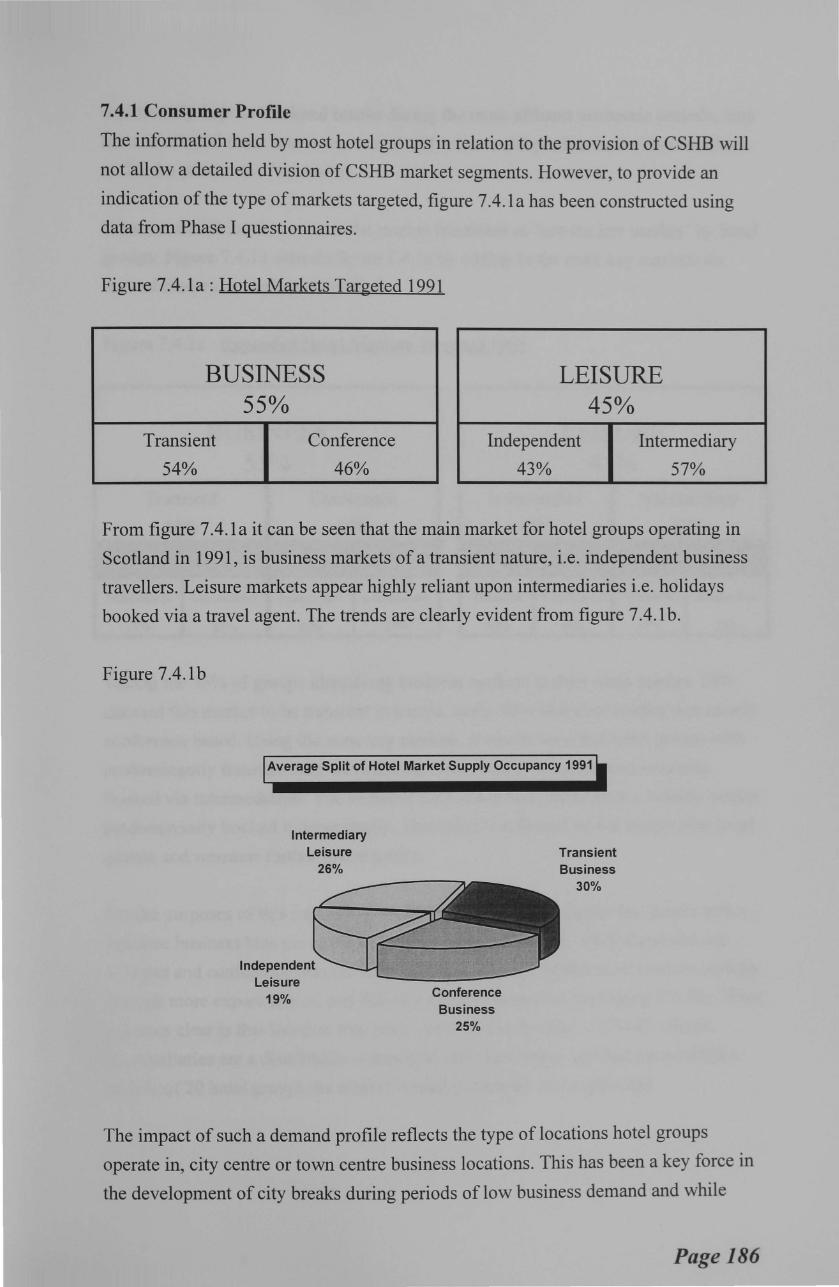
7.4.1 Consumer Profile
The information held by most hotel groups in relation to the provision of CSHB will
not allow a detailed division of CSHB market segments. However, to provide an
indication of the type of markets targeted, figure 7.4 .1 a has been constructed using
data from Phase I questionnaires.
Figure 7.4.1a: Hotel Markets Targeted 1991
BUSINESS LEISURE 55% 45%
Transient Conference Independent Intermediary
54% 46% 43% 57%
From figure 7 .4.1 a it can be seen that the main market for hotel groups operating in
Scotland in 1991, is business markets of a transient nature, i.e. independent business
travellers. Leisure markets appear highly reliant upon intermediaries i.e. holidays
booked via a travel agent. The trends are clearly evident from figure 7.4.1b.
Figure 7 .4.1 b
Average Split of Hotel Market Supply Occupancy 1991
Intermediary Leisure
26%
Leisure 19% Conference
Business 25%
Transient Business
30%
The impact of such a demand profile reflects the type of locations hotel groups
operate in, city centre or town centre business locations. This has been a key force in
the development of city breaks during periods of low business demand and while
Page 186
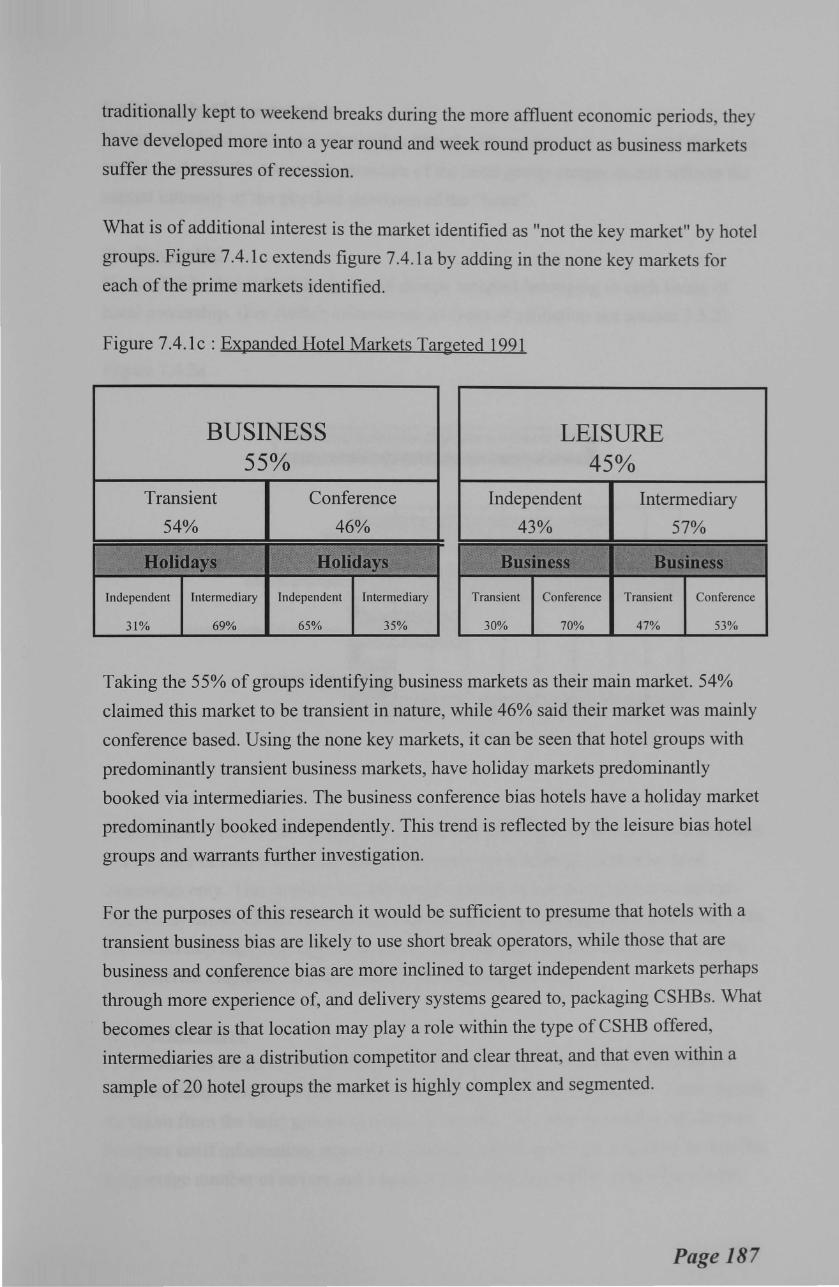
traditionally kept to weekend breaks during the more affluent economic periods, they
have developed more into a year round and week round product as business markets
suffer the pressures of recession.
What is of additional interest is the market identified as "not the key market" by hotel
groups. Figure 7.4.1c extends figure 7.4.la by adding in the none key markets for
each of the prime markets identified.
Figure 7.4.1c: Expanded Hotel Markets Targeted 1991
BUSINESS 55%
Transient
54%
Conference
46%
Independent Intermediary Independent Intermediary
31% 69% 65% 35%
LEISURE 45%
Independent
43%
Intermediary
57o/o
Business
Transient Conference Transient Conference
30% 70% 47% 53%
Taking the 55% of groups identifying business markets as their main market. 54%
claimed this market to be transient in nature, while 46% said their market was mainly
conference based. Using the none key markets, it can be seen that hotel groups with
predominantly transient business markets, have holiday markets predominantly
booked via intermediaries. The business conference bias hotels have a holiday market
predominantly booked independently. This trend is reflected by the leisure bias hotel
groups and warrants further investigation.
For the purposes of this research it would be sufficient to presume that hotels with a
transient business bias are likely to use short break operators, while those that are
business and conference bias are more inclined to target independent markets perhaps
through more experience of, and delivery systems geared to, packaging CSHBs. What
becomes clear is that location may play a role within the type of CSHB offered,
intermediaries are a distribution competitor and clear threat, and that even within a
sample of 20 hotel groups the market is highly complex and segmented.
Page 187
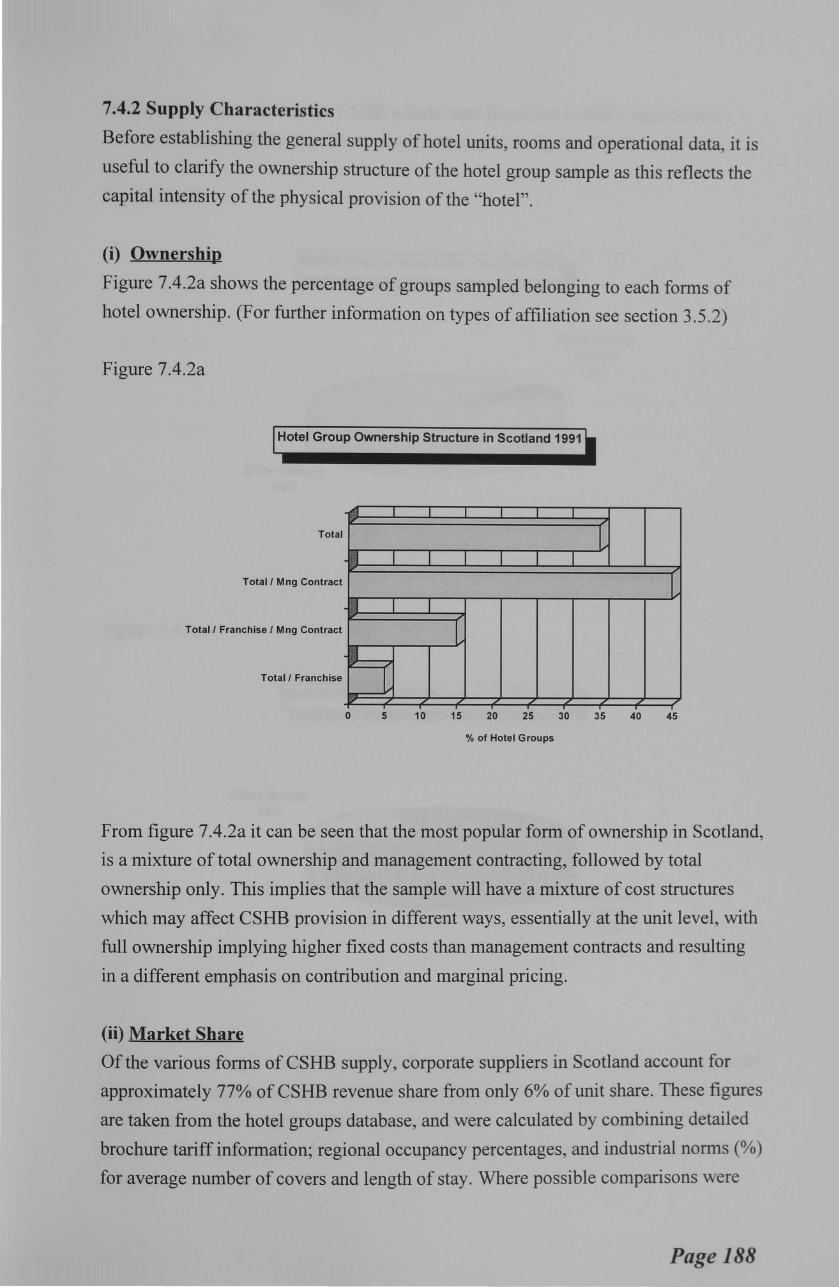
7.4.2 Supply Characteristics
Before establishing the general supply of hotel units, rooms and operational data, it is
useful to clarify the ownership structure of the hotel group sample as this reflects the
capital intensity of the physical provision of the "hotel".
(i) Ownership
Figure 7.4.2a shows the percentage of groups sampled belonging to each forms of
hotel ownership. (For further information on types of affiliation see section 3.5.2)
Figure 7.4.2a
Hotel Group Ownership Structure in Scotland 1991
~ I I
Total l I
Total/ Mng Contract l I
Total/ Franchise I Mng Contract l I
Total/ Franchise 1 0 5 10 15 20 25 30 35 40 45
% of Hotel Groups
From figure 7.4.2a it can be seen that the most popular form of ownership in Scotland,
is a mixture of total ownership and management contracting, followed by total
ownership only. This implies that the sample will have a mixture of cost structures
which may affect CSHB provision in different ways, essentially at the unit level, with
full ownership implying higher fixed costs than management contracts and resulting
in a different emphasis on contribution and marginal pricing.
(ii) Market Share
Ofthe various forms ofCSHB supply, corporate suppliers in Scotland account for
approximately 77% of CSHB revenue share from only 6% of unit share. These figures
are taken from the hotel groups database, and were calculated by combining detailed
brochure tariff information; regional occupancy percentages, and industrial norms (%)
for average number of covers and length of stay. Where possible comparisons were
Page 188
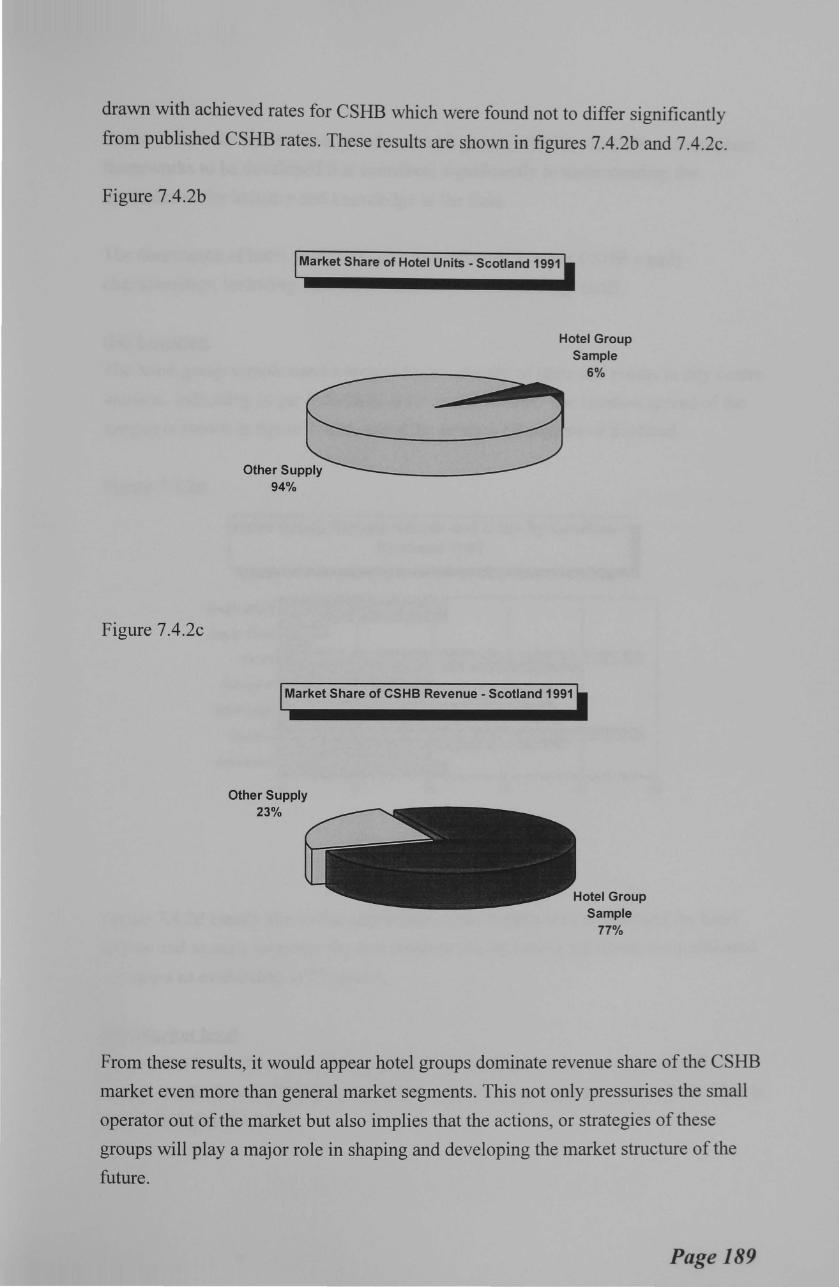
drawn with achieved rates for CSHB which were found not to differ significantly
from published CSHB rates. These results are shown in figures 7.4.2b and 7.4.2c.
Figure 7.4.2b
Figure 7.4.2c
Market Share of Hotel Units- Scotland 1991
94%
Hotel Group Sample
6%
Market Share of CSHB Revenue -Scotland 1991
Other Supply 23%
Hotel Group Sample
77%
From these results, it would appear hotel groups dominate revenue share of the CSHB
market even more than general market segments. This not only pressurises the small
operator out of the market but also implies that the actions, or strategies of these
groups will play a major role in shaping and developing the market structure of the
future .
Page 189
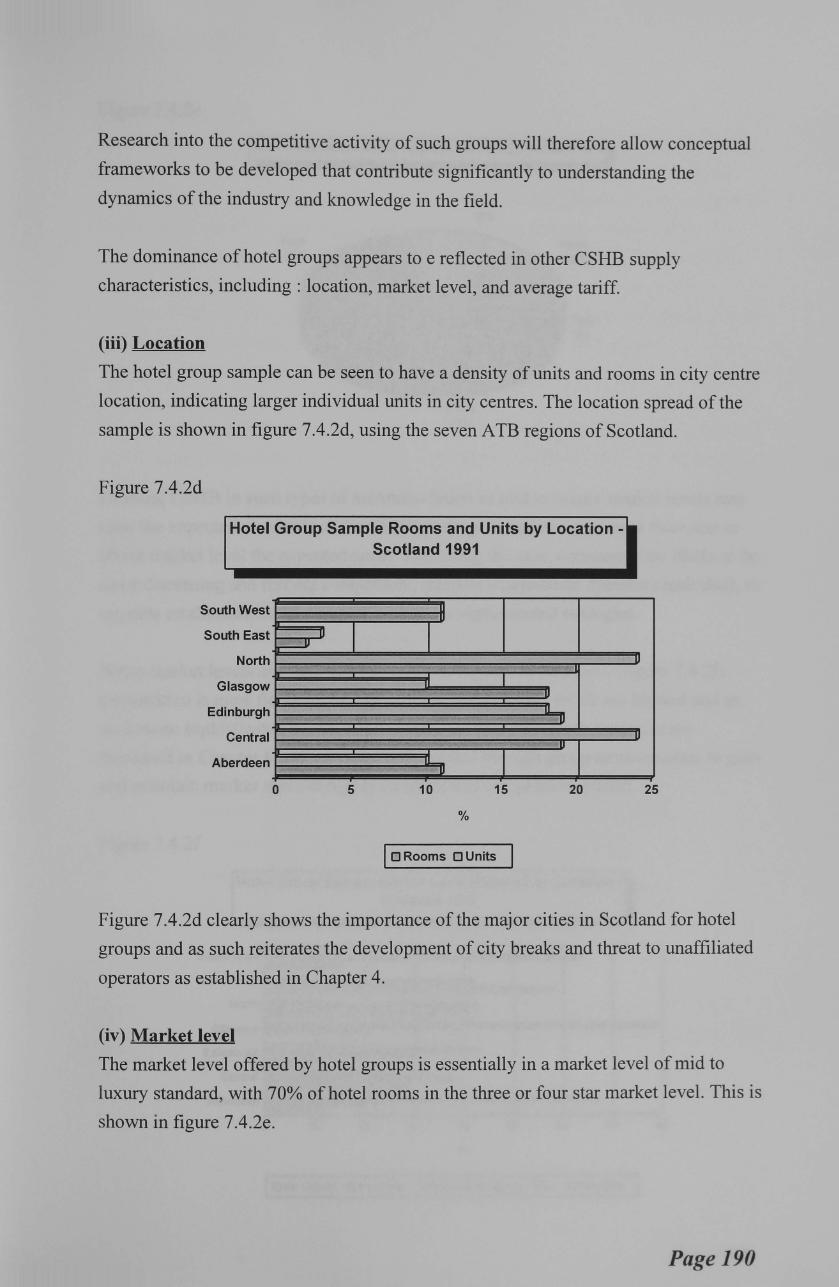
Research into the competitive activity of such groups will therefore allow conceptual
frameworks to be developed that contribute significantly to understanding the
dynamics of the industry and knowledge in the field.
The dominance of hotel groups appears to e reflected in other CSHB supply
characteristics, including : location, market level, and average tariff.
(iii) Location
The hotel group sample can be seen to have a density of units and rooms in city centre
location, indicating larger individual units in city centres. The location spread of the
sample is shown in figure 7.4 .2d, using the seven A TB regions of Scotland.
Figure 7.4.2d
Hotel Group Sample Rooms and Units by Location -Scotland 1991
SouthWest
South East
North
Glasgow
Edinburgh
Central
Aberdeen
r-----1'
0
II I
5
u
I
u
u
u
10 15 20
%
I ORooms OUnits
u
u
25
Figure 7.4.2d clearly shows the importance of the major cities in Scotland for hotel
groups and as such reiterates the development of city breaks and threat to unaffiliated
operators as established in Chapter 4.
(iv) Market level
The market level offered by hotel groups is essentially in a market level of mid to
luxury standard, with 70% of hotel rooms in the three or four star market level. This is
shown in figure 7.4.2e.
Page 190
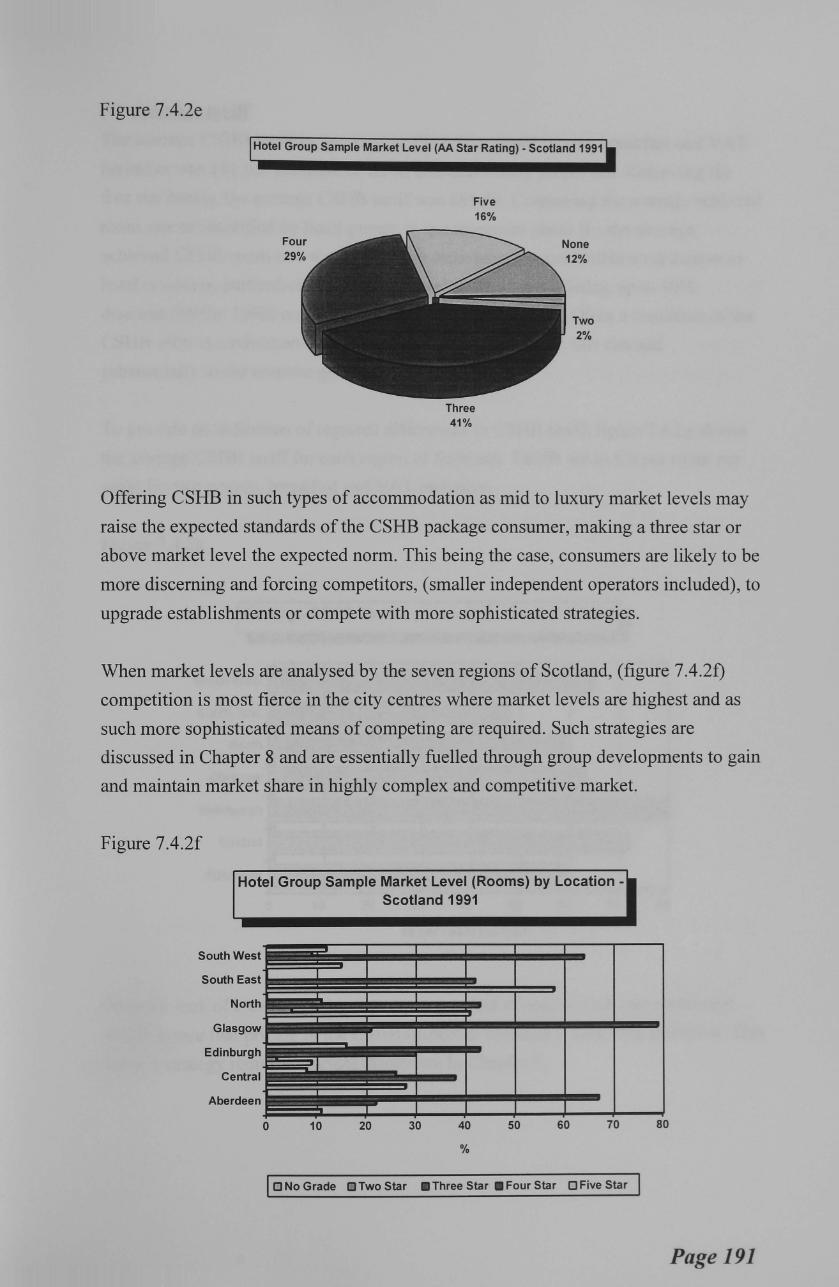
Figure 7 .4.2e
Hotel Group Sample Market Level (AA Star Rating)- Scotland 1991
Five 16%
Three 41%
Two 2%
Offering CSHB in such types of accommodation as mid to luxury market levels may
raise the expected standards of the CSHB package consumer, making a three star or
above market level the expected norm. This being the case, consumers are likely to be
more discerning and forcing competitors, (smaller independent operators included), to
upgrade establishments or compete with more sophisticated strategies.
When market levels are analysed by the seven regions of Scotland, (figure 7.4.2±)
competition is most fierce in the city centres where market levels are highest and as
such more sophisticated means of competing are required. Such strategies are
discussed in Chapter 8 and are essentially fuelled through group developments to gain
and maintain market share in highly complex and competitive market.
Figure 7 .4.2f
Hotel Group Sample Market Level (Rooms) by Location -Scotland 1991
South West
South East
North
Glasgow
Edinburgh
Central
Aberdeen
0
I
~I
10 20 30 40 50 60 70
%
0 No Grade 0 Two Star • Three Star 8 Four Star 0 Five Star
80
Page 191
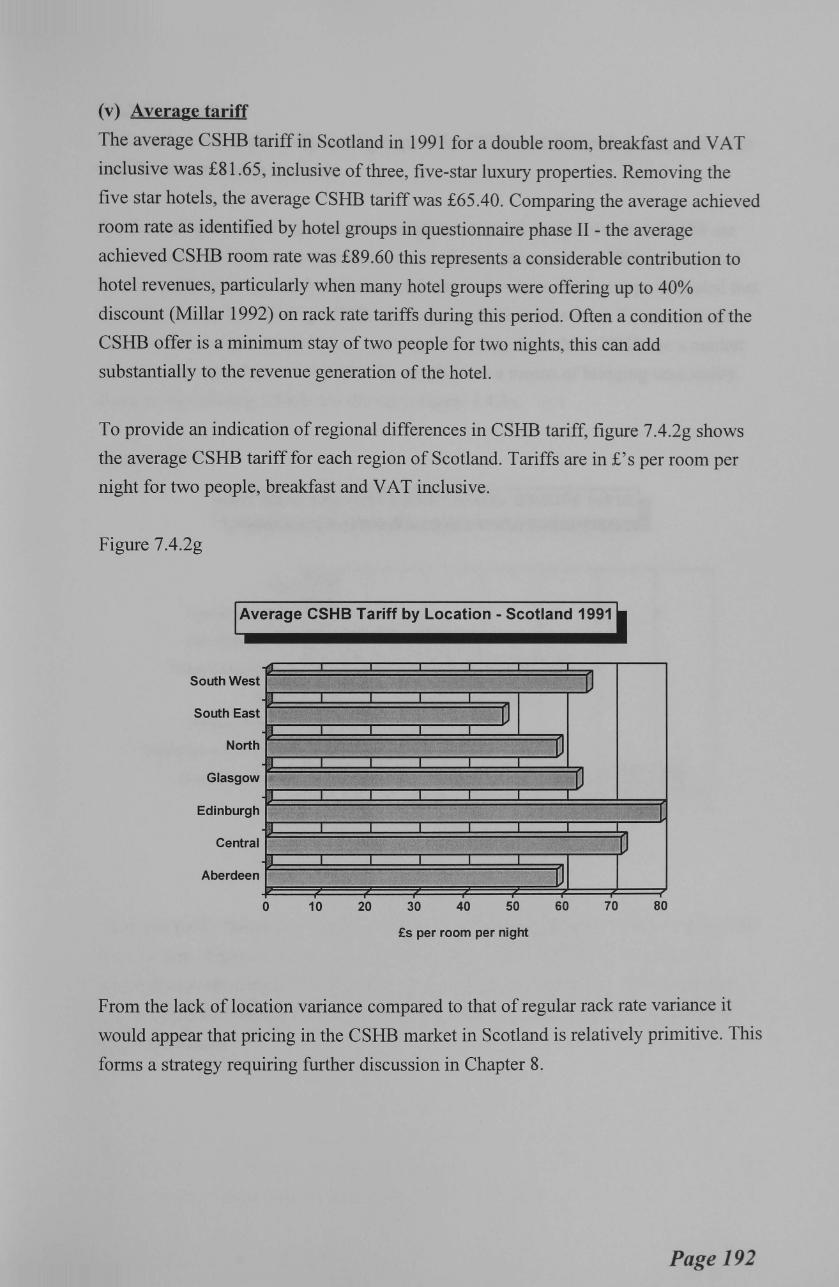
(v) Average tariff
The average CSHB tariff in Scotland in 1991 for a double room, breakfast and VAT
inclusive was £81.65, inclusive of three, five-star luxury properties. Removing the
five star hotels, the average CSHB tariff was £65.40. Comparing the average achieved
room rate as identified by hotel groups in questionnaire phase II - the average
achieved CSHB room rate was £89.60 this represents a considerable contribution to
hotel revenues, particularly when many hotel groups were offering up to 40%
discount (Millar 1992) on rack rate tariffs during this period. Often a condition of the
CSHB offer is a minimum stay of two people for two nights, this can add
substantially to the revenue generation of the hotel.
To provide an indication of regional differences in CSHB tariff, figure 7.4.2g shows
the average CSHB tariff for each region of Scotland. Tariffs are in £'s per room per
night for two people, breakfast and VAT inclusive.
Figure 7.4.2g
Average CSHB Tariff by Location- Scotland 1991
SouthWest u llll
South East IJ l!iJ
North fJ 1!11
Glasgow u llll
Edinburgh l 1!11
- u Central
Aberdeen Ul 0 10 20 30 40 50 60 70 80
£s per room per night
From the lack of location variance compared to that of regular rack rate variance it
would appear that pricing in the CSHB market in Scotland is relatively primitive. This
forms a strategy requiring further discussion in Chapter 8.
Page 192
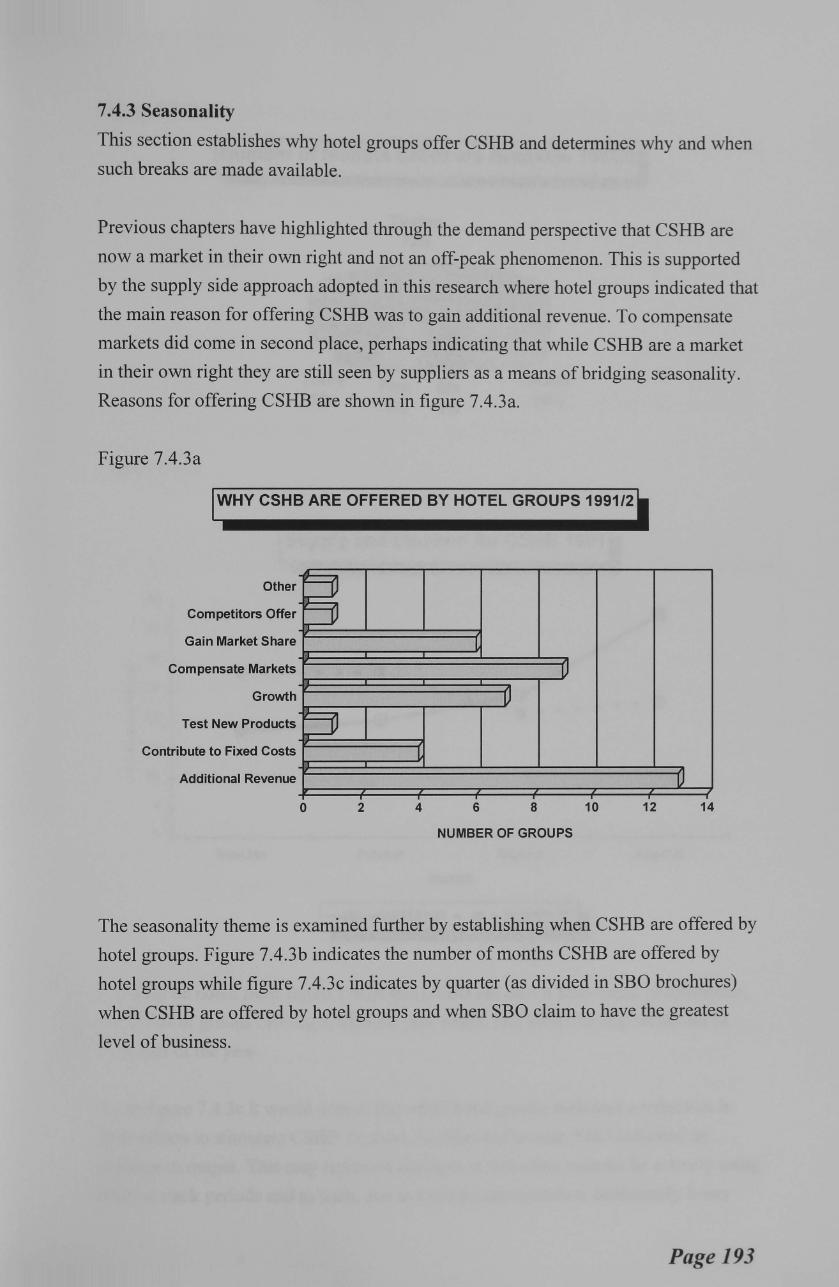
7 .4.3 Seasonality
This section establishes why hotel groups offer CSHB and determines why and when
such breaks are made available.
Previous chapters have highlighted through the demand perspective that CSHB are
now a market in their own right and not an off-peak phenomenon. This is supported
by the supply side approach adopted in this research where hotel groups indicated that
the main reason for offering CSHB was to gain additional revenue. To compensate
markets did come in second place, perhaps indicating that while CSHB are a market
in their own right they are still seen by suppliers as a means of bridging seasonality.
Reasons for offering CSHB are shown in figure 7.4.3a.
Figure 7.4.3a
WHY CSHB ARE OFFERED BY HOTEL GROUPS 1991/2
Other
Competitors Offer
Gain Market Share
Compensate Markets
Growth
Test New Products
Contribute to Fixed Costs
Additional Revenue
A:
~ c=Jl
c=Jl
0 2
l
u lJ
L
4 6 8 10
NUMBER OF GROUPS
1J 12 14
The seasonality theme is examined further by establishing when CSHB are offered by
hotel groups. Figure 7.4.3b indicates the number of months CSHB are offered by
hotel groups while figure 7.4.3c indicates by quarter (as divided in SBO brochures)
when CSHB are offered by hotel groups and when SBO claim to have the greatest
level of business.
Page 193
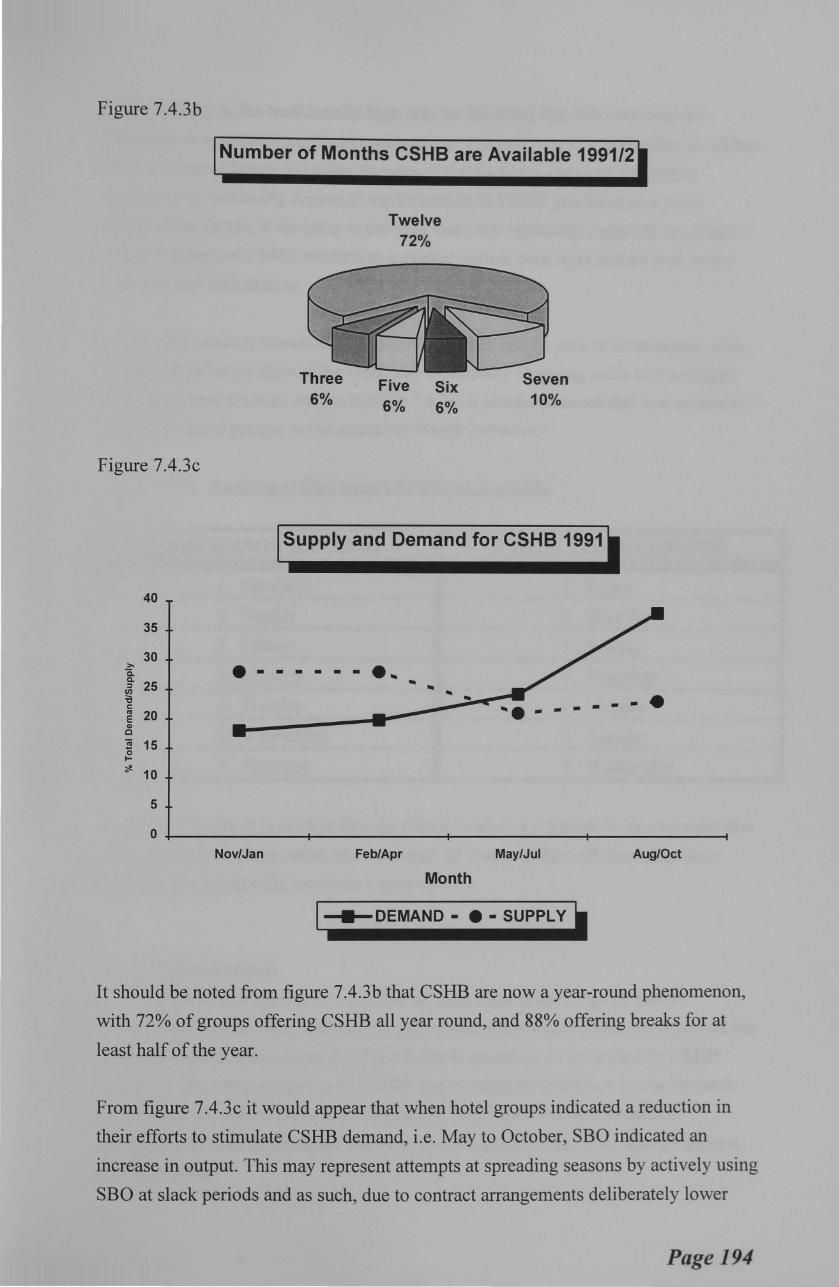
Figure 7 .4.3b
Figure 7.4.3c
40
35
30 >-c. c.
25 ~
!e "'C c:
"' 20 E Q)
c ;;; 15 0 1-;;e.
10
5
0
Number of Months CSHB are Available 1991/2
Three 6%
Twelve 72%
Five Six 6% 6%
Seven 10%
I Supply and Demand for CSHB 1991~
e- - - - - - e ... .. ... ..... -----·
Nov/Jan Feb/Apr May/Jul Aug/Oct
Month
• DEMAND - • - SUPPLy I It should be noted from figure 7.4.3b that CSHB are now a year-round phenomenon,
with 72% of groups offering CSHB all year round, and 88% offering breaks for at
least half of the year.
From figure 7.4.3c it would appear that when hotel groups indicated a reduction in
their efforts to stimulate CSHB demand, i.e. May to October, SBO indicated an
increase in output. This may represent attempts at spreading seasons by actively using
SBO at slack periods and as such, due to contract arrangements deliberately lower
Page 194
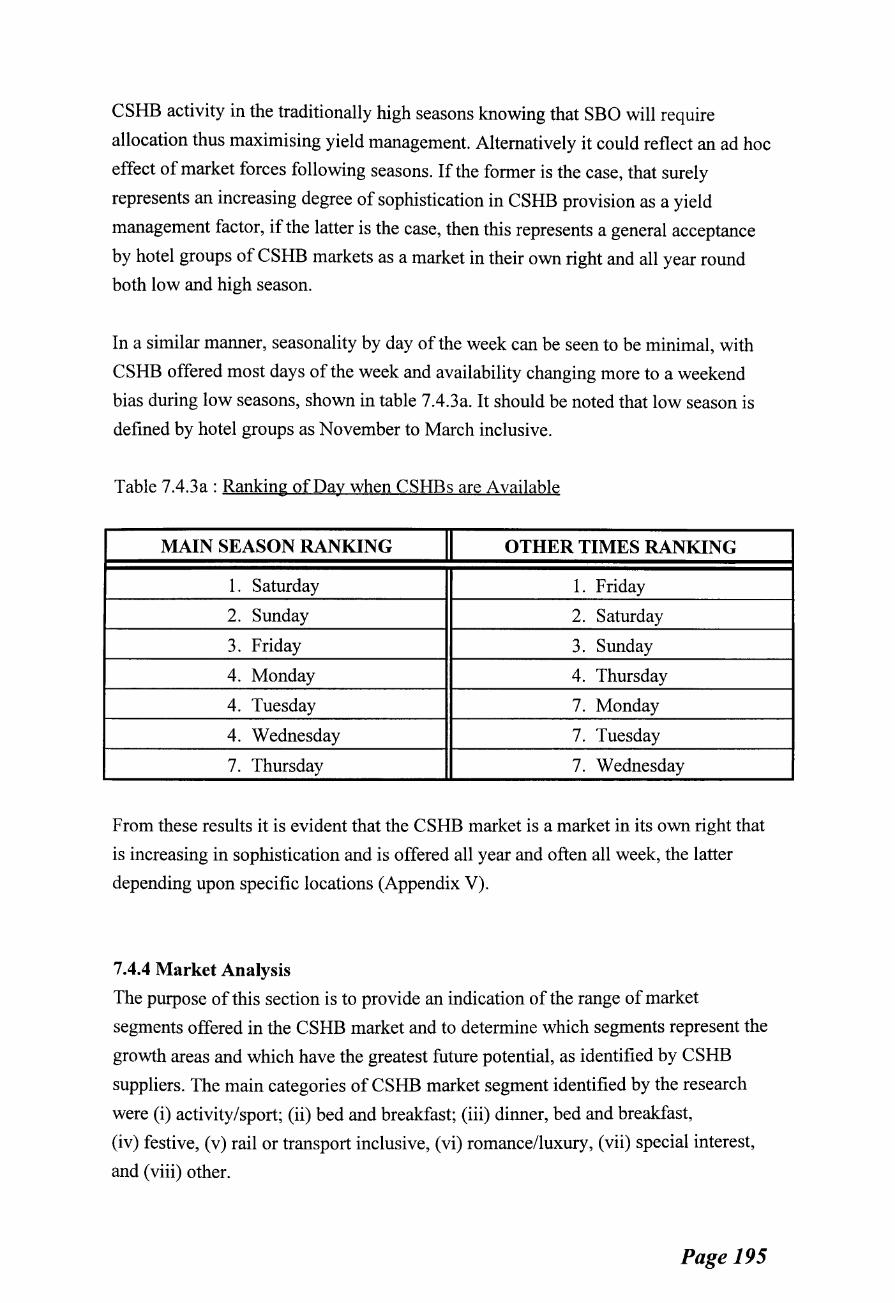
CSHB activity in the traditionally high seasons knowing that SBO will require
allocation thus maximising yield management. Alternatively it could reflect an ad hoc
effect of market forces following seasons. If the former is the case, that surely
represents an increasing degree of sophistication in CSHB provision as a yield
management factor, if the latter is the case, then this represents a general acceptance
by hotel groups of CSHB markets as a market in their own right and all year round
both low and high season.
In a similar manner, seasonality by day of the week can be seen to be minimal, with
CSHB offered most days of the week and availability changing more to a weekend
bias during low seasons, shown in table 7.4.3a. It should be noted that low season is
defined by hotel groups as November to March inclusive.
Table 7.4.3a: Ranking of Day when CSHBs are Available
MAIN SEASON RANKING OTHER TIMES RANKING
1. Saturday 1. Friday
2. Sunday 2. Saturday
3. Friday 3. Sunday
4. Monday 4. Thursday
4. Tuesday 7. Monday
4. Wednesday 7. Tuesday
7. Thursday 7. Wednesday
From these results it is evident that the CSHB market is a market in its own right that
is increasing in sophistication and is offered all year and often all week, the latter
depending upon specific locations (Appendix V).
7 .4.4 Market Analysis
The purpose of this section is to provide an indication of the range of market
segments offered in the CSHB market and to determine which segments represent the
growth areas and which have the greatest future potential, as identified by CSHB
suppliers. The main categories of CSHB market segment identified by the research
were (i) activity/sport; (ii) bed and breakfast; (iii) dinner, bed and breakfast,
(iv) festive, (v) rail or transport inclusive, (vi) romance/luxury, (vii) special interest,
and (viii) other.
Page 195
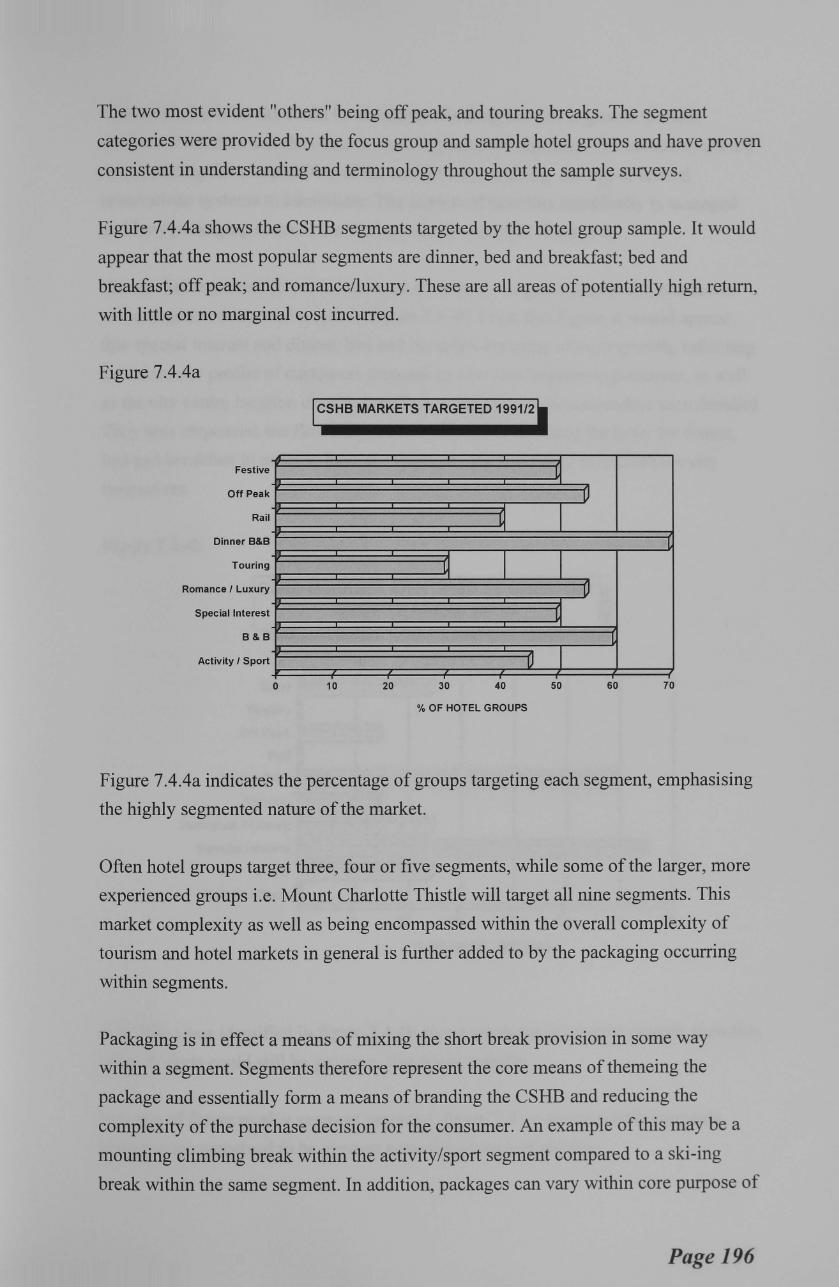
The two most evident "others" being off peak, and touring breaks. The segment
categories were provided by the focus group and sample hotel groups and have proven
consistent in understanding and terminology throughout the sample surveys.
Figure 7.4.4a shows the CSHB segments targeted by the hotel group sample. It would
appear that the most popular segments are dinner, bed and breakfast; bed and
breakfast; off peak; and romance/luxury. These are all areas of potentially high return,
with little or no marginal cost incurred.
Figure 7 .4.4a
ICSHB MARKETS TARGETED 1991/21
Festive lJ Off Peak TJ
Rai I 1J T Dinner 8&8 1
Touring l.J T T Romance I Luxury 1J
Special Interest 1J 8&8 L
Activity I Sport 1J I 0 10 20 30 40 50 60 70
% OF HOTEL GROUPS
Figure 7.4.4a indicates the percentage of groups targeting each segment, emphasising
the highly segmented nature of the market.
Often hotel groups target three, four or five segments, while some of the larger, more
experienced groups i.e. Mount Charlotte Thistle will target all nine segments. This
market complexity as well as being encompassed within the overall complexity of
tourism and hotel markets in general is further added to by the packaging occurring
within segments.
Packaging is in effect a means of mixing the short break provision in some way
within a segment. Segments therefore represent the core means of themeing the
package and essentially form a means of branding the CSHB and reducing the
complexity of the purchase decision for the consumer. An example of this may be a
mounting climbing break within the activity/sport segment compared to a ski-ing
break within the same segment. In addition, packages can vary within core purpose of
Page 196
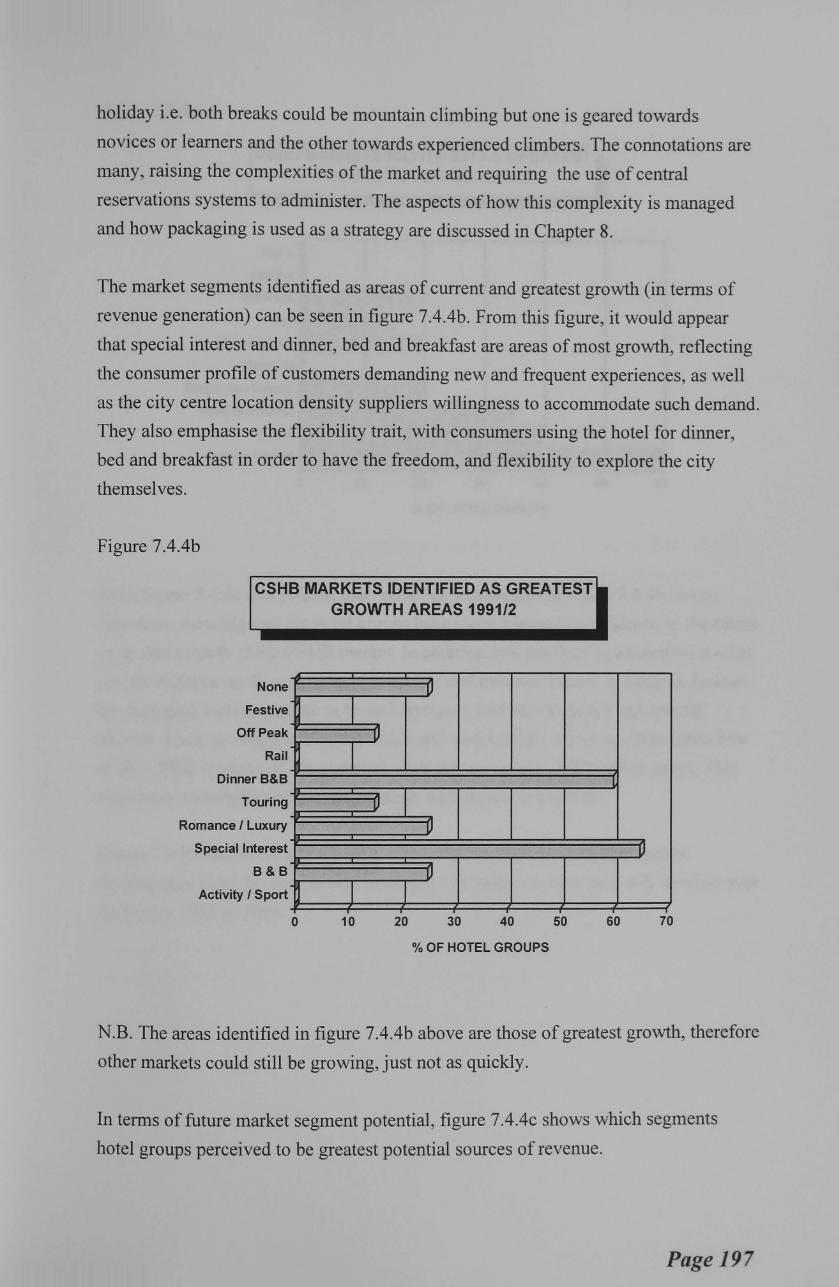
holiday i.e. both breaks could be mountain climbing but one is geared towards
novices or learners and the other towards experienced climbers. The connotations are
many, raising the complexities of the market and requiring the use of central
reservations systems to administer. The aspects of how this complexity is managed
and how packaging is used as a strategy are discussed in Chapter 8.
The market segments identified as areas of current and greatest growth (in terms of
revenue generation) can be seen in figure 7.4.4b. From this figure, it would appear
that special interest and dinner, bed and breakfast are areas of most growth, reflecting
the consumer profile of customers demanding new and frequent experiences, as well
as the city centre location density suppliers willingness to accommodate such demand.
They also emphasise the flexibility trait, with consumers using the hotel for dinner,
bed and breakfast in order to have the freedom, and flexibility to explore the city
themselves.
Figure 7.4.4b
CSHB MARKETS IDENTIFIED AS GREATEST GROWTH AREAS 1991/2
None
Festive
Off Peak
Rail
Dinner B&B
Touring
Romance I Luxury
Special Interest
B&B
Activity I Sport
~
~
[ 0
I I
1 10
lJ
1J
lJ
lJ
lJ
20 30 40 50
% OF HOTEL GROUPS
L
lJ
60 70
N.B. The areas identified in figure 7.4.4b above are those of greatest growth, therefore
other markets could still be growing, just not as quickly.
In terms of future market segment potential, figure 7 .4.4c shows which segments
hotel groups perceived to be greatest potential sources of revenue.
Page 197
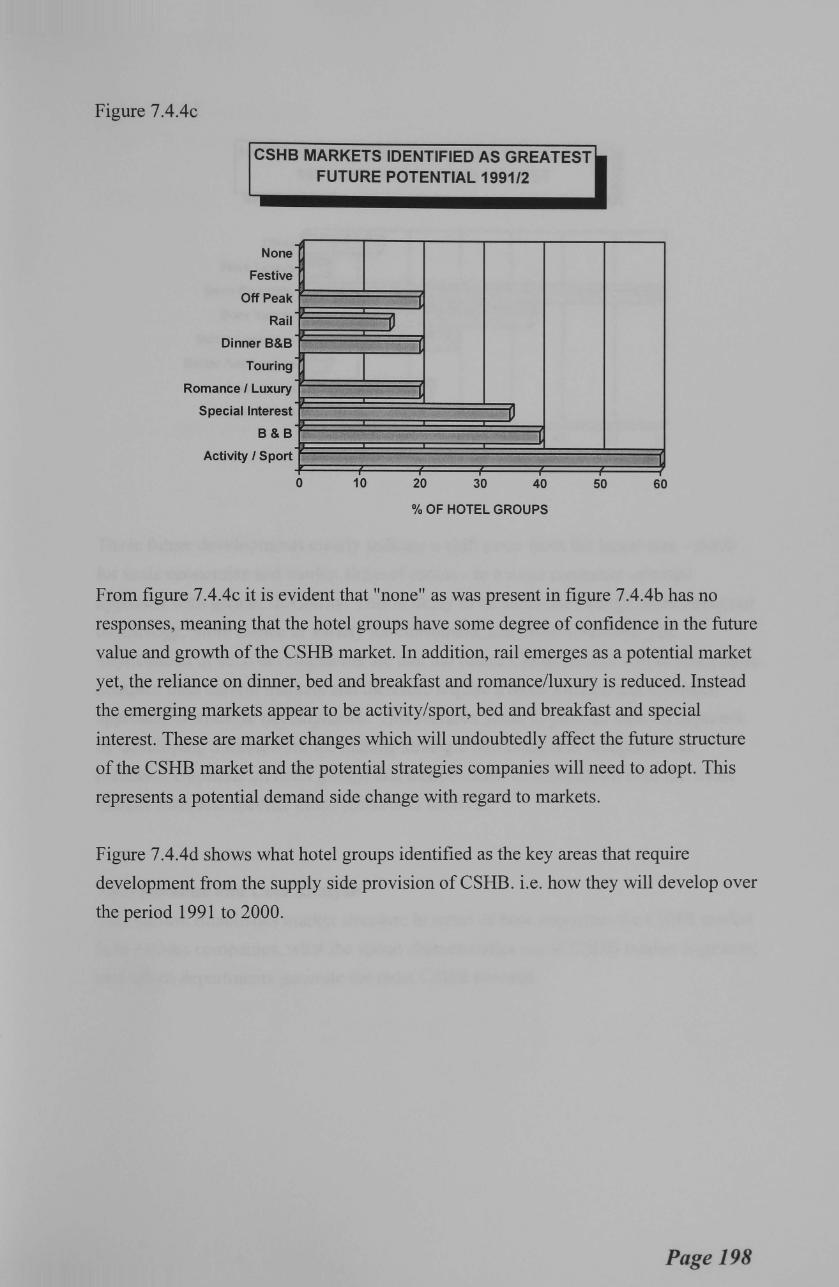
Figure 7.4.4c
CSHB MARKETS IDENTIFIED AS GREATEST FUTURE POTENTIAL 1991/2
None
Festive
Off Peak
Rail
Dinner 8&8
Touring
Romance I Luxury
Special Interest
8&8
Activity I Sport
0
u
10
L
L
L
u L
20 30 40
%OF HOTEL GROUPS
l
50 60
From figure 7.4.4c it is evident that "none" as was present in figure 7.4.4b has no
responses, meaning that the hotel groups have some degree of confidence in the future
value and growth of the CSHB market. In addition, rail emerges as a potential market
yet, the reliance on dinner, bed and breakfast and romance/luxury is reduced. Instead
the emerging markets appear to be activity/sport, bed and breakfast and special
interest. These are market changes which will undoubtedly affect the future structure
of the CSHB market and the potential strategies companies will need to adopt. This
represents a potential demand side change with regard to markets.
Figure 7.4.4d shows what hotel groups identified as the key areas that require
development from the supply side provision of CSHB. i.e. how they will develop over
the period 1991 to 2000.
Page 198

Figure 7.4.4d
HOTEL GROUP IDENTIFIED NEED FOR CHANGE 1991-2000 IN THE CSHB MARKET
Other
More Luxury
More Flexibility
More Variety
Better Locations
Better Ammenities
Lower Cost
Larger Hotels
E=i'l
E=i'l ~ I
0 10
lJ
20
u l
u
30 40 50 60
%OF HOTEL GROUPS
L
70
These future developments clearly indicate a shift away from the larger size - strive
for scale economies and market share of rooms - to a more consumer oriented
approach with greater flexibility. This is likely to be achieved through more advanced
technology, more choice or variety for consumers, and better locations. The
implications of such developments are that the future CSHB market will be even more
complex than current markets and therefore require a more focused and informed
approach to strategic developments. This research seeks to provide such an approach
by developing a framework for making strategic decisions, that recognises the
increased emphasis on hotel groups and independents to compete on both the wider
market base, and specific niche markets to survive.
7.4.5 Revenue and Cost Analysis
This section establishes market structure in terms of how important the CSHB market
is to various companies, what the spend characteristics are of CSHB market segments;
and which departments generate the most CSHB revenue.
Page 199
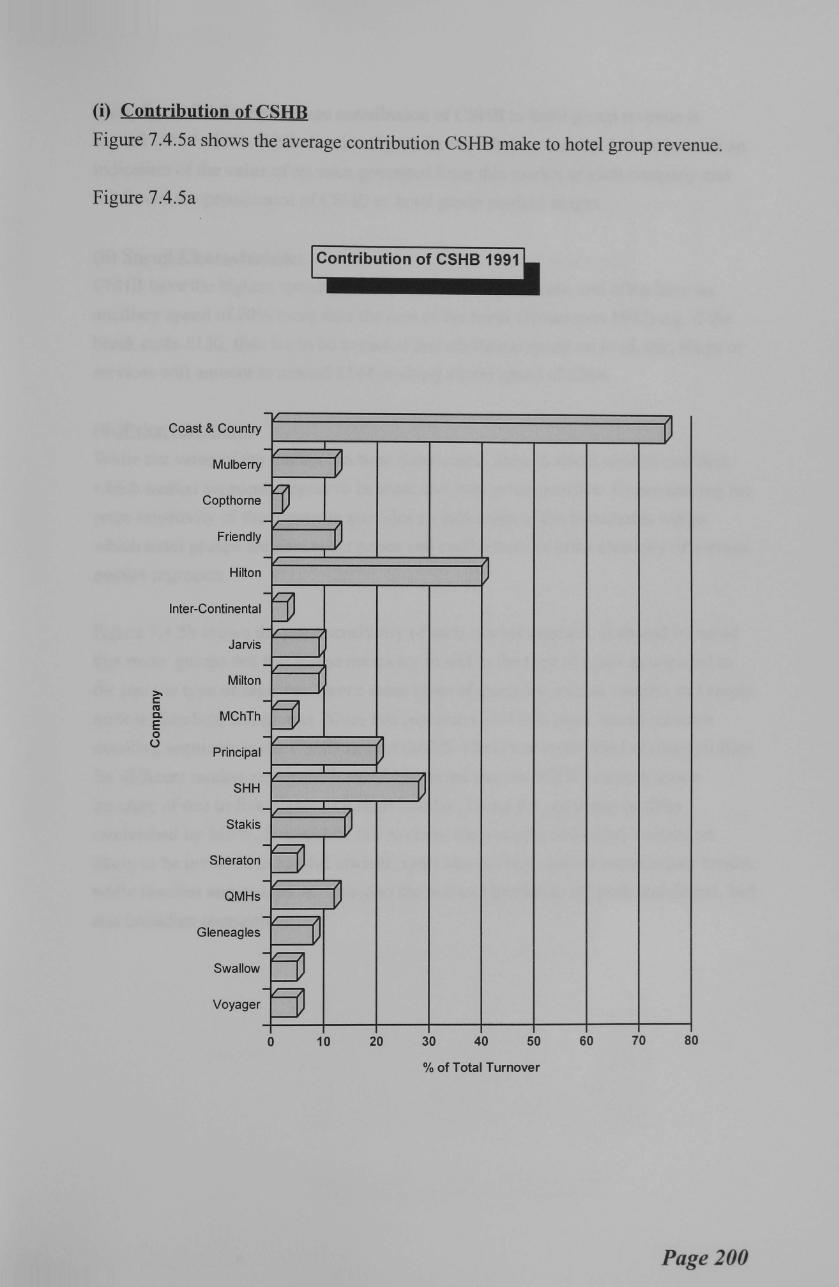
(i) Contribution of CSHB
Figure 7.4.5a shows the average contribution CSHB make to hotel group revenue.
Figure 7.4.5a
>. c: IU c. E 0 ()
Coast & Country
Mulberry
Copthorne
Friendly
Hilton
Inter-Continental
Jarvis
Milton
MChTh
Principa I
SHH
Stakis
Sheraton
QMHs
Gleneagles
Swallow
Voyage r
-
-
-tv -
-
-[0 -
-
-5)
-
-
-
-[j -
-
-[j -[j 0
~ 0
-o 0
u ~
-o
-o l
10 20 30 40 50 60 70 80
%of Total Turnover
Page 200
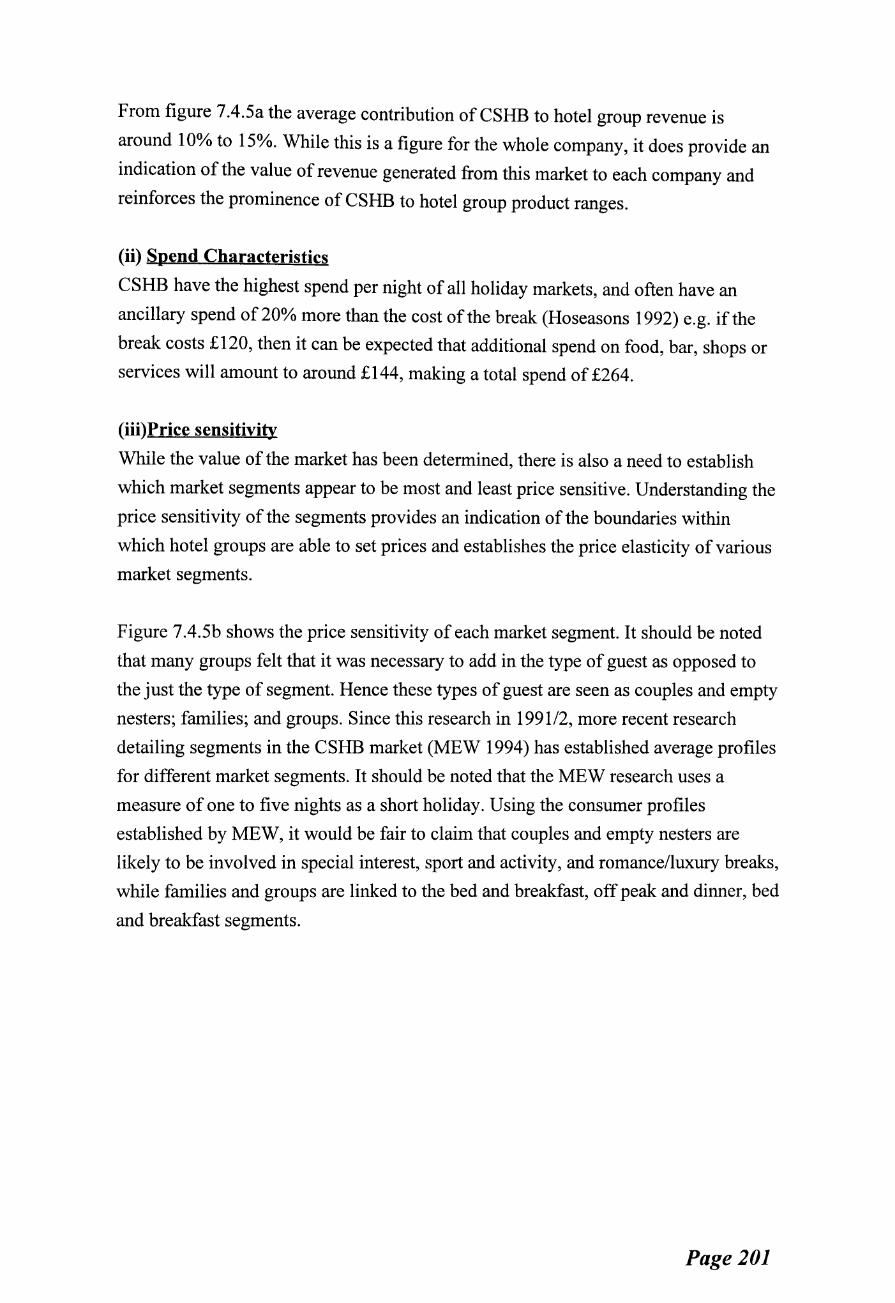
From figure 7.4.5a the average contribution of CSHB to hotel group revenue is
around 10% to 15%. While this is a figure for the whole company, it does provide an
indication of the value of revenue generated from this market to each company and
reinforces the prominence of CSHB to hotel group product ranges.
(ii) Spend Characteristics
CSHB have the highest spend per night of all holiday markets, and often have an
ancillary spend of20% more than the cost ofthe break (Hoseasons 1992) e.g. if the
break costs £120, then it can be expected that additional spend on food, bar, shops or
services will amount to around £144, making a total spend of £264.
(iii)Price sensitivity
While the value of the market has been determined, there is also a need to establish
which market segments appear to be most and least price sensitive. Understanding the
price sensitivity of the segments provides an indication of the boundaries within
which hotel groups are able to set prices and establishes the price elasticity of various
market segments.
Figure 7.4.5b shows the price sensitivity of each market segment. It should be noted
that many groups felt that it was necessary to add in the type of guest as opposed to
the just the type of segment. Hence these types of guest are seen as couples and empty
nesters; families; and groups. Since this research in 1991/2, more recent research
detailing segments in the CSHB market (MEW 1994) has established average profiles
for different market segments. It should be noted that the MEW research uses a
measure of one to five nights as a short holiday. Using the consumer profiles
established by MEW, it would be fair to claim that couples and empty nesters are
likely to be involved in special interest, sport and activity, and romance/luxury breaks,
while families and groups are linked to the bed and breakfast, off peak and dinner, bed
and breakfast segments.
Page 201
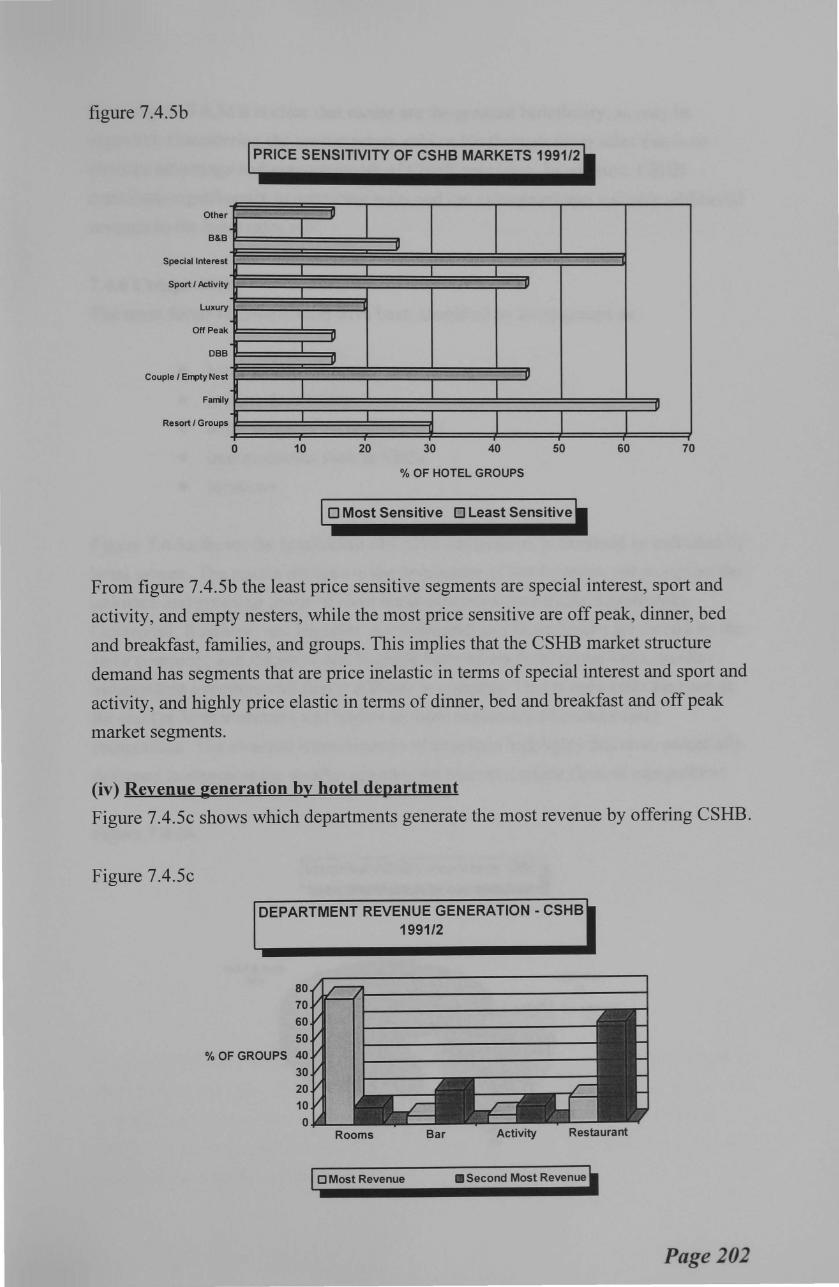
figure 7.4.5b
PRICE SENSITIVITY OF CSHB MARKETS 1991/2
Other u
B&B I Special Interest
I I Sport I Activity
M I Luxury
Off Peak 11
DBB n I
I II
Couple I Empty Nest
Family
Resort I Groups I I
0 10 20 30 40 50 60 70
% OF HOTEL GROUPS
0 Most Sensitive 0 Least Sensitive
From figure 7.4.5b the least price sensitive segments are special interest, sport and
activity, and empty nesters, while the most price sensitive are off peak, dinner, bed
and breakfast, families, and groups. This implies that the CSHB market structure
demand has segments that are price inelastic in terms of special interest and sport and
activity, and highly price elastic in terms of dinner, bed and breakfast and off peak
market segments.
(iv) Revenue generation by hotel department
Figure 7.4.5c shows which departments generate the most revenue by offering CSHB.
Figure 7.4.5c
DEPARTMENT REVENUE GENERATION- CSHB 1991/2
80 70
60
50 % OF GROUPS 40
30 20 10
~-___,
O.jliliL-Rooms
I 0 Most Revenue
Bar Activity Restaurant
• Second Most Revenue~
Page 202
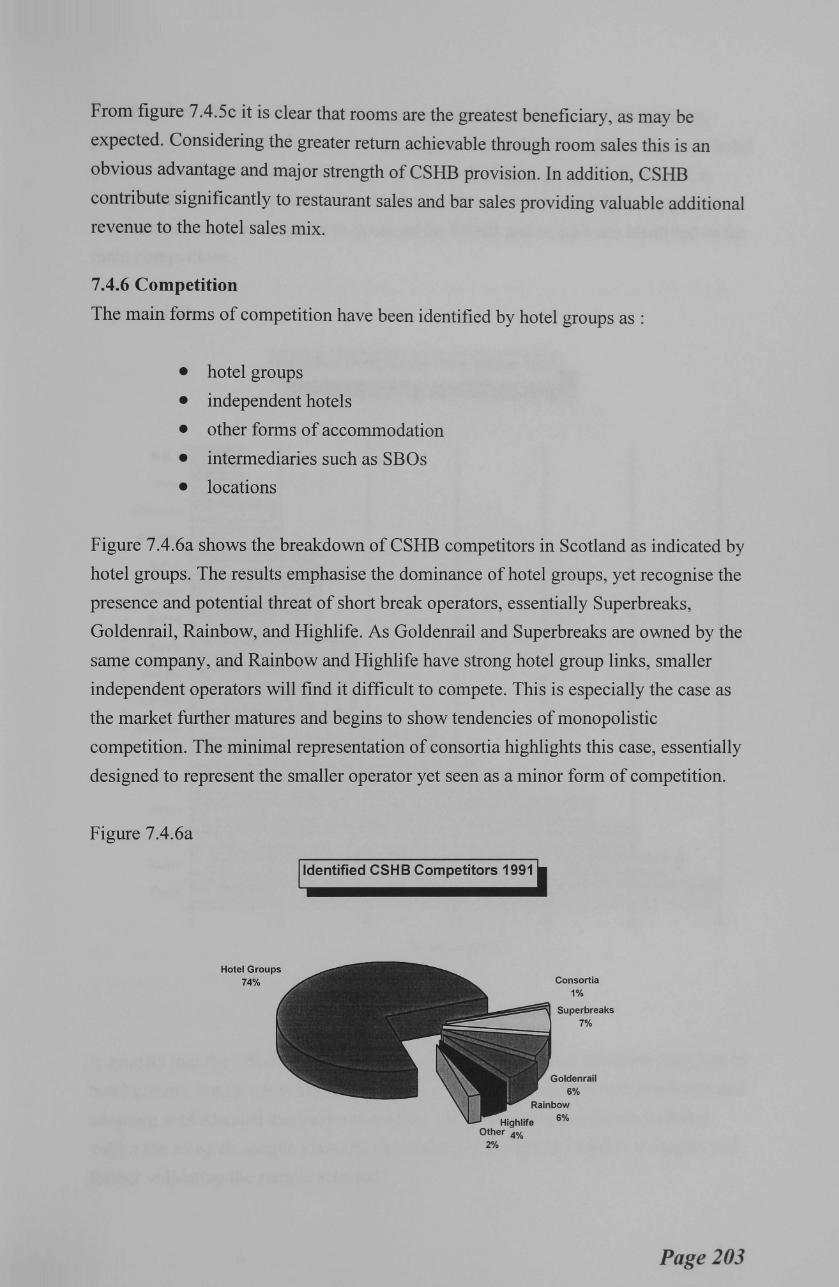
From figure 7.4.5c it is clear that rooms are the greatest beneficiary, as may be
expected. Considering the greater return achievable through room sales this is an
obvious advantage and major strength of CSHB provision. In addition, CSHB
contribute significantly to restaurant sales and bar sales providing valuable additional
revenue to the hotel sales mix.
7.4.6 Competition
The main forms of competition have been identified by hotel groups as :
• hotel groups
• independent hotels
• other forms of accommodation
• intermediaries such as SBOs
• locations
Figure 7.4.6a shows the breakdown of CSHB competitors in Scotland as indicated by
hotel groups. The results emphasise the dominance of hotel groups, yet recognise the
presence and potential threat of short break operators, essentially Superbreaks,
Goldenrail, Rainbow, and Highlife. As Goldenrail and Superbreaks are owned by the
same company, and Rainbow and Highlife have strong hotel group links, smaller
independent operators will find it difficult to compete. This is especially the case as
the market further matures and begins to show tendencies of monopolistic
competition. The minimal representation of consortia highlights this case, essentially
designed to represent the smaller operator yet seen as a minor form of competition.
Figure 7.4.6a
Hotel Groups 74%
Identified CSHB Competitors 1991
Consortia 1%
7%
6%
Page 203
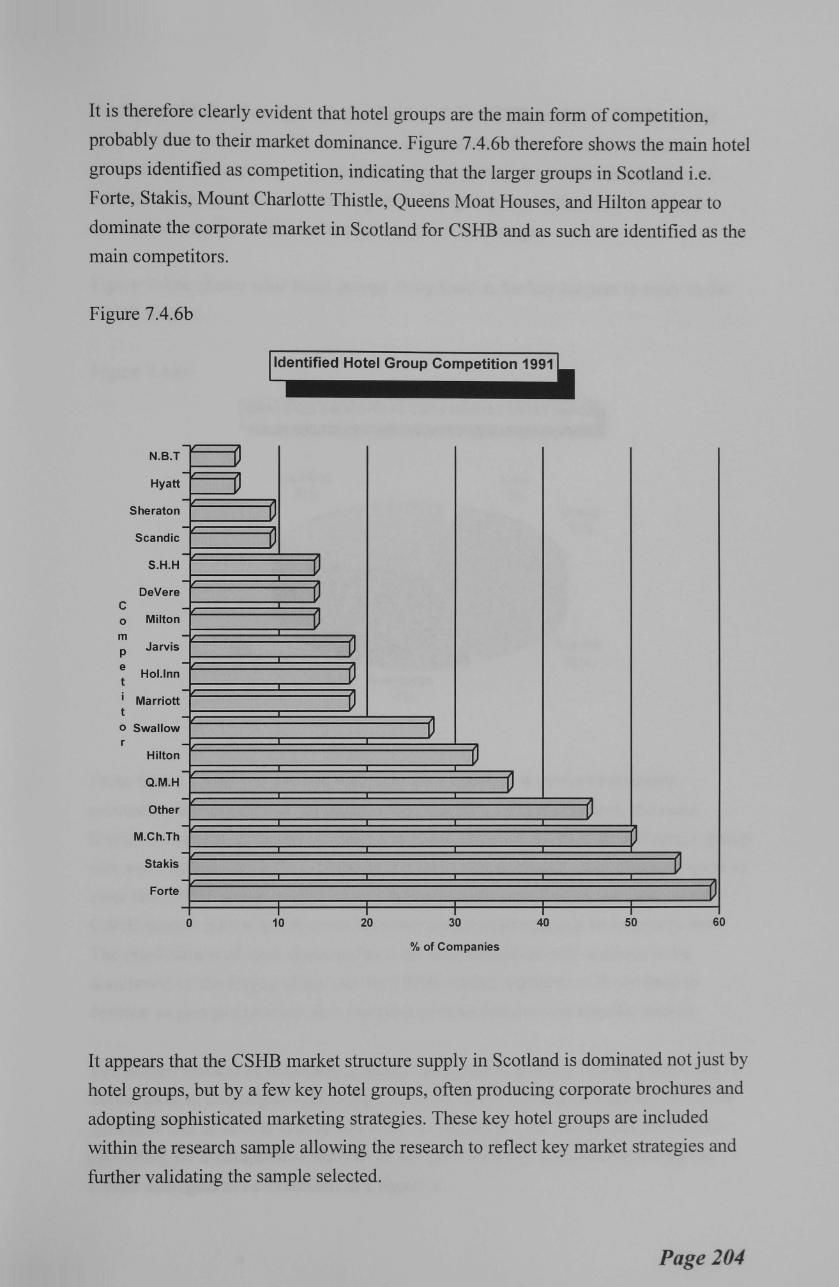
It is therefore clearly evident that hotel groups are the main form of competition,
probably due to their market dominance. Figure 7.4.6b therefore shows the main hotel
groups identified as competition, indicating that the larger groups in Scotland i.e.
Forte, Stakis, Mount Charlotte Thistle, Queens Moat Houses, and Hilton appear to
dominate the corporate market in Scotland for CSHB and as such are identified as the
main competitors.
Figure 7.4.6b
Identified Hotel Group Competition 1991
N.B.T 1J Hyatt 1J
Sheraton l)
Scandic l)
S.H.H lJ DeVere u c
0 Milton u m p Jarvis jJ e
Hoi. Inn t TJ
Marriott 1J o Swallow TJ r
Hilton 1J Q.M.H 1J Other 1J
M.Ch.Th u Stakis J)
Forte lJ I I I I I
0 10 20 30 40 50 60
% of Companies
It appears that the CSHB market structure supply in Scotland is dominated not just by
hotel groups, but by a few key hotel groups, often producing corporate brochures and
adopting sophisticated marketing strategies. These key hotel groups are included
within the research sample allowing the research to reflect key market strategies and
further validating the sample selected.
Page 204
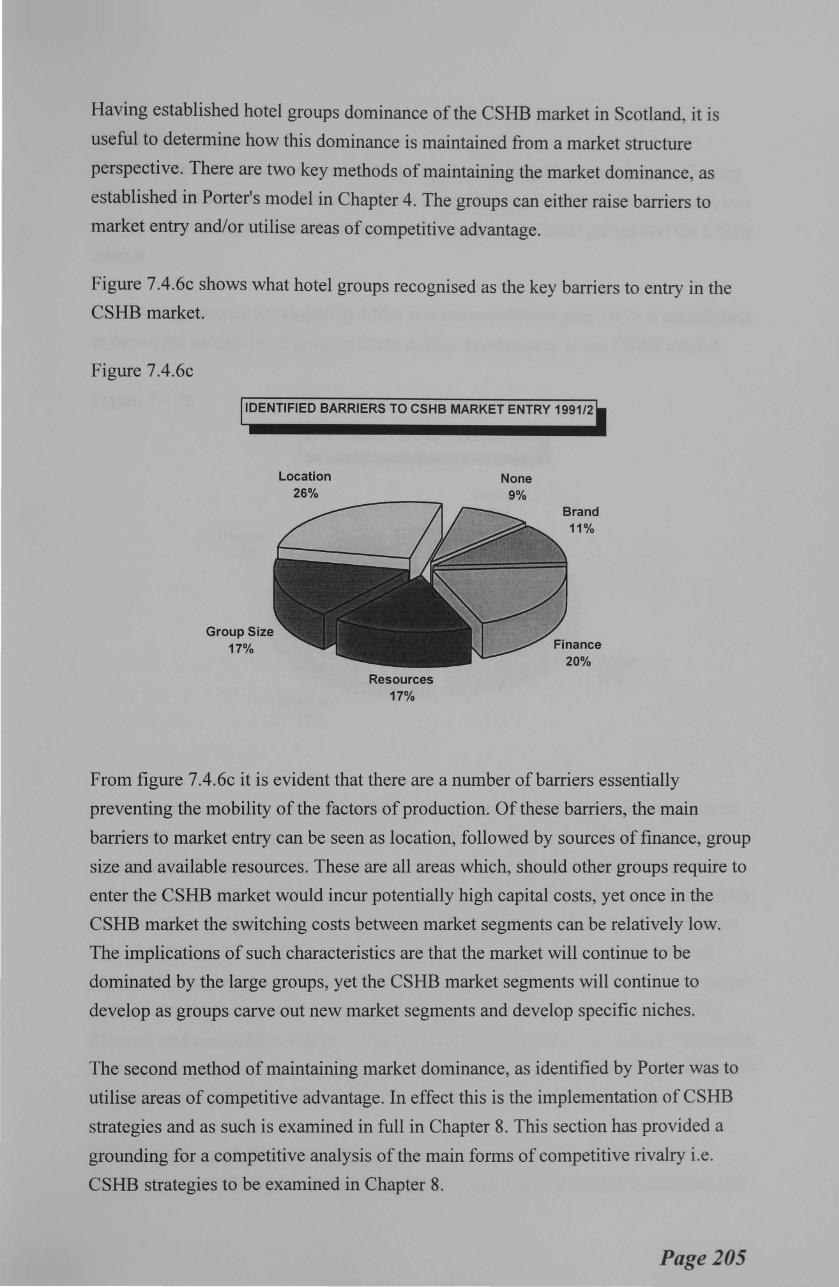
Having established hotel groups dominance of the CSHB market in Scotland, it is
useful to determine how this dominance is maintained from a market structure
perspective. There are two key methods of maintaining the market dominance, as
established in Porter's model in Chapter 4. The groups can either raise barriers to
market entry and/or utilise areas of competitive advantage.
Figure 7.4.6c shows what hotel groups recognised as the key barriers to entry in the
CSHB market.
Figure 7.4.6c
IDENTIFIED BARRIERS TO CSHB MARKET ENTRY 1991/2
Group Size 17%
Location 26%
Resources 17%
None 9%
Brand 11%
Finance 20%
From figure 7.4.6c it is evident that there are a number of barriers essentially
preventing the mobility of the factors of production. Of these barriers, the main
barriers to market entry can be seen as location, followed by sources of finance, group
size and available resources. These are all areas which, should other groups require to
enter the CSHB market would incur potentially high capital costs, yet once in the
CSHB market the switching costs between market segments can be relatively low.
The implications of such characteristics are that the market will continue to be
dominated by the large groups, yet the CSHB market segments will continue to
develop as groups carve out new market segments and develop specific niches.
The second method of maintaining market dominance, as identified by Porter was to
utilise areas of competitive advantage. In effect this is the implementation of CSHB
strategies and as such is examined in full in Chapter 8. This section has provided a
grounding for a competitive analysis of the main forms of competitive rivalry i.e.
CSHB strategies to be examined in Chapter 8.
Page 205
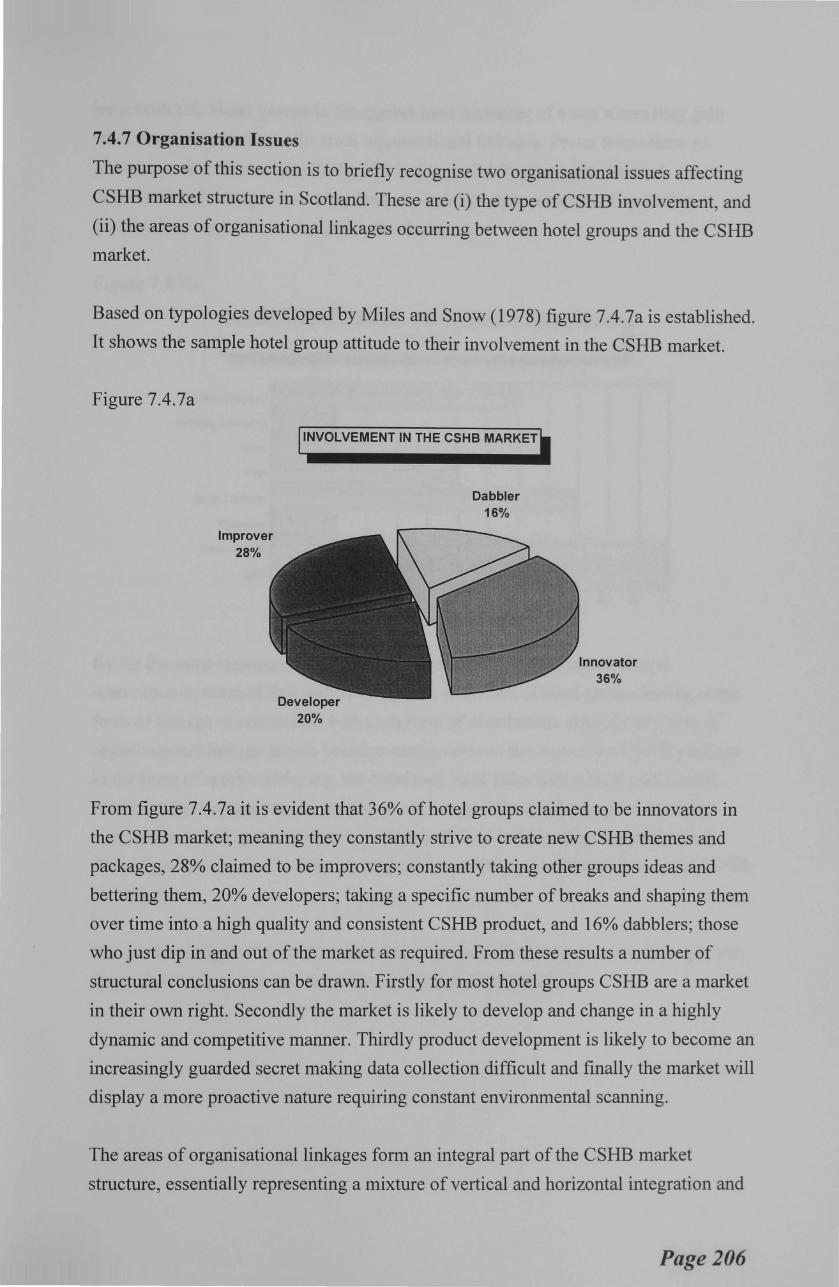
7.4. 7 Organisation Issues
The purpose of this section is to briefly recognise two organisational issues affecting
CSHB market structure in Scotland. These are (i) the type of CSHB involvement, and
(ii) the areas of organisational linkages occurring between hotel groups and the CSHB
market.
Based on typologies developed by Miles and Snow (1978) figure 7.4.7a is established.
It shows the sample hotel group attitude to their involvement in the CSHB market.
Figure 7.4.7a
Improver 28%
I INVOLVEMENT IN THE CSHB MARKET~
Dabbler 16%
1111'~:~.''1):/ Innovator
36%
From figure 7.4.7a it is evident that 36% of hotel groups claimed to be innovators in
the CSHB market; meaning they constantly strive to create new CSHB themes and
packages, 28% claimed to be improvers; constantly taking other groups ideas and
bettering them, 20% developers; taking a specific number of breaks and shaping them
over time into a high quality and consistent CSHB product, and 16% dabblers; those
who just dip in and out of the market as required. From these results a number of
structural conclusions can be drawn. Firstly for most hotel groups CSHB are a market
in their own right. Secondly the market is likely to develop and change in a highly
dynamic and competitive manner. Thirdly product development is likely to become an
increasingly guarded secret making data collection difficult and finally the market will
display a more proactive nature requiring constant environmental scanning.
The areas of organisational linkages form an integral part of the CSHB market
structure, essentially representing a mixture of vertical and horizontal integration and
Page 206
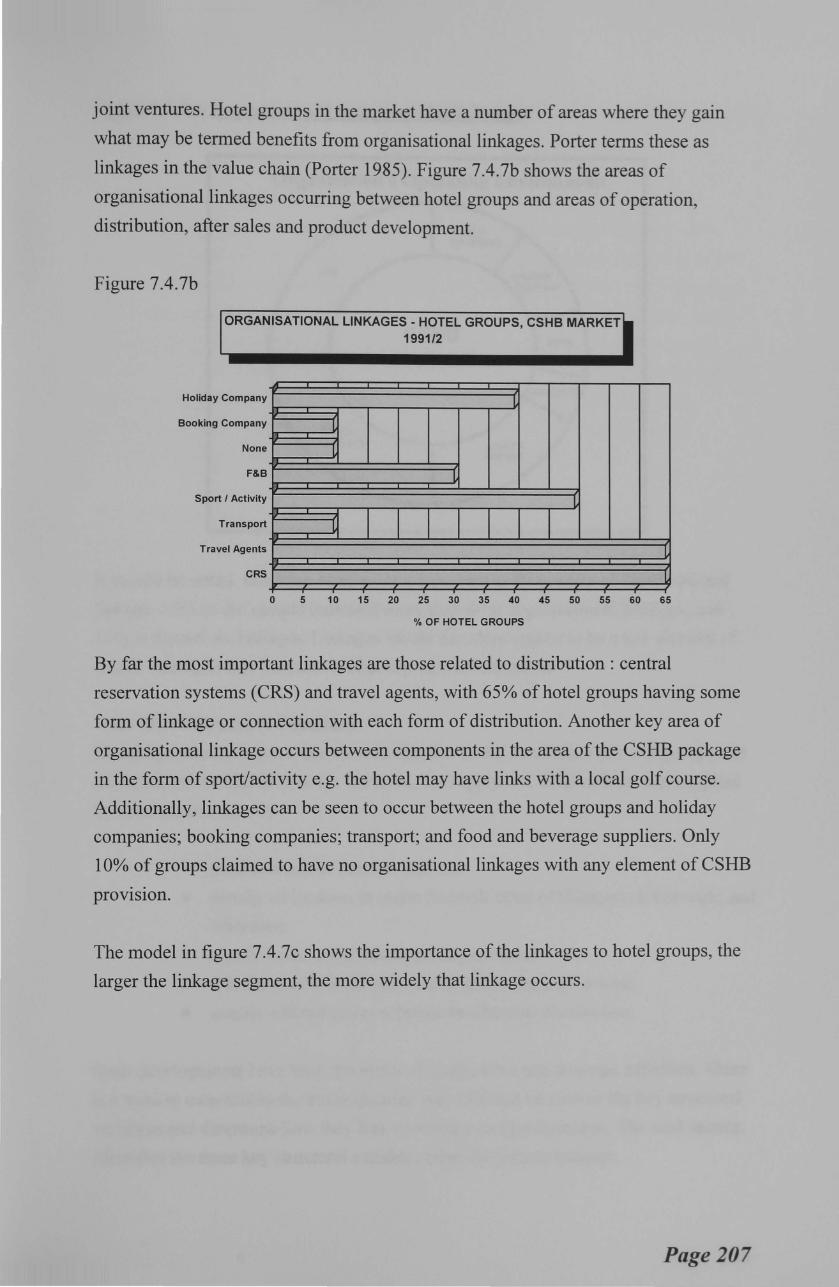
joint ventures. Hotel groups in the market have a number of areas where they gain
what may be termed benefits from organisational linkages. Porter terms these as
linkages in the value chain (Porter 1985). Figure 7.4.7b shows the areas of
organisational linkages occurring between hotel groups and areas of operation,
distribution, after sales and product development.
Figure 7.4.7b
ORGANISATIONAL LINKAGES- HOTEL GROUPS, CSHB MARKET 1991/2
Holiday Company L Booking Company L
None L
F&B L
Sport I Activity L Transport 1J
Travel Agents
CRS
L
L 0 5 10 15 20 25 30 35 40 45 50 55 60 65
% OF HOTEL GROUPS
By far the most important linkages are those related to distribution : central
reservation systems (CRS) and travel agents, with 65% ofhotel groups having some
form of linkage or connection with each form of distribution. Another key area of
organisational linkage occurs between components in the area of the CSHB package
in the form of sport/activity e.g. the hotel may have links with a local golf course.
Additionally, linkages can be seen to occur between the hotel groups and holiday
companies; booking companies; transport; and food and beverage suppliers. Only
1 0% of groups claimed to have no organisational linkages with any element of CSHB
prOVISIOn.
The model in figure 7.4.7c shows the importance of the linkages to hotel groups, the
larger the linkage segment, the more widely that linkage occurs.
Page 207
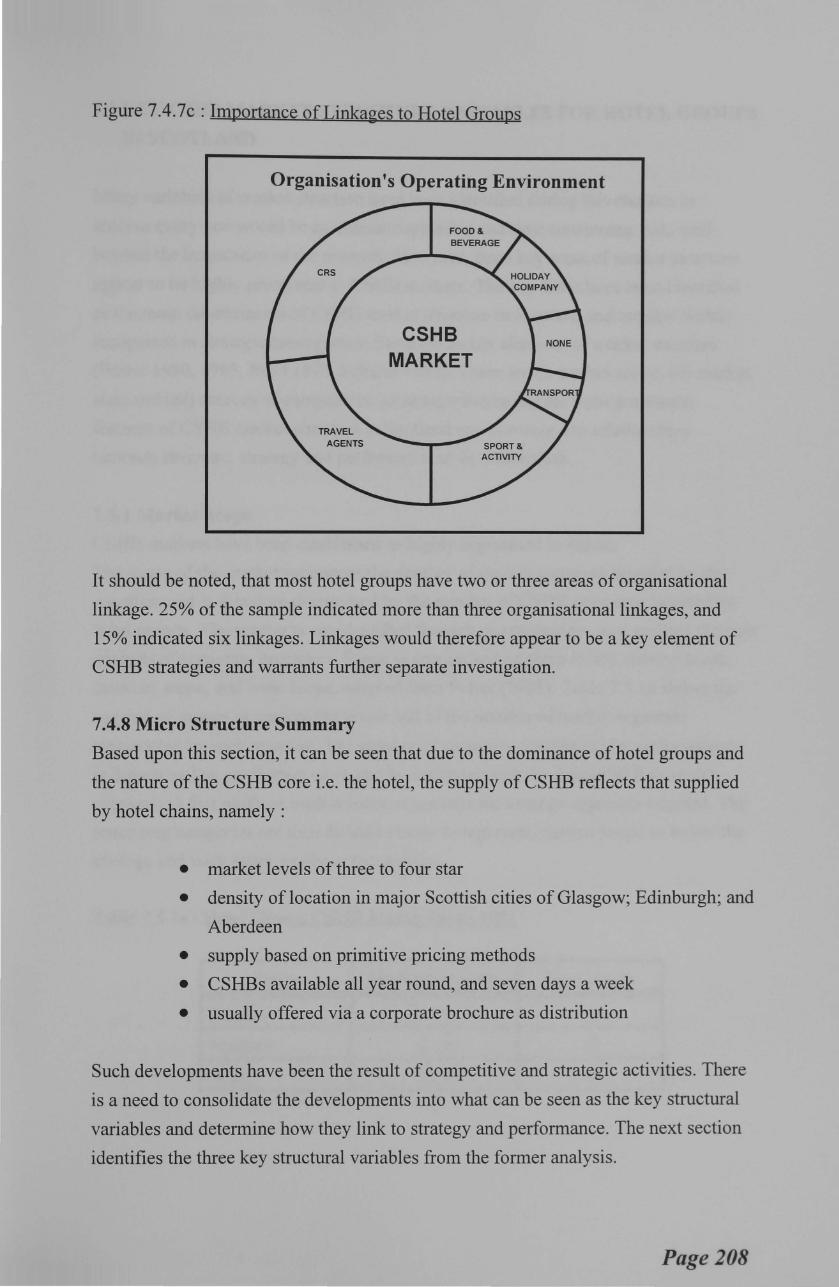
Figure 7.4.7c: Importance of Linkages to Hotel Groups
Organisation's Operating Environment
CSHB MARKET
It should be noted, that most hotel groups have two or three areas of organisational
linkage. 25% of the sample indicated more than three organisational linkages, and
15% indicated six linkages. Linkages would therefore appear to be a key element of
CSHB strategies and warrants further separate investigation.
7.4.8 Micro Structure Summary
Based upon this section, it can be seen that due to the dominance of hotel groups and
the nature of the CSHB core i.e. the hotel, the supply of CSHB reflects that supplied
by hotel chains, namely :
• market levels of three to four star
• density of location in major Scottish cities of Glasgow; Edinburgh; and
Aberdeen
• supply based on primitive pricing methods
• CSHBs available all year round, and seven days a week
• usually offered via a corporate brochure as distribution
Such developments have been the result of competitive and strategic activities. There
is a need to consolidate the developments into what can be seen as the key structural
variables and determine how they link to strategy and performance. The next section
identifies the three key structural variables from the former analysis.
Page 208
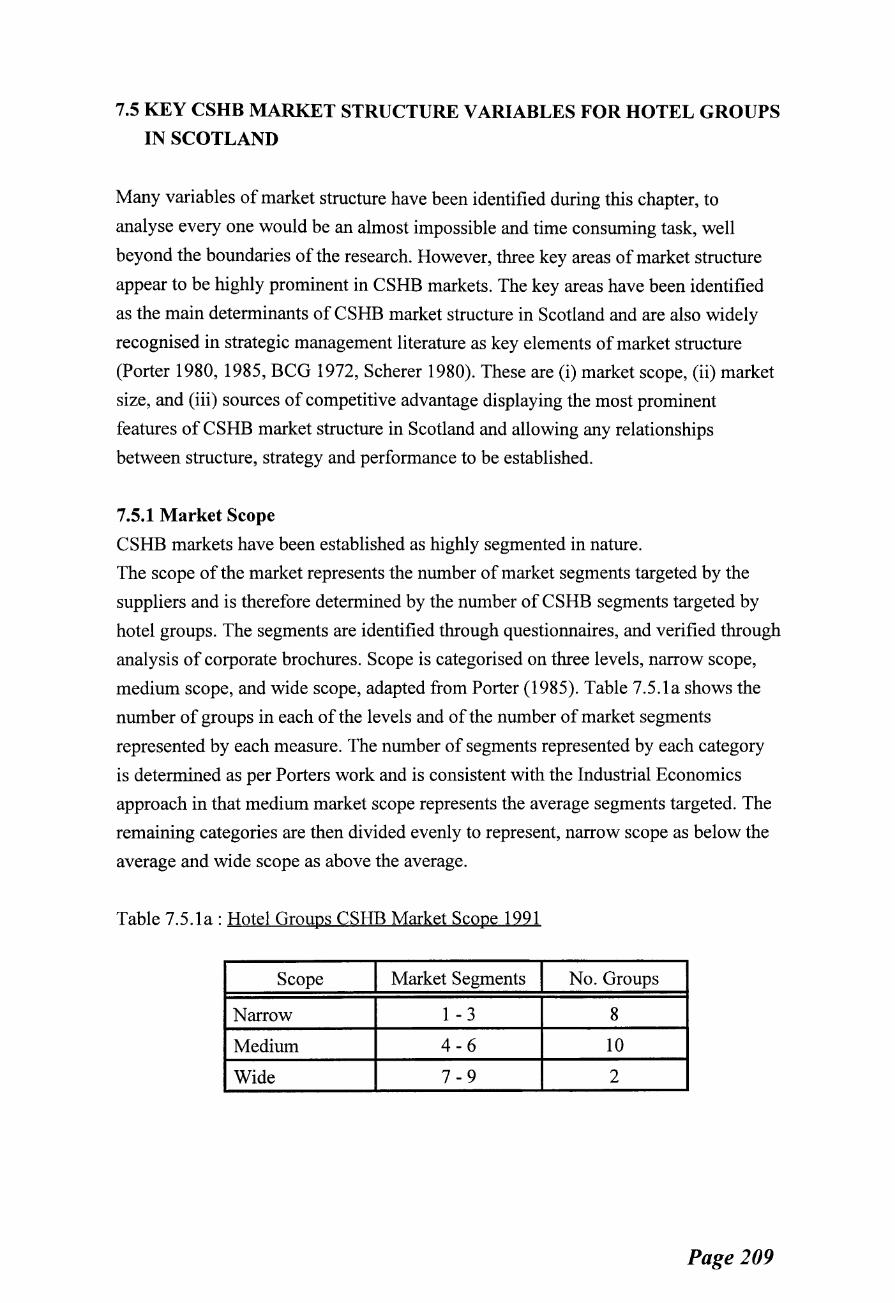
7.5 KEY CSHB MARKET STRUCTURE VARIABLES FOR HOTEL GROUPS
IN SCOTLAND
Many variables of market structure have been identified during this chapter, to
analyse every one would be an almost impossible and time consuming task, well
beyond the boundaries of the research. However, three key areas of market structure
appear to be highly prominent in CSHB markets. The key areas have been identified
as the main determinants of CSHB market structure in Scotland and are also widely
recognised in strategic management literature as key elements of market structure
(Porter 1980, 1985, BCG 1972, Scherer 1980). These are (i) market scope, (ii) market
size, and (iii) sources of competitive advantage displaying the most prominent
features of CSHB market structure in Scotland and allowing any relationships
between structure, strategy and performance to be established.
7.5.1 Market Scope
CSHB markets have been established as highly segmented in nature.
The scope of the market represents the number of market segments targeted by the
suppliers and is therefore determined by the number of CSHB segments targeted by
hotel groups. The segments are identified through questionnaires, and verified through
analysis of corporate brochures. Scope is categorised on three levels, narrow scope,
medium scope, and wide scope, adapted from Porter (1985). Table 7.5.1a shows the
number of groups in each of the levels and of the number of market segments
represented by each measure. The number of segments represented by each category
is determined as per Porters work and is consistent with the Industrial Economics
approach in that medium market scope represents the average segments targeted. The
remaining categories are then divided evenly to represent, narrow scope as below the
average and wide scope as above the average.
Table 7.5.1a: Hotel Groups CSHB Market Scope 1991
Scope Market Segments No. Groups
Narrow 1 - 3 8
Medium 4-6 10
Wide 7-9 2
Page 209
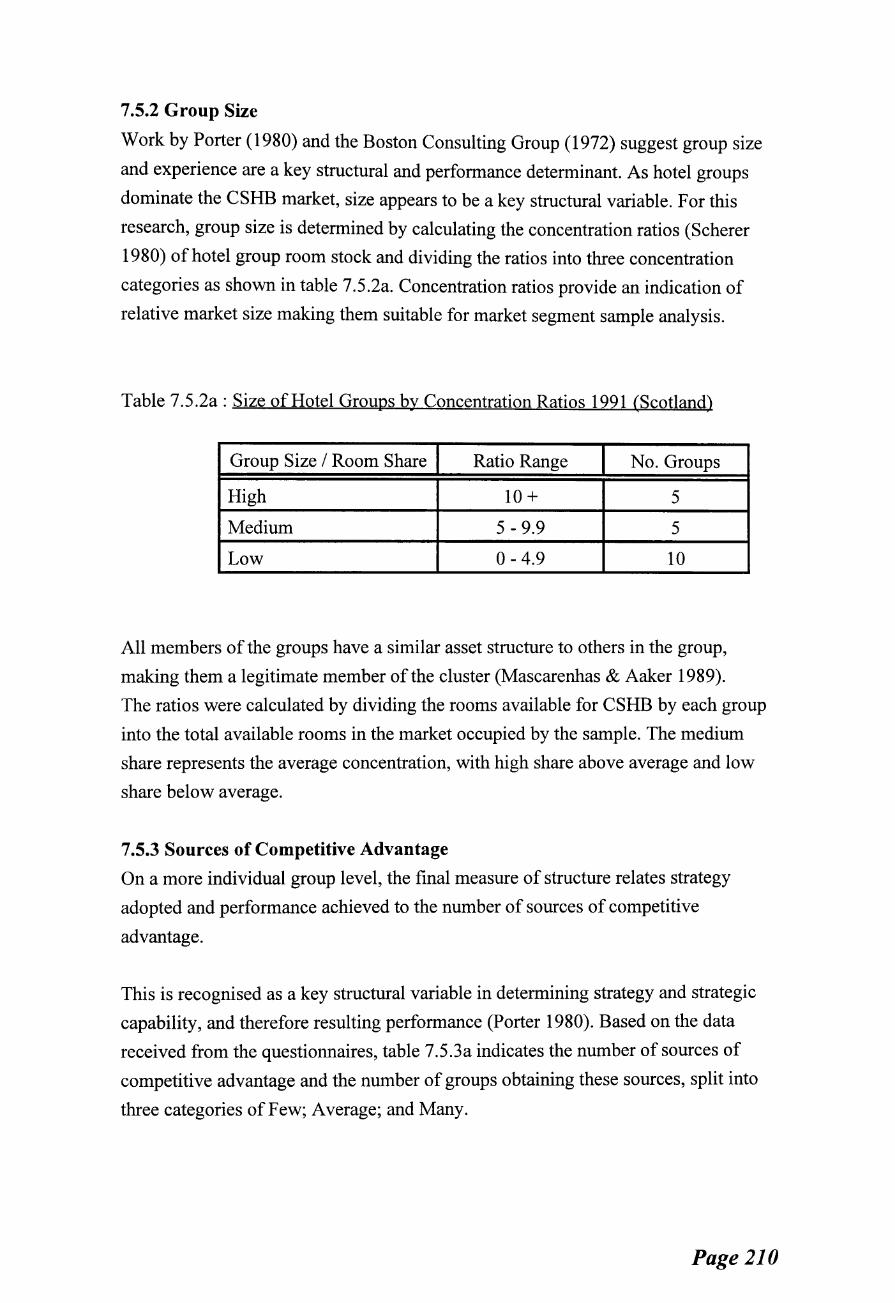
7.5.2 Group Size
Work by Porter (1980) and the Boston Consulting Group (1972) suggest group size
and experience are a key structural and performance determinant. As hotel groups
dominate the CSHB market, size appears to be a key structural variable. For this
research, group size is determined by calculating the concentration ratios (Scherer
1980) of hotel group room stock and dividing the ratios into three concentration
categories as shown in table 7.5.2a. Concentration ratios provide an indication of
relative market size making them suitable for market segment sample analysis.
Table 7.5.2a: Size ofHotel Groups by Concentration Ratios 1991 (Scotland)
Group Size I Room Share Ratio Range No. Groups
High 10 + 5
Medium 5-9.9 5
Low 0-4.9 10
All members of the groups have a similar asset structure to others in the group,
making them a legitimate member of the cluster (Mascarenhas & Aaker 1989).
The ratios were calculated by dividing the rooms available for CSHB by each group
into the total available rooms in the market occupied by the sample. The medium
share represents the average concentration, with high share above average and low
share below average.
7.5.3 Sources of Competitive Advantage
On a more individual group level, the final measure of structure relates strategy
adopted and performance achieved to the number of sources of competitive
advantage.
This is recognised as a key structural variable in determining strategy and strategic
capability, and therefore resulting performance (Porter 1980). Based on the data
received from the questionnaires, table 7.5.3a indicates the number of sources of
competitive advantage and the number of groups obtaining these sources, split into
three categories ofF ew; Average; and Many.
Page 210

Table 7.5.3a: Number of Sources of Competitive Advantage- Hotel Groups 1991
Category No. Sources No. Groups
Few 1-2 10
Average 3-4 4
Many 5-6 6
In constant fashion to the former structural measures, the average category represents
the sample average while few is less than average and many is more than average.
The three measure of market structure represent core elements of the sample market
structure and allow relationships between the market structure and strategic dynamics
to be explored.
Page 211

7.6 CHAPTER SUMMARY
Previous chapters have provided structural data on the nature of UK and Scottish
tourism and the provision of commercial accommodation, particularly hotels. Within
such a context the value and growth of CSHB was established and the need for further
research highlighted.
This chapter has applied the first stage of the research framework adopted by focusing
on CSHB in hotel groups in Scotland to determine key elements of the market
structure which will allow further analysis when combined with strategy and
performance.
From the CSHB market structure analysis it has been found that the market structure
in Scotland is dominated by large hotel groups, (influencing overall CSHB
characteristics) and represents a highly segmented and complex market. Such a
market is widely recognised as a market in its own right. It has highlighted that
competition between groups for market share is fierce and often based upon barriers
to entry and distribution i.e. branded corporate brochures. Pricing has been established
as relatively unstructured and primitive yet a number of more sophisticated
approaches are emerging - highlighting the need for research into the strategic
dynamics of such hotel groups.
In economic terms the market can be seen to be displaying signs of being under
conditions of monopolistic competition in that there are a few large companies
competing for market share, essentially through market development and branding -
making any research findings of particular interest to industry.
As the market structure is of such a complex and dynamic nature, three highly
prominent structural variables have been identified for further analysis. These
variables allow the relationship between structure and strategy to be formed.
The three measures of structure identified are : market scope i.e. segmentation,
market size i.e. group concentration and sources of competitive advantage.
The next chapter focuses on hotel group methods of competing i.e. competitive
rivalry, and determines the key strategies used to gain and sustain market share.
Understanding the strategic dimensions of the market will allow bilateral linkages
between structure and strategy to be established. Combining such linkages with the
Page 212
resulting performance of suppliers allows recommended associations to be made, via
a performance enhancement model, as to how suppliers may maximise returns in
CSHB markets.
Page 213
REFERENCES
Ackoff, R (1970) "The concept of corporate plannin~", John Wiley & Sons New
York
Bailey, J (1989) "Short holidays", Insights, ETB I BTA B1-B7
Barney, J.B; Me Williams, A; Turk, T (1989) "Relevance of entry barriers in
competitive strate~y", Strategic Management Society Conference Proceedings
San Francisco
Barney, J; Hoskisson, R (1990) "Strate~ic ~roups: untested assertions and research
proposals", Managerial and Decision Economics, 11 pp 189-198
Beioley, S (1991) "Short holidays", Insights, ETB September B29-B38
Belkaoui, A; Pavlik, E (1992) "The effects of ownership structure and diversification
strate~y on performance", Managerial and Decision Economics, 13 pp 343-
352
Boston Consulting Group (1972) "Perspectives on experience 1968, 1970~ 1972",
BCG Ltd New York
BTA (1989) "The short break market", BTA I ETB November London
BTA (1990) "Holiday", Insights, 6 A127-A132, B61-B70
Demetriadi, J (1992) "Takin~ a break", Hospitality, June pp 10-12
Dev, C.S; Brown, J.R (1990) "Marketin~ strate~ies~ vertical structure, and
performance in the lod~in~ industry : a contin~ency approach", International Journal of Hospitality Management, 9(3) pp 269-282
Fahy, I; King, W.R; Narayanan, V.K (1981) "Environmental scannin~ and
forecastin~ in strate~ic plannin~ - the state of the art", Long Range Planning, 14 pp 32-39
Hatten, K; Schendel, D.E; Cooper, A.C (1978) "A strate~ic model of the US brewin~
industry: 1952-1971 ", Academy of Management Journal, December 21(4)
pp 592-610
Hatten, K; Hatten, M (1987) "Strate~ic ~roups, asymmetrical mobility barriers and
contestibility", Strategic Management Journal, 8 pp 329-342
Hoseasons (1992) "Hoseasons holiday survey", Travel GBL June 164 pp 6
Hunt, J (1991) "Prospects for international tourism 1992", EIU Travel and Tourism Analyst, 6 pp 77-93
Jacobson, R (1988) "The persistence of abnormal returns", Strategic Management Journal, 9 pp 415-430
Jacobson, R (1992) "The Austrian school of strate~y", Academy of Management Review, 17( 4) pp 782-807
Page 214
Jain, S.C (1984) "Environmental scanning in US corporations", Long Range Planning, 17 pp 117-128
Johnson, G; Thomas, H (1987) "The industry context of strategy, structure and
performance", Strategic Management Journal, 8 pp 343-361
Khandwalla, P .N (1977) "The design of organisations", Harcourt Brace Jovanovich New York
Lawrence, P; Lorsch, J (1967) "Organisation and environment", Harvard University
Press Boston
Lenz, R. T; Engledow, J.L (1986) "Environmental analysis units and strategic
decision-making : a field study of selected leading edge corporations",
Strategic Management Journal, 7 pp 69-89
Lewis, R.C; Chambers, R.E (1989) "Marketing leadership in hospitality", Van
Nostrand Reinhold, New York
Lohmann, M (1991) "Evolution of short break holidays", Tourist Review, 2 pp 14-
22
Mascarenhas, B; Aaker, D (1989) "Mobility barriers and strategic groups", Strategic Management Journal, 10 pp 475-485
McGee, J (1985) "Strategic groups : a bridge between industry structure and strategic
management", Strategic Marketing and Management, John Wiley & Sons
New York pp 293-313
Me Williams, A; Smart, D ( 1993) "Efficiency V structure - conduct - performance :
implications for strategy research and practice", Journal of Management, Spring 19(1) pp 63-78
MEW Research (1994) "Short break destination choice", Insights, ETB January
A77-A94
Middleton, V.T.C (1987) "Marketing holidays to Wales- responding to market
changes", Tourist Review, 2 pp 27-30
Miles, R.E; Snow, C.C (1978) "Organisational strategy, structure and process",
McGraw Hill, New York
Millar, B (1992) "In times of gloom there's still good news for the hotel lobby", The Scotsman, Tuesday 15 September pp 25
Miller, D (1987) "The structural and environmental correlates of business strategy",
Strategic Management Journal, 8 pp 55-76
MSI (1991) "Databrief: short break holidays", Marketing Strategies for Industry,
London
Newman, H ( 1978) "Strategic groups and the structure - performance relationship",
The Review of Economics and Statistics, 60(3) pp 417-427
Page 215
Oster, S (1982) "Intra-industry structure and ease of strate~ic chan~e", The Review of Economics and Statistics, 64(3) pp 376-383
Porter, M.E (1980) "Competitive strate~y", Free Press New York
Porter, M.E (1985) "Competitive advanta~e", Free Press New York
Porter, M.E (1987) "From competitive advanta~e to corporate strate~y", Harvard Business Review, 65 pp 43-59
Porter, M.E ( 1979) "The structure within industries and companies performance",
Review of Economics and Statistics, 61 pp 214-227
Rumelt, R.P (1982) "Diversification strate~y and profitability", Strategic Management Journal, 3(4) pp 359-370
Schaffer, J.D (1984) "Strategy~ organisation structure and success in the lodgin~
industry", International Journal of Hospitality Management, 3( 4) pp 159-
166
Thomas, D.R.E (1978) "Strategy is different in service businesses", Harvard Business Review, July- August pp 29-36
UKTS (1991) "United Kingdom Tourist Statistics 1991", ETB I STB I WTB INITB
London
Walker, O.C; Ruekert; R.W (1987) "Marketing's role in the implementation of
business strategies : a critical review and conceptual framework", Journal of Marketing, 51 pp 15-23
Wang, P-F (1993) "Business strategy~ or~anisation structure and performance", PhD
Thesis, Manchester Metropolitan University, Manchester
West, J.J; Olsen, M.D (1989) "Environmental scanning, industry structure and
strate~y making : concepts and research in the hospitality industry",
International Journal of Contemporary Hospitality Management, 8(4) pp
283-298
Page 216
CHAPTER EIGHT
CSHB STRATEGIES AND COMPETITIVE ADVANTAGE
8.1 INTRODUCTION
This chapter seeks to establish the CSHB strategies adopted by hotel groups in
Scotland. Each CSHB strategy is examined in tum, highlighting operational
implications before identifying strategic group clusters based upon market structure
and CSHB strategy variables. The differences between group clusters are determined,
introducing the concept of strategic space and the need to examine performance
differences in strategic group clusters (Edgar et al 1994a, 1994b ).
8.2 THEORETICAL FOUNDATIONS
The competitive environment of the tourism industry has been established as
complex, dynamic, highly segmented and fierce. Increasingly hotel chains are having
to compete directly with one another in the same locations (Dev 1990). This is a
notable change for an industry that for long relied on locational specificity to limit the
threat of competition. As growth and competition in the industry mean that market
share is no longer assured, hotel groups have been forced to follow other sectors of
the tourism industry with the implementation of marketing strategies (Tarrant 1989,
Meidan & Lee 1982), often based on product differentiation, growth in new markets,
high value for money, or emerging brands (Olsen 1993).
Strategy is generally viewed as a pattern of important decisions that (i) guides the
organisation in its relationships with its environment, (ii) affects the organisation
structure and (iii) centrally affects the organisation's performance (Hambrick 1980,
Horvath & McMillan 1979, Mintzburg 1978). It is not a single decision representing
the whole, nor a "fragment of functional specialist decisions" (Boschken 1990), and is
generally long term in nature (Chandler 1962). However, defining strategy as a
pattern of a firm's behaviour fails to capture the notion that strategy can vary in
emphasis along one or more strategic dimensions. Strategic management literature
argues that in a competitive environment a focused strategy is required to align the
organisation with "critical environment resources", to capitalise on the organisation's
distinct competencies, and to achieve a competitive edge (Schaffer 1987, Andrew
1972, Porter 1980, 1985, Thompson 1967, Newman 1967). Prime or key strategies
should therefore be identified for any analysis of strategy to take place, yet
recognition should be given to the secondary or support strategies used to protect,
support, or divert competition from the prime strategy (Bourgeois & Astley 1979).
Page 217

Porter (1980) identified that the essence of strategy formulation was coping with
competition, where competition in an industry was rooted in its underlying economics
and competitive forces. A view that has stood up to considerable exploration (Dess &
Davis 1984, Hambrick 1983). As such, writers have provided a profusion of strategies
for competing in different industries ranging from declining industries (Harrigan
1980) to stagnant or growth industries (Hamermesh & Silk 1979). Similarly,
strategies are identified in a range of differing market condition, including low market
shares (Hamermesh, Anderson, Harris 1978, Woo 1980), high market shares (Bloom
& Kotler 1975), and for differing purposes, such as segmenting markets (Muller
1991 ), entering new markets (Erramilli 1989), gaining growth (Tse & West 1992,
Olsen 1991) or simply acquisition (Singh & Montgomery 1987). Such writers have
contributed to the growing bank of strategy types already identified by Galbraith and
Schendel (1983), each requiring different forms of expertise, competencies, resources,
and with differing performance (Hambrick 1983(b), McDaniel & Kolari 1987, Miles
& Snow 1978, Smith, Guthrie & Chen 1986, Snow & Hrebiniak 1980). The three
most prominent strategy types relate to market concentration, market diversification
(Olusoga 1993, Ayal & Zif 1979), or differentiation strategies (Vierich & Calver
1991).
It is widely agreed that such strategies and the concept of strategy are worthy of
empirical investigation (Bourgeois 1978, Hambrick 1980, West & Anthony 1990), yet
while strategy is undoubtedly an important variable of corporate and market analysis
it is difficult to measure or even confirm its existence within many organisations
(Snow & Hambrick 1980, Venkatraman & Grant 1986, Whittington 1988). More
recent research (Robinson & Pearce 1988, Miller 1987) has successfully identified
and operationalised strategy (Bourgeois 1981, Flamholtz 1979, Ginsberg 1984,
Hambrick 1980, Montgomery 1982, Ramanujam & Venkatraman 1985, Snow &
Hambrick 1980, Venkatraman & Grant 1986, Venkatraman & Ramanujam 1986,
1987), some through factor or cluster analysis (Dess & Davis 1984, Robinson &
Pearce 1988(a)). Hambrick (1983)(a) concludes that strategy does exist but as a
composite of numerous variables and as such strategy revolves around four categories
of components, first identified by Schendel and Hofer (1979), as (i) scope, the range
of market segments or product range offered, (ii) resource deployment and distinctive
competencies, how capital is dispersed and what the company does better than anyone
else (Selznick 1957, Bourgeois 1980, Day & Wensley 1988, Hitt & Ireland 1986),(iii)
synergy, where the component parts of an operation or process create more value
when combined that when operating separately and (iv) competitive advantage, how a
company gains and sustains a competitive edge over competition.
Page 218

The concept of competitive advantage is at the heart of marketing strategies and as
such warrants further clarification. Competitive advantage can be gained from a range
of sources, including technology (Dollar 1993 ), differences in supply (Leamer 1993 ),
or product differentiation (Hummels & Levinsohn 1993). Companies have to
concentrate on such activities and competencies to build sustainable competitive
advantages and therefore create value greater than competitors (Bronder & Pritzl
1992, Overstreet 1993, Brathwaite 1992), increasingly, created through strategic
alliances (Dev & Klein 1993) and an understanding of the competitive environment.
Porter ( 1980) argues forcefully that an essential requirement in assessing strategy is to
build up a clear picture of industry environment and relate strategy specifically to that
environment. As organisations are dependant upon their environments for resources
(Aldrich 1979, Pfeffer & Salancik 1978), they will attempt to manage their
dependency by developing and maintaining strategies geared toward the environment
(Thompson 1967, Hoffer & Schendel 1978). In some industries, the environment is
hostile in the sense that only one strategy can survive (Oster 1981). On occasion,
however, it is possible for firms in a particular environment to follow many different
strategies (Miles & Snow 1978, Dutta 1991, McDonald 1993) revolving around the
dimensions of product/service innovation (Bums & Stalker 1961, Thompson 1961,
Peters 1987), marketing differentiation, breadth, and cost control (Miller 1986, Miles
& Snow 1978, Henderson 1979, Porter 1980, Dess & Davis 1984). As the
environment changes, so should the strategies adopted (Thompson 1967) hence
analysis of any strategy should be understood within the context of the time of
research and the type of environment. Chapters 1 to 7 have set the scene for CSHB
environments opening the way for CSHB strategy analysis and then the determination
of market structure - CSHB strategy group clusters.
The nature of strategy has been established and is applicable on various organisational
levels. Strategy and strategic planning in hotel groups occurs on three levels, the (i)
corporate level i.e. Board of directors and the chief executive officer, the (ii)
business level, i.e. hotel group executives responsible for conveying corporate policy
relative to specific functions (Hrebiniak 1992), and the (iii) operational or functional
level i.e. individual hotel level usually at general manager status (Nebel & Schaffer
1991, Pearce & Robinson 1988(b)). Dev and Brown (1990) recognise the difference
between the corporate, business and operational levels of strategy as (i) corporate
being the pattern of decisions about an organisations domain (Mintzberg 1978, Miles
& Snow 1978), (ii) business level as decisions relating to competing within a
Page 219

particular product/market segment (Hofer & Schendel 1978), and (iii) operational as
being concerned with individual hotels at local market level.
This research into CSHB is therefore concerned essentially with the business level of
strategy, representing the corporate perspective of competition within the market
segment of CSHB. However, the obvious importance of the operational level i.e.
individual hotels within the group requires operational strategies to be examined, as
this will reveal differences in market level strategy between locations, markets and
possibly even corporate direction i.e. the gap between the unit and the head office.
This chapter will examine the business level strategies providing an industry
perspective of CSHB strategies while Appendix V provides the operational level
strategies through an analysis of multi-site operations.
In summary, strategy and strategic planning as opposed to short term tactics is
essential to the long term survival of hospitality organisations in the 1990s
(Feltenstein 1992, Senior & Morphew 1990). Firms in the industry will differ from
one another along various dimensions, reflecting differences in the competitive
strategies of the firms in the industry (Porter 1980). Hence, an analysis of prime
strategies will assist in understanding the dynamics of the industry and strategic group
composition, and contribute significantly to knowledge, a view supported by
Mascarenhas and Aaker (1989). As Miller (1987) recognised, particular market
structures and strategies commonly go together, and are often found in certain types
of environment. This gives rise to the concept of strategic group clusters and strategic
space as a framework for analysis, discussed in section 8.5.
Therefore, analysis of CSHB strategy provides a means of unifying a firms activities
(Newman 1978) and in the process defines the strategic relationship between the
individual parts and the whole, forming an excellent medium for market and
performance analysis.
Page 220
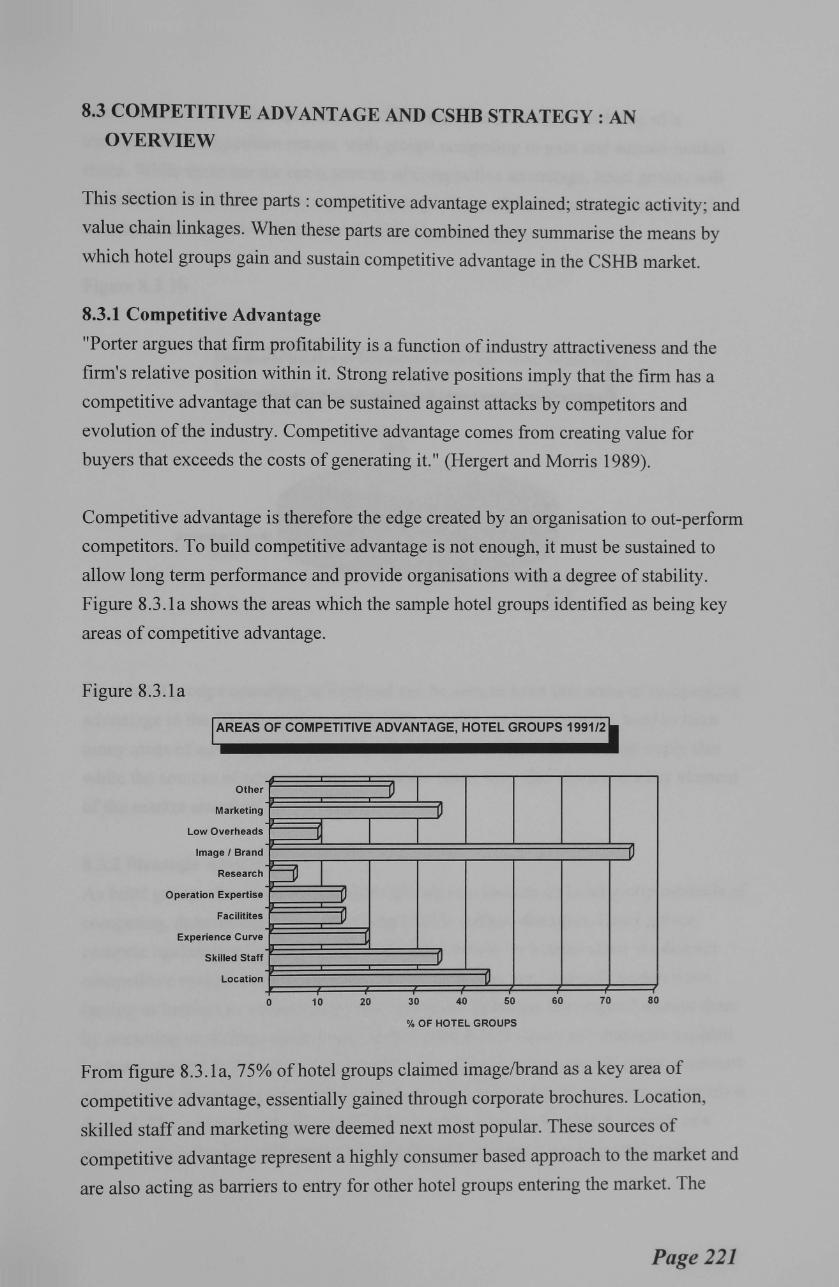
8.3 COMPETITIVE ADVANTAGE AND CSHB STRATEGY : AN OVERVIEW
This section is in three parts : competitive advantage explained; strategic activity; and
value chain linkages. When these parts are combined they summarise the means by
which hotel groups gain and sustain competitive advantage in the CSHB market.
8.3.1 Competitive Advantage
"Porter argues that firm profitability is a function of industry attractiveness and the
firm's relative position within it. Strong relative positions imply that the firm has a
competitive advantage that can be sustained against attacks by competitors and
evolution of the industry. Competitive advantage comes from creating value for
buyers that exceeds the costs of generating it." (Hergert and Morris 1989).
Competitive advantage is therefore the edge created by an organisation to out-perform
competitors. To build competitive advantage is not enough, it must be sustained to
allow long term performance and provide organisations with a degree of stability.
Figure 8.3.la shows the areas which the sample hotel groups identified as being key
areas of competitive advantage.
Figure 8.3.la
AREAS OF COMPETITIVE ADVANTAGE, HOTEL GROUPS 1991/2
Other
Marketing
Low Overheads
Image I Brand
Research
Operation Expertise
Facilitites
Experience Curve
Skilled Staff
Location
lJ
E:DI lJ
1J
0 10
u lJ
I
lJ
-u 20 30 40 50 60 70
% OF HOTEL GROUPS
I)
80
From figure 8.3.la, 75% of hotel groups claimed image/brand as a key area of
competitive advantage, essentially gained through corporate brochures. Location,
skilled staff and marketing were deemed next most popular. These sources of
competitive advantage represent a highly consumer based approach to the market and
are also acting as barriers to entry for other hotel groups entering the market. The
Page 221

results reflect the market structure of CSHB markets in Scotland as being of a
monopolistic competition nature, with groups competing to gain and sustain market
share. While these are the main sources of competitive advantage, hotel groups will
often have more than one source of advantage. Figure 8.3.lb shows the number of
sources of competitive advantage identified by hotel groups.
Figure 8.3.1 b
Number of Sources of Competitive Advantage - Hotel Groups in Scotland 1991
Average (3 to 4) 20%
Many (5 to 6) 30%
50%
Most hotel groups operating in Scotland can be seen to have few areas of competitive
advantage in the CSHB market, while 30%, usually the larger groups, tend to have
many areas of advantage. In this context, the nature of the market would imply that
while the sources of advantage are a strategic issue, they also represent a key element
of the market structure.
8.3.2 Strategic Activity
As hotel groups dominate market share this section focuses on hotel group methods of
competing, determining and categorising CSHB market strategies. Hotel groups
compete against intermediaries and unaffiliated hotels for market share via distinct
competitive routes :broadly categorised into strategies that "defend" market share,
(acting as barriers to market entry) and "predator" strategies that expand market share
by attracting or shifting market segments. Figure 8.3.2a shows the strategies adopted
by hotel groups. It should be noted at this stage, that hotel groups will adopt a mixture
of strategies depending upon which segments are being targeted and what end result is
desired. The various strategies adopted by hotel groups can be seen to consist of a
mixture of packaging, differentiation, distribution, pricing, branding and quality.
Page 222
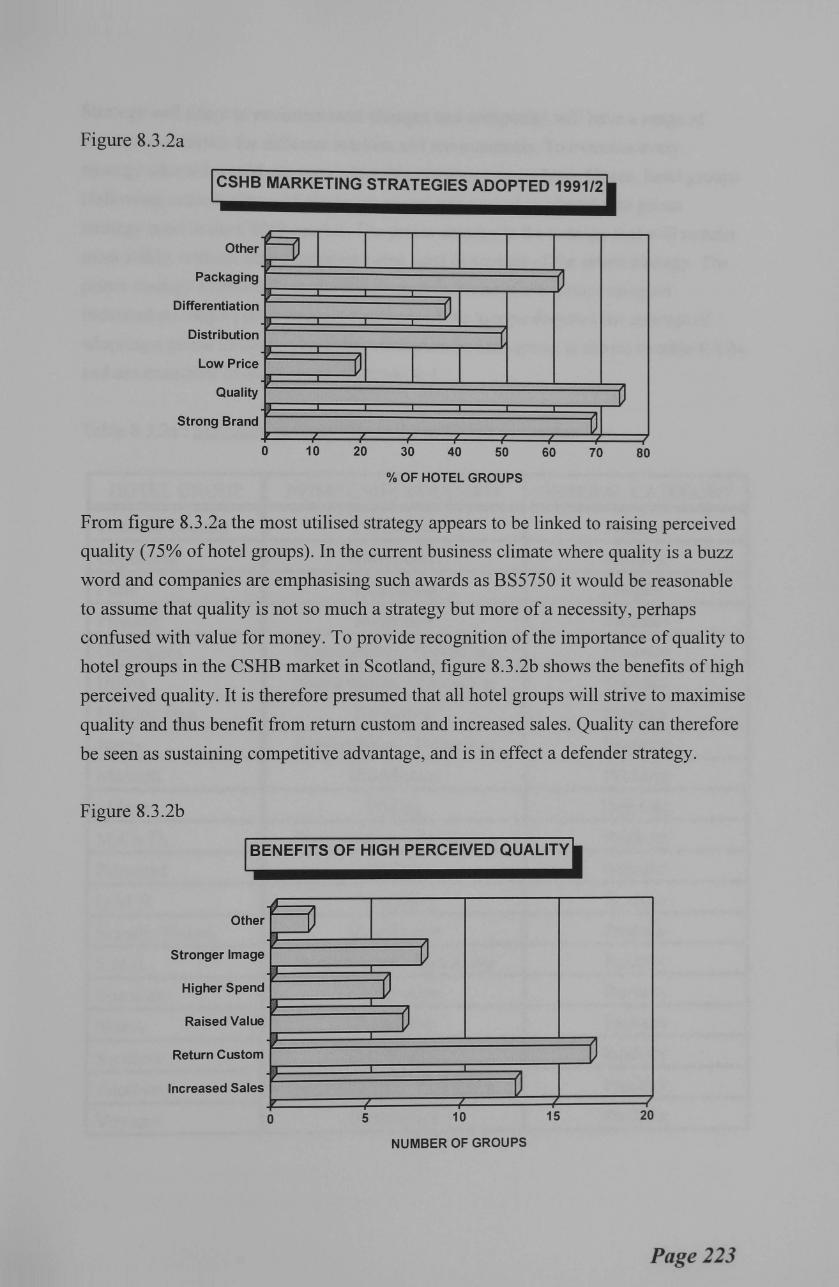
Figure 8.3.2a
CSHB MARKETING STRATEGIES ADOPTED 1991/2
Other ~I I I I Packaging lJ
Differentiation -vi Distribution L
Low Price ul I I Quality 1J
Strong Brand lJ 0 10 20 30 40 50 60 70 80
%OF HOTEL GROUPS
From figure 8.3.2a the most utilised strategy appears to be linked to raising perceived
quality (75% of hotel groups). In the current business climate where quality is a buzz
word and companies are emphasising such awards as BS5750 it would be reasonable
to assume that quality is not so much a strategy but more of a necessity, perhaps
confused with value for money. To provide recognition of the importance of quality to
hotel groups in the CSHB market in Scotland, figure 8.3.2b shows the benefits of high
perceived quality. It is therefore presumed that all hotel groups will strive to maximise
quality and thus benefit from return custom and increased sales. Quality can therefore
be seen as sustaining competitive advantage, and is in effect a defender strategy.
Figure 8.3.2b
I BENEFITS OF HIGH PERCEIVED QUALITY I Other v
n
Stronger Image -o Higher Spend 1J Raised Value IJ
Return Custom IJ Increased Sales 1)
0 5 10 15 20
NUMBER OF GROUPS
Page 223
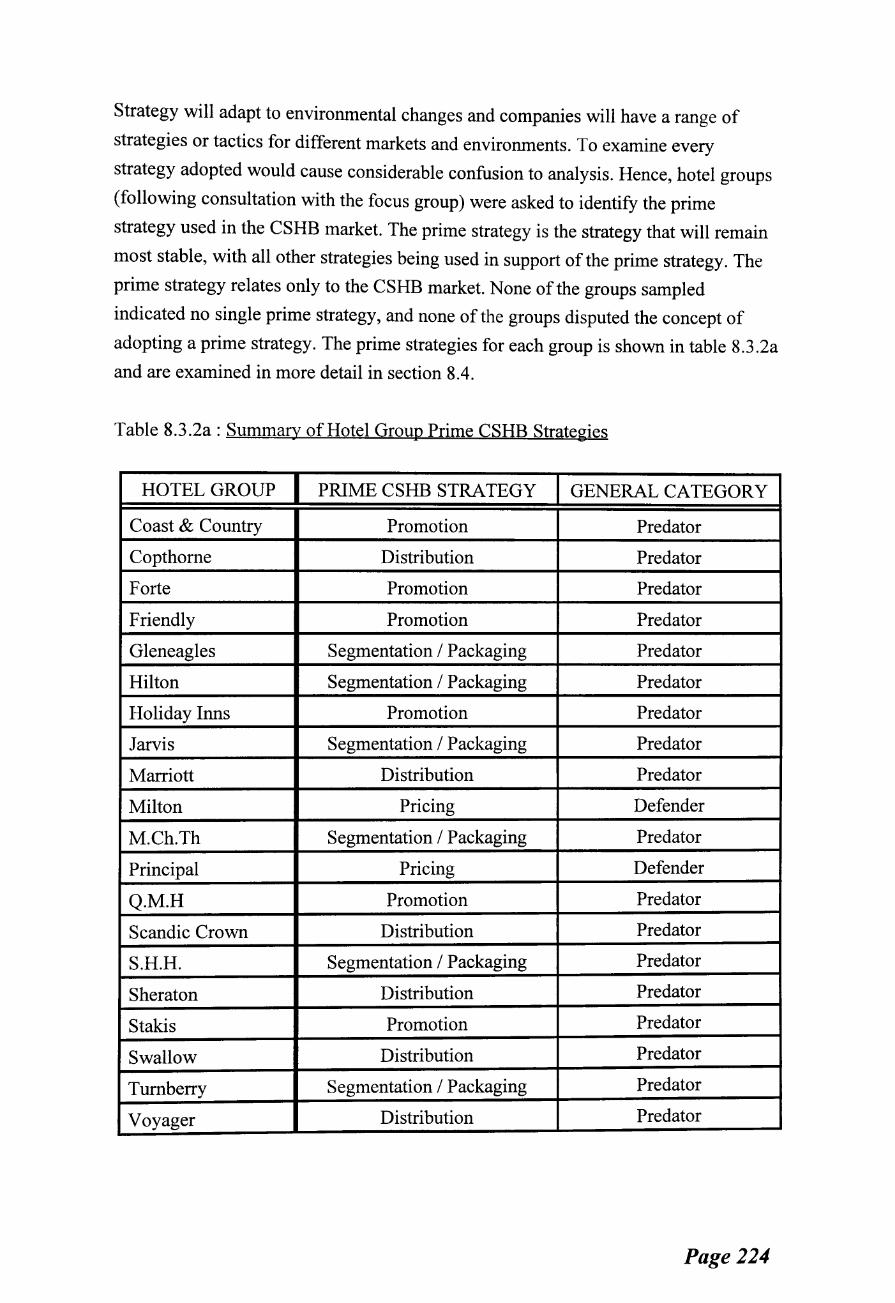
Strategy will adapt to environmental changes and companies will have a range of
strategies or tactics for different markets and environments. To examine every
strategy adopted would cause considerable confusion to analysis. Hence, hotel groups
(following consultation with the focus group) were asked to identify the prime
strategy used in the CSHB market. The prime strategy is the strategy that will remain
most stable, with all other strategies being used in support of the prime strategy. The
prime strategy relates only to the CSHB market. None of the groups sampled
indicated no single prime strategy, and none of the groups disputed the concept of
adopting a prime strategy. The prime strategies for each group is shown in table 8.3.2a
and are examined in more detail in section 8.4.
Table 8.3.2a: Summary of Hotel Group Prime CSHB Strategies
HOTEL GROUP PRIME CSHB STRATEGY GENERAL CATEGORY
Coast & Country Promotion Predator
Copthorne Distribution Predator
Forte Promotion Predator
Friendly Promotion Predator
Gleneagles Segmentation I Packaging Predator
Hilton Segmentation I Packaging Predator
Holiday Inns Promotion Predator
Jarvis Segmentation I Packaging Predator
Marriott Distribution Predator
Milton Pricing Defender
M.Ch.Th Segmentation I Packaging Predator
Principal Pricing Defender
Q.M.H Promotion Predator
Scandic Crown Distribution Predator
S.H.H. Segmentation I Packaging Predator
Sheraton Distribution Predator
Stakis Promotion Predator
Swallow Distribution Predator
Tum berry Segmentation I Packaging Predator
Voyager Distribution Predator
Page 224
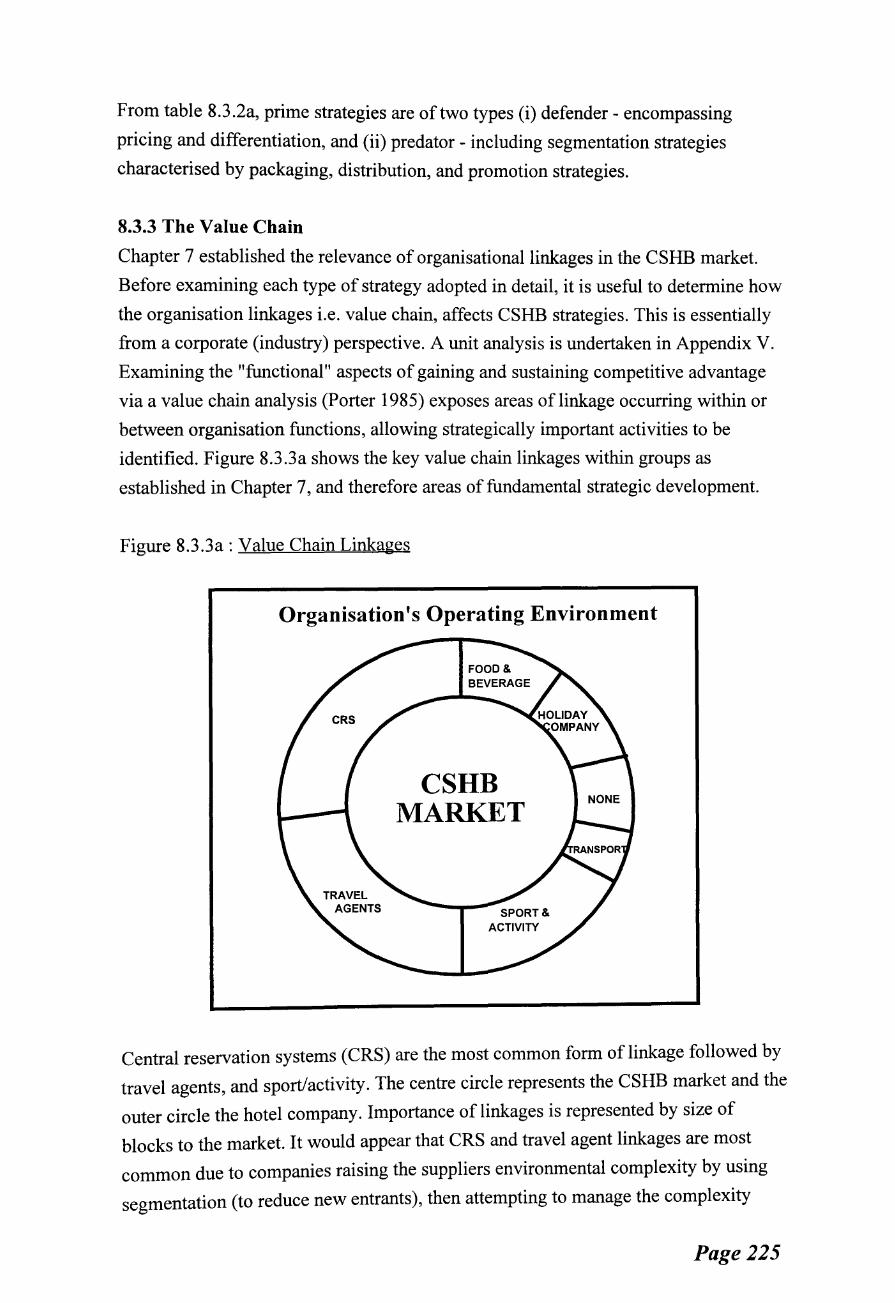
From table 8.3.2a, prime strategies are of two types (i) defender- encompassing
pricing and differentiation, and (ii) predator- including segmentation strategies
characterised by packaging, distribution, and promotion strategies.
8.3.3 The Value Chain
Chapter 7 established the relevance of organisational linkages in the CSHB market.
Before examining each type of strategy adopted in detail, it is useful to determine how
the organisation linkages i.e. value chain, affects CSHB strategies. This is essentially
from a corporate (industry) perspective. A unit analysis is undertaken in Appendix V.
Examining the "functional" aspects of gaining and sustaining competitive advantage
via a value chain analysis (Porter 1985) exposes areas of linkage occurring within or
between organisation functions, allowing strategically important activities to be
identified. Figure 8.3 .3a shows the key value chain linkages within groups as
established in Chapter 7, and therefore areas of fundamental strategic development.
Figure 8.3.3a: Value Chain Linkages
Organisation's Operating Environment
CSHB MARKET
Central reservation systems (CRS) are the most common form of linkage followed by
travel agents, and sport/activity. The centre circle represents the CSHB market and the
outer circle the hotel company. Importance of linkages is represented by size of
blocks to the market. It would appear that CRS and travel agent linkages are most
common due to companies raising the suppliers environmental complexity by using
segmentation (to reduce new entrants), then attempting to manage the complexity
Page 225
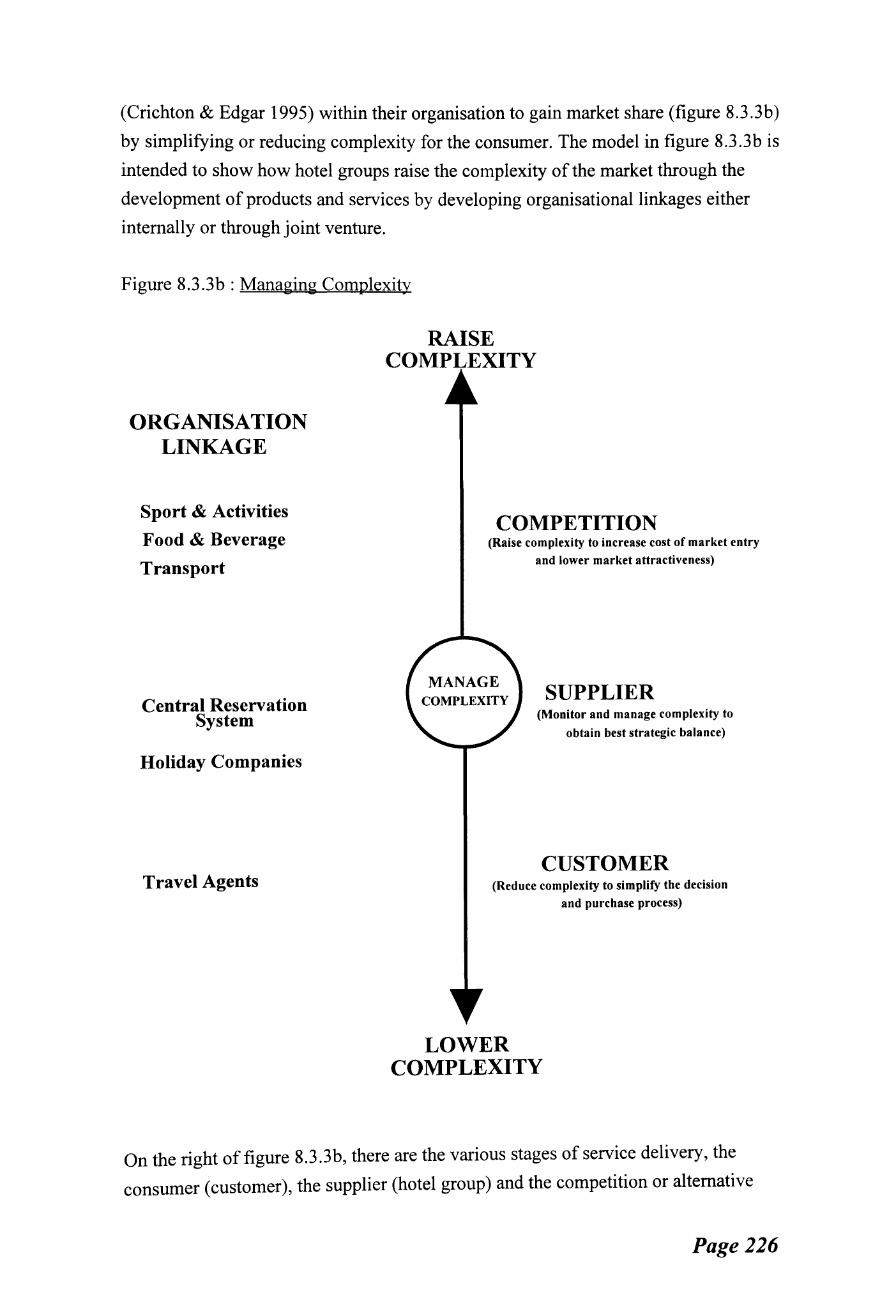
(Crichton & Edgar 1995) within their organisation to gain market share (figure 8.3.3b)
by simplifying or reducing complexity for the consumer. The model in figure 8.3.3b is
intended to show how hotel groups raise the complexity of the market through the
development of products and services by developing organisational linkages either
internally or through joint venture.
Figure 8.3.3b : Managing Complexity
ORGANISATION LINKAGE
Sport & Activities
Food & Beverage
Transport
Central Reservation System
Holiday Companies
Travel Agents
RAISE
COMPETITION (Raise complexity to increase cost of market entry
and lower market attractiveness)
SUPPLIER (Monitor and manage complexity to
obtain best strategic balance)
CUSTOMER (Reduce complexity to simplify the decision
and purchase process)
LOWER COMPLEXITY
On the right of figure 8.3.3b, there are the various stages of service delivery, the
consumer (customer), the supplier (hotel group) and the competition or alternative
Page 226
supply. The hotel groups will attempt to raise market complexity to deter competition.
in effect lowering market attractiveness, while at the same time attempting to lower
complexity making it easier for the customer to make the purchase decision.
Organisational linkages can be used to achieve this essentially through the key
elements of the CSHB i.e. the booking process, package construction, and
distribution. Hence in order to simplify the customer purchase decision, linkages are
formed with travel agents, holiday companies and CRS. These can often be costly if
contracted out with travel agents charging around 12% commission, and holiday
companies 30%. However, many groups are either integrating vertically, or forming
joint ventures to lower costs of this linkage e.g. Queens Moat Houses (Q.M.H) and
Mount Charlotte Thistle (M.Ch.Th) use the same brochure. At the other end of the
spectrum, complexity is raised to deter competition by suppliers establishing linkages
in the areas of food and beverage, sport and activity and transport. Such developments
either attempt to offer a unique product, or attempt to lower operating costs and
therefore achieve greater margins. By moderate pricing competitors who are unable to
lower their operating costs or accept lower returns, will find the industry unattractive
and not be willing to compete for market share.
The issue of complexity is one that warrants further investigation in terms of
individual segments or different markets altogether. For the purposes of this research
complexity is recognised as a spin-off effect of the strategies adopted and an area that
hotel groups will undoubtedly recognise and develop in the future. The next section
focuses on the strategies adopted by hotel groups in more detail.
Page 227
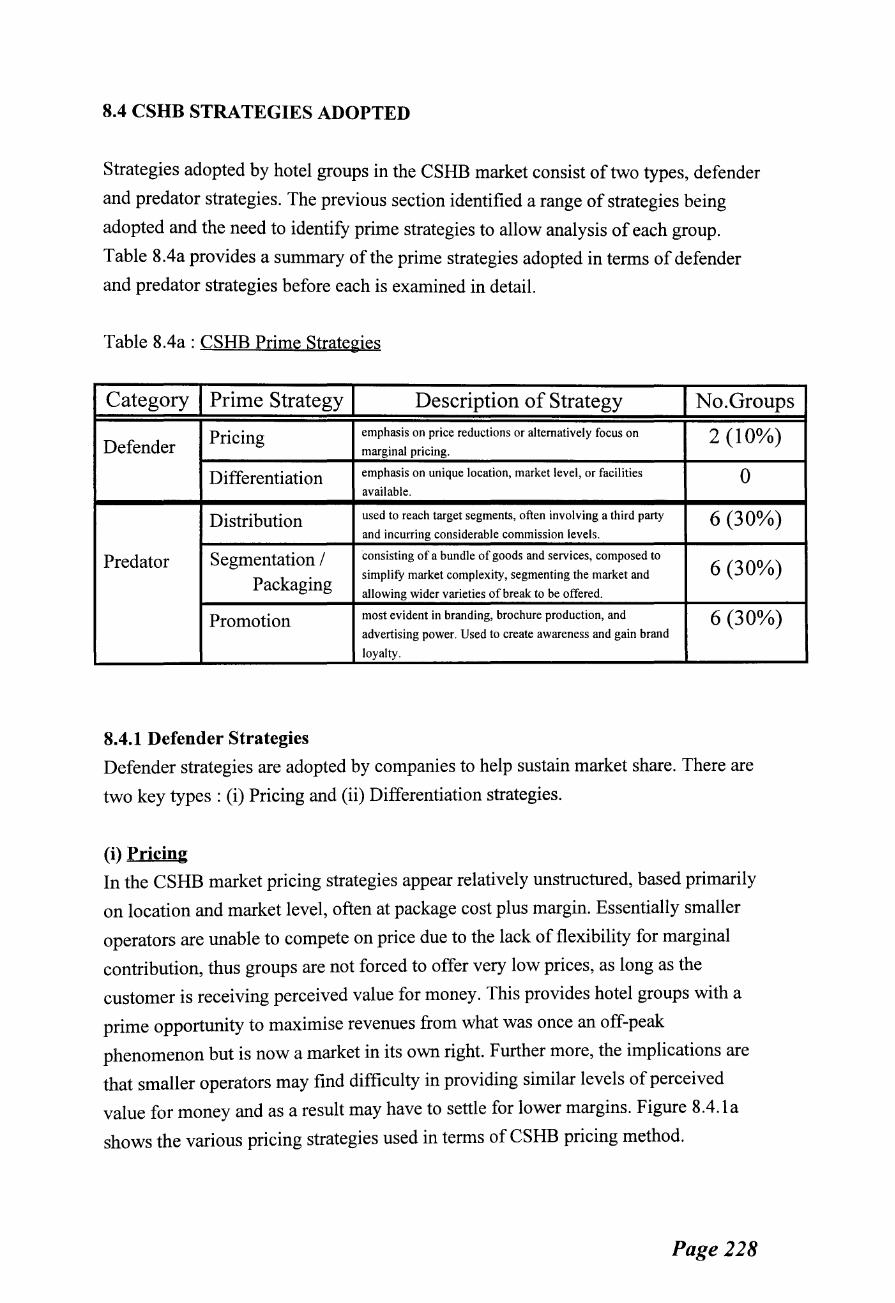
8.4 CSHB STRATEGIES ADOPTED
Strategies adopted by hotel groups in the CSHB market consist of two types, defender
and predator strategies. The previous section identified a range of strategies being
adopted and the need to identify prime strategies to allow analysis of each group.
Table 8.4a provides a summary of the prime strategies adopted in terms of defender
and predator strategies before each is examined in detail.
Table 8.4a: CSHB Prime Strategies
Category Prime Strategy Description of Strategy No.Groups
Defender Pricing emphasis on price reductions or alternatively focus on 2 (10%) marginal pricing.
Differentiation emphasis on unique location, market level, or facilities 0 available.
Distribution used to reach target segments, often involving a third party 6 (30%) and incurring considerable commission levels.
Predator Segmentation I consisting of a bundle of goods and services, composed to 6 (30%)
Packaging simplify market complexity, segmenting the market and
allowing wider varieties of break to be offered.
Promotion most evident in branding, brochure production, and 6 (30%) advertising power. Used to create awareness and gain brand
loyalty.
8.4.1 Defender Strategies
Defender strategies are adopted by companies to help sustain market share. There are
two key types : (i) Pricing and (ii) Differentiation strategies.
(i) Pricing In the CSHB market pricing strategies appear relatively unstructured, based primarily
on location and market level, often at package cost plus margin. Essentially smaller
operators are unable to compete on price due to the lack of flexibility for marginal
contribution, thus groups are not forced to offer very low prices, as long as the
customer is receiving perceived value for money. This provides hotel groups with a
prime opportunity to maximise revenues from what was once an off-peak
phenomenon but is now a market in its own right. Further more, the implications are
that smaller operators may find difficulty in providing similar levels of perceived
value for money and as a result may have to settle for lower margins. Figure 8.4.la
shows the various pricing strategies used in terms of CSHB pricing method.
Page 228
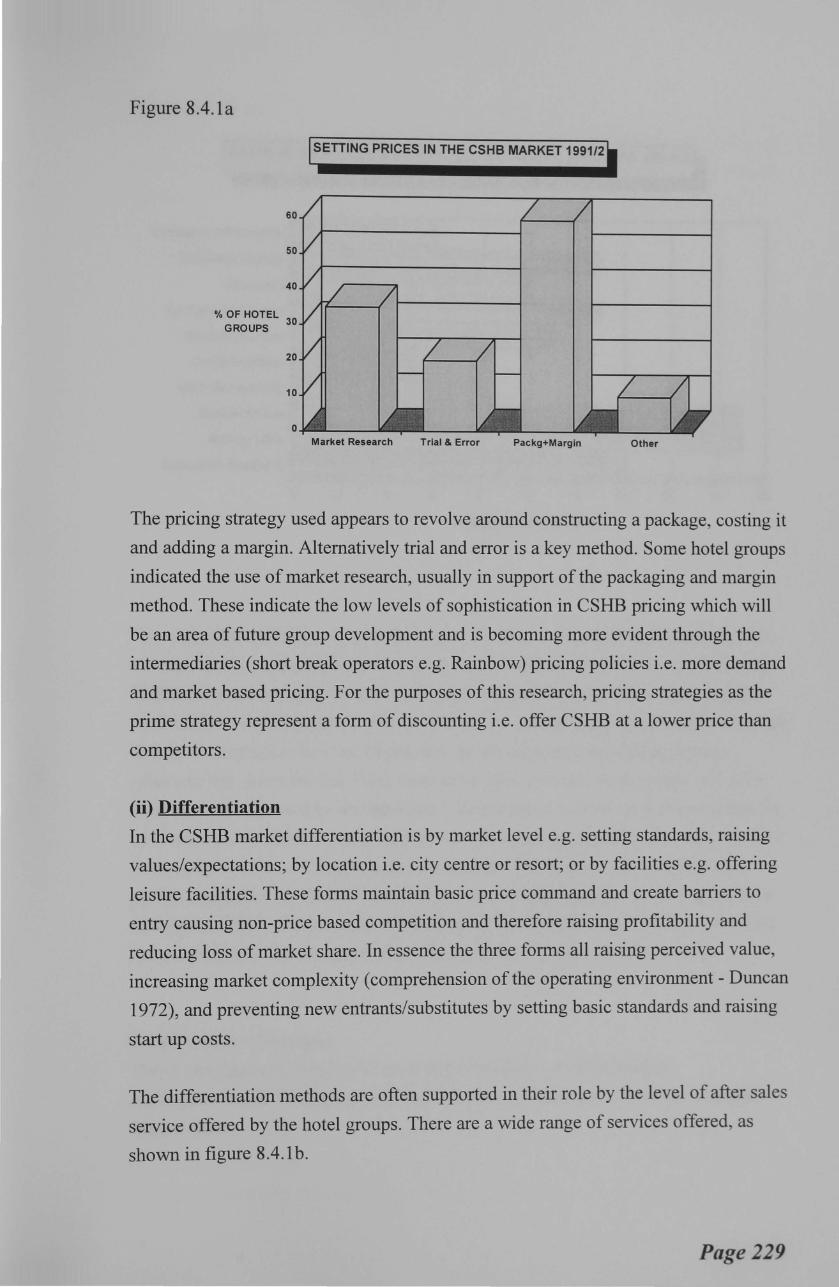
Figure 8.4.1 a
60
50
40
%OF HOTEL 30
GROUPS
20
10
0
SETIING PRICES IN THE CSHB MARKET 1991/2
Market Research Trial & Error Packg+Margin Other
The pricing strategy used appears to revolve around constructing a package, costing it
and adding a margin. Alternatively trial and error is a key method. Some hotel groups
indicated the use of market research, usually in support of the packaging and margin
method. These indicate the low levels of sophistication in CSHB pricing which will
be an area of future group development and is becoming more evident through the
intermediaries (short break operators e.g. Rainbow) pricing policies i.e. more demand
and market based pricing. For the purposes of this research, pricing strategies as the
prime strategy represent a form of discounting i.e. offer CSHB at a lower price than
competitors.
(ii) Differentiation
In the CSHB market differentiation is by market level e.g. setting standards, raising
values/expectations; by location i.e. city centre or resort; or by facilities e.g. offering
leisure facilities. These forms maintain basic price command and create barriers to
entry causing non-price based competition and therefore raising profitability and
reducing loss of market share. In essence the three forms all raising perceived value,
increasing market complexity (comprehension of the operating environment - Duncan
1972), and preventing new entrants/substitutes by setting basic standards and raising
start up costs.
The differentiation methods are often supported in their role by the level of after sales
service offered by the hotel groups. There are a wide range of services offered, as
shown in figure 8.4.1 b.
Page 229
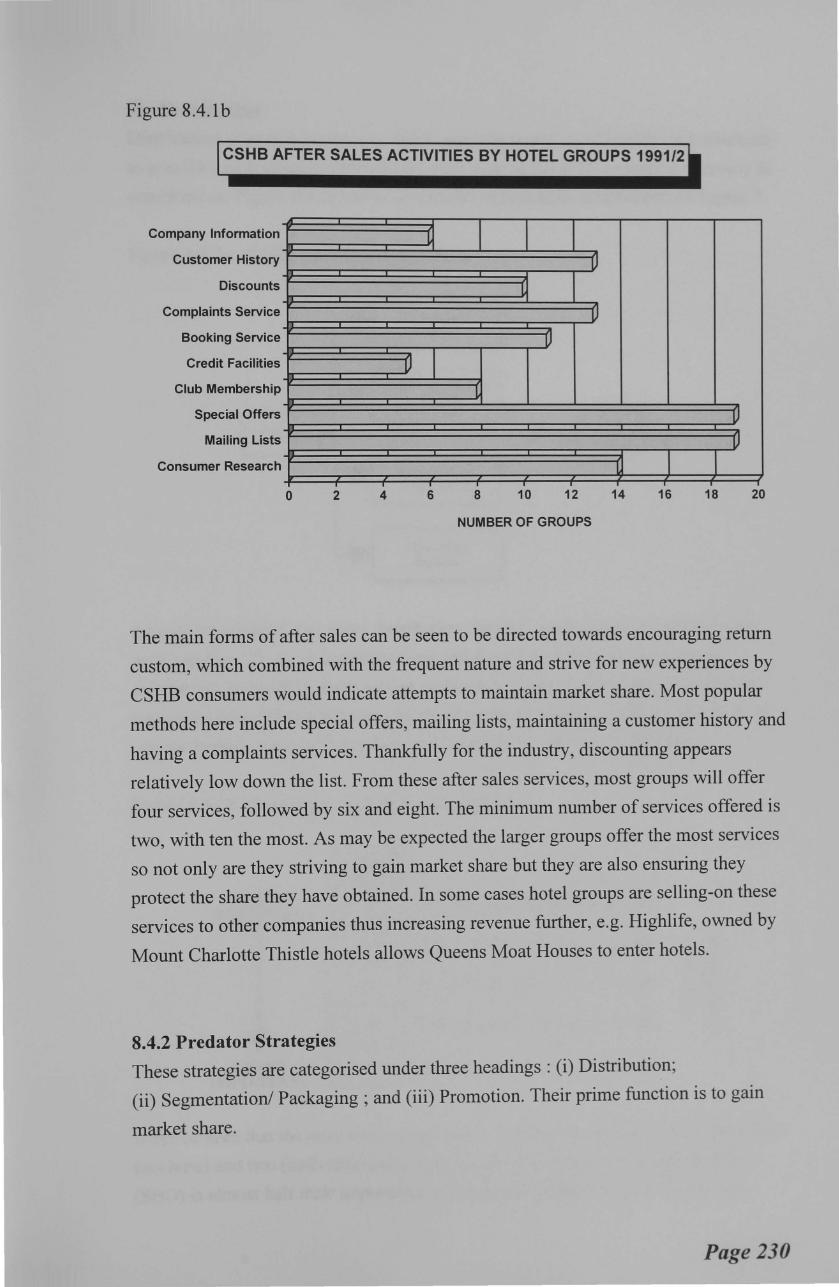
Figure 8.4.1 b
CSHB AFTER SALES ACTIVITIES BY HOTEL GROUPS 1991/2
Company Information
Customer History
Discounts
Complaints Service
Booking Service
Credit Facilities
Club Membership
Special Offers
Mailing Lists
Consumer Research
0
lJ
1J I
2 4 6
-u -l
v 1J
I
1l
8 10 12 14 16
NUMBER OF GROUPS
1J 1J
18 20
The main forms of after sales can be seen to be directed towards encouraging return
custom, which combined with the frequent nature and strive for new experiences by
CSHB consumers would indicate attempts to maintain market share. Most popular
methods here include special offers, mailing lists, maintaining a customer history and
having a complaints services. Thankfully for the industry, discounting appears
relatively low down the list. From these after sales services, most groups will offer
four services, followed by six and eight. The minimum number of services offered is
two, with ten the most. As may be expected the larger groups offer the most services
so not only are they striving to gain market share but they are also ensuring they
protect the share they have obtained. In some cases hotel groups are selling-on these
services to other companies thus increasing revenue further, e.g. Highlife, owned by
Mount Charlotte Thistle hotels allows Queens Moat Houses to enter hotels.
8.4.2 Predator Strategies
These strategies are categorised under three headings : (i) Distribution;
(ii) Segmentation/ Packaging ; and (iii) Promotion. Their prime function is to gain
market share.
Page 230

(i) Distribution
Distribution strategies are used to reach target segments as effectively and efficiently
as possible, each form of distribution can be used in isolation, or more commonly in
combination. Figure 8.4.2a shows distribution channels as established in Chapter 7.
Figure 8.4.2a : CSHB Distribution Channels
_...... Individual ....... Activity
__..., Corporate Brand ,..... :Company :Consortia
HOTEL ~
..... Destination ....... Marketing
...... Operator
....... Brand
I\ I
I
"' v
I
I
li
\
\ ',._ CSHB )~MARKET 'I
' I
I
As may be expected, not every distribution channel carries equal importance with
each supplier. The most important form and therefore most common usage of
distribution methods by hotel groups is shown in figure 8.4.2b where channels are
ranked in order of importance as identified by the hotel group sample. The closer to
one the ranking the most important, the closer to five, the least important.
Figure 8.4.2b Importance of Distribution Channels
MOST IMPORTANT
LEAST IMPORTANT
AVERAGE SCORE
1.72
1.94
3.33
3.89
4.33
Hotel Group Brochure
Individual Hotel Activity
Short Break Operator
Destination Marketing
Consortia
....
.... c~
.... s R HK B E
.... T
....
It can be seen that the most important forms of distribution ranking one (hotel group
brochure) and two (individual hotel activity) are very close, while ranking three
(SBO) is almost half their importance, perhaps due to high associated costs e.g.
Page 231
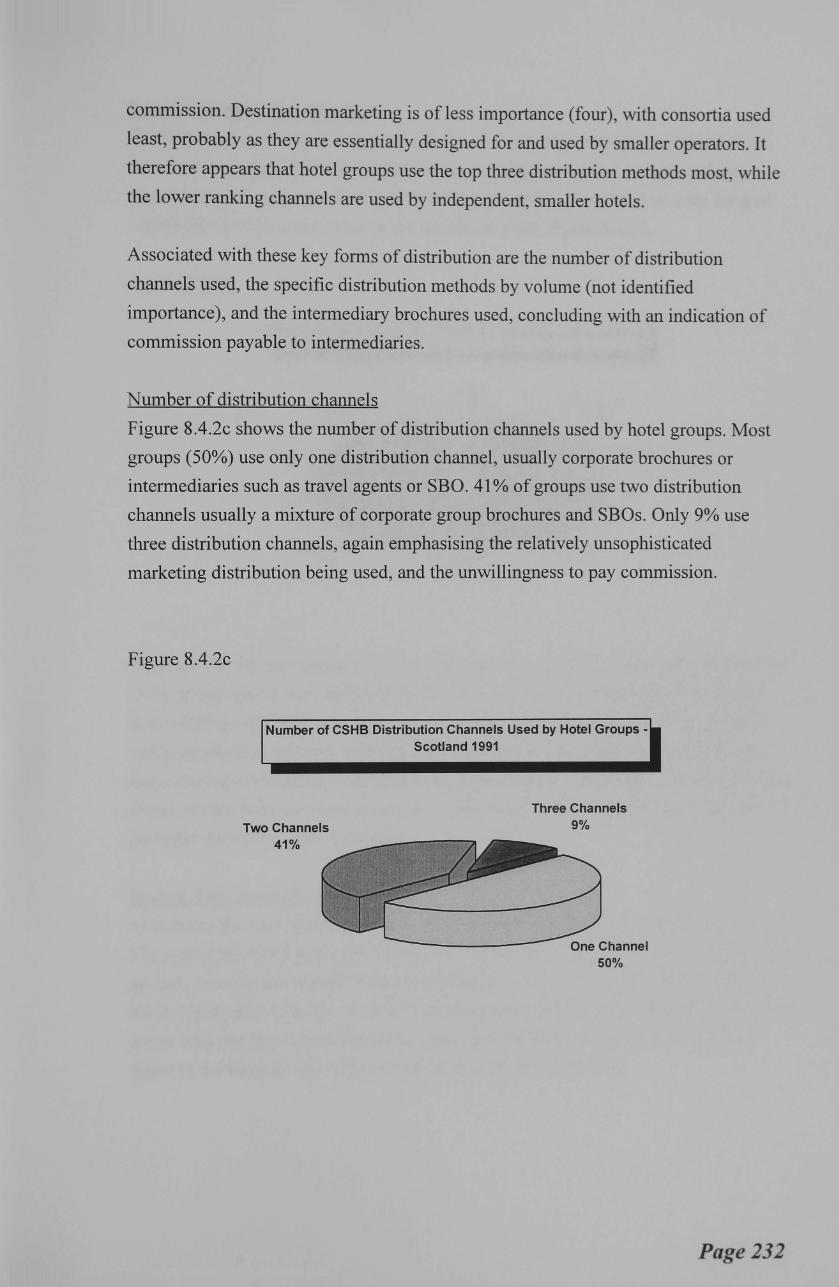
commission. Destination marketing is of less importance (four), with consortia used
least, probably as they are essentially designed for and used by smaller operators. It
therefore appears that hotel groups use the top three distribution methods most, while
the lower ranking channels are used by independent, smaller hotels.
Associated with these key forms of distribution are the number of distribution
channels used, the specific distribution methods by volume (not identified
importance), and the intermediary brochures used, concluding with an indication of
commission payable to intermediaries.
Number of distribution channels
Figure 8.4.2c shows the number of distribution channels used by hotel groups. Most
groups (50%) use only one distribution channel, usually corporate brochures or
intermediaries such as travel agents or SBO. 41% of groups use two distribution
channels usually a mixture of corporate group brochures and SBOs. Only 9% use
three distribution channels, again emphasising the relatively unsophisticated
marketing distribution being used, and the unwillingness to pay commission.
Figure 8.4.2c
Number of CSHB Distribution Channels Used by Hotel Groups -~ Scotland 1991
Two Channels 41%
Three Channels 9%
50%
Page 232
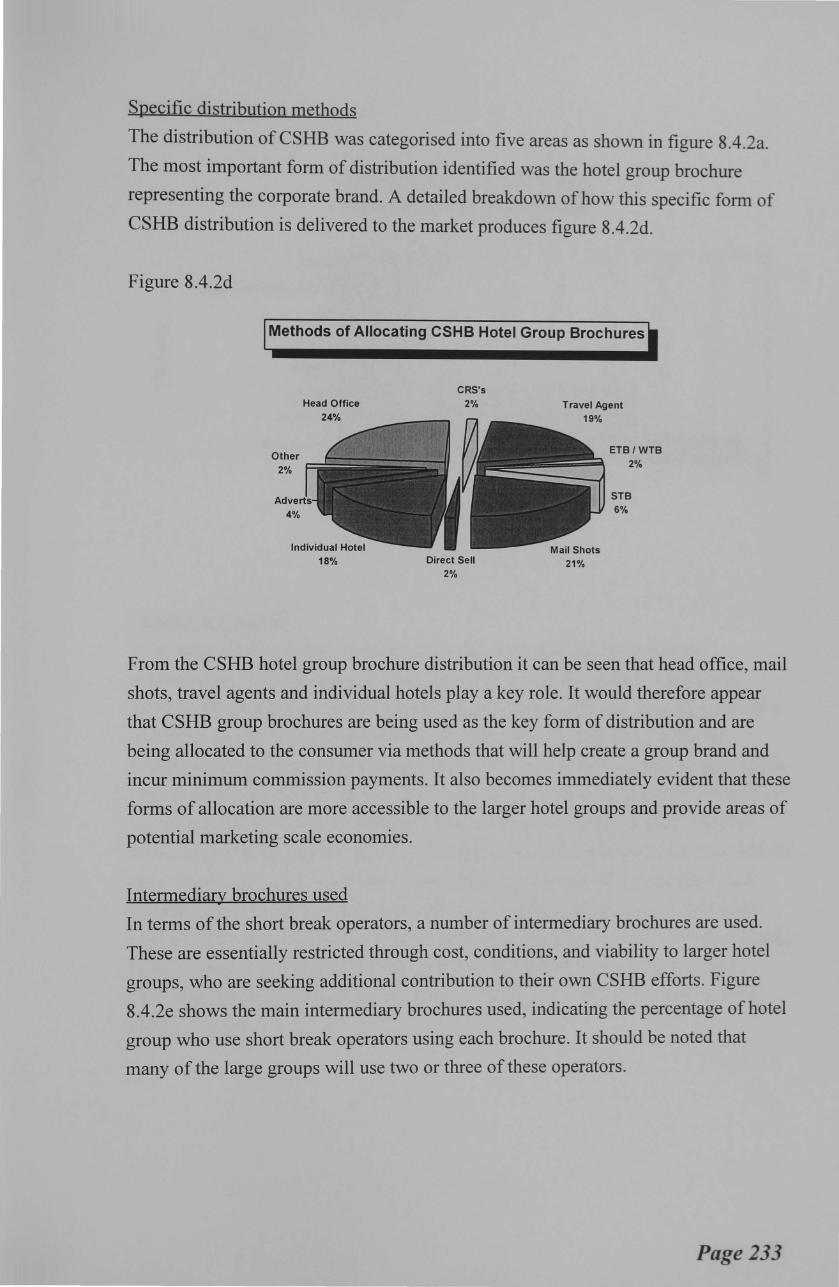
Specific distribution methods
The distribution of CSHB was categorised into five areas as shown in figure 8.4.2a.
The most important form of distribution identified was the hotel group brochure
representing the corporate brand. A detailed breakdown of how this specific form of
CSHB distribution is delivered to the market produces figure 8.4.2d.
Figure 8.4.2d
Methods of Allocating CSHB Hotel Group Brochures
Head Office
18%
CRS"s
2%
Direct Sell 2%
Travel Agent
21%
ETB/WTB
2%
STB 6%
From the CSHB hotel group brochure distribution it can be seen that head office, mail
shots, travel agents and individual hotels play a key role. It would therefore appear
that CSHB group brochures are being used as the key form of distribution and are
being allocated to the consumer via methods that will help create a group brand and
incur minimum commission payments. It also becomes immediately evident that these
forms of allocation are more accessible to the larger hotel groups and provide areas of
potential marketing scale economies.
Intermediary brochures used
In terms of the short break operators, a number of intermediary brochures are used.
These are essentially restricted through cost, conditions, and viability to larger hotel
groups, who are seeking additional contribution to their own CSHB efforts. Figure
8.4.2e shows the main intermediary brochures used, indicating the percentage of hotel
group who use short break operators using each brochure. It should be noted that
many of the large groups will use two or three of these operators.
Page 233
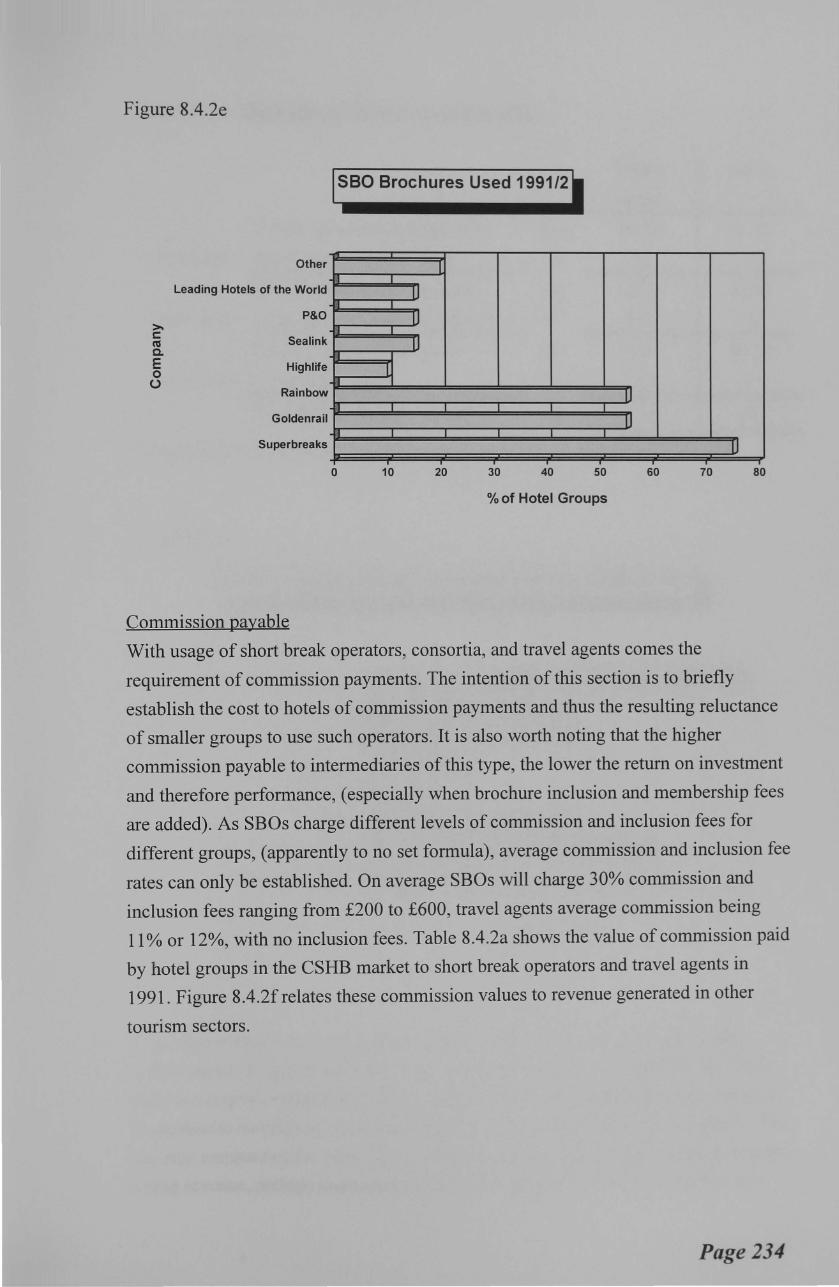
Figure 8.4.2e
Other
Leading Hotels of the World
>c: ns a. E 0 ()
P&O
Sea link
Highlife
Rainbow
Goldenrail
Superbreaks
Commission payable
0
SBO Brochures Used 1991/2
I
fJ
fJ
rJ
IJ
IJ
IJ
u 10 20 30 40 50 60 70 80
%of Hotel Groups
With usage of short break operators, consortia, and travel agents comes the
requirement of commission payments. The intention of this section is to briefly
establish the cost to hotels of commission payments and thus the resulting reluctance
of smaller groups to use such operators. It is also worth noting that the higher
commission payable to intermediaries of this type, the lower the return on investment
and therefore performance, (especially when brochure inclusion and membership fees
are added). As SBOs charge different levels of commission and inclusion fees for
different groups, (apparently to no set formula), average commission and inclusion fee
rates can only be established. On average SBOs will charge 30% commission and
inclusion fees ranging from £200 to £600, travel agents average commission being
11% or 12%, with no inclusion fees. Table 8.4.2a shows the value of commission paid
by hotel groups in the CSHB market to short break operators and travel agents in
1991. Figure 8.4.2frelates these commission values to revenue generated in other
tourism sectors.
Page 234

Table 8.4.2a: The Value ofCSHB Commission 1991
Travel SBOs
Agent
CSHB spend in Scotland 1991 £m 56.25 56.25 (multiply) Hotel groups market share % 76 76
CSHB spend in hotel groups £m 42.75 42.75 (multiply) Hotel groups using T A or SBO % 87.5 94
Possible spend attributable £m 37.41 40.18 (multiply) Commission level % 10.8 30
Potential commission payable * £m 4.04 12.02
* includes double counting, only to be used as a reference point.
Figure 8.4.2f
Value of CSHB Commission and Market Segments- Scotland 1991
TOTAL SELF-CATERING SECTOR l
Caravans u Private B&B IJ
Rented villa I Holiday village u
Camping 0 SBO commission I
Travel agent commission l
0 2 4 6 8 10 12 14 16
£s Million Revenue
From figure 8.4.2f it is clear that the potential value of commission alone in the
CSHB market is greater than the revenue generated by many tourism sectors. While
there is a degree of double counting and ratios are never accurate, the purpose here is
to emphasise commission payment value. These figures therefore act as a guide. This
not only emphasises the value of the CSHB market but shows where hotel groups are
losing revenue, perhaps unnecessarily to SBO. Hotel groups need to develop more
Page 235
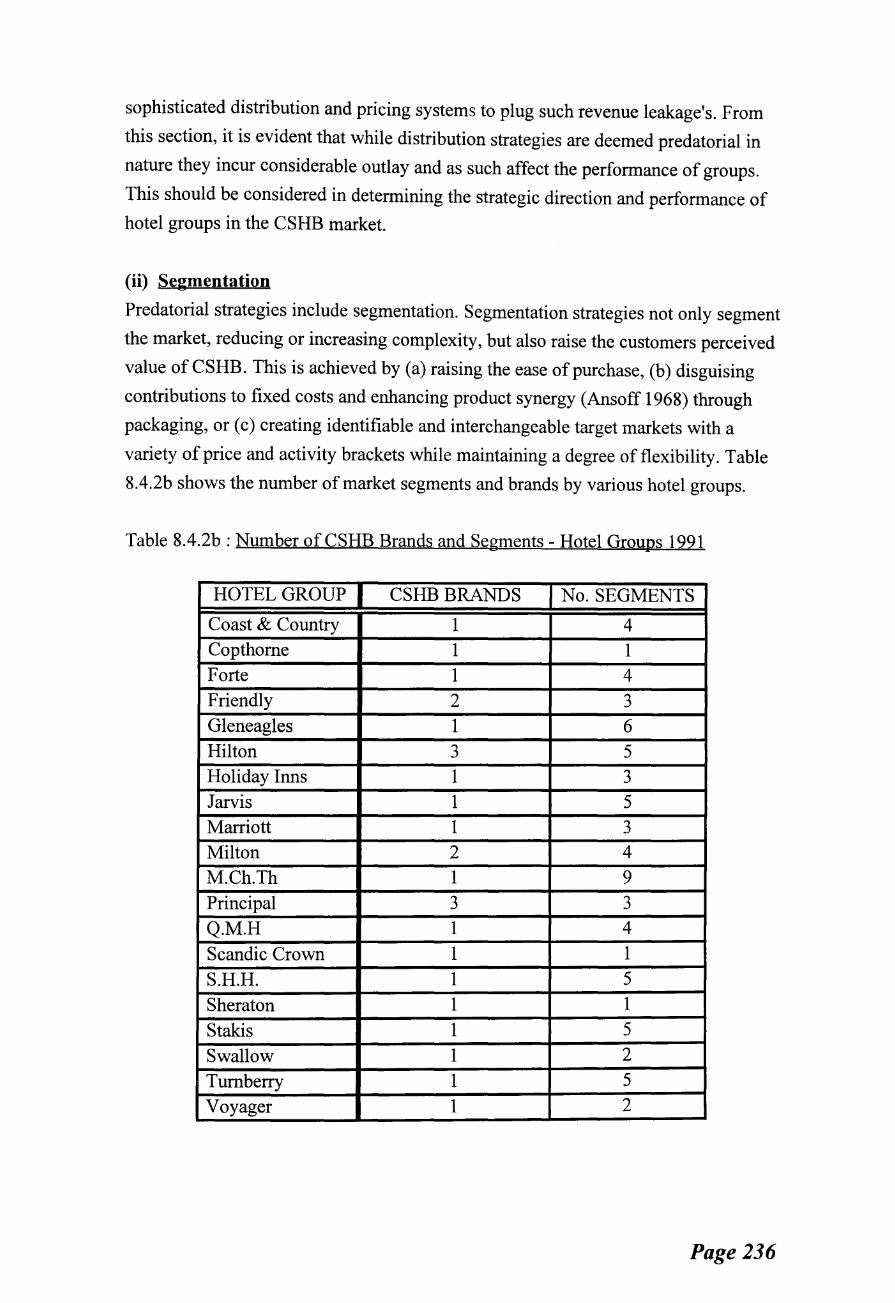
sophisticated distribution and pricing systems to plug such revenue leakage's. From
this section, it is evident that while distribution strategies are deemed predatorial in
nature they incur considerable outlay and as such affect the performance of groups.
This should be considered in determining the strategic direction and performance of
hotel groups in the CSHB market.
(ii) Segmentation
Predatorial strategies include segmentation. Segmentation strategies not only segment
the market, reducing or increasing complexity, but also raise the customers perceived
value ofCSHB. This is achieved by (a) raising the ease of purchase, (b) disguising
contributions to fixed costs and enhancing product synergy (Ansoff 1968) through
packaging, or (c) creating identifiable and interchangeable target markets with a
variety of price and activity brackets while maintaining a degree of flexibility. Table
8.4.2b shows the number of market segments and brands by various hotel groups.
Table 8.4.2b :Number of CSHB Brands and Segments- Hotel Groups 1991
HOTEL GROUP CSHBBRANDS No. SEGMENTS
Coast & Country 1 4 Copthorne 1 1 Forte 1 4 Friendly 2 3 Gleneagles 1 6 Hilton 3 5 Holiday Inns 1 3 Jarvis 1 5 Marriott 1 3
Milton 2 4
M.Ch.Th 1 9
Principal 3 3
Q.M.H 1 4
Scandic Crown 1 1
S.H.H. 1 5
Sheraton 1 1
Stakis 1 5
Swallow 1 2
Tum berry 1 5
Voyager 1 2
Page 236
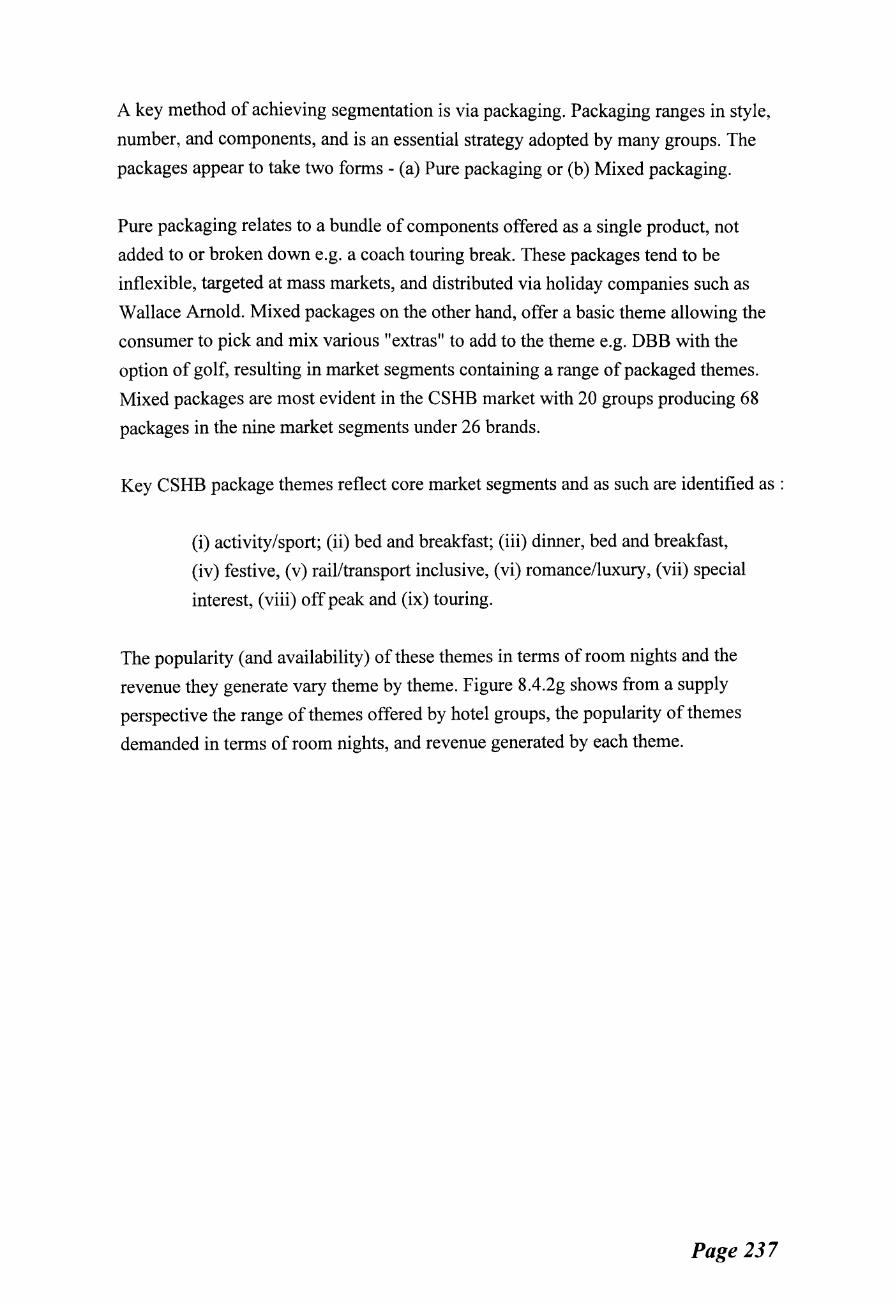
A key method of achieving segmentation is via packaging. Packaging ranges in style,
number, and components, and is an essential strategy adopted by many groups. The
packages appear to take two forms- (a) Pure packaging or (b) Mixed packaging.
Pure packaging relates to a bundle of components offered as a single product, not
added to or broken down e.g. a coach touring break. These packages tend to be
inflexible, targeted at mass markets, and distributed via holiday companies such as
Wallace Arnold. Mixed packages on the other hand, offer a basic theme allowing the
consumer to pick and mix various "extras" to add to the theme e.g. DBB with the
option of golf, resulting in market segments containing a range of packaged themes.
Mixed packages are most evident in the CSHB market with 20 groups producing 68
packages in the nine market segments under 26 brands.
Key CSHB package themes reflect core market segments and as such are identified as :
(i) activity/sport; (ii) bed and breakfast; (iii) dinner, bed and breakfast,
(iv) festive, (v) rail/transport inclusive, (vi) romance/luxury, (vii) special
interest, (viii) off peak and (ix) touring.
The popularity (and availability) of these themes in terms of room nights and the
revenue they generate vary theme by theme. Figure 8.4.2g shows from a supply
perspective the range of themes offered by hotel groups, the popularity of themes
demanded in terms of room nights, and revenue generated by each theme.
Page 237

Figure 8.4.2g
CSHB Theme Hotel Group Supply, Demand and Revenue Generation-~ Scotland 1991
Revenue Generation
Demand (Room Nights)
Supply (Hotel Groups)
0% 10% 20% 30% 40% 50% 60% 70% 80% 90% 100%
%
0 Activity I sport 0 Bed & breakfast 0 Dinner, bed & 0 Festive breakfast
0 Rail/ transport • Romance I luxury
Special interest Ill Touring
•ott peak
If one presumes that figure 8.4.2g represents a single hotel group then the CSHB sales
mix offered can be seen to consist primarily of special interest, dinner bed and
breakfast, and activity/sport breaks. However, the consumer demands dinner bed and
breakfast and touring breaks. Revenue generated reflects the consumer demand. This
would imply that suppliers are expanding the range of segments beyond basic
consumer demand. Packaging strategies can therefore be seen as attempts to segment
the market further to raise complexity for competitors. This is essentially achieved by
catering for the consumers core CSHB requirements in the form of dinner, bed and
breakfast and then seeking additional market share by offering the consumer a new
experience hence the wide range of special interest, and sport and activity breaks.
Hotel groups adopting a packaging strategy will therefore develop packages within
the key themes. As such, packages are created and abolished with great frequency
making it difficult to establish an exact number of packages at any particular time.
With the development of packages and the attempts of groups to obtain the best
package or product mix there is an obvious need by groups to ensure the components
of the package are correctly mixed and assembled. The package components are
resources that have varying degrees of availability or may cost a considerable outlay
to supply. Hence package components can be analysed with more ease as they will be
more evident and long lasting in nature, with their mix changing, not the package
Page 238
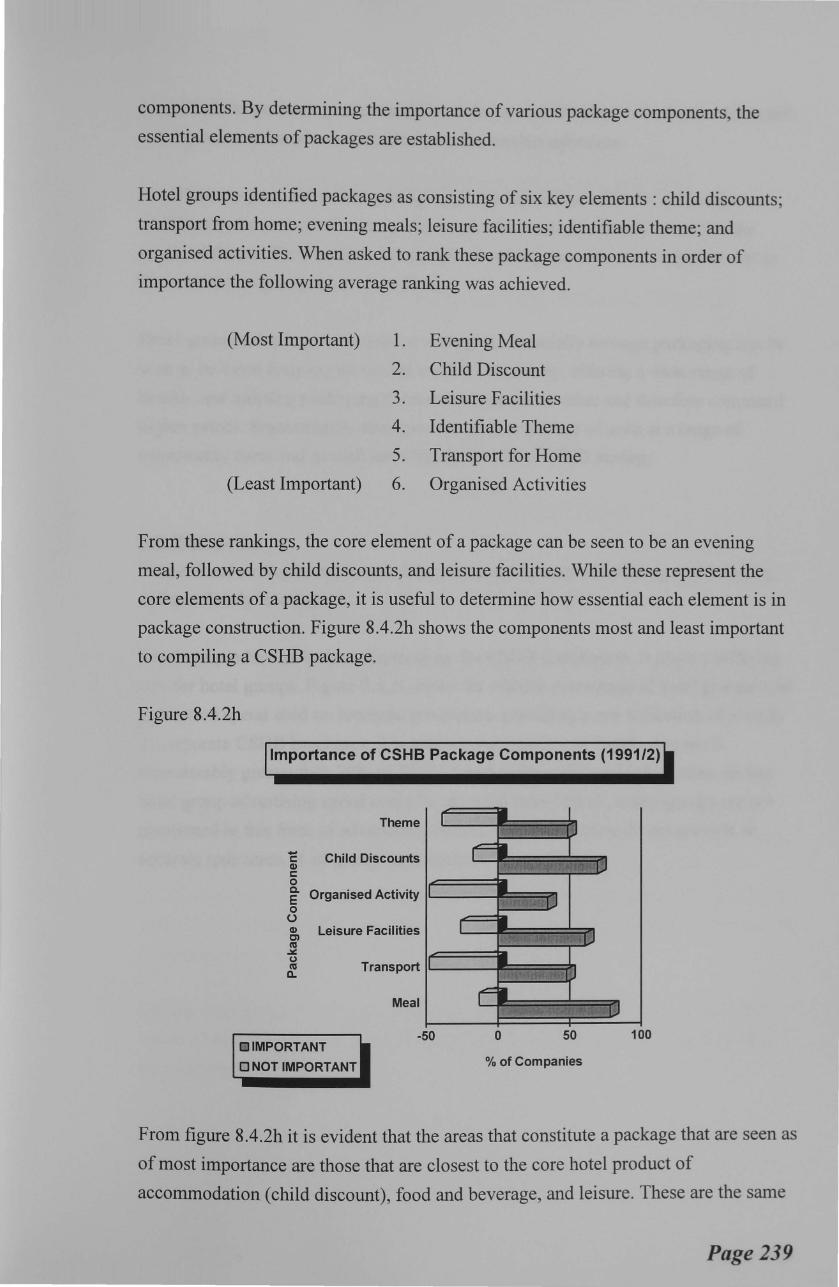
components. By determining the importance of various package components, the
essential elements of packages are established.
Hotel groups identified packages as consisting of six key elements : child discounts;
transport from home; evening meals; leisure facilities; identifiable theme; and
organised activities. When asked to rank these package components in order of
importance the following average ranking was achieved.
(Most Important) 1. Evening Meal
2. Child Discount
3. Leisure Facilities
4. Identifiable Theme
5. Transport for Home
(Least Important) 6. Organised Activities
From these rankings, the core element of a package can be seen to be an evening
meal, followed by child discounts, and leisure facilities. While these represent the
core elements of a package, it is useful to determine how essential each element is in
package construction. Figure 8.4.2h shows the components most and least important
to compiling a CSHB package.
Figure 8.4.2h
Importance of CSHB Package Components (1991/2)
Theme
i: Child Discounts Q) c: 0
~ Organised Activity 0 u Ill Leisure Facilities C) ns .X c.> ~ Transport
Meal
-50 OIMPORTANT
0 NOT IMPORTANT
I
I
·: -;.;·,: ·· I :J
F • '• ;, ! ' ",•: .~f'i-··· tJ
I·. . LJ -,,, , .. , ., •. '1)
• ., '•/ :-!.• 1.:.1
r • ,. . ... ' .,;;·1)
0 50 100
%of Companies
From figure 8.4.2h it is evident that the areas that constitute a package that are seen as
of most importance are those that are closest to the core hotel product of
accommodation (child discount), food and beverage, and leisure. These are the same
Page 239
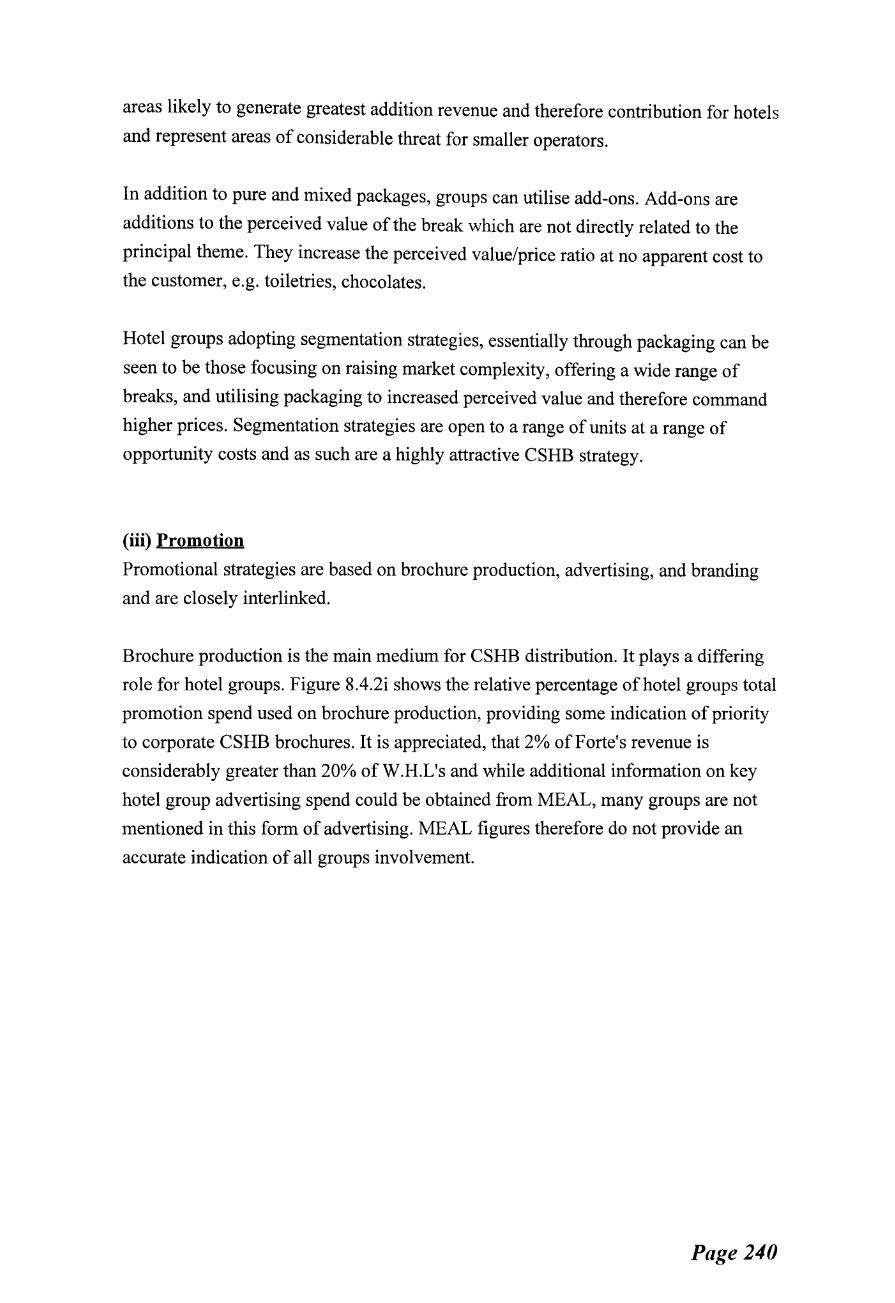
areas likely to generate greatest addition revenue and therefore contribution for hotels
and represent areas of considerable threat for smaller operators.
In addition to pure and mixed packages, groups can utilise add-ons. Add-ons are
additions to the perceived value of the break which are not directly related to the
principal theme. They increase the perceived value/price ratio at no apparent cost to
the customer, e.g. toiletries, chocolates.
Hotel groups adopting segmentation strategies, essentially through packaging can be
seen to be those focusing on raising market complexity, offering a wide range of
breaks, and utilising packaging to increased perceived value and therefore command
higher prices. Segmentation strategies are open to a range of units at a range of
opportunity costs and as such are a highly attractive CSHB strategy.
(iii) Promotion
Promotional strategies are based on brochure production, advertising, and branding
and are closely interlinked.
Brochure production is the main medium for CSHB distribution. It plays a differing
role for hotel groups. Figure 8.4.2i shows the relative percentage of hotel groups total
promotion spend used on brochure production, providing some indication of priority
to corporate CSHB brochures. It is appreciated, that 2% of Forte's revenue is
considerably greater than 20% of W.H.L's and while additional information on key
hotel group advertising spend could be obtained from MEAL, many groups are not
mentioned in this form of advertising. MEAL figures therefore do not provide an
accurate indication of all groups involvement.
Page 240
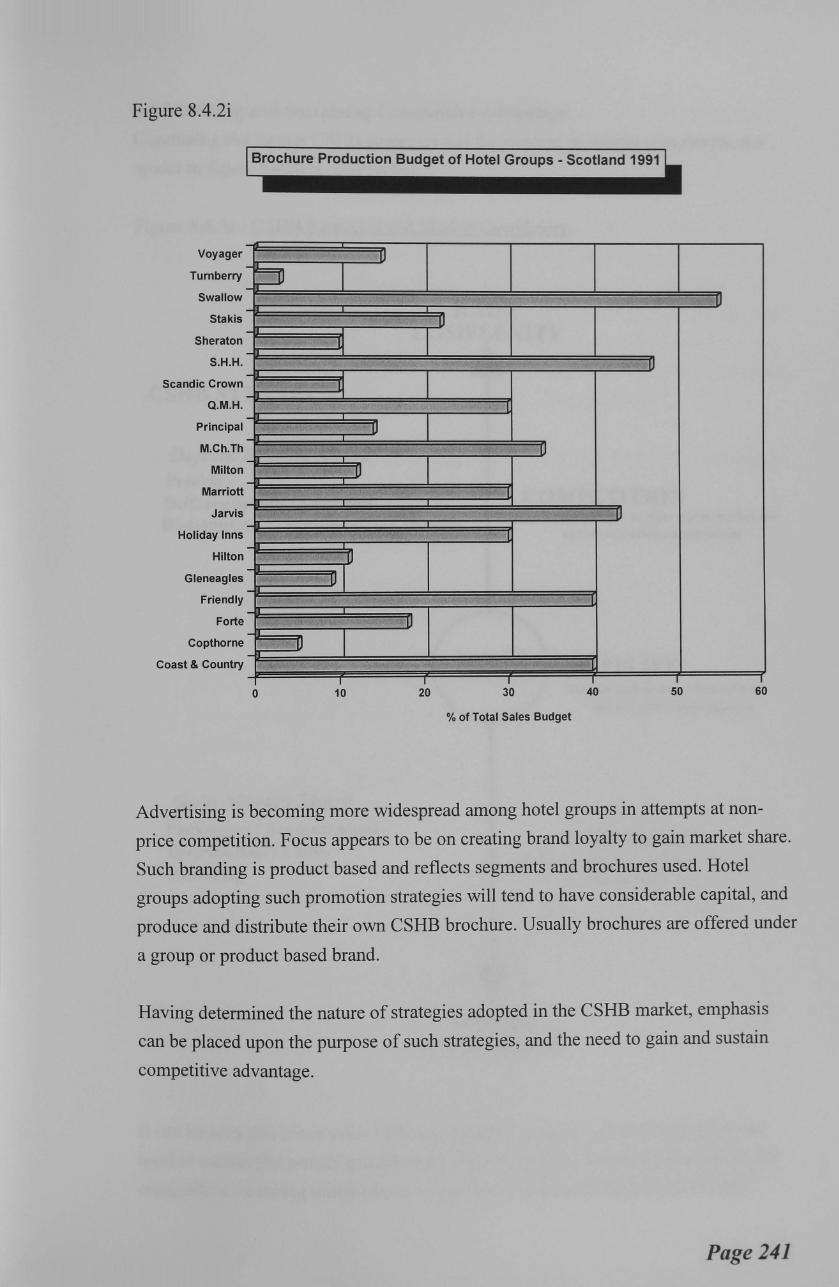
Figure 8.4.2i
Voyager
Turn berry
Swallow
Stakis
Sheraton
S.H.H.
Scandic Crown
Q.M.H.
Principal
M.Ch.Th
Milton
Marriott
Jarvis
Holiday Inns
Hilton
Gleneagles
Friendly
Forte
Copthorne
Coast & Country
-
Brochure Production Budget of Hotel Groups - Scotland 1991
IJ
~ I u
[J
u -u
lJ
l
u u
u - l
IJ
-, lJ
lJl I
u IJ I
l I I I I I I
0 10 20 30 40 50 60
% of Total Sales Budget
Advertising is becoming more widespread among hotel groups in attempts at non
price competition. Focus appears to be on creating brand loyalty to gain market share.
Such branding is product based and reflects segments and brochures used. Hotel
groups adopting such promotion strategies will tend to have considerable capital, and
produce and distribute their own CSHB brochure. Usually brochures are offered under
a group or product based brand.
Having determined the nature of strategies adopted in the CSHB market, emphasis
can be placed upon the purpose of such strategies, and the need to gain and sustain
competitive advantage.
Page 241
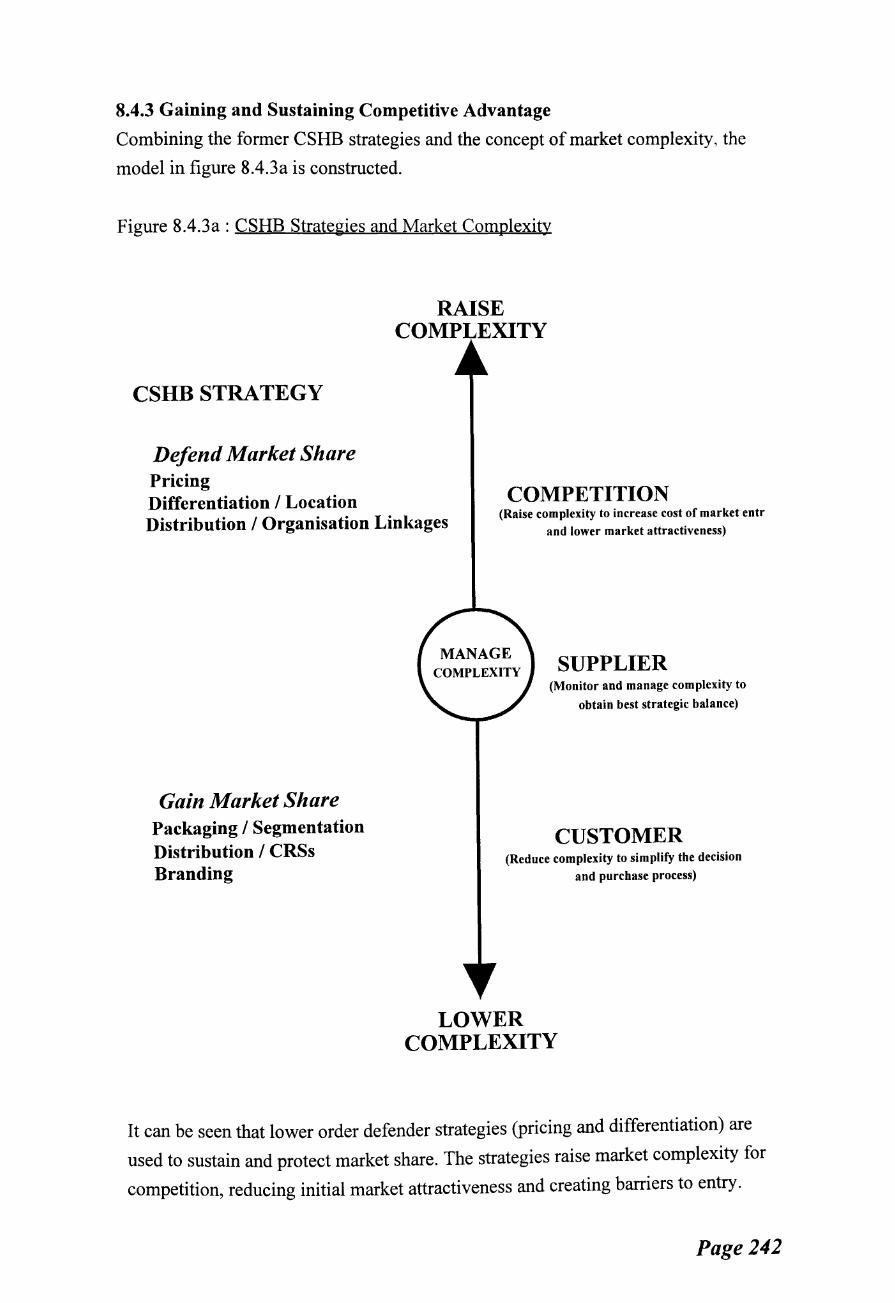
8.4.3 Gaining and Sustaining Competitive Advantage
Combining the former CSHB strategies and the concept of market complexity, the
model in figure 8.4.3a is constructed.
Figure 8.4.3a : CSHB Strategies and Market Complexity
CSHB STRATEGY
Defend Market Share Pricing
RAISE
Differentiation I Location Distribution I Organisation Linkages
COMPETITION (Raise complexity to increase cost of market entr
and lower market attractiveness)
Gain Market Share Packaging I Segmentation Distribution I CRSs Branding
SUPPLIER (Monitor and manage complexity to
obtain best strategic balance)
CUSTOMER (Reduce complexity to simplify the decision
and purchase process)
LOWER COMPLEXITY
It can be seen that lower order defender strategies (pricing and differentiation) are
used to sustain and protect market share. The strategies raise market complexity for
competition, reducing initial market attractiveness and creating barriers to entry.
Page 242
Organisation linkages as an element of distribution are also present at the operational
level allowing synergistic advantage. However, distribution strategies are essentially
predatorial in nature as they seek to gain further market share, usually via a CRS.
The higher order predator strategies are used to gain market share by managing
complexity e.g. simplifying the purchase decision for the consumer, and maximising
achievable marginal contributions. This is achieved by segmenting the market and
packaging the CSHB thus providing specific segments with the desired product. The
complexities of implementing such strategies are managed through the use of
distribution strategies - essentially CRS or intermediaries - and branding allowing the
consumer to easily recognise the product and develop brand loyalty.
Table 8.4.3a summarises the prime strategies adopted by various groups operating in
the CSHB market.
Table 8.4.3a : Prime Strategies Summarised
Category Prime Strategy No.Groups
Distribution 6
Predator Segmentation/Packaging 6
Promotion 6
Defender Pricing 2
Differentiation 0
Summary
Strategies adopted by major companies vary across market segments, and appear to be
relatively primitive. The packaging component appears to be the most developed.
While pricing, and differentiation exist, these seem to act more as barriers to entry,
with value chain linkages creating cost economies (essentially in the area of CRS) for
widening and targeting markets, reducing commission payable, and using packaging
to gain additional market share.
CSHB strategies are adopted by a wide range of companies, all with differing levels
of ownership, cost structure, location, market level, and tariff, yet some companies
perform significantly better in the market than others. The next chapter seeks to
establish performance categories of the hotel groups to allow relationships between
Page 243
performance, and strategy and structure variables to be established. However, to allow
analysis of hotel groups in terms of identifying areas of structure, strategy,
performance relationships requires the organisation of complex data on strategy into
manageable units. When examining strategy, a widely accepted method of doing this
is to collect hotel groups adopting the same or similar strategies into overall
encompassing groups, termed strategic groups.
The next section establishes the concept of strategic groups and which hotel groups
belong to which strategic groups, in relation to structure and strategy variables (Edgar
et al1994).
8.5 STRATEGIC GROUPS AND STRATEGIC SPACE
The concept of a strategic "group" of firms, defined as a set of firms competing within
an industry on the basis of similar combinations of scope (Cool & Schendel 1987),
customer patronage (Harrigan 1985), and commonalty of strategies (Hunt 1972,
Caves & Porter 1977), provides a framework for determining the relationship between
strategy, structure, and performance within and between industries (Dess & Davis
1984, Hergert 1983, Barney & Hoskisson 1990).
Since Hunt (1972) introduced the term "strategic groups", a growing body of literature
has adopted this analytical concept to determine relationships between industry
competitors (Porter 1980, Hatten 1974, Cool1985, McGee & Thomas 1986).
Such studies have been further developed to demonstrate performance linkages
(Newman 1978, Kotabe & Duhan 1993) and to suggest forms of competitive
benchmarking through strategic modelling (Kumar, Fiegenbaum & Thomas 1990) and
frameworks for group formation (Fiegenbaum & Thomas 1990).
Although Meyer and Rowan (1977) identified that organisations are adaptable and
will try to adapt to environmental changes, little research has been undertaken in the
dynamics of this field. Mascarenhas (1989) provides some direction in this area by
establishing the three types of strategic change, essentially representing movement in
strategic space (defined by Fiegenbaum and Thomas 1990 as the map of
characteristics of the competitive environment) linked to economic activity. He
concludes that environment and industry structure may not totally determine strategic
changes. Rather, strategic choice and individual firm characteristics play an important
Page 244
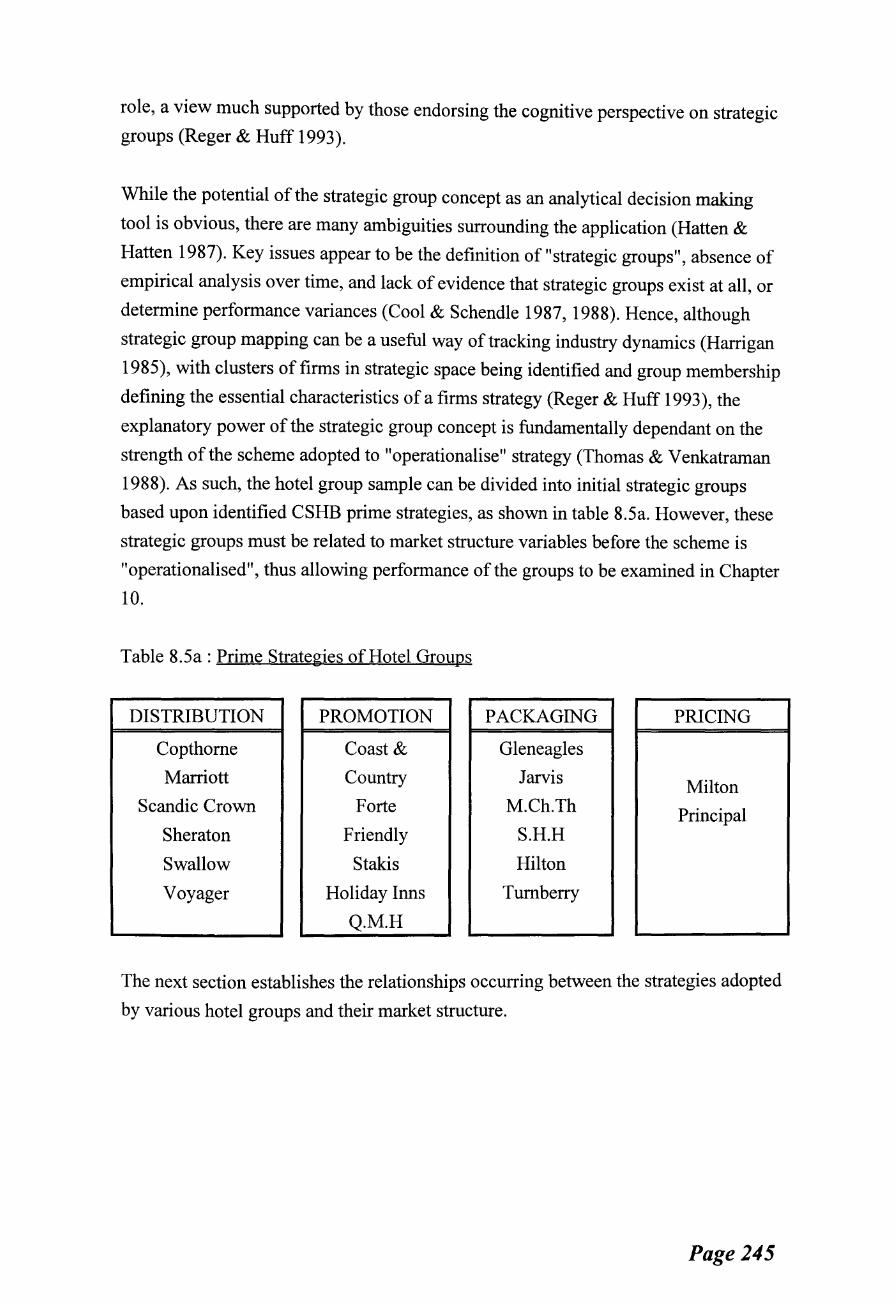
role, a view much supported by those endorsing the cognitive perspective on strategic
groups (Reger & Huff 1993).
While the potential of the strategic group concept as an analytical decision making
tool is obvious, there are many ambiguities surrounding the application (Hatten &
Hatten 1987). Key issues appear to be the definition of "strategic groups", absence of
empirical analysis over time, and lack of evidence that strategic groups exist at all, or
determine performance variances (Cool & Schendle 1987, 1988). Hence, although
strategic group mapping can be a useful way of tracking industry dynamics (Harrigan
1985), with clusters of firms in strategic space being identified and group membership
defining the essential characteristics of a firms strategy (Reger & Huff 1993), the
explanatory power of the strategic group concept is fundamentally dependant on the
strength of the scheme adopted to "operationalise" strategy (Thomas & Venkatraman
1988). As such, the hotel group sample can be divided into initial strategic groups
based upon identified CSHB prime strategies, as shown in table 8.5a. However, these
strategic groups must be related to market structure variables before the scheme is
"operationalised", thus allowing performance of the groups to be examined in Chapter
10.
Table 8.5a : Prime Strategies of Hotel Groups
DISTRIBUTION PROMOTION
Copthome Coast &
Marriott Country
Scandic Crown Forte
Sheraton Friendly
Swallow Stakis
Voyager Holiday Inns
Q.M.H
PACKAGING
Gleneagles
Jarvis
M.Ch.Th
S.H.H
Hilton
Tum berry
PRICING
Milton
Principal
The next section establishes the relationships occurring between the strategies adopted
by various hotel groups and their market structure.
Page 245
8.6 CSHB STRATEGY- STRUCTURE RELATIONSHIPS
The purpose of this section is to identify any areas of correlation between the three
key structural variables established in Chapter 8 and the strategies adopted by hotel
groups.
(i) Structure Variables
The structural determinants have been established as variables relating to market
scope, group size, and sources of competitive advantage. As such, three structure -
strategy group maps are created and conclusions drawn from each.
(ii) Strategy Variables
It has been established that strategy and therefore strategic groups may change with
organisation levels (corporate; business; functional) giving rise to the concept of
"overlapping" strategic groups (Fombrun & Zajac 1987) and that such groups may be
the result of combinations of strategies that are internal or external in orientation
(Wright, Kroll, Chan, & Hamel1991). The research has established what the hotel
groups identify as their prime CSHB strategy with other secondary strategies
supporting the prime. As such, the prime strategies consist of the organisations'
variables that cannot easily be changed (Tang & Thomas 1992) or replicated (mobility
barriers - Caves & Porter 1977), and form the dimension of strategy.
In addition, as hotel companies are multi-site in nature, any analysis of corporate
groups could possibly neglect "the subgroups of firms employing different mixes of
substantially the same strategic variables" (Hatten 1979). This is the subject of
Appendix V, where the model is applied at unit level. For this section, the view of
Miller (1981) is adopted, where the identification oftightly integrated and mutually
supportive parts are best understood by adopting a holistic approach. Hence the prime
strategy of each group are related to market structure. Taking each of the three key
structural variables, and linking them to CSHB strategies adopted by hotel groups the
following strategic groups emerge.
8.6.1 Market Scope - CSHB Strategy
When prime strategy is mapped against market scope, i.e. the number of market
segments targeted, figure 8.6.1a is formed. Each black dot represents a hotel group as
a member of the strategic group formed. The number in the dot corresponds to table
8.6.1a. The results appear clearly grouped.
Page 246
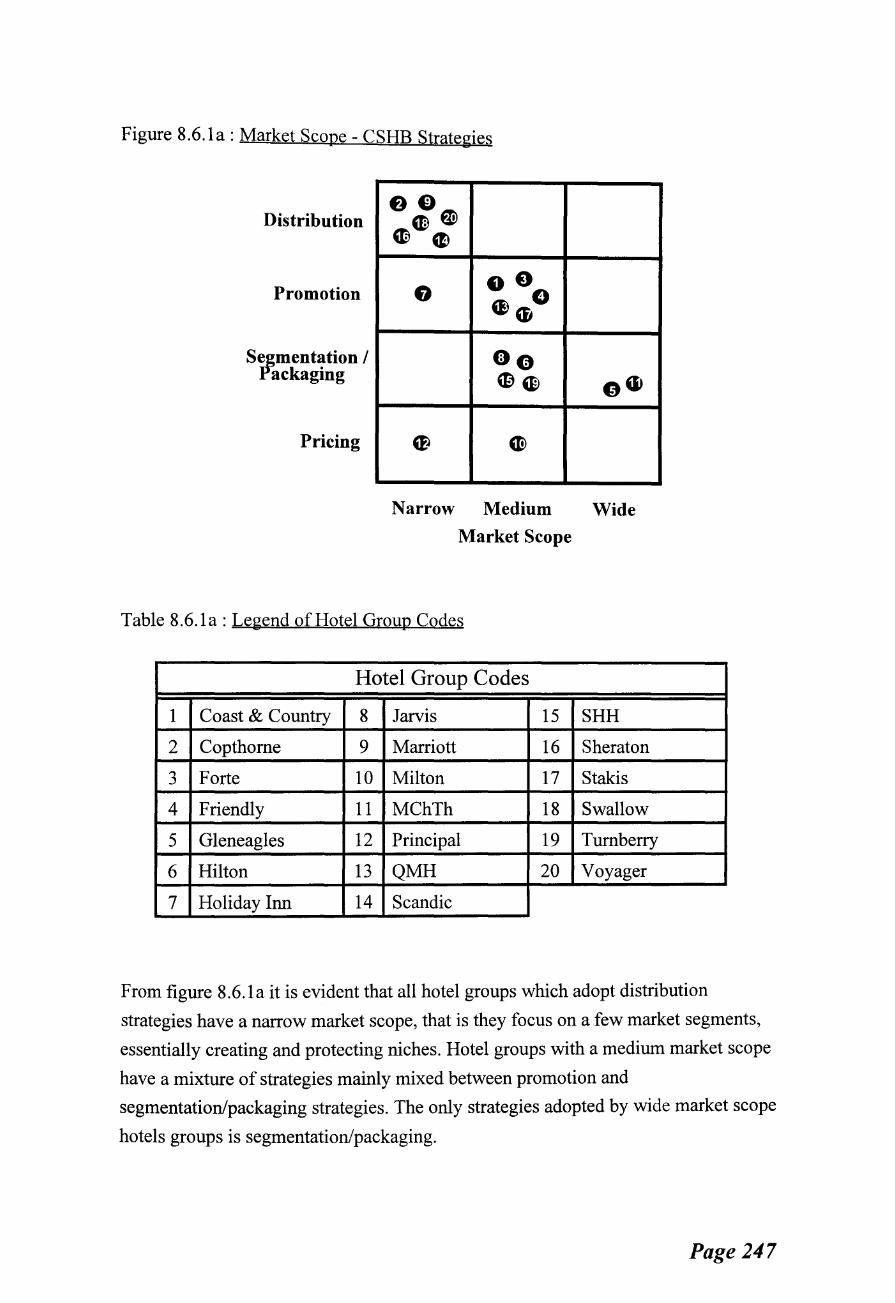
Figure 8.6.1a : Market Scope- CSHB Strategies
Distribution
Promotion
Segmentation I Yackaging
Pricing
eo Gl~
~ ell
G
eEl
eo 0 a>m
eo ~~
Gl
oG
Narrow Medium Wide
Market Scope
Table 8.6.1a: Legend of Hotel Group Codes
Hotel Group Codes
1 Coast & Country 8 Jarvis 15 SHH
2 Copthome 9 Marriott 16 Sheraton
3 Forte 10 Milton 17 Stakis
4 Friendly 11 MChTh 18 Swallow
5 Gleneagles 12 Principal 19 Tum berry
6 Hilton 13 QMH 20 Voyager
7 Holiday Inn 14 Scandic
From figure 8.6.1a it is evident that all hotel groups which adopt distribution
strategies have a narrow market scope, that is they focus on a few market segments,
essentially creating and protecting niches. Hotel groups with a medium market scope
have a mixture of strategies mainly mixed between promotion and
segmentation/packaging strategies. The only strategies adopted by wide market scope
hotels groups is segmentation/packaging.
Page 247
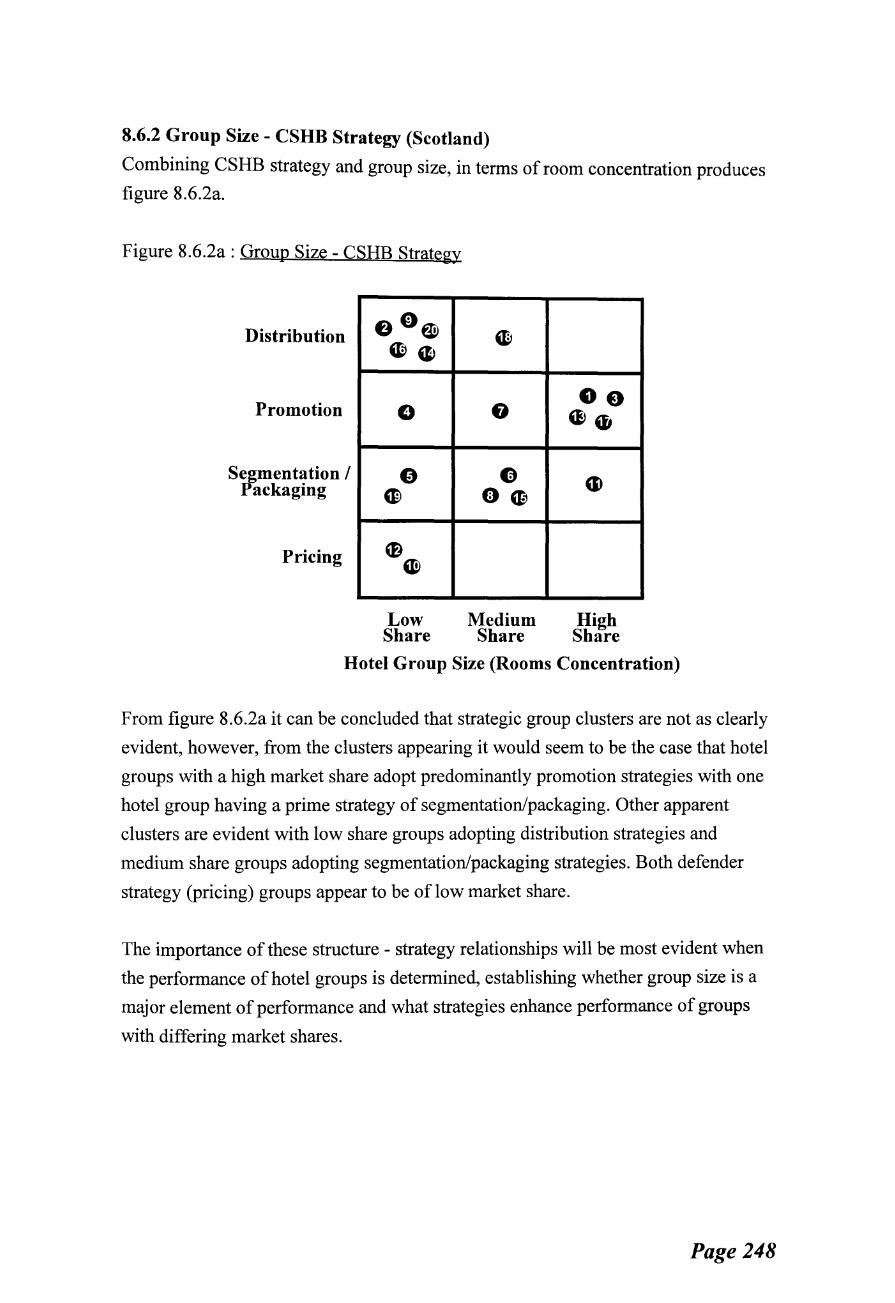
8.6.2 Group Size - CSHB Strategy (Scotland)
Combining CSHB strategy and group size, in terms of room concentration produces
figure 8.6.2a.
Figure 8.6.2a : Group Size - CSHB Strategy
Distribution
Promotion
Segmentation I Packaging
Pricing
e 0 tll ~Q)
0
0 ~
~ ~
Low Share
~
8
0 Oep
Medium Share
eo Gl4f1
G
High Share
Hotel Group Size (Rooms Concentration)
From figure 8.6.2a it can be concluded that strategic group clusters are not as clearly
evident, however, from the clusters appearing it would seem to be the case that hotel
groups with a high market share adopt predominantly promotion strategies with one
hotel group having a prime strategy of segmentation/packaging. Other apparent
clusters are evident with low share groups adopting distribution strategies and
medium share groups adopting segmentation/packaging strategies. Both defender
strategy (pricing) groups appear to be of low market share.
The importance of these structure - strategy relationships will be most evident when
the performance of hotel groups is determined, establishing whether group size is a
major element of performance and what strategies enhance performance of groups
with differing market shares.
Page 248

8.6.3 Sources of Competitive Advantage - CSHB Strategy
From figure 8.6.3a it can be seen that hotel groups adopting promotional strategies
and pricing strategies (defenders) as their prime strategy have few sources of
competitive advantage. Distribution strategies have medium to few sources of
competitive advantage and segmentation strategies have many sources of advantage.
This results in the former strategies being more focused and cost driven, while the
segmentation strategies are more broad, innovative, and are essentially driving and
steering CSHB market development.
Figure 8.6.3a: Sources of Competitive Advantage- CSHB Strategy
Distribution
Promotion
Segmentation I Packaging
Pricing
f.)
~
8 0 G QIG
0
~ @l
Few
~~ ee
e
em 61oG
Avg Many
No. Sources of Competitive Advantage
In summary to this section it would appear that distinct strategies are adopted by
groups relative to certain market structure conditions, with the key structural
determinants seen as group size, segmentation, and sources of advantage. The
question arising is what differences in performance exist between strategies adopted
i.e. the vertical relationship, and between structural variables, i.e. the horizontal
relationship. For example, the difference in performance between hotel groups
adopting a pricing strategy in a narrow scope compared to distribution strategies
would be vertical relationship. The horizontal relationship would be the difference in
performance between hotel groups adopting promotion strategies in a narrow and
medium scope.
Page 249
Once performance relationships are determined in Chapter 10 the potential of moving
in strategic space to enhance performance, can be discussed. Movement in strategic
space is for example a hotel group adopting a promotion strategy with a narrow
market scope trying to either widen market scope or move to a different strategy, or
both - to improve performance. This would cause movement in strategic space. Such
moves in strategic space are fine in theory but in practice they are often not possible
in terms of horizontal moves i.e. changing the structural variables due to mobility and
entry barriers (Caves & Porter 1977, McGee 1985, Mascarenhas & Aaker 1989,
McGee & Thomas 1986, Bain 1956) such as strategic capabilities and resource
availability.
The next stage is therefore to establish if there are any performance differences
between these group clusters and to explore the possibilities of movement between
strategic group clusters, within the constraints of entry and mobility barriers.
Page 250
8.7 CHAPTER SUMMARY
Having explored the structural profile of CSHB markets in Chapter 7. This chapter
has identified the prime strategies adopted by hotel groups in the CSHB market. Such
prime strategies appear to be of two general types : defender strategies designed to
protect market share, and predator strategies designed to gain market share.
In general, strategies adopted by major hotel companies vary between market
segments, and appear relatively primitive. The packaging component is the most
developed.
While branding, pricing, and differentiation strategies exist, these seem to be acting
more as barriers to entry, with packaging being used to gain additional market share.
Various components of the package are mixed to target different market segments. As
such the revenues of packages contribute to fixed costs and return on investment in
varying degrees.
CSHB strategies are adopted by a wide range of companies, all with differing levels
of ownership, cost structure, location, market level, and tariff yet some companies
perform significantly better in the market than others. The correlates of structure and
strategy have determined that distinct strategic groups clusters do emerge. This begs
the question of what performance differences exist between groups on horizontal and
vertical planes, providing clues as to the best strategy-structure mix and identifying
the basic strategic capability of hotel groups. In establishing any performance
linkages of companies adopting specific strategies in the CSHB market in Scotland it
is necessary to determine what measures of performance exist and how hotel groups
are performing in the market. The next chapter explores performance variables before
Chapter 10 constructs a performance model to determine the dynamics of competition
in the CSHB market and establish the driving force behind the successfully
performing companies.
Page 251
REFERENCES
Aldrich, H.E (1979) "Organisations and environments", Prentice Hall Englewood
Cliffs New Jersey
Andrews, K (1972) "The concept of corporate strategy", Irwin Homewood Illinois
Ansoff, H.I (1968) "Corporate strategy : an analytical approach to business policy for
growth and expansion", McGraw-Hill New York
Ayal, I; Zif, J (1979) "Market expansion strategies in multinational marketing",
Journal of Marketing, Spring pp 84-94
Bain, J.S (1956) "Barriers to new competition", Harvard University Press
Cambridge Massachusetts
Barney, J; Hoskisson, R (1990) "Strategic groups: untested assertions and research
proposals", Managerial and Decision Economics, 11 pp 187-198
Bloom, P.N; Kotler, P (1975) "Strategies for high market share companies",
Harvard Business Review, November I December pp 38-47
Boschken, H.L (1990) "Strategy and structure: reconceiving the relationship",
Journal of Management, 16(1) pp 135-150
Boston Consulting Group (1972) "Perspectives on experience. 1968. 1970. 1972",
BCGLtd.
Bourgeois, L.J (1981) "On the measurement of organisational slack", Academy of Management Review, 6(1) January pp 29-39
Bourgeois, L.J; Astley, W. G ( 1979) "A strategic model of organisational conduct and
performance", International Studies of Organisation and Management, 9(3)
pp 40-66
Bourgeois, L.J (1980) "Strategy and environment : a conceptual integration",
Academy of Management Review, 5(1) pp 25-39
Brathwaite, R (1992) "Value-chain assessment of the travel experience", The Cornell HRA Quarterly, October pp 41-49
Bronder, C; Pritzl, R (1992) "Developing strategic alliances : a conceptual framework
for successful co-operation", European Management Journal, 10(4) pp 412-
421
Burns, T; Stalker, G (1961) "The management of innovation", Tavistock London
Caves, R; Porter, M.E (1977) "From entry barriers to mobility barriers", Quarterly Journal of Economics, 91 May pp 241-261
Chandler, A.D (1962) "Strategy and structure: chapters in the history of the
industrial enterprise", Cambridge Massachusetts MIT Press
Page 252
Crichton, E; Edgar, D.A (1995) "Managing market complexity for competitive
advantage : an IT perspective", International Journal of Contemporary Hospitality Management, 7(2/3) pp 12-19
Cool, K (1985) "Strategic group formation and strategic group shifts :a longitudinal
analysis ofthe us pharmaceutical industry. 1963-1982", Unpublished doctoral
dissertation, Purdue University West Lafayette, Indiana
Cool, K; Schendel, D (1987) "Strategic group formation and performance: the case
of the US pharmaceutical industry", Management Science, 33 (9) Sept pp
1102-1124
Cool, K; Schendel, D (1988) "Performance differences among strategic group
members", Strategic Management Journal, 9 pp 207-223
Day, G.S; Wensley, R (1988) "Assessing advantage: a framework for diagnosing
competitive superiority", Journal of Marketing, 52(2) pp 1-20
Dess, G; Davis, P (1984) "Porter's (1980) generic strategies as determinants of
strategic group membership and organisation performance", Academy of Management Journal, 27 pp 467-488
Dev, C.S; Klein, S (1993) "Strategic alliances in the hotel industry", The Cornell HRA Quarterly, 34(1) February pp 42-45
Dev, C.S (1990) "Marketing practices ofhotel chains", The Cornell HRA Quarterly, November pp 54-63
Dev, C.S; Brown, J.R (1990) "Marketing strategy~ vertical structure~ and performance
in the lodging industry : a contingency approach", International Journal of Hospitality Management, 9(3) pp 269-282
Dollar, D (1993) "Technological differences as a source of competitive advantage",
AEA Papers and Proceedings, 83(2) May pp 520-525
Duncan, R.B (1972) "Characteristics of organisational environments and perceived
environmental uncertainty", Administrative Science Quarterly, 17 pp 313-
327
Dutta, D.M (1991) "Relevance of product mix strategy in tourism marketing",
Annals Tourism Research, 18(3) pp 496-499
Edgar, D; Litteljohn, D.L; Allardyce, M; Wanhill, S (1994) "Commercial short
holiday breaks :the relationship between market structure. competitive
advantage~ and performance", Tourism : the State of the Art Wiley & Sons
Chichester pp 323-342
Edgar, D; Litteljohn, D.L (1994) "Strategic groups and strategic space :the case of
the UK short break market", International Journal of Contemporary Hospitality Management, 6(5) pp 20-26
Page 253
Erramilli, M.K (1989) "Entry mode choice in service industries", International Marketing Review, 7(5) pp 50-62
Feltenstein, T (1992) "Strategic planning for the 1990's : exploiting the inevitable",
The Cornell HRA Quarterly, June pp 50-54
Fiegenbaum, A; Thomas, H (1990) "Strategic groups and performance: the US
insurance industry. 1970-84", Strategic Management Journal, 11 pp 197-215
Flamholtz, E.G (1979) "Toward a psycho-technical systems paradigm of
organisational measurement", Decision Sciences, 10(1) January pp 71-84
Fombrun, C; Zajac, E (1987) "Structural and perceptual influences on intraindustry
stratification", Academy of Management Journal, 30 pp 33-50
Galbraith, C; Schendel, D (1983) "An empirical analysis of strategy types", Strategic Management Journal, 4 pp 153-173
Ginsberg, A (1984) "Operationalising organisational strategy: toward an integrative
framework", Academy of Management Review, 9(3) July pp 548-557
Godfrey, K (1992) "In search of identity", Caterer & Hotelkeeper, 6 April pp 56-
57
Hambrick, D.C (1980) "Operationalising the concept of business level strategy in
research", Academy of Management Review, 5(4) October pp 567-575
Hambrick, D.C (1983)(a) "Some tests of the effectiveness and functional attributes of
Miles and Snow's strategic types", Academy of Management Review, 26(1)
March pp 5-26
Hambrick, D.C (1983)(b) "High profit strategies in mature capital goods industries",
Academy of Management Review, 26(1) March pp 567-576
Hamermesh, R.G; Silk, S.B (1979) "How to compete in stagnant industries",
Harvard Business Review, September I October pp 56-63
Hamermesh, R.G; Anderson, M.J; Harris, J.E (1978) "Strategies for low market share
business", Harvard Business Review, May I June pp 48-55
Harrigan, K (1985) "An application of clustering for strategic group relationships",
Strategic Management Journal, 6 pp 55-73
Harrigan, K.R (1980) "Strategies for declining business", Lexington Massachusetts
Heath
Hatten, K (1974) "Strategic models in the brewing industry", PhD dissertation
Purdue University West Lafayette Indiana
Hatten, K (1979) "Quantitative research methods in strategic management". (In
Schendel) "Strategic Management : A New View of Business Policy and
Planning", Little, Brown and Co. Boston,
Hatten, K; Hatten, M (1987) "Strategic groups~ asymmetrical mobility barriers and
contestibility", Strategic Management Journal, 8 pp 329-342
Page 254
Henderson, B ( 1979) "Henderson on corporate strategy", Abt Books Cambridge
Massachusetts
Hergert, M (1983) "The incidence and implications of strategic grouping in us
manufacturing industries", Unpublished Doctoral Dissertation, Harvard
University
Hergert, H; Morris, D (1989) "Accounting data for value chain analysis", Strategic Management Journal, 10 pp 175-188
Hitt, M.A; Ireland, R.D (1986) "Relationships among corporate level distinctive
competence. diversification~ strategy. corporate structure and performance",
Journal of Management Studies, 23(4) pp 401-416
Hoffer, C.W; Schendel, D.E (1978) "Strategy formulation: analytical concepts",
West Publishing St. Paul
Horvarth, D; McMillan, C.J (1979) "Strategic choice and the structure of decision
processes", International Studies of Organisation and Management, 9(3) pp
87-112
Hrebiniak, L (1980) "Implementing global strategies", European Management Journal, 10(4) December pp 392-403
Hummels, D; Levinsohn, J (1993) "Product differentiation as a source of competitive
advantage", AEA Papers and Proceedings, 83(2) May pp 445-449
Hunt, M (1972) "Competition in the home appliance industry 1960-1970",
Unpublished PhD Dissertation, Business Economics Committee, Harvard
University, May
Kotabe, M; Duhan, D (1993) "Strategy clusters in Japanese markets: firm
performance implications", Journal of the Academy of Marketing Science, 21(1) Winter pp 21-31
Kumar, K; Thomas, H; Fiegenbaum, A (1990) "Strategic groupings as competitive
benchmarks for formulating competitive strategy", Managerial and Decision Economics, 11 pp 99-109
Leamer, E.E (1993) "Factor supply differences as a source of competitive
advantage", AEA Papers and Proceedings, 83(2) May pp 435-439
Mascarenhas, B (1989) "Strategic group dynamics", Academy of Management Journal, 32(2) pp 333-352
Mascarenhas, B; Aaker, D (1989) "Mobility barriers and strategic groups", Strategic Management Journal, 10 pp 475-485
McDaniel, S.W; Kolari, J.W (1987) "Marketing strategy implications ofthe Miles
and Snow strategic typology", Journal of Marketing, 51(4) October pp 19-
30
Page 255
McDonald, M ( 1993) "Portfolio analysis and marketing management", Marketing Business, May pp 30-33
McGee, J; Thomas, H (1986) "Strategic groups: theory, research and taxonomy",
Strategic Management Journal, 7(2) pp 141-160
McGee, J (1985) "Strategic groups: review and prospects", Strategic Marketing and Management, John Wiley & Sons London
McWilliams, A; Smart, D.L (1993) "Efficiency V structure- conduct- performance:
implications for strategy research and practice", Journal of Management, 19(1) pp 63-78
Meidan, A; Lee, B (1982) "Marketing strategies for hotels", International Journal of Hospitality Management, 1(3) pp 169-178
Meyer, J; Rowan, B (1977) "Industrialised organisations : formal structures as myth
and ceremony", American Journal of Sociology, 83 pp 340-363
Miles, R.E; Snow, C.C (1978) "Organisational strategy. structure. and process",
McGraw-Hill New York
Miller, R (1981) "Strategic pathways to growth in retailing", Journal of Business Strategy, 1(3) winter pp 16-29
Miller, D (1987) "The structural and environmental correlates ofbusiness strategy",
Strategic Management Journal, 8 pp 55-76
Miller, D (1986) "Configuration of strategy and structure : towards a synthesis",
Strategic Management Journal, 7 pp 233-249
Mintzberg, H (1978) "Patterns in strategy formation", Management Science, 24 pp
934-948
Montgomery, C.A (1982) "The measurement of firm diversification: some new
empirical evidence", Academy of Management Review, 25(2) June pp 299-
307
Muller, T.E (1991) "Using personal values to define segments in an international
tourism market", International Marketing Review, 8(1) pp 57-70
Nebel, E.C; Schaffer, J.D (1993) "Hotel strategic planning at the business level in the
USA", In International Hospitality Management, Teare, R; Olsen, M
Pitman New York pp 228-231
Newman, H (1978) "Strategic groups and the structure -performance relationship",
The Review of Economics and Statistics, 60(3) pp 417-427
Newman, W.H (1967) "Shaping the master strategy of your firm", California Management Review, 9 pp 77-88
Olsen, M.D; Crawford-Welch, S; Tse, E (1991) "The global hospitality industry of
the 1990's", In Strategic Hospitality Management, Teare, R; Boer, A
Cassell London
Page 256
Olsen, M.D (1993) "International growth strategies of major US hotel companies",
EIU Travel and Tourism Analyst, 3 pp 51-64
Olusoga, S.A (1993) "Market concentration versus market diversification and
internationalisation : implications for MNE performance", International Marketing Review, 10(2) pp 40-59
Oster, S (1982) "Intraindustry structure and ease of strategic change", The Review of Economics and Statistics, 64(3) pp 376-383
Overstreet, G.A (1993) "Creating value in oversupplied markets", The Cornell HRA Quarterly, October pp 68-96
Pearce, J.A; Robinson, R.B (1988)(a) "Planned patterns of strategic behaviour and
their relationship to business- unit performance", Strategic Management Journal, 9(2) pp 43-60
Pearce, J.A; Robinson, R.B (1988)(b) "Strategic management : strategy formulation
and implementation", Third Edition Irwin Illinois pp 5-17
Peters, T (1987) "Thriving on chaos: Handbook for a management revolution",
Guild Publishing, London
Pfeffer, J; Salancik, G.R (1978) "The external control of organisations", Harper and
Row NewYork
Porter, M.E (1980) "Competitive strategy", New York Free Press
Porter, M.E (1985) "Competitive advantage : creating and sustaining superior
performance", New York Free Press
Porter, M.E (1979) "How competitive forces shape strategy", Harvard Business Review, March I April pp 86-94
Ramanujam, V; Venkatraman, N (1985) "A multi-disciplinary review and
implications for strategy research", In "Multi-item scales to measure
organisational performance" Conant, J.S; Mokwa, M.P; Varadarjan, P.R
(1990) Strategic Management Journal, 11 pp 365-383
Reger, R; Huff, A (1993) "Strategic groups : a cognitive perspective", Strategic Management Journal, 14 pp 103-124
Schaffer, J.D (1987) "Competitive strategies in the lodging industry", International Journal of Hospitality Management, 6(1) pp 33-42
Selznick, P (1957) "Leadership in administration", Harper and Row New York
Senior, M; Morphew, R (1990) "Competitive strategies in the budget hotel sector",
International Journal of Contemporary Hospitality Management, 2(3) pp 3-9
Singh, H; Montgomery, C.A (1987) "Corporate acquisition strategies and economic
performance", Strategic Management Journal, 8 pp 377-386
Page 257
Smith, K; Guthrie, J; Chen, M (1986) "Miles and Snow's typology of strategy.
organisational size and organisational performance", Academy of Management Proceedings, pp 45-49
Snow, C.C; Hambrick, D.C (1980) "Measuring organisational strategies : some
theoretical and methodological problems", Academy of Management Review, 5(4) October pp 527-538
Snow, C.C; Hrebiniak, L.G (1980) "Strategy. distinctive competence. and
organisational performance", Academy of Management Review, 25(2) June
pp 317-336
Tang, M.J; Thomas, H ( 1992) "The concept of strategic groups : Theoretical
construct or analytical convenience", Managerial and Decision Economics, 13 pp 323-329
Tarrant, C (1989) "UK hotel industry- market restructuring and the need to respond
to customer demands", Tourism Management, 10(3) September pp 187-191
Thomas, H; Venkatraman, N (1988) "Research on strategic groups: progress and
prognosis", Journal of Management Studies, 25 pp 537-555
Thompson, J.A (1967) "Organisations in action", McGraw Hill New York
Thompson, V (1961) "Modem organisations", Knopf New York
Tse, E.C; West, J.J (1992) "Development strategies for international hospitality
markets", In International Hospitality Management, Teare, R; Olsen, M
Pitman New York pp 118-134
Venkatraman, N; Grant, J.H (1986) "Construct measurement in organisational
strategy research", Academy of Management Review, 11(1) January pp 71-
87
Venkatraman, N; Ramanujam, V (1986) "Measurement of business performance in
strategy research : a comparison of approaches", Academy of Management Review, 11(4) October pp 801-814
Venkatraman, N; Ramanujam, V (1987) "Measurement of business economic
performance : an examination of method convergence", Journal of Management, 13(1) Spring pp 109-122
Vierich, W; Calver, S (1991) "Hotels and the leisure sector: a product differentiation
strategy for the 1990's", International Journal of Contemporary Hospitality
Management, 3(3) pp 10
West, J.J; Anthony, W.P (1990) "Strategic group membership and environmental
scanning : their relationship to firm performance in the food service industry",
International Journal of Hospitality Management, 9(3) pp 247-267
Whittington, R (1988) "Environmental structure and theories of strategic choice",
Journal of Management Studies, 25(6) pp 521-536
Page 258
Woo, C.Y (1983) "Evaluation ofthe strategies and performance of low ROI market
share leaders", Strategic Management Journal, 4 pp 123-135
Wright, P; Kroll, M; Chan, C; Hamel, J (1991) "Strategic profiles and performance:
an empirical test of select key propositions", Journal of the Academy of Marketing Science, 19(3) Summer pp 245-254
Page 259

CHAPTER NINE
PERFORMANCE IN THE CSHBMARKET
9.1 INTRODUCTION
In this chapter, measures of corporate and business level performance are determined
in terms of financial and non-financial measures. The performance of each hotel
group is established to prepare the reader for associating structure, strategy and
performance variables, and drawing conclusions and contributions to knowledge.
9.2 THEORETICAL FOUNDATIONS
The concept of strategy is generally believed to have effects on financial performance
for a firm (Beard & Dess 1981, Rumelt 197 4, 1982, Channon 1978, Bettis 1981,
Bettis & Hall 1982, Christenson & Montgomery 1981, Ginyer & Yasai-Ardekani
1981, Luffman & Reed 1984, Hambrick 1983, McDaniel & Kolari 1987, Miles &
Snow 1978, Smith; Guthrie & Chen 1986, Snow & Hvenbiniak 1980).
The structure - strategy - performance paradigm implies that the structural
characteristics of an industry, (particularly the level of concentration of firms), and the
height of entry barriers will have a significant influence on the ability of firms within
an industry to price above the competitive price, i.e. its strategy leading to
performance. This being the case, the market characteristics can be expected to
determine the performance potential of individual firms or strategic groups.
Montgomery (1979) supports this view, finding performance differences in firms
linked to differing market characteristics.
Porter (1976, 1979) and Caves (1977) were among the first to examine potential
effects of strategic group membership for group and firm performance. They found
that strategic groups did exist and systematically affected distribution of industry
profits. Since this time, the relationship between strategic group membership and firm
performance has been a central and controversial theme in strategic group literature
(Hatten & Schendel1977, Schendel & Patten 1978, McGee & Thomas 1986, Thomas
& Venkatraman 1988, Cool & Schendel1987, 1988, Newman 1978, Harrigan 1985).
Empirical evidence linking performance differences with strategic groups is not
extensive and is conflicting, with a number of authors establishing no structure,
strategy, performance linkages (Mascarenhas & Aaker 1989, Cool & Schendel1987,
Johnson & Thomas 1987, Schendel & Hofer 1979, Lawless, Bergh & Wilsted 1989,
Frazier & Howell1983, Vredenburgh & Alutto 1977). However, a wide body of
research supports and confirms the existence of a relationship between the structure,
Page 260
strategy, performance paradigm (Caves & Porter 1977, Caves 1984, Rage & Dewar
1973, McGee & Thomas 1986, Thomas 1988, Baldridge & Burnham 1975, Dess &
Davis 1984, Feigenbaum & Thomas 1987, 1990, Oster 1982, Porter 1979, Lewis &
Thomas 1990), including studies specific to the service sector (Channon 1978) and
hospitality and tourism industry (West & Anthony 1990).
These findings do not imply that strategic groups have any performance implications
at all. Part of the appeal of the strategic group construct stems from the fact that intra
group rivalry and inter-group rivalry differ, and with such differences come
performance differences. What it implies is that strategic group membership is not the
only variable of performance, (as performance is not a unitary concept), meaning
some groups will display closer similarities in performance than others. This should
be recognised in any structure- strategy- performance research. In addition, as
returns on a given strategy dissipate over time, firms must adapt and respond to
changing conditions (Jacobson 1992). Hence, if firms recognise greater performance
in other strategic groups they will attempt to join such groups i.e. move in strategic
space. The likely result of such activity is, reduced performance for original members
ofthe group, and in response the erection of mobility barriers. Mobility barriers
(Caves & Porter 1977) prevent firms from moving from one strategic group within an
industry to another, and thus provide an explanation of differences in intra and inter
industry and market performance (McGee 1985).
The variations in inter and intra industry profitability and performance may be
explained on the basis of strategic group membership. The strategic groups model
also serves to explain differences in performance among firms of equivalent sizes,
where a close association between market share and profitability is already strongly
acknowledged (BCG 1974, Gale 1972, Woo 1983, Jacobson 1988). When firms are
divided by size within an industry, each size category may contain members of more
than one strategic group (Dess & Davis 1984) showing areas of performance
difference independent of size alone (i.e. strategy is important), and has differing
levels ofviability for different firms (Zajac & Shortell1989). Hence, as Cool and
Schendel (1988) established, strategic group membership does not therefore imply "de
facto" performance, but instead provides an indication of where and how groups may
perform better.
In summary, it is commonly observed that the structure- performance model is
seriously deficient on its own e.g. it lacks dynamism (Hay & Morris 1979) and that
more complex causal links need to be taken into account. A strategic groups approach
Page 261
allows such links (McGee 1985) and therefore goes some way to allowing analysis of
dynamic markets by identifying areas of apparent association.
The chapter establishes the measures of performance for hotel groups in the CSHB
market, and provides an indication of how each group performs thus allowing the
performance of strategic groups to be examined and a model of performance
enhancement to be constructed.
9.3 MEASURES OF PERFORMANCE
For the purposes of this research, (and in accordance with suggestions made by Oster
(1982), Dess and Davis (1984) and Cool and Schendel (1987)), multiple performance
indicators were used to test differences in hotel group performance. To allow a
comparative analysis of the research findings, all hotel group performance measures
were measured in exactly the same way and represented both financial and non
financial measures, the latter being a measure neglected by many researchers. While
measures were consistent, the reader should be aware that for financial data obtained
from CD-ROM (and cross referenced to company accounts) the financial year
reporting differed between groups. Hence, some groups had financial years from April
1991 to April1992, while others are from January 1991 to January 1992. Although
the financial years 1991/2 were considerably turbulent, these differences in financial
reporting are not deemed to have any major effect upon the investigation of strategic
group structure - strategy - performance relationships, as they essentially act as
benchmarks of analysis.
Financial performance was measured on two levels, the (i) industry level, and the (ii)
market level.
9.3.1 Industry Level Performance
The industry/corporate level performance is measured to provide an indication of how
the hotel group is performing as a whole. It should be recognised that when these
measures are applied to the strategic group clusters in Chapter 10 that the resulting
performance is only partially attributable to the CSHB market and indeed to strategies
within the CSHB market. They do however provide a benchmark to compare groups
at an industry level in relation to CSHB strategies adopted. Industry financial
performance indicators were selected as return on capital employed (ROCE), gearing,
and profitability. These indicators represent the key measures of performance
Page 262
indicated by previous management and industrial organisations research and are
widely regarded by industry as critical measures of performance (Coats et al1991,
Dess & Davids 1984, Lesser & Rubin 1993, West & Anthony 1990, Slattery et al
1995, 1994, Slattery & Johnson 1993, 1992, 1990).
(i) ROCE
A key performance measure used by many industrialists and researchers is that of
return on investment or return on capital employed - ROCE (Buzzell & Gale 1972,
Schoeffler, Buzzell & Heany 1974. Lesser & Rubin 1993). The ROCE can be seen as
the ratio of net, pre-tax operating income to average capital employed. Where,
operating income is what is available after deductions of allocated corporate overhead
expenses and any financial charges on assets employed. Capital employed is equity
and long term debt plus total assets less current liabilities.
This measure therefore indicates the performance of the hotel group in terms of
financial returns to capital, and as such reduces the influence of large group
dominance skewing figures.
(ii) Gearing
Coats et al (1991) recognised that in the UK there appeared to be a pre-occupation
with financial stability, and attention to gearing i.e. a company's debt situation, among
corporate objectives and performance measures. This is probably due to the
importance of interest rates, which as has become evident with the growth of
companies in receivership, plays an ever increasing role in organisations operations.
Gearing in this context is taken as the debt to equity ratio, and then scaled to 100% as
maximum gearing, in other measures this figure can be found to be two or three
hundred percent.
(iii) Profitability
Probably the most widely accepted measure of organisation performance is
profitability (Porter 1976, 1979), not only among researchers but also among
companies themselves (Coats et al1991). However, there are many measures of
profitability, ranging from profit ratios, to actual figures, before tax, after tax, before
expenses, after expenses, before wages etc. To allow comparison of strategic group
profitability this research uses the ratio of percentage profit after interest and tax to
sales, (P AIT). In effect this provides a bottom line comparable performance figure
between groups, accounting for debt repayments and any taxation payable or
rebateable.
Page 263
The three financial measures adopted represent a comprehensive attempt at
establishing the key performance indicators at industry level. While some may argue a
need for more financial figures, (Hansen & Wemerfelt 1989), such as market
capitalisation, share price, efficiency ratios etc., one should consider the need for
focus to allow reduced complexity of analysis thus allowing clarity of results. The
measures selected are clearly the most relevant to operations in the CSHB market and
have been confirmed as such by the industrial focus group. In addition, when looking
at the relevance of alternative measures the reader is reminded of trends towards
revaluing hotel groups after a series of overvaluations in the late 1980's and early
1990's and the implications of over borrowing on other financial measures e.g. Queen
Moat Houses share suspension in 1993, and the subsequent trend by major hotel
groups to revalue their portfolios.
This makes analysis difficult, and the general reluctance or ability of some hotel
groups to provide financial data adds to the difficulty. The measures provided
represent commonly used and accepted measures of the three key areas of managerial
finance analysis : investment (ROCE), liquidity (gearing) and profitability (P AIT) and
as such are appropriate measures of financial industry/corporate performance.
9.3.2 Market Level Performance
While the industry performance may be attributable to a number of market segments
and their various components. The market level performance is specific to the CSHB
market in Scotland and as such provides an indication of performance at market
segment level. Again, a number of alternative variables apart from strategy - structure
relationships may influence the market performance but this allows a more focused
approach and provides a means of determining the differences in hotel group
relationships.
Only one financial measure is used here, that of the average CSHB revenue per room
per annum 199112. This is the average CSHB revenue for the hotel group divided by
the number of rooms available, and provides an indication of market performance
from a hotel group perspective. One should consider also that each hotel group
contains a range of individual hotels, all with different strategies and performance
levels, these are discussed in Appendix V. By calculating CSHB revenue per room,
the element of market dominance of groups is reduced and relative market share
established.
Page 264
9.3.3 Non-Financial Market Level Performance
To provide an additional dimension to performance measurement, a non-financial
performance measure was also introduced. A number of measures were considered,
including employee satisfaction (Cameron 1986, Goodman & Pennings 1977),
number of employees, consumer return rates, growth in room stock etc. Given the
competitive nature of the market and the danger of overlap between market structure
measures and performance measures (i.e. growth in market share), a measure of non
financial performance was taken as the strength of competitive identity.
The strength of competitive identity represented the perceived threat posed by various
hotel groups as identified by peers, and as such reflected the competitive nature of the
market and an element of the qualitative balance of the research approach. Hotel
groups were categorised into strong, with 27% or above of companies identifying the
hotel group as competition, medium (16%-26%) or weak (0%-15%) bands according
to their level of competitive identity. The competitive identity being determined by
establishing which groups were most often identified as competition by other hotel
groups. The quantitative translation of the determinants of strong, medium and weak
peer competitive identity was calculated by establishing, from research, the average
degree of competitive identity, this being 21.5% of groups. Below the average figure
represents a weaker competitive identity, above the average represents a stronger
competitive identity. To reduce the affect of a number of strong identity groups
skewing the data, a one hotel group variance was allowed either side of the average.
The one hotel group variance represented 5.5% making below 15% a weak peer
competitive identity in the CSHB market, 16%-26% an average or medium peer
identity, and 27% or above a strong peer competitive identity. Having determined the
indicative measures used to identify hotel group performance, the measures can be
applied to the hotel group sample.
9.4 HOTEL GROUP FINANCIAL PERFORMANCE
1991/2 was a very turbulent year for many groups and as such some groups performed
poorer than in previous years, e.g. Stakis, S.H.H, and M.Ch.Th.
The purpose of this section is to highlight potential differences between hotel group
performance clusters, hence measures should be treated as benchmarks and focus
should be upon the underlying concepts and principles of the linkages between
structure and strategy, representing methodology, not the performance results of
specific years.
Page 265
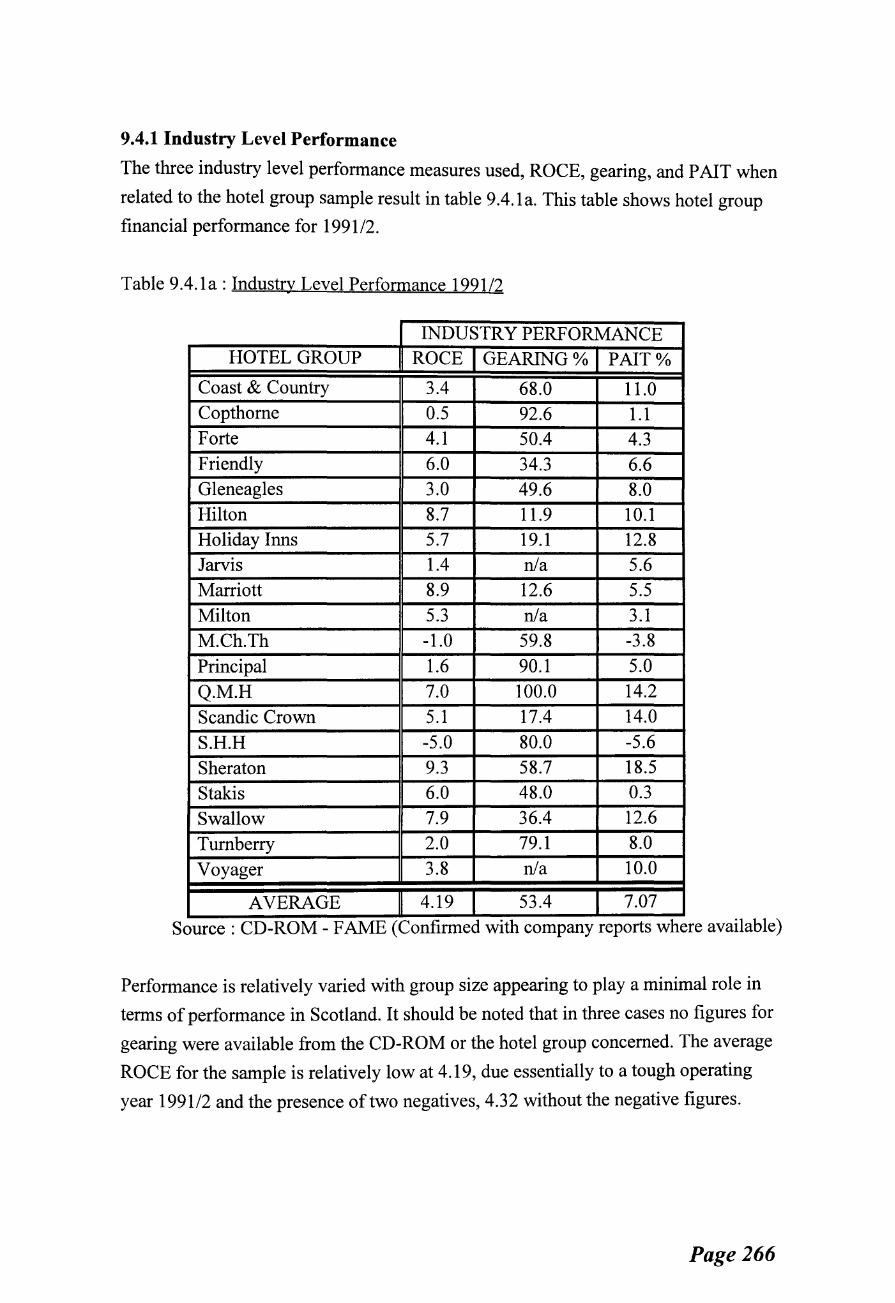
9.4.1 Industry Level Performance
The three industry level performance measures used, ROCE, gearing, and P AIT when
related to the hotel group sample result in table 9.4.1a. This table shows hotel group
financial performance for 199112.
Table 9.4.la: Industry Level Performance 199112
INDUSTRY PERFORMANCE HOTEL GROUP ROCE GEARING% PAIT%
Coast & Country 3.4 68.0 11.0 Copthome 0.5 92.6 1.1 Forte 4.1 50.4 4.3 Friendly 6.0 34.3 6.6 Gleneagles 3.0 49.6 8.0 Hilton 8.7 11.9 10.1 Holiday Inns 5.7 19.1 12.8 Jarvis 1.4 n/a 5.6 Marriott 8.9 12.6 5.5 Milton 5.3 n/a 3.1 M.Ch.Th -1.0 59.8 -3.8
Principal 1.6 90.1 5.0
Q.M.H 7.0 100.0 14.2
Scandic Crown 5.1 17.4 14.0
S.H.H -5.0 80.0 -5.6
Sheraton 9.3 58.7 18.5
Stakis 6.0 48.0 0.3
Swallow 7.9 36.4 12.6
Tum berry 2.0 79.1 8.0
Voyager 3.8 n/a 10.0
AVERAGE 4.19 53.4 7.07 Source: CD-ROM- FAME (Confirmed with company reports where available)
Performance is relatively varied with group size appearing to play a minimal role in
terms of performance in Scotland. It should be noted that in three cases no figures for
gearing were available from the CD-ROM or the hotel group concerned. The average
ROCE for the sample is relatively low at 4.19, due essentially to a tough operating
year 1991/2 and the presence of two negatives, 4.32 without the negative figures.
Page 266
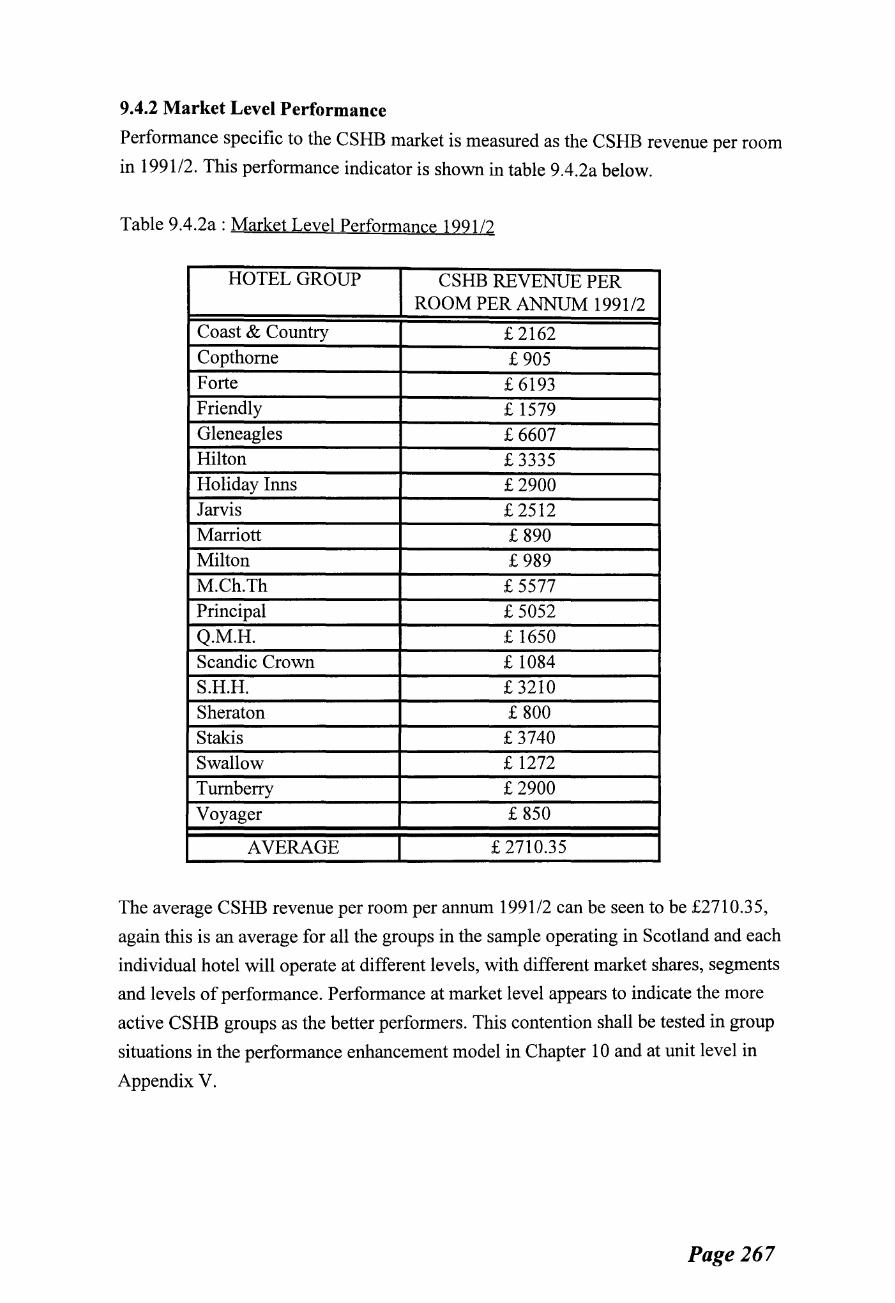
9.4.2 Market Level Performance
Performance specific to the CSHB market is measured as the CSHB revenue per room
in 1991/2. This performance indicator is shown in table 9.4.2a below.
Table 9.4.2a: Market Level Performance 1991/2
HOTEL GROUP CSHB REVENUE PER ROOM PER ANNUM 1991/2
Coast & Country £2162 Copthome £905 Forte £6193 Friendly £1579 Gleneagles £6607 Hilton £3335 Holiday Inns £2900 Jarvis £2512 Marriott £890 Milton £989 M.Ch.Th £5577 Principal £5052 Q.M.H. £ 1650 Scandic Crown £ 1084 S.H.H. £3210 Sheraton £800 Stakis £3740 Swallow £1272 Tum berry £2900 Voyager £850
AVERAGE £2710.35
The average CSHB revenue per room per annum 1991/2 can be seen to be £2710.35,
again this is an average for all the groups in the sample operating in Scotland and each
individual hotel will operate at different levels, with different market shares, segments
and levels of performance. Performance at market level appears to indicate the more
active CSHB groups as the better performers. This contention shall be tested in group
situations in the performance enhancement model in Chapter 10 and at unit level in
Appendix V.
Page 267

9.5 HOTEL GROUP NON-FINANCIAL PERFORMANCE
In terms of non-financial performance, table 9.5a shows the groups identified peer
competitive identity, ranging from strong to average to weak.
Table 9.5a : Peer Competitive Identity
HOTEL GROUP IDENTIFIED BY COMPETITIVE %OF COS. IDENTITY
Coast & Country 5 Weak Copthome 10 Weak Forte 60 Strong Friendly 10 Weak Gleneagles 5 Weak Hilton 35 Strong Holiday Inns 20 Average Jarvis 20 Average
Marriott 20 Average Milton 20 Average
M.Ch.Th. 50 Strong
Principal 10 Weak
Q.M.H 35 Strong
Scandic Crown 10 Weak
S.H.H 20 Average
Sheraton 10 Weak
Stakis 55 Strong
Swallow 25 Average
Tum berry 5 Weak
Voyager 5 Weak
AVERAGE 21.5 Average
The average peer competitive identity can be seen to be "average", with the average
identity being recognition by 21.5% of hotel groups. In general, the larger groups
appear to be the best performers in terms of peer competitive identity, probably due to
the ability to utilise more distribution channels and the general market coverage
dominance, often through a recognised brand.
Page 268
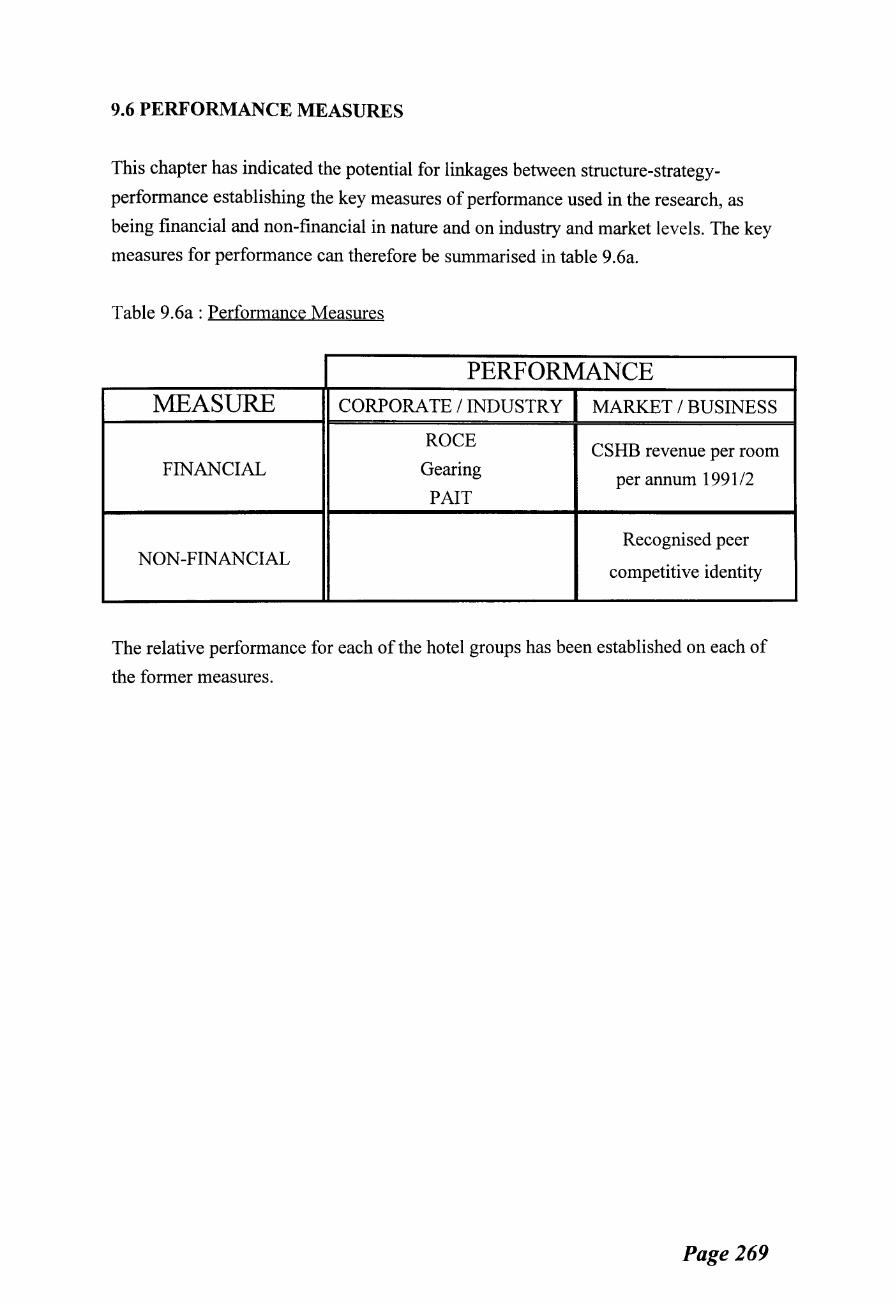
9.6 PERFORMANCE MEASURES
This chapter has indicated the potential for linkages between structure-strategy
performance establishing the key measures of performance used in the research, as
being financial and non-financial in nature and on industry and market levels. The key
measures for performance can therefore be summarised in table 9.6a.
Table 9.6a: Performance Measures
PERFORMANCE MEASURE CORPORATE I INDUSTRY MARKET I BUSINESS
ROCE CSHB revenue per room FINANCIAL Gearing per annum 199112
PAIT
Recognised peer NON-FINANCIAL
competitive identity
The relative performance for each of the hotel groups has been established on each of
the former measures.
Page 269
9.7 CHAPTER SUMMARY
The chapter has focused on alternative measures of performance, highlighting two
levels of performance analysis : industry level and market level. Measures of industry
level performance are determined as ROCE, gearing and P AIT, while market level
performance is examined in terms of CSHB revenue per room per annum, and a non
financial measure of peer competitive identity.
Having determined the measures of performance adopted for the research, the chapter
has highlighted distinct performance differences between different hotel groups.
The causes of such performance variations currently provide little indication of
influences of why performance is different. The combination of CSHB market
structure data based upon the dominance of hotel groups and highly segmented and
complex market structure, and the specific strategies adopted by hotel groups - either
defender or predatorial in nature- may provide some clues as to the differences in
performance. Such relationships allow some indication of the strategic capabilities of
the hotel groups and how such groups can enhance performance.
The next chapter combines CSHB market structure-strategy and performance
variables in order to determine strategic capability and construct a performance
enhancement model for companies operating in the market.
Page 270
REFERENCES
Baldridge, J.V; Burnham, R.A (1975) "Organisation innovation. individual~
organisational and environmental impacts", Administrative Science Quarterly, 20 pp 165-175
Beard, D.W; Dess, G.G (1981) "Corporate level strategy~ business level strategy and
firm performance", Academy of Management Journal, 24 pp 663-688
Bettis, R.A (1981) "Performance differences in related and unrelated diversified
firms", Strategic Management Journal, 2 pp 379-383
Bettis, R.A; Hall, W.K (1982) "Diversification strategy. accounting risk and
accounting determined return", Academy of Management Journal 25(2) pp
254-264
Boston Consulting Group (1974) "Perspectives on experience 1968. 1970. 1972.
1974", BCG Ltd Boston
Cameron, K (1986) "A study of organisational effectiveness and its predictors",
Management Science, 32(1) pp 87-112
Caves, R (1984) "Economic analysis and the quest for competitive advantage",
American Economic Review, May pp 127-132
Caves, R; Porter, M.E (1977) "From entry barriers to mobility barriers", Quarterly Journal of Economics, 91 May pp 241-261
Channon, D (1978) "The service industries : strategy. structure and financial
performance", MacMillan London
Christensen, H.K; Montgomery, C.A (1981) "Corporate economic performance:
diversification strategy versus market structure", Strategic Management Journal, 2 pp 327-343
Coats, J; Davis, E; Longden, S; Stacey, R; Emmanuel, C (1991) "Objectives.
missions and performance measures in multinationals", European Management Journal, 9(4) pp 444-452
Cool, K.O; Schendel, D.E (1987) "Strategic group formation and performance : the
case of the US pharmaceutical industry. 1963-1982", Management Science, 33(9) pp 1102-1124
Cool, K.O; Schendel, D.E (1988) "Performance differences among strategic group
members", Strategic Management Journal, 9 pp 207-223
Dess, G; Davis, P (1984) "Porter's (1980) generic strategies as determinants of strategic
group and organisational performance", Academy of Management Journal,
27(3) pp 467-488
Page 271
Fiegenbaum, A; Thomas, H (1990) "Strategic groups and performance: the US
insurance industry 1970-1984", Strategic Management Journal, 11 pp 197-215
Frazier, G; Howell, R (1983) "Business definition and performance", Journal of Marketing, Spring pp 59-67
Gale, B (1972) "The existence of direction and causality in cross-section analysis of
hypotheses : a paper in research strategy", American Statistics Association Proceedings, Business & Economic Statistics pp 314-319
Goodman, P.S; Pennings, M (1977) "New perspectives on organisational
effectiveness", Jossey-Bass San Francisco California
Grinyer, P.H; Yasai-Ardekani, M (1981) "Strategy= structure= size and bureaucracy",
Academy of Management Journal, 24 pp 4 71-486
Hage, J; Dewar, R (1973) "Elite values versus organisational structure in predicting
innovation", Administrative Science Quarterly, 18 pp 270-290
Hambrick, DC (1983) "Some tests of the effectiveness and functional attributes of
Miles and Snow's strategic types", Academy of Management Journal, 26(1)
March pp 5-26
Hansen, G.S; Wernerfelt, B (1989) "Determinants of firm performance: the relative
importance of economic and organisational factors", Strategic Management Journal, 10 pp 399-411
Harrigan, K.R (1985) "An application of clustering for strategic group analysis",
Strategic Management Journal, 6 pp 55-73
Hatten, K; Schendel, D.E (1977) "Heterogeneity within an industry : firm conduct in
the US brewing industry : 1952-1971 ", Journal of Industrial Economics, 26(2) December pp 97-113
Hay, D.A; Morris, D.J (1979) "Industrial economics: theory and evidence", Oxford
University Press Oxford
Jacobson, R (1988) "The persistence of abnormal returns", Strategic Management Journal, 9 pp 415-430
Jacobson, R (1992) "The Austrian school of strategy", Academy of Management Review, 17( 4) pp 782-807
Johnson, G; Thomas, H (1987) "The industry context of strategy= structure and
performance", Strategic Management Journal, 8 pp 343-361
Lawless, M; Bergh, D; Wilsted, W (1989) "Performance differences among strategic
group members : an examination of individual firm capability", Journal of
Management, 15( 4) pp 649-661
Lesser, D.H; Rubin, K (1993) "Rates of return on hotel investments", The Cornell HRA Quarterly, June pp 83-89
Page 272
Lewis, P; Thomas, H (1990) "The linkage between strategy. strategic groups. and
performance in the UK retail grocery industry", Strategic Management Journal, 11 pp 385-397
Luffman, G.A; Reed, R (1984) "The strategy and performance of British industry
1970-1980", MacMillan London
Mascarenhas, B; Aaker, D (1989) "Mobility barriers and strategic groups", Strategic Management Journal, 10 pp 475-485
McDaniel, S.W; Kolari, J.W (1987) "Marketing strategy implications of the Miles
and Snow strategic typology", Journal of Marketing, 51(4) October pp 19-
30
McGee, J; Thomas, H (1986) "Strategic groups: theory. research and taxonomy",
Strategic Management Journal, 7 pp 141-160
McGee, J (1985) "Strategic groups : a bridge between industry structure and strategic
management", Strategic Marketing and Management, John Wiley & Sons
New York pp 293-313
Miles, R.E; Snow, C.C (1978) "Organisational strategy~ structure~ and process",
McGraw-Hill New York
Montgomery, C.A (1979) "Diversification. market structure and economic
performance", Ph.D. dissertation, Purdue University
Oster, S (1982) "Intraindustry structure and ease of strategic change", The Review of Economics and Statistics, 64(3) pp 376-383
Porter, M.E (1976) "Interbrand choice. strategy and bilateral market power", Harvard
University Press Cambridge Massachusetts
Porter, M.E (1979) "The structure within industries and companies performance",
Review of Economics and Statistics, 61 May pp 214-227
Rumelt, R.P (1982) "Diversification strategy and profitability", Strategic Management Journal, 3(4) pp 359-370
Rumelt, R.P (1974) "Strategy. structure and economic performance", Harvard
University Press Cambridge Massachusetts
Schendel, D.E; Hofer, C.W (1979) "Strategic management", Boston Little Brown
Schendel, D; Patton, R (1978) "A simultaneous equation model of corporate
strategy", Management Science, 24(15) November pp 1611-1621
Schoeffler, S; Buzzell, R; Heany, D.F (1974) "Impact of strategic planning on profit
performance", Harvard Business Review, March I April pp 116-124
Slattery, P; Feehely, G; Savage, M (1995) "Quoted hotel companies: The World
markets 1995", 9th Annual Review, Kleinwort Benson Research, London,
March
Page 273

Slattery, P; Feehely, G; Savage, M (1994) "Quoted hotel companies: The World
markets 1994", 8th Annual Review, Kleinwort Benson Research, London,
March
Slattery, P; Johnson, S (1993) "Quoted hotel companies: The European markets
1993 ", 7th Annual Review, Klein wort Benson Research, London, February
Slattery, P; Johnson, S (1992) "Quoted hotel companies: The European markets
1992", 6th Annual Review, Kleinwort Benson Research, London, February
Slattery, P; Johnson, S (1990) "UK hotels Plc: The Decade Review", Kleinwort
Benson Research, London, January
Smith, K.G; Guthrie, J.P; Chen, M (1986) "Miles and Snow's typology of strategy.
organisational size and organisational performance", Academy of Management Proceedings pp 45-49
Snow, C.C; Hrebiniak, L.G (1980) "Strategy. distinctive competence and
organisational performance", Administrative Science Quarterly, 25(2) June
pp 317-336
Vredenburgh, D.J; Alutto, J.A (1977) "Perceived structure and relation to individual
attitudes and performance", In "Organisation Design", Burack, E.H;
Neghandi, A.R pp 255-272
West, J.J; Anthony, W.P (1990) "Strategic group membership and environmental
scanning : their relationship to firm performance in the foodservice industry",
International Journal of Hospitality Management, 9(3) pp 247-267
Woo, C.Y (1983) "Evaluation of the strategies and performance of low ROI market
share leaders", Strategic Management Journal, 4 pp 123-135
Zajac, E.J; Shortell, S.M (1989) "Changing generic strategies : likelihood~ direction.
and performance implications", Strategic Management Journal, 10 pp 413-
430
Page 274
PARTY
CONCLUSION AND CRITIQUE
PAaE CHAPTER tO
SUMMARY DISCUSSION, CSHB PERFORMANCE MODEL & CONTRIBUTIONS TO KNOWLEDGE 275
CHAPTERll METHODOLOGICAL CRITIQUE AND FURTHER RESEARCH 319
CHAPTER TEN
SUMMARY DISCUSSION, CSHB PERFORMANCE
MODEL& CONTRIBUTIONS TO
KNOWLEDGE
10.1 INTRODUCTION
This chapter establishes whether structure- strategy- performance relationships exist
between hotel groups in the CSHB market in Scotland. The structure - CSHB strategy
- performance framework is established. Industry performance is then examined to
determine strategic capability, followed by a market level analysis to suggest means
of enhancing CSHB market performance. The concept of movement in strategic space
is discussed, and the results combined to construct a model of CSHB performance
enhancement. Contributions to knowledge are summarised.
10.2 THE STRUCTURE- STRATEGY- PERFORMANCE ANALYSIS
FRAMEWORK
To provide a measure of performance for strategic groups, the strategy, structure and
performance variables are combined. Cool and Dierickx (1993) recognise that "a
firm's assets result from the pattern of its strategic decisions over time and must fit the
current strategy for good performance." Hence, there will be a strong link between a
firm strategy and industry structure. Assuming this to be the case allows an analysis
of performance within and between strategic group clusters. The measure of
performance is structured in three steps : (i) individual hotel group performance, (ii)
cluster performance, and (iii) comparisons between clusters.
10.2.1 Individual Hotel Group Performance
Chapter 9 established the measures of performance adopted and the individual
performance of each hotel group. These are summarised in section 10.3. The research
approach, by its nature, clusters individual hotel groups into CSHB structure-CSHB
strategy clusters. Thus results in individual performance of hotel groups are combined
to form cluster performance.
1 0.2.2 Cluster Performance
The measure for cluster performance in this research is based on work by McNamee
and McHugh (1987). This represents performance as an ellipse. The horizontal and
vertical axis of the ellipse are derived from the performance achieved and the standard
deviation of the performance data used (i.e. the spread of performance of cluster
constituents) and, therefore, the closeness of performance in the group. This
determines the stability of the cluster group relating to prime strategy and structural
variables. The measure of standard deviation is intended as an indication of group
Page 275
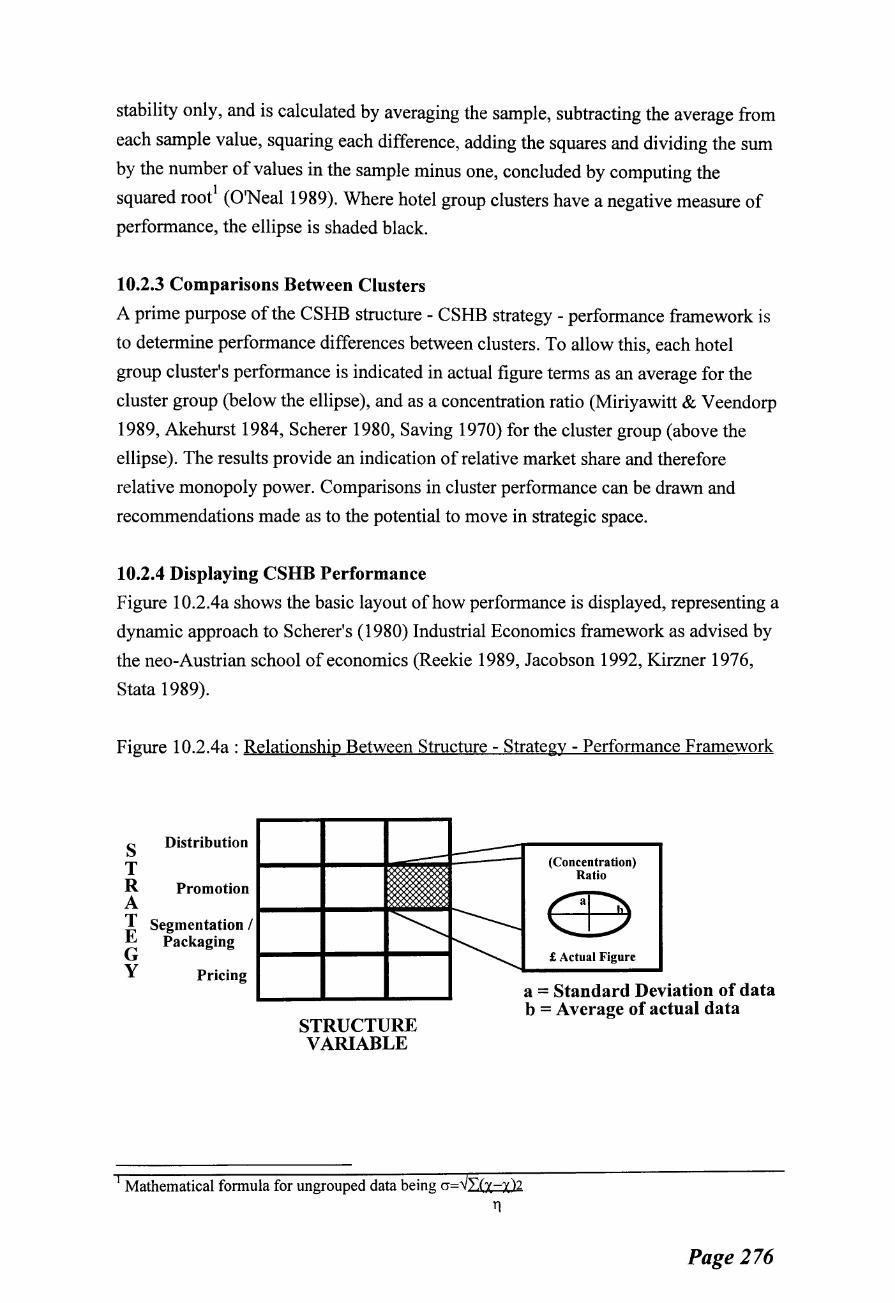
stability only, and is calculated by averaging the sample, subtracting the average from
each sample value, squaring each difference, adding the squares and dividing the sum
by the number of values in the sample minus one, concluded by computing the
squared root1
(O'Neal 1989). Where hotel group clusters have a negative measure of
performance, the ellipse is shaded black.
10.2.3 Comparisons Between Clusters
A prime purpose of the CSHB structure - CSHB strategy - performance framework is
to determine performance differences between clusters. To allow this, each hotel
group cluster's performance is indicated in actual figure terms as an average for the
cluster group (below the ellipse), and as a concentration ratio (Miriyawitt & V eendorp
1989, Akehurst 1984, Scherer 1980, Saving 1970) for the cluster group (above the
ellipse). The results provide an indication of relative market share and therefore
relative monopoly power. Comparisons in cluster performance can be drawn and
recommendations made as to the potential to move in strategic space.
10.2.4 Displaying CSHB Performance
Figure 1 0.2.4a shows the basic layout of how performance is displayed, representing a
dynamic approach to Scherer's (1980) Industrial Economics framework as advised by
the neo-Austrian school of economics (Reekie 1989, Jacobson 1992, Kirzner 1976,
Stata 1989).
Figure 1 0.2.4a : Relationship Between Structure - Strategy - Performance Framework
s Distribution
T R Promotion A T Segmentation I E Packaging G y Pricing
----<X)Qo
SM~ X%15<: ~~ sggg
NV. NN
~
STRUCTURE VARIABLE
1----
----.._ ~
1 Mathematical formula for ungrouped data being cr=)L(X-X)2 11
(Concentration) Ratio
EB £ Actual Figure
a = Standard De viation of data b = Average of actual data
Page 276

The structure variables, (horizontal axis) are applied to market scope, market share
and source of competitive advantage. The axis measures from left to right indicating
incremental changes in structure. In addition to this basic layout, the number of hotel
groups present in each strategic cluster group is indicated in the top right hand corner
of the box representing that group's strategic space.
Having determined the means by which relationships will be displayed and the
performance measures used, the next section combines CSHB market structure with
CSHB strategy and evaluates resulting industry level performance.
10.3 THE STRUCTURE- STRATEGY- PERFORMANCE ANALYSIS
FRAMEWORK APPLIED : INDUSTRY LEVEL
This section applies the strategic framework to hotel groups operating in the CSHB
market in Scotland. Industry relationships are established, determining which strategic
groups appear to perform best in terms ofROCE, gearing, and PAIT. The results
provide an indication of performance and allow the construction of a model to suggest
potential strategic capability i.e. an organisation's resources available as a whole and,
therefore, the potential to develop and nurture CSHB.
Following the industry analysis section, specific CSHB market analysis is undertaken
to highlight which strategic group clusters appear to perform best in terms of CSHB
revenue, thus constructing a CSHB performance enhancement model. Table 10.3a
provides a summary of the key elements of structure (Chapter 7), strategy (Chapter 8)
and performance (Chapter 9) established for each of the hotel groups operating in the
CSHB market in Scotland 1991/2.
Page 277
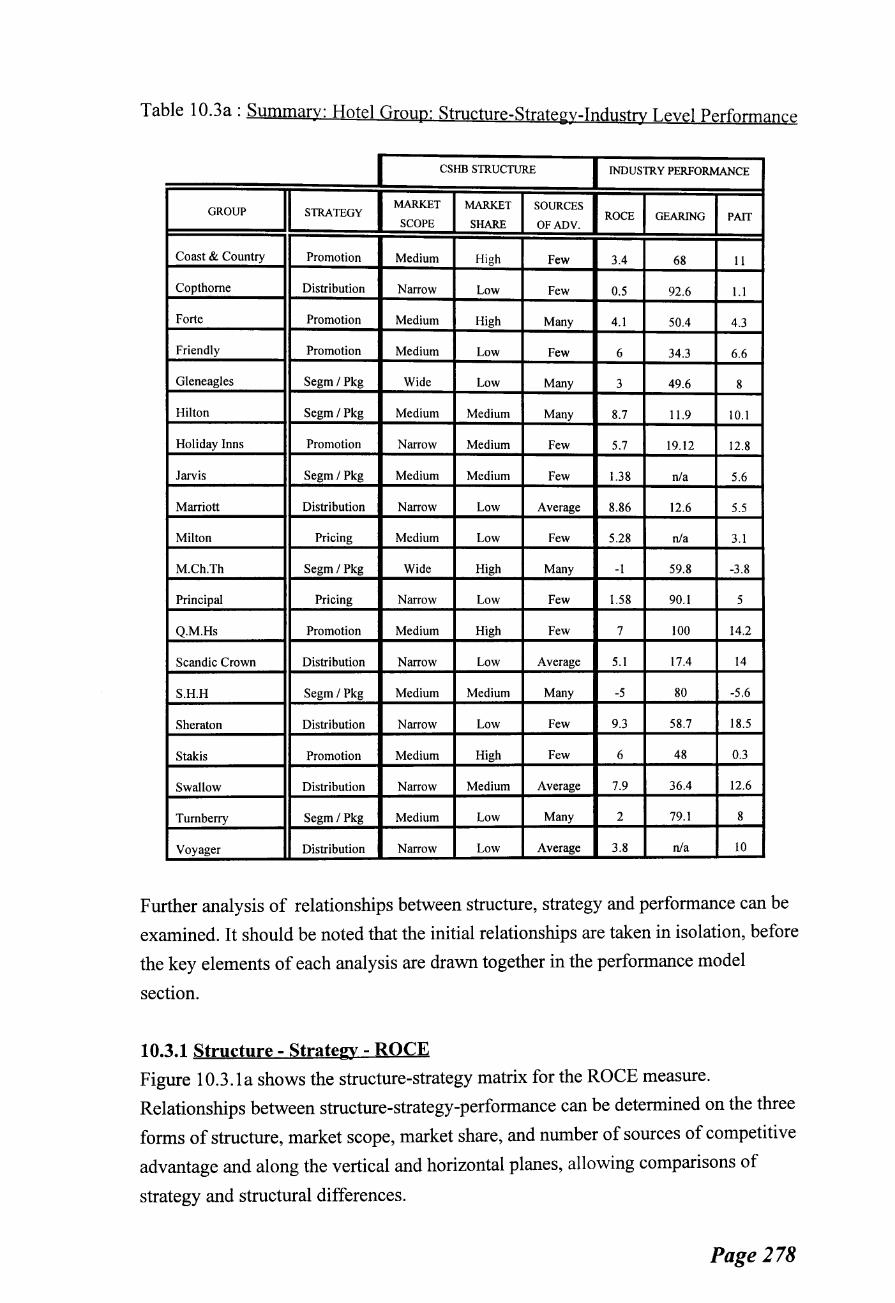
Table 10.3a: Summary: Hotel Group: Structure-Strategy-Industry Level Performance
CSHB STRUCTURE ~USTRYPERFO~CE
GROUP STRATEGY MARKET MARKET SOURCES
ROCE GEARING PAIT SCOPE SHARE OF ADV.
Coast & Country Promotion Medium High Few 3.4 68 11
Copthome Distribution Narrow Low Few 0.5 92.6 1.1
Forte Promotion Medium High Many 4.1 50.4 4.3
Friendly Promotion Medium Low Few 6 34.3 6.6
Gleneagles Segm/Pkg Wide Low Many 3 49.6 8
Hilton Segm/Pkg Medium Medium Many 8.7 11.9 10.1
Holiday Inns Promotion Narrow Medium Few 5.7 19.12 12.8
Jarvis Segm/Pkg Medium Medium Few 1.38 n/a 5.6
Marriott Distribution Narrow Low Average 8.86 12.6 5.5
Milton Pricing Medium Low Few 5.28 n/a 3.1
M.Ch.Th Segm/Pkg Wide High Many -1 59.8 -3.8
Principal Pricing Narrow Low Few 1.58 90.1 5
Q.M.Hs Promotion Medium High Few 7 100 14.2
Scandic Crown Distribution Narrow Low Average 5.1 17.4 14
S.H.H Segm/ Pkg Medium Medium Many -5 80 -5.6
Sheraton Distribution Narrow Low Few 9.3 58.7 18.5
Stakis Promotion Medium High Few 6 48 0.3
Swallow Distribution Narrow Medium Average 7.9 36.4 12.6
Tumberry Segm/Pkg Medium Low Many 2 79.1 8
Voyager Distribution Narrow Low Average 3.8 n/a 10
Further analysis of relationships between structure, strategy and performance can be
examined. It should be noted that the initial relationships are taken in isolation, before
the key elements of each analysis are drawn together in the performance model
section.
10.3.1 Structure- Strategy- ROCE
Figure 1 0.3.1a shows the structure-strategy matrix for the ROCE measure.
Relationships between structure-strategy-performance can be determined on the three
forms of structure, market scope, market share, and number of sources of competitive
advantage and along the vertical and horizontal planes, allowing comparisons of
strategy and structural differences.
Page 278
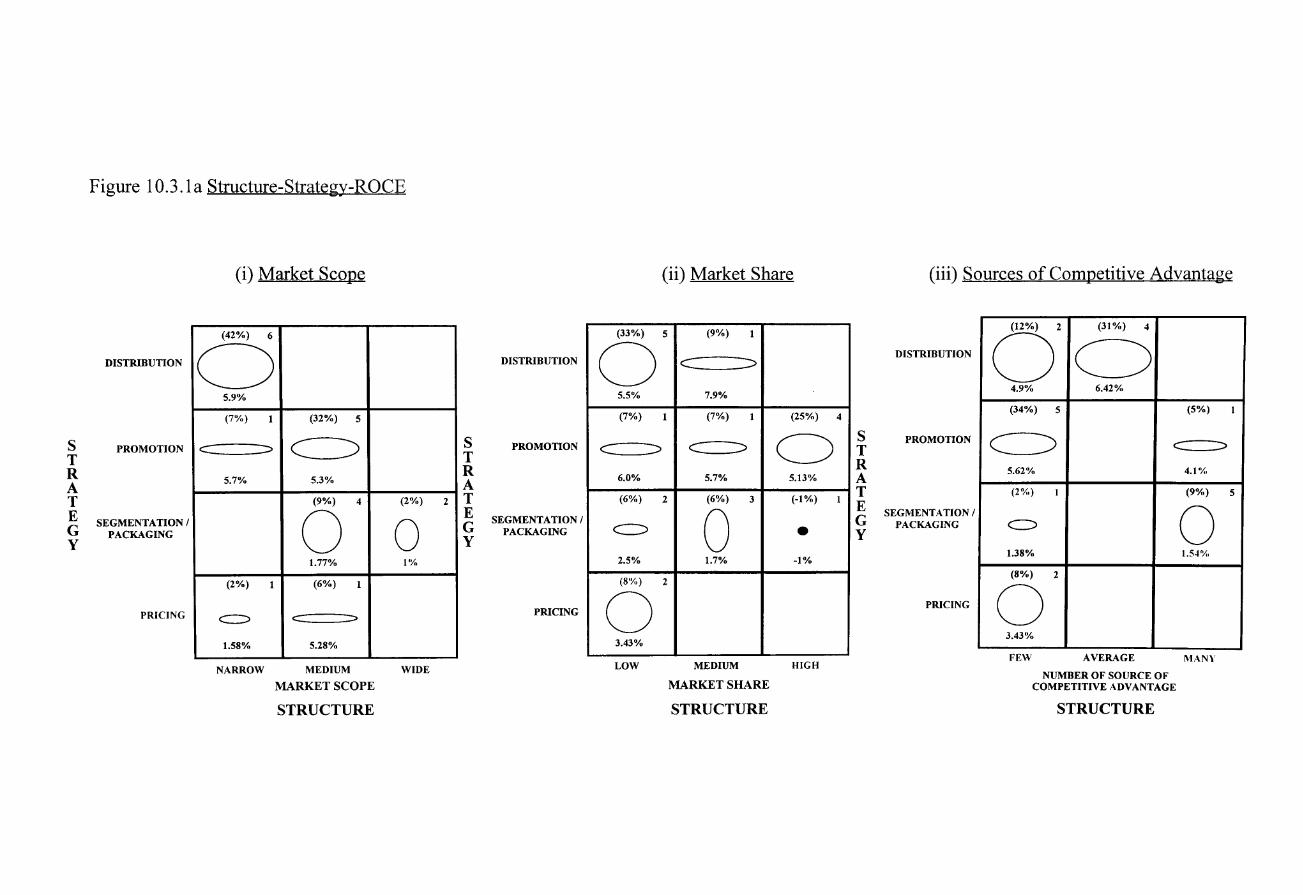
s T R A T E G y
Figure 10.3.1a Structure-Strategy-ROCE
DISTRIBUTION
PROMOTION
SEGMENTATION I PACKAGING
PRICING
(i) Market Scope
(42%) 6
0 5.9%
(7%) 1 (32%) 5
c :::> c==:> 5.7% 5.3%
(9%) 4
0 1.77%
(2%) 1 (6%) 1
c:=::> c:::::: ::>
1.58% 5.28%
NARROW MEDIUM
MARKET SCOPE
STRUCTURE
(2%)
0 l 1Yo
WIDE
2
s T R A T E G y
DISTRIBUTION
PROMOTION
SEGMENTATION I PACKAGING
PRICING
(33%)
0 5.5%
(7%)
~
6.0%
(6%)
c:=:>
2.5%
(8'Yo)
0 3.43%
LOW
(ii) Market Share
5 (9%) 1
c:===:::> 7.9%
1 (7%) 1 (25%)
c:==:::> 0 5.7% 5.13%
2 (6%) 3 (-1%)
0 • 1.7% -1%
2
MEDIUM HIGH
MARKET SHARE
STRUCTURE
4
1
s T R A T E G y
(iii) Sources of Competitive Advantage
DISTRIBUTION
PROMOTION
SEGMENTATION I PACKAGING
PRICING
(12%) 2 (31%) 4
0 0 4.9% 6.42%
(34%) 5 (5%)
~ c:=:::> 5.62% 4.1%
(201..) I (9%)
c:.:> 0 1.38% 1.54'X.
(8%) 2
0 3.43%
FEW AVERAGE MANY
NUMBER OF SOURCE OF COMPETITIVE ADVANTAGE
STRUCTURE
I
5
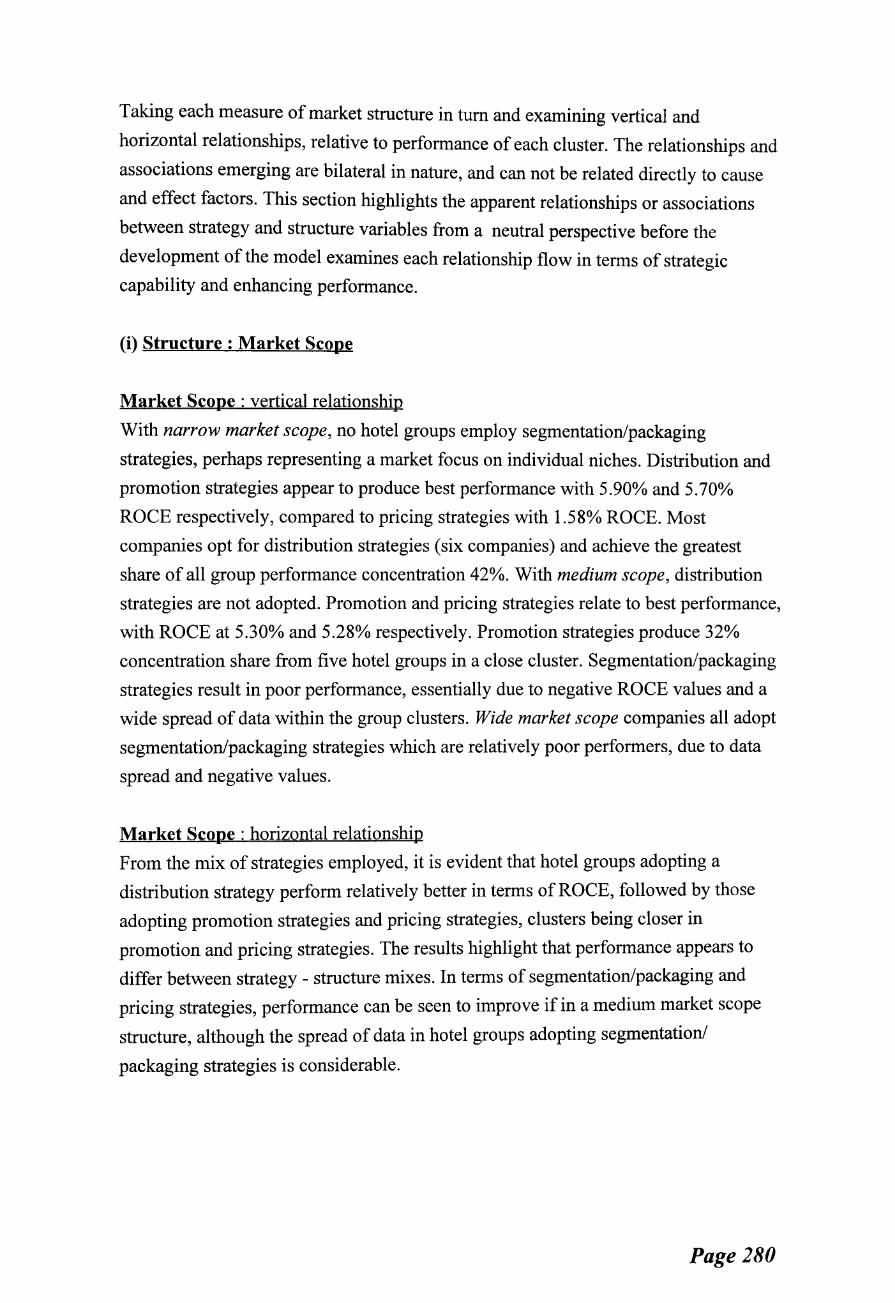
Taking each measure of market structure in tum and examining vertical and
horizontal relationships, relative to performance of each cluster. The relationships and
associations emerging are bilateral in nature, and can not be related directly to cause
and effect factors. This section highlights the apparent relationships or associations
between strategy and structure variables from a neutral perspective before the
development of the model examines each relationship flow in terms of strategic
capability and enhancing performance.
(i) Structure: Market Scope
Market Scope : vertical relationship
With narrow market scope, no hotel groups employ segmentation/packaging
strategies, perhaps representing a market focus on individual niches. Distribution and
promotion strategies appear to produce best performance with 5.90% and 5.70%
ROCE respectively, compared to pricing strategies with 1.58% ROCE. Most
companies opt for distribution strategies (six companies) and achieve the greatest
share of all group performance concentration 42%. With medium scope, distribution
strategies are not adopted. Promotion and pricing strategies relate to best performance,
with ROCE at 5.30% and 5.28% respectively. Promotion strategies produce 32%
concentration share from five hotel groups in a close cluster. Segmentation/packaging
strategies result in poor performance, essentially due to negative ROCE values and a
wide spread of data within the group clusters. Wide market scope companies all adopt
segmentation/packaging strategies which are relatively poor performers, due to data
spread and negative values.
Market Scope : horizontal relationship
From the mix of strategies employed, it is evident that hotel groups adopting a
distribution strategy perform relatively better in terms of ROCE, followed by those
adopting promotion strategies and pricing strategies, clusters being closer in
promotion and pricing strategies. The results highlight that performance appears to
differ between strategy - structure mixes. In terms of segmentation/packaging and
pricing strategies, performance can be seen to improve if in a medium market scope
structure, although the spread of data in hotel groups adopting segmentation/
packaging strategies is considerable.
Page 280
(ii) Structure : Market Share
Market Share : vertical relationship
When market share is low, best performance appears to be achieved by hotel groups
adopting a promotion (6.00%) or distribution (5.50%) strategy, although data is
widely skewed. Pricing strategies show more skewed data but good levels of
performance (3.43%), while segmentation/packaging strategies display poorest
performance when in low market share (2.50%). Distribution strategies are clearly the
best ROCE performing strategy in medium market share structures (7.90%), followed
by promotion (5.70%) and then segmentation/packaging (1.70%). High market share structures clearly show that segmentation/packaging strategies result in negative
ROCE performance ( -1.00% ), while promotion strategies, (used by most groups with
high share) produce considerably better levels ofROCE (5.13%). No other strategies
are adopted by high market share hotel groups.
Market Share : horizontal relationship
In general, distribution and promotion strategies produce best performance and are
adopted by the majority of hotel groups- (these are also two strategies most likely to
be available to hotel groups as opposed to independent unaffiliated hotels and as such
emphasise the dominant nature of hotel groups in the market). Distribution strategies
appear to provide further improved performance when adopted in medium market
share structures, while promotion and segmentation/packaging strategies provide
increasing performance as market share is lowered. Promotion strategies perform
considerable better than segmentation/packaging. Pricing strategies display a wide
spread of data with poor performance.
(iii) Structure : Competitive Advantage
Competitive Advantage : vertical relationship
Promotion strategies show a clear cluster when related to few sources of competitive advantage, and show a considerable resulting ROCE performance (5.62%). This
indicates a useful strategy for hotel groups with few sources of advantage.
Performance is better where distribution (4.90%) and promotion (5.62%) strategies
are used, and poorer when pricing (3.43%) or segmentation (1.38%) strategies are
used. In clusters with average sources of competitive advantage, all hotel groups with
this number of sources, adopt distribution strategies with an excellent performance
(6.42%) and large ROCE concentration share (31 %). For groups with many sources of competitive advantage, two strategies are adopted, promotion, and
Page 281
segmentation/packaging. Promotion strategies appear to offer best ROCE ( 4.1%)
while segmentation/packaging are poorer performers (1.54%) and have data that is
widely skewed, although more commonly used.
Competitive Advantage : horizontal relationship
Hotel groups adopting distribution or segmentation/packaging strategies appear to
perform better with the more sources of competitive advantage they can achieve. On
the other hand, those hotel groups adopting promotion strategies appear to perform
better with fewer sources of advantage. Pricing strategy again shows a wide spread of
data. The main form of competitive advantage can be seen to be image or brand
(Chapter 8) which may explain why groups with few sources of advantage adopt
promotion strategies, in an attempt to gain brand image with the resources available.
This may also reflect the maturing nature of the CSHB market.
(iv) Market Structure-CSHB Strategy-ROCE Performance : Summary
Using ROCE as a performance measure, the relative performance of each structure
CSHB strategy measure can be summarised as:
Market Scope
Distribution strategies in narrow scope, and promotion strategies in narrow or medium
scope appear to produce good ROCE performance. When using
segmentation/packaging strategies performance appear lower particularly in a wide
scope market, as is performance of pricing in a narrow scope market. The implications
of such market scope-strategy relationships are that hotel groups may consider
moving to distribution or promotion strategies to improve their ROCE performance.
Alternatively, if they are intent on maintaining a segmentation/packaging strategy, or
pricing strategy, they may attempt to move towards a medium market scope structure
to enhance ROCE. Either way, such developments would influence conduct in the
market and ultimately the market structure of the future.
Market Share
Performance in terms of ROCE appears to be enhanced by hotel groups adopting
distribution and promotion strategies, with indications that reducing market share
enhances ROCE. This contradicts concepts of scale or experience curve economies
(Hedley 1987), yet supports work by Porter (1980), establishing that large market
share does not necessarily enhance performance. The implications of such findings are
considerable to the improvement of CSHB performance of smaller operators ( 60o/o of
Page 282
the hotel industry in the UK) or to individual hotels which are part of the larger group
but display characteristic of smaller operations i.e. low market share.
Competitive Advantage
While it may appear obvious that in general, the more sources of advantage the better
performance. An interesting development is the performance achieved by hotel groups
adopting promotional strategies with few sources of advantage. This may imply that
groups that are "stuck" with few sources of competitive advantage should consider
developing a promotional strategy based upon the advantage(s) they hold.
The overall implications of market structure-CSHB strategy relationships upon ROCE
appear to indicate that hotel groups produce higher ROCE by achieving certain
structure-strategy mixes.
• Distribution strategies appear to provide best results in narrow market scope and
medium market share structures, with average sources of competitive advantage.
• Promotion strategies appear to enhance ROCE if adopted in medium market scope,
high market share and with few sources of competitive advantage.
• Pricing strategies appear to enhance ROCE when adopted in medium market
scope, low market share structures with few sources of competitive advantage.
• Segmentation/packaging strategies generally perform poorer than the other
strategies in terms of ROCE.
As shall be explored later (10.3.5), the performance measure at industry level may
also be an indication of strategic capability. Given this perspective, the hotel group
with the greatest strategic capability (and perhaps available resources) may adopt a
wider range of CSHB strategies. In attempts to gain competitive advantage such
groups are more able to implement the more costly prime strategies of distribution
and promotion and perhaps use other less costly strategies (or tactics) in support of the
prime. This summary represents the strategy perspective implying that strategy
follows market structure. This in itself is an area for further debate but is justified in
that strategy is potentially more susceptible to dynamic change than the market
structure and therefore highlights an area allowing operationalisation.
Page 283

1 0.3.2 Structure - Strategy - Gearing
This section determines the relationship between hotel groups using gearing as a
performance measure. Again, each structure variable is examined, beginning with
market scope. Figure 10.3.2a shows the structure-strategy matrix for the performance
measure of gearing. Each market structure measure is examined in turn, exploring key
vertical, horizontal and summary relationships.
Page 284
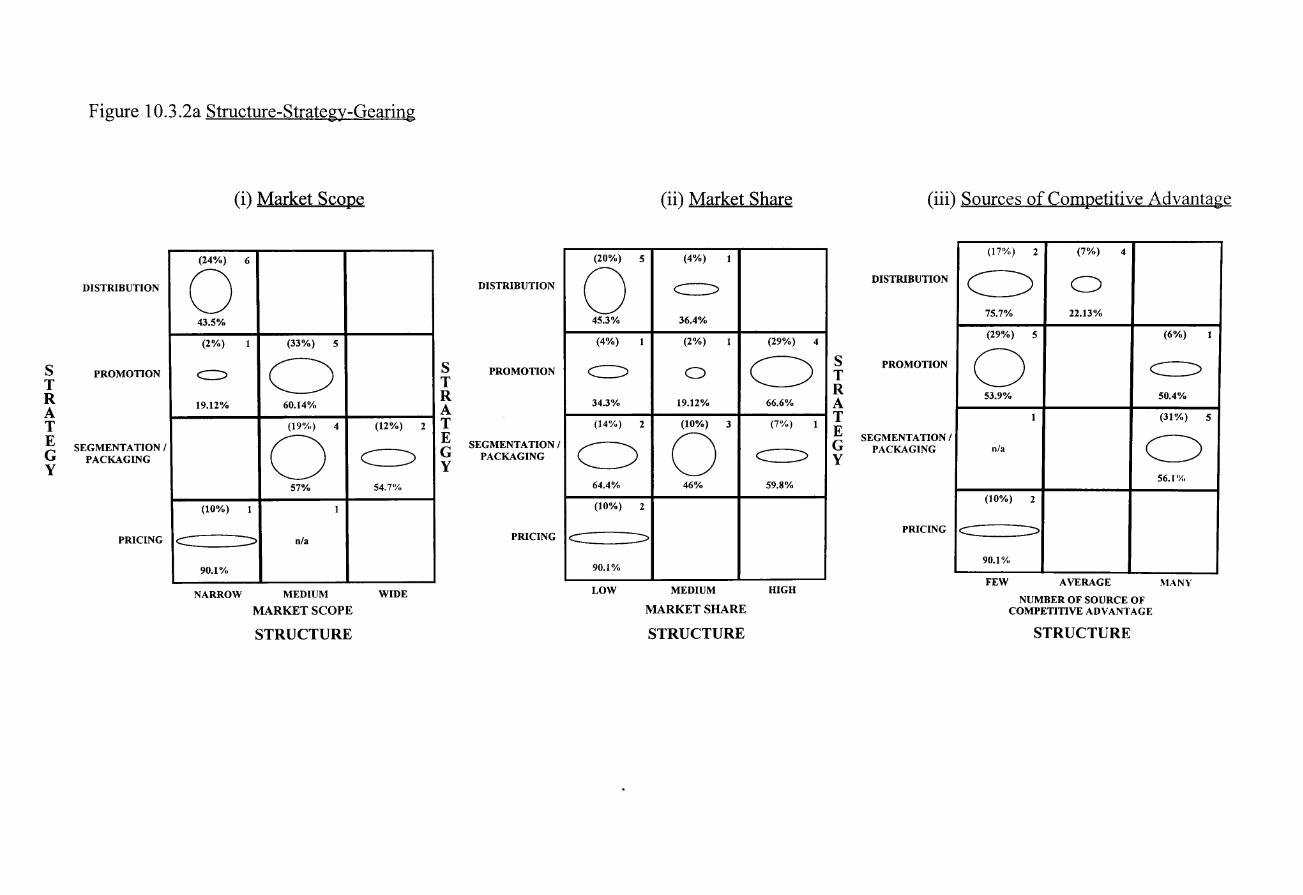
s T R A T E G y
Figure 10.3.2a Structure-Strategy-Gearing
DISTRIBUTION
PROMOTION
SEGMENTATION I PACKAGING
PRICING
(i) Market Scope
(24%) 6
0 43.5%
(2%) 1 (33%) s
c=:> C) 19.12% 60.14%
(19'Y,,) 4 (12%) 2 I
0 c=:> 57% S4.7'X,
(10%) 1 1
c =::> n/a
90.1% ---
NARROW MEDIUM WIDE
MARKET SCOPE
STRUCTURE
s T R A T E G y
DISTRIBUTION
PROMOTION
SEGMENTATION I PACKAGING
PRICING
(ii) Market Share
(20%) s (4%) 1
0 c=::> 45.3% 36.4%
(4%) 1 (2%) 1 (29%) 4
~ 0 C) 34.3% 19.12% 66.6%
(14'Yo) 2 (10%) 3 (7"!..) 1
C) 0 c=:::> 64.4% 46% 59.8%
(10%) 2
c :::>
90.1%
LOW MEDIUM HIGH
MARKET SHARE
STRUCTURE
s T R A T E G y
(iii) Sources of Competitive Advantage
DISTRIBUTION
PROMOTION
SEGMENTATION I PACKAGING
PRICING
(17%) 2 (7%) 4
~ C)
75.7% 22.13%
(29%) s (6%)
0 c=:> 53.9% 50.4%
1 (31%)
n/a C) 56.1 'X.
(10%) 2
~
90.1%
FEW AVERAGE MANY
NUMBER OF SOURCE OF COMPETITIVE ADVANTAGE
STRUCTURE
1
s

(i) Structure : Market Scope
Market Scope : vertical relationship
In this case, the higher the gearing figure, the more debt burden is being incurred by
the strategic group cluster. While it is equally dangerous to have no debt, this section,
in the absence of industry norms, will treat low gearing as a higher form of
performance.
In terms of narrow market scope, it appears that poorer performers are the hotel
groups adopting pricing strategies, with 90.10% gearing. Promotion strategies provide
the lowest gearing of 19.12% and distribution strategies 43.50%, although widely
skewed, this could be seen as an acceptable level of gearing and therefore good
performance. Hotel groups operating in the medium scope markets appear to have
consistent levels of gearing between 60.14% for promotion strategies and 57.00% for
segmentation/packaging. Promotion strategies have a relatively close cluster while
segmentation/packaging clusters appear widely skewed. The two hotel groups with
wide market scope adopt segmentation strategies and appear to perform well with
gearing of 54.70% and closely related in terms of data spread.
Market Scope : horizontal relationship
All companies adopting a distribution strategy appear to be in narrow market scope
and produce a highly skewed, but good level of performance. The hotel groups
adopting a promotion strategy appear to perform better when in narrow scope markets
as opposed to medium, while the hotel groups adopting segmentation/packaging
strategies appear to perform better in a wide market scope as opposed to medium.
Companies adopting pricing strategies are poor performers.
(ii) Structure : Market Share
Market Share : vertical relationship
The hotel groups operating in a medium market share appear to achieve lower levels
of gearing, especially when adopting promotion (19.2%) or distribution (36.40%)
strategies. The poorest performer is the pricing strategy (90.10%) in the low market share, while performance in a low market share appears to be enhanced by adopting
promotion (34.30%), or distribution strategies (figures for distribution are highly
skewed), or even segmentation/packaging strategies (64.40%). In a high market share, most hotel groups appear to adopt promotion strategies and have high gearing
Page 286
(66.60%), while in the same market structure hotel groups adopting
segmentation/packaging have lower gearing (59.80%).
Market Share : horizontal relationship
In all forms of strategy adopted, gearing performance appears to improve as the
market scope moves away from the poles and into a position of medium market share.
Again, the pricing strategy is a poor performer, presumably due to the perils of what
could be classed as discounting, (see Chapter 3).
(iii) Structure : Competitive Advantage
Competitive Advantage : vertical relationship
The hotel groups operating in the CSHB market with few sources of competitive advantage on the whole, appear to show poorer performance than the groups with
average or many sources. Performance appears worse when the few sources hotel
groups adopt a pricing strategy (90.1 0% ), yet is improved, moving to distribution
(75.70%), and promotion (53.90%) strategies, the latter being considerably skewed.
All the groups with average sources of competitive advantage (i.e. between 3 and 4
sources) adopt distribution strategies and show considerably better gearing
performance with 22.13% and a solid cluster. Of the two strategies adopted in the
many sources of competitive advantage structure, promotion strategies appear to
perform better than segmentation/packaging strategies.
Competitive Advantage : horizontal relationship
Hotel groups adopting distribution strategies in average sources structure appear to
perform better than those in few sources. Similarly, promotion strategies with many
sources appear to perform better than those with few. It would therefore appear that
the more sources of advantage, the better the gearing performance, again, pricing
strategies perform worst.
(iv) Market Structure-CSHB Strategy-Gearing Performance: Summary
Using Gearing as a performance measure, the relative performance of each structure
CSHB strategy relationship can be summarised as :
Market Scope : Performance in terms of gearing appears closely linked between groups. Two clear
patterns emerge. Hotel groups adopting pricing strategies in a narrow market scope
Page 287
appear to be poor performers. Hotel groups adopting promotion strategies in a narrow
scope seem to be high performers. The implications are that to improve performance
with regard to market scope, hotel groups may seek to widen market scope with
segmentation/packaging strategies or narrow market scope with distribution or
promotion strategies.
Market Share :
Enhancing gearing performance appears to be achievable if moving towards a
promotion or distribution strategy and/or medium market share. However, if keeping
a wide market share, moving towards a segmentation/packaging strategy appears to
improve performance. The implications are that hotel groups may seek a medium
market share to enhance performance or identify specific strategies to enhance their
position within their current market share.
Competitive Advantage :
Performance in terms of gearing appears to improve with the greater number of
sources of advantage. Hotel groups should consider moving to either an average
number of sources with a distribution strategy, or if they have few or many sources of
advantage they may consider a promotion strategy to enhance performance. Such
characteristics have obvious implications upon strategic dynamics in the CSHB
market. As it is presumed that sources of competitive advantage are always utilised to
their full potential, consideration should be given to seek additional sources of
advantage, perhaps through joint ventures or synergy from acquisition.
The overall implications of structure-CSHB strategy relationships on gearing
performance appears to indicate a need for distribution strategies in narrow market
scope and medium market share, with average sources of competitive advantage.
Similarly, promotion strategies perform better with narrow market scope, medium
market share but many sources of competitive advantage.
Segmentation/packaging strategies provide best performance when adopted in wide
market scope, medium market share and many sources of competitive advantage.
Performance indicators of pricing strategies are only available in narrow market
scope, low market share, and few sources of competitive advantage, resulting in very
poor (90.10%) gearing performance.
Page 288

1 0.3.3 Structure - Strategy - P AIT
This section establishes the relationship between each of the structural variables,
CSHB strategy and performance in profitability terms. Figure 10.3.3a shows the
structure-CSHB strategy matrix for the performance measure of profit after interest
and tax (PAIT).
Page 289
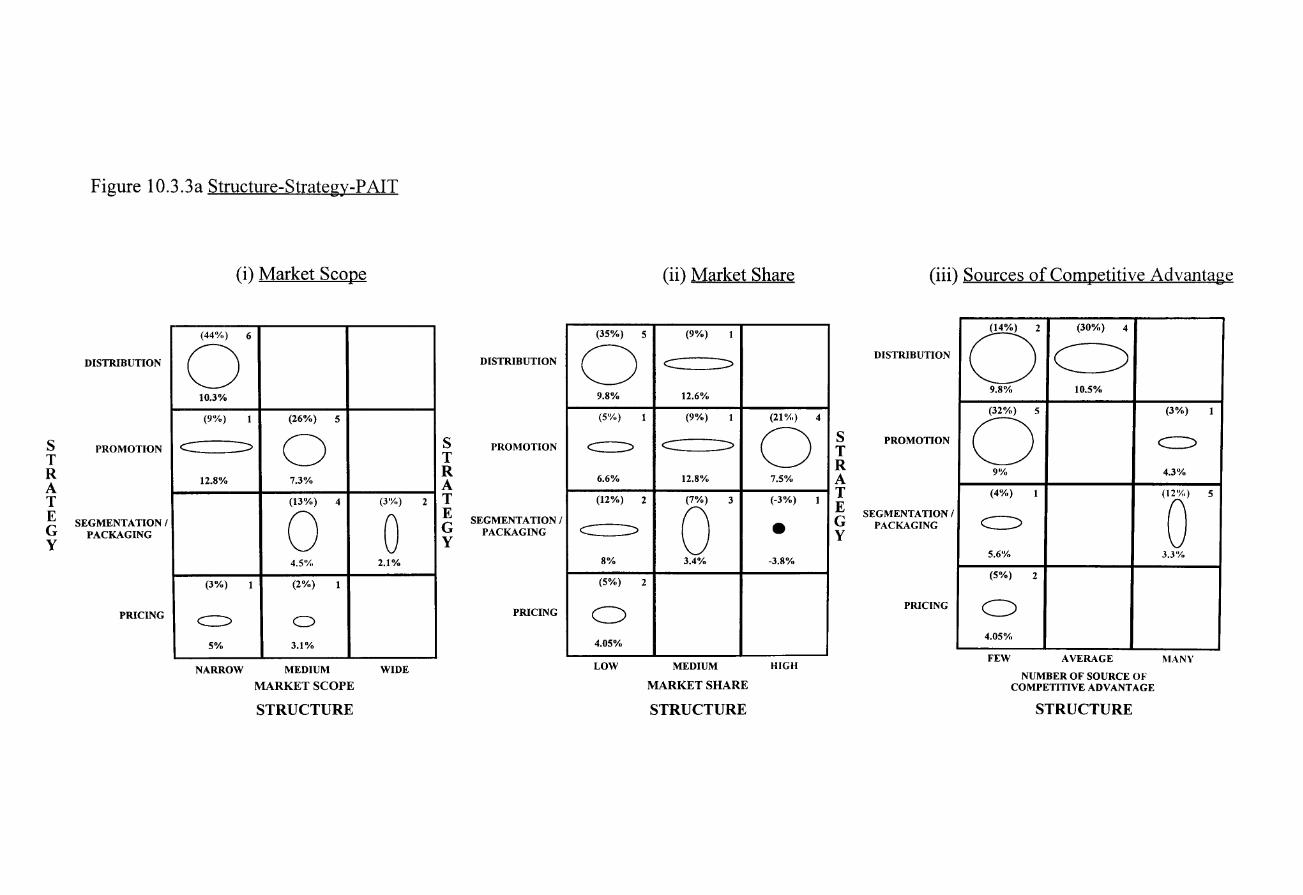
s T R A T E G y
Figure 1 0.3.3a Structure-Strategy-PAIT
DISTRIBUTION
PROMOTION
SEGMENTATION PACKAGING
PRICING
I
(i) Market Scope
(44"/..) 6
0 10.3%
(9%) 1 (26%) 5
c:==:::> 0 12.8% 7.3%
(13%) 4 (3'Y..)
0 0 4.5 4Yt, 2.1%
(3%) 1 (2%) 1
c:::> 0
5% 3.1%
NARROW MEDIUM WIDE
MARKET SCOPE
STRUCTURE
2
s T R A T E G y
DISTRIBUTION
PROMOTION
SEGMENTATION I PACKAGING
PRICING
(35%) 5
0 9.8%
(5%) 1
c=::::>
6.6%
(12%) 2
~
8%
(5%) 2
C)
4.05%
LOW
(ii) Market Share
(9%) 1
c==::::>
12.6%
(9%) 1 (21%)
c:==:::> 0 12.8% 7.5%
(7%) 3 (-3%)
0 • 3.4% -3.8%
MEDIUM HIGH
MARKET SHARE
STRUCTURE
4
1
s T R A T E G y
(iii) Sources of Competitive Advantage
DISTRIBUTION
PROMOTION
SEGMENTATION I PACKAGING
PRICING
-
0 2 (30%) 41
c=:> 9.8% 10.5%
0' (3%)
c=:> 9 1Yo 4.3%
(4%) 1
c=:> '0' 5.6% J.J%,
I-. (5%) 2
C)
L 4.05% I I FEW AVERAGE 1\IANY
NUMBER OF SOURCE OF COMPETITIVE ADVANTAGE
STRUCTURE
-
1
5
I
I
(i) Structure : Market Scope
Market Scope : vertical relationship
The emerging pattern of pricing strategies producing the poorest performance in the
narrow market scope structure is maintained in terms of profitability. Hotel groups
adopting pricing strategies achieve a P AIT of 5.0% compared to 12.8% by groups
adopting a promotion strategy and 10.3% by groups adopting a distribution strategy.
In the medium market scope promotion strategies appear to perform best (7.3%),
followed by a very highly skewed segmentation/packaging strategy (4.5%) and finally
pricing strategies with on 3.1% profit. The lowest performance is held by the two
hotel groups in a wide market scope adopting segmentation/packaging strategies and
only achieving 2.1 % profit.
Market Scope : horizontal relationship
All distribution strategies are adopted in the narrow scope and show good
performance in profitability terms. The promotional strategies are adopted in narrow
and medium market scopes with narrow scope producing best performance and
medium scope being highly skewed. Of the segmentation/packaging strategies,
performance appears to be better as the market scope is narrowed from wide to
medium. This trend is shared by the pricing strategy hotel groups who improve
performance when market scope is reduced from medium to narrow.
(ii) Structure : Market Share
Market Share : vertical relationship
Of the hotel groups with low market share, the groups operating a distribution
strategy appear to perform best with 9.8% profitability, followed by segmentation
strategies with 8.0% and promotion with 6.6%. Again pricing strategies display low
performance ( 4.05% ). As market share increases, the emphasis switches towards
promotion strategies as higher performers (12.8%), followed by distribution strategies
with 12.6% and some way behind segmentation/packaging with 3.4%. In a high market share, performance is better in the promotion strategy group (7.5%). This is
the strategy which appears to be adopted by most groups in this structural variable and
shows considerable variance between group member performance. In the high market
share, promotion would appear a more desirable strategy than
segmentation/packaging, producing 7.5% profitability compared to 3.8% loss.
Page 291

Market Share : horizontal relationship
The hotel groups adopting a distribution strategy can be seen to improve performance
as market share increases. Groups adopting promotion strategies have greatest
performance in a medium market share. These trends in essence reflect work by Porter
(1979) in establishing performance and the U-curve, highlighting that large market
share does not necessarily imply greater performance. Segmentation /packaging
strategies show greatest performance in the low market share sector, perhaps
reflecting their niche nature. Pricing strategies perform poorly, with only 4.05%
profit.
(iii) Structure : Competitive Advantage
Competitive Advantage : vertical relationship
In structures with few sources of competitive advantage, strategies of distribution and
promotion seem to produce best profitability with 9.8% and 9.0% respectively. Both
strategies produce highly skewed ellipses. Segmentation/packaging and pricing
strategies result in lower levels of performance with 5.6% and 4.05% but are less
skewed. All the hotel groups with average sources of competitive advantage adopt
distribution strategies with the best overall performance of 10.5% and relatively solid
group cluster i.e. low variance in data. Of the companies with many sources of competitive advantage, most adopt segmentation strategies which are poorer
performers than the promotion strategies and have very highly skewed figures within
the group.
Competitive Advantage : horizontal relationship
The general trend in terms of sources of advantage would appear to be that groups
adopting a distribution strategy improve performance with the more sources of
advantage. Hotel groups adopting promotion and segmentation strategies improve
performance with the fewer sources of competitive advantage. Pricing strategies
display poor performance, but on this occasion better than promotion or segmentation
strategies of companies with many sources of competitive advantage.
Page 292
(iv) Market Structure-CSHB Strategy-PAIT Performance : Summary
Using PAIT as a performance measure, the relative performance of each structure
CSHB strategy relationship can be summarised as :
Market Scope :
In general terms, profitability appears to improve as market scope narrows. Given that
profitability is a key measure for practitioners, this may explain the large number of
hotel groups that have a narrow market scope. As strategies move more to a
distribution or promotion orientation, performance appears to improve. In the long
run, hotel groups are therefore likely to either adopt a narrow market scope or adopt
distribution or promotion strategies to enhance performance.
Market Share :
In general, hotel groups with a medium to high market share should attempt to adopt
distribution or promotion strategies to improve performance. Over time, groups may
attempt to reduce market share to a medium level and further enhance performance.
Hotel groups with low market share should adopt either distribution or
segmentation/packaging strategies, thus maximising profit potential. This has
implications upon the developments in market share in terms of the number of rooms
hotel groups are willing to release to CSHB markets.
Competitive Advantage :
In general hotel groups should direct themselves towards developing distribution or
promotion strategies. Distribution strategy performance improves with more sources
of competitive advantage, while all other strategies improve with less sources of
competitive advantage. The implications of such developments provide potential for
smaller operators and perhaps expose the associated costs of widening sources of
competitive advantage e.g. profit share or joint venture costs.
As profitability is likely to play a key role in an organisations perception of
performance, this measure is likely to be the driving force behind CSHB strategy
development. The implications of this section are therefore likely to impact greatly in
terms of industry measures.
Page 293
The implications are that :
• Distribution strategies appear to produce best profitability in narrow market scope,
medium market share and with average sources of competitive advantage.
• Promotion strategies also appear to perform best in narrow market scope, medium
market share but with few sources of competitive advantage.
• Segmentation/packaging strategies seem to perform best in medium market scope,
medium market share and with few sources of competitive advantage.
• Pricing strategies appear most common with narrow/medium market scope, low
market share and few sources of competitive advantage, but provide poor (4.05%)
profitability.
The next section provides a summary of all CSHB structure-strategy and industry
level performance measures.
10.3.4 Summary of Industry Performance Strategies.
This section briefly summarises the single strategy from each measure which appears
to indicate the greatest industry level performance. Table 10.3.4a shows the
relationship between financial measures, market structure and the best performing
strategy. From table 1 0.3.4a it is evident that a number of strategies appear to clearly
provide enhanced performance across a range of market structure and performance
measures. The implications of such patterns is the potential to suggest how
organisations, at an industry level, may enhance performance. In adopting such an
approach there is a danger that such industry level performance is a result of other
markets or factors, not just the CSHB market. This perspective is taken here. What is
suggested in this case is that industry level performance is not necessarily the result of
the CSHB strategies adopted but instead, the industry performance is the driving force
behind which CSHB strategies can be adopted.
Page 294
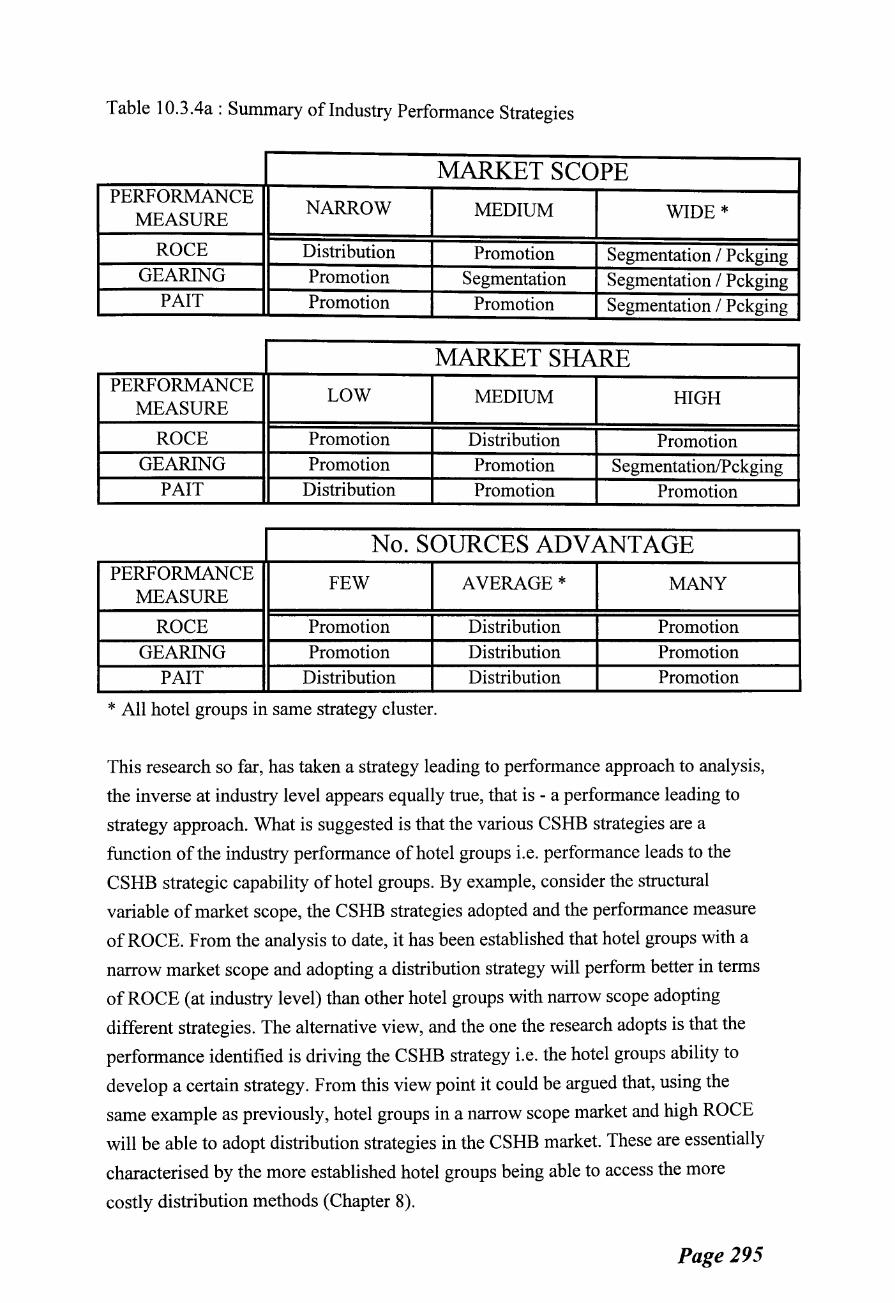
Table 10.3.4a: Summary ofindustry Performance Strategies
MARKET SCOPE PERFORMANCE
NARROW MEASURE MEDIUM WIDE*
ROCE Distribution Promotion Segmentation I Pckging GEARING Promotion Segmentation Segmentation I Pckging
PAIT Promotion Promotion Segmentation I Pckging
MARKET SHARE PERFORMANCE LOW MEDIUM
MEASURE HIGH
ROCE Promotion Distribution Promotion GEARING Promotion Promotion Segmentation/Pckging
PAIT Distribution Promotion Promotion
No. SOURCES ADVANTAGE PERFORMANCE
MEASURE FEW AVERAGE* MANY
ROCE Promotion Distribution Promotion
GEARING Promotion Distribution Promotion
PAIT Distribution Distribution Promotion
* All hotel groups in same strategy cluster.
This research so far, has taken a strategy leading to performance approach to analysis,
the inverse at industry level appears equally true, that is - a performance leading to
strategy approach. What is suggested is that the various CSHB strategies are a
function of the industry performance of hotel groups i.e. performance leads to the
CSHB strategic capability of hotel groups. By example, consider the structural
variable of market scope, the CSHB strategies adopted and the performance measure
of ROCE. From the analysis to date, it has been established that hotel groups with a
narrow market scope and adopting a distribution strategy will perform better in terms
ofROCE (at industry level) than other hotel groups with narrow scope adopting
different strategies. The alternative view, and the one the research adopts is that the
performance identified is driving the CSHB strategy i.e. the hotel groups ability to
develop a certain strategy. From this view point it could be argued that, using the
same example as previously, hotel groups in a narrow scope market and high ROCE
will be able to adopt distribution strategies in the CSHB market. These are essentially
characterised by the more established hotel groups being able to access the more
costly distribution methods (Chapter 8).
Page 295
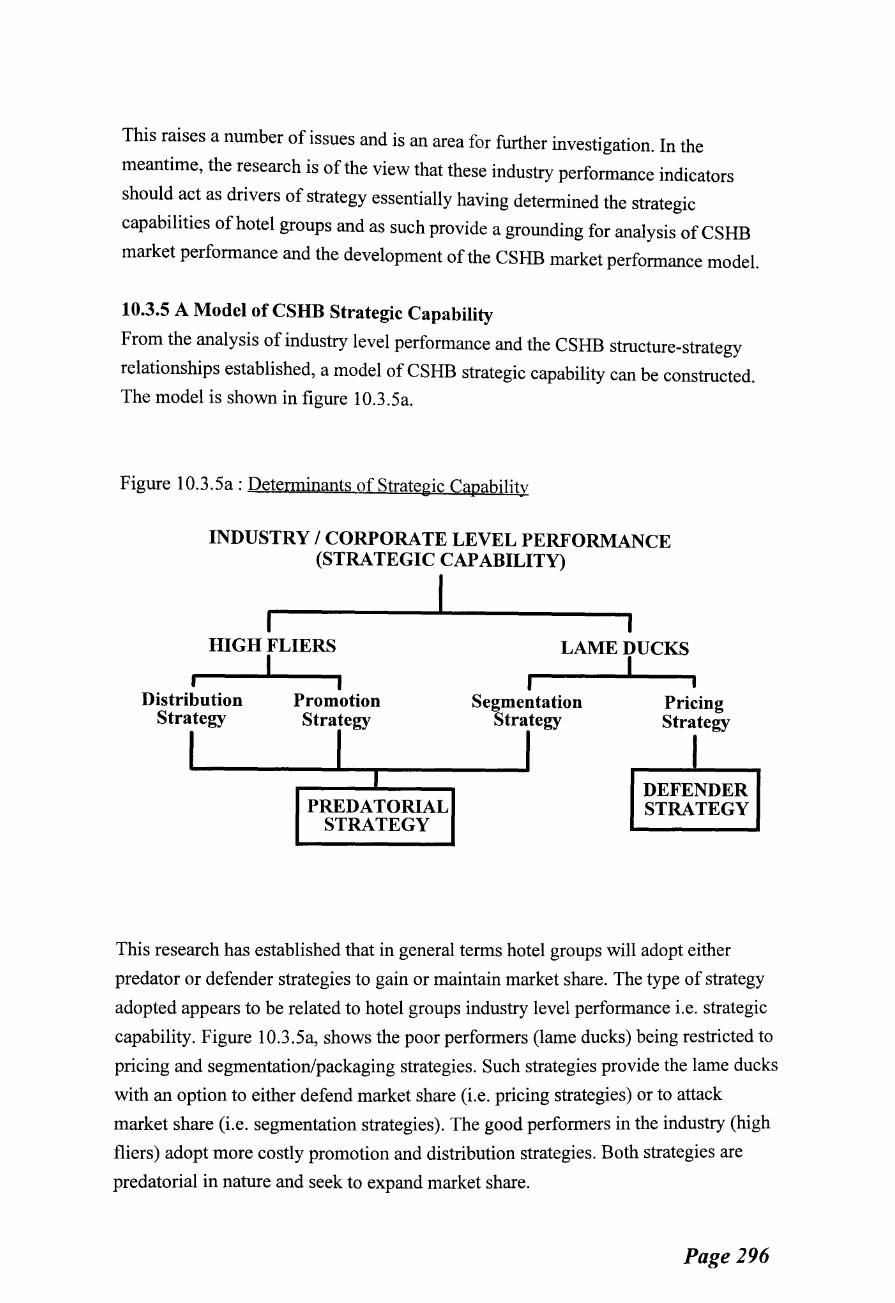
This raises a number of issues and is an area for further investigation. In the
meantime, the research is of the view that these industry performance indicators
should act as drivers of strategy essentially having determined the strategic
capabilities of hotel groups and as such provide a grounding for analysis of CSHB
market performance and the development of the CSHB market performance model.
1 0.3.5 A Model of CSHB Strategic Capability
From the analysis of industry level performance and the CSHB structure-strategy
relationships established, a model of CSHB strategic capability can be constructed.
The model is shown in figure 10.3.5a.
Figure 10.3.5a: Determinants of Strategic Capability
INDUSTRY/CORPORATELEVELPERFORMANCE (STRATEGIC CAPABILITY)
I I
HIGH FLIERS
I Distribution
Strategy
I I
Promotion Strategy
I PREDATORIAL
STRATEGY
I
I
LAME DUCKS I
Segmentation Strategy
I Pricing Strategy
DEFENDER STRATEGY
This research has established that in general terms hotel groups will adopt either
predator or defender strategies to gain or maintain market share. The type of strategy
adopted appears to be related to hotel groups industry level performance i.e. strategic
capability. Figure 10.3.5a, shows the poor performers (lame ducks) being restricted to
pricing and segmentation/packaging strategies. Such strategies provide the lame ducks
with an option to either defend market share (i.e. pricing strategies) or to attack
market share (i.e. segmentation strategies). The good performers in the industry (high
fliers) adopt more costly promotion and distribution strategies. Both strategies are
predatorial in nature and seek to expand market share.
Page 296

Having determined the strategic capability of organisations in the CSHB market, the
question arises as to how performance specifically in the CSHB market can be
enhanced by the way in which hotel groups organise their resources i.e. strategy,
within the confines of their strategic capability. The next section determines CSHB
level performance relative to CSHB strategies adopted and highlights areas of
performance enhancement.
Page 297
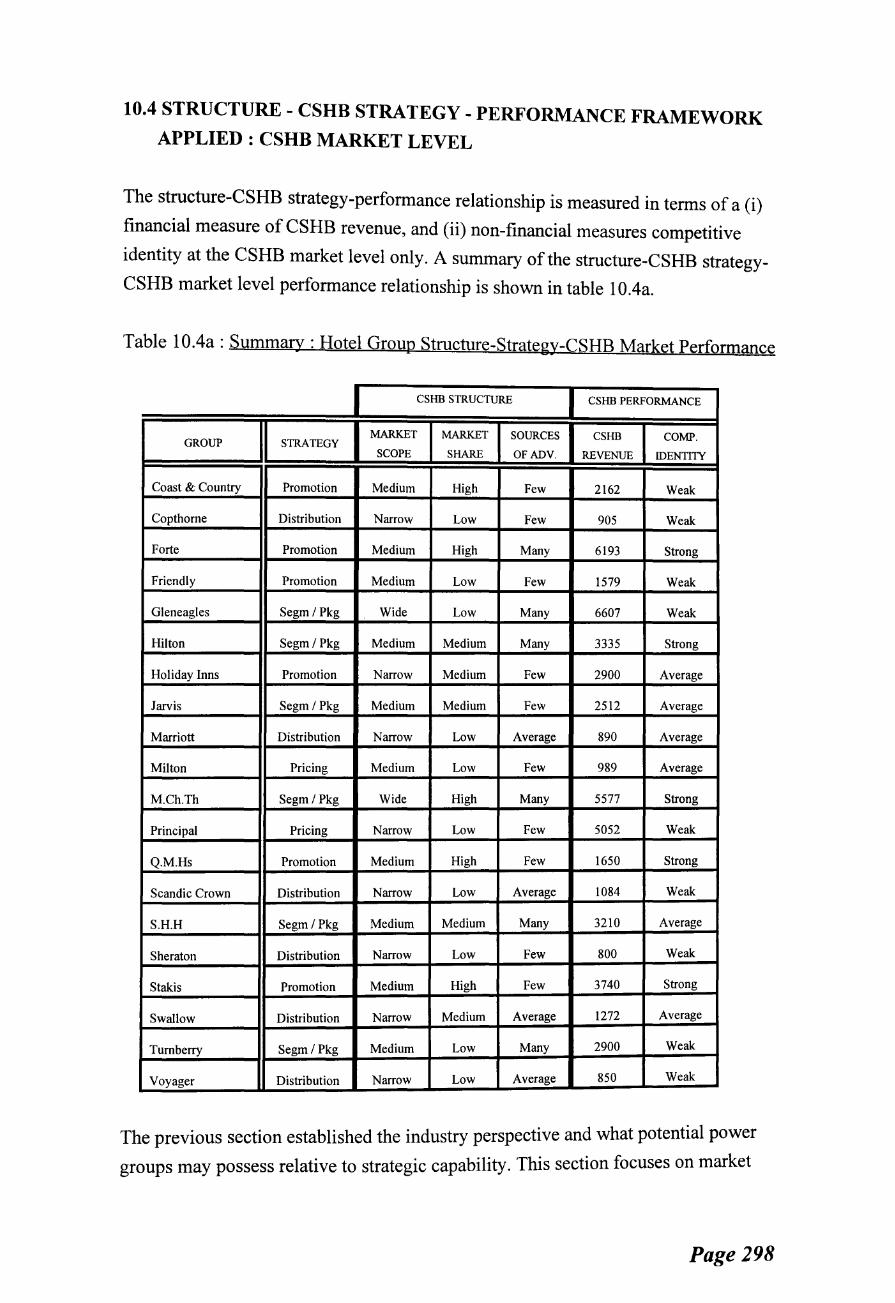
10.4 STRUCTURE- CSHB STRATEGY- PERFORMANCE FRAMEWORK
APPLIED : CSHB MARKET LEVEL
The structure-CSHB strategy-performance relationship is measured in terms of a (i)
financial measure of CSHB revenue, and (ii) non-financial measures competitive
identity at the CSHB market level only. A summary of the structure-CSHB strategy
CSHB market level performance relationship is shown in table 10.4a.
Table 1 0.4a : Summary : Hotel Group Structure-Strategy-CSHB Market Performance
CSHB STRUCTURE CSHB PERFORMANCE
MARKET MARKET SOURCES CSHB COMP. GROUP STRATEGY SCOPE SHARE OF ADV. REVENUE IDENTITY
Coast & Country Promotion Medium High Few 2162 Weak
Copthorne Distribution Narrow Low Few 905 Weak
Forte Promotion Medium High Many 6193 Strong
Friendly Promotion Medium Low Few 1579 Weak
Glen eagles Segm I Pkg Wide Low Many 6607 Weak
Hilton Segm/Pkg Medium Medium Many 3335 Strong
Holiday Inns Promotion Narrow Medium Few 2900 Average
Jarvis Segm I Pkg Medium Medium Few 2512 Average
Marriott Distribution Narrow Low Average 890 Average
Milton Pricing Medium Low Few 989 Average
M.Ch.Th Segm/Pkg Wide High Many 5577 Strong
Principal Pricing Narrow Low Few 5052 Weak
Q.M.Hs Promotion Medium High Few 1650 Strong
Scandic Crown Distribution Narrow Low Average 1084 Weak
S.H.H Segm/Pkg Medium Medium Many 3210 Average
Sheraton Distribution Narrow Low Few 800 Weak
Stakis Promotion Medium High Few 3740 Strong
Swallow Distribution Narrow Medium Average 1272 Average
Turn berry Segm/Pkg Medium Low Many 2900 Weak
Voyager Distribution Narrow Low Average 850 Weak
The previous section established the industry perspective and what potential power
groups may possess relative to strategic capability. This section focuses on market
Page 298
level performance specific to CSHB to determine how CSHB market level
performance can be enhanced.
10.4.1 Structure- Strategy- CSHB Revenue
The former sections have provided an industry analysis that relates industry
performance measures to a specific market strategy i.e. the CSHB market. There are
obviously many factors affecting the overall performance of a hotel group in an
industry of which CSHB strategies are a part. However, what the previous section has
established is the underlying performance relationships (or associations) between
CSHB strategies and the companies general performance, providing indications of
where environmental factors may effect results and adding a further dimension to the
research design. This section focuses on the CSHB market and provides a market
level perspective to the structure-CSHB strategy-performance relationship to be
considered in the context of the industry performance as a whole. The findings of this
section are the core of the CSHB performance enhancement model developed in
section 1 0.6.
The performance measure for the CSHB market level analysis is the average CSHB
revenue per room per annum 1991/2. This measure represents direct CSHB market
value and provides an indication of "top line" performance. Such a measure reduces
the effect of any potential scale economies upon the cost base of the operation not
necessarily specifically related to CSHB provision. Figure 10.4.1a shows the
structure-CSHB strategy matrix using CSHB revenue as a performance measure.
Page 299
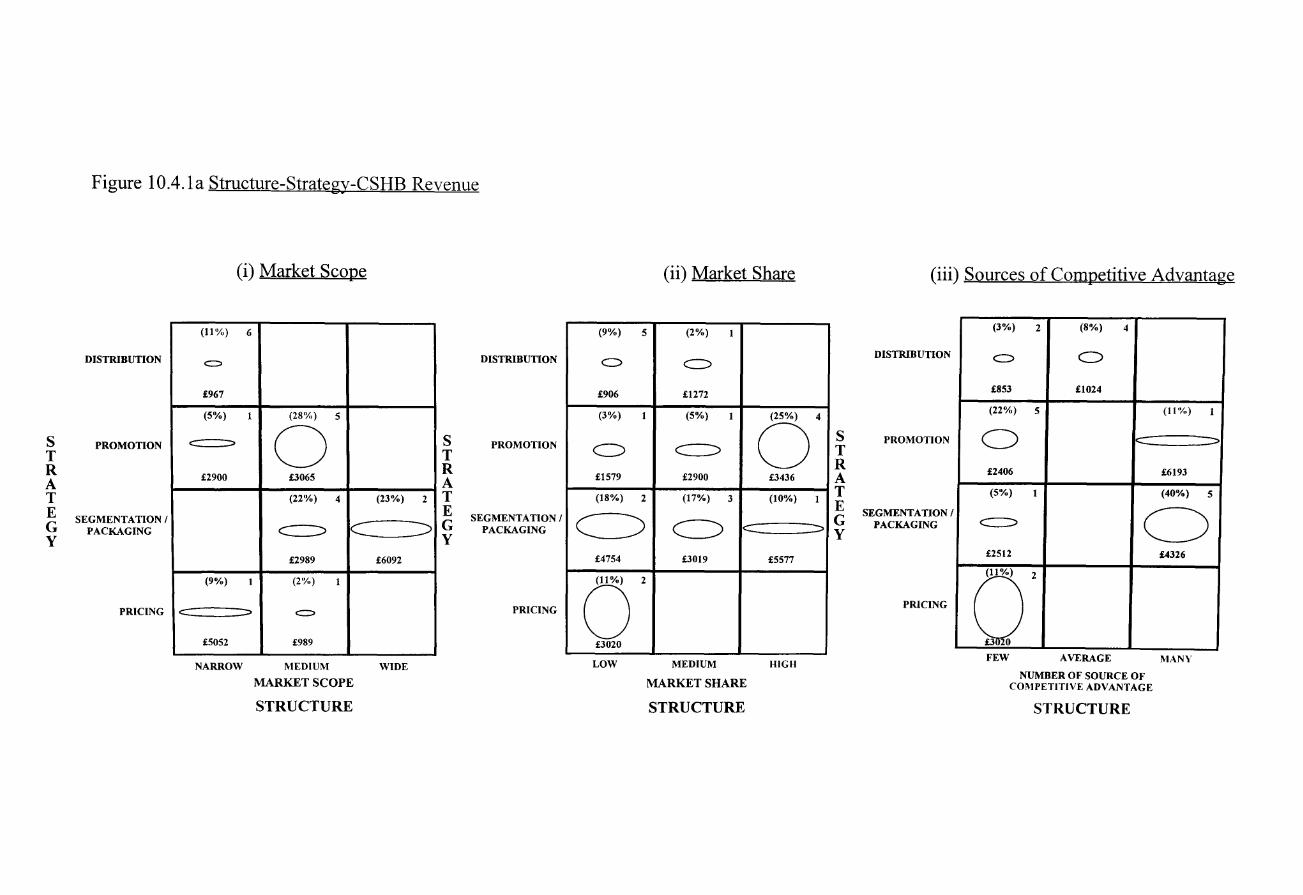
s T R A T E G y
Figure 10.4.1a Structure-Strategy-CSHB Revenue
DISTRIBUTION
PROMOTION
SEGMENTATION PACKAGING
PRICING
'
(i) Market Scope
(11%) 6
c::>
£967
(5"/o,) 1 (28%.) 5
c:::::=.:::::> 0 £2900 £3065
(22%) 4 (23%) 2
c=::> c:==::> £2989 £6092
(9%) 1 (2'!/o) 1
c:: ::::> <:::>
£5052 £989
NARROW MEDIUM WIDE
MARKET SCOPE
STRUCTURE
I
!
s T R A T E G y
DISTRIBUTION
PROMOTION
SEGMENTATION I PACKAGING
PRICING
(9%) 5
c:::>
£906
(3%) 1
C)
£1579
(18%) 2
~ £4754
0 2
£3020
LOW
(ii) Market Share
(2%) 1
~
£1272
(5%) 1 (25%) 4
c=:::> 0 £2900 £3436
(17%) 3 (10%) 1
c=:> c:::: -:::>
£3019 £5577
MEDIUM HIGH
MARKET SHARE
STRUCTURE
i
s T R A T E G y
(iii) Sources of Competitive Advantage
DISTRIBUTION
PROMOTION
SEGMENTATION PACKAGING
PRICING
I
(3%) 2 (8%) 4
c:::> 0
£853 £1024
(22%) 5 (II'X.) 1
0 :>
£2406 £6193
(5%) 1 (40%) 5 '
c::::> C) £2512 £4326
0' FEW AVERAGE !\I ANY
NUMBER OF SOURCE OF COMPETITIVE ADVANTAGE
STRUCTURE

(i) Market Scope
From figure 1 0.4.1 (i) it can be seen that all the companies adopting a distribution
strategy appear to also have narrow market scope and considerably lower performance
£967. This is contradictory to industry level analysis and supporting the concept that
industry level analysis provided an indication of strategic capability, not performance.
The greatest stable revenue earning cluster appears to be composed of companies
implementing segmentation/packaging strategies, with medium market scope £2989,
and even better with wide market scope, £6092. The wider the market scope the more revenue appears to be generated. This is the only prime strategy adopted by
companies with a wide scope, and none of the companies adopting this strategy have a
narrow scope. This area warrants further investigation, particularly in the field of
entry barriers, (Porter 1980).
Most companies adopting a promotion strategy are of medium scope with an average
CSHB revenue per room per annum of £3065 but a very large spread of data
indicating instability in the cluster performance. This would provide opportunities for
members of this cluster to enhance performance by attempting to shift in strategic
space to a strategic cluster offering higher financial rewards.
The remaining three companies are not members of specific clusters, however, they
do reveal the individual hotel group market scope-CSHB strategy-performance
relationship, with pricing strategies in a narrow scope producing considerable
performance per room (presumably in volume terms, as a percentage of total revenue,
or an upward niche pricing policy), and pricing in a medium scope indicating poorest
performance, perhaps indicating a need to focus more on niches to improve
performance.
(ii) Market Share
While the clusters are considerably more widespread and generally smaller in nature,
some patterns do emerge.
Hotel groups with a high market share of room stock offered to CSHB markets adopt
promotional strategies essentially in the form of branding, with a performance level of
£3436 and a wide spread of data (high ellipse). Other hotel group with high market
share adopt packaging strategies and achieves considerably higher performance at
£5577. This indicates a potential option for companies in the promotional strategy
space to perhaps move into a segmentation/packaging strategy space. In general, high
Page 301

market share companies only adopt segmentation/packaging or promotion prime
strategies. Of the medium market share clusters, the results indicate poorer
performance by the hotel group adopting a distribution strategy and comparable
performance between those adopting packaging and promotion strategies. None of the
medium share clusters adopt pricing strategies. The low market share clusters indicate
the full range of strategies employed, with segmentation/packaging showing £4754
and low skew. This indicates stable results and high revenue potential. Pricing
strategies produce for some hotel groups high performance based on small size.
Promotion strategies are used less by low share hotel groups and result in poorer
performance than other companies adopting promotion strategies with a higher market
share.
Again, the poorer performance of clusters adopting distribution strategies is
highlighted, indicating that most hotel groups using distribution strategies as their
prime are of low share, and perform less well £906 with fairly consistent results (low
skew). Such hotel groups should perhaps consider moving in strategic space from a
prime strategy of distribution to one of segmentation/packaging, supported by
distribution. Segmentation/packaging and promotion strategies appear to be adopted
across the range of hotel group market shares, with higher performance in the
segmentation/packaging strategy clusters and more of an emphasis on market share in
the promotion strategies with performance improving with market share.
(iii) Number of Sources of Competitive Advantage
From figure 10.4.la, it is evident that hotel groups adopting a segmentation/packaging
strategy tend to have many sources of competitive advantage and achieve higher
performance than the hotel groups that have fewer advantage sources. This may be
due to the composition of the packages and areas of potential synergistic advantage.
As such, this area warrants further more detailed investigation, and forms a separate
study. In contrast, hotel groups adopting a promotion strategy appear to have fewer
sources of competitive advantage and achieve lower performance. In general, it would
appear that the sources of competitive advantage have a considerable affect on the
type of strategy adopted either at the strategic choice stage, or simply the capabilities
to implement the strategy. This concept is reflected in the strategic capability model
developed in section 10.3.5.
Of the hotel groups adopting distribution strategies, performance is again relatively
stable. Higher performance (although comparatively poorer than other strategies
adopted) is achieved by clusters with an average as opposed to few sources of
Page 302
competitive advantage. The main source of competitive advantage being image or
brand (Chapter 8). Both pricing strategy hotel groups have few sources of competitive
advantage and result in a wide spread of data.
(iv) Structure-CSHB Strategy-CSHB Revenue : Summary
The result of this analysis has found considerable differences between market and
industry measures of performance. While industry level performance has established
CSHB strategic capability, CSHB market level performance has highlighted distinct
differences in hotel group clusters.
• Distribution strategies are adopted in narrow market scope only and perform better
when combined with medium market share and average sources of competitive
advantage. Overall however, this is the worst performing strategy.
• Promotion strategies perform best in medium market scope structures, with high
market share and many sources of competitive advantage.
• Segmentation/packaging strategies appear to perform best in wide market scope,
high market share market structures and with many sources of competitive
advantage.
e Pricing strategies performance is enhanced in niche markets (narrow market
scope) and with low market share and few sources of competitive advantage.
These issues imply the potential for hotel companies to move between clusters by
changing strategy and/or structure in attempts at improving CSHB performance. This
issue is termed movements in strategic space and is examined in section 10.5 before
the construction of a CSHB performance enhancement model. Before constructing the
model, the next section explores the non-financial performance of CSHB market
strategic clusters to highlight a more qualitative measure of performance.
Page 303
10.4.2 Structure- Strategy- CSHB Competitive Identity
This section relates non-financial performance in the form of peer competitive identity
to strategies adopted by hotel groups operating in the CSHB market in Scotland,
revolving around the various structure variables. This provides a further qualitative
element to the research and indicates which structure-CSHB strategy combinations
appear to offer greatest CSHB peer competitive identity. While the results of this
section are not an integral part of the CSHB performance enhancement model - due to
their dynamic nature - they are an important element of understanding the market
perspective for operationalising the model. It is anticipated that organisations with
strong competitive identity will be viewed as market leaders and will be subjected to
closer scrutiny by competitors. Such developments imply that the strong identity
organisations will play a major role in shaping the future structure of CSHB markets
as less "identified" organisations seek to follow their evident strategies. From this
perspective a further proactive and dynamic element is added to the research. Figure
1 0.4.2a shows the structure-strategy matrix using CSHB peer competitive identity as a
performance measure.
Page 304
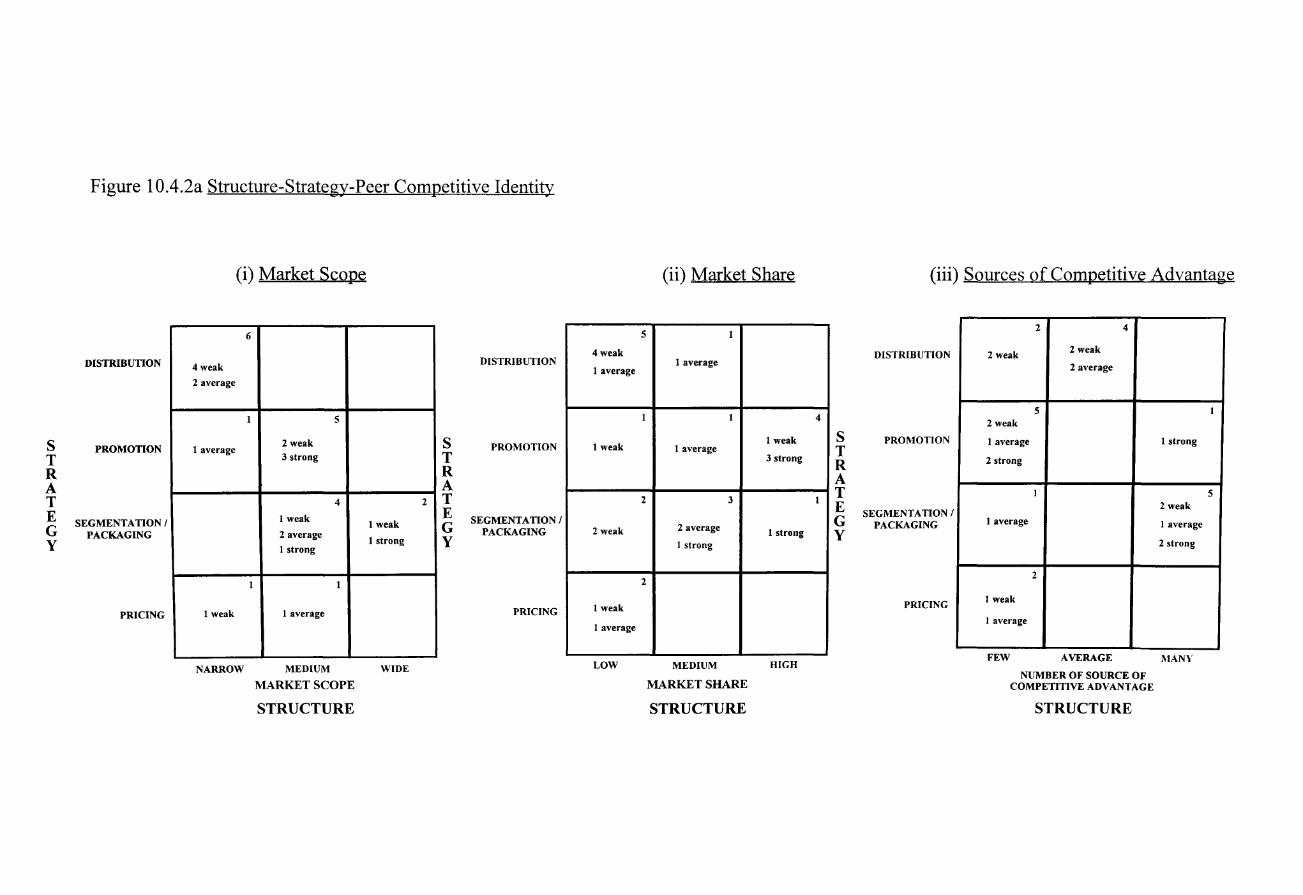
s T R A T E G y
Figure 10.4.2a Structure-Strategy-Peer Competitive Identity
DISTRIBUTION
PROMOTION
SEGMENTATION I PACKAGING
PRICING
(i) Market Scope
6
4weak
2 average
1 5
2weak 1 average
3 strong
4
I weak
2 average
I strong
I I
I weak I average
NARROW MEDIUM
MARKET SCOPE
STRUCTURE
2
I weak
I strong
J WIDE
s T R A T E G y
DISTRIBUTION
PROMOTION
SEGMENTATION I PACKAGING
PRICING
5
4weak
I average
I
I weak
2
2weak
2
I weak
I average
LOW
(ii) Market Share
1
1 average
I
1 average
3
2 average
I strong
MEDIUM
MARKET SHARE
STRUCTURE
1 weak
3 strong
1 strong
HIGH
4
I
'
s T R A T E G y
(iii) Sources of Competitive Advantage
DISTRIBUTION
PROMOTION
SEGMENTATION I PACKAGING
PRICING
2 4
2weak 2weak
2 average
5 2weak
I average I strong
2 strong
I 2weak
1 average I average
2 strong
2
I weak
I average
L..,____ ________
FEW AVERAGE MANY
NUMBER OF SOURCE OF COMPETITIVE ADVANTAGE
STRUCTURE
I
5
(i) Market Scope
Hotel groups with a strong competitive identity tend to have medium to wide market
scope. Distribution and pricing strategies display no indications of strong group
identities, which when combined with the CSHB market analysis previously would
imply that the better performing strategies are also where hotel groups have been
identified as strong forms of competition.
(ii) Market Share
The competitive identity is clearly reflected in the size of market share rooms
allocated to CSHB by hotel groups. The larger share hotel groups are recognised as
major competitors and have strong competitive identities. It can be seen particularly
in the areas of promotion and segmentation/packaging strategies that the greater the
market share the hotel group has, the higher the level of competitive identity. This is
of particular importance in these two strategies as they are based upon image, theme,
and corporate brochure distribution.
(iii) Number of Sources of Competitive Advantage
In general, no clear patterns emerge, except perhaps to state that pricing strategies
result in lower peer competitive identity i.e. hotels adopting pricing strategies are seen
as less of a threat in the CSHB market. Competitive identity is strong for hotel groups
adopting promotion strategies with many sources of advantage and weak for
distribution strategies with few sources of advantage. As competitive identity
indicates a perceived threat, these groups are likely to be higher profile operations and
subject to "follower" strategies by other hotel groups.
(iv) Market Structure-CSHB Strategy-Competitive Identity : Summary
The structure-strategy relationships relative to peer competitive identity indicate that
hotel groups with strong competitive identity appear to adopt promotion or
segmentation strategies in market structures that are medium in market scope, high in
market share and varied in sources of competitive advantage. Alternatively, hotel
groups that have weak competitive identity tend to adopt distribution strategies in
narrow market scope, low market share structures, with few sources of competitive
advantage.
This measure of performance represents a dynamic and proactive element which
highlights the future implications of the market. The implications of such
characteristics are that hotel groups may wish to alter strategic direction in the CSHB
market to improve performance or alternatively attempt to reposition their group in a
Page 306
different market structure variable, i.e. increase room stock available for CSHB to
increase market share concentration. The groups identified as strong in competitive
identity are the ones likely to be subjected to follower strategies by less successful
organisations. Hence, promotion or segmentation/packaging strategies may be
favoured by the majority of followers, resulting in more sophisticated strategies
emerging in these two areas as the market matures.
To allow a more proactive and structured approach to strategy development in the
CSHB market as opposed to relying on "copying" apparently successful strategies.
The next section determines how hotel groups may move in strategic space and
determines the foundation of the need for a performance model to establish hotel
group direction in the CSHB market.
10.5 DESIRE TO MOVE IN STRATEGIC SPACE
Teece (1984) identified that "a firm needs to match its capabilities to its ever
changing environment if it is to attain its best performance." Based on this grounding,
it could be argued that if companies operating in the CSHB market could simplify the
environment and determine areas potentially more lucrative, then they would attempt
to revise their mix of resources (capabilities) in order to change strategy. The result
would be a movement in strategic space aimed at enhancing performance. Following
on from this, it could be argued that the methods put forward in this research go some
way towards simplifying the environment and thus allow general "implications" to be
drawn with regard to hotel group movements in strategic space- on both a theoretical
and a practical level. The following examples are suggested based upon this premise.
1. Hotel groups adopting a pricing strategy, with a medium scope, low market share,
and few sources of competitive advantage should, in an attempt to improve
performance, move towards promotion strategies (with a longer term view of
increasing scope and adopting segmentation/packaging strategies). A short term
response may be to narrow market scope to enhance performance.
2. Distribution strategies should be avoided as the prime. Hotel groups adopting
these strategies should attempt to move strategic space firstly by increasing
market scope, followed by a movement towards segmentation/packaging
strategies. If it is not possible to widen market scope, then they may consider
maintaining a narrow scope and adopting a pricing strategy.
Page 307
In general, segmentation/packaging strategies would appear to be available to any
size of company operating in, or capable of operating in, a market with medium to
wide market scope. Performance improving with the larger number of sources of
advantage. Promotional strategies would be the direction for companies with few
sources of advantage, a medium market scope but with a medium to high company
market share of rooms. Distribution strategies would be recommended as a support
strategy, not a prime one. Pricing strategies are recommended for companies with
low market share, narrow scope, and few sources of competitive advantage. Moving
towards these strategies will be in incremental steps and will require environmental
scanning to monitor competitors reaction, but should enhance performance in the
CSHB market.
The general content of the research thus far has been the potential of CSHB
performance enhancement through movement in strategic space. However, mention
must be made of the inevitable attempts by company clusters to prevent not only
market entrants but also movement between markets, also applicable to strategies
(Caves & Porter 1977, Mascarenhas & Aaker 1989) making it difficult to move
between strategic space zones, if at all possible (Oster 1982). This area warrants
further investigation and is an area for further research.
To develop the concept of movement in strategic space, and to provide a more
structured and proactive approach to CSHB performance enhancement, a model of
CSHB structure-CSHB strategy-CSHB market performance has been constructed.
This model attempts to provide direction for hotel groups operating in the CSHB
market in Scotland. It is constructed from the combined results of structure, strategy,
and the measure ofCSHB market level performance (CSHB revenue). Section 10.6
establishes the construction and implications of the model.
10.6 MODEL OF ENHANCED CSHB PERFORMANCE
At the CSHB market level, the performance of the hotel groups appears to be a
function of structure and CSHB strategy and as such provides an opportunity for hotel
groups to move in strategic space. Each structure-CSHB strategy-performance
relationship to date has been examined in a two dimensional manner, i.e. structure and
strategy coming to form strategic groups with a resulting performance. In order to
"operationalise" the strategic framework the approach requires to be modelled on the
three dimensions of structure, combined with CSHB strategy and performance. By
Page 308
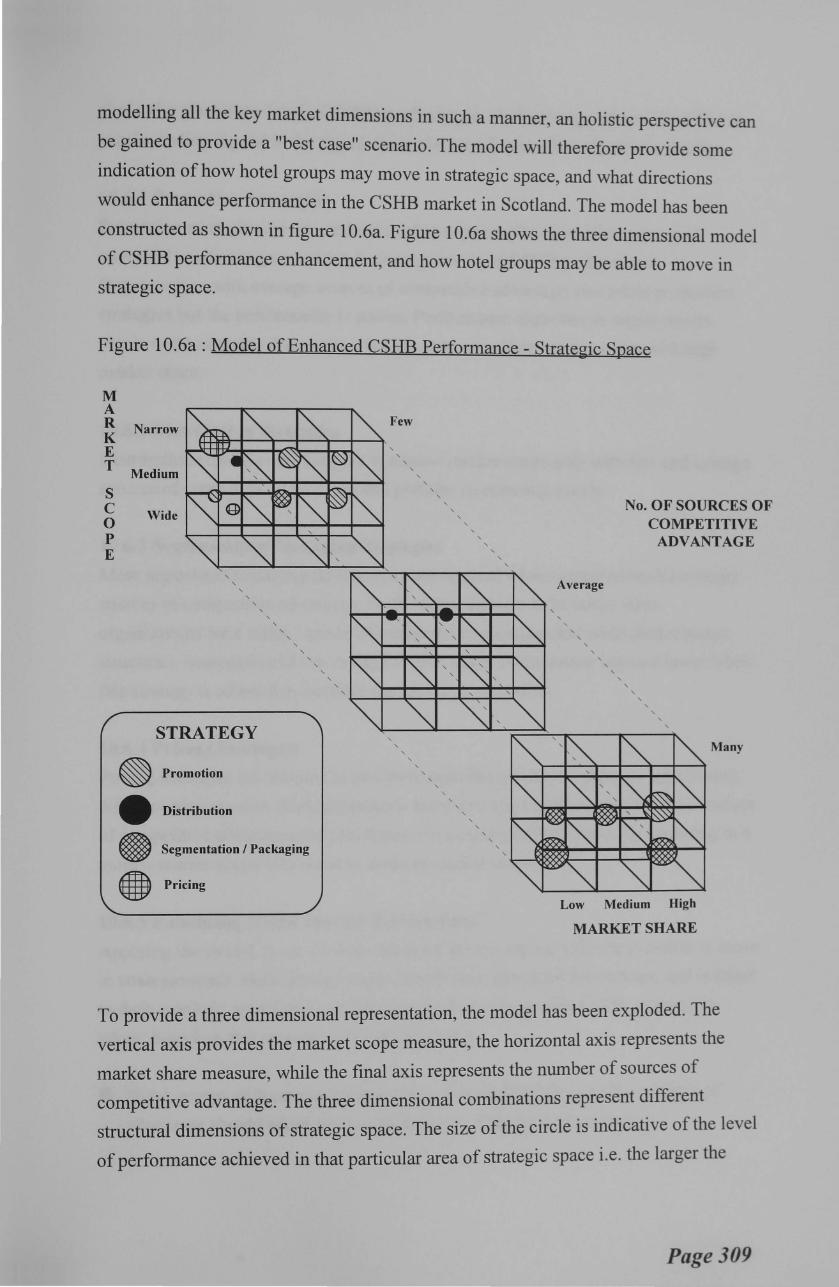
modelling all the key market dimensions in such a manner, an holistic perspective can
be gained to provide a "best case" scenario. The model will therefore provide some
indication of how hotel groups may move in strategic space, and what directions
would enhance performance in the CSHB market in Scotland. The model has been
constructed as shown in figure 1 0.6a. Figure 1 0.6a shows the three dimensional model
of CSHB performance enhancement, and how hotel groups may be able to move in
strategic space.
Figure 10.6a: Model of Enhanced CSHB Performance- Strategic Space
M A R Narrow K E T
Medium
~ "' "' , @ ~ I ~ ~
s c Wide 0 ~ ~ ~ ""
g
p E
'
"" "" ~ ' ' ' ' ' ' ' ' ' ' ' ' ' ' '
ST RATEGY
®Pro motion
• Dis tribution
@ Seg mentation I Packaging
icin • Pr g
"" Few
' &
"' ' ' ' '
~ ' ' ~
"" ' ' '
', "" ' ~ ',~ ,_
, r.-:
"" -. ~ ~
' '
' ' ' ' ' '· ' '
"" I"'
"" "" '
Average
' ' ' ' ' ' '
No. OFSO URCESOF TITIVE TAGE
COMPE ADVAN
~' "" '
"" "" ' ' ' ' ' ' ' ' ' ' ' ' '
"" "" ~ '"" ' ' ' '
' ~ ', ~ "" "" ' ' ' '
Many
' ' ' ~ ~ ~ "" ' ' ~ ' ' ' ' ' . FJ<,} ~ ' ""\:
=~ ' '
' ~ =~ ~~ ' ' ' '~ ~ ~
~ ~"' "" ~~
Low Medium High
MARKET SHARE
To provide a three dimensional representation, the model has been exploded. The
vertical axis provides the market scope measure, the horizontal axis represents the
market share measure, while the final axis represents the number of sources of
competitive advantage. The three dimensional combinations represent different
structural dimensions of strategic space. The size of the circle is indicative of the level
of performance achieved in that particular area of strategic space i.e. the larger the
Page 309

circle, the greater the level of CSHB performance. Each strategy adopted is coded as
per the coding legend in the figure. From the model, a number of patterns emerge.
10.6.1 Promotion Strategies
Promotion strategies are adopted most when organisations have few sources of
competitive advantage, resulting in average levels of CSHB performance.
Organisations with average sources of competitive advantage also adopt promotion
strategies but the performance is poorer. Performance improves as organisations
obtain more sources of advantage and move to a medium market scope with high
market share.
10.6.2 Distribution Strategies
Distribution strategies are adopted in narrow market scope only with few and average
sources of competitive advantage and perform consistently poorly.
10.6.3 Segmentation/Packaging Strategies
Most segmentation/packaging strategies are adopted when organisations have many
sources of competitive advantage. Performance appears to be better when
organisations have many sources of competitive advantage and wide market scope
structures, irrespective of low or high market share. Performance appears lower when
this strategy is adopted in medium market scope structures.
1 0.6.4 Pricing Strategies
Pricing strategies are adopted in two structural dimensions, resulting in significantly
different performance. Both dimensions are of low market share and with few sources
of competitive advantage yet performance is considerably enhanced by operating in a
narrow market scope compared to medium market scope.
10.6.5 Enhancing CSHB Market Performance
Applying the model, it can be seen that hotel groups can identify the potential to move
in strategic space. Hotel groups must identify their structural dimensions, and (subject
to their strategic capability) may identify the most appropriate CSHB strategy to
adopt. Based on this premise, it is suggested that :
e Hotel groups with narrow market scope, low market share and few sources of
advantage should adopt pricing strategies to enhance performance.
Page 310
• High market share hotel groups should consider using promotional strategies
when in medium scope, and segmentation/packaging strategies when in wide market scope.
• Distribution strategies are not advised as a prime strategy as they result in poor
performance and as such should be used as a secondary or support strategy.
The former has established the changing strategy perspective, (although one should
also consider the strategic capability of hotel groups established in section 10.3.5).
While changing structure is difficult (if not impossible) it appears from the model that
performance is enhanced with the following market structure combinations :
• low market share, wide market scope, many sources of competitive advantage,
and segmentation/packaging strategy
• high market share, wide market scope, many sources of advantage and
segmentation/packaging strategy
• low market share, narrow market scope, few sources of advantage, pricing
strategy
• high market share, medium market scope, many sources of advantage,
promotion strategy.
The model has conceptualised linkages between segmented CSHB markets, strategic
activity, and enhancing performance. As such, the research contributes significantly to
academic and industrial knowledge both at market level and in terms of
methodological approach. The next section highlights the key areas of contribution to
knowledge made by the research.
10.7 SUMMARY OF CONTRIBUTIONS TO KNOWLEDGE
The research, through its process, approach, and findings has highlighted a range of
valuable contributions to knowledge in the field of hospitality strategic management,
mainstream strategic management and in the area of CSHB markets. It has analysed
the nature and methods of provision of CSHB in Scotland, with a particular emphasis
on the strategic dimensions of corporate ventures and resulting performance, and thus
provided a model of enhancing performance at corporate and unit level. Such
contribution to knowledge are split into three areas highlighting contributions to
Page 311

academic knowledge, industry knowledge and additional contributions through testing the model at unit level.
10.7.1 Academic Knowledge
The contribution to academic knowledge has essentially arisen from three key areas,
the methodology adopted, the performance model and the findings of the research.
(i) Methodology Adopted
From the methodology adopted, an approach has been established that combines an
evolving research design with cross discipline frameworks. Such methodology allows
analysis of dynamic and complex markets, with an approach determining inter and
intra relationships (or associations). The framework allows for more than just
forecasting for future events and is proactive to allow determination of how, where,
possibly even when and who are likely to move in strategic space. Such an approach
has constructed an understanding of the strategic capabilities of hotel groups in CSHB
markets and highlighted how barriers to entry and mobility may be created. As
industry performance appears to influence strategies adopted i.e. strategic capability, a
greater understanding of corporate development has been achieved.
While the research approach has been applied to CSHB markets, it is by no means
exclusive to such a market. One of the key contributions to knowledge the author
offers is the overall research approach as a means of exploring organisation and
market dynamics in what is a highly complex, and fragmented and volatile tourism
environment. This contribution to knowledge implies that the methodology adopted
could be applied to other hotel group or tourism markets (i.e. business, or leisure
markets); from a locational perspective (in terms of other countries) or from a
combination of structure; strategy and performance variables, to determine the
dynamics of variable relationships (or associations). Similarly, the approach could be
applied to a range of service industries or sectors of the hospitality and tourism
industry i.e. brewing; contract catering; tour operating; casinos etc.
Contributions have also been made to what may be termed hospitality and mainstream
strategic management disciplines. Chapter one literature review highlighted the
evolution of strategic management. This research contributes to the development of
Hospitality strategic management research through aligning current thought in
hospitality fields with the developments in mainstream strategy. From the mainstream
perspective, the research provides a contextual bridge to the two core schools of
strategic thought - namely positioning and core competencies. This research through
Page 312
application to the hospitality industry has allowed analysis of an industry that has a
distinct product/service mix that may be identified as a core evolutionary factor in
developing mainstream thinking (founded from manufacturing bases shifting to
service oriented organisations). The contribution has been to explore the dynamics of
the market and provide an inductive approach to contextual theorisation of strategic
developments within a hospitality paradigm.
(ii) Performance Model
The prime focus of the research has been the development of a performance
enhancement model. The model has been constructed through analysis of the key
market structure-CSHB strategy-performance paradigm. The resulting model
establishes how hotel groups can improve CSHB performance and what relationships
appear to exist between market structure, CSHB strategies and various levels of
performance. In a market where understanding industry and strategic dynamics can
greatly assist an understanding of the market itself and therefore operational and
strategic decision-making. Such contributions are essential to advancing the field of
hospitality strategic management. The development in constructing the model and the
final performance model therefore offer considerable contributions to knowledge both
from the perspective of understanding the dynamics of the CSHB market relative to
hotel group activity and performance, and from the general research philosophy and
approach.
These methodological developments are all contributions that assist in understanding
and researching hospitality markets. In addition to such contribution, the research
findings also highlighted areas of understanding relative to the CSHB market itself.
(iii) Research Findings
The findings of the research provided knowledge in the areas of understanding the
dynamics of the CSHB market from a supplier perspective. The research has
attempted to standardise a definition of CSHB for future researchers and has
established the complex, dynamic and highly segmented nature of the CSHB market
in Scotland. In addition, a consolidation of the nature of tourism markets and hotel
operations within these markets has been established.
The growth and nature of CSHB markets has been explained in more depth than
before, and a number of distinct characteristics highlighted essentially relating to the
considerable value of the market, the nature of market growth and distribution of the
CSHB concept. The result being that the market has been highlighted as having
Page 313

distinct monopolistic competition tendencies and therefore influences the means by
which hotel groups compete. Such competitive strategies were found to revolve
around enhancing contribution to hotel returns. An examination of each of the
strategies has provided considerable contribution to knowledge by profiling each
strategy and highlighting its component characteristics. An indication of how hotel
groups and other suppliers compete in the market and what structural determinants
appear to lead to which types of competitive strategy has been established. This
analysis showed that competitive strategies in the CSHB market are developing from
a primitive state to one that is increasing in sophistication, and that as a result, distinct
strategic groups are emerging.
The question was posed as to what was the potential effect of implementing different
strategies in the market upon organisation performance. Performance was therefore
analysed, and contributions to knowledge made in terms of performance measures and
CSHB performance. Such contributions to knowledge allow the development of the
performance model.
From the market perspective, the understanding of the nature of CSHB markets
established allows for further analysis of what as been proven to be an extremely
valuable and important market to Scottish and UK tourism. Areas for further research
are established in Chapter 11.
10.7.2 Industry Knowledge
In terms of contributing to knowledge at industry level, i.e. practical usefulness, a
number of key findings have been established.
The nature and underlying structure of the CSHB market and hotel industry in
Scotland have been determined, consolidating previous demand based research and
providing an holistic review of the market. A profile of short break takers has been
provided and detail of the value and nature of CSHB growth have been established
highlighting contribution and fit between market developments, the environment, and
yield management. Differences between locations in Scotland have been highlighted
and their implications upon operations in different locations determined. In addition,
the nature of competition for CSHB markets was established as being in terms of
market share, with smaller operators losing market share.
The competitive environment has been analysed providing indications of the key
competitors, value of various market segments, strategies adopted, components of
Page 314
packaging and detail of strategic dimensions of competition. The range and
effectiveness of various competitive strategies has been determined through the
structure, strategy, performance paradigm and the strategies categorised into
performance levels through the performance enhancement model. Concepts of
strategic space and movements in strategic space have considerable potential benefits
for public and private sector organisations in CSHB markets.
The research in general provides operators in the CSHB market in Scotland with an
indication of direction and potential consequences and as such would allow
consolidated reviews of performance, and indications of future developments. If
combined with the methodology adopted, the research may act as a means of strategic
planning at market/business level for specific markets or market segments.
The research has examined the industry and market level of CSHB structure, strategy,
performance relationships contributing significantly to knowledge in the field, and
providing practitioners with information that assists in operating and strategic
decision making. However the research has not fully explored the individual hotel
unit (i.e. the operational or functional level). Such a multi-site perspective is adopted
in appendix V where the CSHB performance model is applied and tested at unit level,
combining the importance of location and the contributions to knowledge established
at industry/market levels.
10.7.3 Model Testing- The Unit Level
As the unit level is recognised as an important yet difficult and costly level to
research, Appendix V provides a consolidated review of the multi-site unit level
perspective of CSHB market structure, strategies, and performance. This analysis tests
the methodology and performance model at unit level, and establishes further
contributions to knowledge, determining areas requiring further research.
The contributions to knowledge at the unit level analysis are found through applying
the CSHB research framework. Similar results are achieved at unit level as were
evident at corporate level, in terms of the relationships between structural variables of
market scope, market share, number of sources of competitive advantage, CSHB
strategies and performance. Such results imply that the model can be operationalised
and as such can be a valuable contribution to unit level managers.
Page 315

In addition, location appears to affect the performance of certain strategies in the
CSHB market. While the framework has been tested at unit level and proved
successful in the process a number of additional contributions to knowledge emerged.
The research established that the unit level offers CSHBs for different reasons than
the corporate level, essentially displaying the short term operational nature of the unit
as opposed to the longer term perspective of corporate head offices. As such there
appears to be a high degree of head office intervention, perhaps in attempts to ensure a
degree of longer term planning is introduced at the units level. In some cases, most
notably QMHs the intervention by head office appears to cause a degree of confusion
due to inconsistency i.e. allowing units to formulate CSHB strategies but compiling
the CSHB packages almost entirely from head office. This may account for the poorer
performance of QMHs and the degree of discontent shown in terms of head office
communications.
In terms of market structure, at unit level the market scope of hotel appears to be
wider and packaging more prominent. In market share terms, market share of rooms
increases as one moves from tertiary, to secondary, to primary locations.
Pricing is still very primitive with head office maintaining tight controls. In general,
pricing strategies appear most evident in tertiary locations, segmentation/packaging
strategies in secondary locations and promotional strategies in primary locations.
Performance appears to vary between locations, with good and poor performance
mainly in primary and tertiary locations. When examining the structure, strategy,
performance relationships, it becomes evident that performance relationships are very
similar to the corporate level, with the exception of market share structure variables
which show some variation. Such findings at the unit level contribute significantly to
an understanding of potential strategic gaps occurring and the operational level of
offering CSHB.
Page 316
10.8 CHAPTER SUMMARY
This chapter has examined the relationship between the CSHB market structure.
strategies and performance, on industry and market level. Relationships occurring
have been established and a CSHB performance enhancement model based upon the
concept of movement in strategic space constructed.
From the chapter findings it was established that the industry/corporate level
performance provides an indication, not just of comparable performance for market
analysis, but that the industry level performance appears to determine the type of
CSHB strategies adopted (i.e. the hotel groups strategic capability). As such, this
introduces a new dimension to the research requiring further study out with the focus
of this thesis.
The CSHB strategies were seen to combine with structure variables to produce
different levels of performance. The most prominent finding being the poor
performance from distribution strategies and enhanced performance from
segmentation and promotion strategies.
Finally the concept of strategic space was established within the context of the CSHB
performance model. This established that hotel groups may change strategies to move
to areas of greater potential performance. Alternatively, if possible, they may attempt
to change the structure of their market to enhance performance. How such
developments effect the future structure of the CSHB market and the industry as a
whole is another area that through a longitudinal study will provide potential future
research and further contributions to academic and industrial knowledge.
The analysis of the nature and methods of providing CSHB in Scotland, focusing on
strategic dimensions of corporate ventures and resulting performance and providing a
model for enhancing CSHB performance has highlighted key areas of contribution to
knowledge and exposed the need for a multi-site perspective. This multi-site
perspective was examined in Appendix V testing the CSHB performance model at
unit level and confirming that the model can be operationalised, holds to be
consistent at corporate and unit levels and therefore making a major contribution to
both academic and industrial knowledge.
The next (and final) chapter provides a critique of the research methodology and
highlights areas for further research.
Page 317
REFERENCES
Akehurst, G.P (1984) "The measurement of concentration in the hospitality industry",
International Journal of Hospitality Management, 3(1) pp 25-34
Caves, R; Porter, M.E (1977) "From Entry Barriers to Mobility Barriers", Quarterly Journal of Economics, 91 May pp 241-261
Cool, K; Dierickx, I (1993) "Rivalry~ strategic groups and firm profitability",
Strategic Management Journal, 14 pp 47-59
Hedley, B (1987) "A fundamental approach to strategy development", Long Range Planning, pp 15-24
Jacobson, R (1992) "The Austrian school of strategy", Academy of Management Review, 17( 4) pp 782-807
Kirzner, I.M (1976) "On the method of Austrian economics", Foundations of Modern Austrian Economics, Sheed and Ward, Kansas pp 40-51
Mascarenhas, B; Aaker, D (1989) "Mobility Barriers and Strategic Groups",
Strategic Management Journal, 10 pp 475-485
McNamee, P; McHugh, M (1987) "Mapping Competitive Groups in the Clothing
Industry", Developing Strategies for Competitive Advantage, Long Range Planning
O'Neal, J (1989) "Using standard deviation as a performance measurement tool", The Magazine for Chief Financial Officers, 5(8) August pp 40-43
Oster, S (1982) "Intraindustry Structure and Ease of Strategic Change", The Review of Economics and Statistics, 64 pp 376-383
Porter, M.E (1980) "Competitive Strategy" New York Free Press
Reekie, W.D (1989) "Industrial economics : A critical introduction to corporate
enterprise in Europe and America", Edward Elgar Publishing Ltd. Aldershot
Saving, T.R (1970) "Concentration ratios and the degree of monopoly",
International Economic Review, 11 February pp 139-146
Scherer, F.M (1980) "Industrial market structure and economic performance", 2nd
Edition, Rand McNally, New York
Stata, R (1989) "Organisational learning: the key to management learning", Sloan Management Review, 30(3) pp 63-74
Teece, D (1984) "The Competitive Challenge", Boston Massachusetts Ballinger
Wiriyawitt, C; Veendorp, E (1983) "Concentration measures as indicators of market
performance", Quarterly Review of Economics and Business, 23 PP 44-53
Page 318
CHAPTER ELEVEN
METHODOLOGICAL CRITIQUE & FURTHER
RESEARCH
11.1 INTRODUCTION
This chapter provides a critical review of the research methodology and highlights
areas warranting further investigation. The methodology adopted in this research has
proven to be most satisfactory, providing an informed rationale for research design
which was appropriate for the research problem, and thus achieving the aims and
objectives set and contributing substantially to knowledge in the field. In hindsight,
while the research is highly original and provides a significant contribution to the
study of the management of hospitality services, some areas could have been
conducted more efficiently and effectively based upon the cumulative experience now
gained. The first part of this chapter provides a critique of the methodology,
suggesting how it may be refined to repeat the research in the future, and what
problems may be avoided. The latter section of this chapter highlights areas for
further investigation.
11.2 CRITICAL REVIEW OF METHODOLOGY
The research can be critically reviewed in six areas. The six areas represent key
sections of the research approach and process - (i) general research approach,
(ii) research framework, (iii) research design, (iv) research process, (v) predictive
value of the research, (vi) replication of the research.
11.2.1 General Research Approach
Chapter 1 established that the general approach to the research has reflected an
inductive (soft) research paradigm as opposed to scientific. deductive (hard) paradigm
-thus making the general context of the research a balance between qualitative and
quantitative techniques (Cohen & Manion 1989) and maintaining a degree of order
through a balance of subjective and objective methods (Morgan & Smircich 1980).
The approach (detailed in section 1.4.1, Chapter 1) has minimised weaknesses often
associated with the purely positivist paradigm (Easterby-Smith et al 1993, Keat 1981)
including the notion of scientism; value freedom; generalisation and assumptions that
science itself should be based only on data that can be observed and measured
directly.
The inductive approach was deemed appropriate and necessary to allow theory to be
built and tested in an area that has proven to be very under theorised. It allowed
analysis of a constrained sample, and a balance of qualitative and quantitative
Page 319
methods. As the inductive approach adopted was circular in nature, it encouraged
additional exploration and insight of theory rather than experimentation of existing
theory. As such it has facilitated a more proactive, dynamic and holistic approach to
analysing and understanding the dynamics of the subject, requiring the development
of concepts rather than purely numbers to understand complex organisational
problems (Checkland 1981 ). Adopting a flexible, evolving and proactive approach to
the research was extremely effective. The approach allowed for an analysis of the
nature of the hospitality and tourism industry through cross and interdisciplinary
research design (Wentz 1972, Churchill1992). Such design allows an "holistic and
synthesised understanding of the problem" (Pearce & Butler 1994), taking the
research beyond description towards the fundamental goal of explanation, and
providing a platform to tackle the unique challenges of "traditional tourism research"
(Ritchie 1975, Ritchie & Goeldner 1987) essentially derived from gathering and
interpreting reliable data in a timely manner. Such an approach helped focus and
develop the methodology and research design and process by providing a balance of
both normative and positive research at both macro and micro levels. However, the
approach means that findings are not necessarily mathematically certain as may be
achieved through more objective approaches. In a similar manner, the research is
more difficult to reproduce given its evolving and flexible nature were theory has
been borrowed, adapted and developed from other disciplines. In this context the
research itself may be worth considering as a paradigm in its own right, adaptable to a
range of markets or industry contexts, as opposed to a scientific model (which as
Tuckman 1992 stated is "systematic, logical, and empirical and can be replicated).
The next section focuses on the specific elements of the research framework applied,
establishing the development and refinement of the theory building ..
11.2.2 Research Framework Applied
The research framework reflected the general research approach. This section
highlights issues involved with the evolution of the research framework from the
segmentation model and industrial economics approach and reviews the concept of
strategic groups employed.
(i) Segmentation Model The CSHB segmentation model evolved from work by Guiltinan and Paul (1982) was
examined in Chapter 1 and 6. A short coming of this model was a lack of supply side
analysis, which was resolved by developing the model in relation to Scherer's (1980)
industrial economics approach. While the model development worked excellently in
that there were high degrees of compatibility, the reader should be cautious when
Page320
undertaking research and developing models in such an evolutionary manner as such
compatibility may not be possible. The perspective adopted reflects that of Buffa and
Dyer (1978) who categorically state that a model is a "device for aiding rationale
thinking" and that the "model builder must hypothesise the logical relationships
among elements to create the model. In some cases, these relationships may be based
on empirical data, while in other cases we can only appeal to the criterion of
reasonableness." The segmentation model provided a platform for understanding the
foundations of the research area and form a degree of preknowledge.
(ii) Industrial Economics Approach
The developed structure-conduct-performance (SCP) model proved to be highly
satisfactory in analysing the CSHB market. It allowed varying relationships to be
established, and modelling of CSHB market performance.
The SCP approach postulates causal relationships between the structure of a market,
the conduct of firms in that market and their economic performance (Dixit 1982). As
such the approach has been subject to widespread criticism (Reekie 1989, McKie
1970, Baumol 1982, Demsetz 1973). Main debate centres around the complexity and
stability of relationships and S-C-P variables, the need for inclusion of such elements
as transaction costs (Arrow & Hahn 1971) accommodation of advances in oligopoly
and game theory (Spence 1977, Clarke et al1984) and reliance on linear relationships
(although Donsimoni et al1984 highlight that a significant relationship says nothing
about the direction of causation). The most comprehensive critique of traditional
analysis comes from the work of the Austrian school, where the theoretical approach
is very much at variance with that of the neo-classical mainstream.
The Austrian approach differs from the neo-classical mainstream in three crucial
respects (Ferguson 1988, Littlechild 1986). Austrians reject the:
• assumption that economic agents posses perfect knowledge of all aspects
relevant to their decisions, preferring to assume knowledge as partial;
• neo-classical concern with the state of equilibrium and its properties (i.e.
Austrians believe the economy will be in a state of dynamic flux);
• neo-classical view of competition, where knowledge is perfect, competition
as a process or an activity can not exist.
Therefore, Austrians are interested in the competitive process, the dynamics of market
forces and how decisions are made in conditions of uncertainty and limited
Page 321
information. The implications are therefore that the S-C-P approach is inflexible and
therefore requires caution when analysing dynamic and complex markets such as the CSHB market.
The use of the segmentation model in the early stages, the adoption of an Austrian
economics approach in terms of qualitative as well as quantitative measures, and the
development of concepts of strategic groups and strategic space added to the
flexibility of the framework and countered core criticisms of the S-C-P approach,
making the framework more appropriate, which when analysed as a matrix and
combined with the overall research approach proved most appropriate. Such
developments to the original model allowed a more proactive approach to market and
industry analysis and enabled analysis of dynamic and complex markets to be
undertaken. The resulting model developed in this research is therefore suitable for
analysing most static and dynamic markets. However, it requires further development
in terms of mobility barriers, forecasting movements in strategic space, and
considering cognitive elements of the decision process. These are essentially
longitudinal studies for work after the PhD completion.
(iii) Strategic Groups Modelling
Using strategic group modelling within the industrial economics approach allowed a
degree of flexibility, and bilateral "association" to be added to the research
framework, forming an integral part of the framework. In developing strategic group
theory, care must be taken in a number of areas- (i) to ensure artificial groups are not
created (Punj & Stewart 1989, Hatten & Hatten 1987) and (ii) that the performance of
such groups is measured accurately and reliably, with the results cross referenced in
some form. This research provided a number of measures and structural variables to
achieve this task before establishing the CSHB performance model and then repeating
the process at unit multi-site level to confirm and subsequently reinforce the results.
Areas that require refining here can be seen to be the extension of non-financial
measures of performance, a review of the accuracy of financial measures in the
hospitality/tourism industry per se, recognition of the variety or breadth of structural
variables, and a greater degree of analysis of the multi-site nature of hotel groups.
11.2.3 Research Design
Issues relating to research design are determined in quantitative and qualitative
dimensions. The research design by its approach has attempted to provide a balance of
qualitative and quantitative data, analysis and methods.
Page322
It is recognised that qualitative and quantitative dimensions are not mutually
exclusive and as such the qualitative elements have attempted to provide depth and
flexibility in analysis while the quantitative approaches have attempted to provide
indications of mathematical relationships and a degree of objective empirical
association of variables being researched.
In exploring such methods the constraints imposed by the industry play a key role.
These constraints are essentially related to the lack of available data, through either
the unwillingness or the inability to supply the data. Such a problem results in
variable data sets and a generally smaller sample size. Such problems lead to a need
for a wider usage of qualitative techniques for data collection and analysis. The
research represented a form of applied research, concerned with understanding the
dynamics of the market and improving the performance of business. The qualitative
approaches therefore reflected an area of research where predominantly the decision
making process and market variables where closely related and often the variables
occur concurrently. This highlighted the need for a research methodology that adapted
to change (Gummesson 1991).
The qualitative methods therefore sought to achieve two key roles. The first was to
provide "rich" in-depth data from a relatively narrow purposive (yet clearly
representative) sample. The second element of qualitative methods is evident in the
selection and presentation of structure, strategy and performance variables, where not
every possible variable could be employed. Therefore, logical and rational decisions
had to be made as to the variables to be further explored. These decisions were made
in consultation with the focus group and founded on the preunderstanding of the
market.
In presenting the variables on the model, qualitative approaches were adopted to
provide indications of ellipses where technology was not available to the researcher
(although currently the model is being developed in computer format to allow detailed
presentation of empirical results).
Quantitative techniques were also used for cross checking initial theories,
preuderstanding assumptions and providing indications of mathematical relationships
or associations between variables.
The problem of available data and its reliability is undoubtedly echoed throughout
hospitality research and is an area requiring addressed in terms of standardised data,
Page 323
the scope of hospitality research and indeed the purpose of hospitality research, be it
basic research or problem-solving research. (Hunt 1991, Myers et al1979, Taylor &
Edgar 1995). Indeed, as Black (1993) highlights "the support for the theories will only
be maintained by the validity and appropriateness of the methodological processes."
11.2.4 Research Process
This section highlights issues relative to implementing the research methodology. The
general operational issues relating to the research approach are explored, followed by
issues relating to the implementation of methods and means of data analysis.
(i) General Operational Issues
The researcher must maintain control over the realities of the project and ensure that
the research is not only rigorous, but also provides a degree of practical usefulness. A
key issue here is to ensure that the research does not become too theoretical in nature
and as such divorce the research from the discipline's problems (Arndt 1985) and that
when conversing with industry there is clear understanding from both academic and
practitioner sides as to concepts and terminology being adopted. Arguably, one of the
key strengths of research in the hospitality industry not present in mainstream
business subject research, is the vocational orientation (Taylor & Edgar 1995). By
adopting cross and interdisciplinary approaches, the theoretical rigour and contextual
dimensions must be balanced. While there are dangers of overemphasising the
contribution to theoretical knowledge, if the overemphasis is upon the industry
problems the results can be shallow pragmatism and conceptual malnutrition
(Anderson 1983). This is an issue to be addressed by hospitality researchers as a
whole. A balance must be struck to ensure contributions to knowledge within a
contextual framework. This research has provided such an approach, and through the
industry focus group, ensured relevance in concepts and terminology, making results
more reliable.
A further limitation is essentially related to specialist knowledge of cross-disciplinary
subject areas. The researcher must ensure competence in the disciplines or parts that
are adopted. If the researcher is unclear of the foundations of any concepts,
frameworks or basic principles that are used misinterpretation of results can occur. In
this research this problem was overcome by continual reference and liaison with
specialists in the areas, and ensuring that the cross-disciplines- essentially marketing,
economics and corporate strategy - were areas where the researcher had an existing
high degree of understanding and competence.
Page324
(ii) Methods
The methods adopted can be split into the core areas of : literature review, supply side
information, CSHB definition, fieldwork, sampling, technology and data, and scheduling.
Literature Review
The literature review was used to establish past works in the research area, providing
background to the CSHB market in terms of growth, demand characteristics, and
value of the market. This allowed an appreciation of market conditions and evolution
to the 1990's to be formed, and provided a degree of preunderstanding of the
dynamics of the market.
The main problems encountered essentially relate to the available data, which was
often dated, unstructured, reportive, and demand based. This is a problem identified
by other researchers in the field (Pearce & Butler 1994). Such researchers argue that
as tourism has become recognised as a leading industry, it's visibility has attracted
much more attention and criticism, putting greater emphasis and scrutiny on available
data. Indeed this is compounded by the recent EC directive on tourism statistics
(95/57EC 1995). Different definitions of CSHB emerged and the level of
comparability of literature was negligible. Such literature could only reliably be used
to gain an understanding of demand and general demand characteristics. As such
literature provided only demand based information, and many hotels did not have
available detailed information with regard to CSHB markets. This caused a number of
problems in terms of accuracy and comparability of data. While this is a major
problem, widely recognised by researchers in hospitality and tourism, it provided a
major opportunity to examine the supply side of the CSHB market, and contribute
significantly to knowledge in the field. Exploring the supply side of the market in
Scotland arguably provided a more representative, richer and potentially more
proactive data sample, than the reactive and dated demand analysis.
Since conducting the research a number of alternative sources have emerged for
consideration these include electronic journals, the WHATT CD-Rom database of
hospitality and tourism texts and a range of focus and discussion groups emerging via
the INTERNET and thus opening the discussion of research topics out to a potentially
world-wide audience.
Page325

Supply Side Information
Analysis of fragmented markets, and the lack of available data raised a requirement
for information relating to the supply side of the market; key indicators of the
dynamics of the market and geographical variability.
The requirement for supply side data required the construction of a hotel groups
database, supported by short break operators and consortia databases. The hotel
groups database provided valuable information in terms of estimating the overall
revenue of various hotel groups in the CSHB market and extended the work by
Litteljohn (1991), exploring performance of hotel companies in Scotland.
The accuracy of estimates is debatable, yet the usage of key market indicators is
essential in analysing fragmented markets. By using information from companies and
from using industry norms for costs and sales mix, a profile of the CSHB market in
Scotland was established. To enhance the accuracy of the database it may be advisable
to calculate the various revenues and costs for CSHB on a monthly basis allowing for
structural and seasonal fluctuations throughout the year, as opposed to a one point in
time analysis (thus allowing greater flexibility of analysis by time period).
Additionally faxing hotel groups each month to try to gain verification of the accuracy
of results would improve confidence in findings. This is a time consuming task, and
hotel groups may lose interest quickly but it would allow some confirmation of the
results achieved by the database. The short break operators (SBO) and consortia
databases also require updating as more information is released. For the purposes of
this research the SBO and consortia databases were for comparison and cross
referencing only. However, should they be given a more prominent role they would
require more detailed information updated on a regular basis.
To allow comparisons of structural, supply and demand variations by location, the
databases were analysed by location in terms of seven regions of Scotland. While this
had never been done before in such research for Scotland, the results did show distinct
differences in locational characteristics. These divisions of the seven regions reflected
the highly qualitative nature of the research, balanced with quantitative measures of
hotel group concentration, area tourist board boundaries, and population densities.
Since undertaking this research, the UKTS (1993) has adopted a similar division but
by the nine Regional Councils of Scotland (to 1996). The division of Scotland by
region seems acceptable but has little logic in terms of the nature of the hotel industry.
The fact that often regional councils span and overlapped local Area Tourist Boards,
and indeed the changing area tourist board numbers and boundaries adds to this
Page 326
problem. The suggestion here is that distinct boundaries must be established when
examining hotel activity within a country (as no two parts of the country provide the
same operating environment), but the boundaries for locational differences of hotel
operations should be determined by "industry" boundaries, not political boundaries
(such as Regional Councils or Tourist Boards). However, as to how the boundaries
and indeed number of regions are determined requires a research investigation in its
own right, thus establishing a consistent measure for future researchers to use.
CSHB Definition
In defining CSHB a wide range of definitions were examined and little if any
consistency found. The definition adopted was the result of a combination of
evolutionary development of past research and the focus of the subject area i.e.
commercial accommodation, predominantly hotels, holidays, and breaks. The
definition adopted was "Hotel packages of one to three nights which for a single price together with accommodation include one or more of the following: meals; transport; entertainment; or a programme of activities. " This definition proved
highly satisfactory. However one area could be exposed as weakness in that, by
definition, CSHB are "packages" and as such all hotel groups must adopt some form
of package by definition. Fortunately no groups identified this as a problem and all
had a degree of packaging occurring, although not necessarily as their prime CSHB
strategy.
While It is implied that the definition used is suitable for relating to CSHB markets.
The implications must be recognised when using such a definition, and transferring
the research to different markets or different country situations. It is therefore
necessary to construct specific definitions as a result of the preknowledge stages of
the research. This ensures focus and allows research parameters to be determined.
Fieldwork
Questionnaires formed the main element of fieldwork. The questionnaires were
conducted in three phases representing an evolution of the research design and
providing data of an increasingly strategic nature. All questionnaires proved highly
successful essentially due to the focus group advice in terms of types of questions and
terminology to adopt. The first two phases of questionnaire were semi-structured
telephone interviews with executives from hotel group head offices. In the first
questionnaire it was found that the questions had terminology which executives were
unfamiliar with and lists of terminology had to be produced. In addition, the wording
of the questionnaire was on occasion too long for telephone interviews meaning
Page 327

interviews lasting around 20 to 25 minutes instead of the original intention of 15 minutes.
Having corrected these basic errors, conducting Phase Two interviews ran very
smoothly, on time and with no or little respondent hesitation. However, it was
recognised that while telephone interviews displayed a wide range of distinct
advantages over other methods there were also a number of disadvantages. These
disadvantages included having to use short questionnaires, not being able to observe
the respondents reactions, and having to co-ordinate calls at particular times around
various work schedules and other business calls. In addition, with the nature of
information required, often the respondent had to obtain data from a number of
support sources. In an attempt to eliminate these fundamental errors the phase three
questionnaires were conducted as semi-structured one to one interviews with general
managers. These worked very well, eliminating the former problems, although the
cost was considerably higher and an intensive programme can lead to fatigue. Distinct
relationships were built allowing further contact in related research and providing
informal feedback to research methods, and findings to date. In general, the mix of
telephone and personal interviews was adequate and provided results that the
researcher has a high degree of confidence in.
Sampling
The problems of changing samples was examined in Chapter 6. The changing sample
should however be highlighted here, as the economic climate of the 1990's caused
some degree of sample changes in terms of hotel groups operating in Scotland. The
researcher would be advised to anticipate such developments and have contingency
samples of a comparable nature ready in the event sample shifts.
Technology and Data Processing
Technology has changed rapidly during the research. In analysing data for the
research, technology has played a prime role, particularly with the nature of data
analysis. It was found that the most compatible and user friendly database for data
analysis was Paradox by Borland. This allowed importing into Excel or Lotus and
also enabled importing into Microsoft Access which allows a great deal of flexibility
in terms of cut and paste technology. The key elements here must be understanding,
compatibility and standardisation. The researcher must ensure they build an
understanding of the software available and ensure they select software that is
compatible with the other applications they are using and above all be consistent with
the packages used so that files can be accessed within one operating environment.
Page 328
Scheduling
Scheduling the research, in particular questionnaires and financial analysis is of
utmost importance. It was found that when interviewing marketing executives in
questionnaire phases one and two that most were available in mid September to
October but not in August as many are on holiday. Similarly November caused
problems as they are preparing for Christmas advertising. January and February are
favourite times for international conventions and sales fares and March is coming into
the Easter and summer preparation periods, making these unobtainable periods. In
terms of Phase Three interviews, (with general managers) the end of April was found
to be a good time, with the Easter holidays over and the hotels relatively quiet but not
too quiet that the General manager is on holiday.
In examining financial information it was found that the hotel groups have a wide
range of reporting years by different start and finish months and as such care should
be taken to ensure that no major event occurred in particular months that may skew
results of some hotel groups in the sample e.g. Lockerbie disaster (1988) leading to a
sharp reduction in international business.
11.2.5 Predictive Value
The research undoubtedly offers a degree of proactive prediction as to potential for
movements in strategic space. While the value of such relationships (or associations)
are highly evident an issue for consideration is the concept of the "user-gap". The user
gap is a concept coined by Argyris (1985) and relates to the relevance of research in
practice, where Argyris states "most managers will be unaware of research or, if
aware unable to effect the transfer to their own situations." Given that the nature of
this research benefits from a range of applications, the predictive value can be
enhanced by encouraging wider usage of the approach and methods. To this end a
future task is to further prescribe the research approach at industry level and through
the curriculum to highlight the predictive value of the research.
11.2.6 Replication of Research
"One goal of scientific research is to be self-policing through rigour and consistency
of practice. This is necessary if the conclusions drawn at the end of a piece of
complex research are to be valid and replicable" (Cohen & Manion 1989). The
inductive approach to theory construction adopted in this research means things
change so radically during the research process (e.g. hotel group or market
environments) that not only is generalisability difficult but replication is impossible
(Guba 1978). Given this fundamental replication problem, there are a number of
Page 329
changes that may be made in attempts to repeat the research process. Two key areas
are identified. The first is the introduction of the hotel or hotel group organisation
structure into the research framework. While this research examined the relationship
of market structure, CSHB strategy and performance, it may be considered to analyse
a further dimension of how the strategy is implemented. It would therefore be useful
to analyse the relationship between market structure, CSHB strategy, organisation
structure, and performance. This could be taken one step further to examine how the
market structure, CSHB strategy, organisation structure, and performance determine
the next phase of market structure. This is longitudinal in nature and would represent
a further area of study.
The second area requiring refined is in relation to the nature of the CSHB market. The
CSHB market has been established as highly complex and segmented. More research
may be conducted into the nature of specific market segments in terms of cost
structure, attractiveness, contribution, and construction. This area is currently under
further investigation, however its nature forms a separate research project in its own
right and as such forms an area for further investigation.
This section has highlighted the limitations of the research through a critical review of
research methodology. A number of suggestions have been made as to how the
research could be applied in a more efficient and perhaps effective manner. Overall,
the researcher is satisfied that the research is original; valid; reliable; and objective.
The next section determines the most prominent areas warranting further investigation
established from this research to date.
11.3 AREAS FOR FURTHER RESEARCH
This section provides an overview of key areas warranting further investigation. The
areas of further research are a result of contributions to knowledge or the research
approach adopted. They are split into three areas relevant to key stages of the research
process adopted. The three areas are therefore : (i) market related developments, (ii)
organisation related developments, and (iii) testing the research model.
11.3.1 Market Related Developments In terms of the CSHB market, it is clear that further research is required. A number of
specific areas can be identified.
Page330
There is a clear need for a longitudinal study to document the size and growth of the
CSHB market and to identify any clear patterns of environmental influences.
The area of segmented markets and comparative analysis of differing segments is an
area warranting further analysis particularly in relations to the value of segments,
packaging segments and the relative elasticity's of markets. Such research not only
assists in reducing the complexity of tourism markets but exposes valuable data with
regard to hotel operators in such markets.
Further research is also warranted in the area of cost structures and performance in the
CSHB market. Work by EIU (1992) identified the potential effects ofhotel cost
structures on pricing levels in international markets. As cost and contribution are key
elements of CSHB provision, this area provides considerable opportunities for further
research that may contribute to understanding hospitality operations and markets.
Such research may be considered from the multi-site operational perspective (Berry et
al1991) or from an industry corporate perspective, determining the value of various
segment sales mixes (Quain 1992) and cost structure ratios.
In addition, the elements of changes in seasonality, and fluctuations in exchange rate
affects upon pricing (Muller et al1990), and the perception of the hotel unit (market)
level should be further investigated, to provide an understanding of CSHB market
dynamics. An area of particular focus here is the role and strength of branding and
positioning of hotels in various market segments (Dibb & Simkin 1993), as well as
the ability to move between distribution channels (Stem 1993). The research areas
linked to distribution provide further opportunities for additional contributions to
knowledge. This research has highlighted the range and usage of distribution channels
however, questions arise as to the value of commission in the market, the most
effective mixture of channels used, and the role of technology in distributing CSHB.
11.3.2 Organisation Related Developments
Further research opportunities exist in relation to the dynamics of the hotel or hotel
group itself as opposed to a market perspective. In this area differing organisational
structures affecting strategy or performance in the market (Boschken 1990) offer
major research opportunities. Introducing the organisational structure into the research
framework allows a further dimension to the research to be analysed. In addition,
research may determine if such variables as asset specificity or ownership
(Balakrishnan & Fox 1993, Sudarsanam 1992) affect CSHB or other market
relationships.
Page 331

The existence of barriers to entry or mobility provide opportunities to contribute to an
understanding of organisation dynamics and how organisations react to such market
and strategic developments, highlighting the value and development of joint ventures
and the degree of organisational innovation.
A further area of potential research, and one of key importance is research into the
role of secondary support strategies in enhancing strategy implementation. Determing
not only the strategic capability of organisations but the suggested "best mix" of
strategies for market structures provides an excellent tool for decision making.
Organisation linkages also provide potential to determine their influence upon
organisational performance, and within various market segments. One such example
is the role of technology in increasing and managing market complexity and
improving performance. In addition here further research is required into the nature of
multi-site or multi-destination hotel units as opposed to and in comparison to the
corporate perspective, and the strategic dynamics of such relationships; including
advertising and promotion links. All of these areas warrant further investigation.
11.3.3 Testing The Research Model
Finally, in relation to the research methodology, major opportunity exists for further
research by applying the research approach and model to other market segments,
wider geographic areas, other industries, or different organisational levels.
Relative to the research approach, opportunities exist to widen the performance
measures adopted and evolve the cross discipline design to analyse inter and intra
relationships. This will ultimately be achieved by application of the model and
approach.
In line with evolving the research and adapting the approach, further research may be
designed to predict strategy developments through using cognitive mapping could be
applied to the strategic groups to determine where the decision makers of hotel groups
are directing themselves, and their operations. This would determine future
developments and help predict future market structures, allowing predictions of
movements in strategic space and indicating areas for developments and mapping
future market structures to allow companies to position themselves for better
performance.
Page332

The areas of further research provide major opportunities for other researchers in the
field and allow for a range of research levels, timescales and resource implications. As
Wong-Rieger and Rieger (1993) highlight, "are researchers concerned with studying
things right or studying the right things ?". The areas of further research are therefore
intended to be indicative and stimulate additional, perhaps more lateral thought.
Page333
11.4 CHAPTER SUMMARY
This chapter has established that the research has proven most satisfactory in
achieving the aims and objectives set, and thus contributing to knowledge. It has
provided a critical review of the research methodology adopted, highlighting problem
areas and identifying how the research may be refined. Recommendations for
refinement have been provided relative to the research approach, research methods,
samples, technology and data processing, and general changes.
This has been followed by establishing the key areas warranting further research
investigation in three categories of market analysis, organisational analysis and
application of the research methodology.
From the areas identified as requiring further analysis considerable additional
contributions to knowledge can be made either from an academic or practitioner
perspective. In this respect, the research has not only contributed significantly to
knowledge in the field of hospitality and tourism strategic management and to the
cross disciplines utilised, it has exposed a wide range of areas warranting further
investigation. In providing such opportunities the research acts as a milestone in
further research developments in hospitality and tourism and makes this research
contribution even more prominent and meaningful.
Page 334
REFERENCES
Argyris, C (1985) "Making knowledge more relevant to practice: maps for action", in
Lawler, E.E; Mohrman, A.M; Motirmann, A.M; Ledford, G.E; Cummings,
T.G (Eds) "Ding research that is useful for theory and practice", Jossey-Bass, San Francisco, pp 79-106
Arrow, K.J; Hahn, F.H (1971) "General competitive analysis", Holden Day, pp 48
Balakrishnan, S; Fox, I (1993) "Asset specificity~ firm heterogeneity and capital
structure", Strategic Management Journal, 14 pp 3-16
Baumol, W.J (1982) "Contestable markets : an uprising in the theory of industrial
structure", American Economic Review, 72, pp 1-15
Berry, W.L; Bozarth, C.C; Hill, T.J; Klompmaker, J.E (1991) "Factory focus :
segmenting markets from an operations perspective", Journal of Operations Management, 10(3) pp 363-387
Black, T.R (1993) "Evaluating social science research: an introduction", Sage
Publications, London
Boschken, H.L (1990) "Strategy and structure : reconceiving the relationship",
Journal of Management, 16(1) pp 135-150
Buffa, E.S; Dyer, J.S (1978) "Essentials of management science/operations research",
John Wiley & Sons, Chichester
Checkland, P (1981) "Systems thinking~ systems practice", Wiley, Chichester
Churchill, G.A (1991) "Marketing research: methodological foundations", Dryden
Press, 5th Edition, Hinsdale, Illinois.
Clarke, R; Davies, S. W; Waterson, M ( 1984) "The profitability - concentration
indices and market power : two views", Journal of Industrial Economics, 32,
pp 419-434
Cohen, L; Manion, L (1989) "Research methods in education", 3rd Edition,
Routledge, London, pp 3 8
Demsetz, H (1973) "Industrial structure, market rivalry and public policy", Journal of Law and Economics, 16, p1-9
Dibb, S; Simkin, L (1993) "The strength of branding and positioning in services",
International Journal of Service Industry Management, 4(1) pp 25-35
Dixit, A (1982) "Recent developments in oligopoly theory", American Economic
Review, 72, pp 12-1 7 E.I.U (1992) "International hotel prices and cost structures", EIU Travel and Tourism
Analyst, 5 pp 66-83
Page335
Easterby-Smith, M; Thorpe, R; Lowe, A (1993) "Management research : an
introduction", Sage, London
Edgar, D.A (1992) "The Commercial Short Holiday Break market in Scotland"
Unpublished report for the Scottish Tourist Board, Edinburgh March
European Commission (1995) "Collection of statistics offered in the field of
Tourism", Directive 95/57EC, November (Issued 6112/95)
'
Ferguson, P.R (1988) "Industrial economics: issues and perspectives", Macmillan
Education, London
Guba, E.G (1978) "Towards a naturalistic inquiry in education", Monograph 8, Centre for Study of Evaluation, UCLA
Guiltinan, J.P; Paul, G.W (1982) "Marketing Management", McGraw-Hill, New
York, pp 76
Gummesson, E (1991) "Qualitative methods in management research", Sage, London
Habermas, J (1970) "Knowledge and interest", in Emmet, D; Macintyre, A (eds)
"Sociological theory and philosophical analysis", Macmillan, London
Hatten, K.J; Hatten, M.L (1987) "Strategic groups. asymmetrical mobility barriers
and contestability", Strategic Management Journal, 8 pp 329-342
Keat, R (1981) "The politics of social theory", Blackwell, Oxford
Litteljohn, D.L. (1990) "Mount Charlotte climb to the top", Scottish Business Insider, March, pp 72-7 4
Littlechild, S.C (1986) "The fallacy of the mixed economy", 2nd Edition, Institute of
Economic Affairs, pp 12
McKie, J.W (1970) "Market structure and function: performance versus behaviour",
in Moukham, J.W; Papanek, G.F (Eds) "Industrial organisation and economic
development", Houghton, Mifflin pp 9
Morgan, G; Smircich, L (1980) "The case for qualitative research", Academy of Management Review, 5, pp 491-500
Muller, U.A; Dacorogna, M.M; Olsen, R.B; Pictet, O.V; Schwarz, M; Morgenegg, C
( 1990) "Statistical study of foreign exchange rates. empirical evidence of a
price change scaling law~ and intraday analysis", Journal of Banking and
Finance, 14 pp 1189-1208
Pearce, D.G; Butler, R.W (1994) "Tourism research: critiques and challenges",
Routledge, London, pp 13 Punj, G; Stewart, D (1989) "Cluster analysis in marketing research: review and
suggestions for application", Journal of Marketing Research, 20 pp 134-148
Quain, W.J (1992) "Analysing sales-mix profitability", The Cornell HRA Quarterly,
April pp 57-62
Page336
Reekie, D.W (1989) "Industrial economics: A critical introduction to corporate
enterprise in Europe and America", Edward Elgar, Aldershot. pp 38-59
Ritchie, J.R.B (1975) "Some critical aspects of measurement theory and practice in
travel research", Journal ofTravel Research, 13, 1
Ritchie, J.R.B; Goeldner, C.R (1987) "Travel, tourism and hospitality research. a
handbook for managers and researchers", Wiley, New York
Spence, A.M (1977) "Entry, capacity, investment and oligopolistic pricing'', Bell Journal of Economics and Management Science, 8, pp 534-544
Stern, L.W (1993) "Accomplishing marketing channel changes", European Management Journal, 11(1) pp 1-8
Sudarsanam, P (1992) "Market and industry structure and corporate cost of capital",
Journal of Industrial Economics, 40(2) pp 189-199
Tuckman, B.W (1992) "Conducting educational research", Harcourt Brace
Jovanovich, New York
Wentz, W.B (1972) "Marketing research: management and methods", Harper and
Row, New York
Wong-Rieger, D; Rieger, F (1993) "International management research: looking to
the future", Walter de Gruyter, Berlin
Page 337

BIBLIOGRAPHY

Ackoff, R (1970) "The concept of corporate planning", John Wiley & Sons New
York
Aldrich, H.E (1979) "Organisations and environments", Prentice Hall Englewood
Cliffs New Jersey
Allen, B.J and Vellenga, D.B (1987) "Affiliation of authors in transportation and
logistics academic journals- an update", Transportation Journal, 26(2) 39-47
Anderson, P.F. (1983) "Marketing. Scientific Progress and Scientific Method".
Journal of Marketing, 47, Fall, 18-31.
Andrews, K (1972) "The concept of corporate strategy", Irwin Homewood Illinois
Ansoff, H.I (1968) "Corporate strategy : an analytical approach to business policy for
growth and expansion", McGraw-Hill New York
Arndt, J. (1985) "The Tyranny of Paradigms: The Case for Paradigmatic Pluralism in
Marketing"~ In Dholakia, N. and Arndt, J (eds), Changing the Course of
Marketing: Alternative Paradigms for Widening Marketing Theory, JAI
Press: Greenwich, CN.
Ashton, T.S. (1971) "The Relation of Economic History to Economic Theory" In
Harte, N.B. (ed.), The Study of Economic History, Frank Cass: London.
Babbie, E ( 1989) "The practice of social research", Wadaworth Publishing
Company, New York
Bain, J.S (1956) "Barriers to new competition", Harvard University Press
Cambridge Massachusetts
Balakrishnan, S; Fox, I ( 1993) "Asset specificity. firm heterogeneity and capital
structure", Strategic Management Journal, 14 pp 3-16
Baumol, W.J (1982) "Contestable markets : an uprising in the theory of industrial
structure", American Economic Review, 72, pp 1-15
Page 338

Berry, W.L; Bozarth, C.C; Hill, T.J; Klompmaker, J.E (1991) "Factory focus:
segmenting markets from an operations perspective", Journal of Operations
Management, 10(3) pp 363-387
Black, T.R (1993) "Evaluating social science research: an introduction", Sage
Publications, London
Boschken, H.L (1990) "Strategy and structure: reconceiving the relationship",
Journal of Management, 16( 1) pp 13 5-150
Boston Consulting Group (1972) "Perspectives on experience 1968. 1970. 1972",
BCG Ltd New York
Boyer, E.L. (1990) "Scholarship Reconsidered: Priorities ofthe Professorate".
Princeton University Press: Princeton, NJ.
Buchholz, R.A (1982) "Business environment and public policy", Prentice Hall,
Englewood Cliffs
Buffa, E.S; Dyer, J.S (1978) "Essentials of management science/operations research",
John Wiley & Sons, Chichester
Burns, T; Stalker, G (1961) "The management of innovation", Tavistock London
Buttle, F (1986) "Hotel and food service marketing: a managerial approach", Cassell
London
Calantone, R.J; Mazanec, J.A (1991) "Marketing management and tourism"~ Annals
Tourism Research, 18(1) pp 101-119
Cameron, K. ( 1986) "A Study of Organizational Effectiveness and its Predictors".
Management Science, 32 (1), pp 87-112.
Caves, R; Porter, M.E (1977) "From entry barriers to mobility barriers", Quarterly
Journal of Economics, 91 May pp 241-261
Page339
Chamberlin, E.H (1962) "Theory of monopolistic competition", Harvard Univ.
Press, (first ed. 1932) London
Chandler, A.D (1962) "Strategy and structure: chapters in the history of the
industrial enterprise", Cambridge Massachusetts MIT Press
Channon, D (1978) "The service industries : strategy, structure and financial
performance", MacMillan London
Checkland, P (1981) "Systems thinking, systems practice", Wiley, Chichester
Churchill, G.A (1991) "Marketing research: methodological foundations", Dryden
Press, 5th Edition, Hinsdale, Illinois.
Clarke, R; Davies, S.W; Waterson, M (1984) "The profitability- concentration
indices and market power : two views", Journal of Industrial Economics, 32,
pp 419-434
Cohen, L; Manion, L (1989) "Research methods in education", 3rd Edition,
Routledge, London, pp 3 8
Daft, R.L (1989) "Organisation theory and design", West Publishing St. Paul
Davidson, R (1989) "Tourism", Pitman London pp 1-25
Demsetz, H (1973) "Industrial structure, market rivalry and public policy", Journal of
Law and Economics, 16, p1-9
Dibb, S; Simkin, L (1993) "The strength of branding and positioning in services",
International Journal of Service Industry Management, 4(1) pp 25-35
Dicken, P (1992) "Global shift", 2nd Edition Paul Chapman Publishing London
Dixit, A (1982) "Recent developments in oligopoly theory", American Economic
Review, 72, pp 12-17
Downey, K.H and Ireland, D (1979) "Quantitative versus Qualitative", Administrative
Science Quarterly, 24, pp 630-636
Page 340
E.I.U (1992) "International hotel prices and cost structures", EIU Travel and Tourism
Analyst, 5 pp 66-83
Easterby-Smith, M; Thorpe, R; Lowe, A (1993) "Management research: an
introduction", Sage, London
Edgar, D.A (1992) "The Commercial Short Holiday Break market in Scotland",
Unpublished report for the Scottish Tourist Board, Edinburgh March
English Tourist Board (1983) "Short break holidaytakers to Brighton", ETB Report,
London
Euromonitor (1978) "The Euromonitor holiday survey", Euromonoitor, London
Euromonitor (1987) "Short break holidays", Market Research G.B, Euromonitor
Publ. Ltd April Vol26 pp 15-22
European Commission (1995) "Collection of statistics offered in the field of
Tourism", Directive 95/57EC, November (Issued 6/12/95)
Ferguson, P.R (1988) "Industrial economics: issues and perspectives", Macmillan
Education, London
Goodman, P.S; Pennings, M (1977) "New perspectives on organisational
effectiveness", Jossey-Bass San Francisco California
Goulding, P (1992) "Britain's Leisure Industry", Jordan and Sons Ltd Bristol pp 23
Guba, E.G (1978) "Towards a naturalistic inquiry in education", Monograph 8,
Centre for Study of Evaluation, UCLA
Guiltinan, J.P; Paul, G.W (1982) "Marketing Management", McGraw-Hill, New
York
Gummesson, E (1991) "Qualitative methods in management research", Sage, London
Habermas, J (1970) "Knowledge and interest", in Emmet, D; Macintyre, A (eds)
"Sociological theory and philosophical analysis", Macmillan, London
Page341
Harrigan, K.R (1980) "Strategies for declining business", Lexington Massachusetts
Heath
Hatten, K (1974) "Strategic models in the brewing industry", PhD dissertation
Purdue University West Lafayette Indiana
Hatten, K (1979) "Quantitative research methods in strategic management". (In
Schendel) "Strategic Management : A New View of Business Policy and
Planning", Little, Brown and Co. Boston,
Hatten, K.J; Hatten, M.L (1987) "Strategic groups. asymmetrical mobility barriers
and contestability", Strategic Management Journal, 8 pp 329-342
Hay, D.A; Morris, D.J (1979) "Industrial economics: theory and evidence", Oxford
University Press Oxford
Hempel, C.G. (1969) "Logical Positivism and the Social Sciences". In Achinstein, P.
and Borker, S.F. (eds.), The Legacy of Logical Positivism, John Hopkins
Press: Baltimore.
Henderson, B (1979) "Henderson on corporate strategy", Abt Books Cambridge
Massachusetts
Hergert, M (1983) "The incidence and implications of strategic grouping in us
manufacturing industries", Unpublished Doctoral Dissertation, Harvard
University
Hoffer, C.W; Schendel, D.E (1978) "Strategy formulation: analytical concepts",
West Publishing St.Paul
Horwarth & Horwarth (1987) "World-wide Hotel Industry", Horwarth and Horwarth
International New York
Horwarth Consulting (1992) "The UK Hotel industry", Horwarth Consulting
Limited, London
Page342

Hughes, H.L (1989) "Economic for hotel and catering students", Stanley Thomas,
London
Hunt, J.D; Layne, D (1991) "Evolution oftravel and tourism terminology and
definitions", Journal ofTravel Research, 29(4) pp 7-11
Hunt, M (1972) "Competition in the home appliance industry 1960-1970",
Unpublished PhD Dissertation, Business Economics Committee, Harvard
University, May
Hunt, S.D. (1991) "Modem Marketing Theory: Critical Issues in the Philosophy of
Marketing Science". South-Western Publishing Co.: Cincinnati, OH.
Itami, H; Roehl, T.W (1987) "Mobilising invisible assets", Cambridge, Harvard
University Press
Keat, R (1981) "The politics of social theory", Blackwell, Oxford
Key Note Publications (1990) "Hotels: a market sector overview", Key Note
publications Ltd, London, Edition 6
Khandwalla, P.N (1977) "The design of organisations", Harcourt Brace Jovanovich
New York
Kidder, L.H; Judd, C.M (1986) "Research methods in social relations", CBS
Publishing, New York
Kotas, R; Davis, B (1976) "Food cost control", International Textbook Company
Ltd. London
Kzynak, E (1985) "Developing marketing strategy for a resource based industry",
Tourism Management, Sept pp 184-193
Lawrence, P; Lorsch, J (1967) "Organisation and environment", Harvard University
Press Boston
Page 343
Leeds Polytechnic (1983) "Off peak tourism study: an appraisal of the short and
additional holiday market", Leeds Polytechnic
Lewis, R.C; Chambers, R.E (1989) "Marketing leadership in hospitality : foundations
and practices", Von Nostrand Reinhold New York
Litteljohn, D.L. (1990) "Mount Charlotte climb to the top", Scottish Business Insider,
March, pp 72-7 4
Littlechild, S.C (1986) "The fallacy of the mixed economy", 2nd Edition, Institute of
Economic Affairs, pp 12
Lovelock, A (1991) "Services marketing", 2nd Edition Prentice Hall London
Luffman, G.A; Reed, R (1984) "The strategy and performance of British industry
1970-1980", MacMillan London
Martin, F (1991) "Challenges on the move: the 300 largest hotel chains", Hotels,
25(7) pp 40-43
Martin, W; Mason, S (1991) "The Thatcher years", Leisure Management, 11(4) pp
40-43
MAS Survey Research (1984) "Evaluation of the 1983 Wind in the Willows, short
break advertising campaign", English Tourist Board, London
McGee, J (1985) "Strategic groups : a bridge between industry structure and strategic
management", Strategic Marketing and Management, John Wiley & Sons
New York
McKie, J.W (1970) "Market structure and function: performance versus behaviour",
in Moukham, J. W; Papanek, G .F (Eds) "Industrial organisation and economic
development", Houghton, Mifflin pp 9
Middleton, V (1991) "British tourism: market prospects for the next 12 months",
Insights, 4 A71-A76
Page 344
Miles, R.E; Snow, C.C (1978) "Organisational strategy~ structure and process",
McGraw Hill, New York
Montgomery, C.A., Wernerfelt, B., and Balakrishnan, S. (1989) "Strategy Content
and the Research Process: A Critique and Commentary", Strategic
Management Journal, 10, pp 189-197.
Morgan, G; Smircich, L (1980) "The case for qualitative research", Academy of
Management Review, 5, pp 491-500
Moss-Kanter, R. (1983) "The Change Masters: Innovation and Entrepreneurship in
the American Corporation", Simon and Schuster: New York.
Moyle, F (1989) "Making a package tourist attraction", Marketing Week, 11(50) pp
44-47
MSI (1991) "Databrief: Short break holidays", Marketing Strategies for Industry
London
Muller, U.A; Dacorogna, M.M; Olsen, R.B; Pictet, O.V; Schwarz, M; Morgenegg, C
(1990) "Statistical study of foreign exchange rates. empirical evidence of a
price change scaling law. and intraday analysis", Journal of Banking and
Finance, 14 pp 1189-1208
Nailon, P. (1982) "Theory in Hospitality Management"~ International Journal of
Hospitality Management, 1 (3), pp 135-143.
Oglethorpe, M (1987) "Tourism and industrial Scotland", Tourism Management, pp
268-271 Sept
Pearce, D.G; Butler, R.W (1994) "Tourism research: critiques and challenges",
Routledge, London, pp 13
Peter, T.J. and Waterman, R.H. (1982) "In Search of Excellence", Harper and Row:
New York.
Page345
Peters, T. (1987) "Thriving on Chaos: Handbook for a management revolution.",
Guild Publishing, London
Pfeffer, J; Salancik, G.R (1978) "The external control of organisations", Harpers and
Row, New York
Porter, M.E (1976) "Interbrand choice. strategy and bilateral market power", Harvard
University Press Cambridge Massachusetts
Porter, M.E (1980) "Competitive strategy", Free Press New York
Porter, M.E (1985) "Competitive advantage", Free Press New York
Punj, G; Stewart, D (1989) "Cluster analysis in marketing research : review and
suggestions for application", Journal of Marketing Research, 20 pp 134-148
Quain, W.J (1992) "Analysing sales-mix profitability", The Cornell HRA Quarterly,
April pp 57-62
Reekie, D.W (1989) "Industrial economics: A critical introduction to corporate
enterprise in Europe and America", Edward Elgar, Aldershot. pp 38-59
Riddick, C.C; DeSchriver, M and Weissinger, E (1984) "A Methodological Reveiw of
Research in Journal of Leisure Research from 1978 to 1982", Journal of
Leisure Research, 16( 4) pp 23-28
Rippingale, N (1987) "Short breaks-are we pulling together", Tour Operator, April
pp 10
Ritchie, J.R.B (1975) "Some critical aspects of measurement theory and practice in
travel research", Journal ofTravel Research, 13, 1
Ritchie, J.R.B; Goeldner, C.R (1987) "Travel~ tourism and hospitality research. a
handbook for managers and researchers", Wiley, New York
Rumelt, R.P ( 197 4) "Strategy~ structure and economic performance", Harvard
University Press Cambridge Massachusetts
Page 346
Schendel, D.E; Hofer, C.W (1979) "Strategic management", Boston Little Brown
Scherer, F.M (1980) "Industrial market structure and economic performance", 2nd
Edition, Rand McNally, New York
Scottish Tourist Board (1980) "Tourism in the economy of Scotland", STB,
Edinburgh,
Sheldon, P.J (1991) "An authorship analysis of tourism research", Annals of Tourism
Research, 18(4) pp 473-484
Silverman, D (1985) "Qualitative methodology and sociology", Gower Publishing
Company, London
Spence, A.M (1977) "Entry. capacity~ investment and oligopolistic pricing", Bell
Journal of Economics and Management Science, 8, pp 534-544
Stem, L.W (1993) "Accomplishing marketing channel changes", European
Management Journal, 11(1) pp 1-8
Sudarsanam, P (1992) "Market and industry structure and corporate cost of capital",
Journal of Industrial Economics, 40(2) pp 189-199
Teare, R; Moutinho, L; Morgan, N (1990) "Managing and marketing services in the
1990's", Cassell London
Teece, D (1984) "The Competitive Challenge", Boston Massachusetts Ballinger
Thompson, J.A (1967) "Organisations in action", McGraw Hill, New York
Trinity Research (1989) "The short break package holiday market in the UK", Trinity
Research, London
Tuckman, B.W (1992) "Conducting educational research", Harcourt Brace
Jovanovich, New York
Watkins, E (1990) "Lodgings 400: who's best and why", Lodging Hospitality, 46(8)
pp 60-108
Page347

Wentz, W.B (1972) "Marketing research: management and methods", Harper and
Row, New York
Wong-Rieger, D; Rieger, F (1993) "International management research: looking to
the future"~ Walter de Gruyter, Berlin
Wood, R.C. (1988) "Against Social Science?". International Journal of Hospitality
Management, 7 (3), pp 239-250.
Page348

APPENDICES
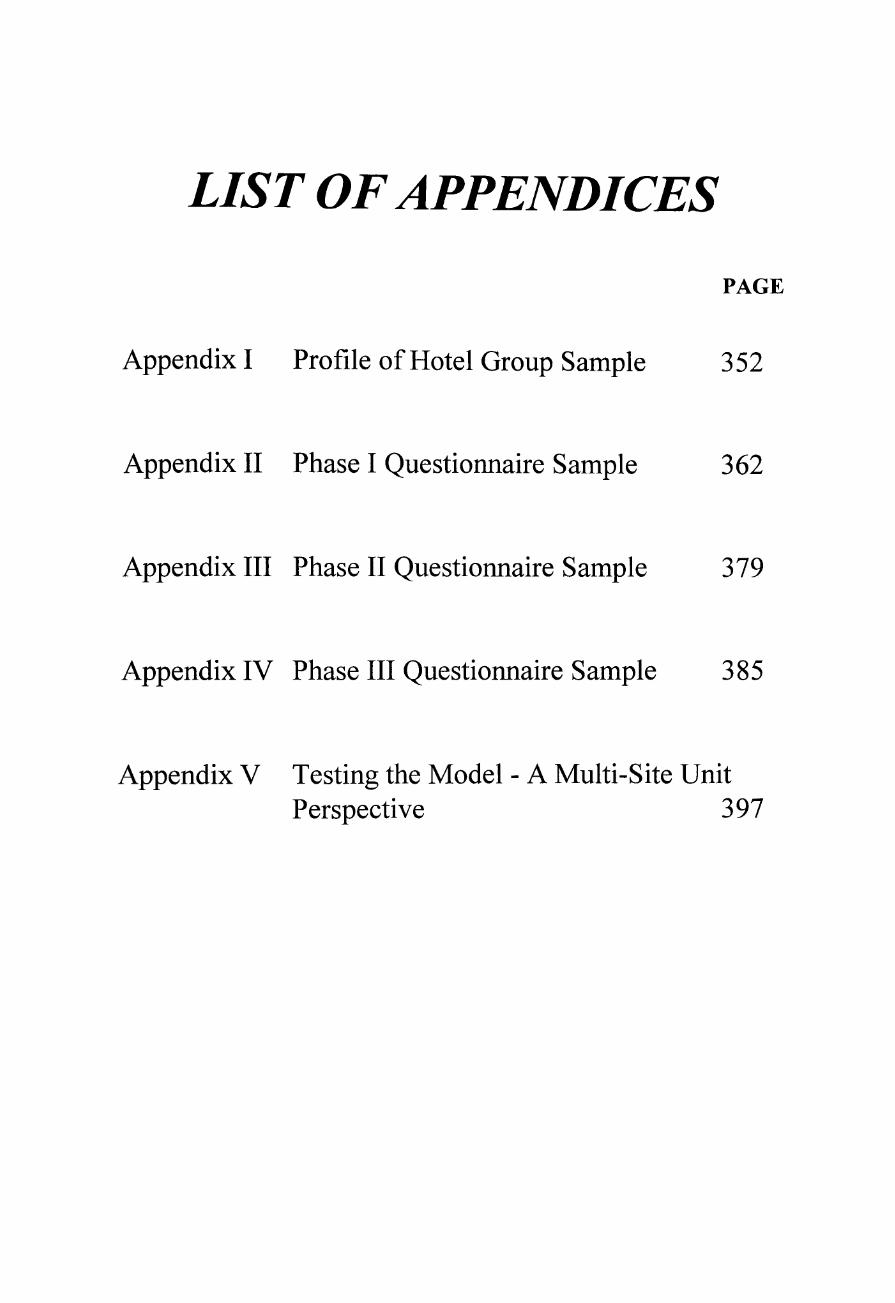
LIST OF APPENDICES
PAGE
Appendix I Profile of Hotel Group Sample 352
Appendix II Phase I Questionnaire Sample 362
Appendix III Phase II Questionnaire Sample 379
Appendix IV Phase III Questionnaire Sample 385
Appendix V Testing the Model - A Multi-Site Unit Perspective 397

APPENDIX/
Profile of Hotel Group Sample
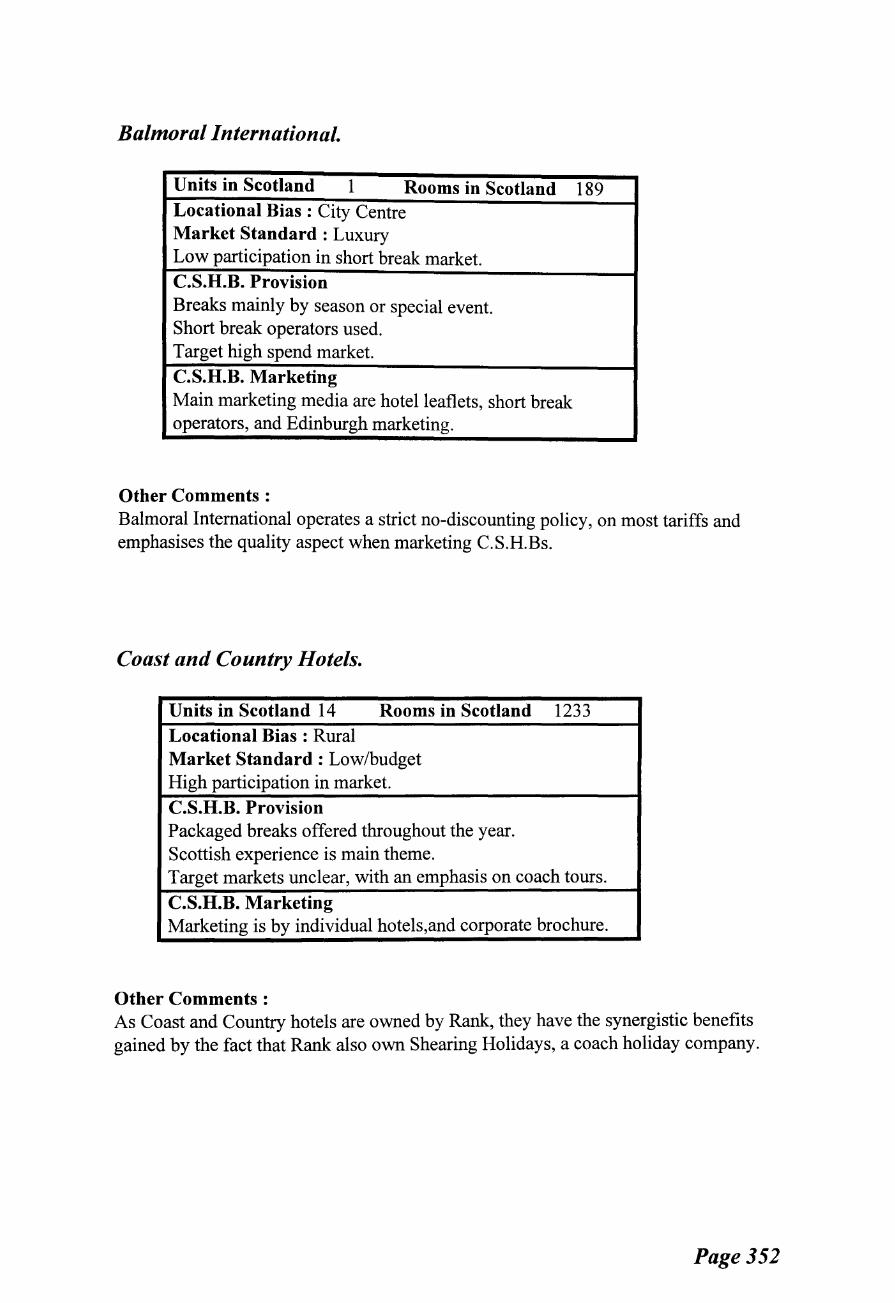
Balmoral International.
Units in Scotland 1 Rooms in Scotland 189 Locational Bias : City Centre Market Standard: Luxury Low participation in short break market. C.S.H.B. Provision Breaks mainly by season or special event. Short break operators used. Target high spend market. C.S.H.B. Marketing Main marketing media are hotel leaflets, short break operators, and Edinburgh marketing.
Other Comments : Balmoral International operates a strict no-discounting policy, on most tariffs and emphasises the quality aspect when marketing C.S.H.Bs.
Coast and Country Hotels.
Units in Scotland 14 Rooms in Scotland 1233 Locational Bias : Rural Market Standard : Low/budget High participation in market. C.S.H.B. Provision Packaged breaks offered throughout the year. Scottish experience is main theme. Target markets unclear, with an emphasis on coach tours.
C.S.H.B. Marketing Marketing is by individual hotels,and corporate brochure.
Other Comments : As Coast and Country hotels are owned by Rank, they have the synergistic benefits gained by the fact that Rank also own Shearing Holidays, a coach holiday company.
Page352
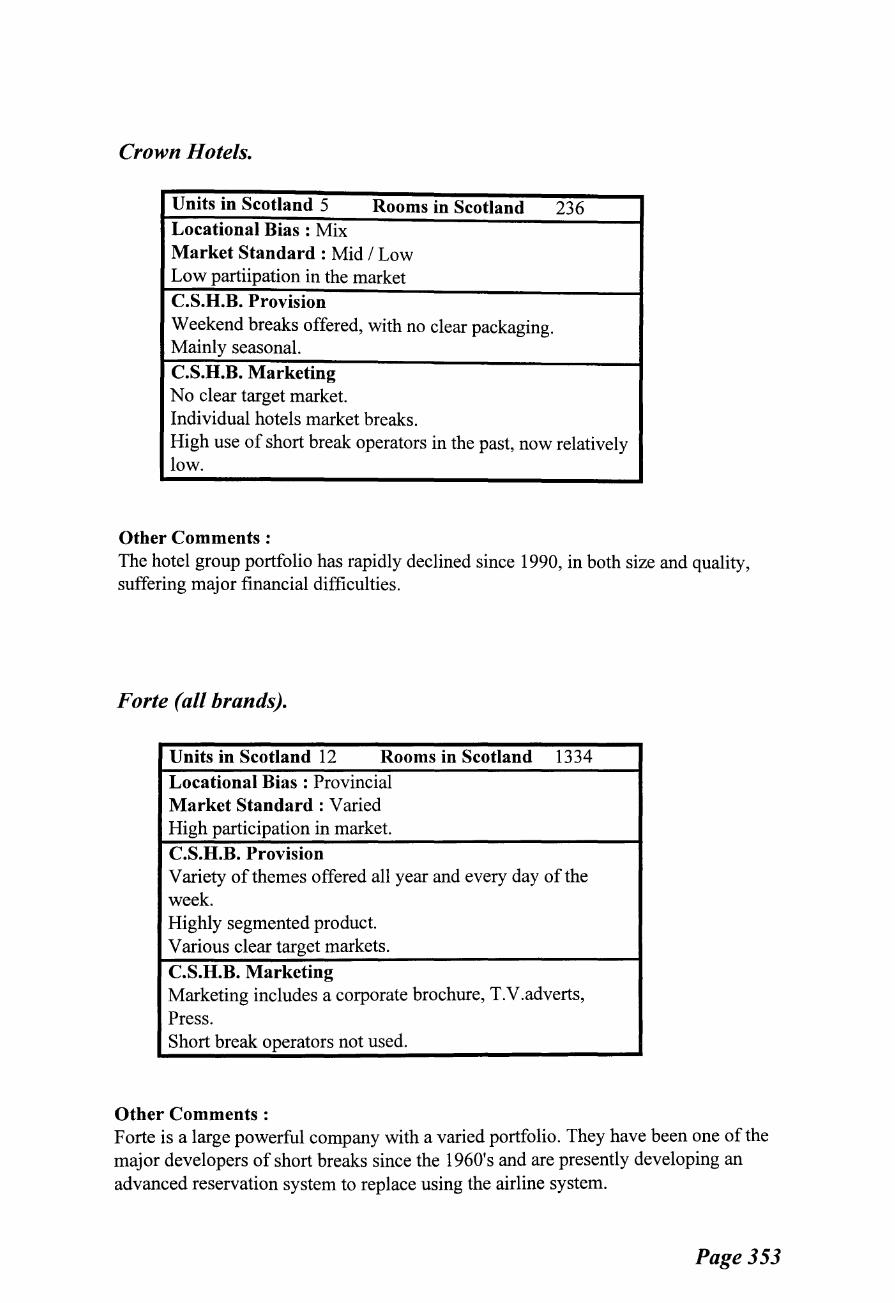
Crown Hotels.
Units in Scotland 5 Rooms in Scotland 236 Locational Bias : Mix Market Standard : Mid I Low Low partiipation in the market C.S.H.B. Provision Weekend breaks offered, with no clear packaging. Mainly seasonal. C.S.H.B. Marketing No clear target market. Individual hotels market breaks. High use of short break operators in the past, now relatively low.
Other Comments : The hotel group portfolio has rapidly declined since 1990, in both size and quality, suffering major financial difficulties.
Forte (all brands).
Units in Scotland 12 Rooms in Scotland 1334 Locational Bias : Provincial Market Standard : Varied High participation in market. C.S.H.B. Provision Variety of themes offered all year and every day of the week. Highly segmented product. Various clear target markets. C.S.H.B. Marketing Marketing includes a corporate brochure, T.V.adverts, Press. Short break operators not used.
Other Comments : Forte is a large powerful company with a varied portfolio. They have been one of the major developers of short breaks since the 1960's and are presently developing an advanced reservation system to replace using the airline system.
Page353
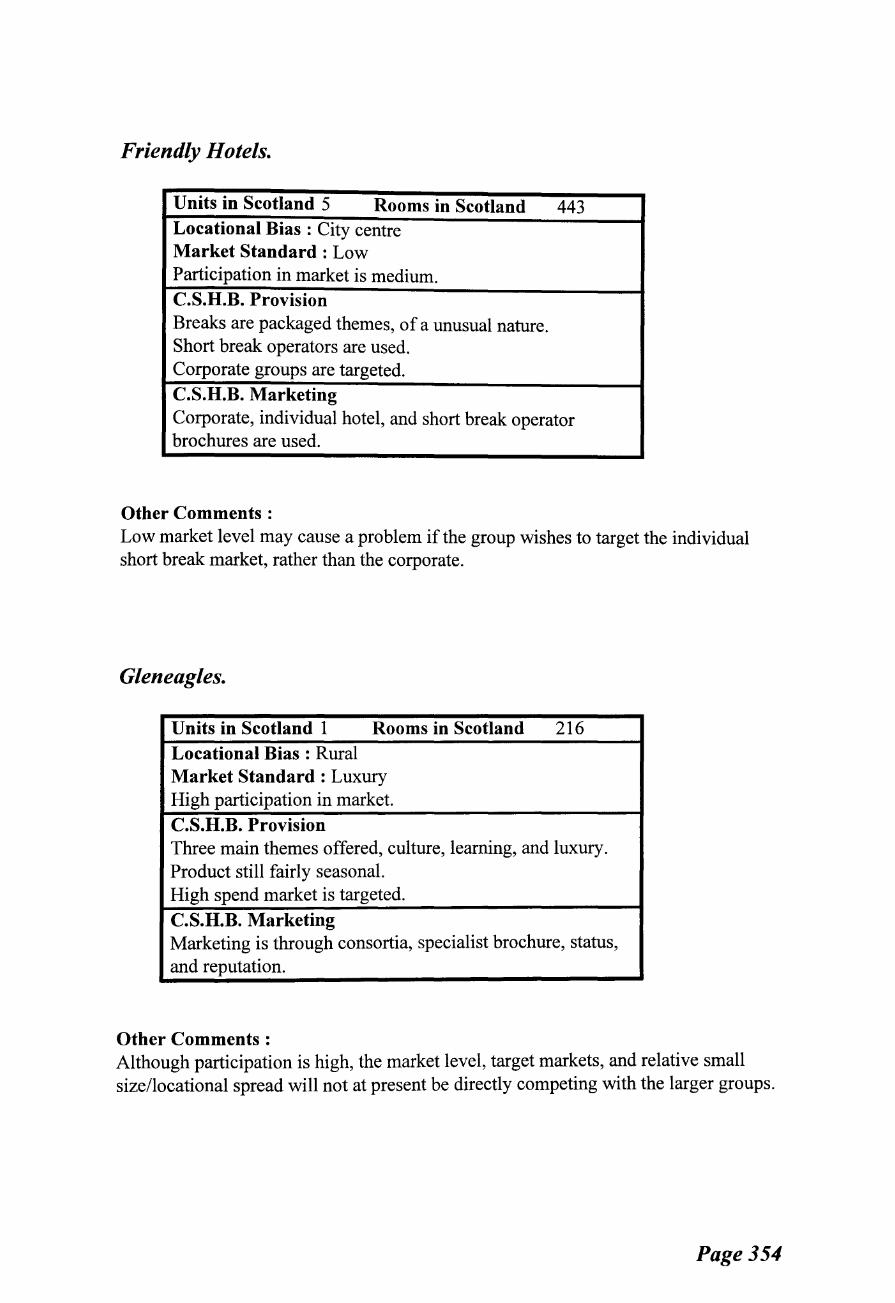
Friendly Hotels.
Units in Scotland 5 Rooms in Scotland 443 Locational Bias : City centre Market Standard : Low Participation in market is medium. C.S.H.B. Provision Breaks are packaged themes, of a unusual nature. Short break operators are used. Corporate groups are targeted. C.S.H.B. Marketing Corporate, individual hotel, and short break operator brochures are used.
Other Comments : Low market level may cause a problem if the group wishes to target the individual short break market, rather than the corporate.
Gleneagles.
Units in Scotland 1 Rooms in Scotland 216 Locational Bias : Rural Market Standard: Luxury High participation in market.
C.S.H.B. Provision Three main themes offered, culture, learning, and luxury. Product still fairly seasonal. High spend market is targeted.
C.S.H.B. Marketing Marketing is through consortia, specialist brochure, status, and reputation.
Other Comments : Although participation is high, the market level, target markets, and relative small size/locational spread will not at present be directly competing with the larger groups.
Page354
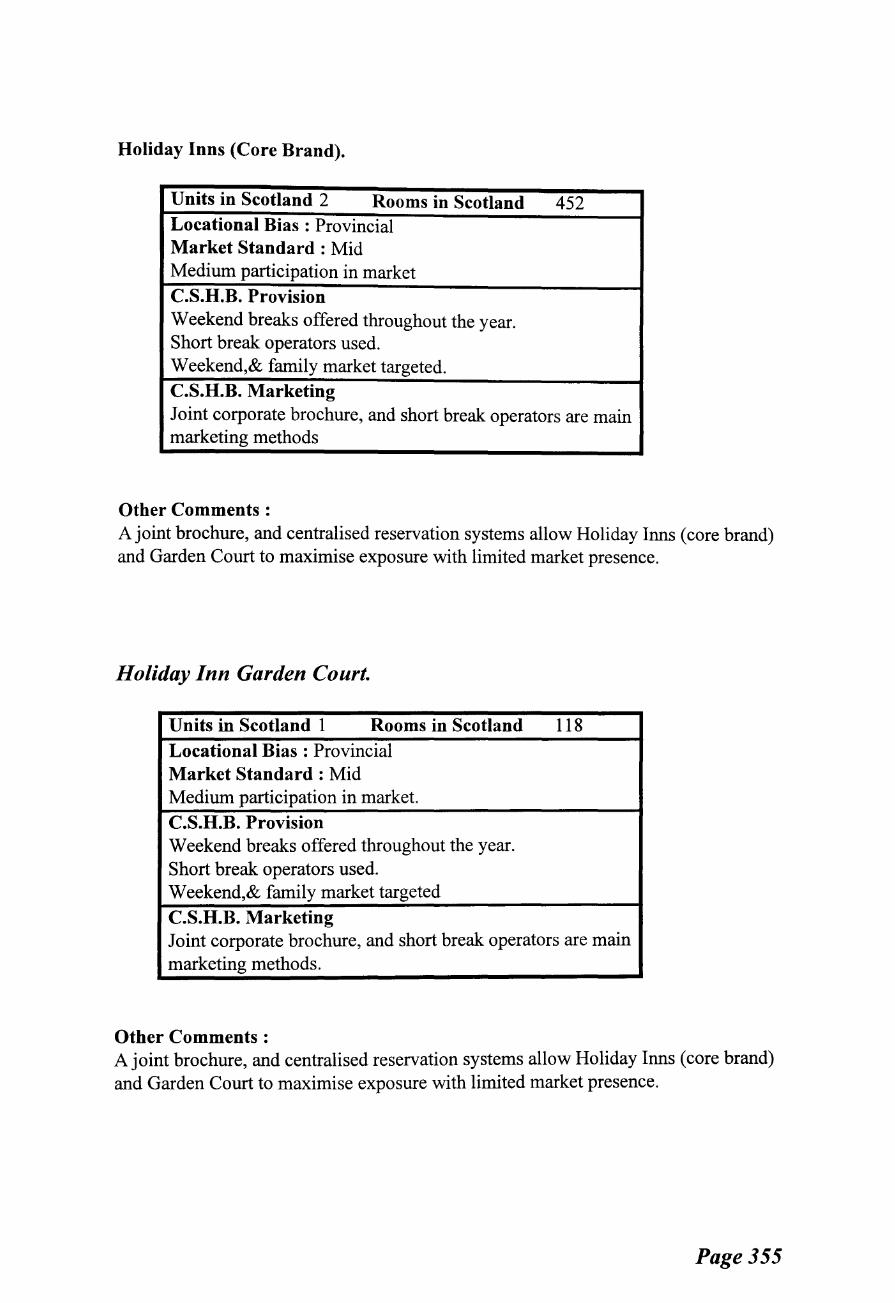
Holiday Inns (Core Brand).
Units in Scotland 2 Rooms in Scotland 452 Locational Bias : Provincial Market Standard : Mid Medium participation in market C.S.H.B. Provision Weekend breaks offered throughout the year. Short break operators used. Weekend,& family market targeted. C.S.H.B. Marketing Joint corporate brochure, and short break operators are main marketing methods
Other Comments : A joint brochure, and centralised reservation systems allow Holiday Inns (core brand) and Garden Court to maximise exposure with limited market presence.
Holiday Inn Garden Court.
Units in Scotland 1 Rooms in Scotland 118 Locational Bias : Provincial Market Standard : Mid Medium participation in market. C.S.H.B. Provision Weekend breaks offered throughout the year. Short break operators used. Weekend,& family market targeted
C.S.H.B. Marketing Joint corporate brochure, and short break operators are main marketing methods.
Other Comments : A joint brochure, and centralised reservation systems allow Holiday Inns (core brand) and Garden Court to maximise exposure with limited market presence.
Page 355
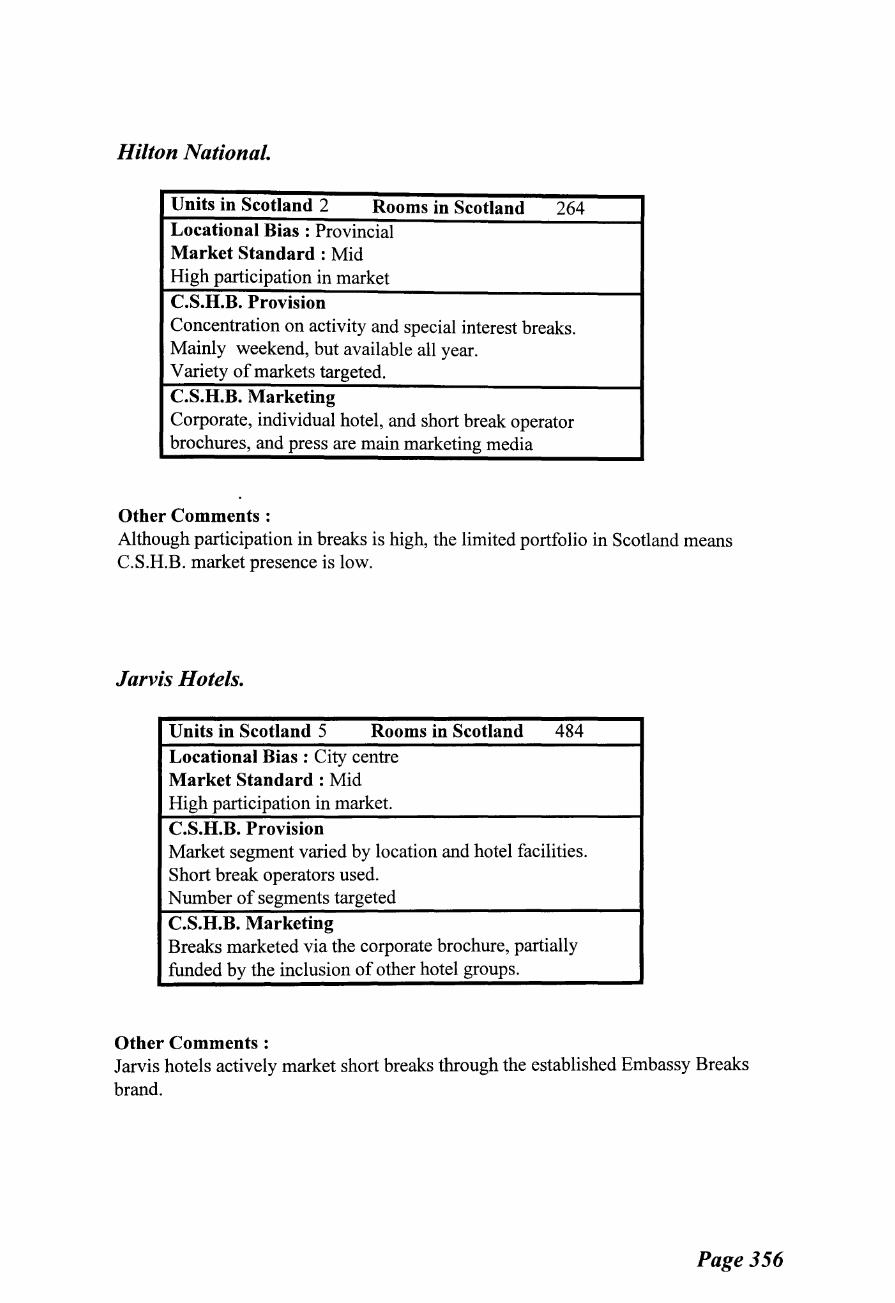
Hilton National.
Units in Scotland 2 Rooms in Scotland 264 Locational Bias : Provincial Market Standard : Mid High participation in market C.S.H.B. Provision Concentration on activity and special interest breaks. Mainly weekend, but available all year. Variety of markets targeted. C.S.H.B. Marketing Corporate, individual hotel, and short break operator brochures, and press are main marketing media
Other Comments : Although participation in breaks is high, the limited portfolio in Scotland means C.S.H.B. market presence is low.
Jarvis Hotels.
Units in Scotland 5 Rooms in Scotland 484 Locational Bias : City centre Market Standard : Mid High participation in market. C.S.H.B. Provision Market segment varied by location and hotel facilities. Short break operators used. Number of segments targeted
C.S.H.B. Marketing Breaks marketed via the corporate brochure, partially funded by the inclusion of other hotel groups.
Other Comments : Jarvis hotels actively market short breaks through the established Embassy Breaks brand.
Page356
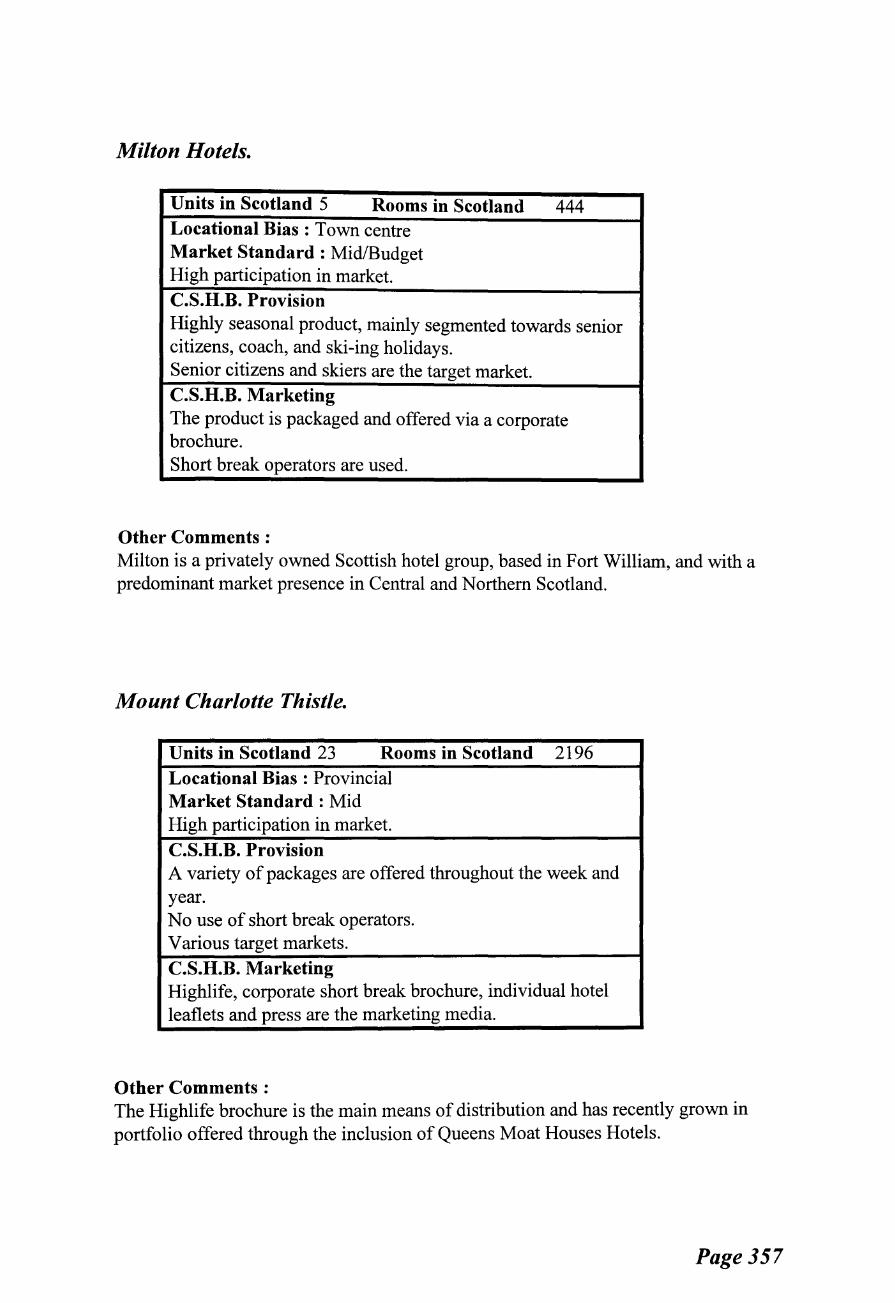
Milton Hotels.
Units in Scotland 5 Rooms in Scotland 444 Locational Bias: Town centre Market Standard : Mid/Budget High participation in market.
C.S.H.B. Provision Highly seasonal product, mainly segmented towards senior citizens, coach, and ski-ing holidays. Senior citizens and skiers are the target market.
C.S.H.B. Marketing The product is packaged and offered via a corporate brochure. Short break operators are used.
Other Comments : Milton is a privately owned Scottish hotel group, based in Fort William, and with a predominant market presence in Central and N orthem Scotland.
Mount Charlotte Thistle.
Units in Scotland 23 Rooms in Scotland 2196
Locational Bias : Provincial Market Standard : Mid High participation in market.
C.S.H.B. Provision A variety of packages are offered throughout the week and year. No use of short break operators. Various target markets.
C.S.H.B. Marketing Highlife, corporate short break brochure, individual hotel leaflets and press are the marketing media.
Other Comments : The Highlife brochure is the main means of distribution and has recently grown in portfolio offered through the inclusion of Queens Moat Houses Hotels.
Page357
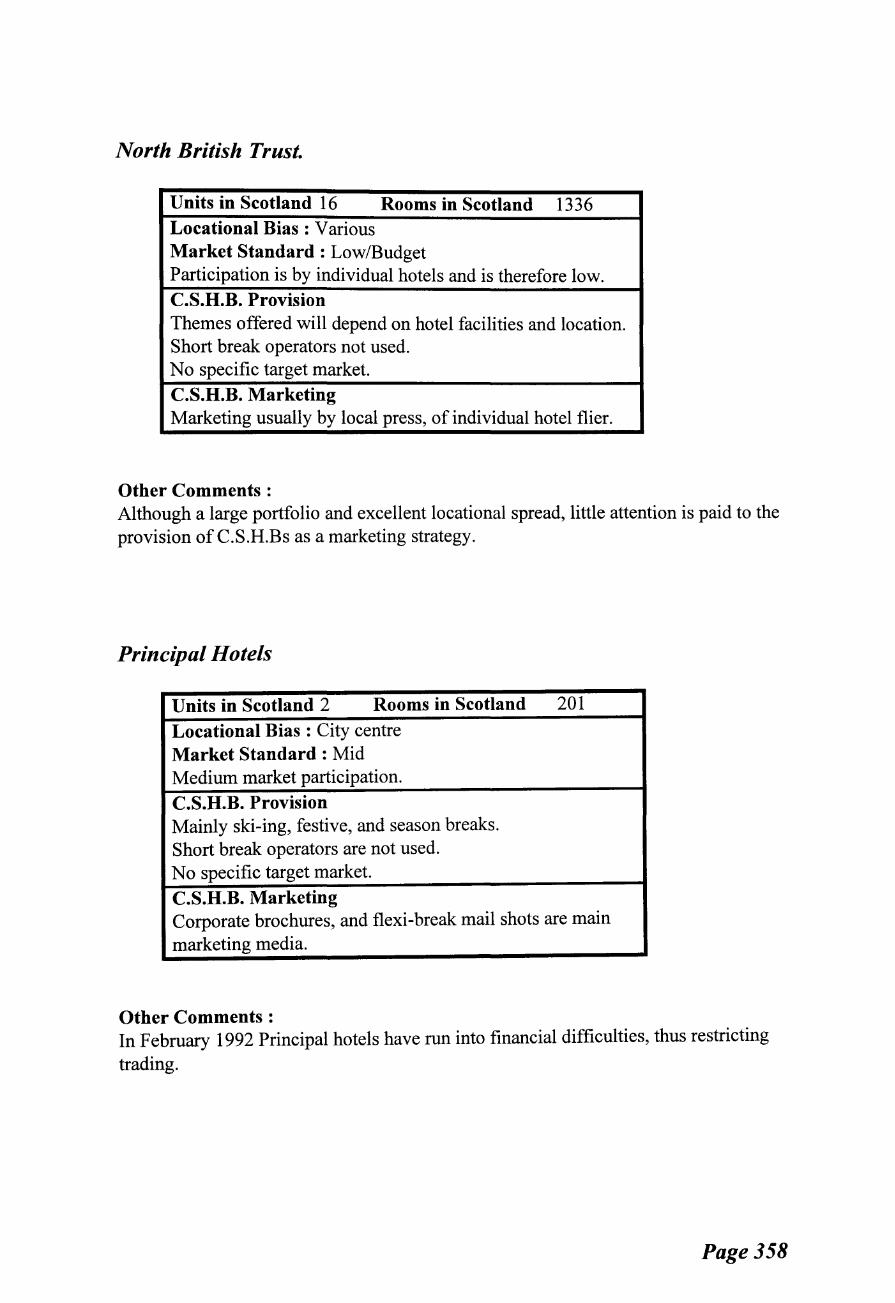
North British Trust.
Units in Scotland 16 Rooms in Scotland 1336 Locational Bias : Various Market Standard: Low/Budget Participation is by individual hotels and is therefore low. C.S.H.B. Provision Themes offered will depend on hotel facilities and location. Short break operators not used. No specific target market. C.S.H.B. Marketing Marketing usually by local press, of individual hotel flier.
Other Comments : Although a large portfolio and excellent locational spread, little attention is paid to the provision of C.S.H.Bs as a marketing strategy.
Principal Hotels
Units in Scotland 2 Rooms in Scotland 201
Locational Bias : City centre Market Standard: Mid Medium market participation. C.S.H.B. Provision Mainly ski-ing, festive, and season breaks. Short break operators are not used. No specific target market. C.S.H.B. Marketing Corporate brochures, and flexi-break mail shots are main marketing media.
Other Comments : In February 1992 Principal hotels have run into financial difficulties, thus restricting
trading.
Page358
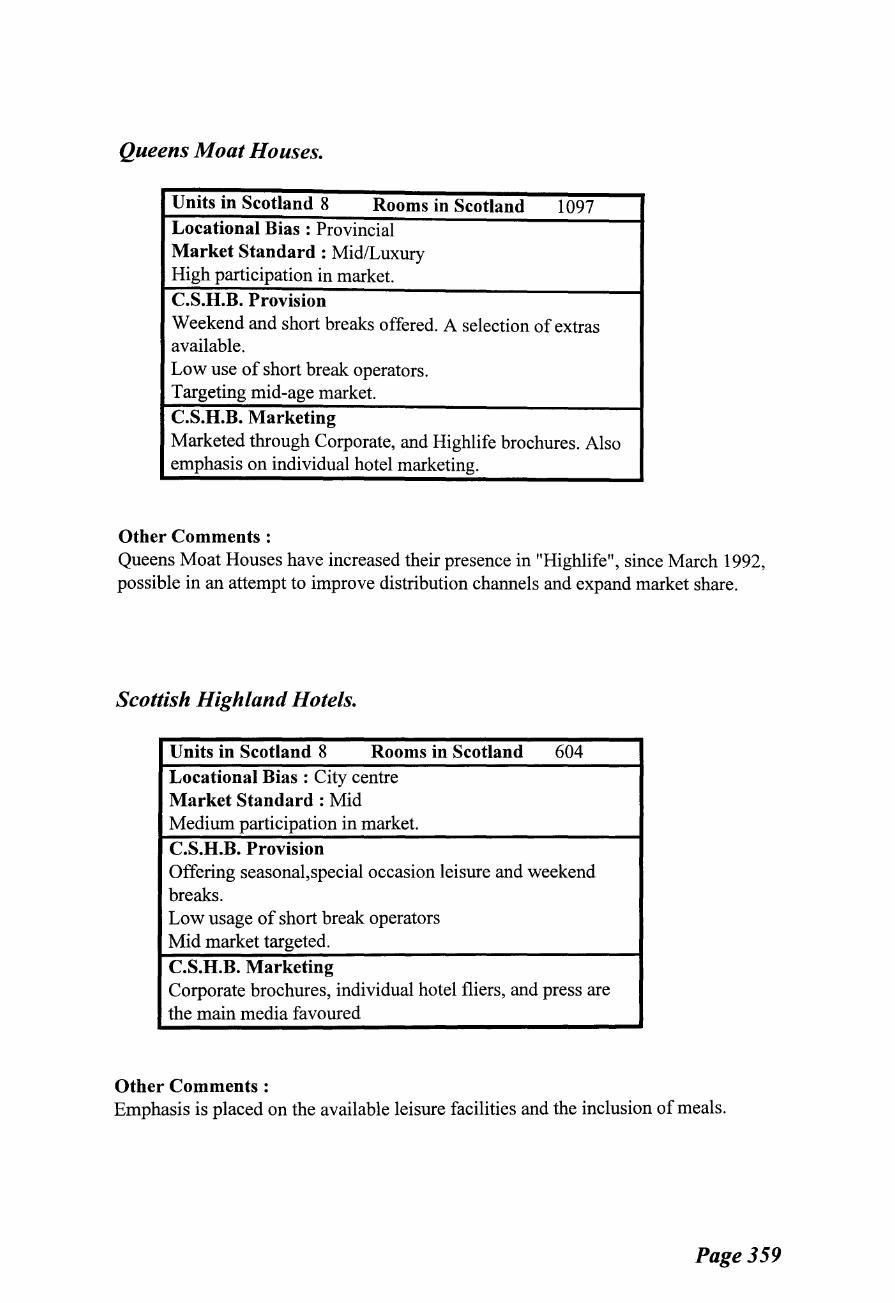
Queens Moat Houses.
Units in Scotland 8 Rooms in Scotland 1097 Locational Bias : Provincial Market Standard : Mid/Luxury High participation in market. C.S.H.B. Provision Weekend and short breaks offered. A selection of extras available. Low use of short break operators. Targeting mid-age market. C.S.H.B. Marketing Marketed through Corporate, and Highlife brochures. Also emphasis on individual hotel marketing.
Other Comments : Queens Moat Houses have increased their presence in "Highlife", since March 1992, possible in an attempt to improve distribution channels and expand market share.
Scottish Highland Hotels.
Units in Scotland 8 Rooms in Scotland 604 Locational Bias : City centre Market Standard : Mid Medium participation in market.
C.S.H.B. Provision Offering seasonal,special occasion leisure and weekend breaks. Low usage of short break operators Mid market targeted.
C.S.H.B. Marketing Corporate brochures, individual hotel fliers, and press are the main media favoured
Other Comments : Emphasis is placed on the available leisure facilities and the inclusion of meals.
Page359
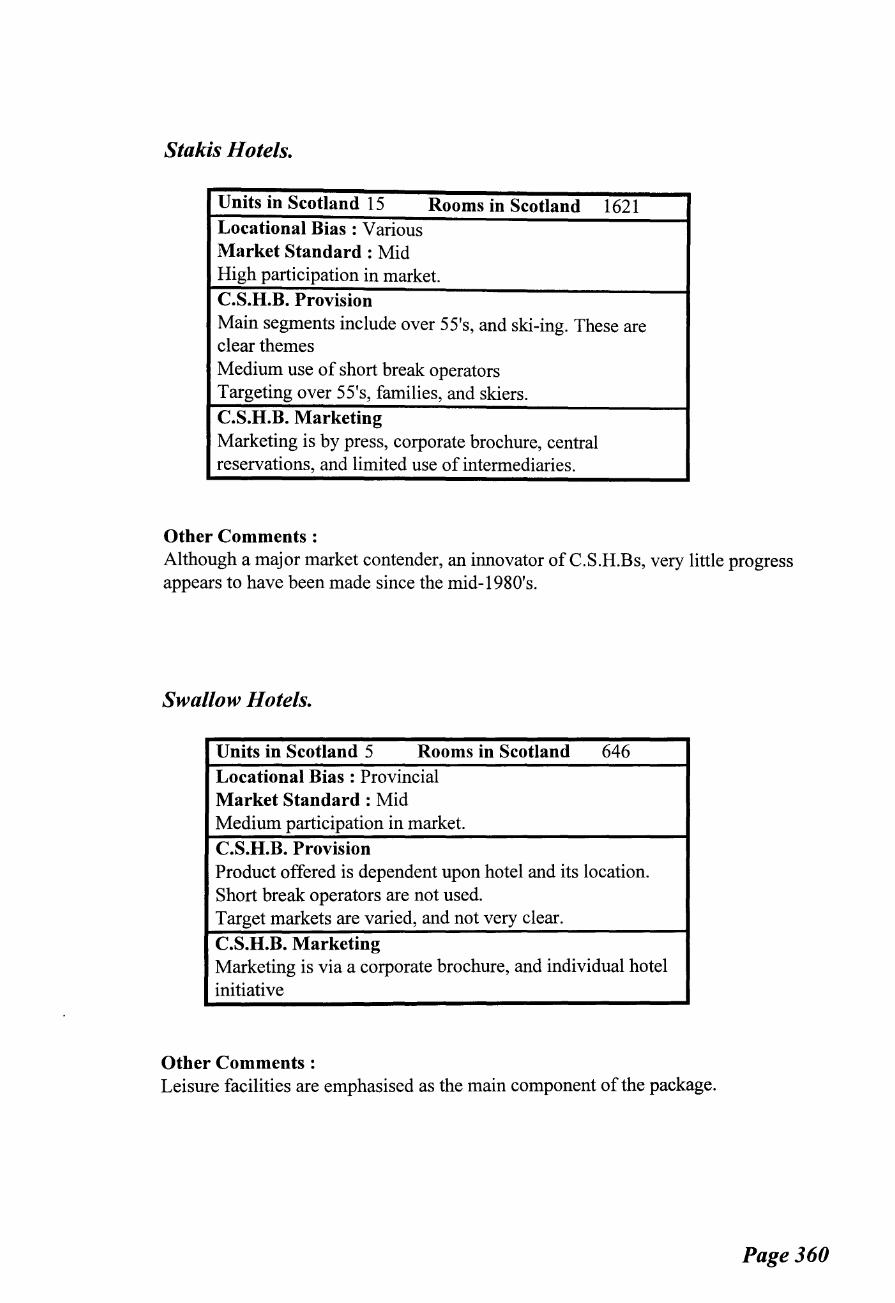
Stakis Hotels.
Units in Scotland 15 Rooms in Scotland 1621 Locational Bias : Various Market Standard : Mid High participation in market. C.S.H.B. Provision Main segments include over 55's, and ski-ing. These are clear themes Medium use of short break operators Targeting over 55's, families, and skiers. C.S.H.B. Marketing Marketing is by press, corporate brochure, central reservations, and limited use of intermediaries.
Other Comments : Although a major market contender, an innovator of C.S.H.Bs, very little progress appears to have been made since the mid-1980's.
Swallow Hotels.
Units in Scotland 5 Rooms in Scotland 646 Locational Bias : Provincial Market Standard : Mid Medium participation in market. C.S.H.B. Provision Product offered is dependent upon hotel and its location. Short break operators are not used. Target markets are varied, and not very clear. C.S.H.B. Marketing Marketing is via a corporate brochure, and individual hotel initiative
Other Comments : Leisure facilities are emphasised as the main component of the package.
Page360
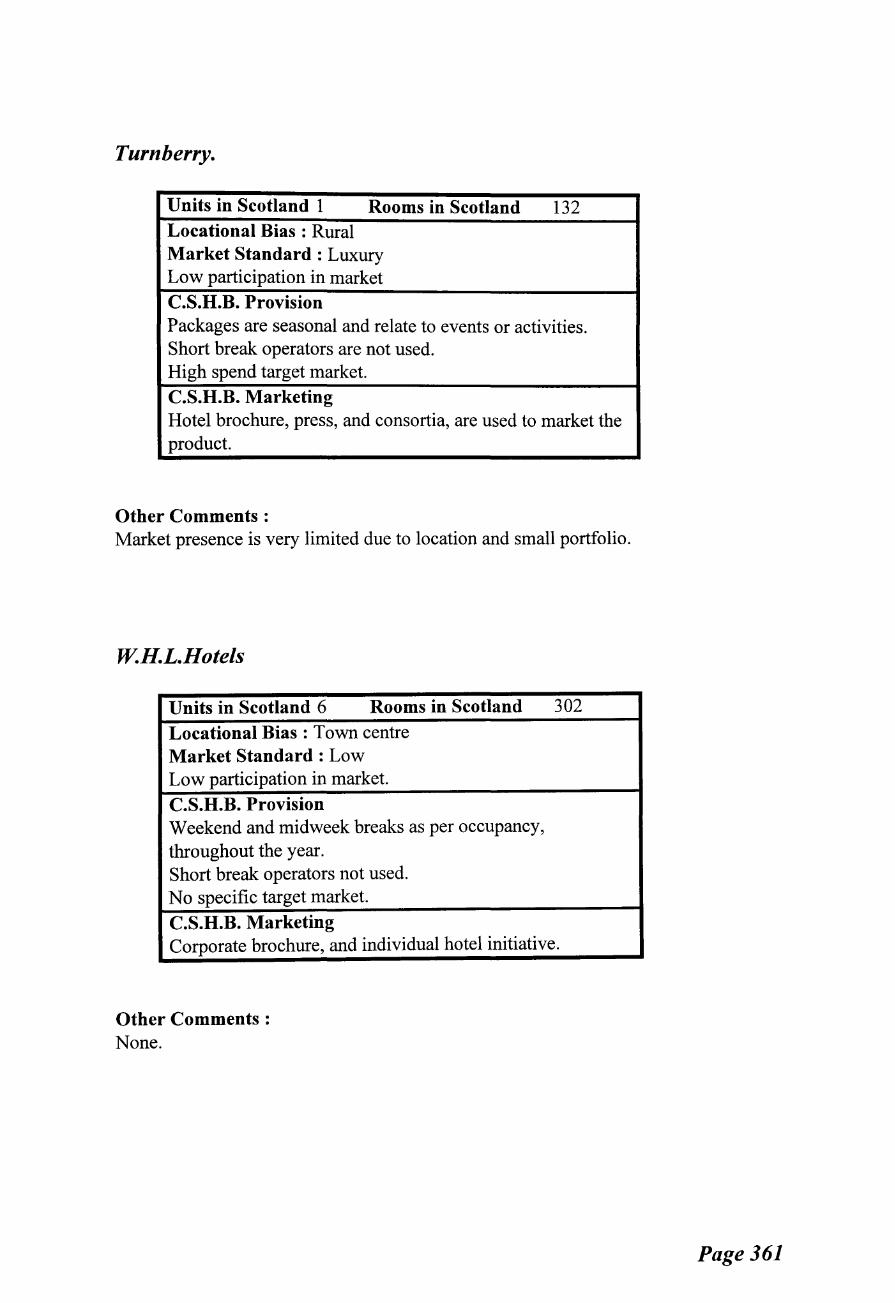
Turn berry.
Units in Scotland 1 Rooms in Scotland 132 Locational Bias : Rural Market Standard : Luxury Low participation in market C.S.H.B. Provision Packages are seasonal and relate to events or activities. Short break operators are not used. High spend target market. C.S.H.B. Marketing Hotel brochure, press, and consortia, are used to market the product.
Other Comments : Market presence is very limited due to location and small portfolio.
W.H.L.H otels
Units in Scotland 6 Rooms in Scotland 302
Locational Bias: Town centre Market Standard : Low Low participation in market. C.S.H.B. Provision Weekend and midweek breaks as per occupancy, throughout the year. Short break operators not used. No specific target market. C.S.H.B. Marketing Corporate brochure, and individual hotel initiative.
Other Comments : None.
Page 361
APPENDIX/I
Phase I Questionnaire Sample
PURPOSE To establish the basic market structure and nature of supply in CSHB
markets in Scotland
SAMPLE 24 companies
(18 hotel groups, 4 SBOs, 2 consortia)
FORMAT Telephone Interviews
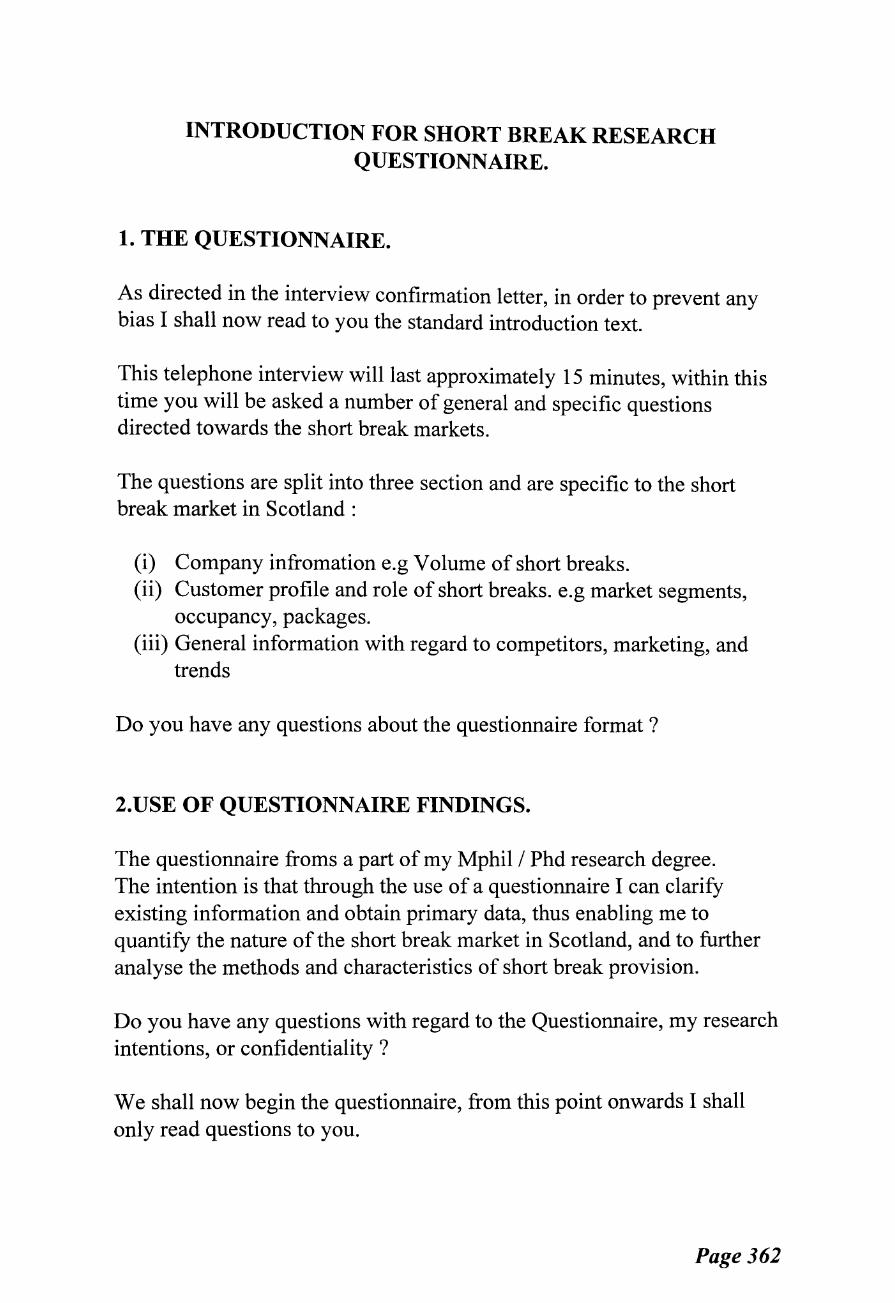
INTRODUCTION FOR SHORT BREAK RESEARCH QUESTIONNAIRE.
1. THE QUESTIONNAIRE.
As directed in the interview confirmation letter, in order to prevent any bias I shall now read to you the standard introduction text.
This telephone interview will last approximately 15 minutes, within this time you will be asked a number of general and specific questions directed towards the short break markets.
The questions are split into three section and are specific to the short break market in Scotland:
(i) Company infromation e.g Volume of short breaks. (ii) Customer profile and role of short breaks. e.g market segments,
occupancy, packages. (iii) General information with regard to competitors, marketing, and
trends
Do you have any questions about the questionnaire format ?
2.USE OF QUESTIONNAIRE FINDINGS.
The questionnaire froms a part of my Mphil I Phd research degree. The intention is that through the use of a questionnaire I can clarify existing information and obtain primary data, thus enabling me to quantify the nature of the short break market in Scotland, and to further analyse the methods and characteristics of short break provision.
Do you have any questions with regard to the Questionnaire, my research intentions, or confidentiality ?
We shall now begin the questionnaire, from this point onwards I shall only read questions to you.
Page 362

NAPIER POLYTECHNIC DEPARTMENT OF HOTEL AND CATERING STUDIES
COMMERCIAL SHORT HOLIDAY BREAK OPERATORS/CONSORTIA QUESTIONNAIRE
TELEPHONE INTERVIEW :-
DATE : .. .! . .! .•.
WITH : ........................... .
COMPANY : ....................... . CODE : ........... .
Please note that all answers given will be treated in complete confidence. No company will be transmitted to any third party and no company will be individually identified.
1. COMPANY DETAILS.
1.1 Firstly, I would like generally to establish what hotel portfolio is represented in your brochure for Scotland, and the o/o of rooms provided at various market levels in 1991.
A working definition of the market levels is: : Luxury .... 5 Star or 4 Star (Equivalent) : Medium .... 3 Star (Equivalent) : Budget .... 2 Star or Less (Equivalent)
Number of Number MARKET LEVEL HOTELS ROOMS %of Rooms
Luxury:
Medium:
Budget:
TOTAL:
Page363

1.2 To establish how short breaks have grown over the years, I would like to know some general information on the volume of your business in 1991:
how many C.S.B.H. room nights were sold in Scotland in 1991 :
how much revenue did C.S.H.B. account for in 1991.
YEAR ROOM NIGHTS TURNOVER£s
1991
THE NEXT GROUP OF QUESTIONS RELATES TO THE OVERALL COMPANY CUSTOMER PROFILE AND THE ROLE OF SHORT HOLIDAY PACKAGES.
2. Could you estimate the rough 0/o split between the following three booking methods:
: Independently booked by customer ..... .
: Booked through an agency ............. .
: Booked through other intermediaries ...
3. TIMING OF DEMAND.
3.1 On average, over the last six years, roughly what o/o of your yearly business comes in the following monthly groupings.
e.g If all business is in JAN. JAN= 100°/o
TIME OF YEAR
MONTH
Jan Feb Mar Apr May Jun Jul Aug Sep Oct Nov Dec
Page 364

3.2 Being more specific, rating 1 - 10, (1 =no demand, 10= unable to satisfy demand) what is the level of demand at various times of the week, by night of stay.
TIME OF WEEK (NIGHT)
SUN MON TUE WED THR FRI SAT
4. PACKAGING SHORT BREAKS.
Having established the various demand trends, we shall now turn our attention to the role of Short Holiday packages in the holiday market.
4.1 It has been suggested by various sources that packages are an integral part of the short break product, does your company offer short break packages.
YES/NO
IF YES: What packages do you offer.
TYPE OF PACKAGE
1 ............... .
~ •...••......•...
3 ............... .
4 ............... .
5 ............... .
6 ............... .
Which are the most popular in terms of :
Bed nights: 1 2 3 4 5 6
Revenue generated : 1 2 3 4 5 6
Page 365

4.2 On a scale of one to ten, how important is it that inclusive packages contain the following:
( 10=essential, 1=ofno importance)
(a) Evening meals included (b) Transport from home (c) Leisure centre in hotel (d) Organised activities (e) Child discounts (t) " A Theme "
10 9 8 7 6 54 3 2 1 10 9 8 7 6 54 3 2 1 10 9 8 7 6 54 3 2 1 10 9 8 7 6 54 3 2 1 10 9 8 7 6 54 3 2 1 10 9 8 7 6 54 3 2 1
Would you like to add any additional comments :
........................................
........................................
........................................
Page366

5. MARKETING COMMERCIAL SHORT BREAK HOLIDAYS.
I am now going to look at how the various short break packages are marketed :
5.1 Do you use your own specialist company brochure: YES I NO
IF YES : Taking each brochure in turn, can you provide me with some detailed information on its production and distribution.
:What is it called ... When is it released :How many are produced ... how are they distributed
METHOD OF DISTRIBUTION
NAME RELEASE No HO TA ETB/W STB OTHER PRODUCED TB
5.2 Is there a selection criteria for hotels to be included in your brochure.
YES/NO
IF YES What is it : ..............................
.............................
We shall now examine some basic financial factors with regard to the brochure and its production.
5.3 Do hotels have to pay a fee to be included in your brochure.
YES/NO
IF YES : How much is the fee : £ ............ per issue
Page 367

5.4 Do hotels pay you commission. YES/NO
IF YES : What 0/o commission do you receive : ......... 0/o
5.5 Do you use a travel agent. YES I NO
What commission do you pay to them 0/o ...... .
5.6 Do you pay commission to anybody else. YES I NO
IF YES Who to ............... . 0/ • • /o ••••• commiSSIOn
................ 0/ • • /o ••••• COmmiSSIOn 0/ • • /O ••••• COmmiSSIOn ................
5. 7 Could you please provide an indication of :
The brochure production budget:::£ ..... .
The promotional budget:::£ ..... .
Is the brochure production budget included in the promotional budget. YES/NO
6. I now wish to determine who you perceive as your major competitors in the categories of HOTELS or INTERMEDIARIES.
HOTELS INTERMEDIARIES
Page 368

7. ENVIRONMENTAL CHANGES AND THEIR EFFECT.
7.1 From your experience how do you feel companies will need to develop in the C.S.H.B. market, in relation to the following environmental factors.
ECONOMIC FACTORS SOCIAL FACTORS
e.g Recession I single market. e.g Ageing population.
TECHNOLOGICAL FACTORS LEGAL FACTORS
e.g Transport I communication I CRS's e.g Package travel directive
OTHER COMMENTS
Page 369

7.2 Do you feel the total holiday market has :
GROWN or DECLINED or REMAINED STATIC
7.3 Do you feel the market for short breaks has :
GROWN or DECLINED or REMAINED STATIC
7.4 How long do you feel this trend for short breaks will last.
SIX MONTHS ONE YEAR TWO YEARS FIVE YEARS
MORE THAN FIVE YEARS
7.5 Have other markets suffered/flourished as a result of the trends in the short break market.
YES NO HOW : ..................... .
..........•.................
............................
............................
THANK YOU FOR YOUR TIME AND ATTENTION
Page370
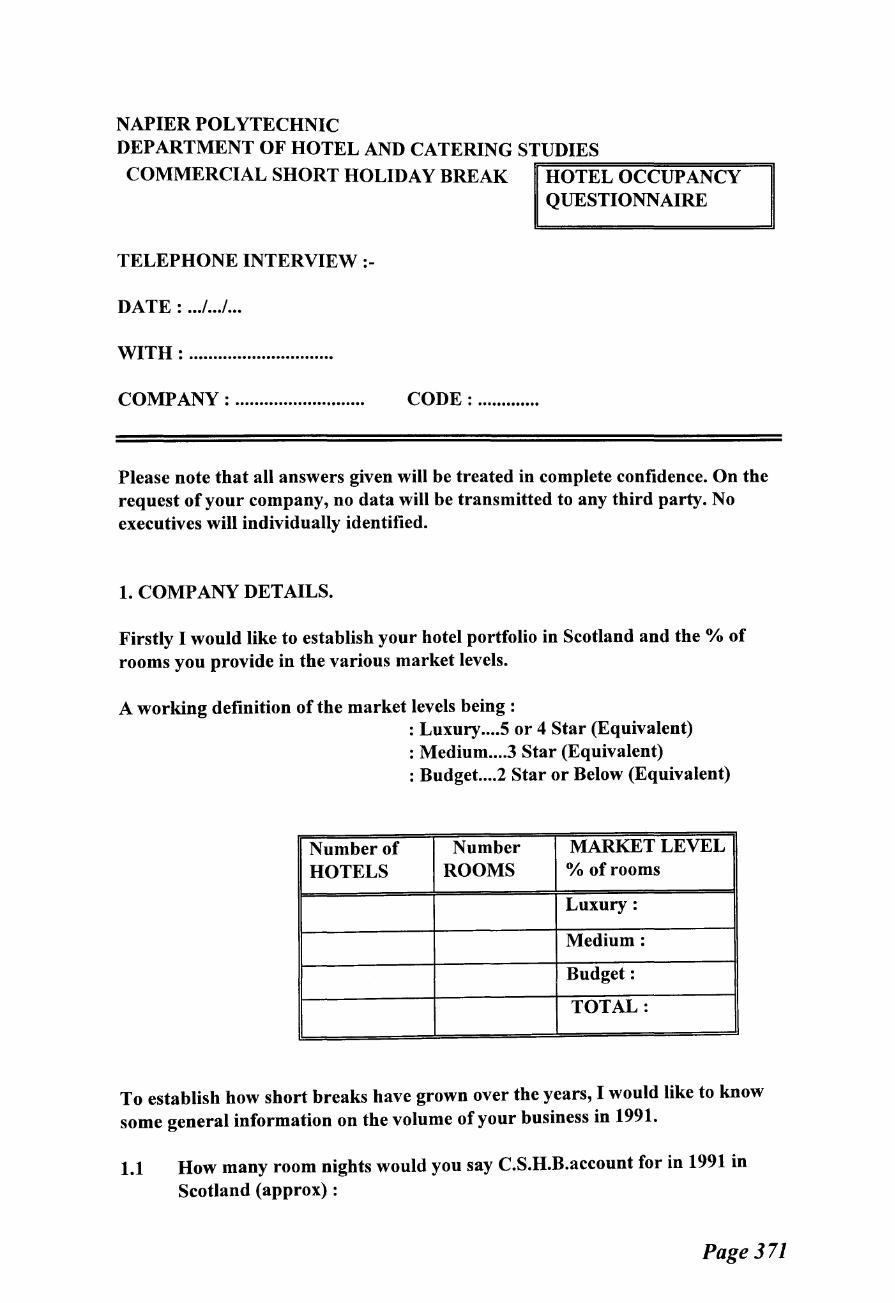
NAPIER POLYTECHNIC DEPARTMENT OF HOTEL AND CATERING STUDIES
COMMERCIAL SHORT HOLIDAY BREAK rr=H:::::::::::::::O=T=E=L=o=c=c=u=P=A=N=C=Y===;J
QUESTIONNAIRE
TELEPHONE INTERVIEW :-
DATE : .. ./ .. ./ ...
WITH : ............................. .
COMPANY : .......................... . CODE : ............ .
Please note that all answers given will be treated in complete confidence. On the request of your company, no data will be transmitted to any third party. No executives will individually identified.
1. COMPANY DETAILS.
Firstly I would like to establish your hotel portfolio in Scotland and the 0/o of rooms you provide in the various market levels.
A working definition of the market levels being : : Luxury .... 5 or 4 Star (Equivalent) : Medium .... 3 Star (Equivalent) : Budget .... 2 Star or Below (Equivalent)
Number of Number MARKET LEVEL HOTELS ROOMS 0/o of rooms
Luxury:
Medium:
Budget:
TOTAL:
To establish how short breaks have grown over the years, I would like to know some general information on the volume of your business in 1991.
1.1 How many room nights would you say C.S.H.B.account for in 1991 in Scotland (approx) :
Page 371
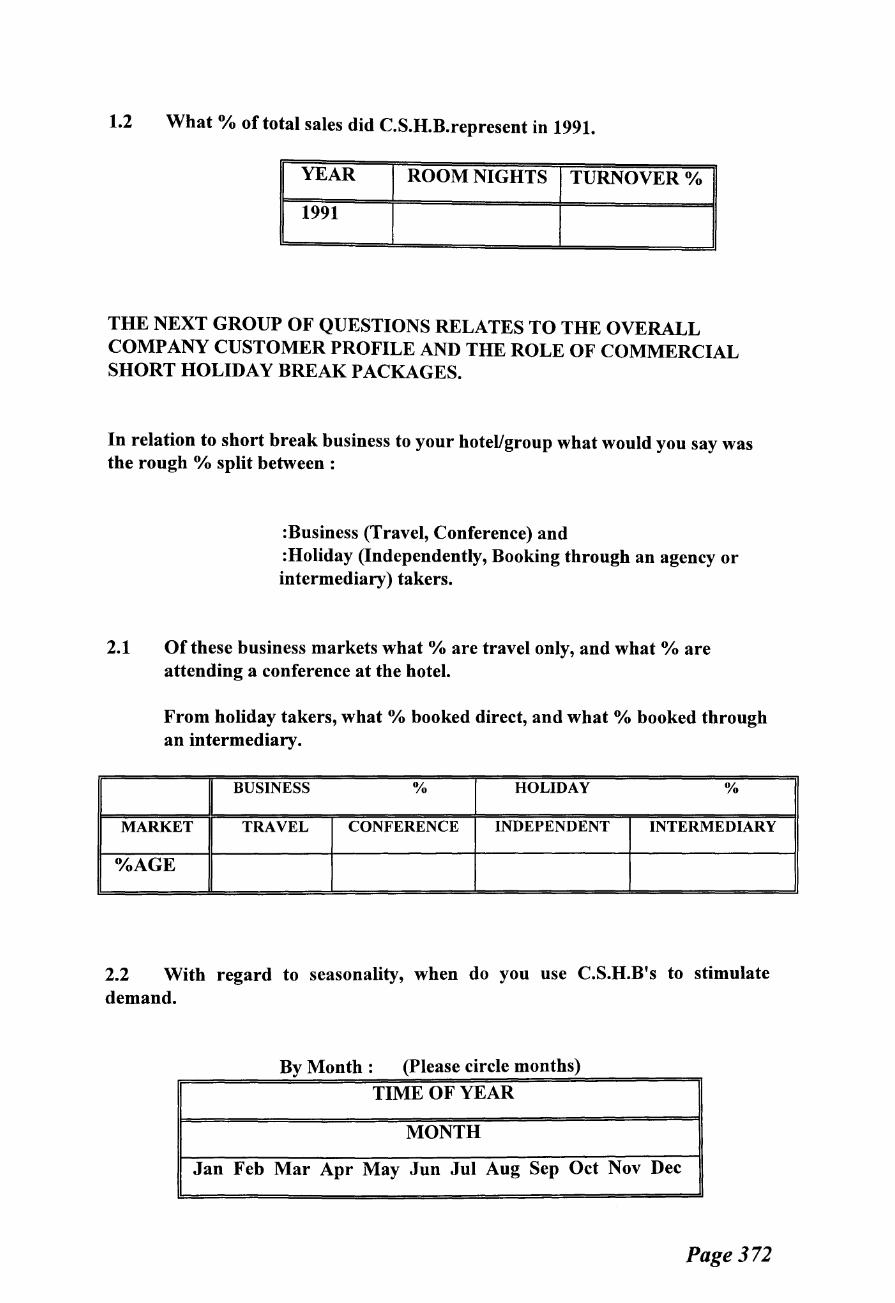
1.2 What 0/o of total sales did C.S.H.B.represent in 1991.
YEAR ROOM NIGHTS TURNOVER o/o
1991
THE NEXT GROUP OF QUESTIONS RELATES TO THE OVERALL COMPANY CUSTOMER PROFILE AND THE ROLE OF COMMERCIAL SHORT HOLIDAY BREAK PACKAGES.
In relation to short break business to your hotel/group what would you say was the rough 0/o split between :
:Business (Travel, Conference) and :Holiday (Independently, Booking through an agency or intermediary) takers.
2.1 Of these business markets what o/o are travel only, and what 0/o are attending a conference at the hotel.
From holiday takers, what 0/o booked direct, and what 0/o booked through an intermediary.
BUSINESS o;o HOLIDAY %
MARKET TRAVEL CONFERENCE INDEPENDENT INTERMEDIARY
0/oAGE
2.2 With regard to seasonality, when do you use C.S.H.B's to stimulate demand.
By Month: (Please circle months)
TIME OF YEAR
MONTH
Jan Feb Mar Apr May Jun Jul Aug Sep Oct Nov Dec
Page372

2.3 Being more specific, if one week is 100°/o short break trade, what o/o of short break nights does each night of the week account for.
Firstly during main season.
Please state what months are included in your main season.
JFMAMJJASOND
Now during other times.
FACTOR Sun Mon Tue Wed Thr Fri Sat
MAIN SEASON 0/o OTHER TIMES Ofo
3.1 It has been suggested by various sources that packages are an integral part of the short break concept, does your company offer short break packages.
YES/NO IF YES:
What packages do you offer.
TYPE OF PACKAGE
1. •••...••••.••......•...•....•••.•••
2. . ................................. .
3. . ................................. .
4. . ................................. .
5. . ................................. .
6. . ................................. .
Page 373

3.2 Which are the most popular in terms of :
Bed nights : 1 2 3 4 5 6
Revenue generated : 1 2 3 4 5 6
3.3 On a scale of one to ten, how important is it that inclusive packages contain the following :
(a) (b) (c) (d) (e) (t)
(10=essential, 1 =of no importance)
Evening meal included Transport from home Leisure centre in hotel Organised activities Child discounts "A Theme"
10 9 8 7 6 5 4 3 2 1 10 9 8 7 6 5 4 3 2 1 10 9 8 7 6 5 4 3 2 1 10 9 8 7 6 5 4 3 2 1 10 9 8 7 6 5 4 3 2 1 10 9 8 7 6 5 4 3 2 1
Would you like to add any general comments at this stage .
.......................................................
..........................................•............
.......................................................
.........•.............................................
Page 374
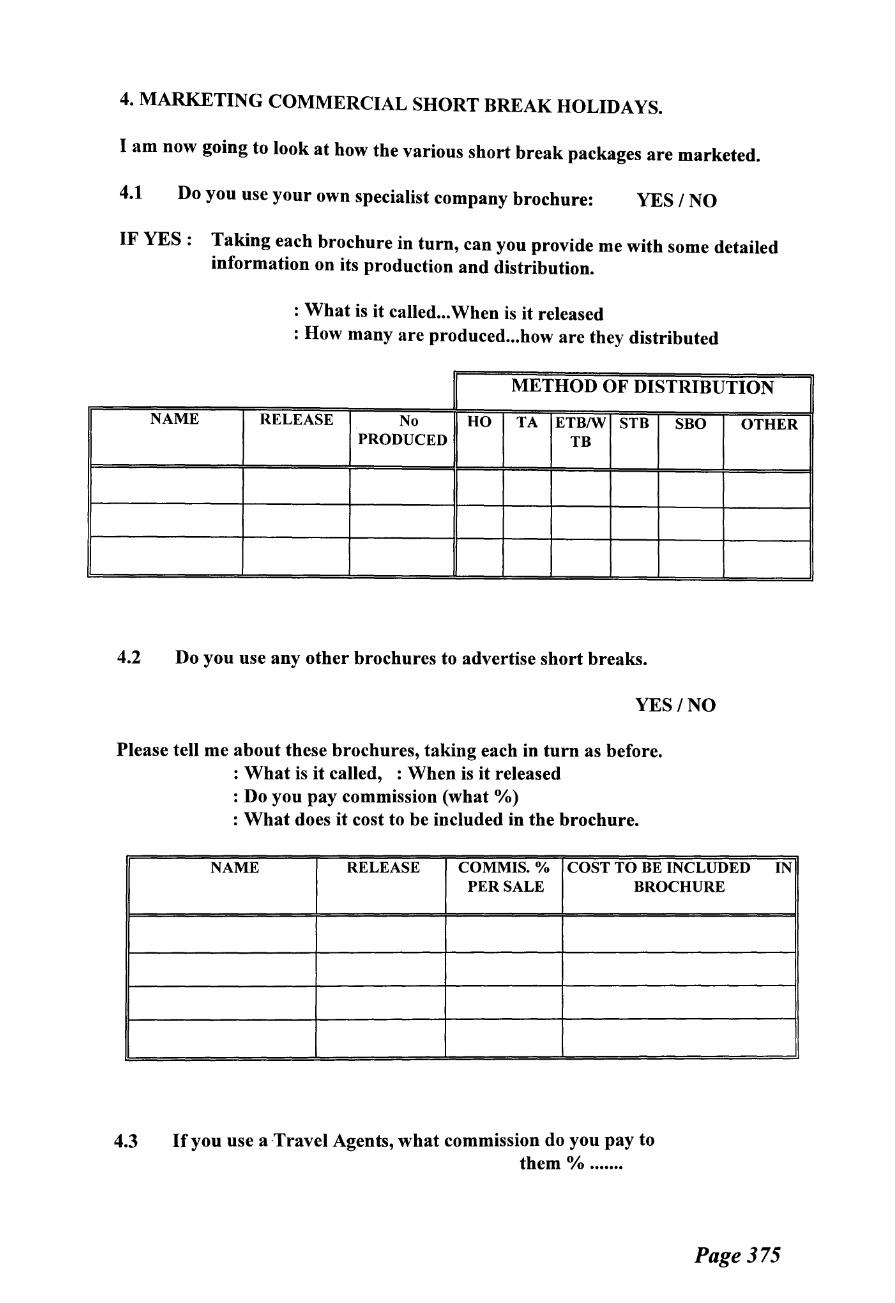
4. MARKETING COMMERCIAL SHORT BREAK HOLIDAYS.
I am now going to look at how the various short break packages are marketed.
4.1 Do you use your own specialist company brochure: YES/NO
IF YES : Taking each brochure in turn, can you provide me with some detailed information on its production and distribution.
:What is it called ... When is it released : How many are produced ... how are they distributed
METHOD OF DISTRIBUTION
NAME RELEASE No HO TA ETB/W STB SBO OTHER PRODUCED TB
4.2 Do you use any other brochures to advertise short breaks.
YES/NO
Please tell me about these brochures, taking each in turn as before. : What is it called, : When is it released : Do you pay commission (what 0/o) : What does it cost to be included in the brochure.
NAME RELEASE COMMIS.% COST TO BE INCLUDED PER SALE BROCHURE
4.3 If you use a Travel Agents, what commission do you pay to them 0/o ...... .
IN
Page 375

4.4 Do you pay commission to anybody else. YES NO
IF YES Who to ............... . 0/ • • /o ••••• COmmiSSIOn
················ 0/ • • /o ••••• COmmiSSIOn 0/ • • /o ••••• commiSSIOn ................
4.5 Could you please provide an indication of :
The brochure production budget:::£ ..... .
The promotional budget:::£ ..... .
Is the brochure production budget included in the promotional budget.
YES NO
5. In this section I wish to establish which of the following Distribution Channels you use, and which are the most important in terms of customer exposure.
a) Individual Hotel Activity, eg Local press, RANKING hotel brochure, or leaflets.
YES NO
b) Hotel Group Brochure YES NO
c) Consortia Brochure YES NO
d) Short Break Operators YES NO
e) Destination Marketing, eg Edinburgh Marketing.
YES NO
Could you now rank these in order of importance, if any are of equal importance please state this.
Page376
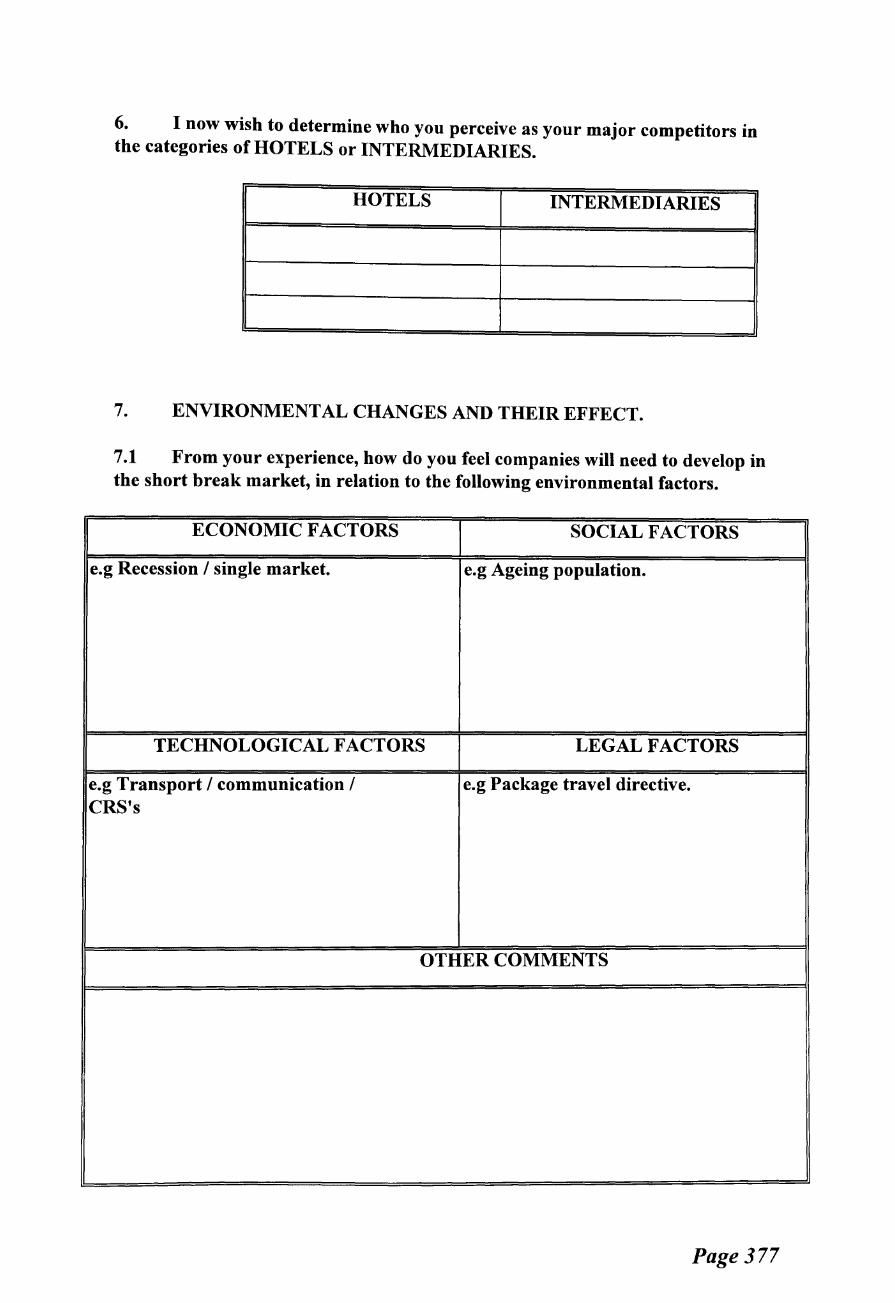
6. I now wish to determine who you perceive as your major competitors in the categories of HOTELS or INTERMEDIARIES.
HOTELS INTERMEDIARIES
7. ENVIRONMENTAL CHANGES AND THEIR EFFECT.
7.1 From your experience, how do you feel companies will need to develop in the short break market, in relation to the following environmental factors.
ECONOMIC FACTORS
e.g Recession I single market.
TECHNOLOGICAL FACTORS
e.g Transport I communication I CRS's
SOCIAL FACTORS
e.g Ageing population.
LEGAL FACTORS
e.g Package travel directive.
OTHER COMMENTS
Page 377

7.2 Do you feel the total holiday market has :
GROWN or DECLINED or REMAINED STATIC
7.3 Do you feel the market for short breaks has :
GROWN or DECLINED or REMAINED STATIC
7.4 How long do you feel this trend for short breaks will last.
SIX MONTHS ONE YEAR TWO YEARS FIVE YEARS
MORE THAN FIVE YEARS
7.5 Have other markets suffered/flourished as a result of the trends in the short break market.
YES NO HOW : ..................... .
............................
............................
............................
THANK YOU FOR YOUR TIME AND ATTENTION
Page 378
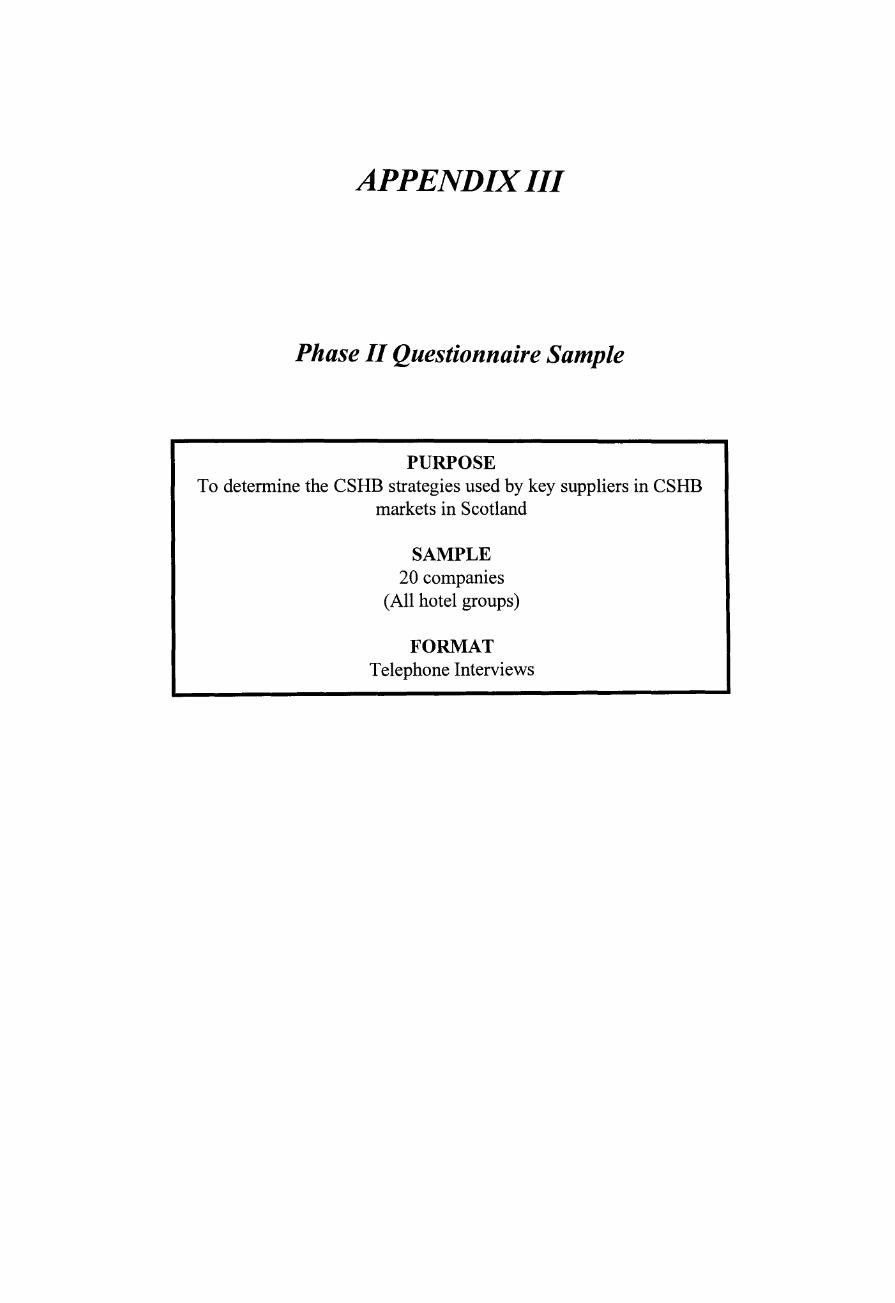
APPENDIX III
Phase II Questionnaire Sample
PURPOSE To determine the CSHB strategies used by key suppliers in CSHB
markets in Scotland
SAMPLE 20 companies
(All hotel groups)
FORMAT Telephone Interviews
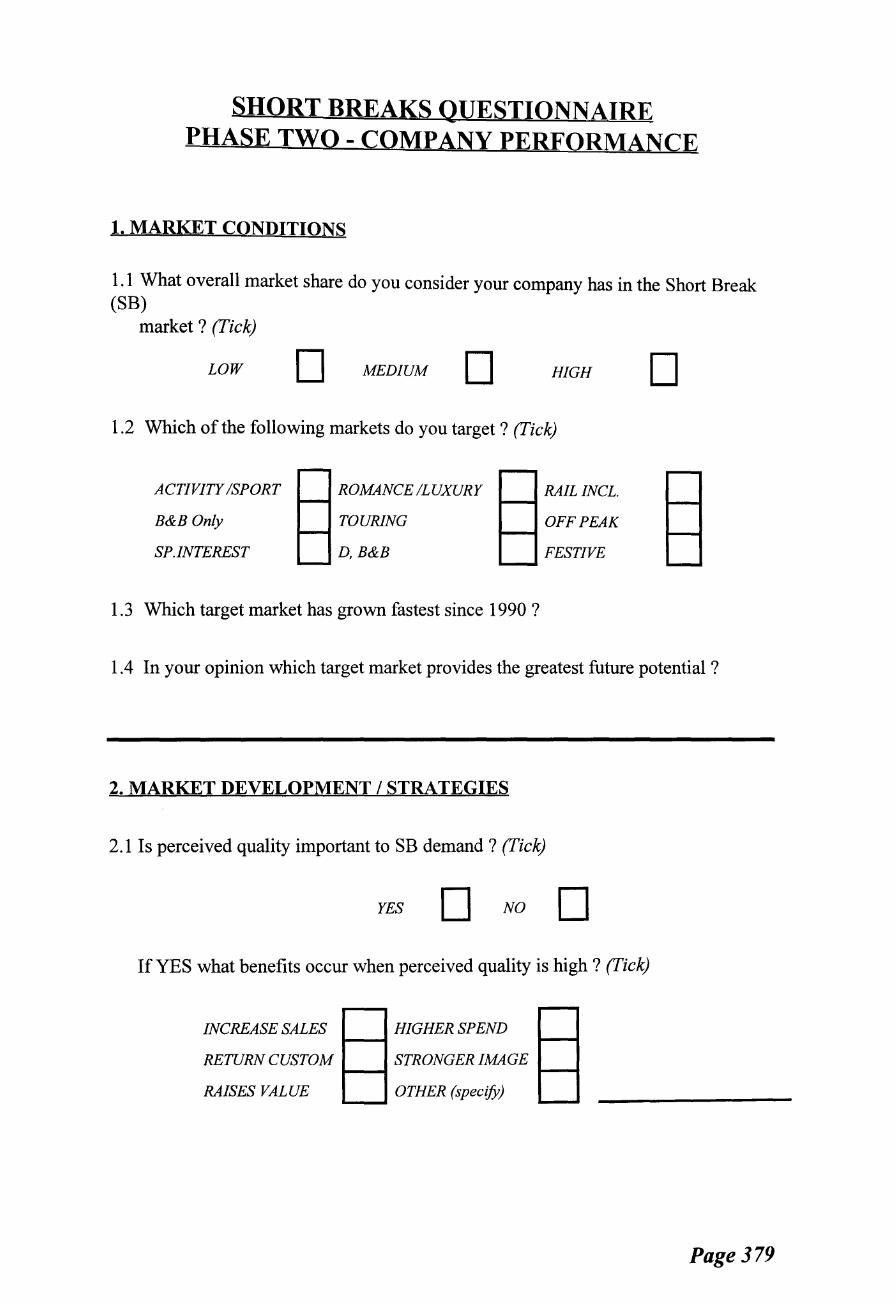
SHORT BREAKS QUESTIONNAIRE PHASE TWO- COMPANY PERFORMANCE
1. MARKET CONDITIONS
1.1 What overall market share do you consider your company has in the Short Break (SB)
market ? (Tick)
LOW D MEDIUM D HIGH
1.2 Which of the following markets do you target ? (Tick)
ACTIVITY /SPORT
B&B Only
SP.INTEREST
ROMANCE /LUXURY
TOURING
D,B&B
1.3 Which target market has grown fastest since 1990 ?
RAIL INCL.
OFF PEAK
FESTIVE
D
1.4 In your opinion which target market provides the greatest future potential ?
2. MARKET DEVELOPMENT I STRATEGIES
2.1 Is perceived quality important to SB demand ? (Tick)
YES D NO D If YES what benefits occur when perceived quality is high ? (Tick)
INCREASE SALES HIGHER SPEND 1--1
RETURN CUSTOM STRONGER IMAGE ~--~ 1----t
RAISES VALUE OTHER (specify)
Page379
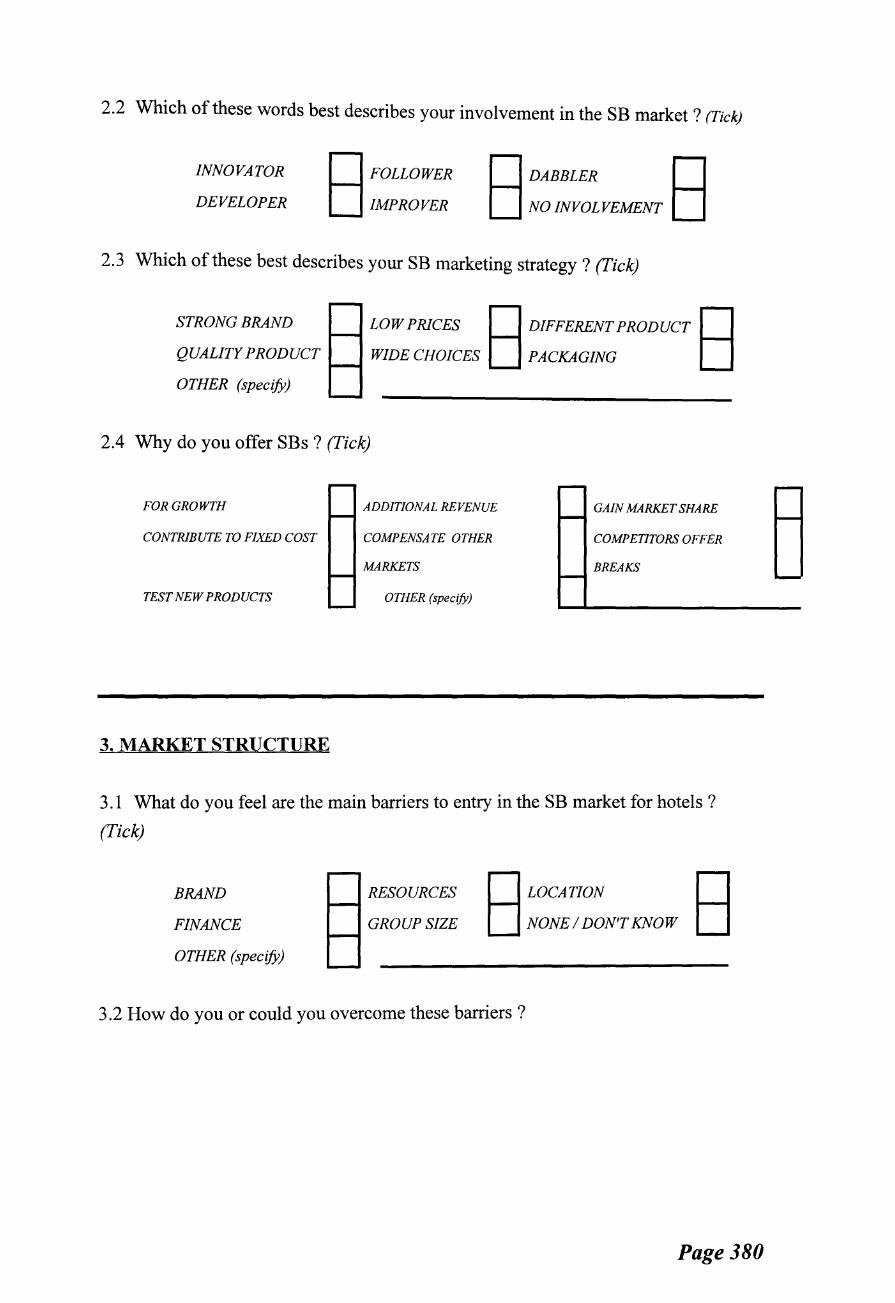
2.2 Which of these words best describes your involvement in the SB market ? (Tick)
INNOVATOR
DEVELOPER
D FOLLOWER
D IMPROVER
DDABBLER D D NOINVOLVEMENT D
2.3 Which of these best describes your SB marketing strategy? (I'ick)
STRONG BRAND
QUALITY PRODUCT
OTHER (specify)
LOW PRICES D DIFFERENT PRODUCT D WIDECHOICES D PACKAGING D
2.4 Why do you offer SBs ? (I'ick)
FOR GROWTH ADDITIONAL REVENUE GAIN MARKET SHARE
CONTRIBUTE TO FIXED COST COMPENSATE OTHER COMPETITORS OFFER
MARKETS BREAKS
TEST NEW PRODUCTS OTHER (specify)
3. MARKET STRUCTURE
3.1 What do you feel are the main barriers to entry in the SB market for hotels ?
(I'ick)
BRAND
FINANCE
OTHER (specify)
RESOURCES
GROUP SIZE
DLOCATION D DNONE/DON'TKNOW D
3.2 How do you or could you overcome these barriers ?
Page380
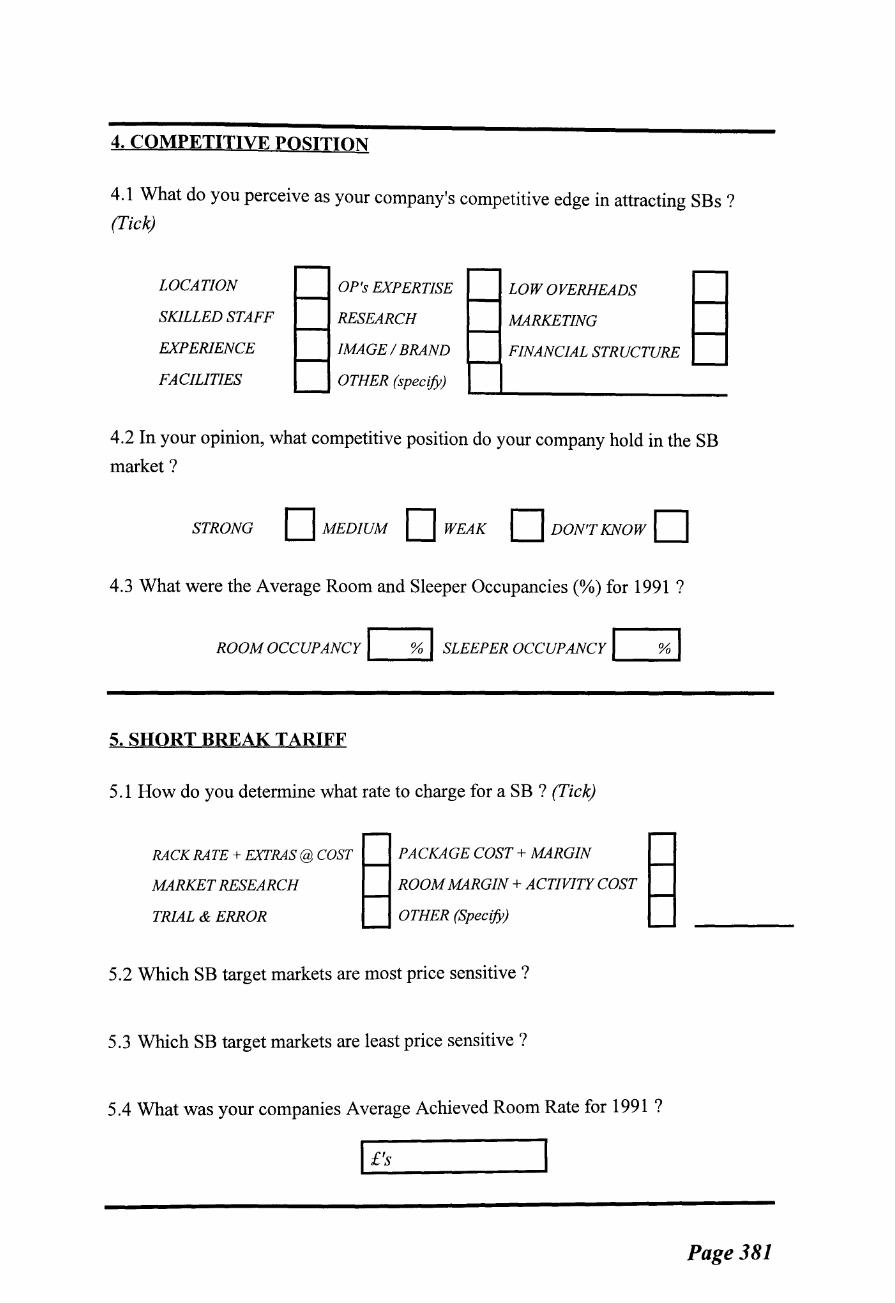
4. COMPETITIVE POSITION
4.1 What do you perceive as your company's competitive edge in attracting SBs ? (Tick)
LOCATION
SKILLED STAFF
EXPERIENCE
FACILITIES
OP's EXPERTISE
RESEARCH
IMAGE I BRAND
OTHER (specify)
LOW OVERHEADS
MARKETING
FINANCIAL STRUCTURE
4.2 In your opinion, what competitive position do your company hold in the SB
market?
STRONG D MEDIUM D WEAK D DON'T KNOW D 4.3 What were the Average Room and Sleeper Occupancies(%) for 1991?
ROOMOCCUPANCY~ SLEEPERoccuPANcrf %I
5. SHORT BREAK TARIFF
5 .1 How do you determine what rate to charge for a SB ? (Tick)
RACK RATE+ EXTRAS@ COST
MARKET RESEARCH
TRIAL & ERROR
PACKAGE COST+ MARGIN
ROOM MARGIN+ ACTIVITY COST
OTHER (Specify)
5.2 Which SB target markets are most price sensitive?
5.3 Which SB target markets are least price sensitive ?
5.4 What was your companies Average Achieved Room Rate for 1991 ?
Page 381
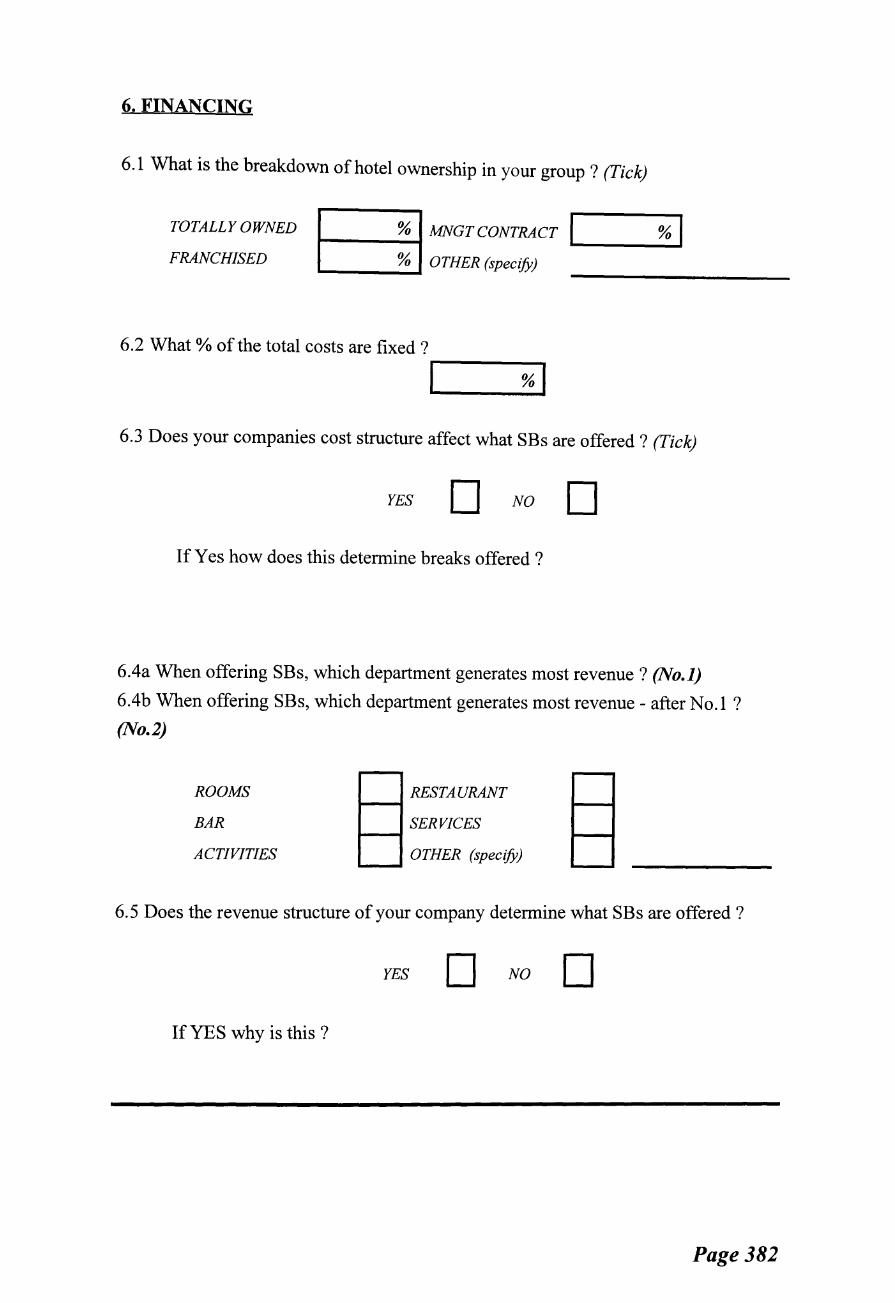
6. FINANCING
6.1 What is the breakdown of hotel ownership in your group ? (Tick)
TOTALLY OWNED
FRANCHISED
% MNGT CONTRACT 1------1
...._ ___ % ..... OTHER (specify)
6.2 What% of the total costs are fixed?
6.3 Does your companies cost structure affect what SBs are offered ? (Tick)
YES D NO D If Yes how does this determine breaks offered ?
6.4a When offering SBs, which department generates most revenue? (No.1)
6.4b When offering SBs, which department generates most revenue - after No.1 ?
(No.2)
ROOMS
BAR
ACTIVITIES
RESTAURANT 1----1
SERVICES 1----1
....___. OTHER (specify)
6. 5 Does the revenue structure of your company determine what SBs are offered ?
YES D NO D If YES why is this ?
Page382
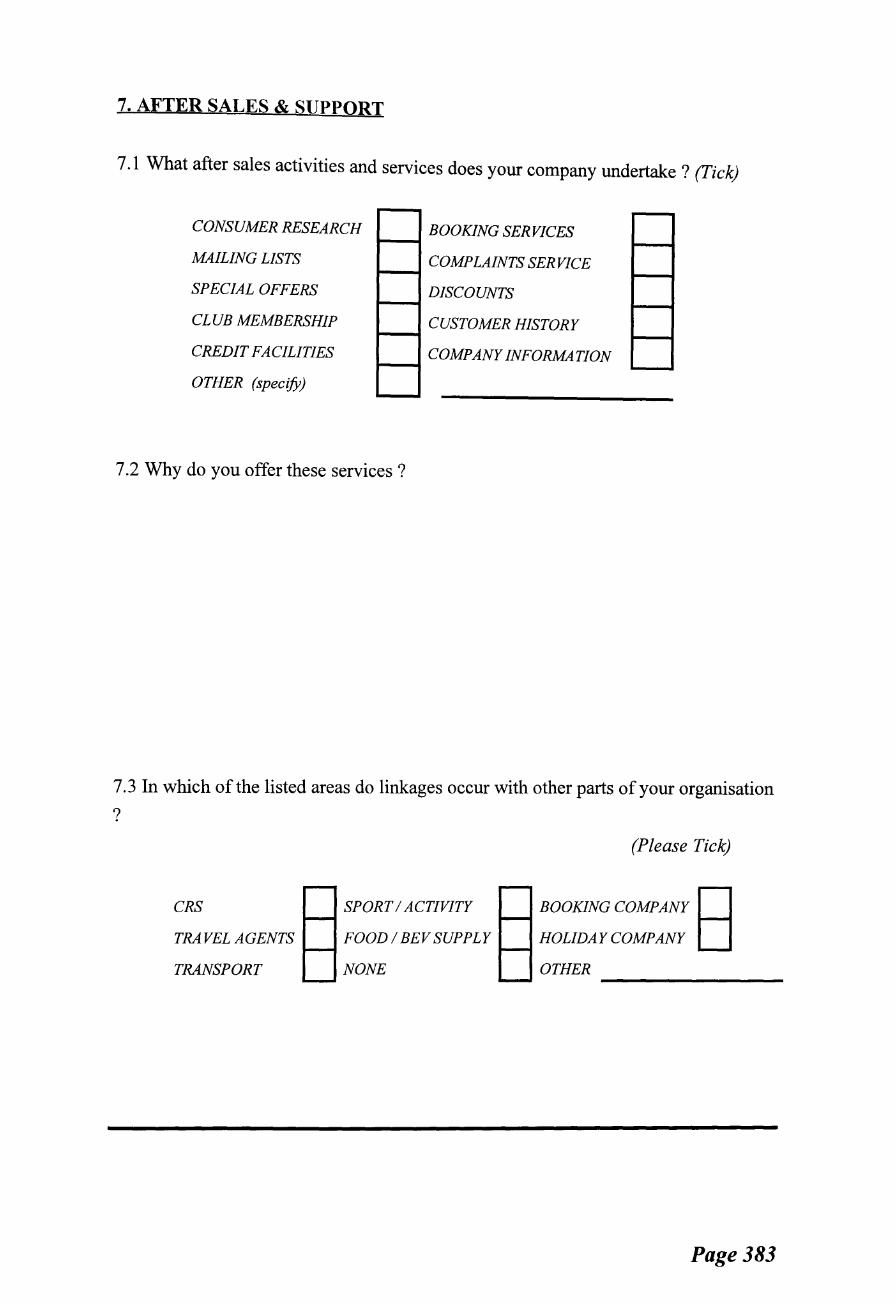
7. AFTER SALES & SUPPORT
7.1 What after sales activities and services does your company undertake ? (Tick)
BOOKING SERVICES 1-----1
COMPLAINTS SERVICE 1---1
DISCOUNTS 1---1
CUSTOMER HISTORY 1---1
CONSUMER RESEARCH
MAILING LISTS
SPECIAL OFFERS
CLUB MEMBERSHIP
CREDIT FACILITIES
OTHER (specify)
COMPANY INFORMATION
7.2 Why do you offer these services ?
7.3 In which of the listed areas do linkages occur with other parts of your organisation
?
CRS
TRAVEL AGENTS
TRANSPORT
SPORT I ACTIVITY
FOOD/ BEVSUPPLY
NONE
(Please Tick)
BOOKJNGCOMPANY D HOLIDAYCOMPANY D OTHER ----------------
Page 383

S.FUTURE
8.1 How do you think your group will have to respond to attract the SB market over the next five years? (Please Tick)
LARGER HOTELS
LOWER COST
BETTER AMENITIES
BETTER LOCATIONS
8.2 Any further comments?
MORE VARIETY
MORE FLEXIBILITY
MORE LUXURIOUS
OTHER (specify)
THANK YOU FOR YOUR TIME AND ATTENTION
Please return this form in the envelope provided to :
David A Edgar, PhD Research Student, Department of Tourism & Hospitality,
Napier University, 10 Colinton Road, Edinburgh, EH10 5DT, (Tel: 031 455
2555)
Page 384
APPENDIX IV
Phase III Questionnaire Sample
PURPOSE To provide data to allow a unit (market) perspective to CSHB
markets in Scotland and the UK
SAMPLE 39 companies
( 6 hotel groups)
FORMAT Face to Face Interviews
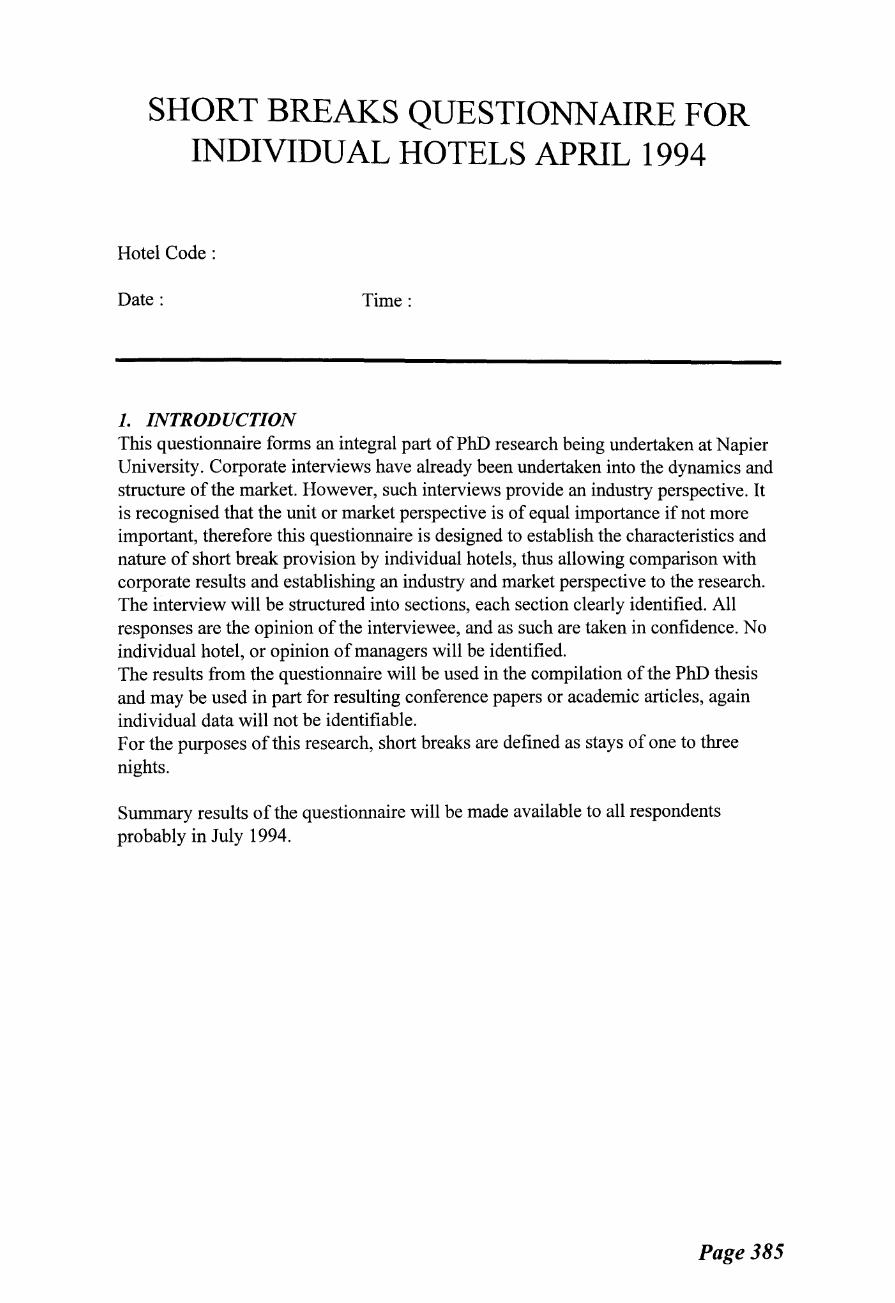
SHORT BREAKS QUESTIONNAIRE FOR INDIVIDUAL HOTELS APRIL 1994
Hotel Code:
Date: Time:
1. INTRODUCTION This questionnaire forms an integral part of PhD research being undertaken at Napier University. Corporate interviews have already been undertaken into the dynamics and structure of the market. However, such interviews provide an industry perspective. It is recognised that the unit or market perspective is of equal importance if not more important, therefore this questionnaire is designed to establish the characteristics and nature of short break provision by individual hotels, thus allowing comparison with corporate results and establishing an industry and market perspective to the research. The interview will be structured into sections, each section clearly identified. All responses are the opinion of the interviewee, and as such are taken in confidence. No individual hotel, or opinion of managers will be identified. The results from the questionnaire will be used in the compilation of the PhD thesis and may be used in part for resulting conference papers or academic articles, again individual data will not be identifiable. For the purposes of this research, short breaks are defined as stays of one to three nights.
Summary results of the questionnaire will be made available to all respondents probably in July 1994.
Page385

2. SHORT BREAK INVOLVEMENT
This section is to determine what level of involvement you have within the Short Break (SB) Market.
When do you offer SBs ?
by month:
All Year
Low Season Only
High Season Only
Other ........ .
by days of the week :
All Week Specific Days E1
JFMAMJJASOND JFMAMJJASOND
specify-
Mon Tue Wed Thu Fri Sat Sun
( Low Season 0 High Season_)
What % of your total revenue would you say s attributable to SBs ?
I
How many room nights did SBs account for in 1991/2?
I nights I
Page 386
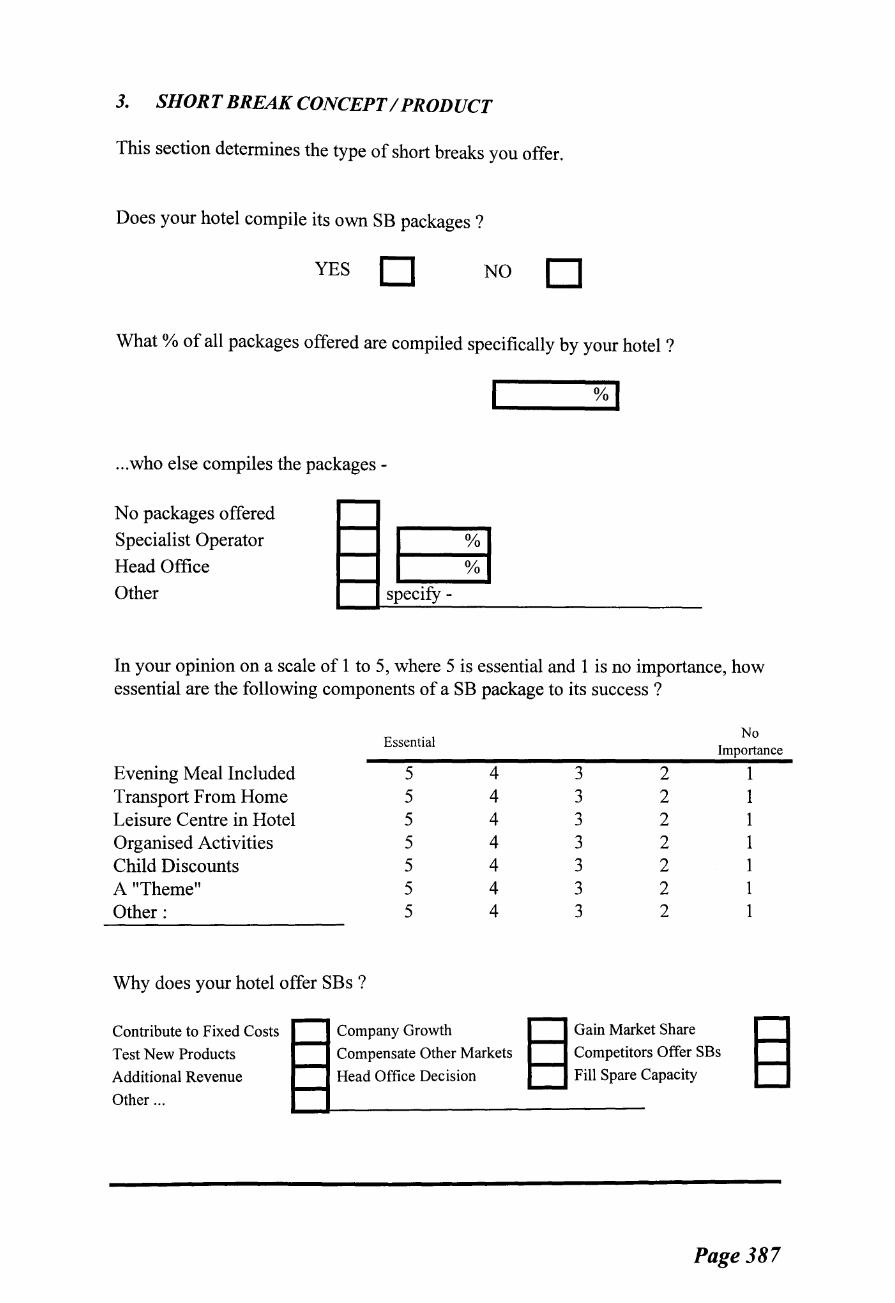
3. SHORT BREAK CONCEPT I PRODUCT
This section determines the type of short breaks you offer.
Does your hotel compile its own SB packages ?
YES D NO D What o/o of all packages offered are compiled specifically by your hotel ?
... who else compiles the packages -
No packages offered
Specialist Operator
Head Office
Other
I
a 0
specify-
In your opinion on a scale of 1 to 5, where 5 is essential and 1 is no importance, how essential are the following components of a SB package to its success ?
Essential
Evening Meal Included 5 4 Transport From Home 5 4 Leisure Centre in Hotel 5 4 Organised Activities 5 4 Child Discounts 5 4 A "Theme" 5 4 Other: 5 4
Why does your hotel offer SBs ?
Contribute to Fixed Costs
Test New Products
Additional Revenue
Other ...
Company Growth
Compensate Other Markets
Head Office Decision
No Importance
3 2 3 2 3 2 3 2 3 2 3 2 3 2
§ Gain Market Share
Competitors Offer SBs
Fill Spare Capacity
1 1 1 1 1 1 1
Page387
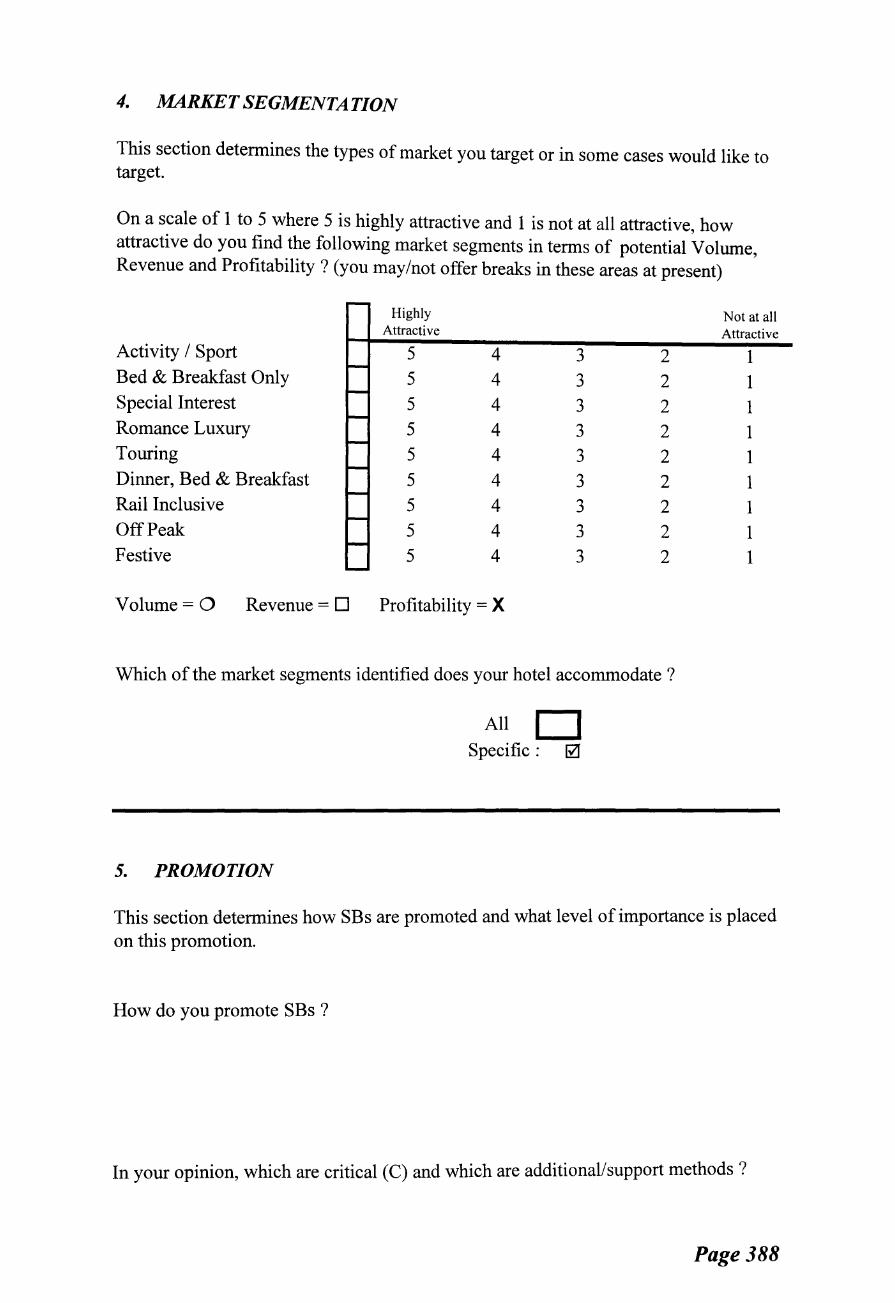
4. MARKET SEGMENTATION
This section determines the types of market you target or in some cases would like to target.
On a scale of 1 to 5 where 5 is highly attractive and 1 is not at all attractive, how attractive do you find the following market segments in terms of potential Volume, Revenue and Profitability? (you may/not offer breaks in these areas at present)
Highly Not at all Attractive Attractive
Activity I Sport 5 4 3 2 1 Bed & Breakfast Only 5 4 3 2 1 Special Interest 5 4 3 2 1 Romance Luxury 5 4 3 2 1 Touring 5 4 3 2 1 Dinner, Bed & Breakfast 5 4 3 2 1 Rail Inclusive 5 4 3 2 1 Off Peak 5 4 3 2 1 Festive 5 4 3 2 1
Volume= 0 Revenue= D Profitability = X
Which of the market segments identified does your hotel accommodate ?
All D Specific: 0
5. PROMOTION
This section determines how SBs are promoted and what level of importance is placed on this promotion.
How do you promote SBs ?
In your opinion, which are critical (C) and which are additional/support methods?
Page 388
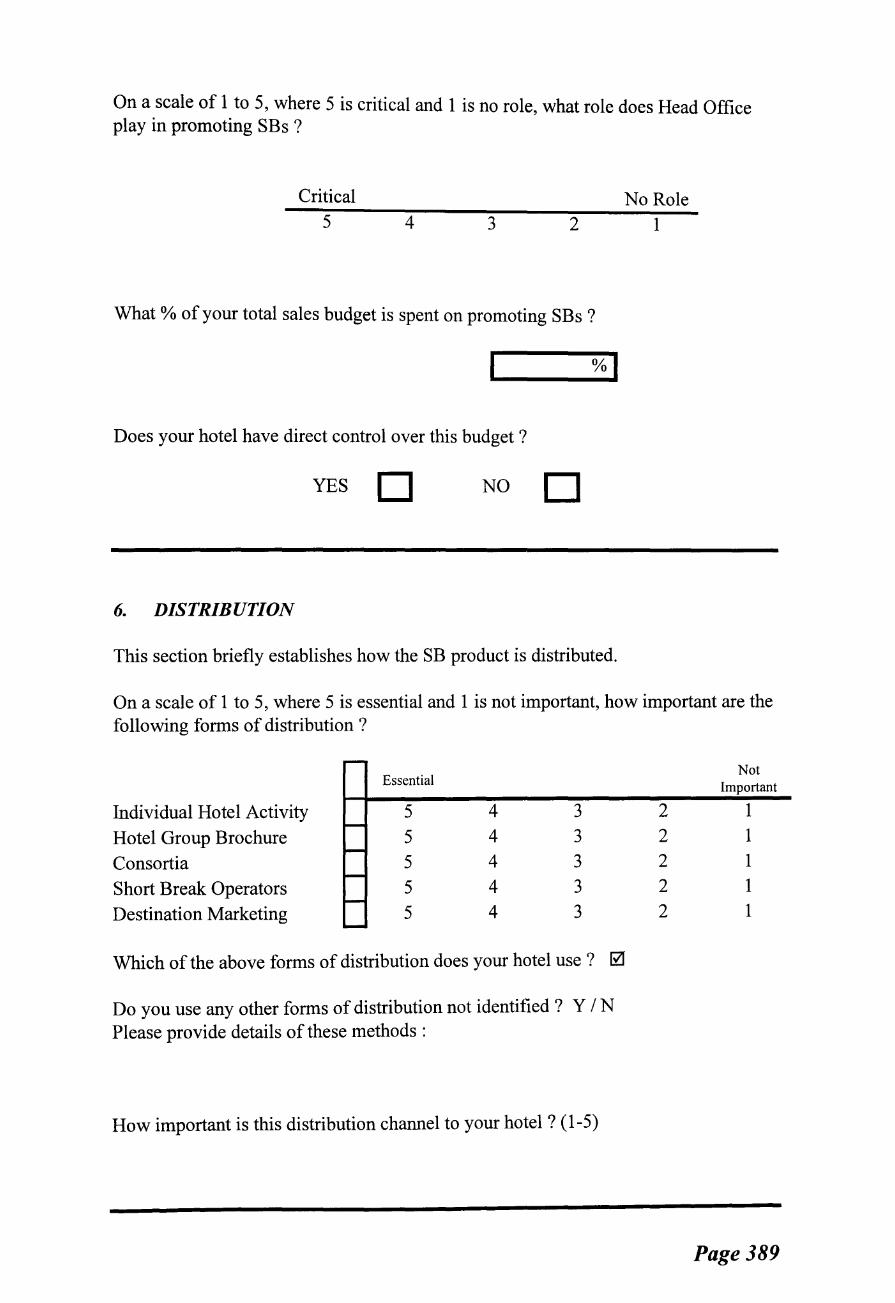
On a scale of 1 to 5, where 5 is critical and 1 is no role, what role does Head Office play in promoting SBs ?
Critical No Role 5 4 3 2 1
What % of your total sales budget is spent on promoting SBs ?
I
Does your hotel have direct control over this budget ?
YES D NO D
6. DISTRIBUTION
This section briefly establishes how the SB product is distributed.
On a scale of 1 to 5, where 5 is essential and 1 is not important, how important are the following forms of distribution ?
Essential
Individual Hotel Activity 5 4 3
Hotel Group Brochure 5 4 3
Consortia 5 4 3
Short Break Operators 5 4 3
Destination Marketing 5 4 3
Which of the above forms of distribution does your hotel use ? 0
Do you use any other forms of distribution not identified ? Y I N Please provide details of these methods :
How important is this distribution channel to your hotel ? (1-5)
Not Important
2 1 2 1 2 1 2 1 2 1
Page389
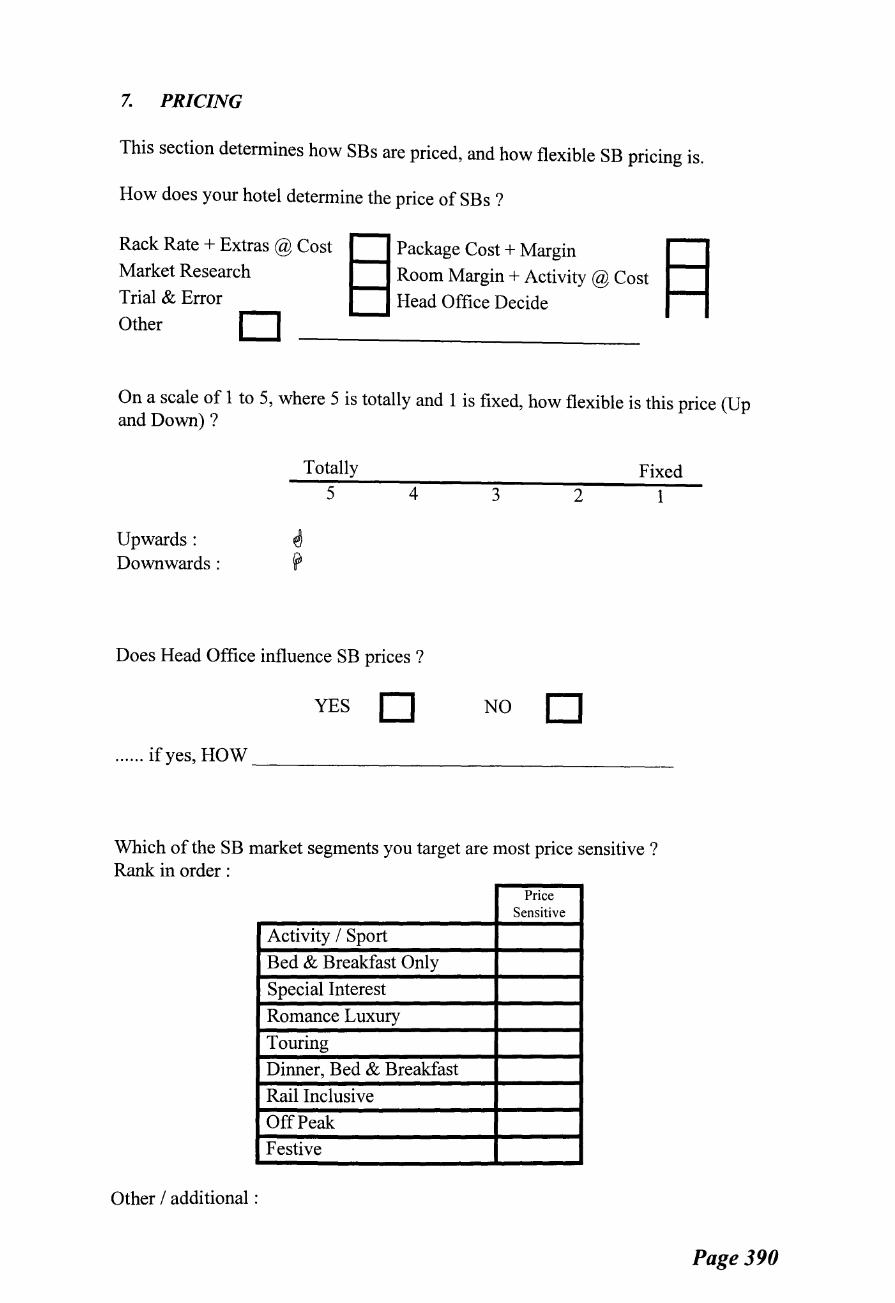
7. PRICING
This section determines how SBs are priced, and how flexible SB pricing is.
How does your hotel determine the price of SBs ?
Rack Rate + Extras @ Cost Market Research
Trial & Error
Other ~
Package Cost + Margin t-""'!1
Room Margin + Activity @ Cost .......... Head Office Decide
On a scale of 1 to 5, where 5 is totally and 1 is fixed, how flexible is this price (Up and Down)?
Totally Fixed 5 4 3 2 1
Upwards: ~ Downwards : ~
Does Head Office influence SB prices?
YES D NO D ...... if yes, HOW------------------
Which of the SB market segments you target are most price sensitive ? Rank in order :
Price Sensitive
Activity I Sport
Bed & Breakfast Only
Special Interest
Romance Luxury
Touring
Dinner, Bed & Breakfast
Rail Inclusive
Off Peak
Festive
Other I additional :
Page 390
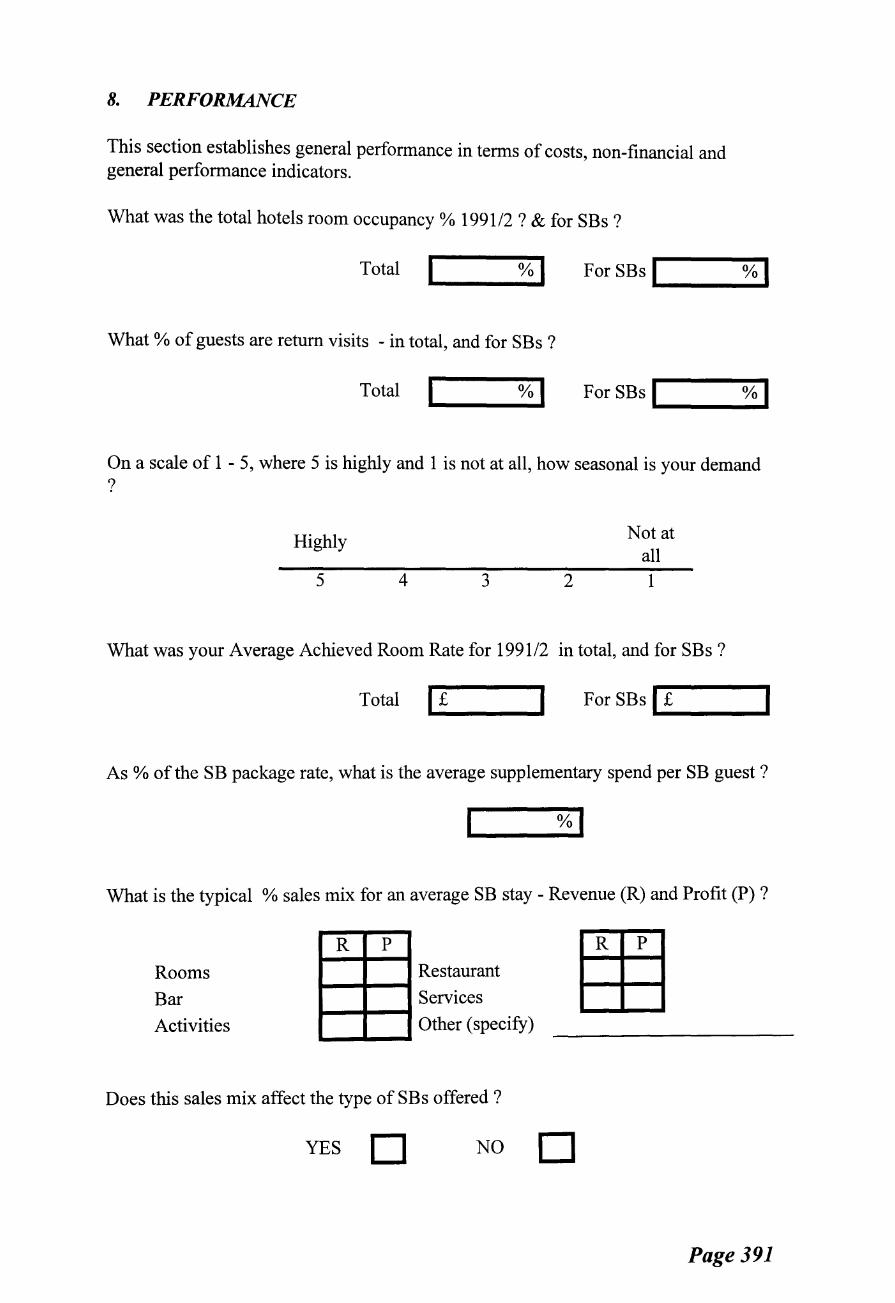
8. PERFORMANCE
This section establishes general performance in terms of costs, non-financial and general performance indicators.
What was the total hotels room occupancy% 1991/2? & for SBs?
Total .. 1 ____ %_.1 For SBs ._1 ____ %_.1
What% of guests are return visits -in total, and for SBs?
Total .. 1 ____ %_.1 For SBs ._l ____ %_.1
On a scale of 1 - 5, where 5 is highly and 1 is not at all, how seasonal is your demand ?
Highly
5 4 3 2
Not at all
1
What was your Average Achieved Room Rate for 1991/2 in total, and for SBs?
Totall .. £ ___ _.1 For SBs ._I £ ___ _.1
As% of the SB package rate, what is the average supplementary spend per SB guest?
What is the typical % sales mix for an average SB stay - Revenue (R) and Profit (P) ?
Rooms
Bar
Activities
R p
Restaurant ..... --t..,_--11
Services ~--~~------~
..................... Other (specify)
Does this sales mix affect the type of SBs offered ?
YES D NO
R p
D
Page 391
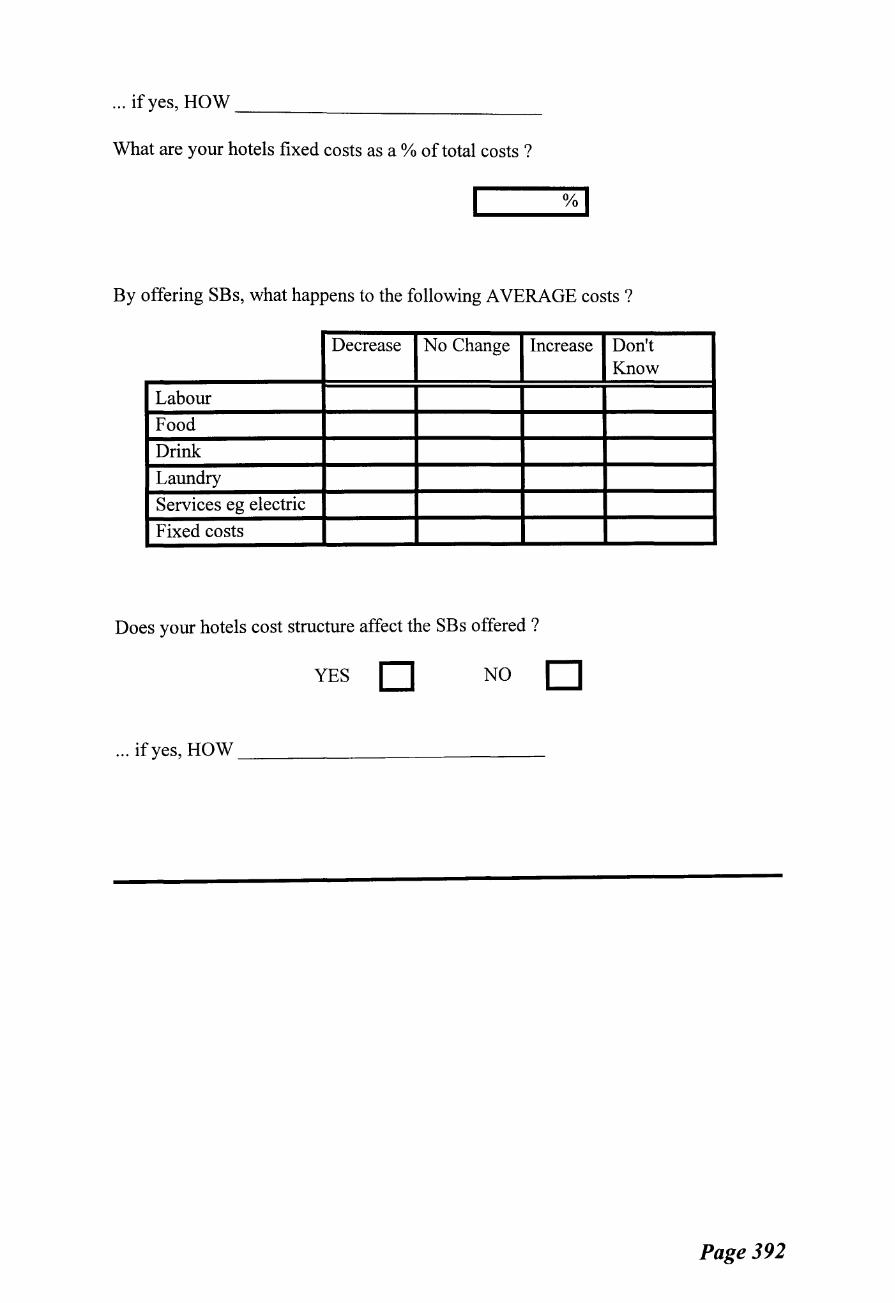
... if yes, HOW ____________ _
What are your hotels fixed costs as a % of total costs ?
By offering SBs, what happens to the following AVERAGE costs ?
Decrease No Change Increase Don't Know
Labour
Food
Drink
Laundry
Services eg electric
Fixed costs
Does your hotels cost structure affect the SBs offered ?
YES D NO D
... if yes, HOW ____________ _
Page 392
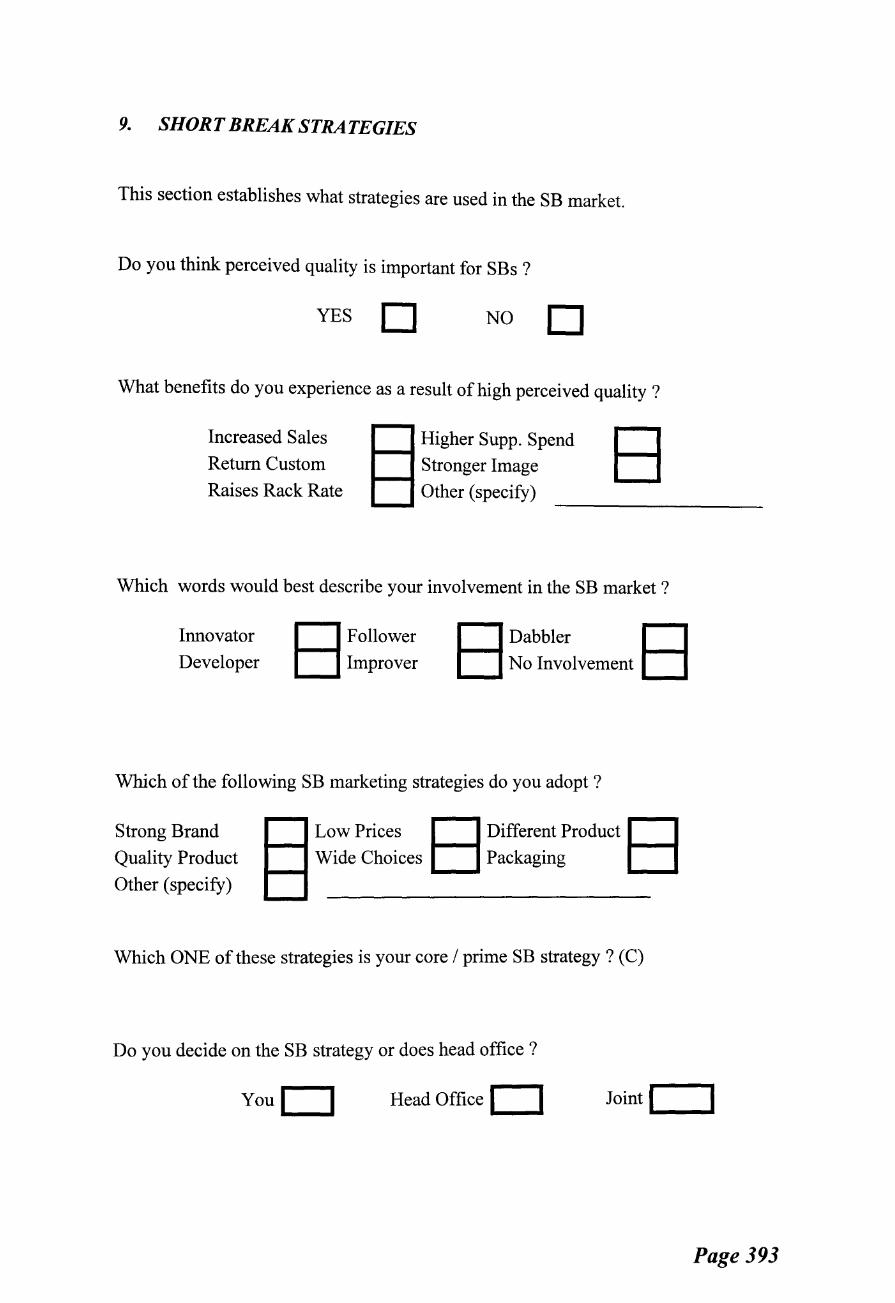
9. SHORT BREAK STRATEGIES
This section establishes what strategies are used in the SB market.
Do you think perceived quality is important for SBs ?
YES D NO D What benefits do you experience as a result of high perceived quality?
Increased Sales
Return Custom
Raises Rack Rate
Higher Supp. Spend ........... Stronger Image ........... Other (specify) ..... __.
B Which words would best describe your involvement in the SB market ?
Innovator
Developer 0Follower
0Improver 0Dabbler D D No Involvement D
Which of the following SB marketing strategies do you adopt ?
Strong Brand
Quality Product
Other (specify)
........... Low Prices B Different Product EJ Wide Choices Packaging ._ ......
Which ONE of these strategies is your core I prime SB strategy? (C)
Do you decide on the SB strategy or does head office ?
YouO Head Office D Jointl._ _..,.I
Page 393
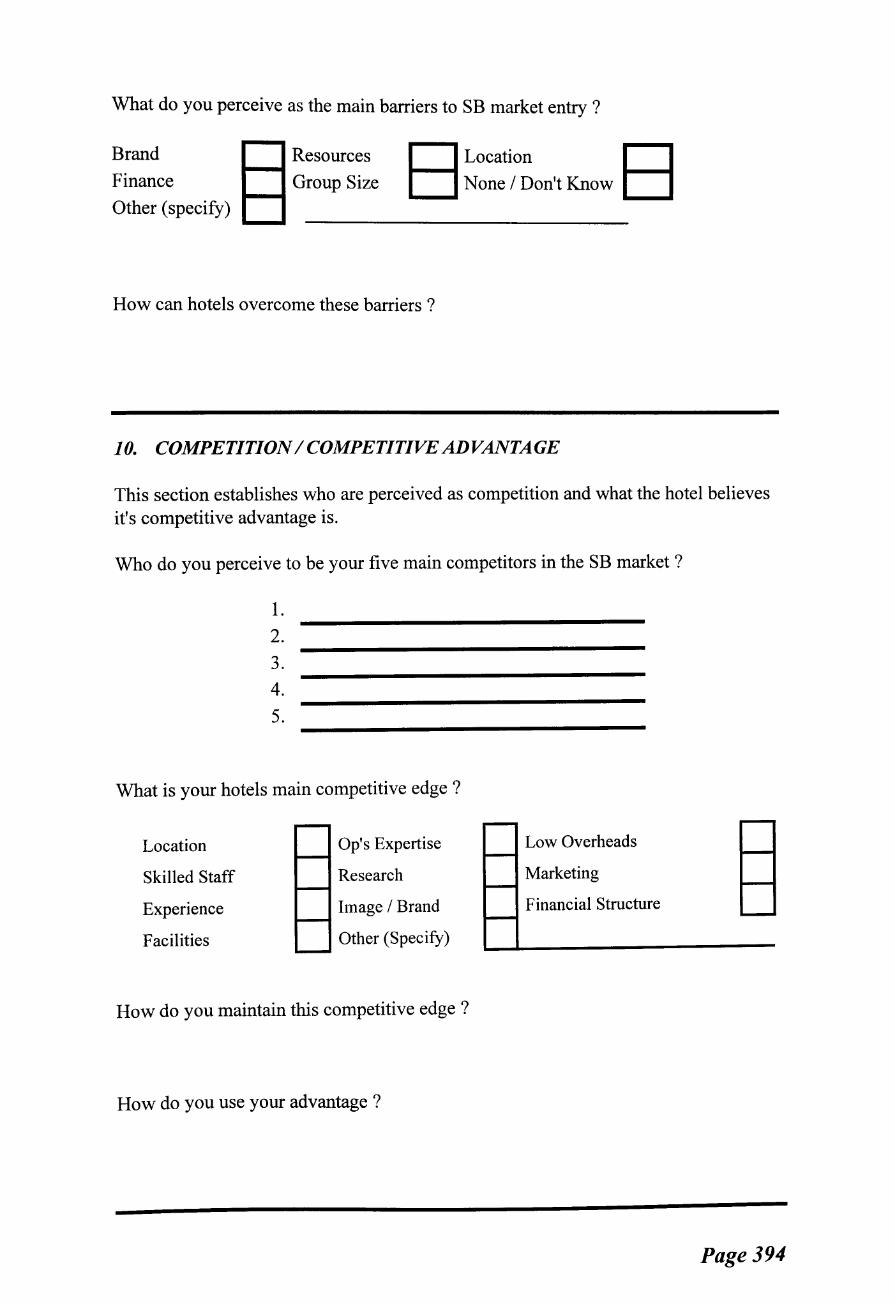
What do you perceive as the main barriers to SB market entry ?
Brand
Finance
Other (specify)
Resources ......... Group Size ......... E3 Location E3
None I Don't Know
How can hotels overcome these barriers ?
10. COMPETITION I COMPETITIVE ADVANTAGE
This section establishes who are perceived as competition and what the hotel believes it's competitive advantage is.
Who do you perceive to be your five main competitors in the SB market ?
1.
2.
3.
4.
5.
What is your hotels main competitive edge ?
Location
Skilled Staff
Experience
Facilities
Op's Expertise
Research
Image I Brand
Other (Specify)
How do you maintain this competitive edge ?
How do you use your advantage ?
Low Overheads
Marketing
Financial Structure
Page394

11. HEAD OFFICE/CORPORATE INVOLVEMENT
This section establishes the relationship between head office and the unit in terms of short break autonomy and product provision.
In general what support services are offered in relation to the SB market ?
Consumer Research
Mailing Lists
Special Offers
Club Membership
Credit Facilities
Other (specify)
Which of these are provided by :
Booking Services t----t
Complaints Service 1----t
Discounts
Customer History t----1
Company Information 1-----1
Head Office A
Joint Ventures B
An outside company C
What % of SBs are booked through Head Office ?
I
Do you suffer in any way as a result of Head Office links ?
YES D NO D If Yes HOW?
What are the main benefits of Head Office links?
Page 395

12. FUTURE MARKET
This section determine how you think the SB market will change in the future and what responses are necessary.
How do you think the SB market will change over the next five years ?
As a unit, how will you respond ?
How do you think your group will respond as a whole ?
Larger Hote Is
Lower Cost
Better Amenities
Better Locations
More Variety
More Flexibility
More Luxurious
Other (specify)
Thank you for participating in this questionnaire, summary results will be made available as soon as possible.
Page 396

APPEND/XV
Testing the performance model- A CSHB multi site unit perspective
APPENDIXV
TESTING THE MODEL
THE MULTI-SITE UNIT PERSPECTIVE: A CONSOLIDATED
REVIEW
Al. INTRODUCTION
Other researchers have identified the differing characteristics in multi product firms
(Bradley & Baron 1993 ). In hospitality operations a similar approach can be adopted
towards location. This appendix provides a multi-site perspective to the research,
providing an indication of the structure-strategy-performance relationship at the third
strategic level of functional management and over a range of location types. The
underlying theme here is based on the premise that often within group variations in
performance are greater than between group variations (Johnson & Thomas 1988). As
such, areas of potential synergy (Ansoff 1965, Hofer & Schendel 1978) and the results
of diversification strategies (Prahalad 197 6) are established through determining
similarities and differences in corporate and unit perspectives (Scott & Simpson 1989,
Banks & Wheelwright 1979, Hobbs & Heany 1977) of the CSHB market and
competitive strategies. The research model established throughout this research is
applied at unit level to test the model and to provide a unit perspective to the model
development. Each of the strategic group units, termed by Porter (1980), strategic
business units (SBUs), are examined and their performance determined. The appendix
is concluded by indicting areas of additional contribution to knowledge.
A2. MULTI-SITE Vs CORPORATE PERSPECTIVE
In this section the comparison is made between the corporate perspective of CSHB
provision and the unit perspective. The sample consist the six most active hotel
groups in the CSHB market: Forte, Milton, Mount Charlotte Thistle (MChTh),
Queens Moat Houses (QMHs), Scottish Highland Hotels (SHH), and Stakis. The hotel
samples are established in Chapter 6 and include a number of hotels operating in
England, this is to provide an addition dimension to the CSHB multi-site analysis by
widening the range of locations or consumer destinations.
To undertake the comparison between unit and corporate perspectives the general
background of unit involvement in the CSHB market is established, followed by an
analysis of the unit market structure, CSHB strategies adopted, and fmally
performance. At each of these stages of development, comment is made with regard to
corporate versus unit similarities or differences.
Page 397
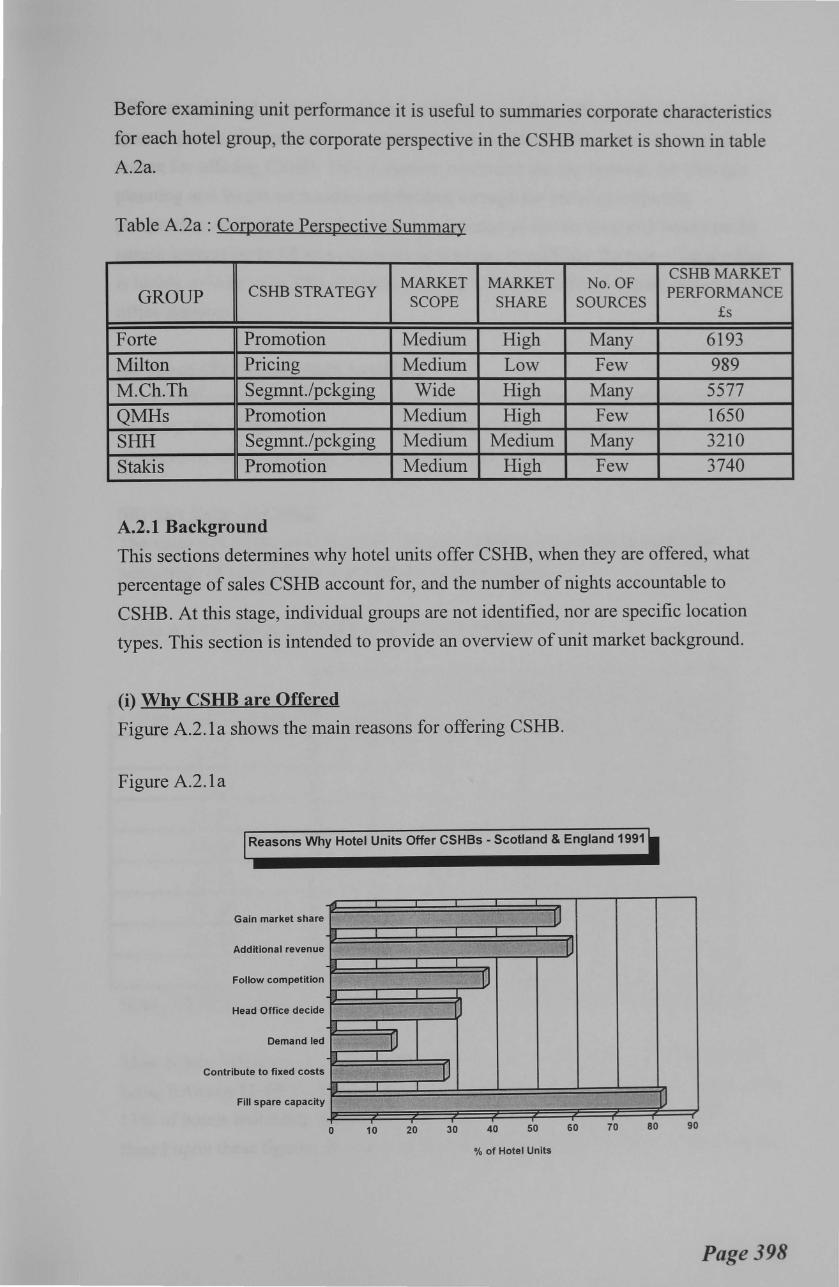
Before examining unit performance it is useful to summaries corporate characteristics
for each hotel group, the corporate perspective in the CSHB market is shown in table
A.2a.
Table A.2a : Corporate Perspective Summary
MARKET MARKET No. OF CSHB MARKET
GROUP CSHB STRATEGY SCOPE SHARE SOURCES
PERFORMANCE £s
Forte Promotion Medium High Many 6193
Milton Pricing Medium Low Few 989
M.Ch.Th Segmnt./pckging Wide High Many 5577
QMHs Promotion Medium High Few 1650
SHH Segmnt./pckging Medium Medium Many 3210
Stakis Promotion Medium High Few 3740
A.2.1 Background
This sections determines why hotel units offer CSHB, when they are offered, what
percentage of sales CSHB account for, and the number of nights accountable to
CSHB. At this stage, individual groups are not identified, nor are specific location
types. This section is intended to provide an overview of unit market background.
(i) Why CSHB are Offered
Figure A.2.1a shows the main reasons for offering CSHB.
Figure A.2.la
Reasons Why Hotel Units Offer CSHBs -Scotland & England 1991
Gain market share lJ Additional revenue u Follow competition u Head Office decide J
Demand led u Contribute to fixed costs lJ
llll
Fill spare capacity u 0 10 20 30 40 50 60 70 80 90
% of Hotel Units
Page 398
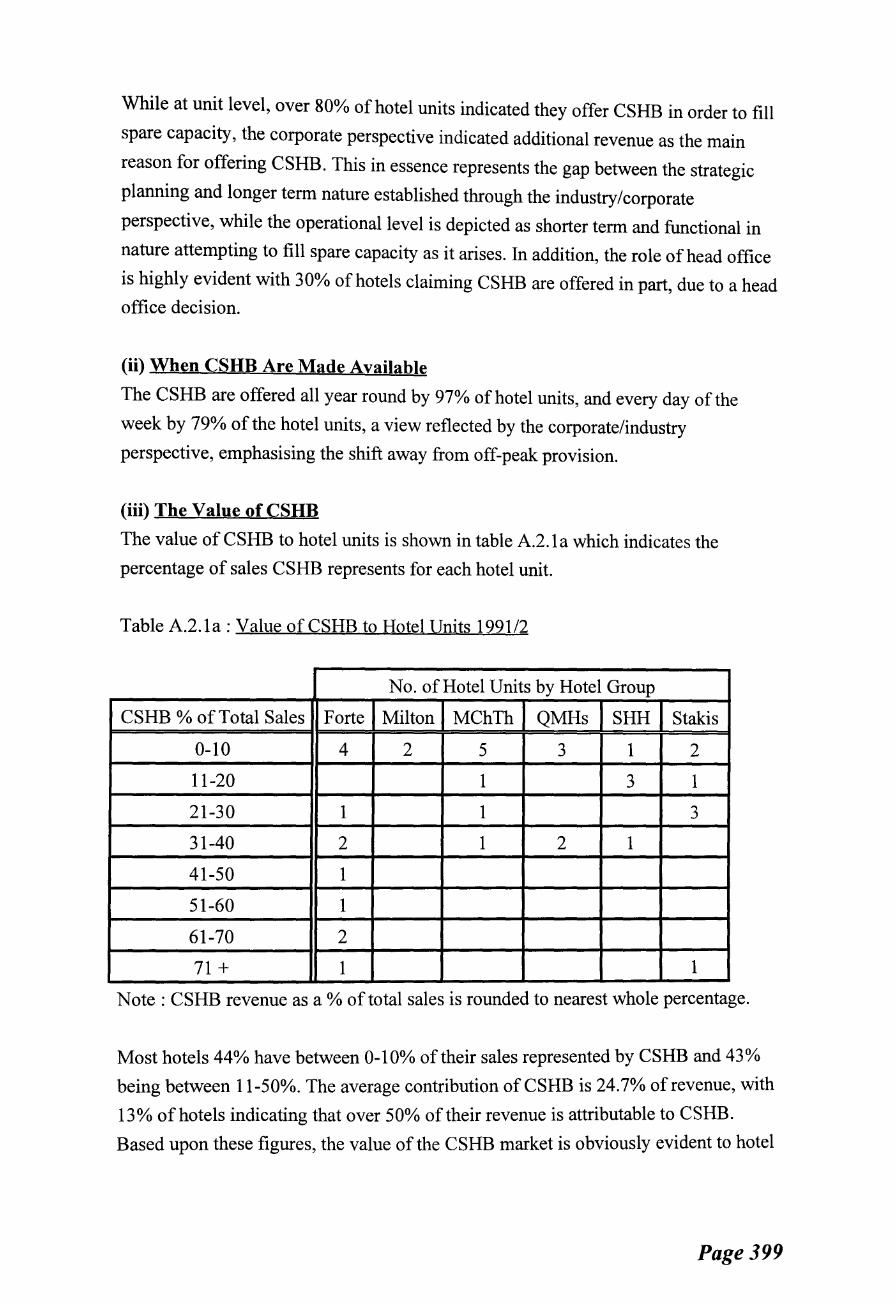
While at unit level, over 80% of hotel units indicated they offer CSHB in order to fill
spare capacity, the corporate perspective indicated additional revenue as the main
reason for offering CSHB. This in essence represents the gap between the strategic
planning and longer term nature established through the industry/corporate
perspective, while the operational level is depicted as shorter term and functional in
nature attempting to fill spare capacity as it arises. In addition, the role of head office
is highly evident with 30% of hotels claiming CSHB are offered in part, due to a head
office decision.
(ii) When CSHB Are Made Available
The CSHB are offered all year round by 97% of hotel units, and every day of the
week by 79% of the hotel units, a view reflected by the corporate/industry
perspective, emphasising the shift away from off-peak provision.
(iii) The Value of CSHB
The value of CSHB to hotel units is shown in table A.2.la which indicates the
percentage of sales CSHB represents for each hotel unit.
Table A.2.1a: Value ofCSHB to Hotel Units 199112
No. of Hotel Units by Hotel Group
CSHB% of Total Sales Forte Milton MChTh QMHs SHH Stakis
0-10 4 2 5 3 1 2
11-20 1 3 1
21-30 1 1 3
31-40 2 1 2 1
41-50 1
51-60 1
61-70 2
71 + 1 1
Note: CSHB revenue as a% of total sales is rounded to nearest whole percentage.
Most hotels 44% have between 0-10% of their sales represented by CSHB and 43%
being between 11-50%. The average contribution of CSHB is 24.7% of revenue, with
13% of hotels indicating that over 50% of their revenue is attributable to CSHB.
Based upon these figures, the value of the CSHB market is obviously evident to hotel
Page 399

units, even more so than at the corporate level where all hotel groups provide an
average of 10-15% and the six hotel groups of this sample 10%.
It is worth noting here that only hotel units in Forte and to a limited extent Stakis,
indicated that over 41% of revenue comes from CSHB. Both these groups are high
profile in terms of CSHB markets compared to other market segments.
(iv) Volume of CSHB
Table A.2.1 b shows the number of CSHB room nights reported by hotel units 1991/2.
T3;ble A.2.1 b : CSHB Room Nights in Hotel Units 1991/2
No. of Hotel Units by Hotel Group
CSHB Room Nights Forte Milton MChTh QMHs SHH Stakis
0-1000 1 1 4 1
1001-2000 1 1 2 1 2
2001-3000 3 1 1 1
3001-4000 1 1 1
4001-5000 1 1 1 1
5001-6000 1
6001-7000
7001-8000
8001-9000 1
9001-10000 1
10000 + 3 1 2
Three hotels were unable to provide the information required. The total number of
room nights for 199112 was 160382, with an average of 4455 per hotel, or 12 rooms
per night.
The volume of CSHB varies considerably with 74% having up to 5000 CSHB nights,
and 26% having more than this figure. Again, Forte, and Stakis represent the most
room nights, with QMHs also included. These three groups can be seen to be among
the most prominent and active in the CSHB market in Scotland and the UK.
Page 400

This section has established the general background to hotel unit CSHB provision.
The next sections focus on the specific areas of market structure, CSHB strategies and
CSHB performance.
A.2.2 CSHB Market Structure
As in the previous areas of industry level analysis the market structure is determined
in relation to three key variables, (i) market scope, (ii) market share and (iii) number
of sources of competitive advantage.
To identify the hotel groups corporate perspective of market structure, the corporate
perception of structure is indicated in brackets on each figure.
(i) Market Scope
Market scope refers to the breadth of CSHB markets targeted. Using the same scale as
in chapter seven the following degrees of market scope are determined, shown in table
A.2.2a and figure A.2.2a.
Table A.2.2a: Market Scope of Hotel Units 1991/2
No. of Hotel Units by Hotel Group
Market Scope Forte Milton MChTh QMHs SHH Stakis
Wide 7 2 4 1 1 4
Medium 4 0 4 4 3 2
Narrow 1 0 0 0 1 1
Figure A.2.2a
Hotel Units Market Scope by Hotel Group 1991/2
.. I Stakis (Med)
SHH (Med) JJ I
QMHs (Med)
-, MChTh (Wide)
Milton (Med) I Forte (Med)
0 2 3 4 5 6 7
Number of Hotel Units
I 0 Wide 0 Medium 0 Narrow I
Page 401
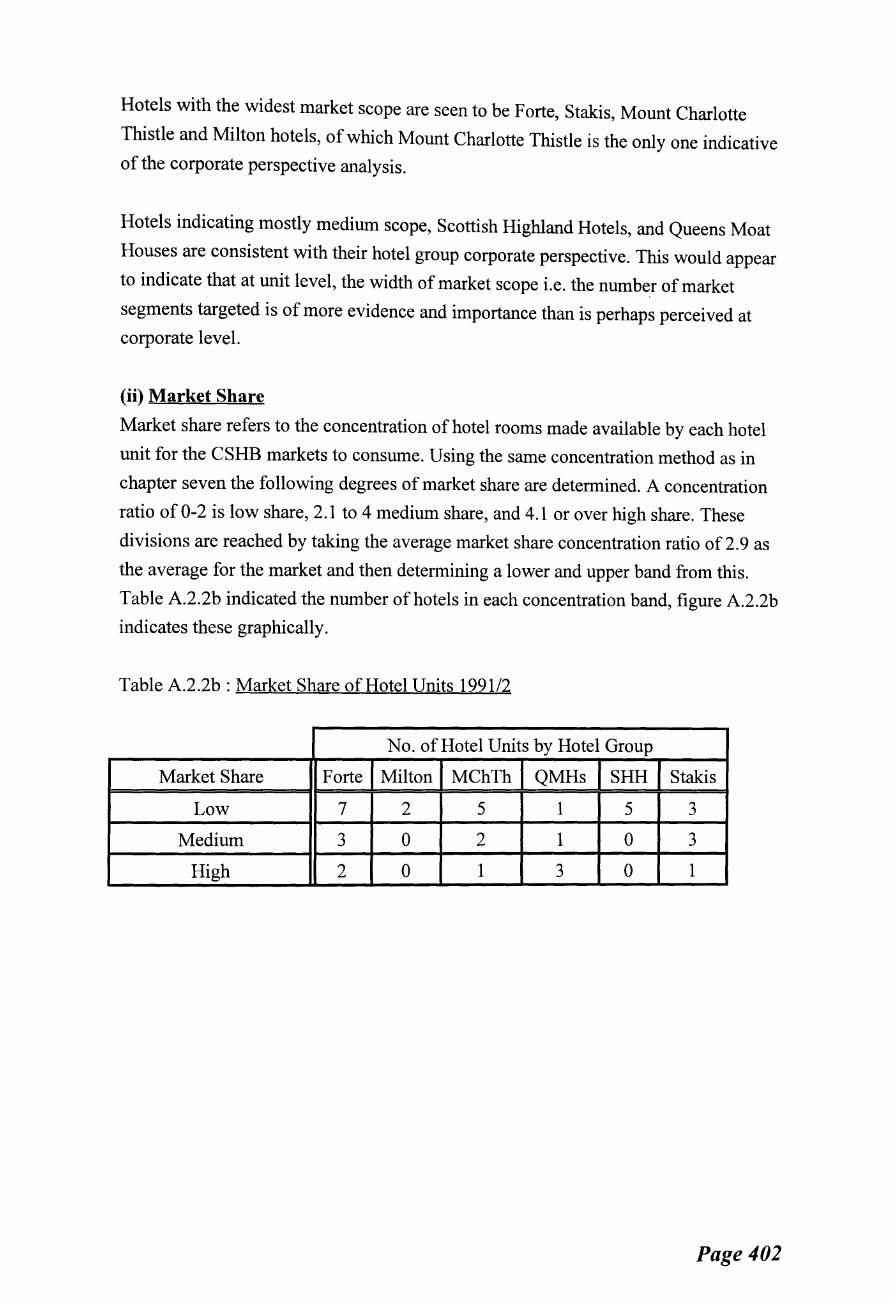
Hotels with the widest market scope are seen to be Forte, Stakis, Mount Charlotte
Thistle and Milton hotels, of which Mount Charlotte Thistle is the only one indicative
of the corporate perspective analysis.
Hotels indicating mostly medium scope, Scottish Highland Hotels, and Queens Moat
Houses are consistent with their hotel group corporate perspective. This would appear
to indicate that at unit level, the width of market scope i.e. the number of market
segments targeted is of more evidence and importance than is perhaps perceived at
corporate level.
(ii) Market Share
Market share refers to the concentration of hotel rooms made available by each hotel
unit for the CSHB markets to consume. Using the same concentration method as in
chapter seven the following degrees of market share are determined. A concentration
ratio of 0-2 is low share, 2.1 to 4 medium share, and 4.1 or over high share. These
divisions are reached by taking the average market share concentration ratio of 2.9 as
the average for the market and then determining a lower and upper band from this.
Table A.2.2b indicated the number of hotels in each concentration band, figure A.2.2b
indicates these graphically.
Table A.2.2b: Market Share of Hotel Units 199112
No. of Hotel Units by Hotel Group
Market Share Forte Milton MChTh QMHs SHH Stakis
Low 7 2 5 1 5 3
Medium 3 0 2 1 0 3
High 2 0 1 3 0 1
Page 402
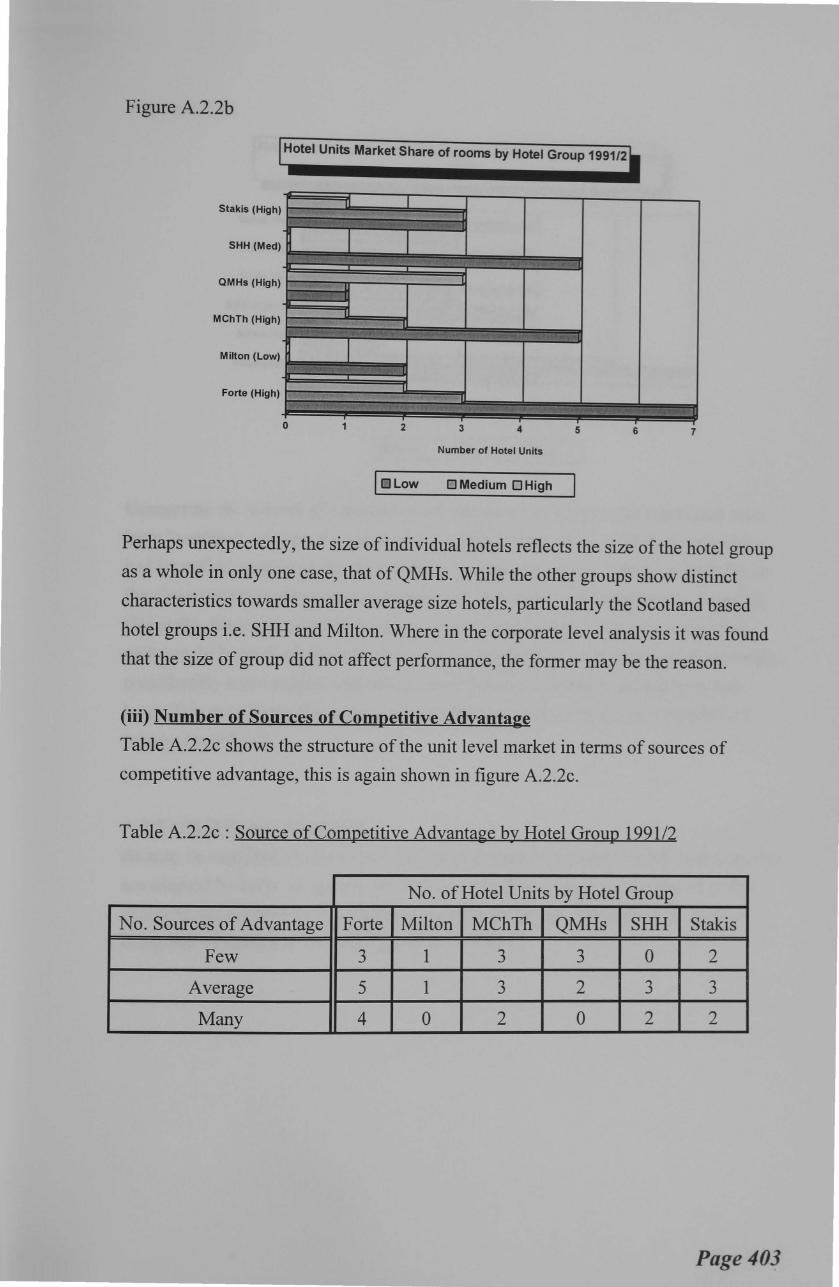
Figure A.2.2b
Hotel Units Market Share of rooms by Hotel Group 1991/2
Stakls (High) I
,.,.,,,.
SHH (Med) _,~~~· '"c>' ·' ''"''~ ..... '·'·' , ., . ,. ~ '"' , ..... ~~ ........ , ,.,""
QMHs (High) u ' IJ
MChTh (High) 11
....... . ··-.~··- ... ., ...... ,_..._ .. ,.,.,_ ,......, ..... Milton (Low)
. .,...,y,;,
Forte (High) 1 '~~·1-<· ··~
... •.; .... 0 2 3 4 5 6 7
Number of Hotel Units
I 0 Low 0 Medium 0 High
Perhaps unexpectedly, the size of individual hotels reflects the size of the hotel group
as a whole in only one case, that of QMHs. While the other groups show distinct
characteristics towards smaller average size hotels, particularly the Scotland based
hotel groups i.e. SHH and Milton. Where in the corporate level analysis it was found
that the size of group did not affect performance, the former may be the reason.
(iii) Number of Sources of Competitive Advantage
Table A.2.2c shows the structure of the unit level market in terms of sources of
competitive advantage, this is again shown in figure A.2.2c.
Table A.2.2c: Source of Competitive Advantage by Hotel Group 1991/2
No. of Hotel Units by Hotel Group
No. Sources of Advantage Forte Milton MChTh QMHs SHH Stakis
Few 3 1 3 3 0 2
Average 5 1 3 2 3 3
Many 4 0 2 0 2 2
Page403
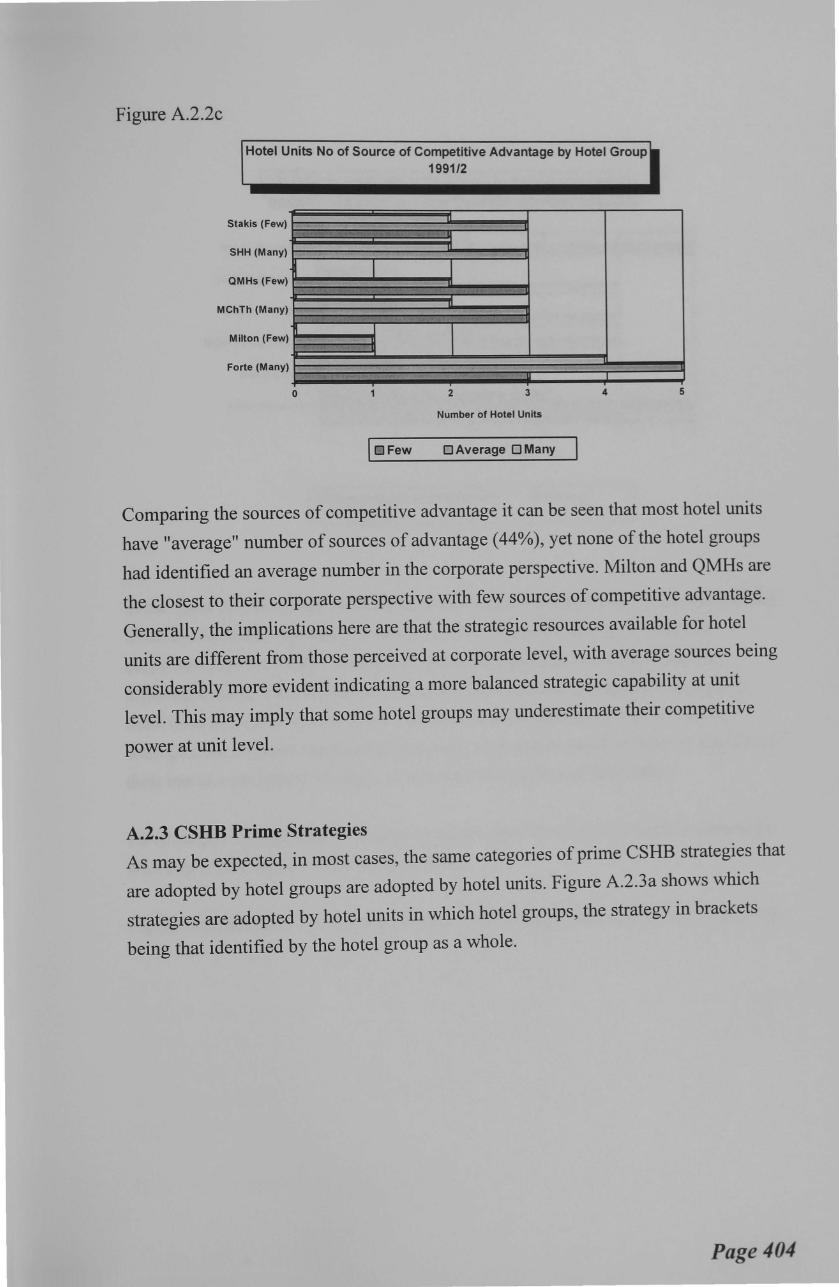
Figure A.2.2c
Hotel Units No of Source of Competitive Advantage by Hotel Group 1991/2
stakis (Few)~~~~~~~~~;;;r---~--l SHH (Many) t I I
QMHs (Few)~~~~~~~~~~~~~~ MChTh (Many)!
Milton(Few)~~~§gl~~~§g::::::;J Forte (Many) F 0 2 3 4 5
Number of Hotel Units joFew 0 Average 0 Many
Comparing the sources of competitive advantage it can be seen that most hotel units
have "average" number of sources of advantage (44%), yet none of the hotel groups
had identified an average number in the corporate perspective. Milton and QMHs are
the closest to their corporate perspective with few sources of competitive advantage.
Generally, the implications here are that the strategic resources available for hotel
units are different from those perceived at corporate level, with average sources being
considerably more evident indicating a more balanced strategic capability at unit
level. This may imply that some hotel groups may underestimate their competitive
power at unit level.
A.2.3 CSHB Prime Strategies As may be expected, in most cases, the same categories of prime CSHB strategies that
·are adopted by hotel groups are adopted by hotel units. Figure A.2.3a shows which
strategies are adopted by hotel units in which hotel groups, the strategy in brackets
being that identified by the hotel group as a whole.
Page 404
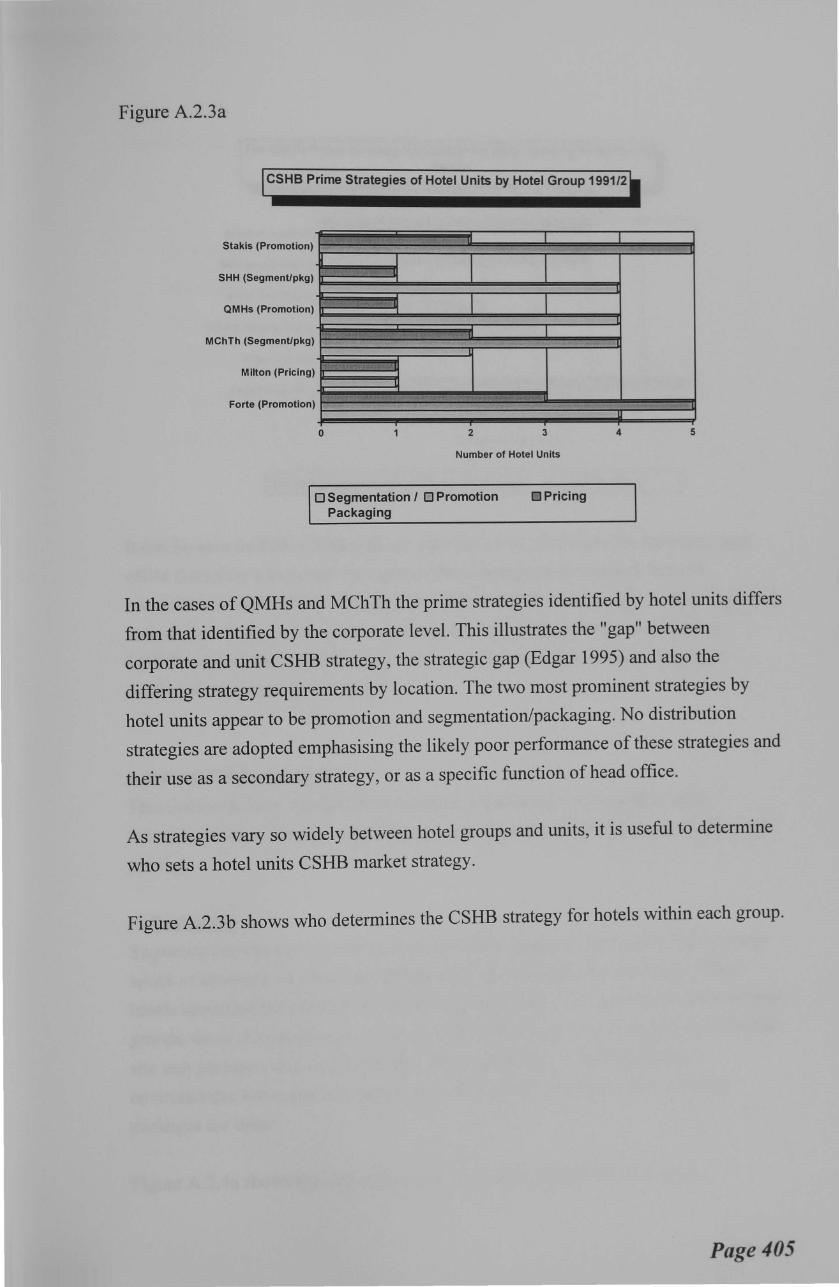
Figure A.2.3a
CSHB Prime Strategies of Hotel Units by Hotel Group 1991/2
Stakls (Promotion)
I SHH (SegmenUpkg)
Ll
QMHs (Promotion) II
I MChTh (SegmenUpkg)
Milton (Pricing)
Forte (Promotion)
0 2 3
Number of Hotel Units
0 Segmentation I 0 Promotion Packaging
OPricing
4 5
In the cases of QMHs and MChTh the prime strategies identified by hotel units differs
from that identified by the corporate level. This illustrates the "gap" between
corporate and unit CSHB strategy, the strategic gap (Edgar 1995) and also the
differing strategy requirements by location. The two most prominent strategies by
hotel units appear to be promotion and segmentation/packaging. No distribution
strategies are adopted emphasising the likely poor performance of these strategies and
their use as a secondary strategy, or as a specific function of head office.
As strategies vary so widely between hotel groups and units, it is useful to determine
who sets a hotel units CSHB market strategy.
Figure A.2.3b shows who determines the CSHB strategy for hotels within each group.
Page 405

Figure A.2.3b
The CSHB Prime Strategy Formulator for Hotel Units by Hotel Group 1991/2
Stakis (Promotion) u
SHH (SegmenUpkg)
QMHs (Promotion)
MChTh (SegmenUpkg)
Milton (Pricing)
Forte (Promotion) u
0 2 3 4 5 6
Number of Hotel Units
0 Hotel Independently 0 Head Office Alone 0 Joint Decision
7
It can be seen that most strategies are determined by joint decision, however, head
office does play a key role. Two groups that displayed key variance from the
corporate strategy, QMHs and MChTh. QMHs can be seen to make a wider degree of
independent strategy formulation perhaps explaining the strategy discrepancy.
MChTh on the other hand has joint decision and head office perhaps leading to
confusion over strategic direction.
A.2.4 All CSHB Strategies
This section focuses on all CSHB strategies regardless of prime and as such
determines characteristics of packaging I segmentation, distribution, promotion, and
pnc1ng.
(i) Packaging Segmentation was established as a key profitable strategies for hotel groups at most
levels of structure, of which packaging was a key element of the strategy. While
hotels identified the elements of the package as being of the same importance as hotel
groups, there is a question as to the role head office plays in the compilation of multi
site unit packages and indeed whether their knowledge of local operating
environments and markets is adequate to take such an involvement in creating
packages for units.
Figure A.2.4a shows the role of head office in compiling CSHB packages.
Page 406
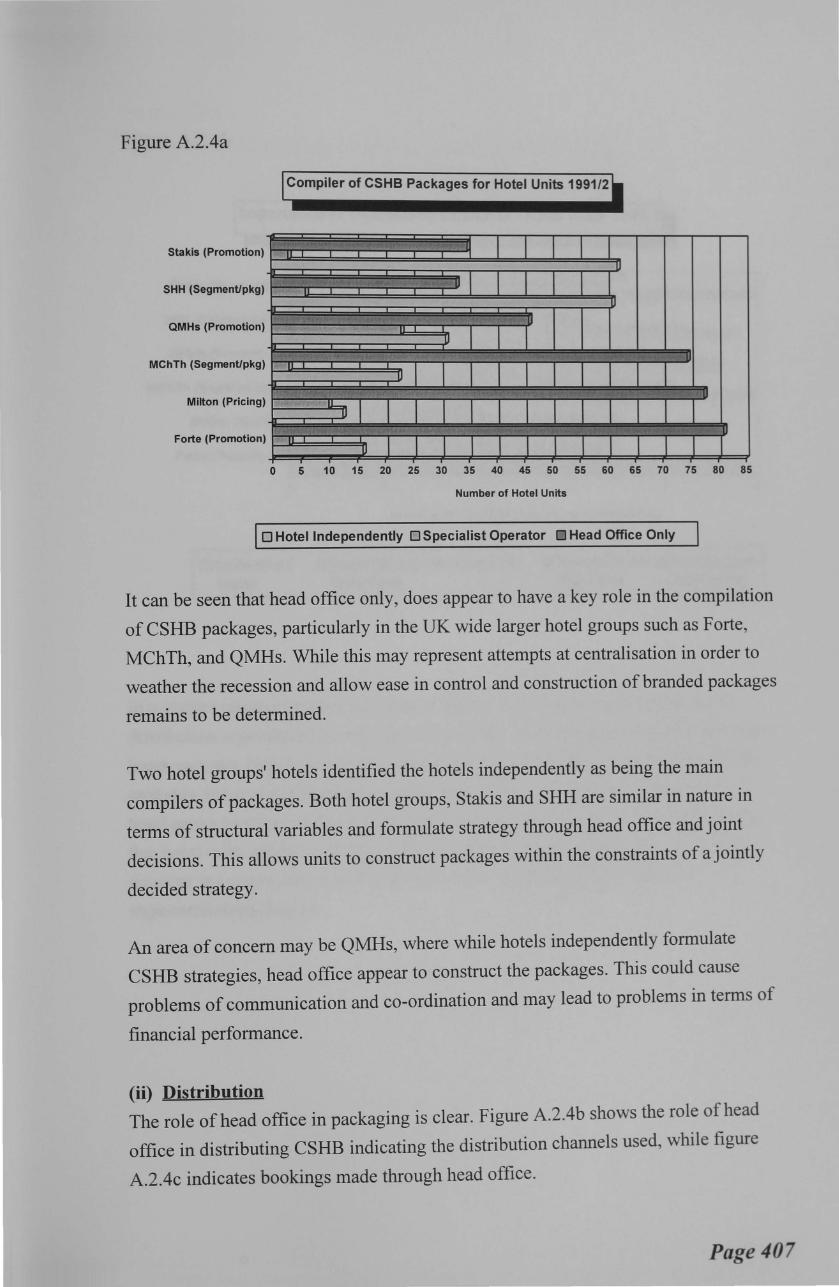
Figure A.2.4a
Compiler of CSHB Packages for Hotel Units 1991/2
Stakis (Promotion) . •. """" - ~r ~ .. ~· . ..,, ,., ··u I
SHH (Segment/pkg) ........ ,, -,.. . ...... ..... ~ ·~= I I
..•. ,,, ... ····· .. ll
I I QMHs (Promotion)
.. .. -:;- ~ .. -.-;-;;- . _ ....... , ..... ~ ,.,..~.._._, .• -. '·U
IJI I I I I MChTh (Segment/pkg)
.. , -~.- ... .. ~. .,, -..=-; ,,,. '".''l" ..... ~ ~-'" Milton (Pricing)
11 -lJ I I I I I I .•.. .... , ...... '·· •", . . .. . ··- ... ·• ....... ·······~\1' ',, .. ,. I><•'· 'IF\~'
Forte (Promotion) I 1 1 I I 0 5 10 15 20 25 30 35 40 45 50 55 60 65 70 75 80 85
Number of Hotel Units
0 Hotel Independently 0 Specialist Operator 0 Head Office Only
It can be seen that head office only, does appear to have a key role in the compilation
of CSHB packages, particularly in the UK wide larger hotel groups such as Forte,
MChTh, and QMHs. While this may represent attempts at centralisation in order to
weather the recession and allow ease in control and construction of branded packages
remains to be determined.
Two hotel groups' hotels identified the hotels independently as being the main
compilers of packages. Both hotel groups, Stakis and SHH are similar in nature in
terms of structural variables and formulate strategy through head office and joint
decisions. This allows units to construct packages within the constraints of a jointly
decided strategy.
An area of concern may be QMHs, where while hotels independently formulate
CSHB strategies, head office appear to construct the packages. This could cause
problems of communication and co-ordination and may lead to problems in terms of
financial performance.
(ii) Distribution The role of head office in packaging is clear. Figure A.2.4b shows the role of head
office in distributing CSHB indicating the distribution channels used, while figure
A.2.4c indicates bookings made through head office.
Page 407
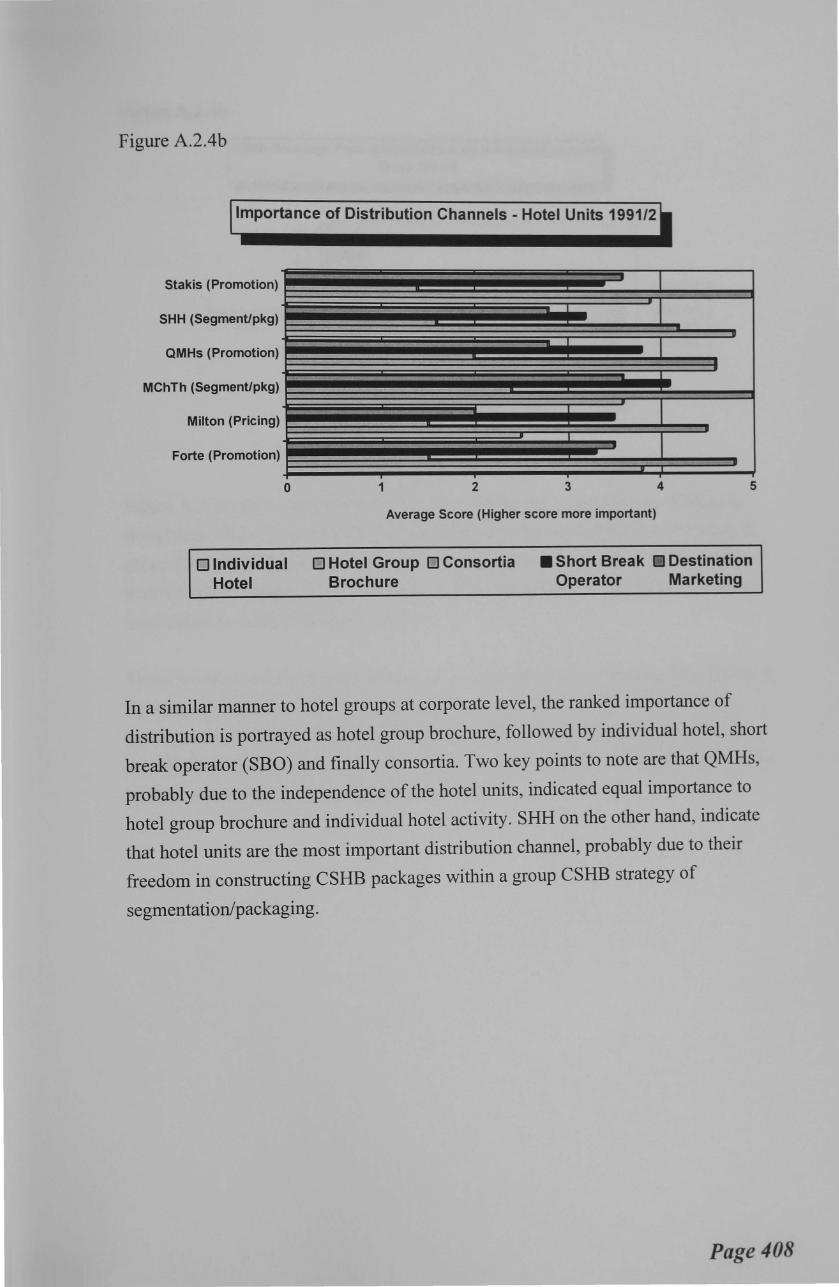
Figure A.2.4b
Importance of Distribution Channels- Hotel Units 1991/2
SHH (Segment/pkg)
QMHs (Promotion)
MChTh (Segment/pkg)
Milton (Pricing)
Forte (Promotion)
0
0 Individual Hotel
1 2 3 4 5
Average Score (Higher score more important)
0 Hotel Group 0 Consortia Brochure
• Short Break tiD Destination Operator Marketing
In a similar manner to hotel groups at corporate level, the ranked importance of
distribution is portrayed as hotel group brochure, followed by individual hotel, short
break operator (SBO) and finally consortia. Two key points to note are that QMHs,
probably due to the independence of the hotel units, indicated equal importance to
hotel group brochure and individual hotel activity. SHH on the other hand, indicate
that hotel units are the most important distribution channel, probably due to their
freedom in constructing CSHB packages within a group CSHB strategy of
segmentation/packaging.
Page 408
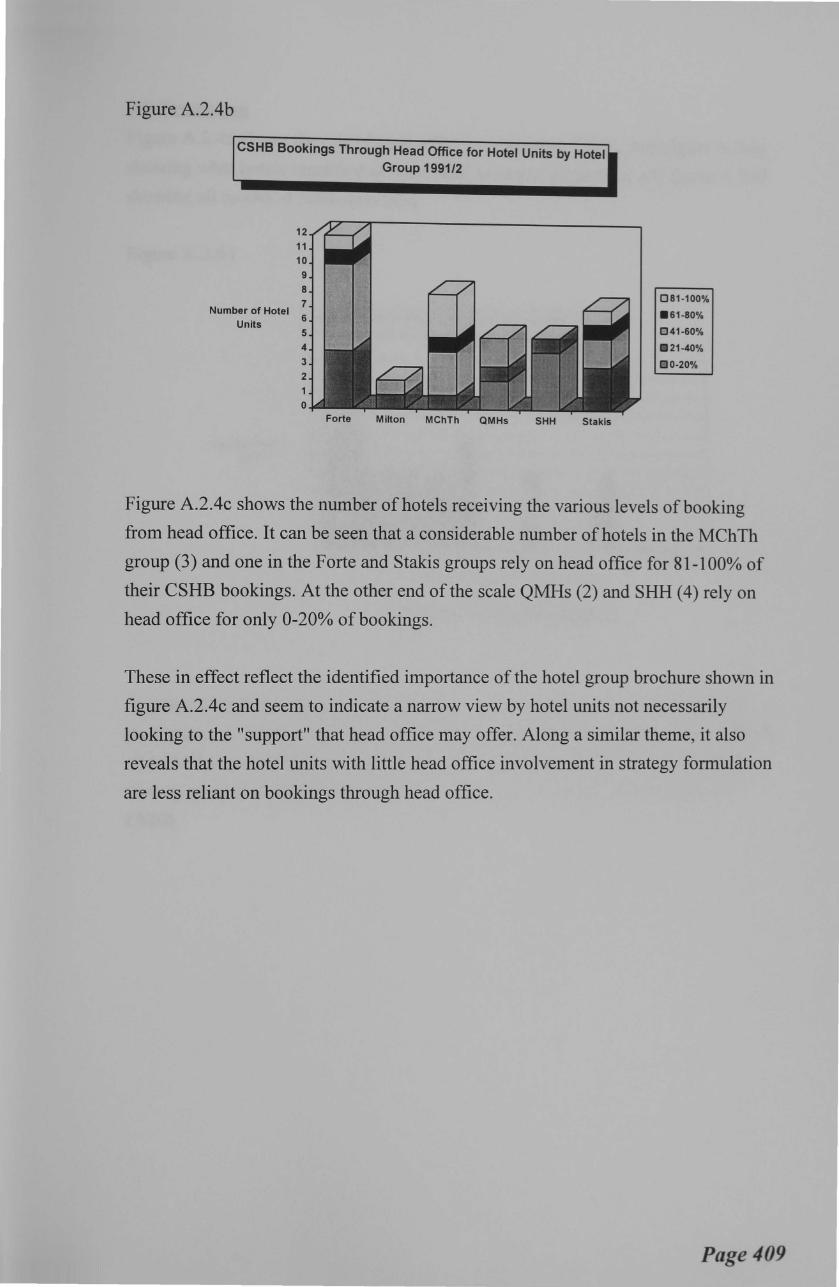
Figure A.2.4b
CSHB Bookings Through Head Office for Hotel Units by Hotel Group 1991/2
12 11 10
9
8
Number of Hotel 7
Units 6
5
4 3
2
0 Forte Milton MChTh QMHs SHH Stakis
081-100%
.61-80%
041-60%
.21-40%
00-20%
Figure A.2.4c shows the number of hotels receiving the various levels of booking
from head office. It can be seen that a considerable number of hotels in the MChTh
group (3) and one in the Forte and Stakis groups rely on head office for 81-100% of
their CSHB bookings. At the other end of the scale QMHs (2) and SHH (4) rely on
head office for only 0-20% of bookings.
These in effect reflect the identified importance of the hotel group brochure shown in
figure A.2.4c and seem to indicate a narrow view by hotel units not necessarily
looking to the "support" that head office may offer. Along a similar theme, it also
reveals that the hotel units with little head office involvement in strategy formulation
are less reliant on bookings through head office.
Page 409
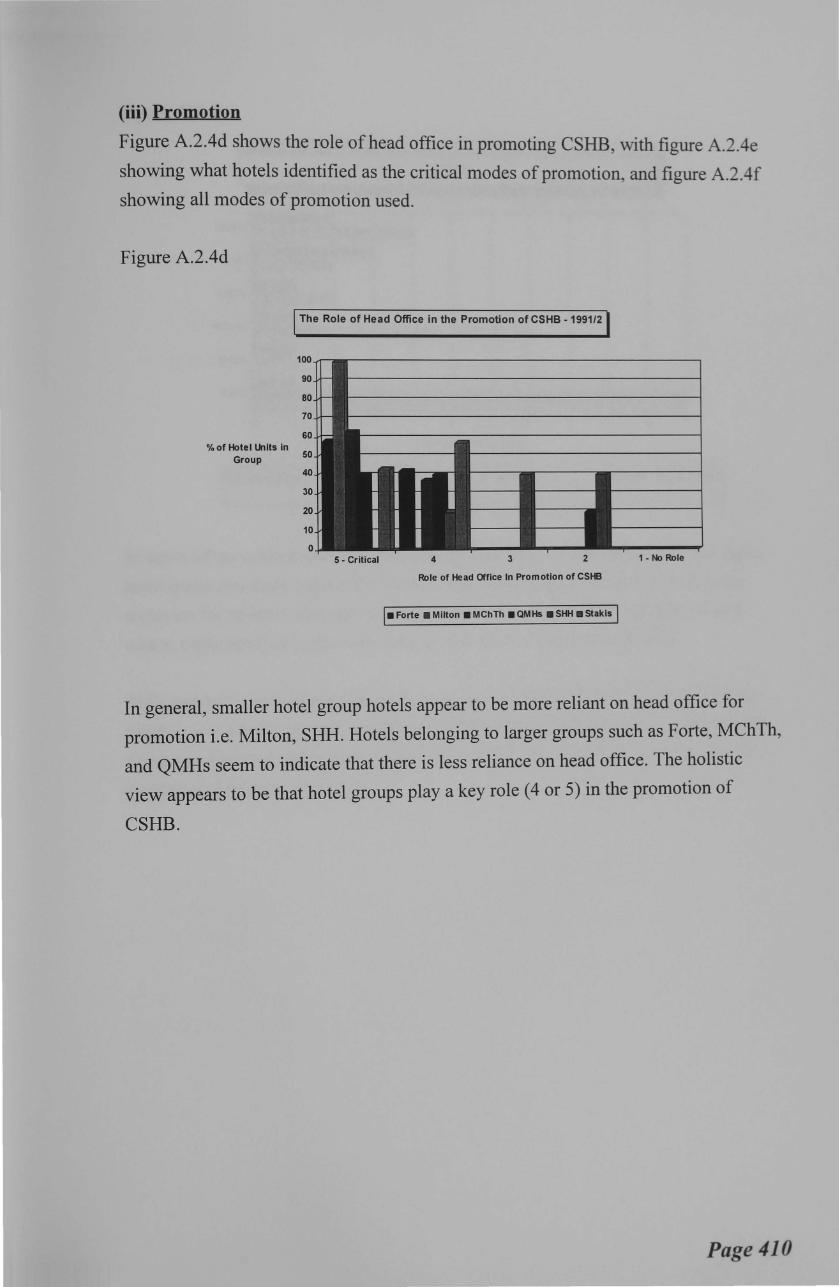
(iii) Promotion
Figure A.2.4d shows the role of head office in promoting CSHB, with figure A.2.4e
showing what hotels identified as the critical modes of promotion, and figure A.2.4f
showing all modes of promotion used.
Figure A.2.4d
%of Hotellkllts in Group
The Role of Head Office in the Promotion of CSHB- 1991/2
5- Critical 4 3 2 1- No Role
Role of Head Office In Promotion of CSHB
In general, smaller hotel group hotels appear to be more reliant on head office for
promotion i.e. Milton, SHH. Hotels belonging to larger groups such as Forte, MChTh,
and QMHs seem to indicate that there is less reliance on head office. The holistic
view appears to be that hotel groups play a key role ( 4 or 5) in the promotion of
CSHB.
Page 410
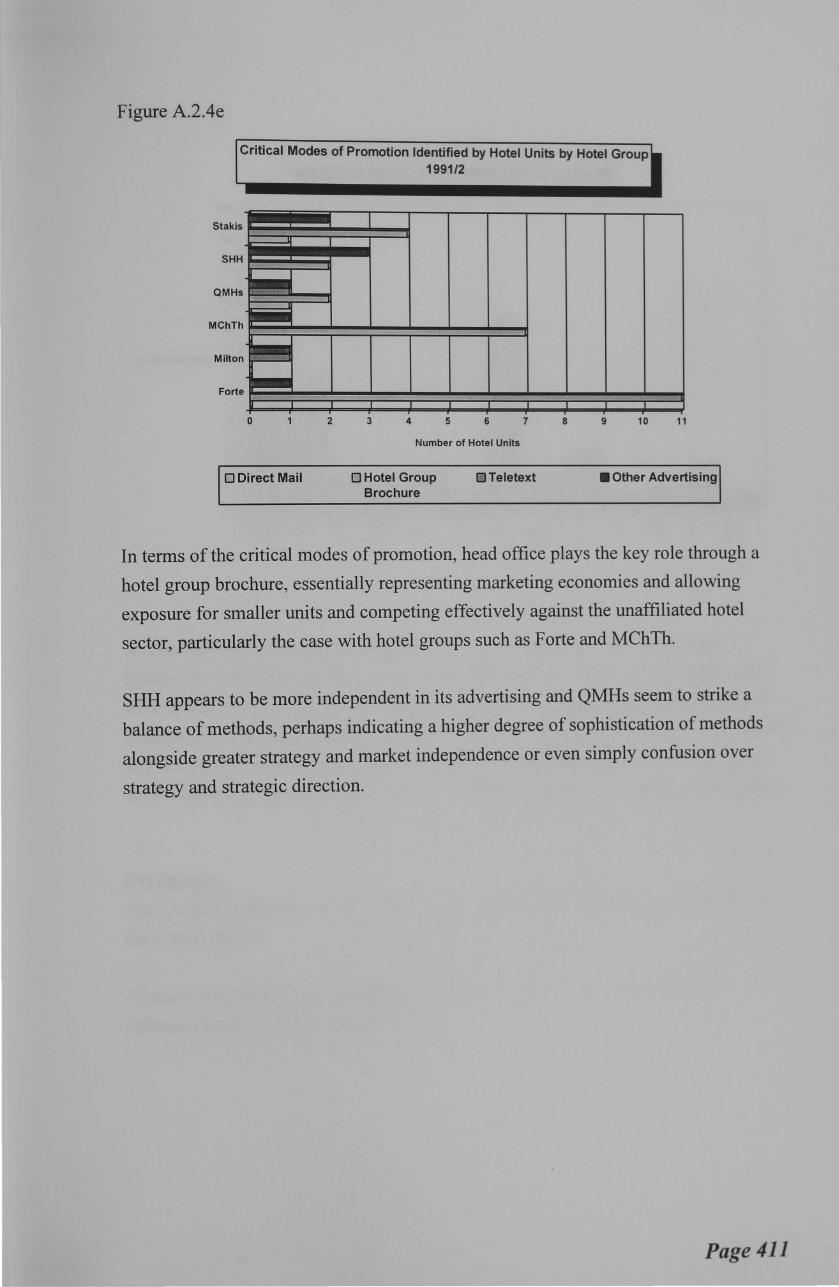
Figure A.2.4e
Critical Modes of Promotion Identified by Hotel Units by Hotel Group 1991/2
Stakis
SHH
QMHs
MChTh
Milton
Forte
0 2 3 4 5 6 7 8 9 10
Number of Hotel Units
11
0 Direct Mail 0 Hotel Group Brochure
OTeletext • Other Advertising
In terms of the critical modes of promotion, head office plays the key role through a
hotel group brochure, essentially representing marketing economies and allowing
exposure for smaller units and competing effectively against the unaffiliated hotel
sector, particularly the case with hotel groups such as Forte and MChTh.
SHH appears to be more independent in its advertising and QMHs seem to strike a
balance of methods, perhaps indicating a higher degree of sophistication of methods
alongside greater strategy and market independence or even simply confusion over
strategy and strategic direction.
Page 411
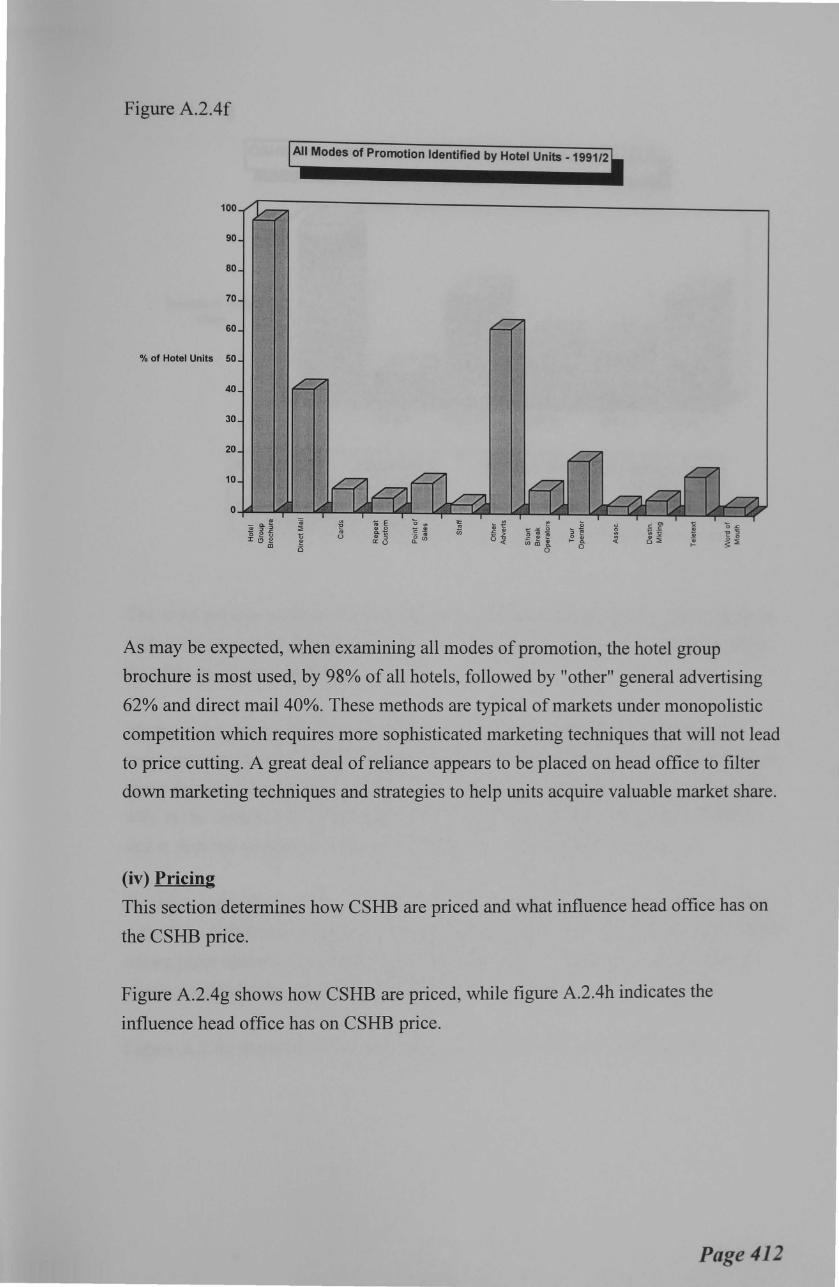
Figure A.2.4f
All Modes of Promotion Identified by Hotel Units -1991/2
100
90
80
70
60
% of Hotel Units 50
40
30
m f ~ ~ g ~ .~ ~ 0 ~ .
~ ~
~ " 5 > m
~ '"li i .., m 0 m ~::;; ~ <( en a; . .... tS ,!. tS
As may be expected, when examining all modes of promotion, the hotel group
brochure is most used, by 98% of all hotels, followed by "other" general advertising
62% and direct mail 40%. These methods are typical of markets under monopolistic
competition which requires more sophisticated marketing techniques that will not lead
to price cutting. A great deal of reliance appears to be placed on head office to filter
down marketing techniques and strategies to help units acquire valuable market share.
(iv) Pricing
This section determines how CSHB are priced and what influence head office has on
the CSHB price.
Figure A.2.4g shows how CSHB are priced, while figure A.2.4h indicates the
influence head office has on CSHB price.
Page 412
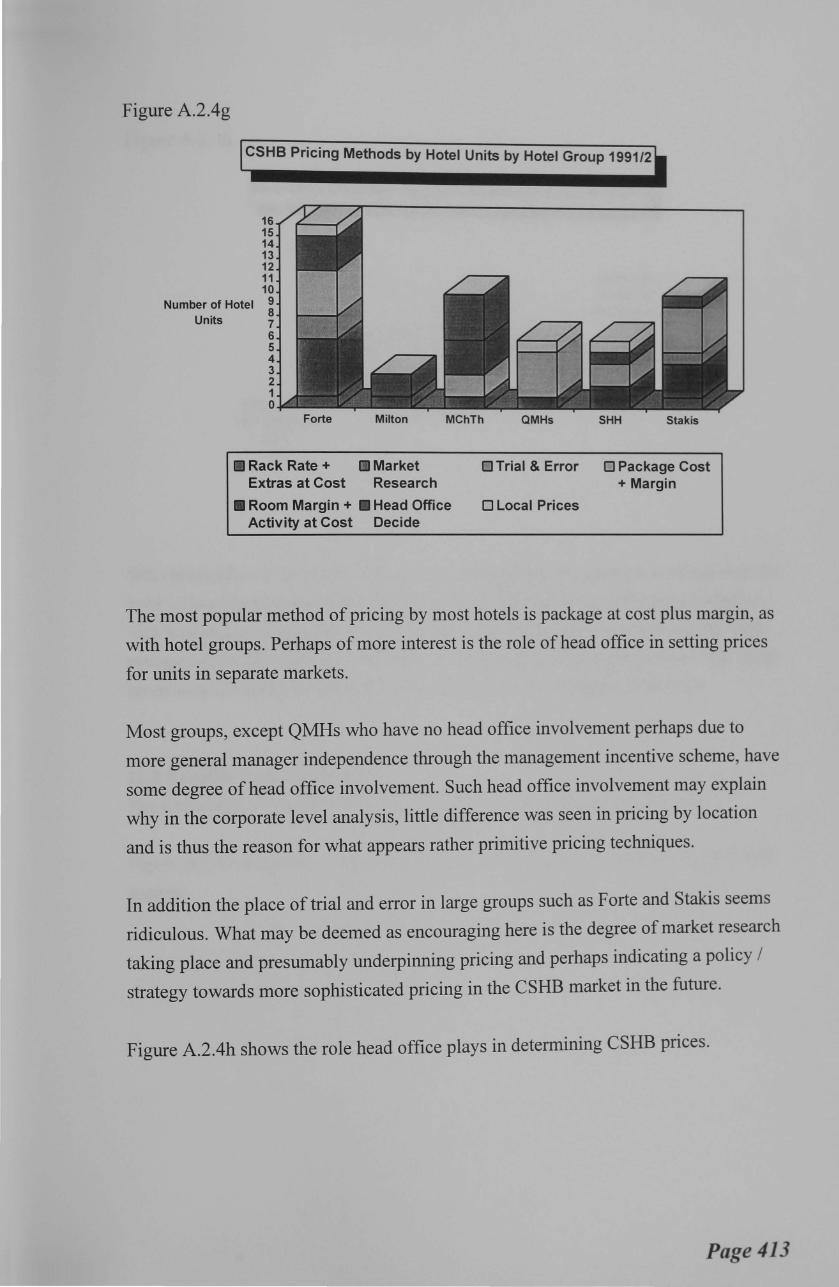
Figure A.2.4g
CSHB Pricing Methods by Hotel Units by Hotel Group 1991/2
16 15 14 13 12 11 10
Number of Hotel 9 8
Units 7 6 5 4 3 2 1 0
MChTh QMHs SHH Stakis
Rack Rate + Market Extras at Cost Research
• Room Margin + • Head Office Activity at Cost Decide
0 Trial & Error 0 Package Cost +Margin
0 Local Prices
The most popular method of pricing by most hotels is package at cost plus margin, as
with hotel groups. Perhaps of more interest is the role of head office in setting prices
for units in separate markets.
Most groups, except QMHs who have no head office involvement perhaps due to
more general manager independence through the management incentive scheme, have
some degree of head office involvement. Such head office involvement may explain
why in the corporate level analysis, little difference was seen in pricing by location
and is thus the reason for what appears rather primitive pricing techniques.
In addition the place of trial and error in large groups such as Forte and Stakis seems
ridiculous. What may be deemed as encouraging here is the degree of market research
taking place and presumably underpinning pricing and perhaps indicating a policy I
strategy towards more sophisticated pricing in the CSHB market in the future.
Figure A.2.4h shows the role head office plays in determining CSHB prices.
Page 413
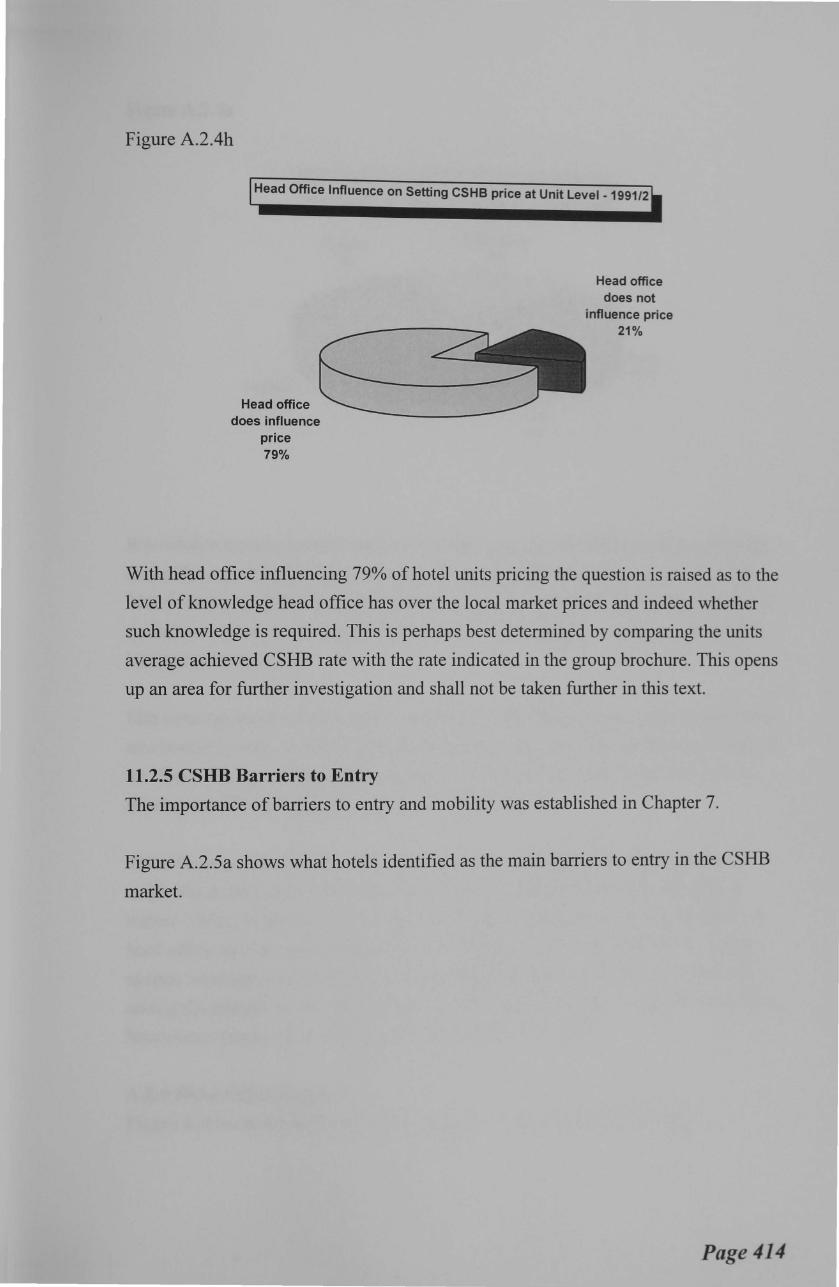
Figure A.2.4h
Head Office Influence on Setting CSHB price at Unit Level. 1991/2
Head office does influence
price 79%
Head office does not
influence price 21%
With head office influencing 79% of hotel units pricing the question is raised as to the
level of knowledge head office has over the local market prices and indeed whether
such knowledge is required. This is perhaps best determined by comparing the units
average achieved CSHB rate with the rate indicated in the group brochure. This opens
up an area for further investigation and shall not be taken further in this text.
11.2.5 CSHB Barriers to Entry
The importance of barriers to entry and mobility was established in Chapter 7.
Figure A.2.5a shows what hotels identified as the main barriers to entry in the CSHB
market.
Page 414
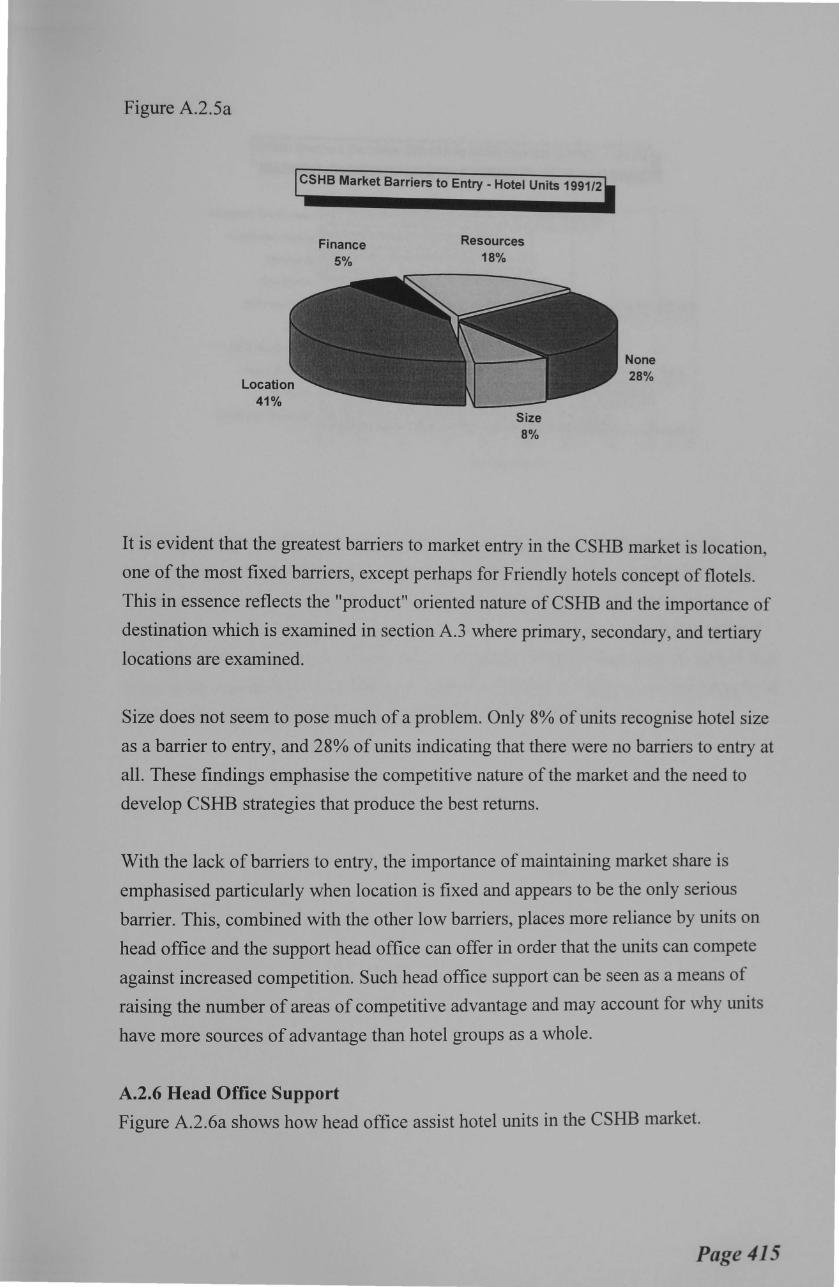
Figure A.2.5a
CSHB Market Barriers to Entry- Hotel Units 1991/2
Finance 5%
Resources 18%
Size 8%
None 28%
It is evident that the greatest barriers to market entry in the CSHB market is location,
one of the most fixed barriers, except perhaps for Friendly hotels concept of flotels.
This in essence reflects the "product" oriented nature of CSHB and the importance of
destination which is examined in section A.3 where primary, secondary, and tertiary
locations are examined.
Size does not seem to pose much of a problem. Only 8% of units recognise hotel size
as a barrier to entry, and 28% of units indicating that there were no barriers to entry at
all. These findings emphasise the competitive nature of the market and the need to
develop CSHB strategies that produce the best returns.
With the lack of barriers to entry, the importance of maintaining market share is
emphasised particularly when location is fixed and appears to be the only serious
barrier. This, combined with the other low barriers, places more reliance by units on
head office and the support head office can offer in order that the units can compete
against increased competition. Such head office support can be seen as a means of
raising the number of areas of competitive advantage and may account for why units
have more sources of advantage than hotel groups as a whole.
A.2.6 Head Office Support
Figure A.2.6a shows how head office assist hotel units in the CSHB market.
Page 415

Figure A.2.6a
CSHB Support Services Offered by Hotel Groups to Units -1991/2
Company Information
Customer History
Discounts
Complaints
Booking I CRS
Credit
Club Membership
Special Offers
Mail List
Consumer Research
u lJ
0 10 20 30
IJ
IJ
u IJ
IJ
u 40 50 60 70 80
% of Hotel Units
l
u
90
The main support offered by head office can be seen to be booking via central
reservation systems (CRS), special offers, company information, mailing lists, and
consumer research, focusing on the distribution and marketing of CSHB. These
benefits are reiterated by figure A.2.6b which shows the three main benefits of head
office links in terms of the CSHB market. However, 26% of hotel units identified that
there were considerable drawbacks of head office links, the main ones appearing to be
a lack of communication and poor supply of critical information.
Page 416

Figure A.2.6b
Main Benefit of CSHB Support Services Offered by Hotel Groups to I Units -1991/2
80
70
60
50
% of Hotel Units 40
30
20
10
Booking I CRS Backup Support Marketing
In conclusion to this section, the future direction of hotel groups is determined from
the perspective of the hotel units and then compared to the future direction identified
by the hotel groups themselves.
A.2.7 Future Hotel Group Direction Figure A.2.7a indicates what individual hotels think their hotel group will do to react
to changes in the CSHB market.
Page 417
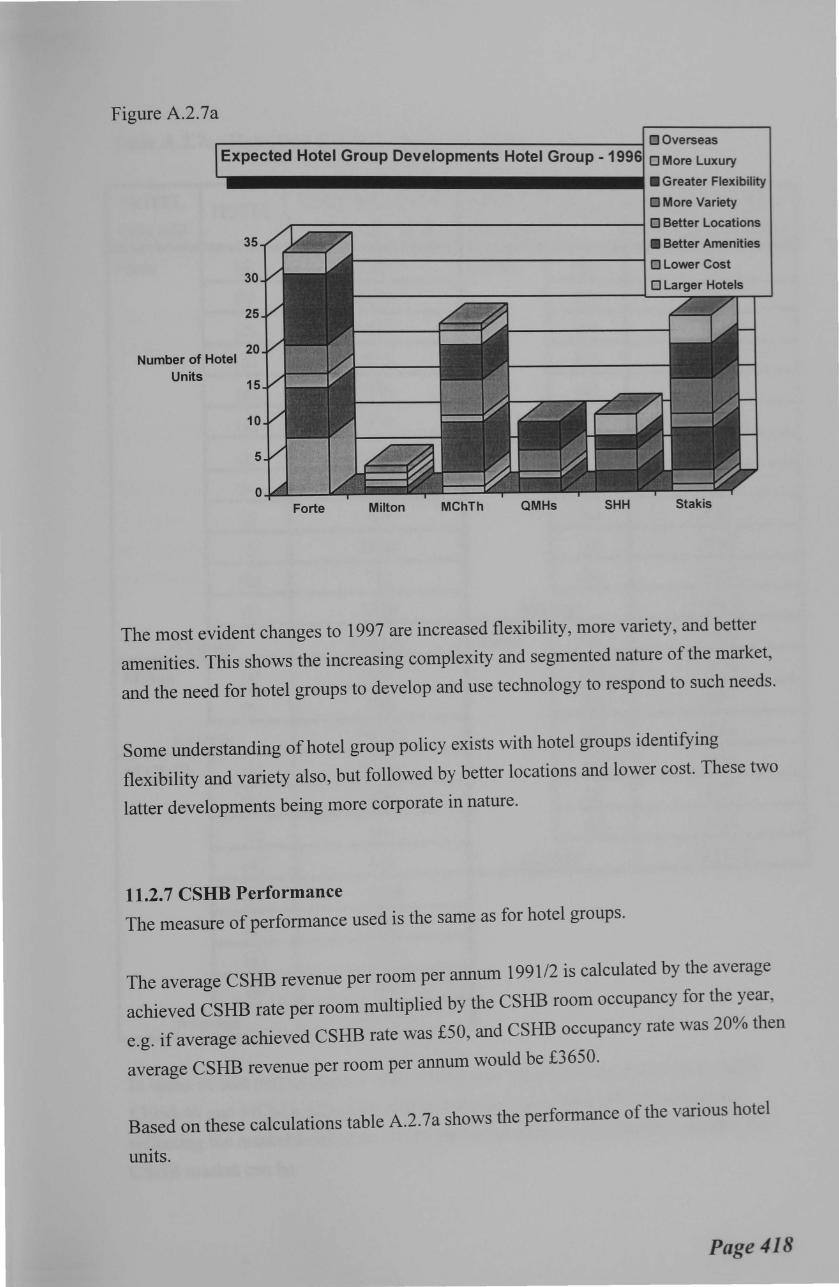
Figure A.2.7a
rie=::=:=::;-;::;::;::-;-;::::-:-:-=--:::---:----------J 0 Overseas xpected Hotel Group Developments Hotel Group - 199 0 More Luxury
• Greater Flexibility
0 More Variety
1--:;:;:.:::;:;:;--------------~ 0 Better Locations 35
30
25
20 Number of Hotel
Units 15
10
5
• Better Amenities
r--------------__J 0 Lower Cost
Milton MChTh QMHs SHH Stakis
The most evident changes to 1997 are increased flexibility, more variety, and better
amenities. This shows the increasing complexity and segmented nature of the market,
and the need for hotel groups to develop and use technology to respond to such needs.
Some understanding of hotel group policy exists with hotel groups identifying
flexibility and variety also, but followed by better locations and lower cost. These two
latter developments being more corporate in nature.
11.2.7 CSHB Performance The measure of performance used is the same as for hotel groups.
The average CSHB revenue per room per annum 1991/2 is calculated by the average
achieved CSHB rate per room multiplied by the CSHB room occupancy for the year,
e.g. if average achieved CSHB rate was £50, and CSHB occupancy rate was 20o/o then
average CSHB revenue per room per annum would be £3650.
Based on these calculations table A.2.7a shows the performance of the various hotel
units.
Page 418
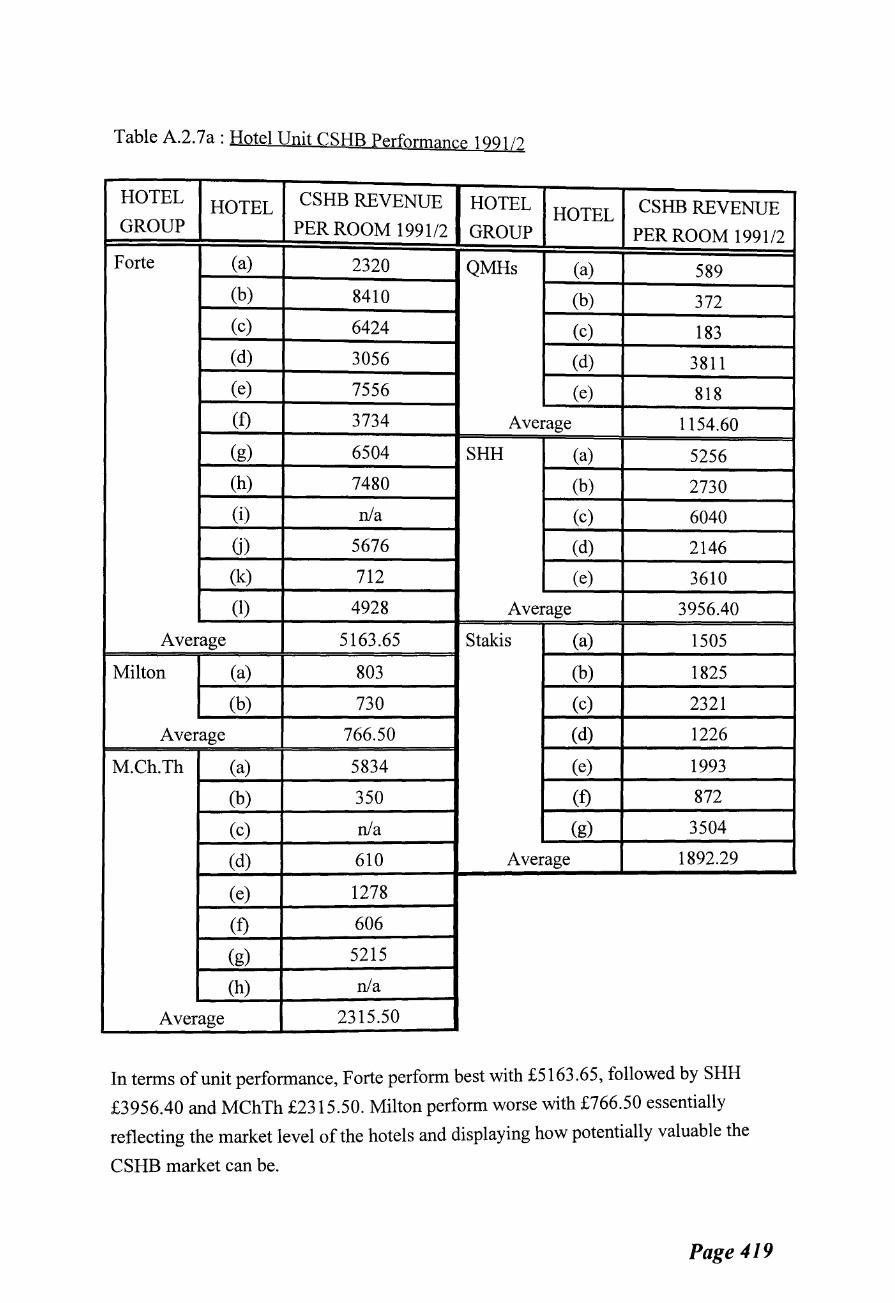
Table A.2.7a: Hotel Unit CSHB Performance 1991/2
HOTEL HOTEL CSHB REVENUE HOTEL CSHB REVENUE HOTEL
GROUP PER ROOM 1991/2 GROUP PER ROOM 1991/2
Forte (a) 2320 QMHs (a) 589 (b) 8410 (b) 372 (c) 6424 (c) 183 (d) 3056 (d) 3811 (e) 7556 (e) 818 (f) 3734 Average 1154.60
(g) 6504 SHH (a) 5256
(h) 7480 (b) 2730
(i) n/a (c) 6040
G) 5676 (d) 2146
(k) 712 (e) 3610
(1) 4928 Average 3956.40
Average 5163.65 Stakis (a) 1505
Milton (a) 803 (b) 1825
(b) 730 (c) 2321
Average 766.50 (d) 1226
M.Ch.Th (a) 5834 (e) 1993
(b) 350 (f) 872
(c) n/a (g) 3504
(d) 610 Average 1892.29
(e) 1278
(f) 606
(g) 5215
(h) n/a
Average 2315.50
In terms of unit performance, Forte perform best with £5163.65, followed by SHH
£3956.40 and MChTh £2315.50. Milton perform worse with £766.50 essentially
reflecting the market level of the hotels and displaying how potentially valuable the
CSHB market can be.
Page 419

In summary to the corporate versus unit perspective, it can be seen that the unit level
concentrates on predatorial type strategies striving to gain market share. Distribution
and general strategy formulation are largely the responsibility of head office.
Competition at unit level is intense requiring head office assistance although on some
occasions distinct corporate - unit gaps appear.
The next section introduces another key structural variable particularly relevant to
multi site operations - location.
A.3 LOCATIONAL VARIANCE OF MULTI-SITE UNITS
The locational variance of multi site units relates the three key location types,
primary, secondary, and tertiary to the CSHB variables of market background, CSHB
market structure, CSHB prime strategies adopted and distribution methods, and
CSHB performance by location.
A.3.1 Background
Again, CSHB are offered all year round by location, however, when the days of the
week are determined it becomes evident that CSHB are made available essentially at
weekends in primary locations, and all week in other locations. The closer to primary
location the unit becomes, the more weekend oriented the CSHB becomes.
This is shown in figure A.3 .1 a.
Page 420

Figure A.3.1a
Days When CSHBs are Available by Location 1991/2
Sunday .. , .. ...
. ~---·-"'
Saturday ' - ·- --:.. ~··
;-.~
Friday ',. ~~·v:.;; •!<"?'· ..... ' ..
.• Thursday
IJ I I I I I ,,~
Wednesday IJ I I I I I ... ..... ~···
Tuesday u I I I I I
Monday IJ IJ -,
0 10 20 30 40 50 60 70 80 90 100
% of Hotel Units
I 0 Primary 0 Secondary 0 Tertiary
A.3.2 CSHB Market Structure
Market structure is determined in terms of market scope, market share, and number of
sources of competitive advantage. Table A.3 .2a shows these location variations.
Table A.3 .2a : CSHB Market Structure by Location
Number of Hotels
STRUCTURE Primary Secondary Tertiary
Wide 6 8 5
Market Scope Medium 3 11 3
Narrow 1 2 0
High 3 4 0
Market Share Medium 4 4 1
Low 3 13 7
Many 2 6 3
Sources of Average 5 8 3
Advantage Few 3 7 2
Using this table, figures A.3.2a, A.3.2b, and A.3.2c are formed.
Page 421
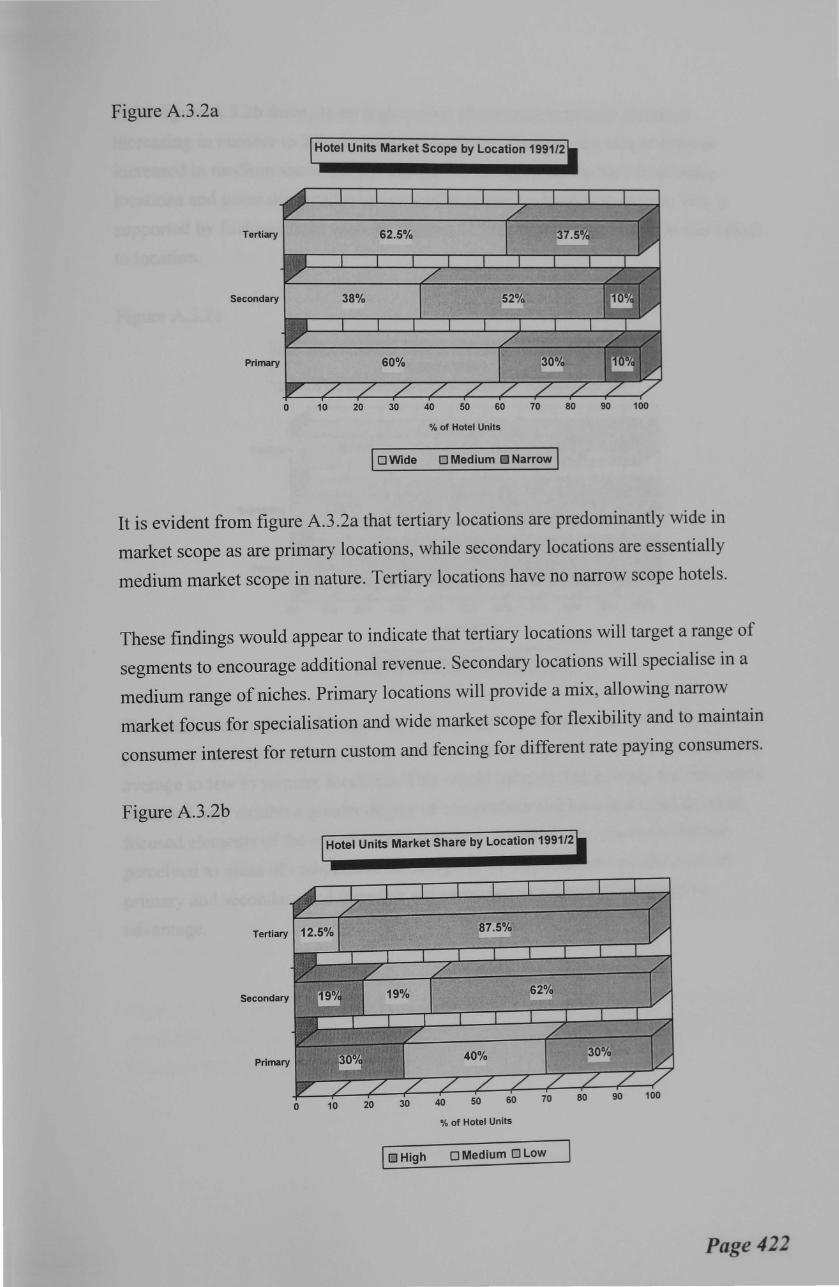
Figure A.3 .2a
Hotel Units Market Scope by Location 1991/2
Tertiary
Secondary
Primary
10 20 30 40 50 60 70 80 90 100
% of Hotel Units
I 0 Wide 0 Medium 0 Narrow I
It is evident from figure A.3 .2a that tertiary locations are predominantly wide in
market scope as are primary locations, while secondary locations are essentially
medium market scope in nature. Tertiary locations have no narrow scope hotels.
These findings would appear to indicate that tertiary locations will target a range of
segments to encourage additional revenue. Secondary locations will specialise in a
medium range of niches. Primary locations will provide a mix, allowing narrow
market focus for specialisation and wide market scope for flexibility and to maintain
consumer interest for return custom and fencing for different rate paying consumers.
Figure A.3.2b
Hotel Units Market Share by Location 1991/2
Secondary
Primary
0 10 20 30 40 50 60 70
% of Hotel Units
I o High 0 Medium 0 Low
Page 422
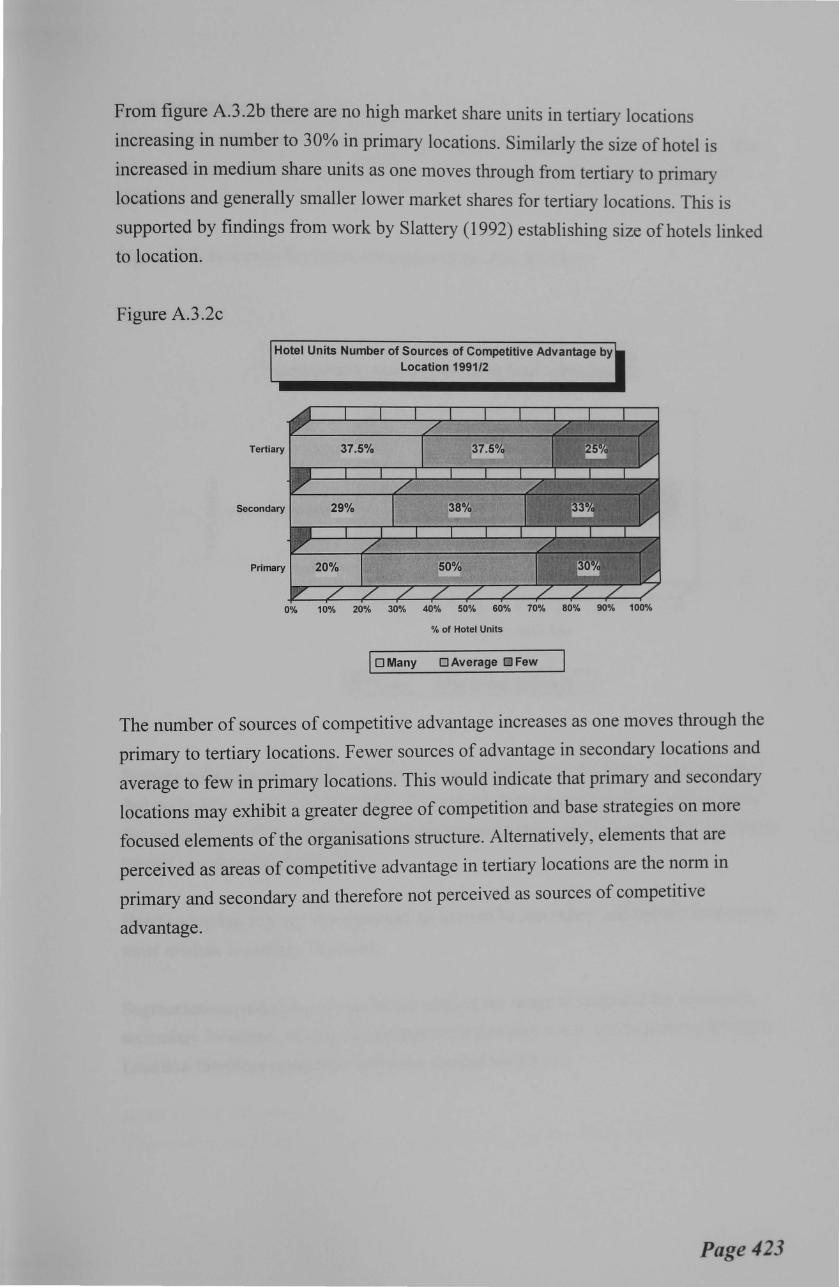
From figure A.3 .2b there are no high market share units in tertiary locations
increasing in number to 30% in primary locations. Similarly the size of hotel is
increased in medium share units as one moves through from tertiary to primary
locations and generally smaller lower market shares for tertiary locations. This is
supported by findings from work by Slattery (1992) establishing size of hotels linked
to location.
Figure A.3.2c
Hotel Units Number of Sources of Competitive Advantage by Location 1991/2
Tertiary
Secondary
0% 10% 20% 30% 40% 50% 60% 70% 80% 90% 100%
% of Hotel Units
I 0 Many 0 Average 0 Few
The number of sources of competitive advantage increases as one moves through the
primary to tertiary locations. Fewer sources of advantage in secondary locations and
average to few in primary locations. This would indicate that primary and secondary
locations may exhibit a greater degree of competition and base strategies on more
focused elements of the organisations structure. Alternatively, elements that are
perceived as areas of competitive advantage in tertiary locations are the norm in
primary and secondary and therefore not perceived as sources of competitive
advantage.
Page 423
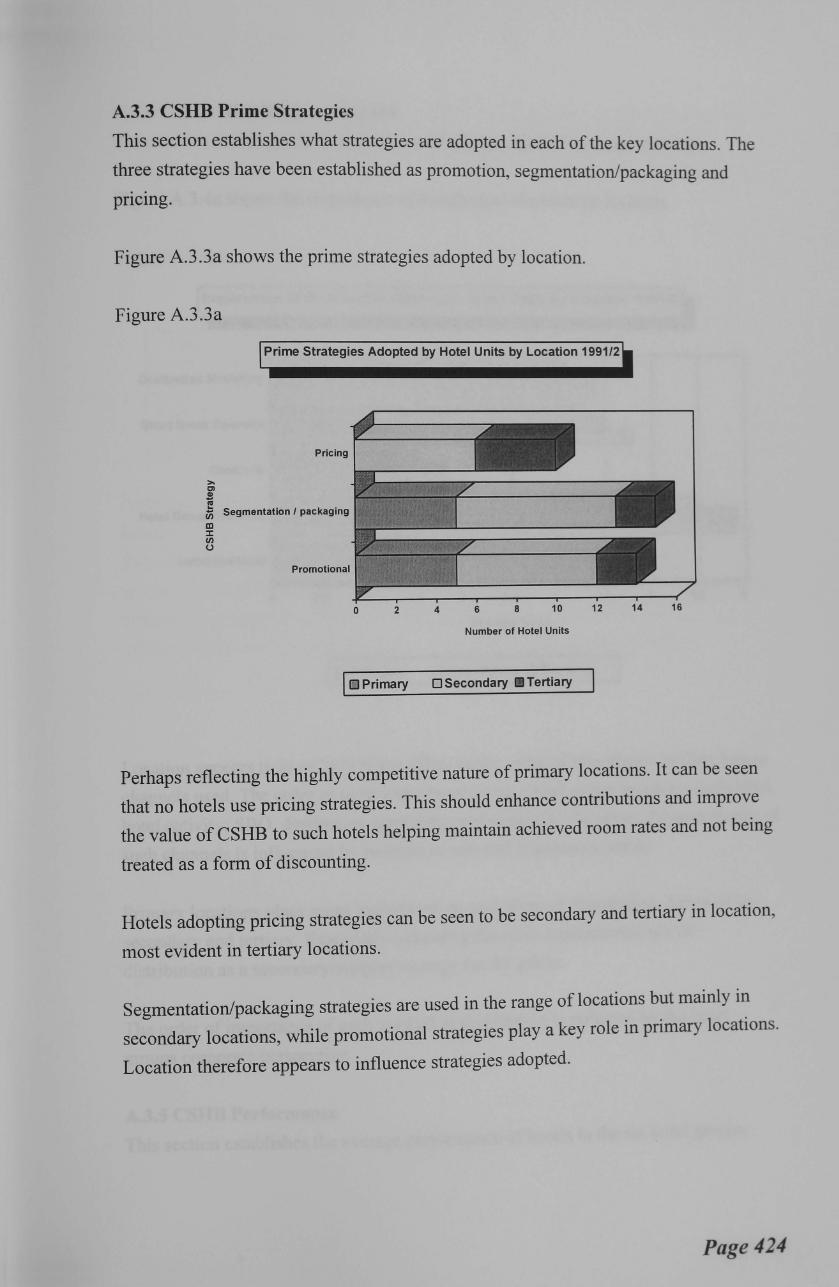
A.3.3 CSHB Prime Strategies
This section establishes what strategies are adopted in each of the key locations. The
t~e~ strategies have been established as promotion, segmentation/packaging and
pnc1ng.
Figure A.3 .3a shows the prime strategies adopted by location.
Figure A.3.3a
Prime Strategies Adopted by Hotel Units by Location 1991/2
>r:n
Pricing
.!l f! (i5 Segmentation I packaging
ID ::t: rn (.)
Promotional
0 2 4 6 8 10
Number of Hotel Units
I I1J Primary OSecondary Tertiary
12 14 16
Perhaps reflecting the highly competitive nature of primary locations. It can be seen
that no hotels use pricing strategies. This should enhance contributions and improve
the value of CSHB to such hotels helping maintain achieved room rates and not being
treated as a form of discounting.
Hotels adopting pricing strategies can be seen to be secondary and tertiary in location,
most evident in tertiary locations.
Segmentation/packaging strategies are used in the range of locations but mainly in
secondary locations, while promotional strategies play a key role in primary locations.
Location therefore appears to influence strategies adopted.
Page 424
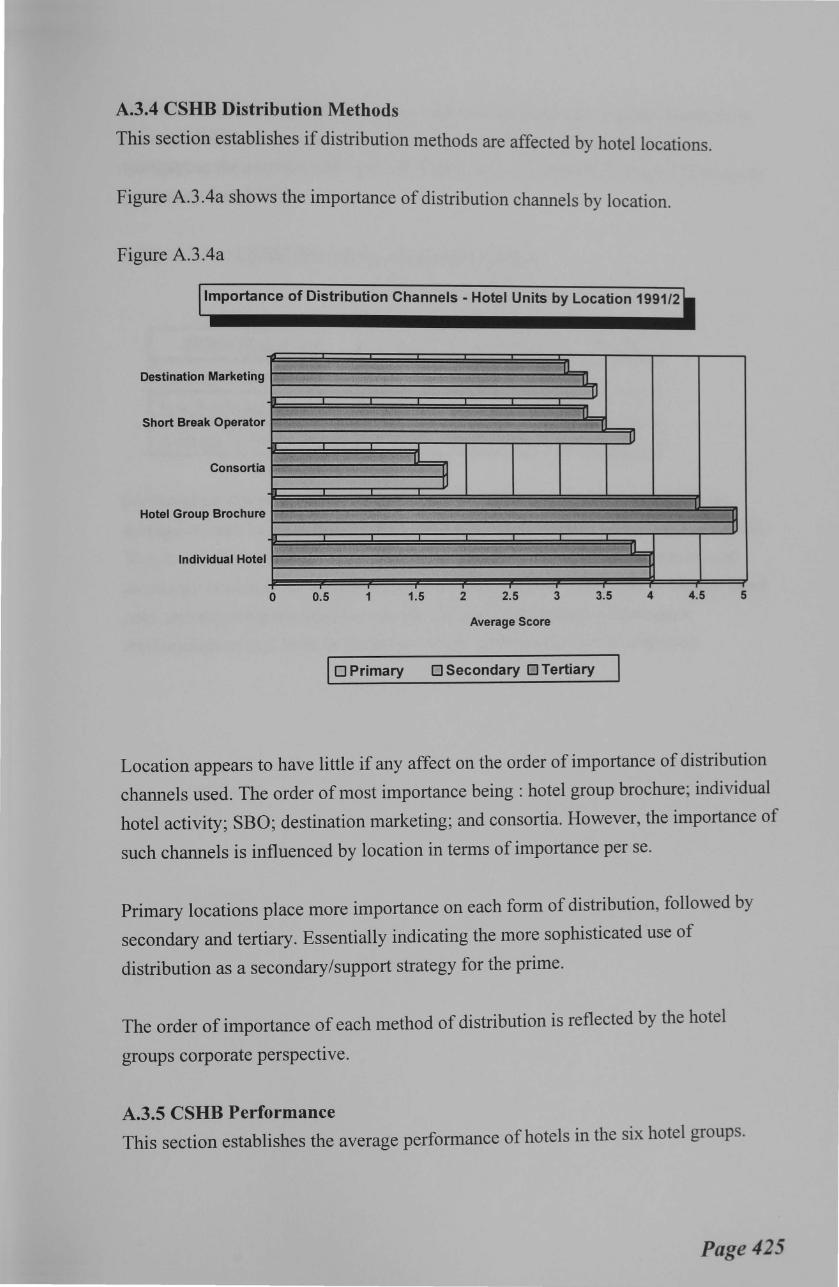
A.3.4 CSHB Distribution Methods
This section establishes if distribution methods are affected by hotel locations.
Figure A.3 .4a shows the importance of distribution channels by location.
Figure A.3.4a
Importance of Distribution Channels- Hotel Units by Location 1991/2
Destination Marketing ll
I! 1J
I! I Short Break Operator
u n
Consortia lJ u
Hotel Group Brochure u IJ
11 Individual Hotel -1
l
0 0.5 1 1.5 2 2.5 3 3.5 4 4.5 5
Average Score
I 0 Primary 0 Secondary 0 Tertiary
Location appears to have little if any affect on the order of importance of distribution
channels used. The order of most importance being : hotel group brochure; individual
hotel activity; SBO; destination marketing; and consortia. However, the importance of
such channels is influenced by location in terms of importance per se.
Primary locations place more importance on each form of distribution, followed by
secondary and tertiary. Essentially indicating the more sophisticated use of
distribution as a secondary/support strategy for the prime.
The order of importance of each method of distribution is reflected by the hotel
groups corporate perspective.
A.3.5 CSHB Performance This section establishes the average performance of hotels in the six hotel groups.
Page 425
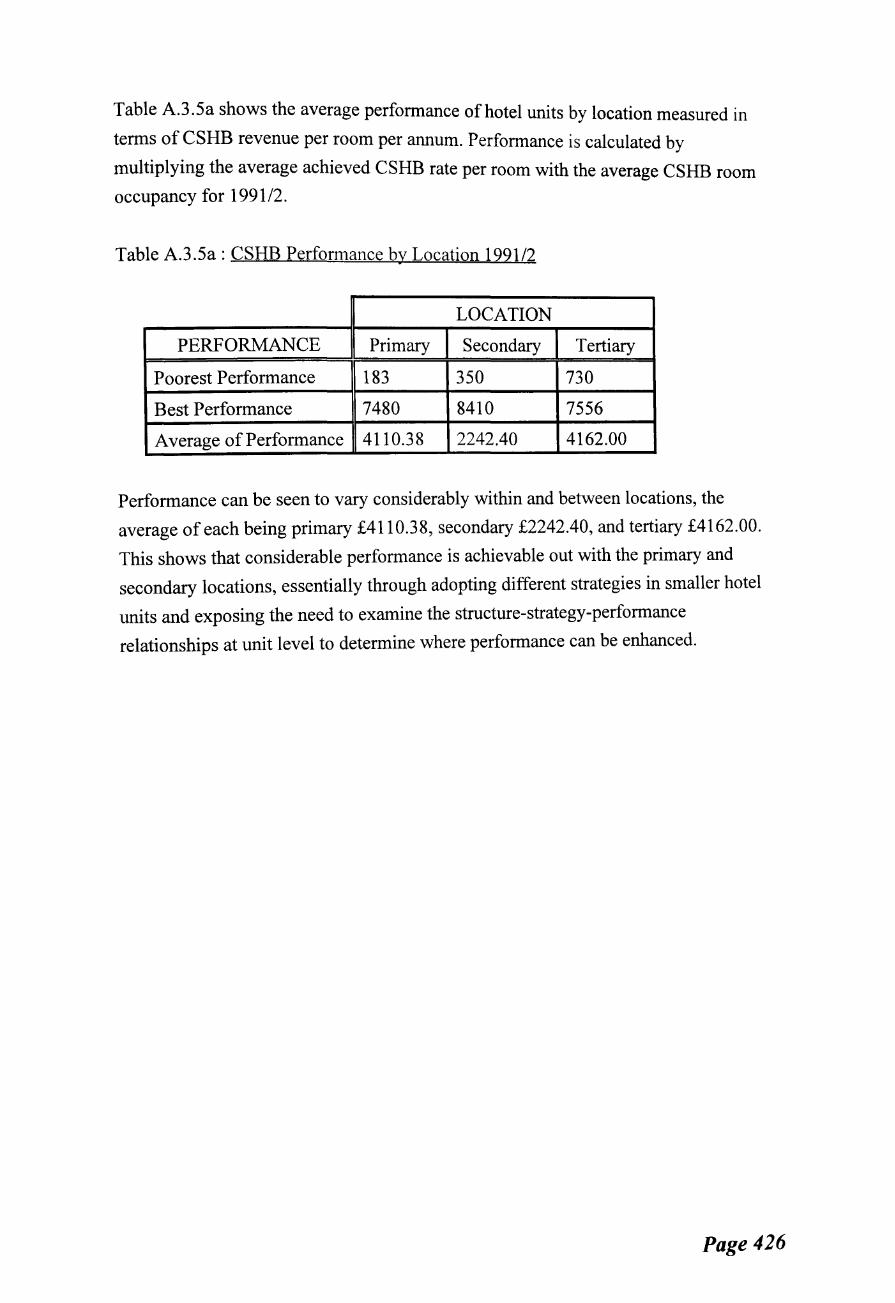
Table A.3.5a shows the average performance of hotel units by location measured in
terms of CSHB revenue per room per annum. Performance is calculated by
multiplying the average achieved CSHB rate per room with the average CSHB room
occupancy for 1991/2.
Table A.3.5a: CSHB Performance by Location 199112
LOCATION
PERFORMANCE Primary Secondary Tertiary
Poorest Performance 183 350 730
Best Performance 7480 8410 7556
Average of Performance 4110.38 2242.40 4162.00
Performance can be seen to vary considerably within and between locations, the
average of each being primary £4110.38, secondary £2242.40, and tertiary £4162.00.
This shows that considerable performance is achievable out with the primary and
secondary locations, essentially through adopting different strategies in smaller hotel
units and exposing the need to examine the structure-strategy-performance
relationships at unit level to determine where performance can be enhanced.
Page 426
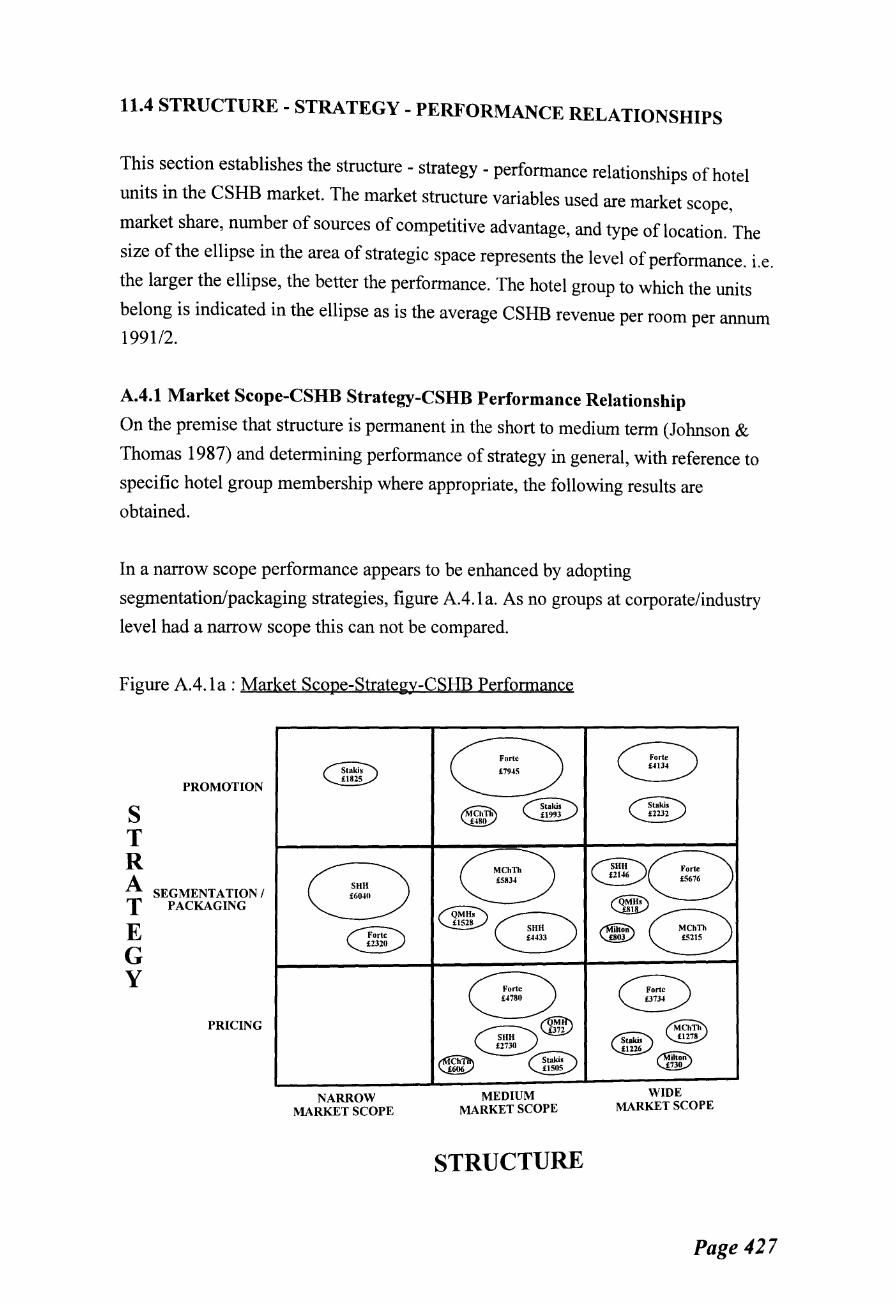
11.4 STRUCTURE- STRATEGY- PERFORMANCE RELATIONSHIPS
This section establishes the structure - strategy - performance relationships of hotel
units in the CSHB market. The market structure variables used are market scope,
market share, number of sources of competitive advantage, and type of location. The
size of the ellipse in the area of strategic space represents the level of performance. i.e.
the larger the ellipse, the better the performance. The hotel group to which the units
belong is indicated in the ellipse as is the average CSHB revenue per room per annum
199112.
A.4.1 Market Scope-CSHB Strategy-CSHB Performance Relationship
On the premise that structure is permanent in the short to medium term (Johnson &
Thomas 1987) and determining performance of strategy in general, with reference to
specific hotel group membership where appropriate, the following results are
obtained.
In a narrow scope performance appears to be enhanced by adopting
segmentation/packaging strategies, figure A.4.1a. As no groups at corporate/industry
level had a narrow scope this can not be compared.
Figure A.4.1a: Market Scope-Strategy-CSHB Performance
s T R
PROMOTION
A SEGMENTATION I T PACKAGING
E G y
PRICING
NARROW MARKET SCOPE
~ ~
MEDIUM MARKET SCOPE
STRUCTURE
~~ ~~ ~
I'MiitOi1\ ~0 ~
WIDE MARKET SCOPE
Page 427
Hotels operating in a medium scope seem to improve for hotels moving from pricing.
through segmentation/packaging to promotion, best seen through Forte moving from
£4780 with pricing to £7945 in promotion, and Stakis with £1505 to £1993. MChTh
seem to perform better with segmentation/packaging strategies, the findings here
being the same as at corporate level. In a medium scope market on the whole
promotional strategies perform best.
When hotel units operate with a wide market scope, best performance is achieved by
moving from a pricing strategy to promotion and then segmentation/packaging. As is
displayed by the improving performance of hotels in groups such as Forte, MChTh,
Milton, and Stakis.
The enhanced performance is reflected at corporate level where performance is best
for groups in a wide market scope adopting a segmentation/packaging strategy.
These structure-strategy-performance linkages at hotel unit level are generally
consistent with the hotel group perspective and as such seem to allow the transfer of
findings from the corporate analysis to the unit level.
A.4.2 Market Share - CSHB Strategy - CSHB Performance Relationship
From figure A.4.2a it can be seen that with a low share, performance for most hotels
improves as the groups move strategy from pricing through segmentation/packaging
and to promotion. This is the same for medium market shares, yet for high market
share segmentation/packaging provides the best performance. The latter being the
only consistent result with the corporate level analysis.
Page 428

Figure A.4.2a : Market Share-Strategy-CSHB Performance
s T R
PROMOTION
A SEGMENTATION I T PACKAGING
E G y
PRICING
~ ~
LOW MARKET SHARE
@g) MChTh ~ ~
0£183 QMH<
~ ~
MEDIUM MARKET SHARE
STRUCTURE
~ ~
~ '-!!!Y
~ ~
@ QMH•
HIGH MARKET SHARE
In terms of specific groups, it can be seen that the further to the top left comer of the
matrix, Forte, Stakis, SHH, and Milton hotel moves the better the performance.
The high market share for QMHs the better performance, and closer to low share and
segmentation/packaging strategies improves performance for MChTh hotels.
A.4.3 Number of Sources of Competitive Advantage-Strategy-Performance
From figure A.4.3a showing the relationship between the number of sources of
competitive advantage-CSHB strategy-CSHB performance it can be seen that hotels
with few sources of advantage and adopting pricing strategies generally perform
better than hotels adopting other strategies with few sources of advantage.
This was also the case at corporate level, although an exception should be noted in the
form of QMHs who perform better in within hotel group terms by adopting
segmentation/packaging strategies. This performance is however considerably poorer
than other groups.
Page 429
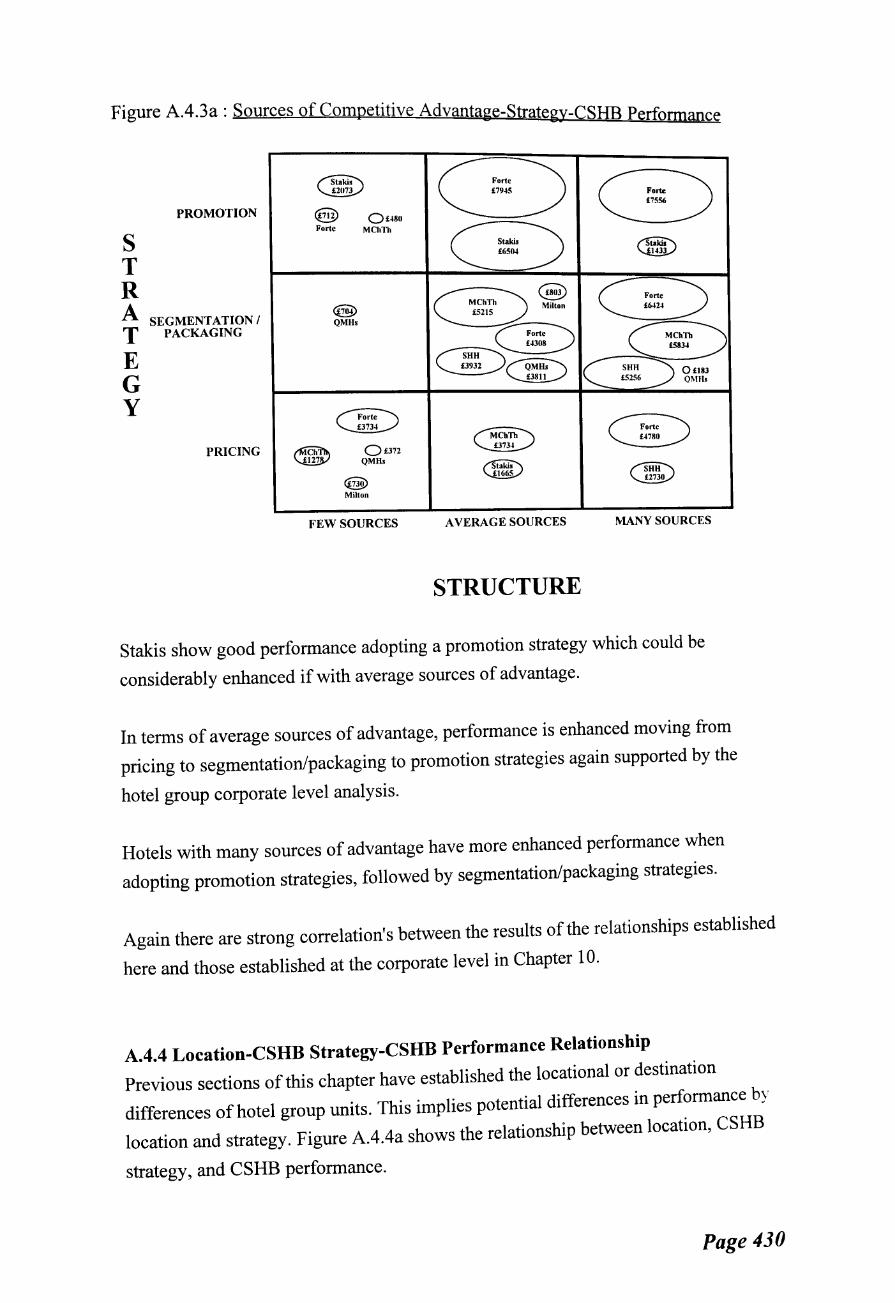
Figure A.4.3a : Sources of Competitive Advantage-Strate -CSHB p gy erformance
s T R
PROMOTION
A SEGMENTATION I T PACKAGING
E G y
PRICING
@ Forte
@ QMHs
Quso MChTh
Oon QMHs
@ Milton
FEW SOURCES AVERAGE SOURCES MANY SOURCES
STRUCTURE
Stakis show good performance adopting a promotion strategy which could be
considerably enhanced if with average sources of advantage.
In terms of average sources of advantage, performance is enhanced moving from
pricing to segmentation/packaging to promotion strategies again supported by the
hotel group corporate level analysis.
Hotels with many sources of advantage have more enhanced performance when
adopting promotion strategies, followed by segmentation/packaging strategies.
Again there are strong correlation's between the results of the relationships established
here and those established at the corporate level in Chapter 10.
A.4.4 Location-CSHB Strategy-CSHB Performance Relationship
Previous sections of this chapter have established the locational or destination
differences of hotel group units. This implies potential differences in performance by
location and strategy. Figure A.4.4a shows the relationship between location, CSHB
strategy, and CSHB performance.
Page 430

Figure A.4.4a : Location-Strategy-CSHB Performance
@:) 6
PROMOTION
s Ouso @ @[) T MChTh
4 56
R ~ ~ ~ A 8
SEGMENTATION I 28 4
T ou~~ PACKAGING QMHs F011e Qi0® aD £5676
E 0
~ 2
(§> ® G
£2146 5 Milton
y @ ~ @ 6
MChTh 9
PRICING ® ® 6 0£372
0
QMHs <§) Milton
PRIMARY SECONDARY TERTIARY LOCATION LOCATION LOCATION
STRUCTURE
In primary locations segmentation/packaging strategies seem to reap the greatest
benefits, while in secondary locations for most hotels moving towards promotional
strategies provides the best performance, a trend supported in tertiary locations.
Location would therefore appear to have some form of strategy-performance linkages.
Page 431

A.5 MULTI-SITE UNIT LEVEL SUMMARY
The multi-site unit level analysis has provided a summary review of the nature of the
CSHB market and structure-strategy-performance relationships at unit level in what is
a multi-site market by nature.
Through applying the CSHB research framework at unit level it has been established
that very similar results are achieved in terms of the relationships between structural
variables of market scope, market share, number of sources of competitive advantage,
CSHB strategies and performance.
In addition it has been established that location appears to affect the performance of
certain strategies in the CSHB market. While the framework has been tested at unit
level and proved successful in the process a number of additional contributions to
knowledge emerged- these are established in Chapter 10.
Page 432
REFERENCES
Ansoff, H.I (1968) "Corporate strategy", New York McGraw-Hill
Banks, R.L; Wheelwright, S.C (1979) "Operations Vs Strategy", Harvard Business Review, May I June pp 127-135
Bradley, M.D; Baron, D.M (1993) "Measuring performance in a multiproduct firm:
an application to the US postal service", Operations Research, 41(3) May
June pp 450-458
Edgar, D.A (1995) "The strategic gap: a short break. multi-site perspective", IAHMS
Conference Proceedings, Norwich, April
Hobbs, J.M; Heany, D.F (1977) "Coupling strategy to operating plans", Harvard Business Review, May I June pp 136-143
Hofer, C.W; Schendel, D.E (1978) "Strategy formulation: analytical concepts",
St.Paul Minnesota West Publishing Company
Johnson, G; Thomas, H (1988) "Strategic groups and financial performance: a
critical examination", In Lewis, P; Thomas, H (1990) Strategic Management Journal, 11 pp 385
Johnson, G; Thomas, H (1987) "The industry context of strategy. structure and
performance", Strategic Management Journal, 8 pp 343-361
Prahalad, C.K (1976) "Strategic choices in diversified MNCs", Harvard Business
Review, July I August pp 73-84
Scott, P.M; Simpson, W.W (1989) "Connecting overall corporate planning to
individual business units", Public Utilities Fortnightly, 123(12) pp 27-30
Slattery, P (1992) "Unaffiliated hotels in the UK", EIU Travel & Tourism Analyst, 1
pp 90-102
Page 433