Identification and characterisation of eight novel SERPINA1 Null mutations
Upload
independentCategory
view
1download
0
Interbank markets and multiplex networks:centrality measures and statistical null models
Leonardo Bargigli, Giovanni di Iasio, Luigi Infante, Fabrizio Lillo and FedericoPierobon
Abstract The interbank market is considered one of the most important channelsof contagion. Its network representation, where banks and claims/obligations arerepresented by nodes and links (respectively), has received a lot of attention in therecent theoretical and empirical literature, for assessing systemic risk and identi-fying systematically important financial institutions. Different types of links, forexample in terms of maturity and collateralization of the claim/obligation, can beestablished between financial institutions. Therefore a natural representation of theinterbank structure which takes into account more features of the market, is a multi-plex, where each layer is associated with a type of link. In this paper we review theempirical structure of the multiplex and the theoretical consequences of this repre-sentation. We also investigate the betweenness and eigenvector centrality of a bankin the network, comparing its centrality properties across different layers and withMaximum Entropy null models.
Leonardo BargigliDipartimento di Scienze per l’Economia e l’Impresa, Universita di Firenze, e-mail: [email protected]
Giovanni di IasioBank of Italy, e-mail: [email protected]
Luigi InfanteBank of Italy, e-mail: [email protected]
Fabrizio LilloScuola Normale Superiore, piazza dei Cavalieri 7, Pisa, Italy e-mail: [email protected]
Federico PierobonEuropean Central Bank, e-mail: [email protected]
1
arX
iv:1
501.
0575
1v1
[q-
fin.
GN
] 2
3 Ja
n 20
15

2 Authors Suppressed Due to Excessive Length
1 Introduction
In part as a consequence of the crisis burst after the Lehman event in late 2008,financial networks are gaining popularity across policymakers, regulators and aca-demics interested in systemic risk analysis. Networks are useful and natural toolsto identify critical financial institutions as well as to understand how distress couldpropagate within the financial system.1 The type of financial network consideredin this paper is the one of direct exposures between financial institutions, whichinclude credit relations, derivatives transactions, cross-ownerships, etc..
Interlinkages between any two financial institutions is more complex than theinformation that can be summarized in a single number (the weight of the link) anda direction, such as in a directed and weighted network. This is due to the fact thatbetween two institutions there exists a multiplicity of linkages, each of them relatedto one class of claims/obligations. The interplay between different types of relationcould be relevant for systemic risk analysis. In the network jargon, such a situationis best modeled with a multiplex network or simply multiplex. A multiplex is madeup with several ”layers”, each of them composed by all relations of the same typeand modeled with a simple (possibly weighted and directed) network. Since thenodes in each layer are the same, the multiplex can be visualized as a stack ofnetworks or equivalently by a network where several different types of links cancoexist between two nodes, each type corresponding to a layer. Figure 1 shows astylized representation of the interbank multiplex, where three layers are explicitlyshown, together with the aggregated interbank network.
The study of financial multiplex is still at its infancy [Montagna and Kok (2013),Bargigli et al. (2014)]. This paper builds on the analysis performed recently by theauthors on the Italian Interbank Market (IIN) (see [Bargigli et al. (2014)]). Takingadvantage of a unique dataset collected by Banca d’Italia, [Bargigli et al. (2014)]analyze in detail the evolution of the multiplex during the crisis (2008-2012).2
In this paper, after a brief description of the [Bargigli et al. (2014)] main findingson the multiplex representation of the interbank market, we add on a novel resultby investigating an important network property, previously not considered, namelythe network centrality of the banks. Node centrality is critical to identify the mostimportant nodes in the network architecture. There are several different definitionsof centrality, depending on the meaning given to the word ”important” above. Here
1 See for instance [Abbassi et al. (2013), Allen and Gale (2000), Battiston et al. (2007),Battiston et al. (2012), Bech and Atalay (2008), Boss et al. (2004), Caccioli et al. (2011),Cont et al. (2011), Fricke and Lux (2013), Gai and Kapadia (2010), Iazzetta and Manna (2009),Iori et al. (2008), Iori et al. (2006), Mastromatteo et al. (2012), Martinez Jaramillo et al. (2012),Soramaki et al. (2007)]2 [Bargigli et al. (2014)] compare the topological proprieties of each layer, study the similarity be-tween layers, i.e. how much one can learn from a layer knowing another one, and use a MaximumEntropy approach to investigate which high order topological properties of each layer can be ex-plained by the statistical properties of degree and strength. In other words, the paper investigateshow much the huge heterogeneity in degree and strength observed in interbank markets signifi-cantly constrains (e.g. for the assortativity) or is a sufficient statistics (e.g. for the core-peripherystructure) other topological properties studied in the recent interbank network literature.

Title Suppressed Due to Excessive Length 3
total%interbank%
long%term%
repo%market%
…………….%
overnight%%
Fig. 1: Stylized representation of the multiplex structure of the interbank market.Each node is a bank, and links represent credit relations. A layer is the set of allcredit relations of the same type. The network in red is the total interbank market,obtained by aggregating all the layers.
we shall consider betweenness centrality and eigenvector centrality, two widespreadcentrality metrics. Our main research questions can be summarized as follows: (i)Given a centrality measure of a node, how much is it correlated with degree andstrength of the node? Is this correlation layer specific? (ii) Is the centrality (abso-lute or rank) of a bank approximately the same in each layer? Or are there bankswhich are very central in some layers but essentially peripheral in the others? (iii)How much the centrality of a node can be explained by a statistical null model thatpreserves nodes’ degree and strength? Is the centrality ranking mostly determinedby the degree (or strength) ranking?
The paper is organized as follows. In Section 2 we present the dataset and in-troduce the construction of our multiplex. In Section 3 we review the main findingsof [Bargigli et al. (2014)] about the Italian Interbank Network. Section 4 introducesseveral types of centrality metrics and presents our results, both on the investiga-tion of the centrality property of a bank in each layer and on the comparison withMaximum Entropy null models. Section 5 concludes.

4 Authors Suppressed Due to Excessive Length
2 Data description
Our analysis investigates a unique database of interbank transactions based on thesupervisory reports transmitted to Banca d’Italia by all institutions operating inItaly (see [Bargigli et al. (2014)] for details). We focus only on domestic links, i.e.transactions between Italian banks. Information refers to end-of-year outstandingbalances at the end of 2008, 2009, 2010, 2011, and 2012. This was a particularlydelicate period for the Italian banking system because of the concurrent sovereigndebt crisis hardly hitting the Euro zone and Italy in particular. Most banks oper-ate in Italy through a large set of subsidiaries. Distinguishing between intragroupand intergroup transactions is therefore crucial. Since interbank lending and bor-rowing decisions are normally taken at the parent company level, we assume thatthe relevant economic agents of the network lie at the group level. We thus focuson data on intergroup transactions consolidated at the group level. As shown in[Bargigli et al. (2014)] this consolidation has a dramatic effect on the volumes andthe network structure. In fact in the investigated dataset and period the intragrouplending accounts for a fraction of the total volume ranging between 78% and 89%.
We represent the interbank market as a weighted and directed network, wherea set of nodes (banks) are linked to each other through different types of financialinstruments (edges). The direction of the link goes from the bank i having a claimto the bank j , and the weight is the amount (in millions of Euros) of liabilities of jtowards i.
One specificity of our database is the availability of other information on theinterbank transactions, namely the maturity and the presence of a collateral. As in[Bargigli et al. (2014)] we use this information to build a multiplex representationof the interbank network, where each layer describes the network of a specific typeof credit relation. Specifically, in terms of maturity we consider
• Overnight (OVN) transactions• Short term (ST) transaction, namely those with maturity up to 12 months exclud-
ing overnight• Long term (LT) transaction, namely those with maturity of more that 12 months
Considering collateralization we distinguish
• Unsecured (U) loans, i.e. without collateral• Secured (S) loans, i.e. with collateral
Thus, for example, the symbol U ST stands for unsecured short term contracts. Wehave in total 5 possible combinations, since there are no secured overnight trans-actions. It is important to stress that our data on secured transactions only refer toOTC contracts, while secured transactions taking place on regulated markets andcentrally cleared are not included in our database.

Title Suppressed Due to Excessive Length 5
3 The multiplex structure of the Italian interbank market
In [Bargigli et al. (2014)] we presented one of the first in-depth analyses of the mul-tiplex structure of an interbank market, investigating in particular the Italian market.Here we summarize our main findings. The first important observation is that in-terbank market is dominated (in volume) by intragroup lending. To give an idea,in 2012 almost 78% of the volume of the Italian interbank market was traded be-tween two banks belonging to the same group, while only 22% was intergroup lend-ing. Since intergroup lending is the main channel of systemic risk propagation, in[Bargigli et al. (2014)] and here we aggregate banks belonging to the same groupand we consider the network of banking groups.
When we consider the volume in the different layers we observed that in 2012the layer with the largest activity was U LT with roughly 41%, followed by OVNwith 28% and U ST with 18%. The two layers describing secured transactions havesmall volumes, namely 9% and 2% in the S ST and S LT , respectively. This is mostlydue to the fact that today the majority of collateralized trades are operated throughCentral Counterparties (CCPs) and these trades are not included in our dataset. Wefound that the three unsecured layers are composed by many nodes, while the twosecured one are much smaller. In 2012 the Italian multiplex had 533 banks, andalmost all of them were active in the three unsecured layers. In all layers there isa strong correlation between the degree of a node (i.e. the number of counterparts)and the its strength (the total volume lent or borrowed). The Spearman correlationbetween these two quantities ranges between 0.49 and 0.94. Moreover degree andstrength are also very correlated (> 0.5) with bank size (as measured by the totalasset). This means that the size of a bank is an important determinant of the amounttraded in the interbank market and of the number of counterparts.
In [Bargigli et al. (2014)] we compared also the topology of each layer individ-ually. All the layers display a scale free property, i.e. the degree distribution hasa power law tail characterized by a tail exponent between 1.8 and 3.5. This indi-cates a very strong heterogeneity of the system, with few important hubs and manylow-degree nodes. Each layer has a small diameter, it is strongly reciprocal, and hasa large clustering coefficient. Finally, it presents a disassortative mixing and has aclear core periphery structure. Below we will discuss on the relevance of these tworelated last findings.
The multiplex structure of the system raises immediately the question of the sim-ilarity between the layers, not in terms of their generic statistical properties, but ona link-by-link basis. In other words, in [Bargigli et al. (2014)] we asked how muchthe presence of a link between two banks in a layer is predictive of the presenceof a link between the same two banks in the other layers. Interestingly, the answeris that layers are quite different one from each other, and the knowledge of thelinks in one layer gives little information about the presence of links in the otherlayers. On average across pairs of layers, the similarity, as measured by the Jac-card similarity, was roughly 17% in 2012. This means that by observing a link in alayer, one can predict that the link exists in another layer only in 17% of the cases.This low level of similarity, combined with the high level of similarity between the

6 Authors Suppressed Due to Excessive Length
same layer in consecutive years (roughly 70%), indicates that banks diversify theircounterparts across different layers, but maintain stable relationships with the samecounterparts in a given layer across the years. From a systemic risk point of view,the dissimilarity between layers tells us that the propagation of contagion can besignificantly faster when one considers the multiplex structure, as compared withthe contagion in individual layers. In fact, simple diffusion models on multiplexnetworks [Gomez et al. (2013)] show that diffusion can be very fast when the layersare ”orthogonal” one to each other. In the second part of this paper we will considera related question, namely how much centrality measures of a node are specific of alayer or whether different nodes are the most central in different layers.
Finally, [Bargigli et al. (2014)] compares the properties of the real multiplex net-work with those obtained under statistical null models, specifically with MaximumEntropy models (see Section 4.2 below). The Maximum Entropy principle allowsto build explicitly probability distributions of graphs, which are maximally randomand satisfy some given constraints. In particular we constrained the ensembles tohave, on average, the same degree and/or strength sequence as the real network. Thischoice corresponds to the (weighted) configuration model. The aim of this analysisis to discriminate which high order properties of the real interbank networks area mere consequence of the heterogeneity of degrees (or strengths) and which areinstead genuinely new properties. We focused on disassortativity, reciprocity, andthe presence of triadic motifs and we discussed which of these properties can bereproduced by the null model. To give a specific, yet important, example of theapplication of Maximum Entropy null models to interbank networks, we discussbriefly the case of the core-periphery structure.
Recently there has been an increasing interest toward the core-periphery struc-ture of the interbank network [Craig and von Peter (2009), Fricke and Lux (2012)].The core is defined as a subset of nodes which are maximally connected withother core members, while the periphery is the complementary subset made ofnodes with no reciprocal connections but having only connections with the core[Borgatti and Everett (2000)]. Recently, [Craig and von Peter (2009)] defined a tier-ing model in which core members without links with the periphery are penalized.Despite the fact that the two definitions of core-periphery are different, because ofthe different objective function, in Appendix 2 of [Bargigli et al. (2014)] we foundthat the two models are highly correlated, i.e. the identified cores are essentiallythe same. The key question now is whether core-periphery is a genuine property ofthe interbank network or if it can be explained by the strong heterogeneity of de-gree. To this end in [Bargigli et al. (2014)] we generated random sample from theMaximum Entropy ensemble where we fix either the average degree or the averageweight of each node. By comparing the core-periphery subdivision in the real net-work or in the random samples, we conclude that they are very similar one to eachother3. Thus core-periphery subdivision (at least by using the aforementioned defi-nitions) is a consequence of the large heterogeneity of degree. Since, as mentioned
3 It is worth noticing that this can also be explained by using the result of [Lip (2011)],showing analytically that the subdivision in core and periphery according to the definition of[Borgatti and Everett (2000)] is entirely determined by the degree sequence.

Title Suppressed Due to Excessive Length 7
above, degree and bank size are strongly correlated, we conclude that in great partcore-periphery structure is a consequence of the existence of large and small banks.
4 Centrality measures
Centrality is a key concept of network theory, originally developed in social net-work analysis and rapidly developed to other types of networks. Broadly speaking,the centrality of a node (or of an edge) of a network is a measure of the importanceof the node, measuring, for example, how influential is a person in a social network,how critical is an element in an infrastructure network, what is the disease spreadingcapacity of an individual, etc.. Despite being an important concept, the loose defi-nition given above leads to several different proposed centrality measures, each ofthem able to capture some specific aspects of the concept of centrality. The reviewof all the centrality measures is beyond the scope of this paper. In the following wewill discuss the three measures of node centrality we are going to use in the analysisof the different layers of the IIN.
Degree centrality. Degree of a node is an obvious measure of centrality. A largenumber of links, in fact, is a symptom of the fact that the node is important for theconnection of all the nodes which are linked to it. It is a local measure, i.e. it doesnot take into account the whole network, but only the local neighborhood of thenode. Thus, while for small networks degree is a sensible centrality measure, forlarge networks it can miss important global characteristics of the importance of thenode.
Betweenness centrality. One of the most popular global centrality measures isthe betweenness centrality (often shortened as betweenness in the following). Itquantifies how frequently a node acts as a bridge along the shortest path betweentwo other nodes. More formally, betweenness centrality of a node v is computed inthe following way: for each pair of vertices (i, j) one identifies the Ni j shortest pathsbetween them and computes the number Ni j(v) of them that pass through v. Thebetweenness of node v is
CB(v) =1
(n−1)(n−2) ∑i, j 6=v
Ni j(v)Ni j
, (1)
i.e. the average fraction of shortest paths passing through v, where the average istaken across all the pairs of vertices. The number of nodes in the network is n and thenormalization factor in equation 1, and used in this paper, holds for directed graphs.Intuitively CB(v) measures how frequently a shortest path between two nodes passesthrough a given node.
Eigenvector centrality. Eigenvector centrality is defined in terms of the adja-cency matrix A = {ai j}, where ai j can be either a binary or a non negative real value(weighted matrix). The vector x= (x1, ....,xn)
′, containing the eigenvector centralityxi of node i, satisfies

8 Authors Suppressed Due to Excessive Length
10-3 10-2 10-1
10-1
100
α=1.63
Nt/N=0.13
10-2 10-110-2
10-1
100
α=1.76
Nt/N=0.13
Fig. 2: Complementary cumulative distribution function of betweenness in the unse-cured overnight layer (left panel) and in the unsecured long term layer (right panel)in 2012. The plot is in double logarithmic scale and the green line is the best fit witha power law function. The tail exponent α is reported in the panels.
Ax = λmaxx (2)
i.e. it is a right eigenvector of the adjacency matrix corresponding to the maximaleigenvalue λ max. Interpreting the network as a representation of a Markov chain withn states and transition probabilities proportional to the weights of the links connect-ing two nodes (states), it can be seen that the vector x is the stationary probabilitydistribution of the chain. Interestingly the eigenvector centrality is at the heart ofGoogle’s PageRank algorithm. In the context of systemic risk, it has been recentlymodified to define DebtRank [Battiston et al. (2012)] for measuring the centralityof the network of mutual exposures and BankRank [Dehmamy et al. (2014)] formeasuring the centrality of the bipartite network of banks and assets. In the presentpaper we will use the original definition of eigenvector centrality of Eq. 2.
4.1 Centrality measures in the interbank multiplex
The aim of this subsection is to compare the centrality measures in different layersof the interbank network. The comparison of the degree of a bank in different layershas been investigated in depth in [Bargigli et al. (2014)], also with respect to nullmodels that preserve the degree in average (configuration model). For this reason inthe paper we will consider mostly betweenness and eigenvector centrality.
As a preliminary analysis, figure 2 shows the distribution of betweenness in twoimportant layers, overnight and unsecured medium term in 2012 (similar results areobtained for the other investigated years). The distribution is well fit by a power lawfunction with a tail exponent between 1.5 and 2. This fat tail behavior shows thatthere is a large heterogeneity of the betweenness centrality among the banks in alllayers. In part this heterogeneity in the value of the betweenness is due to the scale
Title Suppressed Due to Excessive Length 9
10-7 10-6 10-5 10-4 10-3 10-2 10-1 100
Betweenness
100
101
102
103
outd
egre
e
ρ=0.97
ρs =0.59
(a) out-degree
10-7 10-6 10-5 10-4 10-3 10-2 10-1 100
Betweenness
100
101
102
103
indegre
e
ρ=0.85
ρs =0.66
(b) in-degree
10-7 10-6 10-5 10-4 10-3 10-2 10-1 100
Betweenness
10-2
10-1
100
101
102
103
104
outs
trength
ρ=0.35
ρs =0.38
(c) out-strength
10-7 10-6 10-5 10-4 10-3 10-2 10-1 100
Betweenness
10-3
10-2
10-1
100
101
102
103
104
inst
rength
ρ=0.92
ρs =0.5
(d) in-strength
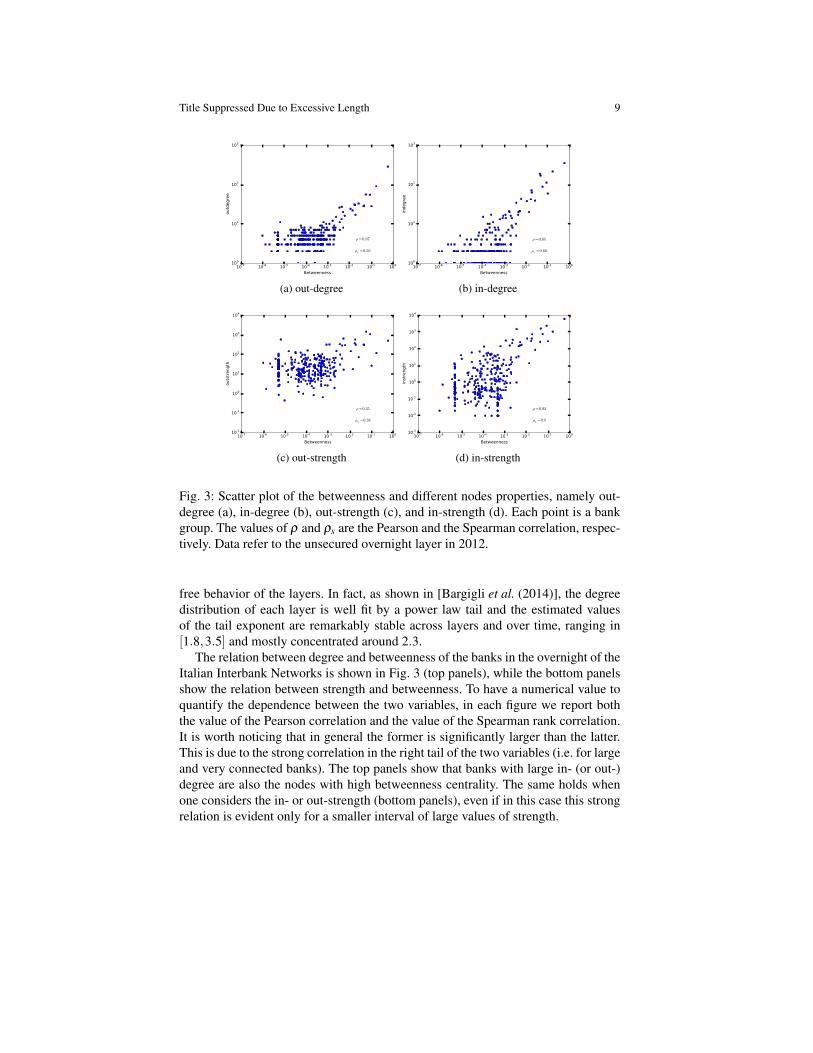
Fig. 3: Scatter plot of the betweenness and different nodes properties, namely out-degree (a), in-degree (b), out-strength (c), and in-strength (d). Each point is a bankgroup. The values of ρ and ρs are the Pearson and the Spearman correlation, respec-tively. Data refer to the unsecured overnight layer in 2012.
free behavior of the layers. In fact, as shown in [Bargigli et al. (2014)], the degreedistribution of each layer is well fit by a power law tail and the estimated valuesof the tail exponent are remarkably stable across layers and over time, ranging in[1.8,3.5] and mostly concentrated around 2.3.
The relation between degree and betweenness of the banks in the overnight of theItalian Interbank Networks is shown in Fig. 3 (top panels), while the bottom panelsshow the relation between strength and betweenness. To have a numerical value toquantify the dependence between the two variables, in each figure we report boththe value of the Pearson correlation and the value of the Spearman rank correlation.It is worth noticing that in general the former is significantly larger than the latter.This is due to the strong correlation in the right tail of the two variables (i.e. for largeand very connected banks). The top panels show that banks with large in- (or out-)degree are also the nodes with high betweenness centrality. The same holds whenone considers the in- or out-strength (bottom panels), even if in this case this strongrelation is evident only for a smaller interval of large values of strength.

10 Authors Suppressed Due to Excessive Length
This analysis shows that large (and/or more interconnected) banks are also typ-ically those more central (as measured by the betweenness)4. Thus, at least in theItalian Interbank Market, it is hard to discriminate between too big to fail and toointerconnected to fail. Considering medium and small sized banks, the relation be-tween centrality and degree and especially size becomes significantly noisier, andby looking at figure 3, it is possible to identify banks with moderate strength butsignificant centrality. These institutions are likely playing a central role in interme-diation in the considered layer or connecting subsets of banks which are only weaklyconnected.
We then investigate whether banks which are central in a given layer are alsocentral in other layers. This is important because it gives insight on the degree ofspecialization of some banks as intermediary for some type of credit. To answer thisquestion we compute centrality measure in different layers and compare the values(or the ranking) We remind that the number of banks active in the different layersis different [Bargigli et al. (2014)]. For example, in 2012, of the 533 banks activein the interbank market, 532 had credit relations in the overnight market, 521 wereactive in the unsecured short term, 450 in the unsecured long term, and 45 in thesecured short term. In order to compare layers with different number of nodes, wecomputed the centrality measures in the whole layer (i.e. including all the banksactive in the layer), but we compared the centrality measures only within the subsetof banks which were active in both layers. Therefore, when considering rankings,it should be kept in mind that these are not absolute rankings, but only rankingsamong the banks considered in the intersection.
Figure 4 shows the scatter plot of the betweenness in the overnight market ei-ther versus the betweenness in the unsecured long term (left panel) or versus thebetweenness in the unsecured long term (right panel) market. In the figure we alsoreport the value of the Pearson and Spearman correlation and, as explained above,the former is typically much higher of the latter due to the high correlation on thetop left part of the scatter plot.
Comparing the short term and overnight layers (left panel), it is evident that topcentral nodes in one layer are also typically central in the other layer. For mediumand low centrality, the correlation is much weaker. On the contrary, the right panelshows that, with the exception of three banks on the top right corner of the figure,there is a very weak correlation between the centrality in the overnight network andin the long term network. This is an indication that in some cases, centrality of abank, also with respect to the other banks, can be markedly different in differentlayers. Therefore central banks in the long term layer are not necessarily central inthe overnight or in the short term layer.
Similar conclusions can be drawn by considering the eigenvector centrality. Fig-ure 5 shows the scatter plot between the eigenvector centrality and in- and out-degree (top panels) and in- and out-strength (bottom panels). The correlation aresignificantly smaller when compared to those of the betweenness centrality (see Fig.
4 As mentioned in Section 3, [Bargigli et al. (2014)] show that nodes’ properties (degree andstrength) turn out to be correlated with balance sheet data of banks, in particular with the totalassets.

Title Suppressed Due to Excessive Length 11
10-7 10-6 10-5 10-4 10-3 10-2 10-1 100
Overnight
10-7
10-6
10-5
10-4
10-3
10-2
10-1
100
Short
term
ρ=0.99
ρs =0.35
(a)
10-7 10-6 10-5 10-4 10-3 10-2 10-1 100
Overnight
10-7
10-6
10-5
10-4
10-3
10-2
10-1
100
Long t
erm
ρ=0.96
ρs =0.23
(b)
Fig. 4: Scatter plot of the betweenness in the unsecured overnight versus that in theunsecured short term layer. The year investigated is 2012. The values of ρ and ρsare the Pearson and the Spearman correlation, respectively.
3). In this sense eigenvector centrality (and probably DebtRank) brings informationon the importance of a bank which is not contained already in the basic measures ofdegree and strength.
Finally, in figure 6 we show the three dimensional plots of the eigenvector cen-trality in the three unsecured layers, namely overnight, short term, and long term.We show the results for the four years because we find a different behavior in thedifferent years. In all years we find a very large dispersion of points, indicating thatthe eigenvector centrality in the three considered layers is very different. Thus theimportance of a node, as measured by the eigenvector centrality, is typically quitelayer specific.
4.2 Comparison with null models
As a last analysis, we compare our findings on the centrality metrics with suitablestatistical null models. In the last two decades complex network theory has intro-duced a large number of metrics able to capture many interesting aspects of theorganization of networks, such as clustering, assortativity, core-periphery structure,etc. However, from a statistical point of view, it is not always clear which of theseproperties carry some information which is not already contained, in some form,in simpler properties of the network. For example, one could ask whether the core-periphery organization observed in many networks (included the interbank ones) isnot a mere consequence of the large heterogeneity in degree of the considered net-work. In fact, in a network with heterogeneous degree distribution, a core peripheryemerges even if the links among nodes are assigned randomly.

12 Authors Suppressed Due to Excessive Length
10-19 10-17 10-15 10-13 10-11 10-9 10-7 10-5 10-3 10-1
Right eigenvector
100
101
102
103
outd
egre
e
ρ=0.17
ρs =0.32
(a) out-degree
10-19 10-17 10-15 10-13 10-11 10-9 10-7 10-5 10-3 10-1
Right eigenvector
100
101
102
103
indegre
e
ρ=0.17
ρs =0.59
(b) in-degree
10-19 10-17 10-15 10-13 10-11 10-9 10-7 10-5 10-3 10-1
Right eigenvector
10-2
10-1
100
101
102
103
104
outs
trength
ρ=0.61
ρs =0.3
(c) out-strength
10-19 10-17 10-15 10-13 10-11 10-9 10-7 10-5 10-3 10-1
Right eigenvector
10-3
10-2
10-1
100
101
102
103
104
inst
rength
ρ=0.11
ρs =0.86
(d) in-strength
Fig. 5: Scatter plot of the eigenvector centrality and different nodes properties,namely out-degree (a), in-degree (b), out-strength (c), and in-strength (d). Eachpoint is a bank group. The values of ρ and ρs are the Pearson and the Spearmancorrelation, respectively. Data refer to the unsecured overnight layer in 2012.
To properly answer to these questions one needs to build statistical models ofnetworks, which allow computing a probability distribution of graphs. Such a dis-tribution is calibrated on the investigated real network, and it is chosen in such away to preserve some low order properties (e.g. the degree of each node). Then onecomputes, analytically or computationally, the distribution of the considered highorder property (e.g. the size of the core) and extracts from it a p-value for the valueobserved in the real data.
One of the most common methods for building null models is by using the Maxi-mum Entropy Principle.5 One looks for the probability distribution for graphs, P(G),which maximizes the Shannon entropy
5 See for instance [Bargigli (2013), Bargigli and Gallegati (2011), Fagiolo et al. (2013),van Lelyveld and In ’t Veld (2012), Mistrulli (2011), Park and Newman (2004),Squartini and Garlaschelli (2011)].

Title Suppressed Due to Excessive Length 13
Overnight
14 12 10 8 6 4 2 0 2
Short te
rm
1614
1210
86
420
2
Long t
erm
25
20
15
10
5
0
5
2009
(a) 2009
Overnight
1210
86
42
02
Short te
rm
1210
86
42
02
Long t
erm
50
40
30
20
10
0
10
2010
(b) 2010
Overnight
14 12 10 8 6 4 2 0 2
Short te
rm
20
15
10
50
5
Long t
erm
16141210
8
6
4
2
0
2
2011
(c) 2011
Overnight
16 14 12 10 8 6 4 2 0 2
Short te
rm
20
15
10
50
5
Long t
erm
25
20
15
10
5
0
5
2012
(d) 2012
Fig. 6: Three dimensional scatter plot of the decimal logarithm of the eigenvectorcentrality in the three unsecured layers in the period 2009-2012.
S[P(G)] =−∑G
P(G) lnP(G) (3)
under suitable constraints, including the normalization ∑G P(G) = 1. More detailson the construction and estimation of Maximum Entropy models for networks arereviewed in Appendix 4 of [Bargigli et al. (2014)].
Here we consider the so called Directed Binary Configuration Model (DBCM)(see [Bargigli et al. (2014)]). In this case we impose 2n constraints, namely the av-erage in- and out-degree of each node. This model can be fitted from a real networkusing Maximum Likelihood and one can then sample from a graph distribution ofa DBCM calibrated on the a real network. We can compute the distribution of thebetweenness centrality for each node of the network under the DBCM. We thencompute the p-value of the betweenness centrality of each node observed in the realnetwork.
Figure 7 shows the scatter plot of the betweenness centrality in the real networkversus the one simulated in the DBCM. As a first observation we note that thereis a significantly high Pearson and Spearman correlation between the betweenness

14 Authors Suppressed Due to Excessive Length
10-6 10-5 10-4 10-3 10-2 10-1
Real
10-4
10-3
10-2
10-1
Sim
ula
ted
ρ=0.98
ρs =0.78
(a) Overnight
10-5 10-4 10-3 10-2 10-1
Real
10-4
10-3
10-2
10-1
Sim
ula
ted
ρ=0.98
ρs =0.72
(b) Short term
10-5 10-4 10-3 10-2 10-1
Real
10-4
10-3
10-2
10-1
Sim
ula
ted
ρ=0.98
ρs =0.7
(c) Long term
Fig. 7: Scatter plot of the betweenness centrality in the real network and in the onesimulated from the Maximum Entropy (ME) ensemble corresponding to the directedconfiguration model. Larger circles correspond to nodes for which the (ME) nullmodel is rejected with 1% confidence. The values of ρ and ρs are the Pearson andthe Spearman correlation, respectively. Data refer to 2012.
in the real and simulated network. In this sense we can conclude that a significantfraction of the betweenness centrality property of a node is a consequence of thedegree distribution. This observation is in agreement with the empirical observationdescribed above that betweenness centrality is very correlated with degree. Howeverdeviations from the null model can be identified by computing for each node thep−value, comparing the centrality in the real network with the values obtained by alarge sample of network realization. In figure 7 larger circles correspond to nodes forwhich the (ME) null model is rejected with 1% confidence. Interestingly, the nodesfor which betweenness centrality is larger than what expected from their degree (andthe Maximum Entropy null model) are mostly large banks.

Title Suppressed Due to Excessive Length 15
5 Conclusions
This paper reviews the multiplex description of the interbank market proposed in[Bargigli et al. (2014)]. In this description, each layer is a network of interbank ex-posures characterized by the maturity and the presence of a collateral. By using anunique dataset of the Italian Interbank market, we discuss the main findings relatedto (i) the similarity of the topological properties of the different layers, (ii) the link-by-link similarity of pairs of layers and (iii) the use of Maximum Entropy approachfor the construction of layer-specific null models.
The main original contribution of the paper is the investigation of two centralitymeasures, namely betweenness and eigenvector centrality, in the multiplex describ-ing the Italian Interbank market. We found that the correlation between the centralityof a bank in different layer is significant, but not extremely large. There are severalmedium sized banks which are central in some layers and peripheral in others. Verylarge banks are typically central in all layers, but this can be due - at least partially- to the constraint given by their typically large degree. Interestingly, the centralityof large banks is not explained by Maximum Entropy null models preserving thedegree of each node. This indicates deviations from centrality measure expected bythe degree distribution. Finally, betweenness centrality is more correlated with de-gree than eigenvector centrality. This finding seems to indicate that the eigenvectorcentrality is less affected by information already contained in the degree, strength,and bank size.
Acknowledgements The views expressed in the article are those of the authors only and do notinvolve the responsibility of the Bank of Italy. This paper should not be reported as representing theviews of the European Central Bank (ECB). The views expressed are those of the authors and donot necessarily reflect those of the ECB. The research leading to these results has received fundingfrom the European Union, Seventh Framework Programme FP7/2007- 2013 under grant agree-ment CRISIS-ICT-2011-288501 and from the INET-funded grant New tools in Credit NetworkModeling with Heterogeneous Agents. L. Infante contributed while visiting the NYU Departmentof Economics.
References
Abbassi et al. (2013). Abbassi, P., Co-Pierre, G. and Gabrieli, S., A Network View on MoneyMarket Freezes, 2013, mimeo.
Allen and Gale (2000). Allen, F. and Gale, D., Financial contagion.Journal of Political Economy,2000, 108, 1–33.
Bargigli (2013). Bargigli, L., Statistical Ensembles for Economic Networks. Journal of StatisticalPhysics, March 2014.
Bargigli and Gallegati (2011). Bargigli, L. and Gallegati, M., Random digraphs with given ex-pected degree sequences: A model for economic networks.Journal of Economic Behavior &Organization, 2011, 78, 396 – 411.
Bargigli et al. (2014). Bargigli, L., Di Iasio, G., Infante, L., Lillo, F., Pierobon, F., The multiplexstructure of interbank networks, Quantitative Finance, (in press, 2015).

16 Authors Suppressed Due to Excessive Length
Battiston et al. (2007). Battiston, S., Delli Gatti, D., Gallegati, M., Greenwald, B.C. and Stiglitz,J.E., Credit chains and bankruptcy propagation in production networks. Journal of EconomicDynamics & Control, 2007, 31, 2061 – 2084.
Battiston et al. (2012). Battiston, S., Delli Gatti, D., Gallegati, M., Greenwald, B.C. and Stiglitz,J.E., Liaisons dangereuses: Increasing connectivity, risk sharing, and systemic risk. Journal ofEconomic Dynamics & Control, 2012, 36, 1121 – 1141.
Battiston et al. (2012). Battiston, S., Puliga, M., Kaushik, R., Tasca, P., Caldarelli, G. DebtRank:Too Central to Fail? Financial Networks, the FED and Systemic Risk. Scientific Reports2,541, 2012.
Bech and Atalay (2008). Bech, M. L. and Atalay, E., The topology of the federal funds market.Staff Reports 354, Federal Reserve Bank of New York, 2008.
Borgatti and Everett (2000). Borgatti, S. P., and Everett, M. G., Models of core/periphery struc-tures. Social Networks, 2000, 21, 375–395.
Boss et al. (2004). Boss, M., Elsinger, H., Summer, M., and Thurner, S., Network topology of theinterbank market.Quantitative Finance, 2004, 4, 677–684.
Caccioli et al. (2011). Caccioli, F., Catanach, T.A., Doyne Farmer, J., Heterogeneity, correlationand financial contagion. 2011, arXiv:1109.1213v1.
Cont et al. (2011). Cont, R., Moussa, A. and Santos, E.B., Network Structure and Systemic Riskin Banking Systems. In Handbook of Systemic Risk, edited by J.P. Fouque and J. Langsam,2012 (Cambridge University Press).
Craig and von Peter (2009). Craig, B.R. and von Peter, G., Interbank tiering and money centerbanks. Working Paper 0912, Federal Reserve Bank of Cleveland, 2009.
Dehmamy et al. (2014). Dehmamy, N., Buldyrev, S.V., Havlin, S., Stanley, H.E., Vodenska, I.Classical mechanics of economic networks, http://arxiv.org/abs/1410.0104, 2014.
Fagiolo et al. (2013). Fagiolo, G., Squartini, T. and Garlaschelli, D., Null models of economicnetworks: the case of the world trade web. Journal of Economic Interaction and Coordination,2013, 8, 75–107.
Fricke and Lux (2012). Fricke, D., Lux, T., Core-periphery structure in the overnight money mar-ket: Evidence from the e-mid trading platform. Kiel Working Papers 1759, Kiel Institute forthe World Economy, March 2012.
Fricke and Lux (2013). Fricke, D. and Lux, T., On the distribution of links in the interbank net-work: evidence from the e-mid overnight money market. Kiel Working Papers 1819, KielInstitute for the World Economy, 01/2013.
Gai and Kapadia (2010). Gai, P. and Kapadia, S., Contagion in Financial Networks. Proceedingsof the Royal Society A, 2010, 466, 2401–2423.
Gomez et al. (2013). Gomez, S., Diaz-Guilera, A., Gomez-Gardenes, J., Perez-Vicente, C.J.,Moreno, Y. and Arenas, A., Diffusion dynamics on multiplex networks. Physical Review Let-ters, 2013, 110, 028701.
Iazzetta and Manna (2009). Iazzetta, C. and Manna, M., The topology of the interbank market:Developments in Italy since 1990. Temi di discussione, 711, Banca d’Italia, 2009.
Iori et al. (2008). Iori, G., De Masi, G., Precup, O.V., Gabbi, G. and Caldarelli, G., A networkanalysis of the Italian overnight money market. Journal of Economic Dynamics and Control,2008, 32, 259–278.
Iori et al. (2006). Iori, G., Jafarey, S., Padilla, F.G., Systemic risk on the interbank market. Journalof Economic Behavior and Organization, 2006, 61, 525–542.
Mastromatteo et al. (2012). Mastromatteo, I., Zarinelli, E., Marsili, M., Reconstruction of finan-cial networks for robust estimation of systemic risk. Journal of Statistical Mechanics: Theoryand Experiment 3, 11,2012.
van Lelyveld and In ’t Veld (2012). van Lelyveld, I., In ’t Veld, D., Finding the core: Networkstructure in interbank markets. DNB Working Papers 348, Netherlands Central Bank, Re-search Department, July 2012.
Lip (2011). Lip, S. Z. W., A fast algorithm for the discrete core/periphery bipartitioning Problem.ArXiv e-prints, February 2011.

Title Suppressed Due to Excessive Length 17
Martinez Jaramillo et al. (2012). Martinez Jaramillo, S., Alexandrova-Kabadjova, B., Bravo-Benitez, B. and Solorzano-Margain, J.P., An empirical study of the Mexican banking system’snetwork and its implication for systemic risk. Banco de Mexico, Working Paper, 2012-07.
Mistrulli (2011). Mistrulli, P., Assessing financial contagion in the interbank market: Maximumentropy versus observed interbank lending patterns. Journal of Banking & Finance, 2011,35, 1114 – 1127.
Montagna and Kok (2013). Montagna, M. and Kok, C., Multi-layered interbank model for assess-ing systemic risk. Technical report, Kiel Working Paper, 2013.
Park and Newman (2004). Park, J. and Newman, M. E. J., Statistical mechanics of networks.Phys. Rev. E, 2004, 70, 066117.
Soramaki et al. (2007). Soramaki, K., Bech, M.L., Arnold, J., Glass, R.J., and Beyeler, W.E., Thetopology of interbank payment flows. Physica A: Statistical Mechanics and its Applications,2007, 379, 317 – 333.
Squartini and Garlaschelli (2011). Squartini, T. and Garlaschelli, D., Analytical maximum-likelihood method to detect patterns in real networks. New Journal of Physics, 2011, 13,083001.
Copyright © 2022 FDOKUMEN