Automated DNA profiling employing multiplex amplification of short tandem repeat loci
11
Automated D.NA Profilo g S Employing Multiplex Amplification hort Tandem Repeat Loci Colin P. Kimpton, Peter Gill, Abbie Walton, Andy Urquhart, Emma S. Millican, and Maia Adams Central Research and Support Establishment, Forensic Science Service, Aldermaston, Reading, Berks RG7 4PN, United Kingdom We have employed automated fluo- rescence-based technology to detect amplified tri-, tetra-, and pentanu- cleotide short tandem repeat (STR) loci electrophoresed on denaturing polyacrylamide sequencing gels. The system described incorporates an in- ternal size standard in each sample, allowing the STR-PCR products to he sized automatically with a high de- gree of precision. By utilizing differ- ent fluorescent dye markers for loci that have overlapping allele size ranges, we have developed three multiplex STR systems containing a total of 14 different loci. These mul- tiplex systems were then used to eval- uate the usefulness of the 14 loci for the identification of individuals. Al- lele frequency data were collected from a minimum of SO individuals from each of three different racial groups: Caucasians, Afro-Caribbeans, and Asians. Of the resulting 42 locus population sets, deviation from Hardy-Weinberg equilibria was de- tected in only the STR HUMCYARO3- Caucasian data. The probabilities of two unrelated individuals matching by chance (pM) at all 14 loci in the three multiplex reactions was <1 x 10 -14. The combination of mul- tiplex STR-PCR and automatic fluo- rescence-based detection is thus a rapid and powerful technique for in- dividual Identification. STR (or microsatellite) loci consist of simple tandemly repeated sequences of 1-6 bp in length. As with the larger vari- able number tandem repeat (VNTR or minisatellite) loci, STRs may exhibit a high degree of length polymorphism owing to variation in the number of re- peat units displayed. However, unlike VNTRs, which occur predominantly in telomeric regions, STRs appear to be abundant throughout the human ge- nome and occur, on average, every 6-10 kb.~l~ Polymorphic STR sequences have been reported in both genic and extra- genic regions of the human genome. Those in genic regions are present not only in intron and flanking sequences, but also within coding regions. (2~ STR loci are also commonly associated with the 3' end of Alu repeats, presumably re- sulting from degeneration of the Alu poly(A) tail sequence. (1'3) Because of their abundance, polymor- phic nature, and amenability to amplifi- cation by PCR, STRs are ideal markers for genomic mapping and genetic linkage analysis. Numerous STR loci have been reported for use in predictive diagnosis of many genetically inherited diseases, including myotonic dystrophy, (4) cystic fibrosis, <s~ Duchenne/Becker muscular dystrophy, ~6~ and Huntington's dis- ease/7} Genetic linkage maps of the hu- man genome based entirely on dinucle- otide STR loci have also been generated/8~ Furthermore, it has re- cently become apparent that enlarge- ment of polymorphic trinucleotide re- peat loci may be the primary cause of a number of genetic diseases such as my- otonic dystrophy, (9~ X-linked spinal and bulbar muscular atrophy, ~°~ and fragile X syndrome/~ In addition to their suitability for mapping and linkage analysis, STRs pro- vide a source of highly informative loci for use in the identification of individu- als. DNA profiling based on PCR ampli- fication of STRs has the advantage of be- ing more sensitive than conventional techniques. Furthermore, because of their small allele sizes (generally < 300 bp), STR systems are more likely to be successful on old or poorly stored speci- mens that contain only degraded DNA. ~12-14~ Also, the ability to resolve PCR products differing in size by just 1 base on polyacrylamide gels allows pre- cise allele designation, thus eliminating the need for the continuous allele distri- bution models currently employed with VNTR systems. (ls'16~ Analysis of dinucleotide STRs has re- vealed enzyme slippage during amplifi- cation, resulting in artifactual "stutter" bands. This makes unambiguous allele designation difficult. However, tri- and tetrameric repeats, which have a wider allele spacing, appear to be significantly less prone to slippage and are therefore more suitable for individual identifica- tion. (2'17~ In addition, the ability to am- plify multiple loci in a single "multi- plex" reaction, (2's'~8~ coupled with the direct detection of amplified products on polyacrylamide gels, makes STR DNA profiling amenable to automation. The use of automated fluorescence- based technology for the detection of both VNTR and dinucleotide STR loci has been described recently/~s-2°~ Here, we report the use of similar technology in the evaluation of 14 of the more poly- morphic 3- to 5- bp STRs currently avail- able for individual identification, and document an automated fluorescence- based multiplex DNA profiling system. 3:13-22©1993 by Cold Spring Harbor Laboratory Press ISSN 1054-9803/93 $5.00 PCR Methods and Applications 13 Cold Spring Harbor Laboratory Press on May 22, 2016 - Published by genome.cshlp.org Downloaded from
-
Upload
independent -
Category
Documents
-
view
2 -
download
0
Transcript of Automated DNA profiling employing multiplex amplification of short tandem repeat loci

Automated D.NA Profilo g S Employing Multiplex Amplification hort Tandem
Repeat Loci Colin P. Kimpton, Peter Gill, Abbie Walton, Andy Urquhart, Emma S. Millican, and Maia Adams
Central Research and Support Establishment, Forensic Science Service, Aldermaston, Reading, Berks RG7 4PN, United Kingdom
We have employed automated fluo- rescence-based technology to detect amplified tri-, tetra-, and pentanu- cleotide short tandem repeat (STR) loci electrophoresed on denaturing polyacrylamide sequencing gels. The system described incorporates an in- ternal size standard in each sample, allowing the STR-PCR products to he sized automatically with a high de- gree of precision. By utilizing differ- ent fluorescent dye markers for loci that have overlapping allele size ranges, we have developed three multiplex STR systems containing a total of 14 different loci. These mul- tiplex systems were then used to eval- uate the usefulness of the 14 loci for the identification of individuals. Al- lele frequency data were collected from a minimum of SO individuals from each of three different racial groups: Caucasians, Afro-Caribbeans, and Asians. Of the resulting 42 locus population sets, deviation from Hardy-Weinberg equilibria was de- tected in only the STR HUMCYARO3- Caucasian data. The probabilities of two unrelated individuals matching by chance (pM) at all 14 loci in the three multiplex reactions was <1 x 10 -14. The combination of mul- tiplex STR-PCR and automatic fluo- rescence-based detection is thus a rapid and powerful technique for in- dividual Identification.
S T R (or microsatellite) loci consist of simple tandemly repeated sequences of 1-6 bp in length. As with the larger vari- able number tandem repeat (VNTR or minisatellite) loci, STRs may exhibit a high degree of length polymorphism owing to variation in the number of re- peat units displayed. However, unlike VNTRs, which occur predominantly in telomeric regions, STRs appear to be abundant throughout the human ge- nome and occur, on average, every 6-10 kb.~l~
Polymorphic STR sequences have been reported in both genic and extra- genic regions of the human genome. Those in genic regions are present not only in intron and flanking sequences, but also within coding regions. (2~ STR loci are also commonly associated with the 3' end of Alu repeats, presumably re- sulting from degeneration of the Alu poly(A) tail sequence. (1'3)
Because of their abundance, polymor- phic nature, and amenability to amplifi- cation by PCR, STRs are ideal markers for genomic mapping and genetic linkage analysis. Numerous STR loci have been reported for use in predictive diagnosis of many genetically inherited diseases, including myotonic dystrophy, (4) cystic fibrosis, <s~ Duchenne/Becker muscular dystrophy, ~6~ and Huntington's dis- ease/7} Genetic linkage maps of the hu- man genome based entirely on dinucle- otide STR loci have also been generated/8~ Furthermore, it has re- cently become apparent that enlarge- ment of polymorphic trinucleotide re- peat loci may be the primary cause of a number of genetic diseases such as my- otonic dystrophy, (9~ X-linked spinal and bulbar muscular atrophy, ~°~ and fragile X s y n d r o m e / ~
In addition to their suitability for mapping and linkage analysis, STRs pro- vide a source of highly informative loci for use in the identification of individu- als. DNA profiling based on PCR ampli- fication of STRs has the advantage of be- ing more sensitive than conventional techniques. Furthermore, because of their small allele sizes (generally < 300 bp), STR systems are more likely to be successful on old or poorly stored speci- mens that contain only degraded DNA. ~12-14~ Also, the ability to resolve PCR products differing in size by just 1 base on polyacrylamide gels allows pre- cise allele designation, thus eliminating the need for the continuous allele distri- bution models currently employed with VNTR systems. (ls'16~
Analysis of dinucleotide STRs has re- vealed enzyme slippage during amplifi- cation, resulting in artifactual "stutter" bands. This makes unambiguous allele designation difficult. However, tri- and tetrameric repeats, which have a wider allele spacing, appear to be significantly less prone to slippage and are therefore more suitable for individual identifica- tion. (2'17~ In addition, the ability to am- plify multiple loci in a single "multi- plex" reaction, (2's'~8~ coupled with the direct detection of amplified products on polyacrylamide gels, makes STR DNA profiling amenable to automation.
The use of automated fluorescence- based technology for the detection of both VNTR and dinucleotide STR loci has been described recently/~s-2°~ Here, we report the use of similar technology in the evaluation of 14 of the more poly- morphic 3- to 5- bp STRs currently avail- able for individual identification, and document an automated fluorescence- based multiplex DNA profiling system.
3:13-22©1993 by Cold Spring Harbor Laboratory Press ISSN 1054-9803/93 $5.00 PCR Methods and Applications 13
Cold Spring Harbor Laboratory Press on May 22, 2016 - Published by genome.cshlp.orgDownloaded from

This system incorporates automatic siz- ing of PCR products and eliminates dif- ferences in electrophoretic mobil i ty among gel lanes by the inclusion of an internal sizing standard with every sam- ple.
MATERIAL AND METHODS
Source of DNA
DNA was prepared from whole blood as described previously. °s~ Blood samples were obtained from unrelated Cauca- sians, Afro-Caribbeans, and Asians resid- ing within the United Kingdom.
Locus-specific Amplification Conditions
Repeat uni t and primer sequences for the STR loci under study are given in Table 1. All ol igonucleotide primers used were synthesized commercial ly (Oswel DNA Services). Selected primers were labeled
with one of the fluorescent dye markers FAM (5-carboxyfluorescein), JOE (2',7'- dimethoxy-4' ,5 '-dichloro-6-carboxyfluo- rescein), or TAMRA (N,N,N',N'-tetra- methyl-6-carboxyrhodamine) [Applied Biosystems Incorporated (ABI)] coupled with an aminohexyl linker (Oswel DNA Services). PCR amplification was per- formed using 10 ng of genomic DNA in a 50-~tl reaction volume. Each locus, with the exception of HUMAPOAI1, was am- plified initially in an individual reaction consisting of l x PARR buffer (Cambio Laboratories), 1.25 units of Taq poly- merase, 200 tJ, M dNTPs, and 0.25 IXM of each relevant primer. HUMAPOAI1 reac- tions contained 0.065 Id, M of each primer.
PCR cycling condit ions for each locus were as follows: (HUMCD4) 27 cycles at 94°C for 45 sec, 60°C for 30 sec, and 72°C for 30 sec; (HUMDHFR, HUMCYARO3, HUMTH01 and HUMPLA2A) 28 cycles at 94°C for 45 sec, 60°C for 30 sec, 72°C for 30 sec; (HUMAPOAI1 and HUMF13A1) 27 cycles at 94°C for 45 sec, 55°C for 30 sec, and 72°C for 30 sec; (HUMVWA3 l/A) 28 cycles at 94°C for 45 sec, 50°C for 30
sec, and 72°C for 30 sec; (HUMFES/FPS) 28 cycles at 94°C for 45 sec, 55°C for 30 sec, and 72°C for 30 sec; (HUMGABARB1 and HUMACTBP2) 28 cycles at 94°C for 60 sec, 60°C for 60 sec, and 72°C for 60 sec; (D21Sll) 30 cycles at 94°C for 60 sec, 60°C for 60 sec, and 72°C for 60 sec; (HUMFIIDA and HUMFABP) 26 cycles at 94°C for 45 sec, 55°C for 30 sec, and 72°C for 30 sec.
Multiplex PCR
Multiplex 1: HUMVWA31, HUMTHO1, HUMF13A1, HUMFES/FPS Reaction components : l x PARR buffer, 1.25 units of Taq polymerase, 200 Id, M dNTPs, 0.25 ~I,M VWA/1 and 2, 0.10 tam TH01/1 and 2, 0.10 Id, M F13/1 and 2, and 0.125 I.I,M FES/1 and 2. PCR cycling condit ions: 28 cycles at 94°C for 45 sec, 54°C for 30 sec, and 72°C for 30 sec.
Multiplex 2: HUMCD4, HUMDHFR, HUMCYAR03, HUMAPOAII, HUMPLA2A, HUMIIDA, HUMFABP Reaction compo- nents: l x PARR buffer, 1.25 units of Taq polymerase, 200 IXM dNTPs, 0.25 }ZM
TABLE 1 STR Loci Under Study and Primer Sequences Employed
Accession Chromosomal Locus number location Primers a Reference
HUMVWA31/A M25858 12p12-pter
HUMTH01 D00269 11p15-15.5
HUMF13A1 M21986 6p24-25
HUMFES/FPS X06292 15q25-qter
HUMCD4 -- 12p
HUMPLA2A M22970 12
HUMDHFRP2 J00145 6
HUMCYARO3 M30795 15q21.1
HUMF11DA M36960 6
HUMFABP M 18079 4q28-31
HUMGABARB1 - - 4p12-13
HUMD21S11 M84567 21
HUMACTBP2 V00481 5/6
HUMAPOAI1 J00048 11q23-qter
VWA/1 CCCTAGTGGATGATAAGAATAATC TAMRA VWA/2 GGACAGATGATAAATACATAGGATGGATGG TH01/1 GTGGGCTGAAAAGCTCCCGATTAT FAM TH01/2 GTGATTCCCATTGGCCTGTTCCTC F13A1/1 ATGCCATGCAGATTAGAAA JOE F13A1/2 GAGGTTGCACTCCAGCCTTT FES/1 GGGATTTCCCTATGGATTGG FAM FES/2 GCGAAAGAATGAGACTACAT CD4/1 TTGGAGTCGCAAGCTGAACTAGC FAM CD4/2 GCCTGAGTGACAGAGTGAGAACC PLA2A/1 CCCACTAGGTTGTAAGCTCCATGA JOE PLA2A/2 TACTATGTGCCAGGCTCTGTCCTA DHFR/1 ATTGTAAGACTTTTGGAGCCATTT JOE DHFR/2 TTCAGGGAGAATGAGATGGGC P450/1 CTCTGGAAAACAACTCGACCCTTC FAM P450/2 TGGGTGATAGAGTCAGAGCCTGTC FIIDA/1 GCCTATTCAGAACACCAATA FAM FIIDA/2 TGGGACGTTGACTGCTGAAC FABP/1 GTAGTATCAGTTTCATAGGGTCACC FAM FABP/2 TTACGCGTCTCGGACAGTATTCAGTTCGTTTC GABA/1 CTAGAAAGCTAGCAAGGTGGAT FAM GABA/2 GCTCATTAAACACTGTGTTCCT D21/1 ATATGTGAGTCAATTCCCCAAG JOE D21/2 TGTATTAGTCAATGTTCTCCAG ACTBP2/1 AATCTGGGCGCACAAGAGTGA FAM ACBTP2/2 ACATCTCCCCTACCGCTATA APOAII/1 GGAGCAGTGCTAGGGCCGCGCCGT FAM APOAII/2 GTGACAGAGGGAGACTCCATTAAA
21
2,22
23
24
25
26
27
28
29
2,30
31
32
33,34
35,36
aFluorescent dye labels (ABI): FAM (blue), JOE (green), TAMRA (yellow).
14 PCR Methods and Applications
Cold Spring Harbor Laboratory Press on May 22, 2016 - Published by genome.cshlp.orgDownloaded from

CD4/1 and 2, 0.50 IJ.M DHFW1 and 2, 0.125 tXM P450/1 and 2, 0.125 ~bM APOAII 1 and 2, 0.375 t~M PLA2A/1 and 2, 0.50 I~M IIDA/1 and 2, and 0.065 taM FABP/1 and 2. PCR cycling condi t ions : 30 cycles at 94°C for 45 sec, 60°C for 30 sec, and 72°C for 30 sec.
Multiplex 3: HUMGABA, D21Sll, HUMACTBP2 React ion componen t s : l x PARR buffer, 1.25 uni ts of Taq poly- merase, 200 IJ, M dNTPs, 0.12 txM GABA/1 and 2, 0.5 I~M D21Sl l /1 and 2, and 0.125 ~I,M SE33/1 and 2. PCR cycl ing condi- t ions: 28 cycles at 94°C for 60 sec, 60°C for 60 sec, and 72°C for 60 sec.
Detect ion System
A 1- to 4-1xl a l iquot of each ampl i f i ca t ion react ion was c o m b i n e d wi th 6 fmoles of in ternal lane s tandard GS2500 (ABI), consis t ing of PstI-restricted bacter ioph- age h DNA labeled wi th the dye ROX. PCR product and in terna l s tandard sam- ples were heat dena tu red before be ing loaded on to a s tandard 6% polyacryla- mide dena tu r ing sequenc ing gel. Gels were e lec t rophoresed for 8 hr at cons tan t power (30 W) on an Applied Biosystems au tomated DNA sequencer mode l 370. Fragment sizes were de t e rmined auto- matical ly us ing GENESCAN 672 software (ABI) employ ing the m e t h o d of second- order regression to establish a curve of best fit for the in te rna l s tandard in each lane.
Statist ical Calculat ions
The precis ion of b a n d size es t ima t ion by the GENESCAN 672 software was deter- mined for each locus us ing the formula
%Prec i s ion = 1 - x 100
wi th SD being the s tandard devia t ion of observed band sizes for a given allele, and Exp being the theoret ica l allele size.
Hardy-Weinbe rg equi l ibr ia were tested using the log Likel ihood G statis- tic. (37) Po lymorph ic i n f o r m a t i o n con- tent (PIC) was calculated us ing the for- mula of Botstein et al. (38~ Discr imina t ing power and m a t c h i n g probabi l i t ies (pM) were calculated by the m e t h o d of Jones. (39) The sample gene diversi ty (fre- quency of heterozygotes expected unde r Hardy-Weinberg equi l ibr ium) was cal- culated as
B
C
A
~, 2 ? ,3
2800
2~00 " Z
20C0"
. ~ . 6 0 0 "
I '2 F~ D "
40 i)i
; ~; ~ ,,; .J i ?:i i 8 ;,: i 2 ~ 2 2 ;i ;2 2 2 ~ 2 3 2 ;.; 4 2 £ ~; 2 £ C; 2
2
4
Io2 i22 ta2 ,1~2, , 1 8 ? . , 12~2, 22,2 , , F ! 2 . . ,29 . " 2 8 } . . ,
0 ( ) ~ • ~ " ~ " " ' J " " " 4 7
1
4, } 0
i i ~ : 5
\ . . . . . . . . . ~ ~ ~ . - , - - , . - - ~ - . - - - - : ........................ 1
4 0 ' . } _
'.:, A P,
;:; ~ r C
; r,"
2 1
. , ~ s ~ , . ?7~ .
3
L FIGURE 1 Electrophoretograms of individual lanes from a 6% denaturing polyacrylamide gel. Peaks represent fluorescent intensities of dye-labeled DNA products. Peak height is measured against an arbitrary scale displayed on the y axis. The size of the products, in bases, is shown along the x axis. (A) Multiplex 1: Locus 1 HUMVWA (black), locus 2 HUMTHO1 (blue), locus 3 HUMF13A1 (green), locus 4 HUMFES/FPS (blue). GS2500 internal size standard (red). (B) Multi- plex 2: Locus 1 HUMCD4 (blue), locus 2 HUMFIIDA (blue), locus 3 HUMPLA2A (green), locus 4 HUMDHFRP2 (green), locus 5 HUMCYARO3 (blue), locus 6 HUMFABP (blue), locus 7 HU- MAPOAI1 (blue). GS2500 internal size standard (red). (C) Multiplex 3: Locus 1 HUMGABARB1 (blue), locus 2 D21Sll (green), locus 3 HUMACTBP2 (blue). GS2500 internal size standard (red).
PCR Methods and Applications 15
Cold Spring Harbor Laboratory Press on May 22, 2016 - Published by genome.cshlp.orgDownloaded from

d = 1 - £ pi 2
i
with pi being the allele frequency.
RESULTS
Fourteen 3- to 5-bp STR loci were se- lected for evaluation based on their pre- dicted discr iminat ion power, as indi- cated by data publ ished previously (for references, see Table 1).
STR amplif icat ion products were tagged by the a t tachment of a fluores- cent dye molecule to one of each pair of locus-specific primers. Amplified prod- ucts were then detected by laser scan- ning during electrophoresis on denatur- ing polyacrylamide gels. Band sizes were generated automatically by comparison with a standard sizing ladder included in every sample prior to electrophoresis.
PCR componen t concentrations and cycling parameters were optimized for each locus individual ly (see Materials and Methods). STRs suitable for coampli- fication (multiplexing) were then se- lected on the basis of similar opt imal re- action conditions and compatible allele size ranges. Three mult iplex systems were constructed, containing a total of 14 loci. Examples of electrophoreto- grams displaying the PCR products of these mult iplex reactions are shown in Figure 1. STR loci with overlapping allele size ranges were differentiated by use of different fluorescent dye labels. Compa- rable signal intensities of amplif ied products within a mult iplex system were obtained by adjustment of individual primer concentrations (see Materials and Methods).
Microsatellite loci were found to co- amplify with relative ease, and all multi- plex systems employed identical buffer, dNTP, and enzyme concentrations. Cy- cling times and temperatures were also similar, with only the anneal ing temper- ature requiring adjustment for each spe- cific mult iplex system.
Computer-generated band sizes for 12 of the 14 loci fell into discrete groups. This is demonstrated in Figure 2A by the HUMTH01 size calling data, which is representative of the 12 loci. The differ- ence between the mean band sizes of each group corresponded to the theoret- ical repeat uni t size for 11 of the 12 loci. The m a x i m u m band size range for any given group was 1.2 bp [corresponding
A
1 4
1 2
1 0
8
I,i, ,lli,,I,I, ,llll,,ll lllU,, , , , , , , , , i | . . i i . . , , t , , , 0 , , , , , , . , , , , , . , , , , , , , , , . , , , ' ' ' ' ' • ' ' ' ' ' '
1 5 6 1 5 7 1 5 8 1 5 9 1 6 0 1 6 1 1 6 2 1 6 3 1 6 4 1 6 5 1 6 6 1 6 7 1 6 8 1 6 9 1 7 0 1 7 1 1 7 2 1 7 3 1 7 4
BAND SIZE (base pair)
. I:t], i,. :i,l; : : .I, ,i.. t,I, :t..it. i. :i: !! 2 4 8 2 4 9 2 5 0 2 5 1 2 5 2 2 5 3 2 5 4 2 5 5 2 5 6 2 5 7 2 5 8 2 5 9 2 6 0 2 6 1 2 6 2 2 6 3 2 6 4 2 6 5 2 6 6 2 6 7 2 6 8 2 6 9 2 7 0
B A N D S I Z E ( b a s e p a i r )
FIGURE 2 Frequency distributions of automatically generated PCR product sizes. Amplification products were combined with 6 fmoles of an internal lane standard before being loaded onto 6% polyacrylamide denaturing gels. Fragment sizes were determined automatically using GENES- CAN 672 software (ABI) employing the method of second-order regression to establish a curve of best fit for the internal standard in each lane. (A) HUMTHO1 sizing data for 212 allele bands from six gels. (B) HUMACTBP2 sizing data for 92 allele bands between the range of 248-270 bases in length, from five gels.
to - 0.6 bp either side of the mean (Ta- ble 2).] As the m i n i m u m repeat unit size was 3 bp, unambiguous allele designa- t ion was possible for every sample for the 11 loci ment ioned above. The micro- satellite D21Sl l displayed a number of allele bands differing by only 2 bp (the- oretical repeat unit size was 4 bp). How- ever, because the m a x i m u m band size range for this locus was only 0.7 bp (0.35 bp either side of the mean), these half repeat unit alleles could be identified precisely. Therefore, it was also possible to readily assign allele designations for D21Sl l .
The remaining two loci (HUMAPOAI1
and HUMACTBP2) displayed a n u m b e r of allele bands differing by 1 bp and 2 bp, respectively. Although such differ- ences were readily resolvable on poly- acrylamide gels, the consistency of auto- matic sizing between gels was not sufficient to allow precise allele designa- tion using these loci (demonstrated for HUMACTBP2 in Fig. 2B). For this reason, allele assignment for HUMAPOAI1 and HUMACTBP2 was under taken by the di- rect comparison of computer-generated band sizes to those of an allelic ladder control run on the same gel.
Allele bands for all loci were sized with a h igh degree of precision when
16 PCR Methods and Applications
Cold Spring Harbor Laboratory Press on May 22, 2016 - Published by genome.cshlp.orgDownloaded from

TABLE 2 Precision of Computer-generated Band Sizing
Within gels Across gels precision S.D. a range b precision S.D. a range b
Locus (%) (bp) (bp) (%) (bp) (bp)
HUMCD4 99.92 (0.10) 0-0.6 99.78 (0.26) 0.5-1.2 HUMDHFR 99.94 (0.10) 0.1-0.6 99.89 (0.18) 0.7-1.0 HUMCYARO3 99.95 (0.09) 0.1-0.5 99.87 (0.24) 0.6-1.1 HUMVWA31/A 99.93 (0.10) 0--0.7 99.82 (0.27) 0.6-1.2 HUMTH01 99.95 (0.08) 0--0.5 99.93 (0.12) 0.4--0.6 HUMF13A1 99.95 (0.10) 0-0.7 99.88 (0.25) 0.3-1.2 HUMFES/FPS 99.95 (0.11) 0--0.7 99.92 (0.19) 0.1-0.9 HUMPLA2A 99.95 (0.07) 0.1-0.4 99.90 (0.12) 0.4-0.8 HUMF11DA 99.95 (0.10) 0.1-0.5 99.87 (0.24) 0.4-1.1 HUMFABP 99.95 (0.12) 0.2-0.7 99.87 (0.31) 0.2-1.2 HUMGABAR1 99.95 (0.08) 0-0.6 99.90 (0.14) 0.2-0.8 HUMD21S11 99.96 (0.09) 0--0.6 99.94 (0.13) 0.1-0.7 HUMACTBP2 ND 99.79 (0.53) 0.7-2.1 HUMAPOA11 ND 99.84 (0.44) 0.1-1.4
aStandard deviation. (ND) Not done. bRange of computer generated sizes for a given allele.
compared wi thin gels (Table 2). How- ever, this level of precision was reduced when sizes were compared among gels, al though the reduction was only signif- icant with the HUMAPOAI1 and HU- MACTBP2 loci. With these STRs the mi- gration of PCR product bands appeared to be affected by gel to gel variation to a greater extent than the internal size stan- dard bands. This is probably because of the substantially different sequence compositions of the PCR products and the size standard; both HUMAPOAI1 and HUMACTBP2 contain long AT-rich re- peat regions.
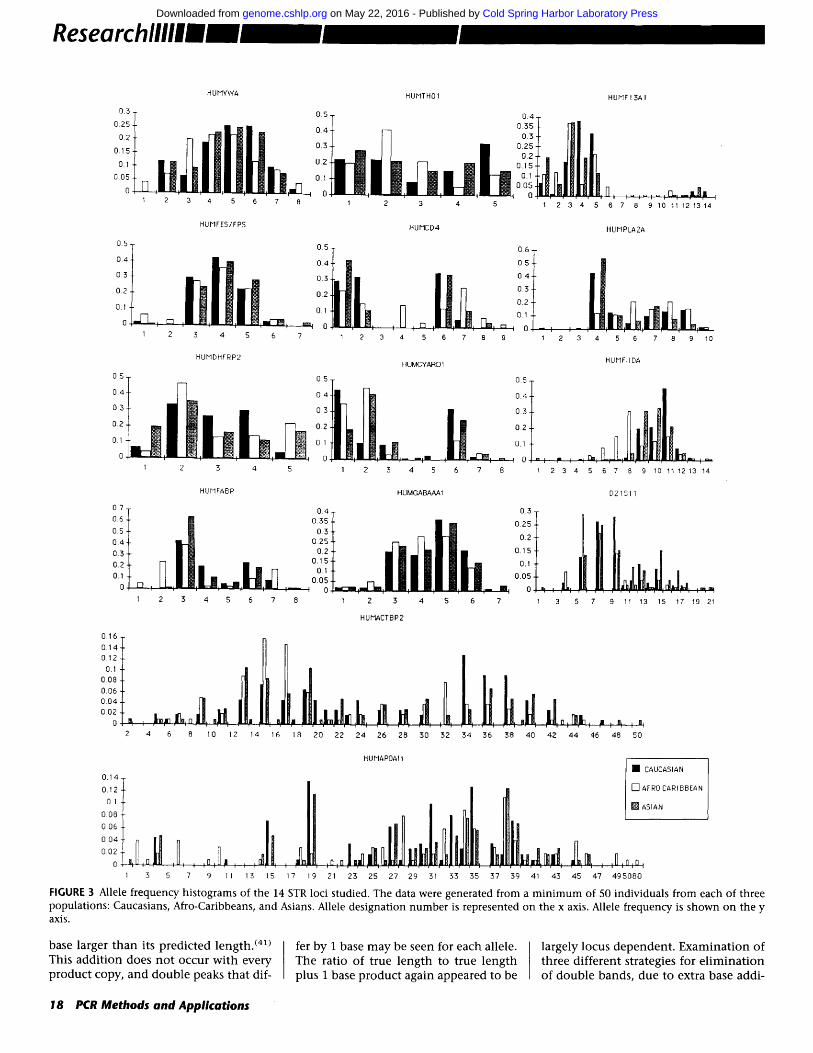
Allele frequencies for each STR locus under investigation were determined from a m i n i m u m of 50 random individ- uals for each of three different popula- tions: Caucasians, Afro-Caribbeans, and Asians. Allele frequency histograms for all 14 loci are shown in Figure 3. Sym- metrical and skew unimodal , b imodal and more complex distributions were observed among the 14 loci. Differences in allele frequencies among populat ion groups were also seen. This was most pronounced for HUMFIIDA, with the smaller alleles (1-8) being significantly more c o m m o n in the Afro-Caribbean population. The overall incidence of these alleles in Afro-Caribbeans was 58%, in contrast with 5% and 10% in Caucasians and Asians, respectively. Al- lele frequency differences among popu- lations were compared for each micro- satellite using a Chi-square test. Interpopulation differences were signifi-
cant (P < 0.05) for all loci, with the ex- ception of HUMFES/FPS (P = 0.1) and HUMGABARB1 (P = 0.38).
The data sets were tested for Hardy- Weinberg equilibria using a log likeli- hood-G test. ~37~ In total, 42 locus popu- lation comparisons were carried out. Deviation from Hardy-Weinberg equi- libria was only detected for the HUMC- YARO3 Caucasian data (P < 0.05).
The number of alleles observed, gene diversity, and PIC for each locus and populat ion are summarized in Table 3. The STR loci appear to fall into two main groups. Those in the first group, which contains all loci except HUMACTBP2, HUMAPOAI1, and D21Sll , display a small number of well-separated alleles (< 12). These alleles differ in size by the expected length of the repeat unit in vir- tually every case, with only two excep- tions. The exceptions are the smallest al- lele for HUMF13A1 (4-bp repeat unit), which is only 2 bp less than the second allele; and allele 5 for HUMTHO1 (con- taining 10 repeat units), which appears to be only 3-bp larger than allele 4. A rare, full-length 10 repeat allele (1 bp larger than the common 10-repeat uni t allele) was also observed in this study. Both of these 10-repeat unit alleles were grouped as one in this paper.
The second STR locus group, contain- ing HUMACTBP2 and HUMAPOAI1, is significantly more polymorphic and dis- plays a greater number of alleles (>35). However, these loci appear to be much more complex and possess mult iple al-
leles, which differ by less than the pub- lished repeat uni t size. The D21Sl l locus falls between the two groups.
The pMs of individual loci (Table 4) was calculated from the allele frequency data using the formula of Jones. (38). Val- ues ranged from 0.25 for HUMFABP in Asians to 0.02 for both HUMACTBP2 in Caucasians and HUMAPOAI1 in Afro- Caribbeans and Asians. Differences in discriminating power between popula- tions occurred to varying degrees for in- dividual loci. However, in most cases the loci were more discr iminat ing for Afro- Caribbeans. The latter populat ion also tended to display a greater number of alleles for most loci, indicat ing that the Afro-Caribbean populat ion was more heterogeneous than the Caucasian or Asian groups. This has also been re- ported for VNTRs. (4°; The average com- bined pMs of the mul t iplex reactions, calculated by the product rule, were: 1.3 x 10 -4 for mul t iplex 1 (4 loci); 5 x 10 -7 for mult iplex 2 (7 loci); and 1.6 x 10 -4 for mult iplex 3 (3 loci). The combined figure for the three mult iplex systems is thus >1 × 10-14.
Artifactual stutter bands caused by en- zyme slippage during amplif icat ion were detected with a number of STR loci. The degree of slippage appeared to be locus dependent and remained relatively con- stant, ranging from negligible (e.g., HUMTH01) to a m a x i m u m of 12% of the signal intensity of the adjacent allele as measured by peak area (e.g., HUMPLA2A).
Variation in signal intensi ty of differ- ent allele bands in heterozygote samples was also observed for some loci. Again, this variation appeared to be locus de- pendent, and in most instances the larger of the two alleles gave a less in- tense signal. This was most apparent when allele size differences were pro- nounced (>50 bp) and was probably the result of preferential amplif icat ion of smaller sequences during PCR. Three loci (HUMCD4, HUMCYARO3, and HUMFES/FPS) displayed signal variation for either of the two alleles. The reason for this is unclear. Prel iminary studies of mixed samples using loci that showed negligible signal variation indicated that signal intensi ty can be a relatively accu- rate measure of template DNA ratios (data not shown).
The addit ion of an extra base by the Taq polymerase enzyme at the end of elongation can result in a PCR product 1
PCR Methods and Applications 17
Cold Spring Harbor Laboratory Press on May 22, 2016 - Published by genome.cshlp.orgDownloaded from
0.3
0.25
O.Z
0.15
0.1
0.05
0
HUMVWA HUMTHO I HUMF 13A 1
l i l t 0. 40"5 i l l i l l h 00!+~~Ii~ 0 o+ + +.i++.. tt h °' i I o 0.1 0 05
, .~I I] ........ n... _dl ; ', ', ' , 4 0 t ' I I I " 0
2 3 4 5 6 7 8 1 2 3 4 5 1 2 3 4 5 6 7 8 9 10 11 12 13 14
HUMFESIFPS HUMCD4 HUMPLA2A
o+i. #11 ° it it o+! 0.4 04 05 03 0.3 04 o. o. ..o+
o., o., I-] °' l i O, I E3 I ' I ; I I " - ' l ~ , ram; O , ; ; ' , [ ] . . , L-Ilw, r~ I 0 - - ', I . . . . i =
, , , , m , t , , , , , 1 2 3 4 5 6 7 1 2 3 4 5 6 7 8 9 1 2 3 4 5 6 7 8 9 10
HUMDHFRP2 HUMFtlDA HUMCYAROl
''+o''O'+I, ilh 0.'0+0+++0113. . 02 I ~ 0.2 0.1 O.
0 ]; I I J ~ + ~ i ~ - - III
I 2 3 4 5 1 2 3 4 5
0.5
0.4 I ~ l ] ~ ~ ~ I ~ 0.3 0.2
HUMFABP HUMGABAAA1 DZ 1S I 1
d of+ ,,+,. o+i lib o , ° ' °~:t I , o~+
o~ Oo2~ o~
0.15 Jl![a i ~ 0.3
o., o,' ~_ l , , l t , ~ °+ ' o., ,~ J 1 2 5 4 5 6 7 8 I 2 3 4 5 6 7 1 3 5 7 9 11 13 15 17 19 21
HUMACTBP2
o.16 T 0.14f I]
o0o;I ~ II I
°+t ~l iI ~lhdb,+ J l II,J 0.04
°°~..,, k . . P . , o , .lnl. . . . . L ~ i J , . , o . m ~ , . . , , , , , . . . . . . . . . . . . . . . . . . . . . . . ', : , I , ', , ', ', ', , I , : , , , I . . . . . . . . . . 2 4 6 8 I 0 12 14 6 18 20 22 24 26 28 :50 32 34 36 58 40 42 44 46 48 50
0.14
0.12
0.1
0.08
0.06
0.04
0.02
0
3 5 7 9 II 13 15 17 19
HUMAPOAI 1 • CAUCASIAN
I ~ [] AFRO CARIBBEAN
I LII ° +
21 23 Z5 27 29 31 53 35 37 39 41 43 45 47 495080 FIGURE 3 Allele frequency histograms of the 14 STR loci studied. The data were generated from a minimum of 50 individuals from each of three populations: Caucasians, Afro-Caribbeans, and Asians. Allele designation number is represented on the x axis. Allele frequency is shown on the y axis.
base larger than its predicted length. (4t) I fer by 1 base may be seen for each allele. This addition does not occur with every I The ratio of true length to true length product copy, and double peaks that dif- plus 1 base product again appeared to be
largely locus dependent. Examination of three different strategies for el imination of double bands, due to extra base addi-
18 PCR Methods and Applications
Cold Spring Harbor Laboratory Press on May 22, 2016 - Published by genome.cshlp.orgDownloaded from

TABLE 3 N u m b e r of Alleles, Gene Diversity, and PIC of the STR Loci Studied
Caucasian Afro-Caribbean Asian (N = 55) a (N = 50) a (N = 55) a
Locus K gene D PIC K gene D PIC K gene D PIC Total K
HUMVWA31/A 7 0.81 0.79 8 0.83 0.82 6 0.80 0.79 8 HUMTH01 5 0.77 0.76 5 0.73 0.70 5 0.78 0.78 5 HUMF13A1 7 0.72 0.68 12 0.78 0.78 8 0.77 0.75 13 HUMFES/FPS 5 0.67 0.62 6 0.73 0.70 6 0.69 0.65 7 HUMCD4 4 0.69 0.68 8 0.82 0.82 5 0.68 0.68 8 HUMPLA2A 7 0.75 0.74 9 0.84 0.83 6 0.66 0.65 9 HUMDHFR 5 0.72 0.69 5 0.69 0.68 5 0.77 0.75 5 HUMCYARO3 7 0.69 0.69 6 0.66 0.61 6 0.72 0.71 8 HUMFIIDA 8 0.70 0.68 11 0.83 0.82 10 0.75 0.72 13 HUMFABP 6 0.71 0.70 8 0.75 0.73 5 0.55 0.54 8 HUMGABARB1 7 0.75 0.73 6 0.76 0.74 7 0.76 0.74 7 HUMD21Sll 11 0.81 0.81 14 0.83 0.83 15 0.86 0.86 15 HUMACTBP2 26 0.94 0.94 26 0.92 0.92 28 0.94 0.94 36 HUMAPOAI1 24 0.92 0.92 34 0.95 0.95 26 0.94 0.94 39
a(N) Number of individuals studied for each locus. (K) Number of alleles observed. (Gene D) Gene diversity (expected heterozygosity).
t ion, was carried out. The first s trategy involved incorpora t ion of an MluI re- str ict ion site in to the non-dye- labe led pr imer sequence. This a l lowed cleavage of a small sequence, i nc lud ing the extra base if it had been added, f rom one end of the PCR produc t (Fig. 4). This proce- dure was successful, a l t h o u g h small bands represent ing a p ropor t ion of un- cleaved product were still detectable. A simpler m e t h o d to remove the extra base involved the add i t ion of 2 uni t s of T4
DNA polymerase to the PCR product fol- lowed by incuba t ion at 37°C for an addi- t ional 30 min . The extra base was effi- c ient ly removed by the 3' to 5' single- s t randed exonuclease activity of the T4 DNA polymerase (Fig. 4). The final strat- egy examined was ad jus tmen t of the am- pl i f icat ion condi t ions to favor addi t ion of the extra base, thus e l imina t ing the fo rma t ion of double peaks. This was achieved by inc lud ing a final lO-min, in- cuba t ion at 72°C and increas ing the
TABLE 4 M a t c h i n g Probabi l i ty (pM) of STR Loci
Locus Caucasian Afro-Caribbean Asian
Multiplex 1 HUMVWA31/A 0.07 0.06 HUMTHO1 0.09 0.15 HUMF13A1 O.13 0.09 HUMFES/FPS 0.19 0.15
Combined pM 1.5 × 10 -4 1.2 x 10 -4 1.3 Multiplex 2
HUMCD4 O. 16 0.07 HUMPLA2A 0.10 0.07 HUMDHFR 0.14 0.15 HUMCYARO3 0.16 0.17 HUMFIIDA 0.13 0.16 HUMFABP 0.16 0.11 HUMAPOAI1 0.03 0.02
Combined pM 2.2 × 10 - 7 1.6 × 10 -8 2.5 Multiplex 3
HUMGABARB 1 O. 10 O. 10 HUMD21S11 0.07 0.07 HUMACTBP2 0.02 0.08
Combined pM 1.4 × 10 -4 2.1 × 10 -5 1.5 Combined pM 4.6 × 10⁻¹⁵ 4.0 × 10⁻¹⁶ 4.9
0.08 0.11 0.11 0.14 × 10 -4
0.06 0.15 0.10 0.14 0.13 0.25 0.02 x 10 -7
0.10 0.05 0.03 × 10 -4 x 10- ~5
star t ing concen t r a t i on of dATP. Al- t h o u g h this did no t comple te ly elimi- nate the true l eng th b a n d for every lo- cus, it was suff ic ient to a l low u n a m b i g u o u s allele des igna t ion .
DISCUSSION
We have developed mul t ip lex amplif ica- t ion systems tha t were used in con junc- t ion wi th au toma ted f luorescence-based de tec t ion to evaluate the sui tabi l i ty of 14 h igh ly p o l y m o r p h i c tri-, tetra-, and pen- t anuc leo t ide STR loci for iden t i f i ca t ion of individuals .
The STR loci s tudied were s h o w n to coampl i fy readily u n d e r s tandard PCR condi t ions . Efficient ampl i f i ca t ion of all loci in mul t ip lex sys tems was ach ieved by the a d j u s t m e n t of a n n e a l i n g temper- ature and ind iv idua l p r imer concent ra- t ion. In contrast , VNTR loci of ten require diverse reac t ion cond i t ions for success- ful ampl i f ica t ion and are diff icult to co- amplify. (19'42~ Fur thermore , allelic drop- out caused by preferent ia l ampl i f i ca t ion of smal ler sequences has been repor ted wi th some ampl i f ied VNTR loci. (42~ A1- lelic d ropou t does no t appear to occur wi th STR loci, because of the i r na r row allele size range.
The nar row allele size range of STRs also increases the po ten t i a l n u m b e r of loci tha t can be d i f ferent ia ted in one gel lane. This m a y be fur ther faci l i tated by the use of di f ferent f luorescent dye markers for loci w i th over lapp ing allele size ranges. The avai labi l i ty of four dis- t ingu ishab le f luorescent dyes also allows the incorpora t ion of an in te rna l size s tandard in every gel lane, t he reby elim- ina t ing in t e rp re ta t ion errors caused by differences in e lec t rophore t ic mob i l i t y across a gel. Moreover, by e m p l o y i n g the GENESCAN 672 c o m p u t e r software, it was possible to size PCR products auto- mat ica l ly against the in te rna l ladder s tandard. The data were t h e n stored in a spreadsheet format. The use of a univer- sal in te rna l size s tandard e l imina tes the r equ i r emen t to develop allelic ladders for each separate locus and, thus, al lows every lane of a gel to be used for exper- imen ta l samples.
The precis ion achieved by the auto- mat ic sizing software was suff icient to al- low u n a m b i g u o u s allele des igna t ion for 12 of the 14 loci studied. However, vari- abil i ty be tween gels did no t a l low reli- able allele des igna t ion for two STRs (HU- MAPOAI1 and HUMACTBP2), w h i c h
PCR Methods and Applications 19
Cold Spring Harbor Laboratory Press on May 22, 2016 - Published by genome.cshlp.orgDownloaded from

A
Non-restricted PCR products 1600~ 1200~ 800.~_ 4000~
MluI-restricted PCR products 1600~ 1200~ 800.~ 4000~
B
Non-T4 treated PCR products
000 400~ 2000~
T4 treated PCR products
FIGURE 4 Incomplete addition of an extra base by the Taq polymerase enzyme at the end of elongation results in double peaks differing by 1 base for each allele. (A) Elimination of double peaks by incorporation of an MluI restriction site in the non-dye-labeled primer coupled with MluI restriction of products following amplification. (B) Removal of the extra base by incubation of PCR products with T4 DNA polymerase.
contain long AT-rich repeat regions and display alleles differing by only 1 and 2 bp. With both of these loci it was neces- sary to run an allelic ladder on each gel. The anomalous migrat ion rates of ampli- fication products relative to an internal size standard have also been reported for AT-rich VNTRs. (a9) This is probably caused by differences in DNA-gel inter- actions, which are affected by variation in gel composition, and by a DNA-bend- ing p h e n o m e n o n to which AT-rich se- quences are more susceptible. (43~ This problem could be overcome by use of an AT-rich internal size standard for AT-rich loci, as opposed to the use of specific al- lelic ladder markers.
Examination of the sequence of HU- MAPOAI1 and HUMACTBP2 reveals that the repeat regions of these loci consist of degenerative repeat sequences of varying size. (44'4s) Moreover, length variation ap-
pears to occur at a number of sites within the repeat regions of these loci, (46~ thus explaining the presence of alleles differ- ing by 1 and 2 bp. Prior to routine use of these loci by forensic laboratories for the identification of individuals, it must be confirmed that the detection and sizing protocols used allow accurate, reliable, and unambiguous allele designation.
Sequence analysis of D21Sl l has re- vealed a c o m m o n 2-bp mutat ion within the repeat region of this locus (A. Urqu- hart, pers. comm.), which would ac- count for the 2-bp allele differences ob- served for D21Sl l .
The reason for the different STR fre- quency distributions observed here (un- imodal, bimodal, and complex) is un- clear. Such distributions have been reported previously for STR loci, and it was suggested that they may represent the evolutionary history of the alleles for
different populations. (17) In addition, structural limitations on allele sizes are also likely to play a major role in the generat ion and frequency of specific al- leles.
Interpopulat ion differences in allele frequencies were significant for 12 of the 14 loci examined in this study, indicat- ing the potential usefulness of STR loci as race markers. A number of loci ap- peared to display race specific alleles, al- though these alleles occurred at a rela- tively low frequency. It would be necessary to type substantially greater numbers of individuals before such al- leles could be confirmed as being com- pletely race-specific. It may be possible to group potential race-informative loci in a single multiplex reaction allowing a probability of racial origin to be calcu- lated from the profile of an individual of unknown origin.
Although the number of chromo- somes studied for each locus and popu- lation was relatively small in this study, prel iminary tests indicated that with the exception of HUMCYARO3 in Cauca- sians, all of the loci were within Hardy- Weinberg equilibria. The apparent devi- ation from the Hardy-Weinberg equilibrium for the HUMCYARO3 data is currently under more detailed investiga- tion but may be simply because of sam- pling error. The overall pM of the three multiplex systems developed was <1 × 10-14, thus highl ight ing the power of these systems for individual identification. However, before a dis- cr iminatory system is accepted for rou- tine forensic use, it must be proved to be both robust and reliable. The high inci- dence of artifactual stutter bands ob- served with dinucleotide STR loci make them unsuitable for forensic applica- tions. However, the significantly re- duced level of stuttering for 3- to 5-bp repeat loci observed both in this and pre- vious studies, (2) suggests that these STRs are more amenable to forensic investiga- tions. This is reinforced by prel iminary studies carried out in our laboratories on forensic material (data not shown).
Fluorescence signals are known to be linear over a much greater range of in- tensities than conventional autoradiog- raphy. (2°) Therefore, fluorescence-based detection systems are likely to be more useful than autoradiography for direct quanti tat ion of PCR products. This has a direct forensic significance when it is necessary to type samples of mixed ori-
20 PCR Methods and Applications
Cold Spring Harbor Laboratory Press on May 22, 2016 - Published by genome.cshlp.orgDownloaded from

gin. Pre l iminary studies o n mixed sam- ples suggest tha t compar i son of fluores- cent STR-PCR band in tens i t ies m a y give a relat ively accurate quan t i t a t i on of the propor t ions of mater ia l f rom each indi- vidual in a mixed sample. Current ly , we are unde r t ak ing detai led studies of mixed forensic spec imens which , in turn, shou ld assist in the in te rp re ta t ion of profiles f rom compl ica ted forensic samples.
In conclus ion, tri-, tetra-, and penta- nucleot ide STR loci appear to be well suited for rou t ine iden t i f i ca t ion of indi- viduals. These loci readily coamplify, thus faci l i tat ing the d e v e l o p m e n t of h igh ly d i sc r imina t ing mul t ip l ex sys- tems. E m p l o y m e n t of a u t o m a t e d fluo- rescent de tec t ion systems increases the potent ia l for d e v e l o p m e n t of mul t ip lex reactions. This can be accompl i shed by the use of different f luorescent dyes for loci wi th over lapping allele sizes and the incorpora t ion of an in te rna l size stan- dard in each sample. PCR products can t hen be au tomat ica l ly sized wi th a h i g h degree of precis ion and the data trans- ferred in to compute r data bases or ma- n ipu la ted further. Thus, the combina- t ion of mul t ip lex STR-PCR and au tomated f luorescent de tec t ion results in a rapid and powerful DNA prof i l ing t echn ique wi th cons iderable po ten t ia l in a variety of areas i nc lud ing forensics.
REFERENCES
1. Beckmann, J.S. and J.L. Weber. 1992. Sur- vey of human and rat microsatellites. Ge- nomics 12: 627-631.
2. Edwards, A., A. Civitello, H.A. Hammond, and C.T. Caskey. 1991. DNA typing and genetic mapping with trimeric and tet- rameric tandem repeats. Am. J. Hum. Genet. 49: 746-756.
3. Economou, E.P., A.W. Bergen, A.C. War- ren, and S.E. Antonarakis. 1990. The polydeoxyadenylate tract of Alu repetitive elements is polymorphic in the human genome. Proc. Natl. Acad. Sci. 87: 2951- 2954.
4. Mully, J.C., A.K. Gedeon, S.J. White, E.A. Haan, and R.I. Richards. 1991. Predictive diagnosis of myotonic dystrophy with flanking microsatellite markers. J. Med. Genet. 28: 448-452.
5. Morral, N. and X. Estivill. 1992. Multiplex PCR amplification of three microsatel- lites within the CFTR gene. Genomics 13: 1362-1364.
6. Oudet, C., R. Heilig, A. Hanauer, and J.-L. Mandel. 1991. Nonradioactive assay for new microsatellite polymorphisms at the
5' end of the dystrophin gene, and esti- mation of intragenic recombination. Am. J. Hum. Genet. 49: 311-319.
7. Weber, B., O. Riess, G. Wolff, S. Andrew, C. Collins, R. Graham, J. Thielman, and M.R. Hayden. 1992. Delineation of a 50 kilobase segment containing the recom- bination site in a sporadic case of Hun- tington's disease. Nature Genet. 2: 216- 222.
8. Weissenbach, J., G. Gyapay, C. Dib, A. Vignal, J. Morissette, P. Millasseau, G. Vaysseix, and M. Lathrop. 1992. A second- generation linkage map of the human ge- nome. Nature 359: 794-801.
9. Mahadevan, M., C. Tsilfidis, L. Sabourin, G. Shutler, C. Amemiya, G. Jansen, C. Neville, M. Narang, J. Barcelo, K. O'Hoy, S. Leblond, J. Earle-Macdonald, P.J. de Jong, B. Wieringa, and R.G. Korneluk. 1992. Myotonic dystrophy mutation: An unstable CTG repeat in the 3' untrans- lated region of the gene. Science 255: 1253-1255.
10. La Spada, A.R., E.M. Wilson, D.B. Lubahn, A.E. Harding, and K.H. Fischbeck. 1991. Androgen receptor gene mutations in X-linked spinal and bulbar muscular at- ropy. Nature 352: 77-79.
11. Richards, R.I. and G.R. Sutherland. 1992. Fragile X syndrome: The molecular pic- ture comes into focus. Trends Genet. 8: 249-253.
12. Hagelberg, E., I.C. Gray, and A.J. Jeffreys. 1991. Identification of the skeletal re- mains of a murder victim by DNA analy- sis. Nature 352: 427-429.
13. Gill, P., C.P. Kimpton, and K.M. Sullivan. 1992. A rapid polymerase chain reaction method for identifying fixed specimens. Electrophoresis 13: 173-175.
14. Jeffreys, A.J., M.J. Allen, E. Hagelberg, and A. Sonnberg. 1992. Identification of the skeletal remains ofJosef Mengele by DNA analysis. Forensic Sci. Int. 56: 65-76.
15. Gill, P., K. Sullivan, and D.J. Werrett. 1990. The analysis of hypervariable DNA profiles: Problems associated with the ob- jective determination of the probability of a match. Hum. Genet. 85: 75-79.
16. Evett, I.W. and P. Gill. 1991. A discussion of the robustness of methods for assessing the evidential value of DNA single locus profiles in crime investigations. Electro- phoresis 12: 226-230.
17. Edwards, A., H.A. Hammond, L. Jin, C.T. Caskey, and R. Chakraborty. 1992. Ge- netic variation at five trimeric and tet- rameric tandem repeat loci in four hu- man population groups. Genomics 12: 241-253.
18. Schwartz, L.S., J. Tarleton, B. Popovich, W.K. Seltzer, and E.P. Hoffman. 1992. Flu- orescent multiplex linkage analysis and carrier detection for Duchenne/Becker muscular dystrophy. Am. J. Hum. Genet. 51: 721-729.
19. Sullivan, K.M., S. Pope, P. Gill, and J.M. Robertson. 1992. Automated DNA profil- ing by fluorescent labeling of PCR prod- ucts. PCR Methods Applic. 2: 34-40.
20. Ziegle, J.S., Y. Su, K.P. Corcoran, L. Nie, P.E. Mayrand, L.B. Hoff, L.J. McBride, M.N. Kronick, and S.R. Diehl. 1992. Ap- plication of automated DNA sizing tech- nology for genotyping microsatellite loci. Genomics 14: 1026--1031.
21. Kimpton, C.P., A. Walton, and P. Gill. 1992. A further tetranucleotide repeat polymorphism in the vWF gene. Hum. Mol. Genet. 1: 287.
22. Polymeropoulos, M.H., H. Xiao, D.S. Rath, and C.R. Merril. 1991. Tetranucle- otide repeat polymorphism at the human tyrosine hydrolase gene (TH). Nucleic Ac- ids Res. 19: 3753.
23. Polymeropoulos, M.H., D.S. Rath, H. Xiao, and C.R. Merril. 1991. Tetranucle- otide repeat polymorphism at the human coagulation factor XIII A subunit gene (F13A1). Nucleic Acids Res. 19: 4036.
24. Polymeropoulos, M.H., D.S. Rath, H. Xiao, and C.R. Merril. 1991. Tetranucle- otide repeat polymorphism at the human c-fes/fps proto-oncogene (FES). Nucleic Ac- ids Res. 19: 4018.
25. Edwards, M.C., P.R. Clemens, M. Tristan, A. Pizzuti, and R.A. Gibbs. 1991. Pentanu- cleotide repeat length polymorphism at the human CD4 locus. Nucleic Acids Res. 19: 4791.
26. Polymeropoulos, M.H., D.S. Rath, H. Xiao, and C.R. Merril. 1990. Trinucleotide repeat polymorphism at the human pan- creatic phospholipase A-2 gene (PLA2). Nucleic Acids Res. 18: 7468.
27. Polymeropoulos, M.H., D.S. Rath, H. Xiao, and C.R. Merril. 1991. Tetranucle- otide repeat polymorphism at the human dihydrofolate reductase psi-2 pseudogene (DHFRP2). Nucleic Acids Res. 19: 4792.
28. Polymeropoulos, M.H., D.S. Rath, H. Xiao, and C.R. Merril. 1991. Tetranucle- otide repeat polymorphism at the human aromatase cytochrome P-450 gene (CYP19). Nucleic Acids Res. 19: 195.
29. Polymeropoulos, M.H., D.S. Rath, H. Xiao, and C.R. Merril. 1991. Trinucleotide repeat polymorphism at the human tran- scription factor IID gene. Nucle icAcids Res. 19: 4037.
30. Polymeropoulos, M.H., D.S. Rath, H. Xiao, and C.R. Merril. 1990. Trinucleotide repeat polymorphism at the human intes- tinal fatty acid binding protein gene (FABP2). Nucleic Acids Res. 18: 7198.
31. Dean, M., S. Lucas-Derse, A. Bolos, S.J. O'Brien, E.F. Kirkness, C.M. Fraser, and D. Goldman. 1991. Genetic mapping of the [31 GABA receptor gene to human chro- mosome 4, using a tetranucleotide repeat polymorphism. Am. J. Hum. Genet. 49: 621-626.
32. Sharma, V. and M. Litt. 1992. Tetranucle-
PCR Methods and Applications 21
Cold Spring Harbor Laboratory Press on May 22, 2016 - Published by genome.cshlp.orgDownloaded from

otide repeat polymorphism at the D21511 locus. Hum. Mol. Genet. 1: 67.
33. Warne, D., C. Warkins, P. Bodfish, K. Ny- berg, and N.K. Spurr. 1991. Tetranucle- otide repeat polymorphism at the human beta-actin related pseudogene 2 (ACTBP2) detected using the polymerase chain reac- tion. Nucleic Acids Res. 19: 6980.
34. Polymeropoulos, M.H., D.S. Rath, H. Xiao, and C.R. Merril. 1992. Tetranucle- otide repeat polymorphism at the human beta-actin related pseudogene H-beta- Ac- psi-2 (ACTBP2). Nucleic Acids Res. 20: 1432.
35. Zuliani, G. and H. Hobbs. 1990. Tetranu- cleotide repeat polymorphism in the apo- lipoprotein C-III gene. Nucleic Acids Res. 18: 4299.
36. Hata, A. and J.°M. Lalouel. 1991. Mi- croVNTR (CTTT)n at the apo C-III locus. Nucleic Acids Res. 19: 5098.
37. Sokal, R.R. and J.F. Rohlf. 1981. Biometry, 2d ed. W.H. Freeman, New York.
38. Botstein, D., R.L. White, M. Skolnick, and R.W. Davis. 1980. Construction of a ge- netic linkage map in man using restric- tion fragment length polymorphisms. Am. J. Hum. Genet. 32: 182-190.
39. Jones, D.A. 1972. Blood samples: Proba- bility of discrimination. J. Forensic Sci. Soc. 12" 355-359.
40. Gill, P., S. Woodroffe, J.E. Lygo, and E.S. Millican. 1991. Population genetics of four hypervariable loci. Int. J. Leg. Med. 104: 221-227.
41. Clark, J.M. 1988. Novel non-templated nucleotide addition reactions catalysed by procaryotic and eucaryotic DNA poly- merases. Nucleic Acids Res. 16:9677-9686.
42. Tully, G., K.M. Sullivan, and P. Gill. 1993. Analysis of 6 VNTR loci by multiplex PCR and automated fluorescent detection. (in prep.)
43. Hagerman, P.J. 1990. Sequence directed curvature of DNA. Annu. Rev. Biochem. 59: 755-781.
44. Protter, A.A., B. Levy-Wilson, J. Miller, G. Bencen, T. White, and J.J Seilhamer. 1984. Isolation and sequence analysis of the human apolipoprotein C-III gene and the intragenic region between the Apo AI and Apo CIII genes. DNA 3: 449-456.
45. Moos, M. and D. Gallwitz. 1983. Structure of two beta-actin-related processed genes one of which is located next to a simple repetitive sequence. EMBO. J. 2: 757-761.
46. Urquhart, A., C.P. Kimpton, and P. Gill. 1993. Sequence variation within the tet- ranucleotide repeat polymorphism at the human beta-actin related pseudogene 2 (ACTBP2). (in prep.).
Received April 23, 1993; accepted in revised form May 4, 1993.
22 PCR Methods and Applications
Cold Spring Harbor Laboratory Press on May 22, 2016 - Published by genome.cshlp.orgDownloaded from

1993 3: 13-22 Genome Res. C P Kimpton, P Gill, A Walton, et al. short tandem repeat loci.Automated DNA profiling employing multiplex amplification of
References
http://genome.cshlp.org/content/3/1/13.full.html#ref-list-1
This article cites 43 articles, 17 of which can be accessed free at:
License
Commons Creative
http://creativecommons.org/licenses/by-nc/3.0/.described at
a Creative Commons License (Attribution-NonCommercial 3.0 Unported License), as ). After six months, it is available underhttp://genome.cshlp.org/site/misc/terms.xhtml
first six months after the full-issue publication date (see This article is distributed exclusively by Cold Spring Harbor Laboratory Press for the
ServiceEmail Alerting
click here.top right corner of the article or
Receive free email alerts when new articles cite this article - sign up in the box at the
http://genome.cshlp.org/subscriptionsgo to: Genome Research To subscribe to
Copyright © Cold Spring Harbor Laboratory Press
Cold Spring Harbor Laboratory Press on May 22, 2016 - Published by genome.cshlp.orgDownloaded from