Zea ribosomal repeat evolution and substitution patterns
10
Zea Ribosomal Repeat Evolution and Substitution Patterns Edward S. Buckler IV and Timothy P. Holtsford Division of Biological Sciences, University of Missouri Zea and Tripsacum nuclear ribosomal internal transcribed spacer (ITS) sequences were used to evaluate patterns of concerted evolution, rates of substitutions, patterns of methylation-induced deamination, and structural constraints of the ITS. ITS pseudogenes were identified by their phylogenetic position, differences in nucleotide composition, extensive deamination at ancestral methylation sites, and substitutions resulting in low-stability secondary RNA structures. Selection was important in shaping the kinds of polymorphisms and substitutions observed in the ITS. ITS substitution rates were significantly different among the Zea taxa. Deamination of cytosines at methylation sites was a potent mutation source, but selection appeared to maintain high methylation site density throughout the ribosomal repeat except for the gene promoter. Nucleotide divergence statistics identified selectively constrained regions at the 5’ ends of the ITS1 and ITS2. Introduction We sequenced nuclear ribosomal internal tran- scribed spacer (ITS) alleles from Zea and its sister genus Tripsacum to try to elucidate mutation origin and fixa- tion and the functional constraints of rDNA. ITS se- quences evolve rapidly, but size and functional con- straints permit comparison of homologous sequences be- tween taxa (Baldwin et al. 1995). Hence, the ITS is use- ful for examining the rates of substitution among closely related taxa and for studying fixation by molecular drive (Schlotterer and Tautz 1994). In maize (2. mays ssp. mays) the single rDNA array is located on the short arm of chromosome 6, and the number of repeats within the array varies between 2,500 and 24,000 per diploid ge- nome or roughly 1% of the genome (Phillips et al. 1988). To study the origin of mutations we related substi- tution rates to cellular processes. The number of germ- line cell divisions and generation time (generation time effect) may account for much of the substitution rate variability in mammals (Wu and Li 1985) and plants (Gaut et al. 1992). Highly diverged taxa have been used to show these relations, and as a result, differences other than generation length have had time to evolve between taxa. Within the closely related Zea, generation length is one of the major differences between the species (Doebley and Iltis 1980). Further, the generation time hypothesis has not been tested while using a phyloge- netic hypothesis to account for correlation due to shared ancestry. Fixation of mutations in tandem arrays of genes requires homogenization throughout both the array and the population (lineage). Ribosomal repeats exhibit a pattern of concerted evolution in which repeats within Abbreviations: ITS, internal transcribed spacer; IGS, intergenic spacer; ETS, external transcribed spacer; mCpG, methylated CpG di- nucleotide; MeCP, methyl-CpG binding protein. Key words: nuclear rDNA internal transcribed spacer (ITS), plant methylation and deamination, pseudogenes, substitution rates, struc- tural constraints, concerted evolution, Zea and maize. Address for correspondence and reprints: Edward S. Buckler IV, Division of Biological Sciences, 105 Tucker Hall, University of Mis- souri, Columbia, Missouri 65211. E-mail: [email protected]. missouriedu. Mol. Biol. Evol. 13(4):623-632. 1996 0 1996 by the Society for Molecular Biology and Evolution. ISSN: 0737-4038 one array are more closely related to one another than to repeats in arrays on other chromosomes (Schlotterer and Tautz 1994; Copenhaver et al. 1995) or to repeats in other taxa (Arnheim 1983). Unequal crossing over (Smith 1976), gene conversion (Arnheim 1983), and bi- ased gene conversion (Hillis et al. 1991) are the mech- anisms responsible for molecular drive. We investigated how mutations become fixed by contrasting the patterns of fixed differences between lineages with polymor- phisms unique to individual alleles. We also examined the substitution patterns of four Zea ITS pseudogenes, which had escaped homogenization from before the spe- ciation of modern Zea (Buckler and Holtsford 1996). We examined the functional constraints on ITS se- quence evolution by mapping nucleotide divergence with a sliding window approach. The ITS regions appear to act like biological springs with many hairpins, which result in properly positioned cleavage sites (Venkates- warlu and Nazar 1991). The sequence alignment of an- giosperm species identified one well-conserved region in the ITS1 and a moderately conserved region in ITS2 (Liu and Schardl 1994). Mutational analyses of yeast ITS1 structure and function suggest multiple domains are important for efficient processing of the 17s and 26s rRNAs (van Nues et al. 1994). Since the angiosperm analysis came from a diverse array of species, we be- lieved that comparing closely related alleles could reveal other structurally important processing regions. Transcriptional regulation may impose further func- tional constraints on rDNA sequence evolution. Nearly every rDNA cytosine is methylated at CpG and CpNpG sites, except near the promoter in actively transcribed ribosomal repeats (Jupe and Zimmer 1990, 1993). Meth- ylation is also associated with chromatin packaging and a reduction in transcription (Selker 1990). Methylated cytosines leave an evolutionary footprint, because they frequently mutate to a thymine (Vairapandi and Duker 1994). This process leads to a depletion of CpG sites in most genes, but the ribosomal repeats show no overall depletion (Gardiner-Garden, Sved, and Frommer 1992). Methylation-related deaminations were characterized in the normal and pseudogene repeats of Zea, and the dis- tribution of CpG sites was examined throughout the Zea ribosomal repeat. 623
-
Upload
independent -
Category
Documents
-
view
3 -
download
0
Transcript of Zea ribosomal repeat evolution and substitution patterns

Zea Ribosomal Repeat Evolution and Substitution Patterns
Edward S. Buckler IV and Timothy P. Holtsford Division of Biological Sciences, University of Missouri
Zea and Tripsacum nuclear ribosomal internal transcribed spacer (ITS) sequences were used to evaluate patterns of concerted evolution, rates of substitutions, patterns of methylation-induced deamination, and structural constraints of the ITS. ITS pseudogenes were identified by their phylogenetic position, differences in nucleotide composition, extensive deamination at ancestral methylation sites, and substitutions resulting in low-stability secondary RNA structures. Selection was important in shaping the kinds of polymorphisms and substitutions observed in the ITS. ITS substitution rates were significantly different among the Zea taxa. Deamination of cytosines at methylation sites was a potent mutation source, but selection appeared to maintain high methylation site density throughout the ribosomal repeat except for the gene promoter. Nucleotide divergence statistics identified selectively constrained regions at the 5’ ends of the ITS1 and ITS2.
Introduction
We sequenced nuclear ribosomal internal tran- scribed spacer (ITS) alleles from Zea and its sister genus Tripsacum to try to elucidate mutation origin and fixa- tion and the functional constraints of rDNA. ITS se- quences evolve rapidly, but size and functional con- straints permit comparison of homologous sequences be- tween taxa (Baldwin et al. 1995). Hence, the ITS is use- ful for examining the rates of substitution among closely related taxa and for studying fixation by molecular drive (Schlotterer and Tautz 1994). In maize (2. mays ssp. mays) the single rDNA array is located on the short arm of chromosome 6, and the number of repeats within the array varies between 2,500 and 24,000 per diploid ge- nome or roughly 1% of the genome (Phillips et al. 1988).
To study the origin of mutations we related substi- tution rates to cellular processes. The number of germ- line cell divisions and generation time (generation time effect) may account for much of the substitution rate variability in mammals (Wu and Li 1985) and plants (Gaut et al. 1992). Highly diverged taxa have been used to show these relations, and as a result, differences other than generation length have had time to evolve between taxa. Within the closely related Zea, generation length is one of the major differences between the species (Doebley and Iltis 1980). Further, the generation time hypothesis has not been tested while using a phyloge- netic hypothesis to account for correlation due to shared ancestry.
Fixation of mutations in tandem arrays of genes requires homogenization throughout both the array and the population (lineage). Ribosomal repeats exhibit a pattern of concerted evolution in which repeats within
Abbreviations: ITS, internal transcribed spacer; IGS, intergenic spacer; ETS, external transcribed spacer; mCpG, methylated CpG di- nucleotide; MeCP, methyl-CpG binding protein.
Key words: nuclear rDNA internal transcribed spacer (ITS), plant methylation and deamination, pseudogenes, substitution rates, struc- tural constraints, concerted evolution, Zea and maize.
Address for correspondence and reprints: Edward S. Buckler IV, Division of Biological Sciences, 105 Tucker Hall, University of Mis- souri, Columbia, Missouri 65211. E-mail: [email protected]. missouriedu.
Mol. Biol. Evol. 13(4):623-632. 1996 0 1996 by the Society for Molecular Biology and Evolution. ISSN: 0737-4038
one array are more closely related to one another than to repeats in arrays on other chromosomes (Schlotterer and Tautz 1994; Copenhaver et al. 1995) or to repeats in other taxa (Arnheim 1983). Unequal crossing over (Smith 1976), gene conversion (Arnheim 1983), and bi- ased gene conversion (Hillis et al. 1991) are the mech- anisms responsible for molecular drive. We investigated how mutations become fixed by contrasting the patterns of fixed differences between lineages with polymor- phisms unique to individual alleles. We also examined the substitution patterns of four Zea ITS pseudogenes, which had escaped homogenization from before the spe- ciation of modern Zea (Buckler and Holtsford 1996).
We examined the functional constraints on ITS se- quence evolution by mapping nucleotide divergence with a sliding window approach. The ITS regions appear to act like biological springs with many hairpins, which result in properly positioned cleavage sites (Venkates- warlu and Nazar 1991). The sequence alignment of an- giosperm species identified one well-conserved region in the ITS1 and a moderately conserved region in ITS2 (Liu and Schardl 1994). Mutational analyses of yeast ITS1 structure and function suggest multiple domains are important for efficient processing of the 17s and 26s rRNAs (van Nues et al. 1994). Since the angiosperm analysis came from a diverse array of species, we be- lieved that comparing closely related alleles could reveal other structurally important processing regions.
Transcriptional regulation may impose further func- tional constraints on rDNA sequence evolution. Nearly every rDNA cytosine is methylated at CpG and CpNpG sites, except near the promoter in actively transcribed ribosomal repeats (Jupe and Zimmer 1990, 1993). Meth- ylation is also associated with chromatin packaging and a reduction in transcription (Selker 1990). Methylated cytosines leave an evolutionary footprint, because they frequently mutate to a thymine (Vairapandi and Duker 1994). This process leads to a depletion of CpG sites in most genes, but the ribosomal repeats show no overall depletion (Gardiner-Garden, Sved, and Frommer 1992). Methylation-related deaminations were characterized in the normal and pseudogene repeats of Zea, and the dis- tribution of CpG sites was examined throughout the Zea ribosomal repeat.
623

624 Buckler and Holtsford
Materials and Methods Repeat Sampling and Phylogeny
Sixty-six ITS regions were sampled from all the species and subspecies of Zea, and eight ITS sequences were sampled from four representative taxa of Tripsa- cum (table 1 of Buckler and Holtsford 1996). Sequences are uniquely identified by a clone number (e.g., #53). Methods and results related to the sampling of repeats and taxon polymorphism are covered in Buckler and Holtsford (1996). The maximum-likelihood tree with in- dels was the phylogeny used in the present study (figs. 1 and 2 of Buckler and Holtsford 1996).
Rates of Substitution
Rates of substitution were determined using the maximum-likelihood solution to the relative rate test (Muse and Weir 1992), which accommodated the biased base composition of Zea alleles. Rates and confidence intervals of transitions ((x), transversions (B), and total substitutions (k = cx + 2B) were compared between pairs of alleles and then averaged over comparisons be- tween taxa following Gaut et al. (1992). Zea m. ssp. mexicana (#53), a putative pseudogene, and T. lawn (#92) were used as outgroups. Since 2. perennis and 2. diploperennis were phylogenetically indistinguishable and have similar environments and habits, these alleles were pooled for estimation of the rates of substitution. Alleles cloned from 2. perennis and 2. diploperennis which were introgressants from 2. m. ssp. mays were excluded from the rate estimates.
We investigated the generation time hypothesis us- ing independent contrasts (Felsenstein 1985) to control for the phylogenetic structure of the taxa. Since only a rough ranking of generation time could be made with the available data, generation time rank orders and sub- stitution rate ratios (relative to 2. diploperennislperen- nis) were estimated. The unrooted phylogeny assumed was: (((Zmmy, Zmmx, Zmp), Zmh), Zl, Zd/p). Rates and ranks at ancestral nodes were estimated by aver- aging the values at lower nodes. A Spearman’s rank cor- relation coefficient was calculated among the contrasts of generation time rank and the contrasts of substitution rate (Felsenstein 1985; Snedecor and Cochran 1989). Ranks were randomly shuffled to produce the null dis- tribution used to determine significance.
Substitution Patterns
Substitution patterns of fixed substitutions versus unique polymorphisms were compared by mapping character-state changes on the topology of the maxi- mum-likelihood tree. The parsimony methods of MacClade 3.01 (Maddison and Maddison 1992) were used to trace character-state changes onto the phylogeny. Fixed events were defined as differences between spe- cies (not subspecies) that were fixed (excluding inferred homoplasies), and unique events were defined as poly- morphisms found in one allele within one species. The intermediate class of polymorphisms (i.e., polymor- phisms shared among some of the alleles within one species) were excluded from analysis, because differ- entiating homoplasy from recombination was difficult.
Zea m. ssp. mays (#32), an allele with a large deletion, and the putative pseudogenes were excluded. Sorghum matarunkense (#69) was used as the outgroup in order to infer the direction of the fixed substitutions. Fixed and unique substitution patterns were also compared to Zea nuclear substitution patterns at Adhl introns (the Z. diploperennis allele was used as an outgroup, Gaut and Clegg 1993a) and four unidentified single-copy nuclear RFLP loci (Shattuck-Eidens et al. 1990). The neutral Adhl and RFLP loci substitution patterns provide a baseline for comparison with Zea ITS substitutions.
Inference of ancestral character states with parsi- mony did not account for multiple substitutions at a site. A bias caused by multiple substitutions is unlikely as the alleles between Zea and Tripsacum are only di- verged 9%. However, the potential bias was estimated with three models. In model one, we estimated the effect of multiple hits and rate variation among sites on the transition bias (Tamura and Nei 1993; Wakeley 1994). In model two, the effect of base composition bias was assessed; Collins, Wimberger, and Naylor’s (1994) study indicates that with the low levels of divergence and the observed fraction of rare states that only minor (cO.10) depressions in the ratio of inferred to actual base changes would have occurred. In model three, we sim- ulated the divergence of two sequences (Zea) by the accumulation of random substitutions based on the unique polymorphism pattern (table 3). The simulation was repeated 500 times, and the minimum and maxi- mum transition-to-transversion ratios between sequences were compared to the observed fixed substitution ratio.
Nucleotide substitution patterns were evaluated in the four putative pseudogenes by counting unambiguous substitutions using MacClade 3.01 (Maddison and Mad- dison 1992) with 2. perennis (#03) as the outgroup. This outgroup diverges at approximately the same point as the pseudogenes from the other Zea (Buckler and Holts- ford 1996).
The equilibrium substitution model was used to calculate the expected values for each substitution class based on the ITS region’s average nucleotide composi- tion (Holmquist 1983). G-tests for goodness of fit were used to evaluate differences between observed and ex- pected substitution frequencies, while G-tests for inde- pendence were used to evaluate differences between the fixed and unique substitution categories (Sokal and Rohlf 1981). The fixed substitutions had small (f < 5) expected values for 10 of 12 possible substitution class- es; therefore, complementary classes were combined to form joint classes with larger expected frequencies (So- kal and Rohlf 198 1).
ITS Structural Constraint
Structural constraint on substitutions was estimated throughout the ITS region; we estimated the average Ki- mura’s two-parameter nucleotide divergence between 10 Poaceae species and within the Zea species using a 30- bp sliding window (Kimura 1980; Kreitman and Hudson 1991). Ten genera were used in the Poaceae analyses (Avena Zongiglumis #72, Clestachne sorghoides #67, Coix sp. #93, Hordeum vulgare #73, Oryza sativa #78,

Ribosomal Repeat Evolution 625
Sorghum bicolor #68, Secale montanum #8 1, Tripsacum dactyloides #84, Triticum aestivum #79, Zea mays ssp. mays #18; GenBank accessions listed in Buckler and Holtsford 1996). Species’ infraspecific divergence was estimated as the average divergence of all alleles within a species. The Zea infraspecific divergence was the weighted average of individual species’ infraspecific di- vergence (weight = [# of alleles in species]/[# of alleles in Zeal).
Minimum-energy secondary structures were esti- mated for the ITS1 and ITS2 regions of all Zea and Tripsacum alleles with the computer program mFold (Zuker 1989). To test whether fixed or unique substitu- tions were more destabilizing on predicted minimum en- ergy, we randomly mutated ITS1 or ITS2 sites of the reconstructed Central Mexican Z. mays ancestor (Buck- ler and Holtsford 1996) with two mutations from the observed pattern of fixed substitutions or unique poly- morphisms. We investigated the effect of two mutations, as roughly two unique polymorphisms were found in each ITS1 and ITS2. The random substitutions were done without replacement; therefore, 30 mutants based on fixed substitutions and 128 based on unique poly- morphisms were tested for their effects on AG in ITS1 and ITS2.
Analysis of Methylation-Related Substitutions
Deamination mutations were examined at cytosine sites along both coding and noncoding strands. Possible sites of deamination were determined for Zea by com- parison with the Tripsacum outgroup. If a potential methylation site (CpG or CpNpG, Gardiner-Garden, Sved, and Frommer 1992) was present in 75% of the Tripsacum alleles, it was considered ancestral and sub- stitutions characteristic of methyl-cytosine to thymine deaminations were tabulated. Substitutions were evalu- ated on a site-by-site basis so that even if multiple al- leles shared the same substitution, it was counted as one substituted site. Base-composition microenvironments have been suggested to affect the rates of deamination (Adams and Eason 1984); therefore, a sliding window was used to measure GC content in the five bases up- stream and downstream of possible methylation sites. Analysis of variance was used to compare GC content between regions surrounding unsubstituted methylation sites versus those surrounding inferred deamination sites.
The number of CpG sites was determined for each region of the ribosomal repeat (sequences came from various rDNA repeats): the maize ITS region, the maize intergenic spacer (IGS) (GenBank: ZMETS 1, McMullen et al. 1986), the maize 17s (GenBank: MZERG17S, Messing et al. 1984), and the rice 25s (GenBank: RI- CRGHA, Sugiura et al. 1985). The ribosomal IGS con- tains multiple subrepeats, which are phylogenetically re- lated to one another; hence, the subrepeats are not fully independent samples. Therefore, both the entire IGS and a subrepeat average were used in calculations. Ob- served-to-expected CpG ratios (O/E CpG) were evalu- ated with lOO-bp sliding windows following Gardiner- Garden and Frommer (1987). Since O/E CpG ratios are
not normally distributed and regions with low GC con- tent have larger O/E variances, we used CpG z-scores to identify regions with aberrant densities of CpG. We estimated an expected mean number of CpG sites (E) and a standard deviation (s) by shuffling the sequence within the lOO-bp window 100 times. Then a CpG z- score [(0-E)/s] was calculated for each window, and sig- nificant deviations from the average of the z-scores were identified by the Grubbs test for outliers (Sokal and Rohlf 1981). CpG densities were also compared by re- gion with expectations derived from the regions’ nucle- otide frequencies [E(CpG) = j(C) X j(G) X n bases] and the regions’ nucleotide frequencies scaled by the average level of CpG depletion found in noncoding monocot sequences [E(CpG) = 0.73 X f(C) X JTG) X n, Gardiner-Garden, Sved, and Frommer 19921.
Results Sequences
Zea and Tripsacum ITSl, 5.8S, and ITS2 regions have GC contents of 70.4%, 56.3%, and 73.3%, respec- tively. All of the Zea and Tripsacum alleles have similar base composition except for the four putative pseudo- gene alleles. The standard deviation of the four nucle- otide frequencies of the normal Zea and Tripsacum al- leles was equal to or less than 0.5%. The pseudogenes have a GC content roughly 3.6% lower than normal al- leles. Stefansky’s maximum normal residuals (MNR) (Snedecor and Cochran 1989) sequentially identified the four pseudogenes as the only outliers for GC content (MNR = 0.541, 0.576, 0.631, and 0.580; P < 0.01 for each test).
Rates of Evolution
Pseudogene Z. m. ssp. mexicana (#53) was basal yet closely related to all the Zea alleles (Buckler and Holtsford 1996), so it was an excellent outgroup for the relative rate tests (table 1). Using T. Zaxum (#92) as an outgroup produced similar results. There were signifi- cant substitution rate differences, especially between Z. mays with Z. diploperennislperennis and Z. luxurians. Transversions exhibited greater differences than did transitions. Transversions were significantly more nu- merous in maize, the domesticate, than in some wild Z. mays, while transitions were statistically equivalent.
The rates of substitution for the pseudogenes were estimated using T. laxum as an outgroup. The pseudo- genes had between 5.15 and 6.57 more transitions than the species or subspecies of Zea. Transversions were 1.52 times more frequent in Z. mays than in the pseu- dogenes. Transversions were more frequent, but not sig- nificantly so, in the pseudogenes compared to Z. diplo- perennislperennis and Z. luxurians.
We used the life history of the various Zea taxa to establish relative generation lengths. Zea diploperennis and Z. perennis are perennials, which are known to pro- duce dense stands of clones (Benz, Sanchez-Velasquez, and Michel 1990). Zea luxurians is an annual in its cur- rent Guatemalan and Honduran habitats (Doebley and Iltis 1980); however, when grown under more northerly

626 Buckler and Holtsford
Table 1 Relative Rates of Substitution
Zw Zmmx Zmh WP Z. luxurians
All substitutions: Z. m. ssp. mays . . . . . . . . . . . . . . . . 1.15” (0.21)b 1.21 (0.22) 1.36 (0.29) 1.69 (0.29) 2.39 (0.45) Z. m. ssp. parviglumis . . . . . . . . . . . 1.05 (0.22) 1.20 (0.28) 1.56 (0.31) 2.25 (0.48) Z. m. ssp. mexicana . . . . . . . . . . . . . 1.15 (0.26) 1.51 (0.30) 2.23 (0.50) Z. m. ssp. huehuetenangensis . . . . . 1.34 (0.37) 2.01 (0.65) Z. diploperennislperennis . . . . . . . . 1.55 (0.40)
Transitions:
Z. m. ssp. mays . . . . . . . . . . . . . . . . 0.95 (0.23) 1.21 (0.32) 0.86 (0.28) 1.20 (0.23) 1.66 (0.42) Z. m. ssp. parviglumis . . . . . . . . . . . 1.28 (0.38) 0.90 (0.32) 1.25 (0.28) 1.73 (0.52) Z. m. ssp. mexicana . . . . . . . . . . . . . 0.71 (0.28) 1.07 (0.26) 1.54 (0.49) Z. m. ssp. huehuetenangensis . . . . . 1.33 (0.43) 1.93 (0.87) Z. diploperennislperennis . . . . . . . . 1.42 (0.46)
Transversions:
Z. m. ssp. mays . . . . . . . . . . . . . . . . l.Sl(O.51) 1.21 (0.22) 3.79 (1.63) 4.90 (1.81) 6.29 (2.41) Z. m. ssp. parviglumis . . . . . . . . . . . 0.65 (0.23) 2.66 (1.31) 3.49 (1.57) 4.90 (2.29) Z. m. ssp. mexicana . . . . . . . . . . . . . 3.31 (1.64) 4.27 (1.87) 5.69 (2.65) Z. m. ssp. huehuetenangensis . . . . . 1.36 (0.64) 2.28 (1.40) Z. diploperennislperennis . . . . . . . . 2.26 (1.37)
No=.-The pseudogene Z. mays ssp. mexicana (#53) was the outgroup. Zmp-Z. m. ssp. parviglumis, Zmmr--Z. m.
ssp. mexicana, Zmh-Z. m. ssp. huehuetenangensis, zd/p-Z. diploperennislperennis.
a The ratio of the relative substitution rates. The taxon at left is the numerator and the taxon in the column heading is
the denominator, i.e., Z. m. ssp. mays has 1.15 times more substitutions than Z. m. ssp. parviglumis. The significant
comparisons are in bold type.
b The jackknifed 95% confidence intervals.
climates 2. Zuxurians may act more perennial (Doebley and Iltis 1980); this is suggestive of a semiperennial habit. All of the wild Zea produce seeds with protective glumes which probably allow the seeds to remain in the seed bank for several years (Beadle 1977), lengthening generation time. Domesticated 2. m. ssp. mays is often planted for multiple crops per year in the tropics. Hence, natural history would predict the following rank order for generation times: 2. m. ssp. mays < 2. m. ssp. mex- icana, parviglumis, and huehuetenangensis < Z. luxu- rians < Z. diploperennislperennis.
None of the rank correlations between the contrasts of generation time and substitution rate were significant, but all substitution rate classes were negatively corre- lated with generation length (n = 7 contrasts, total sub- stitutions rS = -0.562, P = 0.163; transitions rs = -0.580, P = 0.150; transversions r, = -0.661, P = 0.108). When Z. Zuxurians is assumed to have a gener- ation length similar to other wild Z. mays, then there are no correlations with generation length.
Substitution Pattern Analysis
Substitution patterns were very different between unique and fixed classes (table 3). We estimated the tran- sition/transversion bias caused by multiple substitutions and rate variation among sites. The ITS distribution of rate variation among sites did not fit a Poisson distri- bution (P = 0.02) but was not significantly different from a negative binomial (P = 0.43), suggesting that some sites are more mutable (gamma parameter a = 1.266; method of Tamura and Nei 1993). However, the gamma-distribution-corrected estimates of unique and fixed transition/transversion patterns were almost exact- ly the same as the observed patterns (corrected fixed cl/
l3 = 0.78, SD = 0.22; corrected unique cl/p = 2.52, SD = 0.35; method of Wakeley 1994). Simulations of ac- cumulated divergence according to the pattern of unique polymorphisms indicated that this process did not lead to the observed (x/p of fixed substitutions, even when divergence reached 50% (P < 0.01).
Both unique (G = 239.0, df = 11, P < 0.001) and fixed (G = 17.8, df = 5, P < 0.005) substitution classes were significantly different from null expectations based on equilibrium base composition (Holmquist 1983). Unique polymorphisms were dominated by transitions (G = 176.62, df = 1, P < O.OOl), while fixed substi- tutions did not differ from the expected frequency of transitions and transversions (G = 3.52, df = 1, P > 0.05). Transition and transversion frequencies were sig- nificantly different between fixed and unique substitu- tion classes (G = 14.19, df = 1, P < 0.001). Fixed substitutions have a larger number of substituted cyto- sines than expected (G = 7.41, df = 1, P < 0.01). In RNA, G-U base pairing is relatively stable, hence mu- tations from A-U and G-C pairing to G-U pairing would maintain hairpin stem structure (Lewin 1990). Therefore A+G or C+T transitions would maintain stem struc- ture, and there were many more hairpin-maintaining transitions than stem-destroying polymorphisms in the unique substitution class (G = 126.3, df = 1, P < 0.001). C-+T transitions could also be indicative of methylation-induced deaminations, but in normal alleles these transitions were not over-represented at methyl- ation sites (see below) and the A+G transitions were more prevalent. There were more stem-maintaining sub- stitutions in the unique than fixed substitution classes (G = 4.85, df = 1, P < 0.05). The fraction of indels was
Ribosomal Repeat Evolution 627
bp
Zea Infraspecitk Divergence
ITS2 ITS1 5.8s
Poaceae Interspecific Divergence
5.8s ITS2 0.60 -
C-D &
J- O,,T,,-_rP,,,, I_ 50 100 150 200 250 300 350 400 450 500 550 600
Consensus Base Pair
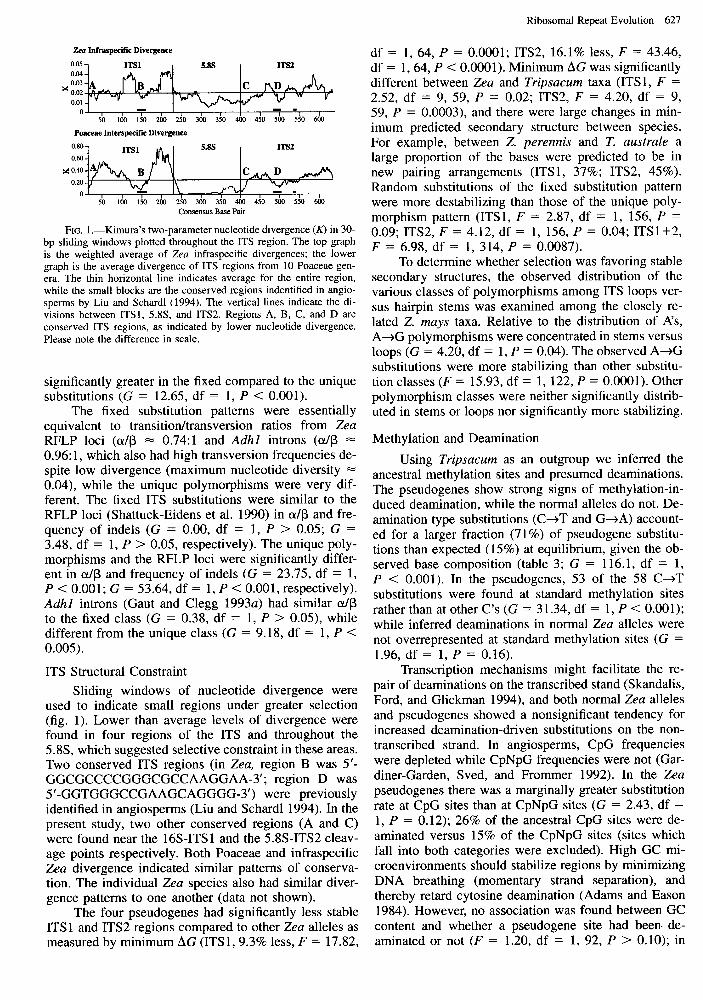
FIG. 1 .-Kimura’s two-parameter nucleotide divergence (K) in 30- sliding windows plotted throughout the ITS region. The top graph
is the weighted average of Zea infraspecific divergences; the lower graph is the average divergence of ITS regions from 10 Poaceae gen- - _ era. The thin horizontal line indicates average for the entire region, while the small blocks are the conserved regions indentified in angio- sperms by Liu and Schardl (1994). The vertical lines indicate the di- visions between ITSl, 5.8S, and ITS2. Regions A, B, C, and D are conserved ITS regions, as indicated Please note the difference in scale.
by lower nucleotide divergence.
significantly greater in the fixed compared to the unique substitutions (G = 12.65, df = 1, P < 0.001).
The fixed substitution patterns were essentially equivalent to transition/transversion ratios from Zea RFLP loci (o/p = 0.74:1 and A&l introns ((Y/B = 0.96: 1, which also had high transversion frequencies de- spite low divergence (maximum nucleotide diversity = 0.04), while the unique polymorphisms were very dif- ferent. The fixed ITS substitutions were similar to the RFLP loci (Shattuck-Eidens et al. 1990) in o/B and fre- quency of indels (G = 0.00, df = 1, P > 0.05; G = 3.48, df = 1, P > 0.05, respectively). The unique poly- morphisms and the RFLP loci were significantly differ- ent in a/B and frequency of indels (G = 23.75, df = 1, P < 0.001; G = 53.64, df = 1, P < 0.001, respectively). A&l introns (Gaut and Clegg 1993a) had similar o/B to the fixed class (G = 0.38, df = 1, P > 0.05), while different from the unique class (G = 9.18, df = 1, P < 0.005).
ITS Structural Constraint
Sliding windows of nucleotide divergence were used to indicate small regions under greater selection (fig. 1). Lower than average levels of divergence were found in four regions of the ITS and throughout the 5.8S, which suggested selective constraint in these areas. Two conserved ITS regions (in Zea, region B was 5’- GGCGCCCCGGGCGCCAAGGAA-3’; region D was 5 ‘-GGTGGGCCGAAGCAGGGG-3’) were previously identified in angiosperms (Liu and Schardl 1994). In the present study, two other conserved regions (A and C) were found near the 16S-ITS 1 and the 5.8S-ITS2 cleav- age points respectively. Both Poaceae and infraspecific Zea divergence indicated similar patterns of conserva- tion. The individual Zea species also had similar diver- gence patterns to one another (data not shown).
The four pseudogenes had significantly less stable ITS1 and ITS2 regions compared to other Zea alleles as measured by minimum AG (ITSl, 9.3% less, F = 17.82,
df = 1, 64, P = 0.0001; ITS2, 16.1% less, F = 43.46, df = 1,64, P < 0.0001). Minimum AG was significantly different between Zea and Tripsacum taxa (ITSl, F = 2.52, df = 9, 59, P = 0.02; ITS2, F = 4.20, df = 9, 59, P = 0.0003), and there were large changes in min- imum predicted secondary structure between species. For example, between 2. perennis and T. australe a large proportion of the bases were predicted to be in new pairing arrangements (ITSl, 37%; ITS2, 45%). Random substitutions of the fixed substitution pattern were more destabilizing than those of the unique poly- morphism pattern (ITSl, F = 2.87, df = 1, 156, P = 0.09; ITS2, F = 4.12, df = 1, 156, P = 0.04; ITS1+2, F = 6.98, df = 1, 314, P = 0.0087).
To determine whether selection was favoring stable secondary structures, the observed distribution of the various classes of polymorphisms among ITS loops ver- sus hairpin stems was examined among the closely re- lated 2. mays taxa. Relative to the distribution of A’s, A+G polymorphisms were concentrated in stems versus loops (G = 4.20, df = 1, P = 0.04). The observed A+G substitutions were more stabilizing than other substitu- tion classes (F = 15.93, df = 1, 122, P = 0.0001). Other polymorphism classes were neither significantly distrib- uted in stems or loops nor significantly more stabilizing.
Methylation and Deamination
Using Tripsacum as an outgroup we inferred the ancestral methylation sites and presumed deaminations. The pseudogenes show strong signs of methylation-in- duced deamination, while the normal alleles do not. De- amination type substitutions (C+T and G+A) account- ed for a larger fraction (71%) of pseudogene substitu- tions than expected (15%) at equilibrium, given the ob- served base composition (table 3; G = 116.1, df = 1, P < 0.001). In the pseudogenes, 53 of the 58 C+T substitutions were found at standard methylation sites rather than at other C’s (G = 31.34, df = 1, P < 0.001); while inferred deaminations in normal Zea alleles were not overrepresented at standard methylation sites (G = 1.96, df = 1, P = 0.16).
Transcription mechanisms might facilitate the re- pair of deaminations on the transcribed stand (Skandalis, Ford, and Glickman 1994), and both normal Zea alleles and pseudogenes showed a nonsignificant tendency for increased deamination-driven substitutions on the non- transcribed strand. In angiosperms, CpG frequencies were depleted while CpNpG frequencies were not (Gar- diner-Garden, Sved, and Frommer 1992). In the Zea pseudogenes there was a marginally greater substitution rate at CpG sites than at CpNpG sites (G = 2.43, df = 1, P = 0.12); 26% of the ancestral CpG sites were de- aminated versus 15% of the CpNpG sites (sites which fall into both categories were excluded). High GC mi- croenvironments should stabilize regions by minimizing DNA breathing (momentary strand separation), and thereby retard cytosine deamination (Adams and Eason 1984). However, no association was found between GC content and whether a pseudogene site had been- de- aminated or not (F = 1.20, df = 1, 92, P > 0.10); in

628 Buckler and Holtsford
Table 2 The Number of Bases in Ribosomal Regions, the Observed Number (obs) of and Fre- quency v) of CpGs, Expected Number (E) of CpGs, and Comparisons Between the Ob- served Number of CpGs and Various Expectations
G-TEST COMPARISONS WITH
REGION BASES OBS(CPG) f(CpG) E(CPG)~ Monocot
E(CPG) Averageb PromoterC
IGS Subrepeat ............ 2058 Average IGS subrepeat . . , . 206 PromoteIe ............... 136/l 36 ETS .................... 821 17s ..................... 1808 ITS1 .................... 212 5.8s .................... 164 ITS2 .................... 220 Rice25S ................ 3376
234 0.114 185.8 23 0.114 18.6
3/2 0.022/0.015 9.419.8 112 0.136 102.0 118 0.065 116.8
26 0.123 25.1 19 0.116 13.5 31 0.141 29.6
325 0.096 296.4
+++d
-_/---
+
+++ +++ ++ +++
_/_ - N/A +++ +++ +++ ++
+ +++ +++ +++
++ +++ +++ +++
a E(CpG) = f(C) X f(G) X no. of bases in region. b Monocot E(CpG) = E(CpG) X 0.73 (the CpG depletion in monocot noncoding regions found in Gardiner-Garden,
Sved, and Frommer 1992).
c Promoter E(CpG) = no. of bases X 0.022 (observed frequency of CpGs in maize ribosomal promoter).
d + indicates a positive deviation and - a negative deviation. +, P < 0.10; ++, P -=c 0.05; +++, P < 0.01. e G-tests for two maize promoter sequences (McMullen et al. 1986; Toloczyki and Feix 1986, respectively).
fact, the trend suggested greater deamination at high- GC regions.
The promoter had significantly fewer CpGs than expected while other regions, especially the IGS sub- repeats, had more CpGs than expected (table 2). CpG frequencies were evaluated throughout the ribosomal re- peat to look for regions exhibiting selection for CpG sites (fig. 2). Only promoter region z-scores of CpG den- sity were significant outliers from the distribution of z- scores from all lOO-bp sliding windows (bases 2235 to 2269 of ZMETS 1; some windows were P < 0.05 and others P < 0.01). A smaller scale (50-bp window) anal- ysis of the promoter region indicated that CpG densities were less than expected from base 2170 to 2308, which corresponded well with the end of the IGS repeats (2159) and the transcription initiation site (2296). An- other maize rDNA promoter sequence has one fewer CpG than ZMETS 1; the methylation site depression in this promoter sequence was even more pronounced (To- loczyki and Feix 1986). Using Gardiner-Garden and Frommer’s (1992) method to identify significantly CpG- rich regions, the entire repeat was significantly above the angiosperm average. The structurally constrained
Table 3 Substitution Patterns
regions (rRNA in a functional ribosome: 17S, 5.8S, and 25s) had lower densities of CpGs than the less struc- turally constrained regions (IGS repeats, promoter, ETS, and ITS; G = 18.53, df = 1, P < 0.001).
Discussion Ribosomal Pseudogenes
The pseudogenes have been able to escape homog- enization since before the divergence of Zea. Four al- leles were classified as pseudogenes by several lines of evidence. They were rare, basal to the Zea alleles (Buck- ler and Holtsford 1996), had a very different GC con- tent, had many deaminations at putative methylation sites, and had much less stable secondary RNA struc- tures. In Drosophila, an rDNA pseudogene is known from the sequence of an IGS region that contains no promoter (Linares, Bowen, and Dover 1994).
Rates of Substitution
The various taxa of Zea had significantly different rates of ITS substitution, which contrasts with the lack of rate variation found in the chloroplast restriction sites
Fixed Substitutions Unique Polymorphisms Pseudogene Substitutions
TO: TO: A C G T I+Dd A C G T I+D
A 14 00 A 7 62 16 2 C 11 4 10 3 c 14 9 49 1
FROM: G 1 5 4 3 G 32 5 10 3 T 1 6 2 1 T 7 32 2 1 I+D 1 2 2 0 I+D 1 2 1 1
Total = 61 Total = 257 j(I+D) = 0.20 o/Bb = 0.75 j(I+D) = 0.05 o/B = 2.50
TO: A C G T I+D
A 0 5 2 1 c 5 2 29 3 G 25 0 4 1 T 03 1 0 I+D 0 2 0 1
Total = 84 flI+D) = 0.10 o//p = 4.43
a I+D is insertions and deletions (indels).
b a/p is the transition-to-transversion ratio.

Ribosomal Repeat Evolution 629
1 I I
IGS subrepeats t ETs 1’s Rzn
Promoter
Rice 25s
FIG. 2.-The top graph plots lOO-bp windows of observed to expected CpG levels. The bottom graph plots lOO-bp windows for G+C frequency. The various regions of the ribosomal repeat are noted below the graphs. The dot indicates the region that was a signifcant outlier from the distribution of CpG density z-scores.
(Doebley, Renfroe, and Blanton 1987). Small popula- tions and base composition variation can cause differ- ences in substitution rate (Gaut and Clegg 19938), but Zea generally appears to have large population sizes (Gaut and Clegg 1993a) and had constant base com- position in normal ITS regions. Interestingly, annual 2. Zuxurians had a substitution rate as slow as or slower than the perennials, and 2. m. ssp. huehuetenangensis had the slowest substitution rate of the Z. muys subspe- cies. These taxa are the most southerly and tropical Zea taxa, which poses the question of whether temperature and/or moisture regimes modify replication fidelity and/ or repair efficiency. Or perhaps their generation time was longer in the past; Guatemalan environmental re- constructions during the Pleistocene and Holocene in- dicated climatic conditions (Leyden et al. 1994) which might lengthen generation time.
Relative substitution rates are related to generation time when highly diverged plants are compared (Gaut et al. 1992). The Zea ITS region possibly supports the generation time effect from closely related taxa, al- though the correlations of the phylogenetically indepen- dent contrasts were not significant, partially due to the small number of taxa being compared.
Despite replication errors being an important source of both transitions and transversions (von Borstel 1994), transversions showed much greater variation be- tween taxa. However, transitions may also be caused by pyrimidine dimerization, ionization, and 5methylcyto- sine deamination-phenomena which are related to ki- netic processes not linked to replication (Vairapandi and Duker 1994; von Borstel 1994). Therefore, transitions may be more closely related to sidereal time, while transversions are more tightly linked to cell replication cycles and generation time.
Unique versus Fixed Substitution Classes
Transitions dominated the unique polymorphism class (o/B = 2.5: 1, while the fixed substitution class was close to the random expectation (o/B = 0.75: 1. All three substitution bias models indicated that the transition/ transversion ratio differences were not artifacts of mul- tiple substitutions, sampling variance, or base compo- sition bias. Like the fixed class of Zea and Tripsacum substitutions, ITS divergence between Drosophila spe- cies had <x/B = OS:1 and several RNA secondary struc- ture changes (Schlotterer et al. 1994).
The unique polymorphisms were dominated by structurally stable polymorphisms. The unique poly-
morphisms had significantly more transitions than Zea RFLP loci and the Adhl introns which should be less structurally constrained than the ITS (Shattuck-Eidens et al. 1990; Gaut and Clegg 1993~). Strong purifying selection must have acted to produce the pattern of unique, structurally stable polymorphisms. By contrast, the fixed substitutions had an essentially random tran- sition/transversion ratio and were similar to the substi- tutions at the RFLP loci and the Adhl introns. The sim- ulation of randomly positioned mutations drawn from fixed substitution pattern indicated that this pattern of state changes was more destabilizing than the transition- dominated unique polymorphism pattern. However, the position of substitutions and polymorphisms within the ITS region was not random (fig. 1 and the rejection of Poisson distribution, Uzzell and Corbin 1971). This sug- gests that the fixed substitutions were restricted to regions with lesser topological constraint and minimal deleterious effect.
The concomitantly variable codons (covarions) concept may partially explain the differences between fixed substitutions and unique polymorphisms (Fitch and Markowitz 1970). Purifying selection permits a lim- ited number and range of polymorphisms at any one time, but each new polymorphism modifies the range of permissible changes so that many substitutions and sec- ondary structures are possible in the long term. The unique polymorphisms represented the fraction of mu- tations that did not disrupt the current ITS secondary structure. However, changes in ITS conformation were seen among the Zea and Tripsacum species, and the fixed class reflected the changes possible given prior substitutions.
Although selection is important in ITS evolution, drift and selfish mechanisms may play a role in over- coming the purifying selection to preserve stable ITS conformations. Bottlenecks and drift could come from two sources: variation in the number plants, and varia- tion in the number of ribosomal copies resulting from unequal crossing over. A severe bottleneck from either source could result in fixation of structurally destabiliz- ing substitutions. However, the large effective popula- tion size of maize (N, = 6.6 X 10⁵, Gaut and Clegg 1993~) and the many repeats per genome (Phillips et al. 1988) suggest that bottlenecks are less likely to be im- portant for the evolution of Zea. Biased gene conversion could also overcome purifying selection as seen in hy- brid parthenogenic lizards (Hillis et al. 1991). Amplifi- cation of repeats by mobile elements or reverse tran- scriptases could also play a role in the evolution of ri- bosomal repeats. Within the constraints of a covarion selection regime, drift and selfish amplification probably control the tempo of fixation by modulating the avail- able polymorphism.
Internal Transcribed Spacer Structure and Function
The sliding window analysis of nucleotide diver- gence indicated that four ITS regions are always selec- tively constrained. Two of these regions were previously identified in an angiosperm ITS sequence study (Liu and

630 Buckler and Holtsford
Schardl 1994), and two regions were novel. The novel regions were probably missed in the angiosperm study because the sequences evolved too rapidly in each lin- eage (similar arguments are used for IGS evolution in Moss and Stefanovsky 1995). Rapid sequence evolution could result from the coevolution of ITS sites and ded- icated ITS processing factors.
Infraspecific polymorphism and interspecies diver- gence exhibited similar regions of conservation, which suggested that similar selection pressures have been op- erating since the divergence of the grasses. Recombi- nation within the ITS must also be frequent, as small regions of high polymorphism were seen between highly conserved regions (e.g., between region B and the 5.8s).
rDNA Methylation Patterns
The pseudogenes, which were ravaged by deami- nations of methylated cytosines, argued for strong mu- tational pressure against methylation sites. However, we found no evidence for CpG depletion in most rDNA regions, and the entire repeat had high O/E CpG ratios. Regulatory and kinetic models have been used to ex- plain variation in densities of CpG sites. In regulatory models, unmethylated CpG-rich regions are associated with the 5’ end (including the promoter region) of housekeeping genes, while tissue-specific genes are un- likely to have CpG-rich regions (Gardiner-Garden and Frommer 1987, 1992). The kinetic stability model (few- er deaminations in high GC regions) has been refuted here and by Gardiner-Garden and Frommer (1987). The ribosomal repeats did not follow either of these estab- lished regulatory patterns. The high density of methy- latable CpG sites in nonpromoter regions, especially in the less structurally constrained regions, suggested se- lection for methylation-induced chromatin condensation. The low density of CpG sites in the promoter region may permit regulatory flexibility. We use vertebrate models of methylated DNA-protein interactions to ex- plain these and others’ observations of maize ribosomal repeats.
Since nuclear space conservation is selectively im- portant in large genomes (Selker 1990), the gigantic ri- bosomal array should be packaged to save cellular space and prevent the dispersal of transcription factors and RNA polymerase I (RPOI). The majority (~80%) of maize ribosomal repeats are transcriptionally inactive, heterochromatic, and DNase I inaccessible (Phillips et al. 1988; Jupe and Zimmer 1993); hence, 7,000 repeats or 63 megabases are inactive at any one time. All maize ribosomal repeats are almost fully methylated (Jupe and Zimmer 1990), which results in a high mCpG (methyl- ated CpG dinucleotide) density. High densities of mCpG are known to bind methyl-CpG-binding proteins (MeCP) in vertebrates, which help convert these regions into heterochromatin (Antequera, Boyes, and Bird 1990; Meehan, Lewis, and Bird 1992). The high CpG levels throughout the ribosomal repeat, despite strong muta- tional pressures against CpGs, argued for selection maintaining the CpGs. The less structurally constrained regions (IGS, ETS, and ITS) exhibited the highest CpG levels-perhaps relaxed structural constraints allowed
selection to elevate CpG densities, thereby increasing regulatory control.
Although ribosomal transcription is needed for cel- lular survival, the proportion of active repeats varies widely according to cell type and total copy number in a given maize plant (Phillips et al. 1988). The low CpG density of the ribosomal promoter permits regulation of transcriptional levels. In mammalian cell lines, methyl- ation of CpG-rich promoter regions results in mutation- like transcriptional inactivation (Antequera, Boyes, and Bird 1990). Low densities of mCpG dinucleotides (= 1%) can reversibly repress transcription, while high densities of mCpG (= 10%) completely repress tran- scription (Boyes and Bird 1992). Hence, the ribosomal promoter’s low CpG levels may allow flexibility in tran- scriptional activity. If the density of CpGs in the pro- moter was equivalent to that in the other ribosomal regions then transcription might be completely re- pressed.
The rDNA region near the maize promoter exhibits hypomethylation in transcriptionally active repeats (Jupe and Zimmer 1990, 1993). This hypomethylation is likely a consequence of chromatin structure and not the cause (Reeder 1989), as active promoters are bound and twist- ed by several transcription factors (Moss and Stefan- ovsky 1995), which could inhibit the methylating activ- ity of methyltransferase. The number of active repeats is probably determined by RPOI activity states and sev- eral transcription factors (Reeder 1989; Moss and Ste- fanovsky 1995).
Another hypothesis can explain the maintenance of high CpG densities in the face of deamination mutation pressure. A few entirely unmethylated ribosomal repeats may persist in the germline and preferentially give rise to future generations of repeats (Gardiner-Garden, Sved, and Frommer 1992). Mutational load would be lessened because the repeats that propagate themselves are not methylated. In Cucurbita about 3% of the repeats were completely unmethylated (Tori-es-Ruiz and Hemleben 1994), but in maize leaf tissue there is no indication of completely unmethylated repeats (Jupe and Zimmer 1990). The germline persistence and transcriptional reg- ulation/chromatin packaging models are not exclusive of one another.
To conclude, we established the existence of rDNA pseudogenes in plants; and for phylogenetic studies these pseudogenes could be invaluable outgroups. Sig- nificant variation in substitution rates was found among Zea species and subspecies. Selection was important in shaping the kinds of polymorphisms and substitutions observed in the ITS. Four ITS regions appeared to have selective constraint. Deamination of methylated cyto- sines was a strong mutational force, but selection for chromatin packing may maintain high densities of meth- ylation sites in ribosomal repeats.
Acknowledgments
We thank S. Muse for his relative rate program. We thank K. Cone, 0. Hoekenga, M. Muszynski, R. Sage, G. Smith, and E. Zimmer for discussing many of the

Ribosomal Repeat Evolution 63 1
covered topics. D. Bergstrom and two anonymous re- viewers provided helpful comments about this manu- script. This work was supported by an NSF Predoctoral Fellowship to E.S.B and UM Research Board award 93- 060.
LITERATURE CITED
ADAMS, R. L. I?, and R. EASON. 1984. Increased G+C content of DNA stabilises methyl CpG dinucleotides. Nucleic Acids Res. 125869-5877.
ANTEQUERA, E, J. BOYES, and A. BIRD. 1990. High levels of de novo methylation and altered chromatin structure at CpG islands in cell lines. Cell 62503-514.
ARNHEIM, N. 1983. Concerted evolution of multigene families. Pp. 38-61 in M. NEI and R. K. KOEHN, eds. Evolution of genes and proteins. Sinauer, Sunderland, Mass.
BALDWIN, B. G., M. J. SANDERSON, J. M. PORTER, M. E Wo- JCIECHOWSKI, C. S. CAMPBELL, and M. J. DONOGHUE. 1995. The ITS region of nuclear ribosomal DNA: a valuable source of evidence on angiosperm phylogeny. Ann. MO. Bot. Gard. 82:247-277.
BEADLE, G. W. 1977. The origin of Zea mays. Pp. 615-635 in C. A. REED, ed. Origins of agriculture. Mouton Press, The Hague.
BENZ, B. E, L. R. SANCHEZ-VELASQUEZ, and E J. S. MICHEL. 1990. Ecology and ethnobotany of Zea diploperennis: pre- liminary investigations. Maydica 3585-98.
BOYES, J., and A. BIRD. 1992. Repression of genes by DNA methylation depends on CpG density and promoter strength: evidence for involvement of a methyl-CpG binding protein. EMBO J. 11:327-333.
BUCKLER, E. S., and T. I? HOLTSFORD. 1996. Zea systematics: ribosomal ITS evidence. Mol. Biol. Evol. 13:612-622.
COLLINS, T. M., I? H. WIMBERGER, and G. J. I? NAYLOR. 1994. Compositional bias, character-state bias, and character-state reconstruction using parsimony. Syst. Biol. 43:482-496.
COPENHAVER, G. I-?, J. H. DOELLING, J. S. GENS, and C. S. PIKAARD. 1995. Use of RFLPs larger than lOO-kbp to map the position and internal organization of the nucleolus or- ganizer region on chromosome-2 in Arubidopsis thuliunu. Plant J. 7:273-286.
DOEBLEY, J. E, and H. H. ILTIS. 1980. Taxonomy of Zeu (Gra- mineae) I. A subgeneric classification with key to taxa. Am. J. Bot. 67:982-993.
DOEBLEY, J., W. RENFROE, and A. BLANTON. 1987. Restriction site variation in the Zeu chloroplast genome. Genetics 117: 139-147.
FELSENSTEIN, J. 1985. Phylogenies and the comparative meth- od. Am. Nat. 125:1-15.
FITCH, W. M., and E. MARKOW~. 1970. An improved method for determining codon variability in a gene and its appli- cation to the rate of fixation of mutations in evolution. Bio- them. Genet. 4:579-593.
GARDINER-GARDEN, M., and M. FROMMER. 1987. CpG islands in vertebrate genomes. J. Mol. Biol. 196:261-282.
GARDINER-GARDEN, M., and M. FROMMER. 1992. Significant CpG-rich regions in angiosperm genes. J. Mol. Evol. 34: 23 l-245.
GARDINER-GARDEN, M., J. A. SVED, and M. FROMMER. 1992. Methylation sites in angiosperm genes. J. Mol. Evol. 34: 219-230.
GAUT, B. S., and M. T. CLEGG. 1993u. Molecular evolution of the Adhl locus in genus Zeu. Proc. Natl. Acad. Sci. USA 90:5095-5099.
GAUT, B. S., and M. T. CLEGG. 1993b. Nucleotide polymor- phism in the Adhl locus of Pearl Millet (Pennisetum gZuuc- urn) (Poaceae). Genetics 135: 1091-1097.
GAUT, B. S., S. V. MUSE, W. D. CLARK, and M. T. CLEGG. 1992. Relative rates of nucleotide substitution at the rbcL locus of monocotyledonous plants. J. Mol. Evol. 35:292- 303.
HILLIS, D. M., C. MORITZ, C. A. PORTER, and R. J. BAKER. 1991. Evidence for biased gene conversion in concerted evolution of ribosomal DNA. Science 251:308-3 10.
HOLMQUIST, R. 1983. Transitions and transversions in evolu- tionary descent: an approach to understanding. J. Mol. Evol. 19: 134-144.
JUPE, E. R., and E. A. ZIMMER. 1990. Unmethylated regions in the intergenic spacer of maize and teosinte ribosomal RNA genes. Plant Mol. Biol. 14:333-347.
JUPE, E. R., and E. A. ZIMMER. 1993. DNaseI-sensitive and undermethylated rDNA is preferentially expressed in a maize hybrid. Plant Mol. Biol. 21:805-821.
KIMURA, M. 1980. A simple model for estimating evolutionary rates of base substitutions through comparative studies of nucieotide sequences. J. Mol. Evol. 16: 11 l-120.
KREITMAN, M., and R. R. HUDSON. 1991. Inferring the evo- lutionary histories of the Adh and Adh-dup loci in Dro- sophila meluoguster from patterns of polymorphism and di- vergence. Genetics 127:565-582.
LEWIN, B. 1990. The topology of nucleic acids. Pp. 75-88 in Genes IV. Cell Press, Cambridge, Mass.
LEYDEN, B. W., M. BRENNER, D. A. HODELL, and J. H. CURTIS. 1994. Orbital and internal forcing of climate on the Yucatan peninsula for the past ca. 36-Ka. Palaeogeogr. Palaeocli- matol. Palaeoecol. 19: 193-210.
LINARES, A. R., T. BOWEN, and G. A. DOVER. 1994. Aspects of nonrandom turnover involved in the concerted evolution of intergenic spacers within the ribosomal DNA of Dro- sophila melunoguster. J. Mol. Evol. 39: 15 l-l 59.
LIU, J. S., and C. L. SCHARDL. 1994. A conserved sequence in internal transcribed spacer-l of plant nuclear ribosomal- RNA genes. Plant Mol. Biol. 26:775-778.
MADDISON, W. I?, and D. R. MADDISON. 1992. MacClade: anal- ysis of phylogeny and character evolution. Sinauer, Sun- derland, Mass.
MCMULLEN, M. D., B. HUNTER, R. L. PHILLIPS, and I. RUB- ENSTEIN. 1986. The structure of the maize ribosomal DNA spacer region. Nucleic Acids Res. 14:49534968.
MEEHAN, R. R., J. D. LEWIS, and A. l? BIRD. 1992. Charac- terization of MeCP2, a vertebrate DNA binding protein with affinity for methylated DNA. Nucleic Acids Res. 20:5085- 5092.
MESSING, J., J. CARLSON, G. HAGEN, I. RUBENSTEIN, and A. OLESON. 1984. Cloning and sequencing of the ribosomal RNA genes in maize: the 17s region. DNA 3:3140.
Moss, T, and V. Y. STEFANOVSKY. 1995. Promotion and reg- ulation of ribosomal transcription in eukaryotes by RNA polymerase I. Prog. Nucleic Acid Res. Mol. Biol. 50:25- 66.
MUSE, S. V., and B. S. WEIR. 1992. Testing for equality of evolutionary rates. Genetics 132:269-276.
PHILLIPS, R. L., M. D. MCMULLEN, S. ENOMOTO, and I. RUB- ENSTEIN. 1988. Ribosomal DNA in maize. Pp. 201-214 in J. l? GUSTAFSON and R. APPELS, eds. Chromosome structure and function: impact of new concepts. Plenum Press, New York.
REEDER, R. H. 1989. Regulatory elements of the generic ri- bosomal gene. Cur-r. Opin. Cell Biol. 1:466-474.

632 Buckler and Holtsford
SCHL~TTERER, C., M. T. HAUSER, A. VON HAESELER, and D. TAUTZ. 1994. Comparative evolutionary analysis of rDNA ITS regions in Drosophila. Mol. Biol. Evol. 11513-522.
SCHL~ITERER, C., and D. TAUTZ. 1994. Chromosomal homo- geneity of Drosophila ribosomal DNA arrays suggests in- trachromosomal exchanges drive concerted evolution. Cut-r. Biol. 4:777-783.
SELKER, E. U. 1990. DNA methylation and chromatin struc- ture: a view from below. Trends Biochem. Sci. 15:103-107.
SHATTUCK-EIDENS, D. M., R. N. BELL, S. L. NEUHAUSEN, and T. HELENTJARIS. 1990. DNA sequence variation within maize and melon: observations from polymerase chain re- action amplification and direct sequencing. Genetics 126: 207-217.
SKANDALIS, A., B. N. FORD, and B. W. GLICKMAN. 1994. Strand bias in mutation involving 5methylcytosine deam- ination in the human hprt gene. Mutat. Res. 314:21-26.
SMITH, G. F? 1976. Evolution of repeated DNA sequences by unequal crossover. Science 191528535.
SNEDECOR, G. W., and W. G. COCHRAN. 1989. Statistical meth- ods. Iowa State Univ. Press, Ames.
SOKAL, R. R., and E J. ROHLF. 198 1. Biometry. W. H. Freeman and Co., San Francisco, Calif.
SUGIURA, M., Y. IIDA, K. 00~0, and E TAKAIWA. 1985. The complete nucleotide sequence of a rice 25s rRNA gene. Gene 37:255-259.
TAMURA, K., and M. NEI. 1993. Estimation of the number of nucleotide substitutions in the control region of mitochon- drial DNA in humans and chimpanzees. Mol. Biol. Evol. 10:5 12-526.
TOLOCZYKI, C., and G. FEIX. 1986. Occurrence of 9 homolo-
TORRES-RUIZ, R. A., and V. HEMLEBEN. 1994. Pattern and de- gree of methylation in ribosomal-RNA genes of Cucurbitu pepo L. Plant Mol. Biol. 26:1167-l 179.
UZZELL, T., and K. W. CORBIN. 1971. Fitting discrete proba- bility distributions to evolutionary events. Science 172: 1089-1096.
VAIRAPANDI, M., and N. J. DUKER. 1994. Excision of ultravi- olet-induced photoproducts of 5-methylcytosine from DNA. Mutat. Res. 315:85-94.
VAN NUES, R. W., J. M. J. RIENTJES, C. A. E M. VANDERSAN- DE, S. E ZERP, C. SLUITER, J. VENEMA, R. J. PLANTA, and H. A. RAuB. 1994. Separate structural elements within in- ternal transcribed spacer 1 of Succhuromyces cerevisiue precursor ribosomal RNA direct the formation of 17s and 26s rRNA. Nucleic Acids Res. 22:9 12-9 19.
VENKATESWARLU, K., and R. NAZAR. 1991. A conserved core structure in the 18-25s t-RNA intergenic region from tobac- co, Nicotiunu rustica. Plant Mol. Biol. 17:189-194.
VON BORSTEL, R. C. 1994. Origins of spontaneous base sub- stitutions. Mutat. Res. 307: 13 l-140.
WAKELEY, J. 1994. Substitution-rate variation among sites and the estimation of transition bias. Mol Biol. Evol. 11:436- 442.
WV, C. I., and W. H. LI. 1985. Evidence for higher rates of nucleotide substiution in rodents than in man. Proc. Natl. Acad. Sci. USA 82:1741-1745.
ZUKER, M. 1989. On finding all suboptimal folding of an RNA molecule. Science 244:48-52.
BARBARA A. SCHAAL, reviewing editor
gous repeat units in the external spacer region of a nuclear maize rRNA gene unit. Nucleic Acids Res. 14:49694986. Accepted January 8, 1996