Dielectrophoretic manipulation of ribosomal RNA
16
Dielectrophoretic manipulation of ribosomal RNA Gerard Giraud, 1,a Ronald Pethig, 2 Holger Schulze, 3 Grace Henihan, 3 Jonathan G. Terry, 2 Anoop Menachery, 2 Ilenia Ciani, 4 Damion Corrigan, 4 Colin J. Campbell, 3 Andrew R. Mount, 4 Peter Ghazal, 3 Anthony J. Walton, 2 Jason Crain, 1,5 and Till T. Bachmann 3,b 1 School of Physics and Astronomy, University of Edinburgh, Edinburgh EH9 3JZ, United Kingdom 2 Institute for Integrated Micro and Nano Systems, School of Engineering, University of Edinburgh, Edinburgh EH9 3JF, United Kingdom 3 Division of Pathway Medicine, College of Medicine and Veterinary Medicine, University of Edinburgh, Edinburgh EH16 4SB, United Kingdom 4 School of Chemistry, University of Edinburgh, Edinburgh EH9 3JJ, United Kingdom 5 National Physical Laboratory, Teddington TW11 0LW, United Kingdom Received 11 March 2011; accepted 6 June 2011; published online 28 June 2011 The manipulation of ribosomal RNA rRNA extracted from E. coli cells by dielec- trophoresis DEP has been demonstrated over the range of 3 kHz–50 MHz using interdigitated microelectrodes. Quantitative measurement using total internal reflec- tion fluorescence microscopy of the time dependent collection indicated a positive DEP response characterized by a plateau between 3 kHz and 1 MHz followed by a decrease in response at higher frequencies. Negative DEP was observed above 9 MHz. The positive DEP response below 1 MHz is described by the Clausius– Mossotti model and corresponds to an induced dipole moment of 3300 D with a polarizability of 7.8 10 -32 Fm 2 . The negative DEP response above 9 MHz indi- cates that the rRNA molecules exhibit a net moment of 250 D, to give an effec- tive permittivity value of 78.5 0 , close to that of the aqueous suspending medium, and a relatively small surface conductance value of 0.1 nS. This suggests that our rRNA samples have a fairly open structure accessible to the surrounding water molecules, with counterions strongly bound to the charged phosphate groups in the rRNA backbone. These results are the first demonstration of DEP for fast capture and release of rRNA units, opening new opportunities for rRNA-based biosensing devices. © 2011 American Institute of Physics. doi:10.1063/1.3604395 I. INTRODUCTION The RNA molecule is a linear polymer in which nucleotides are linked by phosphodiester units. The molecule carries negative charges along its backbone associated with ionized phosphate groups, and in aqueous solutions these charges are screened by counterions. Generally RNA has regions which are self-complementary A-U or G-C pairing leading to the presence of loops and folded motifs. Ribosomes consist of RNA subunits such as the 16S and 23S subunit studied here which translate mRNA into polypeptides during protein synthesis. All living organisms contain ribosomal RNA rRNA. Consequently, rRNA has been used for evolutionary science and tax- onomy and utilized to define and identify different organism species. 1,2 The high copy numbers of rRNA molecules present in individual cells have also been used as a naturally amplified biomarker for the detection of bacteria in proof of concept, environmental and clinical studies. 3–5 The inte- gration of such techniques in modern bioanalytical devices such as micro total analysis systems a Author to whom correspondence should be addressed. Electronic mail: [email protected] b Electronic mail: [email protected] BIOMICROFLUIDICS 5, 024116 2011 5, 024116-1 1932-1058/2011/52/024116/16/$30.00 © 2011 American Institute of Physics
-
Upload
independent -
Category
Documents
-
view
4 -
download
0
Transcript of Dielectrophoretic manipulation of ribosomal RNA

Dielectrophoretic manipulation of ribosomal RNAGerard Giraud,1,a� Ronald Pethig,2 Holger Schulze,3 Grace Henihan,3
Jonathan G. Terry,2 Anoop Menachery,2 Ilenia Ciani,4 Damion Corrigan,4
Colin J. Campbell,3 Andrew R. Mount,4 Peter Ghazal,3
Anthony J. Walton,2 Jason Crain,1,5 and Till T. Bachmann3,b�
1School of Physics and Astronomy, University of Edinburgh, Edinburgh EH9 3JZ,United Kingdom2Institute for Integrated Micro and Nano Systems, School of Engineering,University of Edinburgh, Edinburgh EH9 3JF, United Kingdom3Division of Pathway Medicine, College of Medicine and Veterinary Medicine,University of Edinburgh, Edinburgh EH16 4SB, United Kingdom4School of Chemistry, University of Edinburgh, Edinburgh EH9 3JJ, United Kingdom5National Physical Laboratory, Teddington TW11 0LW, United Kingdom
�Received 11 March 2011; accepted 6 June 2011; published online 28 June 2011�
The manipulation of ribosomal RNA �rRNA� extracted from E. coli cells by dielec-trophoresis �DEP� has been demonstrated over the range of 3 kHz–50 MHz usinginterdigitated microelectrodes. Quantitative measurement using total internal reflec-tion fluorescence microscopy of the time dependent collection indicated a positiveDEP response characterized by a plateau between 3 kHz and 1 MHz followed by adecrease in response at higher frequencies. Negative DEP was observed above9 MHz. The positive DEP response below 1 MHz is described by the Clausius–Mossotti model and corresponds to an induced dipole moment of 3300 D with apolarizability of 7.8�10−32 F m2. The negative DEP response above 9 MHz indi-cates that the rRNA molecules exhibit a net moment of �250 D, to give an effec-tive permittivity value of 78.5 �0, close to that of the aqueous suspending medium,and a relatively small surface conductance value of �0.1 nS. This suggests thatour rRNA samples have a fairly open structure accessible to the surrounding watermolecules, with counterions strongly bound to the charged phosphate groups in therRNA backbone. These results are the first demonstration of DEP for fast captureand release of rRNA units, opening new opportunities for rRNA-based biosensingdevices. © 2011 American Institute of Physics. �doi:10.1063/1.3604395�
I. INTRODUCTION
The RNA molecule is a linear polymer in which nucleotides are linked by phosphodiesterunits. The molecule carries negative charges along its backbone associated with ionized phosphategroups, and in aqueous solutions these charges are screened by counterions. Generally RNA hasregions which are self-complementary �A-U or G-C pairing� leading to the presence of loops andfolded motifs. Ribosomes consist of RNA subunits �such as the 16S and 23S subunit studied here�which translate mRNA into polypeptides during protein synthesis. All living organisms containribosomal RNA �rRNA�. Consequently, rRNA has been used for evolutionary science and tax-onomy and utilized to define and identify different organism species.1,2 The high copy numbers ofrRNA molecules present in individual cells have also been used as a naturally amplified biomarkerfor the detection of bacteria in proof of concept, environmental and clinical studies.3–5 The inte-gration of such techniques in modern bioanalytical devices such as micro total analysis systems
a�Author to whom correspondence should be addressed. Electronic mail: [email protected]�Electronic mail: [email protected]
BIOMICROFLUIDICS 5, 024116 �2011�
5, 024116-11932-1058/2011/5�2�/024116/16/$30.00 © 2011 American Institute of Physics

��TAS� and point of care testing6 �POCT� requires advances in minimally invasive technology toenable efficient concentration, trapping and separation of RNA molecules.
Dielectrophoresis �hereafter DEP� is a contact-free manipulation technique based on the in-duced motion of polar or polarizable particles �with or without charges� in a nonuniform electricfield.7–9 The technique has been used to characterize and manipulate a number of biologicalparticles ranging from micrometer-size cells and bacteria to spores and viruses of nanometerdimensions.10–12 The latest development of the technique and the scope of its applications havebeen recently compiled in two comprehensive reviews.9,13
The work presented here demonstrates for the first time the DEP collection and repulsion of16S and 23S subunits of E. coli rRNA using microelectrodes. The DEP responses were measuredas a function of the strength and frequency of an applied non-uniform electric field. Using micro-fabricated interdigitated electrodes �IDEs� and the total internal reflection fluorescence �TIRF�microscopy technique, we were able to observe that rRNA subunits exhibited both positive andnegative DEPs.
Although the DEP properties of RNA have not been reported previously, pertinent dielectricstudies of the free RNA subunit of 70S rRNA have been performed and interpreted to indicate thatcounterion fluctuations dominate the dielectric dispersions centered around 9 MHz at 25 °C.14
Also of relevance are the DEP studies performed for a variety of DNA systems,15,16 spanningmicron-sized plasmids17 to short-stranded single molecule DNA.18 The positive DEP response ofDNA is found to decrease with increasing frequency,17,18 consistent with the reduction in effectivepolarizability measured by dielectric spectroscopy.19 However, the transition from a positive to anegative DEP response has only been reported for micrometer-size �-DNA.20,21 Electric dichroismmeasurements on transfer RNA �tRNA� indicate that they have permanent dipole moments of�10−27 C m ��300 D� associated with the asymmetric distribution of phosphate charges withrespect to the center diffusion.22 To our knowledge, a value for the permanent dipole moment ofeither the 16S or 23S subunit of rRNA has not been evaluated, but because of their asymmetrictertiary structures we can expect them to possess permanent moments. The secondary structure�helices, loops, and bulges� of the rRNA molecule can be expected to remain intact at roomtemperature at the low ionic concentrations ��1 mM� used in our DEP experiments, but aspectsof the tertiary structure can be expected to be lost as a result of the reduced screening of thecharged phosphate groups.23 Our finding reported here of a transition from a positive to a negativeDEP response for rRNA provides the means to examine more thoroughly the relative contributionsthat the permanent dipole moment, counterion fluctuations, and motions of the molecular structuremake to the DEP response of nucleic acid polymers.
II. THEORY
A. Dielectrophoretic force
A DEP force arises when an electrically polar or polarizable particle experiences a nonuniformelectric field. The direction in which the force acts depends on the frequency of the applied fieldand on the difference between the polarization properties of the particle and the surroundingmedium. Solvated particles can respond to this force by moving either up �positive DEP� or down�negative DEP� the field gradient. As a result, observation of the positive and negative regimes andthe DEP crossover point is useful not only as a manipulation tool but also as a means of eluci-dating the frequency dependence of the different contributions to the polarization.
The DEP force acting on a dipole of moment m in a field gradient is given by
FDEP = m � E , �1�
where � represents the gradient operator acting on the applied field E. In the most general case,the dipole moment m will be composed of a permanent dipole moment mp and an induced momentmind, such that
024116-2 Giraud et al. Biomicrofluidics 5, 024116 �2011�

m = mp + mind = mp + ��E , �2�
in which � is the volume of the polarizable particle and � is the polarizability per unit volume.From Eqs. �1� and �2�, and for a conservative and irrotational field:
FDEP = �mp + ��E� � E = mp � E + 12�v � E2. �3�
The results shown in Fig. 4 �inset� of the DEP voltage dependence measured at 1 MHz reveal thata quadratic relationship is dominant, which from Eq. �3� indicates that any contribution of thepermanent dipole moment mp to the DEP of rRNA is minimal at 1 MHz.
We will assume that the rRNA molecules maintain their secondary structures, as well as someaspects of their tertiary structures, so that as a first approximation they can be treated as sphericalparticles of radius R. On the assumption that the permanent moments of the rRNA molecules donot significantly influence the DEP response, the time-dependent average expression for the DEPforce acting on them is given by7
�FDEP� = 2�o�mR3 Re�f����� � E2. �4�
In Eq. �4�, E is the root-mean-square amplitude of the applied nonuniform ac field, �o�m is theabsolute permittivity of the suspending medium, and f���� is the Clausius–Mossotti factor givenby8
f���� = �p� − �m
�
3��m� + A��p
� − �m� ��
. �5�
In this equation, the complex permittivity of the particle and suspending medium are given as�i
�=�o�i− ji /� in which � is the radian frequency �2f� of the applied field, and j= �−1. Thesubscript i denotes either the particle �p� or the medium �m�. In the case of a spherical particle, thedepolarization factor A=1 /3 leading to f����= ��p
� −�m� � / ��p
� +2�m� �.
In the frequency range of our investigation �103–107 Hz�, we assume that the induced dipolemoment m���
m��� = 4�o�mR3 Re�f�����E �6�
is primarily due to the reorganization of interfacial charges between the particle and the solvent,namely, surface conductivity and field-induced diffusion of counterions in the electrical doublelayer around the particle.
Re�f����� can then be written in the form24
Re�f����� =�o�m
1 + �2�2��2�2 �p − �m
�p + 2�m + p − m
p + 2m , �7�
where the interfacial polarization relaxation time � is given by25
� =�p + 2�m
p + 2m�o. �8�
Equation �7� simplifies to show that the frequency dependence of interfacial charges is domi-nated by conductivity at low frequency and permittivity at high frequency.
024116-3 DEP manipulation of rRNA Biomicrofluidics 5, 024116 �2011�
Re�f�����/�m�0 = �p − m
p + 2mfor �� 1
�p − �m
�p + 2�mfor �� � 1.� �9�
Positive DEP occurs for Re�f������0, leading to accumulation of particles at the electrode edgesin region of high electric field. Conversely for Re�f������0, the particles are repelled from theelectrode edge in the direction of regions of decreasing field strength.
In Eqs. �5� and �7�, the values of the particle and medium conductivity and permittivity areassumed to remain constant as a function of frequency. Dielectric measurements on RNA andDNA suspensions14,15,17 indicate that dispersions associated with conformational relaxations of themolecular structure occur in the frequency range of relevance to our studies reported here. Toaccommodate the possibility that such dispersions might influence the DEP response of RNA, wehave introduced a frequency dependence of the particle permittivity and conductivity according tothe Debye equation:
�p� = �� +
�s − ��
1 + j��d, �10�
where �� is the permittivity at the high frequency limit of the dispersion, �s is the low frequencylimiting permittivity, and �d is the characteristic dipolar relaxation time. This complex permittivitycan be decomposed into real and imaginary parts as
�p���� = �� +�s − ��
1 + ���d�2 , �11�
�p���� =��s − �����d
1 + ���d�2 . �12�
The dielectric loss parameter �p���� gives rise to a particle conductivity term p���=��p����.To account for the mobility of counterions in the electrical double layer surrounding the RNAmolecule, we assign a surface conductance Ks to be added to the particle bulk conductivity b.9,17
The particle conductivity is thus composed of three terms given by
p = b +2Ks
R+ ��p���� . �13�
B. Finite element method simulation
Finite element simulations �COMSOL MULTIPHYSICS� were used to compute the electric field�dc voltage� generated in three dimensions on the gold interdigitated electrode �IDE� arrays. TheDEP force is proportional to the gradient of the squared electric field, �E2, and this factor isplotted Fig. 1 by considering a voltage of 2 V �peak� between the electrodes and a value of therelative permittivity of water �m=80.2. The factor �E2 is minimal in the middle of the gapbetween electrodes and reaches a maximum at the edge of the electrode finger with a value greaterthan of 1019 V2 /m3. Figure 1�a� shows that the DEP force extends above the electrode, but withdecreasing strength. At 20 �m above the electrode surface, the factor �E2, and hence the DEPforce, has decreased by two orders of magnitude.
024116-4 Giraud et al. Biomicrofluidics 5, 024116 �2011�

III. MATERIAL AND METHODS
A. Experimental setup
Live monitoring of the rRNA dielectrophoretic activity was performed using the setup de-picted in Fig. 2. Our customized flow cell �Ref. 26� of total internal volume 900 �l was firstcleaned with RNAaseZap �Ambion, Warrington, UK�, washed thoroughly with pure water andrinsed with methanol. This treatment prevented sample degradation through contamination duringthe experiment. The array of interdigitated electrodes �“IDE chip”� was cleaned with Piranhasolution �3:1 ratio of concentrated sulfuric acid mixed with hydrogen peroxide solution �30%�w/w� in H2O; Sigma Aldrich, UK�� for 10 s, washed with water, dried under nitrogen flow, andplaced into the flow cell.
Figure 2 �inset� shows a photograph of a single gold IDE produced by microfabricationtechnique �Ref. 26�. The RiboGreen-labeled rRNA sample was then injected into the cell andpositioned on the stage of a TE300 Nikon inverted microscope. An excitation beam at 455 nm was
FIG. 1. �a� Contour plot of the gradient of the squared field, �E2, generated across the gold IDE, up to 50 �m above theelectrode’s surface. �b� Contour plot of �E2, simulated in the plane between two fingers separated by 10 �m. The DEPforce is minimal in the middle of the gap and reaches a maximum value at the edge of the electrode’s finger. The voltagebetween the electrodes is 2 V �peak�. �c� Electric field cross section between two electrode fingers calculated for an appliedvoltage of 1.1 V �peak� �red� and 2 V �peak� �blue�.
024116-5 DEP manipulation of rRNA Biomicrofluidics 5, 024116 �2011�

produced by frequency doubling the output beam of a femtosecond Ti:sapphire laser system �10 WVerdi and Mira from Coherent, Glasgow, Scotland� and directed to excite the sample on the IDEchip by total internal reflection. In order to achieve this, a quartz prism �Cairn Research, Faver-sham, UK� was attached to the microscope’s condenser and placed into contact with the under-surface of the chip using transmission immersion oil. The laser beam was directed below criticalangle and focused onto the IDE chip, generating a local evanescent excitation of approximately1 mm2 area with an average power of 1 mW. The resulting fluorescence was then collected witha plan apo Nikon X10 objective, filtered with an emission band pass filter �535/50 nm� and imagedonto an Electron Multiplying Charge Coupled Device �EMCCD� Camera �Ixon, Andor, Belfast,UK� synchronized to an external Shutter �Oriel, Didcot, UK�. AC voltage between 3 kHz and 50MHz was delivered by a pulse generator �HP, 50 MHz, 8112A�. Finally, DEP movies wereobtained by capturing one 256�256 pixel frame every 2 s for 60 s.
B. Sample preparation
Escherichia coli (E. coli) DH10� was cultivated using an overnight culture of 2 ml Luria-Bertani �LB� medium �Sigma Aldrich, UK� containing 10 g/l Bacto-tryptone, 5 g/l yeast extract,and 10 g/l NaCl. The medium was inoculated with an E. coli colony from a LB agar plate andincubated for 16 h at 37 °C in a shaking incubator. Total RNA was isolated with RNeasy ProtectBacteria Mini Kit �Qiagen, Hilden, Germany�, using proteinase K and �-mercaptoethanol treat-ment to remove protein and on-column DNase treatment was performed to remove genomic DNA.The E. coli culture was mixed with RNAprotect Bacteria Reagent solution prior cell lysis accord-ing to the protocol provided by the manufacturer. This patent-pending solution stabilizes RNAbefore cell lysis and prevents RNA degradation. The extracted nucleic acids were then eluted into30 �l of distilled DNase and RNase free water �GIBCO, Invitrogen, Paisley, UK�. All rRNA
FIG. 2. Experimental setup for live monitoring of rRNA dielectrophoretic activity. The IDE chip positioned into a flow cellis excited by prism based evanescent wave. Fluorescence images of RiboGreen-labeled rRNA are collected with a 10�objective and imaged on an EMCCD camera. The zoom shows a plan view of a 200 �m2 gold IDE with 10 �m electrodefingers and 10 �m gap.
024116-6 Giraud et al. Biomicrofluidics 5, 024116 �2011�

solutions for DEP experiments were prepared with distilled DNase and RNase free water. Thesample contains all RNA over 200 nt and subsequent gel electrophoresis confirmed the presence ofthe 16 S �1541 nt� and 23 S �2904 nt� rRNA.
The extracted sample was subsequently labeled with RiboGreen �Quant-iT™ RiboGreen®
RNA Reagent, Invitrogen, UK�. Typically, 2.5 �l of the dye was added to 1 ml of RNA �dilutedin water at a given concentration�. The sample was then left at RT for 5 min. The remaining freedye was then removed by size exclusion gel filtration using an Illustra MicroSpin G-50 Column,�GE Healthcare, UK�.
Sample concentration was estimated by measuring the oligonucleotide absorption band at 260nm of each sample after extraction using a Nanodrop absorbance spectrometer �Thermo FisherScientific, Wilmington, NC�. A 30 �l sample with 700 ng /�l RNA was diluted in 870 �l leadingto a final concentration of 24 ng /�l �38 nanomoles dm−3� total RNA of which about 80% isribosomal RNA.27 The integrity of the sample was evaluated by microfluidics-based electrophore-sis with an Agilent Bioanalyzer �Agilent, Wokingham, UK�. Figure 3�a� shows the electrophero-grams after elution. The two sharp peaks correspond to the 16S and 23S subunits and present anamplitude ratio of 0.8.
C. DEP measurement and data analysis
Time dependent DEP measurements were performed on samples, prepared according to themethods described above, suspended in an aqueous medium of conductivity 13 mS/m as measuredusing an Oakton-510 conductivity meter �Oakton Instruments, Illinois�. The DEP measurementswere conducted for a range of voltage values and frequencies applied to the IDE, referred to as“voltage series” and “frequency series.” For each series, a single IDE was used to record anaverage of 20 DEP collection cycles, corresponding to 20 DEP movies. This approach, whichlimits systematic variations between IDEs, required the removal of the RNA particles from theelectrode between individual measurements. This was achieved by negative DEP by applying a 6V ac field at 50 MHz to the IDE for 2 min.
FIG. 3. Electropherograms of the rRNA sample measured �a� before DEP and �b� after a duration of 6 h, during which timemultiple series of DEP measurements took place. �c� shows the difference spectrum ��a� and �b��.
024116-7 DEP manipulation of rRNA Biomicrofluidics 5, 024116 �2011�

After electrode cleaning, positive DEP was measured by recording the increase in fluores-cence intensity observed on the IDE. It was also possible to monitor the decrease in fluorescenceintensity on the electrode, corresponding to either the diffusion of the collected RNA particlesaway from the electrode edges �with electric field off� or as a result of negative DEP observed forfield frequencies above 9 MHz. For the quantitative analysis of the data, the amount of rRNAcollected on the IDE was obtained from each frame of the DEP movie by determining the meanfluorescence intensity after background subtraction inside the 200 �m2 of the electrode area�120�120 pixels�. The negative DEP response was much weaker than that obtained for positiveDEP. Negative DEP collection data were therefore further processed by subtracting the voltage-independent diffusion of rRNA from the change in fluorescent intensity obtained with the fieldapplied. This should have removed inclusion of any subtle effects arising from heat-induced fluidflow caused by the laser beam. The gain of the EMCCD camera was optimized for each sampleand was maintained at this setting for three series of measurements, each performed on threeindividual IDEs, therefore allowing for direct comparison of the fluorescence absolute values.
IV. RESULTS
A. Sample stability
The integrity of the sample was evaluated by microfluidics-based electrophoresis with anAgilent Bioanalyzer. Figure 3 shows the electropherograms of the used ribosomal RNA samplebefore �a� and after DEP testing �b�. The two sharp peaks of approximately equal amplitudecorrespond to the 16S and 23S subunits of the rRNA. The difference spectrum displayed in Fig.3�c� reveals very little variations, demonstrating that the rRNA has remained intact after 6 hexperimental manipulation.
B. Voltage dependence
The voltage dependence of the rRNA DEP collection was investigated by recording the DEPmovies obtained on a single electrode biased with a series of applied voltage ranging from 0 to5 Vp-p. Figure 4 shows the fluorescence intensity time traces obtained for 17 different voltages at1 MHz frequency. The voltage dependence displayed in Fig. 4 �inset� reveals three distinct re-gimes. �i� Between 0 and 2.2 V, the signal intensity remains constant. In this range, the DEP forceis too weak to overcome Brownian motion. �ii� From 2.2 to 3.8 V, the fluorescence signal isquadratic in applied electric field as expected according to Eq. �4�. �iii� Above 3.8 V, the DEPsignal still increases; however, its dependence is no longer quadratic. This effect was considered toarise from the number of collected RNA particles saturating the volume available to them in thespace interrogated by the TIRF technique. The initial amount of RNA contained in the volume�1.1�10−11 dm3� bounded by the TIRF depth of field �275 nm� and the IDE array �area 4�10−6 dm2� was 4.2�10−19 moles. This is equivalent to 2.5�105 RNA particles, which occupya total volume of �10−15 dm3. From the increase in fluorescence intensity above the backgroundobserved for the DEP measurements between 1 kHz and 1 MHz, we estimate that a 103-foldincrease in RNA concentration occurred after 30 s of an applied 4 Vp-p signal. At this concentra-tion within the “TIRF volume,” mutual electrostatic repulsions between the charged rRNA mol-ecules will begin to counterbalance the DEP force and result in the observed saturation of fluo-rescence.
The V2-dependence of the fluorescence intensity rules out the possible influence on our DEPmeasurements of fluid flow arising from electrothermal effects because these exhibit aV4-dependence.28 Also, ac electro-osmosis, which does exhibit a V2-dependence, peaks at a fre-quency several orders of magnitude smaller than the charge relaxation frequency ��= /�=2.9 MHz for our experiments� and falls off as a function of �2 thereafter.28 Electro-osmosis isconsidered to exhibit a negligible influence on DEP, even for submicron-sized particles, above 100kHz. We therefore consider that our observation of a V2-dependence of fluorescence intensityreflects the DEP collection of our rRNA samples at the electrode edges, with negligible interfer-ence from induced fluid flow effects.
024116-8 Giraud et al. Biomicrofluidics 5, 024116 �2011�

C. Frequency dependence
The frequency dependence of the rRNA DEP collection was investigated in a range spanningfrom 3 kHz to 50 MHz. This was done by applying a 4 Vp−p AC field to the electrode at a givenfrequency for 60 s. Figure 5 shows a series of typical images captured at 4, 10, and 30 s after theonset of DEP and obtained for an IDE with an applied field frequency of 100 kHz �Fig. 5�a��enhanced��, 3 MHz �Fig. 5�b� �enhanced��, and 50 MHz �Fig. 5�c� �enhanced�� �50 MHz mea-sured after positive DEP at 100 kHz�. The signal integration of such DEP movies resulted in aseries of time traces. Figure 6�a� shows the intensity time traces obtained for nine frequencies,averaged over three individual electrodes.
The DEP collection time profiles present two regimes. At time t shorter than the transitiontime Ttransition, the intensity signal rises linearly. In this regime, referred to as the initial collectionrate, the particles collect under the action of the DEP force alone. For t�Ttransition, the collectionof particles reaches a steady state regime. As shown in Fig. 6�a�, Ttransition increases with increasingfrequencies. These observations are consistent with the DEP of micrometer-size DNA plasmids forwhich similar time behaviors have been reported.17
The collection rate was evaluated by calculating the slope ��I /�t� of each time trace. This wasdone by considering the first 10–15 s of DEP where the signal increase is linear. The collectionrate frequency dependence is shown Fig. 6�b�. Between 3 kHz and 1 MHz, the collection effi-
FIG. 4. DEP voltage dependence measured at 1 MHz. Intensity time traces obtained from 0 to 5 Vp-p. In inset is shown theDEP voltage dependence plotted at 6 s after the onset of DEP, along with the quadratic function F �line� given by theequation F=A�V−Vmin�2 with A=1774 and Vmin=2.23. The quadratic dependence of the DEP is observed between Vp-p
=2.2 and 3.8 V.
024116-9 DEP manipulation of rRNA Biomicrofluidics 5, 024116 �2011�
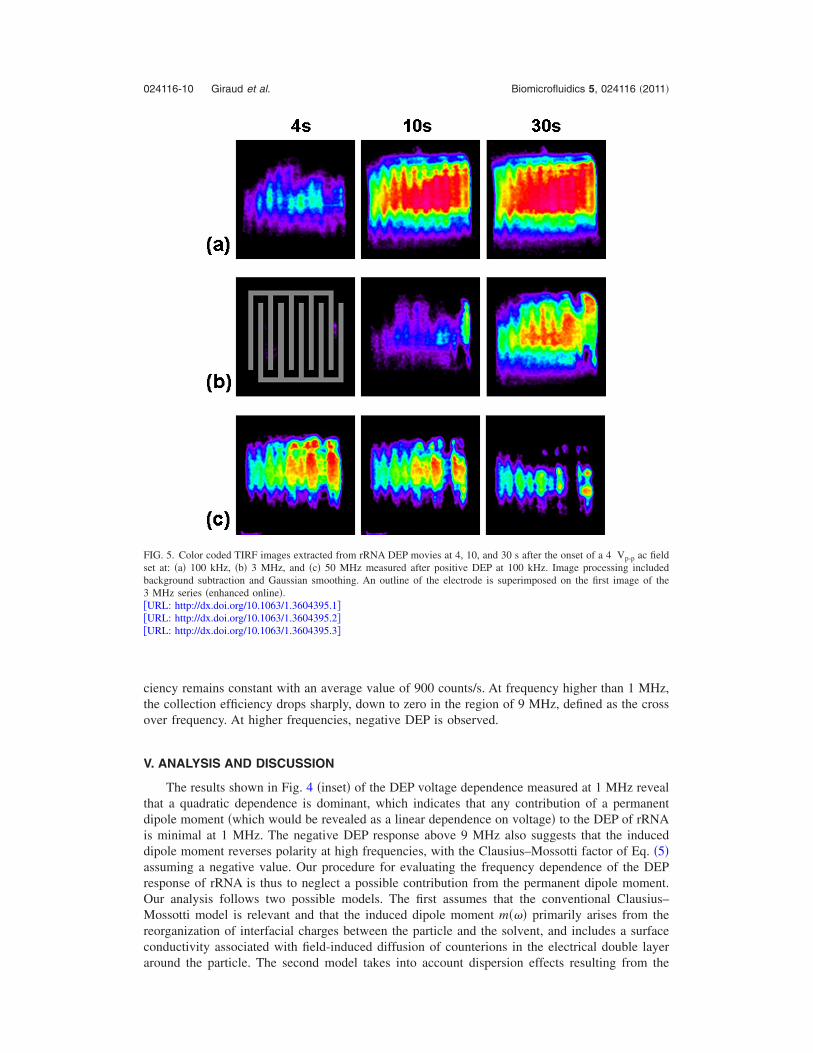
ciency remains constant with an average value of 900 counts/s. At frequency higher than 1 MHz,the collection efficiency drops sharply, down to zero in the region of 9 MHz, defined as the crossover frequency. At higher frequencies, negative DEP is observed.
V. ANALYSIS AND DISCUSSION
The results shown in Fig. 4 �inset� of the DEP voltage dependence measured at 1 MHz revealthat a quadratic dependence is dominant, which indicates that any contribution of a permanentdipole moment �which would be revealed as a linear dependence on voltage� to the DEP of rRNAis minimal at 1 MHz. The negative DEP response above 9 MHz also suggests that the induceddipole moment reverses polarity at high frequencies, with the Clausius–Mossotti factor of Eq. �5�assuming a negative value. Our procedure for evaluating the frequency dependence of the DEPresponse of rRNA is thus to neglect a possible contribution from the permanent dipole moment.Our analysis follows two possible models. The first assumes that the conventional Clausius–Mossotti model is relevant and that the induced dipole moment m��� primarily arises from thereorganization of interfacial charges between the particle and the solvent, and includes a surfaceconductivity associated with field-induced diffusion of counterions in the electrical double layeraround the particle. The second model takes into account dispersion effects resulting from the
FIG. 5. Color coded TIRF images extracted from rRNA DEP movies at 4, 10, and 30 s after the onset of a 4 Vp-p ac fieldset at: �a� 100 kHz, �b� 3 MHz, and �c� 50 MHz measured after positive DEP at 100 kHz. Image processing includedbackground subtraction and Gaussian smoothing. An outline of the electrode is superimposed on the first image of the3 MHz series �enhanced online�.�URL: http://dx.doi.org/10.1063/1.3604395.1��URL: http://dx.doi.org/10.1063/1.3604395.2��URL: http://dx.doi.org/10.1063/1.3604395.3�
024116-10 Giraud et al. Biomicrofluidics 5, 024116 �2011�

intrinsic dipolar fluctuations of the particle’s molecular structure. In both cases the effect of apossible field-induced elongation, and thus a departure from an overall spherical configuration, ofthe rRNA molecules is also taken into account.
A. Data normalization: rRNA polarizability
The DEP collection rate �I /�t is related to the DEP force, which in turn is proportional to thereal part of the induced dipole moment Re�m� calculated according to Eq. �6�. The DEP collectionrate and induced dipole can be normalized by considering the energy of a particle when thedeterministic DEP force exactly counteracts the stochastic Brownian force. The total particleenergy Utot, expressed as the sum of a thermal kinetic energy Uth associated with Brownianmotion, and an attractive potential energy UDEP associated with DEP, is zero according to18
Utot = Uth + UDEP =3
2kBT +
1
2�Emin
2 = 0, �14�
where kB is the Boltzmann constant and � is the rRNA polarizability. The minimum voltage to traprRNA at the electrodes, as determined from the DEP voltage dependence at 1 MHz �see Fig. 4�inset��, is estimated as Vmin=2.2 Vp−p, corresponding to a minimum electric field Emin
=4.105 V /m �calculated at the edge of the electrode �Fig. 1�c��. From Ref. 18, we obtain a rRNApolarizability �=3kBT /Emin
2 =7.8�10−32 F m2. This value is of the same order as polarizabilityobtained for DNA plasmids pUC18 �2700 bp� with �=1�10−32 F m2 �Ref. 29� and pBVboostFG
FIG. 6. �a� DEP collection time profiles obtained at 4Vpp �from top to bottom� at 10 kHz �brown�, 100 kHz �blue star�, 1MHz �yellow�, 3 MHz �pink�, 5 MHz �light blue�, 7 MHz �blue triangle�, 10 MHz �green�, 30 MHz �red�, and 50 MHz�black�. �b� Collection rate frequency dependence measured from 3 kHz to 50 MHz. Standard deviation was calculatedover three “frequency series” measurements, performed on three different electrodes. The solid lines correspond to theClausius–Mossotti model calculated with the parameters presented in Table I and assuming either spherical rRNA �redcurve�, with depolarization factor A=1 /3 or stretched rRNA �blue curve� with A=0.1, corresponding to a prolate ellipsoidof ratio 3:1 for the major and minor axes. �c� corresponds to the Clausius–Mossotti model with dispersion parameters�s=108 �0 and ��=78 �0 obtained from Ref. 14, Ks=0.15 nS and fxo=1 MHz �blue curve� or fxo=9 MHz �red curve�.In both cases, the rRNA is considered to be spherical �A=1 /3�. �d� corresponds to the Clausius–Mossotti model withparameters �s=83 �0, ��=77 �0, Ks=0.1 nS, and fxo=1 MHz. In this case, rRNA is considered elliptical with a ratio of3:1 for the major and minor axes, corresponding to a depolarization factor A=0.1
024116-11 DEP manipulation of rRNA Biomicrofluidics 5, 024116 �2011�

�1065 bp� with �=8.5�10−32 F m2.18 The average induced dipole moment of our rRNA at 1MHz and 4 Vp-p �1.4 Vrms� can thus be calculated as m=�E=1.1�10−26 C m �equivalent to3297 D�. This value was used to normalize the DEP collection rates with the Clausius–Mossottifunctions shown in Figs. 6�b�–6�d�.
B. Clausius–Mossotti model
The conventional Clausius–Mossotti model, as described in Sec. II, was utilized to representthe frequency dependent DEP data presented in Fig. 6�b� using the parameters listed in Tables Iand II. The conductivity of the medium was measured and its permittivity obtained from theliterature. The radius of the 23S rRNA particle was extracted from the crystal structure of thecomplete 70S ribosome30 and estimated at 10 nm. Considering that the samples contained both the16S and 23S subunits, this value should be considered as an upper estimate. The effective con-ductivity and permittivity of rRNA were calculated by analyzing the frequency dependent collec-tion rate of the particle in terms of the induced dipole moment and the DEP force of the molecule.
The results of Fig. 6�b� indicate that the rRNA molecules exhibit positive DEP at low fre-quencies and negative DEP above 9 MHz, which from Eq. �9� imply that p�m and �p��m. Theconductivity m of the aqueous suspending medium was measured to be 12.8 mS/m, and we canassume a value �m�80.2 for the relative permittivity of the medium �water at 20 °C�.31 At thecross-over frequency fxo, the induced dipole moment is zero, which implies that Re�f����� in Eq.�2� is null. From Eqs. �7� and �8�, the following quadratic expression that satisfies this conditioncan be derived:
�xo2 =
1
��o�2
�m − p��p + 2m���p − �m���p + 2�m�
. �15�
A valid �i.e., real� value for the cross-over frequency fxo exists for the situation �m
−p� / ��p−�m��0, and the relationships p�m and �p��m derived from the experimental re-sults satisfy this condition.
The DEP force varies with frequency as
TABLE I. List of the parameters used in the Clausius–Mossotti model.
Definition Symbol Values Details
Suspending medium permittivity �m 80.2 �0 From Ref. 31
Suspending medium conductivity m 0.013 S/m Measured
Applied ac field �peak� E 200 kV/m Measured
Particle radius �rRNA� R 10 nm From Ref. 30
rRNA effective conductivity P 0.015�0.002 S /m Calculated according to the system of Eq. �18�with �I=1.8�0.1 MHz and �X=9 MHzrRNA absolute permittivity �P 78.5�1.5 �0
rRNA induced dipole moment at 1 MHz �RNA 3297 D Calculated according to Eq. �14�
TABLE II. List of the parameters used in the Clausius–Mossotti modelincluding dispersion.
Definition Symbol Values
rRNA depolarization factor A 0.1�0.01rRNA surface conductance KS 0.1�0.01 nSrRNA high frequency permittivity �� 77�1 �0
rRNA low frequency permittivity �S 83�1 �0
024116-12 Giraud et al. Biomicrofluidics 5, 024116 �2011�

FDEP��� = FDEP��� +FDEP�0� − FDEP���
1 + �2�2 , �16�
where FDEP�0� and FDEP��� are the DEP forces at the low and high frequency limits,respectively.32 At the inflection frequency �I, the second derivative of the DEP force vanishes:
�2FDEP����2�
=2�FDEP��� − FDEP�0���2�3�2�2 − 1�
�1 + �2�2�3 = 0. �17�
The set of equalities in Eqs. �15� and �17� constitute a system of two equations with twounknowns:
�xo2 =
1
��o�2
�m − p��p + 2m���p − �m���p + 2�m�
,
�I2 =
1
3�2 . �18�
The inflection frequency �I and the cross-over frequencies, �xo, can be used to determine thevalues of the particle conductivity and polarizability by solving the system of equations �18�.According to Fig. 6�b�, �I and �xo were estimated to be 1.8�0.1 and 9 MHz, respectively.Solving Eq. �18�, p and �p are calculated to be 0.015�0.002 S /m and 78.5�1.5 �0, corre-sponding to a polarization relaxation time of 51.6 ns calculated according to Eq. �8�.
The fit of the experimental data to the Clausius–Mossotti model using the parameters listed inTable I is shown in Fig. 6�b�. The red curve corresponds to a spherical molecular configurationwith a depolarization factor A=1 /3. The blue curve shows the result obtained when considering astretched molecule with a longitudinal/transversal ratio equal to 3:1. Both curves describe thepositive DEP region rather well; however, the description relative to the negative part of the signalis less convincing.
The Clausius–Mossotti model can be further refined by introducing the frequency dependenceof the particle permittivity and conductivity. In this case, the permittivity of rRNA is described bythe high and low frequency permittivity parameters: �� and �s. Previous dielectric studies of rRNA�Ref. 14� reported values for �� and �s equal to 78 �0 and 108 �0, respectively. Figure 6�c� showsthe theoretical curves obtained using these values with a cross-over frequency of 9 MHz in red and1 MHz in blue. It is apparent that none of these curves represents the data satisfactorily. A moreconvincing representation is obtained when introducing a stretched molecular shape while de-creasing the high permittivity parameter, as shown in Fig. 6�d�.
C. rRNA: permittivity, conductivity, and molecular shape
The result of the analyses presented in Fig. 6�b� provides an estimate of the frequency depen-dent induced dipole moment of the rRNA particles. The rRNA permittivity value 78.5 �0 is closeto the permittivity of the medium, suggesting that the rRNA is a fairly open structure which thesolvent can penetrate. This could result from the negative charges of the phosphate backbonetending to repel each other and leading to an open structure. The effective particle conductivity p
for the model used in Fig. 6�b� is given by the sum of the particle’s bulk conductivity b and asurface conductivity expressed as
p = b +2Ks
R, �19�
where Ks is a surface conductance whose magnitude depends on the composition and thickness ofthe electrical double layer surrounding the particle.33 For a charged particle in a symmetrical ionicsolution such as NaCl, the Debye screening length �D is given by
024116-13 DEP manipulation of rRNA Biomicrofluidics 5, 024116 �2011�

�D = ��o�mR̄T/2F2c�1/2, �20�
where R̄ is the gas constant �8.314 J K−1 mol−1�, T is the absolute temperature, F is the Faradayconstant �9.648�104 C mol−1�, and c is the concentration of ions in the solution �mol m−3�.33
Assuming that NaCl is the dominant ionic salt remaining in the extracted sample, and noting thatthe equivalent ionic conductivity of NaCl is of the order 1.3�10−2 m2 S mol−1 for a concentra-tion in the range 0.5–10 mM,31 then a measured value of 12.8 mS/m for the conductivity of thesolution leads to an estimate of �1 mol m−3 �i.e., �1 mM� for the value of the concentration cin Eq. �20�. From Eq. �20�, the Debye screening length �D can thus be estimated to be �10 nm,which is similar to the radius of the rRNA particle. This implies that the surface conductance Ks
will have contributions arising from charge movements in both the Stern layer and the diffuse partof the double layer.33 Solving Eq. �19� with b equal to zero implies that in the case of rRNA, Ks
cannot exceed 0.15 nS. This value is an order of magnitude smaller than the surface conductivityof a latex particle with a typical value of 1 nS.34 The surface conductivity can be envisaged to takethe form of an activated transport of the counterions, where the ions are thermally activated overpotential energy barriers. The relatively small surface conductance obtained for the rRNA mighttherefore arise from a significant proportion of the counterions being strongly bound to the ionizedphosphate groups and thus not freely delocalized over the whole molecular surface.
When combining dielectric dispersion effects and field-induced elongation of the rRNA, abetter fit to the experimental data is obtained, as shown in Fig. 6�d�. Stretching of oligonucleotidesby DEP has been reported before in the case of DNA.15,35 Considering the highly flexible natureof the rRNA molecules,14 similar behavior might also be expected for our samples.
VI. CONCLUSIONS
This article has reported the DEP manipulation, over the frequency range from 3 kHz to 50MHz, of a mixture of the 16S and 23S subunits of ribosomal RNA extracted from E. coli. To ourknowledge, this is the first report of the DEP characterization of rRNA. The majority of DEPstudies of DNA have reported15,18 that DNA exhibits a positive DEP response that decreases inmagnitude as the frequency of the applied nonuniform electric field enters the megahertz region.Some divergences exist regarding the DEP response at high frequency. One study16 measured thecapacitance changes observed between planar microelectrodes during DEP, revealing an increasefor all DNA fragments ranging from 100 bp to 48 kbp, at frequency above 300 kHz. Anotherpaper21 investigating the DEP of micrometer-size lambda-DNA has in the contrary reported nega-tive DEP above 10 MHz. Our finding that above 9 MHz rRNA makes the transition from positiveto negative DEP is thus new to the study of the electrokinetic properties of nanometer-size poly-nucleic acids and opens up the possibility that rRNA samples can be condensed onto microelec-trodes for physicochemical analysis or manipulation, and then released from the electrodes forfurther processing or analysis. It has recently been shown that DEP could be used in the megahertzregime to enhance hybridization efficiency.36 This first demonstration of DEP for fast capture andrelease of rRNA subunits opens up new opportunities for rRNA-based biosensing devices.
The positive DEP response of rRNA below 1 MHz is well described by a model that assumesan induced dipole moment �as described by the classical Clausius–Mossotti theory� dominatesover any effects associated with a permanent dipole moment. As discussed in the analysis of theDEP voltage dependence obtained at 1 MHz �Fig. 4�, a linear dependence that would be indicativeof a permanent dipole moment contribution is not evident. Furthermore, an analysis of the thresh-old voltage required for the DEP force to overcome Brownian motion �Eq. �14�� provides anestimate for the effective dipole moment of 1.1�10−26 C m ��3300 D�, which is probably anorder of magnitude larger than can be expected for the permanent dipole moment of RNAmolecules.22 The negative DEP response above 9 MHz indicates that the rRNA molecules exhibita net moment of the order −8.3�10−28 C m ��−250 D�. This moment could be composed of apositive permanent moment counteracted by a larger induced moment of opposite polarity. How-ever, the negative DEP response is too weak to accurately determine a value for the thresholdvoltage for DEP and to confirm whether a linear voltage dependence �indicative of a permanent
024116-14 Giraud et al. Biomicrofluidics 5, 024116 �2011�

moment� is imposed over a quadrature dependence. Further studies of the negative DEP responseof rRNA are merited, if only to clarify the possible contribution of a permanent dipole moment.
Our DEP measurements and analyses have also provided estimates for the effective permit-tivity and conductivity of rRNA molecules. The value 78.5 �0 obtained for the effective permit-tivity of the RNA molecules is close to the permittivity of the aqueous medium. This suggests thatrRNA has a fairly open structure accessible to the surrounding water molecules and could arisefrom mutual repulsion of the negative charges of the phosphate backbone. In dilute salt solutions,RNA has a partial ��50%� helical structure which results in a flexible polynucleotidestructure.23,37 However, our derived permittivity value could be an overestimate due to the neglectof a possible counteracting contribution to the DEP response of a permanent moment. From Eq.�9�, we expect that the permittivity values of the particle and medium will dominate over theireffective conductivities. The negative DEP response observed above 9 MHz is not insignificant,and this should lead to the expectation of deducing a permittivity value lower than 78.5 �0. Thisapparent inconsistency also merits further study regarding the magnitude of the permanent dipolemoment of an rRNA molecule in dilute ionic solutions. Finally, the surface conductance value of�0.1 nS is an order of magnitude smaller than that typically reported in the literature for smallsolid particles.34 This could reflect the fact that the counterions are strongly bound to the chargedphosphate groups in the RNA backbone, consistent with the finding that some 85% of the coun-terions are localized in tRNA.22
ACKNOWLEDGMENTS
This work was supported by Scottish Enterprise under the Chronic Wound Care program.Gerard Giraud, Ronald Pethig and Holger Schulze contributed equally to this study.
1 S. G. Tringe and P. Hugenholtz, Curr. Opin. Microbiol. 11, 442 �2008�.2 S. Smit, J. Widmann, and R. Knight, Nucleic Acids Res. 35, 3339 �2007�.3 H. A. Joung, N. R. Lee, S. K. Lee, J. Ahn, Y. B. Shin, H. S. Choi, C. S. Lee, S. Kim, and M. G. Kim, Anal. Chim. Acta
630, 168 �2008�.4 J. Small, D. R. Call, F. J. Brockman, T. M. Straub, and D. P. Chandler, Appl. Environ. Microbiol. 67, 4708 �2001�.5 B. P. Nelson, T. E. Grimsrud, M. R. Liles, R. M. Goodman, and R. M. Corn, Anal. Chem. 73, 1 �2001�.6 H. Schulze, G. Giraud, J. Crain, and T. T. Bachmann, J. Biophoto. 2, 199 �2009�.7 D. Pohl, The Behavior of Neutral Matter in Nonuniform Electric Fields �Cambridge University Press, Cambridge, 1978�.8 T. B. Jones, Electromechanics of Particles �Cambridge University Press, Cambridge, 1995�.9 R. Pethig, Biomicrofluidics 4, 022811 �2010�.
10 M. Dürr, J. Kentsch, T. Muller, T. Schnelle, and M. Stelzle, Electrophoresis 24, 722 �2003�.11 F. Grom, J. Kentsch, T. Muller, T. Schnelle, and M. Stelzle, Electrophoresis 27, 1386 �2006�.12 M. Moschallski et al., Electrophoresis 31, 2655 �2010�.13 B. H. Lapizco-Encinas and M. Rito-Palomares, Electrophoresis 28, 4521 �2007�.14 A. Bonincontro, C. Mari, M. Mengoni, and G. Risuleo, Biophys. Chem. 67, 43 �1997�.15 R. Hölzel, NanoBiotechnology 3, 28 �2009�.16 A. Henning, F. F. Bier, and R. Holzel, Biomicrofluidics 4, 022803 �2010�.17 D. J. Bakewell and H. Morgan, IEEE Trans. Nanobiosci. 5, 139 �2006�.18 S. Tuukkanen, A. Kuzyk, J. J. Toppari, H. Hakkinen, V. P. Hytonen, E. Niskanen, M. Rinkio, and P. Torma, Nanotech-
nology 18, 295204 �2007�.19 D. J. Bakewell, I. Ermolina, H. Morgan, J. Milner, and Y. Feldman, Biochim. Biophys. Acta 1493, 151 �2000�.20 R. Yokokawa, Y. Manta, M. Namura, Y. Takizawa, N. C. H. Le, and S. Sugiyama, Sens. Actuators B 143, 769 �2010�.21 M. L. Du, F. F. Bier, and R. Holzel, AIP Conf. Proc. 859, 65 �2006�.22 D. Porschke and J. Antosiewicz, Biophys. J. 58, 403 �1990�.23 I. Tinoco and C. Bustamante, J. Mol. Biol. 293, 271 �1999�.24 T. Inoue, R. Pethig, T. A. K. Alameen, J. P. H. Burt, and J. A. R. Price, J. Electrost. 21, 215 �1988�.25 T. B. Jones, J. Electrost. 6, 69 �1979�.26 See supplementary material at http://dx.doi.org/10.1063/1.3604395 for the description of the flow cell fabrication and
IDE microfabrication.27 E. J. Simon and D. Vanpraag, Proc. Natl. Acad. Sci. U.S.A. 51, 1151 �1964�.28 A. Castellanos, A. Ramos, A. Gonzalez, N. G. Green, and H. Morgan, J. Phys. D: Appl. Phys. 36, 2584 �2003�.29 S. Suzuki, T. Yamanashi, S. Tazawa, O. Kurosawa, and M. Washizu, IEEE Trans. Ind. Appl. 34, 75 �1998�.30 M. M. Yusupov, G. Z. Yusupova, A. Baucom, K. Lieberman, T. N. Earnest, J. H. D. Cate, and H. F. Noller, Science 292,
883 �2001�.31 B. Raton, CRC Handbook of Chemistry and Physics �CRC, Boca Raton, FL, 1992�.32 X. B. Wang, R. Pethig, and T. B. Jones, J. Phys. D: Appl. Phys. 25, 905 �1992�.33 J. Lyklema, Fundamentals of Interface and Colloid Science �Academic, New York, 1995�.34 I. Ermolina and H. Morgan, J. Colloid Interface Sci. 285, 419 �2005�.
024116-15 DEP manipulation of rRNA Biomicrofluidics 5, 024116 �2011�

35 L. F. Zheng, J. P. Brody, and P. J. Burke, Biosens. Bioelectron. 20, 606 �2004�.36 I. F. Cheng, S. Senapati, X. G. Cheng, S. Basuray, H. C. Chang, and H. C. Chang, Lab Chip 10, 828 �2010�.37 U. Z. Littauer, Biophys. Chem. 86, 259 �2000�.
024116-16 Giraud et al. Biomicrofluidics 5, 024116 �2011�