Observations of the 11 June Dryline during IHOP_2002—A Null Case for Convection Initiation
19
Observations of the 11 June Dryline during IHOP_2002—A Null Case for Convection Initiation HUAQING CAI Advanced Study Program and Atmospheric Technology Division, National Center for Atmospheric Research, Boulder, Colorado WEN-CHAU LEE AND TAMMY M. WECKWERTH Atmospheric Technology Division, National Center for Atmospheric Research, Boulder, Colorado CYRILLE FLAMANT Institut Pierre-Simon Laplace/Service d’Aeronomie, Paris, France HANNE V. MURPHEY Department of Atmospheric Sciences, University of California, Los Angeles, Los Angeles, California (Manuscript received 16 August 2004, in final form 1 March 2005) ABSTRACT The detailed analysis of the three-dimensional structure of a dryline observed over the Oklahoma pan- handle during the International H 2 O Project (IHOP_2002) on 11 June 2002 is presented. High-resolution observations obtained from the National Center for Atmospheric Research Electra Doppler Radar (ELDORA), S-band dual-polarization Doppler radar (S-Pol), water vapor differential absorption lidar (DIAL) Lidar pour l’Etude des Interactions Aérosols Nuages Dynamique Rayonnement et du Cycle de l’Eau (LEANDRE II; translated as Lidar for the Study of Aerosol–Cloud–Dynamics–Radiation Interac- tions and of the Water Cycle) as well as Learjet dropsondes are used to reveal the evolution of the dryline structure during late afternoon hours when the dryline was retreating to the northwest. The dryline reflec- tivity shows significant variability in the along-line direction. Dry air was observed to overrun the moist air in vertical cross sections similar to a density current. The updrafts associated with the dryline were 2–3 m s 1 and were able to initiate boundary-layer-based clouds along the dryline. The formation of this dryline was caused by high equivalent potential temperature air pushing northwestward toward a stationary front in the warm sector. Middle-level clouds with radar reflectivity greater than 18 dBZ e near the dryline were detected by ELDORA. A roll boundary, which was associated with larger convergence and moisture content, was evident in the S-Pol data. It is found that the instability parameters most favorable for convection initiation were actually associated with the roll boundary, not the dryline. A storm was initiated near the roll boundary probably as a result of the combination of the favorable instability parameters and stronger upward forcing. It is noted that both the 11 June 2002 dryline and the roll boundary presented in this paper would not be identified if the special datasets from IHOP_2002 were not available. Although all model runs [fifth-generation Pennsylvania State University–NCAR Mesoscale Model (MM5), Meso Eta, and Rapid Update Cycle (RUC)] suggested deep convection over the Oklahoma panhandle and several cloud lines were observed near the dryline, the dryline itself did not initiate any storms. The reasons why the dryline failed to produce any storm inside the IHOP_2002 intensive obser- vation region are discussed. Both synoptic-scale and mesoscale conditions that were detrimental to con- vection initiation in this case are investigated in great detail. Corresponding author address: Huaqing Cai, Advanced Study Program and Atmospheric Technology Division, National Center for Atmospheric Research, Boulder, CO 80307. E-mail: [email protected] 336 MONTHLY WEATHER REVIEW VOLUME 134 © 2006 American Meteorological Society MWR2998
-
Upload
independent -
Category
Documents
-
view
0 -
download
0
Transcript of Observations of the 11 June Dryline during IHOP_2002—A Null Case for Convection Initiation

Observations of the 11 June Dryline during IHOP_2002—A Null Case for ConvectionInitiation
HUAQING CAI
Advanced Study Program and Atmospheric Technology Division, National Center for Atmospheric Research, Boulder, Colorado
WEN-CHAU LEE AND TAMMY M. WECKWERTH
Atmospheric Technology Division, National Center for Atmospheric Research, Boulder, Colorado
CYRILLE FLAMANT
Institut Pierre-Simon Laplace/Service d’Aeronomie, Paris, France
HANNE V. MURPHEY
Department of Atmospheric Sciences, University of California, Los Angeles, Los Angeles, California
(Manuscript received 16 August 2004, in final form 1 March 2005)
ABSTRACT
The detailed analysis of the three-dimensional structure of a dryline observed over the Oklahoma pan-handle during the International H2O Project (IHOP_2002) on 11 June 2002 is presented. High-resolutionobservations obtained from the National Center for Atmospheric Research Electra Doppler Radar(ELDORA), S-band dual-polarization Doppler radar (S-Pol), water vapor differential absorption lidar(DIAL) Lidar pour l’Etude des Interactions Aérosols Nuages Dynamique Rayonnement et du Cycle del’Eau (LEANDRE II; translated as Lidar for the Study of Aerosol–Cloud–Dynamics–Radiation Interac-tions and of the Water Cycle) as well as Learjet dropsondes are used to reveal the evolution of the drylinestructure during late afternoon hours when the dryline was retreating to the northwest. The dryline reflec-tivity shows significant variability in the along-line direction. Dry air was observed to overrun the moist airin vertical cross sections similar to a density current. The updrafts associated with the dryline were 2–3 m s�1
and were able to initiate boundary-layer-based clouds along the dryline. The formation of this dryline wascaused by high equivalent potential temperature air pushing northwestward toward a stationary front in thewarm sector.
Middle-level clouds with radar reflectivity greater than 18 dBZe near the dryline were detected byELDORA. A roll boundary, which was associated with larger convergence and moisture content, wasevident in the S-Pol data. It is found that the instability parameters most favorable for convection initiationwere actually associated with the roll boundary, not the dryline. A storm was initiated near the rollboundary probably as a result of the combination of the favorable instability parameters and strongerupward forcing. It is noted that both the 11 June 2002 dryline and the roll boundary presented in this paperwould not be identified if the special datasets from IHOP_2002 were not available.
Although all model runs [fifth-generation Pennsylvania State University–NCAR Mesoscale Model(MM5), Meso Eta, and Rapid Update Cycle (RUC)] suggested deep convection over the Oklahomapanhandle and several cloud lines were observed near the dryline, the dryline itself did not initiate anystorms. The reasons why the dryline failed to produce any storm inside the IHOP_2002 intensive obser-vation region are discussed. Both synoptic-scale and mesoscale conditions that were detrimental to con-vection initiation in this case are investigated in great detail.
Corresponding author address: Huaqing Cai, Advanced Study Program and Atmospheric Technology Division, National Center forAtmospheric Research, Boulder, CO 80307.E-mail: [email protected]
336 M O N T H L Y W E A T H E R R E V I E W VOLUME 134
© 2006 American Meteorological Society
MWR2998

1. Introduction
During spring and early summer, hot dry air flowingoff the semiarid plateau regions of Mexico and thesouthwest United States meets cooler moist air origi-nating from the Gulf of Mexico, forming a boundarycalled the dryline (Rhea 1966; Schaefer 1974, 1986).The dryline is a relatively common feature that occurs�40% of the time over the Great Plains in late springand early summertime and has been studied extensivelyowing to its important role in convection initiation (e.g.,Schaefer 1974; Anthes et al. 1982; Koch and McCarthy1982; Bluestein and Parks 1983; Bluestein and Parker1993; Parsons et al. 1991, 2000; Sun and Wu 1992; Zieg-ler and Hane 1993; Ziegler et al. 1995; Hane et al. 1993,1997, 2001, 2002; Shaw et al. 1997; Atkins et al. 1998;Grasso 2000; Peckham and Wicker 2000; Miller et al.2001; Weiss and Bluestein 2002; Trier et al. 2004). Thestructure of the dryline has been documented usingvarious observational tools such as surface mesonets,mobile soundings, aircraft in situ measurements (e.g.,Ziegler and Hane 1993; Hane et al. 1993, 1997, 2001,2002), Doppler lidar (Parsons et al. 1991), and airborneDoppler radar with clear-air capability (Atkins et al.1998; Weiss and Bluestein 2002).
Although drylines are favorable places for convec-tion initiation, not every dryline initiates storms. Therehave been a few hypotheses trying to explain why con-vection does not initiate even though the dryline itselfseems to provide enough upward lift. In a case analyzedby Weiss and Bluestein (2002), they argued that a drylayer between the lifting condensation level (LCL) andthe level of free convection (LFC) just atop of the con-vective boundary layer (CBL) played a key role in pro-hibiting convection initiation. When moist boundarylayer updrafts enter this very dry layer, entrainmentand evaporation will occur and eventually the updraftwill lose its buoyancy. Richter and Bosart (2002) stud-ied the synoptic-scale environment of a dryline duringthe Verification of Origins of Rotation in TornadoesExperiment (VORTEX 95) and found that a short-wave ridge over the dryline region caused mesoscalesubsidence and warming at the middle levels, whichprevented convection initiation on that particular dayeven though earlier forecasts suggested that severestorms would be likely. Another detrimental factor forconvection initiation associated with drylines is strongshear within the boundary layer. Ziegler and Rasmus-sen (1998) suggested that strong shear enhances en-trainment and turbulent mixing and as a result of thatthe updraft will be diluted and becomes much weaker.
On 11 June 2002 during the International H2O Proj-ect (IHOP_2002; Weckwerth et al. 2004), a dryline
formed in the Oklahoma panhandle in the late after-noon and was retreating to the northwest at a speed of�1.5–2.5 m s�1. All the IHOP_2002 facilities were di-rected to the region in hope of deep convection basedon early model forecasting. Nevertheless, convectiondid not initiate despite the fact that all models [fifth-generation Pennsylvania State University–NationalCenter for Atmospheric Research (Penn State–NCARMesoscale Model (MM5), Meso Eta, and Rapid Up-date Cycle (RUC)] suggested convection initiation overthe Oklahoma panhandle (see the IHOP_2002 fieldcatalog at http://www.joss.ucar.edu/ihop/catalog/missions.html). Although no convection was initiatednear the dryline inside the IHOP_2002 intensive obser-vation region [IOR; defined as the dual-Doppler do-main of the Electra Doppler Radar (ELDORA)], threestorms were initiated outside the IHOP_2002 IOR.One tornadic storm (storm A) was initiated along astationary front near Russell, Kansas, which was �200km northeast of IHOP_2002 IOR. The second smallerstorm (storm B) was initiated along the stationary front�100 km north of IHOP_2002 IOR. The third storm(storm C) was initiated along a preexisting fine line,which probably originated from well-defined horizontalconvective rolls (HCRs; hereafter, this boundary will becalled the roll boundary) �80 km south of theIHOP_2002 IOR (see Fig. 1).
This paper documents the detailed structure and evo-lution of the 11 June dryline using ELDORA (Hilde-brand et al. 1994, 1996), S-band dual-polarizationDoppler radar (S-Pol) (Lutz et al. 1995), the water va-por differential absorption lidar (DIAL) Lidar pourl’Etude des Interactions Aérosols Nuages DynamiqueRayonnement et du Cycle de l’Eau (LEANDRE II;translated as Lidar for the Study of Aerosol–Cloud–Dynamics–Radiation Interactions and of the WaterCycle) (Bruneau et al. 2001), Learjet dropsondes (Hockand Franklin 1999), NCAR Mobile GPS/Loran Atmo-spheric Sounding System (MGLASS) soundings(Bluestein 1993), as well as Naval Research Laboratory(NRL) P-3 flight-level data. The S-Pol radar refractivityfor mapping surface moisture, the water vapor mea-surements by LEANDRE II, and Learjet dropsondesfor constructing the mesoscale environment of thedryline are unique to IHOP_2002 studies since theywere not available before IHOP_2002. One novel ob-servation that came out of this paper is the simulta-neous detection of the dryline and middle-level cloudsby ELDORA that had yet to be accomplished in pre-vious dryline studies. National Centers for Environ-mental Prediction (NECP)–NCAR reanalysis data(Kalnay et al. 1996; Kistler et al. 2001) are used toinvestigate the synoptic-scale environment at middle
JANUARY 2006 C A I E T A L . 337
levels over the dryline. Various factors that may affectconvection initiation along the dryline are also dis-cussed.
Section 2 briefly describes the IHOP_2002 projectand data methodology. Environmental conditions andS-Pol observations are presented in sections 3 and 4,respectively. ELDORA and LEANDRE II, as wellas Learjet dropsonde analyses, are respectively dis-cussed in sections 5 and 6. Factors not favorable forconvection initiation in this case are discussed in section7, and a summary and discussion are presented in sec-tion 8.
2. IHOP_2002 and data methodology
IHOP_2002 is a multiagency field campaign involv-ing scientists from numerous countries. It was con-
ducted over the southern Great Plains in spring andearly summer of 2002 (Weckwerth et al. 2004). Themajor objective of IHOP_2002 is to improve the under-standing of the role of water vapor in various atmo-spheric processes such as convection initiation (CI).Both ground-based and airborne state-of-the-art re-mote sensing technologies are used to monitor thethree-dimensional kinematic and thermodynamic varia-tions of the atmosphere in unprecedented high spatialand temporal resolution. It is hoped that these high-resolution observations that were largely unavailablebefore IHOP_2002 will help to further understandingof where and when convection will initiate. For an over-view of IHOP_2002, please refer to Weckwerth et al.(2004). The major instruments used in this study arediscussed below.
FIG. 1. Subjective surface analyses superimposed onto visible satellite images at (a) 2000, (b) 2100, (c) 2200, and (d) 2300 UTC on11 Jun 2002. Temperature and dewpoint temperature are shown (°C). Wind vectors are plotted with full barb and half barb representing5 and 2.5 m s�1, respectively. The black box in (b) represents the approximate dimension and position of the S-Pol and ELDORAanalysis domain (i.e., the IHOP_2002 IOR) for this case.
338 M O N T H L Y W E A T H E R R E V I E W VOLUME 134

a. S-Pol radar refractivity
The S-Pol radar developed and operated by NCARhas the unique capability to map atmospheric surfacemoisture fields by measuring the atmospheric refractiveindex, N. The basic principle is to detect the phase shiftof fixed ground targets such as electrical poles and de-rive the atmospheric refractive index N from the Dopp-ler phase shift (Fabry et al. 1997). In the summertimeconditions of the atmosphere near the ground, the re-fractive index N is more sensitive to moisture thanother atmospheric-state variables such as pressure andtemperature; therefore the derived N value is a goodindicator of the moisture content in the atmospherenear the ground. For details of radar-mapping surfacemoisture using radar refractivity, the reader is referredto Fabry et al. (1997) and Weckwerth et al. (2005).
Fortunately the dryline on 11 June 2002 duringIHOP_2002 was fairly close to the S-Pol radar (lessthan 30 km), and accurate refractivity data were col-lected from the dryline. Both S-Pol radar reflectivityand refractivity are interpolated on the same Cartesiancoordinate system as the one used in the ELDORAdual-Doppler analysis. The horizontal grid spacing was600 m and a Cressman filter with a radius of influenceof 600 m was used in the interpolation process.
b. ELDORA
ELDORA has been successfully used in a number offield campaigns studying various atmospheric phenom-ena including tornadoes, supercells, fronts, and drylines(Wakimoto et al. 1996, 1998; Atkins et al. 1998;Wakimoto and Cai 2000, 2002; Dowell and Bluestein2002a,b; Weiss and Bluestein 2002). One unique fea-ture of ELDORA is its high sensitivity (�12 dBZe at10-km range) capable of detecting clear-air returns inthe convective boundary layer that is not available toother X-band airborne Doppler radars. This capabilityis essential for detecting the dryline owing to thedryline’s weak reflectivity. The scanning parameters forthis case are listed in Table 1. A careful navigationcorrection was applied to the original radar data (Lee et
al. 1994; Testud et al. 1995), and each sweep was manu-ally edited using NCAR SOLO software (Oye at al.1995) to remove spurious echoes such as ground clutter,sidelobes, and second trip echoes.
The along-track resolution of �550 m and the sweepangle resolution of �1.5° determined the horizontalgrid spacing of 600 m and vertical grid spacing of 300 m,respectively. Accordingly, the fore and aft radar datawere interpolated to a Cartesian grid using NCARREORDER software. Only features with wavelengthslarger than 3.6 km are resolvable in the present studybased on Carbone et al. (1985). A Cressman (1959)filter is used in the interpolation process with a radiusof influence of 600 m in the horizontal and 300 m in thevertical directions. Custom Editing and Display of Re-duced Information in Cartesian Space (CEDRIC;Mohr et al. 1986) was used to synthesize the dual-Doppler winds, and a two-step Leise (1982) filter wasapplied to the derived wind field. Vertical velocity wasobtained by upward integration of the continuity equa-tion. This very same dual-Doppler technique has beenused in a number of ELDORA data analyses(Wakimoto et al. 1998; Atkins et al. 1998; Wakimotoand Cai 2000, 2002; Dowell and Bluestein 2002a,b;Weiss and Bluestein 2002). For details of ELDORA,the reader is referred to Hildebrand et al. (1994, 1996).
c. LEANDRE II
LEANDRE II is a water vapor DIAL developed atthe Service d’Aéronomie [Centre National de la Re-cherche Scientifique (CNRS)] in cooperation with theTechnical Division of the Institut National des Sciencesde l’Univers (INSU) and was funded by the CentreNational d’Etudes Spatiales (CNES). The design of theLEANDRE II system and the standard DIAL signalprocessing are discussed in great detail by Bruneau etal. (2001). The reader is referred to Murphey et al.(2006) for the configuration and characteristics ofLEANDRE II during IHOP_2002.
LEANDRE II was mounted on the same aircraft(NRL P-3) as ELDORA during IHOP_2002. The lidarwas pointing horizontally out of the right side of theaircraft during convection initiation missions. Accord-ing to Bruneau et al. (2001), LEANDRE II has analong-beam resolution of 300 m and water vapor mixingratio measurement precision better than 0.5 g kg�1 inthe 0–5-km distance range from the aircraft. Because ofthe saturation of the lidar signal caused by high watervapor content in the CBL and the geometric factor ofthe lidar system as discussed in Murphey et al. (2006)the usable lidar water vapor measurements only existbetween 1.2 and 3.5–4 km along the lidar line of sight.
TABLE 1. ELDORA scanning mode.
Antenna rotation rate (° s�1) 75No. of samples 60PRF (Hz) 3000Gate length (m) 110Sweep-angle resolution (°) 1.5Along-track resolution (m) �550Maximum range (km) 50Maximum unambiguous velocities (� m s�1) 23.4
JANUARY 2006 C A I E T A L . 339

A two-pass Barnes (1973) filter was used to interpo-late the lidar water vapor field onto the same Cartesiangrid used for ELDORA wind syntheses. The cutoff ra-dius, the smoothing parameter, and the convergenceparameter were set to 600 m, 600 m2, and 0.3, respec-tively. These parameters were chosen so that the reso-lution of the moisture field was comparable to theELDORA dual-Doppler wind syntheses.
3. Environmental conditions
Subjective surface analyses superimposed on the vis-ible satellite imagery at 2000, 2100, 2200, and 2300 UTC(hereafter, all times are UTC) in the IHOP_2002 do-main are shown in Fig. 1. Upper-level charts indicate nosignificant disturbances over the Oklahoma panhandlewhere the IHOP_2002 IOR was located. A well-defined stationary frontal zone can be seen across Kan-sas from southwest to northeast at 2000. Also apparentis the dryline extending from central Kansas into theOklahoma panhandle. A tornadic storm (storm A) wasinitiated around 2100 along the stationary front nearRussell, Kansas. The winds northwest of the stationaryfront are generally weak and from the north-northeast,while the relatively strong southerly winds are advect-ing warm moist air southeast of the stationary front.The stationary front initiated another small storm(storm B) around 2207, and storm C was started alonga roll boundary detected by S-Pol as a fine line south-east of the retreating dryline around 2210. During theperiod of intensive data collection from 2100 to 2330,no storms were formed inside the IHOP_2002 IOR inthe Oklahoma panhandle, even though middle-levelclouds with radar reflectivity greater than 18 dBZe andboundary layer clouds were observed by ELDORAand IHOP_2002 personnel in the field (F. Fabry 2004,personal communication), respectively. One trend no-ticed from the surface data is the gradual drying of thesurface layer throughout the region, with enhanced dry-ing on the northwest side of the dryline. This gradualdrying trend may be one of the many reasons that thedryline was prevented from initiating storms in this par-ticular case.
The subjective surface analyses presented in Fig. 1can be justified by the subjective surface potential tem-perature (�) and equivalent potential temperature (�e)analyses in Fig. 2. The stationary front across south-central Kansas and the Oklahoma panhandle was char-acterized by a wind shift line. The dryline over theOklahoma panhandle, which is the main focus of thisstudy, was formed as a result of high �e air pushingnorthwestward toward the stationary front in the warmsector (Fig. 2b). Both � and �e differentials were asso-
ciated with this dryline, although they were relativelyweak. Another dryline, which is a more traditionaldryline in the sense that it separates the hot dry air onthe west from the cooler moist air on the east, can beidentified over the Texas panhandle. As the high �e airpushed farther northwestward, these two drylines seemto become connected (Fig. 2d). It should be noted thatthe dryline over the Oklahoma panhandle was not iden-tifiable if the IHOP_2002 special datasets were notavailable (surface analyses from NCEP did not showthis dryline).
The movement of the dryline within the Oklahomapanhandle during the data collection period from 2000to 2330 is shown in Fig. 3. The dryline position wasobtained from S-Pol radar reflectivity fine lines. It isestimated that the dryline was moving at �2.5 m s�1
from 138° until 2200 when its speed slowed down to�1.5 m s�1. The retreating dryline has been studied ina number of cases, and the mechanism of its propaga-tion has been debated among different investigators.One hypothesis is the density current analogy. Parsonset al. (1991), among others, demonstrated that thedryline was retreating to the west at a speed close to theexpected density current speed. On the other hand,Crawford and Bluestein (1997) showed surface obser-vations that suggest that the passage of a dryline doesnot resemble that of a typical density current, such as agust front. This issue will be addressed in section 5 withNCAR mobile soundings and Learjet dropsonde data.
4. S-Pol radar reflectivity and refractivity
The S-Pol radar reflectivity and refractivity fields as-sociated with the 11 June 2002 dryline are shown in Fig.4. The dryline is delineated by a radar reflectivity fineline that is oriented southwest–northeast. Generally thegreatest gradient of radar refractivity is closely associ-ated with or slightly northwest of the radar reflectivityfine line. Larger refractivity values that correspond togreater moisture can generally be seen southeast of theretreating dryline. Noteworthy is the variability ofmoisture in the along-line direction as demonstrated inthe radar refractivity fields northwest of the dryline.The NRL P-3 aircraft tracks are also plotted in Fig. 4.The radar refractivity along the track is compared withthe mixing ratio at the flight level (600 m AGL) in Fig.5. General agreement between the trend of mixing ratioand radar refractivity (N value) are found for the threelegs shown in Fig. 4, although much more detailedvariations can only be seen in the flight-level data. Thisis not surprising since the radar refractivity has a lowereffective resolution (�4 km) compared with that offlight-level data (�110 m). Although the S-Pol radar
340 M O N T H L Y W E A T H E R R E V I E W VOLUME 134

refractivity data have the same nominal resolution asradar reflectivity (�150 m gate length), its effectiveresolution is much lower as a result of filtering andsmoothing by the algorithm used to derive radar refrac-tivity. Other reasons that might contribute to the dis-crepancy of mixing ratio and N values are believed tobe 1) the height difference between flight-level data(�600 m AGL) and refractivity data (near the surface)and 2) pressure and temperature effects on the radarrefractivity in addition to moisture. For a detailed in-tercomparison between S-Pol radar refractivity andother moisture measurements, the reader is referred toWeckwerth et al. (2005).
Another pronounced feature in Fig. 4 is the rollboundary that was associated with a radar reflectivityfine line southeast of the dryline. This roll boundary
probably originated from a well-defined HCR and wasassociated with much larger radar reflectivity values.Since stronger radar reflectivity of a fine line usuallyimplies stronger convergence and updrafts (Wilson etal. 1994; Hane et al. 2002), the best chance for convec-tion initiation might well be associated with this rollboundary. In fact there was a storm (storm C in Figs. 1and 13) that was initiated along this roll boundaryaround 2210.
5. ELDORA, LEANDRE II, and NRL P-3flight-level data analysis
a. Along-line variability
The dual-Doppler synthesis from ELDORA for the11 June 2002 dryline is shown in Fig. 6. Also plotted in
FIG. 2. Potential temperature (�) and equivalent potential temperature (�e) analyses superimposed on the visible satellite images at2000 and 2200 UTC on 11 Jun 2002: (a) � at 2000 UTC, (b) �e at 2000 UTC, (c) � at 2200 UTC, and (d) �e at 2200 UTC. Wind vectorsare plotted with full barb and half barb representing 5 and 2.5 m s�1, respectively.
JANUARY 2006 C A I E T A L . 341

the right panels of Fig. 6 are the echoes from themiddle-level clouds near the dryline observed byELDORA. In the high-resolution ELDORA observa-tions of radar reflectivity, the dryline is shown withsignificant along-line variability that has been docu-mented in previous studies (Atkins et al. 1998). Thedryline was fairly linear in the radar reflectivity field at2108–2116 (Fig. 6a). By 2214–2228, it developed a kinknear the middle of the domain (Fig. 6c). As a result ofthat, the NRL P-3 actually flew within the dryline start-ing around 2221:30 when the flight-level mixing ratioshowed strong variability (Fig. 5b). The mixing ratio atflight level shows a sharp drop from 13 to 9 g kg�1 at2223:30 as the P-3 completely penetrated the kink in thedryline. The moisture recovered shortly after 2225when the P-3 was southeast of the dryline again (seeFigs. 5b and 6c).
The strong variability of the moisture field along thedryline during 2218–2227 was also nicely captured byLEANDRE II. Figure 7 shows the water vapor mixingratio obtained by the lidar superimposed on dryline-relative winds, radar reflectivity, and vertical velocitywithin the box shown in Fig. 6c. Clearly the drylinedemonstrated considerable along-line variability bothin terms of radar reflectivity and water vapor mixingratio. The dryline-relative winds have a larger cross-linecomponent northwest of the dryline kink region withinthe dry air, confirming that the dryline kink was apocket of dry air pushing eastward. As shown by theS-Pol radar reflectivity and refractivity data in Fig. 4,Fig. 7 confirms that the radar reflectivity fine line is
closely associated with the greatest moisture gradient ofthe dryline. A careful examination of the relation be-tween local maxima of radar reflectivity, water vapormixing ratio, and vertical velocity suggests that gener-ally the radar reflectivity maxima are closely associatedwith pockets of high moisture content air and updraftswith a few exceptions at the northeast corner of Fig. 7.There is also strong indication that stronger reflectivityvalues tend to correspond to stronger updrafts, which isconsistent with previous findings (Wilson et al. 1994;Hane et al. 2002).
The dryline became quasi-linear again during 2310–2321 and the general trend of weakening radar reflec-tivity continued (Figs. 6e,f). The flight-level mixing ra-tio confirms that the P-3 is on the dry side of the mois-ture gradient except at the very beginning of the flightleg where large variations of moisture were observed(Fig. 5c). The reason for this is because although gen-erally the aircraft was flying on the dry side, it was nearthe reflectivity maxima at the beginning of the track(Fig. 6e). Remember the reflectivity fine line is a goodindicator of a larger moisture concentration; thereforewhen the P-3 was getting closer to those reflectivitymaxima, the moisture increased dramatically.
b. Cross-line variability
The cross-line variability of water vapor mixing ratioand �v derived from NRL P-3 flight-level data is shownin Fig. 8. The time series of water vapor mixing ratioand �v for three short legs perpendicular to the drylinenear the southwest corner of IHOP_2002 IOR areshown. The mixing ratio decreased by �4 g kg�1 acrossthe dryline zone of 4.4–6.6 km (the dryline zone widthwas determined by cross-line flight-level data). Al-though the moisture differential did not change muchfrom 2118 to 2306, the boundary layer moisture de-creased by �3 g kg�1 on both sides of the dryline dur-ing this same time period. The reason for this is becausethe south-southwesterly winds near the dryline wereadvecting dry air from the northern Texas panhandle tothe Oklahoma panhandle, causing the general dryingtrend in the CBL over the IHOP_2002 IOR (see sur-face analysis in Figs. 1 and 13). The �v differentialacross the dryline is �0.5 K, but it is not necessarilycollocated with the mixing ratio differential. The windsnear the dryline were generally weak (2.5–7.5 m s�1)and had a larger westerly component northwest of thedryline, whereas southeast of the dryline winds weremostly from south-southwest.
The averaged vertical cross sections perpendicular tothe dryline are shown in Figs. 9–11. These cross sectionwere obtained by averaging over �8, 10, and 9 min data(which correspond to 52, 66, and 60 km in the along-line
FIG. 3. Isochrone analysis of the dryline position within theIHOP_2002 IOR in the Oklahoma panhandle derived from S-Polradar reflectivity for times (UTC) shown in the figure.
342 M O N T H L Y W E A T H E R R E V I E W VOLUME 134

FIG. 4. S-Pol radar reflectivity at 0.6 km AGL and radar refractivity at surface. (a) Radar reflectivity at 2113:07–2118:05 UTC, (b) radar refractivity at 2113:03–2113:35 UTC, (c) radar reflectivity at 2220:39–2225:35 UTC, (d)radar refractivity at 2220:36–2221:07 UTC, (e) radar reflectivity at 2317:43–2322:35 UTC, and (f) radar refractivityat 2317:40–2318:09 UTC. The NRL P-3 flight track along with flight-level winds (black line) are also superimposedon (a), (c), and (e). The dryline fine line (gray line) derived from (a), (c), and (e) are also plotted in (b), (d), and(f), respectively. The thick black lines in all panels represent the roll boundary. The short time period for radarrefractivity measurements in (b), (d), and (f) is because refractivity measurements were only made at 0° elevationangle.
JANUARY 2006 C A I E T A L . 343

direction, respectively) for the 2108–2116, 2214–2228,and 2310–2321 analysis times, respectively. The aver-aged cross section increased the signal-to-noise ratio byremoving random noise and preserving the mean struc-ture in the signal. Several features stand out in the av-eraged vertical cross sections of radar reflectivity, up-draft, and vertical vorticity. Generally the strongest up-draft is collocated or slightly northwest of the
reflectivity fine line. Also there are very weak down-drafts �3–5 km southeast of the dryline (the retreatingdryline was moving from southeast to northwest, that is,from right to left in Figs. 9–11). The wavelike pattern ofupdraft/downdraft associated with the dryline has beendocumented before (Parsons et al. 1991; Ziegler andHane 1993). Another observation that stands out is thedissipating reflectivity fine line and the decreasingdryline updrafts with time.
Previous studies have shown that drylines behavelike density currents (Parsons et al. 1991; Ziegler andHane 1993; Atkins et al. 1998). However, Crawford andBluestein (1997) demonstrated that some drylines donot look like a density current by studying dryline pas-sage using surface mesonet data. Moreover, there arestill uncertainties about whether there is a virtual po-tential temperature differential across the dryline.Early observations (NSSP Staff 1963) showed basicallyno �v differential across the dryline, while more recentstudies (Parsons et al. 1991; Ziegler and Hane 1993;Atkins et al. 1998) found �v differential of 1–2 K acrossthe dryline. The reconciliation of these contradictingobservational results seems to come from what timeduring the dryline diurnal cycle the observations weremade (Ziegler and Hane 1993). It is possible that whenthe dryline started to retreat back to the west duringlate afternoon hours, the �v differential became morepronounced and the dryline started to behave like adensity current.
The 11 June 2002 dryline studied in this paper showssome interesting features that have not been noted in aretreating dryline before. The �v differential derivedfrom NRL P-3 flight-level data (Figs. 5 and 8) is rela-tively weak (�0.5 K). The weak baroclinity may con-tribute to the relatively weak updrafts near the dryline.It can be inferred that the dry air on the left side of Figs.9 and 10 is lifted over the dryline and then sinks 2–5 kmdownstream as previous studies have shown before.However, there is no indication of a rotation head orsecondary circulation, which are common in a typicaldensity current. Also, using the density current formulawith an assumption of an internal Froude number ofone, the dryline motion based on Learjet dropsondedata is found to be �5.2 m s�1, which is much largerthan the dryline motion of 2.5 m s�1 estimated fromS-Pol reflectivity at this time. Therefore, it seems thatthe current dryline case does not fit a density currentvery well.
The dryline seems to be weakening during the obser-vational period from 2100 to 2330. The radar reflectiv-ity, the updraft, and vertical vorticity all decreased sig-nificantly. The boundary layer is also drying out (see
FIG. 5. Time series of NRL P-3 flight-level data as it flew at�600 m AGL along the dryline (see Figs. 4 and 6 for flight tracks).Water vapor mixing ratio (q), virtual potential temperature (�v),and equivalent potential temperature (�e) are plotted. The S-Polradar refractivity (N) along the flight track is also plotted. (a)2108–2116, (b) 2214–2228, and (c) 2310–2323 UTC.
344 M O N T H L Y W E A T H E R R E V I E W VOLUME 134

FIG. 6. Dual-Doppler wind synthesis (ground relative) and radar reflectivity from ELDORA at 0.5 and 5.3 kmAGL near the dryline; (a) 2108:03–2116:01 UTC at 0.5 km AGL, (b) 2108:03–2116:01 UTC at 5.3 km AGL, (c)2214:02–2228:04 UTC at 0.5 km AGL, (d) 2214:02–2228:04 UTC at 5.3 km AGL, (e) 2310:03–2321:33 UTC at 0.5km AGL, and (f) 2310:03–2321:33 UTC at 5.3 km AGL. Thin black contours represent radar reflectivity withdashed lines indicating negative reflectivity values. Contour interval is 1 dBZe in (a), (c), and (e) and 5 dBZe in (b),(d), and (f). NRL P-3 flight tracks (black lines) along with time and flight-level winds are plotted in (a), (c), and(e). The dryline fine line positions derived from (a), (c), and (e) are plotted as thick black lines in (b), (d), and (f),respectively. N1 and N2 in (b) represent the positions of NCAR MGLASS soundings at 2137 and 2051 UTC,respectively. D5 and D6 in (b) indicate two Learjet dropsondes at 2146 and 2149 UTC, while D5�, D6�, and D7� in (f)represent three dropsondes at 2331, 2334, and 2337 UTC, respectively. A–A�, B–B�, and C–C� are the positions ofindividual vertical cross sections shown in Figs. 12a–c. The black box in Fig. 6c represents the domain used in Fig. 7.
JANUARY 2006 C A I E T A L . 345

Figs. 1 and 13) and clouds are dissipating inside theIHOP_2002 IOR.
c. The cloud fields near the dryline
The dryline was accompanied by middle-level cloudsat 2108–2116 (Fig. 6b). Satellite imagery loops indicatethat these middle-level clouds were advected into theIHOP_2002 IOR and they tended to dissipate afterthey entered the Oklahoma panhandle region. Cloudscan be seen on both sides of the dryline and sometimesright over the dryline as shown in Fig. 6. Some of themhave radar reflectivity values as large as 18 dBZe. Ver-tical cross sections of both dryline and clouds are shownin Fig. 12. The clouds are middle level based and themaximum reflectivity of these clouds is located around5.5 km AGL. All clouds are found to be within 15 kmof the dryline. The dryline itself is shown as a reflectiv-ity maximum in all three analyses times and found to beassociated with updrafts of 2–3 m s�1 (The cross sec-tions in Fig. 12 are not necessarily cutting through theupdraft maximum; therefore their updraft values arelower). By 2310–2321 the clouds almost disappeared
except for a few low-reflectivity clouds just above thedryline. The reason for cloud dissipation will be dis-cussed in section 7. It should be emphasized that themiddle-level clouds in Figs. 6 and 12 were not con-nected to the dryline at all and they failed to developinto storms as they moved near the dryline, althoughprevious studies have shown that sometimes middle-level clouds did develop into storms when they ap-proached drylines (Hane et at. 1997).
The dryline, roll boundary, and Learjet dropsondepositions superimposed on satellite imagery with sur-face analysis are shown in Fig. 13. The individual cloudsin Figs. 12a–c are indicated in Figs. 13a–c as smallcircles. The dryline and roll boundary positions are ob-tained from S-Pol radar reflectivity. It is apparent thatsome clouds do not show up in radar observations eventhough they can be clearly identified on the satelliteimage. One example of this mismatch is the cloud lineright above the surface dryline at 2112 in Fig. 13a.Those clouds were found to be connected to the bound-ary layer and probably were initiated by the dryline
FIG. 7. Water vapor mixing ratio from LEANDRE II superim-posed on dryline-relative winds, radar reflectivity, and verticalvelocity from ELDORA at 0.5 km AGL for 2218:00–2227:00UTC. Solid (dashed) red line represents updraft (downdraft) withcontour interval of 0.5 m s�1; thick solid (dashed) black line rep-resents positive (negative) radar reflectivity values with contourinterval of 1 dBZe. The NRL P-3 flight track is drawn as the thinblack line.
FIG. 8. Time series of NRL P-3 flight-level data as it flew at�600 m AGL across the dryline (see Fig. 6 for the flight tracks).Water vapor mixing ratio (q), virtual potential temperature (�v),and winds are plotted. (a) 2118:30–2120:00, (b) 2229:40–2231:00,and (c) 2306:30–2308:00 UTC.
346 M O N T H L Y W E A T H E R R E V I E W VOLUME 134
Fig 7 live 4/C

(Fabry 2006). Interestingly those clouds did not evolveinto storms and they were not detected by ELDORA.The cloud line seen by ELDORA in Fig. 6b was �13km southeast of the surface dryline in the moist air
mass and was middle level based. On the other hand,darker clouds, which might be difficult to identify invisible satellite imagery, are sometimes actually associ-ated with much large radar reflectivity, such as theclouds at the west edge of analysis domain in Fig. 13b.By 2319 the clouds inside the IHOP_2002 IOR are al-most all dissipated. Surface observations also show thisgeneral drying trend on both sides of the dryline. Oneinteresting thing is that the roll boundary, which per-haps was associated with the best combination of con-vergence and moisture based on its much stronger re-flectivity observed by S-Pol (Fig. 4) and larger surfacemoisture content shown in the surface analysis (Fig.13), did initiate a storm (storm C in Figs. 1d, 13b, and13c) at 2207. The first echo was identified at 4.7 kmAGL in S-Pol reflectivity with a value of 23 dBZe. Theecho grew both horizontally and vertically (upward anddownward) and reached a maximum reflectivity valueof 60 dBZe by 2300. After the initiation, storm C movednortheast away from the roll boundary and the stormdissipated around 0015 on 12 June 2002.
6. Learjet dropsonde data analysis
One advantage of IHOP_2002 compared to otherfield campaigns studying drylines is its deployment ofdropsonde aircraft. Many previous dryline studies re-lied heavily on aircraft in situ measurements using thestepped-traverse flying pattern and the data usually
FIG. 9. Mean vertical cross section of the dryline for 2108:03–2116:01 UTC. Dual-Doppler winds (dryline relative) superim-posed onto (a) radar reflectivity, (b) vertical velocity, and (c)vertical vorticity.
FIG. 10. Same as Fig. 9 except for 2214:02–2228:04 UTC.
FIG. 11. Same as Fig. 9 except for 2310:03–2321:33 UTC.
JANUARY 2006 C A I E T A L . 347

have poor time and/or vertical resolution. The advan-tage of dropsonde aircraft is its ability to release sound-ings in rapid succession, and therefore the dropsondedata can cover a larger area in a relatively short timeperiod with high spatial resolution. On 11 June 2002 aLearjet released two lines of dropsondes perpendicularto the dryline at 2134–2159 and 2322–2345 whenELDORA was collecting dual-Doppler data on thedryline. The position of each drop is plotted in Fig. 13with respect to the dryline and roll boundary positions.The horizontal drift of the dropsondes was not cor-
rected during IHOP_2002 and it should not cause anyconcern if the winds aloft were not so strong. Each dropis roughly separated by 20–25 km and each cross sectioncontains nine drops that cover a distance of �200 km in
→
FIG. 13. Surface analyses superimposed on visible satellite im-ages at (a) 2112, (b) 2221, and (c) 2319 UTC. Temperature anddewpoint temperature are shown (°C). Wind vectors are plottedwith the full barb and half barb representing 5 and 2.5 m s�1,respectively. The box represents the dual-Doppler domain in Fig.6. Thin black line represents the dryline; thick black line repre-sents the roll boundary. Dropsonde positions are plotted as aster-isks, and the black dot indicates the S-Pol radar position. D1–D9in Figs. 13a and 13b represent the 2134–2159 UTC drop series,and D1�–D9� in Fig. 13c represent the 2322–2345 UTC drop se-ries. The clouds shown in Fig. 12 are represented by small opencircles.
FIG. 12. Individual vertical cross section of dual-Doppler winds(dryline relative) and radar reflectivity from ELDORA at (a)2108:03–2116:01, (b) 2214:02–2228:04, and (c) 2310:03–2321:33UTC analysis times. The positions of the cross sections in (a), (b),and (c) are shown in Figs. 6b, 6d, and 6f, respectively.
348 M O N T H L Y W E A T H E R R E V I E W VOLUME 134

the cross-line direction. Basically the dropsonde datawill provide information about the mesoscale environ-ment, not the detailed structure of the dryline.
The water vapor mixing ratio shown in Fig. 14 indi-cates that the CBL is well mixed and the boundarylayer top is higher within the dry air mass. The dry layerbetween 700 and 500 mb is apparent on both sides ofthe dryline. One interesting feature in Fig. 14 is that themoist plume corresponding to the height of the 9 g kg�1
mixing ratio contour reached �3.2 km MSL approxi-mately 60 km northwest of the dryline, but it onlyreached �2.2 km MSL southeast of the dryline. It alsoshould be pointed out that the boundary layer is rela-tively dry even on the moist side of the dryline for thisparticular case (relative humidity only reaches �40%near the surface at the dryline).
The instability parameters calculated from eachdropsonde using NCAR System for User-editing andDisplay of Soundings (SUDS) software are shown inFig. 15 for 2134–2159. The lowest 50-mb mean mea-surements were used for the calculations of all the liftedparcel parameters. The convective available potentialenergy (CAPE) values derived from both the drop-sonde data and NCAR MGLASS soundings were onlyintegrated up to �450 mb, which causes the CAPEvalues to appear to be incorrectly small and can bemisleading. Therefore, attentions should only be paidto the variations, not the absolute values of the CAPEderived from dropsonde data. Caution should also be
exercised in interpreting the instability parameters cal-culated from the dropsondes since there is no way toknow where those drops landed with respect to theboundary layer updrafts/downdrafts. As Fig. 15 shows,the CAPE reached a local maximum near the station-ary front at first, then decreased to a minimum �20 kmnorthwest of the dryline, and increased dramaticallyacross the dryline and continued rising southeast of it.Convective inhibition (CIN), however, reached itsminimum near the stationary front and its maximum�20 km northwest of the dryline. Generally the CINvalues are between �30 and �100 J kg�1, values thatare too large for CI. Similar to CAPE, lifted index (LI)indicated very unstable air near the roll boundary. BothLCL and LFC reached their maximum �20 km north-west of the dryline and then decreased gradually south-eastward. Notice it is the roll boundary, not the dryline,which is associated with larger CAPE, smaller LI, andlower CIN values. The stationary front is also a favor-able place for CI since it is associated with the lowestCIN values.
The Learjet made the second line of drops at almostthe same location as the first one about 2 h later. Fig-ures 16 and 17 are the vertical cross sections obtainedfrom the dropsonde data for 2322–2345. Two significantchanges occurred between the two dropsonde verticalcross sections. One is the disappearance of the moistplume �60 km northwest of the dryline, and another isthe increase in CBL depth southeast of the dryline. Thisis apparent through the 9 g kg�1 mixing ratio contourline, which used to be at the height of �2.2 km MSLand now reaches 3 km MSL southeast of the dryline.
FIG. 14. Vertical cross section perpendicular to the drylinebased on the dropsonde data between 2134:29 and 2159:37 UTCfor water vapor mixing ratio (q in g kg�1) and virtual potentialtemperature (�v in K). The position of the stationary front,dryline, and the roll boundary are indicated at the bottom of thefigure. Wind vectors are plotted with the half barb, full barb, andflag representing 2.5, 5.0, and 25 m s�1, respectively. D1–D9 rep-resents each individual dropsonde, and their positions are plottedin Fig. 13a.
FIG. 15. Same as Fig. 14 except for relative humidity and insta-bility parameters including CAPE, CIN, LI, LCL, and LFC; LI islabeled beside each dropsonde symbol (D1–D9) at the top of thefigure.
JANUARY 2006 C A I E T A L . 349

Again the similar pattern of instability parametersfound in the previous cross section (Fig. 15) is recon-firmed here in Fig. 17. The stationary front was associ-ated with marginally favorable instability parameterscompared with that of its immediate environment. Thedry air �10 km northwest of the dryline had the highestLCL, LFC, and CIN and the lowest CAPE. Again, theroll boundary was associated with the most favorableinstability parameters. The large decrease in CAPE andincrease in CIN for the last drop is because this par-ticular dropsonde was located at a position where stormC just passed.
The virtual potential temperature in both Figs. 14
and 16 suggests there is a �v differential of �0.5 Kacross the dryline, consistent with flight-level data inFig. 8. Since the most favorable instability parametersas well as stronger surface convergence as indicated bythe stronger radar reflectivity fine line was not associ-ated with the dryline itself but with a roll boundary40–50 km east-southeast of the dryline within the moistair, it is not surprising that convection did not startalong the dryline, but instead, along the roll boundary.Only one storm was initiated along the roll boundary(storm C in Figs. 13b and 13c), which reached a maxi-mum reflectivity of 60 dBZe. Various factors that maycontribute to “convection initiation failure” near the 11June 2002 Oklahoma panhandle dryline will be dis-cussed in section 7.
7. Environmental conditions detrimental toconvection initiation
The major reason that the dryline is often a favorableplace for initiating storms is because it creates the nec-essary lift and is very close to the moist air that fuels thestorm. However, observations frequently suggest thateven though the lift from the dryline seems to be ad-equate and clouds are forming along the dryline, theseclouds may fail to develop into storms (Atkins et al.1998; Weiss and Bluestein 2002). Several hypotheseshave been proposed by various researchers in the pastto explain the lack of convection initiation along somedrylines, and this section will examine them in the con-text of the 11 June IHOP_2002 dryline.
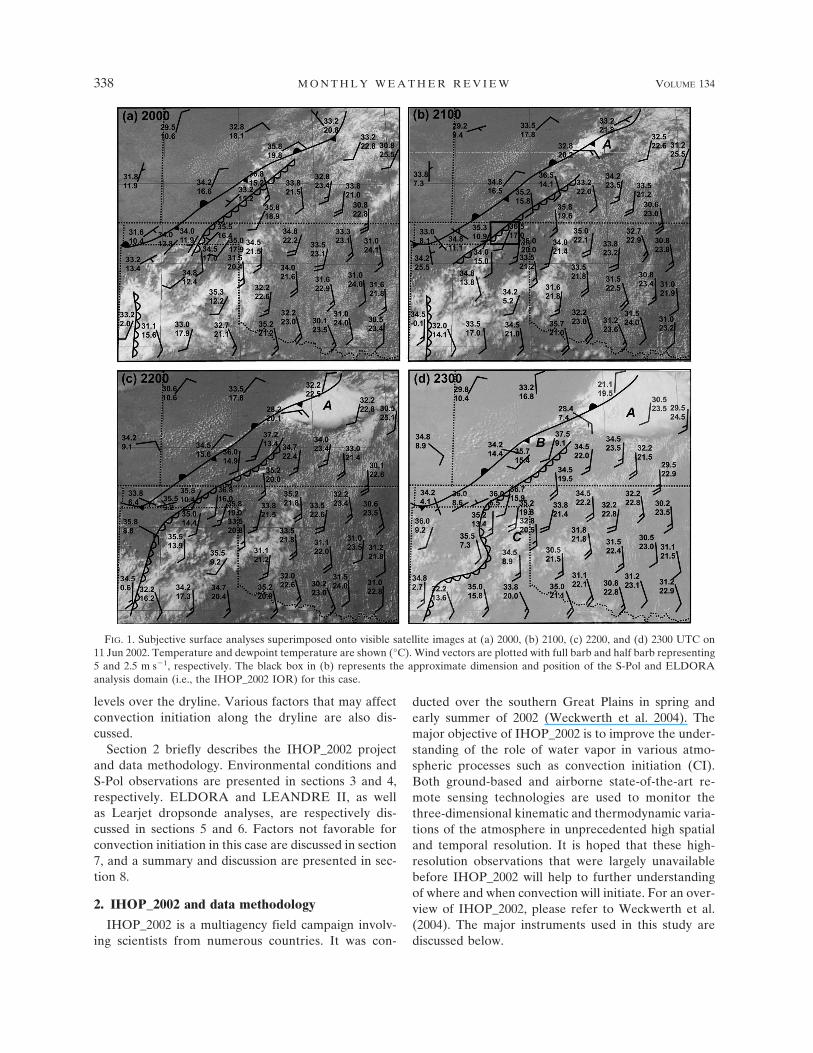
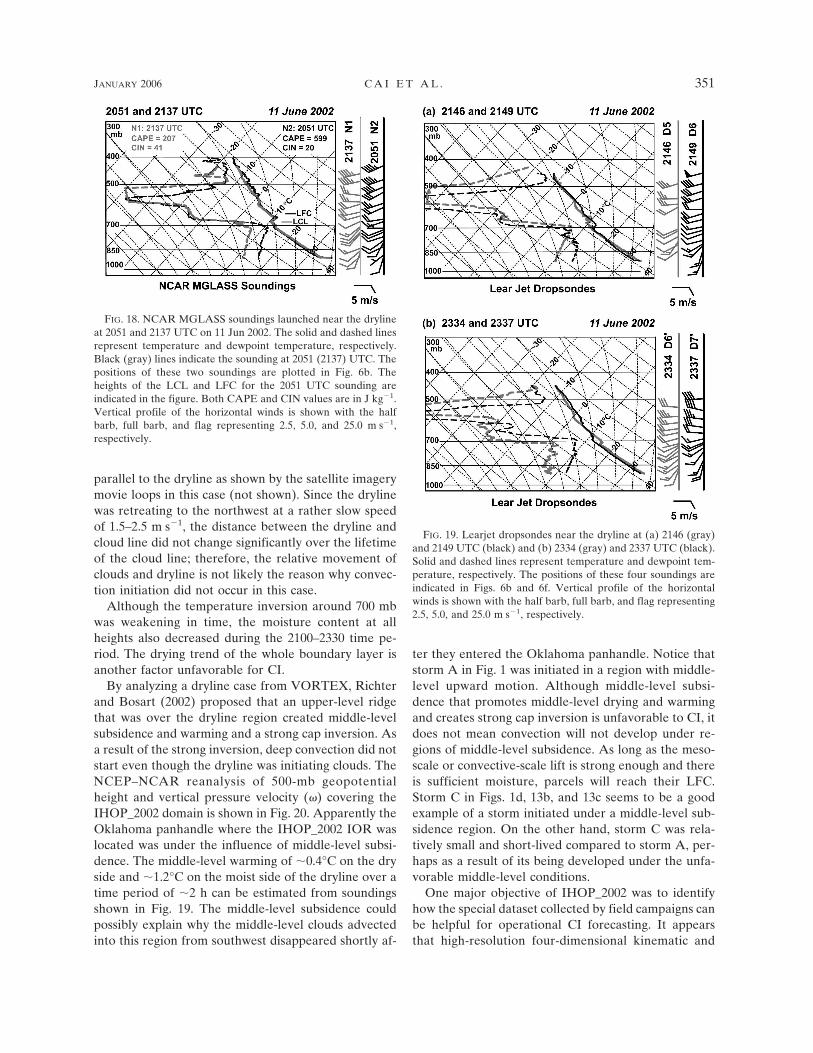
Some typical soundings on both sides of the drylinefrom NCAR MGLASS and the Learjet are shown inFigs. 18 and 19, respectively. The positions of thesesoundings relative to the dryline are shown in Figs. 6band 6f. A pronounced cap inversion is apparent in Fig.18 and a substantial dry layer can be seen above thewell-mixed CBL from 700 to 500 mb on both sides ofthe dryline. This same feature is also apparent in theLearjet dropsondes as shown in Fig. 19. Weiss andBluestein (2002) suggested that a dry layer between theLCL and LFC might be the reason why convection didnot initiate along a dryline they studied. The dry layerbetween the LCL and LFC is detrimental to CI becauseupdrafts originating within the CBL tend to evaporateinside this very dry layer and the evaporative coolingwill make the updrafts lose their buoyancy.
Storm initiation, organization, and lifetime may beaffected by the relative movement of convective cloudsand convergence lines (Wilson and Megenhardt 1997).If the clouds do not propagate at approximately thesame speed as the boundary, convection may be ad-versely affected. The cloud lines were moving almost
FIG. 16. Same as Fig 14 except for dropsonde data between2322:37 and 2345:07 UTC. D1�–D9� represent each individualdropsonde, and their positions are plotted in Fig. 13c.
FIG. 17. Same as Fig. 14 except for relative humidity and insta-bility parameters including CAPE, CIN, LI, LCL, and LFC; LI islabeled beside each dropsonde symbol (D1�–D9�) at the top of thefigure.
350 M O N T H L Y W E A T H E R R E V I E W VOLUME 134
parallel to the dryline as shown by the satellite imagerymovie loops in this case (not shown). Since the drylinewas retreating to the northwest at a rather slow speedof 1.5–2.5 m s�1, the distance between the dryline andcloud line did not change significantly over the lifetimeof the cloud line; therefore, the relative movement ofclouds and dryline is not likely the reason why convec-tion initiation did not occur in this case.
Although the temperature inversion around 700 mbwas weakening in time, the moisture content at allheights also decreased during the 2100–2330 time pe-riod. The drying trend of the whole boundary layer isanother factor unfavorable for CI.
By analyzing a dryline case from VORTEX, Richterand Bosart (2002) proposed that an upper-level ridgethat was over the dryline region created middle-levelsubsidence and warming and a strong cap inversion. Asa result of the strong inversion, deep convection did notstart even though the dryline was initiating clouds. TheNCEP–NCAR reanalysis of 500-mb geopotentialheight and vertical pressure velocity (�) covering theIHOP_2002 domain is shown in Fig. 20. Apparently theOklahoma panhandle where the IHOP_2002 IOR waslocated was under the influence of middle-level subsi-dence. The middle-level warming of �0.4°C on the dryside and �1.2°C on the moist side of the dryline over atime period of �2 h can be estimated from soundingsshown in Fig. 19. The middle-level subsidence couldpossibly explain why the middle-level clouds advectedinto this region from southwest disappeared shortly af-
ter they entered the Oklahoma panhandle. Notice thatstorm A in Fig. 1 was initiated in a region with middle-level upward motion. Although middle-level subsi-dence that promotes middle-level drying and warmingand creates strong cap inversion is unfavorable to CI, itdoes not mean convection will not develop under re-gions of middle-level subsidence. As long as the meso-scale or convective-scale lift is strong enough and thereis sufficient moisture, parcels will reach their LFC.Storm C in Figs. 1d, 13b, and 13c seems to be a goodexample of a storm initiated under a middle-level sub-sidence region. On the other hand, storm C was rela-tively small and short-lived compared to storm A, per-haps as a result of its being developed under the unfa-vorable middle-level conditions.
One major objective of IHOP_2002 was to identifyhow the special dataset collected by field campaigns canbe helpful for operational CI forecasting. It appearsthat high-resolution four-dimensional kinematic and
FIG. 18. NCAR MGLASS soundings launched near the drylineat 2051 and 2137 UTC on 11 Jun 2002. The solid and dashed linesrepresent temperature and dewpoint temperature, respectively.Black (gray) lines indicate the sounding at 2051 (2137) UTC. Thepositions of these two soundings are plotted in Fig. 6b. Theheights of the LCL and LFC for the 2051 UTC sounding areindicated in the figure. Both CAPE and CIN values are in J kg�1.Vertical profile of the horizontal winds is shown with the halfbarb, full barb, and flag representing 2.5, 5.0, and 25.0 m s�1,respectively.
FIG. 19. Learjet dropsondes near the dryline at (a) 2146 (gray)and 2149 UTC (black) and (b) 2334 (gray) and 2337 UTC (black).Solid and dashed lines represent temperature and dewpoint tem-perature, respectively. The positions of these four soundings areindicated in Figs. 6b and 6f. Vertical profile of the horizontalwinds is shown with the half barb, full barb, and flag representing2.5, 5.0, and 25.0 m s�1, respectively.
JANUARY 2006 C A I E T A L . 351

thermodynamic structures of boundaries are essentialfor CI forecasting and it seems that the informationneeded for accurate CI prediction is still not there evenduring IHOP_2002. One big gap that has become moreapparent through this analysis is the wind fields associ-ated with boundaries whose measurements solely relyon clear-air returns detected by radars. The problemwith the clear-air echo is that it tends to disappearabove 2–3 km AGL, which causes lack of wind mea-surements near or above the boundary layer top. As aresult of this limited height coverage of the three-dimensional wind field, it is almost impossible to knowwhether or not the boundary layer updrafts reachedtheir LFC. Another deficiency from the observationalperspective for CI forecasting is the four-dimensionalwater vapor measurements. Although IHOP_2002 wasdedicated to filling the gaps in this aspect, detailed four-dimensional water vapor fields are still not available.
What has been achieved in IHOP_2002 are some hori-zontal and vertical cross sections of the water vaporfield. Therefore, the lack of high-resolution three-dimensional kinematic and thermodynamic informa-tion about updrafts associated with a boundary still pre-sents a great challenge for accurately predicting whichpocket(s) of those updrafts will develop into a storm.
8. Summary and discussions
On 11 June 2002 during IHOP_2002 a dryline formedover the Oklahoma panhandle as a result of high �e airpushing northwestward toward a stationary front in thewarm sector. Convection was expected over the Okla-homa panhandle based on various model runs early inthe morning, and an IHOP_2002 IOR was set up nearNCAR’s S-Pol radar in the Oklahoma panhandle area.The evolution of the dryline’s kinematic and thermo-dynamic structure is documented in this paper by usingELDORA dual-Doppler analysis, S-Pol radar refractiv-ity, LEANDRE II water vapor measurements, Learjetdropsondes, MGLASS soundings, as well as NRL P-3flight-level data. The dryline was retreating toward thenorthwest during the intensive observation period from2100 to 2330 at a speed of 1.5–2.5 m s�1 and was asso-ciated with a moisture differential of 4–5 g kg�1 acrossa distance of �4.4–6.6 km. The virtual potential tem-perature differential across the dryline was relativelyweak (�0.5 K) and pockets of updraft on the order of2–3 m s�1 were found near the dryline. Boundary-layer-based clouds were observed along the dryline inside theIHOP_2002 IOR but no deep convection was initiatedthere. S-Pol radar refractivity shows the greatest mois-ture gradient slightly northwest of or collocated withthe dryline fine line, and a general trend of drying wasevident from radar refractivity as well as surface analy-sis from 2100 to 2330. LEANDRE II water vapor mea-surements reveal strong along-line variability in themoisture field near the dryline and suggest that thereflectivity maxima tend to be closely associated withpockets of rising moist air with only a few exceptions. Aroll boundary, which has more intense radar reflectivityand a north–south orientation inside the IHOP_2002IOR from 2100 to 2230, intercepted the dryline near thenortheast corner of IHOP_2002 IOR. Interestingly, theinterception point that should be a favorable place forCI did not initiate any storm, nor did the dryline itself.Three storms developed in the region on this particularday, and all of them were outside the IHOP_2002 IOR.Storm A, a tornadic one, was initiated near Russell,Kansas (�200 km northeast of IHOP_2002 IOR), at�2100. Another very small storm (storm B) was initi-ated around 2207 along the stationary front �100 km
FIG. 20. NCEP–NCAR reanalysis of the 500-mb height andvertical pressure velocity (�) at (a) 1800 UTC on 11 Jun 2002 and(b) 0000 UTC on 12 Jun 2002. Thick black lines represent geo-potential heights with a contour interval of 30 m; thin black linesrepresent vertical pressure velocity � in 10�3 hPa s�1 with a con-tour interval of 0.5 � 10�3 hPa s�1. Upward motion with � � �0.5� 10�3 hPa s�1 is shaded gray.
352 M O N T H L Y W E A T H E R R E V I E W VOLUME 134

north of the IHOP_2002 IOR. The third storm (stormC) was initiated along the roll boundary around 2210about 80 km south of the IHOP_2002 IOR.
Middle-level clouds near the dryline were observedby ELDORA along with the dryline itself. These cloudsdissipated after they entered the Oklahoma panhandle.The reason for their disappearance is speculated to bethe middle-level subsidence shown in the NCEP–NCAR reanalysis. The dryline was weakening as seenby ELDORA radar reflectivity, and the boundary layerwas drying out according to the S-Pol radar refractivityand soundings. The Learjet dropsonde data show thatthe most favorable instability parameters were actuallyassociated with the roll boundary, not the dryline. Thismay explain why storm C was initiated near the rollboundary at �2210. The reasons why the dryline wasnot able to initiate any storms inside IHOP_2002 IORwere summarized as follows: 1) relatively weak up-drafts perhaps as a result of weak baroclinity across thedryline; 2) a substantial dry layer between the LCL andLFC; and 3) strong cap inversion as a result of middle-level subsidence over the dryline in the Oklahoma pan-handle region.
As an “interesting albeit frustrating” null case de-scribed by IHOP_2002 nowcasters (E. Szoke, IHOP_2002field catalog), this dryline provides a unique dataset forexamining the differences between what the modelspredicted and what actually occurred. The reasons whythe models overpredicted the convection over theOklahoma panhandle for this particular case remains tobe an interesting research topic for numerical modelers,and the detailed observational study of this case pre-sented by this paper should be very helpful to any nu-merical simulation of this case. It is also important tonote that both the dryline and the roll boundary pre-sented in this study would not be resolved by the con-ventional observational network if the special datasetsfrom IHOP_2002 were not available. Therefore, ifboundaries like this have any impact on CI, accuratelyforecasting CI would remain to be a great challenge foroperational models.
Acknowledgments. The first author is grateful toNCAR’s Advanced Study Program and AtmosphericTechnology Division for providing necessary supportfor this research. The comments from two anonymousreviewers greatly improved this manuscript. Thanks arealso extended to Drs. Roger Wakimoto and Jim Wilsonfor their constant encouragements. Dr. Junhong Wangat NCAR provided the dropsonde data. Drs. RogerWakimoto and Stanley Trier are specially thanked fortheir insightful reviews of an earlier version of thismanuscript.
REFERENCES
Anthes, R. A., Y. H. Kuo, S. G. Benjamin, and Y. F. Li, 1982: Theevolution of the mesoscale environment of severe localstorms: Preliminary modeling results. Mon. Wea. Rev., 110,1185–1213.
Atkins, N. T., R. M. Wakimoto, and C. L. Ziegler, 1998: Obser-vations of the finescale structure of a dryline duringVORTEX 95. Mon. Wea. Rev., 126, 525–550.
Barnes, S. L., 1973: Mesoscale objective map analysis usingweighted time-series observations. NOAA Tech. Memo.ERL NSSL-62, 60 pp.
Bluestein, H. B., 1993: CLASS for class. Bull. Amer. Meteor. Soc.,74, 1697–1702.
——, and C. R. Parks, 1983: A synoptic and photographic clima-tology of low-precipitation severe thunderstorms in thesouthern plains. Mon. Wea. Rev., 111, 2034–2046.
——, and S. S. Parker, 1993: Modes of isolated, severe convectivestorm formation along the dryline. Mon. Wea. Rev., 121,1352–1374.
Bruneau, D., P. Quaglia, C. Flamant, M. Meissonnier, and J.Pelon, 2001: Airborne lidar LEANDRE II for water-vaporprofiling in the troposphere. Appl. Opt., 40, 3450–3475.
Carbone, R. E., M. J. Carpenter, and C. D. Burghart, 1985: Dopp-ler radar sampling limitations in convective storms. J. Atmos.Oceanic Technol., 2, 357–361.
Crawford, T. M., and H. B. Bluestein, 1997: Characteristics ofdryline passage during COPS-91. Mon. Wea. Rev., 125, 463–477.
Cressman, G. P., 1959: An operational objective analysis scheme.Mon. Wea. Rev., 87, 367–384.
Dowell, D. C., and H. B. Bluestein, 2002a: The 8 June 1995McLean, Texas, storm. Part I: Observations of cyclic torna-dogenesis. Mon. Wea. Rev., 130, 2626–2648.
——, and ——, 2002b: The 8 June 1995 McLean, Texas, storm.Part II: Cyclic tornado formation, maintenance, and dissipa-tion. Mon. Wea. Rev., 130, 2649–2670.
Fabry, F., 2006: The spatial variability of moisture in the boundarylayer and its effect of convection initiation: Project-long char-acterization. Mon. Wea. Rev., 134, 79–91.
——, C. Frush, I. Zawadzki, and A. Kilambi, 1997: On the extrac-tion of the near-surface index of refraction using radar phasemeasurements from ground targets. J. Atmos. Oceanic Tech-nol., 14, 978–987.
Grasso, L. D., 2000: A numerical simulation of dryline sensitivityto soil moisture. Mon. Wea. Rev., 128, 2816–2834.
Hane, C. E., C. L. Ziegler, and H. B. Bluestein, 1993: Investiga-tion of the dryline and convective storms initiated along thedryline: Field experiments during COPS-91. Bull. Amer. Me-teor. Soc., 74, 2133–2145.
——, B. B. Bluestein, T. M. Crawford, M. E. Baldwin, and R. M.Rabin, 1997: Severe thunderstorm development in relation toalong-dryline variability: A case study. Mon. Wea. Rev., 125,231–251.
——, M. E. Baldwin, H. B. Bluestein, T. M. Crawford, and R. M.Rabin, 2001: A case study of severe storm development alonga dryline within a synoptically active environment. Part I:Dryline motion and an Eta model forecast. Mon. Wea. Rev.,129, 2183–2204.
——, R. M. Rabin, T. M. Crawford, H. B. Bluestein, and M. E.Baldwin, 2002: A case study of severe storm developmentalong a dryline within a synoptically active environment. PartII: Multiple boundaries and convective initiation. Mon. Wea.Rev., 130, 900–920.
JANUARY 2006 C A I E T A L . 353

Hildebrand, P. H., C. A. Walther, C. L. Frush, J. Testud, and F.Baudin, 1994: The ELDORA/ASTRAIA airborne Dopplerweather radar: Goals, design, and first field tests. Proc. IEEE,82, 1873–1890.
——, and Coauthors, 1996: The ELDORA/ASTRAIA airborneDoppler weather radar: High resolution observations fromTOGA COARE. Bull. Amer. Meteor. Soc., 77, 213–232.
Hock, T. F., and J. L. Franklin, 1999: The NCAR GPS dropwind-sonde. Bull. Amer. Meteor. Soc., 80, 407–420.
Kalnay, E., and Coauthors, 1996: The NCEP/NCAR 40-Year Re-analysis Project. Bull. Amer. Meteor. Soc., 77, 437–471.
Kistler, R., and Coauthors, 2001: The NCEP–NCAR 50-year re-analysis: Monthly means CD-ROM and documentation. Bull.Amer. Meteor. Soc., 82, 247–268.
Koch, S. E., and J. McCarthy, 1982: The evolution of an Oklaho-ma dryline: Part II: Boundary-layer forcing of mesoconvec-tive systems. J. Atmos. Sci., 39, 237–257.
Lee, W.-C., P. Dodge, F. D. Marks, and P. H. Hildebrand, 1994:Mapping of airborne Doppler radar data. J. Atmos. OceanicTechnol., 11, 572–578.
Leise, J. A., 1982: A multidimensional scale-telescoped filter anddata extension package. NOAA Tech. Memo. ERL-82, 11pp. [Available from NOAA ERL, 325 Broadway, Boulder,CO 80303.]
Lutz, J., P. Johnson, B. Lewis, E. Loew, M. Randall, and J.VanAndel, 1995: NCAR’s S-Pol: Portable polarimetric S-band radar. Preprints, Ninth Symp. on Meteorological Obser-vations and Instrumentation, Charlotte, NC, Amer. Meteor.Soc., 408–410.
Miller, J. A., T. A. Kovacs, and P. R. Bannon, 2001: A shallowwater model of the diurnal dryline. J. Atmos. Sci., 58, 3508–3524.
Mohr, C. G., L. J. Miller, R. L. Vaughn, and H. W. Frank, 1986:The merger of mesoscale datasets into a common Cartesianformat for efficient and systematic analysis. J. Atmos. Oce-anic Technol., 3, 146–161.
Murphey, H. V., R. M. Wakimoto, C. Flamant, and D. E.Kingsmill, 2006: Dryline on 19 June 2002 during IHOP. PartI: Airborne Doppler and LEANDRE II analysis of the thinline structure and convection initiation. Mon. Wea. Rev., 134,406–430.
NSSP Staff, 1963: Environmental and thunderstorm structures asshown by National Severe Storms Project observations inspring 1960 and 1961. Mon. Wea. Rev., 91, 271–292.
Oye, R., C. Mueller, and S. Smith, 1995: Software for radar trans-lation, visualization, editing, and interpolation. Preprints,27th Conf. on Radar Meteorology, Vail, CO, Amer. Meteor.Soc., 359–361.
Parsons, D. B., M. A. Shapiro, R. M. Hardesty, R. J. Zamora, andJ. M. Intrieri, 1991: The finescale structure of a west Texasdryline. Mon. Wea. Rev., 119, 1242–1258.
——, ——, and E. Miller, 2000: The mesoscale structure of anocturnal dryline and of a frontal-dryline merger. Mon. Wea.Rev., 128, 3824–3838.
Peckham, S. E., and L. J. Wicker, 2000: The influence of topog-raphy and lower tropospheric winds on dryline morphology.Mon. Wea. Rev., 128, 2165–2189.
Rhea, J. O., 1966: A study of thunderstorm formation alongdrylines. J. Appl. Meteor., 5, 58–63.
Richter, H., and L. F. Bosart, 2002: The suppression of deep moistconvection near the southern Great Plains dryline. Mon.Wea. Rev., 130, 1665–1691.
Schaefer, J. T., 1974: The lifecycle of the dryline. J. Appl. Meteor.,13, 444–449.
——, 1986: The dryline. Mesoscale Meteorology and Forecasting,P. S. Ray, Ed., Amer. Meteor. Soc., 549–572.
Shaw, B. L., R. A. Pielke, and C. L. Ziegler, 1997: A three-dimensional numerical simulation of a Great Plains dryline.Mon. Wea. Rev., 125, 1489–1506.
Testud, J., P. H. Hildebrand, and W.-C. Lee, 1995: A procedure tocorrect airborne Doppler radar data for navigation errorsusing the echo returned from the earth’s surface. J. Atmos.Oceanic Technol., 12, 800–820.
Trier, S. B., F. Chen, and K. W. Manning, 2004: A study of con-vection initiation in a mesoscale model using high-resolutionland surface initial conditions. Mon. Wea. Rev., 132, 2954–2976.
Sun, W.-Y., and C.-C. Wu, 1992: Formation and diurnal variationof the dryline. J. Atmos. Sci., 49, 1606–1619.
Wakimoto, R. M., and H. Cai, 2000: Analysis of a nontornadicstorm during VORTEX 95. Mon. Wea. Rev., 128, 565–592.
——, and ——, 2002: Airborne observations of a front near a colduring FASTEX. Mon. Wea. Rev., 130, 1898–1912.
——, C. Liu, and H. Cai, 1998: The Garden City, Kansas, stormduring VORTEX 95: Part I: Overview of the storm’s lifecycle and mesocyclogenesis. Mon. Wea. Rev., 126, 372–392.
——, W.-C. Lee, H. B. Bluestein, C.-H. Liu, and P. H. Hilde-brand, 1996: ELDORA observations during VORTEX 95.Bull. Amer. Meteor. Soc., 77, 1465–1481.
Weckwerth, T. M., and Coauthors, 2004: An overview of the In-ternational H2O Project (IHOP_2002) and some preliminaryhighlights. Bull. Amer. Meteor. Soc., 85, 253–277.
——, R. P. Crystalyne, F. Fabry, S. Park, and J. W. Wilson, 2005:Radar refractivity retrieval: Validation and application toshort-term forecasting. J. Appl. Meteor., 44, 285–300.
Weiss, C. C., and H. B. Bluestein, 2002: Airborne pseudo-dualDoppler analysis of a dryline-outflow boundary intersection.Mon. Wea. Rev., 130, 1207–1226.
Wilson, J. W., and D. L. Megenhardt, 1997: Thunderstorm initia-tion, organization, and lifetime associated with Floridaboundary layer convergence lines. Mon. Wea. Rev., 125,1507–1525.
——, T. M. Weckwerth, J. Vivekanandan, R. M. Wakimoto, andR. W. Russell, 1994: Boundary layer clear-air radar echoes:Origin of echoes and accuracy of derived winds. J. Atmos.Oceanic Technol., 11, 1184–1206.
Ziegler, C. L., and C. E. Hane, 1993: An observational study ofthe dryline. Mon. Wea. Rev., 121, 1134–1151.
——, and E. N. Rasmussen, 1998: The initiation of moist convec-tion at the dryline: Forecasting issues from a case study per-spective. Wea. Forecasting, 13, 1106–1131.
——, W. J. Martin, R. A. Pielke, and R. L. Walko, 1995: A mod-eling study of the dryline. J. Atmos. Sci., 52, 273–285.
354 M O N T H L Y W E A T H E R R E V I E W VOLUME 134