DABACO GROUP (DBC) - INITIATION - VNDirect
15
VNDIRECT RESEARCH www.vndirect.com.vn 1 DABACO GROUP (DBC) - INITIATION Market Price Target Price Dividend Yield Rating Sector VND24,200 VND30,700 2.1% ADD CONSUMER GOODS Outlook – Short term Outlook – Long term Valuation Negative Neutral Positive Negative Neutral Positive Negative Neutral Positive Robust earnings growth in FY20F on pork price spike It’s the golden time for clean meat producers in Vietnam. Untraceable meat supply from individual small-scaled farms is expected to be reduced in 2019-23F due to the outbreak of the African Swine Fever (ASF) disease and the Law of Animal Husbandry effective since 1 st Jan 2020. We believe clean meat producers who adopted Feed-Farm-Food (3F) model will benefit from this opportunity and expand the market firmly over the next four years. Pork production capacity expansion will prompt DBC’s revenue to grow 23.7% yoy in FY20F. China’s pork supply is forecast to drop by 25% in 2020 due to ASF outbreak (USDA, Oct 19). Consequently, prices of pork, broilers, and chicken eggs in Vietnam are expected to rise 37%, 15% and 10% yoy, respectively, next year. Dabaco Group’s (DBC) FY20F revenue will be likely to grow 23.7% yoy on surging demand of all products lines and utilisation rate of pork capacity to ~93% (+10% pts). Additionally, vegetable oil, DBC’s new business, will further support revenue by adding about VND650m in FY20F. Robust earnings growth ahead, on the back of margin expansion. Despite the imminent pork price spike, we observe that animal feed price will likely stay flat next year due to sluggish demand. Note that farmers need time to repopulate their pig’s herd after the damage of ASF. We expect DBC‘s FY20F gross margin to expand 5.4% pts to 18.3%, which leads to a sharp rise of 198.4% yoy in FY20F earnings. Initiate coverage with ADD and TP of VND30,700. Our TP is based on 10-year DCF (WACC of 7.4%; LTG of 1.0%). FY20F forward P/E is 4.8x. We believe this is a good opportunity to form a sound business model with convincing robust earnings growth ahead at appealing valuation. Re-rating catalyst includes higher-than-expected pork price increase in Vietnam in 2020. Risk includes serious animal disease outbreak and pork price falling faster than forecast. 06 Decemeber 2019 Duc Nguyen Tien [email protected] Price performance Source: VND RESEARCH Key statistics 52w high (VND) 25,450 52w low (VND) 20,000 3m Avg daily volume (shares) 99,382 3m Avg daily value (VNDm) 2,370 Market cap (VNDbn) 2,196 Outstanding shares (m) 91.1 Free float (%) 62.0 TTM P/E (x) 7.8 Current P/B (x) 0.8 Ownership Nguyen Nhu So (Chairman) 18.3% SSI Securities Company 11.0% Fraser Investment Holding 8.7% Others 62.0% Source: VND RESEARCH Source: VND RESEARCH Financial summary (VND) 12-18A 12-19E 12-20E 12-21E Net revenue (bn) 6,674 7,039 8,706 9,655 Revenue growth 14.0% 5.5% 23.7% 10.9% Gross margin 16.2% 12.9% 18.3% 17.3% EBITDA margin 12.6% 8.9% 13.4% 12.6% Net profit (bn) 360 207 616 614 Net profit growth 80.0% (42.7%) 198.4% (0.3%) FD EPS 3,700 2,131 6,359 6,339 BVPS 22,878 25,555 26,403 38,047 ROAE 13.7% 7.4% 18.4% 14.5% 76.0 80.3 84.6 88.9 93.1 97.4 101.7 106.0 19,000 20,000 21,000 22,000 23,000 24,000 25,000 26,000 Price Close Relative To HNX (RHS) 200 400 600 11-18 01-19 03-19 05-19 07-19 09-19 Vol th
-
Upload
khangminh22 -
Category
Documents
-
view
2 -
download
0
Transcript of DABACO GROUP (DBC) - INITIATION - VNDirect

VNDIRECT RESEARCH
www.vndirect.com.vn 1
DABACO GROUP (DBC) - INITIATION
Market Price Target Price Dividend Yield Rating Sector
VND24,200 VND30,700 2.1% ADD CONSUMER GOODS
Outlook – Short term Outlook – Long term Valuation
Negative Neutral Positive Negative Neutral Positive Negative Neutral Positive
Robust earnings growth in FY20F on pork price spike
It’s the golden time for clean meat producers in Vietnam. Untraceable meat supply from individual small-scaled farms is expected to be reduced in 2019-23F due to the outbreak of the African Swine Fever (ASF) disease and the Law of Animal Husbandry effective since 1st Jan 2020. We believe clean meat producers who adopted Feed-Farm-Food (3F) model will benefit from this opportunity and expand the market firmly over the next four years.
Pork production capacity expansion will prompt DBC’s revenue to grow 23.7% yoy in FY20F. China’s pork supply is forecast to drop by 25% in 2020 due to ASF outbreak (USDA, Oct 19). Consequently, prices of pork, broilers, and chicken eggs in Vietnam are expected to rise 37%, 15% and 10% yoy, respectively, next year. Dabaco Group’s (DBC) FY20F revenue will be likely to grow 23.7% yoy on surging demand of all products lines and utilisation rate of pork capacity to ~93% (+10% pts). Additionally, vegetable oil, DBC’s new business, will further support revenue by adding about VND650m in FY20F.
Robust earnings growth ahead, on the back of margin expansion. Despite the imminent pork price spike, we observe that animal feed price will likely stay flat next year due to sluggish demand. Note that farmers need time to repopulate their pig’s herd after the damage of ASF. We expect DBC‘s FY20F gross margin to expand 5.4% pts to 18.3%, which leads to a sharp rise of 198.4% yoy in FY20F earnings.
Initiate coverage with ADD and TP of VND30,700. Our TP is based on 10-year DCF (WACC of 7.4%; LTG of 1.0%). FY20F forward P/E is 4.8x. We believe this is a good opportunity to form a sound business model with convincing robust earnings growth ahead at appealing valuation. Re-rating catalyst includes higher-than-expected pork price increase in Vietnam in 2020. Risk includes serious animal disease outbreak and pork price falling faster than forecast.
06 Decemeber 2019
Duc Nguyen Tien
Price performance
Source: VND RESEARCH
Key statistics
52w high (VND) 25,450
52w low (VND) 20,000
3m Avg daily volume (shares) 99,382
3m Avg daily value (VNDm) 2,370
Market cap (VNDbn) 2,196
Outstanding shares (m) 91.1
Free float (%) 62.0
TTM P/E (x) 7.8
Current P/B (x) 0.8
Ownership
Nguyen Nhu So (Chairman) 18.3%
SSI Securities Company 11.0%
Fraser Investment Holding 8.7%
Others 62.0%
Source: VND RESEARCH
Source: VND RESEARCH
Financial summary (VND) 12-18A 12-19E 12-20E 12-21E
Net revenue (bn) 6,674 7,039 8,706 9,655
Revenue growth 14.0% 5.5% 23.7% 10.9%
Gross margin 16.2% 12.9% 18.3% 17.3%
EBITDA margin 12.6% 8.9% 13.4% 12.6%
Net profit (bn) 360 207 616 614
Net profit growth 80.0% (42.7%) 198.4% (0.3%)
FD EPS 3,700 2,131 6,359 6,339
BVPS 22,878 25,555 26,403 38,047
ROAE 13.7% 7.4% 18.4% 14.5%
76.0
80.3
84.6
88.9
93.1
97.4
101.7
106.0
19,000
20,000
21,000
22,000
23,000
24,000
25,000
26,000
Price Close Relative To HNX (RHS)
200
400
600
11-18 01-19 03-19 05-19 07-19 09-19
Vo
l th
VNDIRECT RESEARCH
www.vndirect.com.vn 2
A PIONEER IN DEVELOPING FEED – FARM – FOOD (3F) MODEL
IN VIETNAM
3F business now contributes about 75% to DBC’s revenue
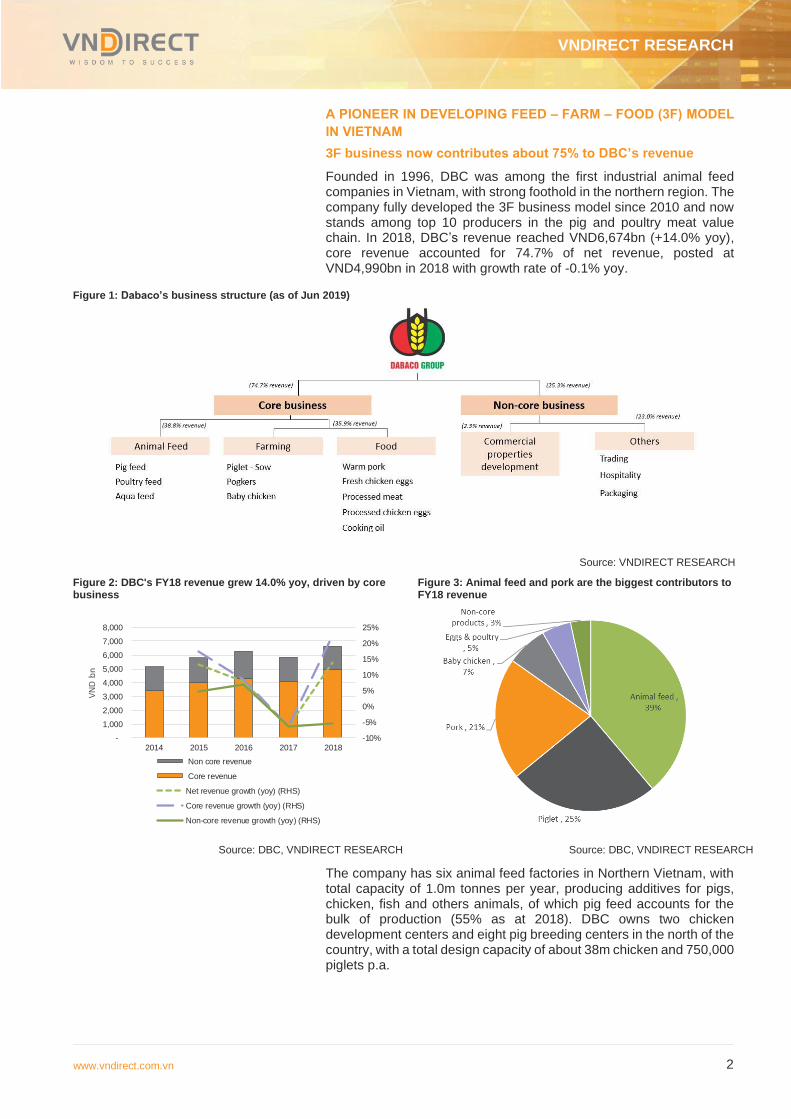
Founded in 1996, DBC was among the first industrial animal feed companies in Vietnam, with strong foothold in the northern region. The company fully developed the 3F business model since 2010 and now stands among top 10 producers in the pig and poultry meat value chain. In 2018, DBC’s revenue reached VND6,674bn (+14.0% yoy), core revenue accounted for 74.7% of net revenue, posted at VND4,990bn in 2018 with growth rate of -0.1% yoy.
Figure 1: Dabaco’s business structure (as of Jun 2019)
Source: VNDIRECT RESEARCH
Figure 2: DBC's FY18 revenue grew 14.0% yoy, driven by core business
Figure 3: Animal feed and pork are the biggest contributors to FY18 revenue
Source: DBC, VNDIRECT RESEARCH Source: DBC, VNDIRECT RESEARCH
The company has six animal feed factories in Northern Vietnam, with total capacity of 1.0m tonnes per year, producing additives for pigs, chicken, fish and others animals, of which pig feed accounts for the bulk of production (55% as at 2018). DBC owns two chicken development centers and eight pig breeding centers in the north of the country, with a total design capacity of about 38m chicken and 750,000 piglets p.a.
Title:
Source:
Please fill in the values above to have them entered in your report
-10%
-5%
0%
5%
10%
15%
20%
25%
-
1,000
2,000
3,000
4,000
5,000
6,000
7,000
8,000
2014 2015 2016 2017 2018
VN
D b
n
Non core revenue
Core revenue
Net revenue growth (yoy) (RHS)
Core revenue growth (yoy) (RHS)
Non-core revenue growth (yoy) (RHS)
VNDIRECT RESEARCH
www.vndirect.com.vn 3
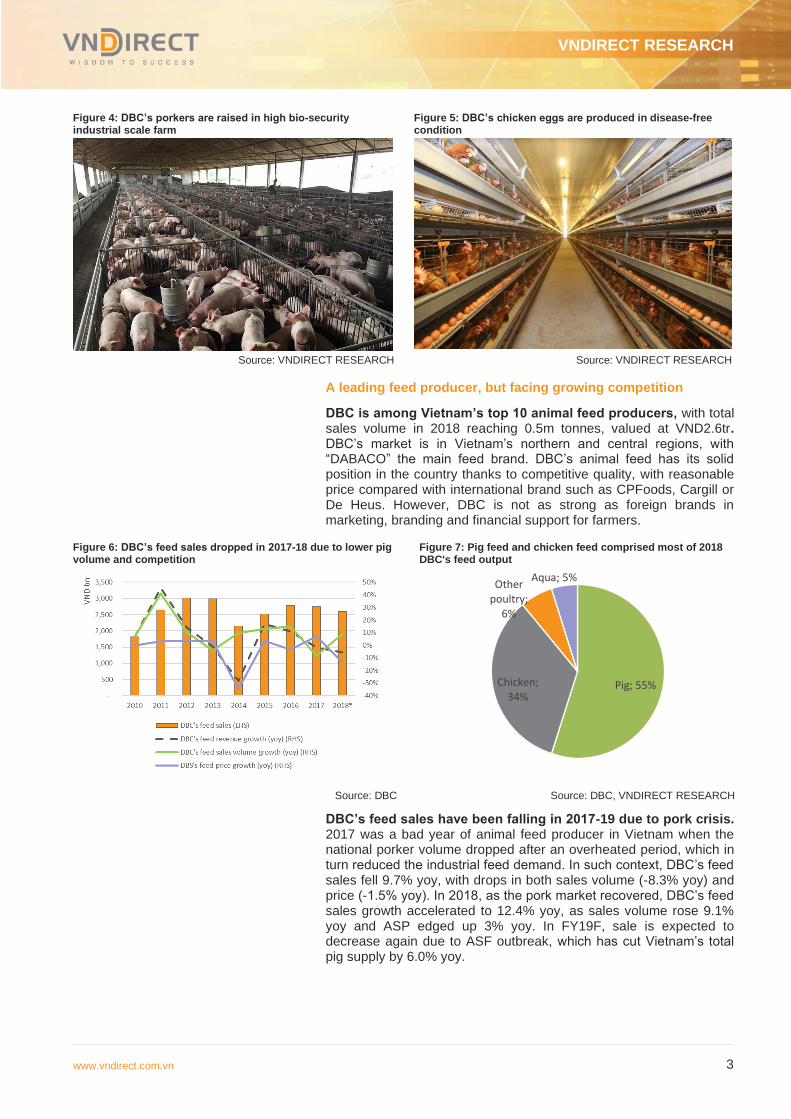
Figure 4: DBC’s porkers are raised in high bio-security industrial scale farm
Figure 5: DBC’s chicken eggs are produced in disease-free condition
Source: VNDIRECT RESEARCH Source: VNDIRECT RESEARCH
A leading feed producer, but facing growing competition
DBC is among Vietnam’s top 10 animal feed producers, with total sales volume in 2018 reaching 0.5m tonnes, valued at VND2.6tr. DBC’s market is in Vietnam’s northern and central regions, with “DABACO” the main feed brand. DBC’s animal feed has its solid position in the country thanks to competitive quality, with reasonable price compared with international brand such as CPFoods, Cargill or De Heus. However, DBC is not as strong as foreign brands in marketing, branding and financial support for farmers.
Figure 6: DBC’s feed sales dropped in 2017-18 due to lower pig volume and competition
Figure 7: Pig feed and chicken feed comprised most of 2018 DBC's feed output
Source: DBC Source: DBC, VNDIRECT RESEARCH
DBC’s feed sales have been falling in 2017-19 due to pork crisis. 2017 was a bad year of animal feed producer in Vietnam when the national porker volume dropped after an overheated period, which in turn reduced the industrial feed demand. In such context, DBC’s feed sales fell 9.7% yoy, with drops in both sales volume (-8.3% yoy) and price (-1.5% yoy). In 2018, as the pork market recovered, DBC’s feed sales growth accelerated to 12.4% yoy, as sales volume rose 9.1% yoy and ASP edged up 3% yoy. In FY19F, sale is expected to decrease again due to ASF outbreak, which has cut Vietnam’s total pig supply by 6.0% yoy.
Pig; 55%Chicken; 34%
Other poultry;
6%
Aqua; 5%
VNDIRECT RESEARCH
www.vndirect.com.vn 4
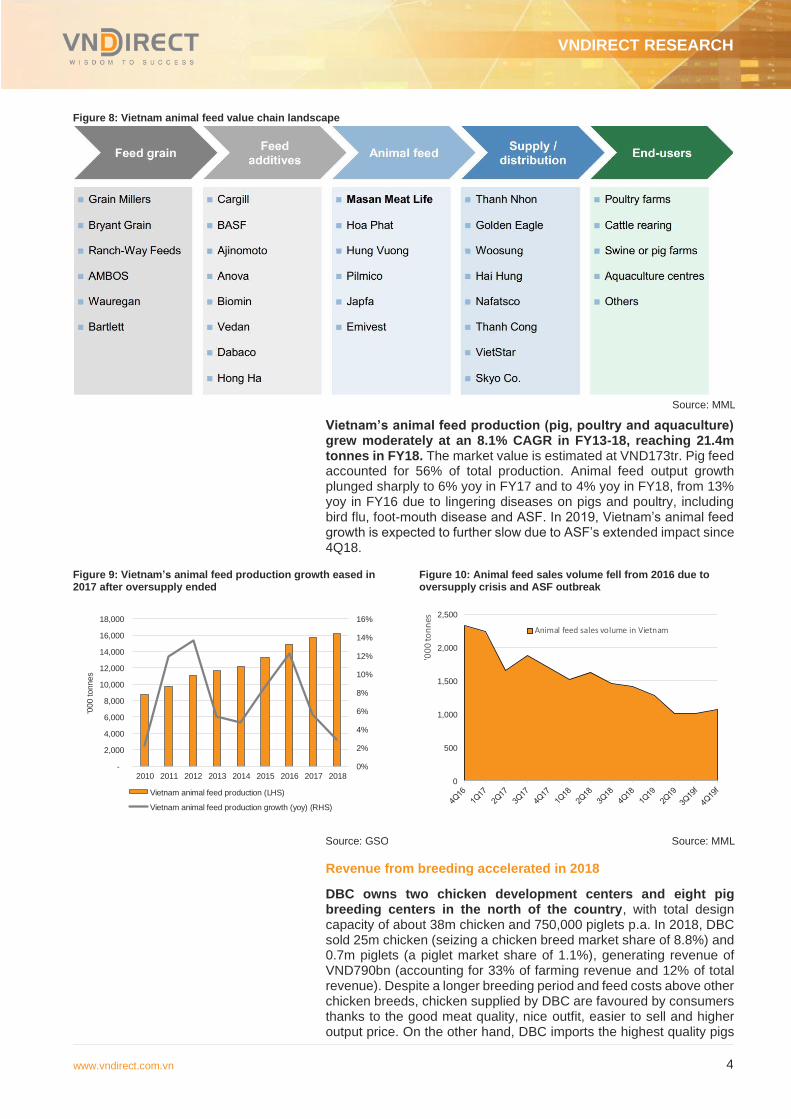
Figure 8: Vietnam animal feed value chain landscape
Source: MML
Vietnam’s animal feed production (pig, poultry and aquaculture) grew moderately at an 8.1% CAGR in FY13-18, reaching 21.4m tonnes in FY18. The market value is estimated at VND173tr. Pig feed accounted for 56% of total production. Animal feed output growth plunged sharply to 6% yoy in FY17 and to 4% yoy in FY18, from 13% yoy in FY16 due to lingering diseases on pigs and poultry, including bird flu, foot-mouth disease and ASF. In 2019, Vietnam’s animal feed growth is expected to further slow due to ASF’s extended impact since 4Q18.
Figure 9: Vietnam’s animal feed production growth eased in 2017 after oversupply ended
Figure 10: Animal feed sales volume fell from 2016 due to oversupply crisis and ASF outbreak
Source: GSO Source: MML
Revenue from breeding accelerated in 2018
DBC owns two chicken development centers and eight pig breeding centers in the north of the country, with total design capacity of about 38m chicken and 750,000 piglets p.a. In 2018, DBC sold 25m chicken (seizing a chicken breed market share of 8.8%) and 0.7m piglets (a piglet market share of 1.1%), generating revenue of VND790bn (accounting for 33% of farming revenue and 12% of total revenue). Despite a longer breeding period and feed costs above other chicken breeds, chicken supplied by DBC are favoured by consumers thanks to the good meat quality, nice outfit, easier to sell and higher output price. On the other hand, DBC imports the highest quality pigs
Title:
Source:
Please fill in the values above to have them entered in your report
0%
2%
4%
6%
8%
10%
12%
14%
16%
-
2,000
4,000
6,000
8,000
10,000
12,000
14,000
16,000
18,000
2010 2011 2012 2013 2014 2015 2016 2017 2018
'000 tonnes
Vietnam animal feed production (LHS)
Vietnam animal feed production growth (yoy) (RHS)
Title:
Source:
Please fill in the values above to have them entered in your report
0
500
1,000
1,500
2,000
2,500
'00
0 to
nn
es
Animal feed sales volume in Vietnam
VNDIRECT RESEARCH
www.vndirect.com.vn 5
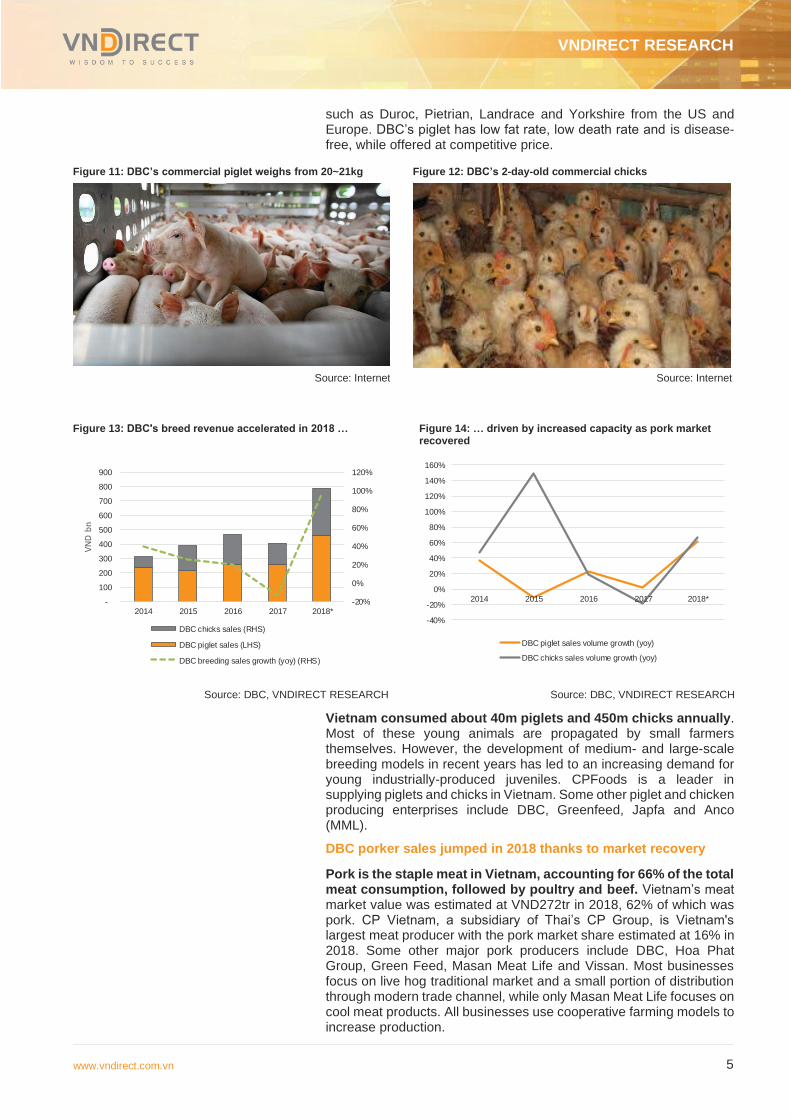
such as Duroc, Pietrian, Landrace and Yorkshire from the US and Europe. DBC’s piglet has low fat rate, low death rate and is disease-free, while offered at competitive price.
Figure 11: DBC’s commercial piglet weighs from 20~21kg Figure 12: DBC’s 2-day-old commercial chicks
Source: Internet Source: Internet
Figure 13: DBC's breed revenue accelerated in 2018 … Figure 14: … driven by increased capacity as pork market recovered
Source: DBC, VNDIRECT RESEARCH Source: DBC, VNDIRECT RESEARCH
Vietnam consumed about 40m piglets and 450m chicks annually. Most of these young animals are propagated by small farmers themselves. However, the development of medium- and large-scale breeding models in recent years has led to an increasing demand for young industrially-produced juveniles. CPFoods is a leader in supplying piglets and chicks in Vietnam. Some other piglet and chicken producing enterprises include DBC, Greenfeed, Japfa and Anco (MML).
DBC porker sales jumped in 2018 thanks to market recovery
Pork is the staple meat in Vietnam, accounting for 66% of the total meat consumption, followed by poultry and beef. Vietnam’s meat market value was estimated at VND272tr in 2018, 62% of which was pork. CP Vietnam, a subsidiary of Thai’s CP Group, is Vietnam's largest meat producer with the pork market share estimated at 16% in 2018. Some other major pork producers include DBC, Hoa Phat Group, Green Feed, Masan Meat Life and Vissan. Most businesses focus on live hog traditional market and a small portion of distribution through modern trade channel, while only Masan Meat Life focuses on cool meat products. All businesses use cooperative farming models to increase production.
Title:
Source:
Please fill in the values above to have them entered in your report
-20%
0%
20%
40%
60%
80%
100%
120%
-
100
200
300
400
500
600
700
800
900
2014 2015 2016 2017 2018*
VN
D b
n
DBC chicks sales (RHS)
DBC piglet sales (LHS)
DBC breeding sales growth (yoy) (RHS)
Title:
Source:
Please fill in the values above to have them entered in your report
-40%
-20%
0%
20%
40%
60%
80%
100%
120%
140%
160%
2014 2015 2016 2017 2018*
DBC piglet sales volume growth (yoy)
DBC chicks sales volume growth (yoy)

VNDIRECT RESEARCH
www.vndirect.com.vn 6
Figure 15: Pork production in 2019 is expected to dip 6% yoy due to ASF outbreak
Figure 16: Pork accounted for 66% volume, and 62% value of Vietnam’s meat consumption in 2018
Source: DBC, VNDIRECT RESEARCH Source: Masan Meatlife
Figure 17: DBC’s presence across the meat value chain, but focuses on farm (live hogs, piglet, baby chicken, eggs)
Source: VNDIRECT RESEARCH
DBC produces clean pork by outsourcing. It supplies piglets, feed, veterinary medicine and buys porkers at a specified price. Contracted farms must meet DBC’s requirements of bio-securities standard and ensure compliance with DBC technical instructions. This business model helps DBC quickly expand production while reducing farm development costs. In 2018, DBC's contracted farm system achieved 32,500 tonnes of live pork (83% of capacity) with sales of VND1,381bn (+89% yoy).
Title:
Source:
Please fill in the values above to have them entered in your report
-8.0%
-6.0%
-4.0%
-2.0%
0.0%
2.0%
4.0%
6.0%
3,100
3,200
3,300
3,400
3,500
3,600
3,700
3,800
3,900
2014 2015 2016 2017 2018 2019E
'00
0 to
nn
es
Vietnam annual pork production (LHS)
Vietnam pork production growth (yoy) (RHS)
Title:
Source:
Please fill in the values above to have them entered in your report
66%
23%
8%3%
Pork Poultry Beef Others
VNDIRECT RESEARCH
www.vndirect.com.vn 7
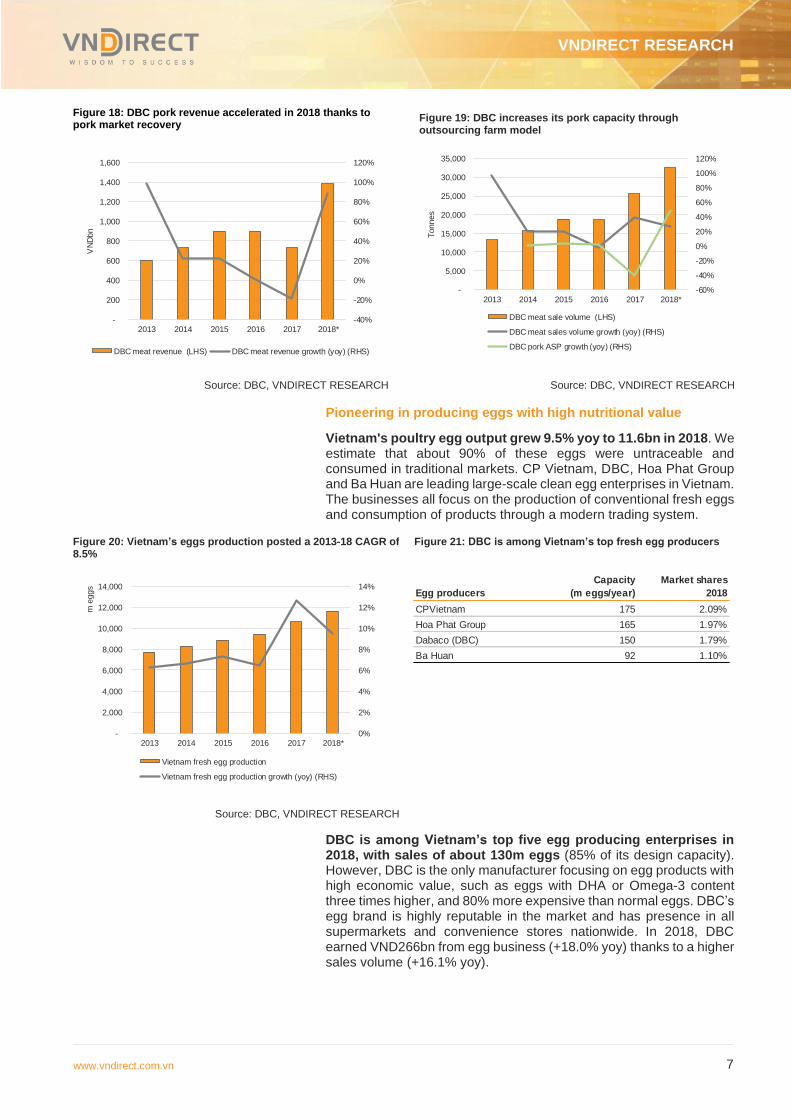
Figure 18: DBC pork revenue accelerated in 2018 thanks to pork market recovery Figure 19: DBC increases its pork capacity through
outsourcing farm model
Source: DBC, VNDIRECT RESEARCH Source: DBC, VNDIRECT RESEARCH
Pioneering in producing eggs with high nutritional value
Vietnam's poultry egg output grew 9.5% yoy to 11.6bn in 2018. We estimate that about 90% of these eggs were untraceable and consumed in traditional markets. CP Vietnam, DBC, Hoa Phat Group and Ba Huan are leading large-scale clean egg enterprises in Vietnam. The businesses all focus on the production of conventional fresh eggs and consumption of products through a modern trading system.
Figure 20: Vietnam’s eggs production posted a 2013-18 CAGR of 8.5%
Figure 21: DBC is among Vietnam’s top fresh egg producers
Source: DBC, VNDIRECT RESEARCH
DBC is among Vietnam’s top five egg producing enterprises in 2018, with sales of about 130m eggs (85% of its design capacity). However, DBC is the only manufacturer focusing on egg products with high economic value, such as eggs with DHA or Omega-3 content three times higher, and 80% more expensive than normal eggs. DBC’s egg brand is highly reputable in the market and has presence in all supermarkets and convenience stores nationwide. In 2018, DBC earned VND266bn from egg business (+18.0% yoy) thanks to a higher sales volume (+16.1% yoy).
Title:
Source:
Please fill in the values above to have them entered in your report
-40%
-20%
0%
20%
40%
60%
80%
100%
120%
-
200
400
600
800
1,000
1,200
1,400
1,600
2013 2014 2015 2016 2017 2018*
VN
Dbn
DBC meat revenue (LHS) DBC meat revenue growth (yoy) (RHS)
Title:
Source:
Please fill in the values above to have them entered in your report
-60%
-40%
-20%
0%
20%
40%
60%
80%
100%
120%
-
5,000
10,000
15,000
20,000
25,000
30,000
35,000
2013 2014 2015 2016 2017 2018*
Tonnes
DBC meat sale volume (LHS)
DBC meat sales volume growth (yoy) (RHS)
DBC pork ASP growth (yoy) (RHS)
Title:
Source:
Please fill in the values above to have them entered in your report
0%
2%
4%
6%
8%
10%
12%
14%
-
2,000
4,000
6,000
8,000
10,000
12,000
14,000
2013 2014 2015 2016 2017 2018*
m e
ggs
Vietnam fresh egg production
Vietnam fresh egg production growth (yoy) (RHS)
Egg producers
Capacity
(m eggs/year)
Market shares
2018
CPVietnam 175 2.09%
Hoa Phat Group 165 1.97%
Dabaco (DBC) 150 1.79%
Ba Huan 92 1.10%
VNDIRECT RESEARCH
www.vndirect.com.vn 8
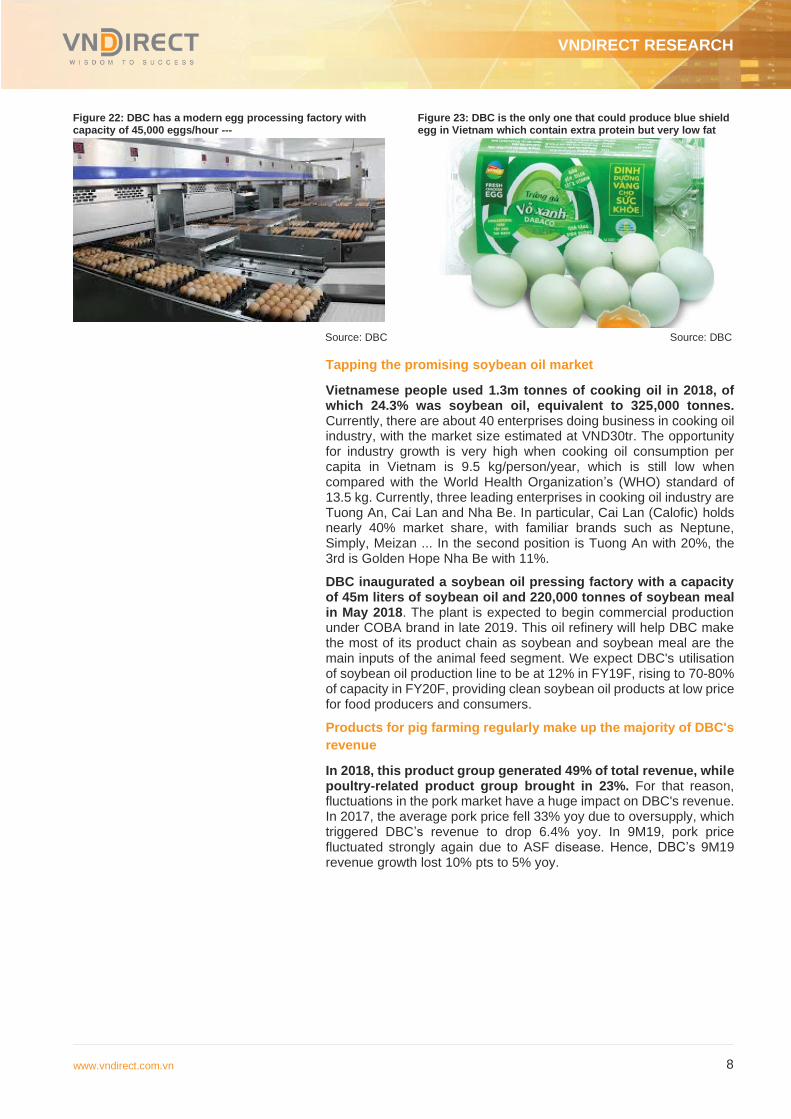
Figure 22: DBC has a modern egg processing factory with capacity of 45,000 eggs/hour ---
Figure 23: DBC is the only one that could produce blue shield egg in Vietnam which contain extra protein but very low fat
Source: DBC Source: DBC
Tapping the promising soybean oil market
Vietnamese people used 1.3m tonnes of cooking oil in 2018, of which 24.3% was soybean oil, equivalent to 325,000 tonnes. Currently, there are about 40 enterprises doing business in cooking oil industry, with the market size estimated at VND30tr. The opportunity for industry growth is very high when cooking oil consumption per capita in Vietnam is 9.5 kg/person/year, which is still low when compared with the World Health Organization’s (WHO) standard of 13.5 kg. Currently, three leading enterprises in cooking oil industry are Tuong An, Cai Lan and Nha Be. In particular, Cai Lan (Calofic) holds nearly 40% market share, with familiar brands such as Neptune, Simply, Meizan ... In the second position is Tuong An with 20%, the 3rd is Golden Hope Nha Be with 11%.
DBC inaugurated a soybean oil pressing factory with a capacity of 45m liters of soybean oil and 220,000 tonnes of soybean meal in May 2018. The plant is expected to begin commercial production under COBA brand in late 2019. This oil refinery will help DBC make the most of its product chain as soybean and soybean meal are the main inputs of the animal feed segment. We expect DBC's utilisation of soybean oil production line to be at 12% in FY19F, rising to 70-80% of capacity in FY20F, providing clean soybean oil products at low price for food producers and consumers.
Products for pig farming regularly make up the majority of DBC's
revenue
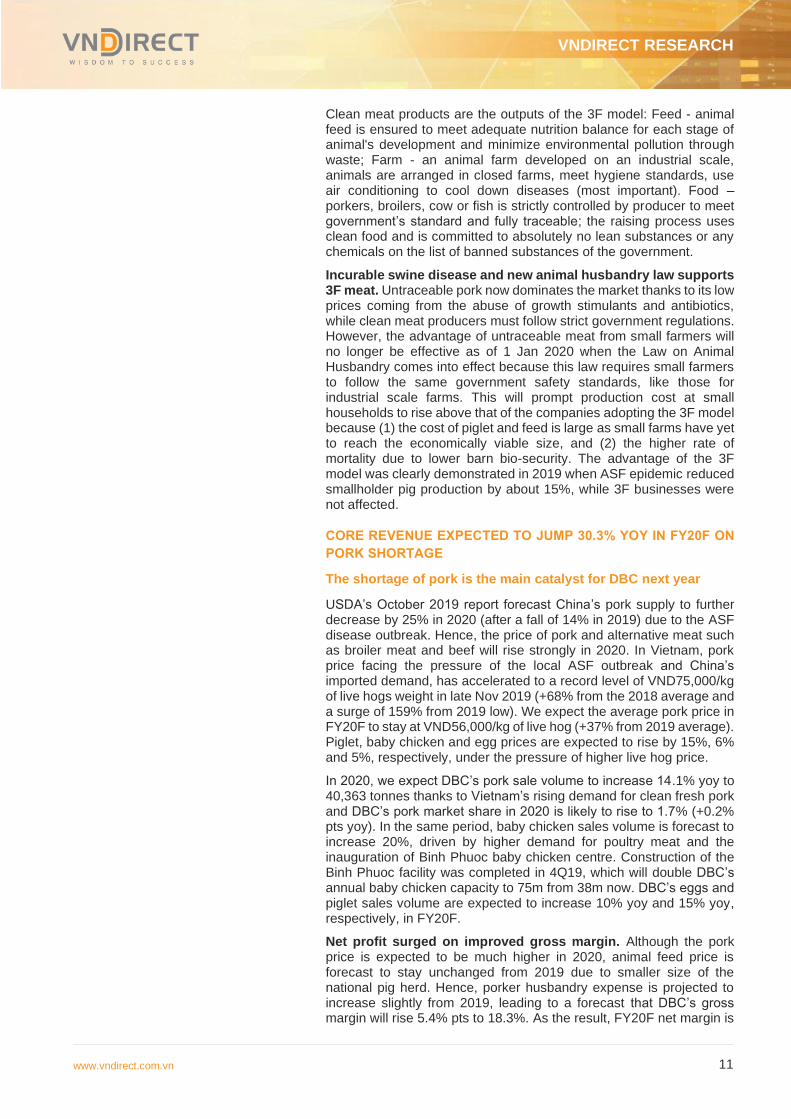
In 2018, this product group generated 49% of total revenue, while poultry-related product group brought in 23%. For that reason, fluctuations in the pork market have a huge impact on DBC's revenue. In 2017, the average pork price fell 33% yoy due to oversupply, which triggered DBC’s revenue to drop 6.4% yoy. In 9M19, pork price fluctuated strongly again due to ASF disease. Hence, DBC’s 9M19 revenue growth lost 10% pts to 5% yoy.
VNDIRECT RESEARCH
www.vndirect.com.vn 9
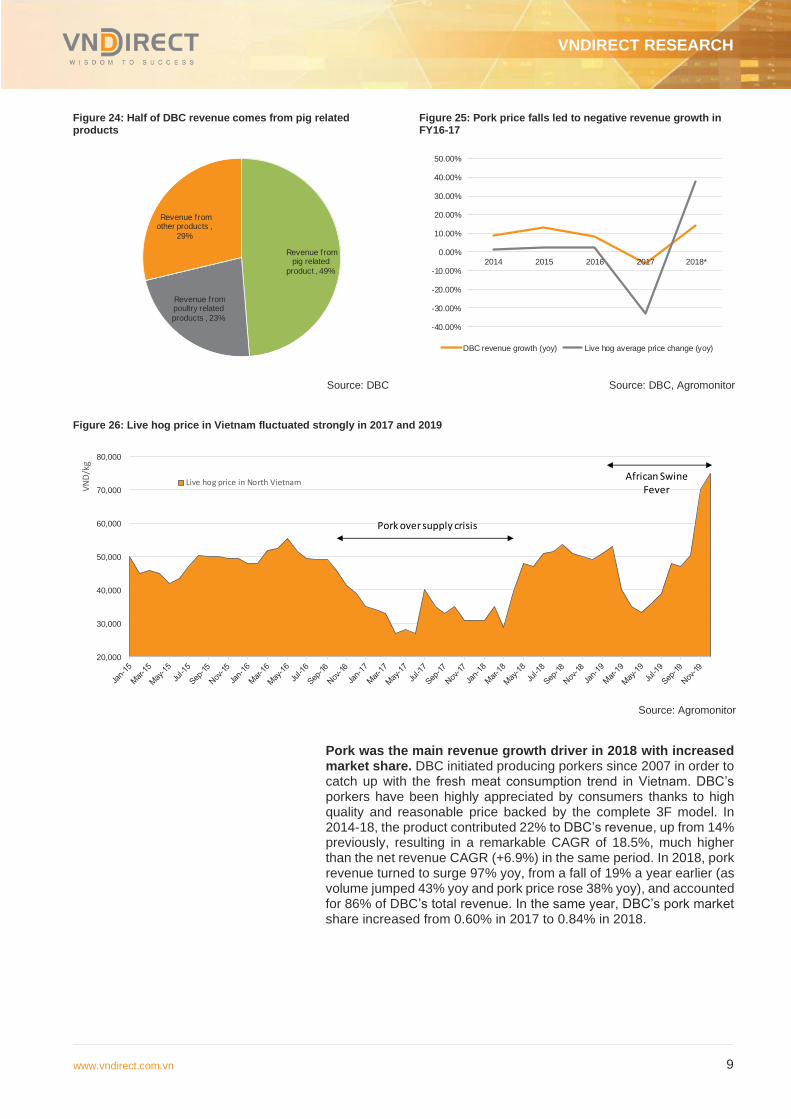
Figure 24: Half of DBC revenue comes from pig related products
Figure 25: Pork price falls led to negative revenue growth in FY16-17
Source: DBC Source: DBC, Agromonitor
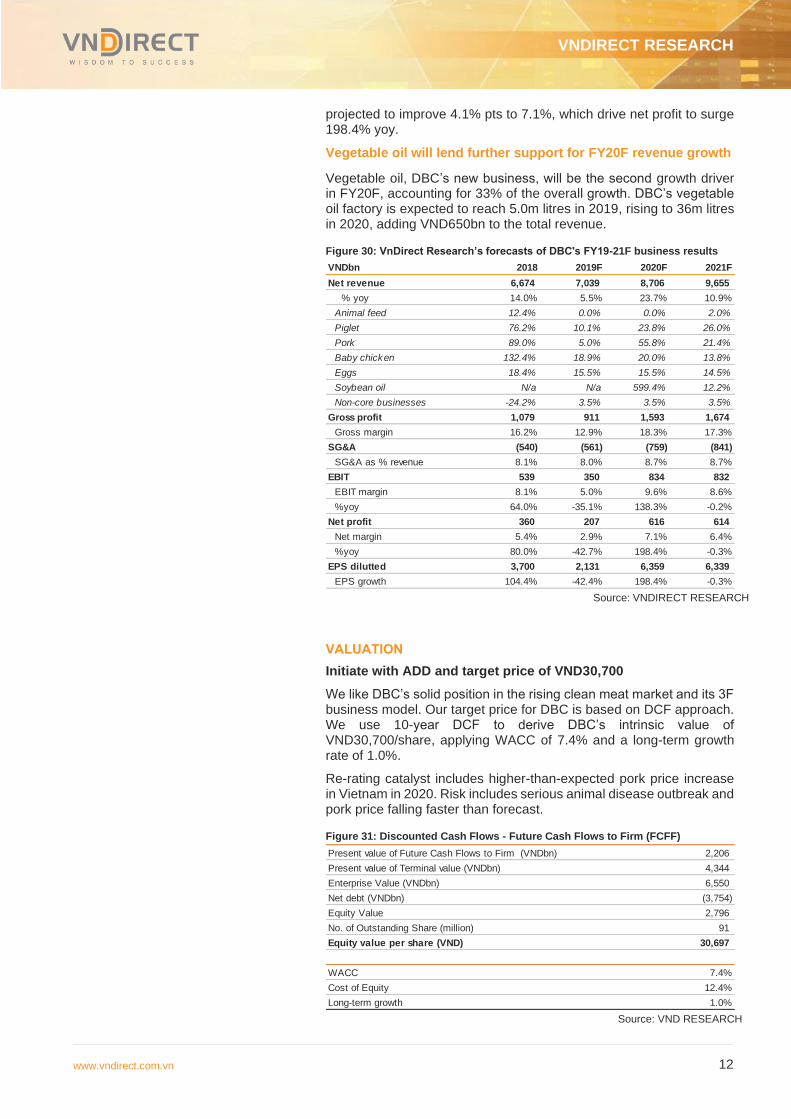
Figure 26: Live hog price in Vietnam fluctuated strongly in 2017 and 2019
Source: Agromonitor
Pork was the main revenue growth driver in 2018 with increased market share. DBC initiated producing porkers since 2007 in order to catch up with the fresh meat consumption trend in Vietnam. DBC’s porkers have been highly appreciated by consumers thanks to high quality and reasonable price backed by the complete 3F model. In 2014-18, the product contributed 22% to DBC’s revenue, up from 14% previously, resulting in a remarkable CAGR of 18.5%, much higher than the net revenue CAGR (+6.9%) in the same period. In 2018, pork revenue turned to surge 97% yoy, from a fall of 19% a year earlier (as volume jumped 43% yoy and pork price rose 38% yoy), and accounted for 86% of DBC’s total revenue. In the same year, DBC’s pork market share increased from 0.60% in 2017 to 0.84% in 2018.
Title:
Source:
Please fill in the values above to have them entered in your reportRevenue from
pig related
product , 49%
Revenue from poultry related
products , 23%
Revenue from other products ,
29%
Title:
Source:
Please fill in the values above to have them entered in your report
-40.00%
-30.00%
-20.00%
-10.00%
0.00%
10.00%
20.00%
30.00%
40.00%
50.00%
2014 2015 2016 2017 2018*
DBC revenue growth (yoy) Live hog average price change (yoy)
Title:
Source:
Please fill in the values above to have them entered in your report
20,000
30,000
40,000
50,000
60,000
70,000
80,000
VN
D/k
g
Live hog price in North Vietnam
Pork over supply crisis
African Swine Fever

VNDIRECT RESEARCH
www.vndirect.com.vn 10
Figure 27: Growth of pork sales contributed 79% of DBC’s growth in 2018
Figure 28: Pork sales rose much faster than DBC's revenue growth in FY14-18
Source: DBC, VNDIRECT RESEARCH Source: DBC, VNDIRECT RESEARCH
3F MEAT IS GOING TO REPLACE UNTRACEBALE MEAT
Vietnam’s meat market is potential but fragmented. Pork is the staple meat in Vietnam, accounting for 66% of the total meat consumption, followed by poultry and beef. Despite the fact that pork is the main meat, the local pork market remains at a low base as 99% of the consumed pork is warm meat and 95% is unsafe (pigs fed with anti-biotics or weight-gain stimulus; slaughtered in small scale, low-hygiene standard; the meat is transported without veterinary control; sold in wet markets which have high risk of contamination).
Figure 29: Meat in Vietnam has high risk of contamination
Source: MML
Products of 3F model satisfy the growing demand for clean meat in Vietnam. Higher income, nutritional knowledge and health awareness of Vietnamese people are increasing, leading to stronger demand for clean meat. This trend is particularly strong in urban areas, thanks to the development of a modern trade channel that has made it easier for consumers to access clean, branded and sourced meat.
VNDIRECT RESEARCH
www.vndirect.com.vn 11
Clean meat products are the outputs of the 3F model: Feed - animal feed is ensured to meet adequate nutrition balance for each stage of animal's development and minimize environmental pollution through waste; Farm - an animal farm developed on an industrial scale, animals are arranged in closed farms, meet hygiene standards, use air conditioning to cool down diseases (most important). Food – porkers, broilers, cow or fish is strictly controlled by producer to meet government’s standard and fully traceable; the raising process uses clean food and is committed to absolutely no lean substances or any chemicals on the list of banned substances of the government.
Incurable swine disease and new animal husbandry law supports 3F meat. Untraceable pork now dominates the market thanks to its low prices coming from the abuse of growth stimulants and antibiotics, while clean meat producers must follow strict government regulations. However, the advantage of untraceable meat from small farmers will no longer be effective as of 1 Jan 2020 when the Law on Animal Husbandry comes into effect because this law requires small farmers to follow the same government safety standards, like those for industrial scale farms. This will prompt production cost at small households to rise above that of the companies adopting the 3F model because (1) the cost of piglet and feed is large as small farms have yet to reach the economically viable size, and (2) the higher rate of mortality due to lower barn bio-security. The advantage of the 3F model was clearly demonstrated in 2019 when ASF epidemic reduced smallholder pig production by about 15%, while 3F businesses were not affected.
CORE REVENUE EXPECTED TO JUMP 30.3% YOY IN FY20F ON
PORK SHORTAGE
The shortage of pork is the main catalyst for DBC next year
USDA’s October 2019 report forecast China’s pork supply to further decrease by 25% in 2020 (after a fall of 14% in 2019) due to the ASF disease outbreak. Hence, the price of pork and alternative meat such as broiler meat and beef will rise strongly in 2020. In Vietnam, pork price facing the pressure of the local ASF outbreak and China’s imported demand, has accelerated to a record level of VND75,000/kg of live hogs weight in late Nov 2019 (+68% from the 2018 average and a surge of 159% from 2019 low). We expect the average pork price in FY20F to stay at VND56,000/kg of live hog (+37% from 2019 average). Piglet, baby chicken and egg prices are expected to rise by 15%, 6% and 5%, respectively, under the pressure of higher live hog price.
In 2020, we expect DBC’s pork sale volume to increase 14.1% yoy to 40,363 tonnes thanks to Vietnam’s rising demand for clean fresh pork and DBC’s pork market share in 2020 is likely to rise to 1.7% (+0.2% pts yoy). In the same period, baby chicken sales volume is forecast to increase 20%, driven by higher demand for poultry meat and the inauguration of Binh Phuoc baby chicken centre. Construction of the Binh Phuoc facility was completed in 4Q19, which will double DBC’s annual baby chicken capacity to 75m from 38m now. DBC’s eggs and piglet sales volume are expected to increase 10% yoy and 15% yoy, respectively, in FY20F.
Net profit surged on improved gross margin. Although the pork price is expected to be much higher in 2020, animal feed price is forecast to stay unchanged from 2019 due to smaller size of the national pig herd. Hence, porker husbandry expense is projected to increase slightly from 2019, leading to a forecast that DBC’s gross margin will rise 5.4% pts to 18.3%. As the result, FY20F net margin is
VNDIRECT RESEARCH
www.vndirect.com.vn 12
projected to improve 4.1% pts to 7.1%, which drive net profit to surge 198.4% yoy.
Vegetable oil will lend further support for FY20F revenue growth
Vegetable oil, DBC’s new business, will be the second growth driver in FY20F, accounting for 33% of the overall growth. DBC’s vegetable oil factory is expected to reach 5.0m litres in 2019, rising to 36m litres in 2020, adding VND650bn to the total revenue.
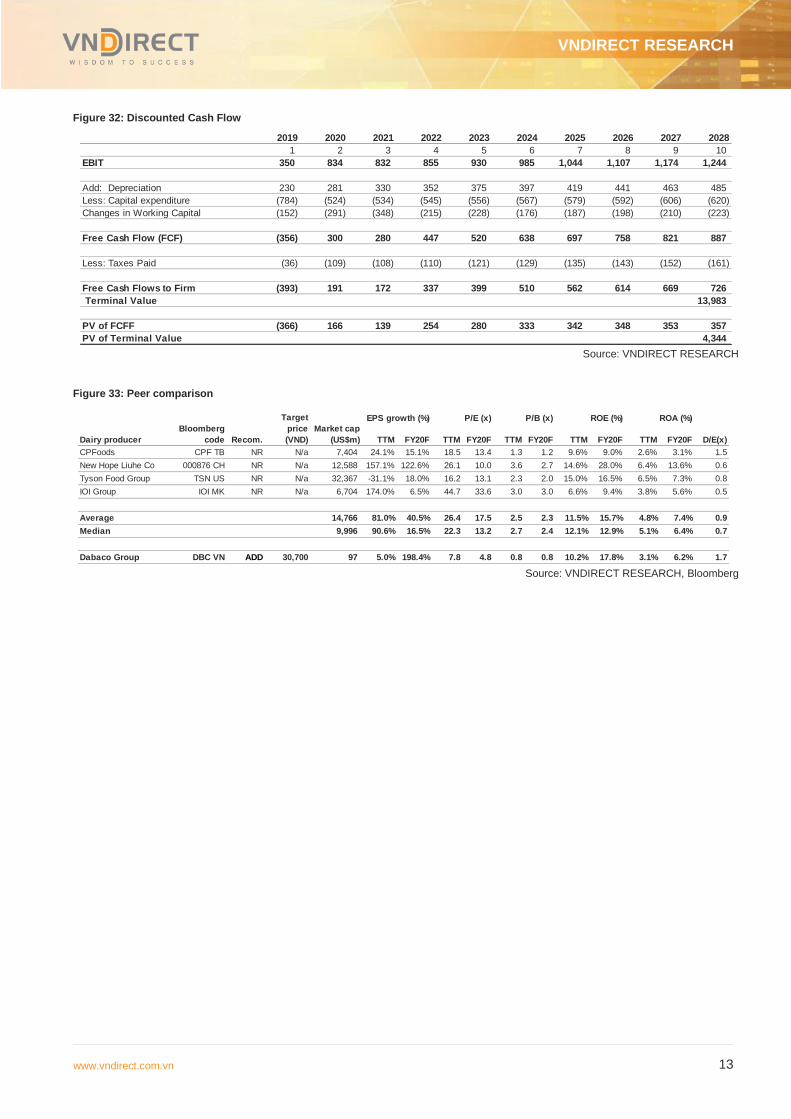
Figure 30: VnDirect Research’s forecasts of DBC's FY19-21F business results
Source: VNDIRECT RESEARCH
VALUATION
Initiate with ADD and target price of VND30,700
We like DBC’s solid position in the rising clean meat market and its 3F business model. Our target price for DBC is based on DCF approach. We use 10-year DCF to derive DBC’s intrinsic value of VND30,700/share, applying WACC of 7.4% and a long-term growth rate of 1.0%.
Re-rating catalyst includes higher-than-expected pork price increase in Vietnam in 2020. Risk includes serious animal disease outbreak and pork price falling faster than forecast.
Figure 31: Discounted Cash Flows - Future Cash Flows to Firm (FCFF)
Source: VND RESEARCH
VNDbn 2018 2019F 2020F 2021F
Net revenue 6,674 7,039 8,706 9,655
% yoy 14.0% 5.5% 23.7% 10.9%
Animal feed 12.4% 0.0% 0.0% 2.0%
Piglet 76.2% 10.1% 23.8% 26.0%
Pork 89.0% 5.0% 55.8% 21.4%
Baby chicken 132.4% 18.9% 20.0% 13.8%
Eggs 18.4% 15.5% 15.5% 14.5%
Soybean oil N/a N/a 599.4% 12.2%
Non-core businesses -24.2% 3.5% 3.5% 3.5%
Gross profit 1,079 911 1,593 1,674
Gross margin 16.2% 12.9% 18.3% 17.3%
SG&A (540) (561) (759) (841)
SG&A as % revenue 8.1% 8.0% 8.7% 8.7%
EBIT 539 350 834 832
EBIT margin 8.1% 5.0% 9.6% 8.6%
%yoy 64.0% -35.1% 138.3% -0.2%
Net profit 360 207 616 614
Net margin 5.4% 2.9% 7.1% 6.4%
%yoy 80.0% -42.7% 198.4% -0.3%
EPS dilutted 3,700 2,131 6,359 6,339
EPS growth 104.4% -42.4% 198.4% -0.3%
Present value of Future Cash Flows to Firm (VNDbn) 2,206
Present value of Terminal value (VNDbn) 4,344
Enterprise Value (VNDbn) 6,550
(3,754)
Equity Value 2,796
No. of Outstanding Share (million) 91
Equity value per share (VND) 30,697
WACC 7.4%
Cost of Equity 12.4%
Long-term growth 1.0%
Net debt (VNDbn)
VNDIRECT RESEARCH
www.vndirect.com.vn 13
Figure 32: Discounted Cash Flow
Source: VNDIRECT RESEARCH
Figure 33: Peer comparison
Source: VNDIRECT RESEARCH, Bloomberg
2019 2020 2021 2022 2023 2024 2025 2026 2027 2028
1 2 3 4 5 6 7 8 9 10
EBIT 350 834 832 855 930 985 1,044 1,107 1,174 1,244
Add: Depreciation 230 281 330 352 375 397 419 441 463 485
Less: Capital expenditure (784) (524) (534) (545) (556) (567) (579) (592) (606) (620)
Changes in Working Capital (152) (291) (348) (215) (228) (176) (187) (198) (210) (223)
Free Cash Flow (FCF) (356) 300 280 447 520 638 697 758 821 887
Less: Taxes Paid (36) (109) (108) (110) (121) (129) (135) (143) (152) (161)
Free Cash Flows to Firm (393) 191 172 337 399 510 562 614 669 726
Terminal Value 13,983
PV of FCFF (366) 166 139 254 280 333 342 348 353 357
PV of Terminal Value 4,344
TTM FY20F TTM FY20F TTM FY20F TTM FY20F TTM FY20F
CPFoods CPF TB NR N/a 7,404 24.1% 15.1% 18.5 13.4 1.3 1.2 9.6% 9.0% 2.6% 3.1% 1.5
New Hope Liuhe Co 000876 CH NR N/a 12,588 157.1% 122.6% 26.1 10.0 3.6 2.7 14.6% 28.0% 6.4% 13.6% 0.6
Tyson Food Group TSN US NR N/a 32,367 -31.1% 18.0% 16.2 13.1 2.3 2.0 15.0% 16.5% 6.5% 7.3% 0.8
IOI Group IOI MK NR N/a 6,704 174.0% 6.5% 44.7 33.6 3.0 3.0 6.6% 9.4% 3.8% 5.6% 0.5
Average 14,766 81.0% 40.5% 26.4 17.5 2.5 2.3 11.5% 15.7% 4.8% 7.4% 0.9
Median 9,996 90.6% 16.5% 22.3 13.2 2.7 2.4 12.1% 12.9% 5.1% 6.4% 0.7
Dabaco Group DBC VN ADD 30,700 97 5.0% 198.4% 7.8 4.8 0.8 0.8 10.2% 17.8% 3.1% 6.2% 1.7
EPS growth (%)
Dairy producer
Bloomberg
code Recom.
Target
price
(VND)
Market cap
(US$m)
P/E (x) P/B (x) ROE (%) ROA (%)
D/E(x)
VNDIRECT RESEARCH
www.vndirect.com.vn 14
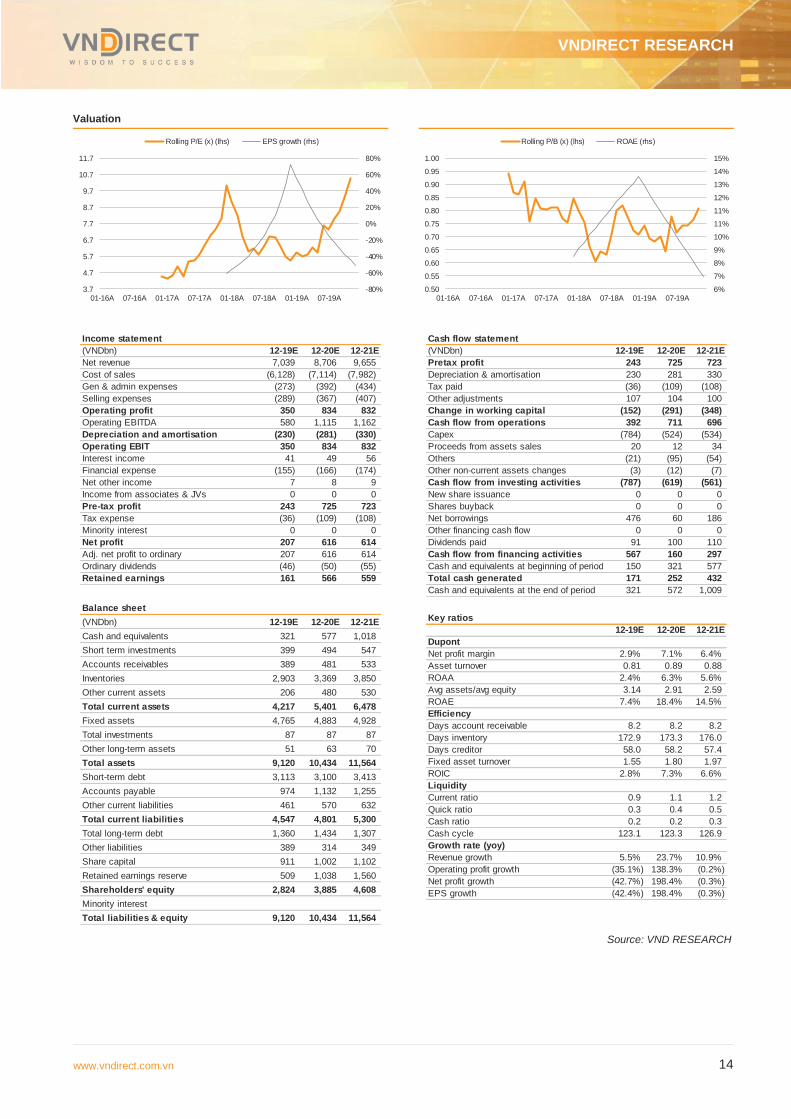
Valuation
Source: VND RESEARCH
-80%
-60%
-40%
-20%
0%
20%
40%
60%
80%
3.7
4.7
5.7
6.7
7.7
8.7
9.7
10.7
11.7
01-16A 07-16A 01-17A 07-17A 01-18A 07-18A 01-19A 07-19A
Rolling P/E (x) (lhs) EPS growth (rhs)
6%
7%
8%
9%
10%
11%
11%
12%
13%
14%
15%
0.50
0.55
0.60
0.65
0.70
0.75
0.80
0.85
0.90
0.95
1.00
01-16A 07-16A 01-17A 07-17A 01-18A 07-18A 01-19A 07-19A
Rolling P/B (x) (lhs) ROAE (rhs)
Income statement
(VNDbn) 12-19E 12-20E 12-21E
Net revenue 7,039 8,706 9,655
Cost of sales (6,128) (7,114) (7,982)
Gen & admin expenses (273) (392) (434)
Selling expenses (289) (367) (407)
Operating profit 350 834 832
Operating EBITDA 580 1,115 1,162
Depreciation and amortisation (230) (281) (330)
Operating EBIT 350 834 832
Interest income 41 49 56
Financial expense (155) (166) (174)
Net other income 7 8 9
Income from associates & JVs 0 0 0
Pre-tax profit 243 725 723
Tax expense (36) (109) (108)
Minority interest 0 0 0
Net profit 207 616 614
Adj. net profit to ordinary 207 616 614
Ordinary dividends (46) (50) (55)
Retained earnings 161 566 559
Balance sheet
(VNDbn) 12-19E 12-20E 12-21E
Cash and equivalents 321 577 1,018
Short term investments 399 494 547
Accounts receivables 389 481 533
Inventories 2,903 3,369 3,850
Other current assets 206 480 530
Total current assets 4,217 5,401 6,478
Fixed assets 4,765 4,883 4,928
Total investments 87 87 87
Other long-term assets 51 63 70
Total assets 9,120 10,434 11,564
Short-term debt 3,113 3,100 3,413
Accounts payable 974 1,132 1,255
Other current liabilities 461 570 632
Total current liabilities 4,547 4,801 5,300
Total long-term debt 1,360 1,434 1,307
Other liabilities 389 314 349
Share capital 911 1,002 1,102
Retained earnings reserve 509 1,038 1,560
Shareholders' equity 2,824 3,885 4,608
Minority interest
Total liabilities & equity 9,120 10,434 11,564
Cash flow statement
(VNDbn) 12-19E 12-20E 12-21E
Pretax profit 243 725 723
Depreciation & amortisation 230 281 330
Tax paid (36) (109) (108)
Other adjustments 107 104 100
Change in working capital (152) (291) (348)
Cash flow from operations 392 711 696
Capex (784) (524) (534)
Proceeds from assets sales 20 12 34
Others (21) (95) (54)
Other non-current assets changes (3) (12) (7)
Cash flow from investing activities (787) (619) (561)
New share issuance 0 0 0
Shares buyback 0 0 0
Net borrowings 476 60 186
Other financing cash flow 0 0 0
Dividends paid 91 100 110
Cash flow from financing activities 567 160 297
Cash and equivalents at beginning of period 150 321 577
Total cash generated 171 252 432
Cash and equivalents at the end of period 321 572 1,009
Key ratios
12-19E 12-20E 12-21E
Dupont
Net profit margin 2.9% 7.1% 6.4%
Asset turnover 0.81 0.89 0.88
ROAA 2.4% 6.3% 5.6%
Avg assets/avg equity 3.14 2.91 2.59
ROAE 7.4% 18.4% 14.5%
Efficiency
Days account receivable 8.2 8.2 8.2
Days inventory 172.9 173.3 176.0
Days creditor 58.0 58.2 57.4
Fixed asset turnover 1.55 1.80 1.97
ROIC 2.8% 7.3% 6.6%
Liquidity
Current ratio 0.9 1.1 1.2
Quick ratio 0.3 0.4 0.5
Cash ratio 0.2 0.2 0.3
Cash cycle 123.1 123.3 126.9
Growth rate (yoy)
Revenue growth 5.5% 23.7% 10.9%
Operating profit growth (35.1%) 138.3% (0.2%)
Net profit growth (42.7%) 198.4% (0.3%)
EPS growth (42.4%) 198.4% (0.3%)

VNDIRECT RESEARCH
www.vndirect.com.vn 15
DISCLAIMER
This report has been written and distributed by Research Department, VNDIRECT Securities Corporation. The information contained in this report is prepared from data believed to be correct and reliable at the time of issuance of this report. Unless otherwise stated, this report is based upon sources that VNDIRECT considers to be reliable. These sources may include but are not limited to data from the stock exchange or market where the subject security is listed, or, where appropriate, any other market. Information on the company(ies) are based on published statements, information disclosure and announcements of the company(ies), and information resulting from our research. VNDIRECT has no responsibility for the accuracy, adequacy or completeness of such information.
All estimates, projections, forecasts and expression of opinions contained in this report reflect the personal views and opinions of the analyst(s) responsible for the production of this report. These opinions may not represent the views and position of VNDIRECT and may change without notice.
This report has been prepared for information purposes only. The information and opinions in this report should not be considered as an offer, recommendation or solicitation to buy or sell the subject securities, related investments or other financial instruments. VNDIRECT takes no responsibility for any consequences arising from using the content of this report in any form.
This report and all of its content belongs to VNDIRECT. No part of this report may be copied or reproduced in any form or redistributed in whole or in part, for any purpose without the prior written consent of VNDIRECT.
RECOMMENDATION FRAMEWORK
Stock Ratings Definition:
Add The stock’s total return is expected to reach 15% or higher over the next 12 months.
Hold The stock’s total return is expected to be between negative 10% and positive 15% over the next 12
months.
Reduce The stock’s total return is expected to fall below negative 10% over the next 12 months.
The total expected return of a stock is defined as the sum of the: (i) percentage difference between the target price and
the current price and (ii) the forward net dividend yields of the stock. Stock price targets have an investment horizon of 12
months.
Sector Ratings Definition:
Overweight An Overweight rating means stocks in the sector have, on a market cap-weighted basis, a positive
absolute recommendation.
Neutral A Neutral rating means stocks in the sector have, on a market cap-weighted basis, a neutral absolute
recommendation.
Underweight An Underweight rating means stocks in the sector have, on a market cap-weighted basis, a negative
absolute recommendation.
Hien Tran Khanh – Deputy Head of Research
Email: [email protected]
Nguyen Tien Duc – Analyst
Email: [email protected]
–
Email:
–
Email:
–
Email:
–
Email:
VNDIRECT Securities Corporation
1 Nguyen Thuong Hien Str – Hai Ba Trung Dist – Ha Noi
Tel: +84 2439724568
Email: [email protected]
Website: https://vndirect.com.vn