A code for transcription initiation in mammalian genomes
12
A code for transcription initiation in mammalian genomes Martin C. Frith, 1,2,5,6 Eivind Valen, 3 Anders Krogh, 3 Yoshihide Hayashizaki, 1,4 Piero Carninci, 1,4 and Albin Sandelin 3,6 1 Genome Exploration Research Group (Genome Network Project Core Group), RIKEN Genomic Sciences Center (GSC), RIKEN Yokohama Institute, 1-7-22 Suehiro-cho, Tsurumi-ku, Yokohama, Kanagawa, 230-0045, Japan; 2 ARC Centre in Bioinformatics, Institute for Molecular Bioscience, University of Queensland, Brisbane, Qld 4072, Australia; 3 The Bioinformatics Centre, Department of Molecular Biology & Biotech Research and Innovation Centre, University of Copenhagen, Ole Maaløes Vej 5, DK-2200 København N, Denmark; 4 Genome Science Laboratory, Discovery Research Institute, RIKEN Wako Institute, 2-1 Hirosawa, Wako, Saitama, 351-0198, Japan Genome-wide detection of transcription start sites (TSSs) has revealed that RNA Polymerase II transcription initiates at millions of positions in mammalian genomes. Most core promoters do not have a single TSS, but an array of closely located TSSs with different rates of initiation. As a rule, genes have more than one such core promoter; however, defining the boundaries between core promoters is not trivial. These discoveries prompt a re-evaluation of our models for transcription initiation. We describe a new framework for understanding the organization of transcription initiation. We show that initiation events are clustered on the chromosomes at multiple scales—clusters within clusters—indicating multiple regulatory processes. Within the smallest of such clusters, which can be interpreted as core promoters, the local DNA sequence predicts the relative transcription start usage of each nucleotide with a remarkable 91% accuracy, implying the existence of a DNA code that determines TSS selection. Conversely, the total expression strength of such clusters is only partially determined by the local DNA sequence. Thus, the overall control of transcription can be understood as a combination of large- and small-scale effects; the selection of transcription start sites is largely governed by the local DNA sequence, whereas the transcriptional activity of a locus is regulated at a different level; it is affected by distal features or events such as enhancers and chromatin remodeling. [Supplemental material is available online at www.genome.org. Perl scripts for parametric clustering and for making and scanning position-specific Markov models, are available together with datasets used in this work at http://binf. ku.dk/∼albin/supplementary_data/tss_code/.] Since most genetic information is expressed via transcription by RNA Polymerase II, understanding the manner and mechanisms of transcription initiation by this enzyme is of fundamental im- portance to biology. Most of our knowledge of the transcription initiation process comes from detailed experiments on single- core promoters (for review, see Smale and Kadonaga 2003). As a consequence, the only reasonably detailed model of the process assumes that promoters have a TATA-box, which directs the posi- tioning of the preinitiation complex—in effect initiating transcrip- tion from a single nucleotide (Hampsey 1998; Thomas and Chiang 2006). However, the fraction of promoters with clear TATA-boxes has been decreasing with the number of promoters discovered (Ohler et al. 2002; Gershenzon and Ioshikhes 2005; Molina and Grotewold 2005; Carninci et al. 2006; Cooper et al. 2006). Indeed, the largest TSS identification study to date (Carninci et al. 2006), in which >12 million mRNA 5 ends were sequenced, showed that the majority of strong human and mouse RNA Poly- merase II core promoters have an array of close TSSs instead of the expected single TSS. That study used the Cap Analysis of Gene Expression (CAGE) technology, based on sequencing 5 ends, “CAGE tags,” of CAP-selected full-length cDNAs. A particu- lar strength of the CAGE method is that tags mapped to the genome show both the location and strength of transcription (the number of mapped tags at a given location) (Carninci et al. 2006; Kodzius et al. 2006). This means that most promoters can be accurately described as a distribution of initiation site events on a stretch of nucleotides. We have previously shown that broad TSS distributions are correlated with CpG islands and ubiqui- tously expressed genes, whereas promoters with a narrow TSS distribution frequently direct tissue-specific genes and often have a TATA box. For most promoters, the TSS distributions are highly conserved between human and mouse, suggesting a regulatory mechanism underlying the precise nucleotide selection even when a promoter has multiple TSS peaks (Carninci et al. 2006; see Supplemental Fig. S1 for examples of different TSS distributions in mouse and human promoters). Moreover, most genes have several strong core promoters, which complements alternative splicing in generating different protein isoforms (Carninci et al. 2006; Kimura et al. 2006). In- triguingly, some, but not all genes have weak TSSs scattered over their exons (Carninci et al. 2006). As this has been observed with multiple technologies, it is unlikely to be an experimental arti- fact—in a recent study, internal TSSs were shown to be the start 5 Present address: CBRC, AIST, 2-42 Aomi, Koto-ku, Tokyo, 135-0064, Japan. 6 Corresponding authors. E-mail [email protected]; fax +81-3-3599-8081. E-mail [email protected]; fax 15-3532-5669. Article published online before print. Article and publication date are at http:// www.genome.org/cgi/doi/10.1101/gr.6831208. Article 18:1–12 ©2008 by Cold Spring Harbor Laboratory Press; ISSN 1088-9051/08; www.genome.org Genome Research 1 www.genome.org
-
Upload
independent -
Category
Documents
-
view
2 -
download
0
Transcript of A code for transcription initiation in mammalian genomes

A code for transcription initiationin mammalian genomesMartin C. Frith,1,2,5,6 Eivind Valen,3 Anders Krogh,3 Yoshihide Hayashizaki,1,4
Piero Carninci,1,4 and Albin Sandelin3,6
1Genome Exploration Research Group (Genome Network Project Core Group), RIKEN Genomic Sciences Center (GSC), RIKENYokohama Institute, 1-7-22 Suehiro-cho, Tsurumi-ku, Yokohama, Kanagawa, 230-0045, Japan; 2ARC Centre in Bioinformatics,Institute for Molecular Bioscience, University of Queensland, Brisbane, Qld 4072, Australia; 3The Bioinformatics Centre,Department of Molecular Biology & Biotech Research and Innovation Centre, University of Copenhagen, Ole Maaløes Vej 5,DK-2200 København N, Denmark; 4Genome Science Laboratory, Discovery Research Institute, RIKEN Wako Institute, 2-1Hirosawa, Wako, Saitama, 351-0198, Japan
Genome-wide detection of transcription start sites (TSSs) has revealed that RNA Polymerase II transcription initiatesat millions of positions in mammalian genomes. Most core promoters do not have a single TSS, but an array ofclosely located TSSs with different rates of initiation. As a rule, genes have more than one such core promoter;however, defining the boundaries between core promoters is not trivial. These discoveries prompt a re-evaluation ofour models for transcription initiation. We describe a new framework for understanding the organization oftranscription initiation. We show that initiation events are clustered on the chromosomes at multiple scales—clusterswithin clusters—indicating multiple regulatory processes. Within the smallest of such clusters, which can beinterpreted as core promoters, the local DNA sequence predicts the relative transcription start usage of eachnucleotide with a remarkable 91% accuracy, implying the existence of a DNA code that determines TSS selection.Conversely, the total expression strength of such clusters is only partially determined by the local DNA sequence.Thus, the overall control of transcription can be understood as a combination of large- and small-scale effects; theselection of transcription start sites is largely governed by the local DNA sequence, whereas the transcriptionalactivity of a locus is regulated at a different level; it is affected by distal features or events such as enhancers andchromatin remodeling.
[Supplemental material is available online at www.genome.org. Perl scripts for parametric clustering and for makingand scanning position-specific Markov models, are available together with datasets used in this work at http://binf.ku.dk/∼albin/supplementary_data/tss_code/.]
Since most genetic information is expressed via transcription byRNA Polymerase II, understanding the manner and mechanismsof transcription initiation by this enzyme is of fundamental im-portance to biology. Most of our knowledge of the transcriptioninitiation process comes from detailed experiments on single-core promoters (for review, see Smale and Kadonaga 2003). As aconsequence, the only reasonably detailed model of the processassumes that promoters have a TATA-box, which directs the posi-tioning of the preinitiation complex—in effect initiating transcrip-tion from a single nucleotide (Hampsey 1998; Thomas and Chiang2006). However, the fraction of promoters with clear TATA-boxeshas been decreasing with the number of promoters discovered(Ohler et al. 2002; Gershenzon and Ioshikhes 2005; Molina andGrotewold 2005; Carninci et al. 2006; Cooper et al. 2006).
Indeed, the largest TSS identification study to date (Carninciet al. 2006), in which >12 million mRNA 5� ends were sequenced,showed that the majority of strong human and mouse RNA Poly-merase II core promoters have an array of close TSSs instead of
the expected single TSS. That study used the Cap Analysis ofGene Expression (CAGE) technology, based on sequencing 5�
ends, “CAGE tags,” of CAP-selected full-length cDNAs. A particu-lar strength of the CAGE method is that tags mapped to thegenome show both the location and strength of transcription(the number of mapped tags at a given location) (Carninci et al.2006; Kodzius et al. 2006). This means that most promoters canbe accurately described as a distribution of initiation site eventson a stretch of nucleotides. We have previously shown that broadTSS distributions are correlated with CpG islands and ubiqui-tously expressed genes, whereas promoters with a narrow TSSdistribution frequently direct tissue-specific genes and often havea TATA box. For most promoters, the TSS distributions are highlyconserved between human and mouse, suggesting a regulatorymechanism underlying the precise nucleotide selection evenwhen a promoter has multiple TSS peaks (Carninci et al. 2006; seeSupplemental Fig. S1 for examples of different TSS distributionsin mouse and human promoters).
Moreover, most genes have several strong core promoters,which complements alternative splicing in generating differentprotein isoforms (Carninci et al. 2006; Kimura et al. 2006). In-triguingly, some, but not all genes have weak TSSs scattered overtheir exons (Carninci et al. 2006). As this has been observed withmultiple technologies, it is unlikely to be an experimental arti-fact—in a recent study, internal TSSs were shown to be the start
5Present address: CBRC, AIST, 2-42 Aomi, Koto-ku, Tokyo, 135-0064,Japan.6Corresponding authors.E-mail [email protected]; fax +81-3-3599-8081.E-mail [email protected]; fax 15-3532-5669.Article published online before print. Article and publication date are at http://www.genome.org/cgi/doi/10.1101/gr.6831208.
Article
18:1–12 ©2008 by Cold Spring Harbor Laboratory Press; ISSN 1088-9051/08; www.genome.org Genome Research 1www.genome.org
of transcripts bridging two genes separated by 300 kbp (TheENCODE Project Consortium 2007). Therefore, in many cases itis hard to judge where a given core promoter starts and ends. Thisissue is analogous to the difficulty of defining gene boundaries inmammalian genomes—in fact, >70% of all nucleotides are tran-scribed at some point (Carninci et al. 2005; The ENCODE ProjectConsortium 2007). These and other recent findings using high-throughput TSS-sequencing methods haven been reviewed in de-tail in Muller et al. (2007) and Sandelin et al. (2007). Thus, we arein a situation where we have an unprecedented depth of datadescribing TSS locations and their usage by the cell, but lack aquantitative model for how the cell selects these TSSs on largerscales and at the nucleotide level.
In this report, we show that initiation events are clusteredhierarchically—clusters within clusters, likely reflecting differentbiological determinants working at different resolutions. Weshow that in the smallest of such clusters—which can be definedas core promoters—a local DNA code can predict the selectionand usage of transcription start sites with nucleotide resolution.Conversely, both the expression strength of clusters and theshape of larger clusters are likely determined by distal effects inaddition to the local code.
ResultsInitiation events are organized in hierarchical clusters
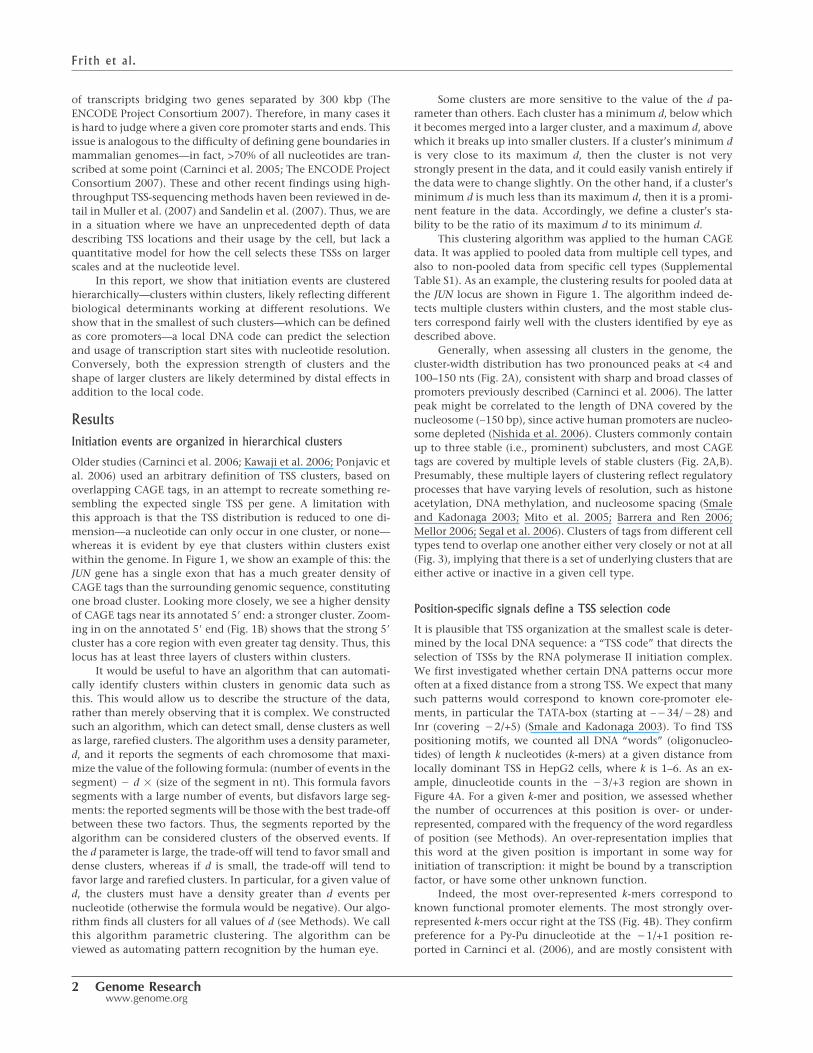
Older studies (Carninci et al. 2006; Kawaji et al. 2006; Ponjavic etal. 2006) used an arbitrary definition of TSS clusters, based onoverlapping CAGE tags, in an attempt to recreate something re-sembling the expected single TSS per gene. A limitation withthis approach is that the TSS distribution is reduced to one di-mension—a nucleotide can only occur in one cluster, or none—whereas it is evident by eye that clusters within clusters existwithin the genome. In Figure 1, we show an example of this: theJUN gene has a single exon that has a much greater density ofCAGE tags than the surrounding genomic sequence, constitutingone broad cluster. Looking more closely, we see a higher densityof CAGE tags near its annotated 5� end: a stronger cluster. Zoom-ing in on the annotated 5� end (Fig. 1B) shows that the strong 5�
cluster has a core region with even greater tag density. Thus, thislocus has at least three layers of clusters within clusters.
It would be useful to have an algorithm that can automati-cally identify clusters within clusters in genomic data such asthis. This would allow us to describe the structure of the data,rather than merely observing that it is complex. We constructedsuch an algorithm, which can detect small, dense clusters as wellas large, rarefied clusters. The algorithm uses a density parameter,d, and it reports the segments of each chromosome that maxi-mize the value of the following formula: (number of events in thesegment) � d � (size of the segment in nt). This formula favorssegments with a large number of events, but disfavors large seg-ments: the reported segments will be those with the best trade-offbetween these two factors. Thus, the segments reported by thealgorithm can be considered clusters of the observed events. Ifthe d parameter is large, the trade-off will tend to favor small anddense clusters, whereas if d is small, the trade-off will tend tofavor large and rarefied clusters. In particular, for a given value ofd, the clusters must have a density greater than d events pernucleotide (otherwise the formula would be negative). Our algo-rithm finds all clusters for all values of d (see Methods). We callthis algorithm parametric clustering. The algorithm can beviewed as automating pattern recognition by the human eye.
Some clusters are more sensitive to the value of the d pa-rameter than others. Each cluster has a minimum d, below whichit becomes merged into a larger cluster, and a maximum d, abovewhich it breaks up into smaller clusters. If a cluster’s minimum dis very close to its maximum d, then the cluster is not verystrongly present in the data, and it could easily vanish entirely ifthe data were to change slightly. On the other hand, if a cluster’sminimum d is much less than its maximum d, then it is a promi-nent feature in the data. Accordingly, we define a cluster’s sta-bility to be the ratio of its maximum d to its minimum d.
This clustering algorithm was applied to the human CAGEdata. It was applied to pooled data from multiple cell types, andalso to non-pooled data from specific cell types (SupplementalTable S1). As an example, the clustering results for pooled data atthe JUN locus are shown in Figure 1. The algorithm indeed de-tects multiple clusters within clusters, and the most stable clus-ters correspond fairly well with the clusters identified by eye asdescribed above.
Generally, when assessing all clusters in the genome, thecluster-width distribution has two pronounced peaks at <4 and100–150 nts (Fig. 2A), consistent with sharp and broad classes ofpromoters previously described (Carninci et al. 2006). The latterpeak might be correlated to the length of DNA covered by thenucleosome (∼150 bp), since active human promoters are nucleo-some depleted (Nishida et al. 2006). Clusters commonly containup to three stable (i.e., prominent) subclusters, and most CAGEtags are covered by multiple levels of stable clusters (Fig. 2A,B).Presumably, these multiple layers of clustering reflect regulatoryprocesses that have varying levels of resolution, such as histoneacetylation, DNA methylation, and nucleosome spacing (Smaleand Kadonaga 2003; Mito et al. 2005; Barrera and Ren 2006;Mellor 2006; Segal et al. 2006). Clusters of tags from different celltypes tend to overlap one another either very closely or not at all(Fig. 3), implying that there is a set of underlying clusters that areeither active or inactive in a given cell type.
Position-specific signals define a TSS selection code
It is plausible that TSS organization at the smallest scale is deter-mined by the local DNA sequence: a “TSS code” that directs theselection of TSSs by the RNA polymerase II initiation complex.We first investigated whether certain DNA patterns occur moreoften at a fixed distance from a strong TSS. We expect that manysuch patterns would correspond to known core-promoter ele-ments, in particular the TATA-box (starting at ∼�34/�28) andInr (covering �2/+5) (Smale and Kadonaga 2003). To find TSSpositioning motifs, we counted all DNA “words” (oligonucleo-tides) of length k nucleotides (k-mers) at a given distance fromlocally dominant TSS in HepG2 cells, where k is 1–6. As an ex-ample, dinucleotide counts in the �3/+3 region are shown inFigure 4A. For a given k-mer and position, we assessed whetherthe number of occurrences at this position is over- or under-represented, compared with the frequency of the word regardlessof position (see Methods). An over-representation implies thatthis word at the given position is important in some way forinitiation of transcription: it might be bound by a transcriptionfactor, or have some other unknown function.
Indeed, the most over-represented k-mers correspond toknown functional promoter elements. The most strongly over-represented k-mers occur right at the TSS (Fig. 4B). They confirmpreference for a Py-Pu dinucleotide at the �1/+1 position re-ported in Carninci et al. (2006), and are mostly consistent with
Frith et al.
2 Genome Researchwww.genome.org

Figure 1. Multiple-scale clustering of transcription initiation events. (A) Clustering of transcription initiation events in a 9-kb region around the JUNoncogene in human chromosome 1. (B) Zoom-in on the main JUN promoter region. Each panel displays genomic features with a representation similarto that used by the UCSC Genome Browser (Kent et al. 2002). Different types of features are shown in different “tracks,” stacked from top to bottomin each panel. The topmost track shows the location in chromosome 1. Below this, the next track indicates the location of the single-exon JUN gene,according to RefSeq cDNAs in the UCSC database (Karolchik et al. 2003); the thicker part with chevrons is the protein-coding region, and the thinnerparts are the 5� and 3� untranslated regions. Transcription is directed right-to-left. CpG island regions are shown below. The CAGE track (the first barplot)shows the number of CAGE tags initiating from each nucleotide. There is clearly a cluster of initiation events roughly covering the JUN gene, contrastedwith a striking absence of initiation events on either side of the gene. Furthermore, this cluster clearly contains a much denser subcluster in the annotatedpromoter region, and the subcluster seems to contain a core region with an even greater density of initiation events (B). The clusters track (B, bottom)shows the clusters in the CAGE data picked out by our algorithm. Stable clusters (stability �2) are black and unstable clusters are gray. Only clusters>1 nt are shown in this track. For some of the clusters in this track, we only see one of their ends, as they extend further in the 3� direction. Finally, thecluster-stability track shows these same clusters as blocks that are stacked on each other, where the height of each block reflects the cluster’s stability.(In fact, the logarithm of the d parameter from our algorithm is plotted on the Y-axis, so that the height of each block is proportional to the logarithmof the cluster’s stability. See the main text and Methods for definitions of stability and d.)
A code for transcription initiation
Genome Research 3www.genome.org

the broader YYANWYY Inr motif (Smaleand Kadonaga 2003), although the +1/+2 dinucleotide appears better repre-sented by RR than AN. The second-strongest motif is the TATA box, in the�31/�23 region (Fig. 4B). The positionof this motif is entirely consistent withprevious studies using a multitude of ex-perimental and statistical techniques(Kovacs and Butterworth 1986; Molinaand Grotewold 2005; Ponjavic et al.2006; Sandelin et al. 2007). Despite be-ing significantly over-represented, theTATA k-mers only occur in a small frac-tion of the sequences (see SupplementalFigs. S2–S7). The low fraction of TATA-box promoters is consistent with recentstudies identifying TSSs genome-wide(Ohler et al. 2002; Gershenzon andIoshikhes 2005; Molina and Grotewold2005; Carninci et al. 2006; Cooper et al.2006). Third is a novel and very clearCG-rich motif in the downstream region(Fig. 4B). It is more specific than merelyCG-rich: the k-mers are all variants of aGCG trinucleotide repeat. The weakestof the clearly visible motifs is an SP1-like
element in the �50/�30 region, and an “echo” of the GCGrepeat 10 nt downstream of the main GCG repeat. Since 10 nt isone turn of the double helix, the GCG repeat and its echo havethe same phasing relative to the TSS. The over-representation ofSP1 sites in this region was reported previously using mouse data(Carninci et al. 2006). The same motifs are consistently foundusing CAGE data from other human and mouse cell types, al-though the gcg echo is not always apparent (Supplemental Figs.S2–S7; Supplemental Table S1).
Importantly, correlation does not prove causation: it is pos-sible that each of these motifs contributes to TSS selection (seealso Discussion), or alternatively, have other functions. For in-stance, SP1 might regulate the level rather than the positioningof transcription, but binding to the �50/�30 region may befavorable for its interaction with the transcription machinery. Inaddition, the bound protein cannot always be identified withcertainty based solely on the DNA patterns; for example, SP1 sitescan be bound by both SP1 and SP3 proteins.
The Inr, SP1, gcg , and gcg echo motifs tend to co-occur witheach other more often than expected by chance (SupplementalTable S2), but the TATA box is neither positively nor negativelycorrelated with the other motifs. This is consistent with therebeing two major promoter architectures, TATA box versusCG-rich, which are sometimes superimposed (Carninci et al.2006).
Notably, we do not find any clear evidence of over-representation of the DPE, MTE, or BRE motifs discovered inDrosophila melanogaster, which all are reported to have positionalpreferences relative to the TSS (for review, see Smale and Ka-donaga 2003). This does not necessarily mean that these ele-ments are not ever used in human promoters, but they likelyhave a less prominent role than in D. melanogaster.
These findings confirm that certain known patterns at spe-cific distances can be predictive of TSS locations, but also indicatethat there might be uncharacterized patterns with similar func-
Figure 2. Properties of transcription initiation clusters. (A) Size distri-bution and numbers of subclusters. Clusters were binned according totheir size, and the number of clusters in each size bin is plotted as ahistogram. Within each size bin, the clusters are subdivided according tohow many subclusters they contain (not counting sub-sub-clusters, etc).(B) Percentage of CAGE tags contained in multiple layers of clusterswithin clusters. The fraction of tags contained within 0, 1, or more clus-ters is shown for varying cluster sizes (X-axis); when only small clusters areconsidered, most tags are isolated, but when large clusters are consid-ered, most tags lie in multiple layers of clusters. In both panels, only stableclusters (stability �2) are considered.
Figure 3. Overlap of transcription initiation clusters from different cell lines. (A) Overlap betweenclusters from skin fibroblasts (HBM library) and clusters from HepG2 cells (HBY library). (B) Overlapbetween clusters from skin fibroblasts (HBM library) and clusters from cerebrum (HAM library). If twoclusters overlap, the degree of overlap is measured as the number of nucleotides in the intersection ofthe clusters divided by the number of nucleotides in the union of the clusters. This value varies betweenone (perfect overlap) and zero (no overlap). Since we are dealing with nested hierarchies of clusters,it is not appropriate to compare every cluster from one cell line with all overlapping clusters in the othercell line. In each panel, the first mentioned library is designated as the “query,” and the second as the“reference.” For each query cluster, we wish to know whether there is a closely corresponding refer-ence cluster. Only robust query clusters are considered, i.e., those with stability �2. For each querycluster, we find the reference cluster with the highest degree of overlap, and report this value. If thereis no overlapping reference cluster, an overlap value of zero is reported. Cases with an intermediatedegree of overlap are often caused by single, outlying CAGE tags that shift the cluster boundary in onelibrary.
Frith et al.
4 Genome Researchwww.genome.org

tions present. Together, these patterns suggest the existence of ageneric DNA code for mammalian TSS selection.
Local DNA sequence accurately predicts selection of initiationsites
A good test of whether the local DNA code organizes transcrip-tion initiation at small scales is to see whether TSS usage withinsmall clusters can be predicted from the sequence. First, we tabu-lated all k-mer counts with a given distance from dominant TSSs,counted as above in the �50/+50 region. An example is shown inFigure 4A: the code is simply a table of characteristic oligonucleo-tide frequencies. From this, for a given word-length k, we built a
statistical model that will score any 100-nt-long sequence based on the wordsobserved at given positions in this se-quence; it essentially evaluates the like-lihood of this sequence, given the un-derlying word distribution, based on theknown TSSs. In statistical terms, this isan inhomogeneous Markov model(MM) of order k � 1 (Borodovsky andPeresetsky 1994). The use of Markovmodels in sequence analysis is reviewedin Durbin et al. (2001). Sequences con-taining k-mers that are similarly posi-tioned to those in the known TSS se-quences will, if evaluated by the MM,have a higher MM score than other se-quences; we will interpret this score (ex-pressed as a likelihood ratio; see Meth-ods) as the transcription initiation pro-pensity of the center nucleotide in thequery sequence. Thus, we can let thisMM slide in 1-nt increments over se-quences to predict the initiation pro-pensity of each nucleotide. To test ourmethod, we counted k-mers in the �50/+50 region around locally dominantTSSs from the whole genome, but ex-cluded those from chromosome 1. Clus-ters from chromosome 1 (defined by thecluster method described previously)were used for testing.
First, we investigated whethernucleotides with different observed ini-tiation usage within a cluster can be dis-tinguished by their MM score. The ini-tiation site usage of a nucleotide withina given cell sample can be measured bythe number of tags whose 5� ends mapto that nucleotide. Importantly, how-ever, CAGE is a sampling procedure(Carninci et al. 2006), and small differ-ences in tag counts between two nucleo-tides might arise due to chance. There-fore, we only compared the scores ofpairs of nucleotides within each clusterthat have significantly different num-bers of CAGE tags (one-sided binomialP � 0.01). If the MM score was higherfor the nucleotide that also had the
higher CAGE tag count, we counted the case as “positive,” oth-erwise “negative.” The accuracy is the percentage of positives ofall pairs tested. If the MM scores had no relation to the CAGE tagcount, we would expect an accuracy of 50% by chance.
As an example, a TSS cluster from the MFSD4 gene has 278pairs of nucleotides with significantly different tag counts; forevery such pair, the nucleotide with more tags also has a higherTSS propensity according to the second-order MM (100% accu-racy) (Fig. 5A,B). More generally, using the HepG2 data, the first-order MM makes correct predictions for 91% of nucleotide pairs,while second- and third-order MMs are marginally less accurate(Table 1). Since the �1/+1 dinucleotide seems especially impor-tant for TSS positioning (Carninci et al. 2006), we also tried a
Figure 4. A code for transcription initiation. (A) Dinucleotide frequencies at fixed distances fromdominant transcription start sites in HepG2 cells. Dinucleotide counts in the �3/+3 region around7734 transcription start sites are shown as a table. These frequencies are highly non-random; eachdinuceotide has a P-value describing its over-representation, where low P-values correspond to highover-representation. Dinucleotides are shaded by colors according to the P-value range they belong to,where red and blue represent the most and least significant categories, respectively (see legend at rightof table). In general, oligonucleotide frequencies in the �50/+50 region constitute a code for TSSselection. The most frequent motifs in this region are shown in B. (B) Over-represented k-mers at fixeddistances from dominant transcription start sites in HepG2 cells. This is a graphical representation of thesame type of data as in A, but extended to all over-represented DNA words (or k-mers) in the �50 to+50 region around dominant transcription start sites. Statistically over-represented k-mers are displayedat the positions where they occur relative to the dominant TSS, whose first transcribed nucleotide is at+1. As in A, k-mers are colored according to their over-representation P-value. From left to right, theword columns can be described as SP1-like (at –50/�37), TATA-box (�32/�25), Inr/Pyrimidine-Purine (�2/+3), gcg-motif (+12/+21), and gcg echo (+25/+32). Each column (motif) is sorted byP-values independently of the other columns; for instance, the words in the Inr column are all moresignificantly over-represented than those in the gcg column. See Supplemental Figure S2 with legendfor a more detailed description of each motif with corresponding statistics, sorted by overall P-value,and Supplemental Figures S3–S7 for corresponding figures using other cell lines from human andmouse.
A code for transcription initiation
Genome Research 5www.genome.org

first-order MM based only on the �1/+1 regions of the trainingsequences. This model achieves 78% accuracy, confirming theimportance of this dinucleotide, but also demonstrating a sub-stantial contribution from the wider flanking region (Table 1).
TSS selection within clusters can vary between cell types,indicating subtle differences in sequence determinants (Kawaji etal. 2006). We identified other CAGE libraries from different tis-sues/cell lines (Supplemental Table S3), each of which is a differ-ent experiment in which the RNA libraries originate from differ-ent laboratories. We repeated the above analysis on each library,which gave accuracies similar to that of the HepG2 data set (Table2; Supplemental Table S4). To test the universality of our model,we trained the MM on one CAGE library (using all chromosomesexcept chromosome 1), and evaluated it with CAGE clusters fromanother library (only using chromosome 1). Generally, trainingand evaluating using a single CAGE library gives higher accuracythan when training and evaluating with disparate libraries (Table2; Supplemental Table S4), but the difference is not large. Thisstrongly indicates that the model is applicable to different cellu-
lar contexts, and at the same time,shows that the initial results are unlikelyto be due to some specific features ofcertain RNA libraries.
We sought to validate the modelfurther, using TSS data from experimen-tal techniques other than CAGE. Sincewe predict relative initiation-site usageon a genome scale, any such data mustbe able to measure initiation-site usagewith nucleotide resolution in standard-ized experiments performed on a mas-sive scale, since results otherwise wouldbe anecdotal. This rules out low-throughput methods such as nucleaseprotection assays, which cannot give ex-pression quantification with single-nucleotide resolution (Carninci et al.2006), and are, as a rule, applied tosingle promoters in a given experiment.Given this, aside from the CAGE set, themost suitable data source is the oligo-capped expressed sequence tag (EST)datasets deposited in the DBTSS data-base (Yamashita et al. 2006), althougheven this is not ideal. The oligo-cappingmethod has two known sources of ex-pression bias: the RNA ligation step andthe PCR amplification of full-lengthcDNAs. In oligo-capping, an oligo-nucleotide is ligated to full-length, 5�-phosphorylated mRNAs (Suzuki et al.2001) with T4 RNA ligase. This enzymehas nucleotide preferences, so that some
RNA sequences are ligated 10-fold more efficiently than others(Ohtsuka et al. 1980; Harada and Orgel 1993), causing some RNAsequences to be under-represented in the full-length cDNA li-brary and others to be over-represented. An additional source ofbias is the PCR reaction that is commonly used to amplify oligo-capped cDNA before cloning and sequencing. PCR often reducescDNA diversity by amplifying some sequences more than others.For instance, when comparing two blastocyst full-length cDNAlibraries, one of which was prepared without PCR and the otherwith PCR amplification, the former identified a much largercDNA diversity than the latter (Carninci et al. 2003). In contrast,CAGE is prepared by cap-trapping, which is based on a chemicalreaction to add a biotin group to the cap-site that has no nucleo-tide bias (Kodzius et al. 2006). Additionally, in CAGE, all of the 5�
ends are chopped to 20–21-nt-long tags, and only subsequentlyamplified by PCR before proceeding to cloning and sequencing.Amplifying tags of the same length minimizes amplification bias(Shiraki et al. 2003; Kodzius et al. 2006). Despite these biases,when we evaluated TSS clusters in human chromosome 1 made
Table 1. Prediction of relative TSS propensity within HepG2 TSS clusters (HBY library)
ModelSequence rangeused in training
Accuracy (percent of 69,457 TSSpairs correctly distinguished)
Accuracy using between-clusters shuffling:(percent of TSS pairs correctly distinguished)
First-order �1/+1 77.90 74.7 (235,211/314,904)First-order �50/+50 90.61 82.1 (257,586/313,562)Second-order �50/+50 90.26 82.8 (264,069/318,843)Third-order �50/+50 85.82 82.3 (256,994/312,230)
Figure 5. Predicting TSS usage. (A) Observed TSS usage in a TSS cluster at the start of the MFSD4gene. The number of CAGE tags (from all libraries) initiating from each nucleotide is shown as a barplot. This is for comparison with the predicted initiation propensity in the next panel. (B) Predicted TSSpropensity of each nucleotide in the above TSS cluster. The transcription initiation propensity of eachnucleotide, calculated as a likelihood ratio predicted from the surrounding DNA sequence using asecond-order Markov model (see main text and Methods), is shown as a bar plot. Note the highcorrelation between predicted rates in this panel and the observed counts in A. (C) Classification ofnucleotides within TSS clusters as active or inactive. The receiver operating characteristic (ROC) curveplots sensitivity vs. specificity (see Methods) for classification methods. The area under the curve (AUC)statistic is shown within the plot for the different prediction methods. An AUC of 100% corresponds toideal performance, while a random classifier (shown as a dotted line) will have an AUC of 50%. We usethe prediction scores, as exemplified in B, to classify each nucleotide in a cluster as active or inactive,for the test clusters on chromosome 1. With no additional scaling of these scores, the predictive poweris adequate (gray line with boxes). Normalizing the nucleotide scores by the sum of prediction scoreswithin the cluster (black line with triangles) does not improve the prediction. However, after scaling theprediction scores by the overall expression level (number of observed CAGE tags) of the cluster (blackline), the AUC reaches an impressive 87%. Thus, knowing the expression output of a given promoterregion adds additional predictive power.
Frith et al.
6 Genome Researchwww.genome.org

from all oligo-capped ESTs, using a first-order model trained onall CAGE data from all other chromosomes, we achieve an accu-racy of 78% (Table 3), which is substantially higher than the 50%expected by chance. As with the CAGE data, using a model basedonly on the �1/+1 dinucleotide results in a ∼10% decrease inaccuracy (Table 3), showing that the DNA code does not reside inthe �1/+1 dinucleotide alone, but in the broader �50/+50 re-gion. Thus, the DBTSS data also support the DNA code, albeitwith more reservations than the CAGE data.
As our method can distinguish between TSS with signifi-cantly different CAGE tag counts, we sought to extend it to pre-dict the nucleotides that are experimentally detected TSSs withineach cluster with the current sequencing depth (see Methods fordetails). For a TSS cluster as in Figure 5A, we use the correspond-ing MM prediction scores (Fig. 5B) to classify a nucleotide as“active” or “inactive.” We rescaled the MM scores on eachnucleotide so that they sum up to the total number of tags withinthe cluster. Then, nucleotides with a rescaled score over a chosenthreshold were predicted as “active.” We evaluate this method byplotting sensitivity against 1 � specificity (Fig. 5C); this is a re-ceiver operating characteristic (ROC) curve, as reviewed inAkobeng (2007). The predictive power of a method can be judgedby the area under the ROC curve (the AUC value). Essentially, theAUC is expected to be 50% with a random classifier and 100%with a perfect classifier. Using the first-order MM, the AUC is87.1%, indicating high predictive performance.
Importantly, by rescaling the MM scores to the number ofCAGE tags, we are predicting whether a certain nucleotide withina cluster is active given the expression strength of the cluster (theobserved number of CAGE tags); since CAGE is a sampling pro-cedure, the number of detected TSSs should be dependent on thenumber of sampled tags. If the normalization based on expres-sion strength is not used, implicitly interpreting MM scores
equally in any genomic location, the perfor-mance is adequate but lower (Fig. 5C). Thus,the chance of observing a particular nucleo-tide as a TSS will be dependent on both thelocal DNA sequence and the expressionlevel of the cluster. In other words, the MMscores in themselves are describing TSS se-lection propensities and not absolute ex-pression rates.
These results suggest a model wherecoarse-grained regulatory processes (en-hancers, chromatin state, etc.) tune the ex-pression level of an entire TSS cluster, and acode defined by the local DNA sequence de-termines relative TSS selection within thecluster (Fig. 6). This model predicts thatDNA sequence alone should be less reliableat predicting relative TSS usage rates of
nucleotides that are taken from two different, non-overlappingclusters, compared with our study above, which comparesnucleotides from within the same cluster. This is because, accord-ing to our model, different distal elements will control the totalexpression output of the different clusters. We tested this by ran-domly shuffling the assignment of clusters to all of the nucleo-tides in the test set, and then re-running the initiation-site usagetest as described above (see Methods). As expected, we observedan overall decrease in prediction accuracy (Table 1).
Discussion
We have shown that, using relatively simple methods, TSS selec-tion can be predicted with high accuracy within local regions just
Table 2. Prediction of relative TSS propensity within clusters from different cell lines,using a first-order Markov model trained on �50/+50 nucleotides
Library used for trainingLibrary used for evaluation(only chromosome 1 TSSs)
Accuracy (% of TSSpairs correctly distinguished)
All human CAGE libraries All human CAGE libraries 87.87HBY HBY 90.61HBY HBM 88.56HBY HAM 89.80HBM HBM 87.89HBM HBY 88.33HBM HAM 88.83HAM HAM 91.33HAM HBY 88.88HAM HBM 88.91
Cases where the training and evaluation process use data from the same cell line or set are in bold.HBY is a HepG2 liver cell library, HBM a skin cell line library, and HAM a cerebrum library. Thedatasets are described in detail in Supplemental Table S1.
Table 3. Prediction of relative TSS propensity within DBTSS TSSclusters on chromosome 1 (all libraries), using a CAGE-definedMarkov model
ModelSequence rangeused in training
Accuracy (percent of 113,625 TSSpairs correctly distinguished)
First-order �1/+1 63.20First-order �50/+50 78.00Second-order �50/+50 78.62Third-order �50/+50 77.21
Figure 6. A general model for the organization of transcription initia-tion. The underlying propensity for initiation of transcription by the RNApolymerase II enzyme is governed solely by local DNA sequence. The roleof processes working distally (such as enhancers) or at larger scales is tostabilize the initiation process or regulate DNA accessibility. The globalfeatures can be viewed as a way to scale the underlying TSS selectiondistribution; these features can change due to context, while the localDNA code cannot. “Context” encompasses both distal DNA elements/chromatin state events and the state of the cell (e.g., which transcriptionfactors are present). The total expression output from a TSS cluster is aproduct of the local and global factors.
A code for transcription initiation
Genome Research 7www.genome.org

using DNA sequence. The model is based on the occurrence ofsequence motifs with a given spacing to the TSS, where the mostover-represented motifs have the greatest impact on TSS predic-tion. Three of the five most over-represented motifs are alreadyestablished as significant determinants of initiation-site usageand/or positioning in multiple studies (Smale and Kadonaga2003); this is particularly true for the TATA-box (see, for example,Kovacs and Butterworth 1986; O’Shea-Greenfield and Smale1992; Zhu et al. 1995). The importance of the Inr/PyPu motif hasbeen investigated in multiple studies (Grosschedl and Birnstiel1980; Tokunaga et al. 1984; Smale and Baltimore 1989). In aprevious study (Carninci et al. 2006), we have shown that natu-rally occurring mutations in PyPu motifs in orthologous mouse–human promoters changing them to PyPy, PuPu, or PuPy, onaverage, decrease initiation rates, which is entirely consistentwith this study. Likewise, the SP1 transcription factor has beenshown to bind in the �80 to �40 region and have an effect oninitiation-site selection (Blake et al. 1990; Smale et al. 1990). Allof these findings fit with our model. Elucidation of the role of thegcg repeats demands further experimental studies. At present,our study can only show that these motifs have a predictive ef-fect, not that they are biologically active. A detailed investigationof their biological effects is beyond the scope of this work: toshow that local DNA sequence can predict initiation rates.
A DNA code for transcription initiation fits with the previ-ously suggested (Sandelin et al. 2007) picture, where RNA Poly-merase II and associated factors scan accessible DNA, and initia-tion events are more likely to occur within sequence contextsthat fit the word distribution depicted in Figure 4B. With thismodel, every genomic nucleotide is a potential transcription startsite, although most are not used significantly.
Conversely, in this model, the total expression strength at alocus (equivalent to the number of initiation events) is deter-mined also by active enhancers, cofactors, and the accessibility ofDNA. The model suggests that that the primary function of distalelements is either to make DNA accessible for the transcriptionmachinery, or to stabilize the formation of the preinitiation com-plex; these elements will then have limited function in the localselection of nucleotides once DNA is accessible (Fig. 6). Thus,integration of local and distal effects will be necessary to simul-taneously model TSS selection and promoter expression.
The MM can be applied to any sequence that is indicated tobe accessible to the transcription apparatus: accessibility data canbe anything from acetylation status to immunoprecipitated com-ponents of the transcription-initiation complex. The correspond-ing MM scores will then be indicative of the relative initiation-site usage between the nucleotides that are assessed. However, asexplained above, the MM scores alone cannot predict the scale ofexpression, as the regulatory determinants reside elsewhere. Theexpression of a given locus must then be assessed by othermeans, which would be dependent on the method used to indi-cate accessibility.
While the MM may be practically used to pinpoint the exactstart sites from other technologies with lower resolution, such asChIP-chip with antibodies targeting parts of the preinitiationcomplex, we consider the main utility of our method to be on theconceptual level; as we can predict the relative initiation siteusage by just using local DNA sequence, it seems likely that themajority of the determinants for this process reside there.
An important caveat with our model is that it is bounded bythe quality and depth of available experimental data; it requiresmassive sequencing of transcription start sites to be trained and
evaluated, and these data sets are just becoming available to thefield. Therefore, the current model should be viewed as a firsttrial to capture the main determinants in a DNA code for initia-tion, which has room for improvement both by experimentaland computational means.
A DNA code for transcription initiation has important bio-medical implications; it may be possible to identify polymor-phisms that create or destroy strong transcription-initiation sites,and the code may help us understand how transcription start-siteusage has evolved between species.
The key difference in our approach compared with earliercomputational efforts to annotate TSSs lies in the changed viewof core promoters made possible by high-throughput TSS se-quencing data (Carninci et al. 2006). Smaller-scale studies (Su-zuki et al. 2001; Smale and Kadonaga 2003) have shown thesebroad types of TSS architectures for single genes, but these ex-amples were not generalized as principles applying to the rest ofthe genome. Thus, most efforts to annotate and predict core pro-moter locations have been targeted to identify a single TSS or theregion around it, often defined by RefSeq cDNAs, modeled assparsely distributed on-off switches (Ohler et al. 2000; Scherf etal. 2000; Davuluri et al. 2001; Down and Hubbard 2002; Werner2003; Bajic et al. 2004, 2006; Gangal and Sharma 2005; Solovyevet al. 2006; Zhao et al. 2007) in otherwise presumed transcrip-tionally silent DNA. In contrast, our model considers multipleinitiation sites and their relative usage, and distinguishes TSSselection propensity from absolute expression levels. Overall, thetarget of our analysis is conceptually different; given a knownactive promoter region and its expression strength, we assess theTSS propensity of each nucleotide within the region.
Together with recent studies showing that nucleosome po-sitioning is predictable (Segal et al. 2006) and that TSSs can beinferred by chromatin signatures (Heintzman et al. 2007), ourresults suggest that an accurate model for genome-wide tran-scription-initiation events with nucleotide resolution is a realisticnear-term goal instead of a distant aspiration.
Methods
Data sourcesCAGE tags are 20–21 bp 5� ends of full-length cDNAs that havebeen mapped to the corresponding (mouse or human) genomesequence. Protocols for CAGE were described by Kodzius et al.(2006). We used the human CAGE data mapped to the hg17genome assembly as described in Carninci et al. (2006) for themajority of analyses—for Supplemental Figures S4–S7, mouseCAGE data from the same study mapped to the mm5 assemblywas used. For clarity, aside from the alignment cut-offs describedin Carninci et al. (2006), each CAGE tag must have a uniquebest-scoring mapping; each CAGE tag only maps to one singlegenomic location. We only used the 5�-end position of tags for allthe analyses. Properties of the datasets are described withinSupplemental Tables S1 and S3. An assessment of the reliabilityof the CAGE technology, using six lines of evidence, is describedin detail in the Supplementary material of Carninci et al. (2006).
Defining locally dominant TSSTo learn the sequence features associated with high rates of ini-tiation, we took locally dominant transcription start sites, i.e.,nucleotides with at least five transcription initiation events inthe CAGE data, and more events than any other nucleotide at adistance of �100 nt upstream or downstream. The two DNA
Frith et al.
8 Genome Researchwww.genome.org

strands (or directions of transcription) were considered sepa-rately. The number of cases retrieved is dependent on what li-brary or libraries are used (see Supplemental Tables S1, S2). Domi-nant TSSs retrieved this way were used for both analyzing k-meroccurrences, and later to train the Markov model (in the lattercase all TSS from chromosome 1 were removed, to allow for anindependent test set).
Parametric clustering algorithmThe aim is to identify clusters, at multiple scales, among tran-scription initiation events observed at specific locations in thegenome. The input data for our analysis is mappings of CAGEtags to unique sites in the genome as described above (Carninciet al. 2006), where each such defined TSS also is labeled withstrand and the number of 5� edges of CAGE tags mapped to it.Clusters among these datapoints are identified as follows: Clus-ters are defined to be maximal scoring segments of a chromo-some, where the score is given by this formula: Score = (numberof events in segment) � d � (segment size in nt).
Events on each strand of the chromosome were consideredseparately (as if each strand were a separate chromosome).Roughly speaking, clusters are maximal segments with a densityof more than d events per nucleotide. More precisely, clusters aremaximal segments where every prefix and suffix of the segmenthas a density of more than d events per nucleotide. (Otherwise,the segment would not be maximal scoring, because its scorecould be increased by removing the prefix or suffix.)
Maximal scoring segments are widely used to identify se-quence features such as hydrophobic tracts in proteins and CpGislands in DNA, and they underlie sequence comparison algo-rithms such as BLAST (Karlin and Altschul 1990; Taylor et al.2006). The definition of maximal scoring segments is discussedin Ruzzo and Tompa (1999). We use the same definition of maxi-mal scoring segments as Ruzzo and Tompa (1999); in particular,ties are broken by disallowing zero-scoring prefixes or suffixes.
Our segment-scoring scheme can be interpreted as a log like-lihood ratio. The simplest statistical model of a cluster is forevents to occur randomly and uniformly in the cluster with av-erage density p per nucleotide, and the simplest null model is forevents to occur randomly and uniformly with average density qper nucleotide (where q < p) (a Poisson process). Then, the loglikelihood ratio of observing n events in a segment of size s is:
log[(exp(�ps) � (ps)n/n!)/(exp(�qs) � (qs)n/n!)] =log(p/q) � n � (p � q) � s
This formula is equivalent to our segment-scoring scheme,with d = (p � q)/log(p/q). Multiplying the score by a fixed num-ber such as log(p/q) does not change the maximal-scoring seg-ments.
Clusters at different scales are found by varying the d pa-rameter; large values of d produce small, dense clusters and smallvalues of d produce large, loose clusters. The following algorithmfinds all clusters for all values of d.
The algorithm begins at the largest scale, where d = 0, and allof the events are merged into one big cluster. It then calculatesthe density (events per nucleotide) of every prefix and suffix ofthe big cluster. The lowest value among all of these densities isthe critical value of d, at which the big cluster ceases to be amaximal-scoring segment (because zero-scoring prefixes or suf-fixes are not allowed). This is the maximum d for the big cluster,and the minimum d for its subclusters. Furthermore, the corre-sponding prefix (or suffix) defines a breakpoint; at higher valuesof d, every maximal scoring segment must be either completelyinside or completely outside of the prefix (or suffix).
To prove this, first assume, without loss of generality, thatwe are dealing with a prefix. At the critical value of d, every suffixof this prefix must have non-positive score; otherwise, an evenlower density prefix could be obtained by removing this suffix. Athigher values of d, the score of any segment can only decrease.Thus, at higher values of d there cannot be a maximal scoringsegment that begins in the prefix and ends outside of it.
Given this breakpoint, we proceed by divide and conquer.The large cluster is broken into two parts: the lowest-densityprefix (or suffix), and the remainder of the cluster. If severalprefixes and/or suffixes are tied for the lowest density, one ischosen arbitrarily; the end result will be the same. Finally, thealgorithm is reapplied recursively to each of the two parts. Whenapplying the algorithm to each part, it is possible for its maxi-mum d, i.e., the lowest density of any prefix or suffix, to be lessthan or equal to its minimum d (i.e., the maximum d of theparent cluster). In this case, there is no value of d at which thepart is a maximal-scoring segment, and so the algorithm does notreport any cluster, but the breaking-in-two and recursion proceedas normal.
This procedure returns all possible maximal scoring seg-ments and also annotates each segment with the minimum andmaximum values of d where it is maximal scoring. If a particularsegment is maximal scoring over a large range of values for d, itis intuitively a “stable” cluster. Thus, the stability of each clusteris defined as max d/min d.
A Perl script implementing this algorithm is available at thesupporting website. The average complexity is O(N logN), and theworst case O(N2), where N is the number of experimentally de-fined TSSs. In practice, it takes a few minutes on a standard desk-top workstation to cluster the human genome-wide FANTOM3CAGE data (Carninci et al. 2006). We call it “parametric” clus-tering based on an analogy with parametric alignment describedin Waterman et al. (1992).
Finding over-represented k-mers at specific positionsFor locally dominant TSS (see above), we counted all k-mers(k = 1–6) at each position from �100 to +100 on the same strandas the TSS. For a given k-mer and position, we tabulated thenumber of occurrences S, and calculated the likelihood of finding�S words at a given position based on the frequency of this k-merin all positions (a Binomial test) in the range. P-values obtainedwere corrected for multiple testing bias by the Bonferronimethod. Specifically, P-values were multiplied by 4k times thenumber of positions.
Position-specific Markov modelsThe aim is to predict the preponderance of transcription-initiation events at a given nucleotide, based on the DNA se-quence surrounding the nucleotide. For locally dominant TSS(see above) we obtained the 100-nt genomic sequence beginning50 nt upstream and ending 49 nt downstream (i.e., the �50 to+50 region relative to the transcription start site at +1). To allowfor test cases independent of the training data, sequences fromchromosome 1 were discarded at this point.
To obtain position-specific Markov models (MMs), alsoknown as inhomogenous Markov models (Borodovsky and Pere-setsky 1994), we simply counted the frequency of every k-mer(where k = 2, 3, or 4) at each position in the training sequences.This directly defines a MM of order k � 1. A MM of order nspecifies the probability of observing a given symbol, given the npreceding symbols (in our cases, nucleotides). This is equal to theprobability of the (n+1)-mer ending at the given nucleotide di-vided by the probability of the preceding n-mer; thus, all of these
A code for transcription initiation
Genome Research 9www.genome.org

probabilities can be estimated from the position-specific k-merfrequencies above. Pseudocounts were not used, since there wereno k-mers in the evaluation sets that did not occur in the trainingset when k = 2 or 3, and only a few cases when k = 4.
We also experimented with variable-order MMs, which uselonger k-mers, when those k-mers are sufficiently common to getreliable frequencies, and shorter k-mers otherwise. Surprisingly,this did not lead to an improvement in prediction accuracy (datanot shown).
Scoring sequences with Markov modelsThe position-specific Markov models were used to make predic-tions as follows. A window of size 100 nt was slid across the testsequence in 1-nt increments. The following likelihood ratio wascalculated for each window: Prob(window|promoter model)/Prob(window|null model). The “promoter model” is the posi-tion-specific Markov model described above. The null model is astandard homogeneous Markov model (i.e., not position spe-cific), derived from the promoter model by summing the countsof each k-mer over all positions. This likelihood ratio predicts theinitiation rate at the 51st nucleotide in the window. Thus, inorder to scan the whole test sequence, flanking genomic se-quence of 50 nt upstream and 49 nt downstream was added first.
As a special case, a first-order Markov model was constructedjust from the �1/+1 regions of the training sequences. Thismodel only has one position, so the null model described abovewould be identical to the promoter model. So, in this case only,a null model of uniform k-mer frequencies was used.
Predicting TSS usage using Markov modelsPredictions were made within small, stable clusters of transcrip-tion-initiation events on chromosome 1. Specifically, clusterswider than 100 bp, or with stability <2, were not considered. Ofthe remaining clusters, the outermost ones were used (i.e., if astable cluster �100 bp lay within another stable cluster �100 bp,predictions were made for every nucleotide in the outer one).Note that the numbers for training and evaluation will vary de-pending on what CAGE libraries are used (see SupplementalTable S3).
The initiation rate predictions were interpreted in two ways:qualitative and binary. In the qualitative interpretation, ifnucleotide X has a higher likelihood ratio value than nucleotideY, then it is predicted to have a higher rate of transcription ini-tiation. In the binary interpretation, we ask whether a givennucleotide within a cluster is used as a TSS, given the total ex-pression level of the cluster (the sum of all observed tags withinthe cluster; for details, see below). To be clear, for all tests, theMM was applied to each nucleotide covered by the cluster, re-gardless of observed CAGE tag counts. Thus, each nucleotide willobtain a MM score.
Predicting relative initiation site usage within clusters(qualitative interpretation)For a given TSS cluster, we assessed all pairs of nucleotides in thecluster that have significantly different tag counts, assuming anull model where tags at both nucleotides are equally likely. Notethat such pairs can include nucleotides with 0 tags. Significancewas determined using the one-sided Binomial test with an alphavalue of �0.01. For each significant pair identified this way, wenoted whether the nucleotide with the larger number of CAGEtags also had a higher MM score. These cases were defined ascorrect predictions, while any other cases were defined as incor-rect. The accuracy reported is the overall number of correct pre-
dictions divided by all significant pairs tested in all clusters (asdefined above) on chromosome 1.
Randomization (shuffling) testOne of our hypotheses in this work is that the total expressionlevel of a TSS cluster (expressed as the total number of CAGE tagswithin the cluster) will be determined partially by events and/orelements outside of the cluster. If this is true, repeating the aboveanalysis where nucleotide pairs are taken from different clustersshould decrease performance, since the expression level of thetwo clusters will have different regulatory inputs. To test this, werandomly shuffled the assignments of cluster names to nucleo-tides in the test set. This results in a new, equally large cluster setwith the same cluster widths as previously, but where the CAGEtag counts in each position in the clusters are randomly sampledfrom the original cluster set without replacement. We then ap-plied the relative initiation site usage prediction test as describedabove for each newly defined cluster. An alternative strategy,exhaustive testing of all nucleotide pairs between all originalclusters, is computationally intractable.
Classification of active TSS within a cluster (binary interpretation)Each TSS cluster can be defined as a vector K with the samelength as the cluster, in which Ki denotes the number of CAGEtags (�0) at nucleotide i. Sliding the Markov model over thecluster will produce a vector T with the same length as K, whereTi is the likelihood ratio score of nucleotide i in the cluster. Wenormalized T to sum to 1, and then multiplied each element bythe sum of K (in other words, we rescale T to the number of CAGEtags in the cluster). If a Ti � a chosen cut-off c, the nucleotide i islabeled “active.” Note that this is different from just transform-ing the vector T to 1 (a probability distribution), as the sum of Kwill be different in different clusters, while the cut-off c is static.Using T as either a probability vector summing to 1 or the rawlikelihood ratio scores as predictors gives adequate, but decreasedpredictive performance (see Fig. 5C).
True positives (TP) are defined as Ki > 0 and Ti � c (where cis an arbitrary cutoff), while true negatives (TN) are defined asKi = 0 and Ti < c. Increases in c will result in higher specificity,[TN/(TN+FP)] but lower sensitivity [TP/(TP+FN)]. The trade-offbetween specificity and sensitivity (a ROC) is shown in Figure 5C.The area under the ROC curve (area under curve [AUC]) can beinterpreted as the predictive performance, where an area of 1corresponds to perfect performance. AUC values were calculatedusing the trapz() function in the caTools R package (Ihaka andGentleman 1996).
Evaluation of TSS predictions using oligo-capped ESTsA collection of 1,562,911 oligo-capped ESTs mapped to the hg17assembly were downloaded from the DBTSS (Suzuki et al. 2004)website. We treated these equivalently to CAGE tags; only the 5�
end nucleotide was assessed. We pooled all available EST librar-ies, and (as in the CAGE trial) assessed the expression of a singlenucleotide by the number of exact 5� ends that were mapped tothis nucleotide. The parametric clustering algorithm was appliedto this set; for our evaluations, we extracted clusters with a sta-bility �2 from chromosome 1. We then used the MM trained byall CAGE tags from the other chromosomes to assess the oligo-capped-derived clusters.
AcknowledgmentsWe thank Tim Bailey, Christine Wells, Erik van Nimwegen, andOle Winther for useful comments on our methods; Jasmina Pon-
Frith et al.
10 Genome Researchwww.genome.org

javic for help with images; and Ulla Hansen, Ann Karlsson, TroelsMarstrand, Hui Gao, Charles Plessy, Valtteri Wirta, and ChrisFrith for advice on the manuscript. This study was supported bya Research Grant for the RIKEN Genome Exploration ResearchProject from the Ministry of Education, Culture, Sports, Scienceand Technology of the Japanese Government to Y.H.; a grant ofthe Genome Network Project from the Ministry of Education,Culture, Sports, Science, and Technology, Japan; the StrategicPrograms for R&D of RIKEN Grant for the RIKEN Frontier Re-search System, Functional RNA research program. A.S, E.V., andA.K are supported by a grant from the Novo Nordisk Foundationto the Bioinformatics Centre. M.C.F. was a University of Queens-land Postdoctoral Fellow.
Note added in proofA recent publication (Xi et al. 2007) reported a novel core pro-moter motif, “motif8,” which matches the gcg repeat motifreported in the present study, in terms of both sequence andposition relative to TSS.
References
Akobeng, A.K. 2007. Understanding diagnostic tests 3: Receiveroperating characteristic curves. Acta Paediatr. 96: 644–647.
Bajic, V.B., Tan, S.L., Suzuki, Y., and Sugano, S. 2004. Promoterprediction analysis on the whole human genome. Nat. Biotechnol.22: 1467–1473.
Bajic, V.B., Brent, M.R., Brown, R.H., Frankish, A., Harrow, J., Ohler, U.,Solovyev, V.V., and Tan, S.L. 2006. Performance assessment ofpromoter predictions on ENCODE regions in the EGASP experiment.Genome Biol. 7: S1–S3. doi: 10.1186/gb-2006-7-S1-S3.
Barrera, L.O. and Ren, B. 2006. The transcriptional regulatory code ofeukaryotic cells - insights from genome-wide analysis of chromatinorganization and transcription factor binding. Curr. Opin. Cell Biol.18: 291–298.
Blake, M.C., Jambou, R.C., Swick, A.G., Kahn, J.W., and Azizkhan, J.C.1990. Transcriptional initiation is controlled by upstream GC-boxinteractions in a TATAA-less promoter. Mol. Cell. Biol.10: 6632–6641.
Borodovsky, M. and Peresetsky, A. 1994. Deriving non-homogeneousDNA Markov chain models by cluster analysis algorithm minimizingmultiple alignment entropy. Comput. Chem. 18: 259–267.
Carninci, P., Waki, K., Shiraki, T., Konno, H., Shibata, K., Itoh, M.,Aizawa, K., Arakawa, T., Ishii, Y., Sasaki, D., et al. 2003. Targeting acomplex transcriptome: The construction of the mouse full-lengthcDNA encyclopedia. Genome Res. 13: 1273–1289.
Carninci, P., Kasukawa, T., Katayama, S., Gough, J., Frith, M.C., Maeda,N., Oyama, R., Ravasi, T., Lenhard, B., Wells, C., et al. 2005. Thetranscriptional landscape of the mammalian genome. Science309: 1559–1563.
Carninci, P., Sandelin, A., Lenhard, B., Katayama, S., Shimokawa, K.,Ponjavic, J., Semple, C.A., Taylor, M.S., Engstrom, P.G., Frith, M.C.,et al. 2006. Genome-wide analysis of mammalian promoterarchitecture and evolution. Nat. Genet. 38: 626–635.
Cooper, S.J., Trinklein, N.D., Anton, E.D., Nguyen, L., and Myers, R.M.2006. Comprehensive analysis of transcriptional promoter structureand function in 1% of the human genome. Genome Res. 16: 1–10.
Davuluri, R.V., Grosse, I., and Zhang, M.Q. 2001. Computationalidentification of promoters and first exons in the human genome.Nat. Genet. 29: 412–417.
Down, T.A. and Hubbard, T.J. 2002. Computational detection andlocation of transcription start sites in mammalian genomic DNA.Genome Res. 12: 458–461.
Durbin, R., Eddy, S.R., Krogh, A., and Mitchison, G. 2001. Biologicalsequence analysis. Cambridge University Press, Cambridge, UK.
The ENCODE Project Consortium. 2007. Identification and analysis offunctional elements in 1% of the human genome by the ENCODEpilot project. Nature 447: 799–816.
Gangal, R. and Sharma, P. 2005. Human pol II promoter prediction:Time series descriptors and machine learning. Nucleic Acids Res.33: 1332–1336. doi: 10.1093/nar/gki271.
Gershenzon, N.I. and Ioshikhes, I.P. 2005. Synergy of human Pol II corepromoter elements revealed by statistical sequence analysis.
Bioinformatics 21: 1295–1300.Grosschedl, R. and Birnstiel, M.L. 1980. Identification of regulatory
sequences in the prelude sequences of an H2A histone gene by thestudy of specific deletion mutants in vivo. Proc. Natl. Acad. Sci.77: 1432–1436.
Hampsey, M. 1998. Molecular genetics of the RNA polymerase II generaltranscriptional machinery. Microbiol. Mol. Biol. Rev. 62: 465–503.
Harada, K. and Orgel, L.E. 1993. In vitro selection of optimal DNAsubstrates for T4 RNA ligase. Proc. Natl. Acad. Sci. 90: 1576–1579.
Heintzman, N.D., Stuart, R.K., Hon, G., Fu, Y., Ching, C.W., Hawkins,R.D., Barrera, L.O., Van Calcar, S., Qu, C., Ching, K.A., et al. 2007.Distinct and predictive chromatin signatures of transcriptionalpromoters and enhancers in the human genome. Nat. Genet.39: 311–318.
Ihaka, R. and Gentleman, R. 1996. R: A language for data analysis andgraphics. J. Comput. Graph. Statist. 5: 299–314.
Karlin, S. and Altschul, S.F. 1990. Methods for assessing the statisticalsignificance of molecular sequence features by using general scoringschemes. Proc. Natl. Acad. Sci. 87: 2264–2268.
Karolchik, D., Baertsch, R., Diekhans, M., Furey, T., Hinrichs, A., Lu, Y.,Roskin, K., Schwartz, M., Sugnet, C., Thomas, D., et al. 2003. TheUCSC Genome Browser Database. Nucleic Acids Res. 31: 51–54.
Kawaji, H., Frith, M.C., Katayama, S., Sandelin, A., Kai, C., Kawai, J.,Carninci, P., and Hayashizaki, Y. 2006. Dynamic usage oftranscription start sites within core promoters. Genome Biol. 7: R118.doi: 10.1186/gb-2006-7-12-r118.
Kent, W.J., Sugnet, C.W., Furey, T.S., Roskin, K.M., Pringle, T.H., Zahler,A.M., and Haussler, D. 2002. The human genome browser at UCSC.Genome Res. 12: 996–1006.
Kimura, K., Wakamatsu, A., Suzuki, Y., Ota, T., Nishikawa, T.,Yamashita, R., Yamamoto, J., Sekine, M., Tsuritani, K., Wakaguri, H.,et al. 2006. Diversification of transcriptional modulation: Large-scaleidentification and characterization of putative alternative promotersof human genes. Genome Res. 16: 55–65.
Kodzius, R., Kojima, M., Nishiyori, H., Nakamura, M., Fukuda, S.,Tagami, M., Sasaki, D., Imamura, K., Kai, C., Harbers, M., et al. 2006.CAGE: Cap analysis of gene expression. Nat. Methods 3: 211–222.
Kovacs, B.J. and Butterworth, P.H. 1986. The effect of changing thedistance between the TATA-box and cap site by up to three basepairs on the selection of the transcriptional start site of a clonedeukaryotic gene in vitro and in vivo. Nucleic Acids Res.14: 2429–2442.
Mellor, J. 2006. Dynamic nucleosomes and gene transcription. TrendsGenet. 22: 320–329.
Mito, Y., Henikoff, J.G., and Henikoff, S. 2005. Genome-scale profilingof histone H3.3 replacement patterns. Nat. Genet. 37: 1090–1097.
Molina, C. and Grotewold, E. 2005. Genome wide analysis of Arabidopsiscore promoters. BMC Genomics 6: 25.
Muller, F., Demeny, M.A., and Tora, L. 2007. New problems in RNApolymerase II transcription initiation: Matching the diversity of corepromoters with a variety of promoter recognition factors. J. Biol.Chem. 282: 14685–14689.
Nishida, H., Suzuki, T., Kondo, S., Miura, H., Fujimura, Y., andHayashizaki, Y. 2006. Histone H3 acetylated at lysine 9 in promoteris associated with low nucleosome density in the vicinity oftranscription start site in human cell. Chromosome Res. 14: 203–211.
Ohler, U., Stemmer, G., Harbeck, S., and Niemann, H. 2000. Stochasticsegment models of eukaryotic promoter regions. Pac. Symp.Biocomput. 5: 377–388.
Ohler, U., Liao, G.C., Niemann, H., and Rubin, G.M. 2002.Computational analysis of core promoters in the Drosophila genome.Genome Biol. 3: RESEARCH0087. doi:10.1186/gb-2002-3-12-research0087.
Ohtsuka, E., Doi, T., Uemura, H., Taniyama, Y., and Ikehara, M. 1980.Comparison of substrate base sequences for RNA ligase reactions inthe synthesis of a tetradecanucleotide corresponding to bases 21-34of E. coli tRNAfMet 1. Nucleic Acids Res. 8: 3909–3916.
O’Shea-Greenfield, A. and Smale, S.T. 1992. Roles of TATA and initiatorelements in determining the start site location and direction of RNApolymerase II transcription. J. Biol. Chem. 267: 1391–1402.
Ponjavic, J., Lenhard, B., Kai, C., Kawai, J., Carninci, P., Hayashizaki, Y.,and Sandelin, A. 2006. Transcriptional and structural impact ofTATA-initiation site spacing in mammalian core promoters. GenomeBiol. 7: R78. doi: 10.1186/gb-2006-7-8-r78.
Ruzzo, W.L. and Tompa, M. 1999. A linear time algorithm for findingall maximal scoring subsequences. In The Seventh InternationalConference on Intelligent Systems for Molecular Biology, pp. 234–241.The AAAI Press, Menlo Park, CA.
Sandelin, A., Carninci, P., Lenhard, B., Ponjavic, J., Hayashizaki, Y., andHume, D.A. 2007. Mammalian RNA polymerase II core promoters:Insights from genome-wide studies. Nat. Rev. Genet. 8: 424–436.
A code for transcription initiation
Genome Research 11www.genome.org

Scherf, M., Klingenhoff, A., and Werner, T. 2000. Highly specificlocalization of promoter regions in large genomic sequences byPromoterInspector: A novel context analysis approach. J. Mol. Biol.297: 599–606.
Segal, E., Fondufe-Mittendorf, Y., Chen, L., Thastrom, A., Field, Y.,Moore, I.K., Wang, J.P., and Widom, J. 2006. A genomic code fornucleosome positioning. Nature 442: 772–778.
Shiraki, T., Kondo, S., Katayama, S., Waki, K., Kasukawa, T., Kawaji, H.,Kodzius, R., Watahiki, A., Nakamura, M., Arakawa, T., et al. 2003.Cap analysis gene expression for high-throughput analysis oftranscriptional starting point and identification of promoter usage.Proc. Natl. Acad. Sci. 100: 15776–15781.
Smale, S.T. and Baltimore, D. 1989. The “initiator” as a transcriptioncontrol element. Cell 57: 103–113.
Smale, S.T. and Kadonaga, J.T. 2003. The RNA polymerase II corepromoter. Annu. Rev. Biochem. 72: 449–479.
Smale, S.T., Schmidt, M.C., Berk, A.J., and Baltimore, D. 1990.Transcriptional activation by Sp1 as directed through TATA orinitiator: Specific requirement for mammalian transcription factorIID. Proc. Natl. Acad. Sci. 87: 4509–4513.
Solovyev, V., Kosarev, P., Seledsov, I., and Vorobyev, D. 2006.Automatic annotation of eukaryotic genes, pseudogenes andpromoters. Genome Biol. 7: S1–S10. doi: 10.1186/gb-2006-7-S1-S10.
Suzuki, Y., Taira, H., Tsunoda, T., Mizushima-Sugano, J., Sese, J., Hata,H., Ota, T., Isogai, T., Tanaka, T., Morishita, S., et al. 2001. Diversetranscriptional initiation revealed by fine, large-scale mapping ofmRNA start sites. EMBO Rep. 2: 388–393.
Suzuki, Y., Yamashita, R., Sugano, S., and Nakai, K. 2004. DBTSS,DataBase of Transcriptional Start Sites: Progress report 2004. NucleicAcids Res. 32: D78–D81. doi: 10.1093/nar/gkh076.
Taylor, T.D., Noguchi, H., Totoki, Y., Toyoda, A., Kuroki, Y., Dewar, K.,
Lloyd, C., Itoh, T., Takeda, T., Kim, D.W., et al. 2006. Humanchromosome 11 DNA sequence and analysis including novel geneidentification. Nature 440: 497–500.
Thomas, M.C. and Chiang, C.M. 2006. The general transcriptionmachinery and general cofactors. Crit. Rev. Biochem. Mol. Biol.41: 105–178.
Tokunaga, K., Hirose, S., and Suzuki, Y. 1984. In monkey COS cells onlythe TATA box and the cap site region are required for faithful andefficient initiation of the fibroin gene transcription. Nucleic AcidsRes. 12: 1543–1558.
Waterman, M.S., Eggert, M., and Lander, E. 1992. Parametric sequencecomparisons. Proc. Natl. Acad. Sci. 89: 6090–6093.
Werner, T. 2003. The state of the art of mammalian promoterrecognition. Brief. Bioinform. 4: 22–30.
Xi, H., Yu, Y., Fu, Y., Foley, J., Halees, A., and Weng, Z. 2007. Analysisof overrepresented motifs in human core promoters reveals dualregulatory roles of YY1. Genome Res. 17: 798–806.
Yamashita, R., Suzuki, Y., Wakaguri, H., Tsuritani, K., Nakai, K., andSugano, S. 2006. DBTSS: DataBase of Human Transcription StartSites, progress report 2006. Nucleic Acids Res. 34: D86–D89. doi:10.1093/nar/gkj129.
Zhao, X., Xuan, Z., and Zhang, M.Q. 2007. Boosting with stumps forpredicting transcription start sites. Genome Biol. 8: R17. doi:10.1186/gb-2007-8-2-r17.
Zhu, Q., Dabi, T., and Lamb, C. 1995. TATA box and initiator functionsin the accurate transcription of a plant minimal promoter in vitro.Plant Cell 7: 1681–1689.
Received January 21, 2007; accepted in revised form October 14, 2007.
Frith et al.
12 Genome Researchwww.genome.org