Initiation of coverage - Fuller Treacy Money
329
9 October 2017 Oil Services & Equipment Initiation of coverage Industrials Oil Services & Equipment Initiation of Coverage North America Canada United States Industry Initiation of coverage Date 9 October 2017 Deutsche Bank Markets Research Not Business as Usual We are initiating coverage of the Oilfield Service and Equipment sector, and in a break from our longstanding negative view, we have no Sell rated stocks and have nine Buy recommendations. Our top picks are PTEN, HAL and CJ . We are also initiating with Buy recommendations on SLB, CLB, RIG, WFT, SPN and SND. We are encouraged by the judicious selloff in the stocks year-to-date, and by what also appears to be a market that is acknowledging the obsolescence of the old cyclical playbook. Earnings revisions that had initially taken an impractical leap higher in 2H16 have been revised down considerably, providing a significantly better setup for the stocks. David Havens Research Analyst +1-212-250-3235 Jason Bandel Associate Analyst +1-212-250-1577 Chris Snyder Research Associate +1-212-250-0165 Matt Taylor Research Associate +1-212-250-1758 Deutsche Bank Securities Inc. Deutsche Bank does and seeks to do business with companies covered in its research reports. Thus, investors should be aware that the firm may have a conflict of interest that could affect the objectivity of this report. Investors should consider this report as only a single factor in making their investment decision. DISCLOSURES AND ANALYST CERTIFICATIONS ARE LOCATED IN APPENDIX 1. MCI (P) 083/04/2017. Distributed on: 09/10/2017 20:00:40 GMT 0bed7b6cf11c
-
Upload
khangminh22 -
Category
Documents
-
view
0 -
download
0
Transcript of Initiation of coverage - Fuller Treacy Money

9 October 2017
Oil Services & Equipment
Initiation of coverage
IndustrialsOil Services & Equipment
Initiation of Coverage
North AmericaCanadaUnited States
Industry
Initiation ofcoverage
Date9 October 2017
Deutsche BankMarkets Research
Not Business as Usual
We are initiating coverage of the Oilfield Service and Equipment sector, and in abreak from our longstanding negative view, we have no Sell rated stocks and havenine Buy recommendations. Our top picks are PTEN, HAL and CJ . We are alsoinitiating with Buy recommendations on SLB, CLB, RIG, WFT, SPN and SND. Weare encouraged by the judicious selloff in the stocks year-to-date, and by whatalso appears to be a market that is acknowledging the obsolescence of the oldcyclical playbook. Earnings revisions that had initially taken an impractical leaphigher in 2H16 have been revised down considerably, providing a significantlybetter setup for the stocks.
David Havens
Research Analyst
+1-212-250-3235
Jason Bandel
Associate Analyst
+1-212-250-1577
Chris Snyder
Research Associate
+1-212-250-0165
Matt Taylor
Research Associate
+1-212-250-1758
Deutsche Bank Securities Inc.
Deutsche Bank does and seeks to do business with companies covered in its research reports. Thus, investors should beaware that the firm may have a conflict of interest that could affect the objectivity of this report. Investors should considerthis report as only a single factor in making their investment decision. DISCLOSURES AND ANALYST CERTIFICATIONSARE LOCATED IN APPENDIX 1. MCI (P) 083/04/2017.
Distributed on: 09/10/2017 20:00:40 GMT
0bed7b6cf11c


9 October 2017
Oil Services & Equipment
Initiation of coverage
IndustrialsOil Services & Equipment
Initiation of Coverage
North AmericaCanadaUnited States
Industry
Initiation ofcoverage
Date9 October 2017
Deutsche BankMarkets Research
Not Business as Usual
Initiation of coverageWe are initiating coverage of the Oilfield Service and Equipment sector, and in abreak from our longstanding negative view, we have no Sell rated stocks and havenine Buy and 15 Hold recommendations. Our top picks are Patterson-UTI (PTEN),Halliburton (HAL) and C&J Energy Services (CJ) . We are also initiating with Buyrecommendations on Schlumberger (SLB), Core Laboratories (CLB), Transocean(RIG), Weatherford (WFT), Superior Energy Services (SPN) and Smart Sand (SND).We are encouraged by the judicious selloff in the stocks year-to-date, and by whatalso appears to be a market that is acknowledging the obsolescence of the oldcyclical playbook. Earnings revisions that had initially taken an impractical leaphigher in 2H16 have been revised down considerably, providing a significantlybetter setup for the stocks.
Not business as usual for the oilfield services industryThis is an industry that is still in transition, and these are companies that still needto navigate this transition. The commercial development of tight oil reserves inthe US was disruptive and it derailed the normalization of the cycle. The businessmodels that worked last cycle will not necessarily work again this cycle. Webelieve in the long term, the oilfield service franchises that will be the winners willbe those that evolve with innovative business models, and those that acquire orinvest in niche technology leaders.
Pressure pumping demand poised to recover to 2014 highsThe biggest common denominator among our top picks is exposure to pressurepumping. As US producers tailor their drilling programs to focus increasingly ontheir core acreage and best wells, there will be a disproportionate mix of leadingedge, longer lateral wells with tighter stage spacing and higher sand loadings.This will drive the average completion intensity per well even higher, which shouldrestore the demand for horsepower to the 2014 highs despite a lower rig count.
Valuation and risksSee our Industry valuation and risks within the Executive Summary section ofthis report, and company specific valuation and risks within individual companypages.
David Havens
Research Analyst
+1-212-250-3235
Jason Bandel
Associate Analyst
+1-212-250-1577
Chris Snyder
Research Associate
+1-212-250-0165
Matt Taylor
Research Associate
+1-212-250-1758
Top picks
C&J Energy Services (CJ.N),USD29.66 Buy
Patterson-UTI (PTEN.OQ),USD20.76 Buy
Halliburton (HAL.N),USD44.93 BuySource: Deutsche Bank
Deutsche Bank Securities Inc.
Deutsche Bank does and seeks to do business with companies covered in its research reports. Thus, investors should beaware that the firm may have a conflict of interest that could affect the objectivity of this report. Investors should considerthis report as only a single factor in making their investment decision. DISCLOSURES AND ANALYST CERTIFICATIONSARE LOCATED IN APPENDIX 1. MCI (P) 083/04/2017.

9 October 2017
Oil Services & Equipment
Initiation of coverage
Executive Summary……………………..……..……….……..…....….....…..Page 3Baker Hughes, a GE company………..…..……..……….……...….....…..Page 58Basic Energy Services Inc………….…......……………..……..……….…..Page 70C&J Energy Services………….…......……………..……..……….…….…..Page 78Core Labs………….…......……………..……..……….……..….....………...Page 88Diamond Offshore Drilling………….…......……………..……..……….…..Page 98ENSCO International………….…......……………..……..……….…..…....Page 110Forum Energy Tech………….…......……………..……..……….……..…...Page 121Frank's International………….…......……………..……..……………..…..Page 131Halliburton………….…......……………..……..……….……..…....………..Page 139Helmerich & Payne………….…......……………..……..……….…….….....Page 153Nabors Industries………….…......……………..……..……….……..…......Page 165National Oilwell Varco………….…......……………..……..……….……….Page 177Noble Corp.………….…......……………..……..……….……..….....………Page 188Oceaneering Int'l.………….…......……………..……..……….……......…..Page 199Oil States………….…......……………..……..……….……..…................…Page 208Patterson-UTI………….…......……………..……..……….……….....……...Page 218Precision Drilling………….…......……………..……..……….……..….....…Page 229Rowan Companies………….…......……………..……..…………..…..........Page 239RPC Inc………….…......……………..……..……….……......…………….....Page 250Schlumberger………….…......……………..…….…….……..…..........…....Page 260Smart Sand………….…......……………..…….…….……..….....................Page 272Superior Energy Services……….….....………..……..……….……..….....Page 284Transocean………….…......…………….…..……….……..….....…………...Page 293Weatherford International…….…......……………..……..……….…….......Page 306
Page 2 Deutsche Bank Securities Inc.
9 October 2017
Oil Services & Equipment
Initiation of coverage
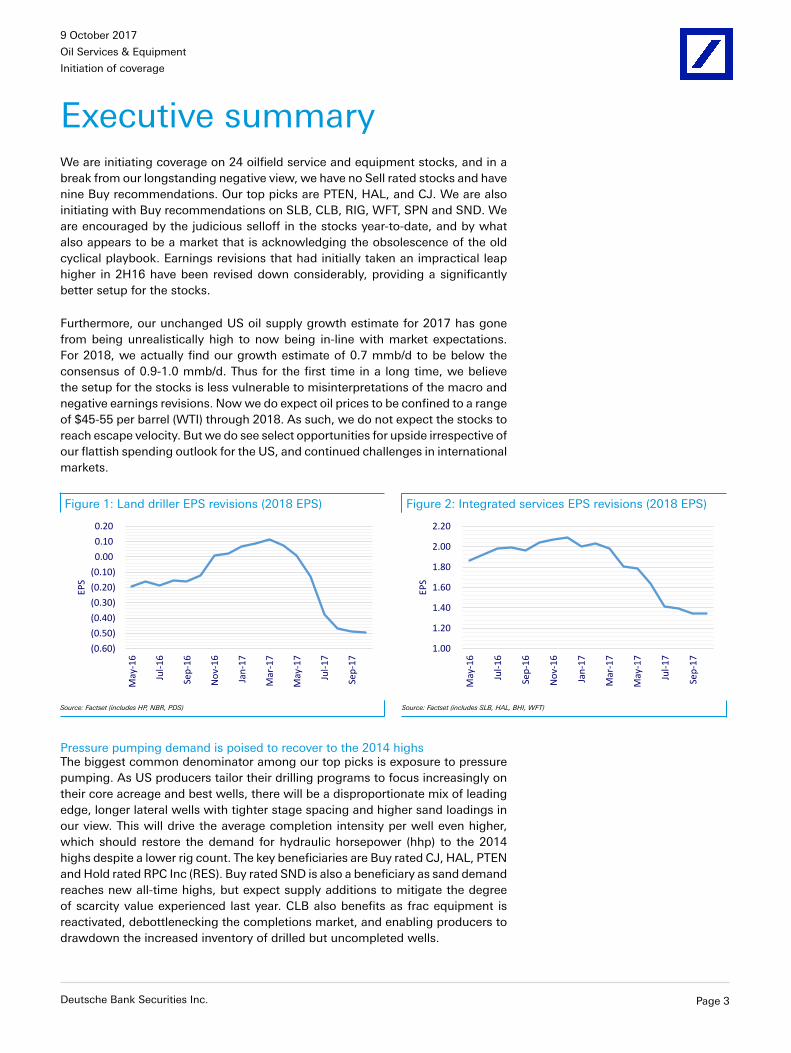
Executive summaryWe are initiating coverage on 24 oilfield service and equipment stocks, and in abreak from our longstanding negative view, we have no Sell rated stocks and havenine Buy recommendations. Our top picks are PTEN, HAL, and CJ. We are alsoinitiating with Buy recommendations on SLB, CLB, RIG, WFT, SPN and SND. Weare encouraged by the judicious selloff in the stocks year-to-date, and by whatalso appears to be a market that is acknowledging the obsolescence of the oldcyclical playbook. Earnings revisions that had initially taken an impractical leaphigher in 2H16 have been revised down considerably, providing a significantlybetter setup for the stocks.
Furthermore, our unchanged US oil supply growth estimate for 2017 has gonefrom being unrealistically high to now being in-line with market expectations.For 2018, we actually find our growth estimate of 0.7 mmb/d to be below theconsensus of 0.9-1.0 mmb/d. Thus for the first time in a long time, we believethe setup for the stocks is less vulnerable to misinterpretations of the macro andnegative earnings revisions. Now we do expect oil prices to be confined to a rangeof $45-55 per barrel (WTI) through 2018. As such, we do not expect the stocks toreach escape velocity. But we do see select opportunities for upside irrespective ofour flattish spending outlook for the US, and continued challenges in internationalmarkets.
Figure 1: Land driller EPS revisions (2018 EPS) Figure 2: Integrated services EPS revisions (2018 EPS)
(0.60)
(0.50)
(0.40)
(0.30)
(0.20)
(0.10)
0.00
0.10
0.20
May-16
Jul-16
Sep-16
Nov-16
Jan-17
Mar-17
May-17
Jul-17
Sep-17
EPS
1.00
1.20
1.40
1.60
1.80
2.00
2.20
May-16
Jul-16
Sep-16
Nov-16
Jan-17
Mar-17
May-17
Jul-17
Sep-17
EPS
Source: Factset (includes HP, NBR, PDS) Source: Factset (includes SLB, HAL, BHI, WFT)
Pressure pumping demand is poised to recover to the 2014 highsThe biggest common denominator among our top picks is exposure to pressurepumping. As US producers tailor their drilling programs to focus increasingly ontheir core acreage and best wells, there will be a disproportionate mix of leadingedge, longer lateral wells with tighter stage spacing and higher sand loadings inour view. This will drive the average completion intensity per well even higher,which should restore the demand for hydraulic horsepower (hhp) to the 2014highs despite a lower rig count. The key beneficiaries are Buy rated CJ, HAL, PTENand Hold rated RPC Inc (RES). Buy rated SND is also a beneficiary as sand demandreaches new all-time highs, but expect supply additions to mitigate the degreeof scarcity value experienced last year. CLB also benefits as frac equipment isreactivated, debottlenecking the completions market, and enabling producers todrawdown the increased inventory of drilled but uncompleted wells.
Deutsche Bank Securities Inc. Page 3

9 October 2017
Oil Services & Equipment
Initiation of coverageFi
gu
re 3
: V
alu
atio
n t
able
5-O
ct1
2-m
oM
kt c
ap
EP
S (
DB
e)
De
bt
Pri
ce/
Su
b-s
ect
or
(co
mp
an
y)S
ymb
ol
Ra
tin
gp
rice
targ
et
($m
)'1
7D
B'1
8D
B'1
9D
B'1
8'1
9'1
8D
B'1
9D
B'1
8D
B'1
9D
B'1
8'1
9'1
8D
B'1
9D
Btu
rns
bo
ok
INT
EG
RA
TE
D S
ER
VIC
ES
Sch
lum
be
rge
rS
LBB
uy
68
.87
78
94
,49
91
.47
2.3
8
3
.33
#N
/A#
N/A
28
.9
2
0.7
8,2
25
9
,74
0
8,5
68
10
,37
0
13
.1
1
1.0
2.3
2.4
Ha
llib
urt
on
HA
LB
uy
45
.09
54
38
,60
31
.14
2.2
2
2
.99
2.1
7
2
.96
20
.3
1
5.1
4,8
10
5
,62
9
4,7
61
5,7
74
9.9
8.5
2.3
4.3
Ba
ker
Hu
gh
es
BH
GE
Ho
ld3
6.4
83
51
5,6
74
0.1
2
1
.31
1.7
5
1
.27
1.9
7
2
7.9
20
.8
3
,08
3
3,7
02
3
,78
7
4
,87
3
4
.8
4
.0
1
.0
1
.3
We
ath
erf
ord
WF
TB
uy
4.2
76
4,1
40
(1.0
1)
(0
.28
)
0.0
2
(0
.45
)
(0.0
1)
n
m2
54
.0
90
5
1
,04
0
90
4
1,2
96
12
.5
1
0.9
8.5
2.8
SM
ID S
ER
VIC
ES
Co
re L
ab
ora
tori
es
CLB
Bu
y9
5.9
91
09
4,1
46
1.9
0
2
.92
3.6
7
2
.73
3.3
9
3
2.9
26
.1
1
88
22
8
1
80
2
18
2
3.4
19
.3
1
.2
2
8.1
Su
pe
rio
r E
ne
rgy
Serv
ice
sS
PN
Bu
y1
0.4
21
51
,53
2(1
.53
)
(0.8
5)
(0
.25
)
(0.6
9)
(0
.20
)
nm
nm
35
9
n
m3
92
4
67
7
.4
n
m3
.6
1
.3
Fra
nk'
s In
tern
ati
on
al
FI
Ho
ld7
.67
71
,65
9(0
.45
)
(0.2
6)
(0
.05
)
(0.2
5)
(0
.03
)
nm
nm
52
1
00
57
11
3
26
.9
1
3.8
0.0
1.3
Ba
sic
En
erg
y Se
rvic
es
BA
SH
old
19
.77
22
48
8(2
.05
)
(0.3
5)
0
.75
(0.2
5)
0
.98
nm
nm
13
4
n
m1
43
1
87
5
.3
n
m1
.9
1
.3
C&
J E
ne
rgy
Serv
ice
sC
JB
uy
29
.56
39
1,8
26
0.1
3
2
.16
3.6
8
2
.02
3.0
6
1
3.7
8.0
35
1
4
81
33
1
46
2
4.4
3.2
-
1
.6
RP
C,
Inc.
RE
SH
old
23
.98
25
5,0
70
0.8
3
1
.42
1.5
0
1
.38
1.4
9
1
6.9
16
.0
6
28
66
0
6
32
6
92
7
.8
7
.4
-
6.0
SA
ND
SU
PP
LIE
RS
Sm
art
Sa
nd
SN
DB
uy
7.0
19
27
10
.33
0.8
6
0
.97
0.7
9
0
.98
8.1
7.2
68
7
7
64
72
3.1
2.7
0.0
1.6
LAN
D D
RIL
LER
S
He
lme
rich
& P
ayn
eH
PH
old
52
.17
45
5,5
84
(1.3
4)
(0
.79
)
(0.1
2)
(0
.66
)
(0.2
1)
n
mn
m4
50
55
1
4
61
5
39
1
2.1
9.9
1.1
1.3
Na
bo
rs I
nd
ust
rie
sN
BR
Ho
ld7
.99
92
,16
1(1
.47
)
(0.5
1)
0
.30
(0.6
1)
(0
.04
)
nm
27
.1
8
30
1,0
49
8
22
1
,02
3
6
.8
5
.4
4
.5
0
.7
Pa
tte
rso
n-U
TI
En
erg
yP
TE
NB
uy
21
.30
25
4,4
28
(0.9
1)
(0
.17
)
0.3
8
(0
.23
)
0.2
6
n
m5
5.7
78
7
9
69
77
1
92
3
6.2
5.0
0.9
1.2
Pre
cisi
on
Dri
llin
gP
D-C
AH
old
3.5
74
1,0
18
(0.3
5)
(0
.15
)
0.1
5
(0
.31
)
(0.0
4)
n
m2
4.4
39
2
5
22
38
1
49
3
7.1
5.3
4.7
0.5
OF
FS
HO
RE
DR
ILLE
RS
Dia
mo
nd
Off
sho
reD
OH
old
14
.88
15
2,0
20
0.9
5
0
.16
(0.3
2)
0
.16
(0.0
4)
9
3.7
nm
45
7
3
56
46
4
42
1
8.4
10
.8
4
.3
0
.5
En
sco
Plc
ES
VH
old
5.8
36
1,7
13
(0.5
7)
(1
.89
)
(1.1
3)
(0
.73
)
(0.7
5)
n
mn
m4
81
31
2
4
60
4
78
9
.6
1
4.7
9.9
0.2
No
ble
Co
rpo
rati
on
NE
Ho
ld4
.50
41
,01
7(1
.29
)
(1.3
9)
(1
.37
)
(1.3
9)
(1
.35
)
nm
nm
40
9
3
35
41
2
40
8
12
.6
1
5.4
9.9
0.2
Ro
wa
n C
om
pa
nie
sR
DC
Ho
ld1
3.0
21
51
,63
9(0
.61
)
(1.9
3)
(2
.23
)
(2.3
7)
(2
.52
)
nm
nm
23
1
1
50
20
8
15
6
13
.0
2
0.1
10
.9
0
.3
Tra
nso
cea
nR
IGB
uy
10
.54
13
4,0
04
0.0
3
(0
.94
)
(1.5
8)
(0
.94
)
(1.2
3)
n
mn
m8
88
62
9
9
09
8
21
9
.5
1
3.4
8.3
0.3
CA
PIT
AL
EQ
UIP
ME
NT
Na
tio
na
l Oilw
ell
Va
rco
NO
VH
old
36
.03
39
13
,35
6(0
.40
)
0.5
5
1
.32
0.4
3
1
.29
65
.6
2
7.3
1,0
07
1
,31
3
1,0
00
1,4
23
14
.9
1
1.4
3.2
1.0
Oil
Sta
tes
Inte
rna
tio
na
lO
ISH
old
25
.55
26
1,2
97
(0.9
9)
(0
.23
)
0.2
9
(0
.20
)
0.4
4
n
m8
8.9
10
6
1
46
10
0
14
4
11
.8
8
.6
0
.5
1
.1
Oce
an
ee
rin
g I
nte
rna
tio
na
lO
IIH
old
25
.47
28
2,4
80
0.0
3
0
.14
0.5
2
0
.09
0.5
2
1
84
.1
49
.1
2
39
28
5
2
52
3
13
1
1.7
9.8
3.3
1.7
Fo
rum
En
erg
y T
ech
no
log
ies
FE
TH
old
15
.50
17
1,6
21
(0.2
7)
0
.23
0.6
6
0
.21
0.6
1
6
7.3
23
.6
1
14
17
6
1
24
1
86
1
4.2
9.2
3.5
1.4
EP
S (
con
sen
sus)
PE
EB
ITD
A (
con
sen
sus)
EB
ITD
A (
DB
e)
EV
/EB
ITD
A
Sou
rce:
Deu
tsch
e B
ank,
Fac
tset
Page 4 Deutsche Bank Securities Inc.

9 October 2017
Oil Services & Equipment
Initiation of coverage
Land drillers are looking to reestablish themselves in the value chainThere is a higher cadence of more productive wells being developed in the USthat is undermining the earnings power of the land drilling industry. The trendof drilling more with less threatens the marketability of the entire legacy land rigfleet as producers continue to demand technologies that enable improved drillingefficiencies and lower well costs. This has reserved pricing power for the preferredAC-electric and super-spec rigs, but even at above 90% utilization, pricing powerfor these rigs is struggling to breakout. Unlike the frac market, we do not expectrig counts to be restored to the 2014 highs by year-end 2018. But while thissub-sector was once an alpha short as earnings revision leaped to impracticallevels in 2016, revisions have since been sharply negative, leaving the stocks lessvulnerable in our view. We initiate with Hold ratings on Helmerich & Payne (HP),Nabors Industries (NBR) and Precision Drilling (PD). PTEN is Buy rated due to itsfrac exposure.
US service inflation will continue at a more modest paceInflation expectations got ahead of the market last year, but have since been ropedin. If oil prices stay within our $45-55 range, we expect inflation will stay below10% in 2018 with only pressure pumping stepping higher to about 15%. In alower oil price environment, moderate oil price inflation is not negative. Restoringvolumes at this stage of the cycle and absorbing fixed costs are the principaldrivers of margin expansion. If service inflation is allowed to breakout in a lowprice environment with increasingly louder calls for producers to exercise capitaldiscipline, we fear our flat rig count assumption for 2018 will have increaseddownside risk.
Rig count outlook domestically and abroad are flatteningThe US experienced a rapid drilling recovery once oil prices inflected, butinternational markets remained a lot more sluggish. We expect an ebb and flowof US upstream capital expenditures to keep pressure on oil prices and a lid on rigcounts both domestically and abroad. The one exception where we see continuedresilience is in Saudi Arabia. The standout exposures to Saudi Arabia are Buy ratedSchlumberger (SLB), and Hold rated NBR and Rowan Companies (RDC).
Figure 4: US onshore rig count Figure 5: International onshore rig count
0
500
1,000
1,500
2,000
2,500
1Q12
2Q12
3Q12
4Q12
1Q13
2Q13
3Q13
4Q13
1Q14
2Q14
3Q14
4Q14
1Q15
2Q15
3Q15
4Q15
1Q16
2Q16
3Q16
4Q16
1Q17
2Q17
3Q17
0
200
400
600
800
1,000
1,200
01/12
05/12
09/12
01/13
05/13
09/13
01/14
05/14
09/14
01/15
05/15
09/15
01/16
05/16
09/16
01/17
05/17
Source: Baker Hughes, a GE Company Source: Baker Hughes, a GE Company
Deutsche Bank Securities Inc. Page 5

9 October 2017
Oil Services & Equipment
Initiation of coverage
Offshore markets bottoming, limited momentum, but some opportunityFor the offshore drillers, the negative sentiment remains firmly entrenched, butwe believe the alpha short is largely gone and the industry is bottoming. The issueis the recovery will lack momentum and earnings are still trending lower each yearthrough 2019. The competitive landscape will likely change significantly as moredeals are announced in an effort to reposition fleets. Attrition will likely continueonce deals are closed. We initiate with a Hold rating on DO, ESV, NE, and RDC,and Buy rating on RIG. RIG has delivered a strong positive free cash flow trackrecord and has preserved cash, and maintained a leading edge ultra-deepwaterfleet with above average marketability. We believe the company is well positionedto make opportunistic acquisitions in an otherwise financially stressed sub-sector.
Weatherford is one of the key idiosyncratic storiesCulture and process. The two things the new CEO needs to change at WFT. Notan easy fix, but if WFT can move up from being dead last on a 10-year averagecash conversion comparison (cash from operations/EBITDA) with 30 other oilfieldservice companies, we believe there is meaningful upside. Weatherford lost about$6 billion in free cash flow over the last ten years while SLB and NOV generatedapproximately $33 billion and $14 billion respectively. The new leadership hasidentified several operating and process related levers to pull, a key one beinginventory days that are approximately twice as high as SLB and HAL. Unrealisticto expect a similar level of working capital efficiency as these peers, but evenmeeting half way moves the needle. In the near-term, equity financing remains akey risk as its international land sales remain challenged.
Figure 6: Average 10-year cash conversions (cash from operations/EBITDA)
- 0.20 0.40 0.60 0.80 1.00 1.20 1.40
WFTNR
CRRRESBRSFTI
HALBHI
RDCOII
SLBCLB
HOSRIGDO
TDWPDS
DRQTS
ATWTTI
NBRESV
NOVSPN
NEUNTPESHP
OISPTEN
Cash from operations/EBITDA
Source: Factset, Deutsche Bank
Page 6 Deutsche Bank Securities Inc.

9 October 2017
Oil Services & Equipment
Initiation of coverage
Not business as usual for the oilfield services industryThis is an industry that is still in transition, and these are companies that stillneed to navigate this transition. The commercial development of tight oil reservesin the US was a remarkable achievement, but it was disruptive, and it derailedthe normalization of the cycle. The business models that worked last cycle willnot necessarily work again this cycle. There is a louder call for capital disciplineamong producers, which are requiring increasingly more intellectual property,data analytics, Big Data and precision well placement capabilities to lower costsand improve returns. As such, we believe in the long-term, the oilfield servicefranchises that will be the winners will be those that evolve with innovativebusiness models, and those that acquire or invest in niche technology leaders.
Within this context, we believe the standouts are Buy rated SLB, HAL, PTEN, andCLB , and Hold rated NBR. These companies are evolving to maximize margin andreturns in an otherwise challenging market. SLB in particular has been addressingthe industry-wide sub-optimal asset turns and tool utilization in an effort to enableabove average margins in a market where its peers are fighting for market share.The company is also taking the most radical look at the future of the industry withits efforts in redefining the entire drilling process and industry workflows.
This cycle will not be like the prior two cyclesIn order for these stocks to sustain a rally, we need to see progress in therebalancing of the oil markets. While we do believe well productivity will continueto keep some pressure on oil prices, US production expectations got a bit ahead ofthemselves in our view. But we do not expect the same proliferation of spendingas last cycle, but instead a more measured outcome.
Figure 7: Global oil inventories showing some progress Figure 8: Higher cadence of more productive wells in US
900
950
1,000
1,050
1,100
1,150
1,200
1,250
1,300
Jan Feb Mar Apr May Jun Jul Aug Sep Oct Nov Dec
mm
bb
ls
2010-2014 range 2016 2017 Avg
High: 248 mmbbls July: 207 mmbbls
0.0
1.0
2.0
3.0
4.0
5.0
6.0
7.0
8.0
9.0
01
/07
08
/07
03
/08
10
/08
05
/09
12
/09
07
/10
02
/11
09
/11
04
/12
11
/12
06
/13
01
/14
08
/14
03
/15
10
/15
05
/16
12
/16
mm
b/d
Conventional oil Tight oil
Source: EIA Source: EIA, Drilling Info
Industry valuation and risksOur price target methodology is based on either the five-year or ten-year multipleof each company's normalized earnings or EBITDA power. We then look astandard deviation above and below, and calculate the price target from aweighted average. The main investment risks include: 1) shifts in OPEC policyand the influence that would have on oil prices and ultimately US upstreamcapital expenditures, 2) negative revisions to global oil demand, 3) pricing tacticsgetting increasingly more aggressive for market share, and 4) another leg downin deepwater spending globally.
Deutsche Bank Securities Inc. Page 7

9 October 2017
Oil Services & Equipment
Initiation of coverage
The Ebb and Flow of US Capex Keeps Pressure on OilPrices
We are still mindful of the headwinds. US oil producers are developing a highercadence of more productive wells for less capital at lower breakeven prices. Theyhave built 10-20 year drilling inventories with 96% success rates and 3-6 monthcash conversions. They have capex budgets that can ebb and flow with oil pricesand they are standing ready to deploy capital once oil prices edge up above $50.
When all is said and done, the US is exerting more influence on global oil marketsthan it has in over 30 years. US producers collectively are undermining OPECand the oil rebalancing effort. We believe the ebb and flow of US capex and therehabilitation of US productivity will confine oil prices to a range of $45 – 55through 2018. This will restrain service inflation when oil prices are below $50,and it will be an obstacle to restoring earnings power.
The unintended consequences of higher density drilling and completionsThe rehabilitation of US well productivity is a direct result of longer laterals,tighter stage spacing, more frac clusters, and higher sand loadings. We expectthese trends to continue, and for the next 3+ years, US producers will enhancecompletion intensities in an effort to increase productivity. We also expect tosee increasingly more technology brought into the fold including precision wellplacement, data analytics, and real-time monitoring, all of which we believewill increase year-over-year estimated ultimate recoveries (EURs) and initialproduction (IP) rates.
But what merits close attention is the increasing trend toward close proximitydrilling. These 10-20 year drilling inventories are populated with a number of infilldrilling wells that present some risks including parent child well interference,which could drive actual EURs lower than expected. This is getting a lot of mindshare as producers return to existing pads to infill drill. While we have alwayshesitated to doubt future progress in well productivity, that was during the earlyinnings of tight oil development.
Figure 9: Average Permian horizontal lateral lengths Figure 10: Average Permian 30-day IPs per 1,000-ft
0
1,000
2,000
3,000
4,000
5,000
6,000
7,000
8,000
2011 2012 2013 2014 2015 2016 2017 2018 2019
Feet
-
20
40
60
80
100
120
140
160
-
100
200
300
400
500
600
700
800
2011 2012 2013 2014 2015 2016 2017
Ytd
30
-da
y I
P p
er
1,0
00
-ft
of
late
ral
b/d
(o
il o
nly
)
Peak monthly production 30-day IP per 1,000-ft
Source: IHS Markit Source: Drilling Info, Deutsche Bank
Page 8 Deutsche Bank Securities Inc.

9 October 2017
Oil Services & Equipment
Initiation of coverage
Figure 11: Permian type curves by vintage Figure 12: Eagle Ford type curves by vintage
2017
2016
2015
-
100
200
300
400
500
600
700
800
0 3 6 9 12 15 18 21 24 27 30 33 36
b/d
(o
il o
nly
)
Months
2017 Ytd
2016
2015
2014
2013
2012
2011
2017
2016
2015
-
100
200
300
400
500
600
700
800
900
0 3 6 9 12 15 18 21 24 27 30 33 36
b/d
(o
il o
nly
)
Months
2017
2016
2015
2014
2013
2012
2011
Source: Drilling Info, Deutsche Bank Source: Drilling Info, Deutsche Bank
Figure 13: Permian peak 30-day production averages Figure 14: Eagle Ford peak 30-day production averages
183
260 299
375
452
538
717
-
100
200
300
400
500
600
700
800
2011 2012 2013 2014 2015 2016 2017 Ytd
b/d
(o
il o
nly
) 24% CAGR (2011 - 2016)
405 415
471 502
572
635
808
-
100
200
300
400
500
600
700
800
900
2011 2012 2013 2014 2015 2016 2017
b/d
(o
il o
nly
)
9% CAGR (2011 - 2016)
Source: Drilling Info, Deutsche Bank Source: Drilling Info, Deutsche Bank
Developing a higher cadence of more productive wells in the USThe ebb and flow of US capex with oil prices is nothing new, but thedevelopment of US tight oil reserves has radically rehabilitated the cause-and-effect relationship between drilling and production. For over a decade, USoil production had remained relatively flat despite oscillations in oil-directedcapex. Tight oil has changed that and has encouraged significant investment inoptimizing completion designs that enhance reservoir contact and productivityper lateral foot. This has made the US a principal market for producers.
Since 2011, the average initial production (IP) rates and estimated ultimaterecoveries (EURs) for wells placed-on-production (POP) in the main tight oil basinshave been increasing. The peak 30-day production numbers for the Permian haveincreased at a CAGR of 24% while the Eagle Ford has increased at a CAGR of 9%.Most of the improvements were a direct result of longer laterals, more frac stages,and more sand. While we expect the positive trend to persist through 2018, wedo believe the rate of change will slow due to some interference from technicaland economic break points.
Deutsche Bank Securities Inc. Page 9

9 October 2017
Oil Services & Equipment
Initiation of coverage
Figure 15: The impact of adding 100 rigs has increased significantly
457
656
873
0
200
400
600
800
1,000
1,200
1,400
1,600
1,800Ja
n-1
8
Au
g-1
8
Ma
r-1
9
Oct
-19
Ma
y-2
0
De
c-2
0
Jul-
21
Fe
b-2
2
Se
p-2
2
Ap
r-2
3
No
v-2
3
Jun
-24
Jan
-25
Au
g-2
5
Ma
r-2
6
Oct
-26
Ma
y-2
7
De
c-2
7
kb
/d
Months
2014 avg IP 2016 avg IP 2017 Ytd avg IP
Source: Drilling Info, Deutsche Bank
Tight oil has rehabilitated the influence of the US rig countA producer working a single rig on a multi-well pad in the Permian can drill a wellin 20 days and can have a three-well pad placed on production in 130 days orless. It can spud 18 wells per year with a completed well cost normalized for a7,500-ft lateral of $5.5 – 6.0 million. Total annual drilling and completion (D&C)expenditures for this single rig would be $100 – 110 million.
Scale this up to a development program with 100 rigs and $10 – 11 billion ofannual D&C expenditures, and within 12-months of spudding the first wells,this program can produce 0.4 mmb/d of oil. By the end of year-three, output isupwards of 0.9 mmb/d. This is almost double what the industry was doing in2014. This is what seduces US producers and brings capital into the US.
Figure 16: Permian year-end flow rate contributions when adding 100 rigs
224
368 457
527 584
321
528
656
755 838
427
704
873
1,006
1,116
0
200
400
600
800
1,000
1,200
2018 2019 2020 2021 2022
kb
/d
2014 avg IP (EOP) 2016 avg IP (EOP) 2017 Ytd avg IP
Source: Drilling Info, Deutsche Bank
Page 10 Deutsche Bank Securities Inc.

9 October 2017
Oil Services & Equipment
Initiation of coverage
Capex Recovery is rapidly Reviving US Oil Production
We believe the upstream capex recovery that began in June 2016 has put the USon track to realize 9.5 mmb/d of oil production by year-end 2017. This would be a1.0 mmb/d revival since the September 2016 lows, of which 0.55 mmb/d has beenrestored as of June 2017. While the drawdown of drilled but uncompleted wells(DUCs) has contributed about 0.24 mmb/d of the restored oil so far, we expectthe 450 oil-directed rigs that have returned to work since June 2016 to contributeabout 0.85 mmb/d of oil production by year-end 2017.
We believe this rapid revival of US production is exerting pressure on global oilprices and is likely to flatten 2018 capex budgets and US rig count growth. Wedo not expect it will once again drive oil prices down into the $30s.
Figure 17: US upstream capex bottomed in 3Q16 andhas risen 65% through 2Q17 with oil prices averaging$47
Figure 18: The Permian has absorbed 54% of theland rigs returning to the field since the May 2016 riginflection
$0
$20
$40
$60
$80
$100
$120
0
5,000
10,000
15,000
20,000
25,000
30,000
35,000
40,000
1Q
14
2Q
14
3Q
14
4Q
14
1Q
15
2Q
15
3Q
15
4Q
15
1Q
16
2Q
16
3Q
16
4Q
16
1Q
17
2Q
17
Oil
pri
ces
$ in
mill
ion
s
US capex Crude oil prices ($/bbl)
0
50
100
150
200
250
300
350
400
450
500
Ma
y-1
6
Jun
-16
Jul-
16
Au
g-1
6
Se
p-1
6
Oct
-16
No
v-1
6
De
c-1
6
Jan
-17
Fe
b-1
7
Ma
r-1
7
Ap
r-1
7
Ma
y-1
7
Jun
-17
Jul-
17
Au
g-1
7
Rig
s
Permian Eagle Ford Cana Bakken Other
Source: Company reports from the top 30 active US producers Source: Baker Hughes, a GE Company
Figure 19: DUCs responded quickly and at the peak arecontributing about 0.24 mmb/d
Figure 20: Newly drilled wells contributingapproximately 0.85 mmb/d by year-end 2017
0
50
100
150
200
250
300
04
/16
06
/16
08
/16
10
/16
12
/16
02
/17
04
/17
06
/17
08
/17
10
/17
12
/17
02
/18
04
/18
06
/18
08
/18
10
/18
12
/18
kb
/d
Permian Eagle Ford Bakken Niobrara Other
0
200
400
600
800
1,000
1,200
1,400
1,600
04
/16
06
/16
08
/16
10
/16
12
/16
02
/17
04
/17
06
/17
08
/17
10
/17
12
/17
02
/18
04
/18
06
/18
08
/18
10
/18
12
/18
kb
/d
Permian Eagle Ford Bakken SCOOP/STACK
Source: Wood Mackenzie, Drilling Info, Deutsche Bank Source: Wood Mackenzie, Drilling Info, Deutsche Bank
Deutsche Bank Securities Inc. Page 11

9 October 2017
Oil Services & Equipment
Initiation of coverage
Figure 21: Permian production by well vintage
-
200,000
400,000
600,000
800,000
1,000,000
1,200,000
1,400,000
01
/10
06
/10
11
/10
04
/11
09
/11
02
/12
07
/12
12
/12
05
/13
10
/13
03
/14
08
/14
01
/15
06
/15
11
/15
04
/16
09
/16
02
/17
b/d
< 2010 2010 2011 2012 2013 2014 2015 2016 2017
Source: Drilling Info, Deutsche Bank
The Permian is the principal driver of activity and oil production growthThe rapid revival of production is happening largely in the Permian. Over 50% ofthe rigs that have returned to work since the June 2016 inflection have gone tothe Permian. We expect these rigs will contribute approximately 0.55 mmb/d ofproduction by year-end 2017.
But even before the inflection in drilling activity, the Permian has experiencedsignificant production growth with over 65% of the total output coming fromwells placed on production since 2015. To put that into context, wells placed onproduction in the Eagle Ford since 2015 are only contributing about 30% of thetotal output.
The Permian has become the epicenter of US drilling activity and is one of thefew regions where there is differentiated service pricing.
Figure 22: Permian oil production by the year in whichthe wells were placed on production
Figure 23: Permian monthly change in oil production bythe year in which the wells were placed on production
< 2010
6%2010
5% 2011
3%
2012
4%
2013
4%
2014
11%
2015
14%
2016
25%
2017
28%
(60,000)
(40,000)
(20,000)
-
20,000
40,000
60,000
80,000
< 2010 2010 2011 2012 2013 2014 2015 2016 2017
b/d
Source: Drilling Info, Deutsche Bank Source: Drilling Info, Deutsche Bank
Page 12 Deutsche Bank Securities Inc.

9 October 2017
Oil Services & Equipment
Initiation of coverage
Does this make the Permian the only game in town?The US is a bigger threat if there is a broader contribution of oil supplies. Thusfar the Permian has contributed the lion’s share of the restored oil productionwith the Eagle Ford only now showing signs of recovery. With two-thirds of thePermian output coming from wells that were placed on production within the lastthree-years, the revival of US oil production since the lows is somewhat vulnerableto the hyper-decline phases these wells are in. We estimate the Permian needsto replace about 110 kb/d (and growing) from wells brought online before 2017.Wells placed on production in 2017 are contributing in excess of 300 kb/d, whichis clearly sufficient and still enough to cover the losses thus far from the EagleFord and the Bakken.
We expect the 40+ rigs added to the Eagle Ford since June 2016 will add about200 kb/d of oil production by year-end 2017. Wells placed on production prior to2017 are currently declining by about 55 kb/d and growing. We expect the EagleFord data which comes at a lag to show a positive pivot in August. The Bakkenis not keeping up in terms of activity. While the drawdown of DUCs contributedmore than 100 kb/d, less than 30 rigs returned to work in the Bakken, which setsit up for small declines through year-end.
Figure 24: Eagle Ford oil production by well vintage Figure 25: Bakken oil production by well vintage
-
200,000
400,000
600,000
800,000
1,000,000
1,200,000
1,400,000
01
/10
06
/10
11
/10
04
/11
09
/11
02
/12
07
/12
12
/12
05
/13
10
/13
03
/14
08
/14
01
/15
06
/15
11
/15
04
/16
09
/16
02
/17
b/d
< 2010 2010 2011 2012 2013 2014 2015 2016 2017
-
200,000
400,000
600,000
800,000
1,000,000
1,200,000
1,400,000
01
/10
06
/10
11
/10
04
/11
09
/11
02
/12
07
/12
12
/12
05
/13
10
/13
03
/14
08
/14
01
/15
06
/15
11
/15
04
/16
09
/16
02
/17
b/d
< 2010 2011 2012 2013 2014 2015 2016 2017
Source: Drilling Info, Deutsche Bank Source: Drilling Info, Deutsche Bank
Figure 26: Eagle Ford monthly change in oil productionby year in which wells were placed in production
Figure 27: Bakken monthly change in oil production byyear in which wells were placed in production
(15,000)
(10,000)
(5,000)
-
5,000
10,000
15,000
20,000
25,000
2010 2011 2012 2013 2014 2015 2016 2017
b/d
(30,000)
(20,000)
(10,000)
-
10,000
20,000
30,000
2010 2011 2012 2013 2014 2015 2016 2017
b/d
Source: Drilling Info, Deutsche Bank Source: Drilling Info, Deutsche Bank
Deutsche Bank Securities Inc. Page 13

9 October 2017
Oil Services & Equipment
Initiation of coverage
Figure 28: US upstream capex guidance for 2017
120,790
82,772
43,568
61,205
0
20,000
40,000
60,000
80,000
100,000
120,000
140,000
2014 2015 2016 2017
$ in
millio
ns
Source: Company reports from some of the top 36 most active producers
The 100+ rig count decline is not in our forecast through year-endThere has been a great deal of speculation that the US rig count was going tolose 100+ rigs into year-end. We expect US producers will have small 2H17 capexrevisions, but nothing that triggers a significant slide in activity. Any declineswe see are also likely to be more gradual, especially now that oil prices haverebounded.
Currently US budget plans take annual capex up 40% in 2017 versus 2016. Thisimplies a 14% increase in 2H17 versus 1H17.
Figure 29: Small downside risk to 2H17 implied guidance
0
10,000
20,000
30,000
40,000
50,000
60,000
70,000
1H14 2H14 1H15 2H15 1H16 2H16 1H17 2H17
$ in
mil
lio
ns
Source: Company reports from some of the top 36 most active US producers
Page 14 Deutsche Bank Securities Inc.

9 October 2017
Oil Services & Equipment
Initiation of coverage
2018 Rig Count Outlook Weighed Down by Oil Prices
Figure 30: Rig count forecast (DBe)(e) (e) (e) (e)
Rig count forecast 1Q16 2Q16 3Q16 4Q16 1Q17 2Q17 3Q17 4Q17 2016 2017 2018
United States
Oil-directed rigs 427 315 374 449 573 699 746 735 391 688 744
Gas-directed rigs 108 82 85 117 148 174 182 170 98 168 167
Total U.S. land rigs 535 397 459 565 721 873 928 904 489 856 911
Sequential chg -26% -26% 16% 23% 27% 21% 6% -3% -48% 75% 6%
Gulf of Mexico 26 23 18 22 20 21 21 21 22 21 21
Canada 166 48 121 181 295 117 206 300 129 230 241
North America 727 468 598 769 1,036 1,011 1,155 1,225 641 1,107 1,173
Source: Baker Hughes, a GE Company, Deutsche Bank
The US rig count will likely be obstructed by low oil prices in 2018We expect the ebb and flow of US upstream capex and the rehabilitation of USproductivity to confine oil prices to a range of $45 – 55 through 2018. With the USalready on track to realize 9.5 mmb/d of production by year-end 2017, the setupfor 2018 is challenging. Our rig count forecast has oil-directed rigs climbing 6%in 2018 versus the 75% increase in 2017. We expect this will keep a lid on serviceinflation with the exception of hydraulic fracturing, which is poised to return to2014 demand levels.
In terms of oil production, we expect the US to grow by 0.7 mmb/d to 10.2 mmb/d by year-end 2018. There will likely be some slower growth periods in 2018because of a build-up in DUCs. Producers are already waiting for frac equipmentthat is in the process of being reactivated. Nonetheless, 2018 is setup to be amilestone for the industry as production surpasses the all-time high of 10.0 mmb/d set back in November 1971.
Figure 31: US oil output still rises with slowing rig count Figure 32: US oil production outcome using DB rig count
5,000
6,000
7,000
8,000
9,000
10,000
11,000
Jan-10
Jul-10
Jan-11
Jul-11
Jan-12
Jul-12
Jan-13
Jul-13
Jan-14
Jul-14
Jan-15
Jul-15
Jan-16
Jul-16
Jan-17
Jul-17
Jan-18
Jul-18
kb/d
Months
7,0
83
7,9
18
9,4
65
9,2
29
8,7
71
9,4
67
10
,18
3
0
2,000
4,000
6,000
8,000
10,000
12,000
2012 2013 2014 2015 2016 2017 2018
(a) (a) (a) (a) (a) (e) (e)
kb
/d
US production US production (EOP)
Source: Baker Hughes, a GE Company, Deutsche Bank Source: EIA, Deutsche Bank
A 100 rig decline versus our base case would trim 2% off 2018 oil outputWe ran a sensitivity analysis of our rig forecast versus our production outcomeand found that a 100 rig decline through year-end 2017 would trim 2% from ourbase case by year-end 2018. The addition of 100 rigs would add 4%. In large scaletight oil developments, rig additions tend to add more upside than subtractionsdo downside, assuming gradual increases in productivity.
Deutsche Bank Securities Inc. Page 15

9 October 2017
Oil Services & Equipment
Initiation of coverage
Figure 33: US oil production outcomes using +/- 100 rigs versus DB basecase
+4%
-2%
8,000
8,500
9,000
9,500
10,000
10,500
11,000Ja
n-1
6
Ma
r-1
6
Ma
y-1
6
Jul-
16
Se
p-1
6
No
v-1
6
Jan
-17
Ma
r-1
7
Ma
y-1
7
Jul-
17
Se
p-1
7
No
v-1
7
Jan
-18
Ma
r-1
8
Ma
y-1
8
Jul-
18
Se
p-1
8
No
v-1
8
kb
/d
+100 rigs -100 rigs Base case
Source: Deutsche Bank, EIA
Can well productivity and service intensity continue to improve?Enhancements in drilling efficiency and completion design have been driving ahigher cadence of more productive wells for seven consecutive years now. Whilethere are some technical and economic break points that are interfering, and alot of the heavy lifting has already been done, we believe the underlying trendsdriving increased reservoir contact will continue to push IPs and EURs higher, butat a slower pace.
In 2017, there was a jump in 30-day IPs in both the Permian and Eagle Ford.The reason for this was producer mix, not a step change in productivity. Whilethe underlying trends are positive, the lower range in oil prices has curbed thenumber of producers placing lower quality wells on production. So far, there are14% fewer producers placing wells on production in the Permian in 2017 versus2016, and 22% fewer than in 2014. Oil prices above $55 would likely bring someback and lead to more development of lower quality acreage, which would thencreate a drag on average productivity metrics.
Figure 34: Permian lateral lengths vs. productivity Figure 35: Eagle Ford lateral lengths vs. productivity
3,000
3,500
4,000
4,500
5,000
5,500
6,000
6,500
-
100
200
300
400
500
600
700
800
2011 2012 2013 2014 2015 2016 2017
Ytd
Fe
et
b/d
(o
il o
nly
)
Peak monthly production Lateral length
3,000
3,500
4,000
4,500
5,000
5,500
6,000
6,500
7,000
-
200
400
600
800
1,000
2011 2012 2013 2014 2015 2016 2017
Fe
et
b/d
(o
il o
nly
)
Peak monthly production Lateral length
Source: IHS Markit, Drilling Info, Deutsche Bank Source: IHS Markit, Drilling Info, Deutsche Bank
Page 16 Deutsche Bank Securities Inc.

9 October 2017
Oil Services & Equipment
Initiation of coverage
Longer laterals to drive further productivity gains despite some interferenceWhile we are seeing gains in the average 30-day IP per 1,000-ft of lateral slowafter years of substantial increases, producers are still extending the overalllateral lengths, which is positive for the services industry. For years we haveall questioned the industry on the technical and economic limits of horizontallaterals. Since 2011, the average lateral length has increased by 40% to 6,000-ft. The leading edge is up to 12,000-ft with some experimenting with 20,000+feet. So far the limitations have been related to limits on friction reducing agents,availability of continuous acreage capable of accommodating longer laterals, andrisk. Risk because laterals are drilled open-hole, not cased hole. When lateralsextend out to 12,000-ft, costs escalate as does the risk of well integrity. Somesmaller, less sophisticated producers are unwilling to take on that risk. But wefound that over the last three years, about 50% of the wells placed on productionin the Permian and Eagle Ford were drilled by one of the top 30 most activeproducers, the vast majority of which are pressing ahead with longer laterals.
Figure 36: Average Permian horizontal lateral lengths Figure 37: Average Permian 30-day IPs per 1,000-ft
0
1,000
2,000
3,000
4,000
5,000
6,000
7,000
8,000
2011 2012 2013 2014 2015 2016 2017 2018 2019
Feet
-
20
40
60
80
100
120
140
160
-
100
200
300
400
500
600
700
800
2011 2012 2013 2014 2015 2016 2017
Ytd 30
-da
y I
P p
er
1,0
00
-ft
of
late
ral
b/d
(o
il o
nly
)
Peak monthly production 30-day IP per 1,000-ft
Source: IHS Markit Source: IHS Markit, Drilling Info, Deutsche Bank
Figure 38: Permian frac stages per well Figure 39: Permian sand volumes per lateral foot
0
5
10
15
20
25
30
35
2011 2012 2013 2014 2015 2016 2017 2018 2019
Fra
c st
ag
es
pe
r w
ell
100
600
1,100
1,600
2,100
2,600
2011 2012 2013 2014 2015 2016 2017 2018 (e) 2019 (e)
Lbs.
pe
r la
tera
l ft
Source: IHS Markit Source: IHS Markit
Deutsche Bank Securities Inc. Page 17

9 October 2017
Oil Services & Equipment
Initiation of coverage
Land Drilling Darwinism
Improved drilling efficiencies and enhanced completions have enabled USproducers to drill a higher cadence of more productive wells using fewer rigs.Not only are producers drilling more with less, but now the US is exerting moreinfluence on global oil markets than it has in over 30 years. We believe thiswill confine oil prices to a range of $45-55 through 2018 and will deflate someof the operating leverage that is customary in the land drilling industry. This isundermining the earnings power of the land drillers, and is forcing key players todevise strategies that will reestablish them in the value chain.
Figure 40: Wells spud per year per rig is up 50% Figure 41: DB rig count forecast
12.0
13.2
15.6 16.0 15.8
17.3 18.0
6
8
10
12
14
16
18
20
2011 2012 2013 2014 2015 2016 2017
We
lls
spu
d p
er
rig
0
500
1,000
1,500
2,000
2,500
Jan-12
May-12
Sep-12
Jan-13
May-13
Sep-13
Jan-14
May-14
Sep-14
Jan-15
May-15
Sep-15
Jan-16
May-16
Sep-16
Jan-17
May-17
Sep-17
Jan-18
May-18
Sep-18
Forecast Actual
Source: IHS Markit Source: Baker Hughes, a GE Company, Deutsche Bank
Since the US recovery began in June 2016, the industry has returned about 450oil-directed rigs to work. It was a quick snap back driven by lower breakevenprices and an inventory of wells with 96% success rates and 3-6 month cashconversions. But we do expect activity to flatten through year-end 2018.
Figure 42: US upstream capex vs. oil-directed rig count Figure 43: We expect recovery to flatten out
0
200
400
600
800
1,000
1,200
1,400
1,600
1,800
0
5,000
10,000
15,000
20,000
25,000
30,000
35,000
40,000
1Q
14
2Q
14
3Q
14
4Q
14
1Q
15
2Q
15
3Q
15
4Q
15
1Q
16
2Q
16
3Q
16
4Q
16
1Q
17
2Q
17
Rig
s
$ in
mill
ion
s
US capex US oil-directed rigs
'02-'08
'09-'14
'16+
'01-'02
'08-'09 '14-'160
50
100
150
200
250
300
350
0 26 52 78 104 130 156 182 208 234 260 286 312
Ind
exe
d t
o 1
00
Weeks
Source: Company reports from the top 36 active US producers, Baker Hughes, a GE Company Source: Baker Hughes, a GE Company
Page 18 Deutsche Bank Securities Inc.

9 October 2017
Oil Services & Equipment
Initiation of coverage
Figure 44: Permian is key destination for returning rigs Figure 45: Regional distribution of total US rig count
0
50
100
150
200
250
300
Permian Eagle Ford Cana Bakken Other
Rig
s
Barnett
1%
Cana Woodford
7%DJ-Niobrara
3%
Eagle Ford
7%
Haynesville
5%
Marcellus
5%
Permian
42%
Utica
3%
Williston
5%
Other
19%
Source: Baker Hughes, a GE Company Source: Baker Hughes, a GE Company
A large-scale, industrialized development of tight oil resourcesThe industry is in the midst of a large-scale, industrialized development of tight oilresources, which creates a high demand for technologies that enable improveddrilling efficiencies and lower wells costs. The Permian has become the epicenterof it all, attracting over half of the rigs that have returned to the market sincethe US recovery began. This has created a bifurcated market where drilling daysand pricing are reserved for the preferred 1,500hp AC-electric and super-spec rigsthat have leading edge functionality, performance and mobility. HP is the leadingprovider of super-spec rigs.
On the other side of the fence are the legacy mechanical and SCR (silicon-controlled rectifier) rig fleets that have endured large scale retirements, but a smallpopulation has survived and are still competing for horizontal work.
Figure 46: Producers prefer the 1,500hp AC-electric rigs Figure 47: Utilization restored for premium rigs
0
200
400
600
800
1,000
1,200
1,400
1,600
1,800
2,000
1Q10
3Q10
1Q11
3Q11
1Q12
3Q12
1Q13
3Q13
1Q14
3Q14
1Q15
3Q15
1Q16
3Q16
1Q17
Rigs
AC SCR Mechanical
0%
10%
20%
30%
40%
50%
60%
70%
80%
90%
100%
Jan
-11
Ma
y-1
1
Se
p-1
1
Jan
-12
Ma
y-1
2
Se
p-1
2
Jan
-13
Ma
y-1
3
Se
p-1
3
Jan
-14
Ma
y-1
4
Se
p-1
4
Jan
-15
Ma
y-1
5
Se
p-1
5
Jan
-16
Ma
y-1
6
Se
p-1
6
Jan
-17
Ma
y-1
7
Uti
liza
tio
n
1,500-1,999 HP 1,000-1,499 HP 500-999 HP
Source: Company reports, IHS Markit, Land Rig Newsletter Source: Land Rig Newsletter
Deutsche Bank Securities Inc. Page 19

9 October 2017
Oil Services & Equipment
Initiation of coverage
Figure 48: Average dayrates across asset classes Figure 49: Average realized dayrate assumptions
$10,000
$12,000
$14,000
$16,000
$18,000
$20,000
$22,000
$24,000
Jan
-11
Ma
y-1
1
Sep
-11
Jan
-12
Ma
y-1
2
Sep
-12
Jan
-13
Ma
y-1
3
Sep
-13
Jan
-14
Ma
y-1
4
Sep
-14
Jan
-15
Ma
y-1
5
Sep
-15
Jan
-16
Ma
y-1
6
Sep
-16
Jan
-17
Ma
y-1
7
Da
yra
te
1,500+ HP 1,000-1,500 HP < 1,000 HP
$10,000
$12,000
$14,000
$16,000
$18,000
$20,000
$22,000
$24,000
$26,000
$28,000
$30,000
1Q07
3Q07
1Q08
3Q08
1Q09
3Q09
1Q10
3Q10
1Q11
3Q11
1Q12
3Q12
1Q13
3Q13
1Q14
3Q14
1Q15
3Q15
1Q16
3Q16
1Q17
3Q17
1Q18
3Q18
Forecast Actual
Source: Land Rig Newsletter Source: Deutsche Bank, includes HP, PTEN, NBR and PDS
The pricing leverage customary in land drilling will be deflated in 2018While we have seen a bounce in the average pricing for 1,500hp AC-electric rigsfrom $16 kpd to $18 kpd, with leading edge at $20-22 kpd, pricing traction isslowing. Utilization for 1,500hp AC-electric rigs is above 90% and producers aresaying there is a very limited selection of high-specification rigs left, but we expectthe subdued level of activity in 2018 will keep prices from breaking out to andabove the $25 kpd level.
Most contractors do not intend to fund newbuilds in this environmentIn the late 1990s, HP began rolling out its proprietary FlexRig designs, which wereleading edge land rigs with enhanced mobility and faster rates of penetration.The company delivered over 390 of these rigs, mainly in the US, and was ableto exploit a significant competitive edge for almost a decade. In the mid-2000s,the peers developed their own proprietary rigs and started their own newbuildprograms with some deliveries still in the pipeline.
Figure 50: AC-electric fleet growth Figure 51: Additions of AC-electric rigs
0
200
400
600
800
1,000
1,200
1Q11
3Q11
1Q12
3Q12
1Q13
3Q13
1Q14
3Q14
1Q15
3Q15
1Q16
3Q16
1Q17
HP NBR PTEN PD Other
0
10
20
30
40
50
60
70
1Q11
2Q11
3Q11
4Q11
1Q12
2Q12
3Q12
4Q12
1Q13
2Q13
3Q13
4Q13
1Q14
2Q14
3Q14
4Q14
1Q15
2Q15
3Q15
4Q15
1Q16
2Q16
3Q16
4Q16
1Q17
2Q17
Source: Company reports Source: Company reports
Page 20 Deutsche Bank Securities Inc.

9 October 2017
Oil Services & Equipment
Initiation of coverage
But since the collapse in oil prices, the playbook has changed. While the industrycontinues to demand technology that increases drilling efficiencies and reducescosts, the imbalance in the land rig market is not supporting the $25 kpddayrate threshold many contractors say is needed to justify newbuilds. With spotrates in the high-teens, the industry is focused on upgrading rigs to super-speccapabilities, which are earning leading edge rates of $20-22 kpd.
The alternative to funding newbuilds is funding upgrades to super-specSuper-spec rigs are 1,500hp AC-electric rigs that are pad capable, have a thirdmud pump, a 7,500 psi mud system, a 750k lb. hook load, a fourth engine anda 25,000-ft pipe racking capacity. In essence it is a rig with superior mobilitycharacteristics that enables a producer to drill longer, better quality laterals at afaster rate of penetration, and then move quickly to the next well on the pad.There is high demand for these rigs and producers are paying a $2 kpd premiumon 12-24 month contracts to secure access. Utilization of super-spec rigs is nowabove 90%, but pricing is not acting like utilization is that high.
Figure 52: Super-spec rig market share Figure 53: Inventory of potential upgrades to super-spec
HP
32%
PTEN
23%
NBR
16%
PD
13%
Other
16%
0
20
40
60
80
100
120
140
HP PTEN NBR PD
Rigs
Source: Company reports Source: Company reports
There are varying opinions of how many super-spec rigs there really are, butPatterson-UTI has guided to a fleet of 465 as of 2Q17, which is up from 375 in4Q16. Helmerich & Payne has the largest market share and the largest inventoryof rigs it can upgrade, with 122 candidates that would cost $2-3 million each.Patterson-UTI is currently upgrading seven of its APEX 1000 rigs from theAppalachia region for about $8 million apiece and moving them to west Texas.Nabors has about 23 left as of 2Q17, and intends to complete all of them by early2018.
Overall, there is the potential to add another 200 super-spec rigs through 2018,which probably has something to do with the less than customary leverage inpricing. But the $2 kpd premium is attracting the upgrade capital, so the questionbecomes opportunity set. As of August 2017, 26% of the horizontal or directionalwells being drilled were done so using mechanical or SCR rigs. Assuming a flatrigs count in 2018, replacing these rigs for performance reasons seems to be themain opportunity.
Deutsche Bank Securities Inc. Page 21

9 October 2017
Oil Services & Equipment
Initiation of coverage
Encouraging that the consensus acknowledged the EPS vulnerabilityThe rapid snap back in the US rig count prompted swift positive EPS revisionsbecause that was the customary course of action. That was discouraging and itstretched out our long-standing negative outlook on the group because in ourview the old cyclical playbook was obsolete. The development of tight oil involveda series of disruptive technologies that had derailed the normalization of thecycle. While it created new, more service intense markets (hydraulic fracturingand sand), it also created challenges for markets including land drilling. So it is atleast encouraging that expectations have been reset lower. The standout is PTEN,which because of its shift in revenue mix toward frac, the company rightfully ismaintained a strong earnings growth outlook.
Figure 54: HP 2018 EPS revisions Figure 55: PTEN 2018 EPS revisions
(0.70)
(0.60)
(0.50)
(0.40)
(0.30)
(0.20)
(0.10)
0.00
0.10
0.20
0.30
0.40
Apr-16
May-16
Jun-16
Jul-16
Aug-16
Sep-16
Oct-16
Nov-16
Dec-16
Jan-17
Feb-17
Mar-17
Apr-17
May-17
Jun-17
Jul-17
Aug-17
Sep-17
EPS
(1.20)
(1.00)
(0.80)
(0.60)
(0.40)
(0.20)
0.00
0.20
Apr-16
May-16
Jun-16
Jul-16
Aug-16
Sep-16
Oct-16
Nov-16
Dec-16
Jan-17
Feb-17
Mar-17
Apr-17
May-17
Jun-17
Jul-17
Aug-17
Sep-17
EPS
Source: Factset Source: Factset
Figure 56: NBR 2018 EPS revisions Figure 57: PDS 2018 EPS revisions
(0.70)
(0.60)
(0.50)
(0.40)
(0.30)
(0.20)
(0.10)
0.00
0.10
Apr-16
May-16
Jun-16
Jul-16
Aug-16
Sep-16
Oct-16
Nov-16
Dec-16
Jan-17
Feb-17
Mar-17
Apr-17
May-17
Jun-17
Jul-17
Aug-17
Sep-17
EPS
(0.25)
(0.20)
(0.15)
(0.10)
(0.05)
0.00
0.05
Apr-16
May-16
Jun-16
Jul-16
Aug-16
Sep-16
Oct-16
Nov-16
Dec-16
Jan-17
Feb-17
Mar-17
Apr-17
May-17
Jun-17
Jul-17
Aug-17
Sep-17
EPS
Source: Factset Source: Factset
Earnings power has been in a longer-term down trendWith the exception of HP, the top North American land drillers have beenexperiencing a long-term erosion in earnings power. We expect this cycle to takeit another leg down for the group in terms of peak earnings achieved, with themost resilient being PTEN because of its increased exposure to the frac market.
Page 22 Deutsche Bank Securities Inc.

9 October 2017
Oil Services & Equipment
Initiation of coverage
Figure 58: HP annual EPS Figure 59: PTEN annual EPS
4.15
6.20
(2.00)
(1.00)
0.00
1.00
2.00
3.00
4.00
5.00
6.00
7.00
20
03
20
04
20
05
20
06
20
07
20
08
20
09
20
10
20
11
20
12
20
13
20
14
20
15
20
16
20
17
20
18
(a) (a) (a) (a) (a) (a) (a) (a) (a) (a) (a) (a) (a) (a) (e) (e)
EP
S
4.03
2.08
(3.00)
(2.00)
(1.00)
0.00
1.00
2.00
3.00
4.00
5.00
20
02
20
03
20
04
20
05
20
06
20
07
20
08
20
09
20
10
20
11
20
12
20
13
20
14
20
15
20
16
20
17
20
18
(a) (a) (a) (a) (a) (a) (a) (a) (a) (a) (a) (a) (a) (a) (a) (e) (e)
EP
S
Source: Company reports, Deutsche Bank Source: Company reports, Deutsche Bank
Figure 60: NBR annual EPS Figure 61: PDS annual EPS3.60
1.72
(2.00)
(1.00)
0.00
1.00
2.00
3.00
4.00
20
02
20
03
20
04
20
05
20
06
20
07
20
08
20
09
20
10
20
11
20
12
20
13
20
14
20
15
20
16
20
17
20
18
(a) (a) (a) (a) (a) (a) (a) (a) (a) (a) (a) (a) (a) (a) (a) (e) (e)
EP
S
0.66
(0.80)
(0.60)
(0.40)
(0.20)
0.00
0.20
0.40
0.60
0.80
1.00
1.20
2009 2010 2011 2012 2013 2014 2015 2016 2017 2018
(a) (a) (a) (a) (a) (a) (a) (a) (e) (e)
EP
S
Source: Company reports, Deutsche Bank Source: Company reports, Deutsche Bank
PTEN’s leverage to frac market embeds more operating leverage to cycleWhile HP had remarkable growth through 2014, this cycle is likely to deflate itsleverage more so than its peers. All four are devising strategies to rejuvenateearnings, and HP is so far focusing on market share while the others, especiallyNabors, are adding service content to extract more value per rig.
Figure 62: Top 4 land drillers EBITDA combined Figure 63: PTEN has retained most EBITDA leverage
-
1,000
2,000
3,000
4,000
5,000
6,000
2007 2008 2009 2010 2011 2012 2013 2014 2015 2016 2017 2018
(e) (e)
$ in
mill
ion
s
-
50
100
150
200
250
20
07
20
08
20
09
20
10
20
11
20
12
20
13
20
14
20
15
20
16
20
17
20
18
(e) (e)
Ind
exe
d t
o 2
00
7
HP PTEN NBR PD
Source: Company reports, Deutsche Bank Source: Company reports, Deutsche Bank
Deutsche Bank Securities Inc. Page 23

9 October 2017
Oil Services & Equipment
Initiation of coverage
Figure 64: Total US land drilling market share Figure 65: AC rig market share
HP
21%
PTEN
16%
NBR
11%PD
7%
Other
45%
EN
16%
HP
29%
PTEN
20%NBR
16%
PD
8%
Other
27%
Source: Company reports, Deutsche Bank Source: Company reports, Deutsche Bank
Emerging trendsProducers are focused on lowering well costs, drilling wells faster, and increasingreservoir contact. They are tailoring drilling programs to harvest core acreage tofast track cash flow. Ultimately producers are striving for increasingly higher IPsand EURs per F&D dollar invested as the call for capital discipline gets louder.That means there is high demand for technologies that improve rig functionalityand performance for:
■ Mobility (pad drilling)
■ Rates-of-penetration (ROP)
■ Tripping performance
■ Precision well placement
Drilling contractors are focused on competitive positioning. They are achievingthis through improving rig functionality, performance and mobility. The keyenablers for industrialized resource development are efficiency, reduced costs,technology and scale. Every step is measurable, benchmarked, and improved. Assuch, contractors are emphasizing their technology and applications that enabledrilling automation and machine learning. They are increasing service content toextract more value from their installed base of rigs. Some of the core disciplinesin focus are:
■ Tubular running services (TRS)
■ Directional drilling, measurement-while-drilling (MWD)
■ Managed pressure drilling (MPD)
In the long run, full drilling automation is the objective. Nabors has introducedthe SMARTRig and the iRIG with the intention of bringing full automation to theindustry. Schlumberger has thrown its hat in the ring with its own land rig designfor which it plans to extract increasingly more drilling efficiencies and value fromthe land rig.
Page 24 Deutsche Bank Securities Inc.

9 October 2017
Oil Services & Equipment
Initiation of coverage
Figure 66: HP regional rig exposure Figure 67: PTEN regional rig exposure
Permian
47%
Eagle Ford
14%
SCOOP/STACK
17%
Haynesville
4%
Bakken
4%
Niobrara
3%
Marcellus
1%Utica
3%
Other
7% W. TX
(Permian)
25%
Appalachia
18%
Mid-Continent
18%
S. TX
13%
E. TX
11%
Rockies
8%
N. Dakota
5%
Canada
2%
Source: Company reports Source: Company reports
Figure 68: NBR regional rig exposure Figure 69: PDS regional rig exposure
Permian
28%
Eagle Ford
10%
SCOOP/STACK
5%Haynesville
12%
Bakken
21%
Niobrara
2%
Marcellus
3%
Other
19%
Permian
55%
Eagle Ford
8%
SCOOP/STACK
6%
Haynesville
4%
Bakken
2%
Niobrara
8%
Marcellus
8%
Other
9%
Source: Bloomberg Finance LP Source: Bloomberg Finance LP
Deutsche Bank Securities Inc. Page 25

9 October 2017
Oil Services & Equipment
Initiation of coverage
Hydraulic Fracturing
Hydraulic fracturing in the US is one of the very few service disciplines that isundersupplied with some pricing traction. There have been a confluence of trendsleading the industry here including a higher penetration of pad drilling, longerlaterals, tighter stage spacing, more frac clusters and higher sand loadings, whichhave all contributed to the need for more horsepower staying on location longer.The average frac spread has increased from about 40k hydraulic horsepower (hhp)to 50k hhp to compensate for maintenance rotations on multi-well pads. Theindustry has also experienced a higher cadence of wells per rig, which is a trendthat appears to be slowing though.
Figure 70: Horizontal wells vs. frac demand Figure 71: Total and marketed frac utilization
0
2
4
6
8
10
12
14
16
18
0
1,000
2,000
3,000
4,000
5,000
6,000
3Q
11
1Q
12
3Q
12
1Q
13
3Q
13
1Q
14
3Q
14
1Q
15
3Q
15
1Q
16
3Q
16
1Q
17
3Q
17
Millio
n h
hp
Ho
rizo
nta
l w
ell
s fr
ac'
d
Total HZ wells frac'd Total hhp demand
0%
20%
40%
60%
80%
100%
120%
3Q
11
4Q
11
1Q
12
2Q
12
3Q
12
4Q
12
1Q
13
2Q
13
3Q
13
4Q
13
1Q
14
2Q
14
3Q
14
4Q
14
1Q
15
2Q
15
3Q
15
4Q
15
1Q
16
2Q
16
3Q
16
4Q
16
1Q
17
Ho
rizo
nta
l w
ell
s fr
ac'
d
Marketed supply Total supply
Source: IHS Markit, Deutsche Bank Source: IHS Markit, Deutsche Bank
Active frac capacity is booked through year-end 2017The rapid recovery in drilling activity that began in June 2016 combined withan initial drawdown of drilled but uncompleted wells (DUCs) at the onset of theoil price inflection (largely in the Bakken) has pushed the demand for hydraulicfracturing up to 12 million hhp from the low of 6 million in early 2016. Marketedutilization has risen above 80% from about 58% with pricing pivoting in 4Q16.Most of the major frac companies are indicating fully booked frac calendarsthrough year-end 2017 with some contractors suggesting the market is currentlyundersupplied by about 1.5–2.0 million hhp. Attrition is also picking up with somemanagements suggesting it is as high 3.5 million hhp per year. The key driver isthe increased job intensity that is chewing up the equipment faster and reducingthe useful life, which means maintenance capex is rising.
Price inflation in frac is leading other service disciplinesThere is pricing power, but it is modest relative to the tightness in the market. Thereason being is the available hhp that is being reactivated through year-end andinto early 2018. While some companies suggest pricing does not justify newbuildsyet, there is at least 1.0 million hhp that has been ordered already and costs areback up to $1,000/hhp. Newbuild lead times are currently 9-12 months for mostexcept HAL, which can launch equipment in a month.
Page 26 Deutsche Bank Securities Inc.

9 October 2017
Oil Services & Equipment
Initiation of coverage
Figure 72: DUCs rising again due to frac bottleneck Figure 73: US onshore wells frac’d
-
1,000
2,000
3,000
4,000
5,000
6,000
Jan
-14
Ap
r-1
4
Jul-
14
Oct
-14
Jan
-15
Ap
r-1
5
Jul-
15
Oct
-15
Jan
-16
Ap
r-1
6
Jul-
16
Oct
-16
Jan
-17
Ap
r-1
7
Jul-
17
Permian Eagle Ford Bakken Anadarko
0
1,000
2,000
3,000
4,000
5,000
6,000
7,000
8,000
9,000
10,000
3Q
11
1Q
12
3Q
12
1Q
13
3Q
13
1Q
14
3Q
14
1Q
15
3Q
15
1Q
16
3Q
16
1Q
17
3Q
17
1Q
18
3Q
18
We
lls
fra
c'd
Actual DBe
Source: EIA Source: IHS Markit , Deutsche Bank
Frac demand is poised to recover to the 2014 highsDespite our flat rig count outlook for 2018, the demand for frac hhp continuesto move higher, exiting 2018 near the 2014 highs in our view. With producerstailoring their rig programs to focus increasingly on their core acreage withoptimized completion designs for maximized reservoir contact, the average laterallengths, stage densities, and sand loadings are all moving higher on pads thatare slowly getting larger. Producers are effectively concentrating their existingrig count on their larger, more productive wells, thus the call on frac demand isdisproportionately higher now than it was in 2014 when only about 55-60% ofthe rigs working were focused on optimized development drilling. The rest weredoing hold-by-production, exploration or delineation drilling.
Figure 74: US hydraulic horsepower demand Figure 75: US frac pricing indexed to 100 at 3Q11
-
2.0
4.0
6.0
8.0
10.0
12.0
14.0
16.0
18.0
3Q
11
1Q
12
3Q
12
1Q
13
3Q
13
1Q
14
3Q
14
1Q
15
3Q
15
1Q
16
3Q
16
1Q
17
3Q
17
1Q
18
3Q
18
MM
HH
P
Actual DBe
0
20
40
60
80
100
120
3Q11
4Q11
1Q12
2Q12
3Q12
4Q12
1Q13
2Q13
3Q13
4Q13
1Q14
2Q14
3Q14
4Q14
1Q15
2Q15
3Q15
4Q15
1Q16
2Q16
3Q16
4Q16
1Q17
2Q17
3Q17
Source: IHS Markit, Deutsche Bank Source: IHS Markit, Deutsche Bank
Deutsche Bank Securities Inc. Page 27

9 October 2017
Oil Services & Equipment
Initiation of coverage
Figure 76: Average Permian horizontal lateral lengths Figure 77: Average US frac stages per well
0
1,000
2,000
3,000
4,000
5,000
6,000
7,000
8,000
2011 2012 2013 2014 2015 2016 2017 2018 2019
Feet
0
5
10
15
20
25
30
35
2011 2012 2013 2014 2015 2016 2017 2018 2019
Fra
c st
ag
es
pe
r w
ell
Source: IHS Markit Source: IHS Markit
Still a fragmented marketHalliburton is still the largest US frac provider with about 13% market sharefollowed by the OneStim JV between Schlumberger and Weatherford. In termsof concentrated earnings exposure, C&J Energy, RPC, Patterson and SuperiorEnergy have the highest bottom line exposures within our coverage universe.
Figure 78: Top US frac providers Figure 79: US market share of top 10 frac companies
-
500
1,000
1,500
2,000
2,500
3,000
MM
hh
p
Top 10
69%
Others
31%
Source: IHS Markit, Deutsche Bank Source: IHS Markit, Deutsche Bank
Page 28 Deutsche Bank Securities Inc.

9 October 2017
Oil Services & Equipment
Initiation of coverage
Bakken
Figure 80: Leading edge production Figure 81: Current activity levels
Production
Oil 985 kb/d
Gas 1,783,431 MCF/d
Rig Count
Oil 49
Gas 0
Total 49
Source: dmr.nd.gov Source: Baker Hughes, a GE Company
Figure 82: Production Figure 83: Rig count
0
200,000
400,000
600,000
800,000
1,000,000
1,200,000
1,400,000
1,600,000
1,800,000
2,000,000
0
200
400
600
800
1,000
1,200
1,400
Jan-14 Jul-14 Jan-15 Jul-15 Jan-16 Jul-16 Jan-17
MC
F/D
KB
/D
Oil (LHS) Gas (RHS)
0
50
100
150
200
250
Oil Gas
Source: dmr.nd.gov Source: Baker Hughes, a GE Company
Figure 84: Top operators Figure 85: Land rig market leaders
2017 Production (mboe/d) Active Rig Count
1. Continental Resources 1. Oasis Petroleum
2. Whiting Petroleum Corporation 2. Marathon Oil
3. Hess Corporation 3. Continental Resources
4. ExxonMobil 4. ConocoPhillips
5. Crescent Point
Top Rig Contractors Mkt Share
1. Nabors 37%
2. Patterson UTI 16%
3. Helmerich & Payne 14%
4. Cyclone Drilling 6%
Source: Wood Mackenzie, RADAR Source: RADAR
Figure 86: Regional frac fundamentals Figure 87: Frac market leaders
Pressure Pumping
Active Warm-stack Cold-stack Total
HHP 567,250 209,000 75,000 851,250
Spreads 20 9 3 32
Utilization 67%
Top Pressure Pumpers Mkt Share
1. Schlumberger 19%
2. Liberty Oilfield Services 14%
3. Calfrac Well Services 12%
4. Keane Group 12%
5. Halliburton 10%
Source: IHS markit Source: IHS markit
Deutsche Bank Securities Inc. Page 29

9 October 2017
Oil Services & Equipment
Initiation of coverage
DJ Niobrara
Figure 88: Leading edge production Figure 89: Current activity levels
Production
Oil 450 kb/d
Gas 4,611,182 MCF/d
Rig Count
Oil 26
Gas 0
Total 26
Source: EIA Source: Baker Hughes, a GE Company
Figure 90: Production Figure 91: Rig count
4,100,000
4,200,000
4,300,000
4,400,000
4,500,000
4,600,000
4,700,000
0
100
200
300
400
500
600
Jan-14 Jul-14 Jan-15 Jul-15 Jan-16 Jul-16 Jan-17
MC
F/D
KB
/D
Oil (LHS) Gas (RHS)
0
10
20
30
40
50
60
Jan-14
Mar-14
May-14
Jul-14
Sep-14
Nov-14
Jan-15
Mar-15
May-15
Jul-15
Sep-15
Nov-15
Jan-16
Mar-16
May-16
Jul-16
Sep-16
Nov-16
Jan-17
Mar-17
May-17
Jul-17
Oil Gas
Source: EIA Source: Baker Hughes, a GE Company
Figure 92: Top operators Figure 93: Land rig market leaders2017 Production (mboe/d) Active Rig Count
1. Anadarko 1. Anadarko
2. Noble Energy 2. PDC Energy
3. PDC Energy 3. Noble Energy
4. Bonanza Creek Energy 4. Crestone Peak Resources
5. Synergy Resources
Top Rig Contractors Mkt Share
1. Ensign USA 27%
2. Precision Drilling 19%
3. Xtreme Drilling 15%
4. Helmerich & Payne 12%
Source: Wood Mackenzie, RADAR Source: RADAR
Figure 94: Regional frac fundamentals Figure 95: Frac market leaders
Pressure Pumping
Active Warm-stack Cold-stack Total
HHP 623,000 126,000 0 749,000
Spreads 19 3 0 22
Utilization 83%
Top Pressure Pumpers Mkt Share
1. Halliburton 41%
2. Liberty Oilfield Services 20%
3. Calfrac Well Services 15%
4. C&J Energy Services 12%
5. Basic Energy Services 7%
Source:IHS markit Source: IHS markit
Page 30 Deutsche Bank Securities Inc.

9 October 2017
Oil Services & Equipment
Initiation of coverage
Eagle Ford
Figure 96: Leading edge production Figure 97: Current activity levels
Production
Oil 981 kb/d
Gas 2,375,125 MCF/d
Rig Count
Oil 60
Gas 8
Total 68
Source: Texas RRC Source: Baker Hughes, a GE Company
Figure 98: Production Figure 99: Rig count
0
500,000
1,000,000
1,500,000
2,000,000
2,500,000
3,000,000
3,500,000
4,000,000
4,500,000
0
200
400
600
800
1,000
1,200
1,400
1,600
1,800
Jan-14 Jul-14 Jan-15 Jul-15 Jan-16 Jul-16 Jan-17
MC
F/D
KB
/D
Oil (LHS) Gas (RHS)
0
50
100
150
200
250
Jan-14
Mar-14
May-14
Jul-14
Sep-14
Nov-14
Jan-15
Mar-15
May-15
Jul-15
Sep-15
Nov-15
Jan-16
Mar-16
May-16
Jul-16
Sep-16
Nov-16
Jan-17
Mar-17
May-17
Jul-17
Oil Gas
Source: Texas RRC Source: Baker Hughes, a GE Company
Figure 100: Top operators Figure 101: Land rig market leaders
2017 Production (mboe/d) Active Rig Count
1. EOG Resources 1. EOG Resources
2. ConocoPhillips 2. Chesapeake Energy
3. Marathon Oil 3. ConocoPhillips
4. Chesapeake Energy 4. Sanchez Oil & Gas
5. Sanchez Energy Corporation
Top Rig Contractors Mkt Share
1. Helmerich & Payne 35%
2. Patterson UTI 28%
3. Nabors Industries 14%
4. Precision Drilling 6%
Source: Wood Mackenzie, RADAR Source: RADAR
Figure 102: Regional frac fundamentals Figure 103: Frac market leaders
Pressure Pumping
Active Warm-stack Cold-stack Total
HHP 1,665,000 278,000 375,500 2,318,500
Spreads 42 7 9 58
Utilization 72%
Top Pressure Pumpers Mkt Share
1. Universal (PTEN) 18%
2. Schlumberger 16%
3. Halliburton 14%
4. FTS International 13%
5. Calfrac Well Services 8%
Source: IHS markit Source: IHS markit
Deutsche Bank Securities Inc. Page 31

9 October 2017
Oil Services & Equipment
Initiation of coverage
Haynesville
Figure 104: Leading edge production Figure 105: Current activity levels
Production
Oil 45 kb/d
Gas 6,296,425 MCF/d
Rig Count
Oil 2
Gas 43
Total 45
Source: EIA Source: Baker Hughes, a GE Company
Figure 106: Production Figure 107: Rig Count
5,200,000
5,400,000
5,600,000
5,800,000
6,000,000
6,200,000
6,400,000
6,600,000
6,800,000
7,000,000
0
10
20
30
40
50
60
70
Jan-14 Jul-14 Jan-15 Jul-15 Jan-16 Jul-16 Jan-17
MC
F/D
KB
/D
Oil (LHS) Gas (RHS)
0
5
10
15
20
25
30
35
40
45
50
Title
Oil Gas
Source: EIA Source: Baker Hughes, a GE Company
Figure 108: Top operators Figure 109: Land rig market leaders
2017 Production (mboe/d) Active Rig Count
1. Chesapeake Energy 1. Indigo Minerals
2. Range Resources Corp 2. GEP Haynesville
3. ExxonMobil 3. EXCO Resources
4. BHP Billiton 4. Comstock Resources
5. GeoSouthern Energy
Top Rig Contractors Mkt Share
1. Nabors Industries 25%
2. Patterson UTI 21%
3. Independence Contractors 14%
4. Helmerich & Payne 14%
Source: Wood Mackenzie, RADAR Source: RADAR
Figure 110: Regional frac fundamentals Figure 111: Frac market leaders
Pressure Pumping
Active Warm-stack Cold-stack Total
HHP 478,000 130,000 0 608,000
Spreads 9 2 0 11
Utilization 79%
Top Pressure Pumpers Mkt Share
1. FTS International 41%
2. Cudd Energy Services 21%
3. Halliburton 16%
4. C&J Energy Services 8%
5. BJ Services 7%
Source: IHS markit Source: IHS markit
Page 32 Deutsche Bank Securities Inc.

9 October 2017
Oil Services & Equipment
Initiation of coverage
Marcellus
Figure 112: Leading edge production Figure 113: Current activity levels
Production
Oil 40 kb/d
Gas 19,156,560 MCF/d
Rig Count
Oil 0
Gas 47
Total 47
Source: EIA Source: Baker Hughes, a GE Company
Figure 114: Production Figure 115: Rig Count
0
5,000,000
10,000,000
15,000,000
20,000,000
25,000,000
0
5
10
15
20
25
30
35
40
45
50
Jan-14 Jul-14 Jan-15 Jul-15 Jan-16 Jul-16 Jan-17
MC
F/D
KB
/D
Oil (LHS) Gas (RHS)
0
10
20
30
40
50
60
70
80
90
100
Title
Oil Gas
Source: EIA Source: Baker Hughes, a GE Company
Figure 116: Top Operators Figure 117: Land Rig Market Leaders
2017 Production (mboe/d) Active Rig Count
1. EQT Corporation 1. EQT Corporation
2. Antero Resources 2. Range Resources
3. Cabot Oil & Gas 3. Rice Energy
4. Southwestern Energy 4. Southwestern Energy
5. Chesapeake Energy
Top Rig Contractors Mkt Share
1. Patterson UTI 31%
2. Falcon Drilling 14%
3. Precision Drilling 11%
4. SWN Drilling Co. 9%
Source: Wood Mackenzie, RADAR Source: RADAR
Figure 118: Regional frac fundamentals Figure 119: Frac market leaders
Pressure Pumping
Active Warm-stack Cold-stack Total
HHP 478,000 130,000 0 608,000
Spreads 9 2 0 11
Utilization 79%
Top Pressure Pumpers Mkt Share
1. Universal (PTEN) 19%
2. US Well Services 12%
3. FTS International 11%
4. Keane Group 10%
5. Halliburton 9%
Source: IHS markit Source: IHS markit
Deutsche Bank Securities Inc. Page 33

9 October 2017
Oil Services & Equipment
Initiation of coverage
MidCon
Figure 120: Leading edge production Figure 121: Current activity levels
Production
Oil 433 kb/d
Gas 6,691,000 MCF/d
Rig Count
Oil 63
Gas 0
Total 63
Source: EIA Source: Baker Hughes, a GE Company
Figure 122: Production Figure 123: Rig Count
0
1,000,000
2,000,000
3,000,000
4,000,000
5,000,000
6,000,000
7,000,000
8,000,000
0
100
200
300
400
500
600
Jan-14 Jul-14 Jan-15 Jul-15 Jan-16 Jul-16 Jan-17
MC
F/D
KB
/D
Oil (LHS) Gas (RHS)
0
10
20
30
40
50
60
70
Oil Gas
Source: EIA Source: Baker Hughes, a GE Company
Figure 124: Top operators Figure 125: Land rig market leaders
2017 Production (mboe/d) Active Rig Count
1. Devon Energy 1. Continental Resources
2. Continental Resources 2. Marathon Oil
3. Newfield Exploration 3. Newfield Exploration
4. Cimarex Energy 4. Devon Energy
5. ExxonMobil 5. Gulfport Energy
Top Rig Contractors Mkt Share
1. Helmerich & Payne 21%
2. Cactus Drilling 19%
3. Patterson UTI 18%
4. Unit Corp 12%
5. Nabors Industries 6%
Source: Wood Mackenzie, RADAR Source: RADAR
Figure 126: Regional frac fundamentals Figure 127: Frac market leaders
Pressure Pumping
Active Warm-stack Cold-stack Total
HHP 1,151,500 321,150 160,000 1,632,650
Spreads 35 11 5 51
Utilization 71%
Top Pressure Pumpers Mkt Share
1. Universal (PTEN) 18%
2. Halliburton 11%
3. Quintana Energy Services 10%
4. Basic Energy Services 8%
5. Keane Group 8%
Source: IHS markit Source: IHS markit
Page 34 Deutsche Bank Securities Inc.
9 October 2017
Oil Services & Equipment
Initiation of coverage
Permian
Figure 128: Leading edge production Figure 129: Current activity levels
Production
Oil 1,501 kb/d
Gas 1,340,123 MCF/d
Rig Count
Oil 386
Gas 0
Total 386
Source: Texas RRC Source: Baker Hughes, a GE Company
Figure 130: Production Figure 131: Rig Count
600,000
700,000
800,000
900,000
1,000,000
1,100,000
1,200,000
1,300,000
1,400,000
1,500,000
1,600,000
600
800
1,000
1,200
1,400
1,600
1,800
Jan-14 Jul-14 Jan-15 Jul-15 Jan-16 Jul-16 Jan-17
MC
F/D
KB
/D
Oil (LHS) Gas (RHS)
0
100
200
300
400
500
600
Jan-14
Mar-14
May-14
Jul-14
Sep-14
Nov-14
Jan-15
Mar-15
May-15
Jul-15
Sep-15
Nov-15
Jan-16
Mar-16
May-16
Jul-16
Sep-16
Nov-16
Jan-17
Mar-17
May-17
Jul-17
Oil Gas
Source: Texas RRC Source: Baker Hughes, a GE Company
Figure 132: Top Operators Figure 133: Land rig market leaders
2017 Production (mboe/d) Active Rig Count
1. Occidental Petroleum 1. Pioneer Natural Resources
2. Pioneer Natural Resources 2. Apache Corp
3. Chevron 3. Newfield Exploration
4. Concho Resources 4. Concho Resources
5. Apache Corp 5. Occidental Petroleum
Top Rig Contractors Mkt Share
1. Helmerich & Payne 23%
2. Patterson UTI 10%
3. Precision Drilling 7%
4. Nabors Industries 7%
5. Trinidad Drilling 6%
Source: Wood Mackenzie, RADAR Source: RADAR
Figure 134: Regional frac fundamentals Figure 135: Frac market leaders
Pressure Pumping
Active Warm-stack Cold-stack Total
HHP 3,913,500 595,000 169,000 4,677,500
Spreads 116 21 7 144
Utilization 84%
Top Pressure Pumpers Mkt Share
1. Halliburton 15%
2. ProPetro 11%
3. Schlumberger 8%
4. Keane Group 8%
5.Liberty Oilfield Services 7%
Source: IHS markit Source: IHS markit
Deutsche Bank Securities Inc. Page 35

9 October 2017
Oil Services & Equipment
Initiation of coverage
Offshore Drilling Facing Unprecedented Challenges
Deepwater markets are in the midst of a very long transitionThis is the most challenging environment the deepwater drilling industry has everfaced. Over the past three years, the industry has endured an unusually severedecline in rig fixtures, an unprecedented wave of early contract terminations,and a sizeable withdrawal of customers. The supply demand imbalance is unlikeanything the industry has ever experienced. Balance sheets are being tested,pricing tactics are fierce, and rigs are being scrapped at a record pace. After allis said and done, the earnings power of the industry has diminished severely andcompanies are seeking ways to reestablish themselves in the value chain.
But after a long wait, the deepwater market is finding a bottom. Deepwater finalinvestment decisions (FIDs) are finally coming in, breakeven prices are movinglower, and tendering activity is picking up. But the recovery is likely to be slowand laborious. The supply demand imbalance and the balance sheet stresses aregoing to keep the fierce pricing tactics in play for a number of years in our view.
This will sooner or later reconfigure the industry. We expect M&A will play a majorrole in the coming months, which presents another quandary. The best companiesin terms of fiscal stability, which has been a key investment factor, are also theprimary suitors. The apathy in this space will not stop sharp scrutiny on deals.The firmly entrenched negative sentiment may judge each deal as too early, tooexpensive, and too taxing on the balance sheet. It is unlikely any suitor will get asgood of a deal as the market thinks it should.
Having said that, we believe Transocean has been ahead of the curve in terms ofcash preservation, and its proposed acquisition of Songa Offshore provides thecompany with $4.1 billion of backlog, $0.7 billion of new annual revenues through2022, and exposure to one of the key deepwater markets, Norway.
Figure 136: Total floater utilization Figure 137: High-specification floater utilization
40%
50%
60%
70%
80%
90%
100%
Jan
-85
Jan
-87
Jan
-89
Jan
-91
Jan
-93
Jan
-95
Jan
-97
Jan
-99
Jan
-01
Jan
-03
Jan
-05
Jan
-07
Jan
-09
Jan
-11
Jan
-13
Jan
-15
Jan
-17
Total utilization Marketed utilization
0%
20%
40%
60%
80%
100%
120%
Jan
-85
Jan
-87
Jan
-89
Jan
-91
Jan
-93
Jan
-95
Jan
-97
Jan
-99
Jan
-01
Jan
-03
Jan
-05
Jan
-07
Jan
-09
Jan
-11
Jan
-13
Jan
-15
Jan
-17
Total utilization Marketed utilization
Source: ODS-Petrodata, Deutsche Bank Source: ODS-Petrodata, Deutsche Bank
Page 36 Deutsche Bank Securities Inc.

9 October 2017
Oil Services & Equipment
Initiation of coverage
Figure 138: Floating rig backlog additions have plunged Figure 139: Floating rig backlog in rig years improving
25.0
16.5
4.7
3.2 3.1
0
5
10
15
20
25
30
2013 2014 2015 2016 2017
In b
illio
n o
f U
SD
158
108
45 44 52
0
20
40
60
80
100
120
140
160
180
2013 2014 2015 2016 2017
Rig
ye
ars
Source: ODS-Petrodata, Deutsche Bank Source: ODS-Petrodata, Deutsche Bank
Unusually severe decline in deepwater rig fixturesThe deepwater has experienced downturns, but none that have depressed itsbook-to-bill to a mere 15% for three consecutive years. In 2014, the industrybooked $16.5 billion of backlog for a book-to-bill of 43%. After the fall in oil prices,new fixtures promptly dropped to $4.7 billion in 2015 and $3.2 billion in 2016. Rigyears booked have increased in 2017, but near breakeven dayrates have been adrag on the backlog value at just $3.1 billion.
Early contract terminations were a major destabilizing factorThe frequency of early terminations has wound down. Since the peak in 2014,there has been an unprecedented wave of early contract terminations that havetotaled 86 rig years and $14 billion in backlog. About $6.9 billion was cancelledin 2015 followed by $6.3 billion in 2016 and only $0.3 billion in 2017.
Figure 140: Early terminations sorted by rig contractor Figure 141: Early terminations sorted by operator
0 2 4 6 8 10 12 14
Transocean
Seadrill
Diamond Offshore
Ensco
China Oilfield
North Atlantic Drilling
Petroserv
Odebrecht
Vantage
Noble
Ocean Rig
Paragon Offshore
Rowan Companies
Stena Drilling
Maersk Drilling
Atwood Oceanics
Pacific Drilling
Saipem
Sevan Drilling
Awilco Drilling
Fred Olsen Energy
Odfjell
Songa Offshore
Rig years
0 5 10 15 20 25 30 35
Petrobras
Statoil
Total
Rosneft
Pemex
Reliance
Freeport McMoRan
BP
ConocoPhillips
Shell
Chevron
ExxonMobil
Tullow
Stone Energy
Marathon
ENI
Cobalt
Murphy Oil
Repsol
Dana
Hess
Anadarko
Premier Oil
Rig years
Source: ODS-Petrodata, Deutsche Bank Source: ODS-Petrodata, Deutsche Bank
Deutsche Bank Securities Inc. Page 37

9 October 2017
Oil Services & Equipment
Initiation of coverage
Sizeable withdraw of customersThe number of operators contracting rigs has fallen significantly and is likelyto keep falling in the coming years in our view. There were 86 operators usingfloaters in 2014, which was a high for the industry. Half had demand only forone rig year or less, but that landscape has since eroded and has left the marketmore dependent on the glacial spending habits of the major deepwater operators,which were 72% of the floater expenditures in 2014.
Figure 142: Customer landscape for floating rigs shrank
0
10
20
30
40
50
60
70
80
90
100
2014 2015 2016 2017(e) 2018(e) 2019(e)
Cu
sto
me
rs
< 1 rig yr 1-4 rig yrs > 4 rig yrs
Source: ODS-Petrodata, Deutsche Bank
Figure 143: Revenues in backlog for the top floating rig customers
Operator 2014 2015 2016 2017 2018 2019
Petrobras 8,272 7,083 5,090 4,372 3,931 3,434
Statoil 2,873 2,353 1,690 1,131 970 749
Shell 3,060 2,423 1,755 1,262 1,363 1,218
BP 2,669 2,499 2,082 1,781 1,403 1,239
Total 2,318 1,906 1,600 1,108 874 624
Chevron 1,715 1,965 1,618 940 852 598
ExxonMobil 1,579 1,703 1,006 515 90 0
Eni 1,410 1,166 1,028 737 355 156
Anadarko 1,207 1,195 988 702 489 263
ONGC 884 605 231 336 454 363
PEMEX 856 820 576 355 251 222
Apache 483 336 349 310 139 91
Hess 395 315 471 304 292 292
Sub-total 27,721 24,369 18,484 13,853 11,462 9,248
Percent of total 72% 69% 76% 79% 91% 97%
Total 38,301 35,111 24,347 17,515 12,619 9,488
Floating rig expenditures ($m)
Source: ODS-Petrodata, Deutsche Bank
Page 38 Deutsche Bank Securities Inc.

9 October 2017
Oil Services & Equipment
Initiation of coverage
Figure 144: Contract expirations stacking up the idlefleet
Figure 145: Contract expirations
0
50
100
150
200
250
300
Current YE 17 Mid 18 YE 18 Mid 19 YE 19 Mid 20 YE 20
Contracted Available
17
23
18
8
12
6
9
0
5
10
15
20
25
YE 17 Mid 18 YE 18 Mid 19 YE 19 Mid 20 YE 20
Source: ODS-Petrodata, Deutsche Bank Source: ODS-Petrodata, Deutsche Bank
New tendering activity is way behind the pace of contract expirationsThe floating rig market has only $13 billion of revenues in backlog for 2018, whichis down 65% from where the industry started in 2014. Between now and year-end 2018, 22% of the floating rig fleet is facing contract expiration, which leavesonly 66 rig years of backlog for 2019. That is down 73% from the 244 rig yearsthat were in backlog at the start of 2014. Not a good starting point.
Figure 146: Revenues in backlog Figure 147: Rig years in backlog
36 34
23
1713
9
38
35
24
18
13
9
0
5
10
15
20
25
30
35
40
45
2014 2015 2016 2017(e) 2018(e) 2019(e)
In b
illi
on
s o
f U
SD
Beginning revenues in backlog Revenues from new fixtures
244219
152
11694
66
258
227
164
131
94
66
0
50
100
150
200
250
300
2014 2015 2016 2017(e) 2018(e) 2019(e)
Rig
ye
ars
Source: ODS-Petrodata, Deutsche Bank Source: ODS-Petrodata, Deutsche Bank
Record attrition to continue for several more yearsThe industry has officially retired a record 90 floaters since 2014, which is 42%of all the floater retirements since 1970. But the industry is still oversupplied.More floaters need to be retired, and we expect more will be retired as M&Aallows companies to recharge earnings power and dispatch more of their olderrigs to scrap yards. This will occur over the next several years, and will likely becontributed to by the reality that many of the industry’s cold-stacked (CS) rigs areunsuitable for reactivation in today’s competitive environment.
Deutsche Bank Securities Inc. Page 39

9 October 2017
Oil Services & Equipment
Initiation of coverage
Figure 148: Market rebalancing requires more attrition
312 266
297 267
44
90
31
30
0
50
100
150
200
250
300
350
400
Net fleet attrition
Excludes Sete Brasil rigs
Source: ODS-Petrodata, Deutsche Bank
Many cold-stacked rigs will likely be ejected from the industryThere are 64 cold-stacked floaters, which is about 23% of the worldwide fleet. Weexpect at least 30 of these will never work again. It may take a few years beforethey are officially retired, but customers are unlikely to consider either the rigquality or the credit quality of some of these contractors. While the reactivationcost for the newer rigs is $30-50 million, the all-in cost for the 20-30 year old rigscan be as high as $100 million.
Figure 149: Cold-stacked floaters by vintage and duration stacked
Rig type 1yr or less <5 yrs 5+ yrs 10+yrs 20+yrs 30+ yrs Total
Semisubmersibles 3 9 55 21 7 59 154
Cold stacked 0 0 11 9 2 19 41
Duration cold stacked
< 1 year 0 0 4 0 0 2 6
1 - 2 years 0 0 4 5 2 13 24
2 - 3 years 0 0 3 4 0 2 9
3 - 4 years 0 0 0 0 0 0 0
4 - 5 years 0 0 0 0 0 0 0
5+ years 0 0 0 0 0 2 2
Total 0 0 11 9 2 19 41
Drillships 1 46 47 13 0 12 119
Cold stacked 0 3 7 11 0 2 23
Duration cold stacked
< 1 year 0 1 2 0 0 0 3
1 - 2 years 0 2 5 3 0 1 11
2 - 3 years 0 0 0 8 0 1 9
3 - 4 years 0 0 0 0 0 0 0
4 - 5 years 0 0 0 0 0 0 0
5+ years 0 0 0 0 0 0 0
Total 0 3 7 11 0 2 23
Age of rig
Source: ODS-Petrodata, Deutsche Bank
Page 40 Deutsche Bank Securities Inc.

9 October 2017
Oil Services & Equipment
Initiation of coverage
Figure 150: Floater attrition by contractorFloaters 2014 2015 2016 2017 Total
Transocean 11 11 8 9 39
Diamond Offshore 3 7 3 5 18
Ensco 0 2 6 0 8
Noble 0 4 0 2 6
Atwood 1 1 1 1 4
Paragon Offshore 0 2 0 1 3
Saipem 0 1 1 1 3
Albatross Energy 0 1 0 0 1
Other 0 1 5 2 8
Total 15 30 24 21 90
Source: ODS-Petrodata, Deutsche Bank
Transocean and Diamond Offshore lead the scrapping effortTransocean and Diamond Offshore have retired a combined 57 rigs out of the total90 since 2014. While owning less than 50% of the worldwide fleet, US drillers intotal have been responsible for over 80% of the retirements. About 40% of the30+ year old cold-stacked floaters are owned by small contractors that have littleelse in terms of revenues, thus may not be proactively retiring rigs, but these arethe rigs being retired by the customers.
There are still 31 newbuild floaters in the queueSince 2005, the industry has ordered 200 newbuild floaters with 31 still in thequeue for delivery, excluding the Sete Brasil rigs. Only ten of the remaining 38have commitments. The industry has successfully deferred the vast majority ofthese deliveries and as of now has 19 deliveries in 2018 and ten in 2019.
Figure 151: Floating fleet trends
(40)
(30)
(20)
(10)
0
10
20
30
40
0
50
100
150
200
250
300
350
Additions Attrition Existing
Source: ODS-Petrodata, Deutsche Bank
Deutsche Bank Securities Inc. Page 41

9 October 2017
Oil Services & Equipment
Initiation of coverage
Floater market bottoming, but we expect a slow laborious recoveryWe believe the bottom is in, but the recovery will be slow and riddled with fiercepricing tactics. Leading edge dayrates have plunged to the $170,000 per day levelfrom over $650,000 because utilization is top of mind for contractors. We expectdemand will have bottomed at about 145 rig years in 2017 versus 258 in 2014.But we only model in a recovery to 165 rig years by 2019. In terms of industryrevenues, we expect them to be below 2017 levels due to the plunge in dayrates.
Figure 152: Slow floating rig recovery through 2019
258227
164131
9466
1463
99
258
227
164145
157165
0
50
100
150
200
250
300
2014 2015 2016 2017(e) 2018(e) 2019(e)
Rig
ye
ars
Rig years in backlog Rig years added
Source: ODS-Petrodata, Deutsche Bank
Figure 153: Strong pricing tactics will be a drag on backlog revenues
3835
24
1813
9
1
58
38
35
24
1917 18
0
5
10
15
20
25
30
35
40
45
2014 2015 2016 2017(e) 2018(e) 2019(e)
In b
illi
on
s o
f U
SD
Revenues in backlog Revenues added to backlog
Source: ODS-Petrodata, Deutsche Bank
Page 42 Deutsche Bank Securities Inc.

9 October 2017
Oil Services & Equipment
Initiation of coverage
Figure 154: Deepwater FIDs YTD in-line with full year 2016 level
0
1
2
3
4
5
6
7
8
9
10
2012 2013 2014 2015 2016 2017YTD
Source: Deutsche Bank
Lower costs, technology and best practices keep deepwater viableThe urgency in the deepwater through 2014 as rig availability was tight anddayrates had surged to $650,000 per day fueled a bloated cost structure andforced errors that now have the chance to be remedied. The focus is nowon more cost efficient facilities using modularization, miniaturization, advancedmaterials, and more efficient processes to reduce costs. Cost cuts have actuallycome to fruition faster than many in the industry had expected with many ofthe incremental deepwater opportunities now involving brownfield tie-backs inthe large infrastructure centers in the Gulf of Mexico and North Sea. Statoil forexample, which ranked second in terms early contract terminations, has achieved20-30% cost improvements in drilling and completions as well as facilities andfield costs in 2/3rd the expected time frame. Breakeven prices industry-wide havecome down below $50, and for some brownfield projects, below $40. Some largeprojects are already economic.
Jackups finding a bottomExposure to the jackup market has faded over the years as contractors includingTransocean, Noble and Diamond have repositioned their fleets to focus on theultra-deepwater. Transocean recently sold its high-specification jackup fleet toBorr Drilling and is now 100% floaters. Transocean used to be the largest jackupoperator following the acquisition of GlobalSantaFe.
The jackup market is highly fragmented with 127 drilling contractors. But the rigsare old. About 49% of the 539 active worldwide jackups are 30+ years old. Thisis the competitive edge Rowan has over the industry. There are roughly 70 high-specification jackups with hook loads of 2 million lbs. or more, and Rowan has 19of them. While most of the 30+ year old rigs will enjoy sporadic at best utilizationwith very little pricing, Rowan’s fleet of high-specification jackups provides itwith a superior competitive positioning to be among the first to gain backlog andpricing as the industry slowly recovers.
Deutsche Bank Securities Inc. Page 43

9 October 2017
Oil Services & Equipment
Initiation of coverage
Figure 155: Cold-stacked jackups by vintage and duration stacked
Rig type 1yr or less <5 yrs 5+ yrs 10+yrs 20+yrs 30+ yrs Total
Jackups 11 106 97 47 15 263 539
Cold stacked 0 0 4 4 4 61 73
Duration cold stacked
< 1 year 0 0 1 1 2 1 5
1 - 2 years 0 0 1 0 1 8 10
2 - 3 years 0 0 0 3 1 30 34
3 - 4 years 0 0 2 0 0 9 11
4 - 5 years 0 0 0 0 0 1 1
5+ years 0 0 0 0 0 12 12
Total 0 0 4 4 4 61 73
Age of rig
Source: ODS-Petrodata, Deutsche Bank
Figure 156: Fleet distributions
0
10
20
30
40
50
60
ESV RIG RDC NE DO ATW
Drillships Semis Jackups
Source: ODS-Petrodata, Deutsche Bank
Figure 157: Offshore fleet age distribution
Rig type 1yr or less <5 yrs 5+ yrs 10+yrs 20+yrs 30+ yrs Constr. Total Avg age
Jackup 11 106 97 47 15 263 97 636 22.1
Semisubmersible 3 9 55 21 7 59 13 167 20.4
Drillship 1 46 47 13 0 12 25 144 9.7
Jackup 2% 17% 15% 7% 2% 41% 15%
Semisubmersible 2% 5% 33% 13% 4% 35% 8%
Drillship 1% 32% 33% 9% 0% 8% 17%
Fleet age
Source: ODS-Petrodata, Deutsche Bank
Page 44 Deutsche Bank Securities Inc.

9 October 2017
Oil Services & Equipment
Initiation of coverage
Gulf of Mexico
Figure 158: Jackups contracted vs utilization Figure 159: Floaters contracted vs utilization
0%
20%
40%
60%
80%
100%
0
10
20
30
40
50
Jan
-12
Ap
r-1
2
Jul-
12
Oct
-12
Jan
-13
Ap
r-1
3
Jul-
13
Oct
-13
Jan
-14
Ap
r-1
4
Jul-
14
Oct
-14
Jan
-15
Ap
r-1
5
Jul-
15
Oct
-15
Jan
-16
Ap
r-1
6
Jul-
16
Oct
-16
Jan
-17
Ap
r-1
7
Jul-
17
% U
tili
zati
on
# C
on
tra
cte
d
No. Contracted % Utilization
0%
20%
40%
60%
80%
100%
0
20
40
60
Jan
-12
Ap
r-1
2
Jul-
12
Oct
-12
Jan
-13
Ap
r-1
3
Jul-
13
Oct
-13
Jan
-14
Ap
r-1
4
Jul-
14
Oct
-14
Jan
-15
Ap
r-1
5
Jul-
15
Oct
-15
Jan
-16
Ap
r-1
6
Jul-
16
Oct
-16
Jan
-17
Ap
r-1
7
Jul-
17
% U
tili
zati
on
# C
on
tra
cte
d
No. Contracted % Utilization
Source: ODS-Petrodata Source: ODS-Petrodata
Figure 160: Jackup dayrates Figure 161: Floater dayrates
$0
$50
$100
$150
$200
$250
Jan
-12
Ma
y-1
2
Sep
-12
Jan
-13
Ma
y-1
3
Sep
-13
Jan
-14
Ma
y-1
4
Sep
-14
Jan
-15
Ma
y-1
5
Sep
-15
Jan
-16
Ma
y-1
6
Sep
-16
Jan
-17
Ma
y-1
7
$ k
pd
JU >400-IC JU 300-MC JU 301-360-IC JU 361-400-IC
$300
$400
$500
$600
Jan
-12
Ma
y-1
2
Sep
-12
Jan
-13
Ma
y-1
3
Sep
-13
Jan
-14
Ma
y-1
4
Sep
-14
Jan
-15
Ma
y-1
5
Sep
-15
Jan
-16
Ma
y-1
6
Sep
-16
Jan
-17
Ma
y-1
7
$ k
pd
Semi >7500 Semi 5001-7500
Source: ODS-Petrodata Source: ODS-Petrodata
Figure 162: Offshore production Figure 163: Capital Expenditures
-
500
1,000
1,500
2,000
2,500
2006 2007 2008 2009 2010 2011 2012 2013 2014 2015 2016
kb
oe
/d
$-
$2,000
$4,000
$6,000
$8,000
$10,000
$12,000
$14,000
2006 2007 2008 2009 2010 2011 2012 2013 2014 2015 2016
An
nu
al $
Mil
lio
ns
Source: Wood Mackenzie Source: Wood Mackenzie
Figure 164: Offshore producing wells Figure 165: Top contractors and operators
Manager # Rigs Operator # Rigs
#1 Transocean 7 Shell 4
#2 Seadrill 4 Chevron 4
#3 Diamond Offshore 4 Anadarko 3
#4 Noble 4 Hess 3
#5 Ensco 1 BP 3
Source: Wood Mackenzie Source: ODS-Petrodata
Deutsche Bank Securities Inc. Page 45

9 October 2017
Oil Services & Equipment
Initiation of coverage
Brazil
Figure 166: Jackups contracted vs utilization Figure 167: Floaters contracted vs utilization
0%
20%
40%
60%
80%
100%
0
2
4
6
8
Jan
-12
Ap
r-1
2
Jul-
12
Oct
-12
Jan
-13
Ap
r-1
3
Jul-
13
Oct
-13
Jan
-14
Ap
r-1
4
Jul-
14
Oct
-14
Jan
-15
Ap
r-1
5
Jul-
15
Oct
-15
Jan
-16
Ap
r-1
6
Jul-
16
Oct
-16
Jan
-17
Ap
r-1
7
Jul-
17
% U
tili
zati
on
# C
on
tra
cte
d
No. Contracted % Utilization
60%
70%
80%
90%
100%
20
40
60
80
100
Jan
-12
Ap
r-1
2
Jul-
12
Oct
-12
Jan
-13
Ap
r-1
3
Jul-
13
Oct
-13
Jan
-14
Ap
r-1
4
Jul-
14
Oct
-14
Jan
-15
Ap
r-1
5
Jul-
15
Oct
-15
Jan
-16
Ap
r-1
6
Jul-
16
Oct
-16
Jan
-17
Ap
r-1
7
Jul-
17
% U
tili
zati
on
# C
on
tra
cte
d
No. Contracted % Utilization
Source: ODS-Petrodata Source: ODS-Petrodata
Figure 168: Jackup dayrates Figure 169: Floater dayrates
$200
$300
$400
$500
Jan
-12
Ma
y-1
2
Sep
-12
Jan
-13
Ma
y-1
3
Sep
-13
Jan
-14
Ma
y-1
4
Sep
-14
Jan
-15
Ma
y-1
5
Sep
-15
Jan
-16
Ma
y-1
6
Sep
-16
Jan
-17
Ma
y-1
7
$ k
pd
Semi <=3000 Semi >7500
$275
$325
$375
$425
$475
Jan
-12
Ma
y-1
2
Sep
-12
Jan
-13
Ma
y-1
3
Sep
-13
Jan
-14
Ma
y-1
4
Sep
-14
Jan
-15
Ma
y-1
5
Sep
-15
Jan
-16
Ma
y-1
6
Sep
-16
Jan
-17
Ma
y-1
7
$ k
pd
Drillship >7500 Drillship 3001-5000 Drillship 5001-7500
Source: ODS-Petrodata Source: ODS-Petrodata
Figure 170: Offshore production Figure 171: Capital Expenditures
-
500
1,000
1,500
2,000
2,500
3,000
2006 2007 2008 2009 2010 2011 2012 2013 2014 2015 2016
kb
oe
/d
$-
$2,000
$4,000
$6,000
$8,000
$10,000
$12,000
2006 2007 2008 2009 2010 2011 2012 2013 2014 2015 2016
An
nu
al $
Mil
lio
ns
Source: Wood Mackenzie Source: Wood Mackenzie
Figure 172: Offshore producing wells Figure 173: Top contractors and operators
Manager # Rigs Operator # Rigs
#1 QGOG Constellation 6 Petrobras 27
#2 Odebrecht 6
#3 Seadrill 3
#4 Transocean 2
#5 Ensco 2
Source: Wood Mackenzie Source: ODS-Petrodata
Page 46 Deutsche Bank Securities Inc.

9 October 2017
Oil Services & Equipment
Initiation of coverage
Norway
Figure 174: Jackups contracted vs utilization Figure 175: Floaters contracted vs utilization
0%
20%
40%
60%
80%
100%
0
5
10
15
20
Jan
-12
Ap
r-1
2
Jul-
12
Oct
-12
Jan
-13
Ap
r-1
3
Jul-
13
Oct
-13
Jan
-14
Ap
r-1
4
Jul-
14
Oct
-14
Jan
-15
Ap
r-1
5
Jul-
15
Oct
-15
Jan
-16
Ap
r-1
6
Jul-
16
Oct
-16
Jan
-17
Ap
r-1
7
Jul-
17
% U
tili
zati
on
# C
on
tra
cte
d
No. Contracted % Utilization
20%
40%
60%
80%
100%
10
15
20
25
30
Jan
-12
Ap
r-1
2
Jul-
12
Oct
-12
Jan
-13
Ap
r-1
3
Jul-
13
Oct
-13
Jan
-14
Ap
r-1
4
Jul-
14
Oct
-14
Jan
-15
Ap
r-1
5
Jul-
15
Oct
-15
Jan
-16
Ap
r-1
6
Jul-
16
Oct
-16
Jan
-17
Ap
r-1
7
Jul-
17
% U
tili
zati
on
# C
on
tra
cte
d
No. Contracted % Utilization
Source: ODS-Petrodata Source: ODS-Petrodata
Figure 176: Jackup dayrates Figure 177: Floater dayrates
$300
$320
$340
$360
Jan
-12
Ma
y-1
2
Sep
-12
Jan
-13
Ma
y-1
3
Sep
-13
Jan
-14
Ma
y-1
4
Sep
-14
Jan
-15
Ma
y-1
5
Sep
-15
Jan
-16
Ma
y-1
6
Sep
-16
Jan
-17
Ma
y-1
7
$ k
pd
JU Harsh High Spec
$200
$700
Jan
-12
Ma
y-1
2
Sep
-12
Jan
-13
Ma
y-1
3
Sep
-13
Jan
-14
Ma
y-1
4
Sep
-14
Jan
-15
Ma
y-1
5
Sep
-15
Jan
-16
Ma
y-1
6
Sep
-16
Jan
-17
Ma
y-1
7
$ k
pd
Semi <=3000 Semi Harsh Deepwater
Source: ODS-Petrodata Source: ODS-Petrodata
Figure 178: Offshore production Figure 179: Capital expenditures
3,200
3,400
3,600
3,800
4,000
4,200
4,400
2006 2007 2008 2009 2010 2011 2012 2013 2014 2015 2016
kb
oe
/d
$-
$2,000
$4,000
$6,000
$8,000
$10,000
$12,000
$14,000
2006 2007 2008 2009 2010 2011 2012 2013 2014 2015 2016
An
nu
al $
Mil
lio
ns
Source: Wood Mackenzie Source: Wood Mackenzie
Figure 180: Offshore producing wells Figure 181: Top contractors and operators
Manager # Rigs Operator # Rigs
#1 Songa Offshore 4 Statoil 8
#2 Odfjell Drilling 3 Aker BP 1
#3 Dolphin 1 Wintershall 1
#4 Ocean Rig 1 Eni 1
#5 Transocean 1 Lundin Petroleum 1
Source: Wood Mackenzie Source: ODS-Petrodata
Deutsche Bank Securities Inc. Page 47

9 October 2017
Oil Services & Equipment
Initiation of coverage
North Sea
Figure 182: Jackups contracted vs utilization Figure 183: Floaters contracted vs utilization
0%
20%
40%
60%
80%
100%
0
5
10
15
Jan
-12
Ap
r-1
2
Jul-
12
Oct
-12
Jan
-13
Ap
r-1
3
Jul-
13
Oct
-13
Jan
-14
Ap
r-1
4
Jul-
14
Oct
-14
Jan
-15
Ap
r-1
5
Jul-
15
Oct
-15
Jan
-16
Ap
r-1
6
Jul-
16
Oct
-16
Jan
-17
Ap
r-1
7
Jul-
17
% U
tili
zati
on
# C
on
tra
cte
d
No. Contracted % Utilization
0%
20%
40%
60%
80%
100%
0
5
10
15
20
25
Jan
-12
Ap
r-1
2
Jul-
12
Oct
-12
Jan
-13
Ap
r-1
3
Jul-
13
Oct
-13
Jan
-14
Ap
r-1
4
Jul-
14
Oct
-14
Jan
-15
Ap
r-1
5
Jul-
15
Oct
-15
Jan
-16
Ap
r-1
6
Jul-
16
Oct
-16
Jan
-17
Ap
r-1
7
Jul-
17
% U
tili
zati
on
# C
on
tra
cte
d
No. Contracted % Utilization
Source: ODS-Petrodata Source: ODS-Petrodata
Figure 184: Jackup dayrates Figure 185: Floater dayrates
$75
$125
$175
$225
$275
Jan
-12
Ma
y-1
2
Sep
-12
Jan
-13
Ma
y-1
3
Sep
-13
Jan
-14
Ma
y-1
4
Sep
-14
Jan
-15
Ma
y-1
5
Sep
-15
Jan
-16
Ma
y-1
6
Sep
-16
Jan
-17
Ma
y-1
7
$ k
pd
JU <250-IC JU Harsh High Spec JU Harsh Standard
$150
$650
Jan
-12
Ma
y-1
2
Sep
-12
Jan
-13
Ma
y-1
3
Sep
-13
Jan
-14
Ma
y-1
4
Sep
-14
Jan
-15
Ma
y-1
5
Sep
-15
Jan
-16
Ma
y-1
6
Sep
-16
Jan
-17
Ma
y-1
7
$ k
pd
Semi <=3000 Semi Harsh Deepwater
Semi Harsh High Spec Semi Harsh Standard
Source: ODS-Petrodata Source: ODS-Petrodata
Figure 186: Offshore production Figure 187: Capital expenditures
-
500
1,000
1,500
2,000
2,500
3,000
3,500
2006 2007 2008 2009 2010 2011 2012 2013 2014 2015 2016
kb
oe
/d
$-
$2,000
$4,000
$6,000
$8,000
$10,000
$12,000
$14,000
2006 2007 2008 2009 2010 2011 2012 2013 2014 2015 2016
An
nu
al $
Mil
lio
ns
Source: Wood Mackenzie Source: Wood Mackenzie
Figure 188: Offshore producing wells Figure 189: Top contractors and operators
Manager # Rigs Operator # Rigs
#1 Transocean 5 Statoil 9
#2 Songa Offshore 4 BP 2
#3 Odfjell Drilling 4 Providence 1
#4 Diamond Offshore 3 Aker BP 1
#5 Paragon Offshore 1 Apache 1
Source: Wood Mackenzie Source: ODS-Petrodata
Page 48 Deutsche Bank Securities Inc.

9 October 2017
Oil Services & Equipment
Initiation of coverage
Angola
Figure 190: Jackups contracted vs utilization Figure 191: Floaters contracted vs utilization
75%
80%
85%
90%
95%
100%
0
1
2
3
4
5
Jan
-12
Ap
r-1
2
Jul-
12
Oct
-12
Jan
-13
Ap
r-1
3
Jul-
13
Oct
-13
Jan
-14
Ap
r-1
4
Jul-
14
Oct
-14
Jan
-15
Ap
r-1
5
Jul-
15
Oct
-15
Jan
-16
Ap
r-1
6
Jul-
16
Oct
-16
Jan
-17
Ap
r-1
7
Jul-
17
% U
tili
zati
on
# C
on
tra
cte
d
No. Contracted % Utilization
92%
94%
96%
98%
100%
0
5
10
15
20
25
Jan
-12
Ap
r-1
2
Jul-
12
Oct
-12
Jan
-13
Ap
r-1
3
Jul-
13
Oct
-13
Jan
-14
Ap
r-1
4
Jul-
14
Oct
-14
Jan
-15
Ap
r-1
5
Jul-
15
Oct
-15
Jan
-16
Ap
r-1
6
Jul-
16
Oct
-16
Jan
-17
Ap
r-1
7
Jul-
17
% U
tili
zati
on
# C
on
tra
cte
d
No. Contracted % Utilization
Source: ODS-Petrodata Source: ODS-Petrodata
Figure 192: Jackup dayrates Figure 193: Floater dayrates
$75
$125
$175
$225
$275
Jan
-12
Ma
y-1
2
Sep
-12
Jan
-13
Ma
y-1
3
Sep
-13
Jan
-14
Ma
y-1
4
Sep
-14
Jan
-15
Ma
y-1
5
Sep
-15
Jan
-16
Ma
y-1
6
Sep
-16
Jan
-17
Ma
y-1
7
$ k
pd
JU 250-IC JU 300-IC JU 301-360-IC JU 361-400-IC
$300
$400
$500
$600
$700
Jan
-12
Ma
y-1
2
Sep
-12
Jan
-13
Ma
y-1
3
Sep
-13
Jan
-14
Ma
y-1
4
Sep
-14
Jan
-15
Ma
y-1
5
Sep
-15
Jan
-16
Ma
y-1
6
Sep
-16
Jan
-17
Ma
y-1
7
$ k
pd
Semi >7500 Semi 3001-5000 Semi 5001-7500
Source: ODS-Petrodata Source: ODS-Petrodata
Figure 194: Offshore production Figure 195: Capital expenditures
-
500
1,000
1,500
2,000
2,500
2006 2007 2008 2009 2010 2011 2012 2013 2014 2015 2016
kb
oe
/d
$-
$2,000
$4,000
$6,000
$8,000
2006 2007 2008 2009 2010 2011 2012 2013 2014 2015 2016
An
nu
al $
Mil
lio
ns
Source: Wood Mackenzie Source: Wood Mackenzie
Figure 196: Offshore producing wells Figure 197: Top contractors and operators
Manager # Rigs Operator # Rigs
#1 Seadrill 2 Total 3
#2 Ocean Rig 2 Eni 1
#3 Ensco 1 ExxonMobil 1
#4
#5
Source: Wood Mackenzie Source: ODS-Petrodata
Deutsche Bank Securities Inc. Page 49

9 October 2017
Oil Services & Equipment
Initiation of coverage
Nigeria
Figure 198: Jackups contracted vs utilization Figure 199: Floaters contracted vs utilization
0%
20%
40%
60%
80%
100%
0
5
10
15
20
Jan
-12
Ap
r-1
2
Jul-
12
Oct
-12
Jan
-13
Ap
r-1
3
Jul-
13
Oct
-13
Jan
-14
Ap
r-1
4
Jul-
14
Oct
-14
Jan
-15
Ap
r-1
5
Jul-
15
Oct
-15
Jan
-16
Ap
r-1
6
Jul-
16
Oct
-16
Jan
-17
Ap
r-1
7
Jul-
17
% U
tili
zati
on
# C
on
tra
cte
d
No. Contracted % Utilization
0%
20%
40%
60%
80%
100%
0
5
10
15
Jan
-12
Ap
r-1
2
Jul-
12
Oct
-12
Jan
-13
Ap
r-1
3
Jul-
13
Oct
-13
Jan
-14
Ap
r-1
4
Jul-
14
Oct
-14
Jan
-15
Ap
r-1
5
Jul-
15
Oct
-15
Jan
-16
Ap
r-1
6
Jul-
16
Oct
-16
Jan
-17
Ap
r-1
7
Jul-
17
% U
tili
zati
on
# C
on
tra
cte
d
No. Contracted % Utilization
Source: ODS-Petrodata Source: ODS-Petrodata
Figure 200: Jackup dayrates Figure 201: Floater dayrates
$80
$100
$120
$140
$160
$180
Jan
-12
Ma
y-1
2
Sep
-12
Jan
-13
Ma
y-1
3
Sep
-13
Jan
-14
Ma
y-1
4
Sep
-14
Jan
-15
Ma
y-1
5
Sep
-15
Jan
-16
Ma
y-1
6
Sep
-16
Jan
-17
Ma
y-1
7
$ k
pd
JU 250-IC JU 300-IC JU 301-360-IC JU 361-400-IC
$200
$400
$600
$800
Jan
-12
Ma
y-1
2
Sep
-12
Jan
-13
Ma
y-1
3
Sep
-13
Jan
-14
Ma
y-1
4
Sep
-14
Jan
-15
Ma
y-1
5
Sep
-15
Jan
-16
Ma
y-1
6
Sep
-16
Jan
-17
Ma
y-1
7
$ k
pd
Semi <=3000 Semi 5001-7500
Source: ODS-Petrodata Source: ODS-Petrodata
Figure 202: Offshore production Figure 203: Capital expenditures
-
500
1,000
1,500
2,000
2,500
2006 2007 2008 2009 2010 2011 2012 2013 2014 2015 2016
kb
oe
/d
$-
$1,000
$2,000
$3,000
$4,000
$5,000
$6,000
2006 2007 2008 2009 2010 2011 2012 2013 2014 2015 2016
An
nu
al $
Mil
lio
ns
Source: Wood Mackenzie Source: Wood Mackenzie
Figure 204: Offshore producing wells Figure 205: Top contractors and operators
Manager # Rigs Operator # Rigs
#1 Seadrill 1 Total 1
#2 Pacific Drilling 1 Erin Energy 1
#3
#4
#5
Source: Wood Mackenzie Source: ODS-Petrodata
Page 50 Deutsche Bank Securities Inc.

9 October 2017
Oil Services & Equipment
Initiation of coverage
Middle East & Saudi Arabia
Figure 206: Middle East jackups Figure 207: Saudi Arabia jackups
60%
70%
80%
90%
100%
10
12
14
16
18
20
Jan
-12
Ap
r-1
2
Jul-
12
Oct
-12
Jan
-13
Ap
r-1
3
Jul-
13
Oct
-13
Jan
-14
Ap
r-1
4
Jul-
14
Oct
-14
Jan
-15
Ap
r-1
5
Jul-
15
Oct
-15
Jan
-16
Ap
r-1
6
Jul-
16
Oct
-16
Jan
-17
Ap
r-1
7
Jul-
17
% U
tili
zati
on
# C
on
tra
cte
d
No. Contracted % Utilization
90%
92%
94%
96%
98%
100%
25
30
35
40
45
50
Jan
-12
Ap
r-1
2
Jul-
12
Oct
-12
Jan
-13
Ap
r-1
3
Jul-
13
Oct
-13
Jan
-14
Ap
r-1
4
Jul-
14
Oct
-14
Jan
-15
Ap
r-1
5
Jul-
15
Oct
-15
Jan
-16
Ap
r-1
6
Jul-
16
Oct
-16
Jan
-17
Ap
r-1
7
Jul-
17
% U
tili
zati
on
# C
on
tra
cte
d
No. Contracted % Utilization
Source: ODS-Petrodata Source: ODS-Petrodata
Figure 208: JU <300, 300+ dayrates Figure 209: JU 360+ dayrates
$70
$80
$90
$100
$110
$120
Jan
-12
Ma
y-1
2
Sep
-12
Jan
-13
Ma
y-1
3
Sep
-13
Jan
-14
Ma
y-1
4
Sep
-14
Jan
-15
Ma
y-1
5
Sep
-15
Jan
-16
Ma
y-1
6
Sep
-16
Jan
-17
Ma
y-1
7
$ k
pd
ME: JU <300 ME: JU 300+
$165
$185
$205
$225
Jan
-12
Ma
y-1
2
Sep
-12
Jan
-13
Ma
y-1
3
Sep
-13
Jan
-14
Ma
y-1
4
Sep
-14
Jan
-15
Ma
y-1
5
Sep
-15
Jan
-16
Ma
y-1
6
Sep
-16
Jan
-17
Ma
y-1
7
$ k
pd
ME: JU 360+ Saudi: JU 360+
Source: ODS-Petrodata Source: ODS-Petrodata
Figure 210: ME vs Saudi Arabia offshore production Figure 211: ME vs Saudi Arabia capital expenditures
-
5,000
10,000
15,000
2006 2007 2008 2009 2010 2011 2012 2013 2014 2015 2016
kb
oe
/d
ME Production Saudi Arabia Production
$-
$2,000
$4,000
$6,000
$8,000
$10,000
2006 2007 2008 2009 2010 2011 2012 2013 2014 2015 2016
An
nu
al $
Mill
ion
s
Saudi Capex ME Capex
Source: Wood Mackenzie Source: Wood Mackenzie
Figure 212: Offshore producing wells Figure 213: Top contractors and operators
Manager # Rigs Operator # Rigs
#1 National Drilling 20 Saudi Aramco 45
#2 Shelf Drilling 12 Adma-Opco 18
#3 Rowan 10 IOOC 6
#4 Gulf Drilling Int'l 9 Pars Oil & Gas 5
#5 Noble 7 Operator TBA 5
Manager # Rigs Operator # Rigs
#1 Rowan 10 Saudi Aramco 44
#2 Shelf Drilling 6
#3 Ensco 6
#4 Seadrill 4
#5 Noble 4
Mid
dle
Ea
st
Sa
ud
i A
ra
bia
Source: Wood Mackenzie Source: ODS-Petrodata
Deutsche Bank Securities Inc. Page 51

9 October 2017
Oil Services & Equipment
Initiation of coverage
Asia Pacific
Figure 214: Jackups contracted vs utilization Figure 215: Jackup dayrates
0%
20%
40%
60%
80%
100%
0
5
10
15
Jan
-12
Ap
r-1
2
Jul-
12
Oct
-12
Jan
-13
Ap
r-1
3
Jul-
13
Oct
-13
Jan
-14
Ap
r-1
4
Jul-
14
Oct
-14
Jan
-15
Ap
r-1
5
Jul-
15
Oct
-15
Jan
-16
Ap
r-1
6
Jul-
16
Oct
-16
Jan
-17
Ap
r-1
7
Jul-
17
% U
tili
zati
on
# C
on
tra
cte
d
No. Contracted % Utilization
$80
$100
$120
$140
$160
$180
Jan
-12
Ma
y-1
2
Sep
-12
Jan
-13
Ma
y-1
3
Sep
-13
Jan
-14
Ma
y-1
4
Sep
-14
Jan
-15
Ma
y-1
5
Sep
-15
Jan
-16
Ma
y-1
6
Sep
-16
Jan
-17
Ma
y-1
7
$ k
pd
JU >400-IC JU 300-IC JU 301-360-IC JU 361-400-IC
Source: ODS-Petrodata Source: ODS-Petrodata
Figure 216: Offshore production Figure 217: Capital expenditures
5,000
5,500
6,000
6,500
7,000
7,500
2006 2007 2008 2009 2010 2011 2012 2013 2014 2015 2016
kb
oe
/d
$-
$5,000
$10,000
$15,000
$20,000
2006 2007 2008 2009 2010 2011 2012 2013 2014 2015 2016
An
nu
al $
Mil
lio
ns
Source: Wood Mackenzie Source: Wood Mackenzie
Figure 218: Offshore producing wells Figure 219: Top contractors and operators
Manager # Rigs Operator # Rigs
#1 UMW Offshore Drilling 6 Vietsovpetro 9
#2 Vietsovpetro 5 Petronas Carigali 5
#3 PV Drilling 4 Chevron 4
#4 Shelf Drilling 2 Pertamina 2
#5 Seadrill 2 Saka Energi Indonesia 1
Source: Wood Mackenzie Source: ODS-Petrodata
Page 52 Deutsche Bank Securities Inc.

9 October 2017
Oil Services & Equipment
Initiation of coverage
FIDs are slowly picking up
Large upstream projects, both offshore and onshore, are usually delivered by agroup of energy companies rather than a single large owner. This helps to spreadout project risks, improve project financing for these large, multi-year projects,and knowledge sharing amongst the players in the industry. In order for a projectto reach FID (Final Investment Decision) several steps have to be taken includingFront End Engineering Design (FEED) studies, country concessions, building thenecessary production facilities, order some long lead time items, just to name afew. The industry tracks FIDs closely because once the decision is made usuallymajor contract tenders are awarded in the following months.
Figure 220: Production outlook for major project FIDs (kboe/d)(kboe/d) 2017 2018 2019 2020 2021 2022 2023 2024 2025
Africa 29 29 67 100 184 618 1,196 1,682 1,900
Latin America 15 30 22 144 394 604 914 1,312 1,770
Middle East 49 229 367 624 1,290 1,991 2,311 2,433 2,605
Asia 234 318 399 568 816 1,163 1,357 1,674 2,038
Europe 0 10 39 446 619 1,022 1,292 1,418 1,453
North America 10 25 35 35 67 319 676 805 836
Total 337 640 929 1,918 3,370 5,717 7,745 9,325 10,601
Source: Wood Mackenzie, Deutsche Bank
The energy downturn and the subsequent lower for longer oil price environmenthas encouraged operators to focus more on shorter-cycle projects in theirportfolio. There has been very little FIDs being announced the past few years asprojects were delayed in order to get re-designed to reflect the new environment.There are still meaningful challenges to the deepwater development includinggeologic risk, project execution risk, and locking up capital in a long projecttimeline.
The industry has shown in the past it can meaningfully improve project economicsand has responded the same way to this challenge by working together to makeoffshore viable again as they remove costs out of the project work. The industryis pursuing multiples avenues of standardization, such as lowering the deliverytime from manufacturers from 26 months to 14-16 months for orders that arecustomized and pushing standardized engineering solutions rather than alwaysre-inventing processes for similar field designs.
Right now sanctions are mainly focused on brownfield development and subseatiebacks which have less exploration risk and faster timeline to first production.However, XOM did announce in June that it has made FID on the first phase ofdevelopment for the Liza field. Phase 1 development includes a subsea productionsystem and FPSO vessel designed to produce 120,000 barrels of oil per day.Production is expected to begin by 2020, less than five years after the field wasdiscovered. Conversely, only 7 exploration wells have been drilling in Brazil in 2017compared to over 200 exploration wells back in 2012.
Deutsche Bank Securities Inc. Page 53

9 October 2017
Oil Services & Equipment
Initiation of coverage
Figure 221: Sanctioned projects by region Figure 222: Future FIDs
0
2
4
6
8
10
12
14
16
18
2012 2013 2014 2015 2016 2017
Africa Latin America Middle East Asia Europe North America
0
10
20
30
40
50
60
2017 2018 2019 2020 2021 2022 2023
Africa Latin America Middle East Asia Europe North America
Source: Wood Mackenzie Source: Wood Mackenzie
Wood Mackenzie tracks future FID projects which currently has over 180potential projects that could reach FID by 2025. This list does not includeUS unconventional plays and fields with commercial reserves smaller than 50mmboe. Interesting to note in the above graphs, the composition of FIDs fromthe ones that have been sanctioned in the past six years to the future projectsbeing tracked changes. North America and Europe were the leading regions forsanctioned projects in the past six years while Asia and Africa look to be leadingregions for future FID projects. Russia accounts for almost one-third to the totalprojects in Asia.
Figure 223: Future FID expected liquids production Figure 224: Peak production from FIDs by Year ofSanction
0
2,000
4,000
6,000
8,000
10,000
12,000
20
17
20
18
20
19
20
20
20
21
20
22
20
23
20
24
20
25
kb
oe
/d
Africa Latin America Middle East Asia Europe North America
0
500
1000
1500
2000
2500
3000
3500
20002001200220032004200520062007200820092010201120122013201420152016
kb
oe
/d
Peak Production
Source: Wood Mackenzie Source: Wood Mackenzie
Wood Mackenzie models out potential production by field if all of the potentialprojects make it to FID. Given the time to first production, onshore and brownfieldprojects have the quickest time to first production followed by larger deepwaterprojects. Total production from the projects that are being tracked starts at only337 kboe/d in 2017 while ramping to 5,717 kboe/d in 2022 and 10,601 kboe/din 2025.
The impact of the downturn and recent focus on faster cycle times can beseen when looking at the graph showing peak production from FIDs by year ofsanction. Project deferrals and a lack of FID announced during the downturn willstart to have a greater impact on incremental deepwater production. While 2017finally makes a turnaround with major projects being sanctioned, including some
Page 54 Deutsche Bank Securities Inc.

9 October 2017
Oil Services & Equipment
Initiation of coverage
greenfield, the average production start-up year based on the list of projects thatare being tracked is around 2021/ 2022.
Gulf of MexicoThe deepwater Gulf of Mexico still accounts for approximately 15% of US crudeoil production. While the rig count remains at low levels and the industry coststructure is still working its way lower, it is still an important part of the US supplypicture. Wood Mackenzie estimates that liquids production in 2017 will average1.39 million b/d, up from 1.22 in 2016 due to the ramp up of fields such as DeltaHouse and Lucius with further development of Thunderhorse. They have Gulf ofMexico production hitting a new peak of 1.46 million b/d in 2019, mainly drivenby Stampede, Big Foot, and Appomattox.
The downturn definitely hit activity in the Gulf of Mexico as very few projects weresanctioned in 2015-2016. Only Appomattox and Vicksburg were sanctioned in2015 and Constellation in 2016. Evidence that the lower cost structure, improvingefficiencies, and benefits from standardization and improving collaboration hasalready helped to see a higher level of sanction activity in 2017. Mad Dog Phase 2,Kaikias, and Buckskin have all been sanctioned so far in 2017. Wood Mackenzieestimates that Mad God Phase 2 has a breakeven below US$50/bbl Brent price,while Kaikias is around $30.
There continues to be risk that the next wave of Gulf of Mexico pre-FID projectsget delayed if operators continue to focus on short-cycle investments or ifoperating partners' interests are not aligned. A recent example (note it is stillincluded in the Wood Mackenzie dataset) is Shenandoah. Following dry-holes atboth Shenandoah-6 and the subsequent side track, Anadarko (APC) suspendedany further appraisal activity and wrote-off $900mm in dry hole and lease-holdimpairment expenses associated with the project. APC will evaluate the go-forward plan by the end of November. These risks explain the difference betweenthe two charts below as Wood Mackenzie only includes 5 pre-FID projects in itsFID project tracker list. However, if we look at potential projects in the Gulf ofMexico depending on if we include discoveries that Wood Mackenzie classifies asGood Technical reserves (fields that could be economic but significant uncertaintyremains over the timing of their development) then the list expands to include 23potential projects.
Figure 225: Gulf of Mexico expected production from FIDs
0
50
100
150
200
250
300
350
20
17
20
18
20
19
20
20
20
21
20
22
20
23
20
24
20
25
kb
oe
/d
North Platte (GB 959) Shenandoah (WR 52) Vito (MC 984)
Hadrian North (KC 919) Anchor (GC 807)
Source: Wood Mackenzie
Deutsche Bank Securities Inc. Page 55

9 October 2017
Oil Services & Equipment
Initiation of coverage
Figure 226: Potential Gulf of Mexico projects peak production
0
20
40
60
80
100
120
140A
nch
or
(GC
80
7)
Bu
cksk
in (
KC
87
2)
Ca
ico
s (G
C 5
64
)
Cla
ibo
rne
(M
C 7
94
)
Fo
rt S
um
ter
(MC
56
6)
Gu
ad
alu
pe
(K
C 1
0)
H;Sヴ
キ;ミ
Nラヴ
デエ ふK
CぐH
off
e P
ark
(M
C 1
66
)
Ka
ikia
s (M
C 7
68
)
Ka
tma
i (G
C 4
0)
No
rth
Pla
tte
(G
B 9
59
)
Ou
rse
(M
C 8
95
)
Ph
ob
os
(SE
39
)
Po
we
r N
ap
(M
C 9
42
)
Po
we
r N
ap
(M
C 9
43
)
Re
d Z
ing
er
(MC
25
7)
Ry
db
erg
(M
C 5
25
)
Sh
en
an
do
ah
(W
R 5
2)
Ta
gg
art
(M
C 8
16
)
Tib
er
(KC
10
2)
Vit
o (
MC
98
4)
Wa
rrio
r (G
C 5
63
)
Ye
ti (
WR
16
0)
kb
oe
/d
Peak Production
Source: Wood Mackenzie
North SeaThe North Sea rig count has been steadily falling since the downturn first startingin 2014. The rig count was around the mid 40/ low 50s in the spring of that yearand fell to a low in the high teens in October 2016. Since then it has remainedmostly in the mid-20s level. The North Sea has also seen quite a bit of M&A thisyear with 12 deals announced as private equity increased their exposure to theregion while majors divested some assets. Wood Mackenzie has tracked sevenfields that came online in the first half of the year with eight more expected in thesecond half. But FIDs in 2017 have been off to a slow start with three sanctionedso far, all focused on Norway, and mostly brownfield and subsea tieback projects.
Wood Mackenzie expects in the second half of 2017 UK and Netherlands FIDswill be announced. These include Q/7-FA in the Netherlands, Lancaster in the UK,and YME Phase III, Snadd, and the Snorre Expansion in Norway. While both sidesof the North Sea are picking up, the Norwegian side has the larger projects byreserve size. Most of the projects on the Norwegian side are being run by largeroperators like Statoil, Repsol, and Aker BP.
While not quite considered an FID, but this example does illustrate the impactboth cost reductions and project standardization are having looking at the Njordfuture project in Norway. The Njord future project will repair a platform andupgrade drilling facilities, with production expected to re-start in 2020 with in-filldrilling resumes in the field. Wood Mackenzie estimates that the capex/boe in theNjord future project has fallen around 30% since 3Q14.
Page 56 Deutsche Bank Securities Inc.

9 October 2017
Oil Services & Equipment
Initiation of coverage
Figure 227: North Sea expected FID production
0
200
400
600
800
1000
1200
1400
2017 2018 2019 2020 2021 2022 2023 2024 2025 2026 2027 2028 2029 2030
kboe/d
Netherlands UK Norway
Source: Wood Mackenzie
Top 20 Projects by Largest Commercial ReservesBelow is the list of top 20 projects by largest commercial reserves. The list ofprojects is mostly greenfield (15), but more of a mix between offshore/ shelf/ LNG(13) and onshore (7) than one might expect. The largest onshore projects arefound in Russia and the Middle East. The largest LNG projects are in Africa. WhileLatin America only shows up twice in the top 20 list, there is no project in NorthAmerica as Wood Mackenzie’s project list is only tracking mostly brownfield oilsands expansions and the 5 expected FID projects shown above in the Gulf ofMexico section.
Figure 228: Top 20 projects by largest commercial reserves
Project Region Country Operator Project Type Type Expected FID
Production Start
Up Yr Peak Prod Yr
Commercial
Reserves (mmboe)
Kharasaveiskoye Asia Russia Gazprom Conventional Onshore Greenfield Jan-20 Jan-23 2033 6,451
Libra LatAm Brazil Petrobras Deepwater Greenfield Jul-17 Jul-21 2030 5,684
Buzios (Surplus) LatAm Brazil Petrobras Deepwater Greenfield Jan-18 Jan-28 2028 4,862
Ob-Taz Bay Fields Asia Russia Gazprom Conventional Shelf GreenField Jan-20 Jan-25 2035 4,660
Kruzenshternskoye Asia Russia Gazprom Conventional Onshore GreenField Jan-22 Jan-27 2030 4,169
Golfinho Area Africa Mozambique Anadarko LNG GreenField Oct-18 Jan-23 2047 2,874
South Pars 11 Middle East Iran Iranian Oil Conventional shelf GreenField Sep-17 Jul-20 2022 2,745
Farzad A and B Middle East Iran Iranian Oil Sour gas GreenField Jul-18 Jan-21 2032 2,636
Kashagan Phase Two Asia Kazakhstan North Caspian Sour gas Brownfield Aug-22 Jul-28 2042 2,524
Mamba Complex Africa Mozambique Eni LNG GreenField Jul-19 Jan-24 2048 2,477
Golshan and Ferdowsi Middle East Iran Pars Oil & Gas Conventional shelf GreenField Jan-25 Jan-26 2034 2,458
Majnoon Phase 3 Middle East Iraq Shell Conventional onshore Brownfield Jan-19 Apr-20 - 2,356
Kharampurskoye Asia Russia Rosneft Conventional onshore Brownfield Jan-18 Oct-22 2028 2,264
Kish Phase 2 & 3 IPC Middle East Iran Iranian Oil Conventional onshore GreenField Aug-20 Jan-22 - 2,197
Troll Phase 3 Europe Norway Statoil Conventional shelf Brownfield Jul-18 Jul-21 - 1,965
Iara Entorno (Surplus) LatAm Brazil Petrobras Deepwater GreenField Jul-20 Jan-26 2028 1,830
Block 1 Africa Tanzania Shell LNG GreenField Jan-21 Jan-26 2032 1,761
Block 2 Africa Tanzania Statoil LNG GreenField Jan-21 Jan-27 2032 1,761
Azadegan Phase 2 Middle East Iran CNPC Conventional onshore Brownfield Jan-18 Jul-20 2025 1,760
Miran and Bina Bawi Middle East Iraq Genel Energy Onshore gas GreenField Jan-19 Jan-20 2023 1,556
Source: Wood Mackenzie
Deutsche Bank Securities Inc. Page 57

9 October 2017
Oil Services & Equipment
Initiation of coverage
Rating
HoldNorth AmericaUnited States
IndustrialsOil Services & Equipment
Company
Baker Hughes, a GECompany
Reuters Bloomberg
BHGE.N BHGE US
Short Cycle to Long CycleInitiating coverage with a Hold rating and a $35 price targetWe are initiating coverage of Baker Hughes, a GE Company with a Hold ratingand a $35 price target. While the company is later cycle and should generallyexhibit lower cyclicality without direct exposure to pressure pumping, the variedend markets and longer lead-times add uncertainty to the earnings growthprogression. We believe integration of the two companies and execution will becrucial in the early days. A lack of near term catalysts translating into near termpositive earnings revisions is the basis for our Hold rating.
Strategic rationale behind the combination still remains a questionBHGE has positioned itself as a fullstream provider of equipment and serviceswhile leveraging digitalization and integrated solutions. The push for digitalizationin the oil patch is not new, but there is uncertainty as to the pace of customerpenetration. GE’s track record in the oil patch has been mixed using acquisitionsof manufacturing oriented businesses to grow. BHGE has a strong productportfolio and good innovation, but had difficulty with its delivery platform andquestions remain if GE can run and support a global services model and what thenew company will look like long term.
Business headwinds causes management to lower expectationsManagement has already had to lower its guidance as its longer cycle businesseshave been recovering slower than expected. Almost 60% of BHGE’s revenueis derived from offshore, which has weighed on the business. BHGE has alsofaced pricing pressures in North America and a softer than expected internationalonshore recovery. These headwinds caused us to introduce our 2018 EBITDAestimate at $3.1bn compared to the $5.5bn in BHGE's prospectus last year.
ValuationOur $35 price target is 13.0x our 2018EBITDA estimate of $3.1bn. The targetmultiple is roughly in-line with the 12.8x five-year average multiple leading up to 2014collapse in oil prices for BHI.The main investment risks include: 1) shiftsin OPEC policy and the influence that wouldhave on oil prices and ultimately upstreamcapital expenditures, 2) continued delaysin longer cycle projects offshore, 3) GEstarts pulling cash out of the business notallowing it to expand, 4) supporting a globalservices infrastructure footprint rather thanjust aftermarket services, and 5) an upsiderisk could be if BHGE is extract greatersynergies from the integration process thanwas originally expected.
Forecasts and ratios
Year End Dec 31 2016A 2017E 2018E
1Q EPS -0.44 -0.04A 0.24
2Q EPS -0.90 -0.15A 0.30
3Q EPS -0.15 0.11 0.35
4Q EPS -0.30 0.20 0.43
FY EPS (USD) -1.79 0.12 1.31
OLD FY EPS (USD) – – –
% Change – – –
P/E (x) – 295.7 27.9
DPS (USD) 0.68 0.68 0.68
Dividend Yield (%) – 1.9 1.9
Revenue (USDm) 9,841.0 15,938.0 23,889.5Source: Deutsche Bank estimates, company data
David HavensResearch [email protected]
Price at 5 Oct 2017 (USD) 36.48
Price target 35.00
52-week range 37.91 - 32.54
Price/price relative
Baker Hughes S&P 500 INDEX (Rebased)
17. Jul 31. Jul 14. Aug 28. Aug 11. Sep 25. Sep32
33
34
35
36
37
38
39
40
Performance(%)
1m 3m 12m
Absolute 7.0 – –
S&P 500INDEX
2.5 4.5 18.0
Source: Deutsche Bank
Stock & option liquidity data
Market Cap (USDm) 15,668.2
Shares outstanding (m) 429.5
Free float (%) –
Volume (5 Oct 2017) 429,443
Option volume (und. shrs., 1M avg.) –Source: Deutsche Bank
Page 58 Deutsche Bank Securities Inc.

9 October 2017
Oil Services & Equipment
Initiation of coverage
Key investment themes
Solidifying its place in the marketBHGE has positioned itself as a fullstream provider of equipment and services todrive productivity solutions to customers. The combined company’s strategy isto create a differentiated solutions provider that will leverage the digital solutionsand technology from GE with Baker Hughes’ oilfield tools and services. Theircomplimentary portfolio of services and capabilities will be able to reach acrossthe entire spectrum in the oil patch, including power generation. The goal is toleverage its breadth of the portfolio, geographic presence, technology, and digitalsolutions through its GE store and Predix platform. Ultimately the combinedcompany wants to drive better efficiency for customers, create new businessmodels, bring innovative solutions to market faster, and increase customer touchpoints.
The closest peer pursuing a similar strategy is likely Schlumberger (SLB) as thenew BHGE is looking to provide a more integrated solution utilizing its deepportfolio of products and services. This strategy has been driven by perceivedchallenges in international markets as project size and complexity increases,lack of established infrastructure, customer preferences toward broader solutionsto get to a simplified supply chain, and reservoirs in harsher/ more remoteenvironments. In North America, BHGE is trying to focus on its technologyleadership while offering different service models depending on customerpreference.
Figure 229: Complimentary portfolio with limited overlapGE Oil & Gas Baker Hughes
% of 2015 Revenue Top 3 Position % of 2015 Revenue Top 3 Position
Surface 13% Advanced Drilling Services 24% X
Subsea Systems & Drilling 26% X Logging & Evalution 6% X
Turbomachinery Solutions 33% X Completion Systems 40% X
Donstream Technology 14% Production Optimization 22% X
Digital Solutions 14% X Industrial Serviecs 8%
Source: Company reports, Spears & Associates
Based on 2015 industry spend, the new BHGE has 60% presence in upstreammarkets, 30% in midstream, and 10% in downstream. We also estimate thatapproximately 60% of BHGE’s revenue is derived from offshore while 40% isonshore based. The combined companies actually have very little overlap, so theywill be able to offer solutions based complementary equipment, services, andtechnology across the entire oil and gas value chain. The two main product lineswhere they overlap are artificial lift and wireline logging, but BHGE was muchlarger in wireline logging than GE.
Deutsche Bank Securities Inc. Page 59

9 October 2017
Oil Services & Equipment
Initiation of coverage
Figure 230: Limited product line overlapName Title Prior Experience
Martin Craighead Vice Chairman Was Chairman & CEO of BHI since January 2012. Prior to that, he was President
and COO from 2009-2012 and group President of Drilling and Evaluation from
2007-2009.
Lorenzo Simonelli Chairman & CEO Prior to this role, had been President and CEO of GE Transportation for the past
5 years. Also had served as CFO Americas for GE Consumer & Industrial. He
joined GE financial management program in 1994.
Maria Claudia Borras President & CEO,
Oilfield Services
She is a 25 year energy veteran, 20 of which was spent at Baker Hughes. In
January 2015, she moved to GE to become COO of GE Oil & Gas. At BHI she was
President Latin America from 2013-2015.
Belgacem Chariag COO He had been President, Global Operations for BHI and Chief Integration Officer.
Prior to that he was President Global Products and Services and served as
President Eastern Hemisphere from 2009-2013.
Matthias Heilmann President & CEO,
Digital Solutions
20 year industry veteran, was previously Chief Digital Officer at GE Oil & Gas.
Before joining GE he led ABB's global product group enterprise software
business.
Derek Mathieson CTO Was Chief Commercial Officer for BHI since May 2016 and before that was Vice
President, Chief Technology Officer from September 2015-May 2016. He joined
BHI in 2008 from WellDynamics.
Brian Worrell CFO Was most recently CFO of GE Oil & Gas, a position he held since January 2014.
Previously had worked as Vice President corporate financial planning and before
that in audit. He joined GE in 1992.
Source: Company reports, Spears & Associates (Revenue in millions of USD)
Later Cycle Exposures in a Shorter Cycle WorldThe new BHGE’s business is definitely later cycle and should generally exhibitlower cyclicality without pressure pumping. However, it has lagged peers giventhat the business has much lower exposure to North American completions postthe spin-off of its pressure pumping business (it did retain a minority interestownership) and likely lost some share in legacy BHGE’s business lines duringall of the noise the past few years. In what is likely a shorter cycle world andwith commodity prices range bound, the timing for the recovery of its longercycle businesses (subsea, drilling, LNG) remains a question. Also customerOPEX spending and related activity has been slower to recover than completionspending. International markets have lagged the recovery in North America,which typically happens, but activity has been slower to recover than manyexpected which provides another headwind for the business. Lastly, the companynow has a backlog component to the business with some product lines gearedtowards larger construction projects in power generation and refining, so themarket will have to get a better feel for revenue turn coming out of backlog andworking capital needs.
Page 60 Deutsche Bank Securities Inc.

9 October 2017
Oil Services & Equipment
Initiation of coverage
Figure 231: BHGE orders by segment
0
1,000
2,000
3,000
4,000
5,000
6,000
7,000
1Q16 2Q16 3Q16 4Q16 1Q17 2Q17
$M
M
Turbomachinery & Process Solutions Oilfield Services
Oilfield Equipment Digital Solutions
Source: Company reports
Ultimate Strategic Goals and its Capital AllocationWe would argue that many still question the strategic rationale behind thecombination, but post the merger the bigger question now is what is the ultimatestrategic goal for the company. One could argue that legacy BHGE had a strongproduct portfolio and some of the best innovation in the oil patch, but haddifficulty with its delivery platform, never fully integrated BJ Services properly, anddid not have enough scale and infrastructure to support global operations. GE’strack record in the oil patch has been mixed at best since its entry and growth intothe business mainly through acquisitions that were focused on manufacturingand leveraging its expertise in improving manufacturing efficiencies and returns.
While the business plans for the big four integrated oilfield service providers havenever been so different, the market will be focused on the integration process andexecution in the early days of BHGE. BHGE does have a strong balance sheet andshould be able to increase leverage, questions exist around what will the capitalallocation decision making process look like. Also how much will BHGE invest inthe business compared to returning capital to shareholders, especially given GE’sownership in the business and its own cash needs. In other words, with GE beingits largest shareholder, how much say will it have in the strategic direction andcapital allocation decision making.
Deutsche Bank Securities Inc. Page 61

9 October 2017
Oil Services & Equipment
Initiation of coverage
Figure 232: FCF vs dividends paid
(2,000)
(1,000)
0
1,000
2,000
3,000
4,000
5,000
2007 2008 2009 2010 2011 2012 2013 2014 2015 2016 2017 2018 2019
(a) (a) (a) (a) (a) (a) (a) (a) (a) (a) (e) (e) (e)
In m
illio
ns
of
USD
Free cash flow Dividends paid
Source: Company reports, Deutsche Bank (2017 forward is BHGE, 2016 prior is BHI)
Lack of near term catalystsIf we do stay in a range bound oil price environment, it has hard to see many nearterm catalysts for BHGE. Management has been making some solid progress onthe integration processes by closing underutilized facilities, but still do not expectto see larger benefits from synergies until 2018. 3Q17 is the first quarter in whichthe company will report results as a single entity but it is unlikely that they will givemuch guidance into 2018 quite yet. Lastly, it will take some time for the marketto fully understand the drivers behind the company's fundamentals.
Valuation and risksOur $35 price target is 13.0x our 2018 EBITDA estimate of $3.1bn. The targetmultiple is roughly in-line with the 12.8x five-year average multiple leadingup to 2014 collapse in oil prices for BHI. The main investment risks include:1) shifts in OPEC policy and the influence that would have on oil prices andultimately upstream capital expenditures, 2) continued delays in longer cycleprojects offshore, 3) GE starts pulling cash out of the business not allowing it toexpand, 4) supporting a global services infrastructure footprint rather than justaftermarket services, and 5) an upside risk could be if BHGE is extract greatersynergies from the integration process than was originally expected.
Company description
The new BHGE has been positioned to have exposure across the entireenergy landscape – serving upstream, midstream, and downstream sectors. Thecompany will be divided into four product companies – Oilfield Services, OilfieldEquipment, Turbomachinery and Process Solutions, and Digital Solutions. Thesefour product companies have 24 product lines and segments. The combinedcompany will have the largest exposure to the Turbomachinery & DownstreamTechnology Solutions business (which was 52% of GE Oil & Gas revenues and68% of segment profit in 2016) and artificial lift, completion tools, wireline,directional drilling, and specialty chemicals from BHI’s legacy business. BHI stillwill retain a minority interest of 46.7% in its former pressure pumping business.The business mix will consist of some backlog driven businesses on GE’s sidewith BHI’s more services oriented business. GE Oil & Gas ended 2016 with abacklog of $21.7bn, while orders of 11,273 were down 27% y/y.
Page 62 Deutsche Bank Securities Inc.

9 October 2017
Oil Services & Equipment
Initiation of coverage
Figure 233: Reporting segment
Oilfield Services Turbomachinery & Process Solutions
- Most of traditional BHI business - Gas turbines, compressors, modular LNG
- Directional drilling, MWD - Turboexpanders, heat exchangers
- Fluids - Steam turbines, recip compressors
- Wireline and surface logging - Downstream valves and fuel gas systems
- Completion Systems - Accounted for approx 47% of GE O&G '15 rev
- Well construction - major EBIT contribution (almost 70% in '15)
- Welbore intervention - BHI Industrial Services
- Artificial Lift - ESP, gas lift, RLS - Includes brands such as NuovoPignone, Salof,
- Chemicals Dresser, Thermodyn
- LNG, refineries - important end markets
Oilfield Equipment Digital Solutions
- Drilling equipment - Monitoring
- Subsea systems - trees, wellheads, manifolds - Inspection
downhole data acquisition, BOPs - Measurement equipment & services
- Completion equipment - Goal to improve machinery health
- Includes brands such as Hydril, Vetco Gray - Also improve productivity of assets
- Flexible pipeline systems - Stepping stone to access PREDIX platform
- Pressure control - BHI Pipeline & Processing Services
- Accounted for 14% of GE O&G '15 revenues
Baker Hughes, a GE Company
Source: Company reports, Deutsche Bank
Different exposuresThe legacy BHGE mostly lies within the Oilfield Services segment with the additionof GE’s artificial lift business. The Oilfield Equipment segment mainly containsthe old GE Oil & Gas Surface, Subsea & Drilling businesses. The Turbomachinery& Process Solutions segment is the same as the previous Turbomachinery &Downstream Technology Solutions. BHGE still will retain a minority interest of46.7% in its former pressure pumping business. BHGE’s business mix will consistof some backlog driven businesses on GE’s side with BHI’s more services orientedbusiness. GE Oil & Gas ended 2016 with a backlog of $21.7bn, while orders of11,273 were down 27% y/y.
Figure 234: BHGE 2018 forecastedsegment revenues breakdown
Figure 235: BHGE 2018 forecastedsegment EBIT breakdown
Oilfield
Services
46%
Turbomachinery
& Process
Solutions
30%
Oilfield
Equipment
12%
Digital Solutions
12%
2018e
Oilfield
Services
29%
Turbomachinery
& Process
Solutions
52%
Oilfield
Equipment
3%
Digital Solutions
16%
2018e
Source: Deutsche Bank Source: Deutsche Bank
Deutsche Bank Securities Inc. Page 63

9 October 2017
Oil Services & Equipment
Initiation of coverage
Historically, GE Oil & Gas offered its solutions through three main segments,Turbomachinery & Downstream Technology Solutions (TMDTS), Surface, Subsea& Drilling (SS&D), and Digital Solutions (DS). The business generated $3.1bn ofrevenue in 1Q17, of which 41% was generated from equipment and 59% fromservices. In FY16, the business generated $13.3bn in revenue, of which 46% fromequipment and 54% from services. Of its three main segments, TMDTS is thelargest and represented approximately 56% and 52% of total GE Oil & Gas revenuein 1Q17 and FY16 respectively. SS&D represented approximately 29% and 33%of total GE Oil & Gas revenue in 1Q17 and FY16 respectively. DS representedapproximately 15% and 16% of total GE Oil & Gas revenue in 1Q17 and FY16respectively.
In terms of regional exposures, BHI largest market historically had been NorthAmerica but its Middle East/ Asia exposure had been growing the past few yearsand was almost 29% of total revenue in 4Q16. North America averaged about 43%of BHI revenue the past 10 years while Latin America was 10%, Europe/ Africa/ CISis 22%, and 19% Middle East. In 2016, NAM was approximately 30% of revenuewhile the Middle East was almost 28%. The other regions were similar to theirlast 10 year averages. While GE Oil & Gas regional revenue in 2016 showed thatits largest region was Middle East/ Africa at 26%, followed by US at 24%, Europe19%, Asia 17%, and then Americas at 14%. Therefore the combined companylargest regional exposure will be North America and Middle East/ Asia and thetwo regions will be relatively similar in size.
Also note that BHGE has a non-compete agreement with BJS in that it willnot engage in any onshore pressure pumping business in the United States orCanada. This agreement is in place until BHGE’s ownership stake in BJS is lessthan 20% (from the initial 46.7% stake) or if BHGE delivers a termination noticeby some predetermined date. BHGE class A BJS common stock is also subjectto a lock-up agreement.
Figure 236: Legacy BHI vs. GE Oil & Gas revenues Figure 237: Legacy BHI vs. GE Oil & Gas operatingincome margins
0
1,000
2,000
3,000
4,000
5,000
6,000
7,000
1Q
11
2Q
11
3Q
11
4Q
11
1Q
12
2Q
12
3Q
12
4Q
12
1Q
13
2Q
13
3Q
13
4Q
13
1Q
14
2Q
14
3Q
14
4Q
14
1Q
15
2Q
15
3Q
15
4Q
15
1Q
16
2Q
16
3Q
16
4Q
16
In m
illio
ns
of
USD
GE Oil & Gas Revenue Baker Hughes Revenue
-25.0%
-20.0%
-15.0%
-10.0%
-5.0%
0.0%
5.0%
10.0%
15.0%
20.0%
1Q
11
2Q
11
3Q
11
4Q
11
1Q
12
2Q
12
3Q
12
4Q
12
1Q
13
2Q
13
3Q
13
4Q
13
1Q
14
2Q
14
3Q
14
4Q
14
1Q
15
2Q
15
3Q
15
4Q
15
1Q
16
2Q
16
3Q
16
4Q
16
Op
era
tin
g P
rofi
t M
arg
in (
%)
GE Oil & Gas Baker Hughes
Source: Company reports Source: Company reports
Management profilesSince this company was so recently formed, we have included brief managementbios for its key leadership. The management team is fairly evenly distributedbetween former GE Oil & Gas executives with former BHI ones. Also the boardmembers consisted of six being designated by GE and five from BHI.
Page 64 Deutsche Bank Securities Inc.

9 October 2017
Oil Services & Equipment
Initiation of coverage
Figure 238: Management bios
Name Title Prior Experience
Jeffrey Immelt Chairman Has been Chairman & CEO of GE since September 2001, but will retire from his
CEO position on July 31, 2017. He will remain Chairman of GE through
December 31.
Martin Craighead Vice Chairman Was Chairman & CEO of BHI since January 2012. Prior to that, he was President
and COO from 2009-2012 and group President of Drilling and Evaluation from
2007-2009.
Lorenzo Simonelli President & CEO Prior to this role, had been President and CEO of GE Transportation for the past
5 years. Also had served as CFO Americas for GE Consumer & Industrial. He
joined GE financial management program in 1994.
Maria Claudia Borras President & CEO,
Oilfield Services
She is a 25 year energy veteran, 20 of which was spent at Baker Hughes. In
January 2015, she moved to GE to become COO of GE Oil & Gas. At BHI she was
President Latin America from 2013-2015.
Belgacem Chariag COO He had been President, Global Operations for BHI and Chief Integration Officer.
Prior to that he was President Global Products and Services and served as
President Eastern Hemisphere from 2009-2013.
Matthias Heilmann President & CEO,
Digital Solutions
20 year industry veteran, was previously Chief Digital Officer at GE Oil & Gas.
Before joining GE he led ABB's global product group enterprise software
business.
Derek Mathieson CTO Was Chief Commercial Officer for BHI since May 2016 and before that was Vice
President, Chief Technology Officer from September 2015-May 2016. He joined
BHI in 2008 from WellDynamics.
Brian Worrell CFO Was most recently CFO of GE Oil & Gas, a position he held since January 2014.
Previously had worked as Vice President corporate financial planning and before
that in audit. He joined GE in 1992.
Source: Company reports
GE "definitions"Predix = GE’s proprietary operating system for the industrial internet byconnecting industrial equipment, analyzing data, and deliver real-time insights.Example of applications include asset performance management, productionoptimization, optimize maintenance, and process optimization.
GE Store = Enables cross business collaboration by providing a forum thatshares technology, markets, structure, and learnings. One example of utilizingthe GE store was in a recent company presentation that showed how AutoTrakcould be improved by the GE Store utilizing improvements in battery technology,GE Healthcare sensor analytics, fluid mechanics science, material science, andsensors to enhance the drilling process.
Principal Sources and Uses of Cash
Pro forma estimated synergiesGE Oil & Gas management estimated synergies of $1.2bn which included$400mm in annual savings from sourcing and procurement improvements by2020, $200mm from manufacturing and service footprint rationalization, $200mmfrom process optimization, and $400mm in SG&A consolidation. They alsoestimated revenue synergies of $400mm. Management believes the combinedcompany can drive material deflation given its size and scale to secure the$400mm in sourcing and procurement savings. Consolidating its propertiesacross its global footprint drives the $200mm while using GE’s advanced
Deutsche Bank Securities Inc. Page 65

9 October 2017
Oil Services & Equipment
Initiation of coverage
manufacturing and digital condition-based maintenance drivers another $200mmsavings. The other estimated $400mm comes from SG&A consolidation by rightsize back office and eliminating duplication. The challenge will be squeezingout some of these synergies given the company had very little overlap and thedifferent model between manufacturing and services. The timeline for the costsynergies was approximately $600mm in 2018, $1bn in 2019, and $1.2bn in 2020.
Sources and uses of cashBHI historically has used cash to fund working capital, capex, R&D (spent$384mm in R&D in 2016, a similar to level to what GE O&G spent), and paydowndebt. The big spike in the free cash flow history was due to receiving the $3.5bnHAL merger breakup fee. BHI used some of those proceeds to pay down its owndebt levels. Sources of cash have been its own cash flow from operations anddebt. In 2016, BHI the Middle East/ Asia region was the only positive contributorto operating income of $186mm. North America was the largest operating lossregion at $687mm, down 8% y/y. Its pressure pumping operations incurred sharereductions and impacted results. If you look at BHI’s capex history, post theBJS acquisition, capex started to go higher in 2010-2012 timeframe. Also BHIincome tax expense continues to be impacted by the geographic mix, valuationallowances, and discrete tax items.
Management originally had set in its proforma estimates in the prospectus atarget 2018 EBITDA of $5.5bn. Based on current market conditions, the lowerthan expected 2017 exit rate, and our view on spending and rig count growth in2018, we estimate that BHGE will generate $3.1bn of EBITDA in 2018. We doexpect management will try to pull forward the benefit of cost synergies to trypartially offset the weaker operating environment.
Figure 239: BHGE consolidated EBITDA
0
1,000
2,000
3,000
4,000
5,000
6,000
2007 2008 2009 2010 2011 2012 2013 2014 2015 2016 2017 2018
(a) (a) (a) (a) (a) (a) (a) (a) (a) (a) (e) (e)
In m
illio
ns
of
USD
Source: Company reports, Deutsche Bank
Balance sheet and FCF
Q3 will be the first quarter in which the new BHGE will report consolidated results.Capital allocation priorities will also be important to watch. Management has saidthat they see the opportunity to increase leverage but seems like they want toprotect their investment grade rating. While they are still assessing the correctcapital allocation priorities, management has said that they expect to return 40 to
Page 66 Deutsche Bank Securities Inc.

9 October 2017
Oil Services & Equipment
Initiation of coverage
50% of net income to shareholders over time. Given concerns around GE’s abilityto generate cash, investors will be watching if BHGE is used as a vehicle to returncash to GE through an increasing dividend.
Figure 240: Recovery in shorter cycle businesses helpsFCF improve
Figure 241: Will BHGE look to increase its dividend
(4,000)
(3,000)
(2,000)
(1,000)
0
1,000
2,000
3,000
4,000
5,000
2007 2008 2009 2010 2011 2012 2013 2014 2015 2016 2017 2018 2019
(a) (a) (a) (a) (a) (a) (a) (a) (a) (a) (e) (e) (e)
In m
illio
ns
of
USD
Cash from operations Capital expenditures Free cash flow
0.00
0.10
0.20
0.30
0.40
0.50
0.60
0.70
0.80
2007 2008 2009 2010 2011 2012 2013 2014 2015 2016 2017 2018
(a) (a) (a) (a) (a) (a) (a) (a) (a) (a) (e) (e)
Div
ide
nd
s p
er
sha
re
Source: Company reports, Deutsche Bank Source: Company reports, Deutsche Bank
Figure 242: Debt turns
0.0
1.0
2.0
3.0
4.0
5.0
6.0
7.0
2007 2008 2009 2010 2011 2012 2013 2014 2015 2016 2017 2018
(a) (a) (a) (a) (a) (a) (a) (a) (a) (a) (e) (e)
De
bt
turn
s
Source: Company reports, Deutsche Bank
Deutsche Bank Securities Inc. Page 67

9 October 2017
Oil Services & Equipment
Initiation of coverage
Figure 243: Income Statement(a) (a) (a) (a) (a) (a) (a) (a) (a) (a) (e) (e) (e)
In millions of USD 2007 2008 2009 2010 2011 2012 2013 2014 2015 2016 2017 2018 2019
Segment revenue
North America 4,440 5,178 3,584 6,732 10,257 10,836 10,878 12,078 6,009 13,292 5,431 7,239 7,329
Latin America 903 1,127 1,133 1,576 2,183 2,399 2,307 2,236 1,799 12,001 2,127 2,674 2,925
Europe/CIS/Africa 3,076 3,386 2,925 3,048 3,325 3,634 3,902 4,417 3,278 12,647 2,986 3,357 3,590
Middle East/Asia 2,008 2,172 2,022 2,276 2,820 3,275 3,998 4,456 3,441 15,744 7,380 9,587 10,226
Eliminations, other 0 0 0 782 1,246 986 1,279 1,364 1,215 (43,843) (1,985) 1,032 1,032
Total revenues 10,428 11,863 9,664 14,414 19,831 21,130 22,364 24,551 15,742 9,841 15,938 23,890 25,101
Op costs 6,323 7,314 6,439 10,121 13,873 15,452 16,700 17,852 12,338 8,149 12,383 18,665 19,946
SG&A 933 1,046 1,120 1,250 1,190 1,316 1,306 1,257 1,173 815 1,642 2,141 1,454
R&D 372 426 397 429 462 497 556 613 483 384 201 0 0
D&A 521 638 711 1,065 1,321 1,548 1,698 1,814 1,742 1,166 1,001 1,107 1,086
EBIT 2,279 2,440 997 1,549 2,985 2,317 2,104 3,015 6 (673) 711 1,976 2,616
Interest (expense) (66) (89) (131) (143) (221) (210) (234) (232) (217) (178) (135) (122) (89)
Interest income 44 27 6 2 0 0 0 0 0 0 0 0 0
Equity income 0 0 0 0 0 0 0 0 0 0 (62) 56 60
Other income 0 0 0 0 0 0 0 0 0 0 20 175 200
PBT 2,257 2,378 872 1,408 2,764 2,107 1,870 2,783 (211) (851) 534 2,085 2,787
Income tax (expense) (743) (695) (281) (513) (919) (674) (625) (936) (6) 75 (263) (584) (780)
Non-controlling interest 0 0 0 (7) (4) (6) (7) (12) 7 (2) (218) (938) (1,254)
Preferred dividends 0 0 0 0 0 0 0 0 0 0 0 0 0
Net income (operating) 1,514 1,682 591 888 1,841 1,427 1,238 1,835 (210) (778) 53 563 753
Discontinued ops 0 0 0 0 0 17 0 0 0 0 0 0 0
Unusual after-tax 0 (47) (170) (75) (102) (133) (142) (130) (1,757) (1,441) (230) 0 0
Net income (GAAP) 1,514 1,635 421 812 1,739 1,311 1,096 1,705 (1,967) (2,219) (177) 563 753
Operating EPS 4.73 5.45 1.90 2.25 4.20 3.24 2.79 4.18 (0.48) (1.79) 0.12 1.31 1.75
GAAP EPS 4.73 5.30 1.36 2.06 3.97 2.98 2.47 3.89 (4.49) (5.11) (0.41) 1.31 1.75
DPS 0.52 0.56 0.60 0.60 0.60 0.60 0.60 0.64 0.68 0.68 0.68 0.68 0.68
Diluted shares 320 309 311 395 438 441 444 439 438 434 430 430 430
EBITDA 2,800 3,077 1,708 2,614 4,306 3,865 3,802 4,829 1,748 493 1,712 3,083 3,702
EBITDA margin 26.9% 25.9% 17.7% 18.1% 21.7% 18.3% 17.0% 19.7% 11.1% 5.0% 10.7% 12.9% 14.7%
EBIT margin 21.9% 20.6% 10.3% 10.7% 15.1% 11.0% 9.4% 12.3% 0.0% -6.8% 4.5% 8.3% 10.4%
Tax rate 32.9% 29.2% 32.2% 36.4% 33.2% 32.0% 33.4% 33.6% -2.8% 8.8% 49.2% 28.0% 28.0%
Source: Company reports, Deutsche Bank
Page 68 Deutsche Bank Securities Inc.

9 October 2017
Oil Services & Equipment
Initiation of coverage
Figure 244: Cash Flow Statement(a) (a) (a) (a) (a) (a) (a) (a) (a) (a) (e) (e) (e)
In millions of USD 2007 2008 2009 2010 2011 2012 2013 2014 2015 2016 2017 2018 2019
Net income 1,514 1,682 591 888 1,841 1,427 1,238 1,835 (210) (778) 53 563 753
Depreciation 521 638 711 1,065 1,321 1,548 1,698 1,814 1,742 1,166 1,001 1,107 1,086
Deferred tax (4) (4) (256) (188) (492) (114) 0 0 0 0 0 0 0
Chg in receivables (287) (484) 399 (702) (1,024) 16 (453) (524) 1,943 762 (323) 77 434
Chg in inventories (142) (371) 240 (243) (641) (547) (120) (259) 1,092 293 (580) (35) 107
Chg in payables 26 242 (89) 292 314 (94) 845 291 (1,349) (360) 559 297 238
Other (154) (89) (357) (255) 188 (401) (47) (204) (1,422) 3,146 (975) (840) (243)
Cash from operations 1,475 1,614 1,239 856 1,507 1,835 3,161 2,953 1,796 4,229 (265) 1,169 2,374
Capital expenditures (1,127) (1,303) (1,086) (1,491) (2,461) (2,910) (2,085) (1,791) (965) (332) (667) (956) (1,004)
Free cash flow 348 311 153 (635) (954) (1,075) 1,076 1,162 831 3,897 (932) 214 1,370
Acquisitions 0 (120) (58) (888) (5) 0 0 (314) 0 0 0 0 0
Asset sales 189 253 163 247 311 389 455 437 388 283 134 0 0
Dividends paid (166) (173) (185) (241) (261) (263) (267) (279) (297) (293) (292) (292) (292)
ESPP | options 68 87 0 0 0 0 0 0 0 0 0 0 0
Equity issuance, net (522) (627) 51 74 183 81 (249) (384) 116 (672) 60 0 0
Debt issuance, net 14 1,235 (541) 1,531 54 847 (571) (248) (45) (1,195) (10) (723) 0
Other 177 (65) 57 23 16 (14) (60) (33) (409) 228 975 0 0
Chg in cash 107 901 (360) 111 (656) (35) 384 341 584 2,248 (65) (802) 1,077
FCF per share 2.16 2.04 1.53 1.40 1.86 1.88 1.23 0.99 0.55 0.28 0.67 0.86 0.92
Capex / revenue 0.11 0.11 0.11 0.10 0.12 0.14 0.09 0.07 0.06 0.03 0.04 0.04 0.04
Capex / depreciation 2.16 2.04 1.53 1.40 1.86 1.88 1.23 0.99 0.55 0.28 0.67 0.86 0.92
Source: Company reports, Deutsche Bank
Figure 245: Balance Sheet(a) (a) (a) (a) (a) (a) (a) (a) (a) (a) (e) (e) (e)
In millions of USD 2007 2008 2009 2010 2011 2012 2013 2014 2015 2016 2017 2018 2019
Cash and equivalents 1,054 1,955 1,595 1,706 1,050 1,015 1,399 1,740 2,324 4,572 4,507 3,705 4,783
Accounts receivable 2,383 2,759 2,331 3,942 4,878 4,815 5,138 5,418 3,217 2,251 5,089 5,012 4,578
Inventories 1,714 2,021 1,836 2,594 3,222 3,781 3,884 4,074 2,917 1,809 5,585 5,620 5,514
Deferred taxes 182 231 268 234 251 266 380 418 301 0 0 0 0
Other current assets 122 179 195 231 396 540 494 395 509 535 1,199 1,309 1,340
Total current assets 5,456 7,145 6,225 8,707 9,797 10,417 11,295 12,045 9,268 9,167 16,380 15,646 16,215
Net PP&E 2,345 2,833 3,161 6,310 7,415 8,707 9,076 9,063 6,693 4,271 6,296 6,144 6,062
Goodwill 1,354 1,389 1,418 5,869 5,956 5,958 5,966 6,081 6,070 4,084 19,111 19,111 19,111
Other assets 702 494 635 2,100 1,679 1,607 1,597 1,638 2,049 1,512 13,150 14,351 14,698
Total assets 9,857 11,861 11,439 22,986 24,847 26,689 27,934 28,827 24,080 19,034 54,937 55,252 56,086
Accounts payable 704 888 821 1,496 1,810 1,737 2,574 2,807 1,409 1,027 3,643 3,940 4,177
Income taxes payable 457 530 448 589 704 646 778 782 690 566 443 483 495
Dividends payable 191 272 95 219 289 226 213 265 55 78 0 0 0
Current debt 15 558 15 331 224 1,079 499 220 151 132 964 241 241
Other current liabilities 251 263 234 504 475 436 514 563 470 501 3,366 3,673 3,762
Total current liabilities 1,618 2,511 1,613 3,139 3,502 4,124 4,578 4,637 2,775 2,304 8,415 8,337 8,675
Long-term debt 1,069 1,775 1,785 3,554 3,845 3,837 3,882 3,913 3,890 2,886 2,727 2,727 2,727
Deferred taxes 416 384 309 1,360 810 745 821 740 252 328 1,283 1,283 1,283
Employee obligations 332 317 379 483 578 579 583 629 646 626 1,117 1,117 1,117
Other LT liabilities 116 67 69 164 148 136 158 178 135 153 1,345 1,468 1,503
Non-controlling int 0 0 0 186 218 199 199 105 84 81 25,051 25,989 27,244
Shareholders' equity 6,306 6,807 7,284 14,100 15,746 17,069 17,713 18,625 16,298 12,656 14,999 14,331 13,537
Total liabilities and equity 9,857 11,861 11,439 22,986 24,847 26,689 27,934 28,827 24,080 19,034 54,937 55,252 56,086
Total debt 1,085 2,333 1,800 3,885 4,069 4,916 4,381 4,133 4,041 3,018 3,691 2,968 2,968
Net debt 30 378 205 2,179 3,019 3,901 2,982 2,393 1,717 (1,554) (816) (737) (1,815)
Debt/capital 15% 26% 20% 22% 21% 22% 20% 18% 20% 19% 20% 17% 18%
Debt/equity 17% 34% 25% 28% 26% 29% 25% 22% 25% 24% 25% 21% 22%
Debt turns 0.4 0.8 1.1 1.5 0.9 1.3 1.2 0.9 2.3 6.1 2.2 1.0 0.8
Source: Company reports, Deutsche Bank
Deutsche Bank Securities Inc. Page 69

9 October 2017
Oil Services & Equipment
Initiation of coverage
Rating
HoldNorth AmericaUnited States
IndustrialsOil Services & Equipment
Company
Basic EnergyServices Inc
Reuters Bloomberg
BAS.N BAS US
Increasing Exposure to CompletionMarketsInitiating coverage with a Hold rating and a $22 price targetWe are initiating coverage of Basic Energy Services with a Buy rating and a $22price target. Despite its solid position in the well servicing market, operatorshave been slow to spend on opex and have deferred maintenance spending.Management wisely has increased exposure to completion markets which hashelped to partially offset the slower recovery in well servicing. If E&Ps truly focuson living within cash flow, then enhancing existing production might start to seesome spending shake loose given its quick cash conversion. Management hasshown a willingness in the past to divest non-core assets or act as a consolidatorto increase its scale.
Changing earnings profile with increasing exposure to completion marketsBAS has become more diversified as it increased its exposure to completionmarkets both through organic growth and acquisitions. In the current upcycle,completion activity has recovered much faster and has become a larger part ofBAS’ overall business. The company typically concentrates on the market belowthe larger players, focusing on underserved smaller customers who are doingsmaller frac jobs. This increasing exposure to completion activity will change theearnings profile as its Completion segment now accounts for almost 50% of totalrevenues.
Improved balance sheet post bankruptcy but has working capital needsBAS emerged from bankruptcy with an improved balance sheet, but respondingquickly to the upcycle has led to working capital needs.
ValuationOur $22 price target is based on 6.0xEV/ EBITDA multiple of our 2018 EBITDAestimate. Our target multiple is based on aone-year forward relative (to the S&P 500)EV/ EBITDA multiple applied to the historicalaverage through-cycle EV/ EBITDA multiplefor BAS.The main investment risks include: 1) shiftsin OPEC policy and the influence thatwould have on oil prices and ultimately USupstream capital expenditures, 2) a stepup in cost inflation in the US, 3) a swiftincrease in new frac capacity in the US,and 4) an upside risk is opex spending onwell maintenance might finally start to shakeloose as older horizontal wells mature.
Forecasts and ratios
Year End Dec 31 2016A 2017E 2018E
1Q EPS -1.36 -0.87A –
2Q EPS -1.34 -0.57 –
3Q EPS -1.91 -0.38 –
4Q EPS -1.18 -0.22 –
FY EPS (USD) -5.80 -2.05 -0.35
OLD FY EPS (USD) -5.80 -2.03 0.60
% Change -0.0% 0.8% -159.1%
P/E (x) – – –
DPS (USD) 0.00 0.00 0.00
Dividend Yield (%) 0.0 0.0 0.0
Revenue (USDm) 547.5 867.0 1,052.9Source: Deutsche Bank estimates, company data
David HavensResearch [email protected]
Price at 5 Oct 2017 (USD) 19.77
Price target 22.00
52-week range 44.50 - 0.32
Price/price relative
Basic Energy Service S&P 500 INDEX (Rebased)
Jan '15 May '15 Sep '15 Jan '16 May '16 Sep '16 Jan '17 May '17 Sep '17-10
0
10
20
30
40
50
Performance(%)
1m 3m 12m
Absolute 28.5 -25.7 2,407.7
S&P 500INDEX
2.5 4.5 18.0
Source: Deutsche Bank
Stock & option liquidity data
Market Cap (USDm) 511.7
Shares outstanding (m) 25.9
Free float (%) 100
Volume (5 Oct 2017) 176,441
Option volume (und. shrs., 1M avg.) 68,258Source: Deutsche Bank
Page 70 Deutsche Bank Securities Inc.

9 October 2017
Oil Services & Equipment
Initiation of coverage
Key investment themes
Increasing exposure to completion servicesBAS has used a combination of organic growth, acquisitions, and ordering newequipment to increase their exposure to completion services. It was a smartdecision strategically for the company as operators have deferred maintenancespending which has impacted their legacy production oriented services in thiscycle. It also enabled BAS to become more of a diversified player with the abilityto offer services across the well lifecycle. Its Completion & Remedial Servicessegment (pressure pumping, rental and fishing tools, coiled tubing, snubbing) hasgrown given the improvement in completion directed spending and now makesup approximately 50% of total revenues, up from 30% back in early 2016.
BAS typically concentrates on working for smaller customers by providing mid-sized fracturing services in a few selected markets and generally does notparticipate in 24-hour, multi wells on a pad jobs. Even still BAS has been able todrive both revenue and margin growth in this segment due to the growth in wellcounts in this upcycle, operators working down their backlog of uncompletedwells, and BAS own pressure pumping capacity growth. This changes theearnings profile of the company due to its increased exposure to completionservices.
Figure 246: BAS nameplate pressure pumping horsepower
0
100,000
200,000
300,000
400,000
500,000
600,000
HHP
Source: Company reports, Deutsche Bank
Maintenance spending and opex continues to be deferredTraditionally, BAS has been a large player in the well servicing market whichprovided maintenance related services for customers needing to perform periodicupkeep of producing oil and gas wells. This work primarily focuses on extendingthe life of a well and improving the ultimate recovery. Operators used to focuson this work as it generated high returns for relatively small opex spending.The difference in this recovery is that operators have continued to focus theiractivity and spending on drilling and completion activities and have deferred wellmaintenance spending. Even though well servicing utilization has improved, therate of change has been lower than historically what one would have expectedto see at this point in the cycle.
The backlog of horizontal oil wellbores have increased after almost 10 years ofdrilling tight oil plays in the US onshore. As these wells continue to age, they will
Deutsche Bank Securities Inc. Page 71

9 October 2017
Oil Services & Equipment
Initiation of coverage
require maintenance services. However, when thinking about why maintenancespending levels have not returned to historical levels, one has to wonder if theimproving efficiencies and well productivity will continue to make operators focusmore on drilling and completion work. This leaves the well servicing rig marketwith a lot of overcapacity and we would expect to see additional consolidation.
Figure 247: Well servicing revenue vs. rig utilization
0%
10%
20%
30%
40%
50%
60%
70%
80%
90%
100%
0
50
100
150
200
250
300
350
400
2006 2007 2008 2009 2010 2011 2012 2013 2014 2015 2016 2017 2018
(a) (a) (a) (a) (a) (a) (a) (a) (a) (a) (a) (e) (e)
In m
illi
on
s o
f U
SD
Well servicing revenue Well servicing utilization
Source: Company reports, Deutsche Bank
Improved balance sheet post emergence from bankruptcyBAS was able to emerge from bankruptcy late in 4Q16 with an improved balancesheet. While the company has no debt maturities until 2021, working capital wasneeded to respond to the upcycle and it has been a drain on liquidity. If the upcyclestarts to slow or reverse, liquidity issues might resurface. At the end of 2Q17, BAShad $34mm cash on its balance sheet.
Under the radar small capSeveral smid cap players that have exposure to well servicing and fluid haulingmarkets went bankrupt during the most recent downturn. Post emergence frombankruptcy and even with some of these companies keeping their original tickers,it seems like these companies have been flying a little bit under the radar. Partof it is due to fewer analysts covering these companies post-bankruptcy. Theother factor is BAS now has a $450mm market cap, which is smaller than manyprofessional investors will look at.
Page 72 Deutsche Bank Securities Inc.

9 October 2017
Oil Services & Equipment
Initiation of coverage
Figure 248: BAS market cap since emerging from bankruptcy
0
200
400
600
800
1000
1200
1400
$M
M
Market Capitalization
Source: Bloomberg Finance LP
Valuation and risksOur price target is based on 6.0x EV/ EBITDA multiple of our 2018 EBITDAestimate. Our target multiple is based on a one-year forward relative (to the S&P500) EV/ EBITDA multiple applied to the historical average relative through-cycleEV/ EBITDA multiple for BAS. The main investment risks include: 1) shifts inOPEC policy and the influence that would have on oil prices and ultimately USupstream capital expenditures, 2) a step up in cost inflation in the US, 3) makingan acquisition that consolidates challenging parts of the market, and 4) an upsiderisk is opex spending on well maintenance might finally start to shake loose asolder horizontal oil wells require maintenance that has been deferred.
Figure 249: EV/ EBITDA since emerging from bankruptcy
2
7
12
17
22
27
32
37
42
47
Dec-16 Jan-17 Feb-17 Mar-17 Apr-17 May-17 Jun-17 Jul-17 Aug-17
-1 std Avg +1 std
Source: Factset
Deutsche Bank Securities Inc. Page 73

9 October 2017
Oil Services & Equipment
Initiation of coverage
Company description
Basic Energy Services can trace its history back 25 years and is currently oneof the largest well service companies in the US with operations in all majoroil and gas production regions. BAS has been focused on growing its wellcompletion business, in which they provide a wide range of services to help gettheir customers ready for production. In addition, BAS provides a full offering ofwell maintenance services on aging producing wells. Basic filed for bankruptcyin October 2016 before re-emerging in December with a cleaned up balancesheet that saw debt levels reduced by $813mm along with an improved liquidityposition.
Figure 250: Changing revenue mix towards completion
Well Servicing
45%
Water Logistics
34%
Completion &
Remedial Services
21%
2006
Source: Company reports
Page 74 Deutsche Bank Securities Inc.

9 October 2017
Oil Services & Equipment
Initiation of coverage
Figure 250: Changing revenue mix towards completion
Well Servicing
30%
Water Logistics
35%
Completion &
Remedial Services
34%
Contract Drilling
1%
2016
Source: Company reports
Principal Sources and Uses of Cash Flow
The primary contributors to EBITDA are mainly its Completion & RemedialServices and its Water Logistics segments. As we previously discussed, itsCompletion segment has been driven by higher utilization and improved pricingfor completion services. In Water Logistics, volumes of water being used infrac plays has been increasing in shale development for the past few yearsas operators use larger completion sizes. Well Servicing has started to seeingimproving utilization more recently and should start to contribute more to EBITDAgoing forward.
The primary uses of cash flow has been working capital and capex to fundreactivation of assets that were stacked during the downturn. BAS has alsopurchased equipment in its efforts to respond to the improving industry utilizationlevels. While BAS has no newbuild commitments, the company purchased 74k ofpressure pumping capacity in 1Q17. With no near term debt maturities until 2021,we do not expect debt pay-down to consume much capital over the near-term.Capex for 2017 is expected to be around $115mm, with approximately $70mmgoing towards maintenance spending.
Deutsche Bank Securities Inc. Page 75

9 October 2017
Oil Services & Equipment
Initiation of coverage
Figure 251: Consolidated EBITDA expected to turnpositive in 2017
Figure 252: Earnings remain negative
-100
-50
0
50
100
150
200
250
300
350
400
2009 2010 2011 2012 2013 2014 2015 2016 2017 2018
(a) (a) (a) (a) (a) (a) (a) (a) (e) (e)
In m
illi
on
s o
f U
SD
(7.00)
(6.00)
(5.00)
(4.00)
(3.00)
(2.00)
(1.00)
0.00
1.00
2.00
3.00
2009 2010 2011 2012 2013 2014 2015 2016 2017 2018
(a) (a) (a) (a) (a) (a) (a) (a) (e) (e)
EPS
Source: Company reports, Deutsche Bank Source: Company reports, Deutsche Bank
Balance Sheet and FCF
BAS emerged from bankruptcy proceedings in December with an improvedbalance sheet after reducing debt levels by $813mm. The company also has nodebt maturities until 2021, but it did burn approximately $50mm of cash in Q1and $16mm in Q2. Working capital continues to be a significant user of cash asthe company looks to respond to the rapidly rebounding market. In addition, BASrecently purchased frac assets and will need to spend some capital on reactivationand maintenance for the equipment. If the upcycle starts to slow or reverse,liquidity issues might resurface.
Figure 253: Free cash flow remains negative in 2017 Figure 254: Improved debt levels post bankruptcy
(300)
(200)
(100)
0
100
200
300
400
2009 2010 2011 2012 2013 2014 2015 2016 2017 2018
(a) (a) (a) (a) (a) (a) (a) (a) (e) (e)
In m
illi
on
s o
f U
SD
Cash from operations Capital expenditures Free cash flow
0
100
200
300
400
500
600
700
800
900
2009 2010 2011 2012 2013 2014 2015 2016 2017 2018
(a) (a) (a) (a) (a) (a) (a) (a) (e) (e)
In m
illio
ns
of
USD
Source: Company reports, Deutsche Bank Source: Company reports, Deutsche Bank
Page 76 Deutsche Bank Securities Inc.

9 October 2017
Oil Services & Equipment
Initiation of coverage
Figure 255: Income Statement(a) (a) (a) (a) (a) (a) (a) (a) (a) (a) (e) (e)
In millions of USD 2007 2008 2009 2010 2011 2012 2013 2014 2015 2016 2017 2018
Segment revenues
Well Servicing 339 343 161 205 333 376 363 362 217 164 214 269
Water Logistics 259 316 215 241 332 352 344 370 259 192 205 217
Completion & Remedial Services 241 304 135 261 537 586 501 699 308 185 437 550
Contract Drilling 38 42 16 21 41 60 55 61 22 7 10 17
Total revenues 877 1,005 527 728 1,243 1,375 1,263 1,491 806 547 867 1,053
Segment gross profit
Well Servicing 134 128 39 48 104 108 98 91 32 24 46 67
Water Logistics 94 113 56 63 120 116 105 105 62 30 40 48
Completion & Remedial Services 115 139 40 105 240 228 174 264 62 26 107 158
Contract Drilling 15 13 3 6 13 20 18 19 6 0 1 3
Total gross profit 358 392 137 221 477 472 395 480 163 80 194 276
SG&A 99 115 104 108 142 170 157 163 143 125 136 143
EBITDA 259 277 33 114 335 302 238 317 19 (45) 58 134
D&A 93 119 133 135 154 187 210 217 241 213 105 110
EBIT 166 158 (100) (21) 181 115 28 100 (222) (259) (46) 24
Interest (expense), net (25) (25) (32) (46) (52) (62) (67) (67) (68) (86) (38) (38)
Other Income (expense) 0 5 1 2 1 (9) (8) (14) (25) 70 0 0
PBT 141 139 (131) (66) 129 43 (47) 19 (315) (275) (84) (14)
Income tax (expense) (53) (55) 47 25 (51) (10) 20 (1) 131 31 31 5
Net Income (operating) 88 84 (84) (41) 78 33 (27) 18 (184) (244) (53) (9)
Discontinued Ops 0 0 0 0 0 0 0 0 0 0 0 0
Unusual after-tax (1) (15) (210) (2) (30) (12) (9) (26) (58) (174) (1) 0
Net Income GAAP 88 68 (294) (44) 47 21 (36) (8) (242) (418) (54) (9)
Operating EPS 2.15 2.01 (2.12) (1.04) 1.87 0.81 (0.68) 0.44 (4.56) (5.80) (2.05) (0.35)
GAAP EPS 2.13 1.65 (7.42) (1.10) 1.14 0.51 (0.89) (0.20) (6.00) (9.94) (2.08) (0.35)
DPS 0.00 0.00 0.00 0.00 0.00 0.00 0.00 0.00 0.00 0.00 0.00 0.00
Diluted shares 41 42 40 40 42 41 40 41 40 42 26 26
Consolidated EBITDA 259 277 33 114 335 302 238 317 19 (45) 58 134
EBITDA margin 29.6% 27.6% 6.2% 15.6% 26.9% 22.0% 18.8% 21.3% 2.4% -8.3% 6.7% 12.7%
EBIT margin 18.9% 15.8% -18.9% -2.9% 14.5% 8.3% 2.2% 6.7% -27.6% -47.3% -5.4% 2.3%
Tax rate 37.6% 44.6% 13.7% 36.3% 52.0% 32.3% 35.4% -6.6% 35.2% 6.9% 36.9% 36.0%
Segment gross margins
Well Servicing 39.6% 37.3% 24.3% 23.4% 31.3% 28.7% 27.1% 25.3% 14.9% 14.4% 21.4% 25.0%
Water Logistics 36.2% 35.6% 25.9% 26.1% 36.2% 32.8% 30.5% 28.3% 24.1% 15.7% 19.4% 22.2%
Completion & Remedial Services 47.7% 45.6% 29.3% 40.1% 44.7% 38.9% 34.6% 37.8% 20.3% 14.0% 24.5% 28.7%
Contract Drilling 39.9% 31.4% 16.9% 26.6% 31.4% 34.0% 33.3% 31.8% 24.9% 2.2% 12.5% 15.5%
Source: Company reports, Deutsche Bank
Deutsche Bank Securities Inc. Page 77

9 October 2017
Oil Services & Equipment
Initiation of coverage
Figure 256: Cash Flow Statement(a) (a) (a) (a) (a) (a) (a) (a) (a) (a) (e) (e)
In millions of USD 2007 2008 2009 2010 2011 2012 2013 2014 2015 2016 2017 2018
Net Income 88 68 (254) (44) 47 21 (36) (8) (242) (456) (78) (9)
D&A 93 119 133 135 154 187 210 217 241 218 105 110
Deferred tax 15 30 (25) (6) 31 12 (20) 0 (131) (4) 0 0
Change in working capital (5) (32) 5 (45) (8) 57 (7) (38) 126 55 (36) 22
Other 8 28 230 9 56 27 19 53 101 36 16 0
Cash from operations 199 213 89 49 279 304 166 225 96 (151) 7 124
Capital expenditures (99) (92) (43) (64) (222) (171) (137) (236) (54) (33) (59) (85)
Free cash flow 100 121 46 (14) 58 132 29 (12) 42 (184) (52) 39
Acquisitions (200) (114) (8) (50) (218) (85) (21) (16) (17) 0 0 0
Asset sales 4 8 (12) 16 20 6 19 39 8 3 5 0
Dividends 0 0 0 0 0 0 0 0 0 0 0 0
Equity issuance, net (0) (3) (6) (0) (2) (18) (4) (8) (5) 125 (0) 0
Debt issuance, net 134 6 2 (28) 184 27 (45) (32) (60) 80 (2) 0
Other 2 1 (8) (0) (11) (5) 0 (3) (1) 28 (0) 0
Chg in cash 41 19 14 (77) 31 56 (23) (32) (33) 52 (49) 39
FCF per share 2.43 2.91 1.16 (0.36) 1.39 3.20 0.71 (0.29) 1.03 (4.57) (2.00) 1.48
Capex / revenue 0.11 0.09 0.08 0.09 0.18 0.12 0.11 0.16 0.07 0.06 0.07 0.08
Capex / depreciation 1.06 0.77 0.33 0.47 1.44 0.92 0.65 1.09 0.22 0.15 0.56 0.77
Source: Company reports, Deutsche Bank
Figure 257: Balance Sheet(a) (a) (a) (a) (a) (a) (a) (a) (a) (a) (e) (e)
In millions of USD 2007 2008 2009 2010 2011 2012 2013 2014 2015 2016 2017 2018
Cash and equivalents 92 111 125 48 78 135 112 80 47 99 50 88
Accounts receivable 138 173 86 150 255 209 204 247 102 109 172 153
Inventories 11 12 11 22 35 40 34 45 37 36 40 43
Other current assets 25 28 101 111 55 54 53 43 39 21 29 29
Total current assets 267 324 323 331 423 438 403 415 225 265 290 313
Net PP&E 637 741 667 626 856 944 928 1,008 846 489 492 467
Goodwill 205 203 3 16 83 106 111 78 0 0 0 0
Other assets 35 43 47 57 98 108 101 96 90 15 15 15
Total assets 1,144 1,311 1,040 1,030 1,460 1,596 1,543 1,597 1,161 768 798 795
Accounts payable 22 28 23 40 57 62 46 51 55 48 88 94
Current debt 17 26 26 24 34 38 41 49 49 38 46 46
Other current liabilities 52 48 43 55 65 78 78 97 66 53 58 58
Total current liabilities 92 102 92 119 156 178 165 196 170 140 193 199
Long-term debt 406 454 476 475 749 845 847 883 838 185 227 227
Other LT liabilities 120 159 132 134 195 199 187 176 47 29 31 31
Shareholders' equity 525 595 340 302 360 374 345 343 106 414 347 338
Total liabilities and equity 1,144 1,311 1,040 1,030 1,460 1,596 1,543 1,597 1,161 768 798 795
Total debt 424 480 502 499 783 883 888 931 887 223 274 274
Net debt 332 369 376 451 705 749 777 851 840 124 224 186
Debt/capital 45% 45% 60% 62% 69% 70% 72% 73% 89% 35% 44% 45%
Debt/equity 81% 81% 148% 165% 218% 236% 257% 272% 834% 54% 79% 81%
Debt turns 1.6 1.7 15.3 4.4 2.3 2.9 3.7 2.9 46.0 NM 4.7 2.0
Source: Company reports, Deutsche Bank
Page 78 Deutsche Bank Securities Inc.

9 October 2017
Oil Services & Equipment
Initiation of coverage
Rating
BuyNorth AmericaUnited States
IndustrialsOil Services & Equipment
Company
C&J EnergyServices
Reuters Bloomberg
CJ.N CJ US
US Margin Leverage Now with CleanBalance SheetInitiating coverage with a Buy rating and a $39 price targetCJ has high operating leverage to the positive fundamentals in the US pressurepumping market, and now has a debt-free balance sheet. The US frac market isone of the few markets recreating scarcity value and pricing. While investors areall over the frac names given the limited alternatives elsewhere, we believe theopportunity set in US tight oil will carry demand for frac through 2018 despite ourview that oil prices will be confined below $55. Up to $55 is still a strong driverof momentum. Discipline is required though, as this cycle is unlikely to run awaywith higher earnings like the prior two cycles.
CJ has a full frac calendar through year-endCJ is reactivating equipment and has placed an order for 20 newbuild pumps thatwill take its capacity up to 900k hhp. The company plans on exiting 3Q17 with575k hhp back in the field with a cadence of 1-2 fleets per quarter into 2018. Weexpect CJ can restore its EBITDA to $350m as soon as 2018.
Valuation & RisksOur $39 price target is 6.5x our estimate ofthe company’s normalized EBITDA power of$350 million, which is a 1.5 turn premiumto the 5.0x five-year average multiple of itsfrac peers leading up to the 2014 collapse inoil prices. We apply this premium for CJ andits peers to account for the margin leverageand expansion opportunities. Furthermore,the company has no leverage, and is likelyto grow its frac capacity and its normalizedEBITDA above our current range.The main investment risks include: 1) shiftsin OPEC policy and the influence thatwould have on oil prices and ultimately USupstream capital expenditures, 2) negativerevisions to global oil demand, 3) a swiftincrease in new frac capacity in the US, and4) and a subsequent move lower in pricingand margins.
Forecasts and ratios
Year End Dec 31 2016A 2017E 2018E
1Q EPS -0.60 -0.33A 0.39
2Q EPS -1.11 -0.01 0.48
3Q EPS -0.37 0.15 0.60
4Q EPS -0.59 0.27 0.69
FY EPS (USD) -2.68 0.13 2.16
OLD FY EPS (USD) -7.98 -0.66 2.25
% Change -66.4% -118.9% -3.9%
P/E (x) – 236.2 13.7
DPS (USD) 0.00 0.00 0.00
Dividend Yield (%) – 0.0 0.0
Revenue (USDm) 971.1 1,660.9 2,270.7Source: Deutsche Bank estimates, company data
David HavensResearch [email protected]
Price at 4 Oct 2017 (USD) 29.56
Price target 39.00
52-week range 41.00 - 24.70
Price/price relative
C&J Energy Services S&P 500 INDEX (Rebased)
Apr '17 May '17 Jun '17 Jul '17 Aug '17 Sep '17 Oct '17
25
30
35
40
45
20
Performance(%)
1m 3m 12m
Absolute 16.8 -15.4 –
S&P 500INDEX
2.5 4.5 18.0
Source: Deutsche Bank
Stock & option liquidity data
Market Cap (USDm) 1,790.2
Shares outstanding (m) 60.6
Free float (%) –
Volume (4 Oct 2017) 136,173
Option volume (und. shrs., 1M avg.) –Source: Deutsche Bank
Deutsche Bank Securities Inc. Page 79

9 October 2017
Oil Services & Equipment
Initiation of coverage
Key investment themes
US pressure pumping market is undersuppliedThe positive supply/demand trends are continuing in the frac market, drivenby a rising well count, increased pad drilling, more wells per pad and anincreasing inventory of DUCs (drilled but uncompleted wells). Frac fleets arealso incorporating more hhp, averaging about 50k now. The increase is toaccommodate the larger pads, which are keeping crews on location longer, thusin order to accommodate maintenance rotations and suitable uptime, contractorshave increased fleet sizes.
CJ has been and continues reactivating idle capacity with plans to exit 3Q17 with575k hhp deployed and a redeployment cadence of 1-2 fleets per quarter. Thecompany also ordered 20 newbuild pumps and expects to have 900k of total hhpby 1Q18, up from 860k hhp in 2Q17.
Demand industry-wide has recovered to about 12 million hhp versus 17 million atthe peak, and less than 6 million at the trough. All available horsepower by andlarge is now booked through year-end 2017. Marketed utilization is back above80% with some contractors suggesting the market is undersupplied by 1.5 – 2.0million horsepower. CJ is being methodical about its redeployments, and is notlooking to just grab utilization. We do expect the company will have about 600khhp deployed by year-end and rising through 1H18.
Figure 258: Total vs. marketed frac hhp utilization Figure 259: US frac hhp demand
0%
20%
40%
60%
80%
100%
120%
3Q
11
4Q
11
1Q
12
2Q
12
3Q
12
4Q
12
1Q
13
2Q
13
3Q
13
4Q
13
1Q
14
2Q
14
3Q
14
4Q
14
1Q
15
2Q
15
3Q
15
4Q
15
1Q
16
2Q
16
3Q
16
4Q
16
1Q
17
Total utilization Marketed utilization
0
2
4
6
8
10
12
14
16
18
3Q
11
4Q
11
1Q
12
2Q
12
3Q
12
4Q
12
1Q
13
2Q
13
3Q
13
4Q
13
1Q
14
2Q
14
3Q
14
4Q
14
1Q
15
2Q
15
3Q
15
4Q
15
1Q
16
2Q
16
3Q
16
4Q
16
1Q
17
2Q
17
3Q
17
Millio
n h
hp
Source: IHS Markit, Deutsche Bank Source: IHS Markit, Deutsche Bank
Pricing moving higher, albeit more modestlyPricing has improved, but more moderately than what some producers hadpreviously expected. While several contractors are suggesting pricing is not yetat newbuild economics, newbuilds are coming, including about 100k hhp fromRES and the 20 pumps from CJ.
Page 80 Deutsche Bank Securities Inc.

9 October 2017
Oil Services & Equipment
Initiation of coverage
Figure 260: US frac pricing indexed to 3Q11
0
20
40
60
80
100
120
3Q11
4Q11
1Q12
2Q12
3Q12
4Q12
1Q13
2Q13
3Q13
4Q13
1Q14
2Q14
3Q14
4Q14
1Q15
2Q15
3Q15
4Q15
1Q16
2Q16
3Q16
4Q16
1Q17
2Q17
3Q17
Source: IHS Markit, Deutsche Bank
Attrition is increasingFrac intensity on the larger pads and bigger wells is chewing equipment fasterthan last cycle, kicking attrition into a higher gear. Industry expectations forattrition are upwards of 3.5 million hhp per annum as useful lives decline andmaintenance capital rises. While this is tightening the market upfront, it increasesthe capital intensity for the industry longer term.
Modest newbuilding, but likely to pickupNewbuild lead times for frac spreads are about 9-12 months versus a high of 18months last cycle. Newbuild costs are back up to $1,000/hhp with modest activityunderway.
Well Support Services not getting the same tractionThe Well Support Service business remains very competitive with limited abilityto increase price. We are modeling flat pricing in 2018.
Valuation and risksOur $39 price target is 6.5x our estimate of the company’s normalized EBITDApower of $350 million, which is a 1.5 turn premium to the 5.0x five-year averagemultiple of its frac peers leading up to the 2014 collapse in oil prices. We apply thispremium for CJ and its peers to account for the margin leverage and expansionopportunities. Furthermore, the company has no leverage, and is likely to growits frac capacity and its normalized EBITDA above our current range.
The main investment risks include: 1) shifts in OPEC policy and the influencethat would have on oil prices and ultimately US upstream capital expenditures, 2)negative revisions to global oil demand, 3) a swift increase in new frac capacityin the US, and 4) and a subsequent move lower in pricing and margins.
Deutsche Bank Securities Inc. Page 81

9 October 2017
Oil Services & Equipment
Initiation of coverage
Company description
C&J Energy Services (CJ) is a leading provider well construction, completions,workover rigs, and fluid management services. The company is a top tenprovider of hydraulic fracturing services with approximately 860k horsepower.The company launched its first 34k hhp frac fleet in 2007, then followed up withanother dozen fleets for a total of about 442k hhp. In 2015 the company combinedwith the completion and production services business of Nabors Industries, whichtook its frac fleet to over one million hhp, and added the Well Support Servicesbusiness, which now includes 458 workover rigs, over 1,100 fluid trucks, and 29salt water disposal wells.
Figure 261: Operating divisions
Completion Services Well Support Services
- Hydraulic fracturing - Rig services
- Cased-hole solutions - 458 workover rigs
- Wireline and pumping Fluids management
- Wireline logging - 1,121 fluid trucks
- Perforating - 29 salt water disposal wells (SWD)
- Well construction and intervention
- Cementing
- Coiled tubing
- Directional drilling services
C&J Energy Services
Source: Company reports
Due to the severity of the oilfield downturn that began in late 2014, CJ filed forChapter 11 bankruptcy in July 2016. The company emerged from Chapter 11 inJanuary 2017 and now has zero debt on the balance sheet.
Figure 262: FY17 DBe segment revenues
Fracturing
50%
Wireline &
Pumpdown
18%
Rig Services
13%
Fluids Mgmt
8%
Coiled Tubing
5%
Other
6%
Source: Deutsche Bank
Page 82 Deutsche Bank Securities Inc.

9 October 2017
Oil Services & Equipment
Initiation of coverage
Principal Sources and Uses of Cash Flow
Core business is completions and well construction…US is principal marketCJ generates over 96% of its revenue from its US operations. Its Canadianexposure is generated by the completion and production services businessacquired from Nabors Industries. After the exit of coiled tubing services in theMiddle East, the only service line still being offered internationally is artificial liftin Ecuador and the Middle East.
Figure 263: Revenue mix
0
500
1,000
1,500
2,000
2,500
3,000
20
11
20
12
20
13
20
14
20
15
20
16
20
17
20
18
20
19
(a) (a) (a) (a) (a) (a) (e) (e) (e)
In m
illio
ns
of
US
D
Completion Services Well Support Services Other Services
Source: Company reports, Deutsche Bank
CJ wants to be positioned as a top 5 player in each of its key product linesand maintains a large footprint across the major US basins. The majority ofAdjusted EBITDA is being generated by Completion Services (frac, wireline,pumping, cementing, and coiled tubing) with its assets generally concentrated inthe Permian, Bakken, and Marcellus.
Figure 264: Year-end 2016 geographic foot print
Frac Wireline Pumping Cement CT W/O Fluid
('000hp) trucks units units units rigs trucks
Permian 290 39 19 20 7 125 255
Bakken 200 18 11 0 0 73 81
Marcellus 170 24 0 16 2 9 62
South TX 80 9 17 0 16 32 212
Mid-Con 40 10 10 0 0 0 0
Canada 0 0 0 0 0 75 0
Other 40 27 0 0 19 145 511
Total 820 127 57 36 44 459 1,121
Completion Services Well Support Services
Source: Company reports, Deutsche Bank
Deutsche Bank Securities Inc. Page 83

9 October 2017
Oil Services & Equipment
Initiation of coverage
Figure 265: Segment EBITDA
(200)
(100)
0
100
200
300
400
500
600
7002
01
1
20
12
20
13
20
14
20
15
20
16
20
17
20
18
20
19
(a) (a) (a) (a) (a) (a) (e) (e) (e)
In m
illio
ns
of
US
D
Completion Services Well Support Services Other Services
Source: Company reports, Deutsche Bank
The primary contributors of free cash flow is its Completion Services segment.This business tends to benefit from greater leverage and pricing than the WellSupport Services business. When CJ acquired the completion and productionservices business from NBR in 2015, the company greatly increased its exposureto production related spend in order to improve diversification, extend its portfolioacross the well lifecycle, and access opex related customer spend. Despiteimproving activity levels, many of its Production Services businesses remainhighly competitive on price due to overcapacity and still low levels of utilization.We do not believe this will remain a core part of CJ’s product offering.
The primary uses of working capital and capex is to fund reactivation ofcompletion related assets that were stacked during the downturn and crewup the equipment. CJ estimates reactivation costs of warm stacked pressurepumping hp in the range of $6-7mm per fleet while cold stacked equipment willbe closer to $10-12mm per fleet. The company also ordered 20 newbuild pumpsto be deployed in 2H17. Management plans to take a measured approach toreactivation of equipment driven by returns. CJ has also focused on improvingits Production Services business by closing underperforming areas (e.g. coiledtubing in East TX) and redeploying those assets to more active regions and re-purposing underutilized fluid trucks to haul sand to help with last mile logistics.
DSOs temporarily spiked in Q1 as CJ migrated to a single ERP system at thebeginning of the year. Management has said that it has started to improve by theend of Q1.
Balance Sheet and LiquidityCJ increased its liquidity after emerging from Chapter 11 to about $426 millionas of June 30, 2017. CJ eliminated $1.4 billion of debt from its Chapter 11 filing,which in turn removed close to $80mm of annual interest expense. On May 4,the company doubled their ABL revolver to $200mm from $100mm and removedthe covenant that limited their ability to incur growth capex. With CJ being debtfree (excluding letters of credit) and the removal of the covenant that limited their
Page 84 Deutsche Bank Securities Inc.

9 October 2017
Oil Services & Equipment
Initiation of coverage
growth capex, the company can now fund reactivation of stacked equipment andorder new build capacity based on returns rather than debt service.
Figure 266: Consolidated EBITDA Figure 267: Earnings per share
(200)
(100)
0
100
200
300
400
500
600
20
11
20
12
20
13
20
14
20
15
20
16
20
17
20
18
20
19
(a) (a) (a) (a) (a) (a) (e) (e) (e)
In m
illi
on
s o
f U
SD
(3.00)
(2.00)
(1.00)
0.00
1.00
2.00
3.00
4.00
2011
2012
2013
2014
2015
2016
2017
2018
2019
(a) (a) (a) (a) (a) (a) (e) (e) (e)
EPS
Source: Company reports, Deutsche Bank Source: Company reports, Deutsche Bank
Figure 268: Free cash flow and capex Figure 269: Net debt
(400)
(300)
(200)
(100)
0
100
200
300
400
500
20
11
20
12
20
13
20
14
20
15
20
16
20
17
20
18
20
19
(a) (a) (a) (a) (a) (a) (e) (e) (e)
In m
illi
on
s o
f U
SD
Cash from operations Capital expenditures Free cash flow
(400)
(200)
0
200
400
600
800
1,000
1,200
1,400
1,600
20
11
20
12
20
13
20
14
20
15
20
16
20
17
20
18
20
19
(a) (a) (a) (a) (a) (a) (e) (e) (e)
In m
illi
on
s o
f U
SD
Source: Company reports, Deutsche Bank Source: Company reports, Deutsche Bank
Deutsche Bank Securities Inc. Page 85

9 October 2017
Oil Services & Equipment
Initiation of coverage
Figure 270: Income Statement(a) (a) (a) (a) (a) (a) (e) (e) (e)
In millions of USD 2011 2012 2013 2014 2015 2016 2017 2018 2019
Segment revenues:
Completion Services 736 1,070 1,062 1,596 1,217 592 1,267 1,870 2,207
Well Support Services 0 0 0 0 456 362 394 401 418
Other Services 22 41 8 12 76 16 0 0 0
Total revenues 758 1,112 1,070 1,608 1,749 971 1,661 2,271 2,625
Segment EBITDA:
Completion Services 310 376 248 317 74 (39) 220 434 563
Well Support Services 0 0 0 0 72 15 10 16 17
Other Services 13 16 7 31 (99) (26) 0 0 0
Corporate and other (38) (55) (65) (96) 2 (40) (95) (98) (98)
Total EBITDA 285 336 189 253 48 (90) 134 351 481
D&A 23 47 75 108 276 217 134 158 180
EBIT 262 289 115 145 (228) (308) 0 193 301
Interest (expense) (4) (5) (7) (10) (82) (157) (2) (2) (2)
Interest income 0 0 0 0 0 0 0 0 0
Equity income 0 0 0 0 0 0 0 0 0
Other income (0) (1) (0) 1 9 13 16 8 39
PBT 258 283 108 136 (301) (452) 14 199 339
Income tax (expense) (91) (96) (41) (51) 111 135 (7) (65) (110)
Non-controlling interest 0 0 0 0 0 0 0 0 0
Preferred dividends 0 0 0 0 0 0 0 0 0
Net income (operating) 167 187 66 84 (190) (317) 8 134 229
Discontinued ops 0 0 0 0 0 0 0 0 0
Unusual after-tax (5) (5) 0 (15) (683) (627) (26) 0 0
Net income (GAAP) 162 182 66 69 (873) (944) (19) 134 229
Operating EPS 3.29 3.47 1.20 1.49 (1.85) (2.68) 0.13 2.16 3.68
GAAP EPS 3.19 3.38 1.20 1.22 (8.50) (7.98) (0.31) 2.16 3.68
DPS 0.00 0.00 0.00 0.00 0.00 0.00 0.00 0.00 0.00
Diluted shares 51 54 55 57 103 118 61 62 62
EBITDA margin 37.6% 30.2% 17.7% 15.7% 2.8% -9.3% 8.1% 15.5% 18.3%
EBIT margin 34.6% 26.0% 10.7% 9.0% -13.0% -31.7% 0.0% 8.5% 11.5%
Tax rate 35.3% 33.9% 38.4% 37.9% 36.9% 29.9% 46.9% 32.5% 32.5%
Source: Deutsche Bank
Page 86 Deutsche Bank Securities Inc.

9 October 2017
Oil Services & Equipment
Initiation of coverage
Figure 271: Cash Flow Statement
(a) (a) (a) (a) (a) (a) (e) (e) (e)
In millions of USD 2011 2012 2013 2014 2015 2016 2017 2018 2019
Net income 167 187 66 84 (190) (317) 8 134 229
Depreciation 23 47 75 108 276 217 134 158 180
Deferred tax 46 16 17 33 (273) (130) 0 0 0
Chg in receivables (72) (11) 15 (136) 278 137 (235) (91) (34)
Chg in inventories (29) (11) (10) (50) 21 4 (19) (14) (4)
Chg in payables 41 (0) 18 132 (169) (75) 52 28 8
Other (4) 27 7 10 159 55 1 6 2
Cash from operations 172 255 187 182 103 (107) (60) 221 381
Capital expenditures (141) (182) (158) (308) (166) (58) (203) (260) (260)
Free cash flow 31 73 29 (126) (63) (165) (262) (39) 121
Acquisitions (27) (273) (15) (34) (663) (1) 0 0 0
Asset sales 2 0 1 1 4 33 31 0 0
Dividends paid 0 0 0 0 0 0 0 0 0
ESPP | options 0 3 5 1 0 0 0 0 0
Equity issuance, net 112 0 0 0 0 0 216 0 0
Debt issuance, net (72) 170 (21) 165 796 181 0 0 0
Other 5 (4) (0) (12) (58) (9) 110 0 0
Chg in cash 52 (32) (0) (4) 16 39 95 (39) 121
FCF per share 0.61 1.34 0.53 (2.23) (0.62) (1.40) (4.33) (0.63) 1.94
Capex / revenue 0.19 0.16 0.15 0.19 0.10 0.06 0.12 0.11 0.10
Capex / depreciation 6.14 3.88 2.11 2.84 0.60 0.27 1.51 1.64 1.45
Source: Deutsche Bank
Deutsche Bank Securities Inc. Page 87

9 October 2017
Oil Services & Equipment
Initiation of coverage
Figure 272: Balance Sheet
(a) (a) (a) (a) (a) (a) (e) (e) (e)
In millions of USD 2011 2012 2013 2014 2015 2016 2017 2018 2019
Cash and equivalents 47 14 14 10 26 65 160 121 242
Accounts receivable 122 167 153 291 275 137 370 461 495
Inventories 45 61 71 122 102 54 69 83 88
Other current assets 10 8 19 38 82 44 57 71 76
Total current assets 224 250 257 461 484 300 656 736 901
Net PP&E 214 434 536 783 1,210 951 649 751 831
Goodwill 65 197 206 220 308 0 0 0 0
Other assets 35 132 134 149 230 111 111 125 130
Total assets 538 1,013 1,132 1,613 2,233 1,362 1,416 1,612 1,862
Accounts payable 58 70 89 229 213 74 136 164 172
Current debt 0 0 0 0 13 25 0 0 0
Other current liabilities 16 35 37 56 64 81 109 135 145
Total current liabilities 74 105 125 285 291 181 245 299 317
Long-term debt 0 174 164 350 1,142 1,445 0 0 0
Other LT liabilities 137 239 272 481 458 215 278 339 360
Shareholders' equity 400 600 696 782 633 (299) 1,139 1,273 1,502
Total liabilities and equity 538 1,013 1,132 1,613 2,233 1,362 1,416 1,612 1,862
Total debt 0 174 164 350 1,156 1,470 0 0 0
Net debt (47) 159 150 340 1,130 1,406 (160) (121) (242)
Debt/capital 0% 22% 19% 31% 65% 125% 0% 0% 0%
Debt/equity 0% 29% 24% 45% 183% -492% 0% 0% 0%
Debt turns 0.0 0.5 0.9 1.4 23.8 (16.3) 0.0 0.0 0.0
Source: Deutsche Bank
Page 88 Deutsche Bank Securities Inc.

9 October 2017
Oil Services & Equipment
Initiation of coverage
Rating
BuyNorth AmericaUnited States
IndustrialsOil Services & Equipment
Company
Core Labs
Reuters Bloomberg
CLB.N CLB US
Best-in-Class Returns and Free CashFlowWe are initiating coverage with a Buy rating and $109 price targetCore Labs is among the most disciplined operators in the oilfield services industryin our view, with an acute focus on returns, free cash flow, and returning capitalto shareholders. The company also has good leverage to the US onshore marginexpansion opportunity via its Production Enhancement business, which to-datehas been impeded by the bottleneck in frac capacity. But as capacity is redeployedand added throughout 2H17 and into 2018, CLB’s earnings power will get tractionand its incremental margins should expand in to the 55-60% range.
Offering EOR techniques that might lift recoveries from 9% to 15%Well probably somewhere in the middle near-term. CLB is involved in a studywith a consortium of operators using its technology to increase the averageunconventional oil recovery rate from 9% to something in the 12-15% range(conventional recoveries average closer to 40% to put into context). CLB’s valueproposition for a 1 mmbbl EUR well is another 300-500 mbbls on top of that,which in CLB’s view could lift well returns by 40-50% including the addedinvestment of $1-2 million. Too early to decipher the market size and pace ofadoption, but increasing reservoir recovery is the Holy Grail for the oil industry.
ValuationOur $109 price target is 23x our estimateof the company’s normalized EPS power of$4.75 per share, which is in-line with the23x ten-year average multiple leading up tothe 2014 collapse in oil prices. The stockis currently trading at 33x our 2018 EPSestimate of $2.92 and 26x our 2019 EPSestimate of $3.67.The main investment risks include: 1) shiftsin OPEC policy and the influence thatwould have on oil prices and ultimately USupstream capital expenditures, 2) negativerevisions to global oil demand, and 3) acontinued rise in DUC inventories due toinsufficient frac capacity.
Best-in-class free cash flow and shareholder returnsReturning excess capital to investors is a core philosophy of CLB’s managementteam. CLB has been free cash positive every year over the last ten (and beyond)and its dividends have more than doubled to $2.20 per share since 2011 and haveremained steady despite the severity of the downturn.
Forecasts and ratios
Year End Dec 31 2016A 2017E 2018E
1Q EPS 0.37 0.42A 0.57
2Q EPS 0.35 0.51A 0.66
3Q EPS 0.38 0.44 0.78
4Q EPS 0.41 0.52 0.91
FY EPS (USD) 1.51 1.90 2.92
P/E (x) 74.6 50.6 32.9
DPS (USD) 2.20 2.20 2.20
Dividend Yield (%) 2.0 2.3 2.3
Revenue (USDm) 594.7 650.3 723.1Source: Deutsche Bank estimates, company data
David HavensResearch [email protected]
Price at 5 Oct 2017 (USD) 95.99
Price target 109.00
52-week range 125.37 - 87.47
Price/price relative
Core Labs S&P 500 INDEX (Rebased)
Jan '15 May '15 Sep '15 Jan '16 May '16 Sep '16 Jan '17 May '17 Sep '1780
100
120
140
160
180
200
Performance(%)
1m 3m 12m
Absolute 7.2 -7.0 -13.5
S&P 500INDEX
2.5 4.5 18.0
Source: Deutsche Bank
Stock & option liquidity data
Market Cap (USDm) 4,258.8
Shares outstanding (m) 44.4
Free float (%) –
Volume (5 Oct 2017) 87,496
Option volume (und. shrs., 1M avg.) 15,401Source: Deutsche Bank
Deutsche Bank Securities Inc. Page 89

9 October 2017
Oil Services & Equipment
Initiation of coverage
Key investment themes
Frac debottlenecking should enable earnings growth in 2018CLB has not yet participated in the earnings recovery to the degree it can becauseof shortages in frac capacity triggering a build in DUC (drilled but uncompletedwell) inventories. As frac capacity is redeployed and newbuilds begin comingto market, the rise in DUC inventories should be arrested by 2Q18 in our view,which should help CLB realize more of its onshore leverage. Its US revenuesare correlated with completion and stimulation activity, not so much the raw rigcount. Thus the build in DUCs since the recovery has impeded its earnings growth.Once activity is in full swing, CLB is guiding to an incremental margin of 60%initially, then back to its 35-45% range.
Figure 273: Drilled but uncompleted wells (DUCs)
-
1,000
2,000
3,000
4,000
5,000
6,000
Jan
-14
Ap
r-1
4
Jul-
14
Oct
-14
Jan
-15
Ap
r-1
5
Jul-
15
Oct
-15
Jan
-16
Ap
r-1
6
Jul-
16
Oct
-16
Jan
-17
Ap
r-1
7
Jul-
17
Permian Eagle Ford Bakken Anadarko
Source: EIA
Larger pads, longer revenue recognitionA high-class problem, but nonetheless keeping earnings revisions low in 2017.The larger pads keep CLB on location longer versus the customary one well,one diagnostic, and then payment. Multi-well pads add to the project size andcomplexity, which is dragging out the revenue recognition for CLB. This shouldall catch up by early 2018 and begin flowing through just as frac is also beginningto debottleneck.
CLB technologies enabling leading edge lateral lengths to increaseThere has been a debate on how long can laterals extend, which is critical forservice intensity. Beyond 10,000-ft, longer laterals encounter frictional forces thatmake the pumping of fluid and proppant in the wellbore less effective in termsof pressure at the toe of the well. CLB has developed friction reducers to enablelonger laterals.
Page 90 Deutsche Bank Securities Inc.

9 October 2017
Oil Services & Equipment
Initiation of coverage
Valuation and risksOur $109 price target is 23x our estimate of the company’s normalized EPS powerof $4.75 per share, which is in-line with the 23x ten-year average multiple leadingup to the 2014 collapse in oil prices. The stock is currently trading at 33x our 2018EPS estimate of $2.92 and 26x our 2019 EPS estimate of $3.67.
The main investment risks include: 1) shifts in OPEC policy and the influencethat would have on oil prices and ultimately US upstream capital expenditures, 2)negative revisions to global oil demand, and 3) a continued rise in DUC inventoriesdue to insufficient frac capacity.
Figure 274: The P/E valuation band as blown out Figure 275: The 5yr P/E leading up to 2014
-
10
20
30
40
50
60
70
80
Jan-10 Jan-11 Jan-12 Jan-13 Jan-14 Jan-15 Jan-16 Jan-17
-1 std 5yr avg +1 std
3
8
13
18
23
28
33
38
-1 std 5yr avg +1 std
Source: Factset Source: Factset
Deutsche Bank Securities Inc. Page 91

9 October 2017
Oil Services & Equipment
Initiation of coverage
Company description
Core Laboratories (CLB) focuses on maximizing daily production and ultimaterecovery rates for operators around the world. The company has two reportingsegments, Reservoir Description and Production Enhancement. ReservoirDescription provides analytical and field services that characterize the porousreservoir rock and all three reservoir fluids (natural gas, crude oil and water). Itmeasures the quality and quantity of the fluids as well as that of the derivedproducts. This data is used to determine the most efficient method of recovering,processing and refining the hydrocarbons. CLB analyzes reservoir rocks for theirporosity, which determines the reservoir storage capacity, as well as permeability,which defines the ability of fluids to flow through the rock. These measurementsare used to determine the oil and gas in-place and the rate at which it can beproduced.
Figure 276: Operating divisions
Reservoir Description Production Enhancement
- Reservoir fluid analysis - Completion diagnostics
- Petrophysical services - Reservoir diagnostics
- Equipment manufacturing - Drilling diagnostics
- Digital rock characterization - Perforating systems
- Well monitoring systems
- Completion and stimulation design
CORE LABS
Source: Company reports
Production Enhancement provides products and services for well completions,perforations, stimulations and production. It evaluate the effectiveness of wellcompletions and develops solutions to increase the effectiveness of enhanced oilrecovery projects. It provides data on the rock type and strength which is thenused to determine the proper design of the frac job.
Figure 277: Revenue mix
E
Reservoir
Description
48%
Production
Enhancement
43%
Reservoir
Management
9%
2014
Reservoir
Description
68%
Production
Enhancement
28%
Reservoir
Management
4%
2016
Source: Company reports, Deutsche Bank
Page 92 Deutsche Bank Securities Inc.

9 October 2017
Oil Services & Equipment
Initiation of coverage
Principal Sources and Uses of Cash Flow
A mix of steady state and higher US onshore leverageThe Reservoir Description business is a steadier state revenue and EBITDA streamthan Production Enhancement is. Management describes it as a $100 millionper quarter baseline business that now stands to benefit from a recovery ininternational FIDs, which is progressing slowly, but with an early 2018 impacton earnings rather than 2H17. The company can generate anywhere from$2-5 million in revenue per project once FIDs move from the planning to theimplementation phase.
CLB’s Production Enhancement business has more leverage to the US onshoreand international completion markets. Its US revenues, which company-widewere 38% of 2016 revenues, correlate not with the raw rig count, but with theactual completion and stimulation activity. Earlier earnings disappointments weretriggered because while rig counts moved higher at a record pace, there wasinsufficient pressure pumping capacity to fulfill the completion needs of theproducers, which contributed to the building of the DUC inventory. CLB makesmoney when wells are being completed, not inventoried. Frac capacity is comingonline with a de-bottlenecking likely in 1H18.
To put the leverage into context, Production Enhancement EBITDA grew 63%from 2010 to 2014, twice the pace of Reservoir Description. While some of thiswas driven by the company’s niche technology M&A strategy, the majority wasa function of the US onshore completions leverage.
Figure 278: Geographic revenues
United
States
47%
Eur/Afr/ME
25%
Canada
10%
LAM
4%
FSU
5%
APAC
9%
2014
United States
38%
Eur/Afr/ME
37%
Canada
4%
LAM
4%
FSU
6%
APAC
11%
2016
Source: Company reports, Deutsche Bank
Deutsche Bank Securities Inc. Page 93

9 October 2017
Oil Services & Equipment
Initiation of coverage
Figure 279: Segment EBITDA
0
50
100
150
200
250
300
350
4002
00
7
20
08
20
09
20
10
20
11
20
12
20
13
20
14
20
15
20
16
20
17
20
18
20
19
(a) (a) (a) (a) (a) (a) (a) (a) (a) (a) (e) (e) (e)
In m
illio
ns
of
USD
Reservoir Description Production Enhancement Reservoir Management Other
Note: Reservoir Management was folded into both Reservoir Description and Production Enhancement in 2017.
Source: Deutsche Bank
CLB demonstrates extraordinary positive free cash flow consistencyThe company has generated close to $1.9 billion of free cash flow since 2007 witha very steady cash conversion performance. The capital intensity of this businessis low. CLB has spent on average only 13% of its cash from operations on capitalexpenditures over the last ten years versus an integrated service company withhigh exposure to the frac industry, like Halliburton, which spent over 70% of itscash flow from operations on capital expenditures.
Figure 280: Leader in consistent cash conversion Figure 281: Positive free cash flow each year
0.00
0.20
0.40
0.60
0.80
1.00
1.20
1.40
20
07
20
08
20
09
20
10
20
11
20
12
20
13
20
14
20
15
20
16
20
17
20
18
20
19
(a) (a) (a) (a) (a) (a) (a) (a) (a) (a) (e) (e) (e)
Ca
sh c
on
ve
rsio
n r
ati
o
(100)
(50)
0
50
100
150
200
250
300
350
20
07
20
08
20
09
20
10
20
11
20
12
20
13
20
14
20
15
20
16
20
17
20
18
20
19
(a) (a) (a) (a) (a) (a) (a) (a) (a) (a) (e) (e) (e)
In m
illio
ns
of
USD
Cash from operations Capital expenditures Free cash flow
Note: Measured as cash from operations/EBITDA
Source: Deutsche Bank
Source: Company reports, Deutsche Bank
Dividends and share buybacks are core uses of capitalSince the inception of the share repurchase program in 2002, CLB has boughtshares at an average price of $41.30 and has returned $2.4 billion in sharerepurchase and dividends.
Page 94 Deutsche Bank Securities Inc.

9 October 2017
Oil Services & Equipment
Initiation of coverage
Figure 282: Share repurchases and dividends paid
(400)
(300)
(200)
(100)
0
100
200
3002
00
7
20
08
20
09
20
10
20
11
20
12
20
13
20
14
20
15
20
16
20
17
(a) (a) (a) (a) (a) (a) (a) (a) (a) (a) (e)
In m
illi
on
s o
f U
SD
Source: Company reports, Deutsche Bank
Figure 283: Net debt
0
50
100
150
200
250
300
350
400
450
20
07
20
08
20
09
20
10
20
11
20
12
20
13
20
14
20
15
20
16
20
17
20
18
20
19
(a) (a) (a) (a) (a) (a) (a) (a) (a) (a) (e) (e) (e)
In m
illi
on
s o
f U
SD
Source: Company reports, Deutsche Bank
Figure 284: Annual EPS Figure 285: Free cash flow and dividends paid
0.00
1.00
2.00
3.00
4.00
5.00
6.00
7.00
2007
2008
2009
2010
2011
2012
2013
2014
2015
2016
2017
2018
2019
(a) (a) (a) (a) (a) (a) (a) (a) (a) (a) (e) (e) (e)
EPS
(150)
(100)
(50)
0
50
100
150
200
250
300
20
07
20
08
20
09
20
10
20
11
20
12
20
13
20
14
20
15
20
16
20
17
20
18
20
19
(a) (a) (a) (a) (a) (a) (a) (a) (a) (a) (e) (e) (e)
In m
illi
on
s o
f U
SD
Free cash flow Dividends paid
Source: Company reports, Deutsche Bank Source: Company reports, Deutsche Bank
Deutsche Bank Securities Inc. Page 95

9 October 2017
Oil Services & Equipment
Initiation of coverage
Figure 286: Income Statement(a) (a) (a) (a) (a) (a) (a) (a) (e) (e) (e)
In millions of USD 2009 2010 2011 2012 2013 2014 2015 2016 2017 2018 2019
Segment revenues:
Reservoir Description 415 426 470 496 522 519 473 404 414 454 477
Production Enhancement 231 314 371 404 452 468 267 164 236 269 296
Reservoir Management 50 55 66 82 99 99 57 27 - - -
Total revenues 696 795 908 981 1,074 1,085 798 595 650 723 772
Segment EBITDA:
Reservoir Description 123 120 137 159 162 160 141 94 87 119 141
Production Enhancement 71 108 121 130 164 175 55 15 46 68 84
Reservoir Management 15 20 23 27 33 39 18 3 - - -
Other 1 3 2 2 3 3 2 3 2 2 3
Total EBITDA 209 252 284 318 362 377 216 115 135 188 228
Segment D&A:
Reservoir Description 14 14 14 14 15 16 17 18 18 18 17
Production Enhancement 6 6 6 6 8 8 7 5 5 5 5
Reservoir Management 1 1 1 1 1 1 2 1 - - -
Corporate and other 3 2 2 2 2 2 2 3 2 2 3
Total D&A 24 23 23 23 25 27 27 27 25 25 25
Segment EBIT:
Reservoir Description 109 106 123 145 147 145 125 76 69 101 123
Production Enhancement 65 101 115 124 156 168 48 10 40 62 79
Reservoir Management 14 20 23 26 32 37 16 2 - - -
Corporate and other (2) 1 0 (0) 1 1 (0) 0 (0) (0) (0)
EBIT 186 228 261 295 336 351 189 88 110 163 203
Interest (expense) (16) (16) (11) (9) (9) (11) (12) (12) (11) (11) (11)
Interest income - - - - - - - - - - -
Equity income - - - - - - - - - - -
Other income - (1) (0) - - - - - - - -
PBT 170 212 250 286 327 340 176 76 99 152 192
Income tax (expense) (54) (64) (68) (71) (82) (81) (40) (10) (15) (23) (29)
Non-controlling interest (0) (0) 0 (1) (0) (1) (0) 0 (0) (0) (0)
Preferred dividends - - - - - - - - - - -
Net income (operating) 115 148 182 214 245 258 136 66 84 130 163
Discontinued ops - - - - - - - - - - -
Unusual after-tax (2) (3) 3 2 (2) (1) (21) (2) (1) - -
Net income (GAAP) 114 145 185 216 243 257 115 64 83 130 163
Operating EPS 2.47 3.06 3.76 4.51 5.32 5.79 3.17 1.51 1.90 2.92 3.67
GAAP EPS 2.44 3.00 3.82 4.55 5.28 5.77 2.68 1.46 1.87 2.92 3.67
DPS 0.58 0.89 1.00 1.12 1.28 2.00 2.20 2.20 2.20 2.20 2.20
Diluted shares 47 48 48 48 46 45 43 44 44 44 44
EBITDA margin 30.1% 31.7% 31.3% 32.4% 33.7% 34.8% 27.1% 19.3% 20.7% 26.0% 29.5%
EBIT margin 26.7% 28.7% 28.7% 30.1% 31.3% 32.3% 23.6% 14.8% 16.8% 22.6% 26.2%
Tax rate 31.8% 30.0% 27.2% 25.0% 25.0% 23.7% 22.7% 13.4% 14.8% 15.0% 15.0%
Source: Deutsche Bank
Page 96 Deutsche Bank Securities Inc.

9 October 2017
Oil Services & Equipment
Initiation of coverage
Figure 287: Cash Flow Statement
(a) (a) (a) (a) (a) (a) (a) (a) (e) (e) (e)
In millions of USD 2009 2010 2011 2012 2013 2014 2015 2016 2017 2018 2019
Net income 115 148 182 214 245 258 136 66 84 130 162
Depreciation 24 23 23 23 25 27 27 27 25 25 25
Deferred tax 26 (10) (7) 4 7 5 (0) (14) 7 - -
Chg in receivables 10 (22) (12) (17) (16) 3 49 32 (17) (18) (1)
Chg in inventories 2 (2) (16) 3 1 3 3 6 (3) (1) (0)
Chg in payables (9) 12 12 (4) (6) (3) (13) (1) 10 1 0
Other 14 58 22 13 43 10 17 17 (2) 10 0
Cash from operations 182 206 204 237 298 303 219 132 104 147 187
Capital expenditures (17) (28) (30) (31) (35) (37) (23) (11) (20) (27) (29)
Free cash flow 165 178 174 206 263 267 196 121 83 120 158
Acquisitions - (9) (21) (1) - (1) (14) (1) - - -
Asset sales 1 1 1 1 1 1 1 1 1 - -
Dividends paid (26) (40) (46) (53) (59) (89) (94) (95) (97) (98) (98)
ESPP | options 0 0 0 0 0 - - - - - -
Equity issuance, net (9) (92) (62) (176) (227) (264) (160) 190 (7) - -
Debt issuance, net - (82) 69 9 33 89 75 (217) 17 - -
Other 15 (3) (220) 4 (5) (4) (6) (5) (1) - -
Chg in cash 145 (47) (105) (10) 6 (2) (1) (8) (5) 22 61
FCF per share 3.53 3.70 3.60 4.34 5.71 5.98 4.58 2.76 1.88 2.70 3.57
Capex / revenue 0.02 0.03 0.03 0.03 0.03 0.03 0.03 0.02 0.03 0.04 0.04
Capex / depreciation 0.73 1.19 1.28 1.36 1.39 1.37 0.83 0.42 0.81 1.11 1.15
Source: Deutsche Bank
Deutsche Bank Securities Inc. Page 97
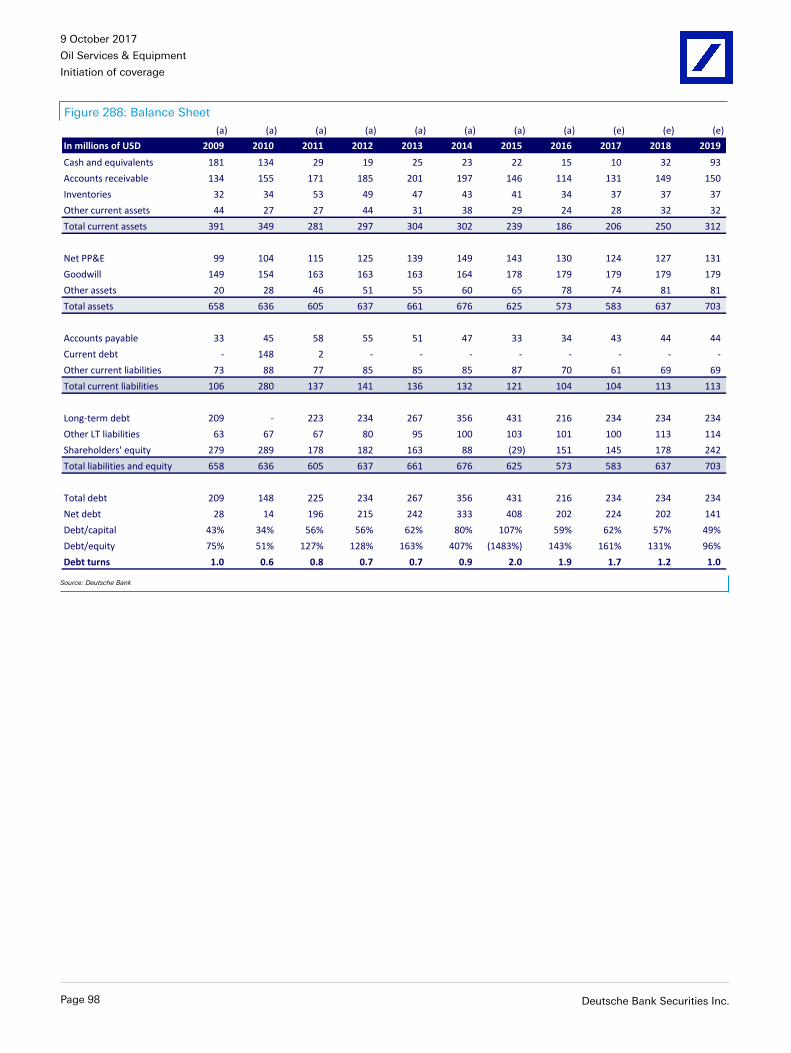
9 October 2017
Oil Services & Equipment
Initiation of coverage
Figure 288: Balance Sheet
(a) (a) (a) (a) (a) (a) (a) (a) (e) (e) (e)
In millions of USD 2009 2010 2011 2012 2013 2014 2015 2016 2017 2018 2019
Cash and equivalents 181 134 29 19 25 23 22 15 10 32 93
Accounts receivable 134 155 171 185 201 197 146 114 131 149 150
Inventories 32 34 53 49 47 43 41 34 37 37 37
Other current assets 44 27 27 44 31 38 29 24 28 32 32
Total current assets 391 349 281 297 304 302 239 186 206 250 312
Net PP&E 99 104 115 125 139 149 143 130 124 127 131
Goodwill 149 154 163 163 163 164 178 179 179 179 179
Other assets 20 28 46 51 55 60 65 78 74 81 81
Total assets 658 636 605 637 661 676 625 573 583 637 703
Accounts payable 33 45 58 55 51 47 33 34 43 44 44
Current debt - 148 2 - - - - - - - -
Other current liabilities 73 88 77 85 85 85 87 70 61 69 69
Total current liabilities 106 280 137 141 136 132 121 104 104 113 113
Long-term debt 209 - 223 234 267 356 431 216 234 234 234
Other LT liabilities 63 67 67 80 95 100 103 101 100 113 114
Shareholders' equity 279 289 178 182 163 88 (29) 151 145 178 242
Total liabilities and equity 658 636 605 637 661 676 625 573 583 637 703
Total debt 209 148 225 234 267 356 431 216 234 234 234
Net debt 28 14 196 215 242 333 408 202 224 202 141
Debt/capital 43% 34% 56% 56% 62% 80% 107% 59% 62% 57% 49%
Debt/equity 75% 51% 127% 128% 163% 407% (1483%) 143% 161% 131% 96%
Debt turns 1.0 0.6 0.8 0.7 0.7 0.9 2.0 1.9 1.7 1.2 1.0
Source: Deutsche Bank
Page 98 Deutsche Bank Securities Inc.

9 October 2017
Oil Services & Equipment
Initiation of coverage
Rating
HoldNorth AmericaUnited States
IndustrialsOil Services & Equipment
Company
Diamond OffshoreDrilling
Reuters Bloomberg
DO.N DO US
Looking to replenish earnings powerInitiating coverage with a Hold rating and an $15 price targetDiamond’s earnings power has diminished severely, but its fiscal stabilitycompares very favorably with its peers. The company has no more newbuildobligations to burden free cash flow, dividends have already been eliminated,and its early termination risk has run its course in our view. But we expect thedeepwater market to remain challenged through at least 2019 with a recoveryforming in 2017, but one that is very slow to build and one with fierce pricingtactics. While we believe the alpha short is gone, the weakening near-term trendsin EBITDA leaves little upside without a rapid move higher in oil prices.
Severely diminished earnings powerDiamond has been experiencing eroding earnings power since 2009. Prior to thedrop in oil prices, EBITDA had already been halved from the high of $2.3 billion,and we expect it will fall to about $0.36 billion in 2019. Its fleet is also half of itspeak earnings size with its midwater floating fleet almost entirely gone due largelyto scrapping. We believe its core marketable fleet has consolidated around 11 ofits remaining 19 rigs including the four newbuild “Blackships” which are 55% ofits backlog. Diamond has been among the most aggressive scrappers of rigs, andwe expect management will look to replenish its earnings power via M&A in thecoming months and years.
ValuationWe are initiating coverage with an $15price target. This is 5.2x our estimate ofthe company’s normalized EBITDA of $0.64billion, which is one-turn below the 6.2xten-year average multiple. The company iscurrently trading at 7.1x our fiscal 2018EBITDA estimate of $0.46 billion. We believethe discounted multiple is warranted due tothe severely diminished earnings power ofthe company and the significant challengesthat lie ahead for the industry in termsof utilization and pricing power as thedeepwater market copes with the historicsupply demand imbalance.
Peer leading fiscal stabilityDespite the erosion in earnings power and the severity of the deepwaterdownturn, Diamond has managed to keep a relatively high fiscal stability withdebt turns of 3.2x versus its peers as high as 8.0x. Its $1.5 billion credit facility isuntouched and its nearest debt maturity is May 2019 for $500 million, which thecompany is more than equipped to handle.
Forecasts and ratios
Year End Dec 31 2016A 2017E 2018E
1Q EPS 0.64 0.17A -0.03
2Q EPS 0.16 0.45A 0.11
3Q EPS 0.10 0.19 0.15
4Q EPS 0.27 0.13 -0.07
FY EPS (USD) 1.17 0.95 0.16
OLD FY EPS (USD) 1.23 0.87 0.35
% Change -5.1% 9.5% -54.9%
P/E (x) 17.3 15.7 93.7
DPS (USD) 0.00 0.00 0.00
Dividend Yield (%) 0.0 0.0 0.0
Revenue (USDm) 1,564.7 1,465.0 1,283.7Source: Deutsche Bank estimates, company data
David HavensResearch [email protected]
Price at 5 Oct 2017 (USD) 14.88
Price target 15.00
52-week range 21.08 - 10.22
Price/price relative
Diamond Offshore Dri S&P 500 INDEX (Rebased)
Jan '15 May '15 Sep '15 Jan '16 May '16 Sep '16 Jan '17 May '17 Sep '175
10
15
20
25
30
35
40
45
50
Performance(%)
1m 3m 12m
Absolute 20.0 26.2 -12.8
S&P 500INDEX
2.5 4.5 18.0
Source: Deutsche Bank
Stock & option liquidity data
Market Cap (USDm) 2,042.0
Shares outstanding (m) 137.2
Free float (%) 100
Volume (5 Oct 2017) 564,897
Option volume (und. shrs., 1M avg.) 93,916Source: Deutsche Bank
Deutsche Bank Securities Inc. Page 99

9 October 2017
Oil Services & Equipment
Initiation of coverage
Key investment themes
Ultra-deepwater contracts providing some cover through 2019These are the most challenging market conditions the deepwater industry hasever faced. Diamond’s sources of cash flow have diminished severely and itsmarketed fleet has been halved due largely to rig attrition. The company’s backlogof $2.7 billion is down 75% from the $10.9 billion in February 2009. But Diamondsecured some cover with its four newbuild drillships, which are 55% of the currentbacklog. Higher legacy contracts with Anadarko (2) and Hess (2) at $495 kpd and$400 kpd respectively with durations extending to mid-June 2019 and early 2020provide the company well needed cash flow.
Figure 289: Backlog by customer
-
0.1
0.2
0.3
0.4
0.5
0.6
0.7
0.8
0.9
AP
C
HE
S
PB
R
BP
AP
A
Wo
od
sid
e
Ori
gin
Co
op
er
RD
S
Ma
ers
k
De
cip
he
r
BH
P
Fie
ldw
oo
d
In b
illio
ns
of
US
D
Source: Company reports, Deutsche Bank
Diamond’s top five customers represent 95% of the company’s total backlog. Theultra-deepwater is 93% of the total backlog.
Figure 290: Revenues in backlog Figure 291: Year-end backlog
0
200
400
600
800
1,000
1,200
1,400
2017 2018 2019 2020 2021
In m
illi
on
s o
f U
SD
Ultra-deepwater Deepwater Midwater Jackups
-500
0
500
1,000
1,500
2,000
2,500
2017 2018 2019 2020 2021
Ultra-deepwater Deepwater Midwater Jackups
Source: Company reports, Deutsche Bank Source: Company reports, Deutsche Bank
Page 100 Deutsche Bank Securities Inc.

9 October 2017
Oil Services & Equipment
Initiation of coverage
Figure 292: Diamond Offshore backlog details
Revenue in backlog ($m) 2017 2018 2019 2020 2021 Total backlog Abbrev ($bn)
Ultra-deepwater 325 1,127 858 174 0 Ultra-deepwater UDW 2.5
Deepwater 38 13 0 0 0 Deepwater DW 0.1
Harsh-environment 0 0 0 0 0 Harsh-environment HE
Midwater 17 43 55 23 0 Midwater MW 0.1
Jackups 2 0 0 0 0 Jackups JU 0.0
Total backlog 383 1,184 913 196 0 Total backlog 2.7
Days committed 2017 2018 2019 2020 2021
Ultra-deepwater 65% 69% 50% 10% 0%
Deepwater 40% 4% 0% 0% 0%
Harsh-environment
Midwater 21% 42% 50% 21% 0%
Jackups 26% 0% 0% 0% 0%
Total backlog 52% 45% 34% 8% 0%
Year-end backlog ($m) 2017 2018 2019 2020 2021
Ultra-deepwater 2,158 1,031 174 0 0
Deepwater 13 0 0 0 0
Harsh-environment 0 0 0 0 0
Midwater 121 78 23 0 0 2017 2018 2019
Jackups 0 0 0 0 0 Total debt 1,981 1,981 1,481
Total backlog 2,292 1,109 196 0 0 Debt / YE backlog 0.9 1.8 7.5
Backlog by customer ($m) #1 #2 #3 #4 #5 Top 5 customers in backlog Percent $bn
Ultra-deepwater APC HES PBR BP Origin APC #1 29% 0.8
Backlog 780 704 567 382 27 HES #2 26% 0.7
% of backlog 31% 28% 23% 15% 1% PBR #3 21% 0.6
Deepwater Woodside Maersk APA APC Azinor BP #4 14% 0.4
Backlog 35 16 - - - APA #5 4% 0.1
% of backlog 68% 32% 0% 0% 0% Other 5% 0.1
Harsh-environment
Backlog 09/18/17 12/31/17 12/31/18 12/31/19
% of backlog Fleet composition 2017 2018 2019
Midwater APA RDS Decipher APC Azinor Ultra-deepwater 11 11 11
Backlog 110 17 11 - - Deepwater 5 5 5
% of backlog 79% 12% 8% 0% 0% Harsh-environment - - -
Jackups Fieldwood APA APC Azinor BHP Midwater 2 2 2
Backlog 2 - - - - Jackups 1 1 1
% of backlog 100% 0% 0% 0% 0% Total in fleet 19 19 19
Backlog by rig type
UDW
DW
HE
MW
JU
Source: Company reports, Deutsche Bank
Deutsche Bank Securities Inc. Page 101

9 October 2017
Oil Services & Equipment
Initiation of coverage
Valuation and risksWe are initiating coverage of Diamond Offshore with an $15 price target. This is5.2x our estimate of the company’s normalized EBITDA of $0.64 billion, whichis one-turn below the 6.2x ten-year average multiple. The company is currentlytrading at 7.1x our fiscal 2018 EBITDA estimate of $0.46 billion. We believe thediscounted multiple is warranted due to the severely diminished earnings powerof the company and the significant challenges that lie ahead for the industry interms of utilization and pricing power as the deepwater market copes with thehistoric supply demand imbalance.
In terms of steel value, we assess the trough net asset value at $6.50 per share,which assumes the market endures another three years of high volumes ofcold-stacking once contracts expire and leading edge market rates that stay atbreakeven levels ($160-170 kpd).
The main investment risks include: 1) shifts in OPEC policy and the influencethat would have on oil prices and ultimately US upstream capital expenditures, 2)negative revisions to global oil demand, 3) M&A with Diamond as the suitor, and4) increased flow of capex directed away from the offshore and toward onshoreoperations. Upside risks are mainly associated with a rapid rise in oil prices, whichwould prompt the firmly entrenched sentiment in the offshore drilling names topivot in our view.
Figure 293: The EV/EBITDA valuation band as blown out Figure 294: The 5yr EV/EBITDA leading up to 2014
-
1
2
3
4
5
6
7
8
9
-1 std 10yr avg +1 std
6.0
3
4
5
6
7
8
9
Se
p-0
7
Jan
-08
Ma
y-0
8
Se
p-0
8
Jan
-09
Ma
y-0
9
Se
p-0
9
Jan
-10
Ma
y-1
0
Se
p-1
0
Jan
-11
Ma
y-1
1
Se
p-1
1
Jan
-12
Ma
y-1
2
Se
p-1
2
Jan
-13
Ma
y-1
3
Se
p-1
3
Jan
-14
Ma
y-1
4
Se
p-1
4
-1 std 10yr avg +1 std
Source: Factset Source: Factset
Page 102 Deutsche Bank Securities Inc.

9 October 2017
Oil Services & Equipment
Initiation of coverage
Company description
Diamond Offshore (DO) is a contract drilling company with a fleet of 19mobile offshore drilling rigs including 11 ultra-deepwater floaters, five deepwaterfloaters, two midwater floaters and one jackup. It is a company that until recentlypreferred upgrading older rigs instead of funding newbuilds. Back in 2009, whenDiamond recorded its highest EBITDA and free cash flow of $2.3 billion and $1.1billion respectively, its fleet was twice its current size and its revenue mix washeavily weighted toward its midwater semisubmersibles. Most of these rigs havesince been scrapped due to poor industry conditions and the company has pivotedits strategy to focus on leading edge ultra-deepwater rigs that are more suitablefor what has become a fiercely competitive deepwater market.
Figure 295: Revenues by rig type
Deepwater
39%
Midwater
48%
Jackups
13%
2009
Ultra-
deepwater
67%
Deepwater
17%
Midwater
14%Jackups
2%
2016
Source: Company reports, Deutsche Bank
Figure 296: Revenues by geography
United States
34%
South America
20%
Europe/Africa/Med
20%
Australia
/Asia
17%
Mexico
9%
2009
Eu
rica
United States
34%
South America
27%
Europe/Africa/Med
22%
Australia
/Asia
15%
Mexico
2%
2016
Source: Company reports
Deutsche Bank Securities Inc. Page 103

9 October 2017
Oil Services & Equipment
Initiation of coverage
Principal Sources and Uses of Cash Flow
Ultra-deepwater has become Diamond’s core source of cash flowDiamond’s principal source of cash flow is its ultra-deepwater fleet. Since 2009,the company has spent in excess of $4.1 billion to reposition its fleet in theultra-deepwater and another $0.8 billion for two major deepwater upgrades. Thissegment generated almost two-thirds of its 2016 EBITDA of $0.7 billion and is93% of the company’s $2.7 billion backlog. Its four newbuild drillships, whichcost over $2.5 billion to build, account for 55% of the total backlog at $1.5 billion.But even this segment is not immune to obsolescence. Three of the semis inthis segment including the Ocean Confidence, Ocean Rover and Ocean Endeavor,were originally built in the 1970s and later upgraded extensively. These rigs arenow cold-stacked and some, if not all are candidates for retirement in our view.The company recently retired the Ocean Baroness, which was the fourth such rig.
Figure 297: Change in fleet size and mix
48 47 50
39 38 39 33
24 19 19 19
0
10
20
30
40
50
60
20
09
20
10
20
11
20
12
20
13
20
14
20
15
20
16
20
17
20
18
20
20
(a) (a) (a) (a) (a) (a) (a) (a) (e) (e) (e)
Ultra-deepwater Deepwater Midwater Jackups Total rigs
Source: Company reports, Deutsche Bank
While the company has no remaining newbuild or upgrade obligations left, itdoes continue to seek ways to build scale in the ultra-deepwater. The companyhas vetted its Floating Factory concept, but we do not believe managementintends to fund any more newbuilds under current industry conditions. We believeacquisitions are a part of Diamond’s strategy to build scale.
Severely diminished earnings powerDiamond recorded its highest ever EBITDA and free cash flow of $2.3 billion and$1.1 billion respectively in 2009. Back then, the company had 47 offshore rigs, 19of which were midwater floaters. These midwater floaters were $6 billion of thetotal $10.9 billion of backlog in February 2009, and generated 49% of the EBITDA.Diamond’s fleet of midwater semisubmersibles has since been reduced to two,mainly due to attrition as well as a few upgrades. Midwater backlog stands ata mere $0.1 billion. The midwater fleet is essentially obsolete with no real valueascribed to it in our model.
Diamond’s fleet of six deepwater semisubmersibles also struggles withobsolescence and has a backlog of only $0.1 billion. The company has one jackupleft (down from 15 in 2009) that is strategic only in the sense that it provides afoothold in Mexico. Combine all this with dayrates that are likely to remain fiercelycompetitive into 2019 means restoring earnings power to 2009 levels of $2.3billion is implausible, at least organically in our view.
Page 104 Deutsche Bank Securities Inc.

9 October 2017
Oil Services & Equipment
Initiation of coverage
Figure 298: Segment EBITDA
(500)
0
500
1,000
1,500
2,000
2,5002
00
2
20
03
20
04
20
05
20
06
20
07
20
08
20
09
20
10
20
11
20
12
20
13
20
14
20
15
20
16
20
17
20
18
20
19
(a) (a) (a) (a) (a) (a) (a) (a) (a) (a) (a) (a) (a) (a) (a) (e) (e) (e)
In m
illi
on
s o
f U
SD
Ultra-deepwater Deepwater Midwater Jackups
Source: Company reports, Deutsche Bank
While Diamond will seek to restore some of its lost earnings power viaacquisitions in our view, the earnings power until then has been more thanhalved. We believe only 11 of its existing 19 rigs will be core cash flowingassets. Aggregated, we believe the earnings power of the fleet in terms ofEBITDA is about $925 million compared to the $2.3 billion generated in 2009, andthis assumes dayrates recover to NPV breakeven levels. We estimate the NPVbreakeven level for a 12,000-ft dynamically positioned drillship is $425,000 perday, which is a lofty assumption in such a challenging market. If we use a leadingedge rate recovery of $300,000 per day, which we believe is still challenging, butmore reasonable through 2019, the earnings power is $640 million in our view.
Fleet renewal program is complete, burden on free cash flow liftedThe principal uses of cash have been the fleet renewal program and dividends.Since 2007, Diamond’s capital expenditures have totaled $8.1 billion, or 69% ofcash from operations. The company’s capex elevated in 2011 when it embarkedon its five-rig ultra-deepwater newbuild program which accounted for about $4.1billion of total expenditures, or 36% of the aggregate cash from operations. Itstwo major upgrades on the Ocean Onyx and Ocean Apex accounted for another$0.8 billion. Diamond completed its newbuild program in 2016 and has guided2017 capex to $145 million, which is down over 90% from the peak of $2 billionin 2014.
Deutsche Bank Securities Inc. Page 105

9 October 2017
Oil Services & Equipment
Initiation of coverage
Figure 299: Free cash flow and dividends Figure 300: Capex
(2,500)
(2,000)
(1,500)
(1,000)
(500)
0
500
1,000
1,500
2,000
20
02
20
03
20
04
20
05
20
06
20
07
20
08
20
09
20
10
20
11
20
12
20
13
20
14
20
15
20
16
20
17
20
18
20
20
(a) (a) (a) (a) (a) (a) (a) (a) (a) (a) (a) (a) (a) (a) (a) (e) (e) (e)
In m
illio
ns
of
USD
Cash from operations Capital expenditures Free cash flow
0
500
1,000
1,500
2,000
2,500
20
02
20
03
20
04
20
05
20
06
20
07
20
08
20
09
20
10
20
11
20
12
20
13
20
14
20
15
20
16
20
17
20
18
20
19
(a) (a) (a) (a) (a) (a) (a) (a) (a) (a) (a) (a) (a) (a) (a) (e) (e) (e)
In m
illio
ns
of
USD
Capital expenditures Depreciation
Source: Deutsche Bank Source: Deutsche Bank
Elevated leverage, but metrics still compare favorably to peersWhile Diamond’s earnings power has diminished more than its peers, its fiscalstability is superior to most of its peers that are trending above 8x debt turns. Thenext debt maturity of $500 million for Diamond is not until May 2019.
Figure 301: Debt turns Figure 302: Net debt
0.0
1.0
2.0
3.0
4.0
5.0
6.0
7.0
8.0
2002
2003
2004
2005
2006
2007
2008
2009
2010
2011
2012
2013
2014
2015
2016
2017
2018
2019
(a) (a) (a) (a) (a) (a) (a) (a) (a) (a) (a) (a) (a) (a) (a) (e) (e) (e)
Debt-turns
(500)
0
500
1,000
1,500
2,000
2,5002
00
2
20
03
20
04
20
05
20
06
20
07
20
08
20
09
20
10
20
11
20
12
20
13
20
14
20
15
20
16
20
17
20
18
20
19
(a) (a) (a) (a) (a) (a) (a) (a) (a) (a) (a) (a) (a) (a) (a) (e) (e) (e)
In m
illio
ns
of
USD
Source: Company reports, Deutsche Bank Source: Company reports, Deutsche Bank
Figure 303: EPS trend
10.19
(2.00)
0.00
2.00
4.00
6.00
8.00
10.00
12.00
20
02
20
03
20
04
20
05
20
06
20
07
20
08
20
09
20
10
20
11
20
12
20
13
20
14
20
15
20
16
20
17
20
18
20
19
(a) (a) (a) (a) (a) (a) (a) (a) (a) (a) (a) (a) (a) (a) (a) (e) (e) (e)
EP
S
Source: Company reports, Deutsche Bank
Page 106 Deutsche Bank Securities Inc.

9 October 2017
Oil Services & Equipment
Initiation of coverage
Figure 304: Fleet profile
Rig name
Water
depth (ft) Rig type
Year in
service Rig design
Backlog
(yrs)
Backlog
($m)
Ultra-deepwater (11):
Ocean Courage 10,000 6G SS-DP 2009 Friede & Goldman ExD 2.8 406.7
Ocean BlackHornet 12,000 DS-DP 2014 GustoMSC P10000 2.6 465.3
Ocean BlackLion 12,000 DS-DP 2015 GustoMSC P10000 2.4 352.0
Ocean BlackRhino 12,000 DS-DP 2014 GustoMSC P10000 2.4 352.0
Ocean GreatWhite 10,000 6G SS-DP 2016 Moss Maritime CS-60 E 2.3 382.1
Ocean BlackHawk 12,000 DS-DP 2014 GustoMSC P10000 1.7 314.3
Ocean Valor 10,000 6G SS-DP 2009 Friede & Goldman ExD 1.1 160.5
Ocean Monarch 10,000 5G SS 2008 ODECO Ocean Victory 1.2 50.4
Ocean Confidence 10,000 5G SS-DP 2001 Aker H-3.2 Enhanced - -
Ocean Endeavor 10,000 5G SS 2007 ODECO Ocean Victory - -
Ocean Rover 8,000 5G SS 2003 ODECO Ocean Victory - -
Deepwater (5):
Ocean Apex 6,000 5G SS 2014 ODECO Ocean Victory 0.4 35.4
Ocean Valiant 5,500 4G SS 1988 ODECO Ocean Odyssey 0.4 16.3
Ocean Onyx 6,000 5G SS 2014 ODECO Ocean Victory - -
Ocean America 5,500 4G SS 1988 ODECO Ocean Odyssey - -
Ocean Victory 5,500 4G SS 1997 ODECO Ocean Victory - -
Midwater (2):
Ocean Patriot 3,000 3G SS 1983 Trosvik Bingo 3000 2.7 127.0
Ocean Guardian 1,500 3G SS 1985 E&W/Sedco 711 Series 0.7 11.3
Jackups (1):
Ocean Scepter 350 IC 2008 KFELS Super B Class 0.1 1.9
Source: Company reports, Deutsche Bank
Deutsche Bank Securities Inc. Page 107

9 October 2017
Oil Services & Equipment
Initiation of coverage
Figure 305: Income Statement(a) (a) (a) (a) (a) (a) (a) (a) (e) (e) (e)
In millions of USD 2009 2010 2011 2012 2013 2014 2015 2016 2017 2018 2019
Segment revenues:
Ultra-deepwater 0 188 842 903 874 976 1,339 989 1,072 1,079 903
Deepwater 1,381 1,193 733 598 619 494 549 257 203 84 88
Midwater 1,699 1,581 1,482 1,275 1,222 1,073 388 213 136 68 93
Jackups 457 268 198 161 174 178 85 30 24 30 31
Reimbursables 95 93 68 50 77 78 59 75 30 23 20
Total revenue 3,631 3,323 3,322 2,987 2,965 2,800 2,419 1,565 1,465 1,284 1,135
Segment EBITDA:
Ultra-deepwater 0 80 348 357 335 440 719 495 529 563 441
Deepwater 974 735 505 345 351 202 271 108 78 (37) (33)
Midwater 1,141 966 847 673 618 538 157 129 75 15 33
Jackups 221 83 28 54 59 67 19 12 (2) 12 12
Other (23) (19) (22) (30) (46) (49) (34) (27) (20) (22) (22)
Reimbursables 2 2 2 2 2 1 1 17 (0) (2) (3)
Corporate G&A (63) (67) (65) (65) (65) (82) (66) (64) (72) (72) (72)
EBITDA 2,252 1,780 1,643 1,336 1,253 1,118 1,067 671 587 457 356
D&A 346 393 399 393 388 456 493 382 347 327 316
EBIT 1,905 1,387 1,244 943 865 662 574 289 240 130 40
Interest (expense) (50) (91) (73) (46) (25) (68) (94) (90) (109) (109) (87)
Interest income 4 3 7 5 1 1 3 1 1 2 2
Gain (Loss) on Sales 0 1 5 1 0 (1) (1) (4) 1 0 0
Other income 10 2 (3) (1) (2) 2 0 (22) 1 0 0
PBT 1,870 1,303 1,179 902 840 595 483 174 134 22 (45)
Income tax (expense) (452) (369) (217) (208) (178) (164) (66) (13) (4) (1) 1
Non-controlling interest 0 0 0 0 0 0 0 0 0 0 0
Preferred dividends 0 0 0 0 0 0 0 0 0 0 0
Net income (operating) 1,418 934 963 694 662 431 416 161 130 22 (44)
Discontinued ops 0 0 0 0 0 0 0 0 0 0 0
Unusual after-tax (42) 22 0 26 (115) (44) (691) (577) (46) 0 0
Net income (GAAP) 1,376 955 963 720 546 387 (274) (416) 84 22 (44)
Operating EPS 10.19 6.71 6.92 4.99 4.76 3.13 3.03 1.17 0.95 0.16 (0.32)
GAAP EPS 9.89 6.87 6.92 5.18 3.93 2.81 (2.00) (3.03) 0.61 0.16 (0.32)
DPS 8.00 5.25 3.50 3.50 3.50 3.50 0.50 0.00 0.00 0.00 0.00
Diluted shares 139 139 139 139 139 137 137 137 137 137 137
EBITDA margin 62.0% 53.6% 49.4% 44.7% 42.3% 39.9% 44.1% 42.9% 40.1% 35.6% 31.4%
Tax rate 24% 28% 18% 23% 21% 28% 14% 8% 3% 3% 3%
Utilization:
Ultra-deepwater n/a 70% 82% 85% 87% 65% 64% 51% 59% 67% 61%
Deepwater 79% 70% 94% 88% 86% 55% 52% 34% 43% 36% 39%
Midwater 85% 79% 72% 68% 66% 62% 36% 30% 33% 71% 97%
Jackups 66% 61% 46% 53% 76% 78% 42% 13% 68% 98% 97%
Dayrates ($000):
Ultra-deepwater n/a 341 343 355 330 435 498 477 429 399 366
Deepwater 380 380 416 369 395 402 410 305 233 126 125
Midwater 282 278 270 263 267 269 271 293 320 130 132
Jackups 126 88 82 90 88 96 93 202 76 84 86
Source: Deutsche Bank
Page 108 Deutsche Bank Securities Inc.

9 October 2017
Oil Services & Equipment
Initiation of coverage
Figure 306: Cash Flow Statement(a) (a) (a) (a) (a) (a) (a) (a) (e) (e) (e)
In millions of USD 2009 2010 2011 2012 2013 2014 2015 2016 2017 2018 2019
Net income 1,418 934 963 694 662 431 416 161 130 22 (44)
Depreciation 346 393 399 393 388 456 493 382 347 327 316
Deferred tax 86 (7) 2 (51) 34 2 (242) (106) (54) 0 0
Chg in receivables (220) 143 61 64 8 5 59 159 (11) 20 26
Chg in inventories 0 0 0 0 0 0 0 0 0 0 0
Chg in payables (27) 33 (10) 10 47 27 (181) (71) (15) 1 (2)
Other (87) (214) 6 201 (73) 71 191 122 41 (1) (1)
Cash from operations 1,517 1,282 1,420 1,311 1,066 993 736 647 438 369 295
Capital expenditures (412) (434) (775) (702) (958) (2,033) (831) (653) (149) (154) (154)
Free cash flow 1,104 848 645 609 108 (1,040) (94) (6) 289 215 141
Acquisitions (950) 0 0 0 0 0 0 0 0 0 0
Asset sales 40 188 6 138 5 18 13 222 4 0 0
Dividends paid (1,115) (734) (490) (490) (490) (486) (69) (0) 0 0 0
ESPP | options 1 0 0 0 0 0 0 0 0 0 0
Equity issuance, net 0 0 0 0 0 (88) 0 0 0 0 0
Debt issuance, net 996 0 0 0 988 (250) 37 (182) (104) 0 (500)
Other (36) (3) (1) (8) 1 (2) (5) (7) (0) 0 0
Chg in cash 41 299 159 249 611 (1,847) (119) 26 188 215 (359)
FCF per share 7.94 6.10 4.64 4.38 0.78 (7.56) (0.69) (0.04) 2.10 1.56 1.03
Capex / revenue 0.11 0.13 0.23 0.24 0.32 0.73 0.34 0.42 0.10 0.12 0.14
Capex / depreciation 1.19 1.10 1.94 1.79 2.47 4.45 1.68 1.71 0.43 0.47 0.49
Source: Deutsche Bank
Deutsche Bank Securities Inc. Page 109

9 October 2017
Oil Services & Equipment
Initiation of coverage
Figure 307: Balance Sheet(a) (a) (a) (a) (a) (a) (a) (a) (e) (e) (e)
In millions of USD 2009 2010 2011 2012 2013 2014 2015 2016 2017 2018 2019
Cash and equivalents 777 1,077 1,236 1,486 2,097 250 131 156 345 559 200
Accounts receivable 791 610 564 500 469 464 405 247 258 237 211
Inventories 0 0 0 0 0 0 0 0 0 0 0
Other current assets 155 177 193 148 152 186 134 103 90 83 74
Total current assets 1,723 1,863 1,993 2,133 2,718 899 670 506 692 880 485
Net PP&E 4,432 4,284 4,667 4,865 5,467 6,946 6,379 5,727 5,400 5,227 5,065
Goodwill 0 0 0 0 0 0 0 0 0 0 0
Other assets 109 580 304 237 206 176 116 139 103 95 84
Total assets 6,264 6,727 6,964 7,235 8,391 8,021 7,165 6,372 6,195 6,201 5,634
Accounts payable 75 99 64 97 94 138 70 30 30 31 28
Accrued expenses 302 469 336 324 371 427 254 182 93 85 76
Current debt 4 0 0 0 250 250 287 104 0 500 0
Other current liabilities 32 58 27 64 31 42 15 24 11 11 9
Total current liabilities 413 626 427 486 746 857 626 340 134 626 114
Long-term debt 1,495 1,496 1,496 1,496 2,244 1,995 1,995 1,981 1,981 1,481 1,481
Deferred taxes 546 542 537 491 526 530 277 197 144 144 144
Other LT liabilities 179 201 171 186 239 188 155 103 100 92 82
Non-controlling int 0 0 0 0 0 0 0 0 0 0 0
Shareholders' equity 3,631 3,862 4,333 4,576 4,637 4,452 4,113 3,750 3,836 3,858 3,814
Total liabilities and equity 6,264 6,727 6,964 7,235 8,391 8,021 7,165 6,372 6,195 6,201 5,634
Total debt 1,500 1,496 1,496 1,496 2,494 2,244 2,281 2,085 1,981 1,981 1,481
Net debt 722 419 260 10 397 1,995 2,151 1,929 1,637 1,422 1,281
Debt/capital 29% 28% 26% 25% 35% 34% 36% 36% 34% 34% 28%
Debt/equity 41% 39% 35% 33% 54% 50% 55% 56% 52% 51% 39%
Debt turns 0.7 0.8 0.9 1.1 2.0 2.0 2.1 3.1 3.4 4.3 4.2
Source: Deutsche Bank
Page 110 Deutsche Bank Securities Inc.

9 October 2017
Oil Services & Equipment
Initiation of coverage
Rating
HoldNorth AmericaUnited States
IndustrialsOil Services & Equipment
Company
ENSCO International
Reuters Bloomberg
ESV.N ESV US
In Pursuit of Tier 1 RigsInitiating coverage with a Hold rating and a $6 price targetConsolidation will be a core focus for the offshore drillers as the severity ofthe downturn combined with what we expect will be a slow, laborious recoveryencourages contractors to scale up their tier 1 rig exposure while retiring theirlower quality rigs. That is what Ensco is attempting with its agreement to acquireAtwood Oceanics. While we understand the commercial rationale motivating thetransaction, Ensco is buying optionality, not cash flow. The transaction consumesliquidity in a market that covets liquidity, and in return gets only about $250 millionin backlog. We believe this adds uncertainty that the company can ill afford inthis market. While this may be a prescient move by Ensco, we do not expect themarket to give it credit until Ensco converts the optionality into cash flow.
Ensco buying tier 1 optionality with AtwoodThis is the first of two major offshore transactions. Whereas Transocean is paying$3.4 billion for Songa Offshore which has $4.1 billion in backlog and providesTransocean $0.7 billion of annual revenues through 2022, Ensco is paying $1.8billion for only about $250 million of backlog and about $120 million of revenuein 2018. Ensco is paying for optionality as it attempts to scale up its tier 1 assetexposure.
ValuationWe are initiating coverage of Ensco with a$6 price target. This is 4.0x our estimateof the company’s normalized EBITDA of$1.35 billion, which is almost two-turnsbelow the 5.8x ten-year average multiple.The company is currently trading at 10xour fiscal 2018 EBITDA estimate of $0.48billion. We believe the discounted multipleis warranted due to the severely diminishedearnings power of the company and thesignificant challenges that lie ahead for theindustry in terms of utilization and pricingpower as the deepwater market copes withthe historic supply demand imbalance.The main investment risks include: 1) shiftsin OPEC policy and the influence thatwould have on oil prices and ultimately USupstream capital expenditures, 2) negativerevisions to global oil demand, 3) an inabilityto contract the rigs acquired in the Atwoodtransaction, and 4) increased flow of capexdirected away from the offshore and towardonshore operations. Upside risks are mainlyassociated with a rapid rise in oil prices,which would prompt the firmly entrenchedsentiment in the offshore drilling names topivot in our view.
Forecasts and ratios
Year End Dec 31 2016A 2017E 2018E
1Q EPS 0.75 -0.04A -0.23
2Q EPS 0.51 -0.10A -0.31
3Q EPS 0.21 -0.22 -0.63
4Q EPS 0.09 -0.22 -0.72
FY EPS (USD) 1.47 -0.57 -1.89
OLD FY EPS (USD) 1.51 – –
% Change -2.9% – –
P/E (x) 6.5 – –
DPS (USD) 0.04 0.04 0.04
Dividend Yield (%) 0.4 0.7 0.7
Revenue (USDm) 2,571.4 1,816.1 1,603.7Source: Deutsche Bank estimates, company data
David HavensResearch [email protected]
Price at 5 Oct 2017 (USD) 5.83
Price target 6.00
52-week range 11.81 - 4.16
Price/price relative
ENSCO International S&P 500 INDEX (Rebased)
Jan '15 May '15 Sep '15 Jan '16 May '16 Sep '16 Jan '17 May '17 Sep '170
10
20
30
40
50
60
Performance(%)
1m 3m 12m
Absolute 28.3 6.2 -27.7
S&P 500INDEX
2.5 4.5 18.0
Source: Deutsche Bank
Stock & option liquidity data
Market Cap (USDm) 1,753.8
Shares outstanding (m) 300.8
Free float (%) –
Volume (5 Oct 2017) 3,955,006
Option volume (und. shrs., 1M avg.) 272,758Source: Deutsche Bank
Deutsche Bank Securities Inc. Page 111

9 October 2017
Oil Services & Equipment
Initiation of coverage
Key investment themes
Ensco has $3 billion of backlog split between floaters and jackupsEnsco has the least customer concentration relative to its peers with its top fivecustomers representing only 72% of total backlog versus most of its peers above90%. Total SA is Ensco’s largest customer with 24% of the total backlog and 72%of the ultra-deepwater backlog. The Atwood transaction adds only about $250million of backlog, mainly from the Atwood Condor contract in Australia. Onlyabout one-third of Ensco’s capacity is booked for 2018, which drops to 20% in2019. Only 20% of its ultra-deepwater capacity is booked in 2018, and that isbefore we pro-forma for Atwood’s six ultra-deepwater rigs, only one of which hasa contract extending through 2018.
Figure 308: Backlog by customer
-
0.1
0.2
0.3
0.4
0.5
0.6
0.7
0.8
TO
T
Ara
mco
Inp
ex
CO
P
PB
R
BP
CV
X
NO
C
RD
S
Pre
mie
r
Me
ll
Are
na
Re
pso
l
INE
OS
Ith
aca
Ta
los
Pe
rta
min
a
En
gie
Sa
pu
ra
An
ko
r
In b
illio
ns
of
USD
Source: Company reports, Deutsche Bank
Figure 309: Revenues in backlog Figure 310: Year-end backlog
0
200
400
600
800
1,000
1,200
1,400
2017 2018 2019 2020 2021
In m
illio
ns
of
USD
Ultra-deepwater Deepwater Midwater Jackups
0
500
1,000
1,500
2,000
2,500
3,000
2017 2018 2019 2020 2021
In m
illi
on
s o
f U
SD
Ultra-deepwater Deepwater Harsh-environment Midwater Jackups
Source: Company reports, Deutsche Bank Source: Company reports, Deutsche Bank
Page 112 Deutsche Bank Securities Inc.

9 October 2017
Oil Services & Equipment
Initiation of coverage
Figure 311: Ensco backlog details
Revenue in backlog ($m) 2017 2018 2019 2020 2021 Total backlog Abbrev ($bn)
Ultra-deepwater 169 379 285 193 0 Ultra-deepwater UDW 1.0
Deepwater 109 330 215 0 0 Deepwater DW 0.7
Harsh-environment Harsh-environment HE
Midwater 22 39 0 0 0 Midwater MW 0.1
Jackups 163 504 242 175 111 Jackups JU 1.3
Total backlog 463 1,252 742 368 111 Total backlog 3.0
Days committed 2017 2018 2019 2020 2021
Ultra-deepwater 27% 20% 12% 6% 0%
Deepwater 100% 83% 56% 0% 0%
Harsh-environment
Midwater 50% 25% 0% 0% 0%
Jackups 51% 40% 22% 16% 11%
Total backlog 47% 36% 20% 11% 7%
Year-end backlog ($m) 2017 2018 2019 2020 2021
Ultra-deepwater 857 478 193 0 0
Deepwater 545 215 0 0 0
Harsh-environment
Midwater 39 0 0 0 0 2017 2018 2019
Jackups 1,121 616 374 200 89 Total debt 4,745 4,745 4,489
Total backlog 2,561 1,310 568 200 89 Debt / YE backlog 1.9 3.6 7.9
Backlog by customer ($m) #1 #2 #3 #4 #5 Top 5 customers in backlog Percent $bn
Ultra-deepwater TOT CVX BP RDS Talos TOT #1 24% 0.7
Backlog 739 118 95 67 7 Aramco #2 16% 0.5
% of backlog 72% 12% 9% 7% 1% Inpex #3 11% 0.3
Deepwater Inpex PBR APA Aramco BP COP #4 10% 0.3
Backlog 346 307 - - - PBR #5 10% 0.3
% of backlog 53% 47% 0% 0% 0% Other 28% 0.8
Harsh-environment
Backlog 09/19/17 12/31/17 12/31/18 12/31/19
% of backlog Fleet composition 2017 2018 2019
Midwater Mell APA Aramco BP Castex Ultra-deepwater 14 15 15
Backlog 61 - - - - Deepwater 3 3 3
% of backlog 100% 0% 0% 0% 0% Harsh-environment - - -
Jackups Aramco COP BP NOC Premier Midwater 2 2 2
Backlog 490 309 164 118 64 Jackups 32 33 33
% of backlog 38% 24% 13% 9% 5% Total in fleet 51 53 53
Backlog by rig type
UDW
DW
HE
MW
JU
Source: Company reports, Deutsche Bank
Deutsche Bank Securities Inc. Page 113

9 October 2017
Oil Services & Equipment
Initiation of coverage
Valuation and risksWe are initiating coverage of Ensco with a $6 price target. This is 4.0x ourestimate of the company’s normalized EBITDA of $1.35 billion, which is almosttwo-turns below the 5.8x ten-year average multiple. The company is currentlytrading at 10x our fiscal 2018 EBITDA estimate of $0.48 billion. We believe thediscounted multiple is warranted due to the severely diminished earnings powerof the company and the significant challenges that lie ahead for the industry interms of utilization and pricing power as the deepwater market copes with thehistoric supply demand imbalance.
In terms of steel value, we assess the trough net asset value at $6.70 per share,which assumes the market endures another three years of high volumes ofcold-stacking once contracts expire and leading edge market rates that stay atbreakeven levels ($160-170 kpd).
The main investment risks include: 1) shifts in OPEC policy and the influencethat would have on oil prices and ultimately US upstream capital expenditures, 2)negative revisions to global oil demand, 3) an inability to contract the rigs acquiredin the Atwood transaction, and 4) increased flow of capex directed away from theoffshore and toward onshore operations. Upside risks are mainly associated witha rapid rise in oil prices, which would prompt the firmly entrenched sentiment inthe offshore drilling names to pivot in our view.
Figure 312: The EV/EBITDA valuation band as blown out Figure 313: The 5yr EV/EBITDA leading up to 2014
-
1
2
3
4
5
6
7
8
9
10
-1 std 10yr avg +1 std
5.8
2
3
4
5
6
7
8
9
Se
p-0
7
Jan
-08
Ma
y-0
8
Se
p-0
8
Jan
-09
Ma
y-0
9
Se
p-0
9
Jan
-10
Ma
y-1
0
Se
p-1
0
Jan
-11
Ma
y-1
1
Se
p-1
1
Jan
-12
Ma
y-1
2
Se
p-1
2
Jan
-13
Ma
y-1
3
Se
p-1
3
Jan
-14
Ma
y-1
4
Se
p-1
4
-1 std 10yr avg +1 std
Source: Factset Source: Factset
Page 114 Deutsche Bank Securities Inc.

9 October 2017
Oil Services & Equipment
Initiation of coverage
Company description
Ensco (ESV) is a contract drilling company with a fleet of 53 mobile offshoredrilling rigs including 15 ultra-deepwater floaters, three deepwater and twomidwater floaters, and 33 jackups. Over the last ten years, the company hasrepositioned itself as leading provider of ultra-deepwater rigs with the additionof 15 newbuilds consisting of eight high-specification drillships and seven 8500series semis. The company also announced in May 2017 the agreement to acquireAtwood Oceanics (ATW), which has a fleet of six ultra-deepwater floaters and fivehigh-specification jackups.
Figure 314: Revenues by rig type
Floaters
3%
Jackups
95%
Other
2%
2008
Jac
Floaters
61%
Jackups
36%
Other
3%
2016
Source: Company reports, Deutsche Bank
Figure 315: Change in fleet size and mix
40 45 44 44 45 45 45 45 46
60
70 70 65
62 61
53 53
0
10
20
30
40
50
60
70
80
20
02
20
03
20
04
20
05
20
06
20
07
20
08
20
09
20
10
20
11
20
12
20
13
20
14
20
15
20
16
20
17
20
20
(a) (a) (a) (a) (a) (a) (a) (a) (a) (a) (a) (a) (a) (a) (a) (e) (e)
Floaters jackups
Source: Company reports
Deutsche Bank Securities Inc. Page 115

9 October 2017
Oil Services & Equipment
Initiation of coverage
Principal Sources and Uses of Cash Flow
A more balanced mix of jackups and floaters than most of its peersEnsco’s principal source of cash flow has evolved from primarily jackups tonow including the ultra-deepwater. The company’s high water mark in terms ofEBITDA was $2.4 billion in 2014, almost two-thirds of which came from its fleetof ultra-deepwater floaters. While we expect the deepwater markets to bottom in2017, fiercely competitive pricing combined with some contract expiries is goingto pressure EBITDA down to $0.5 billion in our view and even lower in 2019.
Figure 316: Segment EBITDA (excludes corporate G&A)
0
500
1,000
1,500
2,000
2,500
3,000
20
02
20
03
20
04
20
05
20
06
20
07
20
08
20
09
20
10
20
11
20
12
20
13
20
14
20
15
20
16
20
17
20
18
20
19
(a) (a) (a) (a) (a) (a) (a) (a) (a) (a) (a) (a) (a) (a) (a) (e) (e) (e)
In m
illio
ns
of
US
D
Floaters Jackups Other
Source: Company reports, Deutsche Bank
Ultra-deepwater cash flows declining further due to expiries and pricingEnsco currently has eight of its 15 floaters idle with the potential for another threegoing idle in early 2018 upon completion of existing contracts. Four of the eightcurrently idled rigs are its 8500 series semis, which could all be idle by mid-2018.These rigs do not share the same degree of commercial marketability as Ensco’sdrillships in our view, and will linger in cold-stack longer than the higher-specbrethren. We do expect Ensco’s fleet of eight drillships to be top of mind withcustomers, although pricing will likely be very competitive and ranging in the$160 – 180 range in 2018. If we assume all of its drillships return to work in thisrange and the DS-8 continues to amortize its contract with Total SA, and the sevensemis remain idle in 2018, the segment EBITDA contribution would be about $270million versus the $1.5 billion in 2014.
Jackup business turning up, but pricing also encountering some headwindsWe would say half of Ensco’s current jackup fleet are core marketable rigs. Theother half are over 30 years old and are likely to be retired in the near future. Weexpect the jackup segment to bottom at about $175 million of EBITDA in 2017 andincrease to $278 million in 2018. This compares to $1.0 billion of jackup EBITDAin 2014.
Page 116 Deutsche Bank Securities Inc.
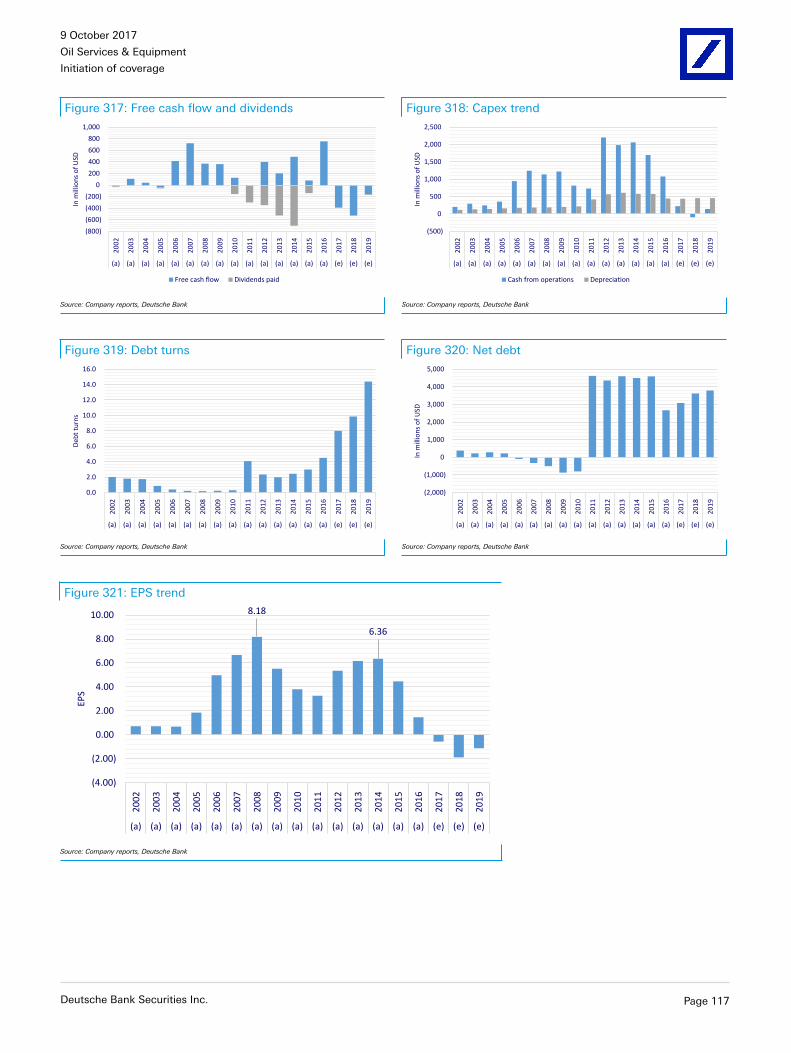
9 October 2017
Oil Services & Equipment
Initiation of coverage
Figure 317: Free cash flow and dividends Figure 318: Capex trend
(800)
(600)
(400)
(200)
0
200
400
600
800
1,000
20
02
20
03
20
04
20
05
20
06
20
07
20
08
20
09
20
10
20
11
20
12
20
13
20
14
20
15
20
16
20
17
20
18
20
19
(a) (a) (a) (a) (a) (a) (a) (a) (a) (a) (a) (a) (a) (a) (a) (e) (e) (e)
In m
illio
ns
of
US
D
Free cash flow Dividends paid
(500)
0
500
1,000
1,500
2,000
2,500
20
02
20
03
20
04
20
05
20
06
20
07
20
08
20
09
20
10
20
11
20
12
20
13
20
14
20
15
20
16
20
17
20
18
20
19
(a) (a) (a) (a) (a) (a) (a) (a) (a) (a) (a) (a) (a) (a) (a) (e) (e) (e)
In m
illio
ns
of
US
D
Cash from operations Depreciation
Source: Company reports, Deutsche Bank Source: Company reports, Deutsche Bank
Figure 319: Debt turns Figure 320: Net debt
0.0
2.0
4.0
6.0
8.0
10.0
12.0
14.0
16.0
20
02
20
03
20
04
20
05
20
06
20
07
20
08
20
09
20
10
20
11
20
12
20
13
20
14
20
15
20
16
20
17
20
18
20
19
(a) (a) (a) (a) (a) (a) (a) (a) (a) (a) (a) (a) (a) (a) (a) (e) (e) (e)
De
bt
turn
s
(2,000)
(1,000)
0
1,000
2,000
3,000
4,000
5,000
20
02
20
03
20
04
20
05
20
06
20
07
20
08
20
09
20
10
20
11
20
12
20
13
20
14
20
15
20
16
20
17
20
18
20
19
(a) (a) (a) (a) (a) (a) (a) (a) (a) (a) (a) (a) (a) (a) (a) (e) (e) (e)
In m
illio
ns
of
US
D
Source: Company reports, Deutsche Bank Source: Company reports, Deutsche Bank
Figure 321: EPS trend
8.18
6.36
(4.00)
(2.00)
0.00
2.00
4.00
6.00
8.00
10.00
20
02
20
03
20
04
20
05
20
06
20
07
20
08
20
09
20
10
20
11
20
12
20
13
20
14
20
15
20
16
20
17
20
18
20
19
(a) (a) (a) (a) (a) (a) (a) (a) (a) (a) (a) (a) (a) (a) (a) (e) (e) (e)
EP
S
Source: Company reports, Deutsche Bank
Deutsche Bank Securities Inc. Page 117

9 October 2017
Oil Services & Equipment
Initiation of coverage
Figure 322: Fleet profile
Rig name
Water
depth (ft) Rig type
Year in
service Rig design
Backlog
(yrs)
Backlog
($m)
Ultra-deepwater (15):
ENSCO DS-10 10,000 DS-DP 2015 Samsung GF12000 1.1 67.3
ENSCO DS-9 10,000 DS-DP 2014 Samsung GF12000 - -
ENSCO DS-8 10,000 DS-DP 2015 Samsung GF12000 3.1 719.8
ENSCO DS-7 10,000 DS-DP 2013 Samsung 12000 0.1 18.9
ENSCO DS-6 10,000 DS-DP 2012 Samsung 0.4 95.1
ENSCO DS-5 10,000 DS-DP 2011 Samsung - -
ENSCO DS-4 10,000 DS-DP 2010 Samsung 1.9 118.2
ENSCO DS-3 10,000 DS-DP 2010 Samsung Saipem 10000 - -
ENSCO 8506 8,500 6th 2012 Ensco 8500 - -
ENSCO 8505 8,500 6th 2012 Ensco 8500 - -
ENSCO 8504 8,500 6th 2011 Ensco 8500 - -
ENSCO 8503 8,500 6th 2010 Ensco 8500 0.1 7.0
ENSCO 8502 8,500 6th 2010 Ensco 8500 - -
ENSCO 8501 8,500 6th 2009 Ensco 8500 - -
ENSCO 8500 8,500 6th 2008 Ensco 8500 - -
Deepwater (3):
ENSCO 5006 6,200 4th 1999 Trosvik Bingo 8000 1.9 346.3
ENSCO 6002 5,700 4th 2001 DeHoop Megathyst Class 2.3 220.7
ENSCO 6001 5,600 4th 2001 DeHoop Megathyst Class 0.8 86.3
Midwater (2):
ENSCO 5004 1,500 3rd 1982 Friede & Goldman 9500 Enhanced Pacesetter 0.8 60.7
ENSCO 5005 1,500 3rd 1982 Friede & Goldman L-1033 Enhanced Pacesetter - -
Jackups (33):
ENSCO 100 350 IC 1987 LeTourneau 150-88-C Enhanced Gorilla Class 0.9 64.0
ENSCO 101 400 IC 2000 Keppel FELS KFELS MOD V A - -
ENSCO 102 400 IC 2002 Keppel FELS KFELS MOD V A 1.3 42.6
ENSCO 104 400 IC 2002 Keppel FELS KFELS MOD V B - -
ENSCO 105 375 IC 2002 Keppel FELS KFELS MOD V B - -
ENSCO 106 400 IC 2005 Keppel FELS KFELS MOD V B Bigfoot 5.3 165.3
ENSCO 107 400 IC 2006 Keppel FELS KFELS B Class Bigfoot - -
ENSCO 108 400 IC 2007 Keppel FELS KFELS B Class Bigfoot - -
ENSCO 109 350 IC 2008 Keppel FELS KFELS Super B Class 0.4 24.8
ENSCO 110 400 IC 2015 Keppel FELS KFELS MOD V B Bigfoot 3.0 118.5
ENSCO 120 400 IC 2013 Keppel FELS KFELS Super A Class 2.9 125.5
ENSCO 121 400 IC 2013 Keppel FELS KFELS Super A Class 0.4 15.4
ENSCO 122 400 IC 2014 Keppel FELS KFELS Super A Class 0.4 13.4
ENSCO 123 400 IC 2016 Keppel FELS KFELS Super A Class - -
ENSCO 140 340 IC 2016 LeTourneau Super 116E Class - -
ENSCO 141 340 IC 2016 LeTourneau Super 116E Class - -
ENSCO 54 300 IC 1982 Friede & Goldman L-780 MOD II 5.0 141.4
ENSCO 67 400 IC 1976 LeTourneau Class 84-C Modified 0.3 5.2
ENSCO 68 400 IC 1976 LeTourneau Class 84-C Modified - -
ENSCO 70 250 IC 1981 Hitachi Zosen K-1032N - -
ENSCO 71 225 IC 1982 Hitachi Zosen K-1032N - -
ENSCO 72 225 IC 1981 Hitachi Zosen K-1025N 0.1 2.8
ENSCO 75 390 IC 1999 LeTourneau Super 116 Class 0.0 0.5
ENSCO 76 350 IC 2000 LeTourneau Super 116 Class 1.3 75.1
ENSCO 80 225 IC 1978 LeTourneau Class 116-C Modified 1.3 32.8
ENSCO 81 350 IC 1979 LeTourneau Class 116-C - -
ENSCO 82 300 IC 1979 LeTourneau Class 116-C - -
ENSCO 84 250 IC 1981 LeTourneau Class 82 SD-C 3.9 101.7
ENSCO 87 350 IC 1982 LeTourneau Class 116-C - -
ENSCO 88 250 IC 1982 LeTourneau Class 82 SD-C 2.2 52.1
ENSCO 92 225 IC 1982 LeTourneau Class 116-C 5.3 183.3
ENSCO 96 250 IC 1982 Hitachi Zosen Drill Hope C-250 1.4 59.7
ENSCO 97 250 IC 1980 LeTourneau Class 82 SD-C 1 60
Source: Company reports, Deutsche Bank
Page 118 Deutsche Bank Securities Inc.

9 October 2017
Oil Services & Equipment
Initiation of coverage
Figure 323: Income Statement(a) (a) (a) (a) (a) (a) (a) (a) (e) (e) (e)
In millions of USD 2009 2010 2011 2012 2013 2014 2015 2016 2017 2018 2019
Segment revenues:
Floaters 254 475 1,539 2,708 3,137 2,869 2,337 1,566 1,080 711 709
Jackups 1,692 1,217 1,224 1,517 1,735 1,849 1,446 930 678 834 723
Other 0 0 52 83 75 92 152 76 58 58 58
Total revenue 1,946 1,693 2,815 4,308 4,947 4,811 3,934 2,571 1,816 1,604 1,491
Segment EBITDA:
Floaters 146 299 747 1,434 1,638 1,540 1,308 841 519 304 250
Jackups 1,074 634 605 759 901 990 752 413 175 278 163
Other 0 0 8 25 17 24 33 21 5 5 5
Corporate (64) (86) (121) (145) (147) (132) (118) (101) (106) (106) (106)
EBITDA 1,156 847 1,240 2,073 2,409 2,422 1,975 1,174 593 481 312
D&A 206 219 419 568 612 580 573 445 437 457 454
EBIT 951 628 821 1,505 1,797 1,842 1,402 728 156 24 (142)
Interest (expense) 0 0 (96) (124) (159) (161) (216) (229) (240) (268) (279)
Interest income 7 1 17 23 17 11 10 14 28 22 14
Equity income 0 0 0 0 0 0 0 0 0 0 0
Other income 2 6 21 3 11 (4) 12 (6) (1) 0 0
PBT 959 634 763 1,407 1,666 1,689 1,208 508 (56) (222) (407)
Income tax (expense) (178) (91) (131) (158) (217) (188) (151) (78) (112) (341) 73
Non-controlling interest (5) (6) (5) (7) (10) (14) (9) (7) (5) (5) (5)
Preferred dividends 0 0 0 0 0 0 0 0 0 0 0
Net income (operating) 776 537 627 1,242 1,439 1,486 1,048 422 (172) (568) (339)
Discontinued ops 4 44 0 22 (5) (1,952) (17) 8 (0) 0 0
Unusual after-tax 0 (1) (38) 100 (16) (3,437) (2,626) 460 (30) 0 0
Net income (GAAP) 779 580 589 1,365 1,418 (3,903) (1,595) 890 (202) (568) (339)
Operating EPS 5.52 3.80 3.26 5.35 6.16 6.36 4.45 1.47 (0.57) (1.89) (1.13)
GAAP EPS 5.55 4.11 3.06 5.89 6.07 (16.90) (6.93) 3.14 (0.67) (1.89) (1.13)
DPS 0.10 1.08 1.40 1.50 2.25 3.00 0.60 0.04 0.04 0.04 0.04
Diluted shares 140 141 192 230 231 232 232 279 301 301 301
EBITDA margin 59.4% 50.0% 44.0% 48.1% 48.7% 50.3% 50.2% 45.6% 32.7% 30.0% 20.9%
EBIT margin 48.8% 37.1% 29.2% 34.9% 36.3% 38.3% 35.6% 28.3% 8.6% 1.5% -9.5%
Tax rate 19% 14% 17% 11% 13% 11% 13% 15% -200% -153% 18%
Utilization:
Floaters 73% 80% 79% 86% 80% 77% 69% 54% 44% 30% 38%
Jackups 72% 76% 77% 85% 88% 88% 73% 60% 63% 76% 73%
Dayrates ($000):
Floaters 425 369 343 360 408 451 416 360 342 321 255
Jackups 151 106 98 106 123 137 136 111 89 92 83
Source: Deutsche Bank
Deutsche Bank Securities Inc. Page 119
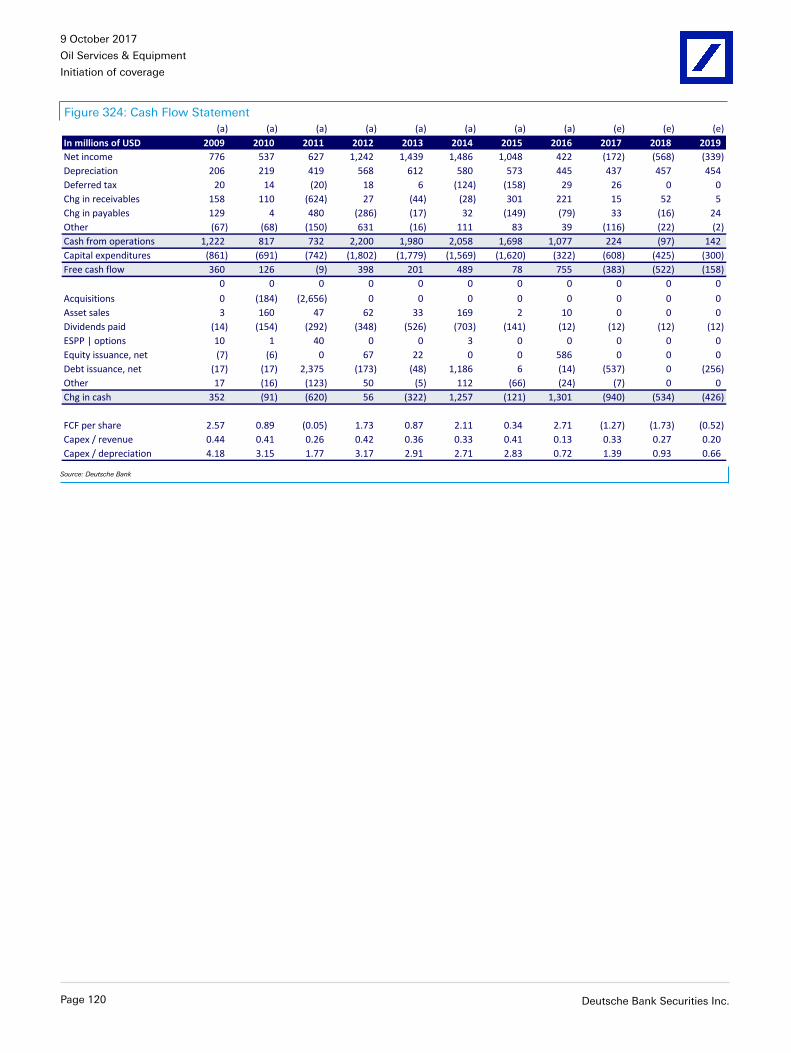
9 October 2017
Oil Services & Equipment
Initiation of coverage
Figure 324: Cash Flow Statement(a) (a) (a) (a) (a) (a) (a) (a) (e) (e) (e)
In millions of USD 2009 2010 2011 2012 2013 2014 2015 2016 2017 2018 2019
Net income 776 537 627 1,242 1,439 1,486 1,048 422 (172) (568) (339)
Depreciation 206 219 419 568 612 580 573 445 437 457 454
Deferred tax 20 14 (20) 18 6 (124) (158) 29 26 0 0
Chg in receivables 158 110 (624) 27 (44) (28) 301 221 15 52 5
Chg in payables 129 4 480 (286) (17) 32 (149) (79) 33 (16) 24
Other (67) (68) (150) 631 (16) 111 83 39 (116) (22) (2)
Cash from operations 1,222 817 732 2,200 1,980 2,058 1,698 1,077 224 (97) 142
Capital expenditures (861) (691) (742) (1,802) (1,779) (1,569) (1,620) (322) (608) (425) (300)
Free cash flow 360 126 (9) 398 201 489 78 755 (383) (522) (158)
0 0 0 0 0 0 0 0 0 0 0
Acquisitions 0 (184) (2,656) 0 0 0 0 0 0 0 0
Asset sales 3 160 47 62 33 169 2 10 0 0 0
Dividends paid (14) (154) (292) (348) (526) (703) (141) (12) (12) (12) (12)
ESPP | options 10 1 40 0 0 3 0 0 0 0 0
Equity issuance, net (7) (6) 0 67 22 0 0 586 0 0 0
Debt issuance, net (17) (17) 2,375 (173) (48) 1,186 6 (14) (537) 0 (256)
Other 17 (16) (123) 50 (5) 112 (66) (24) (7) 0 0
Chg in cash 352 (91) (620) 56 (322) 1,257 (121) 1,301 (940) (534) (426)
FCF per share 2.57 0.89 (0.05) 1.73 0.87 2.11 0.34 2.71 (1.27) (1.73) (0.52)
Capex / revenue 0.44 0.41 0.26 0.42 0.36 0.33 0.41 0.13 0.33 0.27 0.20
Capex / depreciation 4.18 3.15 1.77 3.17 2.91 2.71 2.83 0.72 1.39 0.93 0.66
Source: Deutsche Bank
Page 120 Deutsche Bank Securities Inc.

9 October 2017
Oil Services & Equipment
Initiation of coverage
Figure 325: Balance Sheet(a) (a) (a) (a) (a) (a) (a) (a) (e) (e) (e)
In millions of USD 2009 2010 2011 2012 2013 2014 2015 2016 2017 2018 2019
Cash and equivalents 1,141 1,051 431 487 166 1,422 1,301 2,602 1,663 1,129 703
Accounts receivable 325 215 838 811 856 883 582 361 346 294 289
Other current assets 187 171 376 425 514 629 402 316 301 256 251
Total current assets 1,653 1,437 1,645 1,724 1,535 2,935 2,285 3,279 2,309 1,678 1,243
Net PP&E 4,477 5,050 12,424 13,146 14,311 12,535 11,088 10,919 11,114 11,082 10,928
Goodwill 336 336 3,289 3,274 3,274 276 0 0 0 0 0
Other assets 281 229 514 422 353 314 264 176 127 108 106
Total assets 6,747 7,052 17,871 18,565 19,473 16,060 13,637 14,375 13,550 12,868 12,276
Accounts payable 159 164 644 358 341 373 225 146 179 163 187
Accrued expenses 309 168 507 584 659 697 551 377 300 255 251
Current debt 17 17 173 48 48 35 0 332 0 256 559
Other current liabilities 0 0 0 0 0 0 0 0 0 0 0
Total current liabilities 485 349 1,323 990 1,047 1,105 776 854 479 674 997
Long-term debt 257 240 4,878 4,798 4,719 5,886 5,895 4,943 4,745 4,489 3,930
Deferred taxes 377 358 340 352 362 180 4 0 0 0 0
Other LT liabilities 121 139 446 573 546 667 445 323 273 232 228
Non-controlling int 8 6 5 6 7 7 4 4 8 13 18
Shareholders' equity 5,499 5,960 10,879 11,846 12,792 8,216 6,513 8,251 8,045 7,460 7,105
Total liabilities and equity 6,747 7,052 17,871 18,565 19,473 16,060 13,637 14,375 13,550 12,868 12,276
Total debt 274 257 5,050 4,846 4,766 5,920 5,895 5,275 4,745 4,745 4,489
Net debt (867) (793) 4,619 4,359 4,601 4,498 4,594 2,672 3,082 3,616 3,786
Debt/capital 5% 4% 32% 29% 27% 42% 48% 39% 37% 39% 39%
Debt/equity 5% 4% 46% 41% 37% 72% 91% 64% 59% 64% 63%
Debt turns 0.2 0.3 4.1 2.3 2.0 2.4 3.0 4.5 8.0 9.9 14.4
Source: Deutsche Bank
Deutsche Bank Securities Inc. Page 121

9 October 2017
Oil Services & Equipment
Initiation of coverage
Rating
HoldNorth AmericaUnited States
IndustrialsOil Services & Equipment
Company
Forum Energy Tech
Reuters Bloomberg
FET.N FET US
Forum Energy Technologies (FET)Initiating coverage with a Hold rating and $17 price targetFET has a solid positive free cash flow track record, but the source of cash ischanging significantly as Drilling & Subsea contributions go from the majorityto the minority, and Completions segment benefits from the onshore recoveryand the retooling of the US frac fleet. Pricing has come back in the frac businesswith customer orders rising into year-end. Production & Infrastructure is alsoseeing orders moving higher this year. We expect 2H17 to benefit from the recentconsolidation of its Global Tubing business where FET acquires the remaining52% interest with a $60m EBITDA run rate expected during 2018.
Industry favoring frac exposureThe frac market is one of the very few seeing scarcity value. Pricing is comingback, with FET seeing a backlog build in its Stimulation & Intervention businesson strong demand, while historically the segment has been demand-and-ship.Pricing discussions with customers have begun, with FET responding by addingsignificantly to headcount. We expect to see a benefit in 2H17 with pricingbeginning to materialize, albeit at a slower pace than prior cycles.
Valuation & RisksOur $17 price target is 6.8x our estimate ofthe company’s normalized EBITDA power of$250 million, which is a 1.0 turn discountto its 7.8x average multiple leading upto the 2014 collapse in oil prices. Thecompany has $400 million of total debt andgenerated solid free cash flow through 2016with normalized EBITDA above our currentrange.The main investment risks include: 1) shiftsin OPEC policy and the influence thatwould have on oil prices and ultimately USupstream capital expenditures, 2) negativerevisions to global oil demand, 3) a decreasein new frac capacity in the US, and 4) anda subsequent move lower in pricing andmargins.
1H17 revenues weighted 88% onshore vs 12% offshoreForum has expanded its onshore business to capture market share in USupstream, while Valves (Production & Infrastructure) segment had record 2Q17orders, even excluding the impact of the Jan 2017 Cooper acquisition. An offshorerecovery continues to lag the uptick in US land currently benefitting FET’s revenuemix. 2Q17 Orders in Completions were up 31% and in Stimulation & Interventionup over 45% with increased customer spending across nearly all products. Weexpect 2H17 incremental margins stronger vs 1H17 due to pricing materializingand absorption of ramp up costs. Management guided to 3Q17 EPS loss of $0.07-$0.04.
Forecasts and ratios
Year End Dec 31 2016A 2017E 2018E
1Q EPS -0.22 -0.14A 0.02
2Q EPS -0.19 -0.10A 0.04
3Q EPS -0.19 -0.04 0.07
4Q EPS -0.16 0.00 0.09
FY EPS (USD) -0.76 -0.27 0.23
OLD FY EPS (USD) -0.76 – –
% Change 0.6% – –
P/E (x) – – 67.3
DPS (USD) 0.00 0.00 0.00
Dividend Yield (%) 0.0 0.0 0.0
Revenue (USDm) 587.6 831.4 1,007.7Source: Deutsche Bank estimates, company data
David HavensResearch [email protected]
Price at 5 Oct 2017 (USD) 15.50
Price target 17.00
52-week range 24.30 - 10.35
Price/price relative
Forum Energy Tech S&P 500 INDEX (Rebased)
Jan '15 May '15 Sep '15 Jan '16 May '16 Sep '16 Jan '17 May '17 Sep '175
10
15
20
25
30
35
40
Performance(%)
1m 3m 12m
Absolute 36.9 -5.8 -23.2
S&P 500INDEX
2.5 4.5 18.0
Source: Deutsche Bank
Stock & option liquidity data
Market Cap (USDm) 1,489.9
Shares outstanding (m) 96.1
Free float (%) 89
Volume (5 Oct 2017) 157,703
Option volume (und. shrs., 1M avg.) 132Source: Deutsche Bank
Page 122 Deutsche Bank Securities Inc.

9 October 2017
Oil Services & Equipment
Initiation of coverage
Key investment themes
Consumables seeing sharp demand increasePressure pumping supply/demand trends are continuing, driven by a rising wellcount, increased pad drilling, more wells per pad and an increasing inventory ofDUCs (drilled but uncompleted wells). Frac fleets are also incorporating more hhp,averaging about 50k now. The increase is to accommodate the larger pads, whichare keeping crews on location longer, thus in order to accommodate maintenancerotations and suitable uptime, contractors have increased fleet sizes.
As pumpers reactivate fleets, FET has seen a sharp increase in consumables andfluid ends. Frac demand industry-wide has recovered to about 12 million HHPversus 17 million at the peak, and less than 6 million at the trough. FET’s businessis driven 40% by well count and well construction, 25% valves, 25% rig countand 10% subsea activity. New products like the frac manifold trailer and 7,500PSI mud pump fluid ends will see demand as they push E&Ps up the technologycurve, reduce setup/maintenance cost and reduce component change-out timeup to 75%. The new mud pump also increases flow rates, complementing longerlaterals and increases in the horizontal rig count. To meet demand, FET expectscapex of $30 million in 2017.
Figure 326: Total vs. marketed frac hhp utilization Figure 327: US frac hhp demand
0%
20%
40%
60%
80%
100%
120%
3Q
11
4Q
11
1Q
12
2Q
12
3Q
12
4Q
12
1Q
13
2Q
13
3Q
13
4Q
13
1Q
14
2Q
14
3Q
14
4Q
14
1Q
15
2Q
15
3Q
15
4Q
15
1Q
16
2Q
16
3Q
16
4Q
16
1Q
17
Total utilization Marketed utilization
0
2
4
6
8
10
12
14
16
18
3Q
11
4Q
11
1Q
12
2Q
12
3Q
12
4Q
12
1Q
13
2Q
13
3Q
13
4Q
13
1Q
14
2Q
14
3Q
14
4Q
14
1Q
15
2Q
15
3Q
15
4Q
15
1Q
16
2Q
16
3Q
16
4Q
16
1Q
17
2Q
17
3Q
17
Millio
n h
hp
Source: IHS Markit, Deutsche Bank Source: IHS Markit, Deutsche Bank
Consumables benefit in a flat to down rig count scenarioThe Consumables line will benefit from a stable or down rig count as customerswill use opex to maintain heavily-utilized equipment. At current pace, less mudpumps will need upgrade in 2H17 vs 1H. Completions related products willcontinue to see good activity across centrifugal pumps, Little Tripper catwalksand bearings. Drilling product line revenues are tracking for a small sequentialdecline in 3Q17, and we may see additional uplift in 4Q as some customers mayupgrade lower spec rigs to high spec. Benefit to FET totals $0.5-$2.0 million/rig and includes upgrading catwalks, extending reach and height, and 7,500psi upgrades. In some cases, we could see handling tools and condition basedmonitoring.
Deutsche Bank Securities Inc. Page 123

9 October 2017
Oil Services & Equipment
Initiation of coverage
Stimulation & Intervention lead times extending on strong backlogCustomers have begun pricing discussions for Stimulation & Intervention (S&I)with lead times extending. The segment has added a significant number of peoplein 2017 with the benefit to begin in 2H17 as pricing materializes in 4Q17. TheS&I business has historically been build-and-ship but sharp increases in demandhave built a backlog. In Production Equipment, lead times continue to extend witha strong backlog into 4Q17. The 4Q orders were booked in 1Q17 so we expectpricing uplift will begin to appear late-4Q17 and into 2018. For capital equipmentorders the Middle East has remained strong, with one customer indicating tenderscould happen in 4Q17, though we expect a price below $50 oil could push thetender to 2018.
3Q17 guidance for growth across the onshore-focused segmentsAcross the segments, management guided 3Q17 Completions growth strong,Subsea flat, D&S decline, and Production/Infrastructure to see significant growth.Of the strong 2Q17 completions growth, power ends were 55% newbuilds and45% refurbishments or replacements. We expect going forward refurbishmentsto become a bigger percentage with capital equipment shrinking slightly.
Orders uptick continues, positive US and Intl market share view2Q17 completions orders increased 31% sequentially and over 45% forStimulation & Intervention with customer spending increasing across nearly allproduct offerings. Year-to-date FET has received orders for 480,000 horsepowerof power ends. In 2Q it received orders for 8 manifold trailers (ICBM), andseveral orders for the Race Track suction manifold. With price improvement inpressure pumping orders showing up, we expect to see benefit in 2H17 results.Valves (Production & Infrastructure segment) saw record orders in 2Q17 – evenexcluding impact of Cooper acquisition – and without the uplift from the newmanufacturing facility in Saudi Arabia. The facility is on-track to be operational in2018. Management sees US upstream demand up while US midstream flat-to-upand gaining market share. Internationally both midstream and downstream areactive, and FET is attempting to gain market share. The company is increasing itspresence in Southeast Asia to penetrate the midstream and downstream markets.Offshore continues to lag with Drilling & Subsea orders down 21% in 2017.Subsea orders are now expected to remain at low levels for an extended period,weighted toward non-oil/gas activity.
Valuation and risksOur $17 price target is 6.8x our estimate of the company’s normalized EBITDApower of $250 million, which is a 1.0 turn discount to its 7.8x average multipleleading up to the 2014 collapse in oil prices. The company has $400 million of totaldebt and generated solid free cash flow through 2016 with normalized EBITDAabove our current range.
The main investment risks include: 1) shifts in OPEC policy and the influencethat would have on oil prices and ultimately US upstream capital expenditures, 2)negative revisions to global oil demand, 3) a decrease in new frac capacity in theUS, and 4) and a subsequent move lower in pricing and margins.
Page 124 Deutsche Bank Securities Inc.

9 October 2017
Oil Services & Equipment
Initiation of coverage
Company description
Forum Energy Technologies (FET) was founded in 2010 following the merger ofForum Oilfield Technologies, Triton Group, Subsea Services International, GlobalFlow Technologies and Allied Technology. It’s major legacy brands include Perryand Sub-Atlantic™ (ROVs); B+V Oil Tools, P-Quip, Pipe Wranglers and Vanoil(tubular handling); Dynacon (LARS and winches); and Davis-Lynch, Cannon andMerrimac (downhole products).
The company operates today in three reporting segments: Drilling & Subsea (39%of 2016 revenues), Production & Infrastructure (40%), and Completions (21%).Over half (62%) of its revenues are derived in the US, 13% Europe and Africa, 9%Asia Pacific, 7% Canada, 5% Latin America and 4% Middle East. The companyis growing its midstream and downstream operations internationally, specificallySoutheast Asia. The Middle East remains a strong pipeline of capital equipmentorders. In 1H17 88% of revenues came from its onshore business and 12% fromoffshore.
Figure 328: Onshore & offshore product offering
Source: Company reports, Deutsche Bank
Deutsche Bank Securities Inc. Page 125

9 October 2017
Oil Services & Equipment
Initiation of coverage
Figure 329: Reporting segments
Drilling & Subsea Completions
- Capital equipment - Casing and cementing equipment
- Expendable drilling products - Cable protectors for completions
- Subsea ROVs, trenchers, specialty parts - Wireline flow controls
- Subsea technical services & rental items - Composite plugs
Production & Infrastructure - Frac pumps
- Engineered systems & production equipment - Pump consumables & flow iron
- Field services - Coiled tubing
- Oil & produced water treating equipment - Wireline cable
- Industrial valves - Pressure control equipment
Forum Energy
Source: Company reports, Deutsche Bank
Figure 330: Segment revenue mix
Pro
In
Drilling
&
Subsea
50%
Completions
25%
Production &
Infrastructure
25%
2014
Drilling
&
Subsea
39%
Completions
21%
Production &
Infrastructure
40%
2016
g
a
Source: Company reports
Page 126 Deutsche Bank Securities Inc.

9 October 2017
Oil Services & Equipment
Initiation of coverage
Principal Sources and Uses of Cash Flow
Increasingly focused on production phase of offshore life cycleFET remains committed to the US onshore business, a significant driver itspositive free cash flow record. The company expanded its Completions businessfrom 0% of 2013 revenues to 27% at 2Q17, as the Drilling & Subsea segmentbecame a smaller piece of the pie (32% of 2Q17 revenues vs 45% in 2015).As a result EBIT margins have been more resilient, and are poised to bounceback faster than some peers. Book-to-bill ratios have increased in 2017 acrossCompletions and Production & Infrastructure, while Drilling & Subsea tickeddown slightly from 0.95 in 2016 to 0.84 at 2Q17. The company is attemptingto diversify its geographic and revenue mix toward more international andmidstream/downstream work. We like the strategy but wait for the execution.
Figure 331: Revenue mix
United States
60%
Europe
& Africa
18%
Canada
6%
Asia
Pacific
9%
Latin
America
3% Middle East
4%
2014
United States
62%
Europe &
Africa͙
Canada
7%
Asia
Pacific
9%
Latin
America
5%Middle East
4%
2016
Source: Company reports, Deutsche Bank
The Middle East and Asia Pacific regions have been bright spots during thedownturn and we are hearing of upcoming rig tenders in the Middle East, whichwould benefit FET should it win the work. At 2Q17 the revenue mix was 62% USvs 38% Int’l, although we would caution at entering a price knife-fight solely towin market share. FET has assembled a strong group of businesses since its IPO in2012 but its smaller size could mean margin pressure internationally should it tooaggressively pursue market share. It has a strong balance sheet – historically 1.7xdebt turns – has seen leverage increase with $400 million of total debt ($117mlnnet) today. While $30 million is budgeted for capex this year and 2018 customervisibility still hazy, we are looking for a sustainable path back to positive free cashflow and a larger, more stable internationally business mix benefit.
Deutsche Bank Securities Inc. Page 127

9 October 2017
Oil Services & Equipment
Initiation of coverage
Figure 332: Positive free cash flow track record
(100)
(50)
0
50
100
150
200
250
3002
01
2
20
13
20
14
20
15
20
16
20
17
20
18
20
19
(a) (a) (a) (a) (a) (e) (e) (e)
In m
illi
on
s o
f U
SD
Cash from operations Capital expenditures Free cash flow
Source: Company reports, Deutsche Bank
Figure 333: Earnings per share
(0.76)(1.00)
(0.50)
0.00
0.50
1.00
1.50
2.00
2012
2013
2014
2015
2016
2017
2018
2019
(a) (a) (a) (a) (a) (e) (e) (e)
EPS
Source: Company reports, Deutsche Bank
Figure 334: Net debt Figure 335: Debt turns
0
50
100
150
200
250
300
350
400
450
500
20
12
20
13
20
14
20
15
20
16
20
17
20
18
20
19
(a) (a) (a) (a) (a) (e) (e) (e)
In m
illi
on
s o
f U
SD
(20.0)
(15.0)
(10.0)
(5.0)
0.0
5.0
10.0
15.0
20
12
20
13
20
14
20
15
20
16
20
17
20
18
20
19
(a) (a) (a) (a) (a) (e) (e) (e)
De
bt
turn
s
Source: Deutsche Bank Source: Deutsche Bank
Page 128 Deutsche Bank Securities Inc.

9 October 2017
Oil Services & Equipment
Initiation of coverage
Figure 336: Income Statement(a) (a) (a) (a) (a) (e) (e) (e)
In millions of USD 2012 2013 2014 2015 2016 2017 2018 2019
Segment revenues:
Drilling & Subsea 827 941 864 487 228 258 273 314
Completions 0 0 441 267 127 227 294 350
Production & Infrastructure 589 585 436 320 234 349 443 523
Eliminations (1) (1) (2) (1) (1) (2) (2) (2)
Total revenues 1,415 1,525 1,740 1,074 588 831 1,008 1,185
Segment EBITDA:
Drilling & Subsea 199 207 168 73 (11) (69) 21 33
Completions 0 0 147 61 1 31 69 91
Production & Infrastructure 110 101 64 35 11 29 59 90
Other (16) (29) (39) (27) (26) 48 (34) (39)
Total EBITDA 293 280 340 142 (25) 39 114 176
Segment D&A:
Drilling & Subsea 38 44 35 34 30 (46) 22 24
Completions 0 0 20 25 25 18 20 17
Production & Infrastructure 13 13 8 7 7 10 12 15
Corporate and other 1 3 1 (0) 0 77 (2) (7)
Total D&A 52 61 65 66 62 59 52 49
Segment EBIT:
Drilling & Subsea 161 163 133 39 (41) (23) (1) 10
Completions 0 0 127 36 (24) 14 49 73
Production & Infrastructure 97 87 56 28 5 19 47 75
Corporate and other (18) (31) (41) (26) (27) (30) (32) (32)
EBIT 241 219 275 77 (87) (20) 62 127
Interest (expense) (16) (18) (30) (30) (27) (26) (27) (27)
Interest income 0 0 0 0 0 0 0 0
Equity income 0 0 0 0 0 3 0 0
Other income (2) (3) (0) 0 0 (2) 0 0
PBT 223 198 245 47 (114) (46) 35 100
Income tax (expense) (71) (60) (69) (10) 45 20 (13) (37)
Non-controlling interest (0) (0) (0) 0 0 0 0 0
Preferred dividends 0 0 0 0 0 0 0 0
Net income (operating) 152 138 176 38 (70) (26) 22 63
Discontinued ops 0 0 0 0 0 (4) 0 0
Unusual after-tax 0 (9) (2) (157) (13) (67) 0 0
Net income (GAAP) 152 129 174 (119) (82) (97) 22 63
Operating EPS 1.74 1.46 1.85 0.41 (0.76) (0.27) 0.23 0.66
GAAP EPS 1.74 1.37 1.83 (1.31) (0.90) (1.01) 0.23 0.66
DPS 0.00 0.00 0.00 0.00 0.00 0.00 0.00 0.00
Diluted shares 87 95 95 91 91 96 96 96
EBITDA margin 20.7% 18.3% 19.5% 13.3% -4.3% 4.7% 11.3% 14.8%
EBIT margin 17.0% 14.4% 15.8% 7.1% -14.8% -2.4% 6.1% 10.7%
Tax rate 32.0% 30.1% 28.0% 20.4% 39.1% 43.2% 37.0% 37.0%
EBITDA margins
Drilling & Subsea 0.0% 0.0% 0.0% 0.0% 0.0% 0.0% 0.0% 0.0%
Completions 24.0% 22.0% 19.5% 15.0% (4.7%) (26.6%) 7.5% 10.6%
Production & Infrastructure 0.0% 0.0% 33.2% 22.8% 0.5% 13.7% 23.4% 25.9%
Source: Deutsche Bank
Deutsche Bank Securities Inc. Page 129

9 October 2017
Oil Services & Equipment
Initiation of coverage
Figure 337: Cash Flow Statement
(a) (a) (a) (a) (a) (e) (e) (e)
In millions of USD 2012 2013 2014 2015 2016 2017 2018 2019
Net income 152 138 176 38 (70) (26) 22 63
Depreciation 52 61 65 66 62 59 52 49
Deferred tax (6) 16 (3) (23) (24) (24) 0 0
Chg in receivables 13 1 (45) 146 29 (61) (18) (40)
Chg in inventories (100) 33 (26) 0 57 (44) (15) (84)
Chg in payables (5) (1) 63 (111) 4 49 9 34
Other 33 (36) 40 41 6 52 8 17
Cash from operations 138 211 270 156 65 4 58 39
Capital expenditures (50) (60) (54) (32) (17) (30) (40) (47)
Free cash flow 88 151 216 124 48 (26) 18 (9)
Acquisitions (140) (182) (38) (61) (4) (9) 0 0
Asset sales 5 1 12 2 10 2 0 0
Dividends paid 0 0 0 0 0 0 0 0
ESPP | options 0 0 0 0 0 0 0 0
Equity issuance, net 321 1 (86) (1) 87 (3) 0 0
Debt issuance, net (251) 92 (84) (26) (0) (1) (0) (0)
Other 13 (65) 17 (5) (15) 5 0 0
Chg in cash 36 (1) 37 33 125 (32) 18 (9)
Source: Deutsche Bank
Page 130 Deutsche Bank Securities Inc.

9 October 2017
Oil Services & Equipment
Initiation of coverage
Figure 338: Balance Sheet
(a) (a) (a) (a) (a) (e) (e) (e)
In millions of USD 2012 2013 2014 2015 2016 2017 2018 2019
Cash and equivalents 41 40 77 109 234 202 220 212
Accounts receivable 229 250 287 139 105 169 187 228
Inventories 455 441 462 424 339 392 406 491
Other current assets 50 79 70 46 71 43 48 58
Total current assets 775 809 895 718 750 806 861 988
Net PP&E 153 180 190 187 152 138 126 125
Goodwill 696 802 798 669 653 596 596 596
Other assets 269 377 338 313 281 284 285 286
Total assets 1,893 2,169 2,222 1,886 1,835 1,824 1,868 1,994
Accounts payable 99 100 128 77 74 127 137 171
Current debt 21 1 1 0 0 1 1 1
Other current liabilities 161 119 154 74 68 78 87 105
Total current liabilities 281 220 282 152 142 207 225 278
Long-term debt 400 512 428 396 397 398 398 397
Other LT liabilities 50 106 116 81 61 46 51 61
Shareholders' equity 1,161 1,330 1,395 1,257 1,235 1,173 1,195 1,258
Total liabilities and equity 1,893 2,169 2,222 1,886 1,835 1,824 1,868 1,994
Total debt 421 513 429 396 397 399 399 399
Net debt 380 473 352 287 162 197 179 187
Debt/capital 27% 28% 24% 24% 24% 25% 25% 24%
Debt/equity 36% 39% 31% 32% 32% 34% 33% 32%
Debt turns 1.4 1.8 1.3 2.8 (15.7) 10.2 3.5 2.3
Source: Deutsche Bank
Deutsche Bank Securities Inc. Page 131

9 October 2017
Oil Services & Equipment
Initiation of coverage
Rating
HoldNorth AmericaUnited States
IndustrialsOil Services & Equipment
Company
Frank's International
Reuters Bloomberg
FI.N FI US
Market Share Strategy in a ToughOffshore EnvironmentInitiating with a Hold rating and an $7 price targetFrank’s is the principal player in the deepwater tubular running services (TRS)business, which is encountering a number of significant challenges as thedeepwater market endures the most severe downturn in history. The companyhas been successful in gaining international market share in effort to restoreits earnings power, but the base price for FI’s primary services remains underpressure. We believe the deepwater is bottoming and is showing signs of arecovery, but the recovery is likely to be very laborious. While management hasmanaged the downturn with peer leading fiscal responsibility, the macro outlookis too challenging at this point to endorse a rapid revision upward in earnings.
US onshore markets are improving, but TRS is highly fragmentedThe US onshore environment is challenging its onshore business model. Thecompany is exploring different business models as it looks to shift mix to a rentalbusiness and away from full service TRS. Land drillers in particular are interferingin the market as they look to boost their own daily margins with increasingly moreservice content, with TRS a primary target.
Valuation and risksOur $7 price target is 6.9x our estimate ofthe company’s normalized EBITDA powerof $190 million. This is in-line with theaverage 6.9x multiple leading up to the 2014collapse in oil prices. The main investmentrisks include: 1) shifts in OPEC policyand the influence that would have on oilprices and ultimately US upstream capitalexpenditures, 2) negative revisions to globaloil demand, and 3) an inability to gainmarket share to restore earnings. Upsiderisk includes a more rapid offshore recoverystemming from a rise in commodity prices.
Gaining international market share, targeting Middle East, Norway and BrazilThe company is looking to take advantage of its no debt balance sheet andscore some market share from those of its competitors that are otherwisedistracted with restructuring efforts. The company has had some successes withinternational markets to the focus as FI will be at about 70% market share in theGulf of Mexico deepwater by 1Q18.
Forecasts and ratios
Year End Dec 31 2016A 2017E 2018E
1Q EPS -0.00 -0.12A -0.08
2Q EPS -0.13 -0.12A -0.07
3Q EPS -0.13 -0.11 -0.06
4Q EPS -0.18 -0.10 -0.05
FY EPS (USD) -0.47 -0.45 -0.26
OLD FY EPS (USD) – – –
% Change – – –
P/E (x) – – –
DPS (USD) 0.45 0.30 0.30
Dividend Yield (%) 3.4 3.9 3.9
Revenue (USDm) 487.5 476.5 534.9Source: Deutsche Bank estimates, company data
David HavensResearch [email protected]
Price at 5 Oct 2017 (USD) 7.67
Price target 7.00
52-week range 13.23 - 6.19
Price/price relative
Frank's Internationa S&P 500 INDEX (Rebased)
Jan '15 May '15 Sep '15 Jan '16 May '16 Sep '16 Jan '17 May '17 Sep '175
7.5
10
12.5
15
17.5
20
22.5
Performance(%)
1m 3m 12m
Absolute 20.3 -10.0 -39.0
S&P 500INDEX
2.5 4.5 18.0
Source: Deutsche Bank
Stock & option liquidity data
Market Cap (USDm) 1,709.1
Shares outstanding (m) 222.8
Free float (%) 30
Volume (5 Oct 2017) 247,015
Option volume (und. shrs., 1M avg.) –Source: Deutsche Bank
Page 132 Deutsche Bank Securities Inc.

9 October 2017
Oil Services & Equipment
Initiation of coverage
Key investment themes
The base price for FI’s services remains under pressureApproximately 75% of FI’s business comes from the offshore, largely thedeepwater. The timing of a sustained offshore recovery remains uncertain, butactivity is bottoming in the deepwater, albeit with limited upside in the next fewyears. Lower activity in the Gulf of Mexico has battered its US Services marginsas decremental margins can be 100% as rigs come off contract. Activity in theGoM should level out, but only after 3Q17 offshore US revenues take another15% leg down according to management. On the bright side, the company wasrecently awarded a six rig long-term commitment in the GoM that begins in 4Q17and should be ramped up in 1Q18. This will elevate FI’s GoM market share toabout 70%.
Figure 339: Deepwater drilling outlook (DBe)
258227
164131
9466
1463
99
258
227
164145
157165
0
50
100
150
200
250
300
2014 2015 2016 2017(e) 2018(e) 2019(e)
Rig
ye
ars
Rig years in backlog Rig years added
Source: ODS-Petrodata, Deutsche Bank
The US onshore business is improving, but TRS revenues are lagging the rig counthas FI concedes some low price market share in an effort to preserve onshoremargins. We expect the US land drillers to keep interfering in the US TRS marketas they seek out service content to boost daily margins.
Valuation and risksOur $7 price target is 6.9x our estimate of the company’s normalized EBITDApower of $190 million. This is in-line with the 6.9x average multiple leading upto the 2014 collapse in oil prices. The main investment risks include: 1) shifts inOPEC policy and the influence that would have on oil prices and ultimately USupstream capital expenditures, 2) negative revisions to global oil demand, and 3)an inability to gain market share to restore earnings. Upside risk includes a morerapid offshore recovery stemming from a rise in commodity prices.
Deutsche Bank Securities Inc. Page 133

9 October 2017
Oil Services & Equipment
Initiation of coverage
Company description
Frank’s International (FI) is global leader in tubular running services (TRS)for onshore, offshore, and the more complex deepwater and ultra-deepwaterhigh pressure/high temperature (HP/HT) applications. FI also manufacturesand sells large outer diameter (OD) pipe, connectors and casing attachments,and maintains an inventory of large OD pipe from third-party mills. FI hasone of the industry’s largest inventories of tubulars and connectors. Thecompany also provides fabrication and welding services for offshore projects,but more specifically for drilling and production risers, flowlines and pipeline endterminations, as well as long length tubulars for use as caissons or pilings.
In November 2016, the company acquired Blackhawk Specialty Tools to diversifyinto well construction and intervention. Blackhawk has a particular expertise incementing tools.
Figure 340: Reporting segments
International Services / US Services Tubular Sales
- Tubular running services (TRS) - Manufacturing and distribution of:
- Top drive casing running tools (CRT) - Large outer diameter (OD) pipe
- Casing-while-drilling (CwD) - Connectors
- Automated TRS solutions - Casing attachments
- Corrosion resistant alloy (CRA) TRS Blackhawk
- Cementing tools
Frank's International
Source: Company reports
Figure 341: Revenue mix by reporting segment
U.S
T
International
Services
47%
U.S. Services
38%
Tubular Sales
15%Blackhawk
0%
2014
International
Services
49%
U.S. Services
31%
Tubular Sales
18%
Blackhawk
2%
2016
al
Source: Deutsche Bank
Page 134 Deutsche Bank Securities Inc.

9 October 2017
Oil Services & Equipment
Initiation of coverage
Principal Sources and Uses of Cash Flow
Tubular running services is core business, offshore is FI’s principal marketFrank’s core business is tubular running services (TRS) and its principal marketsare the Gulf of Mexico, West Africa, and the US onshore. Approximately 75%of its overall revenues are generated from offshore applications, primarily in thedeepwater. The significant majority of revenues from its International Servicesegment is from deepwater as it is in the US Services segment. The deepwatermarkets are highly specialized and complex, thus there is a limited competitivelandscape. Its most direct competitor is Weatherford, which has a better shallowwater market share versus FI, and FI has a better position in the deepwater.Following the award on six new rigs in the US Gulf of Mexico, FI will have about70% market share in the US GoM. The company is currently targeting higherpenetration in the Middle East, Norway (where Odfjell has a leading market share),and Brazil.
Figure 342: Revenue mix
International
offshore
International
onshoreTubular
Sales
US
onshore
US
offshore
Blackhawk
2014
o
al
al
International
offshore
International
onshoreTubular
Sales
US
onshore
US
offshore
Blackhawk
2016
Source: Deutsche Bank
Figure 343: US Services mix between onshore andoffshore
Figure 344: EBITDA mix
-
10
20
30
40
50
60
70
80
1Q
13
2Q
13
3Q
13
4Q
13
1Q
14
2Q
14
3Q
14
4Q
14
1Q
15
2Q
15
3Q
15
4Q
15
1Q
16
2Q
16
3Q
16
4Q
16
1Q
17
2Q
17
In m
illi
on
s o
f U
SD
Onshore Offshore
(20)
-
20
40
60
80
100
120
140
1Q
13
2Q
13
3Q
13
4Q
13
1Q
14
2Q
14
3Q
14
4Q
14
1Q
15
2Q
15
3Q
15
4Q
15
1Q
16
2Q
16
3Q
16
4Q
16
1Q
17
2Q
17
International Services U.S. Services Tubular Sales Blackhawk
Source: Company reports, Deutsche Bank Source: Company reports, Deutsche Bank
Deutsche Bank Securities Inc. Page 135

9 October 2017
Oil Services & Equipment
Initiation of coverage
US is a highly fragmented marketWhile US onshore activity is improving, the company is exploring businessmodels for the US where FI is more of a rental company than a full serviceprovider. The US is seeing a downshift in the number of hole sizes in horizontalwells, and many of the leading land drillers are taking share in the onshore TRSbusiness. Land drillers feel like they have been cut out of the value chain, thus oneof the disciplines that makes sense for them to onboard onto their rigs is TRS. FIis making proposals to some of the onshore players to rent them the equipment.This would be a lower revenue business model, but rentals have higher marginsbecause personnel can be 40% of a full service ticket, but are low margin.
Figure 345: Segment EBITDA
(100)
0
100
200
300
400
500
20
13
20
14
20
15
20
16
20
17
20
18
20
19
20
20
(a) (a) (a) (a) (e) (e) (e) (e)
In m
illio
ns
of
USD
International Services U.S. Services Tubular Sales Blackhawk Corporate and other
Source: Company reports, Deutsche Bank
Investing in Blackhawk business and expanding international market shareFI’s focus now is to grow its market share internationally and to invest in itsBlackhawk business. The company does not intend to do M&A in US onshoreTRS, but instead wants to look for growth outside of its flagship TRS business. Itsmost recent initiative is the launch of a new frac plug from Blackhawk. The USis about 85% of Blackhawk revenues.
Figure 346: Annual EPS Figure 347: Net debt
(1.00)
(0.50)
0.00
0.50
1.00
1.50
2.00
2.50
2013
2014
2015
2016
2017
2018
2019
(a) (a) (a) (a) (e) (e) (e)
EPS
(700)
(600)
(500)
(400)
(300)
(200)
(100)
0
20
13
20
14
20
15
20
16
20
17
20
18
20
19
(a) (a) (a) (a) (e) (e) (e)
In m
illi
on
s o
f U
SD
Source: Company reports, Deutsche Bank Source: Company reports, Deutsche Bank
Page 136 Deutsche Bank Securities Inc.

9 October 2017
Oil Services & Equipment
Initiation of coverage
Figure 348: Income Statement(a) (a) (a) (a) (e) (e) (e)
In millions of USD 2013 2014 2015 2016 2017 2018 2019
Segment revenues:
International Services 475 537 442 237 212 229 262
U.S. Services 435 440 326 153 118 127 148
Tubular Sales 167 176 206 88 66 69 79
Blackhawk 0 0 0 10 80 110 140
Total revenue 1,078 1,153 975 488 476 535 629
Segment EBITDA:
International Services 200 231 182 43 33 43 51
U.S. Services 198 181 94 (17) (34) (17) 12
Tubular Sales 41 38 41 2 5 5 10
Blackhawk 0 0 0 1 12 21 28
Corporate and other 0 (0) 0 0 0 0 0
Total EBITDA 439 450 317 30 16 52 100
D&A 78 90 109 114 120 106 96
EBIT 361 360 208 (85) (105) (55) 4
Interest (expense) (1) 0 0 2 3 2 1
Interest income 0 0 0 0 0 0 0
Equity income 0 0 0 0 0 0 0
Other income (13) (43) (31) (30) (23) (19) (20)
PBT 347 318 177 (112) (125) (72) (14)
Income tax (expense) (39) (76) (50) 9 26 14 3
Non-controlling interest (40) (70) (27) 21 0 0 0
Preferred dividends 0 0 0 0 0 0 0
Net income (operating) 268 172 101 (82) (99) (58) (11)
Discontinued ops 43 0 0 0 0 0 0
Unusual after-tax 0 (13) (22) (38) 0 0 0
Net income (GAAP) 311 159 79 (121) (99) (58) (11)
Reconciliation for NCI 33 55 25 0 0 0 0
Operating EPS 1.89 1.09 0.60 (0.47) (0.45) (0.26) (0.05)
GAAP EPS 2.16 1.03 0.50 (0.68) (0.45) (0.26) (0.05)
DPS 0.08 0.45 0.60 0.45 0.30 0.30 0.30
Diluted shares 159 208 209 176 223 223 223
EBITDA margin 40.7% 39.1% 32.6% 6.1% 3.3% 9.6% 16.0%
EBIT margin 33.5% 31.3% 21.4% -17.4% -21.9% -10.2% 0.7%
Tax rate 11.2% 23.9% 28.1% 8.2% 20.8% 19.0% 19.0%
Source: Deutsche Bank
Deutsche Bank Securities Inc. Page 137

9 October 2017
Oil Services & Equipment
Initiation of coverage
Figure 349: Cash Flow Statement
(a) (a) (a) (a) (e) (e) (e)
In millions of USD 2013 2014 2015 2016 2017 2018 2019
Net income 268 172 101 (82) (99) (58) (11)
Depreciation 78 90 109 114 120 106 96
Deferred tax 4 30 5 (28) (20) 0 0
Chg in receivables (82) (43) 141 70 (17) (14) (43)
Chg in inventories (82) (30) 42 27 (5) 1 (34)
Chg in payables 3 5 (3) (3) 1 (0) 5
Other 88 146 34 (109) 19 16 48
Cash from operations 277 369 428 (11) (1) 50 61
Capital expenditures (185) (173) (100) (42) (40) (53) (63)
Free cash flow 93 196 328 (53) (41) (3) (2)
Acquisitions 0 0 (79) (150) 0 0 0
Asset sales 51 1 5 4 2 0 0
Dividends paid (117) (69) (93) (79) (67) (67) (67)
ESPP | options 0 0 0 1 1 0 0
Equity issuance, net 712 0 0 0 0 0 0
Debt issuance, net (472) (0) (1) (7) (0) 0 0
Other (15) (43) (48) 2 8 0 0
Chg in cash 252 84 113 (283) (97) (70) (69)
Source: Deutsche Bank
Page 138 Deutsche Bank Securities Inc.

9 October 2017
Oil Services & Equipment
Initiation of coverage
Figure 350: Balance Sheet
(a) (a) (a) (a) (e) (e) (e)
In millions of USD 2013 2014 2015 2016 2017 2018 2019
Cash and equivalents 405 489 602 320 223 153 84
Accounts receivable 365 391 246 167 178 193 236
Inventories 186 204 161 139 145 145 179
Other current assets 16 23 14 14 17 18 22
Total current assets 971 1,107 1,024 640 564 508 520
Net PP&E 511 580 625 567 492 439 406
Goodwill 15 14 25 256 251 251 251
Other assets 64 57 54 125 126 129 137
Total assets 1,561 1,759 1,728 1,588 1,432 1,327 1,314
Accounts payable 22 16 13 16 21 21 26
Current debt 0 0 7 0 0 0 0
Other current liabilities 153 190 170 83 87 94 115
Total current liabilities 176 207 190 99 109 115 141
Long-term debt 0 0 0 0 0 0 0
Other LT liabilities 287 339 325 177 169 182 222
Shareholders' equity 1,098 1,213 1,213 1,311 1,154 1,029 951
Total liabilities and equity 1,561 1,759 1,728 1,588 1,432 1,327 1,314
Total debt 0 0 7 0 0 0 0
Net debt (405) (489) (595) (319) (223) (153) (83)
Debt/capital 0% 0% 1% 0% 0% 0% 0%
Debt/equity 0% 0% 1% 0% 0% 0% 0%
Debt turns 0.0 0.0 0.0 0.0 0.0 0.0 0.0
Source: Deutsche Bank
Deutsche Bank Securities Inc. Page 139

9 October 2017
Oil Services & Equipment
Initiation of coverage
Rating
BuyNorth AmericaUnited States
IndustrialsOil Services & Equipment
Company
Halliburton
Reuters Bloomberg
HAL.N HAL US
Leadership in US Frac Best PracticesInitiating coverage with a Buy rating and a $54 price targetHalliburton offers liquidity in one of the few growing oilfield service markets, USpressure pumping. Service intensities continue to increase as pads get larger,average laterals continue to increase, the number of frac stages rises and morefrac horsepower gets tied up on pads for longer. While we believe stubbornly lowoil prices will be a headwind for the US rig count, the pressure pumping marketis undersupplied despite capacity racing back into the market. Pricing shouldcontinue to improve through year-end, but at a moderate pace. 2018 shouldbenefit from rising volumes as the industry begins to arrest the ascent of DUCsbeing inventoried due to the lack of frac crews. Importantly, we are encouragedthat the earnings outlook has been reset lower after a period of irrational earningsassessments so early in the cycle.
The macro needs to kick-in for the stock to break out above $54 againWhile the undersupplied US frac market is restoring HAL’s earnings power, theinternational markets are struggling to catch volumes and pricing. Other than theMiddle East, activity has remained depressed, and without a broader internationaluplift in 2019 and beyond, we expect the stock will encounter headwinds above$54.
ValuationOur $54 price target is 16.3x our estimateof the company’s normalized EPS powerof $3.30 per share, which is one standarddeviation above its average five-yearmultiple of 13.2x leading up to the 2014collapse in oil prices. We expect as therelatively unique momentum in the US fracmarket continues in 2018, HAL’s leverageto this market will continue to make it acore holding in the group, especially asinvestors are mindful of trading liquidity inan otherwise volatile market. We expectresistance at $53 though as US drilling haslimited upside in our view due to stubbornlylow oil prices in 2018.The main investment risks include: 1) shiftsin OPEC policy and the influence thatwould have on oil prices and ultimately USupstream capital expenditures, 2) negativerevisions to global oil demand, 3) a deferralof completions on DUCs due to loweroil prices, 4) a rapid acceleration in fracnewbuilds in the US that deflate pricing, and5) a materially weaker international market.
Forecasts and ratios
Year End Dec 31 2016A 2017E 2018E
1Q EPS 0.07 0.04A 0.49
2Q EPS -0.14 0.27A 0.53
3Q EPS 0.01 0.37 0.58
4Q EPS 0.04 0.47 0.62
FY EPS (USD) -0.02 1.14 2.22
OLD FY EPS (USD) -0.02 1.10 2.80
% Change -0.0% 3.9% -20.7%
P/E (x) – 39.5 20.3
DPS (USD) 0.72 0.72 0.72
Dividend Yield (%) 1.7 1.6 1.6
Revenue (USDm) 15,887.0 19,588.5 21,381.3Source: Deutsche Bank estimates, company data
David HavensResearch [email protected]
Price at 5 Oct 2017 (USD) 45.09
Price target 54.00
52-week range 58.21 - 38.66
Price/price relative
Halliburton S&P 500 INDEX (Rebased)
Jan '15 May '15 Sep '15 Jan '16 May '16 Sep '16 Jan '17 May '17 Sep '1720
30
40
50
60
70
80
90
Performance(%)
1m 3m 12m
Absolute 16.1 3.3 1.3
S&P 500INDEX
2.5 4.5 18.0
Source: Deutsche Bank
Stock & option liquidity data
Market Cap (USDm) 39,293.7
Shares outstanding (m) 871.5
Free float (%) 100
Volume (5 Oct 2017) 1,801,894
Option volume (und. shrs., 1M avg.) 2,775,042Source: Deutsche Bank
Page 140 Deutsche Bank Securities Inc.

9 October 2017
Oil Services & Equipment
Initiation of coverage
Key investment themes
Longer laterals to drive further service intensity in the USWhile we are seeing gains in the average 30-day IP per 1,000-ft of lateral slowafter years of substantial increases, producers are still extending the overall laterallengths. For years we have all questioned the industry on the technical andeconomic limits of horizontal laterals. Since 2011, the average lateral length hasincreased by 40% to 6,000-ft. The leading edge is up to 12,000-ft with someexperimenting with 20,000+ feet. So far the limitations have been related tolimits on friction reducing agents, availability of continuous acreage capable ofaccommodating longer laterals, and risk. Risk because laterals are drilled open-hole, not cased hole. When laterals extend out to 12,000-ft, costs escalate as doesthe risk of well integrity. Some smaller, less sophisticated producers are unwillingto take on that risk. But we found that over the last three years, about 50% of thewells placed on production in the Permian and Eagle Ford were drilled by one ofthe top 30 most active producers, the vast majority of which are pressing aheadwith longer laterals.
Figure 351: Average Permian horizontal lateral lengths Figure 352: Average Permian 30-day IPs per 1,000-ft
0
1,000
2,000
3,000
4,000
5,000
6,000
7,000
8,000
2011 2012 2013 2014 2015 2016 2017 2018 2019
Feet
-
20
40
60
80
100
120
140
160
-
100
200
300
400
500
600
700
800
2011 2012 2013 2014 2015 2016 2017
Ytd
30
-da
y I
P p
er
1,0
00
-ft
of
late
ral
b/d
(o
il o
nly
)
Peak monthly production 30-day IP per 1,000-ft
Source: IHS Markit Source: Deutsche Bank
Figure 353: Permian frac stages per well Figure 354: Permian sand volumes per lateral foot
0
5
10
15
20
25
30
35
2011 2012 2013 2014 2015 2016 2017 2018 2019
Fra
c st
ag
es
pe
r w
ell
100
600
1,100
1,600
2,100
2,600
2011 2012 2013 2014 2015 2016 2017 2018 (e) 2019 (e)
Lbs.
pe
r la
tera
l ft
Source: IHS Markit Source: IHS Markit
Deutsche Bank Securities Inc. Page 141

9 October 2017
Oil Services & Equipment
Initiation of coverage
Earnings revisions have acknowledged a more realistic outcome nowWhat discouraged us and kept our long-standing negative view on the stocksintact was the rapid rise in earnings expectations following the recovery in theUS rig count. While standard operating procedure, it showed the market had notacknowledged any shift in market dynamics due to the disruption from tight oildevelopment. Earnings, particularly in HAL, have since reset lower, presenting amuch better setup in the stock.
Figure 355: HAL 2018 consensus EPS revisions
1.50
1.70
1.90
2.10
2.30
2.50
2.70
2.90
3.10
Apr-16
May-16
Jun-16
Jul-16
Aug-16
Sep-16
Oct-16
Nov-16
Dec-16
Jan-17
Feb-17
Mar-17
Apr-17
May-17
Jun-17
Jul-17
Aug-17
Sep-17
EPS
Source: Factset
US pressure pumping market is undersuppliedThe positive supply/demand trends are continuing in the frac market, drivenby a rising well count, increased pad drilling, more wells per pad and anincreasing inventory of DUCs (drilled but uncompleted wells). Frac fleets arealso incorporating more hhp, averaging about 50k now. The increase is toaccommodate the larger pads, which are keeping crews on location longer, thusin order to accommodate maintenance rotations and suitable uptime, contractorshave increased fleet sizes.
Figure 356: Total vs. marketed frac hhp utilization Figure 357: US frac hhp demand
0%
20%
40%
60%
80%
100%
120%
3Q
11
4Q
11
1Q
12
2Q
12
3Q
12
4Q
12
1Q
13
2Q
13
3Q
13
4Q
13
1Q
14
2Q
14
3Q
14
4Q
14
1Q
15
2Q
15
3Q
15
4Q
15
1Q
16
2Q
16
3Q
16
4Q
16
1Q
17
Total utilization Marketed utilization
0
2
4
6
8
10
12
14
16
18
3Q
11
4Q
11
1Q
12
2Q
12
3Q
12
4Q
12
1Q
13
2Q
13
3Q
13
4Q
13
1Q
14
2Q
14
3Q
14
4Q
14
1Q
15
2Q
15
3Q
15
4Q
15
1Q
16
2Q
16
3Q
16
4Q
16
1Q
17
2Q
17
3Q
17
Millio
n h
hp
Source: IHS Markit, Deutsche Bank Source: IHS Markit, Deutsche Bank
Page 142 Deutsche Bank Securities Inc.

9 October 2017
Oil Services & Equipment
Initiation of coverage
Figure 358: DUCs are building as frac horsepower is sold out
-
1,000
2,000
3,000
4,000
5,000
6,000
Jan
-14
Ap
r-1
4
Jul-
14
Oct
-14
Jan
-15
Ap
r-1
5
Jul-
15
Oct
-15
Jan
-16
Ap
r-1
6
Jul-
16
Oct
-16
Jan
-17
Ap
r-1
7
Jul-
17
Permian Eagle Ford Bakken Anadarko
Source: EIA
HAL is reactivating idle equipment at leading edge rates while its in-housemanufacturing is providing a competitive advantage with newbuild lead timesof about one month versus the industry at about 9-12 months. HAL has not yetcommitted to any newbuilds, but the company’s calendar is sold out through year-end. Industry demand has recovered to about 12 million hhp versus 17 million atthe peak, and less than 6 million at the trough. All available horsepower by andlarge is now booked through year-end 2017. Marketed utilization is back above80% with some contractors suggesting the market is undersupplied by 1.5 – 2.0million horsepower.
Figure 359: US frac pricing indexed to 3Q11
0
20
40
60
80
100
120
3Q11
4Q11
1Q12
2Q12
3Q12
4Q12
1Q13
2Q13
3Q13
4Q13
1Q14
2Q14
3Q14
4Q14
1Q15
2Q15
3Q15
4Q15
1Q16
2Q16
3Q16
4Q16
1Q17
2Q17
3Q17
Source: IHS Markit, Deutsche Bank
Pricing moving higher, albeit more modestlyPricing has improved, but more moderately than what some producers hadpreviously expected. While several contractors are suggesting pricing is not yetat newbuild economics, HAL does believe the economics are there, but has notyet committed. We view HAL should benefit from the fact that its fleet pricing willall rollover to market prices within a year.
Deutsche Bank Securities Inc. Page 143

9 October 2017
Oil Services & Equipment
Initiation of coverage
Attrition is increasingFrac intensity on the larger pads and bigger wells is chewing equipment fasterthan last cycle, kicking attrition into a higher gear. Industry expectations forattrition are upwards of 3.5 million hhp per annum as useful lives decline andmaintenance capital rises. While this is tightening the market upfront, it increasesthe capital intensity for the industry longer term.
Valuation and risksOur $54 price target is 16.3x our estimate of the company’s normalized EPSpower of $3.30 per share, which is one standard deviation above its average five-year multiple of 13.2x leading up to the 2014 collapse in oil prices. We expectas the relatively unique momentum in the US frac market continues in 2018,HAL’s leverage to this market will continue to make it a core holding in the group,especially as investors are mindful of trading liquidity in an otherwise volatilemarket. We expect resistance at $53 though as US drilling has limited upside inour view due to stubbornly low oil prices in 2018.
The main investment risks include: 1) shifts in OPEC policy and the influencethat would have on oil prices and ultimately US upstream capital expenditures, 2)negative revisions to global oil demand, 3) a deferral of completions on DUCs dueto lower oil prices, 4) a rapid acceleration in frac newbuilds in the US that deflatepricing, and 5) a materially weaker international market.
Figure 360: The P/E valuation band has blown out Figure 361: The 5yr P/E leading up to 2014
1
2
4
8
16
32
64
128
256
Jan-10 Jan-11 Jan-12 Jan-13 Jan-14 Jan-15 Jan-16 Jan-17
Log
ari
thm
ic s
cale
-1 std 5yr avg +1 std
3
8
13
18
23
28
-1 std 5yr avg +1 std
Source: Factset Source: Factset
Page 144 Deutsche Bank Securities Inc.

9 October 2017
Oil Services & Equipment
Initiation of coverage
Company description
Halliburton (HAL) is a leading multi-national oilfield services company with aparticularly strong presence in the US. At the peak of the last cycle, the companygenerated $16.8 billion of revenue from the US, making it the single largestoilfield service provider in the country, and representing about 51% of its total2014 revenues. Its Middle East/Asia geomarket was its second largest source ofrevenues at $5.8 billion, or 18% of total 2014 revenues.
The company has two reporting segments including Completion & Production(C&P) and Drilling & Evaluation (D&E). Over half of its revenues come fromC&P, which includes HAL’s industry leading hydraulic fracturing and cementingbusinesses. In D&E, Halliburton is top two in drilling fluids with its Baroidbusiness, directional drilling with its Sperry Drilling business, and wireline. HALprides itself on being the execution company and strives to structurally lowerboth its own cost structure as well as for its customers and raise efficiencies byleveraging its scale and vertical integration.
Figure 362: Reporting segments
Completion & Production Drilling & Evaluation
- Production Enhancement - Baroid
- Stimulation - Drilling and Completion Fluids
- Hydraulic Fracturing - Solids Control Equipment and Services
- Acidizing - Performance Additives
- Sand Control Services - Waste Management
- Microseismic - Sperry Drilling
- Cementing (zonal isolation) - Directional Drilling
- Cementing Services - Downhole Tools
- Casing Equipment - Geosteering Services
- Completion Tools - Measurement-while Drilling (MWD)
- Intelligent Well Completions - Logging-while-Drilling (LWD)
- Liner Hanger Systems - Surface Data Logging
- Sand Control Systems - Managed Pressure and Underbalanced
- Production Solutions and Well Intervention - Drill Bits and Services
- Coiled Tubing - Drill Bits
- Workover and Snubbing Units - Coring Equipment
- Thru Tubing Tools - Wireline and Perforating
- Slickline - Formation Evaluation (open-hole logging)
- Pipeline and Process Services - Cased-hole and Slickline Services
- Pre-commissioning and commissioning - Perforating
- Maintenance and Decommissioning - Pipe recovery (fishing)
- Onshore and Offshore - Well Assurance (integrity)
- Chemical Services - Plug and Abandonment
- Production Chemicals - Landmark Software and Services
- Stimulation Chemicals - Integrated Software and Data Management
- Midstream Solutions - Consulting and Project Management
- Artificial Lift - Reservoir Testing and Analysis
- Electric Submersible Pumps (ESP) - Drillstem Testing
- Progressive Cavity Pumps (PCP) - Fluid Sampling
- Remote Monitoring and Control - Surface Well Testing
Halliburton Co.
Source: Company reports
Deutsche Bank Securities Inc. Page 145

9 October 2017
Oil Services & Equipment
Initiation of coverage
Figure 363: HAL 2016 North America revenue mix
US land
81%
US Gulf of
Mexico
15%
Canada
4%
North America (NAM)
Source: Company reports, Deutsche Bank
Figure 364: HAL 2016 international revenue mix
Land
62%
Offshore
38%
International
Source: Company reports, Deutsche Bank
Page 146 Deutsche Bank Securities Inc.

9 October 2017
Oil Services & Equipment
Initiation of coverage
Principal Sources and Uses of Cash Flow
The US is Halliburton’s principal marketHAL generates an increasingly larger portion of its revenue from North Americaversus its peers given its leading position in that market and the cyclical recovery.For the past three years, the US itself has made up between 40-51% of totalrevenues for HAL, while no other individual country accounted for more than 10%.In terms of regions, North America peaked at 60% of total revenue in 1Q12 beforebriefly falling below 40% in 2Q16 as the downturn weighed on activity levels. Asthe NAM cyclical recovery accelerated and given the headwinds and seasonalityof its International operations in the first quarter, NAM accounted for 52% of totalrevenue in 1Q17, and then 56% in 2Q17.
Figure 365: Revenue mix by region
NAM
54%
LAM
12%
ECA
17%
MEA
17%
2014
E
14%
NAM
56%
LAM
10%
ECA
14%
MEA
20%
2Q17
Source: Deutsche Bank
HAL spent a lot of the 2000s building out its international footprint and leveragingits scale and product portfolio to be able to compete for integrated projectmanagement tenders globally. Middle East/ Asia averaged around 18% of totalrevenue over the past 10 years but had grown to 27% in 2016 as the Middle Eastwas more resilient in terms of activity and spending during the downturn and HALgained some market share in the region. Europe/ Africa/ CIS is the next largestregion accounting for about 20% of total revenue, but had slipped slightly to 19%in 2016. Lastly, Latin America has averaged around 13% of total revenue with2016 averaging closer to 12%.
Strategy is to leverage its vertical integrationHAL’s strategy is focused around driving down costs for their customers whilealso improving reservoir productivity and customer operational efficiencies. Thecompany seeks to increase equipment utilization and manage costs throughexpanding its surface efficiency model. It leverages its vertical integration tobuild new capacity at a lower cost than having to order it through an outsidemanufacturer and being able to wait longer to see how the cycle develops beforebuilding new capacity. Its ultimate goal is to pursue an asset light model that willbe able to adjust to what they company believes will be shorter cycles in NorthAmerica. HAL also looks to leverage its scale,
Deutsche Bank Securities Inc. Page 147

9 October 2017
Oil Services & Equipment
Initiation of coverage
technological capabilities, depth and breadth of product lines, and globalinfrastructure to win integrated project management work internationally.
Figure 366: Revenue mix by reporting segment
Completion
& Production
62%
Drilling &
Evaluation
38%
2014
on
tion
Completion
& Production
56%
Drilling &
Evaluation
44%
2016
Source: Company reports, Deutsche Bank
HAL’s strategy shifted early on in the US recovery as the company decided toleverage its leading US position by reactivating equipment faster than originallyexpected in order to win back market share. This part of the business is drivenby the rig and well count in the US, customer spend, pricing, and utilizationof its pressure pumping and related services business lines. C&P marginsshould continue to improve moving forward and start to contribute more tothe company’s overall operating income as customer spending on completionscontinues to increase. Given the lag in international markets compared to theUS recovery, the impact from pricing pressures as older contracts roll off,and in general more offshore weighted markets, headwinds should remain ininternational spending and activity in our view.
Figure 367: EBIT trends by reporting segment
0
1,000
2,000
3,000
4,000
5,000
6,000
2007 2008 2009 2010 2011 2012 2013 2014 2015 2016 2017 2018
(a) (a) (a) (a) (a) (a) (a) (a) (a) (a) (e) (e)
In m
illio
ns
of
USD
Completion & Production Drilling & Evaluation
Source: Company reports, Deutsche Bank
Page 148 Deutsche Bank Securities Inc.

9 October 2017
Oil Services & Equipment
Initiation of coverage
HAL’s asset exposure is heavily weighted to the USHAL is the second largest diversified oilfield services provider and operatesin approximately 70 countries, but has about half of its PP&E in the US. Thecompany’s C&P segment is focused on cementing, stimulation, intervention,pressure control, specialty chemicals, artificial lift, and completion services.Drilling and Evaluation (D&E) provides field and reservoir modeling, drilling,wellbore placement solutions, and well construction. Baroid (drilling fluids),Sperry Drilling (drilling systems), and Landmark software are some of thebusiness lines inside its D&E segment.
Figure 368: Annual segment revenues
0
5,000
10,000
15,000
20,000
25,000
2007 2008 2009 2010 2011 2012 2013 2014 2015 2016 2017 2018
(a) (a) (a) (a) (a) (a) (a) (a) (a) (a) (e) (e)
In m
illi
on
s o
f U
SD
Completion & Production Drilling & Evaluation
Source: Company reports, Deutsche Bank
C&P revenues were down 35% y/y in 2016 due to a decline in activity andpricing across the majority of the individual product lines in the segment butNAM pressure pumping drove the majority of the decline. International revenuedecreased due to lower well completion services and stimulation in all regions.C&P operating income was $107mm in 2016 down from $1.1bn in 2015 due tosimilar reasons that caused the revenue decline in the segment.
D&E revenues were down 30% y/y in 2016 due to lower rig counts, customerspending, and pricing. D&E operating income was $794mm in 2016, down from$1.5bn in 2015 due to similar reasons that caused the revenue decline. HAL calledout lower drilling and logging activity in the Middle East/ Asia region and reducedfluid services in Latin America. D&E revenue and operating income margins didnot fall as far as C&P did as it is more internationally weighted which tends tohave less cyclicality than North America given its longer contract terms and moreproject management oriented work.
Inside these businesses in its two segments, HAL has a leading position in manyof the individual product lines. HAL is known for its cementing, given that ishow the company got its start, so Spears & Associates estimates that HAL isthe market leader in cementing with about 40% global market share. In hydraulicfracturing, HAL is also the market leader at about 30% market share. In othercompletion related product lines HAL generally has a top 3 position. In its drillingproduct portfolio, HAL also generally holds a top 2 or 3 position in those productlines.
Deutsche Bank Securities Inc. Page 149

9 October 2017
Oil Services & Equipment
Initiation of coverage
Figure 369: Consolidated EBITDA Figure 370: Annual EPS
0
1,000
2,000
3,000
4,000
5,000
6,000
7,000
8,000
2007 2008 2009 2010 2011 2012 2013 2014 2015 2016 2017 2018 2019
(a) (a) (a) (a) (a) (a) (a) (a) (a) (a) (e) (e) (e)
In m
illio
ns
of
USD
(0.50)
0.00
0.50
1.00
1.50
2.00
2.50
3.00
3.50
4.00
4.50
2007 2008 2009 2010 2011 2012 2013 2014 2015 2016 2017 2018 2019
(a) (a) (a) (a) (a) (a) (a) (a) (a) (a) (e) (e) (e)
EPS
Source: Company reports, Deutsche Bank Source: Company reports, Deutsche Bank
Figure 371: Free cash flow and capex Figure 372: Free cash flow and dividends
(3,000)
(2,500)
(2,000)
(1,500)
(1,000)
(500)
0
500
1,000
1,500
2,000
(4,000)
(3,000)
(2,000)
(1,000)
0
1,000
2,000
3,000
4,000
5,000
2007 2008 2009 2010 2011 2012 2013 2014 2015 2016 2017 2018
(a) (a) (a) (a) (a) (a) (a) (a) (a) (a) (e) (e)
In m
illi
on
s o
f U
SD
Cash from operations Capital expenditures Free cash flow
(4,000)
(3,000)
(2,000)
(1,000)
0
1,000
2,000
2007 2008 2009 2010 2011 2012 2013 2014 2015 2016 2017 2018
(a) (a) (a) (a) (a) (a) (a) (a) (a) (a) (e) (e)
In m
illi
on
s o
f U
SD
Free cash flow Dividends paid
Source: Company reports, Deutsche Bank Source: Company reports, Deutsche Bank
Figure 373: Net debt Figure 374: Debt turns
0
1,000
2,000
3,000
4,000
5,000
6,000
7,000
8,000
9,000
2007 2008 2009 2010 2011 2012 2013 2014 2015 2016 2017 2018 2019
(a) (a) (a) (a) (a) (a) (a) (a) (a) (a) (e) (e) (e)
In m
illi
on
s o
f U
SD
0.0
1.0
2.0
3.0
4.0
5.0
6.0
2007 2008 2009 2010 2011 2012 2013 2014 2015 2016 2017 2018 2019
(a) (a) (a) (a) (a) (a) (a) (a) (a) (a) (e) (e) (e)
De
bt
turn
s
Source: Company reports, Deutsche Bank Source: Company reports, Deutsche Bank
Page 150 Deutsche Bank Securities Inc.

9 October 2017
Oil Services & Equipment
Initiation of coverage
Figure 375: Income Statement(a) (a) (a) (a) (a) (a) (a) (a) (e) (e) (e)
In millions of USD 2009 2010 2011 2012 2013 2014 2015 2016 2017 2018 2019
Segment revenues:
Completion & Production 7,419 9,997 15,143 17,380 17,506 20,253 13,721 8,882 12,536 14,258 14,843
Drilling & Evaluation 7,256 7,976 9,686 11,123 11,896 12,617 9,912 7,005 7,052 7,124 7,416
Total revenues 14,675 17,973 24,829 28,503 29,402 32,870 23,633 15,887 19,588 21,381 22,259
Segment EBIT:
Completion & Production 1,056 2,032 3,800 3,192 2,925 3,670 1,082 107 1,696 2,732 3,270
Drilling & Evaluation 1,231 1,263 1,431 1,675 1,789 1,740 1,506 794 560 845 1,139
Corporate G&A (205) (236) (377) (380) (429) (362) (267) (210) (278) (280) (280)
Total EBIT 2,082 3,059 4,854 4,487 4,285 5,048 2,321 691 1,979 3,297 4,129
Interest (expense) (297) (308) (268) (301) (331) (383) (410) (527) (501) (480) (476)
Interest income 12 11 5 5 0 0 0 0 0 0 0
Equity income 0 0 0 0 0 0 0 0 0 0 0
Other income (27) (26) (25) (41) (43) 0 (125) (208) (96) (70) (47)
PBT 1,770 2,736 4,566 4,150 3,911 4,665 1,786 (44) 1,382 2,748 3,606
Income tax (expense) (547) (850) (1,468) (1,355) (1,057) (1,243) (449) 22 (387) (811) (1,001)
Non-controlling interest (10) (7) (5) (10) (10) (1) (4) 6 0 0 0
Net income (operating) 1,213 1,879 3,093 2,785 2,844 3,421 1,333 (16) 995 1,937 2,605
Discontinued ops (9) 40 (166) 58 19 64 (5) (2) 0 0 0
Unusual after-tax (60) (84) (88) (208) (738) 15 (1,999) (6,126) (271) 0 0
Net income (GAAP) 1,144 1,835 2,839 2,635 2,125 3,500 (671) (6,144) 723 1,937 2,605
Operating EPS 1.34 2.06 3.35 3.00 3.15 4.02 1.56 (0.02) 1.14 2.22 2.99
GAAP EPS 1.27 2.01 3.08 2.84 2.36 4.11 (0.79) (7.13) 0.83 2.22 2.99
DPS 0.36 0.36 0.36 0.36 0.53 0.66 0.72 0.72 0.72 0.72 0.72
Diluted shares 902 911 922 928 902 851 854 862 871 872 872
EBITDA 3,013 4,178 6,213 6,115 6,185 7,174 4,156 2,194 3,514 4,810 5,629
EBITDA margin 20.5% 23.2% 25.0% 21.5% 21.0% 21.8% 17.6% 13.8% 17.9% 22.5% 25.3%
EBIT margin 14.2% 17.0% 19.5% 15.7% 14.6% 15.4% 9.8% 4.3% 10.1% 15.4% 18.5%
Tax rate 30.9% 31.1% 32.2% 32.7% 27.0% 26.6% 25.2% 50.0% 28.0% 29.5% 27.8%
Source: Deutsche Bank
Deutsche Bank Securities Inc. Page 151

9 October 2017
Oil Services & Equipment
Initiation of coverage
Figure 376: Cash Flow Statement(a) (a) (a) (a) (a) (a) (a) (a) (e) (e) (e)
In millions of USD 2009 2010 2011 2012 2013 2014 2015 2016 2017 2018 2019
Net income 1,213 1,879 3,093 2,785 2,844 3,421 1,333 (16) 995 1,937 2,605
Depreciation 931 1,119 1,359 1,628 1,900 2,126 1,835 1,503 1,535 1,513 1,500
Deferred tax 274 124 (30) 0 0 0 0 0 (216) 0 0
Chg in receivables 869 (902) (1,218) (682) (449) (1,375) 1,468 899 (554) (216) (109)
Chg in inventories 232 (331) (564) (611) 327 (247) 153 552 120 (46) 46
Chg in payables (118) 330 649 200 (107) 489 (603) (219) 362 45 (45)
Other (995) (7) 395 334 (68) (352) (1,280) (4,422) (281) (215) (40)
Cash from operations 2,406 2,212 3,684 3,654 4,447 4,062 2,906 (1,703) 1,961 3,018 3,956
Capital expenditures (1,864) (2,069) (2,953) (3,566) (2,934) (3,283) (2,184) (798) (1,275) (1,410) (1,468)
Free cash flow 542 143 731 88 1,513 779 722 (2,501) 686 1,607 2,488
Acquisitions (55) (523) (880) (214) (94) (231) (39) (31) 0 0 0
Asset sales 203 0 0 395 241 0 168 222 76 0 0
Dividends paid (324) (327) (330) (333) (465) (533) (614) (620) (626) (628) (628)
ESPP | options 30 0 160 107 277 332 167 0 0 0 0
Equity issuance, net (17) (141) (43) (33) (4,356) (800) 0 186 0 0 0
Debt issuance, net 1,944 (790) 978 0 2,968 0 7,440 (3,097) (1,391) (400) 0
Other (53) 295 181 (374) (212) 388 (58) (227) (2) 0 0
Chg in cash 2,270 (1,343) 797 (364) (128) (65) 7,786 (6,068) (1,257) 579 1,860
Source: Deutsche Bank
Page 152 Deutsche Bank Securities Inc.

9 October 2017
Oil Services & Equipment
Initiation of coverage
Figure 377: Balance Sheet(a) (a) (a) (a) (a) (a) (a) (a) (e) (e) (e)
In millions of USD 2009 2010 2011 2012 2013 2014 2015 2016 2017 2018 2019
Cash and equivalents 3,394 2,051 2,848 2,484 2,356 2,291 10,077 4,009 2,752 3,331 5,191
Accounts receivable 2,964 3,924 5,084 5,787 6,181 7,564 5,317 3,922 4,324 4,541 4,650
Inventories 1,598 1,940 2,570 3,186 3,305 3,571 2,417 2,275 2,158 2,204 2,158
Deferred taxes 210 257 321 0 0 0 0 0 0 0 0
Other current assets 472 714 754 1,629 1,862 1,642 3,798 1,471 1,524 1,601 1,639
Total current assets 8,638 8,886 11,577 13,086 13,704 15,068 21,609 11,677 10,759 11,676 13,638
Net PP&E 5,759 6,842 8,492 10,257 11,322 12,475 10,911 8,532 8,291 8,188 8,157
Goodwill 1,100 1,315 1,776 2,135 2,168 2,330 2,109 2,414 2,407 2,407 2,407
Other assets 1,041 1,254 1,832 1,932 2,029 2,367 2,313 4,377 4,495 4,719 4,833
Total assets 16,538 18,297 23,677 27,410 29,223 32,240 36,942 27,000 25,951 26,991 29,035
Accounts payable 787 1,139 1,826 2,041 2,365 2,814 2,019 1,764 2,130 2,176 2,130
Accrued expenses 514 716 862 930 1,029 1,033 838 544 612 642 658
Current debt 750 0 0 0 0 0 659 163 736 336 336
Other current liabilities 838 902 1,433 1,781 1,632 2,036 1,843 1,552 1,031 1,083 1,109
Total current liabilities 2,889 2,757 4,121 4,752 5,026 5,883 5,359 4,023 4,509 4,237 4,233
Long-term debt 3,824 3,824 4,820 4,820 7,816 7,840 14,687 12,214 10,416 10,416 10,416
Deferred taxes 0 0 0 0 0 0 0 0 0 0 0
Employee obligations 462 487 534 607 584 691 457 574 550 550 550
Other LT liabilities 606 842 986 1,441 2,182 1,528 944 741 984 1,033 1,058
Non-controlling int 29 14 18 25 34 31 33 39 36 36 36
Shareholders' equity 8,728 10,373 13,198 15,765 13,581 16,267 15,462 9,409 9,456 10,719 12,742
Total liabilities and equity 16,538 18,297 23,677 27,410 29,223 32,240 36,942 27,000 25,951 26,991 29,035
Total debt 4,574 3,824 4,820 4,820 7,816 7,840 15,346 12,377 11,152 10,752 10,752
Net debt 1,180 1,773 1,972 2,336 5,460 5,549 5,269 8,368 8,400 7,421 5,561
Debt/capital 34% 27% 27% 23% 37% 33% 50% 57% 54% 50% 46%
Debt/equity 52% 37% 37% 31% 58% 48% 99% 132% 118% 100% 84%
Debt turns 1.5 0.9 0.8 0.8 1.3 1.1 3.7 5.6 3.2 2.2 1.9
Source: Deutsche Bank
Deutsche Bank Securities Inc. Page 153

9 October 2017
Oil Services & Equipment
Initiation of coverage
Rating
HoldNorth AmericaUnited States
IndustrialsOil Services & Equipment
Company
Helmerich & Payne
Reuters Bloomberg
HP.N HP US
Navigating an industry in transitionInitiating coverage with a Hold rating and a $45 price targetWhile we believe the company is an industry leader in terms of fleet quality, fiscalstability and free cash flow performance, the higher cadence of more productivewells being drilled in the US is undermining the earnings power of the company.HP is the closest to a pure play US land driller amongst its peers, and while thecompany is tactically taking market share, we believe pricing power in the US willbe challenging as oil prices are confined to a range of $40 – 55 and the US rigcount is confined to only 6% growth in 2018.
Management sees its competitive edge being its inventory of rig upgradesWhile the peers are looking to reestablish themselves in the value chain byoffering a broader suite of service content and technology, HP’s ambition ismarket share. While the company is also actively investing in service content, itsfocus is on restoring its earnings power by upgrading at the lowest relative cost itsindustry leading inventory of 1,500hp AC-electric rigs to super-spec capabilities.The company has already added almost 500 basis points of market share, but asthe market flattens out in 2018, as we expect it will, we believe the cadence ofupgrades will slow and pricing power will ebb.
US Land earnings power downshifting from $1.5 billion to $0.9 billionDrilling more with less has bifurcated the market and has created a challengingpricing environment for HP. We believe it is unreasonable to assume it can restoreits daily margins to the $15,000 per day run rate even with its leading share insuper-spec rigs. We expect $10,000 per day to be at the high-end over the nextfew years. Assuming gains to 25% US market share, that takes our US LandEBITDA best case up to $0.9 billion.
ValuationOur $45 price target is 5.5x our estimateof the company’s normalized EBITDA of$0.9 billion, which is in-line with the 5.5xfive-year average multiple leading up tothe 2014 collapse in oil prices. The maininvestment risks include: 1) shifts in OPECpolicy and the influence that would have onoil prices and ultimately US upstream capitalexpenditures, 2) negative revisions to globaloil demand, 3) a dividend cut, and 4) a stepup in cost inflation in the US Land segment.
Forecasts and ratios
Year End Sep 30 2016A 2017E 2018E
1Q EPS 0.05 -0.41A -0.21
2Q EPS -0.28 -0.47A -0.26
3Q EPS -0.47 -0.25A -0.21
4Q EPS -0.33 -0.21 -0.12
FY EPS (USD) -1.03 -1.34 -0.79
OLD FY EPS (USD) – – –
% Change – – –
P/E (x) – – –
DPS (USD) 2.76 2.80 2.80
Dividend Yield (%) 5.0 5.4 5.4
Revenue (USDm) 1,405.3 1,737.8 2,001.0Source: Deutsche Bank estimates, company data
David HavensResearch [email protected]
Price at 5 Oct 2017 (USD) 52.17
Price target 45.00
52-week range 81.63 - 42.34
Price/price relative
Helmerich & Payne S&P 500 INDEX (Rebased)
Jan '15 May '15 Sep '15 Jan '16 May '16 Sep '16 Jan '17 May '17 Sep '1730
40
50
60
70
80
90
100
110
Performance(%)
1m 3m 12m
Absolute 18.9 -8.3 -21.1
S&P 500INDEX
2.5 4.5 18.0
Source: Deutsche Bank
Stock & option liquidity data
Market Cap (USDm) 5,660.2
Shares outstanding (m) 108.5
Free float (%) 100
Volume (5 Oct 2017) 346,654
Option volume (und. shrs., 1M avg.) 86,711Source: Deutsche Bank
Page 154 Deutsche Bank Securities Inc.

9 October 2017
Oil Services & Equipment
Initiation of coverage
Key investment themes
Largest inventory of low cost upgrades to super-spec capabilitiesImproved drilling efficiencies and enhanced completion designs have enabled USproducers to drill a higher cadence of more productive wells using fewer rigs. Thishas undermined the earnings power of the land drilling industry and has forcedits key players to devise strategies that will reestablish them in the value chain.For HP, market share is a core ambition. The company believes it can restore itsearnings power by upgrading more rigs than any of its peers to the preferredsuper-spec rig capabilities at the lowest relative cost.
Figure 378: HP has 122 rig upgrade candidates in inventory
Super-spec
capabilities
148
Upgrade
candidates
122
Other
56
Source: Company reports
HP currently has 350 land rigs in the US, of which 326 are 1,500hp AC-electricFlexRigs. The company has upgraded 148 of these to super-spec capabilities forabout $1-2 million apiece. Super-spec rigs are 1,500hp AC-electric rigs that arepad capable with 750,000 lb. hook loads, 7,500 psi mud systems with a third mudpump, a fourth engine and a 25,000-ft pipe racking capability.
Figure 379: US super-spec market share Figure 380: Inventory of super-spec upgrade candidates
EN
16%
HP
32%
PTEN
23%
NBR
16%
PD
13%
Other
16%
0
20
40
60
80
100
120
140
HP PTEN NBR PD
Rigs
Source: Company reports, Deutsche Bank Source: Company reports, Deutsche Bank
Deutsche Bank Securities Inc. Page 155

9 October 2017
Oil Services & Equipment
Initiation of coverage
HP has another 122 super-spec upgrade candidates, which is more than its threelargest peers combined. The cost to upgrade as the company reaches deeper intoits inventory is about $2-3 million each. The company does not intend to fund anymore newbuilds in the current environment, but we do expect a cadence of 15-20upgrades per quarter through early 2018.
Super-spec rigs are getting higher prices in select markets, but some frictionThe drilling more with less trend has bifurcated the US land rig market andhas eroded the marketability of mechanical and SCR rigs. Pricing power is nowreserved for the 1,500hp AC-electric and super-spec rigs that enable the drillingefficiencies that are in high demand in the Permian, Eagle Ford and SCOOP/STACK. Super-spec rigs in these regions are getting $2,000 more per day versusAC-electric rigs, and have achieved a leading edge rate of $20-22 kpd. But despitebeing above 90% utilization, super-spec pricing is flattening as the stream ofupgraded capacity comes into a flattening market. We expect the ebb and flow ofUS capex and the rehabilitation of US productivity to confine oil prices to a rangeof $40 – 55 and the US rig count to a mere 6% growth in 2018. We believe thiswill make pricing a challenge.
Figure 381: A bifurcated market Figure 382: Pricing will be challenging in 2018
0
100
200
300
400
500
600
700
800
900
Jan
-11
Ma
y-1
1
Se
p-1
1
Jan
-12
Ma
y-1
2
Se
p-1
2
Jan
-13
Ma
y-1
3
Se
p-1
3
Jan
-14
Ma
y-1
4
Se
p-1
4
Jan
-15
Ma
y-1
5
Se
p-1
5
Jan
-16
Ma
y-1
6
Se
p-1
6
Jan
-17
Ma
y-1
7
Rig
s
1,500+ HP 1,000-1,500 HP < 1,000 HP
12,000
14,000
16,000
18,000
20,000
22,000
24,000
Jan
-11
Ma
y-1
1
Se
p-1
1
Jan
-12
Ma
y-1
2
Se
p-1
2
Jan
-13
Ma
y-1
3
Se
p-1
3
Jan
-14
Ma
y-1
4
Se
p-1
4
Jan
-15
Ma
y-1
5
Se
p-1
5
Jan
-16
Ma
y-1
6
Se
p-1
6
Jan
-17
Ma
y-1
7
Da
yra
tes
1,500+ HP 1,000-1,500 HP
Source: Land Rig Newsletter Source: Land Rig Newsletter
Figure 383: Total US land drilling market share Figure 384: Market share of AC-electric rigs
HP
21%
PTEN
16%
NBR
11%PD
7%
Other
45% 13%
HP
29%
PTEN
20%NBR
16%
PD
8%
Other
27%
Source: Company reports, Baker Hughes, a GE company Source: Company reports
Page 156 Deutsche Bank Securities Inc.

9 October 2017
Oil Services & Equipment
Initiation of coverage
HP has taken almost 500 basis points of market share since the 2014 highsWhile the bifurcation of the US land drilling market should play right into thehands of the top four land drillers, HP has really been the primary driver of thegroup’s market share gains. While high customer demand for technologies thatenable improved drilling efficiencies prompted each of the top four to investin improving rig functionality, HP had the most momentum as the first moverexploiting a decade long competitive edge with its FlexRig designs. From anorganic growth perspective, HP’s leading market in 1,500hp AC-electric rigs andnow in super-spec rigs has enabled the company to increase its total US marketshare by 500 basis points to 21% from the 2014 highs. This is more than any ofits peers on an organic level, but when accounting for the acquisition of SeventySeven Energy by Patterson-UTI Energy, it ranks a close second.
Figure 385: Top 4 land drillers combined market share Figure 386: Market share gains since 2014 peak activity
55%
50%
0%
10%
20%
30%
40%
50%
60%
1Q
09
3Q
09
1Q
10
3Q
10
1Q
11
3Q
11
1Q
12
3Q
12
1Q
13
3Q
13
1Q
14
3Q
14
1Q
15
3Q
15
1Q
16
3Q
16
1Q
17
Top 4 adj. for PTEN/SSE Top 4 excl. SSE Top 3 peers
Excludes HP
0.0%
1.0%
2.0%
3.0%
4.0%
5.0%
6.0%
HP PTEN NBR PD
Organic market share gains Acquisitions
Source: Company reports, Deutsche Bank Source: Company reports, Deutsche Bank
Diminished earnings power in the US Land segmentOver the last ten years, the US Land segment has contributed 88% of thecompany’s total segment EBITDA. Benefitting from the rapid expansion in US landdrilling prompted by higher oil prices and the development of tight oil reserves,HP’s US Land segment achieved a high water mark EBITDA of $1.48 billion infiscal 2014. This corresponds to about $5.3 million per rig. EBITDA from thissegment has since plummeted with the decline in oil prices and we model abottom at about $377 million in fiscal 2017, or $2.4 million per rig.
We think the scarcity value in the US land drilling market has been eliminatedover the next cycle. Drilling more with less has bifurcated the market and hascreated a challenging pricing environment. We believe it will be tough for HP torestore its daily margins to the $15,000 per day run rate and expect $10,000 perday to be at the high-end over the next few years. The company has gained 500basis points of market share to 21% with ambitions for 25%. At that level andassuming upside to a daily margin of $10,000, HP’s US Land business can rebuildits EBITDA power to about $0.89 billion in our view.
Deutsche Bank Securities Inc. Page 157

9 October 2017
Oil Services & Equipment
Initiation of coverage
Figure 387: HP US Land segment EBITDA sensitivity to changes in rig count and daily margin
Daily
margin 100 125 150 175 200 225 250 275 300 325 350
15,000$ 490 625 760 895 1,030 1,165 1,300 1,435 1,570 1,705 1,840
14,000$ 454 580 706 832 958 1,084 1,210 1,336 1,462 1,588 1,714
13,000$ 418 535 652 769 886 1,003 1,120 1,237 1,354 1,471 1,588
12,000$ 382 490 598 706 814 922 1,030 1,138 1,246 1,354 1,462
11,000$ 346 445 544 643 742 841 940 1,039 1,138 1,237 1,336
10,000$ 310 400 490 580 670 760 850 940 1,030 1,120 1,210
9,000$ 274 355 436 517 598 679 760 841 922 1,003 1,084
8,000$ 238 310 382 454 526 598 670 742 814 886 958
7,000$ 202 265 328 391 454 517 580 643 706 769 832
6,000$ 166 220 274 328 382 436 490 544 598 652 706
Rig working
Source: Deutsche Bank
The dividend is manageable, but a threat depending on strategyHP’s dividend has polarized the stock. The roll-off of legacy priced contracts tospot market pricing created a lot of concern that the resulting plunge in averagedaily margins would prompt the company to cut its dividend. With daily spotmargins less than $4,000 per day and with half of the contracted rigs on termcommitments, the concern gained steam. The company has since disclosed itsexpected annual rig margin per day for its long-term contracts for fiscal 2018,2019 and 2020 at $13,000, $14,500 and $15,500 respectively.
Assuming capex of $350-400 million in 2018 and $325 million in 2019, and nomajor cash outlays for M&A, the dividend is manageable in our view. But themargin is thin enough that the threat may linger. The company has been clear itwill not issue debt to maintain the dividend.
Figure 388: US Land segment daily margin mix
$0
$2,000
$4,000
$6,000
$8,000
$10,000
$12,000
$14,000
$16,000
(e) (e) (e) (e) (e) (e) (e) (e) (e)
4Q18 1Q19 2Q19 3Q19 4Q19 1Q20 2Q20 3Q20 4Q20
Daily spot margin Daily term margin Daily margin
Source: Deutsche Bank
Page 158 Deutsche Bank Securities Inc.

9 October 2017
Oil Services & Equipment
Initiation of coverage
Figure 389: HP has the leading dividend yield Figure 390: Helmerich & Payne annual dividend
0.0
1.0
2.0
3.0
4.0
5.0
6.0
7.0
HP NBR SLB OII CLB BHI HAL SLCA ESV NOV PTEN
Div
ide
nd
yie
ld (
%)
0.00
0.50
1.00
1.50
2.00
2.50
3.00
20
03
20
04
20
05
20
06
20
07
20
08
20
09
20
10
20
11
20
12
20
13
20
14
20
15
20
16
20
17
20
18
20
19
(a) (a) (a) (a) (a) (a) (a) (a) (a) (a) (a) (a) (a) (a) (e) (e) (e)
Div
ide
nd
s p
er
sha
re
Source: Company reports, Deutsche Bank Source: Company reports, Deutsche Bank
Valuation and risksWe are initiating coverage of Helmerich & Payne with a $45 price target. This is5.5x our estimate of the company’s normalized EBITDA of $0.9 billion, which isin-line with the 5.5x five-year average multiple leading up to the 2014 collapsein oil prices. The company is currently trading at 12x our fiscal 2018 EBITDAestimate of $0.45 billion, and 10x our 2019 EBITDA estimate of $0.55 billion. Weexpect valuations will continue to consolidate as markets reassess the earningspower of the industry and the company due to the unprecedented influence USoil production is having on global oil prices and drilling activity.
The main investment risks include: 1) shifts in OPEC policy and the influencethat would have on oil prices and ultimately US upstream capital expenditures,2) negative revisions to global oil demand, 3) a dividend cut, and 4) a step up incost inflation in the US Land segment.
Figure 391: The EV/EBITDA valuation band as blown out Figure 392: The 5yr EV/EBITDA leading up to 2014
-
5
10
15
20
25
Jan-10 Jan-11 Jan-12 Jan-13 Jan-14 Jan-15 Jan-16 Jan-17
-1 std 5-yr avg +1 std
5.5
3
4
5
6
7
8
9
Jan
-10
Ap
r-1
0
Jul-
10
Oct
-10
Jan
-11
Ap
r-1
1
Jul-
11
Oct
-11
Jan
-12
Ap
r-1
2
Jul-
12
Oct
-12
Jan
-13
Ap
r-1
3
Jul-
13
Oct
-13
Jan
-14
Ap
r-1
4
Jul-
14
Oct
-14
-1 std 5yr avg +1 std
Source: Factset Source: Factset
Deutsche Bank Securities Inc. Page 159

9 October 2017
Oil Services & Equipment
Initiation of coverage
Company description
Helmerich & Payne (HP) is the largest land drilling company in the US whereit has a fleet of 350 land rigs and 21% market share. The company has threereporting segments: US Land, International Land and Offshore. The US Landsegment accounted for 73% of 2016 revenues and consists almost exclusivelyof HP’s proprietary FlexRigs. International Land was 16% of 2016 revenues andconsists of 38 land rigs in South America and the Middle East. Offshore was 10%of 2016 revenues and includes eight platform rigs in the Gulf of Mexico.
Figure 393: Company reporting segments
US Land International Land
- Land drilling - 348 land rigs - Land drilling - 38 land rigs
- Tubular runnning services - Argentina - 19 - Bahrain - 3
- Directional drilling services (MOTIVE) - Colombia - 8 - UAE - 2
- Rotary steerable systems (TerraVici) - Ecuador - 6
Offshore Other
- Fleet 8 platform rigs in the US Gulf of Mexico - Commercial real estate (Tulsa, OK)
- Terra Vici Drilling Solutions (rotary steerables)
- MOTIVE (bit guidance systems)
Helmerich & Payne
Source: Deutsche Bank
HP is also acquiring and developing service content for its rigs. In addition toproviding tubular running services (TRS) on half of its rigs in the Permian, thecompany recently acquired MOTIVE, which has developed a bit guidance systemfor directional drilling applications. Through its subsidiary Terra Vici DrillingSolutions, HP has also been developing rotary steerable technology. The companyintends to develop increasingly more service content in order to rebuild earningspower.
Figure 394: Revenues by reporting segment
US Land
83%
Offshore
7%
International
10%
Other
0%
2014
US Land
73%
Offshore
10%
International
16%
Other
1%
2016
Source: Company reports
Page 160 Deutsche Bank Securities Inc.

9 October 2017
Oil Services & Equipment
Initiation of coverage
Principal Sources and Uses of Cash Flow
Helmerich & Payne’s core business is land drilling and its principal market is theUS. For almost 20 years, the company has focused on the development of itsproprietary FlexRig designs which offer enhanced mobility and faster rates ofpenetration (ROP). The company established a significant competitive edge withthese rigs that it exploited for almost a decade until its peers began offering similarrig functionalities in response to strong customer demand.
Figure 395: FlexRig newbuild program delivered 392 rigs since the FlexRig1Global newbuild program USA Argentina Colombia Ecuador Bahrain UAE Retired Total
FlexRig1 0 0 0 0 0 0 6 6
FlexRig2 0 0 0 0 0 0 12 12
FlexRig3 218 11 2 0 0 2 0 233
FlexRig4 78 4 3 0 3 0 0 88
FlexRig5 52 0 1 0 0 0 0 53
Total newbuilds 348 15 6 0 3 2 18 392
Source: Company reports, as of fiscal 3Q17, Deutsche Bank
We estimate the company has spent close to $7 billion on the design andconstruction of over 390 FlexRigs since the original six FlexRig1s were deliveredin the late 1990s. The company now has 348 FlexRigs in the US and 26 ininternational markets. Included in the US rig fleet are 326 of the preferred 1,500hpAC-electric rigs, of which 148 are super-spec rigs.
Figure 396: Organic fleet growth
96 111
127 130 128 151
193
224
254 257
281
320 340
374 390 395 397
-
50
100
150
200
250
300
350
400
450
2001 2002 2003 2004 2005 2006 2007 2008 2009 2010 2011 2012 2013 2014 2015 2016 2017
US Land Int'l Land Offshore
Source: Company reports, Deutsche Bank
The US Land segment has contributed 88% of the EBITDA over last ten yearsHelmerich & Payne is one of the only principal players in the US land market thathas been a high growth company. Over the ten years leading up to the collapsein oil prices in 2014, EBITDA from its US Land segment had increased ten-fold.Contributing to this growth was a three-fold increase in fleet size and a three-foldincrease in US daily rig margins. While the company has invested in a relativelysmall international presence, the US land drilling business will likely continue asthe principal source of cash flow.
Deutsche Bank Securities Inc. Page 161

9 October 2017
Oil Services & Equipment
Initiation of coverage
Figure 397: Helmerich & Payne segment EBITDA
0
200
400
600
800
1,000
1,200
1,400
1,600
1,8002
00
3
20
04
20
05
20
06
20
07
20
08
20
09
20
10
20
11
20
12
20
13
20
14
20
15
20
16
20
17
20
18
20
19
(a) (a) (a) (a) (a) (a) (a) (a) (a) (a) (a) (a) (a) (a) (e) (e) (e)
In m
illi
on
s o
f U
SD
US Land Offshore International
Source: Company reports, Deutsche Bank
Drilling more with less undermines rig pricingHP realized leading edge pricing during the upswing of tight oil development withmulti-year commitments that reached in some cases above $30 kpd. Scarcityvalue was high as rigs were stretched between development work, hold-by-production (HBP) operations and exploration. The surge in high-yield debt andequity issuances funded a proliferation of capital spending with a high urgencyto secure high-specification rigs that could enable higher drilling efficiencies andlower well costs. One of the key outcomes was a 50% increase in the number ofwells a high-specification rig could spud per year.
Figure 398: HP average daily revenues and margins in US Land
-
5,000
10,000
15,000
20,000
25,000
30,000
35,000
1Q
03
4Q
03
3Q
04
2Q
05
1Q
06
4Q
06
3Q
07
2Q
08
1Q
09
4Q
09
3Q
10
2Q
11
1Q
12
4Q
12
3Q
13
2Q
14
1Q
15
4Q
15
3Q
16
2Q
17
2Q
18
Average dayrate Average daily margin
Source: Company reports, Deutsche Bank
Now with a higher cadence of more productive wells being drilled with less capitaland fewer rigs, industry pricing has lost the scarcity value. We do not expect HPor the industry will be able to recover the same level of pricing power until oilmarkets rebalance.
Page 162 Deutsche Bank Securities Inc.

9 October 2017
Oil Services & Equipment
Initiation of coverage
Lackluster outlook for international land opportunitiesWe do not expect the contribution from the International Land segment to changemuch for HP. Argentina is its primary source of international cash flow with 12 ofits 19 rigs in the country contracted. We expect HP’s International Land segmentto contribute less than $40 million of EBITDA in 2018.
Figure 399: International rigs working vs available
-
5
10
15
20
25
30
35
40
45
1Q
03
3Q
03
1Q
04
3Q
04
1Q
05
3Q
05
1Q
06
3Q
06
1Q
07
3Q
07
1Q
08
3Q
08
1Q
09
3Q
09
1Q
10
3Q
10
1Q
11
3Q
11
1Q
12
3Q
12
1Q
13
3Q
13
1Q
14
3Q
14
1Q
15
3Q
15
1Q
16
3Q
16
1Q
17
Rigs available Rigs working
Source: Company reports, Deutsche Bank
Figure 400: International Land EBITDA
-
20
40
60
80
100
120
140
160
(a) (a) (a) (a) (a) (a) (a) (a) (a) (a) (a) (a) (a) (a) (e) (e)
2003 2004 2005 2006 2007 2008 2009 2010 2011 2012 2013 2014 2015 2016 2017 2018
In m
illio
ns
of
US
D
Source: Company reports, Deutsche Bank
HP does not intend to fund any more newbuilds in this environmentThe company has had a long track record in investing in newbuilds. About 80% ofthe company’s cumulative capex over the past ten years has been directed to itsFlexRig program. Due to the uncertain environment, the company is opting out ofthe newbuild market and is focusing on upgrades of its remaining 122 candidaterigs at approximately $2-3 million apiece.
Deutsche Bank Securities Inc. Page 163

9 October 2017
Oil Services & Equipment
Initiation of coverage
Figure 401: Income Statement(a) (a) (a) (a) (a) (a) (a) (a) (e) (e) (e)
In millions of USD 2009 2010 2011 2012 2013 2014 2015 2016 2017 2018 2019
Segment revenues:
US Land 1,441 1,412 2,101 2,678 2,785 3,100 2,320 1,024 1,397 1,652 1,790
Offshore 205 203 201 189 222 251 241 139 135 133 135
International 237 254 227 270 367 356 368 230 191 199 231
Other 11 13 15 14 13 13 14 13 15 17 17
Total revenues 1,894 1,882 2,544 3,152 3,387 3,720 2,943 1,405 1,738 2,001 2,173
Segment EBITDA:
US Land 761 616 959 1,240 1,324 1,482 1,015 396 377 473 566
Offshore 67 66 60 55 67 82 79 29 37 37 38
International 21 77 48 51 81 76 79 44 29 37 45
Corp, other (36) (50) (59) (68) (78) (81) (85) (88) (93) (98) (97)
EBITDA 813 708 1,008 1,278 1,393 1,559 1,088 382 351 450 551
D&A 236 267 313 388 456 507 570 560 544 551 545
EBIT 577 441 695 890 937 1,052 518 (179) (193) (101) 7
Interest (expense) (13) (17) (17) (9) (6) (5) (15) (23) (24) (25) (25)
Interest income 5 2 2 1 2 2 6 3 5 5 3
Equity income 0 0 0 0 0 0 0 0 0 0 0
Other income 1 1 (1) 0 (0) (1) (1) (0) (1) (4) (4)
PBT 569 427 679 883 933 1,048 508 (199) (213) (125) (19)
Income tax (expense) (229) (153) (245) (323) (323) (370) (181) 89 67 40 6
Non-controlling interest 10 0 0 0 0 0 0 0 0 0 0
Preferred dividends 0 0 0 0 0 0 0 0 0 0 0
Net income (operating) 350 274 434 560 610 679 327 (110) (146) (86) (13)
Discontinued ops 0 (102) (0) 7 15 (0) (0) (4) 0 0 0
Unusual after-tax 4 (16) 4 13 111 30 96 57 16 0 0
Net income (GAAP) 354 157 437 581 736 709 422 (57) (129) (86) (13)
Operating EPS 3.28 2.56 4.00 5.17 5.66 6.20 2.98 (1.03) (1.34) (0.79) (0.12)
GAAP EPS 3.32 1.46 4.03 5.36 6.83 6.48 3.86 (0.54) (1.19) (0.79) (0.12)
DPS 0.20 0.21 0.26 0.28 0.87 2.44 2.75 2.76 2.80 2.80 2.80
Diluted shares 107 107 109 108 108 109 108 108 108 109 109
EBITDA margin 42.9% 37.6% 39.6% 40.5% 41.1% 41.9% 37.0% 27.2% 20.2% 22.5% 25.4%
EBIT margin 30.5% 23.5% 27.3% 28.2% 27.7% 28.3% 17.6% -12.7% -11.1% -5.0% 0.3%
Tax rate 40.3% 35.8% 36.1% 36.6% 34.6% 35.3% 35.7% 44.7% 31.6% 31.6% 31.6%
US Land Drilling:
Rigs working 132 151 202 236 243 276 208 101 156 197 209
Rigs available 194 207 236 265 295 321 337 340 348 350 350
Utilization 68% 73% 86% 89% 82% 86% 62% 30% 45% 56% 60%
Daily revenue 28,194 23,909 25,809 27,737 28,197 28,096 27,528 25,448 22,051 20,585 21,029
Daily margin 16,185 11,621 13,320 14,715 15,169 15,038 14,045 12,050 7,502 7,333 8,133
International Land Drilling:
Rigs working 20 20 18 20 24 23 20 15 12 15 17
Rigs available 30 34 25 26 29 30 39 38 38 38 38
Utilization 68% 60% 70% 77% 83% 76% 52% 39% 32% 38% 44%
Daily revenue 29,650 33,116 31,633 32,998 37,246 37,117 44,183 39,044 40,415 36,172 36,172
Daily margin 3,657 11,128 8,217 7,474 9,657 9,839 10,645 10,625 7,786 8,472 8,472
Source: Deutsche Bank
Page 164 Deutsche Bank Securities Inc.

9 October 2017
Oil Services & Equipment
Initiation of coverage
Figure 402: Cash Flow Statement(a) (a) (a) (a) (a) (a) (a) (a) (e) (e) (e) (e)
In millions of USD 2009 2010 2011 2012 2013 2014 2015 2016 2017 2018 2019 2020
Net income 350 274 434 560 610 679 327 (110) (146) (87) (16) 19
Depreciation 236 267 313 388 456 507 570 560 544 551 545 535
Deferred tax 158 106 188 197 30 27 132 60 (28) 0 0 0
Chg in receivables 217 (224) (3) (160) (5) (84) 256 73 (74) (19) (28) (12)
Chg in inventories (12) (4) (11) (22) (12) (17) (22) 2 (13) (4) (4) (4)
Chg in payables (29) 17 17 55 (52) (21) (71) (11) 43 4 4 4
Other (24) 26 40 (17) (28) 28 229 179 21 8 12 5
Cash from operations 897 462 978 1,000 997 1,119 1,419 754 347 452 512 548
Capital expenditures (881) (330) (694) (1,098) (809) (953) (1,133) (257) (400) (368) (324) (311)
Free cash flow 17 133 283 (97) 188 166 285 496 (54) 84 188 236
Acquisitions (0) 0 (4) 0 0 0 0 0 (70) 0 0 0
Asset sales 9 8 27 40 28 31 23 22 18 0 0 0
Dividends paid (21) (22) (27) (30) (93) (264) (298) (300) (305) (304) (304) (304)
ESPP | options 1 (0) 15 3 13 23 3 1 10 0 0 0
Equity issuance, net 0 0 0 (78) 0 0 (60) 0 0 0 0 0
Debt issuance, net 23 (165) (10) (115) (40) (115) 452 (41) 0 0 0 0
Other 4 (44) 16 9 255 73 (1) 8 (2) 0 0 0
Chg in cash 32 (91) 301 (268) 352 (87) 403 186 (403) (220) (116) (68)
Source: Deutsche Bank
Figure 403: Balance Sheet(a) (a) (a) (a) (a) (a) (a) (a) (e) (e) (e) (e)
In millions of USD 2009 2010 2011 2012 2013 2014 2015 2016 2017 2018 2019 2020
Cash and equivalents 154 63 364 96 448 361 764 950 547 327 211 143
Accounts receivable 247 458 461 620 621 705 449 375 452 471 500 511
Inventories 45 43 54 79 89 106 129 124 140 144 148 152
Other current assets 77 89 77 100 100 105 97 123 61 63 67 69
Total current assets 523 653 956 895 1,258 1,277 1,439 1,573 1,200 1,006 926 876
Net PP&E 3,266 3,275 3,677 4,352 4,676 5,189 5,567 5,145 5,025 4,842 4,622 4,398
Goodwill 0 0 0 0 0 0 0 0 52 52 52 52
Other assets 895 990 1,327 1,370 1,589 1,533 1,585 1,687 1,351 1,160 1,085 1,037
Total assets 4,161 4,265 5,004 5,721 6,265 6,722 7,152 6,832 6,428 6,054 5,759 5,486
Accounts payable 70 81 104 159 144 182 111 95 139 143 147 151
Current debt 105 0 115 40 115 40 39 0 0 0 0 0
Other current liabilities 127 152 198 182 193 285 201 235 204 213 225 231
Total current liabilities 302 233 417 381 452 508 351 330 343 355 372 381
Long-term debt 420 360 235 195 80 40 492 492 493 493 493 493
Other LT liabilities 1,058 1,098 1,499 1,691 1,741 1,791 1,762 1,779 1,784 1,802 1,826 1,838
Shareholders' equity 2,683 2,807 3,270 3,835 4,444 4,891 4,897 4,561 4,151 3,760 3,440 3,155
Total liabilities and equity 4,161 4,265 5,004 5,721 6,265 6,722 7,152 6,832 6,428 6,054 5,759 5,486
Total debt 525 360 350 235 195 80 532 492 493 493 493 493
Net debt 371 297 (14) 139 (253) (281) (232) (458) (54) 165 281 349
Debt/capital 16% 11% 10% 6% 4% 2% 10% 10% 11% 12% 13% 14%
Debt/equity 20% 13% 11% 6% 4% 2% 11% 11% 12% 13% 14% 16%
Debt turns 0.6 0.5 0.3 0.2 0.1 0.1 0.5 1.3 1.4 1.1 0.9 0.8
Source: Deutsche Bank
Deutsche Bank Securities Inc. Page 165

9 October 2017
Oil Services & Equipment
Initiation of coverage
Rating
HoldNorth AmericaUnited States
IndustrialsOil Services & Equipment
Company
Nabors Industries
Reuters Bloomberg
NBR.N NBR US
A focus on technology and servicecontentInitiating coverage with a Hold rating and a $9 price targetNBR is looking to restore its earnings power by driving its integration andautomation efforts, added service content, and cost reductions. The company isalso focusing on increasing revenues from services closely aligned to its drillingrigs, e.g. directional drilling, automated tubular handling and casing. We believeNBR has good line-of-sight to restoring EBITDA to $1.4 – 1.5 billion in the 2020timeframe, but we believe the company will fall short of its net debt reduction to$2.2 billion by 2020.
NBR intends to extract more value from its existing rigs to restore EBITDANBR’s core strategy is to extract more value from its large installed base of landrigs by increasing the penetration and scale of Nabors Drilling Solutions (NDS)on its rigs and by displacing third-party services. Ultimately, NBR is looking torestore its earnings power without having to depend on the industry returning topeak drilling activity. NBR sees $200-250 million of EBITDA opportunity with thelargest piece of the daily margin upside in wellbore placement services.
Virtually every NBR rig in the US as at least one NDS service on it nowAbout 60% of its US rigs have two services, and more than half of its internationalrigs as at least one NDS service. The company just received qualification forwellbore placement in Saudi Arabia, which NBR believes will be the big driver ofNDS penetration outside of the US lower-48. NDS hit an annual EBITDA run rateof $30m in 2Q17 and is targeting a $50m run rate by 4Q17.
ValuationOur $9 price target is 5.0x our estimate ofthe company’s normalized EBITDA of $1.3billion, which is in-line with the 5.0x five-year average multiple leading up to the2014 collapse in oil prices. Valuations haveconsolidated due to the high leverage inour view as markets reassess the earningspower, but also the probability that NBRcan reduce net debt meaningfully usingcash from operations. The main investmentrisks include: 1) shifts in OPEC policyand the influence that would have on oilprices and ultimately US upstream capitalexpenditures, 2) negative revisions to globaloil demand, 3) an equity raise to reducedebt, and 4) a derailing of its efforts toincrease the scale and penetration of itsNDS services that would lead to a negativerevision in earnings.
Forecasts and ratios
Year End Dec 31 2016A 2017E 2018E
1Q EPS -0.29 -0.49A -0.22
2Q EPS -0.26 -0.38A -0.17
3Q EPS -0.36 -0.33 -0.10
4Q EPS -0.30 -0.27 -0.03
FY EPS (USD) -1.21 -1.47 -0.51
OLD FY EPS (USD) -1.22 -1.37 -0.10
% Change -1.4% 7.6% 409.4%
P/E (x) – – –
DPS (USD) 0.24 0.24 0.24
Dividend Yield (%) 2.3 3.0 3.0
Revenue (USDm) 2,227.8 2,565.7 3,264.9Source: Deutsche Bank estimates, company data
David HavensResearch [email protected]
Price at 5 Oct 2017 (USD) 7.99
Price target 9.00
52-week range 18.19 - 6.27
Price/price relative
Nabors Industries S&P 500 INDEX (Rebased)
Jan '15 May '15 Sep '15 Jan '16 May '16 Sep '16 Jan '17 May '17 Sep '170
5
10
15
20
25
30
Performance(%)
1m 3m 12m
Absolute 18.2 -9.4 -34.6
S&P 500INDEX
2.5 4.5 18.0
Source: Deutsche Bank
Stock & option liquidity data
Market Cap (USDm) 2,226.3
Shares outstanding (m) 278.6
Free float (%) 100
Volume (5 Oct 2017) 1,505,147
Option volume (und. shrs., 1M avg.) 324,263Source: Deutsche Bank
Page 166 Deutsche Bank Securities Inc.

9 October 2017
Oil Services & Equipment
Initiation of coverage
Key investment themes
Evolving to reestablish the company in the value chainImproved drilling efficiencies and enhanced completion designs have enabled USproducers to drill a higher cadence of more productive wells using fewer rigs. Thishas undermined the earnings power of the land drilling industry and has forcedits key players to devise strategies that will reestablish them in the value chain.For NBR, the core focus is not market share, it is on technology initiatives andservice content to enhance its global rig margins.
NBR intends to extract more value from its existing installed baseNBR’s core strategy as it navigates the transition in the land drilling industryis to extract more value from its large installed base of land rigs by increasingthe penetration and scale of Nabors Drilling Solutions (NDS) on its rigs and bydisplacing third-party services. Ultimately, NBR is looking to restore its earningspower without having to depend on the industry returning to peak drilling activity.Initially the company plans to extract higher margins from its global rig fleet bypushing price and controlling costs, which includes making crews more efficientby using its NDS applications and automation. Beyond that, NBR intends to drivepenetration of its NDS services across the US as well as a strong focus on itsinternational markets, which are now 45% of the company’s active rig count. Inthe end, full drilling automation is NBR’s objective.
Figure 404: Nabors Drilling Solutions (NDS) is core to extracting morevalue
Source: Nabors Industries
NDS penetration is key variable for restoring earnings powerNBR sees about $200-250 million of EBITDA opportunity if it can extract morevalue from its existing rig base. The largest piece of the daily margin upsideis wellbore placement services, which NBR believes is half of the total dailymargin opportunity. This consists of the company’s AccuSteer MWD and its RSStool. Managed pressure drilling (MPD) is about 25% of the opportunity with theremainder in performance drilling tools and other services.
Deutsche Bank Securities Inc. Page 167

9 October 2017
Oil Services & Equipment
Initiation of coverage
Virtually every NBR rig in the US has at least one NDS service on it, and about60% have two services. More than half of NBR’s international rig fleet as at leastone NDS service. The company just received qualification for wellbore placementin Saudi Arabia, which NBR believes will be the big driver of NDS penetrationoutside of the US lower-48. In terms of directional drilling in the US, NBR hasabout 20% penetration, which means it can execute jobs on 27 rigs, with the goalof 44 by the end of the year.
NDS hit an annual EBITDA run rate of $30m in 2Q17 and is targeting a $50m runrate by 4Q17. We believe NBR will use acquisitions to reach its goal, a few ofwhich have already been done (Tesco Corporation and Robotics Drilling SystemsAS). Ultimately the target is $200-250 million by 2020.
Figure 405: Nabors Drilling Solutions (NDS) EBITDA opportunity
(1) Assumes $1,000 of EBITDA margin/service/rig and 80% utilization
$100-125m $160-200m
$200-250m
110-140
$150-175m
3
170-200
140-170
# of global rigs
with services
Number of $1,000 margin services per rig (1)
$250-290m
$125-150m
$350-410m
$285-350m
$225-285m
5 7
Source: Company reports, Deutsche Bank
Over the last eight years, NBR’s global weighted daily rig margin has been ina range of $10,000 – 15,000 per day (figure 408). Assuming the company canachieve its daily margin enhancement goals, the company can see a globalweighted margin of $14,500 and an earnings power of $1.6 billion by 2020 at a rigcount that is 80% of its highs in 2014. We believe the key headwind will be pricingand execution. There are too many competitors that are market share driven andthat are being aggressive on pricing. While the $1.6 billion is achievable in a robustmarket in our view, we believe industry conditions will confine the upside closer$1.4 – 1.5 billion.
Figure 406: NBR EBITDA sensitivity to global rig count and daily margins
Note: EBITDA is in million of USD
Weighted global
margin ($'000)
Nabors global rig years
270 295 320
$13.0 $1,320 $1,440 $1,560
$16.0 $1,620 $1,760 $1,900
$14.5 $1,470 $1,600 $1,730
Source: Company reports, Deutsche Bank
Page 168 Deutsche Bank Securities Inc.

9 October 2017
Oil Services & Equipment
Initiation of coverage
Figure 407: NBR global rig years Figure 408: NBR global weighted daily margins
205
268
334
394 431
406 432
291 319
360 373 349
374
261
172
215
261 294
0
50
100
150
200
250
300
350
400
450
500
20
02
20
03
20
04
20
05
20
06
20
07
20
08
20
09
20
10
20
11
20
12
20
13
20
14
20
15
20
16
20
17
20
18
20
19
(a) (a) (a) (a) (a) (a) (a) (a) (a) (a) (a) (a) (a) (a) (a) (e) (e) (e)
USA Canada International
0
2,000
4,000
6,000
8,000
10,000
12,000
14,000
16,000
2010 2011 2012 2013 2014 2015 2016 2017 2018 2019
(a) (a) (a) (a) (a) (a) (a) (e) (e) (e)
$/day
Source: Company reports, Deutsche Bank Source: Company reports, Deutsche Bank
NBR is placing another 23 super-spec rigs into service through 1Q18Since 2005, NBR has been retiring its legacy rigs and building out its proprietaryPACE (programmable AC-electric) rig fleet. The company now has 163 PACE rigsin the US, 77 of which are super-spec rigs that are earnings premiums as high as$2,000 per day over 1,500hp AC-electric rigs. NBR is placing another 23 super-spec rigs into service through 1Q18, seven of which are $18-19 million newbuildsand 16 that are $2-4 million upgrades. But NBR does not intend to fund anymore newbuilds for the US, and there are limited number of suitable upgradecandidates left in its fleet.
Figure 409: Nabors US Lower-48 rig fleet
US Lower 48 rig fleet Walking Skidding Total pad Not pad Total rigs % pad
PACE-X 46 0 46 0 46 100%
PACE-M800 6 0 6 0 6 100%
PACE-B 28 0 28 1 29 97%
PACE-S 9 2 11 0 11 100%
PACE-F 4 6 10 8 18 56%
PACE M550 30 8 38 18 56 68%
Other AC rigs 12 4 16 1 17 94%
Total AC rigs 135 20 155 28 183 85%
SCR rigs 3 5 8 16 24 33%
Total US Lower 48 rigs 138 25 163 44 207 79%
Source: Company reports
NBR is focused on reducing leverageA primary overhang for NBR has been its leverage. The company closed 2Q17 withdebt turns of 7.0x and total net debt of $3.5 billion. The company has committed toreducing net debt to $2.2 billion by 2020, however this requires a robust recoveryto realize this degree of pay down. While we believe there is line of sight toNBR’s EBITDA ambitions, we do not have line of sight on its $1.3 billion net debtreduction plans. We estimate the company will be free cash flow negative in 2017by about $0.4 billion and by about $0.1 billion in 2018. We expect a positive pivotin 2019, but not enough to get it to a net debt of $2.2 billion in 2020. We believethere will have to be an alternative strategy to achieving this goal.
Deutsche Bank Securities Inc. Page 169

9 October 2017
Oil Services & Equipment
Initiation of coverage
Figure 410: NBR free cash flow and dividends paid Figure 411: NBR debt turns
(800)
(600)
(400)
(200)
0
200
400
600
20
02
20
03
20
04
20
05
20
06
20
07
20
08
20
09
20
10
20
11
20
12
20
13
20
14
20
15
20
16
20
17
20
18
20
19
(a) (a) (a) (a) (a) (a) (a) (a) (a) (a) (a) (a) (a) (a) (a) (e) (e) (e)
In m
illi
on
s o
f U
SD
Free cash flow Dividends paid
0.0
1.0
2.0
3.0
4.0
5.0
6.0
7.0
2002
2003
2004
2005
2006
2007
2008
2009
2010
2011
2012
2013
2014
2015
2016
2017
2018
2019
(a) (a) (a) (a) (a) (a) (a) (a) (a) (a) (a) (a) (a) (a) (a) (e) (e) (e)
Debt-to-capital
Source: Company reports, Deutsche Bank Source: Company reports, Deutsche Bank
International execution has some tailwindsInternational rig margins have gained some traction and NBR has at last seena pivot in its international rig count. An interesting win for NBR is its 50/50joint venture with Saudi Aramco, SANAD (Saudi Aramco Nabors Drilling), whichcommences in 2H17. NBR and Saudi Aramco have each committed $20 millionin cash and will commit five land rigs each to the JV. Initially the impact will besmall for NBR, but in two years the JV will add five rigs per year over a period often years from a base of NBR’s 38 rigs in 2Q17.
Figure 412: International daily margins (USD) Figure 413: International rig count
-
5,000
10,000
15,000
20,000
25,000
30,000
35,000
40,000
45,000
50,000
1Q
05
3Q
05
1Q
06
3Q
06
1Q
07
3Q
07
1Q
08
3Q
08
1Q
09
3Q
09
1Q
10
3Q
10
1Q
11
3Q
11
1Q
12
3Q
12
1Q
13
3Q
13
1Q
14
3Q
14
1Q
15
3Q
15
1Q
16
3Q
16
1Q
17
Average dayrate Average daily margin
-
20
40
60
80
100
120
140
1Q
05
3Q
05
1Q
06
3Q
06
1Q
07
3Q
07
1Q
08
3Q
08
1Q
09
3Q
09
1Q
10
3Q
10
1Q
11
3Q
11
1Q
12
3Q
12
1Q
13
3Q
13
1Q
14
3Q
14
1Q
15
3Q
15
1Q
16
3Q
16
1Q
17
Source: Company reports, Deutsche Bank Source: Company reports, Deutsche Bank
Page 170 Deutsche Bank Securities Inc.

9 October 2017
Oil Services & Equipment
Initiation of coverage
Valuation and risksWe are initiating coverage of Nabors Industries with a $9 price target. This is5.0x our estimate of the company’s normalized EBITDA of $1.3 billion, which isin-line with the 5.0x five-year average multiple leading up to the 2014 collapsein oil prices. The company is currently trading at 7.6x our fiscal 2018 EBITDAestimate of $0.82 billion, and 6.0x our 2019 EBITDA estimate of $1.04 billion.Valuations have consolidated due to the high leverage in our view as marketsreassess the earnings power, but also the probability that NBR can reduce netdebt meaningfully using cash from operations.
The main investment risks include: 1) shifts in OPEC policy and the influencethat would have on oil prices and ultimately US upstream capital expenditures, 2)negative revisions to global oil demand, 3) an equity raise to reduce debt, and 4)a derailing of its efforts to increase the scale and penetration of its NDS servicesthat would lead to a negative revision in earnings.
Figure 414: The EV/EBITDA valuation band as blown out Figure 415: The 5yr EV/EBITDA leading up to 2014
0
2
4
6
8
10
12
14
Jan-10 Jan-11 Jan-12 Jan-13 Jan-14 Jan-15 Jan-16 Jan-17
-1 std 5yr avg +1 std
0
1
2
3
4
5
6
7
8
9
Jan-10 Jan-11 Jan-12 Jan-13 Jan-14
Series2 Series3 Series4
Source: Factset Source: Factset
Deutsche Bank Securities Inc. Page 171

9 October 2017
Oil Services & Equipment
Initiation of coverage
Company description
Nabors Industries (NBR) is the largest land drilling company with over 400 landrigs. Its largest presence is in the US, where it has 222 land rigs, making it the thirdlargest with 12% market share. The company’s international land fleet includes137 rigs in 20 countries with a particular leverage to Saudi Arabia and LatinAmerica. In Canada, NBR has 47 land rigs and 8% market share. The companyis also a leading provider of platform rigs with 17 in the Gulf of Mexico and 18platform rigs plus six jackups in international markets.
Figure 416: Company reporting segments
US Drilling Rig Services
- US Lower 48 - 206 land rigs - Nabors Drilling Solutions (NDS)
- US Offshore - 17 platform rigs - RキェデWノノキェWミデゥ キミデWェヴ;デWS ラヮWヴ;デキミェ ゲ┞ゲデWマ- Alaska - 16 land rigs - Accu directional tools
- Rotary steerable systems
- キR;IニWヴゥ ;┌デラミラマラ┌ゲ デ┌H┌ノ;ヴ エ;ミSノキミェInternational Drilling - RIGWATCH® rig performance monitoring
- Land drilling - 137 land rigs - ROCKIT® directional drilling systems
- Offshore drilling - REVit® control systems
- 9 platform drilling rigs - DRILLSMART® rig performance monitoring
- 9 platform workover rigs - RWIキヮW デラ Dヴキノノゥ ┘ラヴニ aノラ┘ - 6 jackups rigs - Tubular running services equiment
- Ryan Directional Services - directional drilling
Canada Drilling - Canrig Drilling Technology
- Canada fleet of 47 land rigs - Top drives, catwalks, drawworks, wrenches
Nabors Industries
Source: Deutsche Bank
NBR’s Rig Services segment includes its Canrig, Ryan Directional Servicesand Nabors Drilling Solutions (NDS) subsidiaries. Canrig manufactures andsells drilling equipment, mainly for internal use. Ryan provides directionaldrilling services, and NDS offers a broad spectrum of drilling technologies andapplications that enhance rig performance and well placement. In 2015, NBR soldits completion and production services businesses to C&J Energy (CJ).
Figure 417: Revenues by reporting segment
United
States
24%
Canada
2%
International
65%
Rig
Services
9%
2016
United
States
30%
Canada
5%
International
23%
Rig
Services
10%
Production
Services
15%
Completion
Services
17%
2014
Source: Company reports
Page 172 Deutsche Bank Securities Inc.

9 October 2017
Oil Services & Equipment
Initiation of coverage
Principal Sources and Uses of Cash Flow
The US and international land markets are the principal sources of cash flow forNBR. In 2015, NBR sold its Completions and Production Services business toC&J Energy, which had accounted for almost one-third of its revenues, and about16% of its EBITDA during the industry peak in 2014. NBR initiated a dividend in2013, but through 2016, aggregate dividend payments only consumed about 5%of cash from operations. NBR does not intend to fund any more newbuilds as longas rates remain depressed, and the company has a limited inventory of suitablerigs to upgrade to super-spec capabilities. As such, capex is down 71% to $0.6billion in 2017 from the peaking spending in 2011. NBR intends to reduce its netdebt to $2.2 billion from
Figure 418: Global active rig count
205
268
334
394 431
406 432
291 319
360 373 349
374
261
172
215
261 294
0
50
100
150
200
250
300
350
400
450
500
20
02
20
03
20
04
20
05
20
06
20
07
20
08
20
09
20
10
20
11
20
12
20
13
20
14
20
15
20
16
20
17
20
18
20
19
(a) (a) (a) (a) (a) (a) (a) (a) (a) (a) (a) (a) (a) (a) (a) (e) (e) (e)
USA Canada International
Source: Company reports, Deutsche Bank
Figure 419: Consolidated EBITDA
0
500
1,000
1,500
2,000
2,500
20
02
20
03
20
04
20
05
20
06
20
07
20
08
20
09
20
10
20
11
20
12
20
13
20
14
20
15
20
16
20
17
20
18
20
20
(a) (a) (a) (a) (a) (a) (a) (a) (a) (a) (a) (a) (a) (a) (a) (e) (e) (e)
In m
illio
ns
of
US
D
Source: Company reports, Deutsche Bank
Deutsche Bank Securities Inc. Page 173

9 October 2017
Oil Services & Equipment
Initiation of coverage
Figure 420: Revenue contribution
0
1,000
2,000
3,000
4,000
5,000
6,000
7,000
8,0002
00
2
20
03
20
04
20
05
20
06
20
07
20
08
20
09
20
10
20
11
20
12
20
13
20
14
20
15
20
16
20
17
20
18
20
19
(a) (a) (a) (a) (a) (a) (a) (a) (a) (a) (a) (a) (a) (a) (a) (e) (e) (e)
In m
illi
on
s o
f U
SD
United States Canada International
Rig Services Production Services Completion Services
Source: Company reports, Deutsche Bank
Figure 421: NBR global land fleet
Global Land Fleet Mech SCR AC SCR AC SCR AC Mech SCR AC Total
US Lower 48 0 10 73 8 108 6 1 0 24 182 206
Alaska 1 4 5 0 1 5 0 1 9 6 16
Canada 19 12 11 2 1 1 1 19 15 13 47
Total North America 20 26 89 10 110 12 2 20 48 201 269
Saudi Arabia 1 0 0 11 2 25 4 1 36 6 43
Argentina 13 2 0 0 6 1 1 13 3 7 23
Colombia 0 0 0 3 8 3 0 0 6 8 14
Algeria 0 0 0 2 4 3 1 0 5 5 10
Russia 1 0 1 2 0 2 1 1 4 2 7
Ecuador 4 0 0 0 0 1 1 4 1 1 6
Mexico 0 1 0 1 0 4 0 0 6 0 6
Venezuela 0 1 0 0 4 0 0 0 1 4 5
Kazakhstan 1 0 0 0 0 4 0 1 4 0 5
Iraq 0 0 0 3 1 0 0 0 3 1 4
Other 0 4 0 0 0 5 5 0 9 5 14
International 20 8 1 22 25 48 13 20 78 39 137
Total global land fleet 40 34 90 32 135 60 15 40 126 240 406
Total< 1,499 HP 1,500 HP > 1,500 HP
Source: Company reports
Page 174 Deutsche Bank Securities Inc.

9 October 2017
Oil Services & Equipment
Initiation of coverage
Figure 422: Income Statement(a) (a) (a) (a) (a) (a) (a) (a) (e) (e) (e)
In millions of USD 2009 2010 2011 2012 2013 2014 2015 2016 2017 2018 2019
Segment revenues:
United States 1,444 1,598 1,999 2,277 1,876 2,130 1,257 554 771 994 1,133
Canada 297 389 575 573 362 335 137 51 99 129 164
International 1,265 1,094 1,104 1,265 1,464 1,623 1,868 1,509 1,517 1,872 2,200
Rig Services 448 457 695 840 595 687 391 216 363 511 641
Production Services 412 445 701 858 1,009 1,034 159 0 0 0 0
Completion Services 0 321 1,237 1,463 1,075 1,218 208 0 0 0 0
Eliminations (152) (79) (187) (372) (189) (260) (150) (102) (184) (240) (284)
Total revenues 3,715 4,225 6,125 6,902 6,192 6,768 3,871 2,228 2,566 3,265 3,854
Segment EBIT:
United States 388 335 443 528 276 340 87 (198) (208) (117) (60)
Canada (7) 23 95 97 61 52 (7) (37) 4 37 54
International 366 255 124 91 178 243 314 165 128 322 524
Rig Services 34 43 55 79 4 48 (13) (48) (2) 43 69
Production Services 29 32 75 104 102 93 (3) 0 0 0 0
Completion Services 0 67 229 189 52 (15) (55) 0 0 0 0
Eliminations, other (146) (104) (146) (142) (146) (194) (160) (131) (178) (247) (315)
Total EBIT 664 650 874 945 527 568 163 (249) (255) 38 271
Interest (expense) (265) (273) (256) (252) (223) (178) (182) (185) (217) (193) (174)
Interest income 26 3 12 0 0 0 0 0 0 0 0
Equity income 0 0 0 0 0 0 (81) (36) 0 0 0
Other income (13) 2 (6) 9 4 (2) (8) (9) (2) 0 0
PBT 412 382 624 702 307 388 (108) (480) (475) (155) 97
Income tax (expense) (42) (53) (186) (196) (56) (56) 18 142 64 21 (7)
Non-controlling interest 0 (1) (1) (1) (7) (1) (1) (0) (7) (8) (8)
Preferred dividends 0 (1) (3) (3) (3) (2) 0 0 0 0 0
Net income (operating) 369 327 435 503 241 329 (90) (338) (418) (142) 82
Discontinued ops 0 (6) (79) (282) (17) 0 (43) (18) (16) 0 0
Unusual after-tax (455) (226) (111) (57) (85) (1,045) (240) (673) (15) 0 0
Net income (GAAP) (86) 95 244 164 139 (716) (373) (1,029) (449) (142) 82
Conv int | share comp
Operating EPS 1.30 1.13 1.49 1.72 0.81 1.12 (0.30) (1.21) (1.47) (0.51) 0.30
GAAP EPS (0.30) 0.33 0.83 0.56 0.47 (2.43) (1.29) (3.71) (1.58) (0.51) 0.30
DPS 0.00 0.00 0.00 0.00 0.16 0.20 0.24 0.24 0.24 0.24 0.24
Diluted shares 284 290 292 292 296 295 283 276 279 279 279
Consolidated EBITDA 1,343 1,440 1,819 2,000 1,622 1,713 1,134 622 565 830 1,049
EBITDA margin 36.2% 34.1% 29.7% 29.0% 26.2% 25.3% 29.3% 27.9% 22.0% 25.4% 27.2%
EBIT margin 17.9% 15.4% 14.3% 13.7% 8.5% 8.4% 4.2% -11.2% -9.9% 1.2% 7.0%
Tax rate 10.3% 13.9% 29.7% 27.9% 18.3% 14.3% 16.5% 29.7% 13.4% 13.4% 7.3%
Rigs working:
US Lower-48 150 174 200 201 177 196 105 53 96 123 139
US Offshore 11 9 10 13 13 10 7 5 3 3 3
Alaska 10 7 5 6 5 6 8 4 3 3 3
Canada 20 30 40 35 30 34 17 10 18 23 27
International 100 98 105 119 124 127 124 100 94 113 127
Segment EBIT margins:
United States 26.9% 21.0% 22.1% 23.2% 14.7% 16.0% 6.9% -35.7% -26.9% -11.7% -5.3%
Canada -2.3% 5.8% 16.5% 16.9% 16.9% 15.7% -5.1% -71.5% 4.1% 28.7% 32.8%
International 28.9% 23.3% 11.2% 7.2% 12.1% 15.0% 16.8% 10.9% 8.4% 17.2% 23.8%
Rig Services 7.6% 9.5% 7.9% 9.4% 0.7% 7.0% -3.2% -22.5% -0.6% 8.4% 10.8%
Source: Deutsche Bank
Deutsche Bank Securities Inc. Page 175

9 October 2017
Oil Services & Equipment
Initiation of coverage
Figure 423: Cash Flow Statement(a) (a) (a) (a) (a) (a) (a) (a) (e) (e) (e)
In millions of USD 2009 2010 2011 2012 2013 2014 2015 2016 2017 2018 2019
Net income 369 327 435 503 241 329 (90) (338) (418) (147) 76
Depreciation 679 790 945 1,056 1,095 1,145 970 872 820 791 778
Deferred tax (219) 56 (35) (145) (103) (240) (203) (207) (136) (46) 14
Chg in receivables 451 (250) (459) 201 (45) (127) 529 250 (130) (60) (66)
Chg in inventories 53 (15) (115) 14 39 (65) 24 41 (8) (7) (10)
Chg in payables (146) 70 518 (223) 114 268 (566) (180) 96 102 31
Other 430 129 169 158 78 472 193 94 (97) (77) (34)
Cash from operations 1,617 1,107 1,456 1,563 1,418 1,782 857 532 128 557 789
Capital expenditures (1,093) (930) (2,043) (1,519) (1,178) (1,821) (867) (395) (576) (616) (765)
Free cash flow 524 177 (586) 44 240 (39) (11) 136 (448) (59) 24
Acquisitions 0 (734) (112) 0 (117) (73) (80) (22) 0 0 0
Asset sales 31 31 324 309 321 157 68 35 19 0 0
Dividends paid 0 0 0 0 (47) (59) (69) (51) (68) (67) (67)
ESPP | options 11 1 0 0 0 0 0 0 0 0 0
Equity issuance, net (8) 2 9 (6) 5 (220) (98) (1) 8 0 0
Debt issuance, net 25 298 153 (246) (690) 216 (677) (70) 302 150 150
Other (76) (65) (49) 137 17 47 606 (6) (33) 0 0
Chg in cash 507 (290) (262) 239 (271) 29 (262) 21 (219) 24 107
FCF per share 1.84 0.61 (2.00) 0.15 0.81 (0.13) (0.04) 0.49 (1.61) (0.21) 0.09
Capex / revenue 0.29 0.22 0.33 0.22 0.19 0.27 0.22 0.18 0.22 0.19 0.20
Capex / depreciation 1.61 1.18 2.16 1.44 1.08 1.59 0.89 0.45 0.70 0.78 0.98
Source: Deutsche Bank
Page 176 Deutsche Bank Securities Inc.

9 October 2017
Oil Services & Equipment
Initiation of coverage
Figure 424: Balance Sheet(a) (a) (a) (a) (a) (a) (a) (a) (e) (e) (e)
In millions of USD 2009 2010 2011 2012 2013 2014 2015 2016 2017 2018 2019
Cash and equivalents 1,091 801 539 778 507 536 275 295 76 99 207
Accounts receivable 724 1,117 1,577 1,383 1,400 1,518 785 508 624 684 750
Inventories 101 159 273 251 210 230 154 104 112 119 128
Other current assets 261 536 699 721 637 458 263 249 278 358 392
Total current assets 2,177 2,613 3,088 3,133 2,754 2,742 1,476 1,156 1,090 1,260 1,477
Net PP&E 7,646 7,815 8,630 8,712 8,598 8,599 7,028 6,268 5,994 5,819 5,807
Goodwill 164 494 501 472 513 174 167 167 167 167 167
Other assets 2,834 3,337 3,781 3,472 3,049 3,107 2,343 1,753 1,764 2,126 2,427
Total assets 10,645 11,647 12,912 12,656 12,160 11,880 9,538 8,187 7,926 8,113 8,401
Accounts payable 226 355 783 499 546 780 272 265 281 384 414
Current debt 0 1,379 275 0 10 6 7 0 0 0 670
Other current liabilities 382 420 744 633 756 781 728 557 682 876 960
Total current liabilities 609 2,154 1,803 1,132 1,311 1,567 1,006 822 963 1,260 2,044
Long-term debt 3,941 3,064 4,348 4,379 3,904 4,349 3,655 3,578 3,740 3,890 3,371
Other LT liabilities 913 1,016 1,091 1,118 894 1,045 582 532 403 403 403
Non-controlling int 0 0 0 12 12 10 11 8 24 24 24
Shareholders' equity 5,182 5,412 5,670 6,014 6,038 4,909 4,283 3,247 2,796 2,536 2,559
Total liabilities and equity 10,645 11,647 12,912 12,656 12,160 11,880 9,538 8,187 7,926 8,113 8,401
Total debt 3,941 4,443 4,624 4,380 3,914 4,355 3,662 3,579 3,740 3,890 4,040
Net debt 2,850 3,642 4,084 3,601 3,407 3,819 3,387 3,283 3,665 3,791 3,834
Debt/capital 43% 45% 45% 42% 39% 47% 46% 52% 57% 61% 61%
Debt/equity 76% 82% 82% 73% 65% 89% 85% 110% 134% 153% 158%
Debt turns 2.9 3.1 2.5 2.2 2.4 2.5 3.2 5.8 6.6 4.7 3.9
Source: Deutsche Bank
Deutsche Bank Securities Inc. Page 177

9 October 2017
Oil Services & Equipment
Initiation of coverage
Rating
HoldNorth AmericaUnited States
IndustrialsOil Services & Equipment
Company
National OilwellVarco
Reuters Bloomberg
NOV.N NOV UN
National Oilwell Varco (NOV)Acquisition Enabled Earnings Growth
Initiating coverage with a Hold rating and a $39 price targetNational Oilwell Varco is among the best-in-class for free cash flow, balance sheetstrength, acquisition enabled earnings growth, and management. The companyhas done over 120 acquisitions over the past decade that largely focused onenhancing its earnings power within its Wellbore Technologies and Completion& Production segments. Earnings have pivoted, a US onshore recovery hasemerged, and irrational earnings expectations have been reset lower providingfor a significantly better setup for the stock.
Acquisition enabled earnings growthNOV should benefit from a US onshore levered margin expansion that hasbeen enabled by cost reductions, improved manufacturing efficiencies, and aninflection in US drilling activity that is driving NOV’s traditional manufacturingbusinesses related to rig upgrades, frac reactivations, and frac newbuilds, aswell as its Wellbore Technologies segment that is 58% levered to North America.Helping restore its earnings power is an acquisition strategy that has beendisproportionately focused on businesses unrelated to its Rig Systems segment.Acquiring geographically captive niche technologies, NOV is growing its globalcompletions, directional drilling and precision well placement capabilities. It alsocontinues to invest in its fiberglass pipe business, which is addressing the top ofmind problem of corrosion and production.
ValuationWe are initiating coverage of NationalOilwell Varco with a $39 price target. Thisis 11.8x our estimate of the company’snormalized EPS power of $3.30 per share,which is in-line with the 11.8x five-yearaverage multiple leading up to the 2014collapse in oil prices.The main investment risks include: 1) shiftsin OPEC policy and the influence thatwould have on oil prices and ultimately USupstream capital expenditures, 2) negativerevisions to global oil demand, 3) a slowingin the retooling efforts in the US landand pressure pumping markets, and 4)further disruptions to the retooling effortsinternationally.
Forecasts and ratios
Year End Dec 31 2016A 2017E 2018E
1Q EPS -0.06 -0.17A 0.03
2Q EPS -0.30 -0.14A 0.08
3Q EPS -0.34 -0.08 0.18
4Q EPS -0.15 -0.01 0.26
FY EPS (USD) -0.85 -0.40 0.55
OLD FY EPS (USD) – – –
% Change – – –
P/E (x) – – 65.6
DPS (USD) 0.61 0.20 0.20
Dividend Yield (%) 1.9 0.6 0.6
Revenue (USDm) 7,251.0 7,403.2 9,034.2Source: Deutsche Bank estimates, company data
David HavensResearch [email protected]
Price at 5 Oct 2017 (USD) 36.03
Price target 39.00
52-week range 41.62 - 29.94
Price/price relative
National Oilwell Var S&P 500 INDEX (Rebased)
Jan '15 May '15 Sep '15 Jan '16 May '16 Sep '16 Jan '17 May '17 Sep '1720
30
40
50
60
70
80
90
100
Performance(%)
1m 3m 12m
Absolute 14.8 3.9 -0.8
S&P 500INDEX
2.5 4.5 18.0
Source: Deutsche Bank
Stock & option liquidity data
Market Cap (USDm) 13,574.3
Shares outstanding (m) 376.8
Free float (%) 100
Volume (5 Oct 2017) 1,193,012
Option volume (und. shrs., 1M avg.) 1,124,105Source: Deutsche Bank
Page 178 Deutsche Bank Securities Inc.

9 October 2017
Oil Services & Equipment
Initiation of coverage
Key investment themes
US pressure pumping reactivations and eventual newbuilds1Q18 is the earliest a customer can get a frac spread from NOV. The company sold260,000 hhp of new frac equipment in 1H17 and had 6-8 ongoing discussionswith customers about additional newbuilds. The urgency of those discussionsdeclined as oil prices drifted lower, but did not disappear. We expect new orderswill continue build into year-end, albeit at a modest pace.
Figure 425: US frac demand Figure 426: US frac price index
0
2
4
6
8
10
12
14
16
18
3Q
11
4Q
11
1Q
12
2Q
12
3Q
12
4Q
12
1Q
13
2Q
13
3Q
13
4Q
13
1Q
14
2Q
14
3Q
14
4Q
14
1Q
15
2Q
15
3Q
15
4Q
15
1Q
16
2Q
16
3Q
16
4Q
16
1Q
17
2Q
17
3Q
17
Millio
n h
hp
0
20
40
60
80
100
120
3Q11
4Q11
1Q12
2Q12
3Q12
4Q12
1Q13
2Q13
3Q13
4Q13
1Q14
2Q14
3Q14
4Q14
1Q15
2Q15
3Q15
4Q15
1Q16
2Q16
3Q16
4Q16
1Q17
2Q17
3Q17
Source: IHS Markit, Deutsche Bank Source: IHS Markit, Deutsche Bank
US land fleet upgrade driving some new order growth in Rig SystemsIn 2Q17, land orders were 60% of the total new orders in the Rig Systemssegment. We model total Rig Systems orders at about $530 million for 2017 and$766 million for 2018, which are small fractions of the $10-15 billion range set in2013 and 2014, but we have seen the pivot in new orders and now some growth. Akey driver is the super-spec upgrade and some of the private contractors retoolingtheir fleets to remain competitive. While complete land rigs generate a soliddouble-digit margin for NOV, rig components are more lucrative and that is whatNOV is pulling in. Top drives, solids control equipment, iron roughnecks, piperacking and BOPs are all benefitting from the current upgrade trend. Top drivesare the highest exposure due to the demand for high torque units with twin 660hpmotors to accommodate for the longer laterals. We expect a few hundred moreupgrades in 2018 alone.
The one negative is Helmerich & Payne, Precision Drilling and Patterson-UTI usedalmost exclusively NOV top drives (NBR uses its Canrig top drives). But Pattersonhas since acquired Warrior, which will fulfill Patterson’s top drive requirementsgoing forward.
In terms of complete land rig packages, we expect that demand to be smallin 2018. Contractors generally need dayrates in the $24-25 kpd range to justifynewbuilds, and rates are currently encountering some headwinds in the low $20s.While private contractors have a lower threshold, there is not an abundance ofcapital among them.
All-in, the US land rig market is experiencing a rapid upgrade cycle as contractorsreposition themselves to ensure they have the most competitive tier 1 land rigs.Helmerich & Payne has identified 122 upgrade candidates in its fleet alone.Ultimately the US is a good opportunity, but the international retooling is better.
Deutsche Bank Securities Inc. Page 179

9 October 2017
Oil Services & Equipment
Initiation of coverage
Figure 427: The irrational EPS expectations have been revised down
0.00
0.20
0.40
0.60
0.80
1.00
1.20Apr-16
May-16
Jun-16
Jul-16
Aug-16
Sep-16
Oct-16
Nov-16
Dec-16
Jan-17
Feb-17
Mar-17
Apr-17
May-17
Jun-17
Jul-17
Aug-17
Sep-17
EPS
Source: Factset
International retooling slow to materialize, but Saudi Aramco stepping upThe international land rig retooling effort has been a lingering opportunity set thathas yet to take-off materially. Timing has been a question, and buy-in is an issue.International contractors and operators do not buy into the value proposition ofthe more expensive high-specification rigs the same way US contractors andoperators do. Thus the retooling effort has been sliding to the right for years. Butthere is a bright spot with Saudi Aramco. NOV is in the final stages of becomingthe exclusive provider of the 50 newbuild land rigs stipulated under the jointventure agreement between Saudi Aramco and Nabors Industries. These rigswould be delivered over a period of ten years on a take-or-pay basis for $30-50million apiece. NOV also intends to sell outside of Saudi Arabia provided thedemand is there to retool, where the company already has a large Middle Eastinstalled base for its aftermarket business.
Cutting costs, more efficient infrastructureManagement has suggested it can restore its $6 per share of earnings power with$17 billion of revenues versus the $22 billion it took in 2014 when it achievedthis earnings high water mark. Consolidating facilities and investing in moreefficient manufacturing equipment that require less headcount is one of severalcost cutting efforts the company has made to prime it for the eventual recovery.NOV has closed 350 locations (which does include sales offices and stockingcenters) and has completed its effort to bring outsourcing in-house (maintainedsome outsourcing). While there is still some margin pressure in the Rig Systemsbusiness due to some legacy throughput, we expect strong incremental marginsin its Wellbore Technologies and Completion & Production Solutions segmentsin 2018.
Infrastructure to support smaller scale deepwater field developmentMore of a longer-term story, NOV is performing a study for a customer for afield development plan in the Barents Sea that would potentially use one of itsproprietary FPSOs that NOV has designed in partnership with GE. The
Page 180 Deutsche Bank Securities Inc.

9 October 2017
Oil Services & Equipment
Initiation of coverage
HoneyBee and MiniBee FPSOs have a capacity of 20-60 kb/d and are targetingmarkets where operators would do phased production on larger scale fields toachieve first oil faster to improve NPVs. Operators can tie-in future phases andperform more comprehensive well testing to optimize the larger FPSOs as theyare built and brought on location. The company is also targeting the 400 or soundeveloped discoveries that are smaller, more marginal fields that are strandedassets.
The intended benefits are lower vessel construction cost and delivery in underthree-years. The designs are 70% standardized and are about 30% cheaper.While NOV has not yet received the green light on its first vessel, we believethe concept of phased production appeals to operators. SBM Offshore has acompeting design, but with a larger capacity of 150 kb/d.
The Seabox seawater injection systemOne of NOV’s latest entries into the subsea market is its seawater injection systemcalled the Seabox. The Seabox injects seawater into injection wells to push oilout. As operators look to reduce overall offshore costs, this technology
Corrosion in the oilfield is top of mindWe expect to hear a lot more about corrosion in the coming years. Corrosion isone of the industry’s biggest production challenges and is key focus for manyprivate equities looking to find secular growth opportunities in oilfield services.NOV’s Fiberglass pipe business is an opportunity in waiting, already representingabout 15% of Completion & Production Solutions revenues. This will be top ofmind for us as we look to define the addressable market.
Valuation and risksWe are initiating coverage of National Oilwell Varco with a $39 price target. Thisis 11.8x our estimate of the company’s normalized EPS power of $3.30 per share,which is in-line with the 11.8x five-year average multiple leading up to the 2014collapse in oil prices.
The main investment risks include: 1) shifts in OPEC policy and the influencethat would have on oil prices and ultimately US upstream capital expenditures,2) negative revisions to global oil demand, 3) a slowing in the retooling effortsin the US land and pressure pumping markets, and 4) further disruptions to theretooling efforts internationally.
Figure 428: The P/E valuation band has blown out Figure 429: The 5yr P/E leading up to 2014
1
2
4
8
16
32
64
128
256
512
1,024
2,048
4,096
Jan-10 Jan-11 Jan-12 Jan-13 Jan-14 Jan-15 Jan-16 Jan-17
Log
ari
thm
ic s
cale
-1 std 5yr avg +1 std
3
5
7
9
11
13
15
17
19
-1 std 5yr avg +1 std
Source: Factset Source: Factset
Deutsche Bank Securities Inc. Page 181

9 October 2017
Oil Services & Equipment
Initiation of coverage
Company description
National Oilwell Varco (NOV) is a leading manufacturer of oilfield toolsand equipment for both land and offshore applications. The company hasfour reporting segments including Rig Systems, Rig Aftermarket, WellboreTechnologies, and Completion & Production Solutions. The Rig Systems segmentmanufactures land rigs, complete offshore drilling packages, workover rigs,and a broad array of discrete rig components. The Rig Aftermarket segmentprovides spare parts (manufactured mainly by Rig Systems), technical support,field services, recertification and remote support.
Figure 430: Company reporting segments
Rig Systems Rig Systems, cont'd
- Land rigs - "Ideal Rig" series - Drilling rig components
- Offshore rig packages - Instrumentation and control systems
- Workover rigs - Power systems - AC drive, SCR drive
- Hoisting systems - derricks, drawworks
- Rotating systems - top drives
Rig Aftermarket - Fluids systems - mud pumps
- Spare parts - Pressure control - BOPs and control systems
- Technical support - Pipe handling equipment
- Field service and repair - Vertical and horizontal pipe racking
- Recertification - Iron roughnecks
- Remote support - Casing running tools (CRT)
- Condition monitoring Pipe handling tools
- RIGSENTRYゥ - BOP predictive analytics - Motion compensation (offshore)
Wellbore Technologies Completion & Production Solutions
- Drill pipe, heavy-weight drill pipe, drill subs - Pressure pumping equipment
- Premium tubular connections - Completion tools
- Tubular inspection, repair and coating - Sliding sleeve, dissolving frac balls
- Downhole drilling motors and power sections - Cementing tools
- MWD sensors and rotary steerable systems - Coiled tubing units
- IntelliServ wired pipe - Wireline units
- Solids control equipment, waste management - FPSO solutions (HoneyBee)
- Drill bits and borehole enlargement tools - Mooring systems
- Drilling tools, fishing tools, coiled tubing tools - Subsea flexible pipe
- Agitator systems - BHA friction reducing tools - Topside processing equipment
- Drilling and completion fluids, mud chillers - Lifting and handling equipment
- Managed pressure drilling (MPD) systems - Fiberglass pipe
- Coring services - Onshore production solutions
- Water services, pad preparation - Artificial lift
- Portable power generation - Fiberglass pipe
- Drilling automation and optimization - Processing equipment
- Instrumentation, measuring and monitoring - Process flow technologies
National Oilwell Varco
Source: Deutsche Bank
Wellbore Technologies is a leading provider of directional drilling tools, drilling andcompletion fluids, drill bits, solids control equipment, waste management, tubularcoating and inspection, and drill pipe. The Completion & Production Solutionssegment manufactures pressure pumping equipment, completion tools, coiledtubing, and wireline units. It also provides floating production solutions, flexiblepipe, fiberglass pipe, subsea products, artificial lift and processing equipment.
Page 182 Deutsche Bank Securities Inc.

9 October 2017
Oil Services & Equipment
Initiation of coverage
Principal Sources and Uses of Cash Flow
Principal source of cash has shifted away from offshore rig packagesFor years, NOV has aligned its high competency in manufacturing with anacquisition strategy that has concentrated on bringing niche technologies in-house that help it establish a core market presence in disciplines the companythinks are primed for growth. Through 2005, and culminating with the VarcoInternational merger, NOV established a strategic foothold in the offshore capitalequipment market. Over the next ten years, NOV took over 70% of the marketshare in deepwater drilling packages in what became the largest deepwater rigexpansion in history.
Figure 431: Total backlog Figure 432: Total revenues
0
2,000
4,000
6,000
8,000
10,000
12,000
14,000
16,000
18,000
20
02
20
03
20
04
20
05
20
06
20
07
20
08
20
09
20
10
20
11
20
12
20
13
20
14
20
15
20
16
20
17
20
18
20
19
(a) (a) (a) (a) (a) (a) (a) (a) (a) (a) (a) (a) (a) (a) (a) (e) (e) (e)
In m
illi
on
s o
f U
SD
0
5,000
10,000
15,000
20,000
25,000
20
02
20
03
20
04
20
05
20
06
20
07
20
08
20
09
20
10
20
11
20
12
20
13
20
14
20
15
20
16
20
17
20
18
20
19
(a) (a) (a) (a) (a) (a) (a) (a) (a) (a) (a) (a) (a) (a) (a) (e) (e) (e)
In m
illio
ns
of
USD
Source: Company reports, Deutsche Bank Source: Company reports, Deutsche Bank
During that same period, NOV also took a leading market share in the replacementof the aging jackup fleet. Accordingly, NOV became synonymous with offshorerig building as its surging backlog reached a 90% gearing to the offshore marketsby 2014.
Figure 433: Revenues by reporting segment (2017 is DB estimate)
Rig
Systems
42%
Rig
Aftermarket
14%
Wellbore
Technologies
24%
Completion
&
Production
20%
2014 Rig
Systems
17%
Rig
Aftermarket
17%
Wellbore
Technologies
32%
Completion
&
Production
34%
2017
Source: Company reports, Deutsche Bank
Deutsche Bank Securities Inc. Page 183

9 October 2017
Oil Services & Equipment
Initiation of coverage
Figure 434: Consolidated EBITDA Figure 435: Annual EPS
0
500
1,000
1,500
2,000
2,500
3,000
3,500
4,000
4,500
5,000
20
02
20
03
20
04
20
05
20
06
20
07
20
08
20
09
20
10
20
11
20
12
20
13
20
14
20
15
20
16
20
17
20
18
20
19
(a) (a) (a) (a) (a) (a) (a) (a) (a) (a) (a) (a) (a) (a) (a) (e) (e) (e)
In m
illio
ns
of
US
D
(2.00)
(1.00)
0.00
1.00
2.00
3.00
4.00
5.00
6.00
7.00
2002
2003
2004
2005
2006
2007
2008
2009
2010
2011
2012
2013
2014
2015
2016
2017
2018
2019
(a) (a) (a) (a) (a) (a) (a) (a) (a) (a) (a) (a) (a) (a) (a) (e) (e) (e)
EPS
Source: Company reports, Deutsche Bank Source: Company reports, Deutsche Bank
Overshadowed by its leverage to the deepwater, NOV was also benefitting fromthe proliferation of capital that was investing in the development of US tight oilreserves. Since the merger with Varco International, NOV had been harvesting theexpansion in the deepwater, but concentrating its acquisition efforts outside ofRig Systems. Since the Varco merger, NOV closed on more than 120 acquisitionstotaling over $16 billion, with a disproportionately large percentage of thatunrelated to Rig Systems. This helped position the company to benefit from theunprecedented expansion in horizontal drilling, but it was still second to theoffshore. At the peak in 2014, NOV derived about two-thirds of its revenues fromthe offshore versus one-third from onshore.
Due to the severity of the downturn in the deepwater, which is the worst theindustry has ever experienced, NOV’s strategy would seemingly have to pivot fastto accommodate the lost earnings from the offshore. But while these earningsare unlikely to be restored organically anytime soon, NOV’s acquisition strategypivoted years ago towards directional drilling, completions, fiberglass pipe, FPSOsolutions and processing equipment to name a few. The company had alreadyaligned its acquisition strategy to address the increasing complexities of longerlaterals, the increased demand for drilling efficiencies, and demand to reducenon-productive time (NPT).
Going forward, NOV intends to continue its acquisition strategy and grow itscapabilities in completion tools, directional drilling, floating production solutions,and new subsea technologies. Management also intends to focus once againon the newbuild cycle for hydraulic fracturing equipment and the upgrade cyclefor AC-electric land rigs in the US and the retooling of international land rigs.NOV’s floating production storage and offloading (FPSO) solution still needs itsfirst newbuild, and NOV is engaged in a study that applies its HoneyBee FPSOdesign to the Barents Sea.
Page 184 Deutsche Bank Securities Inc.

9 October 2017
Oil Services & Equipment
Initiation of coverage
Figure 436: Industry leading free cash flow performance
(1,000)
(500)
0
500
1,000
1,500
2,000
2,500
3,0002
00
2
20
03
20
04
20
05
20
06
20
07
20
08
20
09
20
10
20
11
20
12
20
13
20
14
20
15
20
16
20
17
20
18
20
19
(a) (a) (a) (a) (a) (a) (a) (a) (a) (a) (a) (a) (a) (a) (a) (e) (e) (e)
In m
illio
ns
of
US
D
Free cash flow Dividends paid
Source: Company reports, Deutsche Bank
Figure 437: Net debt Figure 438: Debt turns
(4,000)
(3,000)
(2,000)
(1,000)
0
1,000
2,000
3,000
20
02
20
03
20
04
20
05
20
06
20
07
20
08
20
09
20
10
20
11
20
12
20
13
20
14
20
15
20
16
20
17
20
18
20
19
(a) (a) (a) (a) (a) (a) (a) (a) (a) (a) (a) (a) (a) (a) (a) (e) (e) (e)
In m
illi
on
s o
f U
SD
0.0
2.0
4.0
6.0
8.0
10.0
12.0
20
02
20
03
20
04
20
05
20
06
20
07
20
08
20
09
20
10
20
11
20
12
20
13
20
14
20
15
20
16
20
17
20
18
20
19
(a) (a) (a) (a) (a) (a) (a) (a) (a) (a) (a) (a) (a) (a) (a) (e) (e) (e)
De
bt
turn
s
Source: Company reports, Deutsche Bank Source: Company reports, Deutsche Bank
Figure 439: Dividends Figure 440: Cash conversion (CFO/EBITDA)
0.00
0.20
0.40
0.60
0.80
1.00
1.20
1.40
1.60
1.80
2.00
20
02
20
03
20
04
20
05
20
06
20
07
20
08
20
09
20
10
20
11
20
12
20
13
20
14
20
15
20
16
20
17
20
18
20
19
(a) (a) (a) (a) (a) (a) (a) (a) (a) (a) (a) (a) (a) (a) (a) (e) (e) (e)
Div
ide
nd
s p
er
sha
re
0.00
0.50
1.00
1.50
2.00
2.50
3.00
3.50
20
02
20
03
20
04
20
05
20
06
20
07
20
08
20
09
20
10
20
11
20
12
20
13
20
14
20
15
20
16
20
17
20
18
20
19
(a) (a) (a) (a) (a) (a) (a) (a) (a) (a) (a) (a) (a) (a) (a) (e) (e) (e)
Ca
sh c
on
ve
rsio
n r
ati
o
Source: Company reports, Deutsche Bank Source: Company reports, Deutsche Bank
Deutsche Bank Securities Inc. Page 185

9 October 2017
Oil Services & Equipment
Initiation of coverage
Figure 441: Income Statement(a) (a) (a) (a) (a) (e) (e) (e)
In millions of USD 2012 2013 2014 2015 2016 2017 2018 2019
Segment revenues:
Rig Systems 7,077 8,450 9,848 6,964 2,386 1,418 1,316 1,356
Rig Aftermarket 2,138 2,692 3,222 2,515 1,416 1,372 1,495 1,635
Wellbore Technologies 5,184 5,109 5,722 3,718 2,199 2,587 3,362 3,891
Completion & Production 3,994 4,309 4,645 3,365 2,241 2,827 3,858 4,178
Eliminations 1,648 2,207 (1,109) (1,805) (991) (800) (996) (1,099)
Total revenue 20,041 22,767 22,328 14,757 7,251 7,403 9,034 9,962
Segment EBIT:
Rig Systems 1,685 1,615 1,996 1,318 221 40 54 85
Rig Aftermarket 594 729 882 617 294 307 364 416
Wellbore Technologies 983 854 1,047 162 (294) (81) 250 436
Completion & Production 774 695 700 286 8 163 306 410
Eliminations (348) (425) (793) (749) (610) (522) (651) (718)
EBIT 3,688 3,468 3,832 1,634 (381) (93) 323 629
Interest (expense) (48) (111) (105) (103) (105) (101) (97) (97)
Interest income 10 12 18 14 15 16 8 15
Equity income 58 63 58 13 (21) 0 0 0
Other income (60) (32) (33) (114) (53) (13) (16) (16)
PBT 3,648 3,400 3,770 1,444 (545) (191) 218 531
Income tax (expense) (1,130) (1,032) (1,112) (362) 221 38 (15) (37)
Non-controlling interest 8 (1) (5) 0 4 1 4 4
Preferred dividends 0 0 0 0 0 0 0 0
Net income (operating) 2,525 2,367 2,653 1,082 (320) (152) 207 498
Discontinued ops 0 (51) 11 0 0 0 0 0
Unusual after-tax (65) 11 (162) (1,851) (2,092) (81) 0 0
Net income (GAAP) 2,460 2,327 2,502 (769) (2,412) (233) 207 498
Operating EPS 5.91 5.52 6.18 2.79 (0.85) (0.40) 0.55 1.32
GAAP EPS 5.76 5.43 5.83 (1.98) (6.42) (0.62) 0.55 1.32
DPS 0.49 0.91 1.64 1.84 0.61 0.20 0.20 0.20
Diluted shares 427 428 430 388 376 377 377 377
EBITDA 4,316 4,223 4,614 2,381 322 598 1,007 1,313
EBITDA margin 21.5% 18.5% 20.7% 16.1% 4.4% 8.1% 11.1% 13.2%
EBIT margin 18.4% 15.2% 17.2% 11.1% -5.3% -1.3% 3.6% 6.3%
Tax rate 31.0% 30.4% 29.5% 25.1% 40.6% 19.8% 6.9% 6.9%
Total backlog 12,220 16,662 14,322 7,048 3,306 3,320 3,621 4,216
Rig Systems 10,876 15,028 12,542 6,079 2,488 2,086 2,067 2,384
Completion & Production 1,344 1,634 1,780 969 818 1,234 1,554 1,832
New orders 10,043 14,210 8,883 2,313 1,614 2,675 3,652 4,007
Rig Systems 7,829 11,537 6,203 993 463 528 766 1,121
Completion & Production 2,214 2,673 2,680 1,320 1,151 2,147 2,886 2,886
Source: Deutsche Bank
Page 186 Deutsche Bank Securities Inc.

9 October 2017
Oil Services & Equipment
Initiation of coverage
Figure 442: Cash Flow Statement(a) (a) (a) (a) (a) (e) (e) (e)
In millions of USD 2012 2013 2014 2015 2016 2017 2018 2019
Net income 2,525 2,367 2,653 1,082 (320) (152) 207 498
Depreciation 628 755 782 747 703 691 684 684
Deferred tax (97) (333) (300) (258) (198) 19 0 0
Chg in receivables (517) (493) (153) 1,091 845 (287) (251) (126)
Chg in inventories (1,061) 396 (710) 410 782 (267) (57) 85
Chg in payables (19) 9 95 (570) (243) 160 65 54
Other (839) 696 247 (1,170) (609) (65) 118 97
Cash from operations 620 3,397 2,614 1,332 960 99 766 1,292
Capital expenditures (583) (669) (699) (453) (284) (180) (243) (295)
Free cash flow 37 2,728 1,915 879 676 (82) 523 997
Acquisitions (2,880) (2,397) (291) (86) (230) (82) 0 0
Asset sales 0 0 0 0 0 0 0 0
Dividends paid (209) (389) (703) (710) (230) (76) (75) (75)
ESPP | options 113 58 108 7 4 10 0 0
Equity issuance, net 0 0 (779) (2,221) 0 0 0 0
Debt issuance, net 2,637 (1) 18 762 (900) (503) 0 0
Other 86 118 (168) (87) 8 41 0 0
Chg in cash (216) 117 100 (1,456) (672) (691) 447 922
FCF per share 0 6 4 2 2 (0) 1 3
Capex / revenue 0 0 0 0 0 0 0 0
Capex / depreciation 1 1 1 1 0 0 0 0
Source: Deutsche Bank
Deutsche Bank Securities Inc. Page 187

9 October 2017
Oil Services & Equipment
Initiation of coverage
Figure 443: Balance Sheet(a) (a) (a) (a) (a) (e) (e) (e)
In millions of USD 2012 2013 2014 2015 2016 2017 2018 2019
Cash and equivalents 3,319 3,436 3,536 2,080 1,408 717 1,164 2,086
Accounts receivable 4,320 4,896 4,416 2,926 2,083 2,364 2,614 2,741
Inventories 5,891 5,603 5,281 4,678 3,325 3,596 3,653 3,568
Costs in excess of billings 1,225 1,539 1,878 1,250 665 679 751 787
Other current assets 923 949 1,051 867 395 372 428 467
Total current assets 15,678 16,423 16,162 11,801 7,876 7,727 8,610 9,649
Net PP&E 2,945 3,408 3,362 3,124 3,150 2,805 2,364 1,975
Goodwill 7,172 9,049 8,539 6,980 6,067 6,129 6,129 6,129
Deferred taxes 413 372 503 488 86 70 70 70
Intangibles 4,743 5,055 4,444 3,849 3,530 3,438 3,438 3,438
Investment in affiliates 393 390 362 327 307 306 306 306
Other assets 140 115 190 156 124 176 203 221
Total assets 31,484 34,812 33,562 26,725 21,140 20,652 21,120 21,788
Accounts payable 1,200 1,275 1,189 623 414 526 591 645
Accrued expenses 2,571 2,763 3,518 2,284 1,568 1,738 1,998 2,180
Billings in excess of costs 1,189 1,771 1,775 785 440 361 393 458
Current debt 1 0 152 2 506 6 6 6
Other current liabilities 688 869 740 555 119 83 95 104
Total current liabilities 5,649 6,678 7,374 4,249 3,047 2,714 3,083 3,393
Long-term debt 3,148 3,149 3,014 3,928 2,708 2,708 2,708 2,708
Deferred taxes 1,997 2,292 1,972 1,805 1,064 999 999 999
Other LT liabilities 334 363 430 283 318 307 307 307
Non-controlling int 117 100 80 77 63 67 63 59
Shareholders' equity 20,239 22,230 20,692 16,383 13,940 13,857 13,960 14,322
Total liabilities and equity 31,484 34,812 33,562 26,725 21,140 20,652 21,120 21,788
Total debt 3,149 3,149 3,166 3,930 3,214 2,714 2,714 2,714
Net debt (170) (287) (370) 1,850 1,806 1,997 1,550 628
Debt/capital 13% 12% 13% 19% 19% 16% 16% 16%
Debt/equity 16% 14% 15% 24% 23% 20% 19% 19%
Debt turns 0.7 0.7 0.7 1.7 10.0 4.5 2.7 2.1
Source: Deutsche Bank
Page 188 Deutsche Bank Securities Inc.

9 October 2017
Oil Services & Equipment
Initiation of coverage
Rating
HoldNorth AmericaUnited States
IndustrialsOil Services & Equipment
Company
Noble Corp.
Reuters Bloomberg
NE.N NE US
Grinding Out Debt MaturitiesInitiating coverage with a Hold rating and an $4 price targetWhile the deepwater markets are pivoting, we believe the recovery will be slowand laborious. The extent of the supply demand imbalance and the stresses onthe balance sheets industry-wide are going to keep fierce pricing tactics in playfor a number of years in our view. While we believe the alpha short opportunityis largely used up, the upside in our view is limited as EBITDA erodes even lowerfor the next two years. One more source of volatility for NE is the risk related tothe creditors of Paragon Offshore regarding any fraudulent conveyance claimsagainst NE. We believe this combined with the string of debt maturities each yeartotaling over $800 million through 2021 will keep investors on the sidelines fornow.
Noble among the least proactive in managing its balance sheet
Valuation & RisksWe are initiating coverage with a $4price target. This is 4.5x our estimate ofthe company’s normalized EBITDA of $1.1billion, which is two-turns below the 6.5xten-year average multiple. The company iscurrently trading at 12x our fiscal 2018EBITDA estimate of $0.4 billion. We believethe discounted multiple is warranted due tothe severely diminished earnings power ofthe company and the significant challengesthat lie ahead for the industry in termsof utilization and pricing power as thedeepwater market copes with the historicsupply demand imbalance. The debt burdenin the coming years is another headwind.The main investment risks include: 1) shiftsin OPEC policy and the influence thatwould have on oil prices and ultimately USupstream capital expenditures, 2) negativerevisions to global oil demand, and 3)increased flow of capex directed away fromthe offshore and toward onshore operations.Upside risks are mainly associated witha rapid rise in oil prices, which wouldprompt the firmly entrenched sentiment inthe offshore drilling names to pivot in ourview.
While many of Noble’s peers opted to refinance and/or pay down debt or evenissue equity at considerably higher stock prices to manage leverage and debtmaturities in the most challenging market ever experienced, NE has not tappedcapital markets and has instead opted to grind the maturities out as they come.This has made the markets uneasy in our view as the uncertainty regarding thescope of the recovery and the timing pushes investors toward more fiscally stablebalance sheets. The uncertainty related to the Paragon creditors only adds to theuneasiness.
Forecasts and ratios
Year End Dec 31 2016A 2017E 2018E
1Q EPS 0.32 -0.17A -0.38
2Q EPS 0.01 -0.32A -0.35
3Q EPS -0.23 -0.39 -0.33
4Q EPS -0.15 -0.41 -0.32
FY EPS (USD) -0.05 -1.29 -1.39
OLD FY EPS (USD) -0.05 – –
% Change -4.7% – –
P/E (x) – – –
DPS (USD) 0.19 0.00 0.00
Dividend Yield (%) 2.4 0.0 0.0
Revenue (USDm) 1,892.7 1,193.6 1,122.5Source: Deutsche Bank estimates, company data
David HavensResearch [email protected]
Price at 5 Oct 2017 (USD) 4.50
Price target 4.00
52-week range 7.69 - 3.16
Price/price relative
Noble Corp. S&P 500 INDEX (Rebased)
Jan '15 May '15 Sep '15 Jan '16 May '16 Sep '16 Jan '17 May '17 Sep '170
5
10
15
20
25
30
Performance(%)
1m 3m 12m
Absolute 28.4 12.3 -26.2
S&P 500INDEX
2.5 4.5 18.0
Source: Deutsche Bank
Stock & option liquidity data
Market Cap (USDm) 1,101.0
Shares outstanding (m) 244.7
Free float (%) –
Volume (5 Oct 2017) 1,839,545
Option volume (und. shrs., 1M avg.) 757,584Source: Deutsche Bank
Deutsche Bank Securities Inc. Page 189

9 October 2017
Oil Services & Equipment
Initiation of coverage
Key investment themes
Highest customer concentration among its peersNoble’s backlog is $3.1 billion, which is down 73% from the $11.5 billion inJanuary 2009. The standout customer is Royal Dutch Shell, which is 53% ofNoble’s total backlog. Noble’s top five customers are 98% of the total backlog.About 40% of its ultra-deepwater availability and 46% of its jackup availability arecontracted for 2018.
Figure 444: Backlog by customer
-
0.2
0.4
0.6
0.8
1.0
1.2
1.4
1.6
1.8
RDS Aramco STO XOM Maersk TBA HES TOT MUR PTTEP
In b
illi
on
s o
f U
SD
Source: Company reports, Deutsche Bank
Figure 445: Revenues in backlog Figure 446: Year-end backlog
0
100
200
300
400
500
600
700
800
900
2017 2018 2019 2020 2021
In m
illi
on
s o
f U
SD
Ultra-deepwater Deepwater Jackups
0
500
1,000
1,500
2,000
2,500
3,000
2017 2018 2019 2020 2021
In m
illi
on
s o
f U
SD
Ultra-deepwater Deepwater Jackups
Source: Company reports, Deutsche Bank Source: Company reports, Deutsche Bank
Page 190 Deutsche Bank Securities Inc.

9 October 2017
Oil Services & Equipment
Initiation of coverage
Figure 447: Noble Corporation backlog details
Revenue in backlog ($m) 2017 2018 2019 2020 2021 Total backlog Abbrev ($bn)
Ultra-deepwater 127 468 370 342 290 Ultra-deepwater UDW 1.8
Deepwater 12 0 0 0 0 Deepwater DW 0.0
Harsh-environment Harsh-environment HE
Midwater Midwater MW
Jackups 151 377 304 267 116 Jackups JU 1.3
Total backlog 290 845 674 609 406 Total backlog 3.1
Days committed 2017 2018 2019 2020 2021
Ultra-deepwater 37% 40% 35% 33% 27%
Deepwater 50% 0% 0% 0% 0%
Harsh-environment
Midwater
Jackups 77% 46% 27% 21% 14%
Total backlog 58% 40% 28% 25% 19%
Year-end backlog ($m) 2017 2018 2019 2020 2021
Ultra-deepwater 1,715 1,248 878 536 245
Deepwater 0 0 0 0 0
Harsh-environment
Midwater 2017 2018 2019
Jackups 1,103 726 421 155 38 Total debt 4,043 3,793 3,593
Total backlog 2,818 1,973 1,299 690 284 Debt / YE backlog 1.4 1.9 2.8
Backlog by customer ($m) #1 #2 #3 #4 #5 Top 5 customers in backlog Percent $bn
Ultra-deepwater RDS XOM MUR APA APC RDS #1 53% 1.6
Backlog 1,631 203 8 - - Aramco #2 19% 0.6
% of backlog 89% 11% 0% 0% 0% STO #3 17% 0.5
Deepwater HES APA APC Aramco JX Nippon XOM #4 9% 0.3
Backlog 12 - - - - Maersk #5 1% 0.0
% of backlog 100% 0% 0% 0% 0% Other 2% 0.1
Harsh-environment
Backlog 09/18/17 12/31/17 12/31/18 12/31/19
% of backlog Fleet composition 2017 2018 2019
Midwater Ultra-deepwater 12 12 12
Backlog Deepwater 2 2 2
% of backlog Harsh-environment
Jackups Aramco STO XOM Maersk TBA Midwater
Backlog 591 525 65 33 18 Jackups 14 14 14
% of backlog 47% 42% 5% 3% 1% Total in fleet 28 28 28
Backlog by rig type
UDW
DW
HE
MW
JU
Source: Company reports, Deutsche Bank
Deutsche Bank Securities Inc. Page 191

9 October 2017
Oil Services & Equipment
Initiation of coverage
Valuation and risksWe are initiating coverage with a $4 price target. This is 4.5x our estimate of thecompany’s normalized EBITDA of $1.1 billion, which is two-turns below the 6.5xten-year average multiple. The company is currently trading at 12x our fiscal 2018EBITDA estimate of $0.4 billion. We believe the discounted multiple is warranteddue to the severely diminished earnings power of the company and the significantchallenges that lie ahead for the industry in terms of utilization and pricing poweras the deepwater market copes with the historic supply demand imbalance. Thedebt burden in the coming years is another headwind.
In terms of steel value, we assess the trough net asset value at $3.25 per share,which assumes the market endures another three years of high volumes ofcold-stacking once contracts expire and leading edge market rates that stay atbreakeven levels ($160-170 kpd).
The main investment risks include: 1) shifts in OPEC policy and the influencethat would have on oil prices and ultimately US upstream capital expenditures, 2)negative revisions to global oil demand, 3) fraudulent conveyance risk related toParagon Offshore, and 4) increased flow of capex directed away from the offshoreand toward onshore operations. Upside risks are mainly associated with a rapidrise in oil prices, which would prompt the firmly entrenched sentiment in theoffshore drilling names to pivot in our view.
Figure 448: The EV/EBITDA valuation band as blown out Figure 449: The 5yr EV/EBITDA leading up to 2014
-
2
4
6
8
10
12
14
-1 std 10yr avg +1 std
5.8
2
3
4
5
6
7
8
9
10
Se
p-0
7
Jan
-08
Ma
y-0
8
Se
p-0
8
Jan
-09
Ma
y-0
9
Se
p-0
9
Jan
-10
Ma
y-1
0
Se
p-1
0
Jan
-11
Ma
y-1
1
Se
p-1
1
Jan
-12
Ma
y-1
2
Se
p-1
2
Jan
-13
Ma
y-1
3
Se
p-1
3
Jan
-14
Ma
y-1
4
Se
p-1
4
-1 std 10yr avg +1 std
Source: Factset Source: Factset
Paragon Offshore creditor riskNoble completed the spin-off of its standard jackups and floaters in 2014 in a newpublically traded company called Paragon Offshore. Paragon filed for relief underChapter 11 bankruptcy in 2016 and in May 2017 filed a plan with its creditorsthat included a $10 million litigation trust to pursue litigation against Noble, mostlikely for fraudulent conveyance.
Page 192 Deutsche Bank Securities Inc.

9 October 2017
Oil Services & Equipment
Initiation of coverage
Company description
Noble Corporation (NE) is a contract drilling company with a fleet of 28mobile offshore drilling rigs including 12 ultra-deepwater floaters, two deepwaterfloaters, and 14 jackups. Since 2008, the company has undertaken severalinitiatives to reposition itself competitively in the ultra-deepwater and high-specification jackup markets. Noble spent approximately $4.3 billion on theconstruction of eight ultra-deepwater floaters and about $2.0 billion on sevennewbuild jackups. In 2014, the company spun-off its standard specificationjackups and floaters into a publically traded company, Paragon Offshore.
Figure 450: Revenues by rig type
Jackups
53%
Semis
39%
Drillships
7%
Other
1%
2009
ps
Jackups
26%
Semis
9%
Drillships
65%
Other
0%
2016
Source: Company reports, Deutsche Bank
Figure 451: Change in fleet size and mix
43 49 50
53 53 54 54 57
62 63 66 68
31 30 29 28 28
0
10
20
30
40
50
60
70
80
20
02
20
03
20
04
20
05
20
06
20
07
20
08
20
09
20
10
20
11
20
12
20
13
20
14
20
15
20
16
20
17
20
18
(a) (a) (a) (a) (a) (a) (a) (a) (a) (a) (a) (a) (a) (a) (a) (e) (e)
Jackups Semis Drillships
Source: Company reports, Deutsche Bank
Deutsche Bank Securities Inc. Page 193

9 October 2017
Oil Services & Equipment
Initiation of coverage
Principal Sources and Uses of Cash Flow
Ultra-deepwater and high-specification jackups driving NE’s earningsNoble’s principal source of cash flow is the ultra-deepwater and high-specificationjackup market. Like most of its peers, Noble’s earnings power has diminished asthe industry copes with a severe supply demand imbalance in the deepwater thatwill likely impair dayrates for several more years. NE achieved its highest EBITDAof $2.45 billion in 2009 and we expect that to erode to about $320 million by2019. Using a dayrate recovery to $300 kpd for an ultra-deepwater drillship, weexpect NE can have a normalized EBITDA of about $1.1 billion, but not prior to2020 in our view.
Figure 452: EBITDA eroding lower
0%
10%
20%
30%
40%
50%
60%
70%
80%
0
500
1,000
1,500
2,000
2,500
3,000
20
02
20
03
20
04
20
05
20
06
20
07
20
08
20
09
20
10
20
11
20
12
20
13
20
14
20
15
20
16
20
17
20
18
20
19
(a) (a) (a) (a) (a) (a) (a) (a) (a) (a) (a) (a) (a) (a) (a) (e) (e) (e)
In m
illio
ns
of
US
D
Consolidated EBITDA EBITDA margin
Source: Company reports, Deutsche Bank
Newbuild program is complete, no more funding for new rigsNoble spent over $6 billion on newbuilds since 2008, which ended with thedelivery of the jackup Noble Lloyd Noble in 2016. While some of its peers arelooking to replenish earnings through M&A, we do not expect NE to be active inthis market. Debt maturities are the primary use of capital with over $800 milliontotal due over a series of maturities though 2021. The company has been amongthe least proactive in managing its debt maturities and is now looking to grindthem out as they come. In 2018, $250 million is due followed by $200 million in2019.
Page 194 Deutsche Bank Securities Inc.

9 October 2017
Oil Services & Equipment
Initiation of coverage
Figure 453: Free cash flow and dividends Figure 454: Capex trend
(2,500)
(2,000)
(1,500)
(1,000)
(500)
0
500
1,000
1,500
2,000
20
02
20
03
20
04
20
05
20
06
20
07
20
08
20
09
20
10
20
11
20
12
20
13
20
14
20
15
20
16
20
17
20
18
20
19
(a) (a) (a) (a) (a) (a) (a) (a) (a) (a) (a) (a) (a) (a) (a) (e) (e) (e)
In m
illio
ns
of
US
D
Free cash flow Dividends paid
0
500
1,000
1,500
2,000
2,500
3,000
20
02
20
03
20
04
20
05
20
06
20
07
20
08
20
09
20
10
20
11
20
12
20
13
20
14
20
15
20
16
20
17
20
18
20
20
(a) (a) (a) (a) (a) (a) (a) (a) (a) (a) (a) (a) (a) (a) (a) (e) (e) (e)
In m
illio
ns
of
USD
Capital expenditures Depreciation
Source: Company reports, Deutsche Bank Source:
Company reports, Deutsche Bank
Figure 455: Debt turns Figure 456: Net debt
0.0
2.0
4.0
6.0
8.0
10.0
12.0
20
02
20
03
20
04
20
05
20
06
20
07
20
08
20
09
20
10
20
11
20
12
20
13
20
14
20
15
20
16
20
17
20
18
20
19
(a) (a) (a) (a) (a) (a) (a) (a) (a) (a) (a) (a) (a) (a) (a) (e) (e) (e)
De
bt
turn
s
0
1,000
2,000
3,000
4,000
5,000
6,000
20
02
20
03
20
04
20
05
20
06
20
07
20
08
20
09
20
10
20
11
20
12
20
13
20
14
20
15
20
16
20
17
20
18
20
19
(a) (a) (a) (a) (a) (a) (a) (a) (a) (a) (a) (a) (a) (a) (a) (e) (e) (e)
In m
illio
ns
of
USD
Source: Company reports, Deutsche Bank Source: Company reports, Deutsche Bank
Figure 457: EPS trend
(2.00)
(1.00)
0.00
1.00
2.00
3.00
4.00
5.00
6.00
7.00
2002
2003
2004
2005
2006
2007
2008
2009
2010
2011
2012
2013
2014
2015
2016
2017
2018
2019
(a) (a) (a) (a) (a) (a) (a) (a) (a) (a) (a) (a) (a) (a) (a) (e) (e) (e)
EPS
Source: Company reports, Deutsche Bank
Deutsche Bank Securities Inc. Page 195

9 October 2017
Oil Services & Equipment
Initiation of coverage
Figure 458: Fleet profile
Rig name
Water
depth (ft) Rig type
Year in
service Rig design
Backlog
(yrs)
Backlog
($m)
Ultra-deepwater (12):
Noble Bob Douglas 10,000 DS-DP 2013 GustoMSC P10000 3.5 210.9
Noble Don Taylor 10,000 DS-DP 2013 GustoMSC P10000 1.4 254.5
Noble Sam Croft 10,000 DS-DP 2014 GustoMSC P10000 - -
Noble Tom Madden 10,000 DS-DP 2014 GustoMSC P10000 - -
Noble Globetrotter I 10,000 DS-DP 2011 STX-Huisman GT-10000 4.8 484.3
Noble Globetrotter II 10,000 DS-DP 2013 STX-Huisman GT-10000 6.0 555.6
Noble Bully I 8,200 DS-DP 2011 GustoMSC PRD12,000 - -
Noble Bully II 8,250 DS-DP 2011 GustoMSC PRD12,000 4.6 337.0
Noble Danny Adkins 12,000 6th 1999/2009 Noble Modified Bingo 9000 - -
Noble Jim Day 12,000 6th 1999/2010 Noble Modified Bingo 9000 - -
Noble Dave Beard 10,000 6th 1986/2009 F&Gn 9500 Enhanced Pacesetter - -
Noble Clyde Boudreaux 10,000 5th 1987/2007 F&Gn 9500 Enhanced Pacesetter - -
Deepwater (2):
Noble Amos Runner 8,000 4th 1982/1999 Noble EVA-4000 - -
Noble Paul Romano 6,000 4th 1981/1998 Noble EVA-4000 0.3 12.1
Jackups (14):
Noble Lloyd Noble 492 IC 2016 GustoMSC CJ70-X150A 3.2 524.9
Noble Hans Deul 400 IC 2009 Friede & Goldman JU-2000E 0.2 5.1
Noble Houston Colbert 400 IC 2014 Friede & Goldman JU-3000N - -
Noble Mick O Brien 400 IC 2013 Friede & Goldman JU-3000N - -
Noble Regina Allen 400 IC 2013 Friede & Goldman JU-3000N 2.0 64.6
Noble Roger Lewis 400 IC 2007 Friede & Goldman JU-2000E 4.5 258.4
Noble Sam Hartley 400 IC 2014 Friede & Goldman JU-3000N 0.3 11.5
Noble Sam Turner 400 IC 2014 Friede & Goldman JU-3000N 0.9 33.4
Noble Scott Marks 400 IC 2009 Friede & Goldman JU-2000E 4.8 277.8
Noble Tom Prosser 400 IC 2014 Friede & Goldman JU-3000N 0.1 5.6
Noble Alan Hay 300 IC 1980/2005 Levingston Class 111-C 0.3 8.8
Noble David Tinsley 300 IC 1981/2010 Mitsui 300C-38 0.3 8.8
Noble Gene House 300 IC 1981/1998 Mitsui 300C-38 1.2 27.5
Noble Joe Beall 300 IC 1981/2004 Mitsui 300C-38 1.2 27.5
Source: Company reports, Deutsche Bank
Page 196 Deutsche Bank Securities Inc.

9 October 2017
Oil Services & Equipment
Initiation of coverage
Figure 459: Income Statement(a) (a) (a) (a) (a) (a) (a) (a) (e) (e) (e)
In millions of USD 2009 2010 2011 2012 2013 2014 2015 2016 2017 2018 2019
Segment revenues:
Jackups 1,879 1,200 1,008 1,254 1,577 1,211 644 484 580 601 623
Semis 1,353 1,106 1,237 1,530 1,515 1,265 698 166 45 38 38
Drillships 252 356 311 565 960 1,529 1,638 1,182 541 456 480
Other 32 35 60 82 52 16 0 0 0 0 0
Reimbursables 125 111 79 115 112 104 90 60 28 27 28
Total revenue 3,641 2,807 2,696 3,547 4,216 4,125 3,071 1,893 1,194 1,123 1,169
Op costs 1,111 1,239 1,477 1,917 2,147 2,008 1,308 914 633 649 769
G&A 80 92 91 100 118 107 77 69 65 65 65
D&A 408 540 659 759 879 829 634 611 541 492 433
EBIT 2,042 936 469 771 1,072 1,182 1,051 299 (45) (84) (98)
Interest (expense) (2) (9) (56) (86) (106) (155) (214) (223) (329) (352) (337)
Interest income 7 10 4 5 4 1 7 0 0 0 0
Equity income 0 0 0 0 0 0 0 0 0 0 0
Other income 0 0 (2) 0 1 (1) (0) 0 9 11 11
PBT 2,047 936 415 690 970 1,027 844 76 (365) (425) (424)
Income tax (expense) (361) (144) (88) (142) (162) (179) (130) (16) 64 85 85
Non-controlling interest 0 (0) 8 (34) (68) (75) (72) (72) (16) (0) 4
Preferred dividends 0 0 0 0 0 0 0 0 0 0 0
Net income (operating) 1,686 793 335 514 740 772 642 (12) (316) (340) (335)
Discontinued ops 0 0 0 0 0 (35) 0 0 (1) 0 0
Unusual after-tax (7) (19) 35 8 42 (729) (131) (944) (275) 0 0
Net income (GAAP) 1,679 773 370 522 782 8 511 (956) (592) (340) (335)
Operating EPS 6.45 3.11 1.32 2.01 2.90 3.01 2.60 (0.05) (1.29) (1.39) (1.37)
GAAP EPS 6.42 3.03 1.46 2.05 3.06 (0.01) 2.06 (3.93) (2.42) (1.39) (1.37)
DPS 0.18 0.89 0.60 0.55 0.77 1.50 1.28 0.19 0.00 0.00 0.00
Diluted shares 259 254 252 253 254 253 242 243 245 245 245
Consolidated EBITDA 2,450 1,476 1,128 1,530 1,951 2,011 1,686 910 496 409 335
EBITDA margin 67.3% 52.6% 41.8% 43.1% 46.3% 48.7% 54.9% 48.1% 41.6% 36.4% 28.7%
EBIT margin 56.1% 33.3% 17.4% 21.7% 25.4% 28.7% 34.2% 15.8% -3.8% -7.5% -8.4%
Tax rate 18% 15% 21% 21% 17% 17% 15% 22% 18% 20% 20%
Utilization:
Jackups 82% 79% 75% 83% 91% 85% 85% 83% 91% 97% 99%
Semis 99% 86% 82% 85% 81% 71% 64% 23% 17% 17% 17%
Drillships 83% 89% 59% 69% 81% 95% 100% 82% 60% 63% 82%
Dayrates ($000):
Jackups 148 97 86 97 111 140 162 122 125 122 124
Semis 368 288 296 349 368 395 372 256 123 0 0
Drillships 254 256 242 279 334 440 503 491 314 250 202
Source: Deutsche Bank
Deutsche Bank Securities Inc. Page 197

9 October 2017
Oil Services & Equipment
Initiation of coverage
Figure 460: Cash Flow Statement(a) (a) (a) (a) (a) (a) (a) (a) (e) (e) (e)
In millions of USD 2009 2010 2011 2012 2013 2014 2015 2016 2017 2018 2019
Net income 1,686 793 335 514 740 772 642 (12) (316) (340) (335)
Depreciation 408 540 659 759 879 829 634 611 541 492 433
Deferred tax 37 (41) (82) (20) (16) (11) (36) (190) 303 0 0
Chg in receivables (3) 260 (200) (157) (205) 380 70 180 86 (14) (10)
Chg in payables (61) 177 61 (86) (3) (82) (42) (115) (21) 7 18
Other 69 (74) (14) 371 307 (110) 494 655 (265) 16 12
Cash from operations 2,137 1,654 759 1,382 1,702 1,778 1,762 1,128 328 161 117
Capital expenditures (1,431) (1,284) (2,559) (1,670) (2,488) (2,073) (423) (660) (106) (115) (260)
Free cash flow 705 370 (1,800) (288) (785) (295) 1,340 468 222 46 (143)
Acquisitions 0 (1,630) 0 0 0 0 0 0 0 0 0
Asset sales 0 0 0 0 61 1,606 0 0 0 0 0
Dividends paid (48) (227) (151) (138) (195) (387) (316) (48) 0 0 0
ESPP | options 5 12 10 15 3 2 0 0 0 0 0
Equity issuance, net (204) (229) (10) (11) (8) (154) (101) 0 0 0 0
Debt issuance, net (173) 1,313 1,329 551 921 (688) (381) (69) (300) (250) (200)
Other (64) (6) 523 (86) (165) (131) (99) (138) (28) 0 0
Chg in cash 222 (398) (99) 43 (168) (46) 444 213 (106) (204) (343)
FCF per share 2.72 1.46 (7.14) (1.14) (3.10) (1.16) 5.53 1.93 0.91 0.19 (0.58)
Capex / revenue 0.39 0.46 0.95 0.47 0.59 0.50 0.14 0.35 0.09 0.10 0.22
Capex / depreciation 3.51 2.38 3.89 2.20 2.83 2.50 0.67 1.08 0.20 0.23 0.60
Source: Deutsche Bank
Page 198 Deutsche Bank Securities Inc.
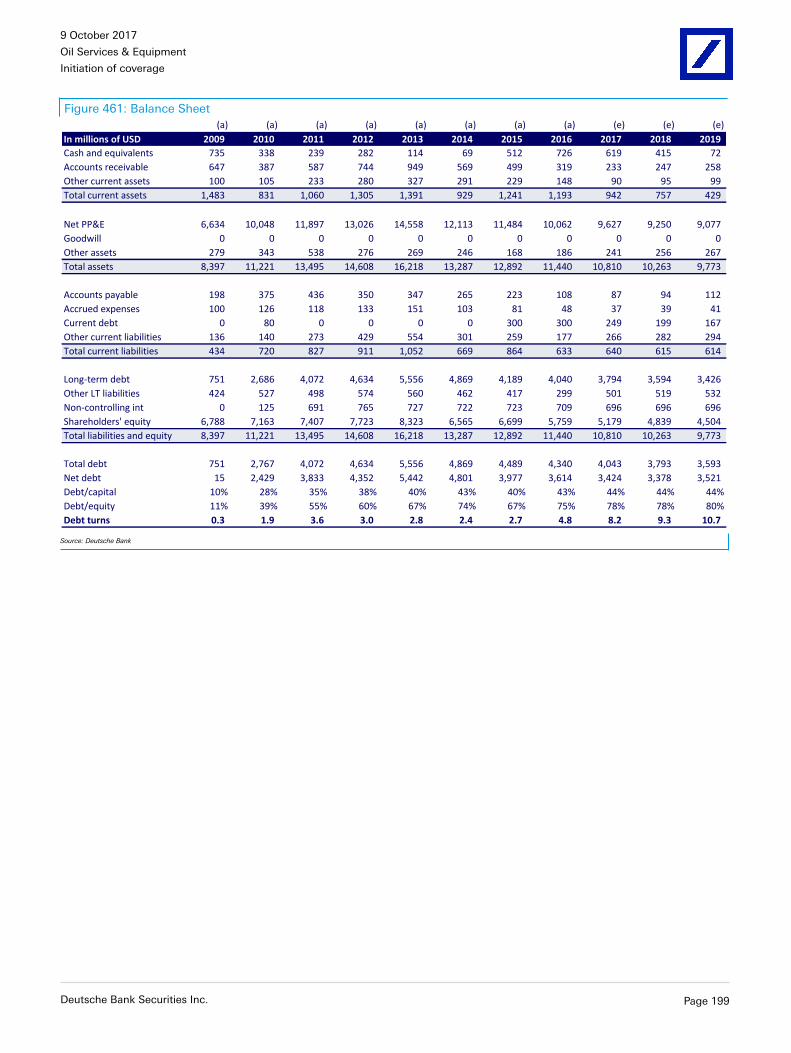
9 October 2017
Oil Services & Equipment
Initiation of coverage
Figure 461: Balance Sheet(a) (a) (a) (a) (a) (a) (a) (a) (e) (e) (e)
In millions of USD 2009 2010 2011 2012 2013 2014 2015 2016 2017 2018 2019
Cash and equivalents 735 338 239 282 114 69 512 726 619 415 72
Accounts receivable 647 387 587 744 949 569 499 319 233 247 258
Other current assets 100 105 233 280 327 291 229 148 90 95 99
Total current assets 1,483 831 1,060 1,305 1,391 929 1,241 1,193 942 757 429
Net PP&E 6,634 10,048 11,897 13,026 14,558 12,113 11,484 10,062 9,627 9,250 9,077
Goodwill 0 0 0 0 0 0 0 0 0 0 0
Other assets 279 343 538 276 269 246 168 186 241 256 267
Total assets 8,397 11,221 13,495 14,608 16,218 13,287 12,892 11,440 10,810 10,263 9,773
Accounts payable 198 375 436 350 347 265 223 108 87 94 112
Accrued expenses 100 126 118 133 151 103 81 48 37 39 41
Current debt 0 80 0 0 0 0 300 300 249 199 167
Other current liabilities 136 140 273 429 554 301 259 177 266 282 294
Total current liabilities 434 720 827 911 1,052 669 864 633 640 615 614
Long-term debt 751 2,686 4,072 4,634 5,556 4,869 4,189 4,040 3,794 3,594 3,426
Other LT liabilities 424 527 498 574 560 462 417 299 501 519 532
Non-controlling int 0 125 691 765 727 722 723 709 696 696 696
Shareholders' equity 6,788 7,163 7,407 7,723 8,323 6,565 6,699 5,759 5,179 4,839 4,504
Total liabilities and equity 8,397 11,221 13,495 14,608 16,218 13,287 12,892 11,440 10,810 10,263 9,773
Total debt 751 2,767 4,072 4,634 5,556 4,869 4,489 4,340 4,043 3,793 3,593
Net debt 15 2,429 3,833 4,352 5,442 4,801 3,977 3,614 3,424 3,378 3,521
Debt/capital 10% 28% 35% 38% 40% 43% 40% 43% 44% 44% 44%
Debt/equity 11% 39% 55% 60% 67% 74% 67% 75% 78% 78% 80%
Debt turns 0.3 1.9 3.6 3.0 2.8 2.4 2.7 4.8 8.2 9.3 10.7
Source: Deutsche Bank
Deutsche Bank Securities Inc. Page 199

9 October 2017
Oil Services & Equipment
Initiation of coverage
Rating
HoldNorth AmericaUnited States
IndustrialsOil Services & Equipment
Company
Oceaneering Int'l.
Reuters Bloomberg
OII.N OII US
Shifting Focus to Production RelatedExpendituresInitiating coverage with a Hold rating and a $28 price targetIndustry before company. While OII has a strong free cash flow track record andhas maintained a flexible balance sheet, the deepwater industry is facing the mostchallenging environment in its history. Pricing remains elusive and volumes areset for a very slow grind higher as a deepwater spending recovery looks to be lowcalorie and elongated. While we believe OII has found an earnings bottom, theupside potential in 2018 is confined in our view by stubbornly low oil prices andstubbornly low deepwater spending activity.
OII has been among the top relative outperformers to-dateThe resiliency of its business model despite the severity of the downturn hasenabled the stock to be among the best relative outperformers year-to-date. OIIhas managed what it can control and has sustained strong relative free cashflows in the process. We believe OII is among the better positioned deepwaterexposures, and for investors that are looking for downside protection, OII offersa more fiscally stable business model in the deepwater.
Valuation & RisksOur $28 price target is 8.0x our estimate ofthe company’s normalized EBITDA powerof $380 million, which is in-line its five-year average 8.0x multiple leading up to the2014 collapse in oil prices. The company iscurrently trading at 12.0x our 2018 EBITDAestimate of $239 million.The main investment risks include: 1) shiftsin OPEC policy and the influence thatwould have on oil prices and ultimately USupstream capital expenditures, 2) negativerevisions to global oil demand, 3) pricingtactics getting increasingly more aggressivefor deepwater market share, and 4) anotherleg down in deepwater spending globally.
Forecasts and ratios
Year End Dec 31 2016A 2017E 2018E
1Q EPS 0.30 -0.04A 0.00
2Q EPS 0.27 0.02A 0.04
3Q EPS 0.17 0.05 0.07
4Q EPS 0.03 -0.00 0.03
FY EPS (USD) 0.77 0.03 0.14
OLD FY EPS (USD) 0.77 – –
% Change 0.0% – –
P/E (x) 38.7 – 184.1
DPS (USD) 0.96 0.60 0.60
Dividend Yield (%) 3.2 2.4 2.4
Revenue (USDm) 2,271.6 1,920.6 1,937.5Source: Deutsche Bank estimates, company data
David HavensResearch [email protected]
Price at 5 Oct 2017 (USD) 25.47
Price target 28.00
52-week range 31.53 - 21.03
Price/price relative
Oceaneering Int'l. S&P 500 INDEX (Rebased)
Jan '15 May '15 Sep '15 Jan '16 May '16 Sep '16 Jan '17 May '17 Sep '1710
20
30
40
50
60
70
80
90
Performance(%)
1m 3m 12m
Absolute 10.7 9.8 -5.2
S&P 500INDEX
2.5 4.5 18.0
Source: Deutsche Bank
Stock & option liquidity data
Market Cap (USDm) 2,511.3
Shares outstanding (m) 98.6
Free float (%) 99
Volume (5 Oct 2017) 533,127
Option volume (und. shrs., 1M avg.) 27,711Source: Deutsche Bank
Page 200 Deutsche Bank Securities Inc.

9 October 2017
Oil Services & Equipment
Initiation of coverage
Key investment themes
Deepwater exposure creating earnings dragThe days of winning as many newbuild deepwater rig contracts as possible areover and OII is pivoting its business mix away from drilling support to productionservices, or vessel-based activity. The current mix is 61% drilling support and39% vessel-based activity. Its other businesses are generally tied to subseainstallations and the cumulative growth in the installed base of subsea facilities.OII also benefits from maintenance, repair, and inspection work, which someoperators have postponed during the downturn. Effectively, OII has exposure toall phases of the well lifecycle, but the macro is not cooperating as deepwateractivity is poised to grind higher at a very laborious pace through 2019 in ourview. ROV pricing remains challenging and has yet to hit an inflection point towhere OII would have any leverage to increase price.
Figure 462: Deepwater drilling outlook (DBe)
258227
164131
9466
1463
99
258
227
164145
157165
0
50
100
150
200
250
300
2014 2015 2016 2017(e) 2018(e) 2019(e)
Rig
ye
ars
Rig years in backlog Rig years added
Source: ODS-Petrodata, Deutsche Bank
Figure 463: Floating rig utilization Figure 464: OII working ROV’s
40%
50%
60%
70%
80%
90%
100%
Jan
-85
Jan
-87
Jan
-89
Jan
-91
Jan
-93
Jan
-95
Jan
-97
Jan
-99
Jan
-01
Jan
-03
Jan
-05
Jan
-07
Jan
-09
Jan
-11
Jan
-13
Jan
-15
Jan
-17
Total utilization Marketed utilization
-
50
100
150
200
250
300
(a) (a) (a) (a) (a) (a) (a) (a) (a) (a) (e) (e) (e)
2007 2008 2009 2010 2011 2012 2013 2014 2015 2016 2017 2018 2019
Source: ODS-Petrodata Source: Company reports, Deutsche Bank
Deutsche Bank Securities Inc. Page 201

9 October 2017
Oil Services & Equipment
Initiation of coverage
Valuation and risksOur $28 price target is 8.0x our estimate of the company’s normalized EBITDApower of $380 million, which is in-line its five-year average 8.0x multiple leadingup to the 2014 collapse in oil prices. The company is currently trading at 12.0xour 2018 EBITDA estimate of $239 million.
The main investment risks include: 1) shifts in OPEC policy and the influencethat would have on oil prices and ultimately US upstream capital expenditures,2) negative revisions to global oil demand, 3) pricing tactics getting increasinglymore aggressive for deepwater market share, and 4) another leg down indeepwater spending globally.
Figure 465: The P/E valuation band as blown out Figure 466: The 5yr P/E leading up to 2014
1
4
16
64
256
1,024
4,096
Jan-10 Jan-11 Jan-12 Jan-13 Jan-14 Jan-15 Jan-16 Jan-17
Log
ari
thm
ic s
cale
-1 std 5yr avg +1 std
3
8
13
18
23
28
-1 std 5yr avg +1 std
Source: Factset Source: Factset
Page 202 Deutsche Bank Securities Inc.

9 October 2017
Oil Services & Equipment
Initiation of coverage
Company description
Oceaneering International (OII) is a leading provider of products and servicescatering specifically to the offshore markets with a particular on the deepwater.The company has four reporting segments within its oilfield franchise includingRemotely Operated Vehicles (ROVs), Subsea Products, Subsea Projects, andAsset Integrity. There is a fifth segment, Advanced Technologies, which operatesoutside of the oil patch and servicing the defense, aerospace and commercialtheme park industries.
Figure 467: Reporting segments
Remotely Operated Vehicles Subsea Projects
- 6 added 2016, retired 41 - Install/maint/inspection/repair
- Fleet size 280 ('16), 315 ('15), 336 ('14) - GOM, Angola, India
Subsea Products - 5 DW vessels, 4 shallow water diving vessels
- Manufactured Products Asset Integrity
- Production control umbilicals - Integrity management and testing services
- Subsea hardware - Onshore and offshore; topside and subsea
- Service and Rental Advanced Technologies
- Tooling and subsea work systems - Engineering services and manufacturing
- IWOCS - US Dept of Defense, NASA, theme parks
Oceaneering
Source: Company reports
OII’s ROVs business has a fleet of 282 work-class vehicles and is the largestin the industry with about 28% market share. The Subsea Products segmentmanufactures umbilicals, production control equipment, and installation andworkover control systems to name a few. The Subsea Projects segment doessubsea intervention, installation, inspection, well tie-backs and ocean-bottommapping services. Asset Integrity focuses on reducing unplanned maintenanceand repair as well as ensuring safety at onshore and offshore facilities.
Figure 468: Revenue mix
T
Remotely
Operated Vehicles
29%
Subsea
Products
34%
Subsea
Projects
16%
Asset Integrity
14%
Advanced
Technologies
7%
2014 Remotely
Operated Vehicles
23%
Subsea
Products
30%
Subsea
Projects
21%
Asset
Integrity
12%
Advanced
Technologies
14%
2016 les
Source: Company reports, Deutsche Bank
Deutsche Bank Securities Inc. Page 203

9 October 2017
Oil Services & Equipment
Initiation of coverage
Principal Sources and Uses of Cash Flow
Increasingly focused on production phase of offshore life cycleOII remains committed to the deepwater and intends to continue investing inits core businesses while also expanding its deepwater capabilities in nichemarkets. But there is a change in strategy, which has the company focusingincreasingly on production services and the operators’ operating expendituresversus its capital expenditures. During the expansion period of the worldwideultra-deepwater fleet, OII’s core strategy was to win the business for as manyultra-deepwater newbuilds as possible because management viewed this as anannuity business given the rigs were receiving five-year term commitments. Thecompany was not focused on vessel-based activity, but was intensely focusedon this drilling support business. The company has since pivoted, and has alsoacquired privately held Blue Ocean Technologies, a provider of riser-less lightwell intervention services for the purpose of maximizing offshore production andrecovery rates. The company also intends to grow geographically with its sightsset on the Middle East, Mediterranean, and select opportunities in the Far East.
Figure 469: Revenue mix
-
500
1,000
1,500
2,000
2,500
3,000
3,500
4,000
20
07
20
08
20
09
20
10
20
11
20
12
20
13
20
14
20
15
20
16
20
17
20
18
20
19
(a) (a) (a) (a) (a) (a) (a) (a) (a) (a) (e) (e) (e)
In m
illio
ns
of
US
D
Remotely Operated Vehicles Subsea Products Subsea Projects
Asset Integrity Advanced Technologies
Source: Company reports, Deutsche Bank
Two-thirds of OII’s ROVs are currently operating in a drilling support rolewhere the company currently has a 53% market share. The other one-thirdare involved with vessel based activities, which include underwater pipelineinspection and surveys, maintenance and repair, installation and constructionsupport, and subsea production facility operation and maintenance. Regionally,its international operations accounted for 57% of total revenue in 2016, flat from2015 levels. Its international operations are focused mainly in the North Sea,Africa, Brazil, Australia, and Asia.
A significant portion of total revenues comes from Subsea Projects segment in theUS Gulf of Mexico, which experiences some seasonality with heightened activityin the second and third quarters.
Page 204 Deutsche Bank Securities Inc.

9 October 2017
Oil Services & Equipment
Initiation of coverage
Figure 470: Strong free cash flow track record
(600)
(400)
(200)
-
200
400
600
8002
00
9
20
10
20
11
20
12
20
13
20
14
20
15
20
16
20
17
20
18
20
19
(a) (a) (a) (a) (a) (a) (a) (a) (e) (e) (e)
In m
illi
on
s o
f U
SD
Cash from operations Capital expenditures Free cash flow
Source: Company reports, Deutsche Bank
Figure 471: Dividends cut in 2016
(200)
(100)
-
100
200
300
400
20
09
20
10
20
11
20
12
20
13
20
14
20
15
20
16
20
17
20
18
20
19
20
20
(a) (a) (a) (a) (a) (a) (a) (a) (e) (e) (e) (e)
In m
illi
on
s o
f U
SD
Free cash flow Dividends paid
Source: Company reports, Deutsche Bank
Figure 472: Net debt Figure 473: Debt turns
(300)
(200)
(100)
-
100
200
300
400
500
20
07
20
08
20
09
20
10
20
11
20
12
20
13
20
14
20
15
20
16
20
17
20
18
20
19
(a) (a) (a) (a) (a) (a) (a) (a) (a) (a) (e) (e) (e)
In m
illi
on
s o
f U
SD
0.0
0.5
1.0
1.5
2.0
2.5
3.0
3.5
4.0
20
07
20
08
20
09
20
10
20
11
20
12
20
13
20
14
20
15
20
16
20
17
20
18
20
19
(a) (a) (a) (a) (a) (a) (a) (a) (a) (a) (e) (e) (e)
De
bt
turn
s
Source: Deutsche Bank Source: Deutsche Bank
Deutsche Bank Securities Inc. Page 205

9 October 2017
Oil Services & Equipment
Initiation of coverage
Figure 474: Income Statement(a) (a) (a) (a) (a) (a) (a) (a) (e) (e) (e)
In millions of USD 2009 2010 2011 2012 2013 2014 2015 2016 2017 2018 2019
Segment revenues:
Remotely Operated Vehicles 649 662 755 854 982 1,069 808 522 410 444 471
Subsea Products 488 549 770 829 1,028 1,239 960 692 594 527 992
Subsea Projects 275 248 167 380 509 589 604 473 293 307 323
Asset Integrity 216 223 267 435 482 500 373 275 230 247 259
Advanced Technologies 194 235 233 285 286 263 318 309 395 412 412
Total revenue 1,822 1,917 2,193 2,783 3,287 3,660 3,063 2,272 1,921 1,938 2,457
Segment gross margin:
Remotely Operated Vehicles 237 248 260 290 328 361 249 100 64 83 88
Subsea Products 115 161 207 241 311 365 284 152 88 70 154
Subsea Projects 85 61 24 81 109 124 117 54 24 33 53
Inspection 41 42 46 71 82 87 51 45 44 56 76
Advanced Technologies 25 33 34 39 45 32 30 34 52 57 57
Unallocated expenses (65) (73) (81) (94) (109) (111) (72) (44) (65) (66) (66)
Total gross margin 438 472 489 628 766 859 659 340 206 232 361
D&A 123 148 151 176 202 230 241 236 210 195 182
EBIT
Remotely Operated Vehicles 208 208 225 249 282 321 214 66 38 49 52
Subsea Products 61 109 142 171 231 281 202 88 40 32 71
Subsea Projects 75 52 14 63 94 108 94 37 9 15 24
Inspection 26 26 31 45 55 55 22 14 15 21 28
Advanced Technologies 12 17 17 21 25 13 10 12 28 31 31
Unallocated expenses (90) (100) (112) (121) (142) (150) (114) (82) (103) (104) (104)
EBIT 292 311 317 429 545 628 428 135 28 44 103
Interest (expense) (8) (3) (1) (4) (2) (5) (25) (25) (29) (30) (29)
Interest income 1 1 1 2 1 0 1 4 8 10 9
Equity income 3 2 4 2 0 (0) 2 0 (2) (2) (2)
Other income 2 (3) (1) (6) (1) (0) (0) 0 (1) (0) (0)
PBT 290 308 320 422 542 623 405 114 4 22 81
Income tax (expense) (101) (106) (101) (133) (171) (195) (128) (39) (1) (8) (30)
Non-controlling interest - - - - - - - - - - -
Preferred dividends - - - - - - - - - - -
Net income (operating) 188 202 219 289 372 428 277 75 2 14 51
Discontinued ops - - - - - - - - - - -
Unusual after-tax - (2) 17 - - - (46) (51) (4) - -
Net income (GAAP) 188 200 236 289 372 428 231 25 (1) 14 51
Reconciliation for NCI (1) - - - - - - - - - -
Operating EPS 1.70 1.85 2.01 2.66 3.42 4.00 2.80 0.77 0.03 0.14 0.52
GAAP EPS 1.70 1.83 2.16 2.66 3.42 4.00 2.34 0.25 (0.01) 0.14 0.52
DPS 0.00 0.00 0.45 0.69 0.84 1.03 1.08 0.96 0.60 0.60 0.60
Diluted shares 110 110 109 109 109 107 99 98 99 99 99
EBITDA margin 22.8% 24.0% 21.3% 21.7% 22.7% 23.4% 21.8% 16.3% 12.4% 12.3% 11.6%
EBIT margin 16.0% 16.2% 14.4% 15.4% 16.6% 17.2% 14.0% 5.9% 1.5% 2.3% 4.2%
Tax rate 35.0% 34.3% 31.5% 31.5% 31.5% 31.3% 31.7% 34.1% 35.9% 37.0% 37.0%
EBIT margin
Remotely Operated Vehicles 32.0% 31.4% 29.8% 29.2% 28.7% 30.0% 26.5% 12.6% 9.2% 11.0% 11.0%
Subsea Products 12.4% 19.8% 18.5% 20.6% 22.5% 22.7% 21.1% 12.7% 6.8% 6.1% 7.2%
Subsea Projects 27.5% 21.1% 8.6% 16.7% 18.4% 18.3% 15.5% 7.8% 3.2% 5.0% 7.6%
Inspection 12.2% 11.6% 11.5% 10.4% 11.5% 11.1% 5.9% 5.1% 6.7% 8.5% 11.0%
Advanced Technologies 6.4% 7.2% 7.1% 7.4% 8.7% 5.0% 3.1% 4.0% 7.1% 7.4% 7.4%
Source: Deutsche Bank
Page 206 Deutsche Bank Securities Inc.

9 October 2017
Oil Services & Equipment
Initiation of coverage
Figure 475: Cash Flow Statement
(a) (a) (a) (a) (a) (a) (a) (a) (e) (e) (e)
In millions of USD 2009 2010 2011 2012 2013 2014 2015 2016 2017 2018 2019
Net income 188 202 219 289 372 428 277 75 2 14 51
Depreciation 123 148 151 176 202 230 241 236 210 195 182
Deferred tax 22 31 8 21 52 71 29 0 (24) - -
Chg in receivables 12 12 (100) (94) (102) (8) 179 123 87 (48) (146)
Chg in inventories 14 (22) (11) (76) (111) 66 59 18 54 (33) (96)
Chg in payables (6) (1) 9 87 128 (44) (45) (117) (8) 10 29
Other 66 71 13 36 (13) (21) (180) 5 (70) 42 127
Cash from operations 418 442 289 439 529 722 560 341 252 179 147
Capital expenditures (175) (185) (235) (301) (383) (387) (200) (112) (99) (127) (123)
Free cash flow 243 257 54 138 146 335 360 228 152 52 24
Acquisitions - (22) (292) (9) (11) (40) (224) (30) - - -
Asset sales 13 15 44 4 12 2 0 6 1 - -
Dividends paid - - (49) (75) (91) (110) (106) (94) (59) (59) (59)
ESPP | options - - - - - - - - - - -
Equity issuance, net 2 (49) (17) (17) - (590) (100) - - - -
Debt issuance, net (109) (120) 120 (27) (94) 742 50 - - - (300)
Other 3 2 1 (0) 9 0 (25) (45) (0) - -
Chg in cash 151 83 (139) 14 (29) 339 (45) 65 94 (8) (335)
Source: Deutsche Bank
Deutsche Bank Securities Inc. Page 207

9 October 2017
Oil Services & Equipment
Initiation of coverage
Figure 476: Balance Sheet(a) (a) (a) (a) (a) (a) (a) (a) (e) (e) (e)
In millions of USD 2009 2010 2011 2012 2013 2014 2015 2016 2017 2018 2019
Cash and equivalents 162 245 106 121 91 431 385 450 544 536 201
Accounts receivable 435 424 550 667 769 778 613 490 403 451 597
Inventories 232 237 255 331 442 376 328 280 226 259 355
Other current assets 44 78 73 84 131 129 191 43 40 45 60
Total current assets 874 984 984 1,203 1,433 1,714 1,517 1,263 1,213 1,292 1,214
Net PP&E 766 786 893 1,025 1,189 1,306 1,267 1,153 1,055 987 928
Goodwill 131 143 333 363 344 331 427 444 451 451 451
Other assets 109 117 190 177 162 161 218 271 244 273 361
Total assets 1,880 2,031 2,401 2,768 3,129 3,512 3,430 3,130 2,962 3,002 2,953
Accounts payable 86 86 111 130 130 124 118 78 69 79 109
Current debt - - - - - - - - - 300 -
Other current liabilities 302 354 390 487 597 555 498 431 350 392 519
Total current liabilities 389 440 501 617 727 679 616 508 420 772 628
Long-term debt 120 - 120 94 - 750 796 793 794 494 494
Other LT liabilities 147 200 221 241 358 425 439 312 283 316 419
Shareholders' equity 1,224 1,390 1,558 1,815 2,043 1,658 1,579 1,517 1,466 1,420 1,412
Total liabilities and equity 1,880 2,031 2,401 2,768 3,129 3,512 3,430 3,130 2,962 3,002 2,953
Total debt 120 - 120 94 - 750 796 793 794 794 494
Net debt (42) (245) 14 (27) (91) 319 411 343 250 258 293
Debt/capital 9% 0% 7% 5% 0% 31% 34% 34% 35% 36% 26%
Debt/equity 10% 0% 8% 5% 0% 45% 50% 52% 54% 56% 35%
Debt turns 0.3 0.0 0.3 0.2 0.0 0.9 1.2 2.1 3.3 3.3 1.7
Source: Deutsche Bank
Page 208 Deutsche Bank Securities Inc.

9 October 2017
Oil Services & Equipment
Initiation of coverage
Rating
HoldNorth AmericaUnited States
IndustrialsOil Services & Equipment
Company
Oil States
Reuters Bloomberg
OIS.N OIS US
Leaning on onshore recoveryMaintaining our Hold rating and $26 price targetWe are maintaining our Hold rating on Oil States and our price target of $26.Despite its size, we believe OIS has a proprietary technology product offeringthat allows for high market share levels, but the downturn in offshore activityand spending has weighed on the overall earnings power of the company. Whileits Offshore/ Manufactured Products segment backlog is finally approaching atrough, the visibility around FIDs moving forward and spending shaking looseoffshore remains challenging. Its Well Site Services segment continues to seeimproved utilization driven by increases in complex completion directed activityand helping to partially offset the lower Offshore revenues.
Later cycle play on offshore developmentWe view OIS as a later cycle play on when activity and spending starts to comeback towards offshore development. As operators pushed further into deepwaterand production is brought online, more production facilities are needed as fieldsare developed further from existing infrastructure. The push for standardizationand tie-back opportunities utilizing existing infrastructure has caused its backlogto lean more towards smaller, short-cycle orders and non-energy applications asproject work has shrunk.
Focus on what they can controlOIS management has done a good job on focusing on the onshore recovery tohelp partially offset the downturn in offshore spending, both through its shorter-cycle products and its Well Site Service segment. OIS has also resumed buyingback stock this year and has $120.5mm remaining authorization.
Valuation & RisksWe are continuing coverage of OIS witha $26 price target. This is 5.7x ourestimate of the company's normalizedEBITDA of $250mm, which is a 0.5 turndiscount to the 6.2x five-year averagemultiple leading up to the 2014 collapsein oil prices. The main investment risksinclude: 1) operator spending continuesto shift towards onshore opportunitiescausing further delays towards offshoredevelopment, 2) increasing focus onstandardization and workflow design maycause additional dollars to come out ofthe deepwater cost structure, 3) negativerevisions to global oil demand, and 4) anupside risk is OIS could potentially be anacquisition target with its low leverage andportfolio of high technology offerings.
Forecasts and ratios
Year End Dec 31 2016A 2017E 2018E
1Q EPS -0.24 -0.34A -0.14
2Q EPS -0.22 -0.27A -0.08
3Q EPS -0.19 -0.21 -0.02
4Q EPS -0.20 -0.18 0.01
FY EPS (USD) -0.86 -0.99 -0.23
OLD FY EPS (USD) -0.86 -1.00 -0.20
% Change -0.3% -0.7% 12.3%
P/E (x) – – –
DPS (USD) 0.00 0.00 0.00
Dividend Yield (%) 0.0 0.0 0.0
Revenue (USDm) 694.4 669.8 791.4Source: Deutsche Bank estimates, company data
Jason BandelAssociate [email protected]
Price at 5 Oct 2017 (USD) 25.55
Price target 26.00
52-week range 41.20 - 21.00
Key changes
EPS (USD) -1.00 to -0.99 ↑ -0.7%
Revenue(USDm)
680.5 to 669.8 ↓ -1.6%
Source: Deutsche Bank
Price/price relative
Oil States S&P 500 INDEX (Rebased)
Jan '15 May '15 Sep '15 Jan '16 May '16 Sep '16 Jan '17 May '17 Sep '1710
20
30
40
50
60
70
80
90
Performance(%)
1m 3m 12m
Absolute 15.5 -10.7 -20.7
S&P 500INDEX
2.5 4.5 18.0
Source: Deutsche Bank
Stock & option liquidity data
Market Cap (USDm) 1,284.6
Shares outstanding (m) 50.3
Free float (%) 154
Volume (5 Oct 2017) 126,256
Option volume (und. shrs., 1M avg.) 25,405Source: Deutsche Bank
Deutsche Bank Securities Inc. Page 209

9 October 2017
Oil Services & Equipment
Initiation of coverage
Key investment themes
Later cycle play on offshore infrastructure developmentWhile overall sentiment towards deepwater development remains poor, wecontinue to believe that long term development of deepwater reserves are notgoing away. OIS is a later cycle play on offshore infrastructure developmentas operators pushed further into deepwater which required more productionfacilities to be built as fields are developed further from existing infrastructure. Thedownturn in deepwater activity levels have driven operators to focus on shorter-cycle onshore projects and maximizing existing infrastructure offshore. This hasled to a push for standardization and leveraging tie-back opportunities reducingthe need in the near term for new production facilities. FIDs are starting to shakeloose and we look for additional projects to be announced as we move closer to2018. Another potential headwind comes from Brazil which accounts for 25-30%of the FPSO market.
Cash flow profile changed post accommodations spin-off and downturnDuring the 2009-2014 upcycle, OIS’ Well Site Services segment accounted for58% of EBITDA. Following the spin-off of its accommodations business and thedownturn weighing on onshore completion activity, Offshore Products startedto be the primary contributor to EBITDA and cash flow generation. Its backlogdoes provide for some visibility for revenues and cash flow, but OIS’ product linestend to have shorter lead times than other manufacturers in the oilfield servicesuniverse. As such the company recognizes 90% of its backlog as revenue in agiven year. OIS did manage to stay free cash flow positive during the downturn.
Figure 477: Offshore Products main EBITDA contributor during downturn
(200)
0
200
400
600
800
1,000
20
09
20
10
20
11
20
12
20
13
20
14
20
15
20
16
20
17
20
18
20
19
(a) (a) (a) (a) (a) (a) (a) (a) (e) (e) (e)
In m
illio
ns
of
US
D
Well Site Services Offshore/ Manufactured Products Corporate
Source: Company reports, Deutsche Bank
Changing backlog composition - increasing leverage to shorter cycle productsOIS backlog levels have been falling due to delays in project awards during thedownturn and with incremental dollars going towards North American onshore.Also this environment has led to smaller sized orders being booked into backlog.This onshore focused recovery has actually led to increasing leverage to shortercycle products (including elastomer consumables and valve products), which hashelped to increase its book to bill ratio and move the company closer to a troughin its backlog levels. These shorter cycle products now makeup close to 40% oftotal Offshore Products revenue, as compared to its historical range of 15-20%.
Page 210 Deutsche Bank Securities Inc.

9 October 2017
Oil Services & Equipment
Initiation of coverage
These bookings also increase OIS’ overall exposure to onshore markets, at leastuntil FIDs start to shake loose and project work starts to increase.
Figure 478: Backlog levels have been falling, but book to bill has started toturn
0.00x
0.50x
1.00x
1.50x
2.00x
2.50x
3.00x
-
100.0
200.0
300.0
400.0
500.0
600.0
700.0
1Q
07
3Q
07
1Q
08
3Q
08
1Q
09
3Q
09
1Q
10
3Q
10
1Q
11
3Q
11
1Q
12
3Q
12
1Q
13
3Q
13
1Q
14
3Q
14
1Q
15
3Q
15
1Q
16
3Q
16
1Q
17
In m
illio
ns
of
US
D
Offshore/ Manufactured Products Book to Bill (rhs)
Source: Company reports, Deutsche Bank
Increasing onshore exposure changes margin profileThe downturn in offshore activity and spending has increased OIS’ onshoreexposure. In the 1H17, US shale play activity accounted for almost 50% ofconsolidated revenues. Also as we just discussed, the increase in shortercycle consumables (elastomers, valves) in its Offshore/ Manufactured Productssegment is also raising their onshore exposure. While its Completion Servicesproduct line inside its Well Site Services segment also has some exposure toGulf of Mexico and International markets, it is mainly US shale focused (77% of2Q17 Completion Services revenue). This is currently weighing on margins forthe company as its Completion Services margins continue to recover from thedownturn and remain below historical levels.
Deutsche Bank Securities Inc. Page 211

9 October 2017
Oil Services & Equipment
Initiation of coverage
Figure 479: Increasing onshore exposure hurting overall margins asCompletion Services margins still recovering
-20.0%
-10.0%
0.0%
10.0%
20.0%
30.0%
40.0%
1Q
11
2Q
11
3Q
11
4Q
11
1Q
12
2Q
12
3Q
12
4Q
12
1Q
13
2Q
13
3Q
13
4Q
13
1Q
14
2Q
14
3Q
14
4Q
14
1Q
15
2Q
15
3Q
15
4Q
15
1Q
16
2Q
16
3Q
16
4Q
16
1Q
17
2Q
17
EB
ITD
A m
arg
ins
Source: Company reports, Deutsche Bank
Proprietary technology product offering despite its sizeDespite its size, OIS has a proprietary technology product offering allowing forhigh market share levels and generally solid through-cycle margins. OIS’ WellSite Services segment is benefiting from the rising well complexity and serviceintensity in the US. Its Offshore/ Manufactured Products segment has highproprietary content around its connector systems, such as its FlexJoint and MerlinConnectors. This level of proprietary content is generally rare for smaller oilfieldservices companies. While Spears & Associates data shows OIS holds around amid-single digit market share level in the broadly defined Rig Equipment space,in some of its proprietary products their market share can be in the 90% range.
Valuation and risksWe are continuing coverage of Oil States and maintaining our $26 price target.This is 5.7x our estimate of the company’s normalized EBITDA of $250mm, whichis a 0.5 turn discount to the 6.2x five-year average multiple leading up to the 2014collapse in oil prices. The company is currently trading at 12.4x our 2018 EBITDAestimate of $106mm and 9x our 2019 EBITDA estimate of $146mm. We expectvaluations will continue to consolidate until the path towards a deepwater activityrecovery becomes clearer.
The main investment risks include: 1) operator spending continues toshift towards onshore opportunities causing further delays towards offshoredevelopment, 2) increasing focus on standardization and workflow design maycause additional dollars to come out of the deepwater cost structure, 3) negativerevisions to global oil demand, 4) an upside risk is OIS could potentially be anacquisition target with its low leverage and portfolio of high technology offerings.
Page 212 Deutsche Bank Securities Inc.

9 October 2017
Oil Services & Equipment
Initiation of coverage
Company description
Oil States International (OIS) is a mid-cap specialty products manufacturer andoilfield services provider focused on delivering technology and solutions to thedeepwater capital equipment market around the world and the North Americashale play market. Following its spin-off of its accommodations segment, OIS isa more focused company leveraged to the deepwater production infrastructurebuildout offshore and rising service intensity and complexity onshore.
Its Offshore Products segment is driven by infrastructure development, rigrefurbishments and upgrades, and rig newbuild supply growth. Its Well SiteServices segment is driven by completion directed spending and activity levels inthe US. OIS also has a fleet of 34 land drilling rigs mostly based in the Permianand the Rockies, that in good times generates positive cash flow that OIS investsin other parts of the business.
Figure 480: Company reporting segments
Offshore/ Manufactured Products Well Site Services
- Flexible bearings, adanced connector systems - Completion Services
- FlexJoints, Merlin Connectors - Wellhead isolation
- Casing and conductor connections - Wireline and coiled tubing support
- Riser systems - Frac valve and flowback services
- Subsea pipeline products - Ball launching services
- Valves, manifolds - Drilling Services (Capstar - 34 rigs)
- Cranes, winches, morring systems
- BOP assembly and testing
Oil States
Source: Company reports, Deutsche Bank
In its Offshore segment, OIS’ FlexJoints and Merlin Connectors have the highproprietary content. Short cycle manufactured products include elastomers andvalves that tend to have some land-based exposure. Short-cycle products havemoved from 15-20% of total Offshore Product revenue to 36% in 1Q17, due tothe slow-down in project work from FIDs.
Deutsche Bank Securities Inc. Page 213

9 October 2017
Oil Services & Equipment
Initiation of coverage
Figure 481: Revenue by reporting segment
Well Site
Services
33%
Tubular
Services
49%
Offshore/
Manufactured
Products
18%
2008
Well Site
Services
27%
Offshore/
Manufactured
Products
73%
2016
Source: Company reports, Deutsche Bank
Principal Sources and Uses of Cash Flow
In this current recovery coming out of the downturn, OIS’ Offshore/ ManufacturedProducts segment has been the primary contributor to EBITDA, while its WellSite Services segment is just starting to contribute positive EBITDA as utilizationlevels improve. Its backlog does provide for some visibility in cash flows, but itsproduct lines tend to have shorter lead times than other manufacturers in theoilfield services universe. As such the company recognizes 90% of its backlog asrevenue in a given year. The primary uses of cash have generally been on capex topurchase rentals for its completion services business and an expansion campaignto build out manufacturing facilities both in the US and construct a new facilityin Edinburgh (while retiring the old one in Aberdeen). OIS also is slowly buildingout facilities in Brazil. Post accommodations spin-off, OIS has used cash to paydown debt (see more details in next section). Lastly, OIS also has a history of stockrepurchases and has resumed buying back stock this year and has $120.5mmremaining authorization.
Figure 482: Consolidated EBITDA Figure 483: Earnings per share
0
100
200
300
400
500
600
700
800
900
1,000
20
09
20
10
20
11
20
12
20
13
20
14
20
15
20
16
20
17
20
18
20
19
(a) (a) (a) (a) (a) (a) (a) (a) (e) (e) (e)
In m
illi
on
s o
f U
SD
(2.00)
(1.00)
0.00
1.00
2.00
3.00
4.00
5.00
6.00
7.00
8.00
9.00
2009
2010
2011
2012
2013
2014
2015
2016
2017
2018
2019
(a) (a) (a) (a) (a) (a) (a) (a) (e) (e) (e)
EPS
Source: Company reports, Deutsche Bank Source: Company reports, Deutsche Bank
Page 214 Deutsche Bank Securities Inc.

9 October 2017
Oil Services & Equipment
Initiation of coverage
Balance Sheet and FCF
Following the spin-off of its accommodations segment, OIS was able to de-lever its already strong balance sheet and continued to pay down debt duringthe downturn. This leaves the company well positioned to pursue growthopportunities or bolt-on acquisitions as their history has shown. At the end of Q1,OIS has a $600mm revolver that matures in 2019 with $22.4mm outstanding. Therevolver does have an option to increase its capacity to $750mm.
Figure 484: Free cash flow and capex Figure 485: Net debt
(600)
(400)
(200)
0
200
400
600
800
20
09
20
10
20
11
20
12
20
13
20
14
20
15
20
16
20
17
20
18
20
19
(a) (a) (a) (a) (a) (a) (a) (a) (e) (e) (e)
In m
illi
on
s o
f U
SD
Cash from operations Capital expenditures Free cash flow
(200)
0
200
400
600
800
1,000
1,200
20
09
20
10
20
11
20
12
20
13
20
14
20
15
20
16
20
17
20
18
20
19
(a) (a) (a) (a) (a) (a) (a) (a) (e) (e) (e)
In m
illi
on
s o
f U
SD
Source: Company reports, Deutsche Bank Source: Company reports, Deutsche Bank
Deutsche Bank Securities Inc. Page 215

9 October 2017
Oil Services & Equipment
Initiation of coverage
Figure 486: Income Statement(a) (a) (a) (a) (a) (a) (a) (a) (e) (e) (e)
In millions of USD 2009 2010 2011 2012 2013 2014 2015 2016 2017 2018 2019
Segment revenues:
Well Site Services 787 1,014 1,519 1,828 1,794 1,111 376 186 291 350 356
Completion Services 234 343 488 523 578 657 308 163 243 296 300
Drilling Services 71 133 166 192 170 201 68 23 48 54 56
Offshore/ Manufactured Prod 509 429 586 804 883 962 724 509 379 442 536
Accomodations 481 538 865 1,113 1,046 253 0 0 0 0 0
Tubular Services 812 969 1,375 1,782 799 0 0 0 0 0 0
Total revenues 2,108 2,412 3,479 4,414 3,476 2,072 1,100 694 670 791 892
Segment EBITDA:
Well Site Services 226 310 564 723 684 378 63 (11) 27 62 71
Offshore/ Manufactured Prod 92 72 107 149 175 222 177 114 68 93 124
Corporate (30) (33) (41) (46) (59) (57) (46) (47) (50) (50) (50)
Total EBITDA 333 386 698 913 832 543 194 56 45 105 145
Segment D&A:
Well Site Services 105 111 172 212 258 141 103 93 85 92 94
Offshore/ Manufactured Prod 11 11 13 15 18 22 27 24 26 26 26
Corporate 1 1 1 1 1 1 1 1 1 1 1
EBIT 213 262 508 673 551 376 61 (66) (66) (13) 25
Interest (expense) (15) (15) (58) (69) (76) (26) (6) (5) (5) (5) (5)
Interest income 0 1 2 2 2 1 1 0 0 0 0
Equity income 1 0 (0) 0 (0) 0 0 0 0 0 0
Other income 0 0 4 8 4 3 1 1 1 1 1
PBT 200 248 455 614 481 354 57 (70) (70) (17) 21
Income tax (expense) (56) (73) (132) (173) (136) (118) (14) 27 20 5 (7)
Non-controlling interest (0) (1) (1) (1) (1) (0) 0 0 0 0 0
Preferred dividends 0 0 0 0 0 0 0 0 0 0 0
Net income (operating) 144 175 322 440 343 236 43 (43) (50) (11) 14
Discontinued ops 0 0 0 0 88 15 0 (0) 0 0 0
Unusual after-tax (84) (7) 0 9 (10) (72) (14) (3) (1) 0 0
Net income (GAAP) 59 168 322 449 421 179 29 (46) (51) (11) 14
Operating EPS 2.87 3.31 5.86 7.94 6.17 4.45 0.85 (0.86) (0.99) (0.23) 0.29
GAAP EPS 1.18 3.19 5.86 8.10 7.57 3.37 0.57 (0.92) (1.01) (0.23) 0.29
DPS 0.00 0.00 0.00 0.00 0.00 0.00 0.00 0.00 0.00 0.00 0.00
Diluted shares 50 53 55 55 56 53 50 50 50 50 50
EBITDA margin 15.7% 16.0% 20.0% 20.5% 23.8% 26.1% 17.2% 7.6% 6.8% 13.4% 16.4%
EBIT margin 10.1% 10.9% 14.6% 15.3% 15.8% 18.1% 5.6% -9.5% -9.8% -1.6% 2.8%
Tax rate 28.1% 29.3% 28.9% 28.2% 28.3% 33.3% 25.2% 38.7% 28.4% 32.0% 32.0%
EBITDA margin
Well Site Services 28.7% 30.5% 37.2% 39.5% 38.1% 34.0% 16.7% (6.0%) 9.3% 17.8% 19.9%
Offshore/ Manufactured Prod 18.1% 16.8% 18.3% 18.6% 19.8% 23.1% 24.5% 22.4% 18.0% 21.0% 23.1%
Source: Deutsche Bank
Page 216 Deutsche Bank Securities Inc.

9 October 2017
Oil Services & Equipment
Initiation of coverage
Figure 487: Cash Flow Statement
(a) (a) (a) (a) (a) (a) (a) (a) (e) (e) (e)
In millions of USD 2009 2010 2011 2012 2013 2014 2015 2016 2017 2018 2019
Net income 144 175 322 440 343 236 43 (43) (50) (11) 14
Depreciation 118 124 188 230 278 164 128 119 111 119 121
Deferred tax (15) 21 27 17 (8) (12) (3) (38) (15) 0 0
Chg in receivables 206 (62) (260) (83) 48 (66) 157 86 24 (44) (26)
Chg in inventories 201 (75) (154) (34) 26 1 18 32 18 (26) (18)
Chg in payables (169) 82 48 31 (11) 6 (98) (28) (5) 6 4
Other (31) (33) 45 37 12 108 12 21 5 8 3
Cash from operations 453 231 216 637 687 438 256 149 90 53 98
Capital expenditures (124) (182) (487) (488) (458) (319) (115) (30) (35) (51) (52)
Free cash flow 329 49 (272) 150 230 119 141 120 54 2 46
Acquisitions 0 (710) (2) (80) (44) 0 (33) 0 (13) 0 0
Asset sales 3 3 6 15 610 4 3 2 1 0 0
Dividends paid 0 0 0 0 0 0 0 0 0 0 0
ESPP | options 0 0 0 0 16 10 6 0 0 0 0
Equity issuance, net 3 23 2 (2) (113) (232) (113) (4) (21) 0 0
Debt issuance, net (300) 648 266 126 (341) (160) (18) (81) 5 0 0
Other 24 (6) (24) (27) (12) (286) (3) (3) 1 0 0
Chg in cash 60 7 (25) 181 346 (546) (17) 33 26 2 46
FCF per share 6.56 0.92 (4.94) 2.70 4.13 2.23 2.81 2.38 1.08 0.04 0.91
Capex / revenue 0.06 0.08 0.14 0.11 0.13 0.15 0.10 0.04 0.05 0.06 0.06
Capex / depreciation 1.05 1.47 2.59 2.12 1.65 1.94 0.90 0.25 0.32 0.42 0.43
Source: Deutsche Bank
Deutsche Bank Securities Inc. Page 217

9 October 2017
Oil Services & Equipment
Initiation of coverage
Figure 488: Balance Sheet
(a) (a) (a) (a) (a) (a) (a) (a) (e) (e) (e)
In millions of USD 2009 2010 2011 2012 2013 2014 2015 2016 2017 2018 2019
Cash and equivalents 4 9 7 14 9 10 65 132 201 412 622
Accounts receivable 131 294 461 388 437 635 232 169 347 369 373
Inventories 56 64 100 141 127 156 128 108 113 123 125
Other current assets 29 32 57 25 32 52 66 70 20 22 22
Total current assets 219 399 627 568 605 852 492 479 681 926 1,142
Net PP&E 750 1,253 1,557 1,852 1,903 650 639 553 489 515 403
Investment in affiliates 5 6 0 0 0 0 0 0 0 0 0
Goodwill 219 475 467 521 514 252 264 263 269 269 269
Other assets 33 182 189 241 189 81 85 77 91 34 11
Total assets 1,932 3,016 3,704 4,440 4,131 1,810 1,599 1,384 1,327 1,362 1,313
Accounts payable 209 305 349 280 149 109 59 34 33 39 43
Income taxes 14 5 10 30 33 9 8 6 3 1 0
Current debt 0 181 34 30 1 1 1 1 1 1 1
Deferred revenue 87 61 75 66 50 49 37 21 21 8 2
Other current liabilities 4 3 6 112 141 104 50 45 42 16 5
Total current liabilities 315 554 475 519 374 271 154 107 99 65 52
Long-term debt 164 732 1,143 1,280 973 147 126 45 50 50 50
Deferred taxes 55 81 97 129 123 34 40 5 4 4 4
Other LT liabilities 16 20 26 47 37 17 20 22 23 9 3
Shareholders' equity 1,382 1,629 1,963 2,466 2,625 1,341 1,258 1,204 1,151 1,228 1,191
Total liabilities and equity 1,932 3,016 3,704 4,440 4,131 1,810 1,599 1,384 1,327 1,362 1,313
Total debt 165 913 1,177 1,310 973 147 126 46 51 51 51
Net debt 75 817 1,105 1,057 374 94 90 (23) (44) (46) (92)
Debt/capital 11% 36% 37% 35% 27% 10% 9% 4% 4% 4% 4%
Debt/equity 12% 56% 60% 53% 37% 11% 10% 4% 4% 4% 4%
Debt turns 0.5 2.4 1.7 1.5 1.2 0.3 0.7 0.9 1.1 0.5 0.3
Cash conversion 1.36 0.60 0.31 0.70 0.83 0.81 1.32 2.69 1.98 0.50 0.68
Cash from operations 453 231 216 637 687 438 256 149 90 53 98
Capital expenditures 124 182 487 488 458 319 115 30 35 51 52
Free cash flow 329 49 (272) 150 230 119 141 120 54 2 46
Dividends paid 0 0 0 0 0 0 0 0 0 0 0
Dividends per share 0.00 0.00 0.00 0.00 0.00 0.00 0.00 0.00 0.00 0.00 0.00
Source: Deutsche Bank
Page 218 Deutsche Bank Securities Inc.

9 October 2017
Oil Services & Equipment
Initiation of coverage
Rating
BuyNorth AmericaUnited States
IndustrialsOil Services & Equipment
Company
Patterson-UTI
Reuters Bloomberg
PTEN.OQ PTEN US
Evolving with the timesInitiating coverage with a Buy rating and a $25 price targetPTEN’s increased frac exposure provides line of sight to restoring its EBITDA to2014 levels that most of its peers do not have. While we believe oil prices will beconfined to a range of $45 – 55, and the US rig count will grow by a mere 6%in 2018, scarcity value in frac is being recreated much faster than in land rigs.While we do not expect pricing in frac to move up unabated throughout 2018,PTEN’s frac increased exposure provides it with peer leading EBITDA growth inan otherwise challenging cycle with challenging returns.
Frac business to drive pivot in earnings with $0.4 billion of EBITDA in 2018The oilfield is not offering up the same margins and returns it did over the prior twocycles. So for those companies that have been caught flat footed, the earningsdeterioration has been devastating. While the returns are materially lower, PTENhas at least repositioned the organization to rebuild its EBITDA. It is the secondlargest provider of super-spec rigs in the US with 23% market share and it isnow the fifth largest US frac company. These are two businesses that are gettingutilization and pricing, albeit more so for frac.
Clean balance sheet offers fiscal stabilityWe expect PTEN to exit the year with a debt turn of 1.6x, down from the 2.8xin 2Q17. This compares very favorably to some of its drilling and services peersthat are in the 5-8x range.
ValuationOur $25 price target is 5.0x our estimate ofthe company’s normalized EBITDA of $1.1billion, which is a half turn premium toits 4.3x five-year average multiple leadingup to the 2014 collapse in oil prices. Weassign the half-turn premium because of thepeer leading earnings leverage it has in anotherwise challenging cycle.The main investment risks include: 1) shiftsin OPEC policy and the influence thatwould have on oil prices and ultimately USupstream capital expenditures, 2) negativerevisions to global oil demand, 3) a rapidincrease in frac newbuilds, and 4) arapid acquisition strategy that threatens thereturns of the company.
Forecasts and ratios
Year End Dec 31 2016A 2017E 2018E
1Q EPS -0.59 -0.42A -0.08
2Q EPS -0.61 -0.21A -0.07
3Q EPS -0.58 -0.19 -0.03
4Q EPS -0.53 -0.13 0.00
FY EPS (USD) -2.32 -0.91 -0.17
OLD FY EPS (USD) -2.18 – –
% Change 6.4% – –
P/E (x) – – –
DPS (USD) 0.16 0.08 0.08
Dividend Yield (%) 0.8 0.4 0.4
Revenue (USDm) 893.0 2,321.0 3,107.9Source: Deutsche Bank estimates, company data
David HavensResearch [email protected]
Price at 5 Oct 2017 (USD) 21.30
Price target 25.00
52-week range 29.47 - 15.26
Price/price relative
Patterson-UTI S&P 500 INDEX (Rebased)
Jan '15 May '15 Sep '15 Jan '16 May '16 Sep '16 Jan '17 May '17 Sep '1710
15
20
25
30
35
40
45
Performance(%)
1m 3m 12m
Absolute 30.6 -0.3 -3.8
S&P 500INDEX
2.5 4.5 18.0
Source: Deutsche Bank
Stock & option liquidity data
Market Cap (USDm) 4,066.6
Shares outstanding (m) 190.9
Free float (%) 100
Volume (5 Oct 2017) 823,423
Option volume (und. shrs., 1M avg.) 91,316Source: Deutsche Bank
Deutsche Bank Securities Inc. Page 219

9 October 2017
Oil Services & Equipment
Initiation of coverage
Key investment themes
Among the best equipped to restore earnings power among the land drillersImproved drilling efficiencies and enhanced completion designs have enabled USproducers to drill a higher cadence of more productive wells using fewer rigs. Thishas undermined the earnings power of the land drilling industry and has forcedits key players to devise strategies that will reestablish them in the value chain.For PTEN, the earnings power of the company is better off than its peers in ourview as its revenue mix has evolved away from land drilling and into pressurepumping over the last decade. The company is taking more steps to broaden itsoffering with the recent acquisition of MS Energy, which is a leading provider ofdirectional drilling services in the US.
Leverage to pressure pumping restoring EBITDA and marginsWe believe PTEN offers more earnings leverage than any of its land drilling peersin an otherwise challenging oilfield cycle. The company has taken its pressurepumping capacity from less than 200k hhp in 2009 to about 1.5 million, whichwe forecast will generate $400 million of EBITDA in 2018. PTEN should exit 2017with 23 active frac spreads representing about 80% of its horsepower followingthe reactivation of two spreads in 2Q17, two in 3Q17, and one more in 4Q17. Theinitial reactivations were $2 million apiece, the latest were $3 million and the nextthree are expected by the company to be $4-5 million apiece.
Figure 489: PTEN pressure pumping EBITDA and margins
0%
5%
10%
15%
20%
25%
30%
35%
40%
45%
0
50
100
150
200
250
300
350
400
450
20
02
20
03
20
04
20
05
20
06
20
07
20
08
20
09
20
10
20
11
20
12
20
13
20
14
20
15
20
16
20
17
20
18
(a) (a) (a) (a) (a) (a) (a) (a) (a) (a) (a) (a) (a) (a) (a) (e) (e)
In m
illio
ns
of
US
D
Segment EBITDA EBITDA margin
Source: Company reports, Deutsche Bank
Top echelon of the land drilling marketThe bifurcation of the land drilling market is forcing the industry’s mechanicaland SCR rigs into retirement, some sooner rather than later. PTEN repositioned itsfleet starting ten years ago and with its fleet of 198 proprietary APEX rigs, PTEN ismanaging to push utilization higher than the industry average while also gettingpricing, albeit small.
Page 220 Deutsche Bank Securities Inc.

9 October 2017
Oil Services & Equipment
Initiation of coverage
Figure 490: PTEN contract drilling EBITDA and margins
0%
10%
20%
30%
40%
50%
60%
0
200
400
600
800
1,000
1,200
1,4002
00
2
20
03
20
04
20
05
20
06
20
07
20
08
20
09
20
10
20
11
20
12
20
13
20
14
20
15
20
16
20
17
20
18
(a) (a) (a) (a) (a) (a) (a) (a) (a) (a) (a) (a) (a) (a) (a) (e) (e)
In m
illio
ns
of
US
D
Segment EBITDA EBITDA margin
Source: Company reports, Deutsche Bank
A leading provider of the high demand super-spec rigsPTEN is the second largest provider of super-spec rigs with 107 as of 2Q17, whichis 23% market share. Pricing is about $2,000 per day higher than the 1,500hp AC-electric rigs and producers are still saying capacity of super-spec rigs is tight. Thecompany is upgrading seven of its APEX 1000 rigs that were in the Appalachiaregion, and is moving them to West Texas. The upgrades are $8 million per rig andthe company has contracts for five of the seven ranging from 18 to 24 monthswith rates at the low $20,000 per day level.
Figure 491: Super-spec rig market share Figure 492: Inventory of super-spec upgrade candidates
EN
16%
HP
32%
PTEN
23%
NBR
16%
PD
13%
Other
16%
0
20
40
60
80
100
120
140
HP PTEN NBR PD
Rigs
Source: Company reports, Deutsche Bank Source: Deutsche Bank
Deutsche Bank Securities Inc. Page 221

9 October 2017
Oil Services & Equipment
Initiation of coverage
Figure 493: Debt turns…PTEN has strong relative fiscal stability
-
1.0
2.0
3.0
4.0
5.0
6.0
7.0
8.0
HP PTEN NBR PD
2014 2Q17
Source: Company reports, Deutsche Bank
Valuation and risksWe are initiating coverage of Patterson-UTI with a $25 price target. This is 5.0x ourestimate of the company’s normalized EBITDA of $1.1 billion, which is a half-turnhigher than the 4.3x five-year average multiple leading up to the 2014 collapsein oil prices. The company is currently trading at 5.6x our fiscal 2018 EBITDAestimate of $0.78 billion, and 4.1x our 2019 EBITDA estimate of $0.96 billion. Webelieve the half-turn premium is warranted due its peer leading leverage to thecycle with its higher mix of pressure pumping revenues and margins.
The main investment risks include: 1) shifts in OPEC policy and the influencethat would have on oil prices and ultimately US upstream capital expenditures,2) negative revisions to global oil demand, 3) a rapid increase in frac newbuilds,and 4) a rapid acquisition strategy that threatens the returns of the company.
Figure 494: The EV/EBITDA valuation band as blown out Figure 495: The 5yr EV/EBITDA leading up to 2014
-
5
10
15
20
25
Jan-10 Jan-11 Jan-12 Jan-13 Jan-14 Jan-15 Jan-16 Jan-17
EV/EBITDA -1 std 5yr avg +1 std
-
2
4
6
8
10
12
Jan
-10
Ap
r-1
0
Jul-
10
Oct
-10
Jan
-11
Ap
r-1
1
Jul-
11
Oct
-11
Jan
-12
Ap
r-1
2
Jul-
12
Oct
-12
Jan
-13
Ap
r-1
3
Jul-
13
Oct
-13
Jan
-14
Ap
r-1
4
Jul-
14
Oct
-14
EV/EBITDA -1 std 5yr avg +1 std
Source: Factset Source: Factset
Page 222 Deutsche Bank Securities Inc.

9 October 2017
Oil Services & Equipment
Initiation of coverage
Company description
Patterson-UTI Energy (PTEN) is the second largest land drilling company in theUS where it is also a leading provider of pressure pumping services. The companymarkets a total of 295 land rigs including 287 in the US where it has 15% marketshare, and seven in Western Canada. The company is also evaluating internationalopportunities in the Middle East and North Africa. Its pressure pumping businessconsists of 1.5 million horsepower in Texas, the Appalachia region and the mid-continent.
Figure 496: Company reporting segments
Contract Drilling Other
- United States - 287 land rigs - Warrior Rig Technologies
- Canada - 7 land rigs - Top drives, drawworks
- Pipe handling tools, Catwalks
- Great Plains Oilfield Rental
Pressure Pumping - BOPs, drill pipe, drill collars
- Texas - 850k horsepower - Water delivery, pumps, frac tanks
- Appalachia - 350k horsepower - MS Energy Services
- Mid-continent - 300k horsepower - Directional drilling services
Patterson-UTI Energy
Source: Deutsche Bank
PTEN also has a rental tools business through its Great Plains OilfieldRental subsidiary, and an equipment manufacturer, Warrior, which providesrig components including top drives, drawworks and pipe handling tools. Thecompany recently acquired MS Energy Services, which is a leading providerof directional drilling in the US. The company’s acquisitions of Seventy-SevenEnergy, Warrior and now MS Energy are all aligned with its strategy to reestablishPTEN in the oilfield services value chain.
Figure 497: Revenues by reporting segment
Contract
drilling
82%
Pressure
pumping
10%
Other
8%
2007
Contract
drilling
58%
Pressure
pumping
40%
Other
2%
2016
Source: Company reports
Deutsche Bank Securities Inc. Page 223

9 October 2017
Oil Services & Equipment
Initiation of coverage
Principal Sources and Uses of Cash Flow
PTEN’s principal market is the United States, where it generates approximately98% of its revenue. But its principal source of cash flow in the US has evolvedsignificantly over the past decade. Historically PTEN has been highly geared to thecommoditized mechanical rig market, with only about 10% of its revenues comingfrom pressure pumping services. But for the last ten years, the company hasintensely focused on its competitive positioning both in the land drilling marketas well as in the overall oilfield services value chain.
Figure 498: Geographic revenue mix
United
States
97%
Canada
3%
2007
United
States
98%
Canada
2%
2016
Source: Company reports
PTEN combined a history of acquisitions with a newbuild strategy that hastransformed the company. Ten years ago, PTEN had 350 land rigs, 80% of whichwere mechanical rigs. Since then, all of its mechanical rigs have been retired andthe company has organically and through acquisitions added 239 electric rigsincluding 199 of its proprietary APEX rigs.
Figure 499: Trend in composition of land rig fleet
324 343
361
403
336 350 344 341 356
328 314 279
239 221
202
295
0
50
100
150
200
250
300
350
400
450
20
02
20
03
20
04
20
05
20
06
20
07
20
08
20
09
20
10
20
11
20
12
20
13
20
14
20
15
20
16
20
17
(a) (a) (a) (a) (a) (a) (a) (a) (a) (a) (a) (a) (a) (a) (a) (e)
Rig
s
Mechanical Electric
91 rigs acquired in
Seventy-Seven Energy
Source: Company reports, Deutsche Bank
Page 224 Deutsche Bank Securities Inc.

9 October 2017
Oil Services & Equipment
Initiation of coverage
Figure 500: Composition of land rig fleet as of 2Q17
Classification US CN Total Pad rigs % pad
From Patterson-UTI
APEX-XK 1500® 57 0 57 53 93%
APEX 300-Series® 49 0 49 49 100%
APEX 1500® 44 1 45 11 24%
APEX 1000® 11 0 11 8 73%
APEX-XCゥ (1) 1 0 1 1 100%
Total APEX class rigs 162 1 163 122 75%
From Seventy Seven Energy (SSE)
PW;ニWRキェゲゥ 28 0 28 28 100%
Other AC drive rigs 12 0 12 9 75%
Total AC drive rigs (2) 40 0 40 37 93%
Other electric rigs
Patterson-UTI Energy 35 6 41 8 20%
Seventy Seven Energy 51 0 51 35 69%
Total other electric 86 6 92 43 47%
Combined rig fleet 288 7 295 202 68%
Total APEX class rigs (1) (2) 198 1 199 158 79%
Source: Company reports, Deutsche Bank
In pressure pumping, the company has added about 1.4 million horsepower overthe same period, elevating revenues from 10% of the total in 2007 to 40% in 2016.We expect pressure pumping revenues will be over half of the revenue mix in2018, carrying an EBITDA margin of about 23%. About 500k horsepower wasacquired in the mid-continent in the acquisition of Seventy-Seven Energy thatclosed earlier in 2017.
Figure 501: Pressure pumping horsepower growth Figure 502: Geographic distribution of pressure pumping
0
200,000
400,000
600,000
800,000
1,000,000
1,200,000
1,400,000
1,600,000
2009 2010 2011 2012 2013 2014 2015 2016 2017
Acquired 500k hhp in
Seventy-Seven
Texas
57%Appalachia
23%
Mid-continent
20%
Source: Deutsche Bank Source: Deutsche Bank
Deutsche Bank Securities Inc. Page 225

9 October 2017
Oil Services & Equipment
Initiation of coverage
Figure 503: Pressure pumping and other services growing in the revenue mix
0
500
1,000
1,500
2,000
2,500
3,000
3,5002
00
2
20
03
20
04
20
05
20
06
20
07
20
08
20
09
20
10
20
11
20
12
20
13
20
14
20
15
20
16
20
17
20
18
(a) (a) (a) (a) (a) (a) (a) (a) (a) (a) (a) (a) (a) (a) (a) (e) (e)
In m
illio
ns
of
US
D
Contract drilling Pressure pumping Other
Source: Company reports, Deutsche Bank
Diversifying cash flow streamsNow PTEN has two core businesses with very different scarcity values, and isbuilding a third with the acquisitions of more service content. The scarcity valueof the land rigs has diminished severely, with the exception of super-spec rigs,which are above 90% utilization. PTEN has 107 super-spec rigs, or about 23% ofthe market. The company does not intend to fund newbuilds at this point, but doesintend to continue upgrading rigs to super-spec capabilities. PTEN is upgradingseven of its APEX 1000 rigs to super-spec at a cost of $7-8 million apiece. Webelieve the company has another 50 or so APEX rigs it can upgrade.
Figure 504: EBITDA trends
0
200
400
600
800
1,000
1,200
1,400
20
02
20
03
20
04
20
05
20
06
20
07
20
08
20
09
20
10
20
11
20
12
20
13
20
14
20
15
20
16
20
17
20
18
(a) (a) (a) (a) (a) (a) (a) (a) (a) (a) (a) (a) (a) (a) (a) (e) (e)
In m
illio
ns
of
US
D
Contract drilling Pressure pumping Other
Source: Company reports, Deutsche Bank
Page 226 Deutsche Bank Securities Inc.

9 October 2017
Oil Services & Equipment
Initiation of coverage
Figure 505: Income Statement(a) (a) (a) (a) (a) (a) (a) (a) (e) (e) (e)
In millions of USD 2009 2010 2011 2012 2013 2014 2015 2016 2017 2018 2019
Segment revenues
Contract drilling 599 1,082 1,670 1,822 1,614 1,839 1,084 521 1,036 1,250 1,390
Pressure pumping 161 351 846 842 979 1,293 712 354 1,211 1,727 1,779
Other 86 30 51 60 57 50 25 18 75 131 174
Total revenues 847 1,463 2,566 2,723 2,651 3,182 1,822 893 2,321 3,108 3,343
Segment EBITDA
Contract drilling 237 421 691 740 640 766 470 209 325 418 521
Pressure pumping 29 103 267 244 217 237 84 8 237 400 437
Other 14 23 41 49 44 37 13 8 13 44 87
Corporate (29) (35) (40) (41) (49) (54) (53) (49) (64) (74) (76)
Total EBITDA 250 512 958 991 853 986 515 176 511 787 969
D&A 281 333 437 514 560 624 702 668 758 816 822
EBIT (31) 179 521 477 293 362 (188) (492) (247) (29) 147
Interest (expense) (4) (8) (16) (22) (28) (30) (36) (40) (37) (37) (34)
Interest income 0 2 0 1 1 1 1 0 2 3 3
Equity income 0 0 0 0 0 0 0 0 0 0 0
Other income (7) 3 6 6 5 16 11 13 8 8 8
PBT (42) 175 511 462 271 349 (213) (519) (274) (56) 123
Income tax (expense) 15 (66) (188) (171) (99) (113) 73 180 101 21 (46)
Non-controlling interest 0 0 0 0 0 0 0 0 0 0 0
Preferred dividends 0 0 0 0 0 0 0 0 0 0 0
Net income (operating) (27) 108 323 291 171 236 (140) (339) (173) (35) 77
Discontinued ops (2) 0 (0) 0 0 0 0 0 0 0 0
Unusual after-tax (9) 9 0 8 14 (21) (155) 16 (46) 0 0
Net income (GAAP) (38) 117 323 299 186 216 (295) (323) (219) (35) 77
Operating EPS (0.18) 0.71 2.08 1.92 1.18 1.62 (0.96) (2.32) (0.91) (0.17) 0.38
GAAP EPS (0.25) 0.76 2.08 1.97 1.27 1.48 (2.02) (2.21) (1.15) (0.17) 0.38
DPS 0.20 0.20 0.20 0.20 0.20 0.40 0.40 0.16 0.08 0.08 0.08
Diluted shares 152 154 155 152 146 146 146 146 191 201 201
EBITDA margin 29.6% 35.0% 37.3% 36.4% 32.2% 31.0% 28.2% 19.7% 22.0% 25.3% 29.0%
EBIT margin -3.6% 12.2% 20.3% 17.5% 11.1% 11.4% -10.3% -55.1% -10.7% -0.9% 4.4%
Tax rate 36.3% 38.0% 36.8% 37.0% 36.7% 32.3% 34.3% 34.7% 36.8% 37.5% 37.5%
Contract Drilling:
Rigs working 91 168 216 221 192 211 124 64 140 167 174
Rigs available 341 356 328 314 279 239 221 202 295 295 295
Utilization 27% 47% 66% 70% 69% 88% 56% 32% 48% 57% 59%
Daily revenue 17,948 17,666 21,201 22,536 23,089 23,881 24,021 22,071 20,216 20,508 21,835
Daily margin 7,233 6,960 8,849 9,231 9,235 10,028 10,535 9,111 6,459 6,945 8,271
EBITDA margin
Contract Drilling 39.6% 38.9% 41.4% 40.6% 39.6% 41.6% 43.3% 40.2% 31.4% 33.4% 37.5%
Pressure Pumping 17.7% 29.4% 31.5% 29.0% 22.2% 18.3% 11.8% 2.3% 19.6% 23.1% 24.5%
Source: Deutsche Bank
Deutsche Bank Securities Inc. Page 227

9 October 2017
Oil Services & Equipment
Initiation of coverage
Figure 506: Cash Flow Statement
(a) (a) (a) (a) (a) (a) (a) (a) (e) (e) (e)
In millions of USD 2009 2010 2011 2012 2013 2014 2015 2016 2017 2018 2019
Net income (27) 108 323 291 171 236 (140) (339) (174) (37) 74
Depreciation 281 333 437 514 560 624 702 668 758 816 822
Deferred tax 101 147 159 160 51 44 (100) (152) (91) 0 0
Chg in receivables 214 (178) (183) 53 12 (214) 441 72 (254) (36) (45)
Chg in inventories 14 (9) (13) 5 1 (6) 40 6 (39) (1) (1)
Chg in payables (53) 50 42 (25) 11 87 (132) 12 126 6 7
Other (77) 74 104 7 83 (42) 187 38 6 8 10
Cash from operations 454 526 869 1,005 889 729 999 305 334 756 868
Capital expenditures (453) (738) (1,012) (974) (662) (1,052) (744) (120) (580) (525) (433)
Free cash flow 1 (212) (143) 31 226 (324) 256 185 (247) 232 435
Acquisitions 0 (238) 0 0 0 (176) 0 0 (434) 0 0
Asset sales 3 29 22 66 10 33 21 22 35 0 0
Dividends paid (31) (31) (31) (30) (29) (58) (59) (24) (16) (16) (16)
ESPP | options 1 1 17 1 7 31 0 0 0 0 0
Equity issuance, net (2) (2) (4) (170) (74) (14) (8) (4) 468 0 0
Debt issuance, net 0 399 104 196 (1) 293 (132) (255) 215 (150) (65)
Other (4) 32 32 (7) (1) 8 (7) (3) 0 0 0
Chg in cash (31) (22) (4) 87 139 (206) 70 (78) 22 65 354
FCF per share 0.01 (1.38) (0.92) 0.21 1.55 (2.22) 1.75 1.27 (1.29) 1.15 2.16
Capex / revenue 0.53 0.50 0.39 0.36 0.25 0.33 0.41 0.13 0.25 0.17 0.13
Capex / depreciation 1.61 2.21 2.31 1.89 1.18 1.69 1.06 0.18 0.77 0.64 0.53
Source: Deutsche Bank
Page 228 Deutsche Bank Securities Inc.

9 October 2017
Oil Services & Equipment
Initiation of coverage
Figure 507: Balance Sheet(a) (a) (a) (a) (a) (a) (a) (a) (e) (e) (e)
In millions of USD 2009 2010 2011 2012 2013 2014 2015 2016 2017 2018 2019
Cash and equivalents 50 28 24 111 250 43 113 35 57 122 476
Accounts receivable 164 337 518 466 452 663 220 148 552 588 632
Inventories 7 17 31 27 21 32 15 20 46 47 48
Other current assets 236 175 192 97 86 170 139 80 80 85 92
Total current assets 457 557 765 700 809 909 487 283 734 842 1,248
Net PP&E 2,110 2,621 3,167 3,615 3,636 4,131 3,921 3,409 4,214 3,923 3,534
Goodwill 86 180 176 171 167 221 93 89 540 540 540
Other assets 8 65 114 70 75 133 33 23 77 82 88
Total assets 2,662 3,423 4,222 4,557 4,687 5,394 4,533 3,805 5,565 5,387 5,410
Accounts payable 84 162 242 189 173 382 83 126 323 329 337
Current debt 0 6 10 6 10 13 64 0 0 0 0
Other current liabilities 110 147 167 165 171 173 162 139 280 298 321
Total current liabilities 193 316 419 360 354 568 308 265 603 627 657
Long-term debt 0 393 493 693 683 973 791 598 814 664 599
Other LT liabilities 580 843 1,213 1,224 1,249 1,515 1,181 957 1,206 1,231 1,261
Shareholders' equity 2,082 2,188 2,517 2,641 2,756 2,906 2,561 2,249 3,546 3,493 3,551
Total liabilities and equity 2,662 3,423 4,222 4,557 4,687 5,394 4,533 3,805 5,565 5,387 5,410
Total debt 0 399 503 699 693 986 855 598 814 664 599
Net debt (50) 371 479 588 443 942 742 563 757 541 122
Debt/capital 0% 15% 17% 21% 20% 25% 25% 21% 19% 16% 14%
Debt/equity 0% 18% 20% 26% 25% 34% 33% 27% 23% 19% 17%
Debt turns 0.0 0.8 0.5 0.7 0.8 1.0 1.7 3.4 1.6 0.8 0.6
Source: Deutsche Bank
Deutsche Bank Securities Inc. Page 229

9 October 2017
Oil Services & Equipment
Initiation of coverage
Rating
HoldNorth AmericaCanada
IndustrialsOil Services & Equipment
Company
Precision Drilling
Reuters Bloomberg
PD.TO PD CN
Capital upgrades focusing on US landfleetInitiating coverage with a Hold rating and a $4 price targetThe drilling more with less trend in the US has the company pivoting from anewbuild strategy to an upgrade strategy as it looks to continue growing itsUS market share. We expect overall US rig activity to flatten in 2018, creatinga challenging environment to recreate the customary pricing leverage we havebecome accustomed to in land drilling. Canadian activity has Precision’s revenuemix leaning toward the shallower basins, where dayrate traction has thus far nothad any success.
Commodity prices are deflating the Precision’s customary drilling leverageNot only are producers drilling more with less, but now the US is exerting moreinfluence on global oil markets than it has in over 30 years. We believe this willconfine oil prices to a range of $40-55 through 2018. This combined with all of itspeers also looking to upgrade rigs in the US in an otherwise flat market in 2018undermines Precision’s earnings power as it looks to add value via technology.
Highly levered balance sheet, but pivoting to positive free cash flow in 2017Precision exited 2Q17 with 7.4 debt turns, up more than 3x from where it was in2014. This should decline through 2018 in our view to about 4.7 turns. We expectfree cash flow to be positive in 2017 and 2018 by almost CAD$200 million.
ValuationOur $4 price target is 5.2x our estimate ofthe company’s normalized EBITDA of $0.5billion, which is in-line with the 5.2x five-year average multiple leading up to the2014 collapse in oil prices. Valuations haveconsolidated due to the high leverage inour view as markets reassess the earningspower. The main investment risks include: 1)shifts in OPEC policy and the influence thatwould have on oil prices and ultimately USupstream capital expenditures, 2) negativerevisions to global oil demand, and 3)a derailing of PD’s efforts to captureincremental margin from its control systemand process automation software.
Forecasts and ratios
Year End Dec 31 2016A 2017E 2018E
1Q EPS -0.12 -0.08A -0.04
2Q EPS -0.19 -0.12A -0.11
3Q EPS -0.17 -0.08 -0.03
4Q EPS -0.10 -0.07 0.02
FY EPS (CAD) -0.58 -0.35 -0.15
OLD FY EPS (CAD) -0.57 – –
% Change 1.9% – –
P/E (x) – – –
DPS (CAD) 0.00 0.00 0.00
Dividend Yield (%) 0.0 0.0 0.0
Revenue (CADm) 928.8 1,372.6 1,763.4Source: Deutsche Bank estimates, company data
David HavensResearch [email protected]
Price at 5 Oct 2017 (CAD) 3.57
Price target 4.00
52-week range 7.86 - 3.02
Price/price relative
Precision Drilling TSE Composite (Rebased)
Jan '15 May '15 Sep '15 Jan '16 May '16 Sep '16 Jan '17 May '17 Sep '172
4
6
8
10
12
14
Performance(%)
1m 3m 12m
Absolute 10.8 -20.3 -36.1
TSEComposite
3.5 3.9 8.3
Source: Deutsche Bank
Stock & option liquidity data
Market Cap (CADm) 1,046.9
Shares outstanding (m) 293.2
Free float (%) 100
Volume (5 Oct 2017) 2,393,476
Option volume (und. shrs., 1M avg.) –Source: Deutsche Bank
Page 230 Deutsche Bank Securities Inc.

9 October 2017
Oil Services & Equipment
Initiation of coverage
Key investment themes
Upgrades and market share are the focusImproved drilling efficiencies and enhanced completion designs have enabled USproducers to drill a higher cadence of more productive wells using fewer rigs. Thishas undermined the earnings power of the land drilling industry and has forcedits key players to devise strategies that will reestablish them in the value chain.Precision sees the best opportunity being market share in the US and rig upgradesthat will add to the daily rig rate.
Vying market share growth in the US onshorePart of Precision’s strategy is to continue market share growth in the US. Thecompany does not intend to fund newbuilds in this environment, but it does viewupgrades in the US as a core opportunity. This includes upgrading its Super Tripleswith NOVOS process automation controls, 20 of which have already been done.The company expects this upgrade to fetch an added $1,500 per day. Overall,Precision’s capital program has targeted 35 Super Triple upgrades at an averageof CAD$1.5 million per rig. As the company moves towards the back-end of itsfleet, it expects per rig cost to rise to CAD$7-8 million.
Regional mix pressuring Precision’s dayrates in CanadaThere are fewer rigs working under legacy contracts and a higher proportion ofrevenue coming from the shallower Canadian plays (Southern Saskatchewan andCentral /Southern Alberta regions) that have dayrates in the low teens. Pricing inthe shallow parts of Western Canada remains challenged due to excess supply,and Precision’s efforts to push higher have not worked. Where Precision hasgotten increased pricing is in the deeper basins (Montney and Duvernay). Thecompany is getting low $20s for Super Triples and Super Triple 1500s, and high-teens for Super Triple 1200s. Super Triples earn 2x the EBITDA as smaller rigs.We expect only moderate pricing in Canada in 2018.
Commodity prices have dampened the broad North America recoveryBut it is also sustaining the focus on rig efficiencies and best practices. Precisionis looking to showcase its technologies including pad walking systems, extendedreach horizontal drilling, AMPHION AC control systems, process automationcontrols, directional drilling guidance software, advanced drilling applications andwired pipe.
Does not expect to realize any upside in its international segment in 2H17Most of Precision’s efforts are focusing on operations, i.e. rig performance, rigmove times, and operating costs. Management believes customer demand maybe bottoming and it is seeing some green shoots in the Middle East and LatinAmerica, but not Mexico. The company has four idle rigs in the Middle East andfive idle rigs in Mexico that they are actively bidding.
Precision is focusing on rejuvenating free cash flow and reducing debtSince 2011, the company on a cumulative basis has been free cash flow negativeby about CAD$0.66 billion and debt turns have risen to 7.4x, one of the highestamongst the land drilling peers. We do expect the company to be free cash flowpositive in 2017 and 2018 by a combined CAD$0.2 billion and for debt turns todrop to 4.7x by year-end 2018.
Deutsche Bank Securities Inc. Page 231

9 October 2017
Oil Services & Equipment
Initiation of coverage
Valuation and risksOur $4 price target is 5.2x our estimate of the company’s normalized EBITDA of$0.5 billion, which is in-line with the 5.2x five-year average multiple leading upto the 2014 collapse in oil prices. Valuations have consolidated due to the highleverage in our view as markets reassess the earnings power.
The main investment risks include: 1) shifts in OPEC policy and the influencethat would have on oil prices and ultimately US upstream capital expenditures,2) negative revisions to global oil demand, and 3) a derailing of PD’s effortsto capture incremental margin from its control system and process automationsoftware..
Figure 508: The EV/EBITDA valuation band as blown out Figure 509: The 5yr EV/EBITDA leading up to 2014
-
2
4
6
8
10
12
14
Jan
-10
Ap
r-1
0Ju
l-1
0O
ct-1
0Ja
n-1
1A
pr-
11
Jul-
11
Oct
-11
Jan
-12
Ap
r-1
2Ju
l-1
2O
ct-1
2Ja
n-1
3A
pr-
13
Jul-
13
Oct
-13
Jan
-14
Ap
r-1
4Ju
l-1
4O
ct-1
4Ja
n-1
5A
pr-
15
Jul-
15
Oct
-15
Jan
-16
Ap
r-1
6Ju
l-1
6O
ct-1
6Ja
n-1
7A
pr-
17
Jul-
17
-1 std 5yr avg +1 std
2
3
4
5
6
7
8
9
Jan
-10
Ap
r-1
0
Jul-
10
Oct
-10
Jan
-11
Ap
r-1
1
Jul-
11
Oct
-11
Jan
-12
Ap
r-1
2
Jul-
12
Oct
-12
Jan
-13
Ap
r-1
3
Jul-
13
Oct
-13
Jan
-14
Ap
r-1
4
Jul-
14
Oct
-14
-1 std 5yr avg +1 std
Source: Factset Source: Factset
Page 232 Deutsche Bank Securities Inc.

9 October 2017
Oil Services & Equipment
Initiation of coverage
Company description
Precision Drilling Corporation (PDS) is a contract drilling and well servicingcompany with operations in the US, Canada, Mexico and the Middle East.Precision’s core business is land drilling with a fleet of 256 rigs, which accountedfor 86% of revenues in 2016, excluding the 3% from the directional drillingbusiness. In the US, Precision has 103 land rigs and is the fourth largest contractorwith 7% market share. In Canada, Precision in the largest land driller with 136land rigs and 29% market share. Precision’s international operations were 18%of 2016 revenues and include 17 land rigs. Its directional drilling business, whichis included in the Contract Drilling segment, provides services in the US as wellas Canada.
Figure 510: Company reporting segments
Contract Drilling Services Completion & Production Services
- Canada - 136 land rigs - Completion and workover service rigs
- United States - 103 land rigs - Canada - 191 service rigs
- International - 17 land rigs - United States - 8 service rigs
- Directional drilling services - Snubbing units (11 in Canada)
- Canada - Equipment rentals (Canada and US)
- United States - Camps and catering (Canada)
- Water systems (Canada)
Precision Drilling Corporation
Source: Deutsche Bank
Precision’s Completion and Production segment includes the largest wellservicing fleet in Canada where it has 191 of its 199 well servicing rigs, and all11 of its snubbing units. Well servicing in Canada and the US was 7% of 2016revenues. The other 4% included Precision Rentals, LRG Camp and Catering, andTerra Water Systems.
Figure 511: Revenues by reporting segment
Contract
Drilling
Services
72%
Completion &
Production
28%
2008
Contract
Drilling
Services
89%
Completion &
Production
11%
2016
Source: Company reports
Deutsche Bank Securities Inc. Page 233

9 October 2017
Oil Services & Equipment
Initiation of coverage
Principal Sources and Uses of Cash Flow
Precision’s core business is land drilling and its two principal markets are theUS and Canada. US land drilling has grown within Precision from 17% of 2008revenues to 39% of 2016 revenues due to the acquisition of Grey Wolf in 2008 anda major newbuild and upgrade campaign that started in 2011. International landdrilling has also grown from nothing in 2008 to 18% of 2016 revenues. Precisionhas 17 rigs in international markets including Mexico (5), Kuwait (5), Saudi Arabia(4), Kurdistan (2) and Georgia (1).
Figure 512: Revenue contribution detail
Drilling - US
17%
Drilling - CAN
51%
Drilling -
INTL
0%
Directional
0%
Well
servicing
21%
Other
C&P
11%
2008
Drilling - US
39%
Drilling - CAN
28%
Drilling -
INTL
18%
Directional
3%
Well
servicing
7%
Other
C&P
5%
2016
Source: Deutsche Bank
Precision’s well servicing business has declined in its contribution from 21% in2008 to 7% in 2016. Precision believes this business is oversupplied and highlycompetitive, with pricing the key differentiator. The company does see its scaleand cost leverage as competitive advantages, but the business has not beenprofitable at the EBIT level since 2015. While management is focusing on morecost reductions, this is a business that is highly responsive to commodity pricechanges.
Figure 513: PDS revenue mix and outlook Figure 514: PDS EBITDA mix and outlook
0
500
1,000
1,500
2,000
2,500
2007 2008 2009 2010 2011 2012 2013 2014 2015 2016 2017 2018
(a) (a) (a) (a) (a) (a) (a) (a) (a) (a) (e) (e)
In m
illio
ns
of
CA
D
Contract Drilling Services Completion & Production
(100)
0
100
200
300
400
500
600
700
800
900
1,000
2007 2008 2009 2010 2011 2012 2013 2014 2015 2016 2017 2018
(a) (a) (a) (a) (a) (a) (a) (a) (a) (a) (e) (e)
In m
illio
ns
of
CA
D
Contract Drilling Services Completion & Production
Source: Company reports, Deutsche Bank Source: Company reports, Deutsche Bank
Page 234 Deutsche Bank Securities Inc.

9 October 2017
Oil Services & Equipment
Initiation of coverage
Figure 515: Super Series rig expansion campaign Figure 516: Contract drilling expansion and upgradecapex
0
20
40
60
80
100
120
140
160
2007 2008 2009 2010 2011 2012 2013 2014 2015 2016 2017
Rigs
0
100
200
300
400
500
600
700
800
2007 2008 2009 2010 2011 2012 2013 2014 2015 2016
Expansion Upgrade
Source: Company reports, Deutsche Bank Source: Company reports, Deutsche Bank
Fleet expansion has been core to Precision’s strategy, especially in the USPrecision’s strategy is to concentrate on market share growth in the US and tocommercialize rig automation and efficiency driven technologies across its SuperSeries fleet. Prior to the drop in oil prices, Precision had launched a significant rigexpansion and upgrade program that added 139 Super Series rigs over the last tenyears. The company spent about CAD$2.9 billion on its Super-Series expansionover that period and about CAD$0.9 billion on upgrades. Just since 2011, thecompany added 99 of these newbuilds and 21 major upgrades for a net 120 tier1 rigs for CAD$2.9 billion. Precision decommissioned 196 legacy rigs over thatsame period.
Going forward, Precision sees upgrades in the US as the core opportunity.The company is looking to upgrade its Super Triples with its NOVOS processautomation, which the company believes can add $1,500 per day to the rate. Sofar 20 have been done and the company has targeted 35 Super Triple upgradesat an average of CAD$1.5 million per rig. As Precision moves to the back halfof its fleet, upgrade costs will escalate to CAD$7-8 million per rig according tomanagement.
Figure 517: Drilling rigs added by geography Figure 518: Drilling rigs retired by geography
0
5
10
15
20
25
30
35
40
2007 2008 2009 2010 2011 2012 2013 2014 2015 2016 2017
Rig
s
Canada United States International
0
10
20
30
40
50
60
70
80
90
2007 2008 2009 2010 2011 2012 2013 2014 2015 2016 2017
Rig
s
Canada United States International
Source: Company reports, Deutsche Bank Source: Company reports, Deutsche Bank
Deutsche Bank Securities Inc. Page 235

9 October 2017
Oil Services & Equipment
Initiation of coverage
Figure 519: Precision’s Canadian rig fleet (136 rigs) Figure 520: Precision’s US rig fleet (103 rigs)
Super Single
49%
Super Double
10%
Super Triple
31%
Other
10%Super Single
14%
Super Triple
86%
Source: Company reports, Deutsche Bank Source: Company reports, Deutsche Bank
Technology is core to PrecisionPrecision has been investing in technology for its rigs in a competitiverepositioning effort for over ten years. Starting with the investment in AC-electricrigs in 2006 (106 AC rigs currently with 20 upgrade candidates) and the additionof walking systems in 2008, the company went on to add integrated directionaldrilling, wired pipe and process automation control.
Precision is in the midst of adding its NOVOS Process Automation Control (PAC) toits AC fleet. The company targeted 20 rigs by year-end 2017 with full deploymentacross all AC rigs by mid-2019. The company is also partnered with Schlumbergerand Pason for its directional guidance system (DGS). Precision also uses wiredpipe for improved downhole transmission rates and is investing in Big Dataanalytics and machine leaning to improve rig efficiencies and deploy predictivemaintenance.
Figure 521: Net changes to US rig fleet Figure 522: US rig fleet asset distribution (103 rigs)
0
20
40
60
80
100
120
140
160
2007 2008 2009 2010 2011 2012 2013 2014 2015 2016 2017
<1,000 HP
1% 1,000 HP
9%
1,200 HP
16%
1,400 HP
1%
1,500 HP
66%
2,000 HP
7%
Source: Company reports, Deutsche Bank Source: Company reports, Deutsche Bank
Page 236 Deutsche Bank Securities Inc.

9 October 2017
Oil Services & Equipment
Initiation of coverage
Figure 523: Income Statement(a) (a) (a) (a) (a) (a) (a) (a) (e) (e) (e)
In millions of CAD 2009 2010 2011 2012 2013 2014 2015 2016 2017 2018 2019
Segment revenue:
Contract Drilling Services 1,031 1,213 1,632 1,725 1,720 2,017 1,378 833 1,176 1,566 2,270
Completion & Production 176 228 330 326 323 344 186 100 202 204 204
Eliminations (10) (11) (11) (11) (13) (10) (9) (5) (5) (6) (9)
Total revenues 1,197 1,430 1,951 2,041 2,030 2,351 1,556 929 1,373 1,763 2,465
Segment EBITDA:
Contract Drilling Services 397 417 665 649 654 821 551 277 339 415 544
Completion & Production 42 59 104 94 61 58 12 (2) 13 20 20
Corporate, other (33) (40) (75) (72) (76) (79) (72) (64) (46) (43) (42)
EBITDA 407 435 695 671 639 800 491 211 306 392 522
D&A 138 183 251 308 333 432 487 392 377 353 339
EBIT 269 253 444 363 306 369 5 (180) (71) 39 183
Interest (expense) (138) (96) (74) (90) (94) (111) (139) (150) (137) (137) (137)
Interest income 0 1 2 2 1 1 4 3 2 8 40
Equity income 0 0 0 0 0 0 0 0 0 0 0
Other income 0 1 (9) (3) 9 1 33 (6) 1 0 0
PBT 131 158 363 273 222 260 (97) (333) (206) (89) 87
Income tax (expense) (4) (4) (73) (41) (30) (31) 64 162 104 45 (44)
Non-controlling interest 0 0 0 0 0 0 0 0 0 0 0
Net income (operating) 127 154 290 231 191 229 (33) (171) (102) (44) 43
Discontinued ops 0 0 0 0 0 0 0 0 0 0 0
Unusual after-tax 34 (92) (97) (179) 0 (196) (330) 16 0 0 0
Net income (GAAP) 162 62 193 52 191 33 (363) (156) (102) (44) 43
Operating EPS 0.50 0.55 1.01 0.81 0.66 0.78 (0.11) (0.58) (0.35) (0.15) 0.15
GAAP EPS 0.64 0.22 0.67 0.18 0.66 0.11 (1.24) (0.53) (0.35) (0.15) 0.15
DPS 0.14 0.00 0.00 0.05 0.20 0.25 0.28 0.00 0.00 0.00 0.00
Diluted shares 256 283 289 287 288 294 293 293 293 293 293
EBITDA margin 34.0% 30.5% 35.6% 32.9% 31.5% 34.1% 31.6% 22.7% 22.3% 22.2% 21.2%
EBIT margin 22.5% 17.7% 22.7% 17.8% 15.1% 15.7% 0.3% -19.4% -5.2% 2.2% 7.4%
Tax rate 3.1% 2.4% 20.1% 15.2% 13.7% 11.8% 65.8% 48.5% 50.6% 50.5% 50.5%
Canada Drilling
Rigs working 58 85 104 88 84 90 47 35 60 108 192
Rigs available 203 203 189 186 187 174 134 135 136 136 136
Utilization 29% 42% 55% 48% 45% 52% 35% 26% 44% 79% 141%
Average dayrate (CAD) 17,824 16,159 18,442 21,030 22,108 22,250 23,670 20,760 18,168 18,833 19,550
US Drilling
Rigs working 62 89 104 95 83 96 58 31 57 61 62
Rigs available 146 151 144 127 127 124 102 103 103 103 103
Utilization 43% 59% 72% 74% 65% 77% 57% 30% 55% 59% 60%
Average dayrate (USD) 23,194 18,952 21,780 23,698 23,586 24,337 25,730 24,472 18,941 18,657 19,412
International Drilling
Rigs working 2 2 2 6 10 11 11 8 8 9 11
Rigs available 3 3 6 8 13 15 15 17 17 17 17
Utilization 65% 55% 32% 70% 75% 74% 75% 45% 47% 54% 65%
Average dayrate (CAD) 33,448 45,248 32,755 31,152 38,729 48,436 55,369 60,763 66,805 65,144 65,144
Source: Deutsche Bank
Deutsche Bank Securities Inc. Page 237

9 October 2017
Oil Services & Equipment
Initiation of coverage
Figure 524: Cash Flow Statement(a) (a) (a) (a) (a) (a) (a) (a) (e) (e) (e)
In millions of CAD 2009 2010 2011 2012 2013 2014 2015 2016 2017 2018 2019
Net income 127 154 290 231 191 229 (33) (171) (102) (44) 43
Depreciation 138 183 251 308 333 432 487 392 377 353 339
Deferred tax 15 (16) 47 (25) 30 (12) (203) (153) (60) 0 0
Other 224 (16) (56) 121 (127) 31 266 55 (4) 0 0
Cash from operations 505 305 533 635 428 680 517 123 211 309 382
Capital expenditures (193) (176) (726) (868) (536) (857) (459) (203) (143) (197) (236)
Free cash flow 311 129 (194) (233) (108) (177) 58 (81) 68 112 145
Acquisitions 0 0 (93) (0) 0 0 0 (12) 0 0 0
Asset sales 16 12 16 31 13 102 10 8 6 0 0
Dividends paid (27) 0 0 (14) (58) (73) (82) 0 0 0 0
ESPP | options 0 0 2 2 2 7 0 2 0 0 0
Equity issuance, net 413 (0) 0 0 48 0 0 0 0 0 0
Debt issuance, net (565) (33) 407 0 30 406 0 (208) 0 0 0
Other (79) 18 72 (101) (0) 146 (33) (37) (46) 0 0
Chg in cash 69 126 211 (315) (72) 411 (47) (329) 27 112 145
FCF per share 1.22 0.46 (0.67) (0.81) (0.37) (0.60) 0.20 (0.28) 0.23 0.38 0.50
Capex / revenue 0.16 0.12 0.37 0.43 0.26 0.36 0.29 0.22 0.10 0.11 0.10
Capex / depreciation 1.40 0.96 2.89 2.82 1.61 1.98 0.94 0.52 0.38 0.56 0.70
Source: Deutsche Bank
Page 238 Deutsche Bank Securities Inc.

9 October 2017
Oil Services & Equipment
Initiation of coverage
Figure 525: Balance Sheet(a) (a) (a) (a) (a) (a) (a) (a) (e) (e) (e)
In millions of CAD 2009 2010 2011 2012 2013 2014 2015 2016 2017 2018 2019
Cash and equivalents 131 257 467 153 81 491 445 116 143 255 400
Accounts receivable 284 415 576 510 550 598 312 294 407 552 771
Inventories 9 5 7 14 12 9 24 24 37 50 73
Other current assets 26 0 0 0 0 0 0 0 41 41 41
Total current assets 449 677 1,051 676 643 1,099 781 434 628 898 1,285
Net PP&E 2,914 2,812 2,942 3,243 3,562 3,929 3,883 3,642 3,332 3,176 3,073
Goodwill 761 737 364 311 312 220 208 207 206 206 206
Other assets 517 748 1,122 747 705 1,160 787 437 631 901 1,288
Total assets 4,192 4,297 4,428 4,300 4,579 5,309 4,879 4,286 4,170 4,283 4,568
Accounts payable 128 216 437 334 333 493 236 241 294 391 572
Current debt 0 0 0 0 0 0 0 0 0 0 500
Other current liabilities 0 1 4 64 4 7 8 0 0 0 0
Total current liabilities 129 217 440 398 337 500 244 241 294 391 1,072
Long-term debt 749 804 1,240 1,219 1,323 1,852 2,181 1,907 1,845 1,845 1,345
Other LT liabilities 730 698 615 512 520 515 333 214 137 137 137
Non-controlling int 0 0 0 0 0 0 0 0 0 0 0
Shareholders' equity 2,585 2,578 2,133 2,171 2,399 2,441 2,121 1,924 1,894 1,911 2,014
Total liabilities and equity 4,192 4,297 4,428 4,300 4,579 5,309 4,879 4,286 4,170 4,283 4,568
Total debt 749 804 1,240 1,219 1,323 1,852 2,181 1,907 1,845 1,845 1,845
Net debt 618 548 772 1,066 1,243 1,361 1,736 1,791 1,702 1,590 1,445
Debt/capital 22% 24% 37% 36% 36% 43% 51% 50% 49% 49% 48%
Debt/equity 29% 31% 58% 56% 55% 76% 103% 99% 97% 97% 92%
Debt turns 1.8 1.8 1.8 1.8 2.1 2.3 4.4 9.0 6.0 4.7 3.5
Source: Deutsche Bank
Deutsche Bank Securities Inc. Page 239

9 October 2017
Oil Services & Equipment
Initiation of coverage
Rating
HoldNorth AmericaUnited States
IndustrialsOil Services & Equipment
Company
Rowan Companies
Reuters Bloomberg
RDC.N RDC US
High-Specification Jackup ExposureInitiating coverage with a Hold rating and an $15 price targetThe main headwind for Rowan has been its rapidly eroding backlog acceleratedby early terminations in its ultra-deepwater fleet. Rowan has high quality, high-specification rigs with over $1 billion in cash on the balance sheet and a JV withSaudi Aramco that provides line-of-sight to 20 newbuild jackups with 15 year termcommitments. But the problem is, through 2019, EBITDA erodes aggressively to$230 million in 2018 and less than $200 million in 2019 without some big contractwins in our view.
Jackup market turning up and RDC has premier rigs, but deepwater erodingOver 80% of Rowan’s backlog is in its jackup fleet, but its ultra-deepwater fleethas got zero committed days in 2019 and only 17% of its days committed in 2018.Normally we would look at the leverage some big contract wins could deliver tothe stock, but the fierce pricing tactics in the deepwater market deflate a lot ofthat leverage.
Could see M&A going either direction
Valuation & RisksWe are initiating coverage with an $15 pricetarget. This is about 4.0x our estimate ofthe company’s normalized EBITDA of $0.8billion, which is two-turns below the 6.0xten-year average multiple. The company iscurrently trading at 11.3x our fiscal 2018EBITDA estimate of $0.2 billion. We believethe discounted multiple is warranted dueto the significant challenges that lie aheadfor the industry in terms of utilization andpricing power as the deepwater marketcopes with the historic supply demandimbalance.The main investment risks include: 1) shiftsin OPEC policy and the influence thatwould have on oil prices and ultimately USupstream capital expenditures, 2) negativerevisions to global oil demand, and 3)increased flow of capex directed away fromthe offshore and toward onshore operations.Upside risks are mainly associated witha rapid rise in oil prices, which wouldprompt the firmly entrenched sentiment inthe offshore drilling names to pivot in ourview.
Rowan would be an attractive target given its fleet quality, but we believe Rowanis interested in being a suitor as it looks to build scale, especially in its deepwatersegment. We believe Rowan is more agnostic about jackups versus drillships thanmany of its peers, and it would seek to do either if the right deal came about, butwe expect management will look hard to build more deepwater scale at theselevels.
Forecasts and ratios
Year End Dec 31 2016A 2017E 2018E
1Q EPS 0.98 0.07A -0.33
2Q EPS 0.75 -0.25A -0.38
3Q EPS 0.30 -0.21 -0.48
4Q EPS 0.07 -0.23 -0.73
FY EPS (USD) 2.10 -0.61 -1.93
OLD FY EPS (USD) 2.14 -0.76 -2.80
% Change -1.8% -19.6% -31.2%
P/E (x) 7.4 – –
DPS (USD) 0.00 0.00 0.00
Dividend Yield (%) 0.0 0.0 0.0
Revenue (USDm) 1,723.3 1,229.1 916.9Source: Deutsche Bank estimates, company data
David HavensResearch [email protected]
Price at 5 Oct 2017 (USD) 13.02
Price target 15.00
52-week range 20.90 - 9.04
Price/price relative
Rowan Companies S&P 500 INDEX (Rebased)
Jan '15 May '15 Sep '15 Jan '16 May '16 Sep '16 Jan '17 May '17 Sep '175
10
15
20
25
30
35
Performance(%)
1m 3m 12m
Absolute 25.9 16.3 -11.3
S&P 500INDEX
2.5 4.5 18.0
Source: Deutsche Bank
Stock & option liquidity data
Market Cap (USDm) 1,648.0
Shares outstanding (m) 126.6
Free float (%) 98
Volume (5 Oct 2017) 658,681
Option volume (und. shrs., 1M avg.) 101,868Source: Deutsche Bank
Page 240 Deutsche Bank Securities Inc.

9 October 2017
Oil Services & Equipment
Initiation of coverage
Key investment themes
Jackup exposure is majority of backlogRowan’s backlog stands at about $1.1 billion, which is down 35% from the $1.7billion in February 2009. Approximately 80% of the backlog is in the jackup fleet,which differentiates the company relative to its deepwater heavy peers. Rowan’sultra-deepwater backlog covers only 17% of the available days in 2018 and zeroin 2019. Its jackup backlog is about one-third of the total capacity.
Figure 526: Backlog by customer
-
0.1
0.2
0.3
0.4
0.5
0.6
0.7
Aramco APC Lundin TOT COP CIE Repsol EOG BP Arena
In b
illio
ns
of
USD
Source: Company reports, Deutsche Bank
In terms of customer concentration, Saudi Aramco is the single largest client with54% of Rowan’s backlog. Rowan’s top five customers are 90% of its total backlog.
Figure 527: Revenues in backlog Figure 528: Year-end backlog
-
100
200
300
400
500
600
2017 2018 2019 2020 2021
In m
illi
on
s o
f U
SD
Ultra-deepwater Jackups
-
100
200
300
400
500
600
700
800
900
2017 2018 2019 2020 2021
In m
illi
on
s o
f U
SD
Ultra-deepwater Jackups
Source: Company reports, Deutsche Bank Source: Company reports, Deutsche Bank
Deutsche Bank Securities Inc. Page 241
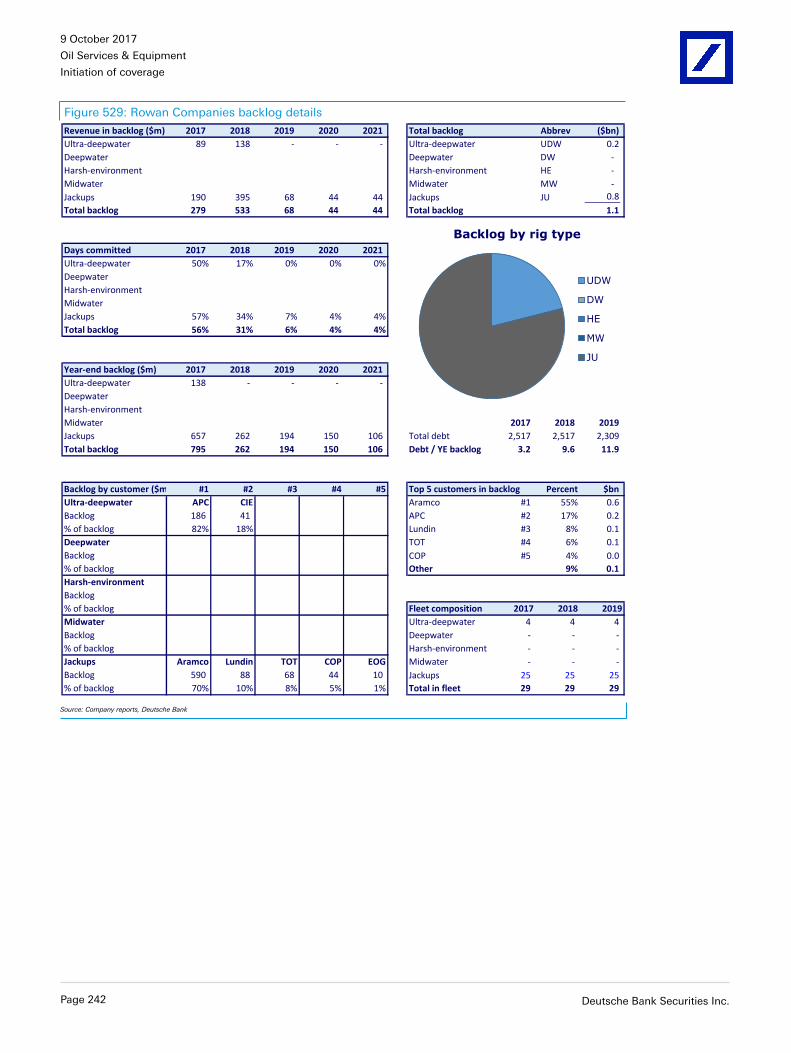
9 October 2017
Oil Services & Equipment
Initiation of coverage
Figure 529: Rowan Companies backlog details
Revenue in backlog ($m) 2017 2018 2019 2020 2021 Total backlog Abbrev ($bn)
Ultra-deepwater 89 138 - - - Ultra-deepwater UDW 0.2
Deepwater Deepwater DW -
Harsh-environment Harsh-environment HE -
Midwater Midwater MW -
Jackups 190 395 68 44 44 Jackups JU 0.8
Total backlog 279 533 68 44 44 Total backlog 1.1
Days committed 2017 2018 2019 2020 2021
Ultra-deepwater 50% 17% 0% 0% 0%
Deepwater
Harsh-environment
Midwater
Jackups 57% 34% 7% 4% 4%
Total backlog 56% 31% 6% 4% 4%
Year-end backlog ($m) 2017 2018 2019 2020 2021
Ultra-deepwater 138 - - - -
Deepwater
Harsh-environment
Midwater 2017 2018 2019
Jackups 657 262 194 150 106 Total debt 2,517 2,517 2,309
Total backlog 795 262 194 150 106 Debt / YE backlog 3.2 9.6 11.9
Backlog by customer ($m) #1 #2 #3 #4 #5 Top 5 customers in backlog Percent $bn
Ultra-deepwater APC CIE APA Aramco Arena Aramco #1 55% 0.6
Backlog 186 41 - - - APC #2 17% 0.2
% of backlog 82% 18% 0% 0% 0% Lundin #3 8% 0.1
Deepwater TOT #4 6% 0.1
Backlog COP #5 4% 0.0
% of backlog Other 9% 0.1
Harsh-environment
Backlog 09/25/17 12/31/17 12/31/18 12/31/19
% of backlog Fleet composition 2017 2018 2019
Midwater Ultra-deepwater 4 4 4
Backlog Deepwater - - -
% of backlog Harsh-environment - - -
Jackups Aramco Lundin TOT COP EOG Midwater - - -
Backlog 590 88 68 44 10 Jackups 25 25 25
% of backlog 70% 10% 8% 5% 1% Total in fleet 29 29 29
Backlog by rig type
UDW
DW
HE
MW
JU
Source: Company reports, Deutsche Bank
Page 242 Deutsche Bank Securities Inc.

9 October 2017
Oil Services & Equipment
Initiation of coverage
Valuation and risksWe are initiating coverage with an $15 price target. This is about 4.0x our estimateof the company’s normalized EBITDA of $0.8 billion, which is two-turns belowthe 6.0x ten-year average multiple. The company is currently trading at 11.3x ourfiscal 2018 EBITDA estimate of $0.2 billion. We believe the discounted multipleis warranted due to the significant challenges that lie ahead for the industry interms of utilization and pricing power as the deepwater market copes with thehistoric supply demand imbalance.
In terms of steel value, we assess the trough net asset value at $13.00 pershare, which assumes the market endures another three years of high volumesof cold-stacking once contracts expire and leading edge market rates that stay atbreakeven levels ($160-170 kpd) for deepwater rigs.
The main investment risks include: 1) shifts in OPEC policy and the influencethat would have on oil prices and ultimately US upstream capital expenditures,2) negative revisions to global oil demand, 3) contract risk with its deepwaterrigs, and 4) increased flow of capex directed away from the offshore and towardonshore operations. Upside risks are mainly associated with a rapid rise in oilprices, which would prompt the firmly entrenched sentiment in the offshoredrilling names to pivot in our view.
Figure 530: The EV/EBITDA valuation band as blown out Figure 531: The 5yr EV/EBITDA leading up to 2014
-
2
4
6
8
10
12
-1 std 10yr avg +1 std
5.8
3
4
5
6
7
8
9
10
Se
p-0
7
Jan
-08
Ma
y-0
8
Se
p-0
8
Jan
-09
Ma
y-0
9
Se
p-0
9
Jan
-10
Ma
y-1
0
Se
p-1
0
Jan
-11
Ma
y-1
1
Se
p-1
1
Jan
-12
Ma
y-1
2
Se
p-1
2
Jan
-13
Ma
y-1
3
Se
p-1
3
Jan
-14
Ma
y-1
4
Se
p-1
4
-1 std 10yr avg +1 std
Source: Factset Source: Factset
Deutsche Bank Securities Inc. Page 243

9 October 2017
Oil Services & Equipment
Initiation of coverage
Company description
Rowan Companies (RDC) is a contract drilling company with a fleet of 29 mobileoffshore drilling rigs including four ultra-deepwater drillships and 25 jackups.The company is principally known as a leader in the high-specification jackupmarket, but made its debut in the ultra-deepwater market in 2014 with the first offour high-specification drillships. The company also recently formed a 50/50 jointventure with Saudi Aramco that will over a period of ten years add 20 newbuildjackups with 15 year term commitments each in Saudi Arabia.
Figure 532: Revenues by rig type
Jackup
66%
Deepwater
0%
Manufacturing
34%
2008
kup
Jackup
59%
Deepwater
41%
Manufacturing
0%
2016
Source: Company reports, Deutsche Bank
High-specification jackups are defined as jackups with at least 2.0 million lbs. ofhook look capacity. Rowan owns 19 of the 73 industry-wide, excluding the 50 orso that are currently on order or under construction.
Figure 533: Change in fleet size and mix
0
500
1,000
1,500
2,000
2,500
20
07
20
08
20
09
20
10
20
11
20
12
20
13
20
14
20
15
20
16
20
17
20
18
20
19
(a) (a) (a) (a) (a) (a) (a) (a) (a) (a) (e) (e) (e)
In m
illi
on
s o
f U
SD
Jackup Deepwater Manufacturing
Source: Company reports, Deutsche Bank
Page 244 Deutsche Bank Securities Inc.

9 October 2017
Oil Services & Equipment
Initiation of coverage
Principal Sources and Uses of Cash Flow
Jackups only partially offsetting deepwater expirations and terminationsUltra-deepwater revenues are on a path to zero in 2019 with terminations andcontract expirations already taking the days committed in 2018 to only 17%. Ultra-deepwater EBITDA reached an annual run rate of $660 million in 2Q16, becominga meaningful source of cash flow before the company began receiving earlyterminations. Looking ahead, with ultra-deepwater dayrates trafficking near $170kpd, we expect the vast majority of the cash flow to come from the company’sjackup fleet, which is operating at about 72% utilization thanks mainly to SaudiAramco. Saudi Aramco is about 69% of Rowan’s contracted backlog in jackups.
Figure 534: EBITDA
0%
10%
20%
30%
40%
50%
60%
0
200
400
600
800
1,000
1,200
20
07
20
08
20
09
20
10
20
11
20
12
20
13
20
14
20
15
20
16
20
17
20
18
20
19
(a) (a) (a) (a) (a) (a) (a) (a) (a) (a) (e) (e) (e)
In m
illio
ns
of
USD
Consolidated EBITDA EBITDA margin
Source: Deutsche Bank
Rowan’s EBITDA reached its high water mark of $1.0 billion in 2015. The fourdrillships contributed about 40% of that. We expect EBITDA to wind down toabout $0.2 billion in 2018 assuming no new contracts for any of its four drillships.If the company were to successfully contract any of its four drillships at marketrates, the contribution would be less than $20 million per year.
Saudi Aramco JVRowan and Saudi Aramco have entered into a 50/50 JV that will own and operateupwards of 27 jackups including 20 newbuilds. Each will contribute $25 millionwith the JV commencing in 2Q17. Rowan will also contribute three of its jackupsincluding the Gilbert Rowe, Bob Keller and J.P. Bussell, while Saudi Aramco willcontribute two jackups. No earlier than October 2018, Rowan will add another twojackups, the Scooter Yeargain and the Hank Boswell. Saudi Aramco will contributean equal amount in cash. Then the JV will begin its newbuild strategy with 15year term commitments at undisclosed index rates that will generate a returncommensurate with the risk. We expect the EBITDA per rig to range from $20-30million, but probably at the lower-end of the range. The benefits of the newbuildswill not begin prior to 2020.
Deutsche Bank Securities Inc. Page 245

9 October 2017
Oil Services & Equipment
Initiation of coverage
Figure 535: Free cash flow and dividends Figure 536: Capex trend
(2,000)
(1,500)
(1,000)
(500)
0
500
1,000
20
07
20
08
20
09
20
10
20
11
20
12
20
13
20
14
20
15
20
16
20
17
20
18
20
19
(a) (a) (a) (a) (a) (a) (a) (a) (a) (a) (e) (e) (e)
In m
illio
ns
of
USD
Free cash flow Dividends paid
0
500
1,000
1,500
2,000
2,500
20
07
20
08
20
09
20
10
20
11
20
12
20
13
20
14
20
15
20
16
20
17
20
18
20
19
(a) (a) (a) (a) (a) (a) (a) (a) (a) (a) (e) (e) (e)
In m
illi
on
s o
f U
SD
Capital expenditures Depreciation
Source: Company reports, Deutsche Bank Source: Company reports, Deutsche Bank
Figure 537: Debt turns Figure 538: Net debt
0.0
2.0
4.0
6.0
8.0
10.0
12.0
14.0
16.0
18.0
20
07
20
08
20
09
20
10
20
11
20
12
20
13
20
14
20
15
20
16
20
17
20
18
20
19
(a) (a) (a) (a) (a) (a) (a) (a) (a) (a) (e) (e) (e)
De
bt
turn
s
0
500
1,000
1,500
2,000
2,500
3,000
20
07
20
08
20
09
20
10
20
11
20
12
20
13
20
14
20
15
20
16
20
17
20
18
20
19
(a) (a) (a) (a) (a) (a) (a) (a) (a) (a) (e) (e) (e)
In m
illi
on
s o
f U
SD
Source: Company reports, Deutsche Bank Source: Company reports, Deutsche Bank
Figure 539: EPS trend
4.05 3.50
(3.00)
(2.00)
(1.00)
0.00
1.00
2.00
3.00
4.00
5.00
20
07
20
08
20
09
20
10
20
11
20
12
20
13
20
14
20
15
20
16
20
17
20
18
20
19
(a) (a) (a) (a) (a) (a) (a) (a) (a) (a) (e) (e) (e)
EP
S
Source: Company reports, Deutsche Bank
Page 246 Deutsche Bank Securities Inc.

9 October 2017
Oil Services & Equipment
Initiation of coverage
Figure 540: Fleet profileRig name Water Rig type Year in Rig design Backlog Backlog
Ultra-deepwater (4):
Rowan Renaissance 12,000 DS-DP 2014 GustoMSC P10000 - -
Rowan Resolute 12,000 DS-DP 2014 GustoMSC P10000 0.9 190.0
Rowan Reliance 12,000 DS-DP 2014 GustoMSC P10000 0.4 43.4
Rowan Relentless 12,000 DS-DP 2015 GustoMSC P10000 - -
Jackups (25):
Rowan Norway 430 IC 2011 Keppel FELS KFELS N Class 0.1 1.9
Rowan Stavanger 430 IC 2011 Keppel FELS KFELS N Class 0.6 39.8
Rowan Viking 430 IC 2010 Keppel FELS KFELS N Class 1.0 91.6
Rowan EXL IV 350 IC 2011 LeTourneau Super 116E EXL - -
Rowan EXL III 350 IC 2010 LeTourneau Super 116E EXL - -
Rowan EXL II 350 IC 2010 LeTourneau Super 116E EXL 0.1 4.9
Rowan EXL I 350 IC 2010 LeTourneau Super 116E EXL - -
Joe Douglas 400 IC 2011 LeTourneau 240-C Workhorse Class 0.0 1.2
Ralph Coffman 400 IC 2009 LeTourneau 240-C Workhorse Class 0.3 10.4
Rowan Mississippi 375 IC 2008 LeTourneau 240-C Workhorse Class 1.3 91.5
J.P. Bussell 300 IC 2008 LeTourneau 225-C Tarzan Class - -
Hank Boswell 300 IC 2006 LeTourneau 225-C Tarzan Class 1.1 66.5
Bob Keller 300 IC 2005 LeTourneau 225-C Tarzan Class 6.7 293.6
Scooter Yeargain 300 IC 2004 LeTourneau 225-C Tarzan Class 1.1 66.5
Bob Palmer 550 IC 2003 LeTourneau 224-C Super Gorilla XL Class - -
Rowan Gorilla VII 450 IC 2002 LeTourneau 219-C Super Gorilla Class - -
Rowan Gorilla VI 400 IC 2000 LeTourneau 219-C Super Gorilla Class 0.5 45.4
Rowan Gorilla V 400 IC 1998 LeTourneau 219-C Super Gorilla Class 2.0 69.1
Rowan Gorilla IV 450 IC 1986 LeTourneau 150-88-C Gorilla Class 0.1 2.7
Rowan California 300 IC 1983 LeTourneau Class 116-C - -
Cecil Provine 300 IC 1982 LeTourneau Class 116-C - -
Gilbert Rowe 350 IC 1981 LeTourneau Class 116-C - -
Arch Rowan 350 IC 1981 LeTourneau Class 116-C 1.0 26.0
Charles Rowan 350 IC 1981 LeTourneau Class 116-C 1.0 26.0
Rowan Middletown 350 IC 1980 LeTourneau Class 116-C 1.0 26.0
Source: Company reports, Deutsche Bank
Deutsche Bank Securities Inc. Page 247

9 October 2017
Oil Services & Equipment
Initiation of coverage
Figure 541: Income Statement(a) (a) (a) (a) (a) (a) (a) (a) (e) (e) (e)
In millions of USD 2009 2010 2011 2012 2013 2014 2015 2016 2017 2018 2019
Segment revenues:
Jackup 1,215 1,209 983 1,393 1,579 1,647 1,389 1,016 782 666 609
Deepwater 0 0 0 0 0 178 748 708 447 250 259
Manufacturing 555 610 114 0 0 0 0 0 0 0 0
Total revenue 1,770 1,819 1,098 1,393 1,579 1,824 2,137 1,723 1,229 917 868
Op costs 1,001 1,066 632 752 861 991 993 778 645 590 622
SG&A 103 133 101 100 131 126 116 102 97 96 96
D&A 171 187 195 248 271 323 391 403 400 387 371
EBIT 495 434 170 293 316 385 637 440 87 (156) (221)
Interest (expense) (30) (65) (75) (82) (118) (161) (164) (157) (156) (156) (147)
Interest income 1 2 1 1 2 1 1 3 12 13 13
Capitalized interest 21 40 55 31 49 58 16 0 0 0 0
Other income 7 6 1 1 0 2 (8) (15) 9 35 46
PBT 495 416 152 243 249 284 482 270 (49) (264) (309)
Income tax (expense) (157) (111) (2) (8) (4) (18) (43) (5) (27) 21 25
Non-controlling interest 0 0 0 0 0 0 0 0 0 0 0
Net income (operating) 339 306 149 236 245 266 439 265 (76) (243) (285)
Discontinued ops 0 0 596 (23) 0 4 0 0 0 0 0
Unusual after-tax 29 (25) (8) (32) 10 (406) (346) 55 2 0 0
Net income (GAAP) 368 280 737 181 254 (136) 93 320 (74) (243) (285)
Operating EPS 2.98 2.57 1.18 1.90 1.96 2.13 3.50 2.10 (0.61) (1.93) (2.23)
GAAP EPS 3.23 2.36 5.82 1.46 2.04 (1.09) 0.75 2.54 (0.59) (1.93) (2.23)
DPS 0.00 0.00 0.00 0.00 0.00 0.30 0.40 0.00 0.00 0.00 0.00
Diluted shares 114 119 127 124 124 125 125 126 127 126 128
Consolidated EBITDA 667 620 365 541 587 707 1,028 843 487 231 150
EBITDA margin 37.7% 34.1% 33.2% 38.8% 37.2% 38.8% 48.1% 48.9% 39.6% 25.2% 17.2%
EBIT margin 28.0% 23.8% 15.5% 21.0% 20.0% 21.1% 29.8% 25.5% 7.1% -17.1% -25.5%
Tax rate 32% 27% 2% 3% 2% 6% 9% 2% -56% 8% 8%
Source: Deutsche Bank
Page 248 Deutsche Bank Securities Inc.

9 October 2017
Oil Services & Equipment
Initiation of coverage
Figure 542: Cash Flow Statement(a) (a) (a) (a) (a) (a) (a) (a) (e) (e) (e)
In millions of USD 2009 2010 2011 2012 2013 2014 2015 2016 2017 2018 2019
Net income 339 306 149 236 245 266 439 265 (76) (243) (285)
Depreciation 171 187 195 248 271 323 391 403 400 387 371
Deferred tax 16 45 (21) (5) (34) (183) (1) (38) 36 0 0
Chg in receivables 147 (34) 23 (106) 31 (201) 135 109 44 76 (36)
Chg in inventories 92 65 (104) 0 0 0 0 0 0 0 0
Chg in payables (135) (35) 45 (9) 32 (21) 23 (4) (9) (6) 9
Other (87) (25) (191) 29 78 238 10 165 (140) (105) 49
Cash from operations 544 508 95 394 623 423 997 901 256 110 108
Capital expenditures (566) (508) (1,518) (685) (607) (1,958) (723) (118) (127) (100) (100)
Free cash flow (22) (0) (1,423) (292) 16 (1,535) 274 783 129 10 8
Acquisitions 0 0 0 0 0 0 0 0 0 0 0
Asset sales 9 3 1,561 11 45 22 19 6 1 0 0
Dividends paid 0 0 0 0 0 (38) (51) 0 0 0 0
ESPP | options 1 8 20 1 7 5 0 0 0 0 0
Equity issuance, net 0 0 (125) 0 0 0 0 0 (4) 0 0
Debt issuance, net 427 (198) (52) 866 0 793 (98) (12) (163) 0 (207)
Other 3 0 5 (1) 2 (1) 0 (6) (25) 0 0
Chg in cash 417 (187) (14) 585 69 (754) 145 771 (63) 10 (199)
FCF per share (0.20) (0.00) (11.25) (2.35) 0.13 (12.31) 2.19 6.21 1.02 0.08 0.07
Capex / revenue 0.32 0.28 1.38 0.49 0.38 1.07 0.34 0.07 0.10 0.11 0.12
Capex / depreciation 3.30 2.72 7.78 2.77 2.24 6.07 1.85 0.29 0.32 0.26 0.27
Source: Deutsche Bank
Deutsche Bank Securities Inc. Page 249

9 October 2017
Oil Services & Equipment
Initiation of coverage
Figure 543: Balance Sheet(a) (a) (a) (a) (a) (a) (a) (a) (e) (e) (e)
In millions of USD 2009 2010 2011 2012 2013 2014 2015 2016 2017 2018 2019
Cash and equivalents 640 453 439 1,024 1,093 339 484 1,256 1,193 1,203 1,004
Accounts receivable 344 418 284 424 345 545 411 301 251 175 210
Inventories 452 348 0 0 0 0 0 0 0 0 0
Deferred taxes 38 37 27 27 22 29 0 0 0 0 0
Other current assets 77 69 72 78 69 27 27 24 24 17 20
Total current assets 1,550 1,325 822 1,553 1,529 941 921 1,580 1,468 1,394 1,235
Net PP&E 3,579 4,793 5,679 6,072 6,386 7,432 7,406 7,060 6,772 6,484 6,213
Goodwill 0 0 0 0 0 0 0 0 0 0 0
Other assets 81 99 97 75 61 38 20 35 57 40 48
Total assets 5,211 6,217 6,598 7,699 7,976 8,411 8,347 8,676 8,297 7,918 7,496
Accounts payable 125 117 111 83 124 103 110 94 78 72 81
Accrued expenses 0 0 131 121 156 194 186 159 110 77 93
Deferred revenue 139 153 36 52 55 36 33 104 61 42 51
Current debt 65 52 45 0 0 0 0 127 0 207 0
Other current liabilities 239 207 25 38 20 0 0 0 0 0 0
Total current liabilities 568 529 348 294 355 333 329 484 249 399 225
Long-term debt 787 1,134 1,089 2,010 2,009 2,807 2,692 2,553 2,517 2,309 2,309
Deferred taxes 466 551 476 474 430 211 196 186 22 22 22
Employee obligations 0 0 0 0 0 0 0 0 0 0 0
Other LT liabilities 279 251 358 390 289 368 358 339 253 176 212
Non-controlling int 0 0 0 0 0 0 0 0 0 0 0
Shareholders' equity 3,110 3,752 4,326 4,532 4,894 4,691 4,772 5,114 5,255 5,011 4,727
Total liabilities and equity 5,211 6,217 6,598 7,699 7,976 8,411 8,347 8,676 8,297 7,918 7,496
Total debt 852 1,186 1,134 2,010 2,009 2,807 2,692 2,680 2,517 2,517 2,309
Net debt 213 733 696 986 916 2,468 2,208 1,425 1,324 1,314 1,305
Debt/capital 22% 24% 21% 31% 29% 37% 36% 34% 32% 33% 33%
Debt/equity 27% 32% 26% 44% 41% 60% 56% 52% 48% 50% 49%
Debt turns 1.3 1.9 3.1 3.7 3.4 4.0 2.6 3.2 5.2 10.9 15.4
Source: Deutsche Bank
Page 250 Deutsche Bank Securities Inc.

9 October 2017
Oil Services & Equipment
Initiation of coverage
Rating
HoldNorth AmericaUnited States
IndustrialsOil Services & Equipment
Company
RPC Inc
Reuters Bloomberg
RES.N RES US
Strong Leverage with Strong Buy-inAlreadyInitiating coverage with a Hold rating and $25 price targetRES has been the go to stock in the mid-cap services universe due its highoperating leverage to the positive fundamentals in the US pressure pumpingmarket, its debt-free balance sheet, and strong free cash flow track record.Typically a name we would want to be adding exposure to, but the idea is wellknown, well liked, and already well on its way. Given our view that the US willencounter a flattened rig count in 2018, we are initiating with a Hold and a $25price target.
Industry trends favoring frac above all elseThe frac market is one of the very few that is actually seeing scarcity value. TheUS market has recovered to about 12 million active horsepower versus 6 millionat the trough and 17 million at the 2014 peak. Pricing is being restored, but ata more moderate pace than what many producers had suggested earlier in theyear. We expect pricing to move higher, and for newbuilds to pick up momentum.Offsetting the risk of newbuilds is an accelerating attrition rate upwards of 3.5million hhp and a market that is already about 1.5 – 2.0 million hhp undersuppliedby some contractor estimates.
ValuationOur $25 price target is 7.3x our estimate ofthe company’s normalized EBITDA powerof $700 million, is a 1.5 turn premium tothe 5.8x five-year average multiple leadingup to the 2014 collapse in oil prices. Thecompany has no leverage, generates solidfree cash flow, and is likely to grow its fraccapacity and its normalized EBITDA aboveour current range.The main investment risks include: 1) shiftsin OPEC policy and the influence thatwould have on oil prices and ultimately USupstream capital expenditures, 2) negativerevisions to global oil demand, 3) a swiftincrease in new frac capacity in the US, and4) and a subsequent move lower in pricingand margins.
RES’s frac fleet is 95% manned and fully booked through year-endAll of RES’s fleet is in the spot market as the company expects to achieve higherpricing into 2018. Earnings revisions for 2018 have been up and to the right asinvestors have focused intensely on this name. We think a step change in pricingis needed to take the next leg higher.
Forecasts and ratios
Year End Dec 31 2016A 2017E 2018E
1Q EPS -0.15 0.02A 0.35
2Q EPS -0.23 0.20A 0.35
3Q EPS -0.18 0.28 0.36
4Q EPS -0.10 0.33 0.36
FY EPS (USD) -0.66 0.83 1.42
OLD FY EPS (USD) – – –
% Change – – –
P/E (x) – 28.7 16.9
DPS (USD) 0.05 0.12 0.24
Dividend Yield (%) 0.3 0.5 1.0
Revenue (USDm) 729.0 1,660.6 2,091.8Source: Deutsche Bank estimates, company data
David HavensResearch [email protected]
Price at 5 Oct 2017 (USD) 23.98
Price target 25.00
52-week range 24.79 - 16.66
Price/price relative
RPC Inc S&P 500 INDEX (Rebased)
Jan '15 May '15 Sep '15 Jan '16 May '16 Sep '16 Jan '17 May '17 Sep '17
10
15
20
25
5
30
Performance(%)
1m 3m 12m
Absolute 24.4 15.7 44.1
S&P 500INDEX
2.5 4.5 18.0
Source: Deutsche Bank
Stock & option liquidity data
Market Cap (USDm) 5,217.5
Shares outstanding (m) 217.6
Free float (%) –
Volume (5 Oct 2017) 392,263
Option volume (und. shrs., 1M avg.) –Source: Deutsche Bank
Deutsche Bank Securities Inc. Page 251

9 October 2017
Oil Services & Equipment
Initiation of coverage
Key investment themes
US pressure pumping market is undersuppliedThe positive supply/demand trends are continuing in the frac market, drivenby a rising well count, increased pad drilling, more wells per pad and anincreasing inventory of DUCs (drilled but uncompleted wells). Frac fleets arealso incorporating more hhp, averaging about 50k now. The increase is toaccommodate the larger pads, which are keeping crews on location longer, thusin order to accommodate maintenance rotations and suitable uptime, contractorshave increased fleet sizes.
RES has been reactivating idle equipment throughout the year as demandindustry-wide has recovered to about 12 million hhp versus 17 million at the peak,and less than 6 million at the trough. All available horsepower by and large isnow booked through year-end 2017. Marketed utilization is back above 80% withsome contractors suggesting the market is undersupplied by 1.5 – 2.0 millionhorsepower. RES sees demand exceeding supply and has said its fleet is bookedthrough year-end as well. The company had only 50% of its fleet manned in 4Q16,70% in 1Q17, 80% in 2Q17, and expects to be at 95% in 3Q17 with half of its hhpin the Permian and two crews in the Bakken. With its fleet near full utilization, weexpect incremental margins to drive EPS in 2H17.
Figure 544: Total vs. marketed frac hhp utilization Figure 545: US frac hhp demand
0%
20%
40%
60%
80%
100%
120%
3Q
11
4Q
11
1Q
12
2Q
12
3Q
12
4Q
12
1Q
13
2Q
13
3Q
13
4Q
13
1Q
14
2Q
14
3Q
14
4Q
14
1Q
15
2Q
15
3Q
15
4Q
15
1Q
16
2Q
16
3Q
16
4Q
16
1Q
17
Total utilization Marketed utilization
0
2
4
6
8
10
12
14
16
18
3Q
11
4Q
11
1Q
12
2Q
12
3Q
12
4Q
12
1Q
13
2Q
13
3Q
13
4Q
13
1Q
14
2Q
14
3Q
14
4Q
14
1Q
15
2Q
15
3Q
15
4Q
15
1Q
16
2Q
16
3Q
16
4Q
16
1Q
17
2Q
17
3Q
17
Millio
n h
hp
Source: IHS Markit, Deutsche Bank Source: IHS Markit, Deutsche Bank
Pricing moving higher, albeit more modestlyAll of RES’s frac horsepower is in the spot market right now. Management seesopportunity for pricing to move higher, although we understand there has beensome operator push back (as there typically is). Pricing has improved, but moremoderately than what some producers had previously expected. While severalcontractors are suggesting pricing is not yet at newbuild economics, newbuildsare coming, including about 100k hhp from RES. RES is not booking term nowbecause if oil prices move lower, customers would look to renegotiate contractsanyway, thus worth waiting for the upside in spot prices.
Page 252 Deutsche Bank Securities Inc.

9 October 2017
Oil Services & Equipment
Initiation of coverage
Figure 546: US frac pricing indexed to 3Q11
0
20
40
60
80
100
120
3Q11
4Q11
1Q12
2Q12
3Q12
4Q12
1Q13
2Q13
3Q13
4Q13
1Q14
2Q14
3Q14
4Q14
1Q15
2Q15
3Q15
4Q15
1Q16
2Q16
3Q16
4Q16
1Q17
2Q17
3Q17
Source: IHS Markit, Deutsche Bank
Attrition is increasingFrac intensity on the larger pads and bigger wells is chewing equipment fasterthan last cycle, kicking attrition into a higher gear. Industry expectations forattrition are upwards of 3.5 million hhp per annum as useful lives decline andmaintenance capital rises. While this is tightening the market upfront, it increasesthe capital intensity for the industry longer term.
Modest newbuilding, but likely to pickupNewbuild lead times for frac spreads are about 9-12 months versus a high of 18months last cycle. Newbuild costs are back up to $1,000/hhp with modest activityunderway. RES intends to order 100k hhp for $1,000/hhp for early 2018 delivery,but half will replace older equipment.
RES has a clean balance sheet and should generate solid free cash flowRES has no debt and is among the industry leaders in terms of generating freecash flow.
Figure 547: Strong free cash flow Figure 548: No debt
(600)
(400)
(200)
0
200
400
600
800
20
02
20
03
20
04
20
05
20
06
20
07
20
08
20
09
20
10
20
11
20
12
20
13
20
14
20
15
20
16
20
17
20
18
20
19
(a) (a) (a) (a) (a) (a) (a) (a) (a) (a) (a) (a) (a) (a) (a) (e) (e) (e)
In m
illi
on
s o
f U
SD
Cash from operations Capital expenditures Free cash flow
(800)
(700)
(600)
(500)
(400)
(300)
(200)
(100)
0
100
200
300
20
02
20
03
20
04
20
05
20
06
20
07
20
08
20
09
20
10
20
11
20
12
20
13
20
14
20
15
20
16
20
17
20
18
20
19
(a) (a) (a) (a) (a) (a) (a) (a) (a) (a) (a) (a) (a) (a) (a) (e) (e) (e)
In m
illi
on
s o
f U
SD
Source: Company reports, Deutsche Bank Source: Company reports, Deutsche Bank
Deutsche Bank Securities Inc. Page 253

9 October 2017
Oil Services & Equipment
Initiation of coverage
Valuation and risksOur $25 price target is 7.3x our estimate of the company’s normalized EBITDApower of $700 million, is a 1.5 turn premium to the 5.8x five-year average multipleleading up to the 2014 collapse in oil prices. The company has no leverage,generates solid free cash flow, and is likely to grow its frac capacity and itsnormalized EBITDA above our current range.
The main investment risks include: 1) shifts in OPEC policy and the influencethat would have on oil prices and ultimately US upstream capital expenditures, 2)negative revisions to global oil demand, 3) a swift increase in new frac capacityin the US, and 4) and a subsequent move lower in pricing and margins.
Figure 549: The EV/EBITDA valuation band as blown out Figure 550: The 5yr EV/EBITDA leading up to 2014
-
20
40
60
80
100
120
140
160
180
200
Sep-07 Sep-08 Sep-09 Sep-10 Sep-11 Sep-12 Sep-13 Sep-14 Sep-15 Sep-16
-1 std 10yr avg +1 std
6.5
3
4
5
6
7
8
9
10
11
Se
p-0
7
Jan
-08
Ma
y-0
8
Se
p-0
8
Jan
-09
Ma
y-0
9
Se
p-0
9
Jan
-10
Ma
y-1
0
Se
p-1
0
Jan
-11
Ma
y-1
1
Se
p-1
1
Jan
-12
Ma
y-1
2
Se
p-1
2
Jan
-13
Ma
y-1
3
Se
p-1
3
Jan
-14
Ma
y-1
4
Se
p-1
4
-1 std 10yr avg +1 std
Source: Factset Source: Factset
Page 254 Deutsche Bank Securities Inc.
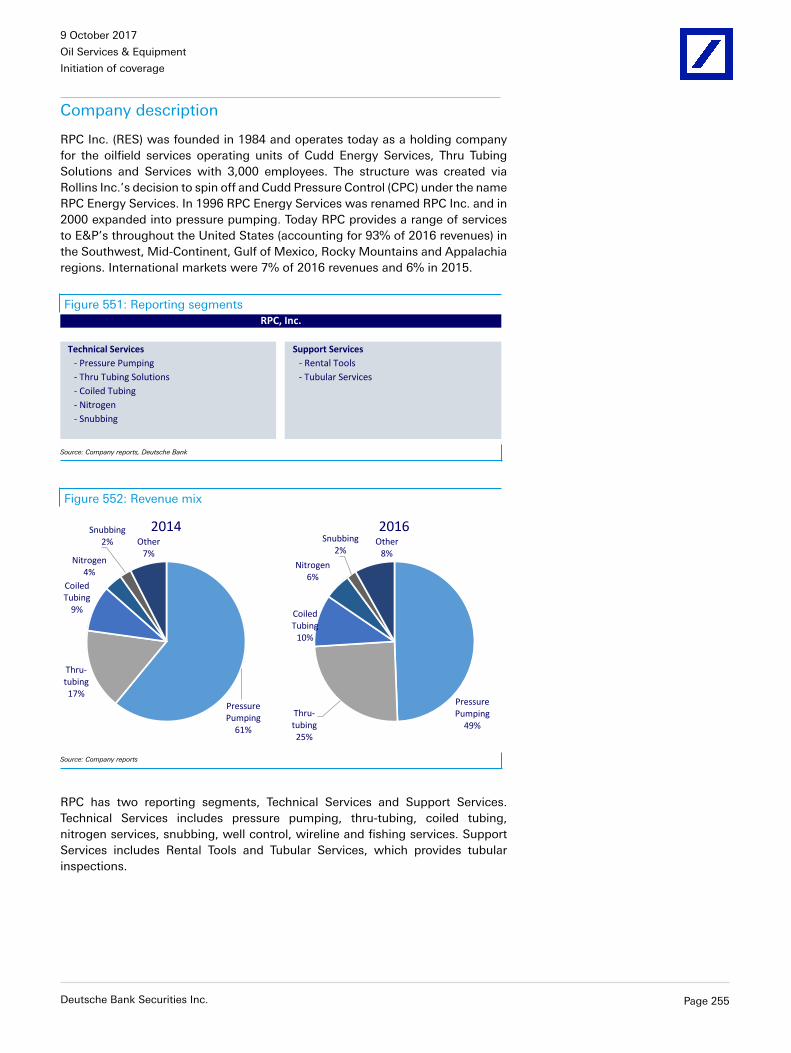
9 October 2017
Oil Services & Equipment
Initiation of coverage
Company description
RPC Inc. (RES) was founded in 1984 and operates today as a holding companyfor the oilfield services operating units of Cudd Energy Services, Thru TubingSolutions and Services with 3,000 employees. The structure was created viaRollins Inc.’s decision to spin off and Cudd Pressure Control (CPC) under the nameRPC Energy Services. In 1996 RPC Energy Services was renamed RPC Inc. and in2000 expanded into pressure pumping. Today RPC provides a range of servicesto E&P’s throughout the United States (accounting for 93% of 2016 revenues) inthe Southwest, Mid-Continent, Gulf of Mexico, Rocky Mountains and Appalachiaregions. International markets were 7% of 2016 revenues and 6% in 2015.
Figure 551: Reporting segments
Technical Services Support Services
- Pressure Pumping - Rental Tools
- Thru Tubing Solutions - Tubular Services
- Coiled Tubing
- Nitrogen
- Snubbing
RPC, Inc.
Source: Company reports, Deutsche Bank
Figure 552: Revenue mix
Pressure
Pumping
61%
Thru-
tubing
17%
Coiled
Tubing
9%
Nitrogen
4%
Snubbing
2% Other
7%
2014
Pressure
Pumping
49%
Thru-
tubing
25%
Coiled
Tubing
10%
Nitrogen
6%
Snubbing
2%Other
8%
2016
Source: Company reports
RPC has two reporting segments, Technical Services and Support Services.Technical Services includes pressure pumping, thru-tubing, coiled tubing,nitrogen services, snubbing, well control, wireline and fishing services. SupportServices includes Rental Tools and Tubular Services, which provides tubularinspections.
Deutsche Bank Securities Inc. Page 255

9 October 2017
Oil Services & Equipment
Initiation of coverage
Principal Sources and Uses of Cash Flow
Pressure pumping is its core business and the US is its principal marketRES generates about two-thirds of its revenues from pressure pumping and rising.The company has added almost 800k hhp since 2006. The company’s principalmarkets are the Permian, Mid-Continent, Rocky Mountains, and Appalachia. Inthe last 3 years services, a small slice of services have also been provided in theGulf of Mexico, Canada, Latin America and the Middle East.
Figure 553: RES revenue mix (2017 DBe) Figure 554: RES pressure pumping horsepower
Pressure
Pumping
68%
Thru-tubing
16%
Coiled
Tubing
6%
Nitrogen
2%
Snubbing
2%
Other
6%
2017
0
100,000
200,000
300,000
400,000
500,000
600,000
700,000
800,000
900,000
1,000,000
2006
2007
2008
2009
2010
2011
2012
2013
2014
2015
2016
2017
Horsepower
Source: Company reports, Deutsche Bank Source: Company reports, Deutsche Bank
In 2016, 70% of RPC revenues were from drilling and production activities foroil and 30% from natural gas. Less than 1% were from offshore operations inthe Gulf of Mexico. It had positive free cash flow of $68mn in 2018 (down from$306mn in 2015), partially influenced by the lowest capex in 10-years of $34mn.RPC began 2017 guiding to $70mn of capex, almost entirely focused towardmaintenance, and recently increased to $100mn given the pace of unstacking.We expect margins to help double-digit free cash flow in 2017 driven by the USland rig count uptick, the entire pumping fleet in the spot market (booked throughYE17), and remaining reactivations by 3Q with benefit in 4Q.
Page 256 Deutsche Bank Securities Inc.

9 October 2017
Oil Services & Equipment
Initiation of coverage
Figure 555: Segment revenues
0
500
1,000
1,500
2,000
2,5002
00
2
20
03
20
04
20
05
20
06
20
07
20
08
20
09
20
10
20
11
20
12
20
13
20
14
20
15
20
16
20
17
20
18
20
19
(a) (a) (a) (a) (a) (a) (a) (a) (a) (a) (a) (a) (a) (a) (a) (e) (e) (e)
In m
illio
ns
of
US
D
Technical Services Support Services
Source: Company reports, Deutsche Bank
Strong balance sheet, no debt and an undrawn revolverRPC has operated a conservative balance sheet (maximum 0.9 debt turns in 2009)and has not carried debt since 2014. At 2Q it had $125mn of cash with an undrawn$125mn revolving credit facility. The $0.05/share dividend was suspended in July2015, with a special dividend of $0.05/share paid 4Q16 and a $0.06/share dividendpaid 3Q17. Management was (as expected) cautious in calling the recent paymenta regular dividend. The company’s stock buyback plan in place since 1998, andwithout expiry date, remains active with 1.7mn of the original 31.5mn sharesavailable for repurchase as of 2Q.
Figure 556: RES free cash flow and dividends Figure 557: RES total debt
(200)
(100)
0
100
200
300
400
20
02
20
03
20
04
20
05
20
06
20
07
20
08
20
09
20
10
20
11
20
12
20
13
20
14
20
15
20
16
20
17
20
18
20
19
(a) (a) (a) (a) (a) (a) (a) (a) (a) (a) (a) (a) (a) (a) (a) (e) (e) (e)
In m
illi
on
s o
f U
SD
Free cash flow Dividends paid
0
50
100
150
200
250
20
02
20
03
20
04
20
05
20
06
20
07
20
08
20
09
20
10
20
11
20
12
20
13
20
14
20
15
20
16
20
17
20
18
20
19
(a) (a) (a) (a) (a) (a) (a) (a) (a) (a) (a) (a) (a) (a) (a) (e) (e) (e)
In m
illio
ns
of
USD
Source: Company data, Deutsche Bank Source: Company data, Deutsche Bank
Deutsche Bank Securities Inc. Page 257

9 October 2017
Oil Services & Equipment
Initiation of coverage
Figure 558: Income Statement(a) (a) (a) (a) (a) (a) (a) (a) (e) (e) (e)
In millions of USD 2009 2010 2011 2012 2013 2014 2015 2016 2017 2018 2019
Segment revenues:
Technical Services 513 980 1,664 1,794 1,730 2,180 1,175 680 1,607 2,036 2,060
Support Services 75 117 146 151 132 157 89 49 53 56 58
Other 0 0 0 0 0 0 0 0 0 0 0
Total revenues 588 1,096 1,810 1,945 1,861 2,337 1,264 729 1,661 2,092 2,118
Segment EBIT:
Technical Services (20) 217 451 420 276 390 (133) (204) 299 495 517
Support Services (2) 31 52 46 26 43 (2) (26) (13) (5) 2
Corporate (12) (13) (17) (18) (18) (17) (13) (17) (17) (17) (17)
EBIT (34) 235 486 448 285 415 (149) (247) 269 473 502
Interest (expense) (2) (3) (3) (2) (2) (1) (2) (1) (0) (0) (0)
Interest income 0 0 0 0 0 0 0 0 1 0 0
Equity income 0 0 0 0 0 0 0 0 0 0 0
Other income 3 5 (4) (4) (7) (15) (2) 8 14 15 15
PBT (33) 238 479 443 276 399 (153) (239) 283 487 516
Income tax (expense) 11 (91) (182) (168) (109) (154) 53 98 (102) (179) (190)
Non-controlling interest 0 0 0 0 0 0 0 0 0 0 0
Preferred dividends 0 0 0 0 0 0 0 0 0 0 0
Net income (operating) (23) 147 296 274 167 245 (100) (141) 182 308 326
Discontinued ops 0 0 0 0 0 0 0 0 0 0 0
Unusual after-tax 0 0 0 0 0 0 0 0 0 0 0
Net income (GAAP) (23) 147 296 274 167 245 (100) (141) 182 308 326
Operating EPS (0.10) 0.67 1.35 1.27 0.77 1.14 (0.47) (0.66) 0.83 1.42 1.50
GAAP EPS (0.10) 0.67 1.35 1.27 0.77 1.14 (0.47) (0.66) 0.83 1.42 1.50
DPS 0.10 0.09 0.21 0.32 0.40 0.42 0.16 0.05 0.12 0.24 0.24
Diluted shares 217 220 220 217 217 216 213 214 218 218 218
Consolidated EBITDA 96 368 666 663 498 646 122 (30) 433 628 660
EBITDA margin 16.4% 33.6% 36.8% 34.1% 26.7% 27.6% 9.7% -4.1% 26.1% 30.0% 31.1%
EBIT margin -5.8% 21.4% 26.8% 23.1% 15.3% 17.8% -11.8% -33.9% 16.2% 22.6% 23.7%
Tax rate 32.1% 38.2% 38.1% 38.0% 39.6% 38.6% 34.9% 41.0% 35.9% 36.7% 36.7%
EBIT margin
Contract Drilling (4.0%) 22.2% 27.1% 23.4% 16.0% 17.9% (11.3%) (30.0%) 18.6% 24.3% 25.1%
Pressure Pumping -2.2% 26.7% 35.4% 30.4% 19.9% 27.1% -2.7% -52.8% -25.3% -8.7% 3.7%
Source: Deutsche Bank
Page 258 Deutsche Bank Securities Inc.

9 October 2017
Oil Services & Equipment
Initiation of coverage
Figure 559: Cash Flow Statement
(a) (a) (a) (a) (a) (a) (a) (a) (e) (e) (e)
In millions of USD 2009 2010 2011 2012 2013 2014 2015 2016 2017 2018 2019
Net income (23) 147 296 274 167 245 (100) (141) 182 308 326
Depreciation 131 133 180 215 213 231 271 217 164 155 158
Deferred tax 2 22 77 5 (13) 12 (33) (34) (21) 0 0
Chg in receivables 80 (163) (167) 74 (50) (198) 402 65 (259) (20) (2)
Chg in inventories (6) (8) (37) (40) 14 (30) 27 20 (28) (6) 3
Chg in payables (6) 14 30 (5) 14 36 (62) (6) 50 5 (3)
Other (9) 23 6 37 20 26 (31) (19) 94 6 1
Cash from operations 169 169 386 560 366 323 474 102 181 449 483
Capital expenditures (68) (187) (416) (329) (202) (372) (167) (34) (101) (162) (164)
Free cash flow 101 (19) (30) 231 164 (49) 306 68 81 287 319
Acquisitions 0 0 0 0 (17) 0 0 0 0 0 0
Asset sales 7 16 25 19 11 19 10 13 8 0 0
Dividends paid (22) (21) (47) (114) (88) (92) (34) (11) (26) (52) (52)
ESPP | options 0 0 0 0 0 0 0 0 0 0 0
Equity issuance, net (2) (2) (34) (30) (25) (50) (4) (3) (12) 0 0
Debt issuance, net (84) 31 82 (96) (54) 171 (225) 0 0 0 0
Other 1 (1) 4 (3) 3 1 1 0 0 0 0
Chg in cash 1 5 (2) 7 (5) 1 55 67 51 234 267
FCF per share 0.47 (0.09) (0.14) 1.07 0.76 (0.23) 1.44 0.32 0.37 1.32 1.47
Capex / revenue 0.12 0.17 0.23 0.17 0.11 0.16 0.13 0.05 0.06 0.08 0.08
Capex / depreciation 0.52 1.41 2.31 1.53 0.95 1.61 0.62 0.16 0.61 1.04 1.04
Source: Deutsche Bank
Deutsche Bank Securities Inc. Page 259

9 October 2017
Oil Services & Equipment
Initiation of coverage
Figure 560: Balance Sheet(a) (a) (a) (a) (a) (a) (a) (a) (e) (e) (e)
In millions of USD 2009 2010 2011 2012 2013 2014 2015 2016 2017 2018 2019
Cash and equivalents 4 9 7 14 9 10 65 132 182 417 684
Accounts receivable 131 294 461 388 437 635 232 169 428 449 451
Inventories 56 64 100 141 127 156 128 108 137 142 140
Other current assets 29 32 57 25 32 52 66 70 25 26 26
Total current assets 219 399 627 568 605 852 492 479 772 1,034 1,300
Net PP&E 396 453 675 756 726 849 688 498 436 442 449
Goodwill 24 24 24 24 32 32 32 32 32 32 32
Other assets 9 12 12 19 21 26 24 26 36 38 38
Total assets 649 888 1,338 1,367 1,384 1,759 1,237 1,035 1,276 1,546 1,819
Accounts payable 50 79 123 110 119 175 76 71 126 131 129
Current debt 0 0 0 0 0 0 0 0 0 0 0
Other current liabilities 18 39 46 55 49 64 32 31 56 59 59
Total current liabilities 68 118 169 165 168 239 107 101 182 190 188
Long-term debt 90 121 203 107 53 225 0 0 0 0 0
Other LT liabilities 149 228 362 324 330 412 285 229 320 334 333
Shareholders' equity 410 539 773 936 1,001 1,123 952 807 956 1,212 1,486
Total liabilities and equity 649 888 1,338 1,367 1,384 1,759 1,237 1,035 1,276 1,546 1,819
Total debt 90 121 203 107 53 225 0 0 0 0 0
Net debt 86 112 196 93 45 215 (65) (132) (182) (417) (684)
Debt/capital 18% 18% 21% 10% 5% 17% 0% 0% 0% 0% 0%
Debt/equity 22% 22% 26% 11% 5% 20% 0% 0% 0% 0% 0%
Debt turns 0.9 0.3 0.3 0.2 0.1 0.3 0.0 0.0 0.0 0.0 0.0
Source: Deutsche Bank
Page 260 Deutsche Bank Securities Inc.

9 October 2017
Oil Services & Equipment
Initiation of coverage
Rating
BuyNorth AmericaUnited States
IndustrialsOil Services & Equipment
Company
Schlumberger
Reuters Bloomberg
SLB.N SLB US
Pore to Pipeline Products and ServicesInitiating with a Buy rating and a $78 price targetIn a challenging industry environment, we like companies that evolve, developnew markets and business models. While SLB does not generate the early EPSleverage of its North American peers, it has a solid track record of delivering long-term margin resiliency and expansion, especially in international markets whereit has outperformed its closet peer by over 770 basis points and its other peers by1000’s of basis points. The company has an industry-leading free cash flow trackrecord of over $30 billion the last ten years. International markets are challengedbut we believe SLB will squeeze more margin from them than any of its peers.In the US, the company still has about 30% of its business there and is activelyramping up its leverage via frac reactivations and its latest JV OneStim.
Initiating with a Buy rating and a $78 price targetWe believe SLB knows how to navigate sea changes in the market. While SLB isbest-in-class in terms of tool reliability, service deliverability, breadth and depthof product portfolio and the art of upselling, what is setting SLB apart now is itsleadership in establishing new business models that push the value of intellectualproperty, data analytics, automation, machine learning and Big Data.
Asset turn efficiency a core differentiatorValuation and risksOur $78 price target is 18.0x our estimateof the company’s normalized EPS powerof $4.25 per share, which is in-line withits 18.3x five-year average multiple leadingup to the 2014 collapse in oil prices. Thecompany is currently trading at 28x our 2018EPS estimate of $2.43 and 20x our 2019estimate of $3.39.The main investment risks include: 1) shiftsin OPEC policy and the influence thatwould have on oil prices and ultimatelyUS upstream capital expenditures, 2)negative revisions to global oil demand,3) an inability to capture margin in itsgrowing project management business, and4) another deceleration in internationalspending budgets that disproportionatelyimpacts SLB versus its more NorthAmerican peers.
For years the company has been addressing low single-digit utilization of theindustry’s tools in an effort to curb working capital needs, reduce capex andincrease margins. While the key industry players are fighting for a smallerupstream capex pie, SLB is also seeking profitability internally. Market sharepreservation can sometimes be more important for the industry, but SLBhas a mechanism to preserve margins and even grow them in challengingenvironments. We believe SLB’s asset turn efforts enables earnings upside to anotherwise competitive international market.
Forecasts and ratios
Year End Dec 31 2016A 2017E 2018E
1Q EPS 0.40 0.25A 0.51
2Q EPS 0.23 0.35 0.54
3Q EPS 0.25 0.41 0.64
4Q EPS 0.27 0.46 0.69
FY EPS (USD) 1.14 1.47 2.38
OLD FY EPS (USD) 1.13 – –
% Change 0.5% – –
P/E (x) 67.7 46.9 28.9
DPS (USD) 2.00 2.00 2.45
Dividend Yield (%) 2.6 2.9 3.6
Revenue (USDm) 27,810.0 30,575.5 32,702.6Source: Deutsche Bank estimates, company data
David HavensResearch [email protected]
Price at 5 Oct 2017 (USD) 68.87
Price target 78.00
52-week range 87.48 - 62.88
Price/price relative
Schlumberger S&P 500 INDEX (Rebased)
Jan '15 May '15 Sep '15 Jan '16 May '16 Sep '16 Jan '17 May '17 Sep '1750
60
70
80
90
100
110
120
130
140
Performance(%)
1m 3m 12m
Absolute 8.6 2.8 -12.4
S&P 500INDEX
2.5 4.5 18.0
Source: Deutsche Bank
Stock & option liquidity data
Market Cap (USDm) 95,781.0
Shares outstanding (m) 1,390.8
Free float (%) 100
Volume (5 Oct 2017) 1,456,619
Option volume (und. shrs., 1M avg.) 2,356,468Source: Deutsche Bank
Deutsche Bank Securities Inc. Page 261

9 October 2017
Oil Services & Equipment
Initiation of coverage
Key investment themes
International marketsInternational markets are struggling to recover even after three consecutive yearsof severely depressed spending. Lower oil prices and the OPEC cuts have delayedsome tenders and have kept market share preservation tactics in play. The weakdrive in international markets is not enough to carry earnings higher for theindustry as contractors look to preserve utilization and avoid demobilization.
But this is the type of market where we believe Schlumberger delivers its valueto shareholders via better than expected earnings power. While the companydoes not provide the hyper-leverage to US onshore margins like Halliburton does,SLB knows how to navigate sea changes in the market. This is not business asusual for the oilfield services industry. These companies need to navigate throughthe turbulence of the most severe downturn in 30 years. Intellectual property,data analytics, automation, machine learning and Big Data are all contributing tohigher efficiencies and lower costs, and have become the differentiating factorsthat will decide the winners and losers. While SLB is best-in-class in terms of toolreliability, service deliverability, breadth and depth of product portfolio and theart of upselling, what is setting SLB apart now is its leadership in establishingnew business models that push the value of intellectual property, data analytics,automation, machine learning and Big Data. The barrier-to-entry here is a bitdifferent than the 9-12 month lead times for delivering a frac spread.
Asset turn efficiency a core differentiatorThe company has for years been addressing the low single-digit utilization of theindustry’s tools in effort to curb working capital needs, reduce capex and increasemargins. While the key industry players are all fighting for a smaller upstreamcapex pie, SLB is also seeking profitability internally. Now all of its peers have hasto cut costs. But this is not just a cost cutting effort. SLB is looking to change howit does business and is looking to get a higher turn in every dollar invested withouthaving to rely in pricing alone. Market share preservation can sometimes be moreimportant for the industry, but SLB has a mechanism to preserve margins andeven grow them in challenging environments. We believe SLB’s asset turn effortsenables earnings upside to an otherwise competitive international market.
SPM is the new model needed to demonstrate growthMany investors are weary of something they cannot see or touch, and there islimited transparency in SLB’s SPM business, but it is a fundamental driver ofthe company’s growth. SLB generated $1.4 billion in SPM revenues in 2016,which was a bit less than 5% of total revenues. From 2011 to 2016, managementhas said the business generated margins that were 700 basis points higherthan its base business. It was also the only business that grew during thedownturn. Patrick Schorn, formerly president of operations, has assumed the roleof Executive Vice President of New Ventures, which means he oversees SPM.This is indicative of the prominence this model has within the company, whichSLB believes will be twice the $1.4 billion in revenues going forward (timing notquantified).
Page 262 Deutsche Bank Securities Inc.

9 October 2017
Oil Services & Equipment
Initiation of coverage
Some of the investor concerns though, other than transparency and difficultymodeling, involve the returns. Over the last five-years, SLB will have capitalizedover $4 billion in SPM, but it is difficult to measure what the return on thishas or will be. The structure of this business is to capitalize costs and thenamortize over the life of the project. Depending on SLB’s performance, marginstoward the tail-end of the project can benefit or dilute overall margins. Whilemanagement has indicated the returns are competitive, hence why the capital isbeing directed there, SLB also highlighted the benefits of SPM absorbing someof the fixed costs in sub-scale regions internationally. It is providing a baselineof business and it is allowing SLB to showcase technology and establish a trackrecord. There are apparently about 50 projects in the pipeline and 1/10 winrate for SLB. While we are unable to demonstrate the accretive nature of thisbusiness independently, SLB has consistently generated peer leading marginsinternationally. From 2007 to 2015, which is when geographic margins stoppedbeing reported, SLB outperformed its closet international competitor Halliburtonby 770 basis points on average.
Rig of the futureSLB’s vision is to revolutionize well construction, and its Integrated DrillingSystem is the centerpiece with the land drilling system of the future. Thiscombines surface and downhole hardware with optimization software that willautomate the drilling process including the integration of rig systems as well asintegration of downhole data for directional drilling and well placement efforts.SLB has seven rigs in process of being deployed in the US, Ecuador and SaudiArabia. Why own the rig? Because SLB believes it is the best platform to integratearound. But SLB also needs rigs for its SPM business, and has in the past neededupwards of 100 rigs. SLB has achieved access in other ways including a JV withthe Arabian Drilling Company and its efforts to acquire Eurasia Drilling. Part ofthe appeal with Eurasia is in Russia, rig contractors generally choose the servicecompanies, not the operator. SLB does not plan on acquiring a US land driller,but it did acquire OMRON, which has 50% of the control systems in the NorthAmerica market.
Valuation and risksOur $78 price target is 18.0x our estimate of the company’s normalized EPS powerof $4.25 per share, which is in-line with its 18.3x five-year average multiple leadingup to the 2014 collapse in oil prices. The company is currently trading at 28x our2018 EPS estimate of $2.43 and 20x our 2019 estimate of $3.39.
The main investment risks include: 1) shifts in OPEC policy and the influencethat would have on oil prices and ultimately US upstream capital expenditures,2) negative revisions to global oil demand, 3) an inability to capture marginin its growing project management business, and 4) another deceleration ininternational spending budgets that disproportionately impacts SLB versus itsmore North American peers.
Deutsche Bank Securities Inc. Page 263

9 October 2017
Oil Services & Equipment
Initiation of coverage
Company description
Schlumberger (SLB) is the industry’s largest multi-national oilfield servicescompany with operations in over 85 countries. The company is a leading providerof technology and best practices for reservoir characterization, drilling, andproduction to the global oil and gas industry. Since its roots in wireline logging,SLB has pursued an integrated model capable of delivering a comprehensiverange of products and services throughout the well lifecycle that optimizerecovery and improve reservoir performance.
For the last eight years, SLB has been implementing a transformation programthat focuses on changing the way it works. Historically SLB has focused on thesubsurface, specifically on formation evaluation and reservoir characterization.The company is now looking at new ways to improve total system performancein drilling and production, where there is considerable untapped potential to beharnessed through the integration of surface and subsurface technologies. Butthe company has also been implanting new ways of managing its resources andoptimizing asset turns in an effort to reduce working capital, capex, and increasemargins.
Figure 561: Schlumberger reporting segments
Reservoir Characterization Drilling Group
- WesternGeco - seismic (marine and land) - Bits and drilling tools, tubular services
- Wireline - openhole and cased hole services - M-I SWACO - fluids
- Well Testing - pressure/flow measurements - Managed pressure drilling (MPD)
- Software Integrated Solutions (SIS) - Underbalanced drilling solutions
- Proprietary software, info management - Drilling & Measurements
- Consulting, IT infrastructure - Mud logging, directional drilling (DD)
- Integrated Services Management (ISM) - Measurement-while-drilling (MWD)
- Logging-while-drilling (LWD)
- Land drilling
- Integrated Drilling Services (IDS)
Production Group Cameron
- Well Services - pressure pumping, stimulation, - OneSubsea - subsea production systems
cementing, coiled tubing, reservoir monitoring, - Wellheads, subsea trees, control systems
downhole data acquisition - Manifold and flowline connectors
- Completions - packers, sand control, valves, - Integration and optimation services
intelligent well technology - Surface Systems - wellheads, Christmas trees
- Artificial Lift - ESP, gas lift, rod lift, PCPs - Drilling Systems - drilling equipment
- Integrated Production Services - Pressure control equipment
- Schlumberger Production Management (SPM) - Rotary drilling equipment
- Valves and Measurements
Schlumberger Ltd.
Source: Company reports, Deutsche Bank
SLB’s vision is to revolutionize well construction, and its Integrated DrillingSystem is the centerpiece, or the land drilling system of the future as theycall it. This system combines surface and downhole hardware with optimizationsoftware that allows for drilling systems integration, automation and eventually,machine learning.
Page 264 Deutsche Bank Securities Inc.

9 October 2017
Oil Services & Equipment
Initiation of coverage
Principal Sources and Uses of Cash Flow
SLB is organized in four groups including Reservoir Characterization, Drilling,Production, and Cameron. Its Reservoir Characterization group is focusedon finding and classifying hydrocarbons and uses services such as seismicimaging, wireline, testing and processing to do so. Its Drilling group providesdrill bits, downhole tools, fluid systems (M-I SWACO), drilling measurements,land rigs, directional drilling, and integrated drilling services. Its Productiongroup is focused on reservoir production utilizing pressure pumping and otherwell services, completion tools, artificial lift, Integrated Project Services, andSchlumberger Production Management (a commercial arrangement where SLBreceives payment in-line with its value creation). Lastly, it created its Camerongroup after acquiring the company in 2016 and is mostly focused on pressure andflow control, valves, and subsea systems including its OneSubsea offering.
Reservoir Characterization■ WesternGeco – geophysical services (seismic) – reservoir imaging,
monitoring and development services for both proprietary andmulticlient surveys
■ Wireline – openhole and cased hole services including perforating andslickline services
■ Testing & Process – pressure and flow rate measurement services both atthe surface and downhole – the separation of oil, gas and produced waterand water injection systems – tubing conveyed perforating services
■ Software Integrated Solutions (SIS) – sells proprietary software andprovides consulting, information management and IT infrastructureservices for reservoir characterization, field development planning, andproduction enhancement
■ Integrated Services Management (ISM) – coordination and managementof Schlumberger services, products and third parties in projects aroundthe world – offers certified Integrated Services Project Managers asa focal point of contact between project owner and the various SLBservices
Drilling■ Bits and drilling tools – drill bits, bottom-hole assembly (BHA)
components, borehole enlargement technologies, tubular and tubularservices
■ M-I SWACO – drilling fluid systems, MPD, and underbalanced drillingsolutions
■ Drilling & Measurements – mud logging, directional drilling (DD),measurement-while-drilling (MWD), logging-while-drilling (LWD)
■ Land Rigs – land drilling system of the future
■ Integrated Drilling Services – all the services necessary for well planning,drilling, engineering, supervision, logistics, and procurement
Production■ Well Services – pressure pumping, cementing, stimulation, coiled
tubing, reservoir monitoring, and downhole data acquisition
Deutsche Bank Securities Inc. Page 265

9 October 2017
Oil Services & Equipment
Initiation of coverage
■ Completions – packers, safety valves, sand control technology,intelligent well technology
■ Artificial Lift – Electric submersible pumps (ESP), gas lift, rod lift, PCPs,and surface horizontal pumping systems
■ Integrated Project Services – project planning, well engineering, wellsitesupervision, logistics, and procurement
■ Schlumberger Production Management (SPM) – A field productionbusiness model where there is commercial alignment between SLB andthe operator – SLB receives payment in line with its value creation – SLBwill invest its own services and products, and in some cases cash, intothe field development activities and operations.
Cameron■ OneSubsea – integrated subsea production systems designed to
optimize production – includes wellheads, subsea trees, manifolds,flowline connectors and control systems.
■ Surface Systems – wellhead systems, processing solutions, Christmastrees
■ Drilling Systems – drilling equipment including pressure controlequipment (BOPs), control systems, riser systems, top drives, mudpumps, pipe handling equipment and rig designs.
■ Valves and Measurement – control, direct and measure the flow of oiland gas
Figure 562: Geographic and segment revenue mix
North America
24%
Latin
America
15%
Europe/CIS/Africa
27%
Middle East/Asia
34%
2016
Reservoir
22%
Drilling
29%
Production
29%
Cameron
20%
2016
Source: Company reports, Deutsche Bank
Largest international exposure versus its peersSLB has a larger exposure to international markets than its peers. WhileHalliburton in 2006 made clear to investors it was a North American centric oilfieldservices company, SLB had already taken a different path and was the undisputedleader in most international markets. The company did not see the merits of aprice knife-fight in a large US competitive landscape , at least until conventionaloil development gave way to unconventional tight oil development. Now SLB hasinvested more resources in North America, but is still only about 30% of total
Page 266 Deutsche Bank Securities Inc.

9 October 2017
Oil Services & Equipment
Initiation of coverage
revenues as of 2Q17 and about 24% in 2016 before the US recovery got traction.US revenues 2016 were $5.4 billion, which accounted for a little over 80% of totalNorth American revenues.
Internationally, Middle East/Asia is its largest region at 34% of 2016 revenues.Spending and activity levels in the Middle East were more resilient during thedownturn than most other regions and SLB has a strong presence. In the last 10years, the Middle East/Asia region had been closer to 25% of total revenue butsince the start of 2016 has been over 30%. Europe/Africa/CIS is the next largestregion accounting for 27% of 2016 revenues. Lastly, Latin America accounted for15% in 2016.
Figure 563: Consolidated EBITDA
0
2,000
4,000
6,000
8,000
10,000
12,000
14,000
16,000
2007 2008 2009 2010 2011 2012 2013 2014 2015 2016 2017 2018 2019
(a) (a) (a) (a) (a) (a) (a) (a) (a) (a) (e) (e) (e)
In m
illi
on
s o
f U
SD
Source: Company data, Deutsche Bank
Evolving with new business modelsSLB’s strategy has been focused on driving value for their customers throughintegration, efficiencies, and investment in technology. The ultimate goal islowering the cost per barrel and increasing recovery rates for their customers.The approach is different from its peers as SLB believes the best way isthrough integration and fostering closer collaboration and commercial alignmentwith customers which ultimately will drive efficiency improvements and betterleverage technological developments. There are several examples of this strategybeing implemented such as their acquisition of Cameron, which combined SLB’sreservoir and well technology with Cameron’s wellhead and subsea expertise.Another example is its development of OneDrill which is an integrated drillingsystem that focuses on understanding the entire drilling workflow, enablingautomation and machine learning, and integrating surface and downhole.
SLB has also been looking at new commercial models including its SPM offeringthat showcases its full range of technology and expertise while demonstratingthe value of its technology as their compensation is directly linked to productiongenerated. SLB recently created a special venture fund offering its customersa different way to pursue E&P project investment with the hope of fosteringfurther collaboration and secure preferred supplier agreements. The companyalso announced a JV with WFT (OneStim) to offer a broad multistage completionportfolio in North America.
Deutsche Bank Securities Inc. Page 267

9 October 2017
Oil Services & Equipment
Initiation of coverage
Changing how the business worksTraditionally the earnings drivers for the company have been spending by largerinternational oil companies (IOCs) and state-owned national oil companies (NOCs)and leveraging its scale and diversification to win large international contracts.Exploration spending was important as SLB’s had a large competitive advantagein their service offerings in exploration and offshore deepwater. In a lower forlonger environment, SLB is focusing on integration and new commercial modelswhich leverage its scale and technological capabilities. This will require operatorschanging the way they procure products and services, interact with the companyat a much earlier time in the planning stages, and in some cases allow SLB totake over the entire project.
Figure 564: Annual EPS
0.00
1.00
2.00
3.00
4.00
5.00
6.00
2007 2008 2009 2010 2011 2012 2013 2014 2015 2016 2017 2018
(a) (a) (a) (a) (a) (a) (a) (a) (a) (a) (e) (e)
EPS
Source: Company reports, Deutsche Bank
OneStim JV with WeatherfordSLB is in the early stages of its JV with WFT called OneStim that was announcedat the end of March 2017. The JV will offer one of the largest frac fleets in NorthAmerica to deliver a broad multistage completion portfolio. SLB will own 70%of the JV while WFT will own 30%. The transaction is expected to close in thesecond half of this year. SLB and WFT contributed their entire North Americapressure pumping assets, multistage completions, and pump down perforationbusinesses. SLB also paid a one-time $535mm payment to WFT. SLB will managethe JV and consolidate it for reporting purposes.
Uses of capital…we expect M&A will remain a core part of SLB’s strategyPrimary uses of cash are working capital and capex to fund reactivation ofequipment that was stacked during the downturn and to crew up. SLB actuallywaited longer than its peers to accelerate its reactivation of equipment as it waswaiting for more profitable work to return. Therefore SLB will be burdened morethan peers in the next quarter or two with reactivation costs.
The company estimates that 2017 capex will be close to $2.2bn. SLB also remainscommitted to investing in technology in the oil patch and generally has an annualR&D budget of roughly $1bn. Its R&D budget is larger than its peer groupcombined. The challenge facing SLB is getting clients to pay for new technologyin a challenging operating environment. Therefore SLB has also
Page 268 Deutsche Bank Securities Inc.

9 October 2017
Oil Services & Equipment
Initiation of coverage
used its own capital in funding SPM projects and its special venture fund as away to showcase the results of its technology.
Also SLB spent $2.6bn in dividends and $0.78mm in stock repurchases in 2016.Given its acquisition of CAM, it took its buyback levels down from the $2.2bn in2015 and $4.7bn in 2014. With its free cash flow levels likely to increase post thereactivation of equipment, look buybacks to return in force.
The one mitigating factor to an acceleration in buybacks is M&A. SLB has beenactive and vocal about the importance of its M&A strategy, which we fully expectwill continue through 2018.
Figure 565: Free cash flow
(8,000)
(6,000)
(4,000)
(2,000)
0
2,000
4,000
6,000
8,000
10,000
12,000
14,000
2007 2008 2009 2010 2011 2012 2013 2014 2015 2016 2017 2018 2019
(a) (a) (a) (a) (a) (a) (a) (a) (a) (a) (e) (e) (e)
In m
illi
on
s o
f U
SD
Cash from operations Capital expenditures Capitalized multi-client
SPM investments Free cash flow
Source: Company reports, Deutsche Bank
Figure 566: Consistent dividend growth paused during down cycle
(4,000)
(2,000)
0
2,000
4,000
6,000
8,000
2007 2008 2009 2010 2011 2012 2013 2014 2015 2016 2017 2018
(a) (a) (a) (a) (a) (a) (a) (a) (a) (a) (e) (e)
In m
illi
on
s o
f U
SD
Free cash flow Dividends paid
Source: Company reports, Deutsche Bank
Deutsche Bank Securities Inc. Page 269

9 October 2017
Oil Services & Equipment
Initiation of coverage
Figure 567: Income Statement(a) (a) (a) (a) (a) (a) (a) (a) (e) (e) (e)
In millions of USD 2009 2010 2011 2012 2013 2014 2015 2016 2017 2018 2019
Segment revenue
North America 3,707 6,003 12,273 13,448 13,898 16,151 9,811 6,665 9,078 10,646 12,867
Latin America 4,225 4,660 6,454 7,529 7,751 7,699 6,014 4,231 4,080 4,388 4,471
Europe/CIS/Africa 7,151 7,553 9,762 11,524 12,365 12,515 9,284 7,352 6,787 6,410 6,786
Middle East/Asia 5,234 6,078 8,071 9,180 10,909 11,875 9,898 9,285 10,137 10,730 12,547
Eliminations, other 2,386 3,153 2,980 1,160 441 340 467 277 494 528 602
Total revenues 22,702 27,446 39,540 42,841 45,364 48,580 35,474 27,810 30,575 32,703 37,273
Op costs 14,556 18,407 27,964 30,096 31,341 33,064 24,066 19,953 22,498 23,245 26,300
SG&A 535 650 417 405 406 476 493 404 431 449 449
R&D 802 919 1,061 1,153 1,174 1,218 1,095 1,011 799 784 784
D&A 2,476 2,775 3,280 3,501 3,764 4,094 4,078 4,094 3,900 3,612 3,421
EBIT 4,333 4,695 6,818 7,686 8,679 9,728 5,742 2,348 2,948 4,613 6,319
Interest (expense) (221) (206) (298) (331) (369) (347) (316) (517) (501) (476) (452)
Interest income 60 54 40 31 23 31 30 84 95 65 51
Equity income 0 0 0 0 0 0 0 0 0 0 0
Other income 0 0 0 0 0 0 0 0 0 0 0
PBT 4,171 4,543 6,560 7,386 8,333 9,412 5,456 1,915 2,541 4,202 5,918
Income tax (expense) (801) (936) (1,575) (1,757) (1,903) (2,063) (1,102) (306) (478) (880) (1,279)
Non-controlling interest (8) 0 (16) (33) (42) (67) (64) (60) (20) (20) (20)
Preferred dividends 0 0 0 0 0 0 0 0 0 0 0
Net income (operating) 3,363 3,608 4,969 5,596 6,388 7,282 4,290 1,549 2,044 3,302 4,618
Discontinued ops (22) (75) 220 33 (124) (205) (383) 0 0 0 0
Unusual after-tax (207) 734 (195) (139) 469 (1,639) (1,835) (3,236) (68) 0 0
Net income (GAAP) 3,134 4,267 4,994 5,490 6,733 5,438 2,072 (1,687) 1,976 3,302 4,618
Operating EPS 2.77 2.86 3.65 4.18 4.79 5.57 3.36 1.14 1.47 2.38 3.33
GAAP EPS 2.59 3.38 3.67 4.10 5.05 4.16 1.62 (1.24) 1.42 2.38 3.33
DPS 0.84 0.84 1.00 1.10 1.25 1.51 1.90 2.00 2.00 2.45 3.19
Diluted shares 1,215 1,264 1,361 1,339 1,334 1,309 1,275 1,360 1,391 1,387 1,387
EBITDA 6,809 7,470 10,098 11,187 12,443 13,822 9,820 6,442 6,848 8,225 9,740
EBITDA margin 30.0% 27.2% 25.5% 26.1% 27.4% 28.5% 27.7% 23.2% 22.4% 25.2% 26.1%
EBIT margin 19.1% 17.1% 17.2% 17.9% 19.1% 20.0% 16.2% 8.4% 9.6% 14.1% 17.0%
Tax rate 19.2% 20.6% 24.0% 23.8% 22.8% 21.9% 20.2% 16.0% 18.8% 20.9% 21.6%
Source: Deutsche Bank
Page 270 Deutsche Bank Securities Inc.

9 October 2017
Oil Services & Equipment
Initiation of coverage
Figure 568: Cash Flow Statement(a) (a) (a) (a) (a) (a) (a) (a) (e) (e) (e)
In millions of USD 2009 2010 2011 2012 2013 2014 2015 2016 2017 2018 2019
Net income 3,363 3,608 4,969 5,596 6,388 7,282 4,290 1,549 2,096 3,439 4,682
Depreciation 2,476 2,775 3,280 3,501 3,764 4,094 4,078 4,094 3,900 3,618 3,430
Deferred tax 373 (109) (35) (76) (105) 0 0 0 0 0 0
Chg in receivables 155 (289) (1,310) (2,116) (858) (187) 2,176 1,098 (942) 356 (415)
Chg in inventories 64 (67) (991) (643) 188 (36) 625 800 (377) 273 (304)
Chg in payables (293) (103) 708 928 654 (36) (2,656) (1,680) 261 (18) 1,437
Other (827) (321) (452) (376) 659 78 292 400 (457) (148) (512)
Cash from operations 5,311 5,494 6,169 6,814 10,690 11,195 8,805 6,261 4,480 7,520 8,319
Capital expenditures (2,395) (2,914) (4,016) (4,695) (3,943) (3,976) (2,410) (2,055) (2,260) (2,823) (3,160)
Capitalized multi-client (230) (326) (289) (351) (394) (321) (486) (630) (338) (296) (296)
SPM investments 0 0 0 0 (902) (740) (953) (1,031) (696) (736) (736)
Free cash flow 2,686 2,254 1,864 1,768 5,451 6,158 4,956 2,545 1,186 3,665 4,127
Acquisitions (514) (1,101) (186) (845) (1,210) (1,008) (443) (2,398) (364) 0 0
Asset sales 0 0 385 1,028 0 0 0 0 0 0 0
Dividends paid (1,006) (1,040) (1,300) (1,432) (1,608) (1,968) (2,419) (2,647) (2,780) (3,398) (4,418)
ESPP | options 206 401 438 410 537 825 448 415 143 0 0
Equity issuance, net (500) (1,717) (2,998) (972) (2,596) (4,678) (2,182) (778) (770) 0 0
Debt issuance, net 108 933 1,773 1,636 1,450 (37) 5,791 (2,377) (2,447) 67 (700)
Other (56) 644 (139) (146) 72 (161) (618) 1,463 180 0 0
Chg in cash 924 374 (163) 1,447 2,096 (869) 5,533 (3,777) (4,852) 334 (991)
FCF per share 2.21 1.78 1.37 1.32 4.09 4.71 3.89 1.87 0.85 2.64 2.98
Capex / revenue 0.11 0.11 0.10 0.11 0.09 0.08 0.07 0.07 0.07 0.09 0.09
Capex / depreciation 0.97 1.05 1.22 1.34 1.05 0.97 0.59 0.50 0.58 0.78 0.92
Source: Deutsche Bank
Deutsche Bank Securities Inc. Page 271

9 October 2017
Oil Services & Equipment
Initiation of coverage
Figure 569: Balance Sheet(a) (a) (a) (a) (a) (a) (a) (a) (e) (e) (e)
In millions of USD 2009 2010 2011 2012 2013 2014 2015 2016 2017 2018 2019
Cash and equivalents 4,616 4,990 4,827 6,274 8,370 7,501 13,034 9,257 4,405 4,739 3,748
Accounts receivable 6,088 8,278 9,500 11,351 11,497 11,171 8,780 9,387 9,461 9,105 9,520
Inventories 1,866 3,804 4,700 4,785 4,603 4,628 3,756 4,225 4,664 4,391 4,695
Other current assets 1,080 1,026 1,512 1,746 1,755 1,394 1,342 1,058 1,994 2,077 2,368
Total current assets 13,650 18,098 20,539 24,156 26,225 24,694 26,912 23,927 20,524 20,313 20,331
LT investments 738 484 256 245 363 442 418 238 13 13 13
Investment in affiliates 2,306 1,071 1,266 1,502 3,317 3,235 3,311 1,243 1,553 1,553 1,553
Net PP&E 9,660 12,071 12,993 14,780 15,096 15,396 13,415 12,821 11,809 11,015 10,745
Multi-client data 288 394 425 518 667 793 1,026 1,073 1,116 1,264 1,412
Goodwill 5,305 13,952 14,154 14,585 14,706 15,487 15,605 24,990 25,058 25,058 25,058
Intangible assets 786 5,162 4,882 4,802 4,709 4,654 4,569 9,855 9,636 9,636 9,636
Other assets 732 535 686 959 2,017 2,203 2,749 3,809 4,371 4,555 5,191
Total assets 33,465 51,767 55,201 61,547 67,100 66,904 68,005 77,956 74,081 73,406 73,938
Accounts payable 5,003 6,488 7,579 8,453 8,837 9,246 7,727 10,016 10,443 10,425 11,863
Income taxes payable 878 1,493 1,245 1,426 1,490 1,647 1,203 1,188 1,290 1,344 1,531
Dividends payable 253 289 337 368 415 518 634 702 694 902 1,172
Current debt 1,125 2,595 1,377 2,121 2,783 2,765 4,557 3,153 2,324 1,424 2,324
Other current liabilities 0 0 0 0 0 0 0 0 0 0 0
Total current liabilities 7,259 10,865 10,538 12,368 13,525 14,176 14,121 15,059 14,750 14,094 16,890
Long-term debt 4,355 5,517 8,556 9,509 10,393 10,565 14,442 16,463 15,000 15,967 14,367
Deferred taxes 0 1,636 1,731 1,493 1,708 1,296 1,075 1,880 2,000 2,000 2,000
Employee obligations 1,660 1,262 1,732 2,169 670 1,501 1,434 1,495 1,385 1,385 1,385
Other LT liabilities 962 1,043 1,252 1,150 1,169 1,317 1,028 1,530 1,555 1,621 1,847
Non-controlling int 109 218 129 107 166 199 272 451 442 462 482
Shareholders' equity 19,120 31,226 31,263 34,751 39,469 37,850 35,633 41,078 38,948 37,877 36,967
Total liabilities and equity 33,465 51,767 55,201 61,547 67,100 66,904 68,005 77,956 74,081 73,406 73,938
Total debt 5,480 8,112 9,933 11,630 13,176 13,330 18,999 19,616 17,324 17,391 16,691
Net debt 864 3,122 5,106 5,356 4,806 5,829 5,965 10,359 12,919 12,652 12,943
Debt/capital 22% 21% 24% 25% 25% 26% 35% 32% 31% 31% 31%
Debt/equity 29% 26% 32% 33% 33% 35% 53% 48% 44% 46% 45%
Debt turns 0.8 1.1 1.0 1.0 1.1 1.0 1.9 3.0 2.5 2.1 1.7
Source: Deutsche Bank
Page 272 Deutsche Bank Securities Inc.

9 October 2017
Oil Services & Equipment
Initiation of coverage
Rating
BuyNorth AmericaUnited States
IndustrialsOil Services & Equipment
Company
Smart Sand
Reuters Bloomberg
SND.OQ SND US
Pushing Ahead with Expansion EffortsInitiating coverage with a Buy rating and $9 price targetThe higher cadence of more productive wells in the US has attracted a rapiddeployment of upstream capital that is disproportionately benefiting two maindisciplines, hydraulic fracturing and frac sand. We expect the bottleneck in thefrac market to begin easing in early 2018, which should benefit sand demand andSND’s expansion efforts. We are encouraged that the markets have rerated thestocks lower and expectations have been reduced broadly, thus we are initiatingon SND with a Buy rating and a $9 price target. Our target is below historicaltrading ranges as the industry is re-investing rapidly to expand sand capacity,thus restoring the same scarcity value experienced in 2014 is unlikely in the near-term in our view.
SND expanding Oakdale facility to 5.5m tons from 3.3 million tonsThe two dryers should be in-place by 2Q18, enabling SND to boost its capacityby two-thirds. Ultimately the expansion should improve cost efficiencies withproduction costs expected to decline to $12 per ton from the $16 per ton exitrate in 4Q16.
SND evaluating opportunities for a regional mine in the PermianWhile the focus remains on the expansion of the Oakdale facility and furtherenhancements to its logistics, SND is looking to make a deal for a Permian sandmine by year-end 2017.
ValuationOur $9 price target is 5.5x our estimateof the company’s 2018 EBITDA power of$69m, is below the three-year averagemultiple of its peers at 8.0x. The discountis applied to account for the scale of thecompany and its single source of operationalcash flow, specifically the Oakdale facility.The opportunity for multiple expansion asthe company diversifies is relevant to thestory as the company looks at opportunitiesin the Permian.The main investment risks include: 1) shiftsin OPEC policy and the influence thatwould have on oil prices and ultimatelyUS upstream capital expenditures, 2)negative revisions to global oil demand,3) a downdraft in pricing if supplyadditions overwhelm demand increases,and 4) operational disruptions at its singleoperating facility near Oakdale, which coulddisrupt earnings materially.
Forecasts and ratios
Year End Dec 31 2016A 2017E 2018E
1Q EPS 0.01 0.02A 0.17
2Q EPS -0.11 0.06A 0.21
3Q EPS -0.00 0.11 0.23
4Q EPS 0.40 0.13 0.24
FY EPS (USD) 0.41 0.33 0.86
OLD FY EPS (USD) 0.26 – –
% Change 58.9% – –
P/E (x) 32.7 21.5 8.1
DPS (USD) 0.00 0.00 0.00
Dividend Yield (%) 0.0 0.0 0.0
Revenue (USDm) 59.2 126.2 195.0Source: Deutsche Bank estimates, company data
David HavensResearch [email protected]
Price at 5 Oct 2017 (USD) 7.01
Price target 9.00
52-week range 21.00 - 4.94
Price/price relative
Smart Sand S&P 500 INDEX (Rebased)
Nov '16 Dec '16 Jan '17 Feb '17 Mar '17 Apr '17 May '17 Jun '17 Jul '17 Aug '17 Sep '17 Oct '172.5
5
7.5
10
12.5
15
17.5
20
22.5
Performance(%)
1m 3m 12m
Absolute 17.2 -23.2 –
S&P 500INDEX
2.5 4.5 18.0
Source: Deutsche Bank
Stock & option liquidity data
Market Cap (USDm) 284.7
Shares outstanding (m) 40.6
Free float (%) 100
Volume (5 Oct 2017) 154,111
Option volume (und. shrs., 1M avg.) –Source: Deutsche Bank
Deutsche Bank Securities Inc. Page 273

9 October 2017
Oil Services & Equipment
Initiation of coverage
Key investment themes
Completion intensities rising, befitting sand demandThe sand industry is seeing a significant benefit from rising completion intensities.It is benefiting from a higher cadence of wells drilled per rig annually, more fracstages per well, longer laterals and increased proppant loadings per lateral foot.Well productivity has undergone a steady and significant move higher over thepast decade which has caused operators to double down on completion intensity,further driving sand demand.
Figure 570: Average Permian horizontal lateral lengths Figure 571: Wells spud per year per rig
0
1,000
2,000
3,000
4,000
5,000
6,000
7,000
8,000
2011 2012 2013 2014 2015 2016 2017 2018 2019
Feet
12.0
13.2
15.6 16.0 15.8
17.3 18.0
6
8
10
12
14
16
18
20
2011 2012 2013 2014 2015 2016 2017
We
lls
spu
d p
er
rig
Source: IHS Markit Source: IHS Markit
Figure 572: Permian frac stages per well Figure 573: Permian sand volumes per lateral foot
0
5
10
15
20
25
30
35
2011 2012 2013 2014 2015 2016 2017 2018 2019
Fra
c st
ag
es
pe
r w
ell
100
600
1,100
1,600
2,100
2,600
2011 2012 2013 2014 2015 2016 2017 2018 (e) 2019 (e)
Lbs.
pe
r la
tera
l ft
Source: IHS Markit Source: IHS Markit
US sand demand totaled 18.9 million tons in 2Q17, up 11% sequentially andalmost 150% year-over-year. The US rig count rebounded at a record pace startingin 2Q16 which provided a tailwind for demand. In addition, sand per well andsand per frac stage continued to set new record highs, driving consumption torecord levels. Despite the low oil prices, 2017 consumption per should continueto rise, albeit at a much more moderate pace.
Page 274 Deutsche Bank Securities Inc.

9 October 2017
Oil Services & Equipment
Initiation of coverage
Permian is the largest demand destination, and is core market for SNDThe Permian consumes more frac sand than any other region which is notsurprising as the basin also boasts the highest level of drilling activity. During2Q17, the Permian accounted for 37% of overall US sand consumption. The EagleFord is the second largest consumer of frac sand, accounting for 22% of overallUS demand in 2Q17, followed by Appalachia at 13%. While sand consumptiongenerally tracks the rig count in a particular region, each basin does exhibitdifferent intensity metrics due to the geology of the rock and operators in theregion. The Permian currently makes up about 38% of SND’s sales, second onlyto the Marcellus which is a bit above 40% year-to-date.
Figure 574: Regional US sand demand Figure 575: US sand demand by region (2Q17)
-
2,000
4,000
6,000
8,000
10,000
12,000
14,000
16,000
18,000
20,000
1Q
11
2Q
11
3Q
11
4Q
11
1Q
12
2Q
12
3Q
12
4Q
12
1Q
13
2Q
13
3Q
13
4Q
13
1Q
14
2Q
14
3Q
14
4Q
14
1Q
15
2Q
15
3Q
15
4Q
15
1Q
16
2Q
16
3Q
16
4Q
16
1Q
17
2Q
17
Th
ou
san
ds
of
ton
s)
Appalachia Bakken Barnett DJ Basin Eagle Ford Haynesville Permian Other
Appalachia
13%
Bakken
7%Barnett
0%
DJ Basin
8%
Eagle Ford
22%Haynesville
2%
Permian
37%
Other
11%
Source: IHS Markit, Deutsche Bank Source: IHS Markit, Deutsche Bank
While overall sand intensity is expected to keep increasing, the rate of change isslowing on average. During the downturn, operators were pushing the envelopeon sand loading to determine optimal intensity and maximum returns. Cheapsand prices and low rates for pumping services encouraged service providersto experiment with intensity levels. Completion has become the most expensivephase of the oil and gas cycle and given that sand is a very big piece ofthe completion cost, E&Ps have begun focusing on optimizing sand efficiency.Customers are spending to research well design, cluster spacing and sand loadingtechniques to get the most of their sand, particularly as some operators encountersome price break points in terms of sand volumes and the overall cost of the well.
SND evaluating regional mines in the PermianThe most prominent shift in the frac sand market over the last five years has beenthe emergence of regional sand mines in Texas. In 2014, regional sand minesaccounted for just 10% of total US demand however this spiked to 35% in 2016and will continue to move higher as new capacity comes on line. Historically, thehigh majority of US sand demand was fulfilled by Midwest northern white fracmines which sport the highest quality reserves in the world. TX accounts for about60% of US sand demand and thus the sand must be transported a long distance.In addition, the commodity has a very low value to weight ratio. These two factorscaused transportation expenses to be about 70% of the total delivered price tothe well. This presented an opportunity for regional sand mines in Texas as theycould deliver the sand for significantly cheaper, allowing them to undercut theMidwest mines on pricing while still generating a healthy margin.
Deutsche Bank Securities Inc. Page 275

9 October 2017
Oil Services & Equipment
Initiation of coverage
The northern white mines are higher quality than the regional brown deposits,exhibiting superior crush strength and roundness which is important as frac sandmust be able to withstand high pressure and temperature. Prior to the downturn,it was considered taboo to use the regional brown sand which is lower qualityhowever as oil prices crashed, operators searched for ways to bring down theircost profiles and breakevens and began experimenting with regional brown sand.To the industry’s surprise, the regional brown sand performed well. SND has beenvery vocal about its intentions to invest in the Permian with timing being sometimenear year-end 2017.
Robust demand has attracted significant supply additions, weighed on stockWhile frac sand demand has the strongest tailwinds in the entire energy complexin our view, sand producers have aggressively added capacity to meet thisrising demand, which is weighing on pricing leverage and the stocks. The sandmarket has made significant capacity additions over the last couple years due tosurging demand. Despite the downturn and declining demand, industry capacitycontinued to move higher as previously announced supply additions came onwith a lag.
Figure 576: Effective industry supply
0
10,000
20,000
30,000
40,000
50,000
60,000
70,000
80,000
90,000
100,000
2013 2014 2015 2016
Th
ou
san
d t
on
s
Coarse Fine
Source: IHS Markit, Deutsche Bank
Year to date there has been 10-15 capacity additions which have been acombination of new mine/production facility start-ups along with expansions toexisting plants. The majority of this capacity will come on-line by late 2017 or early2018. The aggregate production capacity of the additions meant for the PermianBasin only is approximately 25MM tons per year (TPY). This has been a drag onthe stocks, but has forced a re-rating and negative revisions that offer a bettersetup in the shares of SND now.
Page 276 Deutsche Bank Securities Inc.

9 October 2017
Oil Services & Equipment
Initiation of coverage
Valuation and risksOur $9 price target is 5.5x our estimate of the company’s 2018 EBITDA powerof $69m, is below the three-year average multiple of its peers at 8.0x. Thediscount is applied to account for the scale of the company and its single sourceof operational cash flow, specifically the Oakdale facility. The opportunity formultiple expansion as the company diversifies is relevant to the story as thecompany looks at opportunities in the Permian.
The main investment risks include: 1) shifts in OPEC policy and the influencethat would have on oil prices and ultimately US upstream capital expenditures,2) negative revisions to global oil demand, 3) a downdraft in pricing if supplyadditions overwhelm demand increases, and 4) operational disruptions at itssingle operating facility near Oakdale, which could disrupt earnings materially.
Deutsche Bank Securities Inc. Page 277

9 October 2017
Oil Services & Equipment
Initiation of coverage
Company description
Smart Sand (SND) is a pure play producer of Northern White raw frac sand withan annual capacity of 3.3 million tons, which is currently being expanded to 5.5million tons by early 2018. The company owns two properties, the first of which isan integrated facility with mining, wet and dry sand processing and an onsite railinfrastructure with three rail loops located near Oakdale, WI. This property has acurrent annual nameplate capacity of 3.3 million tons and is being expanded to5.5 million tons. It has proven reserves of 332 million tons, 80% of which is the finemesh grades. The second property, the Hixton site, is in Jackson County, WI andhas 100 million tons of proven reserves and is available for future development.
The company is also evaluating opportunities to acquire regional sand capacityand logistical assets in the Permian, and logistical assets in the Bakken andMarcellus. Management expects a transaction as early as year-end 2017.
Figure 577: Proven reserves
20/40
mesh
19%
40/70
mesh
41%
100
mesh
40%
Oakdale, WI (332m tons)
70
mesh
or
coarser
72%
100
mesh
28%
Hixton, WI (100m tons)
Source: Company reports
Onsite rail infrastructure is criticalAt the Oakdale facility, SND has an onsite rail infrastructure that includes sevenmiles of track in a double-loop configuration that just had a third rail loop addedin June 2017. The property also has a connection to a Class I rail line owned byCanadian Pacific with a three rail car loading facility. About 3.5 miles away inByron, WI, SND built a second transloading facility on a second Class I rail line,this one owned by Union Pacific. The company is expanding this facility to be aunit train capable facility with completion in late 3Q or early 4Q17.
Page 278 Deutsche Bank Securities Inc.

9 October 2017
Oil Services & Equipment
Initiation of coverage
Principal Sources and Uses of Cash Flow
Oakdale facility is single source of cash flow, diversification coming soonSND’s primary focus remains growing its Oakdale facility and enhancing itslogistics. This facility is the sole source of operating cash flow for the company,but there are plans to invest in a regional sand mine in West Texas with in-basintransloads, and last mile logistical opportunities. The company is also activelylooking to acquire logistical assets in the Bakken and Marcellus. The timing of aregional sand mine transaction for the Permian is planned for by year-end 2017.
Permian are Marcellus are its principal marketsYear-to-date, SND’s two primary destination markets have been the Permianand Marcellus, which combined are close to 80% of its delivered volumes. Thecompany has been seeing increased interest from Basins other than the Permianincluding specifically the Bakken and Marcellus.
Figure 578: SND key sand destinations
Marcellus
Permian
Bakken
EFS
Mid-Continent
Source: Company reports, Deutsche Bank
Expanding Oakdale to 5.5 million tons of annual capacityIn early 2017, SND decided to move forward with the expansion of the Oakdalefacility to 5.5 million tons from its current nameplate capacity of 3.3 million tons.Ultimately SND can expand this facility to an annual capacity of 9 million tons.SND subsequently increased its capex guidance for 2017 to $85 million from $55million. The company is building two dry plants and a wet plant in an integrateddesign, which will be enclosed so it can work year around. The wet plants shouldbe up by September and the two dryers will online in late March or early April2018. None of the expansion volumes have been contracted yet, but the companyindicated it had good line-of-sight to move ahead with the investment. In February2017, SND did a follow-on equity offering that provided net proceeds of about$24 million. Debt remains near zero.
Deutsche Bank Securities Inc. Page 279

9 October 2017
Oil Services & Equipment
Initiation of coverage
Enhancing logistical infrastructureIn addition to the nameplate capacity expansion to 5.5 million tons, SND hasalso completed a third rail loop at Oakdale and is expanding its nearby Byrontransloading facility to be a unit-train capable facility by late 3Q/early 4Q17.Logistics are crucial components of profitability and delivery flexibility and a keydifferentiator for SND. Having an onsite rail infrastructure eliminates trucking to arail load-out facility and the higher associated costs. Having access to a Class I railline provides direct access to the key unconventional plays and avoids interchangefees and local short hauls. By building out more unit train capabilities at its Byronlocation, SND also reduces the delivery time to its customers from 14+ days toless than 5 days by eliminating interim stops and also allowing for better rail carutilization. As these expansion efforts are completed, SND is expanding its fleetof railcars by 750 to a total of 2,300 railcars.
SND’s business model favors long-term contractsSND sells its sand volumes directly to producers and/or oilfield service companiesunder long-term take-or-pay contracts or in the spot market. The companyrecognizes revenues from direct sand sales, reservation charges and pass throughcharges for transportation. The company prefers to sell on a heavier mix oflong-term take-or-pay contracts and currently has 74% of its annual capacitycontracted with a weighted average term of just under three years. In 2Q17, 82%of SND’s sales were from term commitments. The company looks for about 25%of its mix to be in the spot market.
Pricing for 40/70 mesh sand is in the mid-$40s per ton with 100 mesh in the $30salong with 30/50 mesh.
Production costs were $15.85 per ton in 1Q17 and down to $13.17 per ton in2Q17. The company had initially guided to about $12 per ton as it planned forutilization to increase from 68% in 1Q17 to about 90% by 3Q17. However, therewas some unplanned downtime due to dust control and some other operationalissues, as well as some rail inefficiencies that have pushed the $12 per ton targetto year-end 2017 or early 2018. The company now expects utilization in the75-80% range for 3Q17 and rising into year-end.
Transportation and logistical expenses are a significant portion of the costsincurred by the customer to bring sand to the well site. Suppliers with a closerproximity are a threat, which is why SND has invested in its expansive railinfrastructure, but is also evaluating its own entry into regional sand supply. In2Q17, 82% of its volumes were sent by unit trains compared with 69% in 4Q16.The completion of the Byron expansion is meant to increase unit train takeawayand overall nameplate utilization, helping the company ramp to 90% utilizationand get production costs down to $12 per ton.
Page 280 Deutsche Bank Securities Inc.

9 October 2017
Oil Services & Equipment
Initiation of coverage
Figure 579: SND sand volumes sold Figure 580: SND revenues
-
1,000
2,000
3,000
4,000
5,000
6,000
(a) (a) (a) (e) (e) (e)
2014 2015 2016 2017 2018 2019
To
ns
('0
00
)
-
50
100
150
200
250
20
14
20
15
20
16
20
17
20
18
20
19
(a) (a) (a) (e) (e) (e)
In m
illio
ns
of
US
D
Sand sales Transportation Rail car rental Shortfall pmts
Source: Company reports, Deutsche Bank Source: Company reports, Deutsche Bank
Figure 581: Free cash flow
(100)
(80)
(60)
(40)
(20)
-
20
40
60
80
20
14
20
15
20
16
20
17
20
18
20
19
(a) (a) (a) (e) (e) (e)
In m
illi
on
s o
f U
SD
Cash from operations Capital expenditures Free cash flow
Source: Deutsche Bank
Figure 582: Annual EPS Figure 583: Net debt
-
0.20
0.40
0.60
0.80
1.00
1.20
20
14
20
15
20
16
20
17
20
18
20
19
(a) (a) (a) (e) (e) (e)
EP
S
(60)
(40)
(20)
-
20
40
60
80
100
120
20
14
20
15
20
16
20
17
20
18
20
19
(a) (a) (a) (e) (e) (e)
In m
illio
ns
of
USD
Source: Company reports, Deutsche Bank Source: Company reports, Deutsche Bank
Deutsche Bank Securities Inc. Page 281

9 October 2017
Oil Services & Equipment
Initiation of coverage
Figure 584: Income Statement(a) (a) (a) (e) (e) (e)
In millions of USD 2014 2015 2016 2017 2018 2019
Revenues
Sand sales 63 32 32 76 128 156
Transportation 4 2 1 42 57 59
Rail car rental 2 4 6 8 10 10
Shortfall pmts - 10 21 0 - -
Total revenues 68 48 59 126 195 225
COGS:
DD&A 3 4 6 7 12 14
Freight 6 6 8 47 55 62
Production 21 10 13 32 49 59
Total COGS 30 21 27 87 115 135
Gross profit 38 27 33 39 80 89
Salaries 5 5 7 9 12 13
D&A 0 0 0 0 0 0
SG&A 5 4 5 10 12 13
EBIT 28 17 20 21 56 63
Interest (expense) (2) (3) (3) (0) (0) (0)
Interest income - - - - - -
Equity income - - - - - -
Other income (6) (5) 2 0 0 0
PBT 21 10 20 20 56 63
Income tax (expense) (10) (4) (9) (7) (20) (23)
Non-controlling interest - - - - - -
Preferred dividends - - - - - -
Net income (operating) 11 6 10 13 36 40
Discontinued ops - - - - - -
Unusual after-tax (4) (1) - - - -
Net income (GAAP) 7 5 10 13 36 40
Operating EPS 0.93 0.21 0.41 0.33 0.86 0.97
GAAP EPS 0.60 0.19 0.41 0.33 0.86 0.97
DPS - - - - - -
Diluted shares 12 26 25 41 41 41
EBITDA margin 47.1% 46.4% 45.3% 22.3% 34.8% 34.4%
EBIT margin 41.7% 36.2% 34.4% 16.3% 28.6% 27.9%
Tax rate 46.2% 42.1% 47.5% 34.9% 36.0% 36.0%
Source: Deutsche Bank
Page 282 Deutsche Bank Securities Inc.

9 October 2017
Oil Services & Equipment
Initiation of coverage
Figure 585: Cash Flow Statement
(a) (a) (a) (e) (e) (e)
In millions of USD 2014 2015 2016 2017 2018 2019
Net income 7 25 10 13 36 40
Depreciation 4 2 6 8 12 15
Deferred tax 8 4 1 4 - -
Chg in receivables (4) 3 (3) (13) (10) -
Chg in inventories 0 (2) (1) 4 (4) -
Chg in payables 1 (0) 1 0 2 -
Other 6 0 13 (5) 2 -
Cash from operations 22 31 27 12 38 55
Capital expenditures (31) (29) (3) (83) (40) (46)
Free cash flow (9) 1 24 (71) (2) 9
Acquisitions - - - - - -
Asset sales - - 0 0 - -
Dividends paid - - - - - -
ESPP | options - - - - - -
Equity issuance, net - (0) 138 26 - -
Debt issuance, net 48 2 (67) 20 - -
Other (39) 0 (51) (2) - -
Chg in cash - 4 44 (27) (2) 9
Source: Deutsche Bank
Deutsche Bank Securities Inc. Page 283

9 October 2017
Oil Services & Equipment
Initiation of coverage
Figure 586: Balance Sheet
(a) (a) (a) (e) (e) (e)
In millions of USD 2014 2015 2016 2017 2018 2019
Cash and equivalents - 4 48 20 18 27
Accounts receivable - 2 5 18 28 28
Unbilled receivables - 4 0 0 0 0
Inventories - 4 0 0 0 0
Other current assets - 2 11 15 22 22
Total current assets - 16 65 53 69 77
LT inventories - 8 3 - - -
Net PP&E - 109 104 182 210 241
Goodwill - - - - - -
Other assets - 1 1 1 2 2
Total assets - 133 173 237 281 321
Accounts payable - 1 2 4 6 6
Current debt - 36 1 0 0 0
Other current liabilities - 11 11 10 16 16
Total current liabilities - 49 14 15 22 22
Long-term debt - 65 1 21 21 21
Other LT liabilities - 16 16 21 22 22
Shareholders' equity - 4 142 180 216 256
Total liabilities and equity - 133 173 237 281 321
Total debt - 102 2 21 21 21
Net debt - 98 (46) 1 3 (6)
Debt/capital 0% 96% 1% 10% 9% 8%
Debt/equity 0% 2723% 1% 12% 10% 8%
Debt turns 0.0 4.6 0.1 0.7 0.3 0.3
Source: Deutsche Bank
Page 284 Deutsche Bank Securities Inc.

9 October 2017
Oil Services & Equipment
Initiation of coverage
Rating
BuyNorth AmericaUnited States
IndustrialsOil Services & Equipment
Company
Superior EnergyServices
Reuters Bloomberg
SPN.N SPN US
Choosing the PathMaintaining our Buy rating and $15 price targetWe are maintaining our BUY rating on Superior Energy Services and our pricetarget of $15. SPN has benefitted from changing its strategic direction byinvesting capital into its US Land business when it recognized the opportunity tobe an early responder by re-activating equipment early in the upcycle. Followingsolid execution in 2Q17, highlighted by strong US Land incrementals, SPNagain wants the flexibility to put additional frac horsepower back to workbut visibility into 2018 has become more uncertain. While headwinds in itsDrilling Products and Services segment remain, with challenging offshore andinternational markets, the operating leverage in its US Land businesses shouldcontinue to come through and drive overall company margins higher.
Increasing US Land leverageSPN positioned itself as an early responder and has deployed 250k hp since2Q16 to get to 600k total capacity and will direct incremental capex towards USfrac to grow their total horsepower to 750k by early next year. Rising serviceintensity, increasing utilization, and higher pricing have combined to drive strongUS Land incrementals. US Land has become a larger part of the overall business,accounting for 68% of Q2 revenue vs. 44% a year earlier.
Geographic and earnings diversificationSome have questioned changes in SPN's strategic direction, but we believe itsdiversified portfolio allows it to adjust investment decisions. While the marketmay not fully value its diversification as International and Gulf of Mexico spendinglags the US, geographic and earnings diversification remain a key part of thestrategy. Management will direct incremental capex towards US frac and exportkey product lines abroad.
ValuationWe are continuing coverage of SuperiorEnergy Services with a $15 price target.This is based on a 9.4x EV/ EBITDA multipleof our 2018 EBITDA estimate. Our targetmultiple is based on a one-year forward(relative to the S&P 500) through-cycleEBITDA multiple applied to the historicalaverage through-cycle multiple for SPN.The main investment risks include: 1) shiftsin OPEC policy and the influence thatwould have on oil prices and ultimately USupstream capital expenditures, 2) a step upin cost inflation in the US, 3) increasedregulation around hydraulic fracturing, 4)geographic expansion as SPN continues toexport key product lines abroad, 5) offshorespending levels continue to remain subdued.
Forecasts and ratios
Year End Dec 31 2016A 2017E 2018E
1Q EPS -0.49 -0.59A –
2Q EPS -0.53 -0.41A –
3Q EPS -0.73 -0.30 –
4Q EPS -0.74 -0.25 –
FY EPS (USD) -2.56 -1.53 -0.85
P/E (x) – – –
DPS (USD) 0.08 0.00 0.00
Dividend Yield (%) 0.5 0.0 0.0
Revenue (USDm) 1,450.0 1,919.6 2,219.4Source: Deutsche Bank estimates, company data
Jason BandelAssociate [email protected]
Price at 5 Oct 2017 (USD) 10.42
Price target 15.00
52-week range 19.03 - 8.12
Price/price relative
Superior Energy Serv S&P 500 INDEX (Rebased)
Jan '15 May '15 Sep '15 Jan '16 May '16 Sep '16 Jan '17 May '17 Sep '175
10
15
20
25
30
35
40
45
Performance(%)
1m 3m 12m
Absolute 25.2 -5.8 -40.8
S&P 500INDEX
2.5 4.5 18.0
Source: Deutsche Bank
Stock & option liquidity data
Market Cap (USDm) 1,583.5
Shares outstanding (m) 152.0
Free float (%) 100
Volume (5 Oct 2017) 683,510
Option volume (und. shrs., 1M avg.) –Source: Deutsche Bank
Deutsche Bank Securities Inc. Page 285

9 October 2017
Oil Services & Equipment
Initiation of coverage
Key investment themes
Increasing US Land leverageUS Land continues to become a larger part of their overall business, as USLand revenue accounted for 68% of total Q2 revenue compared to 44% a yearearlier. After closing its pressure pumping operations in the Marcellus, SPN isleveraging its scale by focusing its pressure pumping assets in the Permian andthe Eagle Ford plays. SPN has gone from 350,000 hp working at the end of 2Q16to 600,000 hp working at the end of 2Q17. Management will direct incrementalcapex towards US frac to grow their total horsepower to 750k by early next year.While this horsepower will likely leave them just outside the top 10 in total UScapacity, SPN focuses on a select subset of efficient customers in two plays whichprovides them enough scale to service their customers.
Figure 587: Increasing US Land exposure
0.0%
10.0%
20.0%
30.0%
40.0%
50.0%
60.0%
70.0%
80.0%
90.0%
100.0%
2Q
12
3Q
12
4Q
12
1Q
13
2Q
13
3Q
13
4Q
13
1Q
14
2Q
14
3Q
14
4Q
14
1Q
15
2Q
15
3Q
15
4Q
15
1Q
16
2Q
16
3Q
16
4Q
16
1Q
17
2Q
17
Re
ve
nu
e C
om
po
siti
on
(%
)
US Land Gulf of Mexico International
Source: Company reports, Deutsche Bank
US pressure pumping market is undersuppliedThe positive supply/ demand trends are continuing in the frac market, driven bya rising well count, increased pad drilling, more wells per pad, and an increasinginventory of drilled but uncompleted wells. Frac fleets are also incorporating morehhp, averaging about 50k now. With these trends in mind, SPN decided to buildout its total capacity to 750k hhp by early next year. While pricing has improved,it has been more moderate than what some producers previously expected.SPN also benefits from higher completion oriented spending with some of itscomplimentary product lines such as coiled tubing.
Page 286 Deutsche Bank Securities Inc.

9 October 2017
Oil Services & Equipment
Initiation of coverage
Figure 588: Total vs. marketed frac hhp utilization Figure 589: US frac hhp demand
0%
20%
40%
60%
80%
100%
120%
3Q
11
4Q
11
1Q
12
2Q
12
3Q
12
4Q
12
1Q
13
2Q
13
3Q
13
4Q
13
1Q
14
2Q
14
3Q
14
4Q
14
1Q
15
2Q
15
3Q
15
4Q
15
1Q
16
2Q
16
3Q
16
4Q
16
1Q
17
Total utilization Marketed utilization
0
2
4
6
8
10
12
14
16
18
3Q
11
4Q
11
1Q
12
2Q
12
3Q
12
4Q
12
1Q
13
2Q
13
3Q
13
4Q
13
1Q
14
2Q
14
3Q
14
4Q
14
1Q
15
2Q
15
3Q
15
4Q
15
1Q
16
2Q
16
3Q
16
4Q
16
1Q
17
2Q
17
3Q
17
Millio
n h
hp
Source: IHS Markit, Deutsche Bank Source: IHS Markit, Deutsche Bank
Smid cap diversified oilfield services providerSPN is a smid-cap company with enough product depth and breadth to competein the global diversified oilfield services market. Even with operations in 20countries and 22 product line offerings, people still question the diversifiedservices model with a company this size. The market tends to be more familiarwith smid cap companies that specialize in a smaller subset of products or inone or two regions. We argue that the model does provide optionality whenoffshore and international markets start to improve. SPN also has more leverageto completion and production services markets internationally than the large capdiversifieds, therefore they are not always in direct competition.
Challenging offshore and international markets weigh on marginsAs activity levels have remained challenging in offshore and international markets,there has been a drag in SPN’s results due to its exposure to these markets and theimpact on its high margin DPS business. In the Gulf of Mexico, management hasdone a good job lowering its cost structure and focusing on completion relatedwork as drilling activity remains subdued. While the company strives to protectits leading drilling products market share, they have looked for opportunities toimprove its DPS utilization by transferring under-utilized 5.5 inch drillpipe onshore.Also SPN’s subsea plug and abandonment system should return to work inthe fourth quarter. Internationally, SPN has selectively entered countries usuallybeing pulled by a customer through an individual product line before expandingwith additional lines. Its core markets exist in Latin America, Middle East, andAsia Pacific. While activity has been disappointing overall, they see a couple ofemerging opportunities moving into next year. Improving DPS utilization, whichcarry high EBITDA margins, remains an important focus going forward.
Deutsche Bank Securities Inc. Page 287

9 October 2017
Oil Services & Equipment
Initiation of coverage
Figure 590: Falling offshore and international activity levels have hurt DPSmargins
-30.0%
-20.0%
-10.0%
0.0%
10.0%
20.0%
30.0%
40.0%
50.0%
60.0%
2Q
12
3Q
12
4Q
12
1Q
13
2Q
13
3Q
13
4Q
13
1Q
14
2Q
14
3Q
14
4Q
14
1Q
15
2Q
15
3Q
15
4Q
15
1Q
16
2Q
16
3Q
16
4Q
16
1Q
17
2Q
17
Ad
just
ed
EB
ITD
A m
arg
ins
(%)
Drilling Products & Services Onshore Completion & Workover
Production Services Technical Solutions
Source: Company reports, Deutsche Bank
Debt reduction remains a focusManagement has clearly stated the goal of paying down debt to enter thenext cycle with much lower leverage. Part of the plan is to use proceeds fromdivestitures of product lines that no longer fit within its core portfolio. While notgiving a specific target, management will have to find the right balance betweenthe cyclicality in US Land compared with the general stability (at least in terms ofstaying EBITDA positive during the downturn) of its other geomarkets.
Figure 591: Net debt levels higher than management would like
0
200
400
600
800
1,000
1,200
1,400
1,600
1,800
2,000
2009 2010 2011 2012 2013 2014 2015 2016 2017 2018
(a) (a) (a) (a) (a) (a) (a) (a) (e) (e)
In m
illio
ns
of
US
D
Source: Company reports, Deutsche Bank
Valuation and risksWe are continuing coverage of Superior Energy Services with a $15 price target.This is based on a 9.4x EV/ EBITDA multiple of our 2018 EBITDA estimate. Ourtarget multiple is based on a one-year forward relative (to the S&P 500) through-cycle EBITDA multiple applied to the historical average through-cycle multiple forSPN. The company is trading at 7.6x our 2018 EBITDA estimate of $359mm.
Page 288 Deutsche Bank Securities Inc.

9 October 2017
Oil Services & Equipment
Initiation of coverage
The main investment risks include: 1) shifts in OPEC policy and the influencethat would have on oil prices and ultimately US upstream capital expenditures,2) a step up in cost inflation in the US, 3) increased regulation around hydraulicfracturing, 4) geographic expansion as SPN continues to look to export keyproduct lines abroad, 5) offshore spending levels continue to remain subdued.
Figure 592: EV/ EBITDA band has blown out Figure 593: The 5yr EV/EBITDA leading up to 2014
5.0
2
4
6
8
10
12
14
16
18
20
22
Sep-07 Sep-08 Sep-09 Sep-10 Sep-11 Sep-12 Sep-13 Sep-14 Sep-15 Sep-16
-1 std 10yr avg +1 std
5.0
2
3
4
5
6
7
8
Se
p-0
7
Jan
-08
Ma
y-0
8
Se
p-0
8
Jan
-09
Ma
y-0
9
Se
p-0
9
Jan
-10
Ma
y-1
0
Se
p-1
0
Jan
-11
Ma
y-1
1
Se
p-1
1
Jan
-12
Ma
y-1
2
Se
p-1
2
Jan
-13
Ma
y-1
3
Se
p-1
3
Jan
-14
Ma
y-1
4
Se
p-1
4
-1 std 10yr avg +1 std
Source: Factset Source: Factset
Company description
Superior Energy Services is a mid-cap, global diversified provider of oilfieldservices and equipment. The company significantly changed its business profilein 2012 by exiting the liftboat business and through its acquisition of CompleteProduction Services. In its history, SPN has transitioned from a shallow waterGulf of Mexico liftboat and decommissioning player to an international diversifiedservices provider that operates in three geomarkets – US Land, Gulf of Mexico(GoM), and International.
Figure 594: Revenue mix
Drilling Products &
Services
16%
Onshore
Completion &
Workover
37%
Production
Services
33%
Technical Solutions
14%
2012Drilling Products &
Services
21%
Onshore
Completion &
Workover
36%
Production
Services
23%
Technical Solutions
20%
2016
Source: Company reports
Principal Sources and Uses of Cash Flow
The primary contributors of free cash flow during the downturn has been SPN’sDPS segment which generated $21.8mm in EBITDA in 1Q17 while its OnshoreCompletion & Workover and its Production Services segments each generatedlosses. In 2016, while DPS only accounted for 21% of total revenue, it generated$80mm in EBITDA. This segment and the more stable International business hasallowed SPN to mainly stay free cash flow positive during the downturn. SPN
Deutsche Bank Securities Inc. Page 289

9 October 2017
Oil Services & Equipment
Initiation of coverage
also suspended its dividend in 2Q16 to preserve cash and have not repurchasedshares since 2014. They have used cash to reactivate equipment and hire crewsin the early stages of the upcycle to be positioned as first responder.
Primary uses of free cash flow are working capital and capex to fund reactivationof pressure pumping assets that were stacked during the downturn and crewup the equipment. SPN has so far spent/ expensed around $30mm to reactivate200,000hp since the end of 2Q16 to the end of 1Q17. They will expense another$7-8mm to reactivate another 50,000hp. The company does not capitalize repairand maintenance costs for replacing engines, transmissions, or pumps. SPN haskept its capex spend low since the downturn started and so far in the early stagesof the recovery.
Figure 595: Consolidated EBITDA Figure 596: Earnings remain negative
0.00
200.00
400.00
600.00
800.00
1,000.00
1,200.00
1,400.00
2009 2010 2011 2012 2013 2014 2015 2016 2017 2018
(a) (a) (a) (a) (a) (a) (a) (a) (e) (e)
In m
illi
on
s o
f U
SD
(3.00)
(2.00)
(1.00)
0.00
1.00
2.00
3.00
2009 2010 2011 2012 2013 2014 2015 2016 2017 2018
(a) (a) (a) (a) (a) (a) (a) (a) (e) (e)
EPS
Source: Company reports, Deutsche Bank Source: Company reports, Deutsche Bank
Balance Sheet and FCF
SPN’s management has clearly stated its goal of paying down debt to enterthe next cycle with much lower leverage. CEO Dunlap has said that if theydecide to divest product lines that no longer fit within its core portfolio, proceedsfrom those divestitures will be used to reduce debt levels. While not giving aspecific target, Dunlap has said that it will be about finding the right balancebetween the cyclicality in US Land with its other geomarkets that stayed mostlyEBITDA positive during the downturn. Also impacting its net debt to cap ratiowas that SPN recorded a reduction in the value of its assets of $500.4mm in 2016and $1.74bn in 2015, mainly due to an impairment of goodwill in its OnshoreCompletion & Workover and Production Services segments.
SPN has just under $1.3bn in debt outstanding, consisting of two senior notes.One senior note has outstanding $500mm, matures in May 2019 with a 6 3/8%interest rate. The other has $800mm outstanding, matures in December 2021 witha 7 1/8% interest rate. The company also has a $300mm revolver with a $100mmaccordion feature. They amended the revolver in February which reduced the sizefrom $400mm but allowed SPN to suspend the interest coverage ratio covenantuntil 3Q17.
Page 290 Deutsche Bank Securities Inc.

9 October 2017
Oil Services & Equipment
Initiation of coverage
Figure 597: Free cash flow turning positive Figure 598: Net debt
(1,500)
(1,000)
(500)
0
500
1,000
1,500
2009 2010 2011 2012 2013 2014 2015 2016 2017 2018
(a) (a) (a) (a) (a) (a) (a) (a) (e) (e)
In m
illio
ns
of
US
D
Cash from operations Capital expenditures Free cash flow
0
200
400
600
800
1,000
1,200
1,400
1,600
1,800
2,000
2009 2010 2011 2012 2013 2014 2015 2016 2017 2018
(a) (a) (a) (a) (a) (a) (a) (a) (e) (e)
In m
illio
ns
of
US
D
Source: Company reports, Deutsche Bank Source: Company reports, Deutsche Bank
Deutsche Bank Securities Inc. Page 291

9 October 2017
Oil Services & Equipment
Initiation of coverage
Figure 599: Income Statement(a) (a) (a) (a) (a) (a) (a) (a) (a) (a) (e) (e)
In millions of USD 2007 2008 2009 2010 2011 2012 2013 2014 2015 2016 2017 2018
Segment revenues
Drilling Products & Services 839 924 590 310 280 290
Onshore Completion & Workover 1,597 1,728 934 524 1,020 1,228
Production Services 1,446 1,356 760 332 356 408
Technical Solutions 682 549 490 284 265 294
Total revenues 1,572 1,881 1,449 1,682 2,070 4,568 4,563 4,557 2,775 1,450 1,920 2,219
Segment gross profit
Drilling Products & Services 562 634 386 168 149 171
Onshore Completion & Workover 513 526 181 37 196 321
Production Services 434 411 172 77 61 90
Technical Solutions 237 251 216 110 107 126
Total gross profit 874 983 625 763 952 1,879 1,747 1,822 955 391 513 707
SG&A 228 283 259 343 384 663 630 624 511 351 319 348
EBITDA 646 700 366 420 569 1,216 1,117 1,197 445 40 194 359
D&A 188 176 207 221 257 509 621 651 612 510 446 473
EBIT 458 525 159 199 311 707 496 547 (167) (470) (252) (114)
Interest (expense), net (33) (47) (51) (57) (74) (118) (105) (97) (97) (93) (97) (85)
Other Income (expense) 3 23 2 (17) (24) 22 5 (8) (9) 6 0 0
PBT 428 501 110 125 213 611 396 442 (274) (556) (349) (198)
Income tax (expense) 151 191 37 43 79 225 145 161 (94) (169) (117) (69)
Net Income (operating) 277 311 73 82 134 386 250 281 (180) (387) (232) (129)
Unusual after-tax 5 41 (176) 0 9 (3) (345) (23) (1,666) (497) 0 0
Net Income GAAP 281 351 (102) 82 143 383 (94) 258 (1,845) (885) (232) (129)
Operating EPS 3.35 3.82 0.94 1.03 1.65 2.56 1.56 1.79 (1.19) (2.56) (1.53) (0.85)
GAAP EPS 3.41 4.32 (1.32) 1.03 1.76 2.54 (0.59) 1.64 (12.26) (5.84) (1.53) (0.85)
DPS 0.00 0.00 0.00 0.00 0.00 0.00 0.00 0.32 0.32 0.08 0.00 0.00
Diluted shares 82 81 78 79 81 151 160 157 150 152 152 151
Consolidated EBITDA 646 700 366 420 569 1,216 1,117 1,197 445 40 194 359
EBITDA margin 41.1% 37.2% 25.3% 25.0% 27.5% 26.6% 24.5% 26.3% 16.0% 2.8% 10.1% 16.2%
EBIT margin 29.1% 27.9% 11.0% 11.8% 15.0% 15.5% 10.9% 12.0% -6.0% -32.4% -13.2% -5.1%
Tax rate 35.4% 38.1% 33.6% 34.6% 37.1% 36.8% 36.7% 36.5% 34.5% 30.4% 33.5% 35.0%
Segment gross margins
Drilling Products & Services 67.1% 68.6% 65.4% 54.1% 53.3% 58.9%
Onshore Completion & Workover 32.1% 30.5% 19.4% 7.0% 19.2% 26.2%
Production Services 30.0% 30.3% 22.7% 23.1% 17.2% 22.0%
Technical Solutions 34.8% 45.7% 44.0% 38.7% 40.4% 42.7%
Source: Company reports, Deutsche Bank
Page 292 Deutsche Bank Securities Inc.

9 October 2017
Oil Services & Equipment
Initiation of coverage
Figure 600: Cash Flow Statement(a) (a) (a) (a) (a) (a) (a) (a) (a) (a) (e) (e)
In millions of USD 2007 2008 2009 2010 2011 2012 2013 2014 2015 2016 2017 2018
Net Income 281 351 (102) 143 16 366 (111) 258 (11) (887) (236) (129)
D&A 188 176 207 221 59 509 621 652 162 510 446 473
Deferred tax 62 104 (75) 8 (2) 11 14 (50) (5) (143) (41) (10)
Change in working capital (12) (222) (64) 61 (5) 104 (99) 141 337 (24) (117) (54)
Other 12 (6) 311 24 426 45 463 31 150 604 9 0
Cash from operations 530 402 276 456 493 1,035 888 1,033 633 61 63 280
Capital expenditures (411) (454) (286) (323) (485) (1,142) (609) (616) (358) (81) (136) (175)
Free cash flow 120 (52) (10) 133 8 (107) 279 417 274 (19) (73) 105
Acquisitions (119) (8) (1) (276) (2) (1,091) (24) (24) (46) 0 0 0
Asset sales 27 152 0 0 0 1,076 27 166 16 6 35 0
Dividends 0 0 0 0 0 0 0 (50) (48) (12) 0 0
Equity issuance, net (25) (98) 3 3 10 15 (4) (289) 9 0 0 (100)
Debt issuance, net (1) (1) 176 (3) 799 147 (168) (19) (27) (338) (25) 0
Other 11 0 (6) (13) (786) (29) (10) 5 (7) (14) (7) 0
Chg in cash 13 (7) 162 (156) 30 11 100 205 171 (376) (70) 5
FCF per share 1.45 (0.63) (0.13) 1.67 0.10 (0.71) 1.74 2.65 1.82 (0.13) (0.48) 0.69
Capex / revenue 0.26 0.24 0.20 0.19 0.23 0.25 0.13 0.14 0.13 0.06 0.07 0.08
Capex / depreciation (2.19) (2.59) (1.38) (1.46) (8.16) (2.24) (0.98) (0.94) (2.21) (0.16) (0.31) (0.37)
Source: Company reports, Deutsche Bank
Figure 601: Balance Sheet(a) (a) (a) (a) (a) (a) (a) (a) (a) (a) (e) (e)
In millions of USD 2007 2008 2009 2010 2011 2012 2013 2014 2015 2016 2017 2018
Cash and equivalents 52 45 207 51 80 91 196 393 564 188 118 122
Accounts receivable 343 360 337 452 541 1,027 937 927 429 297 452 510
Prepaid expenses 20 18 20 26 34 93 70 75 42 37 43 43
Inventory & other current assets 56 224 300 235 228 249 273 334 260 260 223 257
Total current assets 471 647 864 764 883 1,460 1,476 1,729 1,295 782 835 933
Net PP&E 878 1,115 1,059 1,313 1,507 3,255 3,002 2,734 2,123 1,605 1,296 998
Goodwill 485 478 482 588 581 2,532 2,458 2,468 1,140 804 804 804
Other assets 423 250 112 242 1,076 555 475 446 356 279 248 248
Total assets 2,257 2,490 2,517 2,908 4,048 7,803 7,411 7,377 4,914 3,470 3,184 2,983
Accounts payable 70 87 63 110 179 252 216 225 114 95 108 129
Current debt 1 1 1 185 1 20 20 21 30 0 0 0
Other current liabilities 222 210 164 211 214 500 403 466 304 250 245 264
Total current liabilities 292 298 228 506 394 772 639 712 449 345 354 392
Long-term debt 711 654 849 682 1,685 1,815 1,647 1,628 1,588 1,285 1,261 1,261
Other LT liabilities 273 283 262 439 516 985 994 958 667 537 500 264
Shareholders' equity 981 1,254 1,178 1,281 1,454 4,231 4,131 4,080 2,211 1,304 1,069 1,137
Total liabilities and equity 2,257 2,490 2,517 2,908 4,048 7,803 7,411 7,377 4,914 3,470 3,184 3,055
Total debt 712 655 849 866 1,686 1,835 1,667 1,649 1,618 1,285 1,261 1,261
Net debt 660 610 643 816 1,606 1,743 1,470 1,256 1,054 1,097 1,144 1,139
Debt/capital 42% 34% 42% 40% 54% 30% 29% 29% 42% 50% 54% 53%
Debt/equity 73% 52% 72% 68% 116% 43% 40% 40% 73% 99% 118% 111%
Debt turns 1.1 0.9 2.3 2.1 3.0 1.5 1.5 1.4 3.6 32.0 6.5 3.5
Source: Company reports, Deutsche Bank
Deutsche Bank Securities Inc. Page 293

9 October 2017
Oil Services & Equipment
Initiation of coverage
Rating
BuyNorth AmericaUnited States
IndustrialsOil Services & Equipment
Company
Transocean
Reuters Bloomberg
RIG.N RIG US
Industry Leading Backlog with GoodCash PreservationInitiating coverage with a Buy rating and an $13 price targetThis is the most challenging market environment ever experienced in thedeepwater with a supply demand imbalance that is prompting fiercelycompetitive pricing tactics in an otherwise laboriously slow recovery in ourview. But we believe the alpha short is gone for the offshore drillers, and withRIG specifically, the company’s fleet is well positioned competitively and ithas preserved cash well to allow it to opportunistically take advantage of theprotracted downturn. With its $10 billion in backlog and $4.1 billion of backlogforthcoming from the Songa Offshore acquisition, Transocean presents the bestsetup in an otherwise difficult offshore drilling landscape.
$10 billion in backlog with the Songa deal bringing another $4.1 billion
Valuation & RisksWe are initiating coverage of Transoceanwith a $13 price target. This is 5.0xour estimate of the company’s normalizedEBITDA of $1.8 billion, which is one-turnbelow the 6.0x five-year average multiple of6.0x. The company is currently trading at8.3x our fiscal 2018 EBITDA estimate of $1.0billion. We believe the discounted multipleis warranted due to the severely diminishedearnings power of the company and thesignificant challenges that lie ahead for theindustry in terms of utilization and pricingpower as the deepwater market copes withthe historic supply demand imbalance.The main investment risks include: 1) shiftsin OPEC policy and the influence thatwould have on oil prices and ultimately USupstream capital expenditures, 2) negativerevisions to global oil demand, 3) moreM&A with Transocean as the suitor, and 4)increased flow of capex directed away fromthe offshore and toward onshore operations.Upside risks are mainly associated witha rapid rise in oil prices, which wouldprompt the firmly entrenched sentiment inthe offshore drilling names to pivot in ourview.
The Songa deal will bring another $0.4 billion in annual EBITDA and $4.1 billionin backlog. The deal is expected to close in 4Q17. We expect Transocean willcontinue to seek more transactions to build on its scale.
Cash obligations are minimal through 2019, staying free cash flow positiveTransocean has been free cash flow positive each year except one since 2007,despite the most severe deepwater downturn in history. Debt obligations are lessthan $0.5 billion in 2018 and 2019 combined with capex less than $200 millioneach year until 2020 when it jumps to $1 billion for the completion of its tworemaining newbuilds.
Forecasts and ratios
Year End Dec 31 2016A 2017E 2018E
1Q EPS 0.24 0.01A -0.18
2Q EPS 0.17 0.00A -0.21
3Q EPS 0.25 0.02 -0.25
4Q EPS 0.24 0.00 -0.31
FY EPS (USD) 0.91 0.03 -0.94
OLD FY EPS (USD) 0.83 – –
% Change 9.0% – –
P/E (x) 11.8 313.3 –
DPS (USD) 0.00 0.00 0.00
Dividend Yield (%) 0.0 0.0 0.0
Revenue (USDm) 3,783.0 2,992.0 2,608.5Source: Deutsche Bank estimates, company data
David HavensResearch [email protected]
Price at 5 Oct 2017 (USD) 10.54
Price target 13.00
52-week range 15.84 - 7.28
Price/price relative
Transocean S&P 500 INDEX (Rebased)
Jan '15 May '15 Sep '15 Jan '16 May '16 Sep '16 Jan '17 May '17 Sep '175
10
15
20
25
30
35
40
45
Performance(%)
1m 3m 12m
Absolute 20.2 18.7 8.1
S&P 500INDEX
2.5 4.5 18.0
Source: Deutsche Bank
Stock & option liquidity data
Market Cap (USDm) 4,118.5
Shares outstanding (m) 390.8
Free float (%) 100
Volume (5 Oct 2017) 2,620,336
Option volume (und. shrs., 1M avg.) 1,492,477Source: Deutsche Bank
Page 294 Deutsche Bank Securities Inc.

9 October 2017
Oil Services & Equipment
Initiation of coverage
Key investment themes
Songa Offshore acquisition will add 40% to backlogBefore accounting for the Songa Offshore transaction, Transocean has $9.7 billionof backlog concentrated largely with two customers, Shell (70%) and Chevron(16%). Pro-forma the deal, Statoil becomes the second largest customer (31%)after Shell (50%) followed by Chevron (11%). The average dayrate across SongaOffshore’s fleet of four working harsh environment semis is about $475 kpdversus less than $300 kpd for Transocean’s harsh environment segment.
Figure 602: Backlog by customer
-
1.0
2.0
3.0
4.0
5.0
6.0
7.0
8.0
RD
S
CV
X
PB
R
En
q
ST
O
ON
GC
SU BP
HSE
Fa
irfi
eld
BH
P
Qu
ad
Mg
mt
Wo
od
sid
e
TB
A
Contribution from Songa
acquisition
Source: Company reports, Deutsche Bank
The deal adds about $0.7 billion of revenues each year through 2022, which is a50% increase to Transocean’s 2019 revenues from backlog and a 70% increaseto 2020 revenues from backlog.
Figure 603: Revenues in backlog Figure 604: Year-end backlog
0
500
1,000
1,500
2,000
2,500
3,000
2017 2018 2019 2020 2021
In m
illi
on
s o
f U
SD
Ultra-deepwater Deepwater Harsh-environment
Midwater Jackups Songa
Revenue additions
from Songa
0
2,000
4,000
6,000
8,000
10,000
12,000
14,000
2017 2018 2019 2020 2021
In m
illi
on
s o
f U
SD
Ultra-deepwater Deepwater Harsh-environment
Midwater Jackups Songa
Backlog additions from
Songa transaction
Source: Company reports, Deutsche Bank Source: Company reports, Deutsche Bank
Deutsche Bank Securities Inc. Page 295

9 October 2017
Oil Services & Equipment
Initiation of coverage
Transocean acquiring Songa Offshore for a total consideration of $3.4 billionTransocean announced it has an agreement to acquire Songa Offshore for atotal consideration of $3.4 billion, which includes $1.7 billion of net debt. RIGis paying a 37% premium to Songa Offshore’s (SONG-OSL) pre-announcementclosing price and is getting four high-specification, harsh-environment semis withapproximately $4.1 billion of backlog. Songa also has three other semis that arestacked, which we would classify as none core to Transocean in the long-run.
All seven of the Songa’s semis are in Norway, with the four contracted unitsall with Statoil at an average daily rate of $475 kpd. These four units are 6thgeneration semis with long-term contracts that extend as far as 2024.
To fund the purchase price, RIG will issue $540 million of equity, $660 millionof convertible bonds, and use $480 million of cash. RIG expects $40 million ofsynergies.
Transocean is paying 8.3x Songa Offshore’s 2018 consensus EBITDA of $412million, in-line with where Transocean is trading on its 2018 consensus of $974million.
RIG preserved cash well during these extraordinarily challenging marketsIn the ten years leading into 2017, Transocean generated cumulative free cashflow of over $13 billion and we expect from 2017 through 2019 it will generateanother $0.9 billion in free cash. The company has about $1 billion of capital callsin 2020 related to its two uncommitted newbuild drillships, which will draw cashbalances down to about $1 billion by year-end 2020 without any withdraws fromits credit facility. This is a far cry from where the consensus pegged its fiscalstability two years ago.
Page 296 Deutsche Bank Securities Inc.

9 October 2017
Oil Services & Equipment
Initiation of coverage
Figure 605: Transocean backlog details (excluding Songa Offshore)
Revenue in backlog ($m) 2017 2018 2019 2020 2021 Total backlog Abbrev ($bn)
Ultra-deepwater 434 1,320 1,267 1,003 948 Ultra-deepwater UDW 8.8
Deepwater 39 121 0 0 0 Deepwater DW 0.2
Harsh-environment 150 348 37 0 0 Harsh-environment HE 0.5
Midwater 29 73 15 0 0 Midwater MW 0.1
Jackups 28 57 0 0 0 Jackups JU 0.1
Total backlog 680 1,918 1,319 1,003 948 Total backlog 9.7
2,011 52%
Days committed 2017 2018 2019 2020 2021
Ultra-deepwater 38% 27% 24% 18% 17%
Deepwater 100% 81% 0% 0% 0%
Harsh-environment 81% 46% 5% 0% 0%
Midwater 50% 37% 10% 0% 0%
Jackups 100% 54% 0% 0% 0%
Total backlog 53% 35% 17% 12% 11%
Year-end backlog ($m) 2017 2018 2019 2020 2021
Ultra-deepwater 8,383 7,063 5,796 4,793 3,845
Deepwater 121 0 0 0 0
Harsh-environment 385 37 0 0 0
Midwater 88 15 0 0 0 2017 2018 2019
Jackups 57 0 0 0 0 Total debt 7,148 6,717 6,689
Total backlog 9,034 7,116 5,796 4,793 3,845 Debt / YE backlog 0.8 0.9 1.2
Backlog by customer ($m) #1 #2 #3 #4 #5 Top 5 customers in backlog Percent $bn
Ultra-deepwater RDS CVX PBR BP BHP RDS #1 70% 6.8
Backlog 6,831 1,473 365 55 38 CVX #2 16% 1.6
% of backlog 77% 17% 4% 1% 0% PBR #3 5% 0.5
Deepwater PBR ONGC BHP BP Bunduq Enq #4 2% 0.2
Backlog 109 51 - - - STO #5 1% 0.1
% of backlog 68% 32% 0% 0% 0% Other 5% 0.5
Harsh-environment Enq STO SU HSE Mgmt
Backlog 184 140 100 68 27 09/26/17 12/31/17 12/31/18 12/31/19
% of backlog 34% 26% 19% 13% 5% Fleet composition 2017 2018 2019
Midwater ONGC Fairfield BHP BP Bunduq Ultra-deepwater 25 27 28
Backlog 62 55 - - - Deepwater 2 2 2
% of backlog 53% 47% 0% 0% 0% Harsh-environment 7 7 7
Jackups CVX BHP BP Bunduq CNR Midwater 4 4 4
Backlog 84 - - - - Jackups 2 2 2
% of backlog 100% 0% 0% 0% 0% Total in fleet 40 42 43
Backlog by rig type
UDW
DW
HE
MW
JU
Source: Company reports, Deutsche Bank
Deutsche Bank Securities Inc. Page 297

9 October 2017
Oil Services & Equipment
Initiation of coverage
Valuation and risksWe are initiating coverage of Transocean with an $13 price target. This is 5.0xour estimate of the company’s normalized EBITDA of $1.8 billion, which is one-turn below the 6.0x five-year average multiple of 6.0x. The company is currentlytrading at 8.3x our fiscal 2018 EBITDA estimate of $1 billion. We believe thediscounted multiple is warranted due to the severely diminished earnings powerof the company and the significant challenges that lie ahead for the industry interms of utilization and pricing power as the deepwater market copes with thehistoric supply demand imbalance.
In terms of steel value, we assess the trough net asset value at $4.35 per share,which assumes the market endures another three years of high volumes ofcold-stacking once contracts expire and leading edge market rates that stay atbreakeven levels ($160-170 kpd).
The main investment risks include: 1) shifts in OPEC policy and the influencethat would have on oil prices and ultimately US upstream capital expenditures,2) negative revisions to global oil demand, 3) more M&A with Transocean asthe suitor, and 4) increased flow of capex directed away from the offshore andtoward onshore operations. Upside risks are mainly associated with a rapid risein oil prices, which would prompt the firmly entrenched sentiment in the offshoredrilling names to pivot in our view.
Figure 606: The EV/EBITDA valuation band as blown out Figure 607: The 5yr EV/EBITDA leading up to 2014
-
2
4
6
8
10
12
-1 std 10yr avg +1 std
6.3
3
4
5
6
7
8
9
10
Se
p-0
7
Jan
-08
Ma
y-0
8
Se
p-0
8
Jan
-09
Ma
y-0
9
Se
p-0
9
Jan
-10
Ma
y-1
0
Se
p-1
0
Jan
-11
Ma
y-1
1
Se
p-1
1
Jan
-12
Ma
y-1
2
Se
p-1
2
Jan
-13
Ma
y-1
3
Se
p-1
3
Jan
-14
Ma
y-1
4
Se
p-1
4
-1 std 10yr avg +1 std
Source: Factset Source: Factset
Page 298 Deutsche Bank Securities Inc.

9 October 2017
Oil Services & Equipment
Initiation of coverage
Company description
Transocean (RIG) is a contract drilling company with a fleet of 42 mobileoffshore drilling rigs including 29 ultra-deepwater floaters (four are currentlyunder construction), seven harsh environment floaters, two deepwater floaters,and four midwater floaters. Until recently, the company had 15 jackups, whichwere sold to Borr Drilling for a total consideration of $1.35 billion. The companyalso recently announced the planned acquisition of Songa Offshore for a totalconsideration of $3.4 billion. Songa Offshore has seven semis in Norway includingfour active harsh environment semis with a backlog of $4.1 billion..
Figure 608: Revenues by rig type
UDW
19%
DW
11%
HE
5%
MW
22%
JU, other
27%
Reimbursables
2%
Other
14%
2008
UDW
61%
DW
6%
HE
13%
MW
10%
JU, other
8%
Reimbursables
1% Other
1%
2016
Note: UDW = ultra-deepwater, DW = deepwater, HE = harsh environment, MW = midwater, JU = jackup.
Source: Company reports, Deutsche Bank
Figure 609: Change in fleet size and mix (excludes Songa Offshore)
0
20
40
60
80
100
120
140
160
2007 2008 2009 2010 2011 2012 2013 2014 2015 2016 2017
Ultra-deepwater Deepwater Harsh-environment
Midwater floaters High-spec jackups Standard jackups
Source: Company reports
Deutsche Bank Securities Inc. Page 299

9 October 2017
Oil Services & Equipment
Initiation of coverage
Principal Sources and Uses of Cash Flow
Executing a strategy to be top ultra-deep and harsh environment drillerThe ultra-deepwater (UDW) segment is Transocean’s largest and accounted for60% of 2016 revenues. RIG has invested heavily in the UDW, totaling $13 billionfrom 2007 through 2020 when the company currently plans to take delivery ofits last remaining two drillships. The company delivered 14 UDW rigs as part ofthis program to-date with another two fully contracted units coming online in thecoming six months.
Figure 610: RIG’s ultra-deepwater newbuild capex since 2007 totals $13billion
-
500
1,000
1,500
2,000
2,500
(a) (a) (a) (a) (a) (a) (a) (a) (a) (a) (e) (e) (e) (e)
2007 2008 2009 2010 2011 2012 2013 2014 2015 2016 2017 2018 2019 2020
In m
illio
ns
of
USD
Source: Company reports, Deutsche Bank
The deepwater (DW) segment has seen its share of the company revenues fallconsiderably during the downturn and accounted for just 6% of overall revenue in2016. The segment includes many 5th generation floaters which have a difficulttime competing as they do not carry the same efficiency as the newest (6th)generation units, yet are more expensive to operate than the older, midwaterunits. RIG elected to retire a number of DW rigs during the downturn as theycould not compete with more capable units that were also available.
The harsh environment segment has proved very resilient during the downturnand accounted for 13% of 2016 revenues. The harsh environment has some ofthe best market trends in the offshore sector in our view and is the least over-supplied among all the offshore drilling segments.
The midwater segment has been hit the hardest during the downturn. Themidwater fleet includes five of the company’s oldest rigs, two of which arecurrently cold-stacked. RIG elected to scrap a number of midwater rigs as theseunits are older and not viable assets going forward.
Page 300 Deutsche Bank Securities Inc.

9 October 2017
Oil Services & Equipment
Initiation of coverage
Figure 611: Segment EBITDA peaked in 2008
0
1,000
2,000
3,000
4,000
5,000
6,000
7,000
8,000
2007 2008 2009 2010 2011 2012 2013 2014 2015 2016 2017 2018 2019
(a) (a) (a) (a) (a) (a) (a) (a) (a) (a) (e) (e) (e)
In m
illi
on
s o
f U
SD
Total high-spec floaters Midwater floaters Jackups, other
Source: Company reports, Deutsche Bank
Transocean’s high water mark was in 2008 when it posted about $7 billion ofEBITDA. We estimate its earnings power has eroded to about $2 billion assumingultra-deepwater rigs regain about $300 kpd of dayrate in 2020 and beyond. Pro-forma for the Songa Offshore deal, we estimate its power to be about $2.4 billionof EBITDA.
Figure 612: Free cash flow and dividends Figure 613: Capex trend
(1,500)
(1,000)
(500)
0
500
1,000
1,500
2,000
2,500
3,000
2007 2008 2009 2010 2011 2012 2013 2014 2015 2016 2017 2018 2019
(a) (a) (a) (a) (a) (a) (a) (a) (a) (a) (e) (e) (e)
In m
illi
on
s o
f U
SD
Free cash flow Dividends paid
0
500
1,000
1,500
2,000
2,500
3,000
3,500
2007 2008 2009 2010 2011 2012 2013 2014 2015 2016 2017 2018 2019
(a) (a) (a) (a) (a) (a) (a) (a) (a) (a) (e) (e) (e)
In m
illio
ns
of
USD
Capital expenditures Depreciation
Source: Company reports, Deutsche Bank Source: Company reports, Deutsche Bank
Deutsche Bank Securities Inc. Page 301

9 October 2017
Oil Services & Equipment
Initiation of coverage
Figure 614: Debt turns Figure 615: Net debt
0.0
2.0
4.0
6.0
8.0
10.0
12.0
2007 2008 2009 2010 2011 2012 2013 2014 2015 2016 2017 2018 2019
(a) (a) (a) (a) (a) (a) (a) (a) (a) (a) (e) (e) (e)
De
bt
turn
s
0
2,000
4,000
6,000
8,000
10,000
12,000
14,000
16,000
18,000
2007 2008 2009 2010 2011 2012 2013 2014 2015 2016 2017 2018 2019
(a) (a) (a) (a) (a) (a) (a) (a) (a) (a) (e) (e) (e)
In m
illi
on
s o
f U
SD
Source: Company reports, Deutsche Bank Source: Company reports, Deutsche Bank
Figure 616: EPS trend
(4.00)
(2.00)
0.00
2.00
4.00
6.00
8.00
10.00
12.00
14.00
16.00
2007 2008 2009 2010 2011 2012 2013 2014 2015 2016 2017 2018 2019
(a) (a) (a) (a) (a) (a) (a) (a) (a) (a) (e) (e) (e)
EPS
Source: Company reports, Deutsche Bank
Page 302 Deutsche Bank Securities Inc.

9 October 2017
Oil Services & Equipment
Initiation of coverage
Figure 617: Fleet profile
Rig name
Water
depth (ft) Rig type
Year in
service Rig design
Backlog
(yrs)
Backlog
($m)
Ultra-deepwater (34):
Deepwater Asgard 12,000 DS-DP 2014 Daewoo (DSME) 12000 - -
Deepwater Invictus 12,000 DS-DP 2014 Daewoo (DSME) 12000 0.2 38.5
Deepwater Pontus 12,000 DS-DP 2017 Daewoo (DSME) 12000 10.0 1,895.4
Deepwater Poseidon 12,000 DS-DP 2017 Daewoo (DSME) 12000 10.0 1,894.4
Deepwater Proteus 12,000 DS-DP 2016 Daewoo (DSME) 12000 8.7 1,540.1
Deepwater Thalassa 12,000 DS-DP 2016 Daewoo (DSME) 12000 8.4 1,501.6
Deepwater Conqueror 12,000 DS-DP 2016 Daewoo (DSME) 12000 4.3 912.4
Transocean Drsh Tbn1 12,000 DS-DP 2020 Jurong Shipyard Limited Jurong Espadon III - -
Transocean Drsh Tbn2 12,000 DS-DP 2020 Jurong Shipyard Limited Jurong Espadon III - -
Discoverer Americas 12,000 DS-DP 2009 Transocean Enhanced Enterprise Class - -
Deepwater Champion 12,000 DS-DP 2010 GustoMSC P10000 - -
Discoverer Clear Leader 12,000 DS-DP 2009 Transocean Enhanced Enterprise Class 0.2 37.4
Discoverer Inspiration 12,000 DS-DP 2009 Transocean Enhanced Enterprise Class 2.5 523.6
Dhirubhai Deepwater KG 12,000 DS-DP 2009 Samsung/Saipem Saipem 10000 0.3 39.8
Dhirubhai Deepwater KG 12,000 DS-DP 2009 Samsung/Saipem Saipem 10000 0.3 24.0
Discoverer India 12,000 DS-DP 2010 Transocean Enhanced Enterprise Class - -
Petrobras 10000 12,000 DS-DP 2009 Samsung 10000 1.9 325.1
Discoverer Deep Seas 10,000 DS-DP 2001 Transocean Offshore Discoverer Class Enhanced - -
Discoverer Enterprise 10,000 DS-DP 1999 Transocean Offshore Discoverer Class Enhanced - -
Discoverer Spirit 10,000 DS-DP 2000 Transocean Offshore Discoverer Class Enhanced - -
GSF C.R. Luigs 10,000 DS-DP 2000 Global Marine Glomar 456 Class - -
GSF Jack Ryan 10,000 DS-DP 2000 Global Marine Glomar 456 Class
Deepwater Discovery 10,000 DS-DP 2000 Samsung/Reading & Bates Deepwater Pathfinder - -
Deepwater Frontier 10,000 DS-DP 1999 Samsung/Reading & Bates Deepwater Pathfinder - -
Deepwater Millennium 10,000 DS-DP 1999 Samsung/Reading & Bates Deepwater Pathfinder - -
Deepwater Pathfinder 10,000 DS-DP 1998 Samsung/Reading & Bates Deepwater Pathfinder
Cajun Express 8,500 5th 2001 Sedco Forex SFXpress 2000
Deepwater Nautilus 8,000 5th 2000 Reading & Bates RBS-8M - -
Discoverer Luanda 7,500 DS-DP 2010 Transocean Enhanced Enterprise Class 0.3 54.7
GSF Development Drille 7,500 6th 2005 Friede & Goldman ExD 0.9 29.8
GSF Development Drille 7,500 6th 2005 Friede & Goldman ExD - -
Development Driller III 7,500 6th 2009 KFELS/MSC DSS 51 0.0 0.7
Sedco Energy 7,500 5th 2001 Sedco Forex SFXpress 2000
Sedco Express 7,500 5th 2001 Sedco Forex SFXpress 2000
Deepwater (3):
Transocean Marianas 7,000 4th 1998 Earl & Wright/Sedco 700 Series Enhanced
Sedco 706 6,562 2nd 1976 Earl & Wright/Sedco 700 Series 1.1 109.2
Jack Bates 5,400 4th 1986 Friede & Goldman L-1020 Trendsetter 1.1 50.8
Harsh-Environment (7):
Transocean Barents 10,000 6th 2009 Aker H-6e 1.1 99.8
Transocean Spitsbergen 10,000 6th 2010 Aker H-6e 1.1 140.0
Henry Goodrich 2,000 4th 1985 Mitsui/Sonat SES-5000 0.7 67.9
Transocean Leader 4,500 4th 1987 Aker H-4.2 1.6 184.0
Paul B. Loyd, Jr. 2,000 4th 1987 Aker H-4.2 0.2 16.3
Transocean Arctic 1,640 4th 1986 Marotec/Ross Marosso 56 0.4 27.1
Polar Pioneer 1,476 4th 1985 Sonat Offshore/Hitachi - -
Midwater (4):
Sedco 711 1,800 3rd 1982 Earl & Wright/Sedco 711 Series - -
Sedco 712 1,600 3rd 1983 Earl & Wright/Sedco 711 Series 0.8 55.4
Sedco 714 1,600 3rd 1983 Earl & Wright/Sedco 711 Series - -
Actinia 1,500 3rd 1982 Friede & Goldman L-1033 Enhanced Pacesetter 1.7 61.8
Retired in Sep-17
Retired in Sep-17
Retired in Sep-17
Retired in Sep-17
Retired in Sep-17
Retired in Sep-17
Source: Company reports, Deutsche Bank
Deutsche Bank Securities Inc. Page 303

9 October 2017
Oil Services & Equipment
Initiation of coverage
Figure 618: Income Statement(a) (a) (a) (a) (a) (a) (a) (a) (e) (e) (e)
In millions of USD 2009 2010 2011 2012 2013 2014 2015 2016 2017 2018 2019
Segment revenues:
Ultra-deepwater 2,997 3,170 3,945 4,644 4,523 4,496 3,366 2,317 1,958 1,760 1,756
Deepwater 1,731 1,461 974 1,145 1,143 1,021 644 214 143 127 73
Harsh-environment 613 675 806 986 1,150 1,099 891 484 519 490 379
Total high-spec floaters 5,341 5,306 5,725 6,775 6,816 6,616 4,901 3,015 2,620 2,377 2,208
Midwater 2,507 2,092 1,461 1,572 1,658 1,722 1,359 388 83 85 67
Jackups, other 2,758 1,569 1,149 800 582 598 526 288 164 81 58
Reimbursables 193 152 161 175 168 173 138 60 28 25 23
Other revenue 757 457 646 350 260 65 95 32 97 40 40
Total revenue 11,556 9,576 9,142 9,672 9,484 9,174 7,019 3,783 2,992 2,608 2,396
Segment EBITDA:
Ultra-deepwater - - 2,011 2,870 2,450 2,483 1,657 1,412 1,227 823 779
Deepwater - - 186 368 392 474 335 80 65 57 4
Harsh-environment - - 464 398 690 492 459 249 262 245 133
Total high-spec floaters 3,438 2,930 2,660 3,636 3,532 3,449 2,451 1,741 1,555 1,125 917
Midwater floaters 1,562 1,283 632 705 657 786 862 217 31 38 19
Jackups, other 1,774 847 291 130 220 278 298 153 98 45 21
Drilling and non-drilling (250) (439) (317) (594) (596) (449) (334) (240) (74) (160) (168)
Corporate (194) (240) (271) (281) (276) (238) (176) (160) (154) (160) (160)
EBITDA 6,330 4,381 2,995 3,597 3,538 3,826 3,100 1,711 1,455 888 629
D&A 1,464 1,568 1,449 1,254 1,109 1,139 963 893 855 794 768
EBIT 4,866 2,813 1,546 2,343 2,429 2,687 2,137 818 600 94 (139)
Interest (expense) (484) (567) (621) (723) (584) (483) (432) (409) (511) (530) (583)
Interest income 5 23 44 56 52 39 22 20 27 25 27
Equity income 0 0 0 0 0 0 0 0 0 0 0
Other income (19) 14 (9) (40) (26) (6) 26 37 (3) (8) (8)
PBT 4,368 2,283 960 1,636 1,871 2,237 1,753 466 112 (419) (703)
Income tax (expense) (699) (327) (385) (306) (383) (406) (300) (86) (84) 50 84
Non-controlling interest 11 (27) (93) (21) 0 (21) (35) (46) (15) 0 0
Preferred dividends 0 0 0 0 0 0 0 0 0 0 0
Net income (operating) 3,680 1,929 481 1,309 1,488 1,810 1,418 333 13 (369) (619)
Discontinued ops 0 0 141 (863) 1 (20) 2 0 0 0 0
Unusual after-tax (499) (969) (6,347) (633) (84) (3,703) (629) 447 (1,604) 0 0
Net income (GAAP) 3,181 960 (5,725) (188) 1,404 (1,913) 792 781 (1,591) (369) (619)
Operating EPS 11.40 6.00 1.49 3.68 4.11 4.98 3.88 0.91 0.03 (0.94) (1.58)
GAAP EPS 9.85 2.97 (17.77) (0.53) 3.88 (5.31) 2.15 2.12 (4.07) (0.94) (1.58)
DPS 0.00 0.00 2.36 0.79 1.68 2.81 1.05 0.00 0.00 0.00 0.00
Diluted shares 321 320 322 356 361 362 364 368 391 391 391
EBITDA margin 54.8% 45.7% 32.8% 37.2% 37.3% 41.7% 44.2% 45.2% 48.6% 34.0% 26.2%
EBIT margin 42.1% 29.4% 16.9% 24.2% 25.6% 29.3% 30.4% 21.6% 20.1% 3.6% -5.8%
Tax rate 16.0% 14.3% 40.2% 18.7% 20.5% 18.1% 17.1% 18.6% 74.9% 12.0% 12.0%
Utilization:
Ultra-deepwater 92% 79% 80% 89% 92% 82% 66% 45% 44% 57% 60%
Deepwater 86% 65% 44% 58% 68% 62% 73% 54% 80% 97% 95%
Harsh-environment 89% 92% 88% 85% 100% 85% 64% 58% 76% 83% 82%
Midwater floaters 79% 69% 56% 61% 61% 64% 77% 42% 37% 49% 48%
Dayrates:
Ultra-deepwater 463 457 500 525 500 539 514 492 446 311 297
Deepwater 345 385 362 356 353 378 354 254 196 179 106
Harsh-environment 378 402 436 450 452 507 543 329 269 230 182
Midwater floaters 323 320 299 278 311 347 349 274 123 120 96
Source: Deutsche Bank
Page 304 Deutsche Bank Securities Inc.

9 October 2017
Oil Services & Equipment
Initiation of coverage
Figure 619: Cash Flow Statement(a) (a) (a) (a) (a) (a) (a) (a) (e) (e) (e) (e)
In millions of USD 2009 2010 2011 2012 2013 2014 2015 2016 2017 2018 2019 2020
Net income 3,680 1,929 481 1,309 1,488 1,810 1,418 333 13 (369) (619) (865)
Depreciation 1,464 1,568 1,449 1,254 1,109 1,139 963 893 855 794 768 768
Deferred tax 13 (145) (31) (133) (9) (142) (78) 68 (39) 0 0 0
Chg in receivables 504 386 (174) (139) 58 97 741 481 336 123 31 32
Chg in inventories 0 0 0 0 0 (50) 183 74 75 42 72 69
Chg in payables (60) 227 978 931 (625) (147) (336) (242) (26) 22 6 0
Other (3) (19) (918) (514) (103) (487) 554 304 (214) (98) 9 5
Cash from operations 5,598 3,946 1,785 2,708 1,918 2,220 3,445 1,911 1,001 514 266 9
Capital expenditures (3,052) (1,411) (1,020) (1,409) (2,238) (2,165) (2,001) (1,344) (533) (165) (190) (1,072)
Free cash flow 2,546 2,535 765 1,299 (320) 55 1,444 567 468 349 76 (1,063)
Acquisitions 0 0 (1,246) 0 0 0 0 0 0 0 0 0
Asset sales 18 60 461 980 378 250 54 30 329 0 0 0
Dividends paid 0 0 (763) (278) (606) (1,018) (381) 0 0 0 0 0
ESPP | options 19 0 0 0 0 0 0 0 0 0 0 0
Equity issuance, net 0 (240) 1,211 0 0 0 0 0 0 0 0 0
Debt issuance, net (2,739) (704) 442 (1,049) (1,692) (539) (1,506) 106 (1,372) (431) (28) (327)
Other 28 575 (247) 165 349 644 93 10 512 0 0 0
Chg in cash (128) 2,226 623 1,117 (1,891) (608) (296) 713 (63) (82) 48 (1,390)
FCF per share 7.93 7.92 2.37 3.65 (0.89) 0.15 3.97 1.54 1.20 0.89 0.20 (2.72)
Capex / revenue 0.26 0.15 0.11 0.15 0.24 0.24 0.29 0.36 0.18 0.06 0.08 0.49
Capex / depreciation 2.08 0.90 0.70 1.12 2.02 1.90 2.08 1.51 0.62 0.21 0.25 1.40
Source: Deutsche Bank
Deutsche Bank Securities Inc. Page 305

9 October 2017
Oil Services & Equipment
Initiation of coverage
Figure 620: Balance Sheet(a) (a) (a) (a) (a) (a) (a) (a) (e) (e) (e)
In millions of USD 2009 2010 2011 2012 2013 2014 2015 2016 2017 2018 2019
Cash and equivalents 1,168 3,394 4,017 5,134 3,243 2,635 2,339 3,052 2,989 2,907 2,955
Accounts receivable 2,385 2,000 2,176 2,200 2,112 2,120 1,379 898 562 440 409
Inventories 462 517 529 610 743 818 635 561 486 444 373
Deferred taxes 104 115 142 142 151 161 0 0 0 0 0
Other current assets 357 169 672 561 523 267 432 587 131 114 106
Total current assets 4,476 6,195 7,536 8,647 6,772 6,001 4,785 5,098 4,169 3,904 3,843
Net PP&E 23,018 21,458 20,788 20,880 21,707 21,538 20,818 21,093 18,771 18,142 17,564
Goodwill 8,134 8,132 3,217 2,987 2,987 0 0 0 0 0 0
Other assets 808 1,026 3,491 1,741 1,080 874 726 698 632 547 509
Total assets 36,436 36,811 35,032 34,255 32,546 28,413 26,329 26,889 23,572 22,593 21,916
Accounts payable 780 847 880 1,047 1,106 784 448 206 180 202 208
Accrued expenses 240 116 86 116 53 131 82 95 66 57 53
Current debt 1,868 2,012 2,187 1,367 323 1,033 1,093 724 713 310 609
Other current liabilities 730 861 2,375 2,933 2,072 1,822 1,046 960 720 622 579
Total current liabilities 3,618 3,836 5,528 5,463 3,554 3,770 2,669 1,985 1,679 1,192 1,449
Long-term debt 9,849 9,209 11,349 11,092 10,379 9,059 7,397 7,740 6,435 6,407 6,080
Deferred taxes 726 594 487 366 374 237 339 178 155 155 155
Other LT liabilities 1,684 1,772 1,925 1,604 1,554 1,354 1,108 1,153 1,014 877 816
Non-controlling int 7 8 106 (15) (6) 311 310 3 4 4 4
Shareholders' equity 20,552 21,392 15,637 15,745 16,691 13,682 14,506 15,830 14,286 13,959 13,411
Total liabilities and equity 36,436 36,811 35,032 34,255 32,546 28,413 26,329 26,889 23,572 22,593 21,916
Total debt 11,717 11,221 13,536 12,459 10,702 10,092 8,490 8,464 7,148 6,717 6,689
Net debt 10,549 7,827 9,519 7,325 7,459 7,457 6,151 5,412 4,159 3,810 3,733
Debt/capital 36% 34% 46% 44% 39% 42% 37% 35% 33% 32% 33%
Debt/equity 57% 52% 87% 79% 64% 74% 59% 53% 50% 48% 50%
Debt turns 1.9 2.6 4.5 3.5 3.0 2.6 2.7 4.9 4.9 7.6 10.6
Source: Deutsche Bank
Page 306 Deutsche Bank Securities Inc.

9 October 2017
Oil Services & Equipment
Initiation of coverage
Rating
BuyNorth AmericaUnited States
IndustrialsOil Services & Equipment
Company
WeatherfordInternational
Reuters Bloomberg
WFT.N WFT US
New CEO, New Process and CultureInitiating coverage with a Buy rating and a $6 price target
The change in leadership, the acknowledgement of systematic problems, andthe plan to fix them offer idiosyncratic upside as most of the oilfield faces offwith the macro uncertainties. The call on WFT has always been more complexthan earnings growth and near-term credit concerns. There has been a systematicissue at WFT dating into the late 1990s as it gobbled up acquisition targetsin pursuit of growth, but with disregard for process and efficiency. As CEOMark McCollum completes his strategic review, we expect a new discipline thatwill elevate WFT from last among 30 oilfield service companies in terms ofcash conversion, which should deliver positive free cash flow and reduce creditconcerns. While we see a path to getting there, the interim risks to capital raisesversus asset sales is still high.
Weatherford can pivot its history of negative free cash flowWhile companies with meaningful international exposure tend to have lower cashconversions (CFO/EBITDA), WFT has ranked dead last over the last ten yearsversus 30 other oilfield service companies. WFT averaged just $0.31 of cashflow from operations for every dollar of EBITDA, which was less than half thatof Halliburton ($0.67) and almost two-thirds less than Schlumberger ($0.78). Asignificantly inefficient cost structure, poor working capital management, and anacquisition strategy that went awry all contributed, but there are fixes that thenew leadership can implement.
Deep cultural turnaround for a company that was lacking processValuationOur $6 price target is 8.0x our estimate ofthe company’s normalized EBITDA power of$1.45 billion, which is a half-turn premium tothe 7.5x five-year average multiple leadingup to the 2014 collapse in oil prices. Arehabilitation of its cash conversion metricsshould in our view provide small multipleexpansion as the company is enabled togenerate positive free cash flow.The main investment risks include: 1) shiftsin OPEC policy and the influence thatwould have on oil prices and ultimately USupstream capital expenditures, 2) negativerevisions to global oil demand, 3) an equityraise to reduce debt, and 4) a derailing ofits efforts to reduce working capital intensityand net debt.
This will not be easy and it will not happen quickly, but we like the potential forthe new leadership to extract and apply best practices to WFT. The new CEO hasidentified upwards of $600 million more in cost reductions, is realistic about whatneeds to happen to sell the international land drilling business, and is focused on$500+ million in working capital inefficiencies.
David HavensResearch [email protected]
Price at 5 Oct 2017 (USD) 4.27
Price target 6.00
52-week range 6.65 - 3.53
Price/price relative
Weatherford Internat S&P 500 INDEX (Rebased)
Jan '15 May '15 Sep '15 Jan '16 May '16 Sep '16 Jan '17 May '17 Sep '170
5
10
15
20
25
30
Performance(%)
1m 3m 12m
Absolute 6.5 6.8 -20.0
S&P 500INDEX
2.5 4.5 18.0
Source: Deutsche Bank
Stock & option liquidity data
Market Cap (USDm) 4,225.2
Shares outstanding (m) 989.5
Free float (%) 99
Volume (5 Oct 2017) 4,067,693
Option volume (und. shrs., 1M avg.) 1,429,321Source: Deutsche Bank
Deutsche Bank Securities Inc. Page 307

9 October 2017
Oil Services & Equipment
Initiation of coverage
Forecasts and ratios
Year End Dec 31 2016A 2017E 2018E
1Q EPS -0.29 -0.32A -0.12
2Q EPS -0.28 -0.25A -0.08
3Q EPS -0.39 -0.24 -0.05
4Q EPS -0.32 -0.20 -0.03
FY EPS (USD) -1.29 -1.01 -0.28
OLD FY EPS (USD) -1.29 – –
% Change -0.0% – –
P/E (x) – – –
DPS (USD) 0.00 0.00 0.00
Dividend Yield (%) 0.0 0.0 0.0
Revenue (USDm) 5,749.0 5,764.4 6,205.1Source: Deutsche Bank estimates, company data
Page 308 Deutsche Bank Securities Inc.

9 October 2017
Oil Services & Equipment
Initiation of coverage
Key investment themes
Line of sight to the end of chronic underperformance in cash conversionWeatherford had for longtime been seen as the high-torque oil-play with highearnings leverage enabled by an active acquisition strategy. Unfortunately, theoutcome was chronic underperformance in generating free cash flow whichscored WFT last place in a ten-year cash conversion comparison with 30of its oilfield service peers. There is an idiosyncratic opportunity embeddedin WFT for the new leadership to elevate its cash conversion by monetizingits inventories, reducing receivable days, reducing redundant costs and mostimportantly, creating a new culture and process.
Figure 621: Average ten year cash conversion ratio…WFT is last
- 0.20 0.40 0.60 0.80 1.00 1.20 1.40
WFTNR
CRRRESBRSFTI
HALBHI
RDCOII
SLBCLB
HOSRIGDO
TDWPDS
DRQTS
ATWTTI
NBRESV
NOVSPN
NEUNTPESHP
OISPTEN
Cash from operations/EBITDA
Source: Deutsche Bank
Working capital efficiencies of $500 – 700 million targeted, but will take timeA glaring difference between Weatherford and its peers are its inventory days.Weatherford over the last ten years has averaged 115 days of inventory versusHalliburton and Schlumberger down at 52 and 60 days respectively. WFT needs tomonetize its inventories better and that is what management intends to do. Thiswill take time, but if management could reduce inventory days to where BHGEhas averaged over the past ten years (92 days), that would unlock $0.5 billion incash. Unrealistic to compare to Schlumberger and Halliburton, but getting downto their level would unlock $1 billion in cash from Working capital.
Deutsche Bank Securities Inc. Page 309

9 October 2017
Oil Services & Equipment
Initiation of coverage
Figure 622: Ten year average inventory days…WFT underperforming
-
20
40
60
80
100
120
140
HAL SLB BHI WFT
Inv
en
tory
da
ys
Source: Company reports, Deutsche Bank
Still room to reduce more costs by upwards of $600 millionAs Mark McCollum works through his strategic review, there have been upwardsof $600 million of additional cost cuts identified including the closure of someredundant facilities.
Figure 623: Cumulative free cash flow over last ten years
(10,000)
(5,000)
-
5,000
10,000
15,000
20,000
25,000
30,000
35,000
40,000
SLB NOV HAL BHI WFT
In m
illio
n o
f U
SD
Source: Company reports, Deutsche Bank
Page 310 Deutsche Bank Securities Inc.

9 October 2017
Oil Services & Equipment
Initiation of coverage
Figure 624: Weatherford has reduced headcount by 55% since 2013
0
10,000
20,000
30,000
40,000
50,000
60,000
70,000
80,000
2013 2014 2015 2016
Down 55%
Source: Company reports, Deutsche Bank
Figure 625: Annual cost reductions since 2014 with another $600m coming
600
1,400
600
300
0
500
1,000
1,500
2,000
2,500
3,000
3,500
2014 2015 2016 2017 Total
In m
illio
ns
of
USD
Source: Company reports, Deutsche Bank
Core to the strategy is delivering the balance sheetDebt reduction is at the top of the list. Weatherford’s annual interest expense is10% of revenues compared to 2.5% for Halliburton and 1.6% for Schlumberger.Management’s goal is to cut its $7.1 billion of net debt in half by year-end 2019.The path to get there includes:
■ $535 million from the OneStim joint venture by year-end 2017
■ Sale of international land rig business for $500 – 1,000 million
■ Additional cost cutting totaling upwards of $500 – 600 million
■ Working capital efficiencies of $500 – 600 million
■ $540 million from any exercise of warrants at $6.43 per share
Deutsche Bank Securities Inc. Page 311

9 October 2017
Oil Services & Equipment
Initiation of coverage
Market willing, the sale of the international land rig business is a key componentand a key unknown still. Management is now willing to sell the segment in piecesinstead of only considering the whole, which could accelerate the process thatbegan just before oil prices dropped in 2014. WFT’s expectation is about $500 –1,000 million. We would suggest the lower end of the range as the most realistic.The additional cost cutting we expect to be implemented in 2018, but the workingcapital efficiencies will take time to normalize, albeit not at peer levels realistically,and probably through 2019.
Valuation and risksOur $6 price target is 8.0x our estimate of the company’s normalized EBITDApower of $1.45 billion, which is a half-turn premium with the five-year averagemultiple leading up to the 2014 collapse in oil prices. A rehabilitation of its cashconversion metrics should in our view provide small multiple expansion as thecompany is enabled to generate positive free cash flow.
The main investment risks include: 1) shifts in OPEC policy and the influencethat would have on oil prices and ultimately US upstream capital expenditures, 2)negative revisions to global oil demand, 3) an equity raise to reduce debt, and 4)a derailing of its efforts to reduce working capital intensity and net debt.
Figure 626: The P/E valuation band as blown out Figure 627: The 5yr P/E leading up to 2014
-
5
10
15
20
25
Sep-10 Sep-11 Sep-12 Sep-13 Sep-14 Sep-15 Sep-16
-1 std 10yr avg +1 std
6.8
3
4
5
6
7
8
9
10
11
-1 std 10yr avg +1 std
Source: Factset Source: Factset
Page 312 Deutsche Bank Securities Inc.

9 October 2017
Oil Services & Equipment
Initiation of coverage
Company description
Weatherford International (WFT) is a diversified oilfield services company withoperations in 90 countries. Approximately 26% of its revenues were in theUS in 2016 versus 37% at the industry peak in 2014. Canada was about 7%of revenues in 2016 with Latin America contributing 19% and the easternhemisphere contributing about 52%. The company is currently organizedunder five operating divisions including Drilling and Formation Evaluation,Well Construction, Completion and Stimulation, Production, and Land Drilling(currently up for sale). Its core strengths and leadership markets are managedpressure drilling (MPD), tubular running services (TRS), fishing and rentals,artificial lift, and completions.
In early 2017, Weatherford and Schlumberger announced the formation of aJV that will deliver completion products and services for the development ofunconventional resources in North America. Schlumberger and Weatherford willhave a 70/30 ownership in the JV. Weatherford will contribute its multi-stagecompletions portfolio including its 20 US frac spreads with about 1 millionhorsepower. Upon closing of the JV agreement by year-end 2017, WFT willreceive $535 million in cash from Schlumberger.
Figure 628: Operating divisions
Drilling and Formation Evaluation Well Construction
- Managed Pressure Drilling (MPD) - Tubular Running Services (TRS)
- Drilling Services - Drilling Tools and Rental Equipment
- Directional Drilling - Re-entry and Fishing Services
- Measurement-while-drilling (MWD) - Cementing Products
- Logging-while-drilling (LWD) - Liner Systems
- Rotary steerable systems (RSS) - Solid Expandable Systems
- Wireline Services
- Open-hole and cased-hole services
- Well intervention and remediation Completion and Stimulation
- Testing and Production Services - OneStim JV with Schlumberger (30/70)
- Laboratory Services (core analysis) - Hydraulic fracturing
- Surface Logging Systems - Multistage completions
- Pump down perforating
Land Drilling - 110 rigs
- Middle East - 47% Production
- Latin America - 22% - Artificial Lift Systems
- North Africa - 16% - Flow Measurements
- Asia Pacific - 12% - Production and Reservoir Monitoring
- Europe - 3% - Pump and Fluid Systems
Weatherford International
Source: Company reports
Deutsche Bank Securities Inc. Page 313

9 October 2017
Oil Services & Equipment
Initiation of coverage
Principal Sources and Uses of Cash Flow
Acquisition strategy a primary source of earnings growthWeatherford has a diversified revenue stream with North America contributing33% of 2016 revenues followed by the Middle East/ North Africa/ Asia Pacificregion contributing 23%. In general, when thinking about WFT compared toits peers, the company has more onshore exposure and has more Canadianexposure, with the latter impacting Q2 results due to the spring breakupseasonality. The company’s land drilling and workover rig fleet, which is for sale,is concentrated in the Middle East and North Africa.
Figure 629: Geographic segment revenues
North
America
46%
Latin
America
15%
Eur/
SSA/
Russia
14%
M East/
N Afr/
Asia
16%
Land
Drilling
9%
2014
North
America
33%
Latin
America
19%
Eur/
SSA/
Russia
16%
M East/
N Afr/
Asia
25%
Land
Drilling
7%
2016
Source: Company reports, Deutsche Bank
WFT has grown organically and via acquisitions (more than 200) over the courseof its history. The former CEO was a builder, using acquisitions to fill in productline gaps and global footprint to compete with the diversified players. In its historywhile aggressively pursuing this growth, the focus would shift from profitabilityand cost control to revenue and market share. The new CEO, Mark McCollum,wants to improve execution and profitability, and create a culture and a processthat lends to returns rather than just market share.
Figure 630: Consolidated EBITDA Figure 631: Annual EPS
0
500
1,000
1,500
2,000
2,500
3,000
3,500
2007 2008 2009 2010 2011 2012 2013 2014 2015 2016 2017 2018 2019
(a) (a) (a) (a) (a) (a) (a) (a) (a) (a) (e) (e) (e)
In m
illio
ns
of
US
D
(1.50)
(1.00)
(0.50)
0.00
0.50
1.00
1.50
2.00
2.50
2007 2008 2009 2010 2011 2012 2013 2014 2015 2016 2017 2018 2019
(a) (a) (a) (a) (a) (a) (a) (a) (a) (a) (e) (e) (e)
EPS
Source: Company reports, Deutsche Bank Source: Company reports, Deutsche Bank
Page 314 Deutsche Bank Securities Inc.

9 October 2017
Oil Services & Equipment
Initiation of coverage
Figure 632: Geographic revenue mix
0
2,000
4,000
6,000
8,000
10,000
12,000
14,000
16,000
18,000
2007 2008 2009 2010 2011 2012 2013 2014 2015 2016 2017 2018
(a) (a) (a) (a) (a) (a) (a) (a) (a) (a) (e) (e)
In m
illi
on
s o
f U
SD
North America Latin America Eur/ SSA/ Russia M East/ N Afr/ Asia Land Drilling
Source: Company reports, Deutsche Bank
North America margins have lagged competitors in recent quarters as WFT’spressure pumping business underperformed and the company was impacted bydeclining activity in the Gulf of Mexico and higher costs to return equipmentinto the field. Its underperforming pressure pumping operations always seemedto lack the necessary scale and it was contributed to the OneStim JV. ItsInternational business continues to be impacted by project delays and pricingpressures, but the company has been able to partially offset some of this byincremental cost savings from their restructuring efforts. WFT is also expects tobenefit from recent contract wins in the Middle East as these projects start toramp up in the coming quarters.
Figure 633: EBIT margins
-30%
-20%
-10%
0%
10%
20%
30%
20
07
20
08
20
09
20
10
20
11
20
12
20
13
20
14
20
15
20
16
20
17
20
18
20
19
(a) (a) (a) (a) (a) (a) (a) (a) (a) (a) (e) (e) (e)
North America Latin America
Eur/ SSA/ Russia M East/ N Afr/ Asia
Source: Company reports, Deutsche Bank
WFT exposure is slightly different than some of its larger peers, but the companystill competes against them across several product lines. Their main competitorsacross the globe are SLB, HAL, and BHGE. WFT also competes against largecompanies across distinct segments of its business including NOV, NBR, and FI.
Deutsche Bank Securities Inc. Page 315

9 October 2017
Oil Services & Equipment
Initiation of coverage
There are also regional competitors that are focused on a specific market or alimited range of equipment and services offerings. To be more
specific around its core product lines, in artificial lift WFT is a top three playerwith SLB and BHGE. In tubular running services, WFT is a top two player sharingessentially a global duopoly with FI. In completion equipment, WFT is also a top3 player with the large diversified peers being the biggest players in that market.In rentals, WFT is the largest player and competes against SPN, SLB, and BHGE.
Page 316 Deutsche Bank Securities Inc.

9 October 2017
Oil Services & Equipment
Initiation of coverage
WFT has generated a $6 billion free cash flow loss over last ten yearsWFT’s free cash flow generation has been very inconsistent throughout itshistory. During its period of acquisitions, the focus was on adding product lines,expanding its geographic footprint, and growing market share. Sometimes thisfocus would lead to taking on contracts that were greater than WFT’s scope/capabilities, such as Zubair in Iraq. When the company was undergoing itsstrategic review and separating out its core and non-core product lines, it wasclear that its core product lines were contributing much of the profitability andcash flow in the company. Pressure pumping has been a drag on profitability fora while and with the separation it should help improve North American margins.
Its Latin American footprint has grown and with it WFT’s receivables have beenimpacted by this growth as LatAm accounted for nearly 40% of its outstandingA/R balances at the end of 2016. WFT has also raised cash from recent debt andequity offerings (which we discuss in more detail in the next section), from non-core divestitures (the rest of the rig business is still up for sale), and from its recentOneStim JV which gave WFT a one-time $535mm cash payment.
Uses of cash have been on working capital, R&D, capex, acquisitions, interestpayments and debt repayment. McCollum has recognized that there is a lot ofcash tied up in working capital for WFT and plans to focus the company to bringdown inventory levels to a more appropriate level. Recent savings generatedfrom lowering corporate expenses will be reinvested into new technologies andprocess improvements in order to improve the overall efficiency of the company.
Figure 634: Free cash flow Figure 635: Capital expenditures
(1,500)
(1,000)
(500)
0
500
1,000
2007 2008 2009 2010 2011 2012 2013 2014 2015 2016 2017 2018
(a) (a) (a) (a) (a) (a) (a) (a) (a) (a) (e) (e)
In m
illio
ns
of
USD
0
500
1,000
1,500
2,000
2,500
3,000
2007 2008 2009 2010 2011 2012 2013 2014 2015 2016 2017 2018
(a) (a) (a) (a) (a) (a) (a) (a) (a) (a) (e) (e)
In m
illi
on
s o
f U
SD
Capital expenditures Depreciation
Source: Company reports, Deutsche Bank Source: Company reports, Deutsche Bank
Capex levels have been trending lower as well the past few years as it finishedbuilding out its international expansion. WFT will likely have to put some capexinto its land rig fleet as it positions it for divestiture. Also in preparation forthe OneStim JV, WFT purchased certain leased equipment in its NAM pressurepumping business for $240mm in January 2017.
Deutsche Bank Securities Inc. Page 317

9 October 2017
Oil Services & Equipment
Initiation of coverage
Balance sheet and liquidityDuring 2016, WFT through a series of debt offerings and a secured term loanraised net proceeds of $3.7bn. The proceeds from those offerings were usedto buyback senior notes ($1.9bn), repay some of its revolver, and for generalcorporate purposes. Also in 2016, WFT issued 200mm shares of equity for a totalcash proceeds of $1.1bn. The company also issued one warrant in November2016 that allows the holder to purchase 84.5mm shares on or prior to May 21,2019 at an exercise price of $6.43. Net interest expense was $499mm in FY16compared to $468mm in 2015 as higher interest on the newly issued debt wasonly partially offset by the debt repurchases.
WFT spent much of last year working to extend its liquidity runway due to its debtand equity issuances last year. The largest piece of its debt maturity wall nowstands in 2021, but the near term levels are much more manageable. McCollumhas made it clear that debt repayment will be a key part of the strategy asprofitability and cash flow generation improves.
Figure 636: Net debt
0
1,000
2,000
3,000
4,000
5,000
6,000
7,000
8,000
9,000
2007 2008 2009 2010 2011 2012 2013 2014 2015 2016 2017 2018
(a) (a) (a) (a) (a) (a) (a) (a) (a) (a) (e) (e)
In m
illio
ns
of
USD
Source: Deutsche Bank
Page 318 Deutsche Bank Securities Inc.

9 October 2017
Oil Services & Equipment
Initiation of coverage
Figure 637: Income Statement(a) (a) (a) (a) (a) (a) (a) (a) (e) (e) (e)
In millions of USD 2009 2010 2011 2012 2013 2014 2015 2016 2017 2018 2019
Segment revenues:
North America 2,762 4,167 6,025 6,824 6,390 6,852 3,494 1,878 1,997 2,077 2,149
Latin America 2,079 1,619 2,226 3,077 2,836 2,282 1,746 1,059 984 1,051 1,109
Eur/ SSA/ Russia 1,619 1,984 2,296 2,519 2,693 2,129 1,533 939 991 1,041 1,083
M East/ N Afr/ Asia 2,372 2,451 2,441 2,795 3,344 2,406 1,947 1,453 1,400 1,622 1,756
Land Drilling 0 0 0 0 0 1,242 713 420 392 414 431
Total revenue 8,833 10,221 12,988 15,215 15,263 14,911 9,433 5,749 5,764 6,205 6,529
Segment EBIT:
North America 191 693 1,258 1,129 822 1,037 (224) (382) 23 197 226
Latin America 277 51 254 403 365 379 315 65 33 84 132
Eur/ SSA/ Russia 223 240 282 335 298 399 217 (11) 11 106 174
M East/ N Afr/ Asia 445 263 23 78 230 267 211 7 41 174 260
Land Drilling 0 0 0 0 0 (11) 13 (87) (84) 20 77
G&A (174) (173) (198) (196) (200) (178) (194) (139) (135) (135) (146)
R&D (196) (216) (245) (257) (266) (290) (231) (159) (147) (144) (144)
EBIT 766 859 1,374 1,492 1,249 1,603 107 (706) (258) 303 578
Interest (expense) (367) (406) (453) (486) (516) (498) (468) (499) (567) (539) (491)
Interest income 0 0 0 0 0 0 0 0 0 0 0
Equity income 0 0 0 0 0 0 0 0 0 0 0
Other income (44) (53) (101) (100) (77) (17) 3 (24) (41) (40) (40)
PBT 355 401 820 906 656 1,088 (358) (1,229) (866) (277) 48
Income tax (expense) (163) (241) (489) (472) (162) (258) 138 104 (111) 28 (7)
Non-controlling interest (26) (15) (16) (28) (31) (45) (34) (19) (23) (24) (24)
Preferred dividends 0 0 0 0 0 0 0 0 0 0 0
Net income (operating) 166 145 315 406 463 785 (254) (1,144) (1,001) (273) 17
Discontinued ops 0 0 0 0 0 0 0 0 0 0 0
Unusual after-tax (77) (362) (134) (990) (806) (1,369) (1,731) (2,248) (54) 0 0
Net income (GAAP) 89 (217) 181 (584) (343) (584) (1,985) (3,392) (1,055) (273) 17
Operating EPS 0.23 0.19 0.42 0.53 0.60 1.01 (0.33) (1.29) (1.01) (0.28) 0.02
GAAP EPS 0.12 (0.29) 0.24 (0.76) (0.44) (0.75) (2.55) (3.82) (1.07) (0.28) 0.02
Diluted shares 723 743 758 768 774 779 779 887 990 990 990
EBITDA 1,672 1,907 2,512 2,774 2,651 2,974 1,307 250 540 905 1,040
EBITDA margin 18.9% 18.7% 19.3% 18.2% 17.4% 19.9% 13.9% 4.3% 9.4% 14.6% 15.9%
EBIT margin 8.7% 8.4% 10.6% 9.8% 8.2% 10.8% 1.1% -12.3% -4.5% 4.9% 8.9%
Tax rate 45.9% 60.2% 59.6% 52.1% 24.7% 23.7% 38.5% 8.5% -12.9% 10.0% 15.0%
Segment EBIT margins 2009 2010 2011 2012 2013 2014 2015 2016 2017 2018 2019
North America 6.9% 16.6% 20.9% 16.5% 12.9% 15.1% -6.4% -20.3% 1.2% 9.5% 10.5%
Latin America 13.3% 3.1% 11.4% 13.1% 12.9% 16.6% 18.0% 6.1% 3.3% 8.0% 11.9%
Eur/ SSA/ Russia 13.8% 12.1% 12.3% 13.3% 11.1% 18.7% 14.2% -1.2% 1.2% 10.2% 16.0%
M East/ N Afr/ Asia 18.7% 10.7% 0.9% 2.8% 6.9% 11.1% 10.8% 0.5% 2.9% 10.7% 14.8%
Land Drilling -0.9% 1.8% -20.7% -21.4% 4.9% 17.9%
Segment margin 12.9% 12.2% 14.0% 12.8% 11.2% 13.9% 5.6% -7.1% 0.4% 9.4% 13.3%
Source: Deutsche Bank
Deutsche Bank Securities Inc. Page 319

9 October 2017
Oil Services & Equipment
Initiation of coverage
Figure 638: Cash Flow Statement(a) (a) (a) (a) (a) (a) (a) (a) (e) (e) (e)
In millions of USD 2009 2010 2011 2012 2013 2014 2015 2016 2017 2018 2019
Net income 166 145 315 406 463 785 (254) (1,144) (1,001) (273) 17
Depreciation 907 1,048 1,138 1,282 1,402 1,371 1,200 956 798 603 462
Deferred tax (100) 55 149 (13) (33) (66) (448) 381 4 0 0
Chg in receivables 100 (190) (626) (705) (12) 78 1,031 214 (54) 13 11
Chg in inventories (46) (360) (606) (738) 129 (167) 349 260 6 430 298
Chg in payables 41 298 237 543 69 (150) (813) (21) 25 (17) 39
Other (454) 132 226 446 (789) (888) (359) (960) (55) (5) (6)
Cash from operations 614 1,128 833 1,221 1,229 963 706 (314) (277) 750 819
Capital expenditures (1,569) (977) (1,524) (2,177) (1,575) (1,450) (682) (204) (171) (279) (358)
Free cash flow (955) 151 (691) (956) (346) (487) 24 (518) (448) 471 461
Acquisitions (44) (170) (166) (190) (17) 10 (22) (15) (243) 0 0
Asset sales 123 197 31 61 488 1,770 45 49 560 500 0
Dividends paid 0 0 0 0 0 0 0 0 0 0 0
ESPP | options 6 0 0 65 0 22 0 0 0 0 0
Equity issuance, net 0 0 0 0 0 0 0 1,071 0 0 0
Debt issuance, net 834 (29) 798 990 12 (1,183) 31 206 94 (116) (539)
Other 50 14 (17) (41) (2) (93) (85) (223) (31) 0 0
Chg in cash 14 163 (45) (71) 135 39 (7) 570 (68) 855 (78)
FCF per share (1.32) 0.20 (0.91) (1.25) (0.45) (0.63) 0.03 (0.58) (0.45) 0.48 0.47
Capex / revenue 0.18 0.10 0.12 0.14 0.10 0.10 0.07 0.04 0.03 0.04 0.05
Capex / depreciation 1.73 0.93 1.34 1.70 1.12 1.06 0.57 0.21 0.21 0.46 0.78
Source: Deutsche Bank
Page 320 Deutsche Bank Securities Inc.

9 October 2017
Oil Services & Equipment
Initiation of coverage
Figure 639: Balance Sheet(a) (a) (a) (a) (a) (a) (a) (a) (e) (e) (e)
In millions of USD 2009 2010 2011 2012 2013 2014 2015 2016 2017 2018 2019
Cash and equivalents 253 416 371 300 435 474 467 1,037 969 1,824 1,746
Accounts receivable 2,511 2,629 3,233 3,885 3,594 3,015 1,781 1,383 1,207 1,194 1,183
Inventories 2,238 2,590 3,158 3,675 3,371 3,087 2,344 1,802 1,675 1,246 948
Other current assets 1,043 860 969 1,169 1,374 1,368 972 688 1,690 1,767 1,859
Total current assets 6,045 6,495 7,731 9,029 8,774 7,944 5,564 4,910 5,541 6,031 5,736
Net PP&E 6,995 6,945 7,287 8,299 8,368 7,123 5,679 4,480 3,279 2,455 2,351
Goodwill 4,243 4,279 4,423 3,871 3,709 3,011 2,803 2,797 2,293 2,293 2,293
Equity in affiliates 533 540 616 646 296 106 76 66 63 63 63
Other assets 966 940 994 950 830 705 665 411 579 606 637
Total assets 18,782 19,199 21,051 22,795 21,977 18,889 14,787 12,664 11,755 11,448 11,080
Accounts payable 1,002 1,335 1,571 2,108 2,091 1,736 948 845 878 861 899
Current debt 870 235 1,320 1,585 1,666 727 1,582 179 152 543 379
Other current liabilities 1,184 1,131 1,392 2,017 1,942 1,564 1,501 1,404 1,497 1,566 1,647
Total current liabilities 3,056 2,701 4,283 5,710 5,699 4,027 4,031 2,428 2,527 2,969 2,925
Long-term debt 5,847 6,530 6,286 7,049 7,061 6,798 5,879 7,403 7,513 7,007 6,631
Deferred taxes 0 0 0 0 0 0 0 0 0 0 0
Other LT liabilities 704 850 1,137 1,218 1,014 1,031 512 765 656 687 722
Non-controlling int 79 67 21 32 41 75 61 56 69 93 117
Shareholders' equity 9,095 9,051 9,324 8,786 8,162 6,958 4,304 2,012 989 692 685
Total liabilities and equity 18,782 19,199 21,051 22,795 21,977 18,889 14,787 12,664 11,755 11,448 11,080
Total debt 6,717 6,765 7,606 8,634 8,727 7,525 7,461 7,582 7,665 7,549 7,010
Net debt 6,464 6,349 7,235 8,334 8,292 7,051 6,994 6,545 6,696 5,725 5,264
Debt/capital 42% 43% 45% 50% 52% 52% 63% 79% 89% 92% 91%
Debt/equity 74% 75% 82% 98% 107% 108% 173% 377% 775% 1091% 1024%
Debt turns 4.0 3.5 3.0 3.1 3.3 2.5 5.7 30.3 14.2 8.3 6.7
Source: Deutsche Bank
Deutsche Bank Securities Inc. Page 321

9 October 2017
Oil Services & Equipment
Initiation of coverage
Appendix 1
Important Disclosures
*Other information available upon request
*Prices are current as of the end of the previous trading session unless otherwise indicated and are sourced fromlocal exchanges via Reuters, Bloomberg, and other vendors. Other information is sourced from Deutsche Bank, subjectcompanies, and other sources. For disclosures pertaining to recommendations or estimates made on securities other thanthe primary subject of this research, please see the most recently published company report or visit our global disclosurelook-up page on our website at http://gm.db.com/ger/disclosure/DisclosureDirectory.eqsr. Aside from within this report,important conflict disclosures can also be found at https://gm/db.com/equities under the "Disclosures Lookup" and "Legal"tabs. Investors are strongly encouraged to review this information before investing.
Analyst Certification
The views expressed in this report accurately reflect the personal views of the undersigned lead analyst about the subjectissuers and the securities of those issuers. In addition, the undersigned lead analyst has not and will not receive anycompensation for providing a specific recommendation or view in this report. David Havens, Jason Bandel
Equity Rating Key Equity rating dispersion and banking relationships
Buy: Based on a current 12- month view of total share-holderreturn (TSR = percentage change in share price from currentprice to projected target price plus pro-jected dividend yield ) ,we recommend that investors buy the stock.Sell: Based on a current 12-month view of total share-holderreturn, we recommend that investors sell the stock.Hold: We take a neutral view on the stock 12-months out and,based on this time horizon, do not recommend either a Buyor Sell.
Newly issued research recommendations and target pricessupersede previously published research.
Page 322 Deutsche Bank Securities Inc.

9 October 2017
Oil Services & Equipment
Initiation of coverage
Additional Information
The information and opinions in this report were prepared by Deutsche Bank AG or one of its affiliates (collectively"Deutsche Bank"). Though the information herein is believed to be reliable and has been obtained from public sourcesbelieved to be reliable, Deutsche Bank makes no representation as to its accuracy or completeness. Hyperlinks to third-party websites in this report are provided for reader convenience only. Deutsche Bank neither endorses the content noris responsible for the accuracy or security controls of these websites.?
If you use the services of Deutsche Bank in connection with a purchase or sale of a security that is discussed in this report,or is included or discussed in another communication (oral or written) from a Deutsche Bank analyst, Deutsche Bank mayact as principal for its own account or as agent for another person.
Deutsche Bank may consider this report in deciding to trade as principal. It may also engage in transactions, for itsown account or with customers, in a manner inconsistent with the views taken in this research report. Others withinDeutsche Bank, including strategists, sales staff and other analysts, may take views that are inconsistent with those takenin this research report. Deutsche Bank issues a variety of research products, including fundamental analysis, equity-linkedanalysis, quantitative analysis and trade ideas. Recommendations contained in one type of communication may differfrom recommendations contained in others, whether as a result of differing time horizons, methodologies or otherwise.Deutsche Bank and/or its affiliates may also be holding debt or equity securities of the issuers it writes on. Analysts arepaid in part based on the profitability of Deutsche Bank AG and its affiliates, which includes investment banking, tradingand principal trading revenues.
Opinions, estimates and projections constitute the current judgment of the author as of the date of this report. They donot necessarily reflect the opinions of Deutsche Bank and are subject to change without notice. Deutsche Bank providesliquidity for buyers and sellers of securities issued by the companies it covers. Deutsche Bank research analysts sometimeshave shorter-term trade ideas that are consistent or inconsistent with Deutsche Bank's existing longer term ratings. Tradeideas for equities can be found at the SOLAR link at http://gm.db.com. A SOLAR idea represents a high conviction beliefby an analyst that a stock will outperform or underperform the market and/or sector delineated over a time frame of noless than two weeks. In addition to SOLAR ideas, the analysts named in this report may from time to time discuss withour clients, Deutsche Bank salespersons and Deutsche Bank traders, trading strategies or ideas that reference catalystsor events that may have a near-term or medium-term impact on the market price of the securities discussed in this report,which impact may be directionally counter to the analysts' current 12-month view of total return or investment return asdescribed herein. Deutsche Bank has no obligation to update, modify or amend this report or to otherwise notify a recipientthereof if any opinion, forecast or estimate contained herein changes or subsequently becomes inaccurate. Coverage andthe frequency of changes in market conditions and in both general and company specific economic prospects make itdifficult to update research at defined intervals. Updates are at the sole discretion of the coverage analyst concerned or ofthe Research Department Management and as such the majority of reports are published at irregular intervals. This reportis provided for informational purposes only and does not take into account the particular investment objectives, financialsituations, or needs of individual clients. It is not an offer or a solicitation of an offer to buy or sell any financial instrumentsor to participate in any particular trading strategy. Target prices are inherently imprecise and a product of the analyst ’ sjudgment. The financial instruments discussed in this report may not be suitable for all investors and investors must maketheir own informed investment decisions. Prices and availability of financial instruments are subject to change withoutnotice and investment transactions can lead to losses as a result of price fluctuations and other factors. If a financialinstrument is denominated in a currency other than an investor's currency, a change in exchange rates may adverselyaffect the investment. Past performance is not necessarily indicative of future results. Unless otherwise indicated, pricesare current as of the end of the previous trading session, and are sourced from local exchanges via Reuters, Bloombergand other vendors. Data is sourced from Deutsche Bank, subject companies, and in some cases, other parties.
The Deutsche Bank Research Department is independent of other business areas divisions of the Bank. Details regardingour organizational arrangements and information barriers we have to prevent and avoid conflicts of interest with respectto our research is available on our website under Disclaimer found on the Legal tab.??
Deutsche Bank Securities Inc. Page 323

9 October 2017
Oil Services & Equipment
Initiation of coverage
Macroeconomic fluctuations often account for most of the risks associated with exposures to instruments that promiseto pay fixed or variable interest rates. For an investor who is long fixed rate instruments (thus receiving these cash flows),increases in interest rates naturally lift the discount factors applied to the expected cash flows and thus cause a loss.The longer the maturity of a certain cash flow and the higher the move in the discount factor, the higher will be theloss. Upside surprises in inflation, fiscal funding needs, and FX depreciation rates are among the most common adversemacroeconomic shocks to receivers. But counterparty exposure, issuer creditworthiness, client segmentation, regulation(including changes in assets holding limits for different types of investors), changes in tax policies, currency convertibility(which may constrain currency conversion, repatriation of profits and/or the liquidation of positions), and settlement issuesrelated to local clearing houses are also important risk factors to be considered. The sensitivity of fixed income instrumentsto macroeconomic shocks may be mitigated by indexing the contracted cash flows to inflation, to FX depreciation, or tospecified interest rates – these are common in emerging markets. It is important to note that the index fixings may -- byconstruction -- lag or mis-measure the actual move in the underlying variables they are intended to track. The choice of theproper fixing (or metric) is particularly important in swaps markets, where floating coupon rates (i.e., coupons indexed toa typically short-dated interest rate reference index) are exchanged for fixed coupons. It is also important to acknowledgethat funding in a currency that differs from the currency in which coupons are denominated carries FX risk. Naturally,options on swaps (swaptions) also bear the risks typical to options in addition to the risks related to rates movements.??Derivative transactions involve numerous risks including, among others, market, counterparty default and illiquidity risk.The appropriateness or otherwise of these products for use by investors is dependent on the investors' own circumstancesincluding their tax position, their regulatory environment and the nature of their other assets and liabilities, and as such,investors should take expert legal and financial advice before entering into any transaction similar to or inspired by thecontents of this publication. The risk of loss in futures trading and options, foreign or domestic, can be substantial. As aresult of the high degree of leverage obtainable in futures and options trading, losses may be incurred that are greaterthan the amount of funds initially deposited. Trading in options involves risk and is not suitable for all investors. Priorto buying or selling an option investors must review the "Characteristics and Risks of Standardized Options”, at http://www.optionsclearing.com/about/publications/character-risks.jsp. If you are unable to access the website please contactyour Deutsche Bank representative for a copy of this important document.?
Participants in foreign exchange transactions may incur risks arising from several factors, including the following: ( i)exchange rates can be volatile and are subject to large fluctuations; ( ii) the value of currencies may be affected bynumerous market factors, including world and national economic, political and regulatory events, events in equity anddebt markets and changes in interest rates; and (iii) currencies may be subject to devaluation or government imposedexchange controls which could affect the value of the currency. Investors in securities such as ADRs, whose values areaffected by the currency of an underlying security, effectively assume currency risk.
?Unless governing law provides otherwise, all transactions should be executed through the Deutsche Bank entity in theinvestor's home jurisdiction. Aside from within this report, important conflict disclosures can also be found at https://gm.db.com/equities under the "Disclosures Lookup" and "Legal" tabs. Investors are strongly encouraged to review thisinformation before investing.
Deutsche Bank (which includes Deutsche Bank AG, its branches and all affiliated companies) is not acting as a financialadviser, consultant or fiduciary to you, any of your agents (collectively, "You" or "Your") with respect to any informationprovided in the materials attached hereto. Deutsche Bank does not provide investment, legal, tax or accounting advice,Deutsche Bank is not acting as Your impartial adviser, and does not express any opinion or recommendation whatsoeveras to any strategies, products or any other information presented in the materials. Information contained herein is beingprovided solely on the basis that the recipient will make an independent assessment of the merits of any investmentdecision, and it does not constitute a recommendation of, or express an opinion on, any product or service or any tradingstrategy.
The information presented is general in nature and is not directed to retirement accounts or any specific person or accounttype, and is therefore provided to You on the express basis that it is not advice, and You may not rely upon it in makingYour decision. The information we provide is being directed only to persons we believe to be financially sophisticated,who are capable of evaluating investment risks independently, both in general and with regard to particular transactionsand investment strategies, and who understand that Deutsche Bank has financial interests in the offering of its products
Page 324 Deutsche Bank Securities Inc.

9 October 2017
Oil Services & Equipment
Initiation of coverage
and services. If this is not the case, or if You are an IRA or other retail investor receiving this directly from us, we askthat you inform us immediately.??United States: Approved and/or distributed by Deutsche Bank Securities Incorporated, a member of FINRA, NFA and SIPC.Analysts located outside of the United States are employed by non-US affiliates that are not subject to FINRA regulations.
Germany: Approved and/or distributed by Deutsche Bank AG, a joint stock corporation with limited liability incorporatedin the Federal Republic of Germany with its principal office in Frankfurt am Main. Deutsche Bank AG is authorized underGerman Banking Law and is subject to supervision by the European Central Bank and by BaFin, Germany ’ s FederalFinancial Supervisory Authority.
United Kingdom: Approved and/or distributed by Deutsche Bank AG acting through its London Branch at WinchesterHouse, 1 Great Winchester Street, London EC2N 2DB. Deutsche Bank AG in the United Kingdom is authorised by thePrudential Regulation Authority and is subject to limited regulation by the Prudential Regulation Authority and FinancialConduct Authority. Details about the extent of our authorisation and regulation are available on request.??Hong Kong: Distributed by Deutsche Bank AG, Hong Kong Branch or Deutsche Securities Asia Limited.??India: Prepared by Deutsche Equities India Pvt Ltd, which is registered by the Securities and Exchange Board of India (SEBI)as a stock broker. Research Analyst SEBI Registration Number is INH000001741. DEIPL may have received administrativewarnings from the SEBI for breaches of Indian regulations.
Japan: Approved and/or distributed by Deutsche Securities Inc.(DSI). Registration number - Registered as a financialinstruments dealer by the Head of the Kanto Local Finance Bureau (Kinsho) No. 117. Member of associations: JSDA, TypeII Financial Instruments Firms Association and The Financial Futures Association of Japan. Commissions and risks involvedin stock transactions - for stock transactions, we charge stock commissions and consumption tax by multiplying thetransaction amount by the commission rate agreed with each customer. Stock transactions can lead to losses as a resultof share price fluctuations and other factors. Transactions in foreign stocks can lead to additional losses stemming fromforeign exchange fluctuations. We may also charge commissions and fees for certain categories of investment advice,products and services. Recommended investment strategies, products and services carry the risk of losses to principaland other losses as a result of changes in market and/or economic trends, and/or fluctuations in market value. Beforedeciding on the purchase of financial products and/or services, customers should carefully read the relevant disclosures,prospectuses and other documentation. "Moody's", "Standard & Poor's", and "Fitch" mentioned in this report are notregistered credit rating agencies in Japan unless Japan or "Nippon" is specifically designated in the name of the entity.Reports on Japanese listed companies not written by analysts of DSI are written by Deutsche Bank Group's analysts withthe coverage companies specified by DSI. Some of the foreign securities stated on this report are not disclosed accordingto the Financial Instruments and Exchange Law of Japan. Target prices set by Deutsche Bank's equity analysts are basedon a 12-month forecast period.
Korea: Distributed by Deutsche Securities Korea Co.
South Africa: Deutsche Bank AG Johannesburg is incorporated in the Federal Republic of Germany (Branch RegisterNumber in South Africa: 1998/003298/10).??Singapore: by Deutsche Bank AG, Singapore Branch or Deutsche Securities Asia Limited, Singapore Branch (One RafflesQuay #18-00 South Tower Singapore 048583, +65 6423 8001), which may be contacted in respect of any matters arisingfrom, or in connection with, this report. Where this report is issued or promulgated in Singapore to a person who is not anaccredited investor, expert investor or institutional investor (as defined in the applicable Singapore laws and regulations),they accept legal responsibility to such person for its contents.
Taiwan: Information on securities/investments that trade in Taiwan is for your reference only. Readers shouldindependently evaluate investment risks and are solely responsible for their investment decisions. Deutsche Bank researchmay not be distributed to the Taiwan public media or quoted or used by the Taiwan public media without written consent.Information on securities/instruments that do not trade in Taiwan is for informational purposes only and is not to be
Deutsche Bank Securities Inc. Page 325

9 October 2017
Oil Services & Equipment
Initiation of coverage
construed as a recommendation to trade in such securities/instruments. Deutsche Securities Asia Limited, Taipei Branchmay not execute transactions for clients in these securities/instruments.??Qatar: Deutsche Bank AG in the Qatar Financial Centre (registered no. 00032) is regulated by the Qatar Financial CentreRegulatory Authority. Deutsche Bank AG - QFC Branch may only undertake the financial services activities that fall withinthe scope of its existing QFCRA license. Principal place of business in the QFC: Qatar Financial Centre, Tower, WestBay, Level 5, PO Box 14928, Doha, Qatar. This information has been distributed by Deutsche Bank AG. Related financialproducts or services are only available to Business Customers, as defined by the Qatar Financial Centre RegulatoryAuthority.
Russia: This information, interpretation and opinions submitted herein are not in the context of, and do not constitute,any appraisal or evaluation activity requiring a license in the Russian Federation.
?Kingdom of Saudi Arabia: Deutsche Securities Saudi Arabia LLC Company, (registered no. 07073-37) is regulated bythe Capital Market Authority. Deutsche Securities Saudi Arabia may only undertake the financial services activities thatfall within the scope of its existing CMA license. Principal place of business in Saudi Arabia: King Fahad Road, Al OlayaDistrict, P.O. Box 301809, Faisaliah Tower - 17th Floor, 11372 Riyadh, Saudi Arabia.??United Arab Emirates: Deutsche Bank AG in the Dubai International Financial Centre (registered no. 00045) is regulatedby the Dubai Financial Services Authority. Deutsche Bank AG - DIFC Branch may only undertake the financial servicesactivities that fall within the scope of its existing DFSA license. Principal place of business in the DIFC: Dubai InternationalFinancial Centre, The Gate Village, Building 5, PO Box 504902, Dubai, U.A.E. This information has been distributed byDeutsche Bank AG. Related financial products or services are only available to Professional Clients, as defined by theDubai Financial Services Authority.
Australia: Retail clients should obtain a copy of a Product Disclosure Statement (PDS) relating to any financial productreferred to in this report and consider the PDS before making any decision about whether to acquire the product. Pleaserefer to Australian specific research disclosures and related information at https://australia.db.com/australia/content/research-information.html??Australia and New Zealand: This research is intended only for "wholesale clients" within the meaning of the AustralianCorporations Act and New Zealand Financial Advisors Act respectively.
Additional information relative to securities, other financial products or issuers discussed in this report is available uponrequest. This report may not be reproduced, distributed or published without Deutsche Bank's prior written consent.Copyright © 2017 Deutsche Bank AG
Page 326 Deutsche Bank Securities Inc.

David Folkerts-LandauGroup Chief Economist and Global Head of Research
Raj HindochaGlobal Chief Operating Officer
Research
Michael SpencerHead of APAC Research
Global Head of Economics
Steve PollardHead of Americas Research
Global Head of Equity Research
Anthony KlarmanGlobal Head ofDebt Research
Paul ReynoldsHead of EMEA
Equity Research
Dave ClarkHead of APAC
Equity Research
Pam FinelliGlobal Head of
Equity Derivatives Research
Andreas NeubauerHead of Research - Germany
Spyros MesomerisGlobal Head of Quantitative
and QIS Research
International locations
Deutsche Bank AGDeutsche Bank PlaceLevel 16Corner of Hunter & Phillip StreetsSydney, NSW 2000AustraliaTel: (61) 2 8258 1234
Deutsche Bank AGMainzer Landstrasse 11-1760329 Frankfurt am MainGermanyTel: (49) 69 910 00
Deutsche Bank AGFiliale HongkongInternational Commerce Centre,1 Austin Road West,Kowloon,Hong KongTel: (852) 2203 8888
Deutsche Securities Inc.2-11-1 NagatachoSanno Park TowerChiyoda-ku, Tokyo 100-6171JapanTel: (81) 3 5156 6770
Deutsche Bank AG London1 Great Winchester StreetLondon EC2N 2EQUnited KingdomTel: (44) 20 7545 8000
Deutsche Bank Securities Inc.60 Wall StreetNew York, NY 10005United States of AmericaTel: (1) 212 250 2500