The Evolutionary Dynamics of Genes and Genomes:
177
The Evolutionary Dynamics of Genes and Genomes: Copy Number Variation of the Chalcone Synthase Gene in the Context of Brassicaceae Evolution
-
Upload
khangminh22 -
Category
Documents
-
view
1 -
download
0
Transcript of The Evolutionary Dynamics of Genes and Genomes:
The Evolutionary Dynamics of Genes and Genomes:
Copy Number Variation
of the Chalcone Synthase Gene in the Context of Brassicaceae Evolution

Dissertation
submitted to the
Combined Faculties for Natural Sciences and for Mathematics
of the Ruperto-Carola University of Heidelberg, Germany
for the degree of
Doctor of Natural Sciences
presented by
Liza Paola Ding
born in Mosbach, Baden-Württemberg, Germany
Oral examination: 22.12.2014

Referees:
Prof. Dr. Marcus A. Koch
Prof. Dr. Claudia Erbar
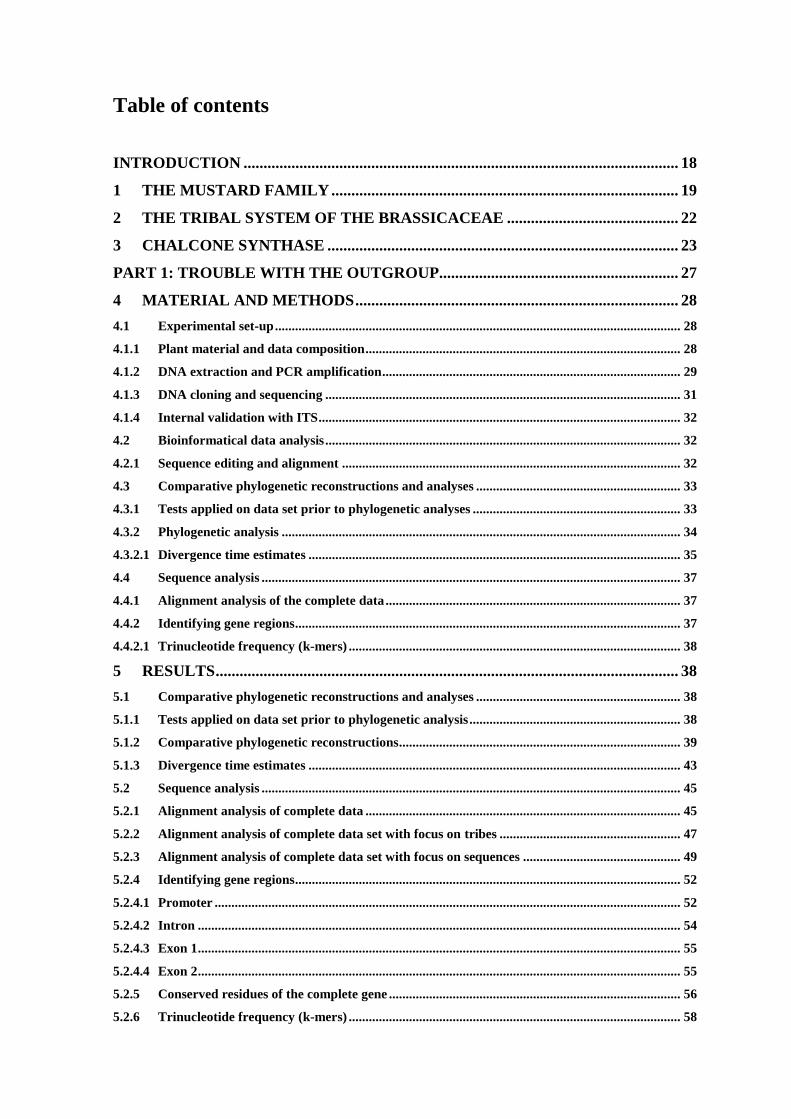
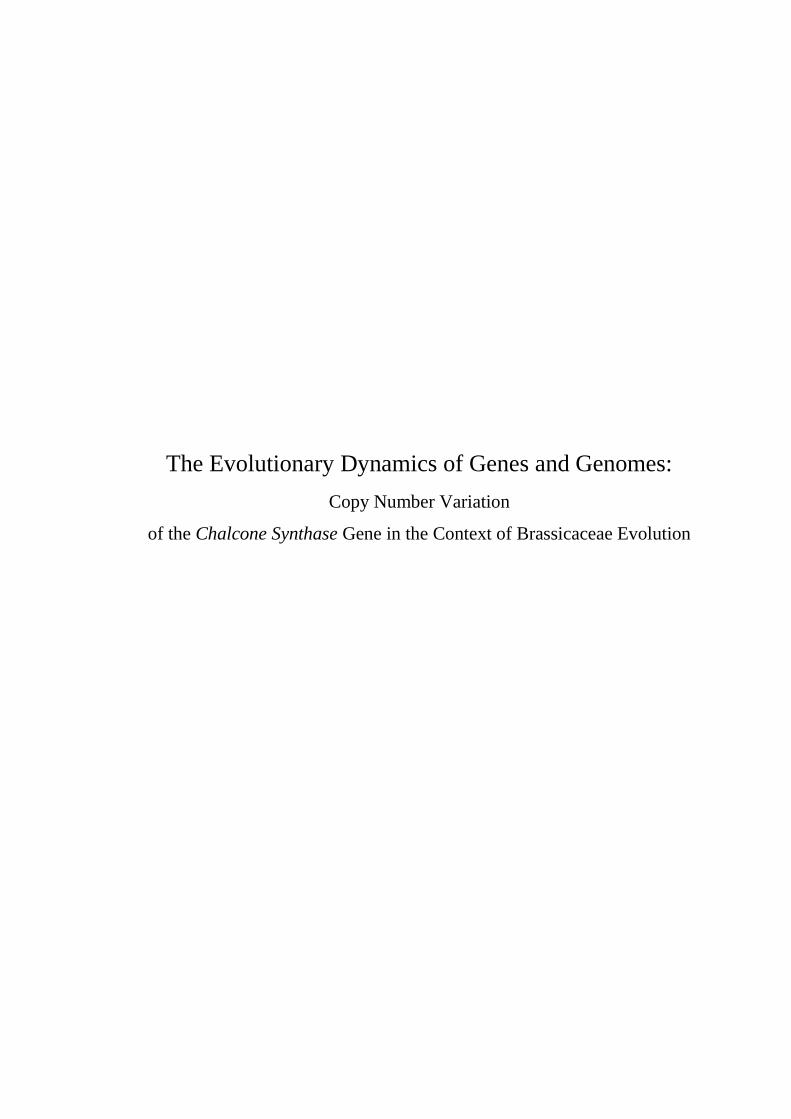
Table of contents
INTRODUCTION ............................................................................................................. 18
1 THE MUSTARD FAMILY ....................................................................................... 19
2 THE TRIBAL SYSTEM OF THE BRASSICACEAE ........................................... 22
3 CHALCONE SYNTHASE ........................................................................................ 23
PART 1: TROUBLE WITH THE OUTGROUP............................................................ 27
4 MATERIAL AND METHODS ................................................................................. 28
4.1 Experimental set-up ......................................................................................................................... 28
4.1.1 Plant material and data composition .............................................................................................. 28
4.1.2 DNA extraction and PCR amplification ......................................................................................... 29
4.1.3 DNA cloning and sequencing .......................................................................................................... 31
4.1.4 Internal validation with ITS ............................................................................................................ 32
4.2 Bioinformatical data analysis .......................................................................................................... 32
4.2.1 Sequence editing and alignment ..................................................................................................... 32
4.3 Comparative phylogenetic reconstructions and analyses ............................................................. 33
4.3.1 Tests applied on data set prior to phylogenetic analyses .............................................................. 33
4.3.2 Phylogenetic analysis ....................................................................................................................... 34
4.3.2.1 Divergence time estimates ............................................................................................................... 35
4.4 Sequence analysis ............................................................................................................................. 37
4.4.1 Alignment analysis of the complete data ........................................................................................ 37
4.4.2 Identifying gene regions ................................................................................................................... 37
4.4.2.1 Trinucleotide frequency (k-mers) ................................................................................................... 38
5 RESULTS .................................................................................................................... 38
5.1 Comparative phylogenetic reconstructions and analyses ............................................................. 38
5.1.1 Tests applied on data set prior to phylogenetic analysis ............................................................... 38
5.1.2 Comparative phylogenetic reconstructions.................................................................................... 39
5.1.3 Divergence time estimates ............................................................................................................... 43
5.2 Sequence analysis ............................................................................................................................. 45
5.2.1 Alignment analysis of complete data .............................................................................................. 45
5.2.2 Alignment analysis of complete data set with focus on tribes ...................................................... 47
5.2.3 Alignment analysis of complete data set with focus on sequences ............................................... 49
5.2.4 Identifying gene regions ................................................................................................................... 52
5.2.4.1 Promoter ........................................................................................................................................... 52
5.2.4.2 Intron ................................................................................................................................................ 54
5.2.4.3 Exon 1 ................................................................................................................................................ 55
5.2.4.4 Exon 2 ................................................................................................................................................ 55
5.2.5 Conserved residues of the complete gene ....................................................................................... 56
5.2.6 Trinucleotide frequency (k-mers) ................................................................................................... 58
6 DISCUSSION ............................................................................................................. 60
PART 2: TROUBLE WITH THE TRIBAL ARRANGEMENT .................................. 64
7 MATERIAL AND METHODS ................................................................................. 65
7.1 Comparative phylogenetic reconstructions and analyses ............................................................. 65
7.1.1 Test for recombination .................................................................................................................... 66
7.1.2 Divergence time estimates ............................................................................................................... 66
7.1.3 Lineage through time plots (LTT) .................................................................................................. 66
7.2 Sequence analysis ............................................................................................................................. 67
7.2.1 Alignment analysis of the complete data ........................................................................................ 67
7.2.2 Identifying gene regions ................................................................................................................... 67
7.2.3 DNA motif search among gene ........................................................................................................ 67
7.2.4 Transition/transversion rate bias .................................................................................................... 68
7.3 Compositional heterogeneity among DNA ..................................................................................... 68
7.3.1 GC content ........................................................................................................................................ 68
7.3.2 Base composition .............................................................................................................................. 69
7.3.3 Trinucleotide frequency .................................................................................................................. 69
7.4 Adaptive evolution ........................................................................................................................... 69
7.4.1 Origin of purifying selection ........................................................................................................... 70
7.4.2 Synonymous substitution rate ......................................................................................................... 71
7.4.3 Ancestral sequence reconstruction ................................................................................................. 71
8 RESULTS .................................................................................................................... 71
8.1 Comparative phylogenetic reconstructions and analyses ............................................................. 71
8.1.1 Test for recombination .................................................................................................................... 74
8.1.2 Divergence time estimates ............................................................................................................... 75
8.1.3 Lineage through time plots .............................................................................................................. 76
8.2 Identifying gene regions ................................................................................................................... 77
8.2.1 Promoter ........................................................................................................................................... 77
8.2.2 Intron ................................................................................................................................................ 78
8.2.3 Exon 1 ................................................................................................................................................ 80
8.2.4 Exon 2 ................................................................................................................................................ 81
8.2.5 DNA motif search among gene ........................................................................................................ 82
8.3 Compositional heterogeneity among DNA ..................................................................................... 83
8.3.1 GC content ........................................................................................................................................ 83
8.3.2 Base composition .............................................................................................................................. 84
8.3.3 Transition/transversion rate bias .................................................................................................... 87
8.3.4 Trinucleotide frequency .................................................................................................................. 88
8.4 Adaptive evolution ........................................................................................................................... 90
8.5 Origin of purifying selection ........................................................................................................... 92
8.6 Synonymous substitution rate ......................................................................................................... 93
8.6.1 Estimation of divergence ages utilising synonymous substitution rates and dS values .............. 93
8.6.2 Estimations of synonymous substitution rates utilising dS values and divergence ages ............ 94
8.7 Synonymous substitution rates for outliers ................................................................................... 95
8.8 Ruling out non-conformance ........................................................................................................... 96
8.9 Ancestral sequence reconstruction ................................................................................................. 99
9 DISCUSSION ........................................................................................................... 101
9.1 Anastaticeae/Malcolmieae ............................................................................................................. 102
9.2 Anchonieae...................................................................................................................................... 103
9.3 Camelineae...................................................................................................................................... 104
9.4 Dontostemoneae ............................................................................................................................. 105
9.5 Megacarpaeeae ............................................................................................................................... 105
9.6 Physarieae ....................................................................................................................................... 106
9.7 Turritideae ...................................................................................................................................... 107
9.8 Yinshanieae ..................................................................................................................................... 107
PART 3. DONE TWICE IS NOT ALWAYS BETTER - DUPLICATED GENE PAIRS
................................................................................................................................ 110
10 MATERIAL AND METHODS ............................................................................... 111
10.1 Comparative phylogenetic reconstructions and analyses ........................................................... 111
10.2 Divergence time estimates ............................................................................................................. 111
10.3 Sequence analysis ........................................................................................................................... 111
10.3.1 Intra-pair identities ........................................................................................................................ 111
10.3.2 Sequence analysis of duplicated gene pairs .................................................................................. 111
10.3.3 Sequence evolution in duplicated genes ....................................................................................... 112
10.3.3.1 Identification of gene regions ........................................................................................................ 112
10.3.4 Genomic sequence blast ................................................................................................................. 112
10.4 Synonymous substitution rates ..................................................................................................... 113
10.4.1 Relative rate test (Tajima’s D) ...................................................................................................... 113
11 RESULTS .................................................................................................................. 114
11.1 Comparative phylogenetic reconstructions and analyses ........................................................... 114
11.1.1 Divergence time estimates ............................................................................................................. 115
11.2 Sequence analysis ........................................................................................................................... 118
11.2.1 Intra-pair identities ........................................................................................................................ 118
11.2.2 Sequence analysis of duplicated gene pairs .................................................................................. 119
11.3 Identifying gene regions ................................................................................................................. 120
11.3.1 Promoter ......................................................................................................................................... 120
11.3.2 Intron .............................................................................................................................................. 121
11.3.3 Exon 1 and exon 2 .......................................................................................................................... 122
11.4 Asymmetric rates of sequence evolution in duplicated genes ..................................................... 123
11.5 Genomic sequence blast ................................................................................................................. 124
11.5.1 Synonymous substitution rates ..................................................................................................... 126
11.5.2 Relative rate test (Tajima’s D) ...................................................................................................... 128
11.5.3 Amino acid composition ................................................................................................................ 128
12 DISCUSSION ........................................................................................................... 129
12.1 Arabideae ........................................................................................................................................ 130
12.2 Cochlearieae ................................................................................................................................... 131
12.3 Dontostemoneae ............................................................................................................................. 132
12.4 Megacarpaeeae ............................................................................................................................... 134
12.5 Microlepidieae ................................................................................................................................ 134
PART 4: NO END OF TROUBLE ................................................................................ 137
13 MATERIAL UND METHODS ............................................................................... 138
13.1.1 Comparative phylogenetic reconstructions and analyses ........................................................... 138
13.1.2 Divergence time estimates ............................................................................................................. 138
13.1.3 Transition/transversion ratio ........................................................................................................ 138
13.1.4 Lineage through time plot ............................................................................................................. 139
14 RESULTS .................................................................................................................. 139
14.1 Bioinformatic data analysis ........................................................................................................... 139
14.2 Comparative phylogenetic reconstructions and analyses ........................................................... 139
14.3 Divergence time estimates ............................................................................................................. 141
14.4 Transition/transversion bias ......................................................................................................... 143
14.5 Lineage through time plot ............................................................................................................. 144
14.6 Investigation of outliers ................................................................................................................. 145
14.6.1 Biscutella laevigata ......................................................................................................................... 145
14.6.2 Bivonaea lutea ................................................................................................................................ 146
14.6.3 Calepina irregularis and Conringia planisiliqua ......................................................................... 147
14.6.4 Iberis saxatilis ................................................................................................................................. 147
14.6.5 Unassigned taxa Fourraea alpina and Ricotia lunaria ............................................................... 147
15 DISCUSSION ........................................................................................................... 148
15.1 Biscutella laevigata ......................................................................................................................... 148
15.2 Bivonaea lutea ................................................................................................................................ 149
15.3 Calepina irregularis and Conringia planisiliqua ......................................................................... 150
15.4 Iberis saxatilis ................................................................................................................................. 150
15.5 Unassigned taxa Fourraea alpina and Ricotia lunaria ............................................................... 151
PART 5: ALL DONE AND DUSTED – THE END OF TROUBLE? ........................ 153
16 PITFALLS – DO ALWAYS LOOK TWICE ........................................................ 154
17 CONCLUSION ......................................................................................................... 158
ACKNOWLEDGEMENTS ............................................................................................ 160
LITERATURE ................................................................................................................. 162
APPENDIX....................................................................................................................... 183
List of Figures
Figure 1 Assumed biological molecule of chalcone synthase. ........................................... 23
Figure 2. Illustration of the chalcone synthase gene (5’ to 3’). .......................................... 25
Figure 3. Illustration of the chalcone synthase gene (5’ to 3’). .......................................... 41
Figure 4. Excerpt from divergence time estimates. ............................................................ 45
Figure 5. Nucleotide and amino acid identity for all tribes. ............................................... 48
Figure 6. Basic sequence statistics of employed tribes ....................................................... 49
Figure 7. Signature of trinucleotides in the chalcone synthase gene. ................................. 59
Figure 8. NJ, Mp and ML analysis of chs sequence data. .................................................. 72
Figure 9. Lineage through time plots for feigned polyphyletic tribes. ............................... 77
Figure 10. Illustration of promoter region from Clausia aprica (DONT). .......................... 78
Figure 11. Motif search among the eight feigned polyphyletic tribes. ............................... 83
Figure 12. Overall average codon usage bias in all tribes. ................................................. 85
Figure 13. Simplified diagramm of duplicated loci. ........................................................... 86
Figure 14. Substitution saturation plot of codon third position. ......................................... 87
Figure 15. Signature of trinucleotided in the chalcone synthase gene. .............................. 89
Figure 16. ML analysis of chs data with additional sequences. ......................................... 98
Figure 17. Ancestral sequence reconstruction of chalcone synthase gene sequences. ..... 100
Figure 18. NJ, MP and ML analysis of adjusted chs sequence data. ................................ 114
Figure 19. Divergence time estimates of duplicated chs genes among the Brassicaceae. 116
Figure 20. Simplified diagram of gene tree from chalcone synthase duplicated loci ....... 117
Figure 21. Simulated data for DNA and amino acid identity for duplicated gene pairs. . 119
Figure 22. Scetch of promoter region from chs of Megacarpaea polyandra. ................... 121
Figure 23. Genomic blast results ...................................................................................... 126
Figure 24. NJ, MP and ML analysis of adjusted data. ...................................................... 140
Figure 25. Substitution saturation plots of the coding chalcone synthase genes .............. 143
Figure 26. Lineage through time plot based on divergence time estimates. ..................... 145
Figure 27. Motif search among promoter region Biscutella laevigata. ............................ 146
List of Tables
Table 1. Overview on tribes. ............................................................................................... 29
Table 2. ITS specific PCR touchdown protocol. ................................................................ 32
Table 3. Results from model tests … .................................................................................. 38
Table 4. List of tribes with corresponding genera and species showing signs of a non-
monophyletic origin concerning chs phylogeny................................................................. 42
Table 5. Parameters and results for the original data set holding 669 sequences of nuclear
chalcone synthase genes ..................................................................................................... 44
Table 6. Statistical attributes of the data set of the complete gene and the coding regions 46
Table 7. Divergence within the tribes and outgroup. .......................................................... 51
Table 8. Overview of all employed tribes. .......................................................................... 53
Table 9. Amino acid changes within conserved residues. .................................................. 57
Table 10. Test for recombination. ....................................................................................... 74
Table 11. Divergence time estimates for reduced data set without Cleome spinosa. ......... 75
Table 12. Significant variability of intronic length within tribes........................................ 80
Table 13 Conserved motif at the carboxyl-terminus of the chalcone synthase. ................. 81
Table 14. Synonymous (dS) and non-synonymous (dN) substitutions and ω values (dN/dS)
for each tribe ....................................................................................................................... 91
Table 15 Tribal ages estimated with synonymous substitution rates .................................. 94
Table 16. Tribal ages estimated with synonymous substitution rates. ................................ 95
Table 17. A conserved motif at the carboxyl-terminus of the chalcone synthase. ............. 96
Table 18. Sequence identities and similarities between duplicated gene pairs. ................ 118
Table 19. Conserved motif at the carboxyl-terminus of the chalcone synthase. .............. 123
Table 20. Output for genomic blast in EnsemblGenomes ................................................ 125
Table 21. Duplicated gene pairs with identical synonymous substitution rate among
branches… ........................................................................................................................ 127
Table 22. Divergence time estimates calculated for all data sets ..................................... 142
Table 23. Divergent chs sequences which have not been discussed................................. 155
Table 24. Checklist for chalcone synthase gene. .............................................................. 158
16
Abstract
The Brassicaceae (Mustards, Cruciferae) are a cosmopolitan family comprising 370
genera and around 3660 species assigned to lately 50 tribes. The tribal system was originally
based on solely homoplasious morphological character traits and reaches back to the early
19th century. De Candolle introduced the first tribal classification of the family nearly 200 years
ago (1821) containing 21 partly still utilised classifications nowadays. Although labelling
seems to be up to date, generic delimitations have been under permanent significant substitution
and replacement. The tribes are arranged in three major monophyletic lineages and some
additional small groups. The relationships within and between these lineages have not been
resolved very clearly yet, as the Brassicaceae are characterised by frequently occurring
hybridisation and polyploidisation events. This could be either the result of early and rapid
radiation events or perhaps be the product of reticulate evolution, lediang to conflicting gene
trees (KOCH & AL-SHEHBAZ 2009).
This lack of resolution could in parts be resolved via the application of the nuclear
encoded chalcone synthase gene (chs) on 39 of the Cruciferous tribes. Several small-scale
tribal-specific duplication events, including age estimations, could be detected giving insight
into the evolutionary history of this molecular single- or low-copy gene. Most definitely a
tendency towards diploidisation is proven by purifying selection as well as accelerated
synonymous substitution rates among this family resulting sooner or later in the reduction of
preliminary multiplied chs loci. Supposedly, chs is single-copy in most diploid mustard taxa.
The determination of orthologous and paralogous gene copies exposed to be of essential
cause as it could be proven that yet functional but fluctuating DNA sequences demonstrate a
huge impact on divergence time estimates as well as on any other extrapolation applying
nucleotide or amino acid data. However, all crown age estimations calculated with diverse
approaches resulted in reasonable output, dating the most recent common ancestor (tmrca) of
the family to the Late Miocene or Oligocene.
Adjustments of the DNA sequences resulted in a well-resolved thoroughgoing gene tree
phylogeny facilitating established taxonomic as well as phylogenetic achievements and do,
moreover, hint to further ambiguities which have to be clarified by the commitment of
additional marker systems.
17
Zusammenfassung
Die Kreuzblütler (Brassicaceae, Crucifereae) sind eine kosmopolitische Familie bestehend aus
etwa 370 Gattungen und 3660 Arten, die 50 Triben zugeteilt werden. Das Tribensystem basierte
ursprünglich auf morphologischen Charaktereigenschaften und kann bis ins 19. Jahrhundert
zurückdatiert werden. De Candolle stellte die erste Tribenklassifikation der Kreuzblütler bereits
vor fast 200 Jahren (1821) vor, welche aus 21 Klassifikationen bestand, die teilweise bis heute
noch in Gebrauch sind. Obwohl es aussehen mag, als wären die Benennungen aktuell, waren
gattungsbezogene Abgrenzungen stets von maßgeblichen Änderungen und Neuerungen
betroffen. Die Triben sind in drei große monophyletische Linien und einige zusätzliche kleine
Gruppen unterteilt. Die Beziehungen sowohl innerhalb als auch zwischen diesen Linien
konnten bis heute nicht befriedigend abgegrenzt werden, was der Tatsache geschuldet ist, dass
die Kreuzblütler durch das regelmäßige Auftreten von Hybridisierungen und
Polyploidisierungen betroffen sind.
Dieser Mangel an Auflösung konnte teilweise durch die Verwendung des nukleär
kodierenden Chalkonsynthase-Gens (chs) bei 39 Triben behoben werden. Verschiedene triben-
spezifische begrenzte Duplikationsereignisse, inklusive deren Altersdatierung, konnten
aufgedeckt werden und liefern damit Einblick in die evolutionäre Geschichte dieses
molekularen Markers, der eine einzelne Kopie oder maximal wenige Genkopien aufweist.
Höchstwahrscheinlich kann eine Tendenz zur Diploidiesrung attestiert werden, die sowohl
durch negative Selektion als auch durch eine beschleunigte synonyme Substitutionsrate
innerhalb der Familie belegt wird, die früher oder später zur Reduktion des vorübergehend
vervielfachten chs Locus führen wird. Wahrscheinlich liegt die Chalkonsynthase als singuläre
Kopie in den meisten diploiden Kreuzblütlern vor.
Die Bestimmung der Orthologie und Paralogie der Genkopien stellte sich als essentiell
heraus, da nachgewiesen werden konnte, dass die noch funktionalen DNA Sequenzen, welche
in absehbarer Zeit fluktuieren werden, großen Einfluss sowohl auf Altersabschätzungen als
auch auf alle weiteren Hochrechnungen haben, die auf Nukleotid- oder Aminosäuresequenzen
basieren. Jedoch resultieren alle Altersberechnungen, die mit verschiedenen Ansätzen den
jüngsten gemeinsamen Vorfahren datieren, in einer Schätzung, die ins späte Miozän
beziehungsweise das Oligozän fällt.
Die Bereinigung der DNA-Sequenzen führte zu einer gut aufgelösten Genbaum
Phylogenie, die bereits nachgewiesene taxonomische und phylogenetische Erkenntnisse
bestätigt. Außerdem konnten verschiedene Ungereimtheiten aufgezeigt werden, welche es nun
durch die Anwendung weiterer Markersysteme aufzuklären gilt.

Introduction
Introduction
19
1 The Mustard Family
The mustards (Brassicaceae), are a large plant family of a high awareness level not only
in research but also in everyday life. They are widely distributed in cuisine as oil and vegetable
plants (cauliflower, Brussels sprouts, kohlrabi, radish, rapeseed oil etc.) and are grown in
gardens, both for consumption and as ornamental plants (Aubrieta ADANS, Erysimum cheiri
(L.) Crantz, Hesperis L., Matthiola R.BR.) all over the world. So they are meanwhile of major
economic and, partly therefore, scientific interest and importance. The probably best known
species among the family is Arabidopsis thaliana (L.) Heynh, proposed by Friedrich Laibach
in 1943, and is assigned to the tribe Camelineae. A. thaliana still is the model organism of
choice, with an increasing importance and impact in respect to systematical, taxonomical,
developmental and evolutionary research due to the tremendous level of knowledge about genes
and their putative functions.
During the last few years, more wild allies and close relatives of Arabidopsis, Arabis
and Brassica are focused on for several acquirements like their resistance to extreme
environmental stress or their capability to attune to the accumulation of heavy metal as
“extremophytes” (AL-SHEHBAZ 2012, AMTMANN 2009, BRESSAN et al. 2001, INAN et al. 2004,
KRAMER 2010). The later named acquirement was investigated in Arabidopsis halleri (L.)
O'Kane & Al-Shehbaz (AL-SHEHBAZ et al. 1999) and Noccaea caerulescens (AL-SHEHBAZ &
O'KANE 2002, INGROUILLE & SMIRNOFF 1986, KOCH & GERMAN 2013, KRAMER 2010), while
stress tolerance (salt, drought, cold) in Eutrema s.l. and Schrenkiella as well as accumulation
(BARKER et al. 2009) have already been subjects to research. The potential of mustards to
provide insight into genetics of flowering time (SCHRANZ et al. 2002), hybridisation,
polyploidisation or gene silencing (PIRES et al. 2004) also supplied the research with an
enhanced insight into evolutionary procedures on many different levels.
Even more information is and will be gathered from the achievement of sequencing full
genomes at a defensible financial and time effort. During the last decade, a magnitude of fully
annotated genomes was made available for research, e.g. Arabidopsis lyrata Reut. (HU et al.
2011), Arabis alpina (LOBREAUX et al. 2014), Thellungiella parvula and Sisymbrium irio
(HAUDRY et al. 2013). Fully sequenced genomes improve the knowledge of functional variants
and provide insight into evolutionary processes only theoretical before hands. As all this has
drawn particular attention towards the family, the Brassicaceae have subsequently become a
model for evolutionary biology (COUVREUR et al. 2010, FRANZKE et al. 2011, KOCH & AL-
SHEHBAZ 2009).
Introduction
20
The phylogenetic position of the Cruciferae, a cosmopolitan family, belonging to the
order Brassicales, within the angiosperms is well established and approved. The Cleomaceae,
for which a family-specific paleoploidisation [Cleome spinosa alpha (Cs-α)] could be
confirmed (BARKER et al. 2009), are acknowledged as sister to the Brassicaceae and therefore
serve as outgroup in various reconstructions (HALL et al. 2002, SCHRANZ & MITCHELL-OLDS
2006). Lately, 50 tribes are recognised (AL-SHEHBAZ et al. 2014) which are arranged in three
major monophyletic lineages, introduced only in 2006, which are lineages 1, 2 and 3 (BEILSTEIN
et al. 2006), and some additional small groups partly not assigned yet. BEILSTEIN et al. (2006)
contributed therewith the first comprehensive phylogeny of the family.
Another group, expanded lineage II, was introduced later by FRANZKE et al. (2011) to
assign several tribes in the family. Relationships between and within these lineages, especially
concerning expanded lineage II, are not satisfyingly resolved yet. The internal classification of
the Brassicaceae has long been and is still controversial. This expanded lineage, especially, is
characterised by a lack of resolution. Lineage I to III are supported by several additional studies
based on various marker systems like nuclear ITS (BAILEY et al. 2006), mitochondrial nad4
(FRANZKE et al. 2009) trnF, adh (alcohol dehydrogenase), chs (chalcone synthase), matK
(plastidic maturase) and ITS (internal transcribed spacer) combined in a supernetwork analysis
(KOCH et al. 2007). This resulted in a largely congruent phylogeny, where expanded lineage II
exacts further enquiries. The polytomy in the backbone phylogeny is not terminally resolved,
yet. The avowal most frequently consulted is the happening of early and rapid radiation events
resulting in minor genetic variation between the respective taxa. The duplication of the genome,
known as whole genome duplication (WGD) or polyploidy, are widely accepted as a prevalent
pathway for speciation in angiosperms and are traded as the event providing new genetic raw
material for evolution of new lineages and species (CAO & SHI 2012, HURKA et al. 1989, KELLIS
et al. 2004, WANG et al. 2011). Hence, WGDs are recognised as fundamental mechanisms in
plant speciation and evolution (DOYLE et al. 2008, SOLTIS et al. 2009). All fully sequenced
flowering plant genomes, including Oryza and Sorghum, contain evidence of
paleopolyploidisation (BARKER et al. 2009).
The analysis of the Arabidopsis genome uncovered at least three ancient rounds of
whole genome duplications within the Brassicaceae during their evolution. The most ancient
known are At - γ (gamma) WGD or 1R, which occurred around 300 million years ago (mya),
near the origin of all angiosperms (DE BODT et al. 2005). Lately, it was discovered that this
paleopolyploidisation event is shared among other Rosids, including papaya (Carica); rape
(Vitis) and poplar (Populus). The intermediate event, referred to as the At-β (beta) or 2R is
Introduction
21
supposed to have happen 170-235 mya (BOWERS et al. 2003, MING et al. 2008), near the
radiation of the eudicots, and could be demonstrated by three groups of syntenic regions among
their genome (JAILLON et al. 2007, MING et al. 2008). The most recent duplication event,
occurring exclusively but independently in the Mustards and Cleomaceae (BHIDE et al. 2014,
BHIDE et al. 2009) is known as At-α (alpha) or 3R. The age of that event which, in parallel,
coincides with the radiation event of the core Brassicaceae, remains controversial. On the one
hand due to the generation time hypothesis which suggests that the dating of all three
duplication events seems to be a vast overestimation, settling At-γ as the synonymous
duplication event detected in Carica and Vitis, shared by all Rosids and maybe even all
eudicots. Carica, as a member of the Brassicales, did not undergo At-β, the constructive
consequence is that the duplication event took place after Carica diverged from the rest of the
Brassicales which dates the age of the intermediate WGD to a more recent point (LYONS et al.
2008). On the other hand, various approaches, concerning mostly the methodology, result in
highly heterogeneous outcome. First family-wide studies used estimated rates of synonymous
nucleotide substitutions (KOCH et al. 2001, KOCH et al. 2000) or, alternatively, the calculated
age of the Arabidopsis duplication event (BELL et al. 2010, ERMOLAEVA et al. 2003, FAWCETT
et al. 2009, SCHRANZ & MITCHELL-OLDS 2006) to deflect the age of the Cruciferae crown group
including the most recent common ancestor.
These estimates concluded with evaluations to be between 15 to 60 million years and
above (BEILSTEIN et al. 2010, COUVREUR et al. 2010, FRANZKE et al. 2009) depending on
calibration approach, molecular data matrices and deviating sampling. But most estimations
result in approximations that date the origin of the Brassicaceae to the Late Eocene or the
Oligocene. However, there is still a debate going on concerning the method of secondary
calibration via fossil constraints in the Brassicaceae. As mentioned later (see 2: The Tribal
System of the Brassicaceae), morphological character traits in this family evolved
independently several times (homoplasy), which, as a consequence, increases the effort to
receive authentic anchor points representing the reliable phylogenetic placement intended to.
For example, the putative Oligocene fruit fossil is assigned to the Thlaspideae. Assuming this
assignment to the respective tribe is erroneous, as the estimates of divergence are biased
(FRANZKE et al. 2011). Divergence time estimates still remain an open issue although a rough
time frame is localised and affirmed to date.
But it is not only polyploidisation that shape the contemporary image of the
Brassicaceae. Other important events as recombination, small scale duplications, hybridisation,
convergent, parallel and reticulate evolution frequently occur and influence genome size,
Introduction
22
chromosome number, chromosome arrangement, number of gene copies, adaptational
mechanisms, to name only a few consequences affected, are being examined extensively
(LIHOVA et al. 2006, LYSAK & LEXER 2006).
2 The Tribal System of the Brassicaceae
“What looks alike is alike” used to be the guideline for earlier tribal classifications,
totally embezzling parallel evolution. This system, which is more than one century of age
(HAYEK 1911, JANCHEN 1942, SCHULZ 1936) and summarised in numerous reviews (AL-
SHEHBAZ 2006, APPLE & AL-SHEHBAZ 2002, KOCH et al. 2003, MITCHELL-OLDS et al. 2004)
was merely based on morphological characters which could be simply observed. Prior to 2005
only the tribe Brassiceae did and still does reflect the phylogenetic relationships of its
component genera, while all other tribes, even Lepidieae, which were discussed to be
monophyletic as well (ZUNK et al. 2000), were proven to derive from artificially delimited
origin (AL-SHEHBAZ 2006). This resulted in an unclear artificial system which, since then, as a
consequence, is under constant rearrangement. Due to the permanently increase of DNA
techniques, methods and material in molecular biology, especially within the last 20 years, the
tribal system is changing from a synthetic to a natural system, reflecting actual phylogenetic
relationships within the Crucifer family. It became clear that most of the taxonomically relevant
morphological characters evolved convergent, and only a small amount of taxonomic traits, that
evolved uniquely, remains (FRANZKE et al. 2011).
This vivid changes are reflected by impressive numbers of research results with
subsequent tribal reestablishments, recreations and renamings (AL-SHEHBAZ et al. 2011, AL-
SHEHBAZ & O'KANE 2002, AL-SHEHBAZ & WARWICK 2007, GERMAN et al. 2009, GERMAN &
AL-SHEHBAZ 2010, KOCH & GERMAN 2013, RESETNIK et al. 2013, WARWICK et al. 2010)
published within considerably short lapses of time. The tribal classification of AL-SHEHBAZ et
al. (2006) recognised 25 tribes. While only eight years later, in 2014, 49 tribes were actually
approved, which is close to a duplication of this systematic unit. Just very recently, a new genus
in the tribe Malcolmieae, namely Marcus-Kochia, was established (AL-SHEHBAZ et al. 2014)
changing again the overall amount of genera in Brassicaceae. The actual achievements, mainly
gathered within the last two decades, resulted in a delimitation comprising 320 genera with
3660 species organised in 49 (now 50) tribes, where only a small proportion of Brassicaceae
taxa, namely less than 3%, (34 genera with 90 species) remains unassigned (Al-Shehbaz,
2012a).
Introduction
23
Much effort was put in retracing and assembling the evolutionary history of branches or
even the whole Mustard family. The majority of contributions combined morphological
characters like trichomes (AL-SHEHBAZ & O'KANE 2002, AL-SHEHBAZ & WARWICK 2007,
BEILSTEIN et al. 2008, FUENTES-SORIANO & AL-SHEHBAZ 2013, KOCH 2003) or seed
morphology (AL-SHEHBAZ 2012, BROCHMANN 1992, KHALIK 2002, KOCH & MUMMENHOFF
2001), with molecular data resulting in phylogenies gaining incredible insight into the putative
factual history and taxonomic relationships (AL-SHEHBAZ 2006, AL-SHEHBAZ et al. 2006,
BEILSTEIN et al. 2006, BEILSTEIN et al. 2008, GERMAN et al. 2009, KOCH et al. 2007, WARWICK
et al. 2010). The overall ambition is to establish a complete delamination of the Brassicaceae
family comprising comprehensible definitions and boundaries of monophyletic tribes, which
reflect the natural relationships within this plant family and to assign the last less than 5% of
the remaining unassigned taxa to their respective position in phylogenies. A synopsis, covering
the complete Crucifers, was recently provided by AL-SHEHBAZ (2012), which already is, in
minor parts, not representing the latest findings.
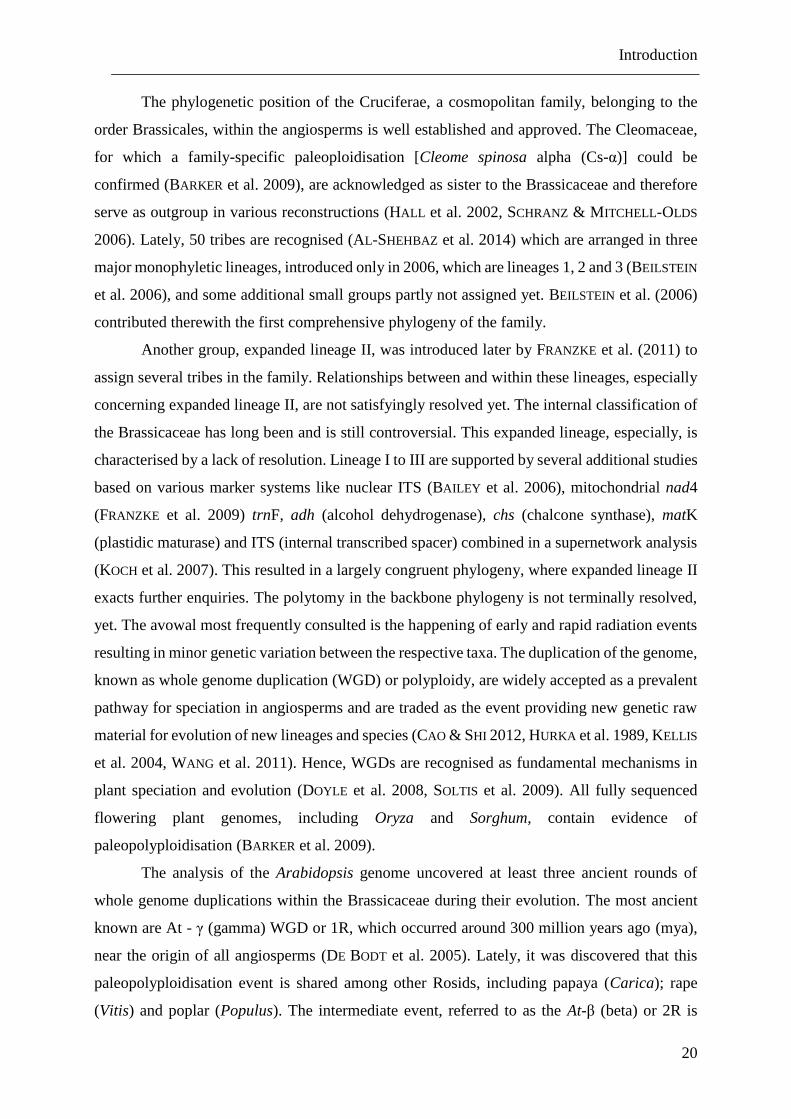
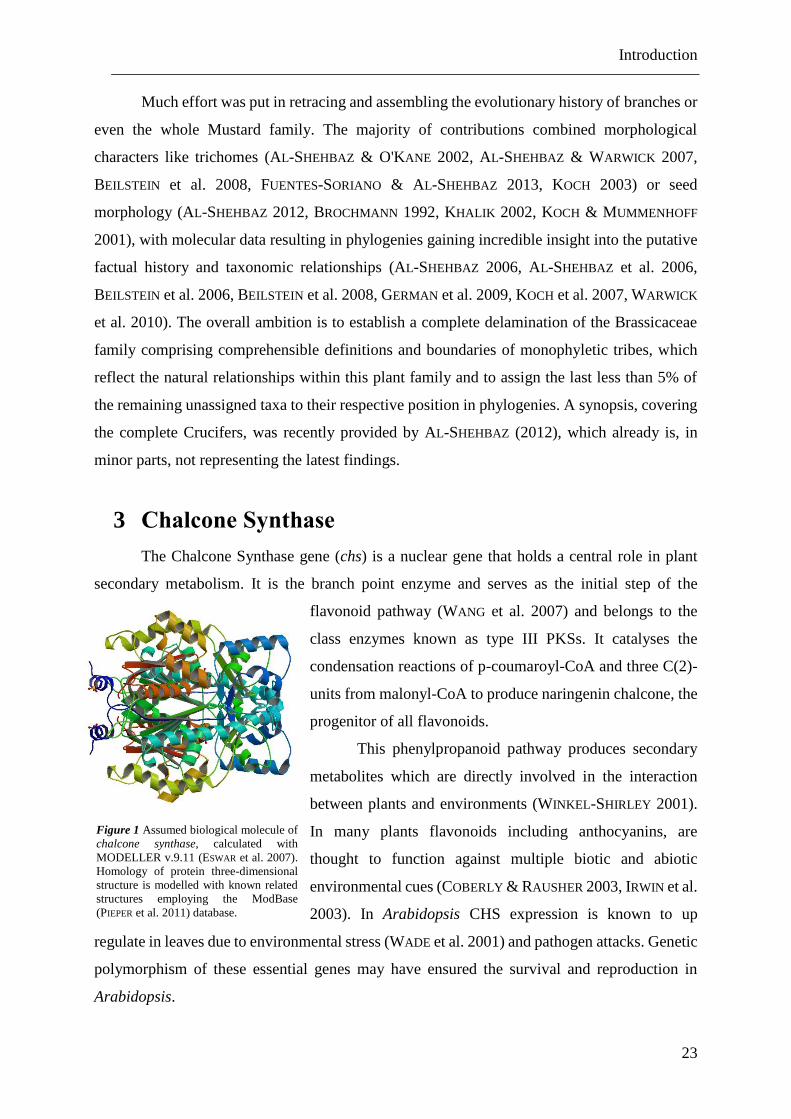
3 Chalcone Synthase
The Chalcone Synthase gene (chs) is a nuclear gene that holds a central role in plant
secondary metabolism. It is the branch point enzyme and serves as the initial step of the
flavonoid pathway (WANG et al. 2007) and belongs to the
class enzymes known as type III PKSs. It catalyses the
condensation reactions of p-coumaroyl-CoA and three C(2)-
units from malonyl-CoA to produce naringenin chalcone, the
progenitor of all flavonoids.
This phenylpropanoid pathway produces secondary
metabolites which are directly involved in the interaction
between plants and environments (WINKEL-SHIRLEY 2001).
In many plants flavonoids including anthocyanins, are
thought to function against multiple biotic and abiotic
environmental cues (COBERLY & RAUSHER 2003, IRWIN et al.
2003). In Arabidopsis CHS expression is known to up
regulate in leaves due to environmental stress (WADE et al. 2001) and pathogen attacks. Genetic
polymorphism of these essential genes may have ensured the survival and reproduction in
Arabidopsis.
Figure 1 Assumed biological molecule of
chalcone synthase, calculated with
MODELLER v.9.11 (ESWAR et al. 2007).
Homology of protein three-dimensional
structure is modelled with known related
structures employing the ModBase
(PIEPER et al. 2011) database.
Introduction
24
It has been demonstrated that enhanced flavonoid synthesis is highly associated with
pigment biosynthesis (BOSS et al. 1996, KOES et al. 2005, SCHMELZER et al. 1988), which in
turn affects the plant-pollinator interaction (IRWIN et al. 2003, SCHEMSKE & BIERZYCHUDEK
2001), disease resistance, UV protection in plant tissues (JOOS & HAHLBROCK 1992, KOOTSTRA
1994, WINKEL-SHIRLEY 2002), and alleviation of heat stress. All these adaptation traits affect
the survival and reproduction of flowering plants. Therefore the products of this secondary
metabolic pathway that control the flavonoid production, enable the plant to adapt more
efficiently to a stressful environment (YANG et al. 2002).
To date not only CHS but also other enzymes involved in plant development and stress
adaptation, like phenylalanin ammonia lyase (PAL), chalcone isomearse (CHI), stilbene
synthase (STS) and flavanone 3-hydroxlase (F3H) have been isolated and studied in different
model plants. It was shown through FLIM FRET imaging that CHS interacts with these
enzymes (CROSBY et al. 2011). The CHS enzyme is encoded by a small multigene family in
many plant taxa, varying in copy number (KOES et al. 1989). In most dicots, CHS form a family
with six to twelve members, such as in Populus (TUSKAN et al. 2006), Glycine max (TUTEJA et
al. 2004), Viola cornuta (FARZAD et al. 2005, VAN DEN HOF et al. 2008) and petunia (KOES et
al. 1989). Only five functional chs genes have been described in morning glories (DURBIN et
al. 2000), with special reference to the genus Ipomea, while nine gene copies exist in clover
(HOWLES et al. 1995). It was suggested by (DURBIN et al. 1995), that new chs genes in flowering
plants are recruited repeatedly resulting in increased nucleotide substitutions in newly
duplicated genes. Providing further evidence of functional divergence appears to have occurred
repeatedly in angiosperms (YANG et al. 2002).
In Arabidopsis thaliana, two active additional chs-like paralogous genes have been
identified (WANG et al. 2007). Consequently, further copies are also often called “chs-like”
regardless of their functionality. However, the chs-like genes in Arabidopsis thaliana (WANG
et al. 2007) show a different expression pattern (ZHOU et al. 2013) in comparison to the one
discovered first, and only one gene encodes chalcone synthase (OWENS et al. 2008). In the close
relative Arabidopsis halleri ssp. gemmifera at least two additional chs-like copies have been
described (WANG et al. 2007). Both sets of paralogs have been long diverged as the sequence
identity is low, which suggests diverse evolutionary travelling. This indicates that the chs gene
is single copy in nearly all Arabidopsis taxa and, moreover, in the whole Brassicaceae family
(WANG et al. 2007).
Introduction
25
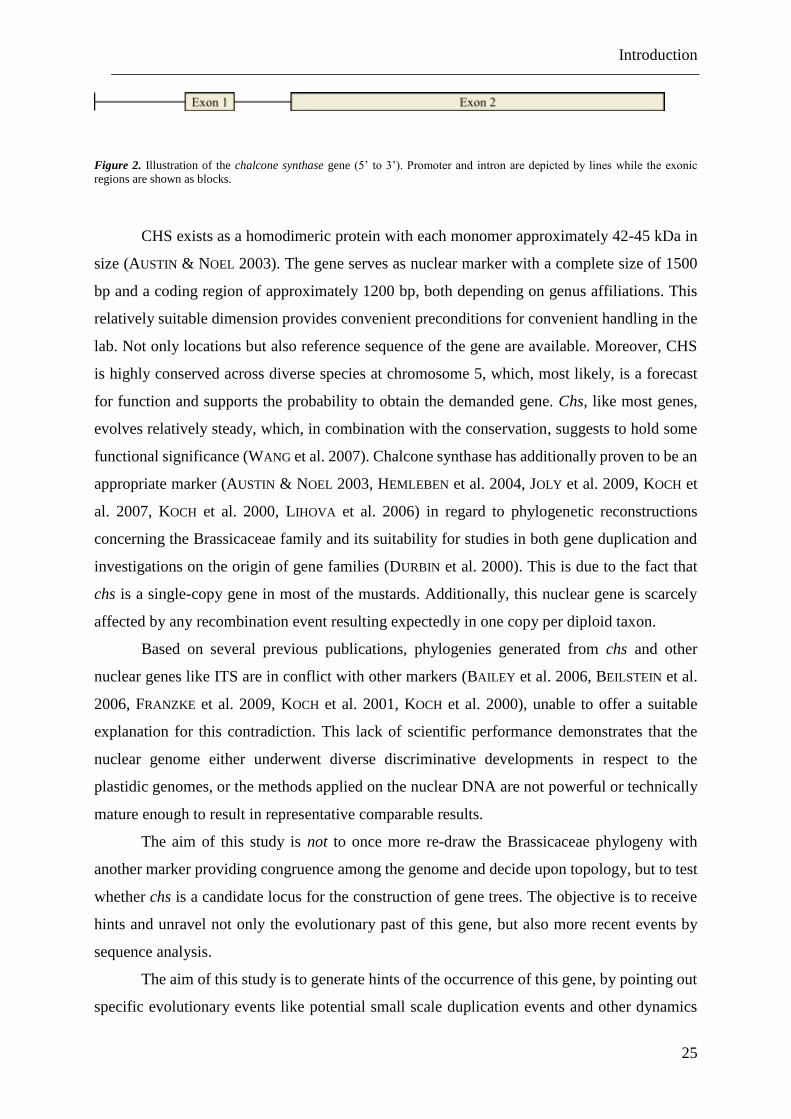
Figure 2. Illustration of the chalcone synthase gene (5’ to 3’). Promoter and intron are depicted by lines while the exonic
regions are shown as blocks.
CHS exists as a homodimeric protein with each monomer approximately 42-45 kDa in
size (AUSTIN & NOEL 2003). The gene serves as nuclear marker with a complete size of 1500
bp and a coding region of approximately 1200 bp, both depending on genus affiliations. This
relatively suitable dimension provides convenient preconditions for convenient handling in the
lab. Not only locations but also reference sequence of the gene are available. Moreover, CHS
is highly conserved across diverse species at chromosome 5, which, most likely, is a forecast
for function and supports the probability to obtain the demanded gene. Chs, like most genes,
evolves relatively steady, which, in combination with the conservation, suggests to hold some
functional significance (WANG et al. 2007). Chalcone synthase has additionally proven to be an
appropriate marker (AUSTIN & NOEL 2003, HEMLEBEN et al. 2004, JOLY et al. 2009, KOCH et
al. 2007, KOCH et al. 2000, LIHOVA et al. 2006) in regard to phylogenetic reconstructions
concerning the Brassicaceae family and its suitability for studies in both gene duplication and
investigations on the origin of gene families (DURBIN et al. 2000). This is due to the fact that
chs is a single-copy gene in most of the mustards. Additionally, this nuclear gene is scarcely
affected by any recombination event resulting expectedly in one copy per diploid taxon.
Based on several previous publications, phylogenies generated from chs and other
nuclear genes like ITS are in conflict with other markers (BAILEY et al. 2006, BEILSTEIN et al.
2006, FRANZKE et al. 2009, KOCH et al. 2001, KOCH et al. 2000), unable to offer a suitable
explanation for this contradiction. This lack of scientific performance demonstrates that the
nuclear genome either underwent diverse discriminative developments in respect to the
plastidic genomes, or the methods applied on the nuclear DNA are not powerful or technically
mature enough to result in representative comparable results.
The aim of this study is not to once more re-draw the Brassicaceae phylogeny with
another marker providing congruence among the genome and decide upon topology, but to test
whether chs is a candidate locus for the construction of gene trees. The objective is to receive
hints and unravel not only the evolutionary past of this gene, but also more recent events by
sequence analysis.
The aim of this study is to generate hints of the occurrence of this gene, by pointing out
specific evolutionary events like potential small scale duplication events and other dynamics

Introduction
26
that could have ended up in putative copy number variations in branches or lineages of the
Brassicaceae, or even within the complete family.
Part 1: Trouble with the Outgroup
27
Part 1: Trouble with the Outgroup
Part 1: Trouble with the Outgroup
28
4 Material and Methods
Experimental and analytical procedures for the initial chalcone synthase (chs) data are
specified in the first part of the work on hand. Within this part, the complete data set, holding
668 Brassicaceae sequences and one Cleome sequence, which serves as outgroup, are
employed. Descriptive as well as experimental approaches are explained and applied on those
669 chs copies.
4.1 Experimental set-up
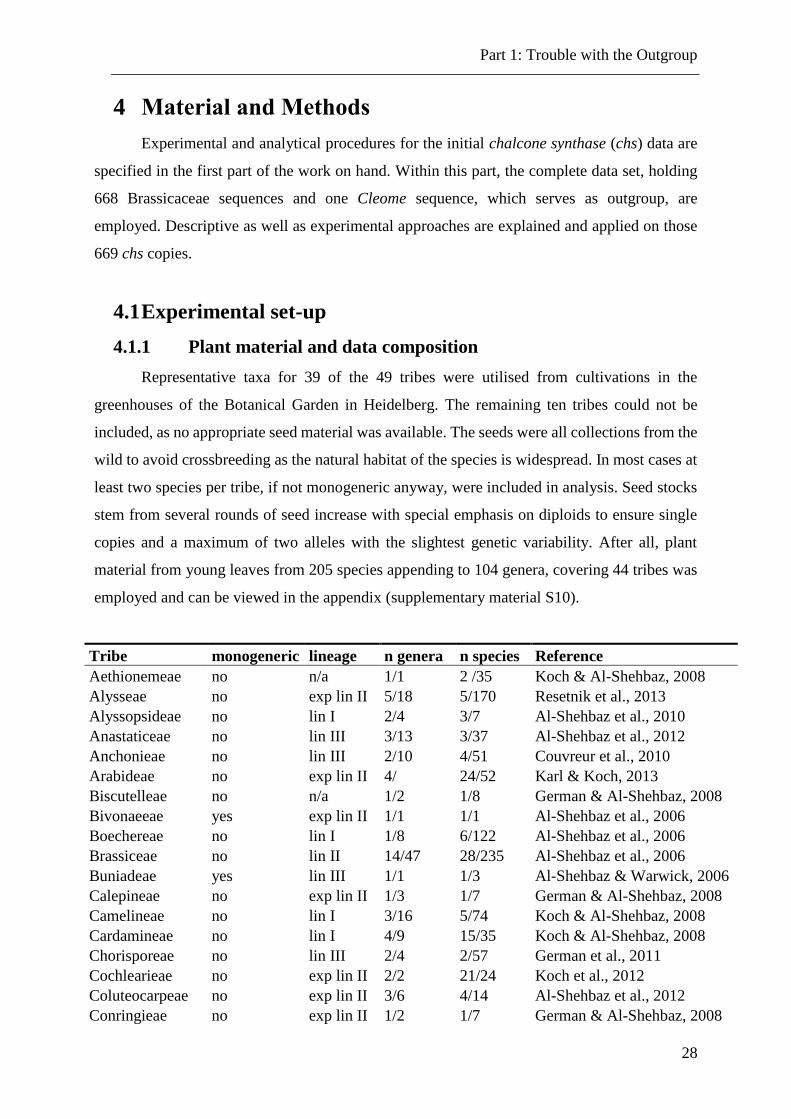
4.1.1 Plant material and data composition
Representative taxa for 39 of the 49 tribes were utilised from cultivations in the
greenhouses of the Botanical Garden in Heidelberg. The remaining ten tribes could not be
included, as no appropriate seed material was available. The seeds were all collections from the
wild to avoid crossbreeding as the natural habitat of the species is widespread. In most cases at
least two species per tribe, if not monogeneric anyway, were included in analysis. Seed stocks
stem from several rounds of seed increase with special emphasis on diploids to ensure single
copies and a maximum of two alleles with the slightest genetic variability. After all, plant
material from young leaves from 205 species appending to 104 genera, covering 44 tribes was
employed and can be viewed in the appendix (supplementary material S10).
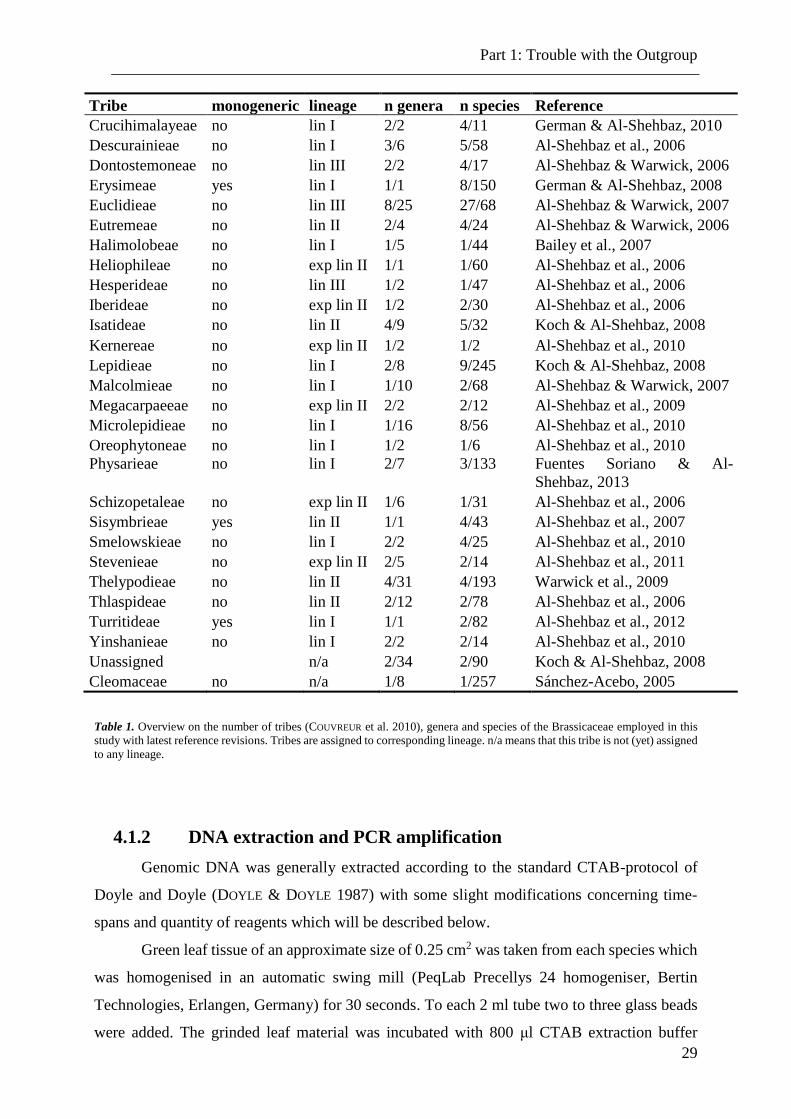
Tribe monogeneric lineage n genera n species Reference
Aethionemeae no n/a 1/1 2 /35 Koch & Al-Shehbaz, 2008
Alysseae no exp lin II 5/18 5/170 Resetnik et al., 2013
Alyssopsideae no lin I 2/4 3/7 Al-Shehbaz et al., 2010
Anastaticeae no lin III 3/13 3/37 Al-Shehbaz et al., 2012
Anchonieae no lin III 2/10 4/51 Couvreur et al., 2010
Arabideae no exp lin II 4/ 24/52 Karl & Koch, 2013
Biscutelleae no n/a 1/2 1/8 German & Al-Shehbaz, 2008
Bivonaeeae yes exp lin II 1/1 1/1 Al-Shehbaz et al., 2006
Boechereae no lin I 1/8 6/122 Al-Shehbaz et al., 2006
Brassiceae no lin II 14/47 28/235 Al-Shehbaz et al., 2006
Buniadeae yes lin III 1/1 1/3 Al-Shehbaz & Warwick, 2006
Calepineae no exp lin II 1/3 1/7 German & Al-Shehbaz, 2008
Camelineae no lin I 3/16 5/74 Koch & Al-Shehbaz, 2008
Cardamineae no lin I 4/9 15/35 Koch & Al-Shehbaz, 2008
Chorisporeae no lin III 2/4 2/57 German et al., 2011
Cochlearieae no exp lin II 2/2 21/24 Koch et al., 2012
Coluteocarpeae no exp lin II 3/6 4/14 Al-Shehbaz et al., 2012
Conringieae no exp lin II 1/2 1/7 German & Al-Shehbaz, 2008
Part 1: Trouble with the Outgroup
29
Tribe monogeneric lineage n genera n species Reference
Crucihimalayeae no lin I 2/2 4/11 German & Al-Shehbaz, 2010
Descurainieae no lin I 3/6 5/58 Al-Shehbaz et al., 2006
Dontostemoneae no lin III 2/2 4/17 Al-Shehbaz & Warwick, 2006
Erysimeae yes lin I 1/1 8/150 German & Al-Shehbaz, 2008
Euclidieae no lin III 8/25 27/68 Al-Shehbaz & Warwick, 2007
Eutremeae no lin II 2/4 4/24 Al-Shehbaz & Warwick, 2006
Halimolobeae no lin I 1/5 1/44 Bailey et al., 2007
Heliophileae no exp lin II 1/1 1/60 Al-Shehbaz et al., 2006
Hesperideae no lin III 1/2 1/47 Al-Shehbaz et al., 2006
Iberideae no exp lin II 1/2 2/30 Al-Shehbaz et al., 2006
Isatideae no lin II 4/9 5/32 Koch & Al-Shehbaz, 2008
Kernereae no exp lin II 1/2 1/2 Al-Shehbaz et al., 2010
Lepidieae no lin I 2/8 9/245 Koch & Al-Shehbaz, 2008
Malcolmieae no lin I 1/10 2/68 Al-Shehbaz & Warwick, 2007
Megacarpaeeae no exp lin II 2/2 2/12 Al-Shehbaz et al., 2009
Microlepidieae no lin I 1/16 8/56 Al-Shehbaz et al., 2010
Oreophytoneae no lin I 1/2 1/6 Al-Shehbaz et al., 2010
Physarieae no lin I 2/7 3/133 Fuentes Soriano & Al-
Shehbaz, 2013
Schizopetaleae no exp lin II 1/6 1/31 Al-Shehbaz et al., 2006
Sisymbrieae yes lin II 1/1 4/43 Al-Shehbaz et al., 2007
Smelowskieae no lin I 2/2 4/25 Al-Shehbaz et al., 2010
Stevenieae no exp lin II 2/5 2/14 Al-Shehbaz et al., 2011
Thelypodieae no lin II 4/31 4/193 Warwick et al., 2009
Thlaspideae no lin II 2/12 2/78 Al-Shehbaz et al., 2006
Turritideae yes lin I 1/1 2/82 Al-Shehbaz et al., 2012
Yinshanieae no lin I 2/2 2/14 Al-Shehbaz et al., 2010
Unassigned n/a 2/34 2/90 Koch & Al-Shehbaz, 2008
Cleomaceae no n/a 1/8 1/257 Sánchez-Acebo, 2005
Table 1. Overview on the number of tribes (COUVREUR et al. 2010), genera and species of the Brassicaceae employed in this
study with latest reference revisions. Tribes are assigned to corresponding lineage. n/a means that this tribe is not (yet) assigned
to any lineage.
4.1.2 DNA extraction and PCR amplification
Genomic DNA was generally extracted according to the standard CTAB-protocol of
Doyle and Doyle (DOYLE & DOYLE 1987) with some slight modifications concerning time-
spans and quantity of reagents which will be described below.
Green leaf tissue of an approximate size of 0.25 cm2 was taken from each species which
was homogenised in an automatic swing mill (PeqLab Precellys 24 homogeniser, Bertin
Technologies, Erlangen, Germany) for 30 seconds. To each 2 ml tube two to three glass beads
were added. The grinded leaf material was incubated with 800 μl CTAB extraction buffer
Part 1: Trouble with the Outgroup
30
[containing 2% (w/v) CTAB, 100 mM Tris-HCl, 1.4 M NaCl, 20 mM Na-EDTA, pH = 8.0 and
freshly added 0.2% β-Mercaptoethanol] each at 60°C on a thermo block (Eppendorf) for 30
minutes. Then, 500 μl cold chloroform-isopropanol (1:24, v/v) were added. The mixture was
inverted and stored at 4°C for 15 minutes. Afterwards the samples were centrifuged at
maximum speed (40,000 rpm) for 5 minutes at 4°C as well. The upper phase of about 600 μl
was extracted and mixed with 400 μl ice-cold isopropanol and left on ice for 10 minutes. After
5 minutes of centrifugation the isopropanol-phase was separated. The remaining pellets were
washed twice with 350 μl of 70% ethanol. After drying, 50 μl of low TE-buffer admixed with
2 U of RNAse were added for RNA digestion (60 minutes at 37°C on a thermo mix).
Concentration of extracted DNA was measured on a Nanodrop ND-1000 Spectrophoto-
meter (Nanodrop Technologies Inc., Wilmington, USA) and all samples were diluted to a final
DNA concentration of 100 ng/μl for the following cloning procedure.
To amplify the respective markers, PCR were performed in a reaction volume of 25 μl
each, which contained 10-50 ng template DNA, 5 μl PCR reaction buffer, a final concentration
of 2.0 mM MgCl2, 10 pmol of each primer, 2.5 pmol of each nucleotide, and 0.5 U of Mango
Taq Polymerase (Bioline, Luckenwalde, Germany). Chalcone synthase sequences were initially
amplified with the primer pair CHS-PRO1-fw [5'-CAT CTG CCC GTC CAT CAA ACC TAC
C-3'] and CHS-EX2-TERM-rev [5'-TTA GAG AGG AAC GCT CTG CAA GAC-3'], as
designed by Koch et al. (2000). The forward primer is situated in the promoter of the gene
(CHS-PRO1-fw) leaving less than 200 nucleotides of the regulatory regions to make sure that,
firstly, the beginning of the coding region is completely synthesised and secondly, that the
remaining part of the promoter ensures the functionality of the gene. The reverse primer (CHS-
EX2-TERM-rev) starts with the end of the second exon. Consequently, the complete gene was
amplified at one stretch. Some accessions from the tribe Arabideae showed to be recalcitrant
and could not be amplified although several attempts were conducted. Therefore, a new primer
pair was designed (ARA-N-CHS-1-for [5'-GGC ACA RAG AGC TGA TGG A-3'] and ARA-
N-CHS-5-rev [5'- AGA GAA GAT GAG AGC RAC WCG -3']) and used on those accessions
indeed resulting in reliable amplifications, as they are more discriminative. PCR products from
this primer combination result in shorter sequences, amplifying only a partial fragment of the
gene.
All amplifications were run on a Peltier Thermal Cycler (MJ Research, Waltham, MA,
USA) with the following programme. Initial denaturation step for 3 minutes at 95°C, followed
by 30 cycles of 30 seconds at 95°C (denaturation) and 30 cycles at 58°C for 30 seconds, as well
(annealing). Another 30 cycles were performed for 1 minute at 72°C for elongation and 5
Part 1: Trouble with the Outgroup
31
minutes at the same temperature for the final elongation. The procedure was stopped with a
hold at 10°C.
PCR products were run with electrophoresis in a 1.5% agarose gel in TAE-buffer which
was stained with GelRed Nucleic Acid Stain (Biotium, Hayward, CA, USA). As reference for
DNA fragment length, 1 μl smart ladder (Eurogentec; Cologne; Germany). To ensure the
absence of contamination and the quality of the PCR run, one negative (PCR mix with added
highly pure water instead of DNA) and one positive (already tested and amplified DNA
fragment) reference were applied to each agarose gel. The complete fragment length, around
1,400 base pairs, was expected to be displayed on the gel.
4.1.3 DNA cloning and sequencing
Chs is reported to be single-copy (CAIN et al. 1997, KOCH et al. 2000), in most diploids
or at least a low-copy gene. But two chs-like genes have been identified in Arabidopsis by
Wang et al. (2007), and up to 13 copies can be identified in other angiosperms like Ipomea
(DURBIN et al. 1995). To avoid accidental multiplication of pseudogenes, resampling or
transferred genes, a colony PCR can be employed to test the plasmids, but only after the cloning
procedure. Therefore, the respective fragments were cloned into chemical competent E. coli
cells (strain JM109). DNA cloning does not only heighten the amount of the respective marker,
it also stabilises the received products. Purified DNA (Wizard SV Gel and PCR Clean-Up
System; Promega, Madison, WI, USA) was ligated into a vector (pGEM-T vector system,
Promega, Madison, WI, USA). Afterwards the E. coli cells are transformed with the vector-
insert construct. Recombinant bacteria were allowed to grow overnight in agarose plates,
containing X-gal, for blue and white screening, selecting for further analysis only white
(positive) colonies.
A colony PCR was conducted in order to detect as many clones as possible carrying the
complete gene sequence The universal primer T7 [5'-TAA TAC GAC TCA CTA TAG GG-3']
and SP6 [5'-ATT TAG GTG ACA CTA TAG AA-3'] in order to detect potential DNA sequence
variation.
Sequencing of all chs plasmids was performed at two commercial sequencing services
(GATC, Konstanz, Germany; MWG Eurofins, Ebersberg, Germany). In case fragments were
directly sequenced (i.e. without subsequent cloning), either the identical amplification primers
or universal primers M13 (-21) [5'-TGT AAA ACG ACG GCC AGT-3'] and M13 (-29) [5'-
CAG GAA ACA GCT ATG ACC-3'] were employed.
Part 1: Trouble with the Outgroup
32
4.1.4 Internal validation with ITS
For internal taxonomic validation of the utilised genera, the internal transcribed spacer
regions (ITS) of the nuclear ribosomal RNA were employed. ITS1 and ITS2 are the “most
commonly used nuclear markers (EDGER et al. 2014)“ in phylogenetic studies. The GeneBank
accession numbers for the synthesised ITS sequences referred to at the work on hand are
LN589647-LN589719.
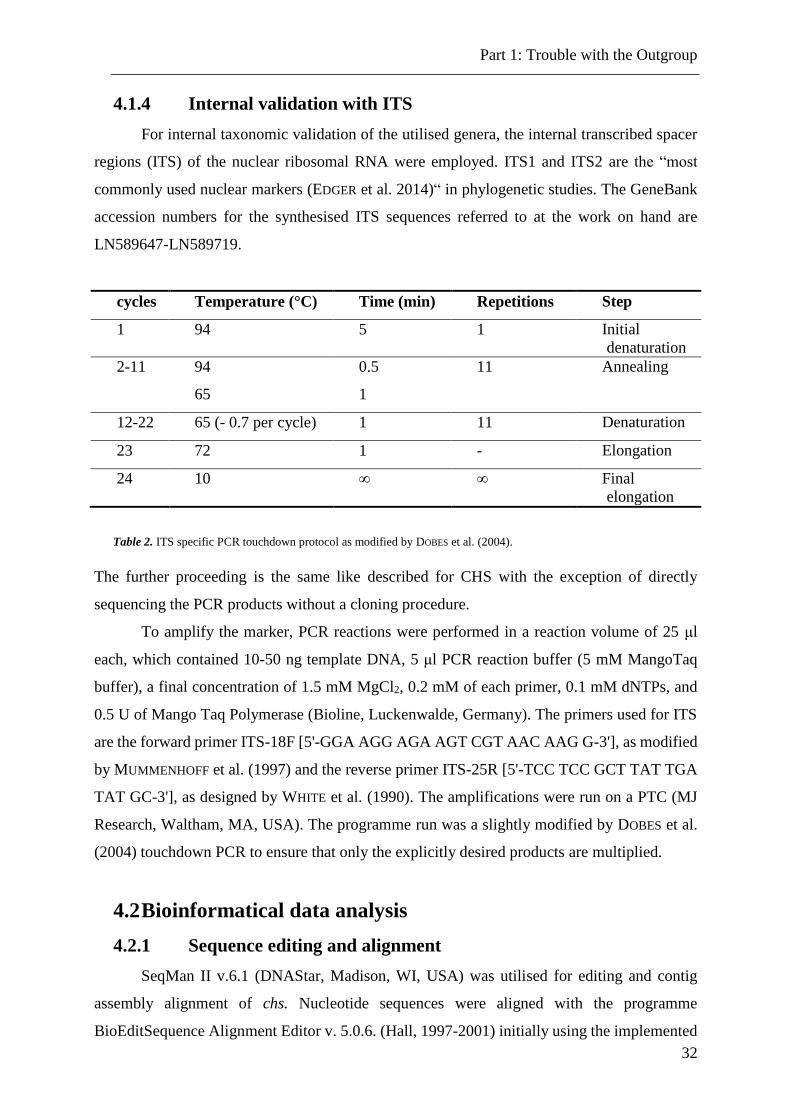
cycles Temperature (°C) Time (min) Repetitions Step
1 94 5 1 Initial
denaturation
2-11 94 0.5 11 Annealing
65 1
12-22 65 (- 0.7 per cycle) 1 11 Denaturation
23 72 1 - Elongation
24 10 ∞ ∞ Final
elongation
Table 2. ITS specific PCR touchdown protocol as modified by DOBES et al. (2004).
The further proceeding is the same like described for CHS with the exception of directly
sequencing the PCR products without a cloning procedure.
To amplify the marker, PCR reactions were performed in a reaction volume of 25 μl
each, which contained 10-50 ng template DNA, 5 μl PCR reaction buffer (5 mM MangoTaq
buffer), a final concentration of 1.5 mM MgCl2, 0.2 mM of each primer, 0.1 mM dNTPs, and
0.5 U of Mango Taq Polymerase (Bioline, Luckenwalde, Germany). The primers used for ITS
are the forward primer ITS-18F [5'-GGA AGG AGA AGT CGT AAC AAG G-3'], as modified
by MUMMENHOFF et al. (1997) and the reverse primer ITS-25R [5'-TCC TCC GCT TAT TGA
TAT GC-3'], as designed by WHITE et al. (1990). The amplifications were run on a PTC (MJ
Research, Waltham, MA, USA). The programme run was a slightly modified by DOBES et al.
(2004) touchdown PCR to ensure that only the explicitly desired products are multiplied.
4.2 Bioinformatical data analysis
4.2.1 Sequence editing and alignment
SeqMan II v.6.1 (DNAStar, Madison, WI, USA) was utilised for editing and contig
assembly alignment of chs. Nucleotide sequences were aligned with the programme
BioEditSequence Alignment Editor v. 5.0.6. (Hall, 1997-2001) initially using the implemented
Part 1: Trouble with the Outgroup
33
programme CLUSTAL-W (THOMPSON et al. 1994) with changed Multiple Alignment
parameters to Gap Opening Penalty = 3 and Gap Extension Penalty = 1,8 to improve accuracy.
Promoter/intron/exon boundaries were determined by comparing the genomic sequence to
previously published chs exonic boundaries (KOCH et al. 2001). The alignment was visually
examined and manually adjusted guided by identification of open reading frames, exon
positions and termination codons. For revision and certainty, each alignment was double-
checked with another programme, MUSCLE (EDGAR 2004), implemented in MEGA5
(TAMURA et al. 2011). Complete identical sequences (number of identical sequences) were
identified and eliminated with the programme ElimDupes (KUIKEN et al. 2005) from the data
set as they do not provide any additional or necessary information.
A study by THOMPSON et al. (1999) compared a number of alignment programmes and
showed that there is a major correlation between the accuracy of the aligned sequences and the
resulting phylogenetic trees. The calculated threshold for amino acid identity is 20% as this
results in around 50% correctly aligned residues. Another study (OGDEN & ROSENBERG 2006)
demonstrated that the tree accuracy varies only little with alignment accuracy as long as this is
above 50%. Therefore the pairwise amino acid distance, which is the proportion (p) of amino
acid sites at which two sequences are different, of the overall multi-sequence alignment was
tested via a p-distance (1 – amino acid identity) based tool, implemented in MEGA version 5
(TAMURA et al. 2011), as well.
Afterwards, the complete data set was divided into the single tribes to receive a better
impression of the closely related genera and their relationships within and between the taxa.
Therefore the promoter and intron regions, as they were too variable to be aligned with
confidence, were manually removed and the remaining sequences were aligned in individual
alignments (upon request) following the same procedure as described above for the complete
alignment. Alignment accuracy was calculated for each tribe, as well.
Nucleotide sequences have been deposited in the European Molecular Biology
Laboratory (EMBL) GeneBank library (LK937201-LK937666 and LN623709- LN623711),
available from European Nucleotide Archive (ENA). A large overall alignment (alignments are
available on request) serves as the bases of any splitting and analysis of further subsets.
4.3 Comparative phylogenetic reconstructions and analyses
4.3.1 Tests applied on data set prior to phylogenetic analyses
Prior to phylogenetic inferences, the best-fit nucleotide substitution model and the
parameter estimates used for tree reconstruction, according to the Akaike Information Criteria
Part 1: Trouble with the Outgroup
34
(AIC), for the respective data set were identified via ML analyses. Therefore the Modeltest 3.7
(POSADA & CRANDALL 1998) in conjunction with PAUP (Phylogenetic Analysis Using
Parsimony) and, for comparison, the model test (Find best Protein/DNA models (ML)
implemented in MEGA5 TAMURA et al. (2011) were applied on the data set.
To test whether the data are suitable for estimating neighbor joining trees, NEI et al.
(2000) described in their book that the Jukes-Cantor (JC) distance method should be applied on
data sets previous to the decision on an appropriate algorithm. The average pairwise distance
was calculated to not exaggerate 1.0. Each data resulting in > 1.0 are not suitable for estimating
NJ trees. Jukes-Cantor distances were calculated using MEGA5 (TAMURA et al. 2011). This
method was applied on the complete data as well as on every partial data set before applying
the NJ algorithm.
4.3.2 Phylogenetic analysis
For a start, two algorithms were applied on the data for phylogenetic analyses. The
neighbor joining (NJ) method, using Kimura’s two-parameter model from 1980 and a
maximum-parsimony (MP) method using PAUP* 4.0b10 (SWOFFORD 2011). A robustness test
of phylogenetic hypotheses is not needed (topology test), because no additional marker systems
are utilised.
Cleome spinosa was used as outgroup to root the trees, as the Cleomaceae are known to
be sister to the Brassicaceae and hence are proven to fulfil the requirements to serve as outgroup.
The complete trees, depicting 624 sequences, can be viewed in the appendix (S15). The
NJ algorithm was applied as mentioned above. This amount of data would result in a tree
covering several pages. For convenience a sub-data set of 63 sequences was extracted from the
original data that is supposed to depict precisely the same. Each tribe is represented by at least
one sequence which results in a small-scale copy of the complete data. For further analysis,
both data sets are invariably employed, where merely the reduced set is displayed while the
entire examinations are attached.
Neighbor joining (NJ) method analyses (SAITOU & IMANISHI 1989) were performed
using MEGA5 (TAMURA et al. 2011) to depict evolutionary relationships among the taxa by
calculating genetic distance based on Maximum Composite Likelihood of the Tamura-Nei
model. This method increases the accuracy of calculating the pairwise distances. Confidence of
the clade reconstruction was tested by bootstrapping with 1,000 replicates, which depicts the
percentage of replicate trees in which the associated taxa clustered together (FELSENSTEIN
1985). The complete data set was utilised for estimations.
Part 1: Trouble with the Outgroup
35
Maximum parsimony algorithm (MP) uses an MP search method to implement
parsimony by searching for the minimum number of steps, which equals the minimum change
between data. A newer method for larger data sets was applied which is called Parsimony
Ratchet implemented with the software PAUP (NIXON 1999, SWOFFORD 2011). After
generating an initial tree, the model repeats a certain process (1. Select character of subsets, 2.
TBR keeping only one tree, 3. Set character to equal rates, 4. TBR on current tree, 5. Repeat
50-200 times) 200 times (= iterations). Settings were chosen mainly following Nixon’s review
(NIXON 1999).
4.3.2.1 Divergence time estimates
The dating of the Brassicaceae origin and various other calibration points within this
family was previously undertaken with huge effort and have led to highly divergent results,
depending on the applied marker systems, substitution rates or calibration points (KOCH 2012).
The chalcone synthase has already been successfully utilised for divergence time estimates in
previous reviews (BEILSTEIN et al. 2010, COUVREUR et al. 2010, KOCH 2012). To compare those
results with newly gathered data at hand, nuclear sequence divergence between groups of taxa
were estimated. Because genes accumulate changes over time at a more or less constant rate,
the genetic distance between two species, measured by the number of changes accumulated,
will be proportional to the time of species divergence. Synonymous substitution rates, also
especially for the nuclear chalcone synthase, have been estimated several times, varying among
a certain range from 8 × 10⁻⁹ to 1,67 × 10⁻⁸ substitutions/site/year (DURBIN et al. 1995, HUANG
et al. 2012, KOCH et al. 2001, LAROCHE et al. 1997, WANG et al. 2007), partly based on fossil
pollen data. For a first approach, these rates were truncated as minimum and maximum, as
secondary calibration dates require boundaries (HO et al. 2010, HO 2007) and will be
prospectively abbreviated as Rate.
Although it is mostly confuted that a strict molecular clock can be applied on that data,
substitution rates are arguable as, firstly, the rate is not tight to a fixed rate and, secondly, groups
are allowed to vary among different lineages (DRUMMOND et al. 2006).
An alternative approach to estimate the age of several groups, namely tribes or lineages,
was focused on using the Bayesian analyses package. Normally, direct primary calibration via
macrofossils is advised to circumvent increasing distortion and noise in the results. But the
utilisation of fossils constraints within the Brassicaceae is debated on intensely. On the other
hand secondary calibration approaches are often being criticised to produce unreliable results
Part 1: Trouble with the Outgroup
36
(SHAUL & GRAUR 2002). Therefore broad prior probability distributions were scheduled on the
calibration point.
Secondary calibration was achieved by referring to major minimum angiosperm split
ages (BELL et al. 2010, WANG et al. 2009, WIKSTROM et al. 2001). Estimations of absolute
divergence times require calibrating the age of at least one node (WANG et al. 2009). The
youngest calibration point set the spilt node of Burseraceae (JF728822 Canarium album) and
Anacardiaceae (KC287084 Rhus chinensis), with the most common ancestor Bursera and
Schinus, to 50 mya (CLEAL et al. 2001) the second point to 65.5 mya indicating the split between
Malvaceae (EF643507 Gossypium hirsutum, EU573212 Abelmoschus manihot) and
Thymelaceae (EF103197 Aquilaria sinensis) and the oldest calibration point was constraint to
the split of Hypericaceae (AF461105 Hypericum perforatum) and Clusiaceae (FJ197128
Garcinia mangostana) dated 89 mya (CREPET & NIXON 1998). All named splits are represented
with chalcone synthase sequences from NCBI (accession numbers in brackets) which were
added to the data set, each with a standard deviation (SD) of 2. The uncorrelated relaxed clock
method (UCLN) was used to infer divergence times. This approach will prospectively be
abbreviated as Angio.
For contrasting reasons, a third approach was tested utilising fossil data (prospectively
abbreviated as Fossil). The primary calibration was based on two fossils. A normal prior of
mean 6 and SD 2 was given to the most recent common ancestor of Rorippa and its closest
relative in dependence on the Rorippa fossil dated to the Pliocene 2 to 5 mya (WALTHER 1995).
Another soft calibration point was utilised with a normal prior with a mean 35 and SD 10 was
enforced to the node of the crown group of the Brassicaceae family (MANDAKOVA et al. 2010),
covering the most frequently estimations from previous calculations, including the oldest
putative Brassicaceae fossil from the Oligocene, 22 to 35 mya (CRONQUIST 1981).
The analyses accounted for rate variation using an UCLN drawn from a lognormal
distribution and the birth-death speciation model for incomplete samplings and the Hasegawa,
Kishino and Yano (HKY) model of nucleotide evolution with four categories and all equal base
frequencies. For the calibration, different types of priors were implemented in the settings of
BEAUti (Bayesian Evolutionary Analysis Utility), which is the graphical user-interface (GUI)
application for generating BEAST XML files (DRUMMOND et al. 2012), to date divergence.
Following the standard procedure, four independent runs were conducted. Based on lab
experience, 5 x 10⁷ generations per analysis from starting trees, with branch lengths satisfying
the respective priors on divergence times, sampling every 5,000 generations, were run. This
Part 1: Trouble with the Outgroup
37
resulted in 10,000 trees each. Four independent runs with each 50 million generations were
accomplished.
For each run convergence statistics were analysed with the programme Tracer v. 1.4.1,
discarding the first 10% (DRUMMOND & RAMBAUT 2007), using 9,000 post-burn-in
generations. Convergence was obtained when reaching stationary phase and a sufficient
effective sample size (ESS > 200), each, in the combined file. Using the included programme
LogCombiner v.1.7.5. (DRUMMOND & RAMBAUT 2007) to combine both log and tree files,
followed by the programme TreeAnnotator v.1.7.5. (DRUMMOND & RAMBAUT 2007) to create
maximum clade credibility trees, burning in the first 10% of the trees, what equals 5.000 trees,
and, moreover, to determine the 95% posterior density for the trees’ nodes. Final tree files were
graphically processed with FigTree v1.4.0 (RAMBAUT 2012), a programme belonging to the
BEAST group, but distributed separately. This tree viewing programme includes summary
information produced by TreeAnnotator.
4.4 Sequence analysis
4.4.1 Alignment analysis of the complete data
All sequence alignments per branch were analysed in different contexts, like divergence
calculations within the tribes or sequence statistics of gene elements, to search for abnormalities
and peculiarities among the genera. A table was compiled (Table 7) depicting each tribe with
its basal statistical composition, which together represent the complete data. Within the
illustration, divergence data (number of differences) both from the coding and the complete
gene were calculated in MEGA5 (TAMURA et al. 2011).
4.4.2 Identifying gene regions
The examination of the complete nuclear gene (promoter, intron and two exons) will
help to unravel the differences and similarities among the tribes, genera and species. It,
moreover, reveals the discrepancies among the sequences that resulted in unexpected
phylogenetic placements. In most studies concerning genes encoding a protein, it is prevailing
to only employ the coding region for analysis. Of course, estimations and calculations are just
applied on the coding gene and not on the intragenic regions. However, molecular generic
elements like the promoter region have been successfully employed to not only compare
sequential parts but also to investigate functionality (DE MEAUX et al. 2005). Therefore the
complete sequences have been torn apart into their ingredients to apply diverse analysis on.
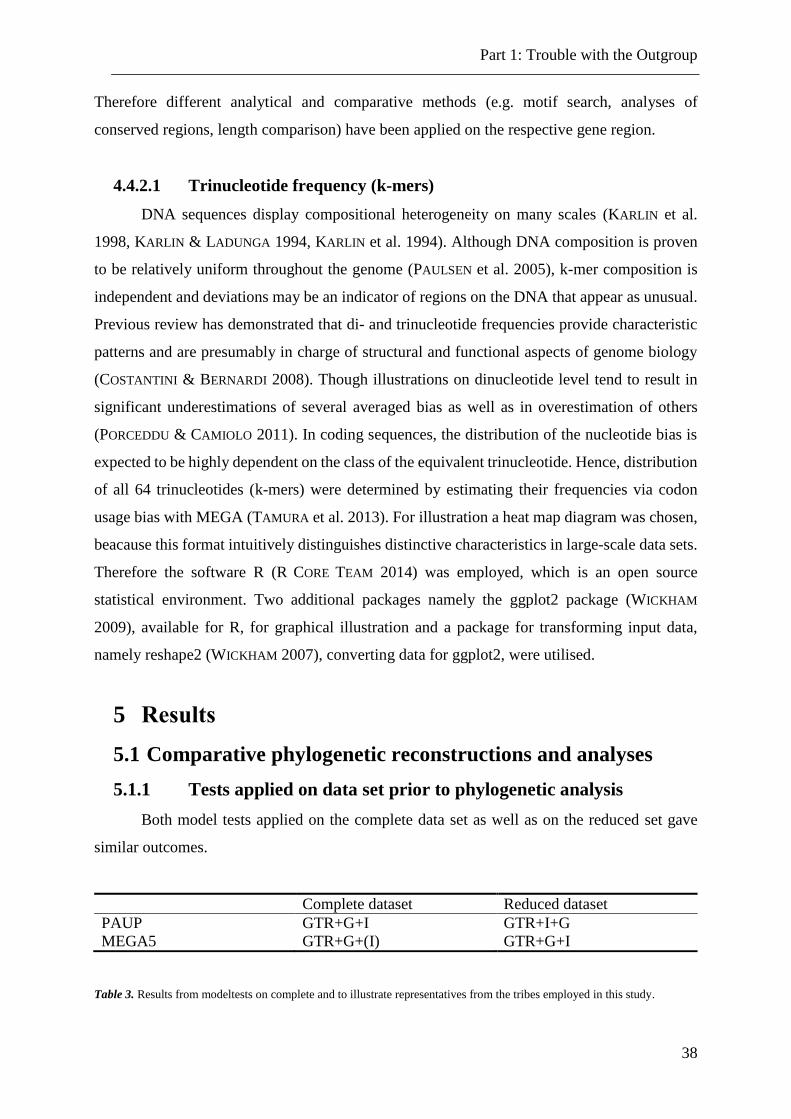
Part 1: Trouble with the Outgroup
38
Therefore different analytical and comparative methods (e.g. motif search, analyses of
conserved regions, length comparison) have been applied on the respective gene region.
4.4.2.1 Trinucleotide frequency (k-mers)
DNA sequences display compositional heterogeneity on many scales (KARLIN et al.
1998, KARLIN & LADUNGA 1994, KARLIN et al. 1994). Although DNA composition is proven
to be relatively uniform throughout the genome (PAULSEN et al. 2005), k-mer composition is
independent and deviations may be an indicator of regions on the DNA that appear as unusual.
Previous review has demonstrated that di- and trinucleotide frequencies provide characteristic
patterns and are presumably in charge of structural and functional aspects of genome biology
(COSTANTINI & BERNARDI 2008). Though illustrations on dinucleotide level tend to result in
significant underestimations of several averaged bias as well as in overestimation of others
(PORCEDDU & CAMIOLO 2011). In coding sequences, the distribution of the nucleotide bias is
expected to be highly dependent on the class of the equivalent trinucleotide. Hence, distribution
of all 64 trinucleotides (k-mers) were determined by estimating their frequencies via codon
usage bias with MEGA (TAMURA et al. 2013). For illustration a heat map diagram was chosen,
beacause this format intuitively distinguishes distinctive characteristics in large-scale data sets.
Therefore the software R (R CORE TEAM 2014) was employed, which is an open source
statistical environment. Two additional packages namely the ggplot2 package (WICKHAM
2009), available for R, for graphical illustration and a package for transforming input data,
namely reshape2 (WICKHAM 2007), converting data for ggplot2, were utilised.
5 Results
5.1 Comparative phylogenetic reconstructions and analyses
5.1.1 Tests applied on data set prior to phylogenetic analysis
Both model tests applied on the complete data set as well as on the reduced set gave
similar outcomes.
Complete dataset Reduced dataset
PAUP GTR+G+I GTR+I+G
MEGA5 GTR+G+(I) GTR+G+I
Table 3. Results from modeltests on complete and to illustrate representatives from the tribes employed in this study.
Part 1: Trouble with the Outgroup
39
After submitting the data sets to different substitution models, the most appropriate one
is the General Time Reversible model with γ-distribution and invariant sites with 121
parameters to estimate with the programme MEGA5. Only the complete data set (PAUP) does
not display identical results concerning the log likelihood (lnL) for GTR+G and GTR+G+I
(therefore I in brackets). All other results suggest that the invariant sites should be added for
calculations, therefore the asset for the respective model is defensible. PAUP’s output is in
congruence, supported by the highest log likelihood.
The Jukes-Cantor distance method (NEI & KUMURA 2000) resulted in d = 0.160 for the
complete coding data set and in d = 0.144 for the reduced data set of 57 sequences depicting a
representative excerpt of the complete data. As the d-values are well within the range (d < 1.0),
the data, both from the complete as well as from the subset, are appropriate to construct
neighbor joining trees.
5.1.2 Comparative phylogenetic reconstructions
The evolutionary history was inferred by the neighbor joining [Maximum Composite
Likelihood method (TAMURA et al. 2004)] algorithm which resulted in an optimal tree with a
length (L) of 3.25. The evolutionary distances are depicted as base substitutions per site and the
confidence probability is shown above branches. Values below 50% are cut off. The resulting
gene tree displays 62 chalcone synthase genes from 39 tribes of the Brassicaceae plus
unassigned genera. Additionally, Cleome spinosa is shown as outgroup. This representation
exhibits ten groups, from which some contain only one sequence, like Iberis saxatilis or
Bivonaea lutea.
The topology of the NJ tree resembles contrastable estimations highly. Lineage I
representing, one of the two crown groups, which are all taxa descended from a major
cladogenesis event, is displayed by 19 sequences. This are all tribes assigned to that lineage.
The branch of that group is supported by a bootstrap value of 91 percent suggesting high
confidence. Two tribes, namely Lepidieae and Cardamineae are positioned outside the
remaining sequences from lineage I, what is not in perfect congruence to approved ITS
phylogenies (GERMAN et al. 2009, LIHOVA et al. 2006, YUE et al. 2009), where Smelowskieae,
Lepidieae and Descurainieae are sister to the rest of lineage I. The Lepidieae, which were
already suggested as sister to lineage I are supported by 91 percent reproducibility and the
Cardamineae are depicted as sister to lineage I and the Lepidieae. However, Smelowskieae,
expected in a sister position to that lineage and here represented by Smelowskia tibetica, have
Part 1: Trouble with the Outgroup
40
swapped placement with Cardamineae. The second crown group assigns a mixture of
sequences.
The most diverged part, supported by a bootstrap value of 64 percent depicts all six
members from lineage II, supporting previous research results of Eutremeae and Thlaspideae
defined as sister group to the remaining lineage II. One Anchonieae sequence (lineage III) is
intermingled with that lineage.
Above that group are seven additional sequences from expanded lineage II and 1, as
well as below lineage II. Group eight displays the placement of Cleome spinosa, which is
applied as outgroup, joined by four sequences representing fragments of the Anastaticeae,
Arabideae and the Dontostemoneae, from lineage III and expanded lineage III, supported with
99 percent. Another pair of sequences, both assigned to expanded lineage II (Megacarpaea
polyandra and Schizopetalon walkeri), depict a sister-relationship to Cleome and its
surrounding tribal representatives. The next group among the topology holds six out of seven
members from lineage III fostered with 99% bootstrap support. Above, a group of three
sequences all from expanded lineage II are arranged.
Below, within group 6, four tribal representatives are gathered, all as well from the
expanded lineage. The remaining groups one to five are situated outside the phylogeny
suggesting higher diversification rates than the sequences within the phylogeny. Biscutealla
laevigata, belonging to the tribe Biscutelleae, is not assigned to any lineage yet, due to its
clustering outside any of the supported lineages.
This genus builds a group with the unassigned taxon Ricotia lunaria. Bivoneae,
Cochlearieae and Iberideae demonstrate an even more diverged placement outside the core
group of the mustard family. Group one is depicted by Aethionemeae, which was expected to
situate outside the core group as it is the oldest tribe of the Brassicaceae. That this tribe arranged
with Physaria pinetorum, however, is unexpected. But the last-mentioned groups are also
supported by appropriate reproducibility values of 80 to 99% and can therefore not be
neglected.
This gene tree reconstruction introduced admittedly bears a vast number of
inconsistencies in comparison to preceding research, which will be further discussed. For
convenience, sequence names are extended to a certain amount to enable affiliations to the
respective tribes and genera immediately. Within this illustration of the mustards several tribes
are represented by more than one branch. Together there are eight tribes affected within the chs
data that show this addressed pattern (see Table 4).
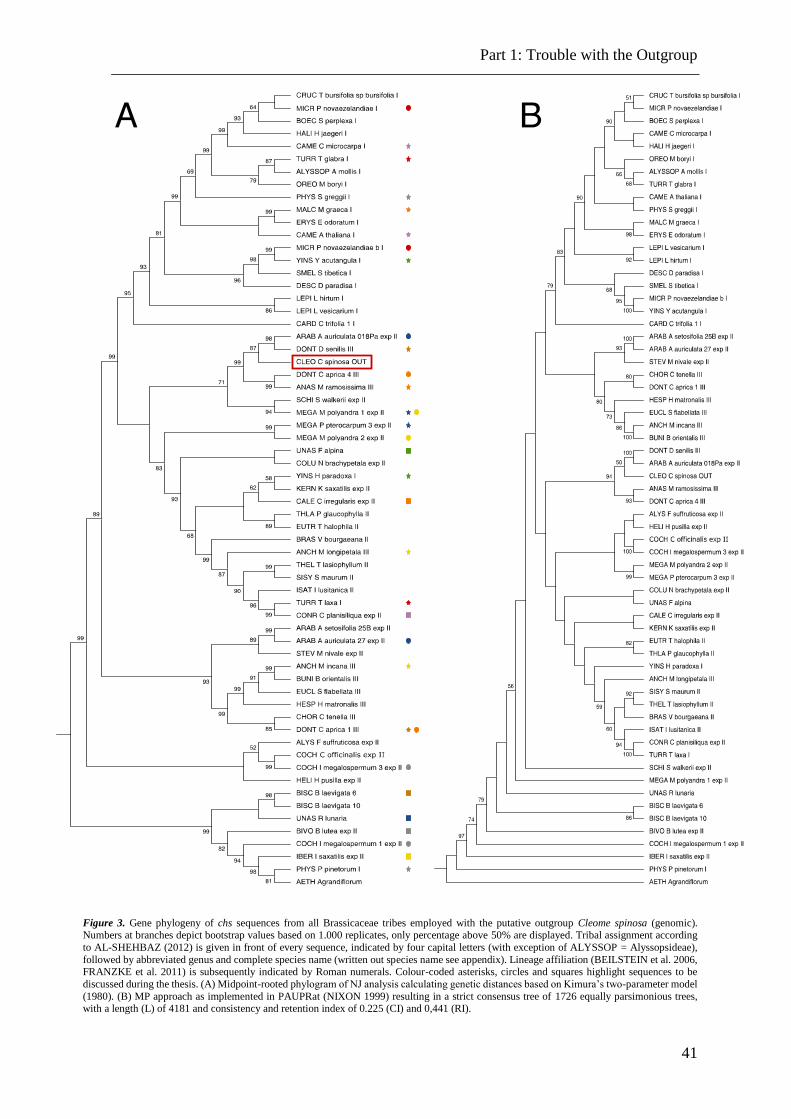
Part 1: Trouble with the Outgroup
41
Figure 3. Gene phylogeny of chs sequences from all Brassicaceae tribes employed with the putative outgroup Cleome spinosa (genomic). Numbers at branches depict bootstrap values based on 1.000 replicates, only percentage above 50% are displayed. Tribal assignment according
to AL-SHEHBAZ (2012) is given in front of every sequence, indicated by four capital letters (with exception of ALYSSOP = Alyssopsideae),
followed by abbreviated genus and complete species name (written out species name see appendix). Lineage affiliation (BEILSTEIN et al. 2006, FRANZKE et al. 2011) is subsequently indicated by Roman numerals. Colour-coded asterisks, circles and squares highlight sequences to be
discussed during the thesis. (A) Midpoint-rooted phylogram of NJ analysis calculating genetic distances based on Kimura’s two-parameter model
(1980). (B) MP approach as implemented in PAUPRat (NIXON 1999) resulting in a strict consensus tree of 1726 equally parsimonious trees, with a length (L) of 4181 and consistency and retention index of 0.225 (CI) and 0,441 (RI).
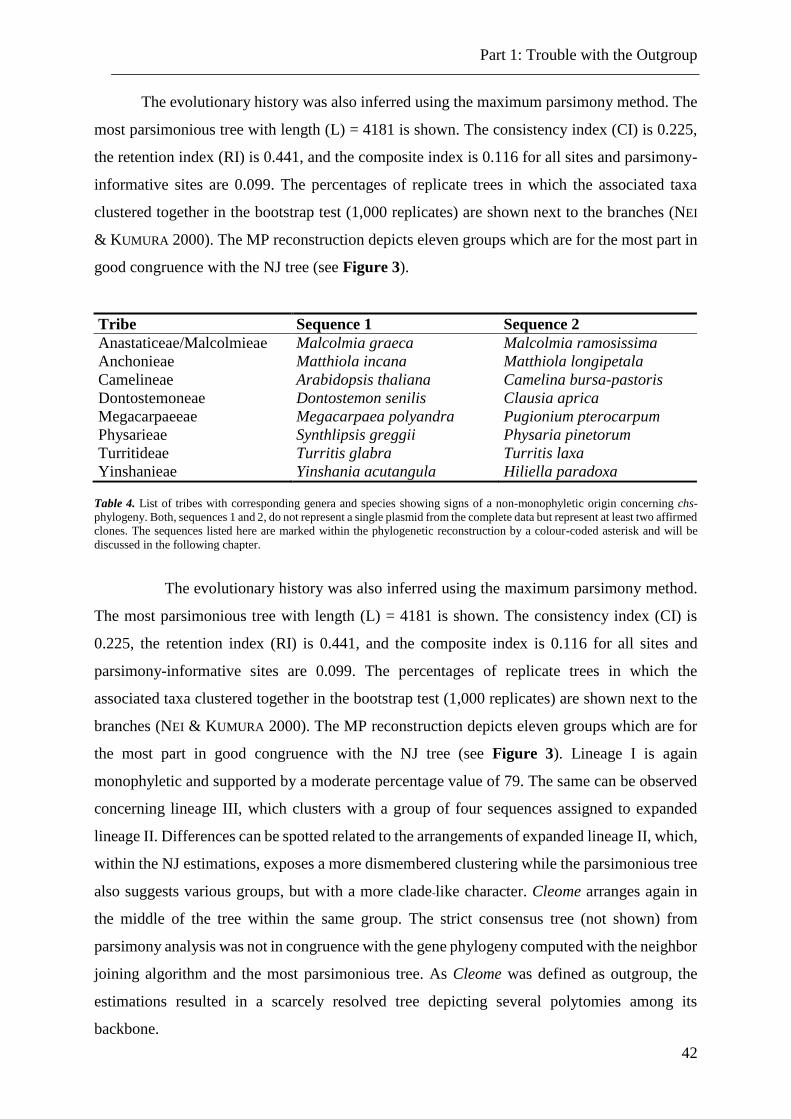
Part 1: Trouble with the Outgroup
42
The evolutionary history was also inferred using the maximum parsimony method. The
most parsimonious tree with length (L) = 4181 is shown. The consistency index (CI) is 0.225,
the retention index (RI) is 0.441, and the composite index is 0.116 for all sites and parsimony-
informative sites are 0.099. The percentages of replicate trees in which the associated taxa
clustered together in the bootstrap test (1,000 replicates) are shown next to the branches (NEI
& KUMURA 2000). The MP reconstruction depicts eleven groups which are for the most part in
good congruence with the NJ tree (see Figure 3).
Tribe Sequence 1 Sequence 2
Anastaticeae/Malcolmieae Malcolmia graeca Malcolmia ramosissima
Anchonieae Matthiola incana Matthiola longipetala
Camelineae Arabidopsis thaliana Camelina bursa-pastoris
Dontostemoneae Dontostemon senilis Clausia aprica
Megacarpaeeae Megacarpaea polyandra Pugionium pterocarpum
Physarieae Synthlipsis greggii Physaria pinetorum
Turritideae Turritis glabra Turritis laxa
Yinshanieae Yinshania acutangula Hiliella paradoxa
Table 4. List of tribes with corresponding genera and species showing signs of a non-monophyletic origin concerning chs-
phylogeny. Both, sequences 1 and 2, do not represent a single plasmid from the complete data but represent at least two affirmed
clones. The sequences listed here are marked within the phylogenetic reconstruction by a colour-coded asterisk and will be
discussed in the following chapter.
The evolutionary history was also inferred using the maximum parsimony method.
The most parsimonious tree with length (L) = 4181 is shown. The consistency index (CI) is
0.225, the retention index (RI) is 0.441, and the composite index is 0.116 for all sites and
parsimony-informative sites are 0.099. The percentages of replicate trees in which the
associated taxa clustered together in the bootstrap test (1,000 replicates) are shown next to the
branches (NEI & KUMURA 2000). The MP reconstruction depicts eleven groups which are for
the most part in good congruence with the NJ tree (see Figure 3). Lineage I is again
monophyletic and supported by a moderate percentage value of 79. The same can be observed
concerning lineage III, which clusters with a group of four sequences assigned to expanded
lineage II. Differences can be spotted related to the arrangements of expanded lineage II, which,
within the NJ estimations, exposes a more dismembered clustering while the parsimonious tree
also suggests various groups, but with a more clade-like character. Cleome arranges again in
the middle of the tree within the same group. The strict consensus tree (not shown) from
parsimony analysis was not in congruence with the gene phylogeny computed with the neighbor
joining algorithm and the most parsimonious tree. As Cleome was defined as outgroup, the
estimations resulted in a scarcely resolved tree depicting several polytomies among its
backbone.
Part 1: Trouble with the Outgroup
43
5.1.3 Divergence time estimates
Divergence time estimates are generally discussed, as they are instantaneously
depending on the methods and calibration points as discussed above. Although results from
previous research are methodologically thoroughgoing, they present highly divergent
estimations of origin and divergence ages. Calculations with the data at hand resulted in three
various estimates of divergence times and varied greatly depending on the approaches applied,
making it difficult to determine the most reliable methodology. The calibrations based on the
range of substitution rates from previous data resulted in a crown age for the Brassicaceae of
25.5 million years. This extrapolation seems to be realistic and within the range of recently
suggested evaluations applied on the family (AL-SHEHBAZ et al. 2006, FRANZKE et al. 2009,
KOCH & MUMMENHOFF 2006), though the age for the crown group seems relatively young. The
calculated mean substitution rate settled at 1.29 x 10⁻⁸ which leads to this predated
approximation. The estimations based on angiosperm split data for the complete data set
proposes an age of 34.48 mya, which is nearly 10 million years earlier than calculations based
on the synonymous substitution rates. This resembles the outcome of several research results
exceedingly (COUVREUR et al. 2010, KOCH et al. 2001, KOCH et al. 2000, SCHRANZ &
MITCHELL-OLDS 2006) suggesting ages between 30 and 54 mya. Still, estimations submitted
here arrange at the lower age boundaries. On the other hand, estimations from BELL et al. (2010)
and WIKSTROM et al. (2001) date the split between Cleomaceae and Brassicaceae to 20 mya
respectively 32 mya indicating more recent outcome for the Brassicaceae crown group
supporting results exposed here.
The divergence estimations of the listed tribes in Table 5 are all relatively high which
is due to the fact that each of those tribes is divided into two clades. The divergence age
indicates the split age of the respective groups, which most likely, is identical to each of the
evolutionary events, like polyploidisations. Estimations of the divergence times of the tribes
suggest no recent but rather a predating of polyploidisation events. Intra-tribal radiations are
only listed for those tribes containing at least two different species (DONT, MICR, ARAB,
COCH).
The divergence of the outgroup Cleomaceae from the Brassicaceae is proposed to 42.01
mya (angiosperm split), while the substitution rate range draft argues for this split to occur more
recently, namely 28.05 mya. The primary fossil-based calibrations following the approach of
MANDAKOVA et al. (2010) seem to have resulted in the highest divergence time values.
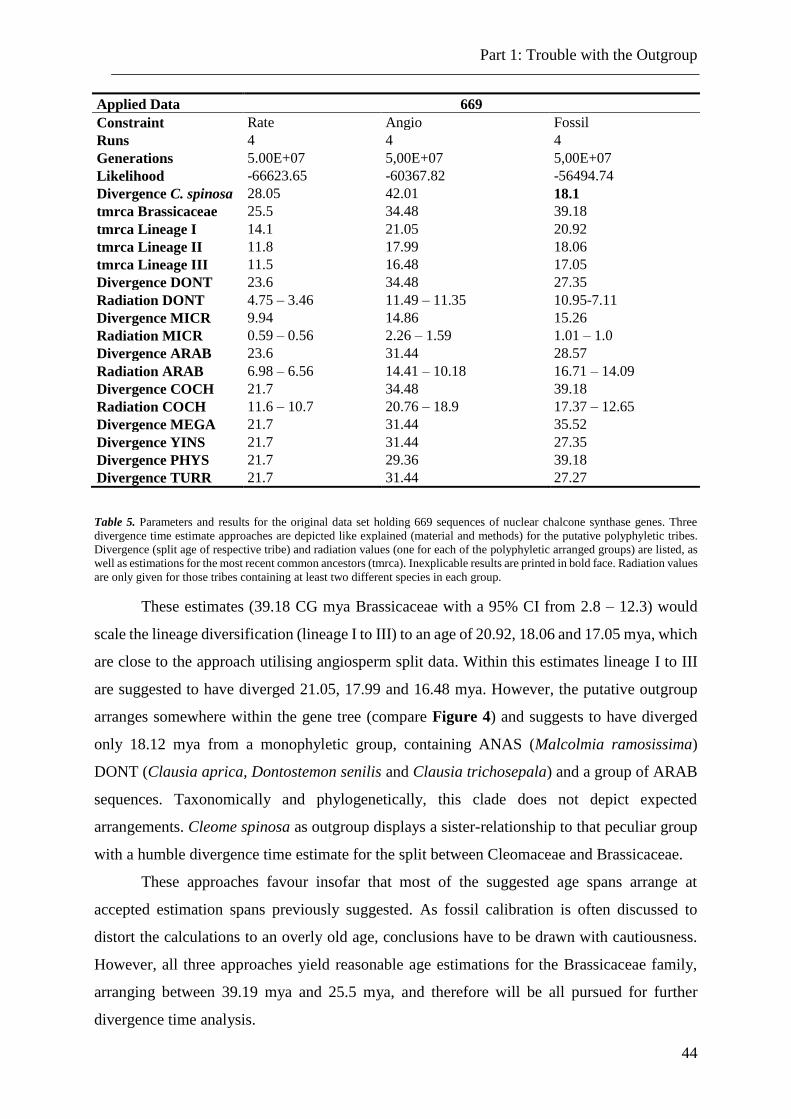
Part 1: Trouble with the Outgroup
44
Applied Data 669
Constraint Rate Angio Fossil
Runs 4 4 4
Generations 5.00E+07 5,00E+07 5,00E+07
Likelihood -66623.65 -60367.82 -56494.74
Divergence C. spinosa 28.05 42.01 18.1
tmrca Brassicaceae 25.5 34.48 39.18
tmrca Lineage I 14.1 21.05 20.92
tmrca Lineage II 11.8 17.99 18.06
tmrca Lineage III 11.5 16.48 17.05
Divergence DONT 23.6 34.48 27.35
Radiation DONT 4.75 – 3.46 11.49 – 11.35 10.95-7.11
Divergence MICR 9.94 14.86 15.26
Radiation MICR 0.59 – 0.56 2.26 – 1.59 1.01 – 1.0
Divergence ARAB 23.6 31.44 28.57
Radiation ARAB 6.98 – 6.56 14.41 – 10.18 16.71 – 14.09
Divergence COCH 21.7 34.48 39.18
Radiation COCH 11.6 – 10.7 20.76 – 18.9 17.37 – 12.65
Divergence MEGA 21.7 31.44 35.52
Divergence YINS 21.7 31.44 27.35
Divergence PHYS 21.7 29.36 39.18
Divergence TURR 21.7 31.44 27.27
Table 5. Parameters and results for the original data set holding 669 sequences of nuclear chalcone synthase genes. Three
divergence time estimate approaches are depicted like explained (material and methods) for the putative polyphyletic tribes.
Divergence (split age of respective tribe) and radiation values (one for each of the polyphyletic arranged groups) are listed, as
well as estimations for the most recent common ancestors (tmrca). Inexplicable results are printed in bold face. Radiation values
are only given for those tribes containing at least two different species in each group.
These estimates (39.18 CG mya Brassicaceae with a 95% CI from 2.8 – 12.3) would
scale the lineage diversification (lineage I to III) to an age of 20.92, 18.06 and 17.05 mya, which
are close to the approach utilising angiosperm split data. Within this estimates lineage I to III
are suggested to have diverged 21.05, 17.99 and 16.48 mya. However, the putative outgroup
arranges somewhere within the gene tree (compare Figure 4) and suggests to have diverged
only 18.12 mya from a monophyletic group, containing ANAS (Malcolmia ramosissima)
DONT (Clausia aprica, Dontostemon senilis and Clausia trichosepala) and a group of ARAB
sequences. Taxonomically and phylogenetically, this clade does not depict expected
arrangements. Cleome spinosa as outgroup displays a sister-relationship to that peculiar group
with a humble divergence time estimate for the split between Cleomaceae and Brassicaceae.
These approaches favour insofar that most of the suggested age spans arrange at
accepted estimation spans previously suggested. As fossil calibration is often discussed to
distort the calculations to an overly old age, conclusions have to be drawn with cautiousness.
However, all three approaches yield reasonable age estimations for the Brassicaceae family,
arranging between 39.19 mya and 25.5 mya, and therefore will be all pursued for further
divergence time analysis.
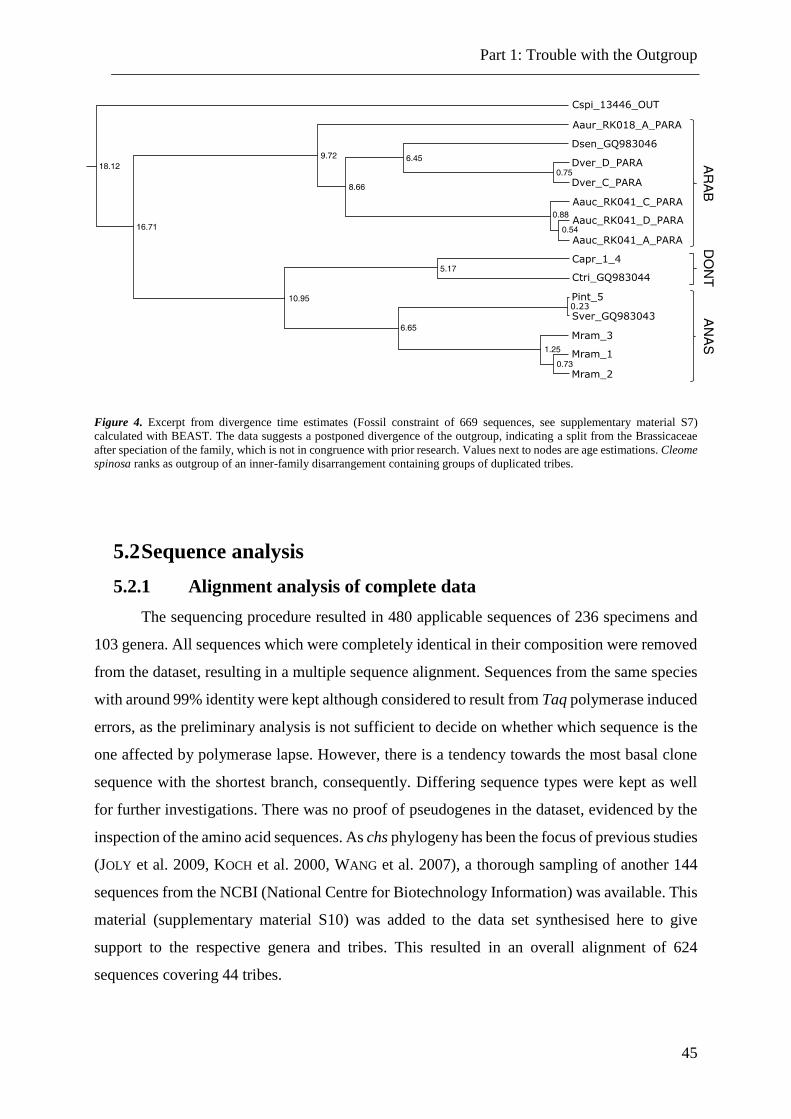
Part 1: Trouble with the Outgroup
45
Figure 4. Excerpt from divergence time estimates (Fossil constraint of 669 sequences, see supplementary material S7)
calculated with BEAST. The data suggests a postponed divergence of the outgroup, indicating a split from the Brassicaceae
after speciation of the family, which is not in congruence with prior research. Values next to nodes are age estimations. Cleome
spinosa ranks as outgroup of an inner-family disarrangement containing groups of duplicated tribes.
5.2 Sequence analysis
5.2.1 Alignment analysis of complete data
The sequencing procedure resulted in 480 applicable sequences of 236 specimens and
103 genera. All sequences which were completely identical in their composition were removed
from the dataset, resulting in a multiple sequence alignment. Sequences from the same species
with around 99% identity were kept although considered to result from Taq polymerase induced
errors, as the preliminary analysis is not sufficient to decide on whether which sequence is the
one affected by polymerase lapse. However, there is a tendency towards the most basal clone
sequence with the shortest branch, consequently. Differing sequence types were kept as well
for further investigations. There was no proof of pseudogenes in the dataset, evidenced by the
inspection of the amino acid sequences. As chs phylogeny has been the focus of previous studies
(JOLY et al. 2009, KOCH et al. 2000, WANG et al. 2007), a thorough sampling of another 144
sequences from the NCBI (National Centre for Biotechnology Information) was available. This
material (supplementary material S10) was added to the data set synthesised here to give
support to the respective genera and tribes. This resulted in an overall alignment of 624
sequences covering 44 tribes.
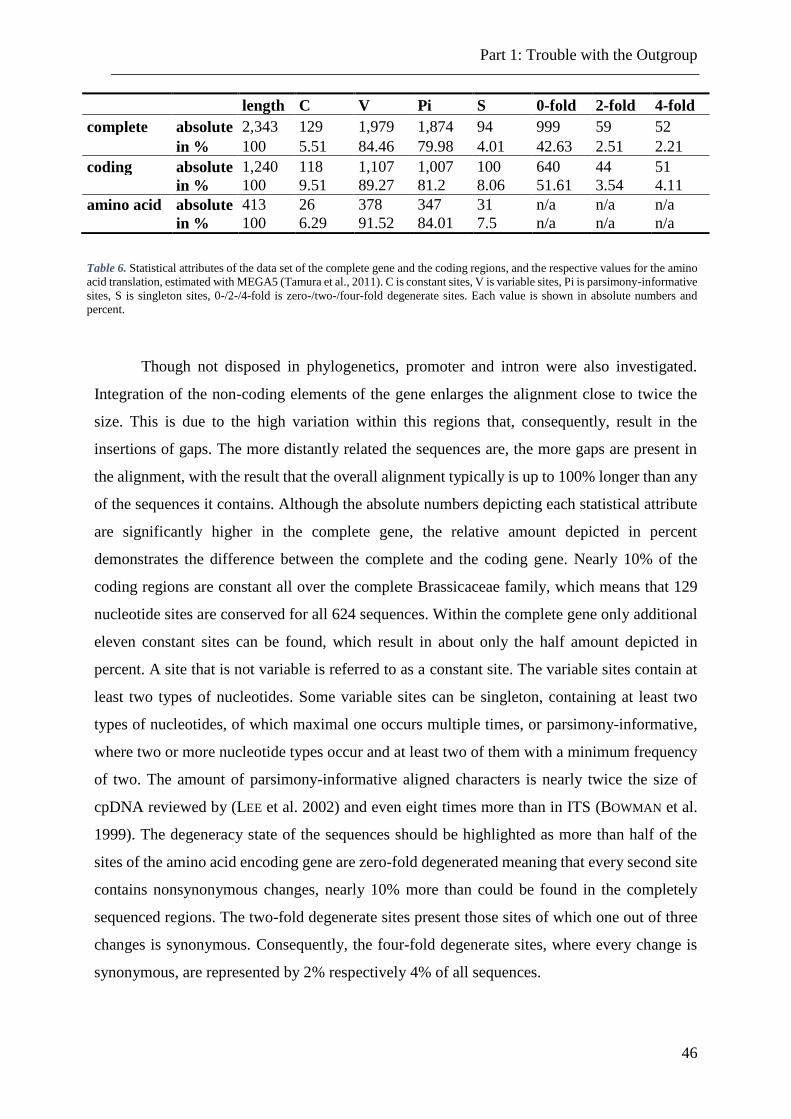
Part 1: Trouble with the Outgroup
46
length C V Pi S 0-fold 2-fold 4-fold
complete absolute 2,343 129 1,979 1,874 94 999 59 52
in % 100 5.51 84.46 79.98 4.01 42.63 2.51 2.21
coding absolute 1,240 118 1,107 1,007 100 640 44 51
in % 100 9.51 89.27 81.2 8.06 51.61 3.54 4.11
amino acid absolute 413 26 378 347 31 n/a n/a n/a
in % 100 6.29 91.52 84.01 7.5 n/a n/a n/a
Table 6. Statistical attributes of the data set of the complete gene and the coding regions, and the respective values for the amino
acid translation, estimated with MEGA5 (Tamura et al., 2011). C is constant sites, V is variable sites, Pi is parsimony-informative
sites, S is singleton sites, 0-/2-/4-fold is zero-/two-/four-fold degenerate sites. Each value is shown in absolute numbers and
percent.
Though not disposed in phylogenetics, promoter and intron were also investigated.
Integration of the non-coding elements of the gene enlarges the alignment close to twice the
size. This is due to the high variation within this regions that, consequently, result in the
insertions of gaps. The more distantly related the sequences are, the more gaps are present in
the alignment, with the result that the overall alignment typically is up to 100% longer than any
of the sequences it contains. Although the absolute numbers depicting each statistical attribute
are significantly higher in the complete gene, the relative amount depicted in percent
demonstrates the difference between the complete and the coding gene. Nearly 10% of the
coding regions are constant all over the complete Brassicaceae family, which means that 129
nucleotide sites are conserved for all 624 sequences. Within the complete gene only additional
eleven constant sites can be found, which result in about only the half amount depicted in
percent. A site that is not variable is referred to as a constant site. The variable sites contain at
least two types of nucleotides. Some variable sites can be singleton, containing at least two
types of nucleotides, of which maximal one occurs multiple times, or parsimony-informative,
where two or more nucleotide types occur and at least two of them with a minimum frequency
of two. The amount of parsimony-informative aligned characters is nearly twice the size of
cpDNA reviewed by (LEE et al. 2002) and even eight times more than in ITS (BOWMAN et al.
1999). The degeneracy state of the sequences should be highlighted as more than half of the
sites of the amino acid encoding gene are zero-fold degenerated meaning that every second site
contains nonsynonymous changes, nearly 10% more than could be found in the completely
sequenced regions. The two-fold degenerate sites present those sites of which one out of three
changes is synonymous. Consequently, the four-fold degenerate sites, where every change is
synonymous, are represented by 2% respectively 4% of all sequences.
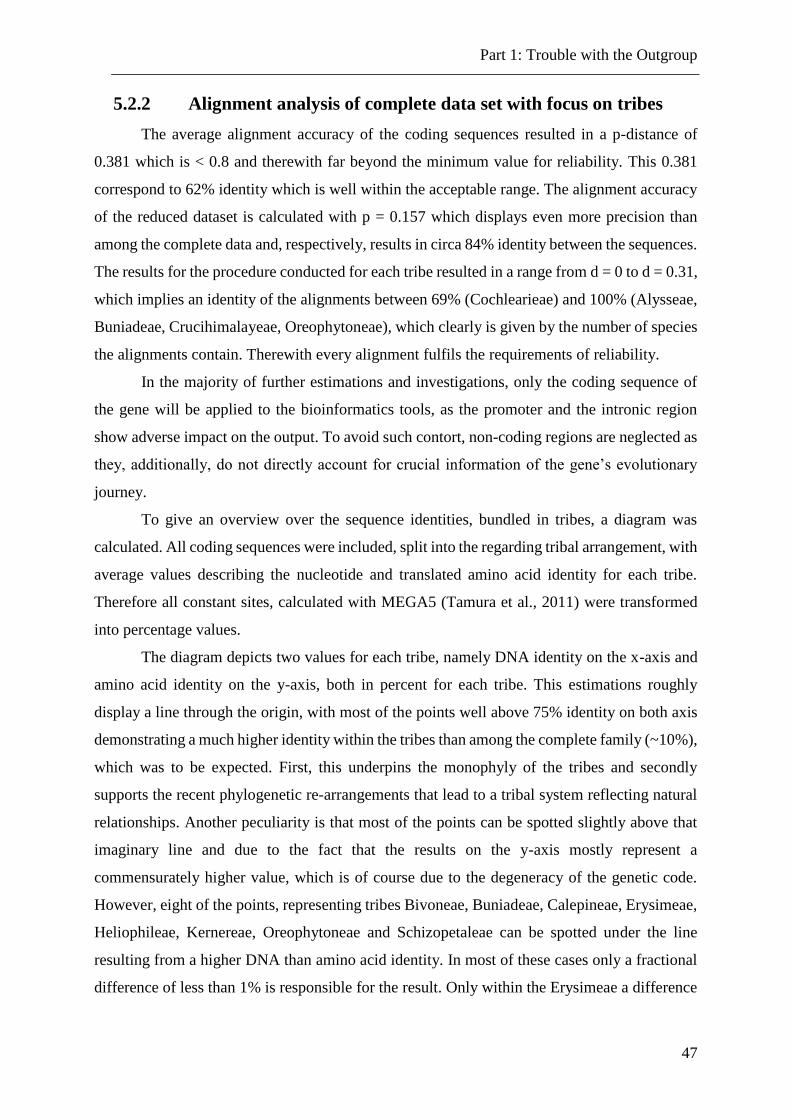
Part 1: Trouble with the Outgroup
47
5.2.2 Alignment analysis of complete data set with focus on tribes
The average alignment accuracy of the coding sequences resulted in a p-distance of
0.381 which is < 0.8 and therewith far beyond the minimum value for reliability. This 0.381
correspond to 62% identity which is well within the acceptable range. The alignment accuracy
of the reduced dataset is calculated with p = 0.157 which displays even more precision than
among the complete data and, respectively, results in circa 84% identity between the sequences.
The results for the procedure conducted for each tribe resulted in a range from d = 0 to d = 0.31,
which implies an identity of the alignments between 69% (Cochlearieae) and 100% (Alysseae,
Buniadeae, Crucihimalayeae, Oreophytoneae), which clearly is given by the number of species
the alignments contain. Therewith every alignment fulfils the requirements of reliability.
In the majority of further estimations and investigations, only the coding sequence of
the gene will be applied to the bioinformatics tools, as the promoter and the intronic region
show adverse impact on the output. To avoid such contort, non-coding regions are neglected as
they, additionally, do not directly account for crucial information of the gene’s evolutionary
journey.
To give an overview over the sequence identities, bundled in tribes, a diagram was
calculated. All coding sequences were included, split into the regarding tribal arrangement, with
average values describing the nucleotide and translated amino acid identity for each tribe.
Therefore all constant sites, calculated with MEGA5 (Tamura et al., 2011) were transformed
into percentage values.
The diagram depicts two values for each tribe, namely DNA identity on the x-axis and
amino acid identity on the y-axis, both in percent for each tribe. This estimations roughly
display a line through the origin, with most of the points well above 75% identity on both axis
demonstrating a much higher identity within the tribes than among the complete family (~10%),
which was to be expected. First, this underpins the monophyly of the tribes and secondly
supports the recent phylogenetic re-arrangements that lead to a tribal system reflecting natural
relationships. Another peculiarity is that most of the points can be spotted slightly above that
imaginary line and due to the fact that the results on the y-axis mostly represent a
commensurately higher value, which is of course due to the degeneracy of the genetic code.
However, eight of the points, representing tribes Bivoneae, Buniadeae, Calepineae, Erysimeae,
Heliophileae, Kernereae, Oreophytoneae and Schizopetaleae can be spotted under the line
resulting from a higher DNA than amino acid identity. In most of these cases only a fractional
difference of less than 1% is responsible for the result. Only within the Erysimeae a difference
Part 1: Trouble with the Outgroup
48
between DNA and amino acid translation of 6.38% can be observed. This means that the genera
within that tribe show an untypical
pattern suggesting that most, or at
least a multiple from the other tribes,
show nonsynonymous changes at
most sites (zero-fold degenerate
sites). The one spot representing a
quite low DNA identity in
comparison to the others and the
amino acid identity represents the
tribe Malcolmieae. Within this tribe
the genera show a low nucleotide
identity (45%) which all seem to be
third codon positions and, therefore,
synonymous changes.
The display of the statistical attributes of solely the coding region of the data, assigned
to the respective tribes (Figure 6), immediately shows that the data received from experimental
assignment hints to some inconsistencies among the sequence constitutions which could be of
crucial concern for further investigations. The conserved sites among the coding region are in
the majority of cases well above 900, with most of them between 1.000 and 1.200 residues,
which indicates that a huge amount of the sequence is of conserved origin and does not describe
deviations from this expected stable trend. Tribes ARAB, CAME, CARD, MICR, PHYS,
BRAS, ANAS, ANCH, DONT with conserved residues below 1.000 hint to disunity within the
tribe, as they consequently depict more variable sites. A steep drop of conserved sites can be
observed within tribes COCH (nearly no conserved sites) and MALC suggesting further
examinations. Variable and parsimony informative sites, as well as singletons, obey a more or
less moderate description, mostly not surpassing the 400 residue mark. A steep increase can of
course be viewed in the two named tribes, as counterpart to the dropped values of conserved
sites.
Figure 5. Nucleotide (x-axis) and amino acid (y-axis) identity for all
44 tribes are depicted. Bisecting line for optical support.
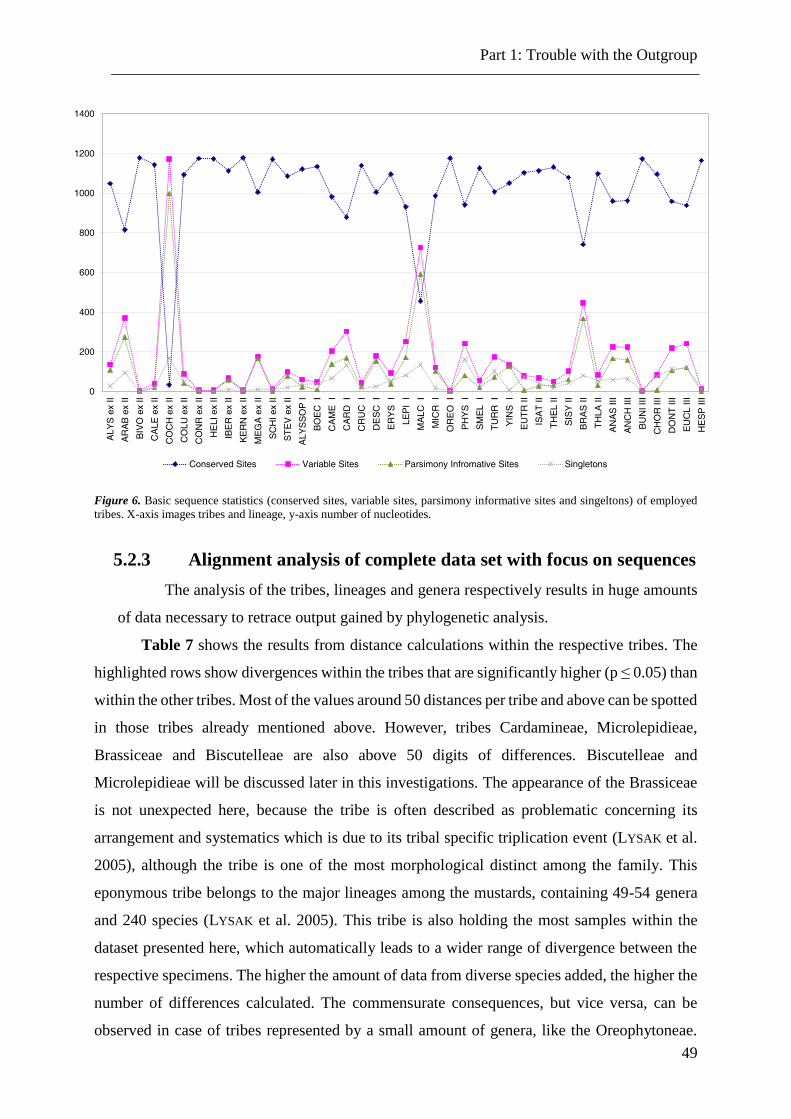
Part 1: Trouble with the Outgroup
49
Figure 6. Basic sequence statistics (conserved sites, variable sites, parsimony informative sites and singeltons) of employed
tribes. X-axis images tribes and lineage, y-axis number of nucleotides.
5.2.3 Alignment analysis of complete data set with focus on sequences
The analysis of the tribes, lineages and genera respectively results in huge amounts
of data necessary to retrace output gained by phylogenetic analysis.
Table 7 shows the results from distance calculations within the respective tribes. The
highlighted rows show divergences within the tribes that are significantly higher (p ≤ 0.05) than
within the other tribes. Most of the values around 50 distances per tribe and above can be spotted
in those tribes already mentioned above. However, tribes Cardamineae, Microlepidieae,
Brassiceae and Biscutelleae are also above 50 digits of differences. Biscutelleae and
Microlepidieae will be discussed later in this investigations. The appearance of the Brassiceae
is not unexpected here, because the tribe is often described as problematic concerning its
arrangement and systematics which is due to its tribal specific triplication event (LYSAK et al.
2005), although the tribe is one of the most morphological distinct among the family. This
eponymous tribe belongs to the major lineages among the mustards, containing 49-54 genera
and 240 species (LYSAK et al. 2005). This tribe is also holding the most samples within the
dataset presented here, which automatically leads to a wider range of divergence between the
respective specimens. The higher the amount of data from diverse species added, the higher the
number of differences calculated. The commensurate consequences, but vice versa, can be
observed in case of tribes represented by a small amount of genera, like the Oreophytoneae.
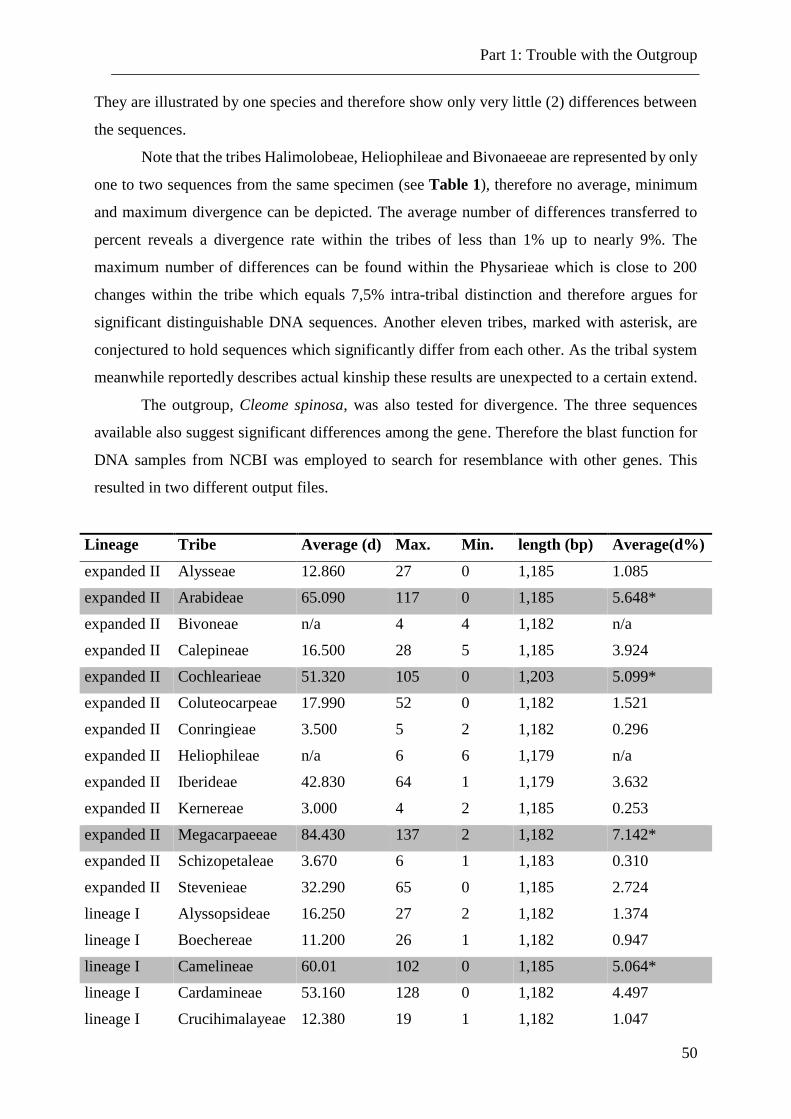
Part 1: Trouble with the Outgroup
50
They are illustrated by one species and therefore show only very little (2) differences between
the sequences.
Note that the tribes Halimolobeae, Heliophileae and Bivonaeeae are represented by only
one to two sequences from the same specimen (see Table 1), therefore no average, minimum
and maximum divergence can be depicted. The average number of differences transferred to
percent reveals a divergence rate within the tribes of less than 1% up to nearly 9%. The
maximum number of differences can be found within the Physarieae which is close to 200
changes within the tribe which equals 7,5% intra-tribal distinction and therefore argues for
significant distinguishable DNA sequences. Another eleven tribes, marked with asterisk, are
conjectured to hold sequences which significantly differ from each other. As the tribal system
meanwhile reportedly describes actual kinship these results are unexpected to a certain extend.
The outgroup, Cleome spinosa, was also tested for divergence. The three sequences
available also suggest significant differences among the gene. Therefore the blast function for
DNA samples from NCBI was employed to search for resemblance with other genes. This
resulted in two different output files.
Lineage Tribe Average (d) Max. Min. length (bp) Average(d%)
expanded II Alysseae 12.860 27 0 1,185 1.085
expanded II Arabideae 65.090 117 0 1,185 5.648*
expanded II Bivoneae n/a 4 4 1,182 n/a
expanded II Calepineae 16.500 28 5 1,185 3.924
expanded II Cochlearieae 51.320 105 0 1,203 5.099*
expanded II Coluteocarpeae 17.990 52 0 1,182 1.521
expanded II Conringieae 3.500 5 2 1,182 0.296
expanded II Heliophileae n/a 6 6 1,179 n/a
expanded II Iberideae 42.830 64 1 1,179 3.632
expanded II Kernereae 3.000 4 2 1,185 0.253
expanded II Megacarpaeeae 84.430 137 2 1,182 7.142*
expanded II Schizopetaleae 3.670 6 1 1,183 0.310
expanded II Stevenieae 32.290 65 0 1,185 2.724
lineage I Alyssopsideae 16.250 27 2 1,182 1.374
lineage I Boechereae 11.200 26 1 1,182 0.947
lineage I Camelineae 60.01 102 0 1,185 5.064*
lineage I Cardamineae 53.160 128 0 1,182 4.497
lineage I Crucihimalayeae 12.380 19 1 1,182 1.047
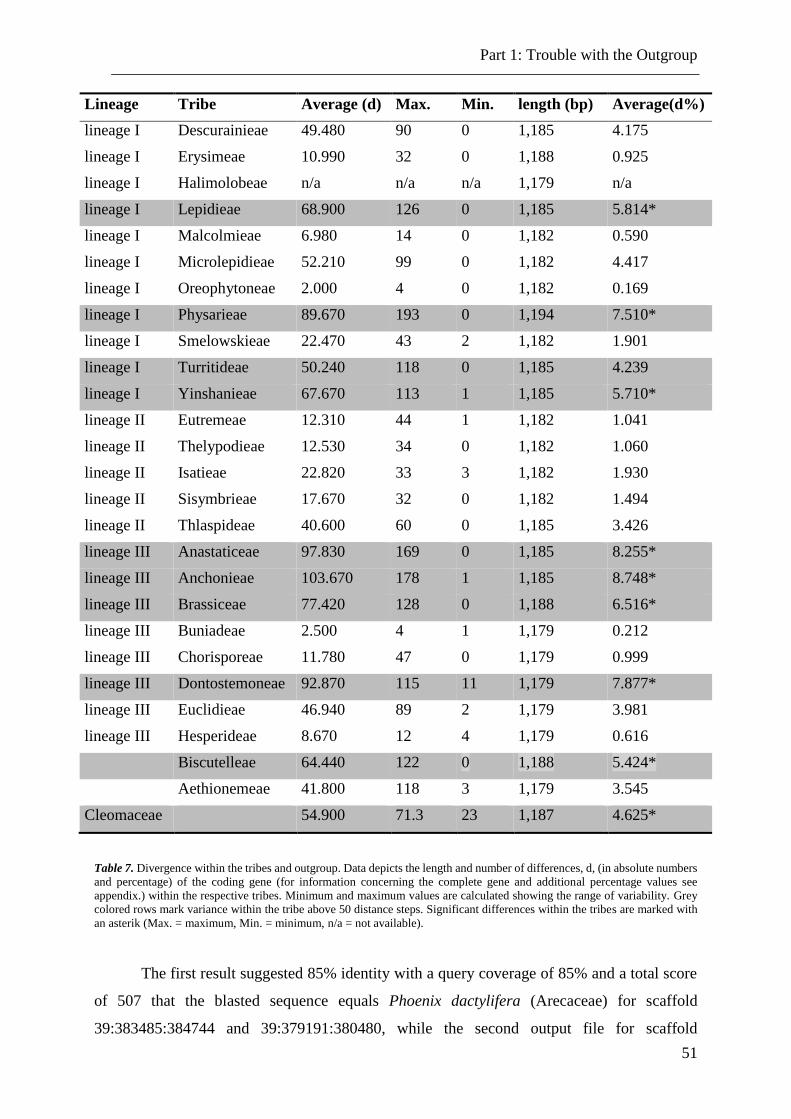
Part 1: Trouble with the Outgroup
51
Lineage Tribe Average (d) Max. Min. length (bp) Average(d%)
lineage I Descurainieae 49.480 90 0 1,185 4.175
lineage I Erysimeae 10.990 32 0 1,188 0.925
lineage I Halimolobeae n/a n/a n/a 1,179 n/a
lineage I Lepidieae 68.900 126 0 1,185 5.814*
lineage I Malcolmieae 6.980 14 0 1,182 0.590
lineage I Microlepidieae 52.210 99 0 1,182 4.417
lineage I Oreophytoneae 2.000 4 0 1,182 0.169
lineage I Physarieae 89.670 193 0 1,194 7.510*
lineage I Smelowskieae 22.470 43 2 1,182 1.901
lineage I Turritideae 50.240 118 0 1,185 4.239
lineage I Yinshanieae 67.670 113 1 1,185 5.710*
lineage II Eutremeae 12.310 44 1 1,182 1.041
lineage II Thelypodieae 12.530 34 0 1,182 1.060
lineage II Isatieae 22.820 33 3 1,182 1.930
lineage II Sisymbrieae 17.670 32 0 1,182 1.494
lineage II Thlaspideae 40.600 60 0 1,185 3.426
lineage III Anastaticeae 97.830 169 0 1,185 8.255*
lineage III Anchonieae 103.670 178 1 1,185 8.748*
lineage III Brassiceae 77.420 128 0 1,188 6.516*
lineage III Buniadeae 2.500 4 1 1,179 0.212
lineage III Chorisporeae 11.780 47 0 1,179 0.999
lineage III Dontostemoneae 92.870 115 11 1,179 7.877*
lineage III Euclidieae 46.940 89 2 1,179 3.981
lineage III Hesperideae 8.670 12 4 1,179 0.616
Biscutelleae 64.440 122 0 1,188 5.424*
Aethionemeae 41.800 118 3 1,179 3.545
Cleomaceae 54.900 71.3 23 1,187 4.625*
Table 7. Divergence within the tribes and outgroup. Data depicts the length and number of differences, d, (in absolute numbers
and percentage) of the coding gene (for information concerning the complete gene and additional percentage values see
appendix.) within the respective tribes. Minimum and maximum values are calculated showing the range of variability. Grey
colored rows mark variance within the tribe above 50 distance steps. Significant differences within the tribes are marked with
an asterik (Max. = maximum, Min. = minimum, n/a = not available).
The first result suggested 85% identity with a query coverage of 85% and a total score
of 507 that the blasted sequence equals Phoenix dactylifera (Arecaceae) for scaffold
39:383485:384744 and 39:379191:380480, while the second output file for scaffold
Part 1: Trouble with the Outgroup
52
229:1056422:1057707 showed a total score of 996, a query coverage of 97% and an identity of
83% matching with Anthirium andraeanum (Araceae). All three sequences, also they could not
directly be connected to the Brassicaceae, display chalcone synthase genes.
5.2.4 Identifying gene regions
5.2.4.1 Promoter
The promoter region (primer start within ACE-MRE region, seven base pairs before the
A-box) of the complete data set was analysed concerning length variability and (highly)
conserved regions. The shortest promoter, found in Iberis semperflorens sequence 2 and 3 (Isem
2 and 3; list of lab IDs see supplementary material S10), counted 116 base pairs, while the
longest counted 186 (Acor 1 and 2, Cmon 5, Crup 2) nucleotides. The promoter identity among
the complete data was, with 88.2% on nucleotide and 83.8% on amino acid level, unexpectedly
high.
The identities within the tribes were between 67.3% and 100% owing to the fact that some
tribes, like the Kernereae, are only represented by one genus or even species. In principle, it is
self-evident that the divergence between the promoter sequences rises the more different species
are involved in the analysis. But when distances within the promoter sequences of Biscutella
laevigata for example are investigated, an intra-species identity of only 76.4% can be observed,
suggesting a certain evolutionary distance between the sequences.
Although there is no defined threshold clearly separating an expected non-coding intra-species
divergence from increased divergence, suggesting evolutionary distance, variability around a
quarter of the promoter region indicates disproportionally difference among the non-coding
region at hand. In other words: around 75% identity of the promoter region within the same
species is too much to talk about allelic variation. Two different types of promoter sequences
could be identified, differing significantly in length. One set of promoters is 167 long, while
the shorter only shows 132 nucleotides. The first 38 base pairs do not display any distinction.
After a deletion of 19 nucleotides, the sequences exhibit only short identical parts, with
exception of the promoter end, where 6 bases are identical. The regulatory signals mentioned
in the next passage could also be detected.
Therefore it cannot be excluded that the functionality of the region is preserved. As a part of
the promoter is missing, further indications are simply not given, but the sequence divergence
can denote a change in functionality of the gene.
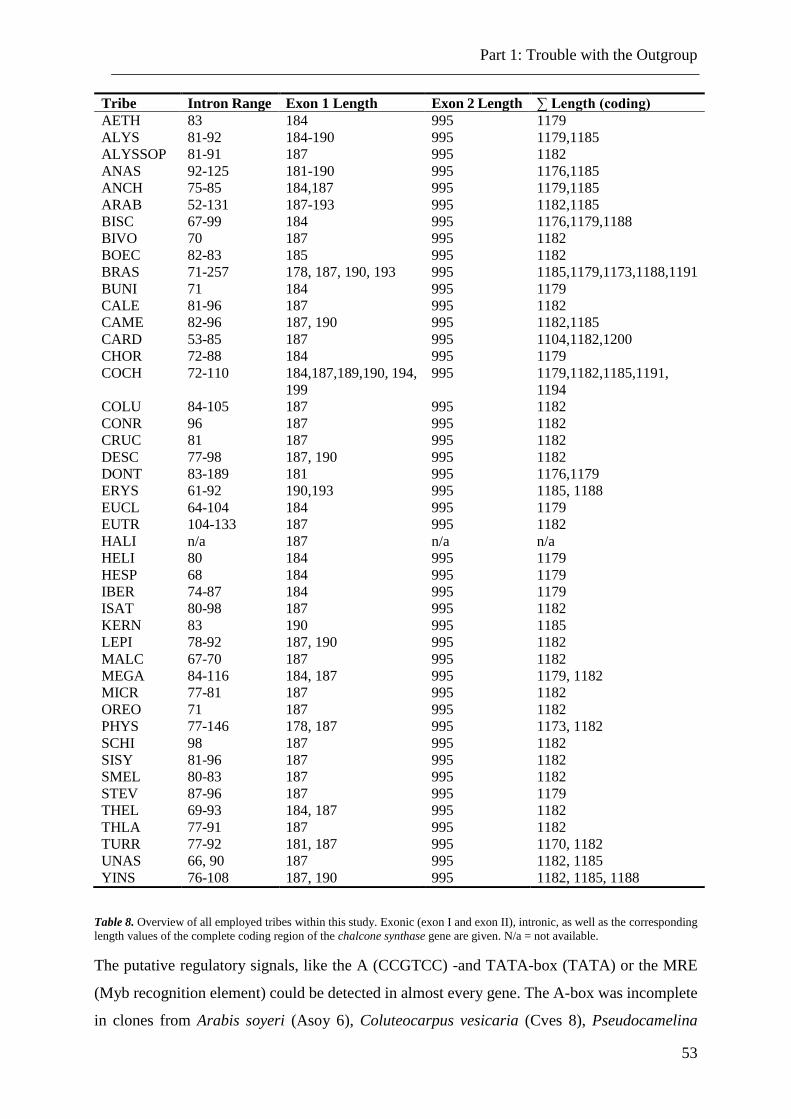
Part 1: Trouble with the Outgroup
53
Tribe Intron Range Exon 1 Length Exon 2 Length ∑ Length (coding) AETH 83 184 995 1179 ALYS 81-92 184-190 995 1179,1185 ALYSSOP 81-91 187 995 1182 ANAS 92-125 181-190 995 1176,1185 ANCH 75-85 184,187 995 1179,1185 ARAB 52-131 187-193 995 1182,1185 BISC 67-99 184 995 1176,1179,1188 BIVO 70 187 995 1182 BOEC 82-83 185 995 1182 BRAS 71-257 178, 187, 190, 193 995 1185,1179,1173,1188,1191 BUNI 71 184 995 1179 CALE 81-96 187 995 1182 CAME 82-96 187, 190 995 1182,1185 CARD 53-85 187 995 1104,1182,1200 CHOR 72-88 184 995 1179 COCH 72-110 184,187,189,190, 194,
199 995 1179,1182,1185,1191,
1194 COLU 84-105 187 995 1182 CONR 96 187 995 1182 CRUC 81 187 995 1182 DESC 77-98 187, 190 995 1182 DONT 83-189 181 995 1176,1179 ERYS 61-92 190,193 995 1185, 1188 EUCL 64-104 184 995 1179 EUTR 104-133 187 995 1182 HALI n/a 187 n/a n/a HELI 80 184 995 1179 HESP 68 184 995 1179 IBER 74-87 184 995 1179 ISAT 80-98 187 995 1182 KERN 83 190 995 1185 LEPI 78-92 187, 190 995 1182 MALC 67-70 187 995 1182 MEGA 84-116 184, 187 995 1179, 1182 MICR 77-81 187 995 1182 OREO 71 187 995 1182 PHYS 77-146 178, 187 995 1173, 1182 SCHI 98 187 995 1182 SISY 81-96 187 995 1182 SMEL 80-83 187 995 1182 STEV 87-96 187 995 1179 THEL 69-93 184, 187 995 1182 THLA 77-91 187 995 1182 TURR 77-92 181, 187 995 1170, 1182 UNAS 66, 90 187 995 1182, 1185 YINS 76-108 187, 190 995 1182, 1185, 1188
Table 8. Overview of all employed tribes within this study. Exonic (exon I and exon II), intronic, as well as the corresponding
length values of the complete coding region of the chalcone synthase gene are given. N/a = not available.
The putative regulatory signals, like the A (CCGTCC) -and TATA-box (TATA) or the MRE
(Myb recognition element) could be detected in almost every gene. The A-box was incomplete
in clones from Arabis soyeri (Asoy 6), Coluteocarpus vesicaria (Cves 8), Pseudocamelina
Part 1: Trouble with the Outgroup
54
glaucophylla (Pgla 3) and Turritis laxa (Tlax 1-1), whereas the TATA-box was damaged in an
Arabis soyeri (Asoy 5) and Pseudocamelina glaucophylla (Pgla 3) clone. The MR element
(ACCTAC) was only once incorrect (Pgla 3). As nearly all remaining promoter sequences (the
complete data set does not provide a promoter region) share these active sites without any
evidence for mutation, and therewith exhibit a high degree of uniformity, it can be concluded
that catalytic conservation among chs respectively within the promoter region is not only
common, but plays an essential role for the functionality of the gene. It further can be confirmed
that the A-box and MR element are a highly conserved region in all sequences.
Only the Euclidieae show a consequent transversion at position 17, which actually is situated
between these two elements. Some other unspecific point mutations could be detected which
could also derive from sequencing errors. A grouping of the region to the respective lineage
eased the aligning tremendously and revealed some specific sequence patterns. Each tribe
displays a specific arrangement of indels and mutational changes which look quite distinctive.
5.2.4.2 Intron
The intronic region is available for 543 sequences and depicts a range from 52
nucleotides (Amon CK4_A and Amon CK4_uA) to 257 nucleotides (Cann 1). Most plant chs
superfamily genes have one intron that splits the Cystein (Cys) in the consensus sequence
(KODURI et al. 2010), which also is applicable to the data at hand. Within the whole family,
chalcone synthase does always display only one intronic region, which is a phase-1 type
(T/GC). They also stick to the GT-AG rule, with exception of Pgla 3, stating that all eukaryotic
nuclear introns start with GT and end with AG, serving as splice donor and acceptor sites.
Although this part of the gene is too variable to align it properly among the whole
family, there are at least identifiable tendencies, due to the fact that the intron belongs to the
conserved non-coding sequences (CNS) bearing the potential to regulate gene expression. In
Pachycladon e.g. are two different patterns among the eight species, pinpointing the divergence
of the respective allopolyploid group. One intron is 77, while the other is 88 base pairs in length,
both with only four point mutations among the diverse sequences but with an inter-intronic p-
distance of 0.187. This suggests that the divergence of both groups happened chronologically
far enough, – 15.06 ± 6.38 mya are suggested (JOLY et al. 2009) according to the CHS data –
to give rise to the accumulation of the respective mutational events resulting in two kinds of
intronic regions with an overall identity of around 80%. The inter-intronic sequence identity of
each group of ~89% furthermore indicates two parallel radiation events which end up in two
sets of sequence species differing only to a very small amount.
Part 1: Trouble with the Outgroup
55
Another interesting observation could be detected in Pseudocamelina glaucophylla
(Pgla 3), which already was discussed above. The intronic sequence of this clone is, like Pgla
1 and Pgla 2, 97 base pairs in length but shows a distance of ~50%. Moreover, the Pgla 3 intron
displays no thymine, but more than 77% adenine bases resulting in long poly-adenine stretches
(up to twelve) and repetitive elements. Interestingly, the coding parts of that genes share nearly
identical sequence content.
5.2.4.3 Exon 1
The exonic region is divided into two parts. Exon 1 exhibits an overall mean distance of
p = 0.116, an average length of 187 and a range of 21 base pairs (Table 8). Most tribes are
defined by one typical length from exon 1, while two tribes show a high heterogeneity in the
length depiction, indicating high diversity for these tribes (COCH and BRAS). Most of those
tribes which show two different kinds of the first exonic region are again those which are nested
within different positions in the phylogeny. Among the tribes an even higher conservation,
described via identity, could be observed. Hence, identities between 88.8% (Physarieae) and
100% (Kernereae) were computed, with an average value well above 90%.
5.2.4.4 Exon 2
Exon 2, where complete, shows a thoroughgoing length of 995 base pairs among the
Brassicaceae family, regardless of tribe, duplication or other evolutionary influences. An
insertion of one codon in exon 2, in comparison to other angiosperms, can be observed, which
seems to be exclusively found in the Brassicaceae. The observed overall identity of exon 2
among the Cruciferae is 86.7%, illustrating a relatively low and slightly higher level of
divergence compared to exon 2. It was expected that the average identity should be higher
among the second exon, but this can be due to the fact that several sequences do have an
incomplete exonic region.
The highly conserved cystein residue at amino acid 169 (WANG et al. 2007), hence in
exon 2, is thought to be part of the 4-coumaroyl-CoA binding site, required for enzymatic
activity, and therefore essential for the functionality of the enzyme. This residue could be
detected in all chalcone synthase sequences employed here, although the position slightly varies
among the respective genera and tribes. In most cases it could be screened between amino acid
position 167 and 170, and often at the expected 169th residue. This shift in position is supposedly
owing the fact that brisk small scale rearrangements, implying insertions and deletions,
repeatedly restructure this gene. This can be viewed in Table 9 demonstrating the variability in
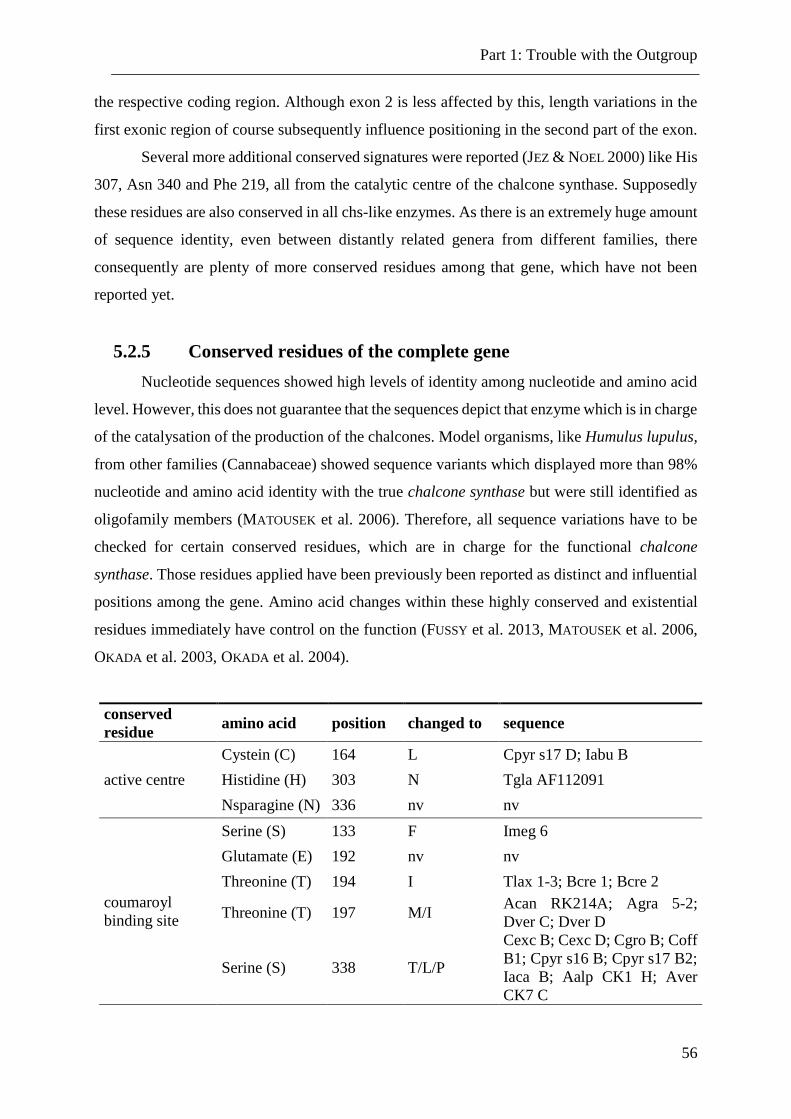
Part 1: Trouble with the Outgroup
56
the respective coding region. Although exon 2 is less affected by this, length variations in the
first exonic region of course subsequently influence positioning in the second part of the exon.
Several more additional conserved signatures were reported (JEZ & NOEL 2000) like His
307, Asn 340 and Phe 219, all from the catalytic centre of the chalcone synthase. Supposedly
these residues are also conserved in all chs-like enzymes. As there is an extremely huge amount
of sequence identity, even between distantly related genera from different families, there
consequently are plenty of more conserved residues among that gene, which have not been
reported yet.
5.2.5 Conserved residues of the complete gene
Nucleotide sequences showed high levels of identity among nucleotide and amino acid
level. However, this does not guarantee that the sequences depict that enzyme which is in charge
of the catalysation of the production of the chalcones. Model organisms, like Humulus lupulus,
from other families (Cannabaceae) showed sequence variants which displayed more than 98%
nucleotide and amino acid identity with the true chalcone synthase but were still identified as
oligofamily members (MATOUSEK et al. 2006). Therefore, all sequence variations have to be
checked for certain conserved residues, which are in charge for the functional chalcone
synthase. Those residues applied have been previously been reported as distinct and influential
positions among the gene. Amino acid changes within these highly conserved and existential
residues immediately have control on the function (FUSSY et al. 2013, MATOUSEK et al. 2006,
OKADA et al. 2003, OKADA et al. 2004).
conserved
residue amino acid position changed to sequence
active centre
Cystein (C) 164 L Cpyr s17 D; Iabu B
Histidine (H) 303 N Tgla AF112091
Nsparagine (N) 336 nv nv
coumaroyl
binding site
Serine (S) 133 F Imeg 6
Glutamate (E) 192 nv nv
Threonine (T) 194 I Tlax 1-3; Bcre 1; Bcre 2
Threonine (T) 197 M/I Acan RK214A; Agra 5-2;
Dver C; Dver D
Serine (S) 338 T/L/P
Cexc B; Cexc D; Cgro B; Coff
B1; Cpyr s16 B; Cpyr s17 B2;
Iaca B; Aalp CK1 H; Aver
CK7 C
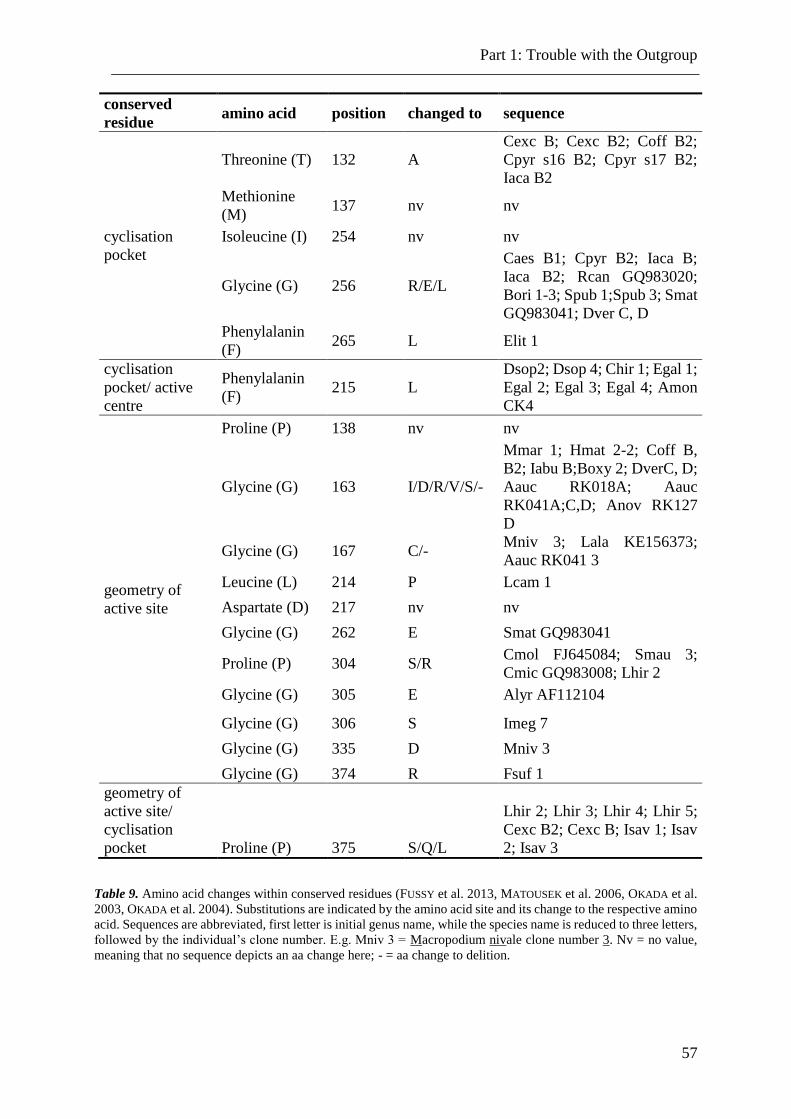
Part 1: Trouble with the Outgroup
57
conserved
residue amino acid position changed to sequence
cyclisation
Threonine (T) 132 A
Cexc B; Cexc B2; Coff B2;
Cpyr s16 B2; Cpyr s17 B2;
Iaca B2
Methionine
(M) 137 nv nv
Isoleucine (I) 254 nv nv
Glycine (G) 256 R/E/L
Caes B1; Cpyr B2; Iaca B;
Iaca B2; Rcan GQ983020;
Bori 1-3; Spub 1;Spub 3; Smat
GQ983041; Dver C, D
Phenylalanin
(F) 265 L Elit 1
cyclisation
pocket/ active
centre
Phenylalanin
(F) 215 L
Dsop2; Dsop 4; Chir 1; Egal 1;
Egal 2; Egal 3; Egal 4; Amon
CK4
geometry of
active site
Proline (P) 138 nv nv
Glycine (G) 163 I/D/R/V/S/-
Mmar 1; Hmat 2-2; Coff B,
B2; Iabu B;Boxy 2; DverC, D;
Aauc RK018A; Aauc
RK041A;C,D; Anov RK127
D
Glycine (G) 167 C/- Mniv 3; Lala KE156373;
Aauc RK041 3
Leucine (L) 214 P Lcam 1
Aspartate (D) 217 nv nv
Glycine (G) 262 E Smat GQ983041
Proline (P) 304 S/R Cmol FJ645084; Smau 3;
Cmic GQ983008; Lhir 2
Glycine (G) 305 E Alyr AF112104
Glycine (G) 306 S Imeg 7
Glycine (G) 335 D Mniv 3
Glycine (G) 374 R Fsuf 1
geometry of
active site/
cyclisation
pocket Proline (P) 375 S/Q/L
Lhir 2; Lhir 3; Lhir 4; Lhir 5;
Cexc B2; Cexc B; Isav 1; Isav
2; Isav 3
Table 9. Amino acid changes within conserved residues (FUSSY et al. 2013, MATOUSEK et al. 2006, OKADA et al.
2003, OKADA et al. 2004). Substitutions are indicated by the amino acid site and its change to the respective amino
acid. Sequences are abbreviated, first letter is initial genus name, while the species name is reduced to three letters,
followed by the individual’s clone number. E.g. Mniv 3 = Macropodium nivale clone number 3. Nv = no value,
meaning that no sequence depicts an aa change here; - = aa change to delition.
Part 1: Trouble with the Outgroup
58
Amino acid changes occurred, but mostly outside the conserved residues, (see Table 9),
depicted by MATOUSEK et al. (2006). These are characteristic for the functional chalcone
synthase gene, like its formation of the active site, the active centre, the cyclisation pocket, and
the coumaroyl binding site (MATOUSEK et al. 2006). In the majority of cases only one change
from one amino acid to another can be observed. As the original sequence, the functional sites
were taken from, derives from hop (Humulus lupulus L.), some of the changes, maybe
especially those which depict a multiple amino acid switch, could derive from sequences
divergence. But, as the residues discussed here are conserved due to functionality of the gene,
it is more likely that the changes derive from interfamilial r sources. A majority of deficiencies
cumulate clones that are assigned to genera or tribes bearing problems with phylogenetic
arrangements. Especially the sequences from the tribe Cochlearieae cover every category in the
residue column, with exception of the combined residue “cyclisation pocket and active centre”.
Together 29 sequences represented here derive from this tribe, which, however, is represented
with the most sequences in the data set, as well. Other tribes gathered here are Turritideae,
Brassiceae, Arabideae, Descurainieae, Buniadeae, Cardamineae, Lepidieae and Alysseae, but
most of them provide only one sequence. Six alignment positions (nv) representing conserved
sites, did not show even one mutational hint in the amino acid alignment. In respect to the size
and divergence of the specimen, these sites are highly conserved within the whole Brassicaceae
and most likely are of ample functional importance.
5.2.6 Trinucleotide frequency (k-mers)
DNA sequences display compositional heterogeneity on many scales, therefore
trinucleotide frequencies potentially deliver information on sequence constitution. Codon NCN
is preferred in any genome, while this in plant genomes corresponds the codon GCG. So, C is
highly preferential as second codon letter, which was already suggested previously by NIIMURA
et al. (2003).
No common behaviour of trinucleotides can be spotted, although some groups depict
analogical appearance of the trinucleotide distribution. CALE and COCH display a similar
amount of the respective trinucleotides, which tends to behave in an anti-parallel nucleotide
usage. While most of the tribes show an intensive occurrenc of the codons GAG, GAC, AAG
and CUC, which confirm the observation that G is highly preferred as first and third letter
(KOZAK 1999, NIIMURA et al. 2003), these are only used to a maximum value of 9.3 in those
two tribes. Heliophileae, Iberideae, Physarieae and Aethionemeae show a pattern that looks
shifted in comparison to the remaining tribes. These results, with exception of Calepineae, were
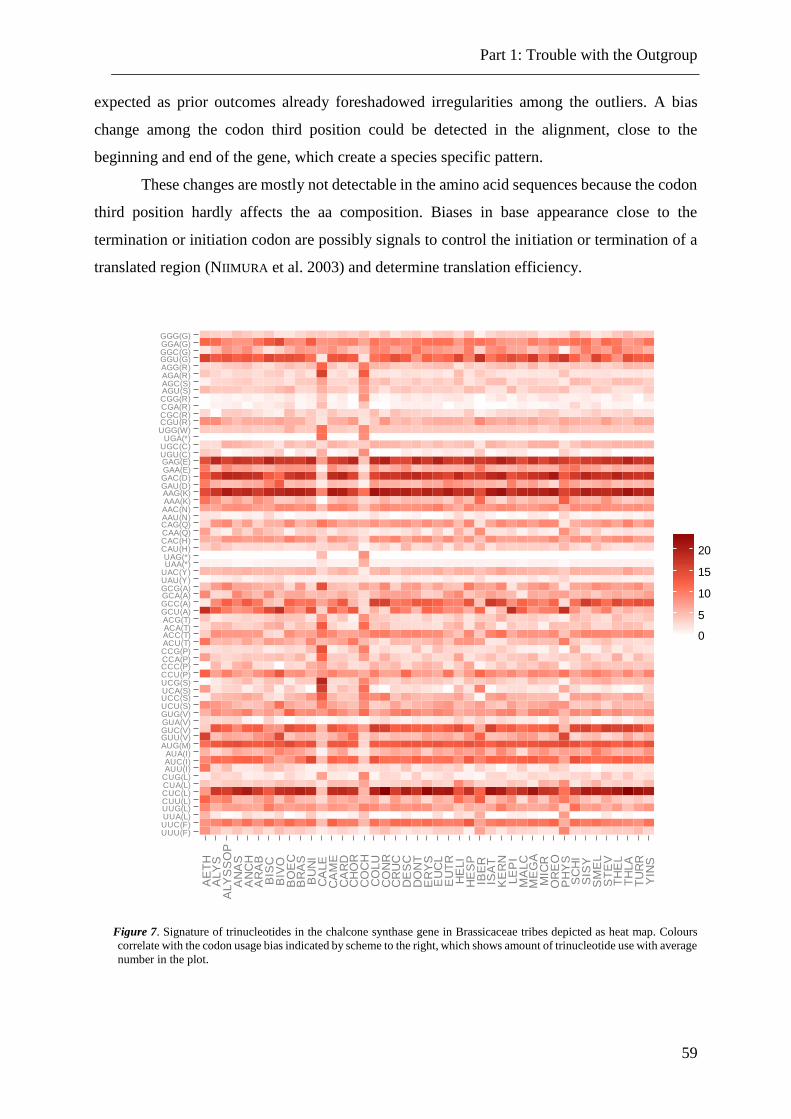
Part 1: Trouble with the Outgroup
59
expected as prior outcomes already foreshadowed irregularities among the outliers. A bias
change among the codon third position could be detected in the alignment, close to the
beginning and end of the gene, which create a species specific pattern.
These changes are mostly not detectable in the amino acid sequences because the codon
third position hardly affects the aa composition. Biases in base appearance close to the
termination or initiation codon are possibly signals to control the initiation or termination of a
translated region (NIIMURA et al. 2003) and determine translation efficiency.
Figure 7. Signature of trinucleotides in the chalcone synthase gene in Brassicaceae tribes depicted as heat map. Colours
correlate with the codon usage bias indicated by scheme to the right, which shows amount of trinucleotide use with average
number in the plot.
UUU(F)UUC(F)UUA(L)UUG(L)CUU(L)CUC(L)CUA(L)CUG(L)AUU(I)AUC(I)AUA(I)
AUG(M)GUU(V)GUC(V)GUA(V)GUG(V)UCU(S)UCC(S)UCA(S)UCG(S)CCU(P)CCC(P)CCA(P)CCG(P)ACU(T)ACC(T)ACA(T)ACG(T)GCU(A)GCC(A)GCA(A)GCG(A)UAU(Y)UAC(Y)UAA(*)UAG(*)
CAU(H)CAC(H)CAA(Q)CAG(Q)AAU(N)AAC(N)AAA(K)AAG(K)GAU(D)GAC(D)GAA(E)GAG(E)UGU(C)UGC(C)UGA(*)
UGG(W)CGU(R)CGC(R)CGA(R)CGG(R)AGU(S)AGC(S)AGA(R)AGG(R)GGU(G)GGC(G)GGA(G)GGG(G)
AE
TH
ALY
SA
LY
SS
OP
AN
AS
AN
CH
AR
AB
BIS
CB
IVO
BO
EC
BR
AS
BU
NI
CA
LE
CA
ME
CA
RD
CH
OR
CO
CH
CO
LU
CO
NR
CR
UC
DE
SC
DO
NT
ER
YS
EU
CL
EU
TR
HE
LI
HE
SP
IBE
RIS
AT
KE
RN
LE
PI
MA
LC
ME
GA
MIC
RO
RE
OP
HY
SS
CH
IS
ISY
SM
EL
ST
EV
TH
EL
TH
LA
TU
RR
YIN
S0
5
10
15
20
Part 1: Trouble with the Outgroup
60
6 Discussion
The phylogram of chs depicts several incongruences compared to expected as well as
previously demonstrated results (GERMAN et al. 2009, WARWICK et al. 2010, WARWICK et al.
2007, WARWICK et al. 2009). These estimations show that the corresponding chs-based
phylogenetic hypothesis is frequently not in congruence with known phylogenetic
reconstructions (BAILEY et al. 2006, BEILSTEIN et al. 2006, KOCH et al. 2001, KOCH 2000).
These incongruences are not supported by low bootstrap values on the majority (see
Figure 3 and S16), which would indicate a lack of consistent signal across sequences sampled
and would deliver a straight forward explanation. Most nodes are well above 50% support.
Therefore, noise ratio as well as an oversized amount of variable or informative sites can be
excluded. Although a considerable argument concerns the fact that a single-gene alignment can
comprise the challenge that it might not depict too much diverse information, but, the other way
round, sequences are too identical to result in well resolved and supported branches.
Evolutionary induced factors like lineage sorting, convergent evolution, or ancient
intergenic recombination events (SYVANEN et al. 1994) can only be considered to a certain
amount, as bootstrap support is too high.
It has also to be taken into account that the employed data set is relatively large
concerning number of sequences as well as the coverage of tribes, compared to other studies
(CONNER et al. 2009, JOLY et al. 2009, KOCH et al. 2001, O'KANE 2003, ZHAO et al. 2010)
displaying high bootstrap values. The number of operational taxonomic units (OUT)
immediately influences estimations in so far as the number of possible trees increases
exponentially (FELSENSTEIN 1978). Thus distances of capacious trees display a tendency to
depict lower bootstrap support, as some nodes are not frequently considered by the applied
algorithm in the sampled data.
The considerations listed above could all be taken into account for low bootstrap support
and poorly resolved gene tree reconstructions which could not be evidenced here. Hence, this
moreover supports the quality of the alignment, the calculations are based on and excludes
several options to be in charge.
Consequently, the gene tree depicted in Figure 3 is authentic but discloses
incongruences which have to be dissolved.
A very demonstrative difference, compared to affirmed Brassicaceae phylogenies is the
location of the outgroup, Cleome spinosa. This sequence is marked by a frame in the NJ tree in
Figure 3. The family of the Cleomaceae is applied within several studies to serve as reliable
outside information to root the mustard family (BAILEY et al. 2006, GERMAN et al. 2009,
Part 1: Trouble with the Outgroup
61
JOHNSTON et al. 2005, LIU et al. 2012). According to the definition of an outgroup, Cleome
spinosa is supposed to be more distantly related to the ingroup sequences than the ingroup
sequences are to each other. The Cleomaceae diverged from their common ancestor between
42.01 and 28.95 mya, thus supporting a legitimate outgroup status.
The reconstructions suggest that Cleome is not appropriate to anchor the gene tree at
hand. The C. spinosa sequence clusters with two clones from lineage II, namely Clausia aprica
and Malcolmia ramosissima (see Figure 3). The branch length of the putative outgroup
suggests a more recent divergence from the Brassicaceae close to the origin of lineage II, which
definitely does not depict the real evolution of the sister family. The reason for the unexpected
clustering behaviour could be due to its difference viewed in the genomic sequence. The
sequences derive from the complete genomic data DQ415920 to DQ415922 and result in three
chs loci within the whole genome, due to a triplication event within the family (JIAO et al. 2012,
SCHRANZ & MITCHELL-OLDS 2006). Neither of the loci results in an appropriate amino acid
sequence which could be aligned to the Brassicaceae correctly. One copy depicts a insertion of
eighteen nucleotides (scaffold 229:1056422:1057707) at the end of exon 2, which on the one
hand enlarges the coding region to a relatively huge extend of six codons and, on the other hand,
implies a shift in the reading frame, leading to a postponed termination codon at the end of exon
2 (alignment upon request). The remaining two sequences (scaffold 39:383485:384744 and
scaffold 39:379191:380480) both show an insert of twelve nucleotides, resulting in four
additional codons at the end of the second exon, while the first named displays an additional
deletion of nine nucleotides in the first exon. All three copies have changed their appearance
but are still in frame. No premature termination codon implies non-functionality but it is quite
likely that this gene encodes for a protein with a function at least slightly different from that of
chs. All three sequences, although they could not directly be connected to the Brassicaceae,
display chalcone synthase genes.
The increased length of the genes is somehow unexpected as SCHRANZ & MITCHELL-
OLDS (2006) argue that the gene loss among the compact Cleome genome is greater compared
to the Arabidopsis genome. Therefore it can be reasoned that the chs loci among the Cleome
genome are not (yet) affected by genome size reduction but by other evolutionary processes.
These indels either display an older duplication a polyploidisation event followed by
functional divergence after polyploidisation or a chromosome rearrangement. The multiple
homeologous small scale copies were rearranged by inversions and translocations within the
diploidised genomes. These events could have led to the present-day gene number and length
variation within the Cleomaceae.
Part 1: Trouble with the Outgroup
62
In case of functional divergence this sequence depicts the fate of a copy on its way to
gene loss. After an individual gene duplication, the redundant copy, which is not under selective
pressure, gathers deleterious mutations, leading to non-functionality and finally results in an
exclusion from the DNA. Most of the dispensable genes, resulting from the last polyploidy
event have already been lost from the genome, only around 27% of duplicates (BLANC et al.
2003) retain in the genome (reference from Arabidopsis thaliana). So, there obviously is a trend
towards reduction by massive gene loss. As the three sequences at hand derive from genomic
DNA and no other putative chs sequences could be spotted this means that at least one out of
these three chs-like sequences must be functional as plants are not capable of living without
these genes, as chs catalysis are responsible for the initial reaction within flavonoid biosynthesis
(CAIN et al. 1997). But this implies that at least some additional small-scale evolutionary
process must have worked on this nuclear gene.
Moreover, divergence time stimates argue that Cleomaceae split from their common
ancestor between 42.01 and 28.95 mya (see Table 22) what is in absolute congruence with ages
estimated by BLANC et al. (2003), proposing 40 to 24 mya for the same event. Thus Cleome is
supporting a legitimate outgroup status. However, the third estimated divergence time, 18.1
mya does not seem to fit into that draft.
It is suggested that Cleome evolved independently from the Brassicaceae and underwent
a triplication event more recently than the Brassicaceae’s duplication event. This results in
different ages for ancient polyploidy events within the two sister lineages Brassicaceae and
Cleomaceae (HALL et al. 2002, SCHRANZ & MITCHELL-OLDS 2006). Therefore it can be
reasoned that the Cleome spinosa chs sequence applied here depicts one copy deriving from the
triplication event which still maintained within the genome. This is assisted by the gathering of
sequences for which Cleome provides the outgroup position (see Figure 4) within divergence
time estimates. This clade contains data from tribes DONT, ARAB and ANAS. Genera within
that last mentioned tribe additionally show a low nucleotide identity (45%) which all seem to
be third codon positions and, therefore, synonymous changes (Figure 6). Those tribes have to
be further investigated, like already suggested in Table 4 (with exception of ARAB, which will
be discussed lateron in this thesis) and Table 7, indicating high divergence within the several
tribes. This table will be analysed within the following chapters.
As a consequence, the Cleomaceae as outgroup was removed from the data set. This
resulted in an alignment length of 1200 bp and 48.8% identity in comparison to 1218 bp and
45.8% identity with Cleome included.
Part 1: Trouble with the Outgroup
63
For further investigations, tribe Aethionemeae, as the most basal tribe of the mustards,
replaces Cleome and functions as outgroup. Moreover, the tribes listed in Table 4 will be
highlighted and surveyed for potential conspicuities causing the arrangements discussed above.
The overall appearance of the gene tree is self-evident for the fact that the chalcone
synthase gene does not end up in a thoroughgoing re-drawing of a backbone phylogeny for the
Brassicaceae. Although there are only nine nodes from more than one hundred within the
cladogram that show a bootstrap value less than 50 (between eleven and 49) which suggest that
the evolutionary history resembles the representation of the gene quite a lot, several questions
remain open concerning the evolution of the gene that led to such a complicated image.

Part 2: Trouble with the Tribal Arrangement
Part 2: Trouble with the Tribal Arrangement
65
The amount of data and already sustained results suggest to undertake several
approaches to receive insight into the diverse levels of DNA quality and constitution with a
focus on the tribes which already emerged distinctive features listed in Table 4. As one group
of chs sequences (sequences in first column) are those which arrange at the expected position
within phylogenetic analyses, while the second column depicts the counterparts arranging at
unexpected positions, those groups will be further referred to as “expected” and “unexpected”.
To identify putative irregularities and maybe evidence or explanations for their origins,
the analyses are conducted in the surrounding of the complete family to warrant
commensurability. A cursorily view on the data is definitely not sufficient to reveal differences
and key aspects which are in charge for the performance of DNA sequence data. Therefore,
diverse methods were applied on, for a start, the complete data, to approximate meaningful
outcomes step by step.
7 Material and methods
7.1 Comparative phylogenetic reconstructions and analyses
The NJ algorithm was repeatedly applied on the modified dataset. Cleome spinosa was
excluded, resulting in a representative dataset of 62 sequences. However, the settings are
completely identical to those described in part 1 (see 4.3.2).
The same holds true for the MP search method. Minimum change estimations are based
on the assumption that the tree, which is most likely, requires the fewest number of changes to
appropriately explain the data (HALL 2011). Parsimony methods do not utilise specific
evolutionary nucleotide substitution models for the estimations of phylogenetic reconstructions.
Hence, a search method has to be applied to find the minimum number of steps, which was
explained in part 1.
For this chapter an additional algorithm was applied on the dataset, namely the
maximum likelihood method (ML). This is a powerful statistical method that seeks for the tree
that makes the data most likely, by applying the log-likelihood, an explicit criterion, on the tree
to compare the diverse substitution models. ML analysis were also conducted in Mega5
(TAMURA et al. 2011). A new modeltest was previously conducted resulting in the same output
like in part 1 where the best fitting substitution model is the General Time Reversible Model
(GTR) with γ distributions and plus Invariant Sites (rates among sites). The Maximum
Likelihood Heuristic Method was set to Nearest-Neighbor-Interchange (NNI).
Part 2: Trouble with the Tribal Arrangement
66
7.1.1 Test for recombination
Within literature, one of the two most cited divergence-based approaches utilise the
GENECONV software package v 1.81 (SAWYER 1989) to test for incongruities between a given
species phylogeny and a gene tree that has been estimated from DNA sequences (INNAN 2011).
GENECONV was originally designed to detect allelic conversion, but has subsequently been
used to detect ectopic gene conversion (EGC), as well. The software searches for stretches of
sequence identity between sequences that extend further than would be expected by chance. A
given model of independent evolution between the loci and permutation tests (here 10,000)
which are used to establish statistical significance. The complete data file was applied on the
programme, fragment limits were set to minlength = 1, minnpolys = 2 and minscore = 2.
GENECONV detects gene conversion by looking for sufficiently similarly aligned segments
between a pair of sequences.
7.1.2 Divergence time estimates
Like in chapter 1 (5.1.3), three approaches were applied on the dataset where Cleome
was excluded. With exception of the outgroup file, no changes in the setting of BEAUti
(DRUMMOND et al. 2012) were deployed in order to both guarantee the comparability of the
output and to define the impact of the inappropriate outgroup.
7.1.3 Lineage through time plots (LTT)
The genetic behaviour of the sequences argue for estimations linked to divergence times
of these species plotted against the birth and maybe death of the gene in the respective group.
LTT daigramms plot the number of lineages in a clade that have any living descendants from
the respective data against time (RABOSKY & LOVETTE 2008).
LTT plots were constructed with the single MCC trees, using the ape package (PARADIS
et al. 2004) of the R software environment (R CORE TEAM 2014). These plots illustrate an
overall pattern of diversification. LTT were created for the tribes causing confusion among the
constructed phylogenies and are suggested to be putatively of non-monophyletic origin
concerning the evolution of the chalcone synthase.
Part 2: Trouble with the Tribal Arrangement
67
7.2 Sequence analysis
7.2.1 Alignment analysis of the complete data
For an overview the complete data was analysed, mostly with models and tools
implemented in MEGA5 (TAMURA et al. 2011) or MEGA6 (TAMURA et al. 2013), to receive
basic statistical values and first hints pointing to further analysis methods and grouping
strategies. Therefore the data set was divided into the single tribes, coding and complete DNA
sequences and nucleotide versus amino acid compositions were analysed. It is not feasible to
depict any chunk of outcome for every lineage, tribe, genus or even species. Hence,
achievements are displayed or discussed to a) give an overview and basis for comparison and
b) depict significant peculiarities.
7.2.2 Identifying gene regions
The examination of the complete nuclear gene will help to unravel the differences and
similarities among the tribes, genera and species. It, moreover reveals the discrepancies among
the sequences that resulted in unexpected phylogenetic placements. In most studies concerning
genes encoding a protein, it is prevailing to only employ the coding region for analysis. Of
course, estimations and calculations are just applied on the gene’s part of interest and not on
the intragenic regions. But molecular generic elements like the promoter region have been
successfully employed to not only compare sequential parts but also to investigate functionality
(DE MEAUX et al. 2005). Therefore the data has been analysed not only as entire coding or
complete gene, but also separated into their respective structural parts.
7.2.3 DNA motif search among gene
For further analysis of the coding and non-coding parts of the chalcone synthase gene,
MEME version 4.9.1 (BAILEY et al. 2009) was employed, which is a motif-based sequence
analysis tool. The statistical significance of each motif is given in E-values, starting with the
motif of highest significance, which means a low E-value, here set to a threshold of 0.05. The
E-value is based on the lnL ratio, width, sites, background letter frequencies and the size of the
applied data.
The chosen database for the motif search is JASPAR CORE (2014) for plants. Further
settings allowed a search for maximum 100 motifs with a minimum length of 6 and a maximum
of 30 nucleotides.
Part 2: Trouble with the Tribal Arrangement
68
7.2.4 Transition/transversion rate bias
An additional factor influencing an accurately phylogeny depends on the pattern and
amount of homoplasy present in a dataset. To reduce that effect character-state weighting, based
on a model of DNA evolution (BROUGHTON et al. 2000), was employed. The
transition/transversion bias is known to be a general possession of DNA sequence evolution. In
virtually all DNA sequences transitions (TC, AG) have been noted to occur at higher
frequencies than transversions (TA, TG, CA, CG) and gather multiple
substitutions at their fast-evolving sites. This results in the accumulation of a stochastic signal
in the sequences, demonstrating homoplasies (GOJOBORI 1983, WAKELEY 1993, YANG &
YODER 1999).
It has been demonstrated in several reviews that low levels of genetic divergence results
in an increased transition/transversion (ti/tv) ratio and, vice versa, at high levels of divergence,
transition/transversion appears to be low. At levels around 20% divergence or more, both
substitution types were demonstrated to show equal frequencies (YANG & YODER 1999).
Therefore the transition/transversion bias was calculated using DAMBE’s 5.3.115 (XIA 2013)
tool for sequence analysis estimating nucleotide substitution patterns, depicting a detailed
output. This beholds generalised assumptions about different types of character changes
(BROUGHTON et al. 2000). Genetic distance analyses were based on a highly hierarchical
hypothesis test of alternative models implemented in Modeltest 3.7 (POSADA 2003).
7.3 Compositional heterogeneity among DNA
7.3.1 GC content
Among species within a phylogenetic group, genomic GC% values can cover a wide
range that is particularly evident at third codon positions. Previous research has demonstrated
that individual genes depict a homostabilising propensity to adopt a comparatively uniform
GC%, defined as (micro)isochores that fill a certain niche and depict an explicit characteristic
pattern among that respective gene, which are said to strongly associate with the genome
organisation (EYRE-WALKER & HURST 2001). In the majority of cases the nucleotide
composition is most diverse in the second codon position, which is of high interest concerning
amino acid determination (FORSDYKE 2004). Therefore nucleotide compositions were
calculated with MEGA5 (TAMURA et al. 2011) and checked for identity and similarity. All
codon positions were considered.
Part 2: Trouble with the Tribal Arrangement
69
7.3.2 Base composition
Base composition analysis suggest that the synonymous codon usage bias is significant
and influenced by various factors as mutational bias, gene function or translational selection
(XU et al. 2008), although Chargaff's rule (CHARGAFF et al. 1952, ELSON & CHARGAFF 1952)
states that any cell from any organism display an 1:1 ratio of purine (A and G) and pyrimidine
(T and C) bases. This specifically means that both the amount of guanine equals that of cytosine,
while the same holds true for adenine and thymine. In other words, G = C and A = T, concerning
base composition.
Another measure to study the codon usage biases in genes (and genomes) is the effective
number of codons (ENC or Nc). It has been proven that this measures are among the most
reliable to show codon usage bias (COMERON & AGUADE 1998).
Therefore, CodonW v. 1.4.2 (SHARP et al. 2005) was employed to estimate the codon
usage indices of an overall GC, as well as an GC3 (third codon position) content and,
additionally, the ENC.
7.3.3 Trinucleotide frequency
The exertion and the motivation of the employment of trinucleotide frequencies has
already been explained in the previous chapter. The disparities are within the utilised data set.
The plot estimated here contains only those eight tribes which are argued to be not of
monophyletic origin. Therefore all sequences assigned to those tribes were gathered in one
record to facilitate data comparison on a small scale level comparing the usage of every single
codon within the groups.
For illustration a heat map diagram was chosen, beacause this format intuitively
distinguishes distinctive characteristics in large-scale data sets. Therefore the software R (R
CORE TEAM 2014) was employed, which is an open source statistical environment. Two
additional packages namely the ggplot2 package (WICKHAM 2009), available for R, for
graphical illustration and a package for transforming input data, namely reshape2 (WICKHAM
2007), converting data for ggplot2, were utilised.
7.4 Adaptive evolution
When homologous DNA sequences are compared, almost always do silent or (nearly)
neutral mutations outnumber the amount of replacement mutations, which is owing to the fact
that most purifying selections are eliminated. To identify evidence of either positive or negative
Part 2: Trouble with the Tribal Arrangement
70
selection, the number of replacement and silent mutations have to be normalised to the number
of silent and replacement sites in the respective gene.
The ω ratio (dN/dS) is used as measure of the operation and pressure of selection applied
on the protein level, which is demanded here.
The corrected proportions of nonsynonymous substitution per nonsynonymous site (dN)
and synonymous substitutions per synonymous site were estimated from the sequences based
on maximum likelihood methodology of YANG (1997) by using the CODEML which is
incorporated in the software package PAML (YANG & YODER 1999).
To test the statistical significance of the dN/dS ratio, a likelihood ratio test (LRT for
hierarchically nested models) has to be applied on the data. The test verifies the goodness-of-
fit between two models and depicts whether individual ratios or only one ratio are valid for the
tree. Therefore the log likelihood for both models has to be compared. Twice the result from
the difference between the likelihoods is used as the score for the chi-square value, as the LRT
statistic approximately follows a chi-square distribution. The degree of freedom needs to be
individually considered for each dataset to find the respective critical chi-square value with a
probability of 5% (p ≤ 0.05) from standard statistical tables.
Selection can operate at miscellaneous levels and therefore different questions can be
posed. An evolutionary pathway method, the Nei-Gojobori method, in comparison to the ML
method mentioned above, can be tested with MEGA5 (TAMURA et al. 2011). Both analyses are
based on the comparison of codons. This method intends to test whether positive or negative
selection was operating as these sequences diverged. Therefore each tribe has to be tested
individually with MEGA’s tool codon based Z-test for selection, where an overall average with
variance estimations of 1,000 bootstrap replications was applied. The substitution type has to
be set to Syn-Nonsynonymous while the Nei-Gojobori method (proportion) has to be chosen.
7.4.1 Origin of purifying selection
To answer the consequently rising question, where in the gene the selection occurred,
dN/dS values have to be estimated among each codon. A ML reconstruction of ancestral states
under a Muse-Gaut model (MUSE & GAUT 1994) of codon substitution and General Time
Reversable model of nucleotide substitution was estimated. This model is implemented in
MEGA6 (TAMURA et al. 2013), originating from the HyPhy software package (POND et al.
2005), and estimates selection among each codon. This option calculates the strength of
selection (positive or negative) operating upon each individual codon in an alignment and
provides statistical support measures of each estimate.
Part 2: Trouble with the Tribal Arrangement
71
Fisher’s Exact Test of Neutrality was additionally applied on the data to estimate the
number of synonymous and nonsynonymous differences among the sequences, using the Nei-
Gojobori method (NEI & GOJOBORI 1986). This test is utilised tests of selection can be
conducted to examine the null hypothesis of the neutral evolution.
7.4.2 Synonymous substitution rate
As functional loci, genes of the chs family are likely to be shaped by natural selection
(WANG et al. 2007). Only synonymous sites tend to be neutral and are capable to provide
information for dating split events. The number of nucleotide substitutions at synonymous sites
(Ks) were calculated for the coding region of every tribe, and, moreover, an overall Ks was
estimated, as well. Calculated data can easily be applied on the formula for synonymous
substitution rates to obtain the remaining values by transposition of the formula, r (sometimes
also found as µ) = dS/2T. Like already discussed, an influence on the rate of substitution among
the respective tribes, due to varying functional constraint, is expected.
7.4.3 Ancestral sequence reconstruction
This method could deliver a projection by which estimated ancestral states resolve some
relatedness within the phylogenetic reconstructions (OMLAND 1999). The idea is that those
reconstructions may offer hints for the gene evolution among the mustards by revealing some
evolutionary structure within the ancient sequences, as those are variations of the recent ones.
It moreover may indicate variations among the sequences that could have arisen (BROOKS
1999). So, already available genetic information can be employed in order to determine
evolutionary routes and timing (RONQUIST 2004). MEGA5 (TAMURA et al. 2011) offers a
maximum likelihood method to estimate those sequences, including ancestral gaps.
Reconstructions were executed mainly following the directions of the manual by HALL (2006).
8 Results
8.1 Comparative phylogenetic reconstructions and analyses
The evolutionary relationship of all three algorithms applied on the dataset without
Cleome spinosa resulted in a nearly absolute congruence concerning the topology displayed by
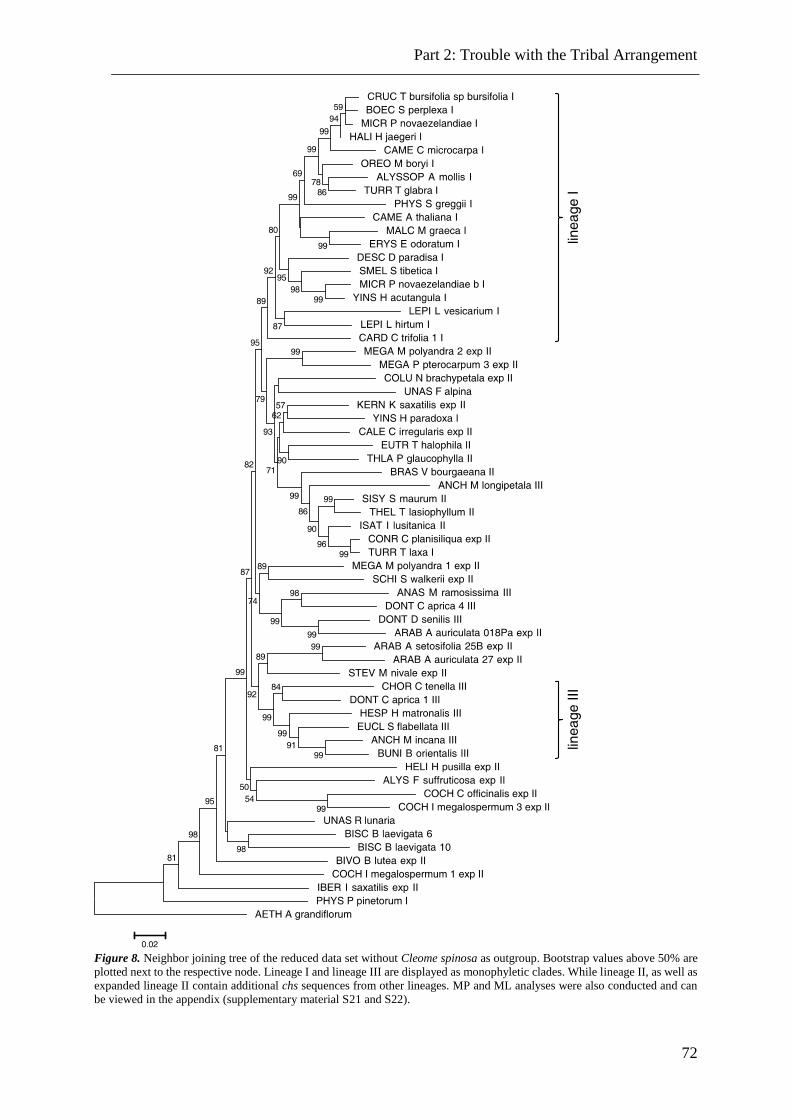
Part 2: Trouble with the Tribal Arrangement
72
Figure 8. Neighbor joining tree of the reduced data set without Cleome spinosa as outgroup. Bootstrap values above 50% are
plotted next to the respective node. Lineage I and lineage III are displayed as monophyletic clades. While lineage II, as well as
expanded lineage II contain additional chs sequences from other lineages. MP and ML analyses were also conducted and can
be viewed in the appendix (supplementary material S21 and S22).
Part 2: Trouble with the Tribal Arrangement
73
the neighbor joining tree in Figure 8. The NJ method lead to an optimal tree with the sum of
branch length = 3.142. The confidence probability (multiplied by 100) that the interior branch
length is greater than zero, as estimated using the bootstrap test (1,000 replicates) is shown next
to the branches (DOPAZO 1994, RZHETSKY & NEI 1992). Moreover, the branch lengths are
depicted in the same unit as those of evolutionary distances used to infer the respective
phylogenetic tree.
What is striking in these gene tree phylogenies is that the exclusion of Cleome
immediately leads to, firstly, nearly congruent trees implying different algorithms and,
secondly, to a gene tree phylogeny which looks straightforward, as AETH, as the most basal
tribe, arranges at the uttermost position within the arrangements. However, the ML and the MP
phylogenies do not depict such extraordinary high bootstrap values like it can be viewed in the
NJ tree (not shown, compare supplementary material S21 and S22). Concerning the maximum
parsimony analysis of taxa, the most parsimonious tree (not shown) with the length = 4008 is
displayed in the appendix, with a consistency index (CI) of 0.22788, a retention index (RI) of
0.44853 and a composite index of 0.118 for all sites. The percentage of replicate trees in which
the associated taxa clustered together in the bootstrap test (1,000 replicates) are shown next to
the branches, but only values above 50% are displayed (FELSENSTEIN 1985). Only the more
recent nodes and the nodes which mark the split into the respective lineages are supported with
values above 50%. Lineage I for example shows a bootstrap support of 68%, while lineage III,
at least, is supported with 83%, while the remaining data is only moderately backed.
The molecular phylogenetic analysis via ML method resulted in a tree with the highest
lnL of -21.9243 and a topology which are superimposable with tree displayed above. The initial
tree for the heuristic search was obtained by applying the NJ method to a matrix of pairwise
distances estimated using the MCL (Maximum Composite Likelihood) approach. The
percentage with which taxa cluster together is again much lower than in the NJ tree and the
values above 50% are also more rarely distributed.
Although bootstrap values do not support every node consummately, identical
behaviour of the associated taxa within diverse reconstruction methods suggest an entity among
the data. In all employed analysis methods, lineage I was well facilitated with moderate to high
bootstrap values, as well as lineage III which is monophyletic in all representations. Lineage II
members do cluster within one group which seems to be polyphyletic as additional sequences
are added to the group and seem to share the recent common ancestor. Several samples from
expanded lineage II (KERN, CALE, COLU, CONR, YINS and MEGA) are associated with
lineage II. The chs reconstruction at hand suggests that Conringia planisiliqua, as well as
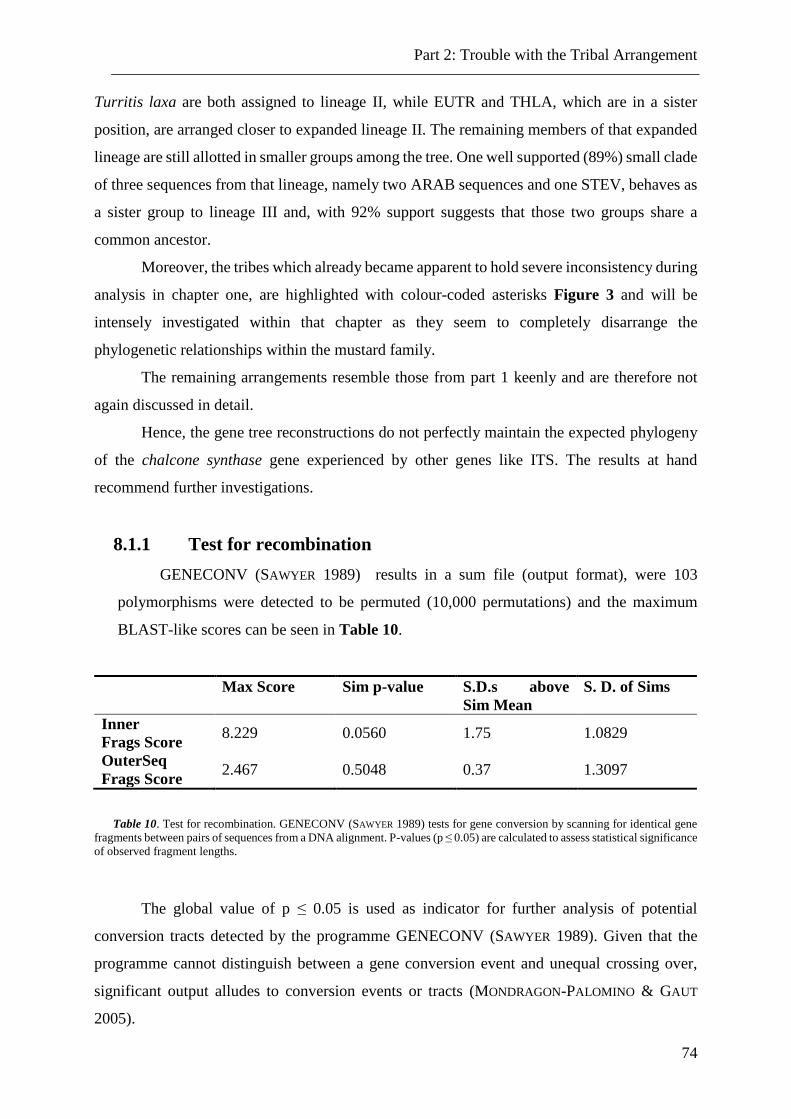
Part 2: Trouble with the Tribal Arrangement
74
Turritis laxa are both assigned to lineage II, while EUTR and THLA, which are in a sister
position, are arranged closer to expanded lineage II. The remaining members of that expanded
lineage are still allotted in smaller groups among the tree. One well supported (89%) small clade
of three sequences from that lineage, namely two ARAB sequences and one STEV, behaves as
a sister group to lineage III and, with 92% support suggests that those two groups share a
common ancestor.
Moreover, the tribes which already became apparent to hold severe inconsistency during
analysis in chapter one, are highlighted with colour-coded asterisks Figure 3 and will be
intensely investigated within that chapter as they seem to completely disarrange the
phylogenetic relationships within the mustard family.
The remaining arrangements resemble those from part 1 keenly and are therefore not
again discussed in detail.
Hence, the gene tree reconstructions do not perfectly maintain the expected phylogeny
of the chalcone synthase gene experienced by other genes like ITS. The results at hand
recommend further investigations.
8.1.1 Test for recombination
GENECONV (SAWYER 1989) results in a sum file (output format), were 103
polymorphisms were detected to be permuted (10,000 permutations) and the maximum
BLAST-like scores can be seen in Table 10.
Max Score Sim p-value S.D.s above
Sim Mean
S. D. of Sims
Inner
Frags Score 8.229 0.0560 1.75 1.0829
OuterSeq
Frags Score 2.467 0.5048 0.37 1.3097
Table 10. Test for recombination. GENECONV (SAWYER 1989) tests for gene conversion by scanning for identical gene
fragments between pairs of sequences from a DNA alignment. P-values (p ≤ 0.05) are calculated to assess statistical significance
of observed fragment lengths.
The global value of p ≤ 0.05 is used as indicator for further analysis of potential
conversion tracts detected by the programme GENECONV (SAWYER 1989). Given that the
programme cannot distinguish between a gene conversion event and unequal crossing over,
significant output alludes to conversion events or tracts (MONDRAGON-PALOMINO & GAUT
2005).
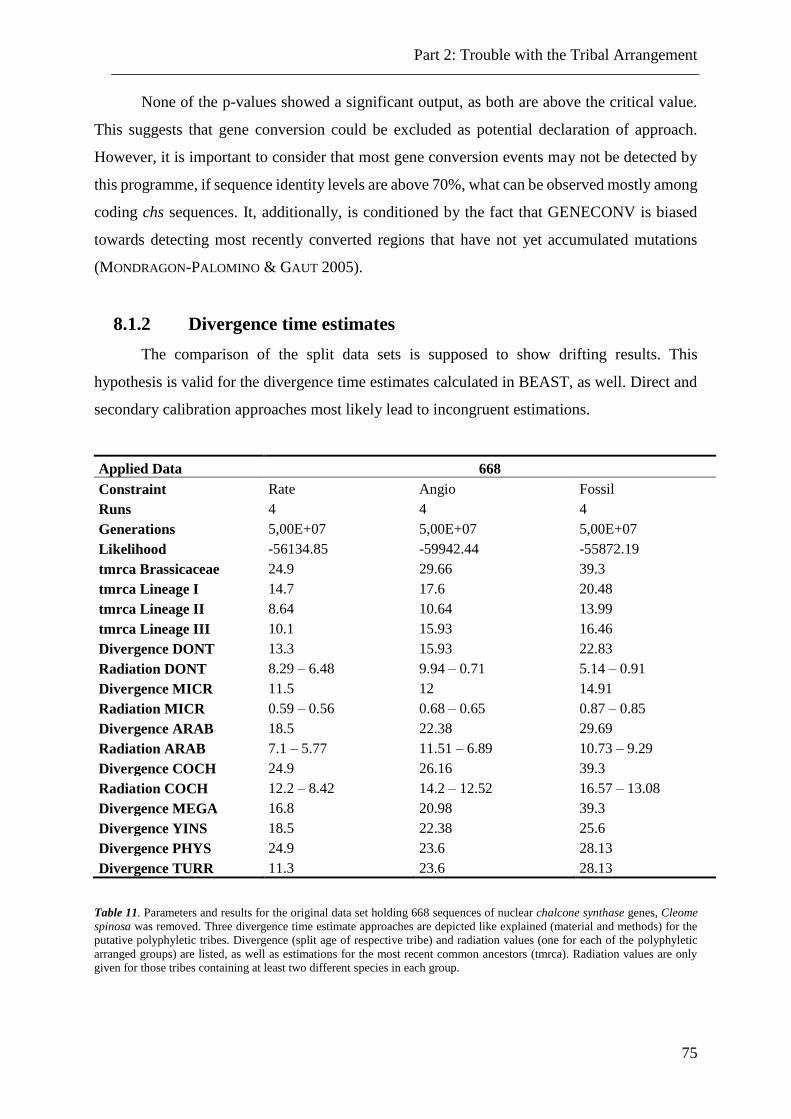
Part 2: Trouble with the Tribal Arrangement
75
None of the p-values showed a significant output, as both are above the critical value.
This suggests that gene conversion could be excluded as potential declaration of approach.
However, it is important to consider that most gene conversion events may not be detected by
this programme, if sequence identity levels are above 70%, what can be observed mostly among
coding chs sequences. It, additionally, is conditioned by the fact that GENECONV is biased
towards detecting most recently converted regions that have not yet accumulated mutations
(MONDRAGON-PALOMINO & GAUT 2005).
8.1.2 Divergence time estimates
The comparison of the split data sets is supposed to show drifting results. This
hypothesis is valid for the divergence time estimates calculated in BEAST, as well. Direct and
secondary calibration approaches most likely lead to incongruent estimations.
Applied Data 668
Constraint Rate Angio Fossil
Runs 4 4 4
Generations 5,00E+07 5,00E+07 5,00E+07
Likelihood -56134.85 -59942.44 -55872.19
tmrca Brassicaceae 24.9 29.66 39.3
tmrca Lineage I 14.7 17.6 20.48
tmrca Lineage II 8.64 10.64 13.99
tmrca Lineage III 10.1 15.93 16.46
Divergence DONT 13.3 15.93 22.83
Radiation DONT 8.29 – 6.48 9.94 – 0.71 5.14 – 0.91
Divergence MICR 11.5 12 14.91
Radiation MICR 0.59 – 0.56 0.68 – 0.65 0.87 – 0.85
Divergence ARAB 18.5 22.38 29.69
Radiation ARAB 7.1 – 5.77 11.51 – 6.89 10.73 – 9.29
Divergence COCH 24.9 26.16 39.3
Radiation COCH 12.2 – 8.42 14.2 – 12.52 16.57 – 13.08
Divergence MEGA 16.8 20.98 39.3
Divergence YINS 18.5 22.38 25.6
Divergence PHYS 24.9 23.6 28.13
Divergence TURR 11.3 23.6 28.13
Table 11. Parameters and results for the original data set holding 668 sequences of nuclear chalcone synthase genes, Cleome
spinosa was removed. Three divergence time estimate approaches are depicted like explained (material and methods) for the
putative polyphyletic tribes. Divergence (split age of respective tribe) and radiation values (one for each of the polyphyletic
arranged groups) are listed, as well as estimations for the most recent common ancestors (tmrca). Radiation values are only
given for those tribes containing at least two different species in each group.
Part 2: Trouble with the Tribal Arrangement
76
When the complete data was applied, relatively strong variations, due to the approaches
and the inappropriate chs sequence from C. spinosa, occurred. The estimates via range of
synonymous subsition rates again resulted in the youngest outcome and assesses the crown age
of the Brassicaceae family, with 24.9 mya, into the early Oligocene. This estimation is well
within the range of previous research (COUVREUR et al. 2010). The mean rate settled at 1.29 x
10-8 (95% HPD 7.08-9 and 1.1-8) which is a bit faster than expected. This might be due to the
fact that the polyphyletic data included displays increased divergence. The output received via
dating with released angiosperm split calibrations resulted in older estimations for the crown
group, namely 29.66 mya. While the third approach, the fossil calibration, resulted in an
estimation of 39.3 mya for the crown age of the family, dating its origin back to the Eocene
(54-35 mya). Without the outgroup, a trend towards younger estimations can be scheduled,
especially in the Angio approach, which displays a crown age which is antedated 5 million
years. The estimated lineage ages are in relative congruence among all three approaches,
arguing for lineage I to be the oldest (between 20.49 and 14.7 mya) and lineage II as the most
recently derived group with estimations between 13.99 and 8.64 mya. The age estimations for
the tribal divergences still settles at relatively high rates. Therefore, the excluded outgroup did
not affect all estimations listed.
8.1.3 Lineage through time plots
Changes in diversification effect the delineation of all organisms among the data and
also in single clades. Therefore the expectation of those estimates is exponential growth in case
the rates of speciation are constant over time. Significant deviations indicate that diversification
is changing as a function of time. This expected results can be viewed in the plot received from
each tribe suggesting a polyphyletic presentation. Each tribe affected was plotted separately
(not shown) depicting a single progress which is due to the fact that the number of sequences
for the single tribes are not that high (between six and 19). Thus, the development of species
among one tribe would result in a meaningful output and the division into the two groups within
each tribe would result in even less administrable data. Therefore all of those (complete) tribes
were gathered in one plot, delivering valuable information of their origin and evolution.
For each tribe a plot was estimated predicting diverse modes of evolution or a parallel
development of the clades among these tribes.
Therefore each curve in the plot consists of two diagrams depicting the particular group
of sequences following the gene tree reconstructions.
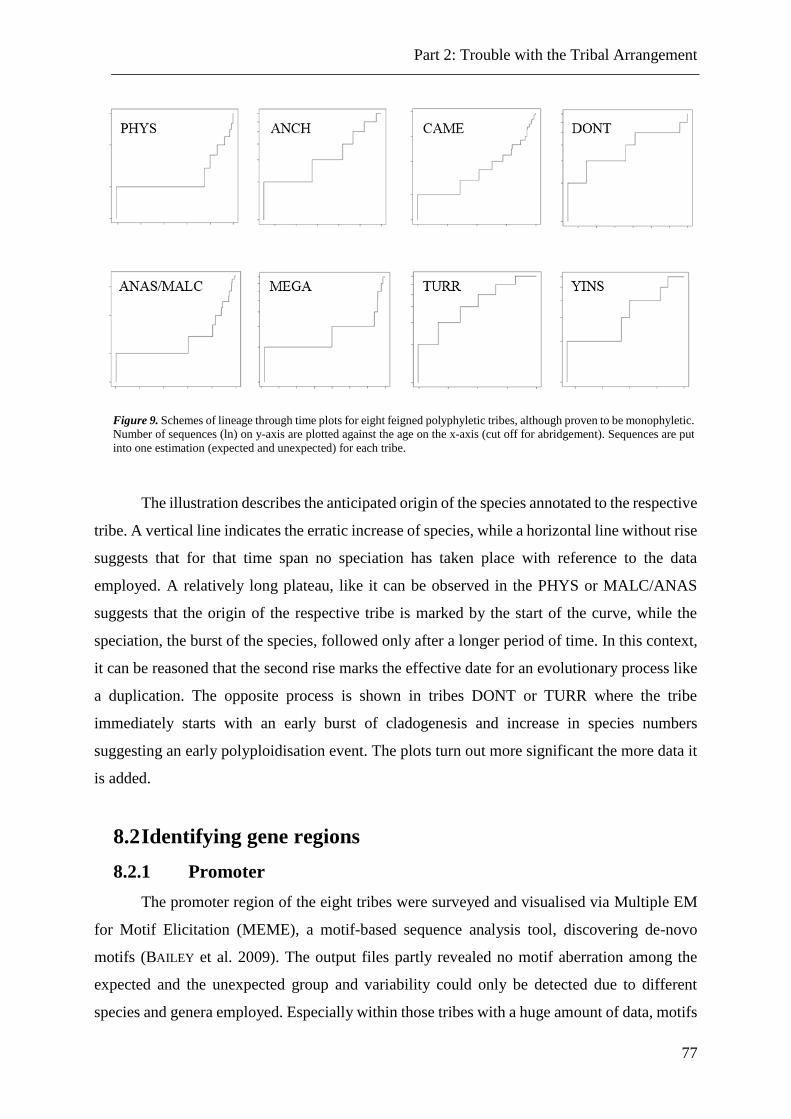
Part 2: Trouble with the Tribal Arrangement
77
The illustration describes the anticipated origin of the species annotated to the respective
tribe. A vertical line indicates the erratic increase of species, while a horizontal line without rise
suggests that for that time span no speciation has taken place with reference to the data
employed. A relatively long plateau, like it can be observed in the PHYS or MALC/ANAS
suggests that the origin of the respective tribe is marked by the start of the curve, while the
speciation, the burst of the species, followed only after a longer period of time. In this context,
it can be reasoned that the second rise marks the effective date for an evolutionary process like
a duplication. The opposite process is shown in tribes DONT or TURR where the tribe
immediately starts with an early burst of cladogenesis and increase in species numbers
suggesting an early polyploidisation event. The plots turn out more significant the more data it
is added.
8.2 Identifying gene regions
8.2.1 Promoter
The promoter region of the eight tribes were surveyed and visualised via Multiple EM
for Motif Elicitation (MEME), a motif-based sequence analysis tool, discovering de-novo
motifs (BAILEY et al. 2009). The output files partly revealed no motif aberration among the
expected and the unexpected group and variability could only be detected due to different
species and genera employed. Especially within those tribes with a huge amount of data, motifs
Figure 9. Schemes of lineage through time plots for eight feigned polyphyletic tribes, although proven to be monophyletic.
Number of sequences (ln) on y-axis are plotted against the age on the x-axis (cut off for abridgement). Sequences are put
into one estimation (expected and unexpected) for each tribe.
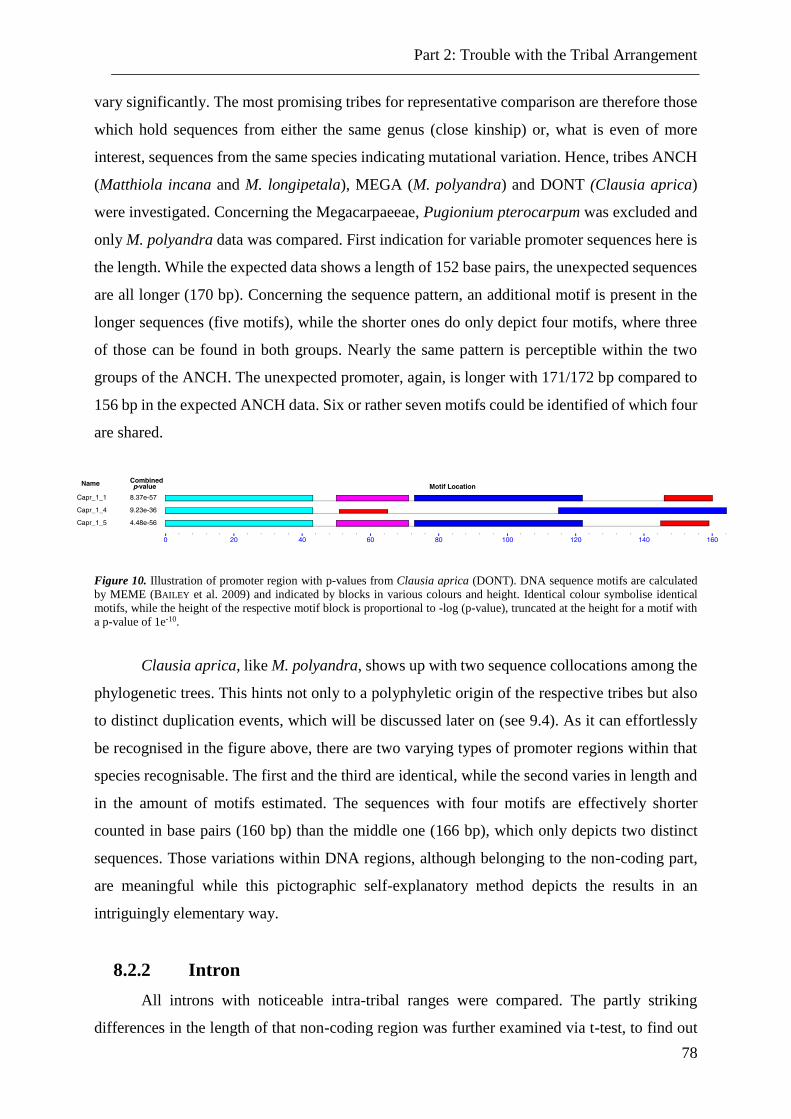
Part 2: Trouble with the Tribal Arrangement
78
vary significantly. The most promising tribes for representative comparison are therefore those
which hold sequences from either the same genus (close kinship) or, what is even of more
interest, sequences from the same species indicating mutational variation. Hence, tribes ANCH
(Matthiola incana and M. longipetala), MEGA (M. polyandra) and DONT (Clausia aprica)
were investigated. Concerning the Megacarpaeeae, Pugionium pterocarpum was excluded and
only M. polyandra data was compared. First indication for variable promoter sequences here is
the length. While the expected data shows a length of 152 base pairs, the unexpected sequences
are all longer (170 bp). Concerning the sequence pattern, an additional motif is present in the
longer sequences (five motifs), while the shorter ones do only depict four motifs, where three
of those can be found in both groups. Nearly the same pattern is perceptible within the two
groups of the ANCH. The unexpected promoter, again, is longer with 171/172 bp compared to
156 bp in the expected ANCH data. Six or rather seven motifs could be identified of which four
are shared.
Figure 10. Illustration of promoter region with p-values from Clausia aprica (DONT). DNA sequence motifs are calculated
by MEME (BAILEY et al. 2009) and indicated by blocks in various colours and height. Identical colour symbolise identical
motifs, while the height of the respective motif block is proportional to -log (p-value), truncated at the height for a motif with
a p-value of 1e-10.
Clausia aprica, like M. polyandra, shows up with two sequence collocations among the
phylogenetic trees. This hints not only to a polyphyletic origin of the respective tribes but also
to distinct duplication events, which will be discussed later on (see 9.4). As it can effortlessly
be recognised in the figure above, there are two varying types of promoter regions within that
species recognisable. The first and the third are identical, while the second varies in length and
in the amount of motifs estimated. The sequences with four motifs are effectively shorter
counted in base pairs (160 bp) than the middle one (166 bp), which only depicts two distinct
sequences. Those variations within DNA regions, although belonging to the non-coding part,
are meaningful while this pictographic self-explanatory method depicts the results in an
intriguingly elementary way.
8.2.2 Intron
All introns with noticeable intra-tribal ranges were compared. The partly striking
differences in the length of that non-coding region was further examined via t-test, to find out
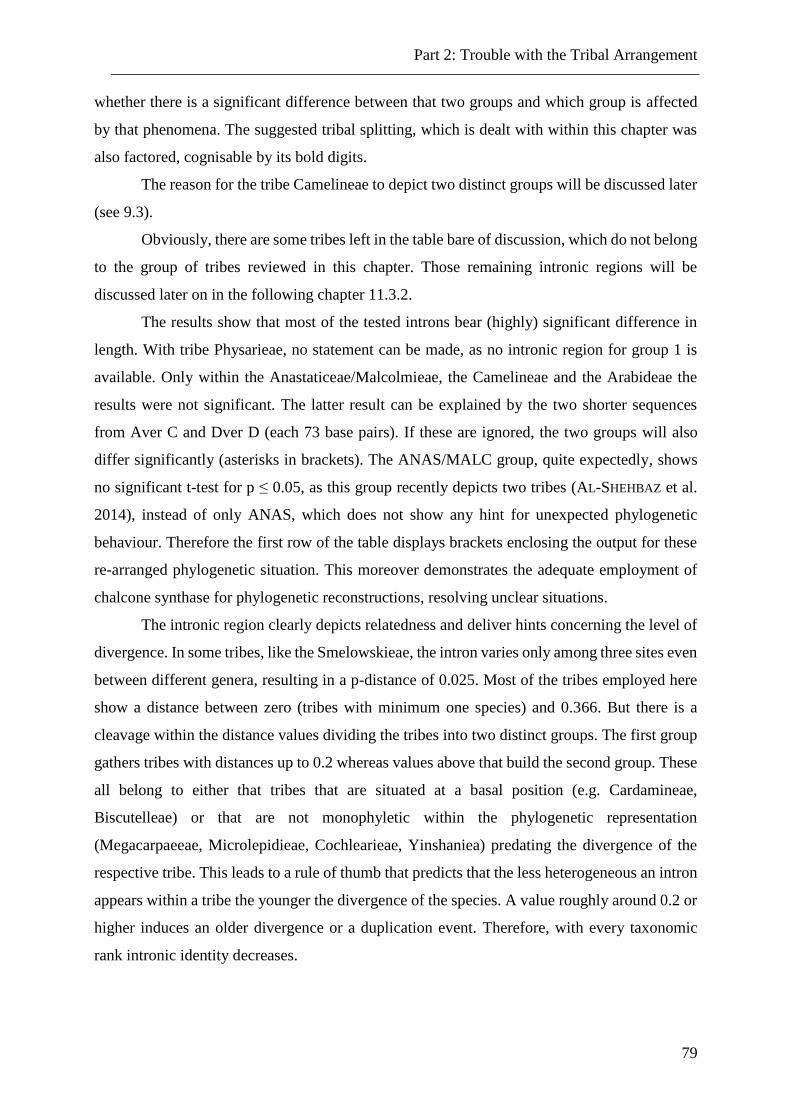
Part 2: Trouble with the Tribal Arrangement
79
whether there is a significant difference between that two groups and which group is affected
by that phenomena. The suggested tribal splitting, which is dealt with within this chapter was
also factored, cognisable by its bold digits.
The reason for the tribe Camelineae to depict two distinct groups will be discussed later
(see 9.3).
Obviously, there are some tribes left in the table bare of discussion, which do not belong
to the group of tribes reviewed in this chapter. Those remaining intronic regions will be
discussed later on in the following chapter 11.3.2.
The results show that most of the tested introns bear (highly) significant difference in
length. With tribe Physarieae, no statement can be made, as no intronic region for group 1 is
available. Only within the Anastaticeae/Malcolmieae, the Camelineae and the Arabideae the
results were not significant. The latter result can be explained by the two shorter sequences
from Aver C and Dver D (each 73 base pairs). If these are ignored, the two groups will also
differ significantly (asterisks in brackets). The ANAS/MALC group, quite expectedly, shows
no significant t-test for p ≤ 0.05, as this group recently depicts two tribes (AL-SHEHBAZ et al.
2014), instead of only ANAS, which does not show any hint for unexpected phylogenetic
behaviour. Therefore the first row of the table displays brackets enclosing the output for these
re-arranged phylogenetic situation. This moreover demonstrates the adequate employment of
chalcone synthase for phylogenetic reconstructions, resolving unclear situations.
The intronic region clearly depicts relatedness and deliver hints concerning the level of
divergence. In some tribes, like the Smelowskieae, the intron varies only among three sites even
between different genera, resulting in a p-distance of 0.025. Most of the tribes employed here
show a distance between zero (tribes with minimum one species) and 0.366. But there is a
cleavage within the distance values dividing the tribes into two distinct groups. The first group
gathers tribes with distances up to 0.2 whereas values above that build the second group. These
all belong to either that tribes that are situated at a basal position (e.g. Cardamineae,
Biscutelleae) or that are not monophyletic within the phylogenetic representation
(Megacarpaeeae, Microlepidieae, Cochlearieae, Yinshaniea) predating the divergence of the
respective tribe. This leads to a rule of thumb that predicts that the less heterogeneous an intron
appears within a tribe the younger the divergence of the species. A value roughly around 0.2 or
higher induces an older divergence or a duplication event. Therefore, with every taxonomic
rank intronic identity decreases.
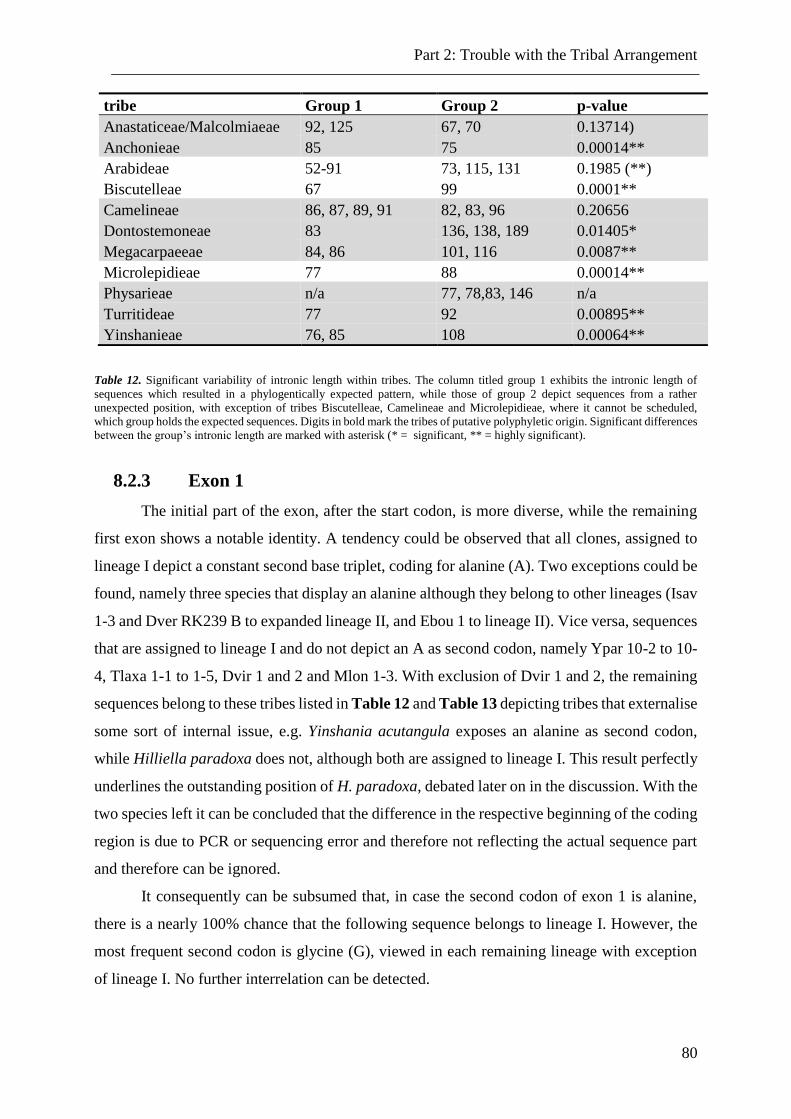
Part 2: Trouble with the Tribal Arrangement
80
tribe Group 1 Group 2 p-value
Anastaticeae/Malcolmiaeae 92, 125 67, 70 0.13714)
Anchonieae 85 75 0.00014**
Arabideae 52-91 73, 115, 131 0.1985 (**)
Biscutelleae 67 99 0.0001**
Camelineae 86, 87, 89, 91 82, 83, 96 0.20656
Dontostemoneae 83 136, 138, 189 0.01405*
Megacarpaeeae 84, 86 101, 116 0.0087**
Microlepidieae 77 88 0.00014**
Physarieae n/a 77, 78,83, 146 n/a
Turritideae 77 92 0.00895**
Yinshanieae 76, 85 108 0.00064**
Table 12. Significant variability of intronic length within tribes. The column titled group 1 exhibits the intronic length of
sequences which resulted in a phylogentically expected pattern, while those of group 2 depict sequences from a rather
unexpected position, with exception of tribes Biscutelleae, Camelineae and Microlepidieae, where it cannot be scheduled,
which group holds the expected sequences. Digits in bold mark the tribes of putative polyphyletic origin. Significant differences
between the group’s intronic length are marked with asterisk (* = significant, ** = highly significant).
8.2.3 Exon 1
The initial part of the exon, after the start codon, is more diverse, while the remaining
first exon shows a notable identity. A tendency could be observed that all clones, assigned to
lineage I depict a constant second base triplet, coding for alanine (A). Two exceptions could be
found, namely three species that display an alanine although they belong to other lineages (Isav
1-3 and Dver RK239 B to expanded lineage II, and Ebou 1 to lineage II). Vice versa, sequences
that are assigned to lineage I and do not depict an A as second codon, namely Ypar 10-2 to 10-
4, Tlaxa 1-1 to 1-5, Dvir 1 and 2 and Mlon 1-3. With exclusion of Dvir 1 and 2, the remaining
sequences belong to these tribes listed in Table 12 and Table 13 depicting tribes that externalise
some sort of internal issue, e.g. Yinshania acutangula exposes an alanine as second codon,
while Hilliella paradoxa does not, although both are assigned to lineage I. This result perfectly
underlines the outstanding position of H. paradoxa, debated later on in the discussion. With the
two species left it can be concluded that the difference in the respective beginning of the coding
region is due to PCR or sequencing error and therefore not reflecting the actual sequence part
and therefore can be ignored.
It consequently can be subsumed that, in case the second codon of exon 1 is alanine,
there is a nearly 100% chance that the following sequence belongs to lineage I. However, the
most frequent second codon is glycine (G), viewed in each remaining lineage with exception
of lineage I. No further interrelation can be detected.
Part 2: Trouble with the Tribal Arrangement
81
8.2.4 Exon 2
Within the second exon a 12 residue chalcone- and stilbene synthase signature motif,
(W)GVLFGFGPGLT, is known, close to the carboxyl-terminus (MARTIN 1993). The conserved
amino acid sequence is present in the CHS/STS (TROPF et al. 1994, WANG et al. 2007) family
among all angiosperms.
Motif sequence changes in the CHS protein imply functional divergence, although these
functions are not known, yet (WANG et al. 2007). The table depicts the amino acid replacements
in the reviewed tribes reviewed in this chapter, which can be categorised as conservative or
radical changes (HUGHES et al. 2000). No other part of the data was affected.
Sequence W G V L F G F G P G L T charge polarity
Polyphyletic Tribe
Yacu 1-3, 1-5, 1-8 S neutral polar
Alyr AF112103 I neutral polar/nonpolar
Cbur GQ983009 S neutral nonpolar/polar
Cbur_AY612785 S neutral nonpolar/polar
Mlon 1, 2, 3 S neutral nonpolar/polar
Table 13 A conserved motif at the carboxyl-terminus of the chalcone synthase. Each amino acid sequence was compared to
the conserved.
Any change of category is counted as radical difference while a change within the
category is evaluated as conservative. Concerning the charge of the amino acids, no radical
categorical change could be observed, the neutral amino acids are changed to another aa neutral
in its charge, while there were several changes in the polarity. Only one change was
conservative, Table 13 [change from (non)polar to (non)polar] while the remaining four
changes mostly depict a switch in the category from a nonpolar residue to a polar one and only
once vice versa. These amino acid substitutions may most likely result in a dramatically change
of structure and chemical properties of the respective proteins (WANG et al. 2007). This can
also result in the pseudogenisation of the gene within the named sequences. The nine sequences
of four species affected do belong to the tribes Yinshanieae, Camelineae and Anastaticeae,
which are three out of eight relevant tribes discussed. This strengthens the hypotheses of
evolutionary divergent events within these tribes or of taxonomic inconsistencies not itemised
yet.
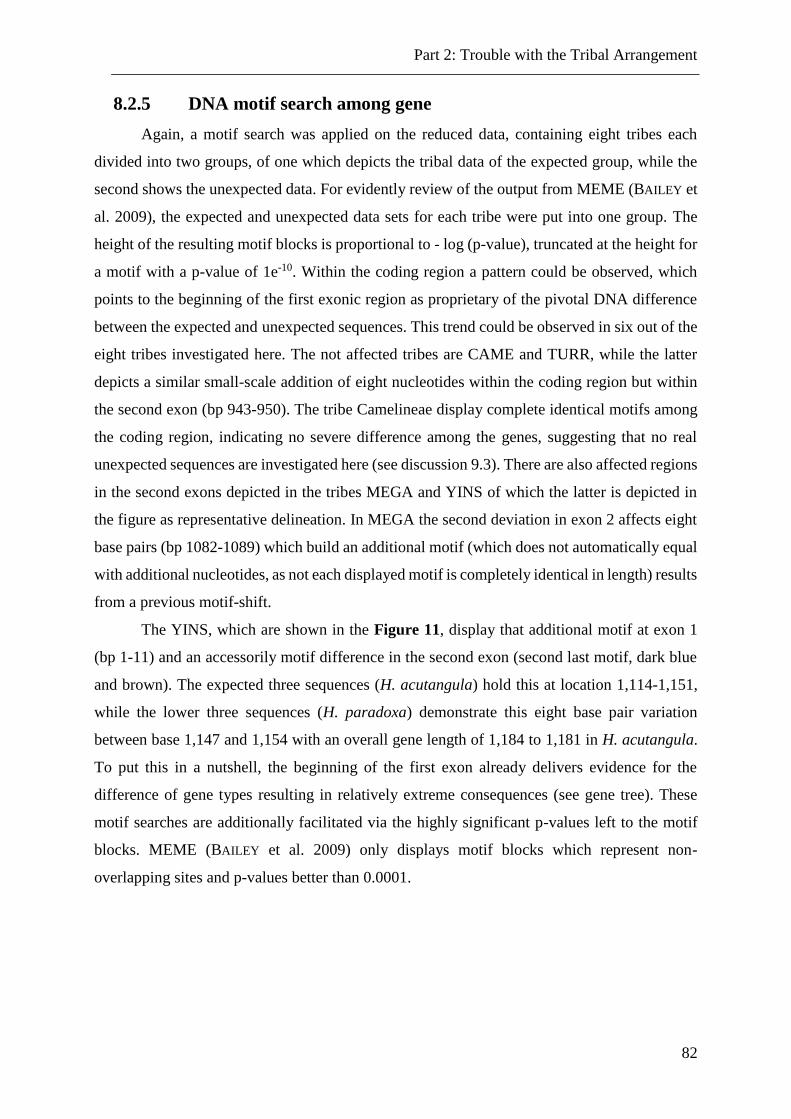
Part 2: Trouble with the Tribal Arrangement
82
8.2.5 DNA motif search among gene
Again, a motif search was applied on the reduced data, containing eight tribes each
divided into two groups, of one which depicts the tribal data of the expected group, while the
second shows the unexpected data. For evidently review of the output from MEME (BAILEY et
al. 2009), the expected and unexpected data sets for each tribe were put into one group. The
height of the resulting motif blocks is proportional to - log (p-value), truncated at the height for
a motif with a p-value of 1e-10. Within the coding region a pattern could be observed, which
points to the beginning of the first exonic region as proprietary of the pivotal DNA difference
between the expected and unexpected sequences. This trend could be observed in six out of the
eight tribes investigated here. The not affected tribes are CAME and TURR, while the latter
depicts a similar small-scale addition of eight nucleotides within the coding region but within
the second exon (bp 943-950). The tribe Camelineae display complete identical motifs among
the coding region, indicating no severe difference among the genes, suggesting that no real
unexpected sequences are investigated here (see discussion 9.3). There are also affected regions
in the second exons depicted in the tribes MEGA and YINS of which the latter is depicted in
the figure as representative delineation. In MEGA the second deviation in exon 2 affects eight
base pairs (bp 1082-1089) which build an additional motif (which does not automatically equal
with additional nucleotides, as not each displayed motif is completely identical in length) results
from a previous motif-shift.
The YINS, which are shown in the Figure 11, display that additional motif at exon 1
(bp 1-11) and an accessorily motif difference in the second exon (second last motif, dark blue
and brown). The expected three sequences (H. acutangula) hold this at location 1,114-1,151,
while the lower three sequences (H. paradoxa) demonstrate this eight base pair variation
between base 1,147 and 1,154 with an overall gene length of 1,184 to 1,181 in H. acutangula.
To put this in a nutshell, the beginning of the first exon already delivers evidence for the
difference of gene types resulting in relatively extreme consequences (see gene tree). These
motif searches are additionally facilitated via the highly significant p-values left to the motif
blocks. MEME (BAILEY et al. 2009) only displays motif blocks which represent non-
overlapping sites and p-values better than 0.0001.
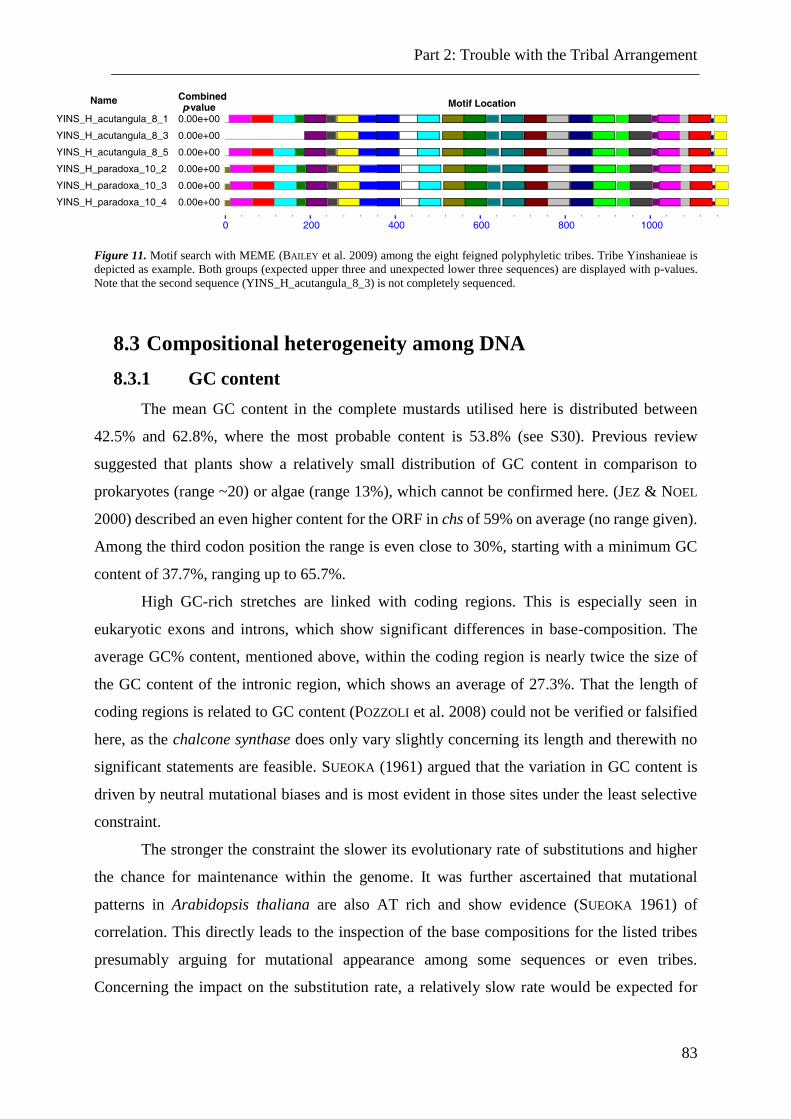
Part 2: Trouble with the Tribal Arrangement
83
Figure 11. Motif search with MEME (BAILEY et al. 2009) among the eight feigned polyphyletic tribes. Tribe Yinshanieae is
depicted as example. Both groups (expected upper three and unexpected lower three sequences) are displayed with p-values.
Note that the second sequence (YINS_H_acutangula_8_3) is not completely sequenced.
8.3 Compositional heterogeneity among DNA
8.3.1 GC content
The mean GC content in the complete mustards utilised here is distributed between
42.5% and 62.8%, where the most probable content is 53.8% (see S30). Previous review
suggested that plants show a relatively small distribution of GC content in comparison to
prokaryotes (range ~20) or algae (range 13%), which cannot be confirmed here. (JEZ & NOEL
2000) described an even higher content for the ORF in chs of 59% on average (no range given).
Among the third codon position the range is even close to 30%, starting with a minimum GC
content of 37.7%, ranging up to 65.7%.
High GC-rich stretches are linked with coding regions. This is especially seen in
eukaryotic exons and introns, which show significant differences in base-composition. The
average GC% content, mentioned above, within the coding region is nearly twice the size of
the GC content of the intronic region, which shows an average of 27.3%. That the length of
coding regions is related to GC content (POZZOLI et al. 2008) could not be verified or falsified
here, as the chalcone synthase does only vary slightly concerning its length and therewith no
significant statements are feasible. SUEOKA (1961) argued that the variation in GC content is
driven by neutral mutational biases and is most evident in those sites under the least selective
constraint.
The stronger the constraint the slower its evolutionary rate of substitutions and higher
the chance for maintenance within the genome. It was further ascertained that mutational
patterns in Arabidopsis thaliana are also AT rich and show evidence (SUEOKA 1961) of
correlation. This directly leads to the inspection of the base compositions for the listed tribes
presumably arguing for mutational appearance among some sequences or even tribes.
Concerning the impact on the substitution rate, a relatively slow rate would be expected for
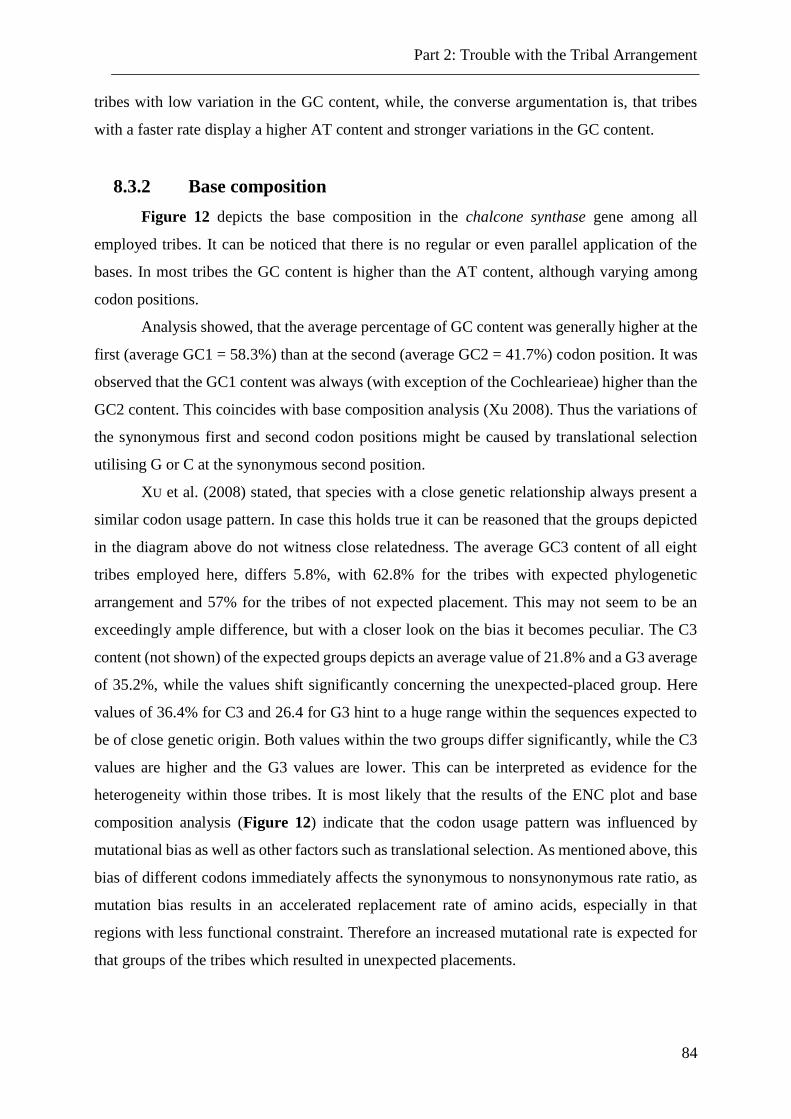
Part 2: Trouble with the Tribal Arrangement
84
tribes with low variation in the GC content, while, the converse argumentation is, that tribes
with a faster rate display a higher AT content and stronger variations in the GC content.
8.3.2 Base composition
Figure 12 depicts the base composition in the chalcone synthase gene among all
employed tribes. It can be noticed that there is no regular or even parallel application of the
bases. In most tribes the GC content is higher than the AT content, although varying among
codon positions.
Analysis showed, that the average percentage of GC content was generally higher at the
first (average GC1 = 58.3%) than at the second (average GC2 = 41.7%) codon position. It was
observed that the GC1 content was always (with exception of the Cochlearieae) higher than the
GC2 content. This coincides with base composition analysis (Xu 2008). Thus the variations of
the synonymous first and second codon positions might be caused by translational selection
utilising G or C at the synonymous second position.
XU et al. (2008) stated, that species with a close genetic relationship always present a
similar codon usage pattern. In case this holds true it can be reasoned that the groups depicted
in the diagram above do not witness close relatedness. The average GC3 content of all eight
tribes employed here, differs 5.8%, with 62.8% for the tribes with expected phylogenetic
arrangement and 57% for the tribes of not expected placement. This may not seem to be an
exceedingly ample difference, but with a closer look on the bias it becomes peculiar. The C3
content (not shown) of the expected groups depicts an average value of 21.8% and a G3 average
of 35.2%, while the values shift significantly concerning the unexpected-placed group. Here
values of 36.4% for C3 and 26.4 for G3 hint to a huge range within the sequences expected to
be of close genetic origin. Both values within the two groups differ significantly, while the C3
values are higher and the G3 values are lower. This can be interpreted as evidence for the
heterogeneity within those tribes. It is most likely that the results of the ENC plot and base
composition analysis (Figure 12) indicate that the codon usage pattern was influenced by
mutational bias as well as other factors such as translational selection. As mentioned above, this
bias of different codons immediately affects the synonymous to nonsynonymous rate ratio, as
mutation bias results in an accelerated replacement rate of amino acids, especially in that
regions with less functional constraint. Therefore an increased mutational rate is expected for
that groups of the tribes which resulted in unexpected placements.
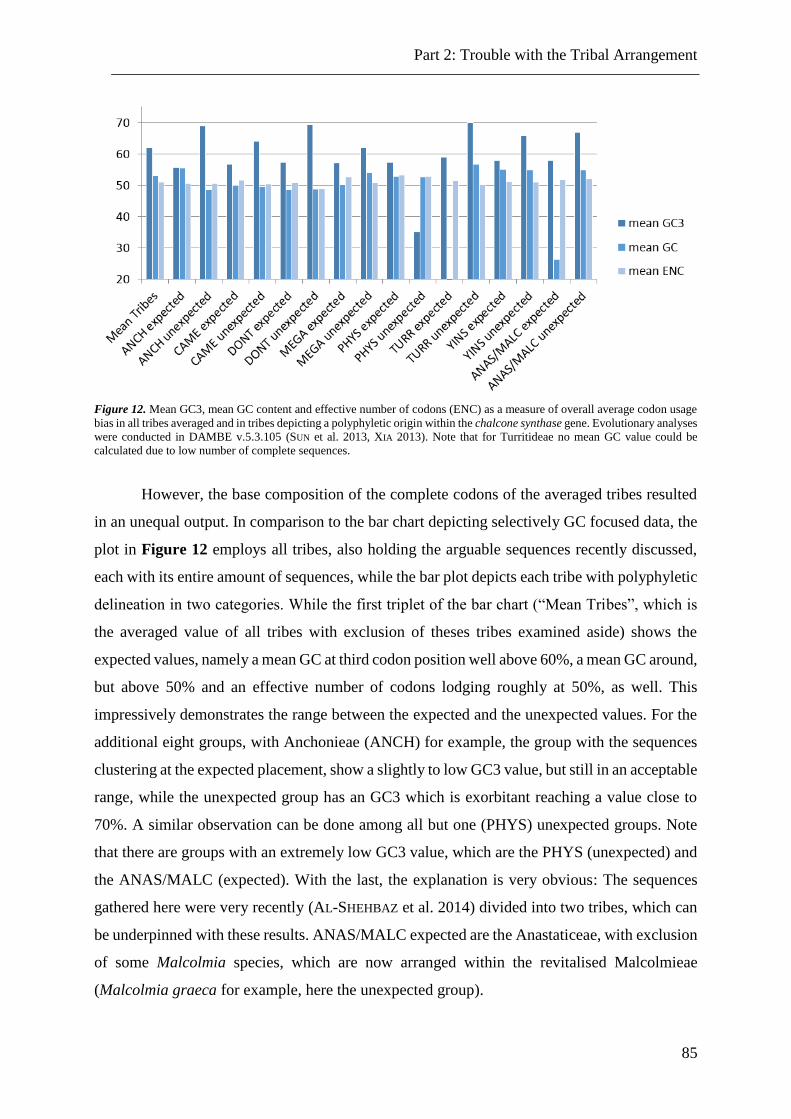
Part 2: Trouble with the Tribal Arrangement
85
Figure 12. Mean GC3, mean GC content and effective number of codons (ENC) as a measure of overall average codon usage
bias in all tribes averaged and in tribes depicting a polyphyletic origin within the chalcone synthase gene. Evolutionary analyses
were conducted in DAMBE v.5.3.105 (SUN et al. 2013, XIA 2013). Note that for Turritideae no mean GC value could be
calculated due to low number of complete sequences.
However, the base composition of the complete codons of the averaged tribes resulted
in an unequal output. In comparison to the bar chart depicting selectively GC focused data, the
plot in Figure 12 employs all tribes, also holding the arguable sequences recently discussed,
each with its entire amount of sequences, while the bar plot depicts each tribe with polyphyletic
delineation in two categories. While the first triplet of the bar chart (“Mean Tribes”, which is
the averaged value of all tribes with exclusion of theses tribes examined aside) shows the
expected values, namely a mean GC at third codon position well above 60%, a mean GC around,
but above 50% and an effective number of codons lodging roughly at 50%, as well. This
impressively demonstrates the range between the expected and the unexpected values. For the
additional eight groups, with Anchonieae (ANCH) for example, the group with the sequences
clustering at the expected placement, show a slightly to low GC3 value, but still in an acceptable
range, while the unexpected group has an GC3 which is exorbitant reaching a value close to
70%. A similar observation can be done among all but one (PHYS) unexpected groups. Note
that there are groups with an extremely low GC3 value, which are the PHYS (unexpected) and
the ANAS/MALC (expected). With the last, the explanation is very obvious: The sequences
gathered here were very recently (AL-SHEHBAZ et al. 2014) divided into two tribes, which can
be underpinned with these results. ANAS/MALC expected are the Anastaticeae, with exclusion
of some Malcolmia species, which are now arranged within the revitalised Malcolmieae
(Malcolmia graeca for example, here the unexpected group).
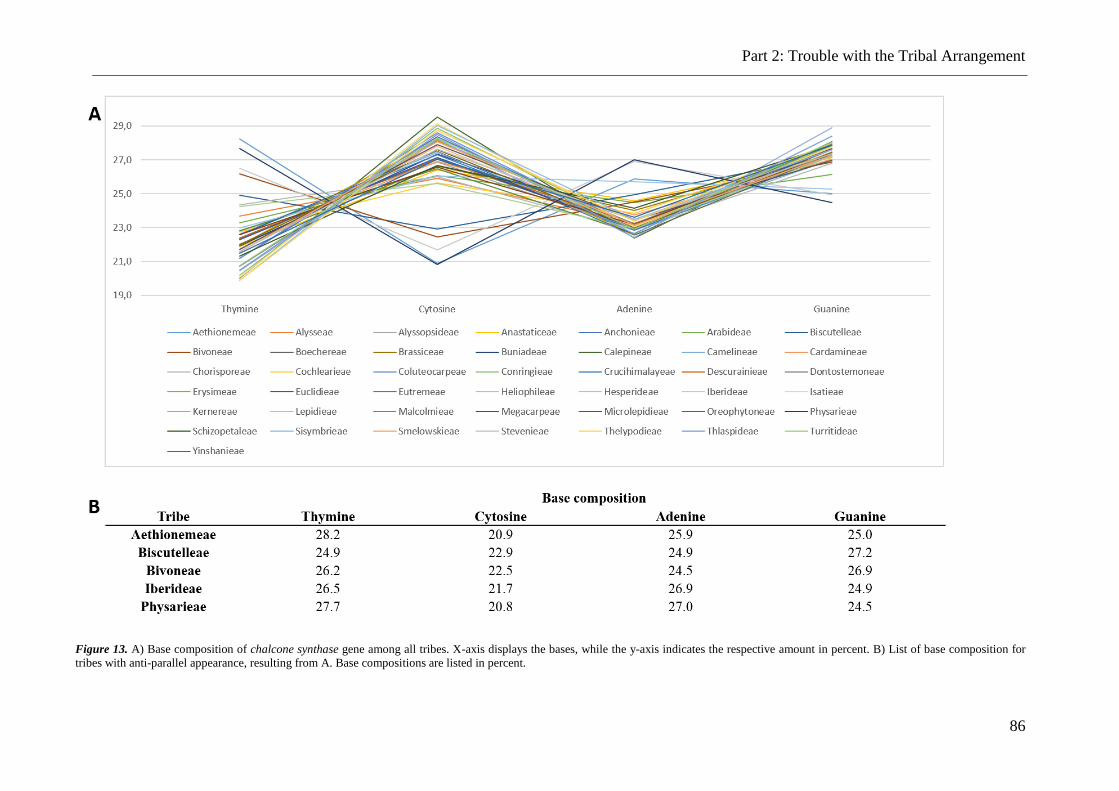
Part 2: Trouble with the Tribal Arrangement
86
Figure 13. A) Base composition of chalcone synthase gene among all tribes. X-axis displays the bases, while the y-axis indicates the respective amount in percent. B) List of base composition for
tribes with anti-parallel appearance, resulting from A. Base compositions are listed in percent.
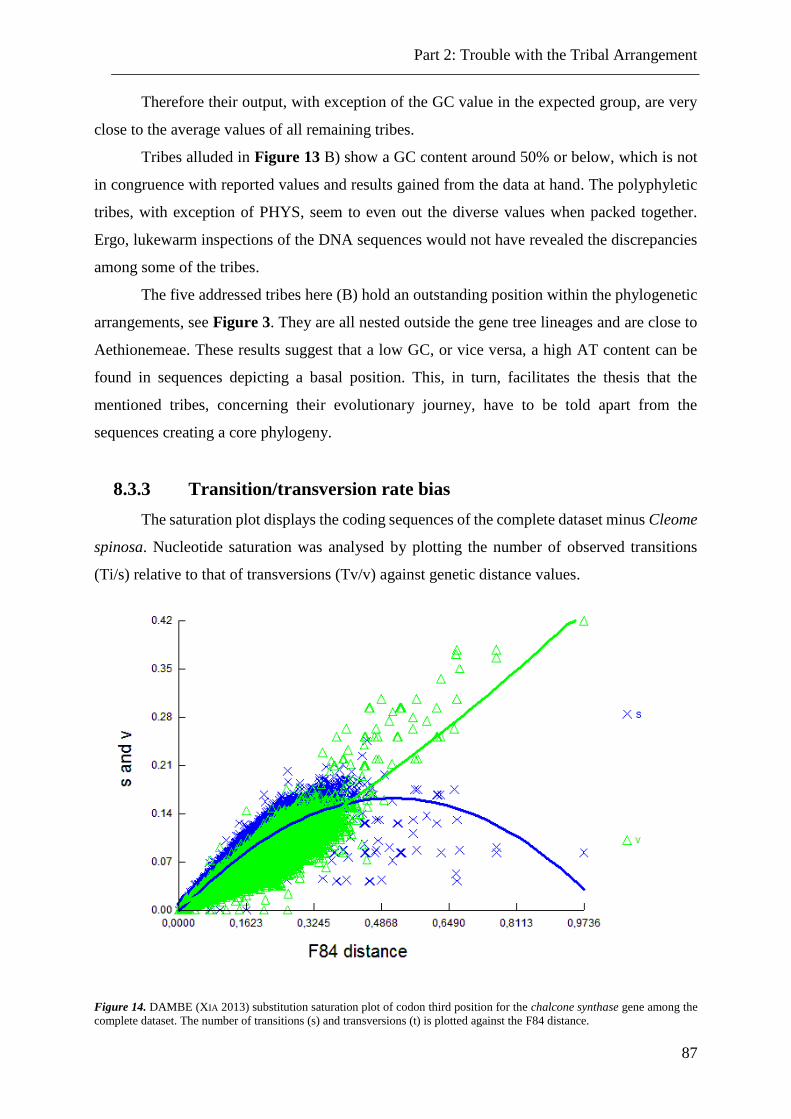
Part 2: Trouble with the Tribal Arrangement
87
Therefore their output, with exception of the GC value in the expected group, are very
close to the average values of all remaining tribes.
Tribes alluded in Figure 13 B) show a GC content around 50% or below, which is not
in congruence with reported values and results gained from the data at hand. The polyphyletic
tribes, with exception of PHYS, seem to even out the diverse values when packed together.
Ergo, lukewarm inspections of the DNA sequences would not have revealed the discrepancies
among some of the tribes.
The five addressed tribes here (B) hold an outstanding position within the phylogenetic
arrangements, see Figure 3. They are all nested outside the gene tree lineages and are close to
Aethionemeae. These results suggest that a low GC, or vice versa, a high AT content can be
found in sequences depicting a basal position. This, in turn, facilitates the thesis that the
mentioned tribes, concerning their evolutionary journey, have to be told apart from the
sequences creating a core phylogeny.
8.3.3 Transition/transversion rate bias
The saturation plot displays the coding sequences of the complete dataset minus Cleome
spinosa. Nucleotide saturation was analysed by plotting the number of observed transitions
(Ti/s) relative to that of transversions (Tv/v) against genetic distance values.
Figure 14. DAMBE (XIA 2013) substitution saturation plot of codon third position for the chalcone synthase gene among the
complete dataset. The number of transitions (s) and transversions (t) is plotted against the F84 distance.
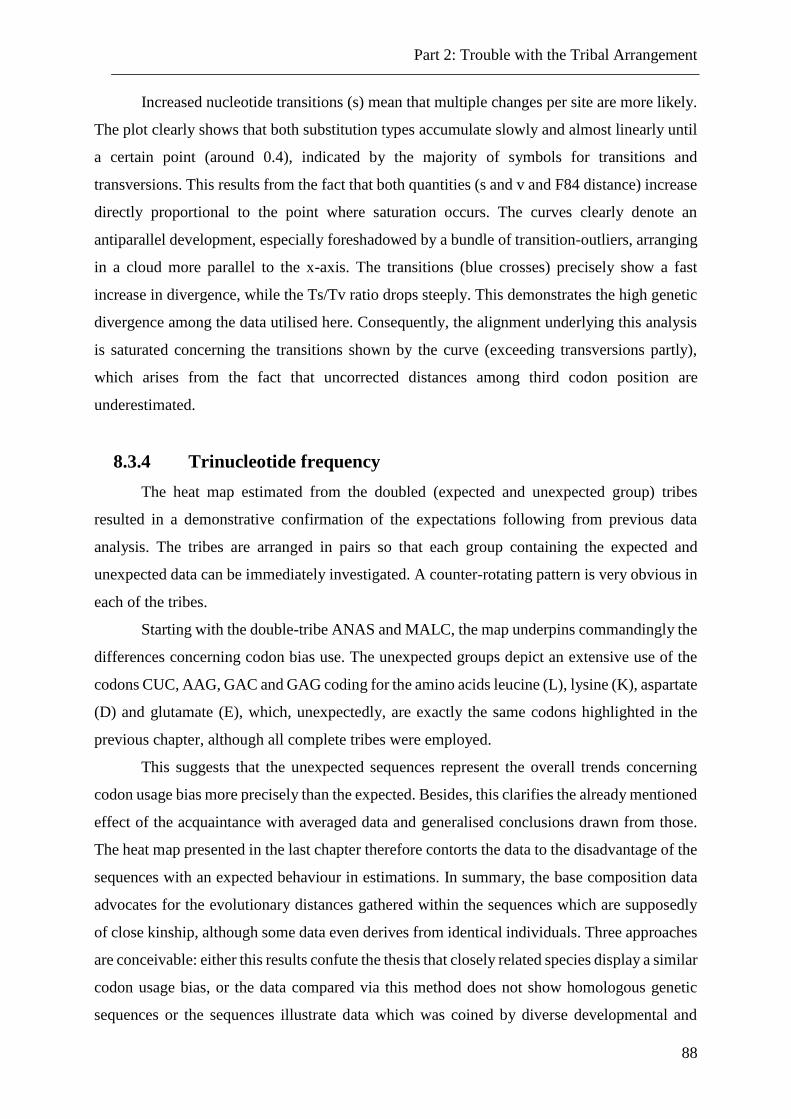
Part 2: Trouble with the Tribal Arrangement
88
Increased nucleotide transitions (s) mean that multiple changes per site are more likely.
The plot clearly shows that both substitution types accumulate slowly and almost linearly until
a certain point (around 0.4), indicated by the majority of symbols for transitions and
transversions. This results from the fact that both quantities (s and v and F84 distance) increase
directly proportional to the point where saturation occurs. The curves clearly denote an
antiparallel development, especially foreshadowed by a bundle of transition-outliers, arranging
in a cloud more parallel to the x-axis. The transitions (blue crosses) precisely show a fast
increase in divergence, while the Ts/Tv ratio drops steeply. This demonstrates the high genetic
divergence among the data utilised here. Consequently, the alignment underlying this analysis
is saturated concerning the transitions shown by the curve (exceeding transversions partly),
which arises from the fact that uncorrected distances among third codon position are
underestimated.
8.3.4 Trinucleotide frequency
The heat map estimated from the doubled (expected and unexpected group) tribes
resulted in a demonstrative confirmation of the expectations following from previous data
analysis. The tribes are arranged in pairs so that each group containing the expected and
unexpected data can be immediately investigated. A counter-rotating pattern is very obvious in
each of the tribes.
Starting with the double-tribe ANAS and MALC, the map underpins commandingly the
differences concerning codon bias use. The unexpected groups depict an extensive use of the
codons CUC, AAG, GAC and GAG coding for the amino acids leucine (L), lysine (K), aspartate
(D) and glutamate (E), which, unexpectedly, are exactly the same codons highlighted in the
previous chapter, although all complete tribes were employed.
This suggests that the unexpected sequences represent the overall trends concerning
codon usage bias more precisely than the expected. Besides, this clarifies the already mentioned
effect of the acquaintance with averaged data and generalised conclusions drawn from those.
The heat map presented in the last chapter therefore contorts the data to the disadvantage of the
sequences with an expected behaviour in estimations. In summary, the base composition data
advocates for the evolutionary distances gathered within the sequences which are supposedly
of close kinship, although some data even derives from identical individuals. Three approaches
are conceivable: either this results confute the thesis that closely related species display a similar
codon usage bias, or the data compared via this method does not show homologous genetic
sequences or the sequences illustrate data which was coined by diverse developmental and
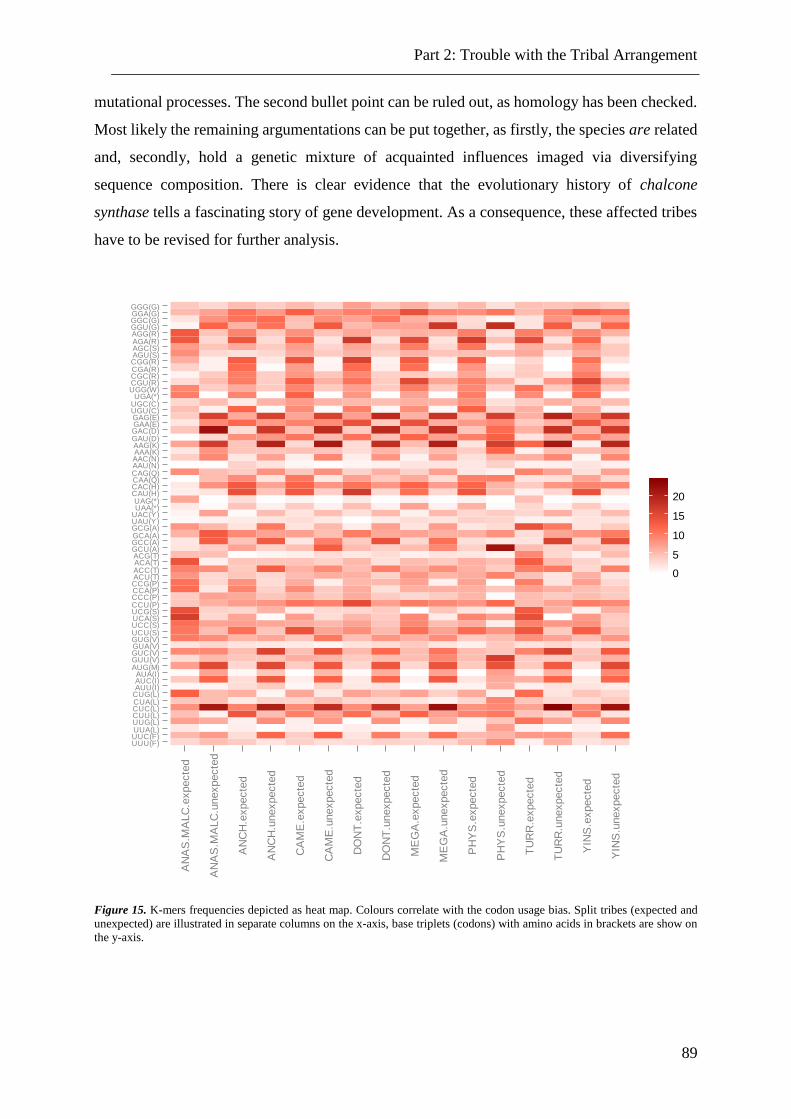
Part 2: Trouble with the Tribal Arrangement
89
mutational processes. The second bullet point can be ruled out, as homology has been checked.
Most likely the remaining argumentations can be put together, as firstly, the species are related
and, secondly, hold a genetic mixture of acquainted influences imaged via diversifying
sequence composition. There is clear evidence that the evolutionary history of chalcone
synthase tells a fascinating story of gene development. As a consequence, these affected tribes
have to be revised for further analysis.
Figure 15. K-mers frequencies depicted as heat map. Colours correlate with the codon usage bias. Split tribes (expected and
unexpected) are illustrated in separate columns on the x-axis, base triplets (codons) with amino acids in brackets are show on
the y-axis.
UUU(F)UUC(F)UUA(L)UUG(L)CUU(L)CUC(L)CUA(L)CUG(L)AUU(I)AUC(I)AUA(I)
AUG(M)GUU(V)GUC(V)GUA(V)GUG(V)UCU(S)UCC(S)UCA(S)UCG(S)CCU(P)CCC(P)CCA(P)CCG(P)ACU(T)ACC(T)ACA(T)ACG(T)GCU(A)GCC(A)GCA(A)GCG(A)UAU(Y)UAC(Y)UAA(*)UAG(*)
CAU(H)CAC(H)CAA(Q)CAG(Q)AAU(N)AAC(N)AAA(K)AAG(K)GAU(D)GAC(D)GAA(E)GAG(E)UGU(C)UGC(C)UGA(*)
UGG(W)CGU(R)CGC(R)CGA(R)CGG(R)AGU(S)AGC(S)AGA(R)AGG(R)GGU(G)GGC(G)GGA(G)GGG(G)
AN
AS
.MA
LC
.expecte
d
AN
AS
.MA
LC
.unexpecte
d
AN
CH
.expecte
d
AN
CH
.unexpecte
d
CA
ME
.expecte
d
CA
ME
.unexpecte
d
DO
NT
.expecte
d
DO
NT
.unexpecte
d
ME
GA
.expecte
d
ME
GA
.unexpecte
d
PH
YS
.expecte
d
PH
YS
.unexpecte
d
TU
RR
.expecte
d
TU
RR
.unexpecte
d
YIN
S.e
xpecte
d
YIN
S.u
nexpecte
d
0
5
10
15
20
Part 2: Trouble with the Tribal Arrangement
90
8.4 Adaptive evolution
The investigation of adaptive evolution is an appropriate tool to closely analyse the
information gained from recent outcome. The table below (Table 14) contains information on
the selective mode of the chalcone synthase gene among all tribes from this study. The dN/dS
ratio (here ω) is used as measure of the operation of selection. For each tribe separate CODEML
files were run, comparing each sequence to every other sequence from the same tribe. A dN/dS
ratio < 1.0 is probative of purifying (negative) selection, while a ratio > 1.0 is taken as evidence
for diversifying (positive Darwinian) selection and a ratio = 0 depicts generally neutral
selection. The products of pseudogenes normally do not contribute anything to the fitness.
Therefore does an ω very close to 1 often hint to pseudogenes, as the intensity of selection is
mirrored in the degree of that ratio. There are no signals for pseudogenes detectable. The dS
value in some tribes displays relatively high numbers (see Arabideae, Brassiceae or
Cochlearieae), which is a sign for substitution saturation among that branches. The affected
tribes are those with the highest data sampling and consequently the most different species,
which automatically results in higher, as more diverse, substitution rates. In parallel, the
respective dN values are also around one order of magnitude higher than the remaining values.
The overall dN/dS values observed here imply that the chs gene is under purifying selection
among all employed tribes since each diverged from a common ancestor, with exception of
Murbeckiella boryi, the only species from the tribe Oreophytoneae, which dispalys an ω value
above 1.
Employing the Z-selection among the tribes, the overall probability that dS exceeds dN
within the Aethionemeae is p = 0.01 and therefore highly significant. Hence, the hypothesis of
strictly neutral evolution (dN = dS) has to be rejected in favour of the alternate hypothesis of
purifying evolution. Comparable results (p values all between 0.0 and 0.03) could be observed
for all tribes with exception of the Oreophytoneae. They showed neither significant results for
purifying (p = 0.29) nor positive selection (p = 0.98). This means that not any significant
conclusion about averaged selection can be drawn.
However, MEGA5 (TAMURA et al. 2011) offers another application to test selection
additionally on pairwise comparison. This resulted in no significant outcome as well, which is
obvious since all sequences are from one species and one individual. This would only result in
significant and reasonable outcome if a comparison between different loci would be estimated.
The pairwise selection tool was hence only applied on tribes with more than one species
or with a tendency for more than one chalcone synthase locus. As expected, most of the tribes
show a trend towards purifying selection. If negative selection occurred within a tribe, at least
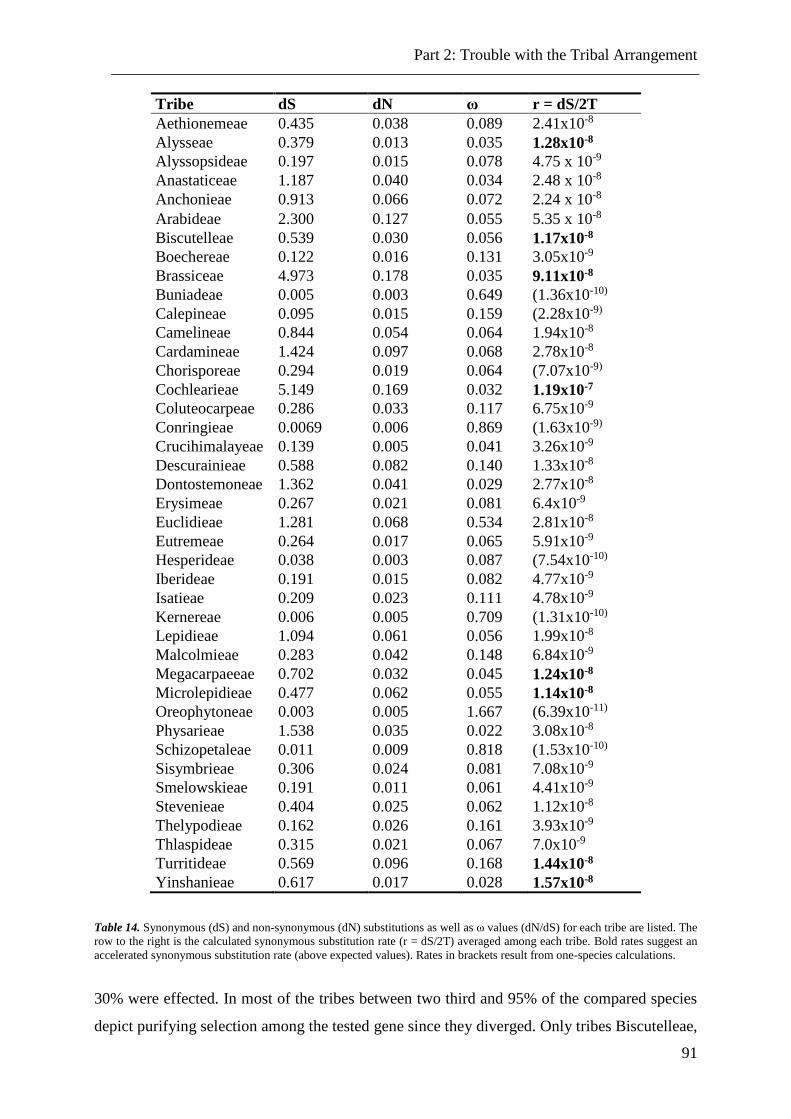
Part 2: Trouble with the Tribal Arrangement
91
Tribe dS dN ω r = dS/2T
Aethionemeae 0.435 0.038 0.089 2.41x10⁻⁸
Alysseae 0.379 0.013 0.035 1.28x10⁻⁸
Alyssopsideae 0.197 0.015 0.078 4.75 x 10⁻⁹
Anastaticeae 1.187 0.040 0.034 2.48 x 10⁻⁸
Anchonieae 0.913 0.066 0.072 2.24 x 10⁻⁸
Arabideae 2.300 0.127 0.055 5.35 x 10⁻⁸
Biscutelleae 0.539 0.030 0.056 1.17x10⁻⁸
Boechereae 0.122 0.016 0.131 3.05x10⁻⁹
Brassiceae 4.973 0.178 0.035 9.11x10⁻⁸
Buniadeae 0.005 0.003 0.649 (1.36x10⁻¹⁰)
Calepineae 0.095 0.015 0.159 (2.28x10⁻⁹)
Camelineae 0.844 0.054 0.064 1.94x10⁻⁸
Cardamineae 1.424 0.097 0.068 2.78x10⁻⁸
Chorisporeae 0.294 0.019 0.064 (7.07x10⁻⁹)
Cochlearieae 5.149 0.169 0.032 1.19x10⁻⁷
Coluteocarpeae 0.286 0.033 0.117 6.75x10⁻⁹
Conringieae 0.0069 0.006 0.869 (1.63x10⁻⁹)
Crucihimalayeae 0.139 0.005 0.041 3.26x10⁻⁹
Descurainieae 0.588 0.082 0.140 1.33x10⁻⁸
Dontostemoneae 1.362 0.041 0.029 2.77x10⁻⁸
Erysimeae 0.267 0.021 0.081 6.4x10⁻⁹
Euclidieae 1.281 0.068 0.534 2.81x10⁻⁸
Eutremeae 0.264 0.017 0.065 5.91x10⁻⁹
Hesperideae 0.038 0.003 0.087 (7.54x10⁻¹⁰)
Iberideae 0.191 0.015 0.082 4.77x10⁻⁹
Isatieae 0.209 0.023 0.111 4.78x10⁻⁹
Kernereae 0.006 0.005 0.709 (1.31x10⁻¹⁰)
Lepidieae 1.094 0.061 0.056 1.99x10⁻⁸
Malcolmieae 0.283 0.042 0.148 6.84x10⁻⁹
Megacarpaeeae 0.702 0.032 0.045 1.24x10⁻⁸
Microlepidieae 0.477 0.062 0.055 1.14x10⁻⁸
Oreophytoneae 0.003 0.005 1.667 (6.39x10⁻¹¹)
Physarieae 1.538 0.035 0.022 3.08x10⁻⁸
Schizopetaleae 0.011 0.009 0.818 (1.53x10⁻¹⁰)
Sisymbrieae 0.306 0.024 0.081 7.08x10⁻⁹
Smelowskieae 0.191 0.011 0.061 4.41x10⁻⁹
Stevenieae 0.404 0.025 0.062 1.12x10⁻⁸
Thelypodieae 0.162 0.026 0.161 3.93x10⁻⁹
Thlaspideae 0.315 0.021 0.067 7.0x10⁻⁹
Turritideae 0.569 0.096 0.168 1.44x10⁻⁸
Yinshanieae 0.617 0.017 0.028 1.57x10⁻⁸
Table 14. Synonymous (dS) and non-synonymous (dN) substitutions as well as ω values (dN/dS) for each tribe are listed. The
row to the right is the calculated synonymous substitution rate (r = dS/2T) averaged among each tribe. Bold rates suggest an
accelerated synonymous substitution rate (above expected values). Rates in brackets result from one-species calculations.
30% were effected. In most of the tribes between two third and 95% of the compared species
depict purifying selection among the tested gene since they diverged. Only tribes Biscutelleae,
Part 2: Trouble with the Tribal Arrangement
92
Brassiceae, Isatideae, Bivoneae and Cochlearieae show some additional tendencies (maximum
of 20% of species) for positive Darwinian selection. This is no opposition, as, firstly, the species
and rather chs may have evolved differently after the divergence from one and another and,
secondly, the evolutionary journey of a gene may vary due to other influences, as well. From
these results it can be concluded that the evolution of these genes among most species tested
here has been under strong purifying selection during some, but not all, of its history.
Concerning the tribes named above, it can be also subsumed that those, additionally,
were under positive selection during a certain time. Some ω values seem to be disproportional
high which is due to the fact that these tribes (Buniadeae, Conringieae, Kernereae,
Oreophytoneae, Schizopetaleae) are all represented by only one species which consequently
results in small amounts of substitutions.
Exactly those values result, while estimating the synonymous substitution rate (r),
logically in higher exponents than expected, illustrating a lower rate.
So, all rates with e-10 or even e-11 (displayed in brackets in the table) can be neglected
for further calculations. The bold numbers depict increased substitution rates putatively
suggesting that chs among those tribes evolves a magnitude faster than among the rest of the
family. This is due to the fact that the data sample assigns sequences that are relatively diverged
from their counterparts, which could result in misinterpretation of the results.
8.5 Origin of purifying selection
As there is a further interest of finding the origin that has been subject to negative
selection, as well as its strength, HyPhy was applied on each tribe to test selection among each
codon. Within every tribe no significant value for any codon could be detected (see
supplementary material S13), neither under positive nor under negative selection. This is most
likely due to the fact that the values calculated are averaged among the entire tree (HyPhy’s
estimations are based on an implemented tree algorithm) and codons under selection, only over
some branches, are not reflected with this test.
None of the tribes showed significant results (see supplementary material S14). This
indicates that the null hypothesis (no significant difference between the groups) cannot be
rejected. Hence, suggested tendencies for selection cannot be accepted.
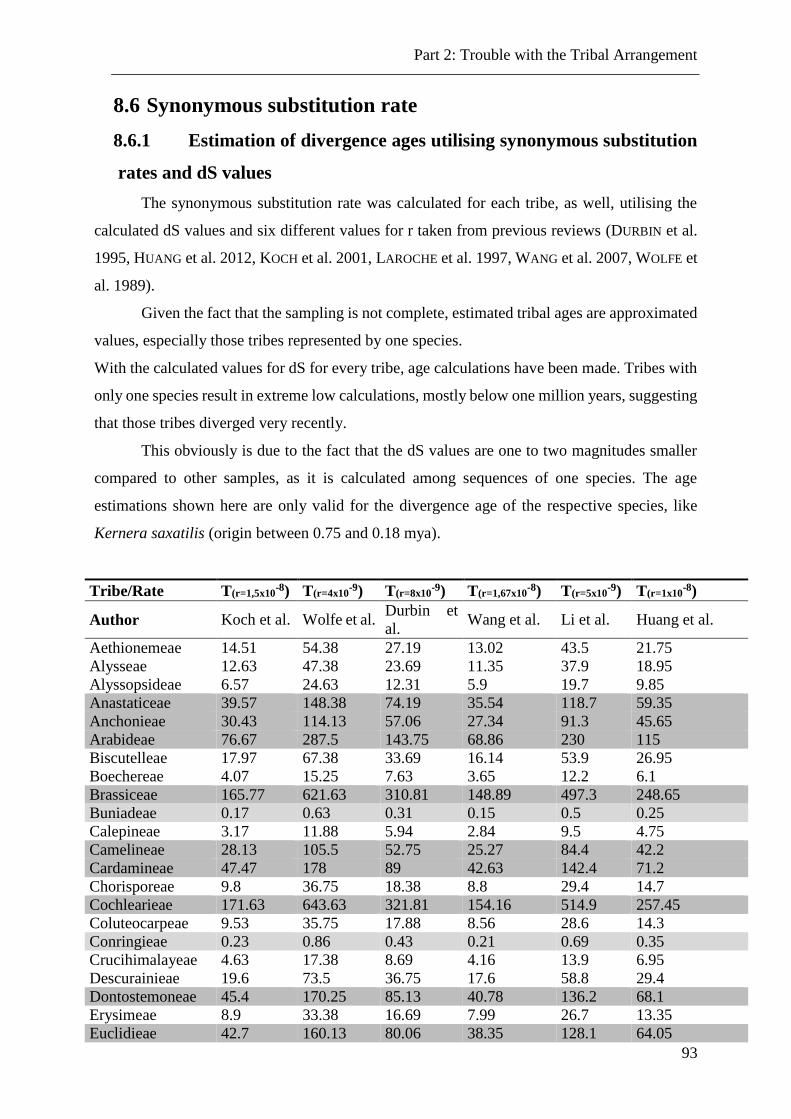
Part 2: Trouble with the Tribal Arrangement
93
8.6 Synonymous substitution rate
8.6.1 Estimation of divergence ages utilising synonymous substitution
rates and dS values
The synonymous substitution rate was calculated for each tribe, as well, utilising the
calculated dS values and six different values for r taken from previous reviews (DURBIN et al.
1995, HUANG et al. 2012, KOCH et al. 2001, LAROCHE et al. 1997, WANG et al. 2007, WOLFE et
al. 1989).
Given the fact that the sampling is not complete, estimated tribal ages are approximated
values, especially those tribes represented by one species.
With the calculated values for dS for every tribe, age calculations have been made. Tribes with
only one species result in extreme low calculations, mostly below one million years, suggesting
that those tribes diverged very recently.
This obviously is due to the fact that the dS values are one to two magnitudes smaller
compared to other samples, as it is calculated among sequences of one species. The age
estimations shown here are only valid for the divergence age of the respective species, like
Kernera saxatilis (origin between 0.75 and 0.18 mya).
Tribe/Rate T(r=1,5x10⁻⁸) T(r=4x10
-9) T(r=8x10⁻⁹) T(r=1,67x10
-8) T(r=5x10⁻⁹) T(r=1x10
-8)
Author Koch et al. Wolfe et al. Durbin et
al. Wang et al. Li et al. Huang et al.
Aethionemeae 14.51 54.38 27.19 13.02 43.5 21.75
Alysseae 12.63 47.38 23.69 11.35 37.9 18.95
Alyssopsideae 6.57 24.63 12.31 5.9 19.7 9.85
Anastaticeae 39.57 148.38 74.19 35.54 118.7 59.35
Anchonieae 30.43 114.13 57.06 27.34 91.3 45.65
Arabideae 76.67 287.5 143.75 68.86 230 115
Biscutelleae 17.97 67.38 33.69 16.14 53.9 26.95
Boechereae 4.07 15.25 7.63 3.65 12.2 6.1
Brassiceae 165.77 621.63 310.81 148.89 497.3 248.65
Buniadeae 0.17 0.63 0.31 0.15 0.5 0.25
Calepineae 3.17 11.88 5.94 2.84 9.5 4.75
Camelineae 28.13 105.5 52.75 25.27 84.4 42.2
Cardamineae 47.47 178 89 42.63 142.4 71.2
Chorisporeae 9.8 36.75 18.38 8.8 29.4 14.7
Cochlearieae 171.63 643.63 321.81 154.16 514.9 257.45
Coluteocarpeae 9.53 35.75 17.88 8.56 28.6 14.3
Conringieae 0.23 0.86 0.43 0.21 0.69 0.35
Crucihimalayeae 4.63 17.38 8.69 4.16 13.9 6.95
Descurainieae 19.6 73.5 36.75 17.6 58.8 29.4
Dontostemoneae 45.4 170.25 85.13 40.78 136.2 68.1
Erysimeae 8.9 33.38 16.69 7.99 26.7 13.35
Euclidieae 42.7 160.13 80.06 38.35 128.1 64.05
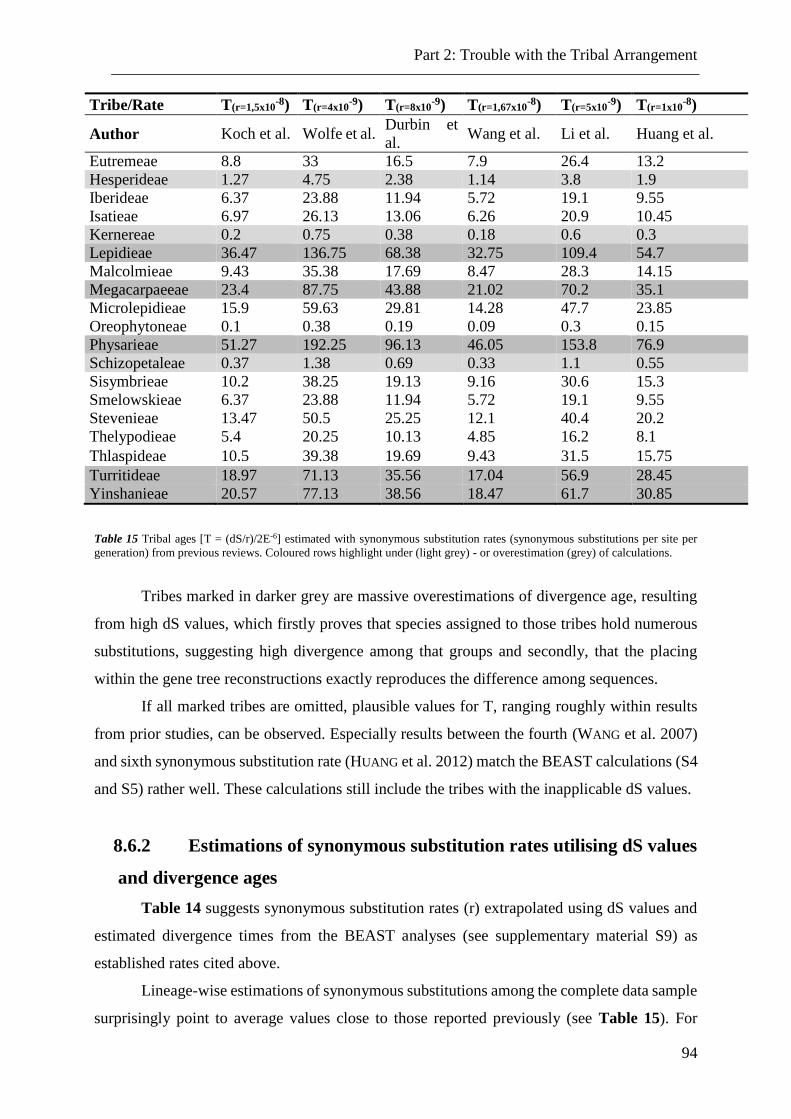
Part 2: Trouble with the Tribal Arrangement
94
Tribe/Rate T(r=1,5x10⁻⁸) T(r=4x10
-9) T(r=8x10⁻⁹) T(r=1,67x10
-8) T(r=5x10⁻⁹) T(r=1x10
-8)
Author Koch et al. Wolfe et al. Durbin et
al. Wang et al. Li et al. Huang et al.
Eutremeae 8.8 33 16.5 7.9 26.4 13.2
Hesperideae 1.27 4.75 2.38 1.14 3.8 1.9
Iberideae 6.37 23.88 11.94 5.72 19.1 9.55
Isatieae 6.97 26.13 13.06 6.26 20.9 10.45
Kernereae 0.2 0.75 0.38 0.18 0.6 0.3
Lepidieae 36.47 136.75 68.38 32.75 109.4 54.7
Malcolmieae 9.43 35.38 17.69 8.47 28.3 14.15
Megacarpaeeae 23.4 87.75 43.88 21.02 70.2 35.1
Microlepidieae 15.9 59.63 29.81 14.28 47.7 23.85
Oreophytoneae 0.1 0.38 0.19 0.09 0.3 0.15
Physarieae 51.27 192.25 96.13 46.05 153.8 76.9
Schizopetaleae 0.37 1.38 0.69 0.33 1.1 0.55
Sisymbrieae 10.2 38.25 19.13 9.16 30.6 15.3
Smelowskieae 6.37 23.88 11.94 5.72 19.1 9.55
Stevenieae 13.47 50.5 25.25 12.1 40.4 20.2
Thelypodieae 5.4 20.25 10.13 4.85 16.2 8.1
Thlaspideae 10.5 39.38 19.69 9.43 31.5 15.75
Turritideae 18.97 71.13 35.56 17.04 56.9 28.45
Yinshanieae 20.57 77.13 38.56 18.47 61.7 30.85
Table 15 Tribal ages [T = (dS/r)/2E-6] estimated with synonymous substitution rates (synonymous substitutions per site per
generation) from previous reviews. Coloured rows highlight under (light grey) - or overestimation (grey) of calculations.
Tribes marked in darker grey are massive overestimations of divergence age, resulting
from high dS values, which firstly proves that species assigned to those tribes hold numerous
substitutions, suggesting high divergence among that groups and secondly, that the placing
within the gene tree reconstructions exactly reproduces the difference among sequences.
If all marked tribes are omitted, plausible values for T, ranging roughly within results
from prior studies, can be observed. Especially results between the fourth (WANG et al. 2007)
and sixth synonymous substitution rate (HUANG et al. 2012) match the BEAST calculations (S4
and S5) rather well. These calculations still include the tribes with the inapplicable dS values.
8.6.2 Estimations of synonymous substitution rates utilising dS values
and divergence ages
Table 14 suggests synonymous substitution rates (r) extrapolated using dS values and
estimated divergence times from the BEAST analyses (see supplementary material S9) as
established rates cited above.
Lineage-wise estimations of synonymous substitutions among the complete data sample
surprisingly point to average values close to those reported previously (see Table 15). For
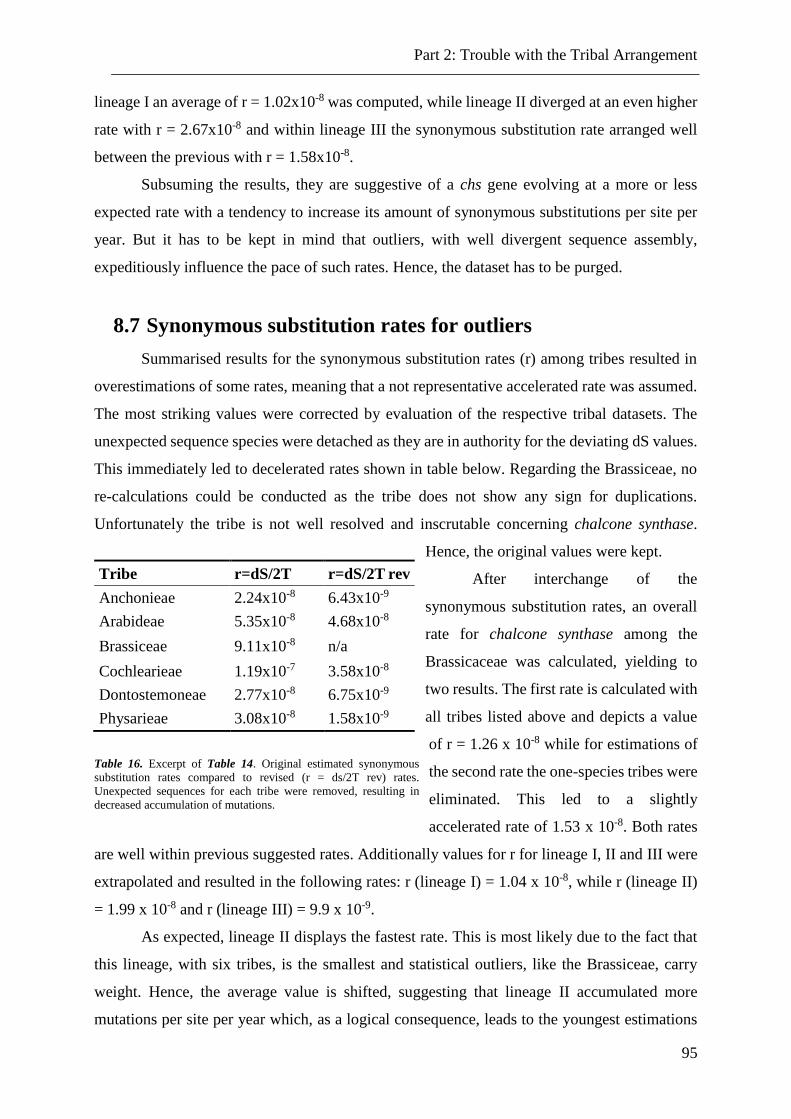
Part 2: Trouble with the Tribal Arrangement
95
lineage I an average of r = 1.02x10⁻⁸ was computed, while lineage II diverged at an even higher
rate with r = 2.67x10⁻⁸ and within lineage III the synonymous substitution rate arranged well
between the previous with r = 1.58x10⁻⁸.
Subsuming the results, they are suggestive of a chs gene evolving at a more or less
expected rate with a tendency to increase its amount of synonymous substitutions per site per
year. But it has to be kept in mind that outliers, with well divergent sequence assembly,
expeditiously influence the pace of such rates. Hence, the dataset has to be purged.
8.7 Synonymous substitution rates for outliers
Summarised results for the synonymous substitution rates (r) among tribes resulted in
overestimations of some rates, meaning that a not representative accelerated rate was assumed.
The most striking values were corrected by evaluation of the respective tribal datasets. The
unexpected sequence species were detached as they are in authority for the deviating dS values.
This immediately led to decelerated rates shown in table below. Regarding the Brassiceae, no
re-calculations could be conducted as the tribe does not show any sign for duplications.
Unfortunately the tribe is not well resolved and inscrutable concerning chalcone synthase.
Hence, the original values were kept.
After interchange of the
synonymous substitution rates, an overall
rate for chalcone synthase among the
Brassicaceae was calculated, yielding to
two results. The first rate is calculated with
all tribes listed above and depicts a value
of r = 1.26 x 10⁻⁸ while for estimations of
the second rate the one-species tribes were
eliminated. This led to a slightly
accelerated rate of 1.53 x 10⁻⁸. Both rates
are well within previous suggested rates. Additionally values for r for lineage I, II and III were
extrapolated and resulted in the following rates: r (lineage I) = 1.04 x 10⁻⁸, while r (lineage II)
= 1.99 x 10⁻⁸ and r (lineage III) = 9.9 x 10⁻⁹.
As expected, lineage II displays the fastest rate. This is most likely due to the fact that
this lineage, with six tribes, is the smallest and statistical outliers, like the Brassiceae, carry
weight. Hence, the average value is shifted, suggesting that lineage II accumulated more
mutations per site per year which, as a logical consequence, leads to the youngest estimations
Tribe r=dS/2T r=dS/2T rev
Anchonieae 2.24x10⁻⁸ 6.43x10⁻⁹
Arabideae 5.35x10⁻⁸ 4.68x10⁻⁸
Brassiceae 9.11x10⁻⁸ n/a
Cochlearieae 1.19x10⁻⁷ 3.58x10⁻⁸
Dontostemoneae 2.77x10⁻⁸ 6.75x10⁻⁹
Physarieae 3.08x10⁻⁸ 1.58x10⁻⁹
Table 16. Excerpt of Table 14. Original estimated synonymous
substitution rates compared to revised (r = ds/2T rev) rates.
Unexpected sequences for each tribe were removed, resulting in
decreased accumulation of mutations.
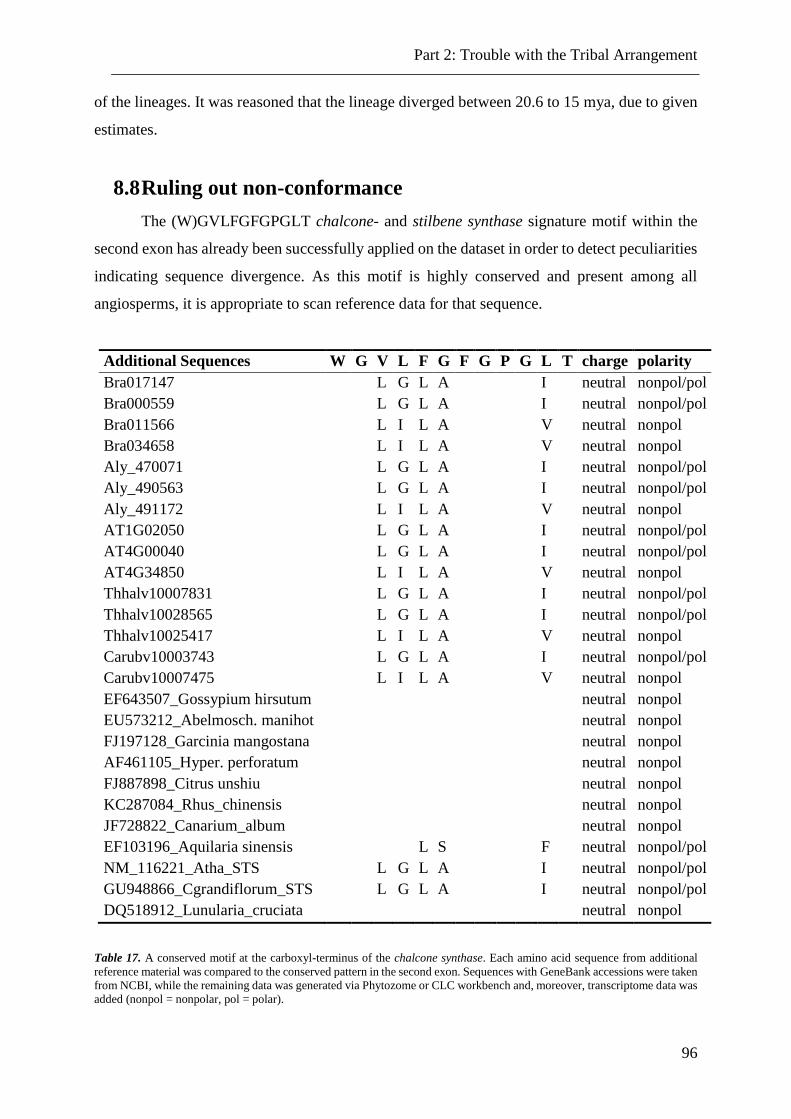
Part 2: Trouble with the Tribal Arrangement
96
of the lineages. It was reasoned that the lineage diverged between 20.6 to 15 mya, due to given
estimates.
8.8 Ruling out non-conformance
The (W)GVLFGFGPGLT chalcone- and stilbene synthase signature motif within the
second exon has already been successfully applied on the dataset in order to detect peculiarities
indicating sequence divergence. As this motif is highly conserved and present among all
angiosperms, it is appropriate to scan reference data for that sequence.
Additional Sequences W G V L F G F G P G L T charge polarity
Bra017147 L G L A I neutral nonpol/pol
Bra000559 L G L A I neutral nonpol/pol
Bra011566 L I L A V neutral nonpol
Bra034658 L I L A V neutral nonpol
Aly_470071 L G L A I neutral nonpol/pol
Aly_490563 L G L A I neutral nonpol/pol
Aly_491172 L I L A V neutral nonpol
AT1G02050 L G L A I neutral nonpol/pol
AT4G00040 L G L A I neutral nonpol/pol
AT4G34850 L I L A V neutral nonpol
Thhalv10007831 L G L A I neutral nonpol/pol
Thhalv10028565 L G L A I neutral nonpol/pol
Thhalv10025417 L I L A V neutral nonpol
Carubv10003743 L G L A I neutral nonpol/pol
Carubv10007475 L I L A V neutral nonpol
EF643507_Gossypium hirsutum neutral nonpol
EU573212_Abelmosch. manihot neutral nonpol
FJ197128_Garcinia mangostana neutral nonpol
AF461105_Hyper. perforatum neutral nonpol
FJ887898_Citrus unshiu neutral nonpol
KC287084_Rhus_chinensis neutral nonpol
JF728822_Canarium_album neutral nonpol
EF103196_Aquilaria sinensis L S F neutral nonpol/pol
NM_116221_Atha_STS L G L A I neutral nonpol/pol
GU948866_Cgrandiflorum_STS L G L A I neutral nonpol/pol
DQ518912_Lunularia_cruciata neutral nonpol
Table 17. A conserved motif at the carboxyl-terminus of the chalcone synthase. Each amino acid sequence from additional
reference material was compared to the conserved pattern in the second exon. Sequences with GeneBank accessions were taken
from NCBI, while the remaining data was generated via Phytozome or CLC workbench and, moreover, transcriptome data was
added (nonpol = nonpolar, pol = polar).
Part 2: Trouble with the Tribal Arrangement
97
To prove and compare the data, additional reference material was collected and
constructed. As it has be proven that stilbene developed out of chalcone synthase several times
(TROPF et al. 1995, TROPF et al. 1994) and that both enzymes differs only in two amino acid
changes, an intensified search for similarities of STS (stilbene synthase) among the data seems
advisable. As the resemblance is that high, it is suggested that erroneously stilbene or other
closely related enzymes like chalcone isomerase (CHI) or other polyketide synthase enzymes
(PKS) which are also involved in the flavonoid biosynthesis have been unwittingly been
sequenced during lab work. In addition, the CHS/STS gene family among the angiosperms
partly holds high numbers of family members (DURBIN et al. 1995, FLAVELL et al. 1998, VAN
DER KROL et al. 1990), although this is not known for the Brassicaceae. Unknown gene family
members, which derive from various duplication events, could easily disarrange the
phylogenetic reconstructions and therefore any other analysis as well, especially if it is not
assumed. In the majority of cases the genes of such families keep the same or a closely related
biochemical function (DAUGHERTY et al. 2012).
Therefore two stilbene synthase enzyme sequences from Arabidopsis thaliana and
Capsella rubella were taken from GeneBank (BENSON et al. 2009, SAYERS et al. 2009)
(accession numbers are listed in the table). Phytozome v.9.1. (GOODSTEIN et al. 2012) is a
comparative online platform holding a genome browser and tools that, like blast search or
keyword search, deliver manifold options to compare and analyse sequence data. Sequences
from this research with uncertain background or origin were blasted against available whole
genome data to verify whether these genomes hold similar episodes within their DNA. 78 and
96% identity for the first and between 72% and 96% for the latter. Thellungiella halophila and
Capsella rubella resulted in three and two sequences, with identities between 71% and 87%
and 82% to 94%, which can all be viewed in table Table 17. All sequences were defined as
chs-like. The Sisymbrium irio genome was downloaded from the BioProject PRJNA202979
available on NCBI (HAUDRY et al. 2013) and was loaded as blast databank, further procedure
was the same like explained for phytozome.
Motif sequence changes in the CHS protein imply functional divergence, although these
functions are not known, yet (WANG et al. 2007). The table depicts the amino acid replacements
in the tribes reviewed in this chapter, which can be categorised as conservative or radical
changes (HUGHES et al. 2000). Any change of category is counted as radical difference while a
change within the category is evaluated as conservative. Concerning the charge of the amino
acids, no radical categorical change could be observed, the neutral amino acids are changed to
another aa neutral in its charge, while there were several changes in the polarity.
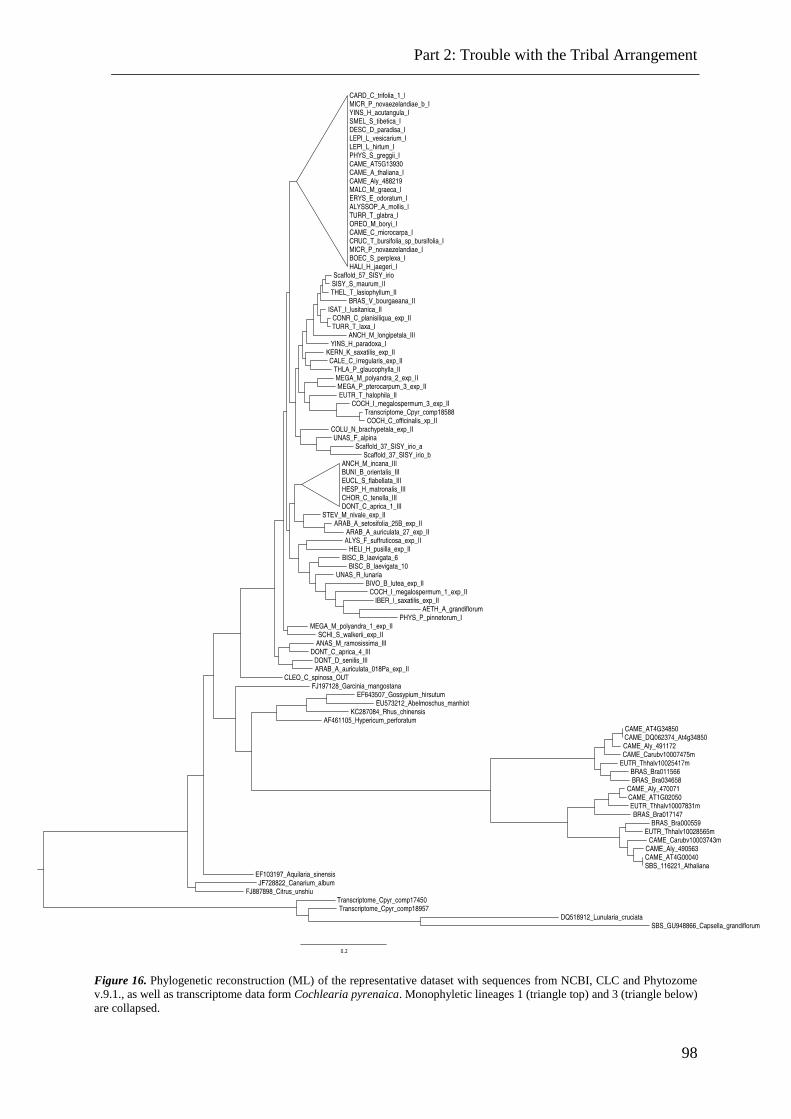
Part 2: Trouble with the Tribal Arrangement
98
Figure 16. Phylogenetic reconstruction (ML) of the representative dataset with sequences from NCBI, CLC and Phytozome
v.9.1., as well as transcriptome data form Cochlearia pyrenaica. Monophyletic lineages 1 (triangle top) and 3 (triangle below)
are collapsed.
Part 2: Trouble with the Tribal Arrangement
99
All changes were radical and only from nonpolar to polar. Most likely, an alteration in those
amino acids results in a change of structure and therefore function. The affected sequences are
all gathered in one group among that represented tree, most likely showing family members
adequate to chromosome 1 in Arabidopsis thaliana as well as the stilbene synthase gene from
the same species, which also shows a radical change.
The sister group to chromosome 1 is a group holding sequences from chromosome 4,
does not exhibit any change, indicating that both groups (chromosome 1 and 4) carry different
functions. It can be argued that the copies, which developed in parallel to those on chromosome
1 on A. thaliana, are more diverged than those on chromosome 4. The cladogram of the diverse
sequences hints to the fact that chalcone synthase could either also be a multigene family in the
Brassicaceae or the extra members are on their pass through to expulsion from the genome. The
sequence material from diverse other angiosperms (used in BEAST estimations as well) and
even one Bryophytes example from Lunularia cruciate also helped to arrange.
The back-cloth of that excursion to multigene families and other sequence analogue data
could thoroughgoing illustrate that the DNA data which is investigated here, does supposedly
not include any closely related genes as stilbene synthase or, moreover, resemble other chs-like
DNA episodes from other chromosomes. Besides, it should be noted that chalcone synthase
sequences, even from relatively far related organisms (Bryophyta) were still akin enough to
unresistingly align and analyse. This attests how highly conserved this gene is.
8.9 Ancestral sequence reconstruction
The character mapping lead to 54 ancestral sequences estimated from the respective
nodes (57-110) from a reduced file (see Figure 16) calculated by ML algorithm. This resulted
in an alignment with sequence lengths between 1176 and 1185 base pairs, resembling the recent
alignment lengths with a range from 1176 to 1188. The ancestral alignment depicts some gaps
at the beginning of exon 1 analogue the modern exonic region. The more distantly related the
sequences are, the more gaps within the constructed sequences are expected and vice versa.
The accuracy score for the DNA sequences, which is the mean of the probabilities of all
the bases, displayed a minimum value of 0.9497 and delivers a good reflection of the overall
accuracy of estimated ancestral sequences (HALL 2006). This means that every base has a
chance of minimum 94.97% of being correct. The probability of the entire sequence correctness
is the product of the most probable base (MPB) probabilities. The log of each probability is a
relatively small negative value, higher than that of the complete tree. As the resulting sequences
do display a minor amount of gaps resulting in an alignment of approximately the same length
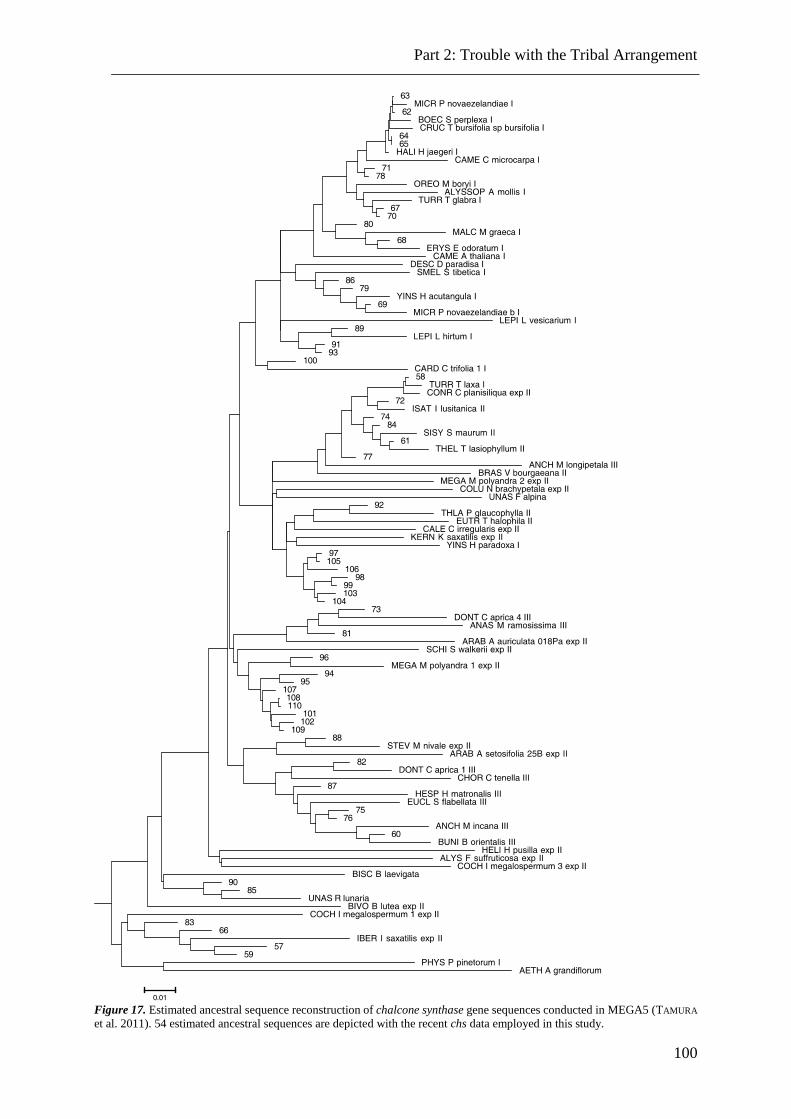
Part 2: Trouble with the Tribal Arrangement
100
Figure 17. Estimated ancestral sequence reconstruction of chalcone synthase gene sequences conducted in MEGA5 (TAMURA
et al. 2011). 54 estimated ancestral sequences are depicted with the recent chs data employed in this study.
Part 2: Trouble with the Tribal Arrangement
101
as the recent sequences it can be concluded that the gene is either highly conserved and/or the
sequences diverged relatively recently. The resulting phylogenetic calculations furnished each
dichotom node with an estimated ancestral sequence suggesting miscellaneous evolutionary
trends.
In most cases it can be concluded, that the ancestor of two recent sequences is closer to
one modern species sequence than to the other, indicating that either intermediate sequences,
bridging the evolutionary distance, are not sampled or that one of the recent sequences
accumulated more mutational steps, since they diverged, than the other. A peculiar result
concerns Aethionema grandiflorum and the sequences clustering close. Their ancestral
sequences seems to display a younger age than the respective modern sequence. This could
underpin the suggestion of duplication events resulting in two gene copies, each. The data on
hand indicates that in these examples both copies are maintained, at least in this temporal
snapshot. These basal sequences seem to have heaped mutations, resulting in a still functional
sequence with an evolutionary distance higher than that of the estimated ancestral sequence.
9 Discussion
The tribes of the mustard family are meanwhile all monophyletic, forming well
supported clades, thanks to through research, especially during the last two decades e.g. (AL-
SHEHBAZ et al. 2006, COUVREUR et al. 2010, KOCH et al. 2001, WARWICK et al. 2010). The
tribal nomenclature therefore displays no longer an artificial system, but describe natural
relationships between genera and species.
As the monophyly of tribes and even lineages has been proven e.g. (AL-SHEHBAZ et al.
2006, BAILEY et al. 2006, BEILSTEIN et al. 2008, KARL & KOCH 2013, KOCH et al. 2005, LIU
et al. 2012, RESETNIK et al. 2013) via distinct approaches, the performance of chs has to be
scrutinised. As indicated by KOCH et al. (2007), phylogenetic constructions based on a one-
marker-sytems are limited in their value to establish robust phylogenies. However, chs was not
employed to unravel phylogenies. As far as known, no comprehensive delineation of this
nuclear encoded marker gene, comprising the majority of the accepted tribes, is available.
Hence, eight tribes recognised within this study, which demonstrate feigned polyphyly, were
investigated. Those divided systematic units do not question confirmed cladistic relationships,
but rather pinpoint evolutionary events, gathered in the genomes of the taxa. This relatively
short DNA unit is capable to hint at several divers occasions which will be discussed
individually for the respective tribe.
Part 2: Trouble with the Tribal Arrangement
102
9.1 Anastaticeae/Malcolmieae
This tribal is intricate due to the actuality that rearrangements concerning taxonomy and
phylogeny are going on continuously. Based on the fact that the complete genus Malcolmia was
assigned to the ANAS until this year and is now divided into four already existing or newly re-
established tribes, and besides, the data at hand encloses three Malcolmia genera, assertions
have to be done. Malcolmia ramossisima was kept within the ANAS but the genus name was
replaced by Marcus-Kochia [(AL-SHEHBAZ et al. 2014) and D. German (pers. comm.)].
Malcolmia maritima and Malcolmia graeca (s.str. Malcolmia), together with other species,
were excluded from the ANAS as they share a vast number of morphological and molecular
data with the ERYS. Re-established MALC are a sister tribe to ERYS, which is in absolute
congruence to the data introduced here (Figure 8) and moreover supported by a bootstrap value
of 99%. Therefore the previous putative polyphyletic arrangement of ANAS within members
of lineage I and III is hence futile and underpins the capability of the nuclear chalcone synthase
to unravel phylogenetic challenges. From here on, Anastaticeae and Malcolmieae will be treated
as two distinct tribes.
But there are still open issues concerning the tribe ANAS in the data at hand.
Cithareloma vernum GQ983043 and Malcolmia ramosissima should be situated close to each
other, as both are assigned to the tribe ANAS of lineage III. The former condition is fulfilled
while the ANAS are the only tribe from that respective lineage that is not arranged among the
group of lineage III, but only with one species from the tribe DONT (see discussion
Dontostemoneae). So, both groupings are proven as existent and it is therefore suggested that
the tribe ANAS sensu AL-SHEHBAZ et al. (2014), underwent at least a tribal-wise duplication
event, if not even lineage-wise or even remaining from the alpha WGD, which resulted in a two
times over appearance of the chalcone synthase gene among the genomes.
What is even more striking is the fact that within M. ramosissima sequences variability
in the coding region settles between 92.48% and 96.03%, while the complete gene shows a
similar overall identity of 93.86% to 96.76%. To make meaningful argumentation from that
result, it is suggested that the tribe Anastaticeae underwent a separate polyploidisation event
after the last WGD. The “wrong”, meaning unexpected, gene tree arrangement of the lineage
III assigned tribe is supposed to be the outcome from At-α while the intra-species (M.
ramosissima) disparity is generated by a recent gene duplication event resulting in two
paralogous copies of chalcone synthase. This incidence must have happened currently (less
than 2 mya), as the amount of paralog-identity is not advanced enough to illustrate the loci at
separated locations within gene tree arrangement. On the other hand, the coding region is
Part 2: Trouble with the Tribal Arrangement
103
diverse enough to indicate an even older duplication event. This puzzling outcome (coding and
complete gene identity close to similar) maybe hints to concerted evolution, as the two
paralogous copies are more closely related (compare gene tree arrangemenet) than to other
orthologs from related species.
As a tendency to diploidisation is reported among the Brassicaceae (KASHKUSH et al.
2002, LYNCH & CONERY 2000, MA & GUSTAFSON 2005, WOLFE 2001), functional divergence
is another manifest approach to explain the fate of the duplicated genes. Here it seems like the
sets of duplicated genes underwent different processing concerning members of lineage III. Six
(ANCH, EUCL, DONT, CHOR, HESP, BUNI) out of seven tribes (ANAS) kept supposedly
only one of the chs copies on the same locus. This definitely advocates for orthologs of chs
among those different species. Orthology, as well as paralogy are key concepts in evolutionary
genomics. Orthologs are genes that derive from a vertical descent as they are related via
speciation (FITCH 1970). Orthologs are homologs that derive from a single ancestral gene
present in the last common ancestor of the compared species (KOONIN 2005).
Concerning the outlying tribe ANAS two scenarios can be imagined. Either
representatives for tribe ANAS maintained both copies were the second could not be sequenced
by mischance. Consequently, these sequences, resulting from a duplication event, would be
defined as paralogs, displaying an additional locus, most likely even on another chromosome.
The missing representative would consequently be the ortholog to the other lineage III species,
as they are homologous sequences placed on the same locus complying the same function. The
alternative hypothesis is, that the tribe ANAS already underwent the gene loss of the additional
redundant copy, maybe even directly after polyploidisation, and resulted in the phylogeny at
hand. A tangible reason for the maintenance of the paralog instead of the ortholog is no obvious
fact and can hardly be explained without further investigations. As ANAS is arranged with
different DONT species it is suggested that the first scenario is conceivable.
9.2 Anchonieae
The tribe ANCH is treated as inconspicuous and, to the best of knowledge, nothing
concerning phylogenetic abnormalities has been discussed previously. Matthiola incana, is
arranged within lineage III, were it was expected. It depicts a close relatedness to the tribe BUNI
and illustrates the deepest node within the lineage. The more peculiar is the arrangement of
Matthiola longipetala, which is nested in the middle of lineage II, separated by a comparatively
long branch. A thoroughgoing explanation for the positioning is long-branch-attraction of the
gene due to shared homoplasies. It can be eliminated that this arrangement is due to
Part 2: Trouble with the Tribal Arrangement
104
experimental or taxonomical lapses as both was double-checked. The branches within this clade
are also supported with very high bootstrap values between 86 and 99 percent which support
the reproducibility of that clustering. Moreover, lineage II is entirely present with six tribal
representatives. Also within that group another sequence pair (T. laxa and C. planisiliqua) can
be observed at the deepest node, suggesting that lineage II within chs phylogeny is not
monophyletic.
An arguable hypothesis for the polyphyletic appearance of ANCH, although
speculative, is, that this tribe as well, kept both chs sequences since the last WGD. As this
Matthiola sequence is relatively diverged from the surrounding sequences, meaning that it has
accumulated several mutations since the duplication, it can be proposed that M. longipetala
indeed is a relict sequence carried within the genome since the duplication. Immediately after
a polyploidisation event, both sequences are redundant meaning that they are identical and no
preference can be predicted. As this appearance in the ANCH could only be witnessed within
one species, this presumably is a still working gene on its way to non-functionalisation ending
long-term in gene loss. However, it is striking that the mutational accumulation is obviously in
progress, while the gene still keeps its function.
9.3 Camelineae
The tribe was found to be polyphyletic within chs illustrations, with one subclade
comprising Capsella bursa-pastoris, C. rubella and Camelina microcarpa, while the other
included all Arabidopsis species (A. lyrata, A. thaliana, A. halleri) employed within this study.
The Arabidopsis clade seems to be more basal and depicts a group that acts like a sister tribe to
tribes Turritideae, Alyssopsideae, Oreophytoneae, Camelineae (with exception of genus
Arabidopsis), Halimolobeae, Boechereae, Microlepidieae A-copy sensu JOLY et al. (2009) and
Crucihimalayeae, all members of lineage I. A similar placement and division of the Camelineae
was observed by studies using the chloroplast gene matK (LIU et al. 2013), the phytochrome A
phylogeny by BEILSTEIN et al. (2008) and another nuclear encoded marker, ITS (GERMAN et al.
2009). In a recent review by COUVREUR et al. (2010) employed a supermatrix analysis, resulting
in similar findings concerning the split within the tribal phylogeny. The cleavage between both
Camelineae groups is even wider within this chs study, which is moreover also underpinned by
another chs study focusing on the tribe Cochlearieae (KOCH 2012). It is not only the tribes
Boechereae and Halimolobeae which are nested within, but also Microlepidieae (A-copy) and
Crucihimalayeae. The disagreement of this tribe suggests further investigations. It, moreover,
can be suggested, based on several identical results listed above, that the Camelineae need
Part 2: Trouble with the Tribal Arrangement
105
supplemental revision or tribal affiliations and should be subdivided into at least two separate
tribes.
9.4 Dontostemoneae
The tribe Dontostemoneae, rather of small dimensions, is restricted to central and
eastern Africa and was only established in 2007 (AL-SHEHBAZ & WARWICK 2007). Chalcone
synthase data from Dontostemoneae has not been employed very often until now. Previous
research analysis from ZHAO et al. (2010) suggest that the tribe is arranged close to Hesperideae
and Chorisporeae, supporting the findings at hand. As all of the named tribes belong to lineage
III, the expected arrangement of Clausia aprica within that group seems not be surprising.
Astonishingly, sequences from the review named above are nested within a second position
among phylogenetic reconstructions, both arrangements supported with a 99 % bootstrap value.
The question rises whether one group of sequences, containing Dontostemon senilis, D. elegans,
Clausia trichosepala and C. aprica depicts the genuine placement or the group holding a second
copy of C. aprica and all the other members from lineage III. On the other hand, the former
group is also surrounded by another lineage III member, but only one (see Figure 8). More
conspicuous is the fact that both placements are arranged within the close neighbourhood of
ARAB species, which belong to the indistinct expanded lineage II. But, like mentioned above,
the tribe ARAB is stated to have undergone an additional duplication event. Hence it is
proposed that the DONT are affected by the same or a parallel incidence, indicating that either
the duplicated sequences derive from the alpha whole genome duplication in the course of the
rapid radiation event, as this historically seems to be the nearest encounter of both tribes
concerning time flow. Or an independent duplication event, most likely close to the divergence
of the DONT and lineage III, which is often discussed to be the oldest of age, having diverged
between 35 and 28 mya (BEILSTEIN et al. 2010, COUVREUR et al. 2010). Independent from the
exact duplication occurrence, it is proposed that the discussed tribe underwent an arbitrarily
duplication event resulting in paralogous gene copies on two loci among the nuclear core
genome which are still present and functional momentarily.
9.5 Megacarpaeeae
This Brassicaceae tribe is neither very widespread nor very well known. To the best of
knowledge no chromosome counts of the species on hand, phylogenies or further
thoroughgoing information are available. The two genera employed here depict no
monophyletic resolution. Megacarpaea polyandra and Pugionium pterocarpum clusters at two
Part 2: Trouble with the Tribal Arrangement
106
positions within the chs reconstruction. The tribe is assigned to expanded lineage II and is
therefore supposed to arrange among other genera and tribes from that lineage, potentially in a
polytomic manner with a lack of resolution. Both species partly fulfil that expectations,
although it is not explicitly obvious whether one of them is an outlier due to the fact that both
arrange among other sequences from the same lineage. It is most likely that the P. pterocarpum
position represents the actual placement, as two additional sequences of M. polyandra are
arranged in a neighbouring position and depict a recent divergence from each other. Moreover,
group eight, which also contains the other M. polyandra sequence, seems to be a receptacle for
incongruous and debatable arrangements. Concerning the tribe’s monophyly, it is suggested
that a duplication event took place, most likely before the diversification of the lineages, what
makes it verisimilar that these sequences even descend from the last whole genome duplication
event. Further discussions regarding the double appearance of M. polyandra are postponed to
the following chapter (see 12.4).
9.6 Physarieae
This tribe was also found to depict a polyphyletic arrangement concerning chs
phylogeny, although it was several times depicted as monophyletic (BAILEY et al. 2006,
FUENTES-SORIANO & AL-SHEHBAZ 2013). The tribe belongs to lineage I, where one of the
genera employed, arranged. Synthlipsis greggii, recently defined as part of the DDNLS clade
by (FUENTES-SORIANO & AL-SHEHBAZ 2013) nested, as expected, within lineage I, with a
bootstrap support of 69%, in a more basal position with a suggested close relationship to the
tribe Descurainieae, one node more outside, and sister to Malcolmieae and Erysimeae. This
placement has often been verified (BAILEY et al. 2006, FUENTES-SORIANO & AL-SHEHBAZ
2013, KOCH et al. 2007) by several marker systems. But a second grouping of members of that
tribe can be found at a position not only outside the lineage but also outside every defined
lineage for the Brassicaceae at a very basal situation. The clones discussed here are both from
the genus Physaria (P. fendleri and P. pinetorum), which are depicted as members of the PP
(Paysonia and Physaria) clade (FUENTES-SORIANO & AL-SHEHBAZ 2013) and are known,
especially Physaria, for their large C-values (up to C = 2.34) in combination with a relatively
low chromosome number (up to 2n = 8). In Physaria bellii for example, a 2C content of 4.7 and
a chromosome number of n = 8 was detected by LYSAK & LEXER (2006). It was therefore
reasoned that the taxa showing this pattern underwent a polyploidisation event followed by
subsequent downsizing of the chromosome number by fractionation which is accompanied by
chromosome rearrangements. Hence, at least the genus Physaria is suggested to be of
Part 2: Trouble with the Tribal Arrangement
107
paleopolyploid origin (LIHOVA et al. 2006, LYSAK et al. 2009, LYSAK et al. 2005). But,
expansion of the chromosome size and the genome size joined by decreasing chromosome
numbers are characteristic for the whole tribe of the Physarieae which supports the suggestion
of a paleopolyploid origin of the complete tribe. This finding should help explaining the
hypothesis for the pattern observed of the genus Physaria within the chs phylogeny
consequently. Both the split of the tribe and the very basal arrangement of the two species, also
supported by JOLY et al. (2009), indicates that the Physarieae underwent a past polyploidisation
event resulting in duplicated genomes, each carrying a copy of the chalcone synthase. This,
most likely, was followed by loss of one gene, as there is only one copy for each species
available, gradually transforming the polyploid into a quasi-diploid genome (MANDAKOVA et
al. 2010). It can be ruled out that the additional copies are indeed present and could simply not
be sampled by the cloning procedure as several reviews depict the exactly identical situation
concerning the tribe Physarieae, especially the genus Physaria (JOLY et al. 2009, MANDAKOVA
et al. 2010). This approves the argumentation that, after the last whole genome duplication
event, the PP clade, or at least the genus Physaria kept one of the duplicated chs copies while
the DDNLS group maintained the other copy and silenced the redundant gene. It is well
supported via whole genome information that large proportions of duplicated genes are
eliminated from the genome over time (BLANC & WOLFE 2004).
9.7 Turritideae
Within this tribe another polyphyletic arrangement could be observed. Between the two
species, Turritis laxa and Turritis glabra, an identity among the coding regions of only 55
respectively 82 percent could be observed. It is thus not astonishing that the species arrange at
more distant positions to each other, what actually does not purge the reason for that distinction.
Especially the positioning of both species is exceptional. T. glabra arranges, as anticipated,
among highly supported lineage I, while T. laxa, supported by 99 percent bootstrap value, both
in the NJ as well as in the MP reconstruction, echoes with CONR as deep node within lineage
II. Blast results also support the concordance of the sequences from T. laxa and C. planisiliqua,
although a close relatedness can be expulsed, as both are even assigned to dissimilar lineages.
9.8 Yinshanieae
This tribe is represented by two species, Hiliella paradoxa and Yinshania acutangula.
The Yinshania species are all diploid, based on x = 6 (7). While Yinshania acutangula, which
was utilised here, is mostly reported as one of the exceptions with 2n = 2x = 14 (Zhang, Y.
Part 2: Trouble with the Tribal Arrangement
108
1995/1996, see reference in BrassiBase, cytogenetic tool), while KOCH (2000) suggests 2n = 12
as the ancestral state. However, all Yinshania species are described as diploids. Concerning the
genus Hilliella, which is reported as polyploid, chromosome counts suggest a hexaploid state
(AL-SHEHBAZ et al. 1998), with 2n = 6x = 42, based on x = 7, indicating an ancient genome
triplication via autopolyploidy or allopolyploidy (WOLFE 2001).
Although this tribe has not been extensively reviewed, the state as polyploidy, at least
in the genus Hilliella requires further regard.
As polyploidy is discussed as the primary mechanism for generated redundancy
(WENDEL 2000), it has long been recognised as the most prominent speciation process (LEWIS
1979, SOLTIS et al. 1993, SOLTIS & SOLTIS 2000). Polyploid evolution in plants is a more
dynamic process were many angiosperm genomes have reportedly experienced several rounds
of polyploidisation at various times in their history and had later become diploid again. This
defines the respective genomes as paleopolyploid, by means of sequence divergence between
the duplicated chromosomes (WOLFE 2001). The modern angiosperm genome is hence
characterised by a series of ancient as well as more recent polyploidisation events interspersed
by rounds of diploidisation, superimposing the traces. Therefore it cannot reliably be
illuminated whether the polyploidisation involved the merger of two differentiated genomes
(allopolyploidisation), a simple doubling of the own genome (autopolyploidisation) or maybe
even something in between, like segmental allopolyploidisation (JACKSON & CASEY 1979,
MASTERSON 1994, SOLTIS et al. 1993).
It is argued that duplicated homoeologous copies of allopolyploids (chromosomes,
segments or genes), as contributed by different donor taxa, result in descendant sequences
(polyploidy) which are expected to arrange in a phylogenetic sister position to their diploid
counterparts (WENDEL 2000) rather to each other (compare MICR Figure 3). Applied on the
YINS this means that the hexaploid Hilliella would be expected to cluster close to the
orthologous diploid taxa it derived from. As those are most likely not sampled, the arrangement
apart from Yinshania corresponds the expectations.
This hypothesis of independent evolution is only assignable in case the genome was not
affected by evolutionary events such as concerted evolution, loss of one homoeologous copy or
other interaction among homoeologous sequences (WENDEL & DOYLE 1998, WENDEL 2000).
An augmented sample size of that tribe could help to resolve the arrangement.
Results from this chapter have shown that the division of the discussed tribes is not due
to polyphyly, but rather the result of distinct evolutionary events which can be traced awithin
Part 2: Trouble with the Tribal Arrangement
109
the genome. Even a small piece of nuclear encoded DNA thus demonstrates to be capable of
delivering evidence for ancient impact on the species’ development.
All clearly duplicated unexpected chs copies (see asterisks Figure 3) have therefore
been removed for further investigations on the data.
However, the previous chapter suggests further ambiguous sequence arrangements
within the phylogenies (see filled colour-coded circles in Figure 3), which could not be
resolved with the exclusion of duplicated loci within the mentioned tribes. Results at hand, e.g.
Figure 10, Table 12 or Table 15 suggest that other tribes do also hold proof for evolutionary
deviations. Thus, tribes Arabideae, Cochlearieae, Dontostemoneae, Megacarpaeeae and
Microlepidieae will be further investigated in order to detect distinctions which show proof for
evolutionary patterns within the mustards.
Part 3. Done Twice is not Always Better - Duplicated
Gene Pairs
Part 3. Done Twice is not Always Better - Duplicated Gene Pairs
111
Each tribe which contained two groups of sequences supposed to arrange within one
monophyletic group was analysed in chapter two. To continue analysis on the chalcone
synthase data without further detraction, the unexpected sequences were removed from the
record to adjust the data set. The following chapter employs the remaining record (see colour-
coded circles in Figure 3) in order to descry the impact of the excluded data on the expected
data, as well as the characteristics of the remaining DNA sequence material.
10 Material and methods
10.1 Comparative phylogenetic reconstructions and analyses
Like previously deployed, different phylogenetic analysis methods have been applied
on the data to assure the solidity and reproducibility. Therefore NJ and MP as well as ML
analyses were utilised to compare the phylogenetic reconstructions with those from prior
analysis. Bioinformatics programmes and settings are identical compared to previous
applications.
10.2 Divergence time estimates
Divergence times have alternatively been generated using the Timetree (RelTime-ML)
method (TAMURA et al. 2012). Divergence times for all branching points were calculated resting
upon a ML method based on the JTT (Jones-Taylor-Thornton) matrix-based model (JONES et
al. 1992). This algorithm was developed for larger phylogenetic datasets without assuming a
specific model for lineage rate variation or specification of any clock. The analysis involved
only the 72 amino acid sequences described above, depicting putative duplicated copies among
36 species.
10.3 Sequence analysis
10.3.1 Intra-pair identities
Scores for amino acid identity and similarity was retrieved from SIAS (Sequence
identity and similarity) server. Inter-and intra-tribal and sequences from duplicated pairs were
compared to find evidence for allelic variance or duplicated loci.
10.3.2 Sequence analysis of duplicated gene pairs
Evolver is a collection of programmes belonging to the software package PAML (YANG
1997) designed to reconstruct the evolution of the nucleotide sequence. The evolution of a
Part 3. Done Twice is not Always Better - Duplicated Gene Pairs
112
representative gene or genome of a species compared with its generation time is simulated. To
determine the relationship between DNA and amino acid identity relative to a model of strictly
neutral evolution, simulated pairs of genes were created, also under neutrality. For simulations
dN/dS was set to 1.0, the transition and transversion parameter was set to 3.0, while the codon
frequency matrix was based on tabulated frequencies (ZHANG et al. 2002) from duplicated gene
pairs (see supplementary material S11). Percent identity of DNA and protein sequences were
calculated. Otherwise, the default parameters were used, setting ω to 0.3 (= dN/dS) and κ
(=transition/transversion) to 5.0, as well as a uniform distribution of rate variation among the
codon sites. For all simulated data, percent identity was calculated from both the DNA
sequences and the translated amino acid sequences.
10.3.3 Sequence evolution in duplicated genes
Five tribes holding duplications of species could be detected within the dataset, which
are to be found within the Arabideae, Cochlearieae, Dontostemoneae, Megacarpaeeae and
Microlepidieae. Together 36 gene pairs could be discovered, most likely from different
duplication events.
To test on the gene pairs, PAML’s (Phylogenetic Analysis by Maximum Likelihood)
two models of evolution, 0 and 1 (YANG 1997), were initially tested. Model 0 forces every
branch to be equal length, which implies an evolution at clock-like rates, whereas model 1
leaves the length of the branches unconstrained so that each sequence is free to evolve at their
own rate.
10.3.3.1 Identification of gene regions
The coding (exon 1 and 2) and non-coding parts (promoter and intron) of the duplicated
36 gene pairs were torn apart in their respective component regions to compare the inter- and
intra-paralog arrangements, identities and distinctions.
10.3.4 Genomic sequence blast
Started with the genome of Arabidopsis thaliana, several complete plant genomes have
been sequenced during the last years, whereof a relevant number also belongs to the
Brassicaceae. A certain number of these are publicly forthcoming others are only available via
data bases and cannot be downloaded, not at least due to their immense size, which partly is up
to 10 GB. Therefore miscellaneous genome browser like CoGe (LYONS & FREELING 2008),
TAIR (LAMESCH et al. 2012) and EnsemblGenomes (KERSEY et al. 2014) and workbenches like
Part 3. Done Twice is not Always Better - Duplicated Gene Pairs
113
UGENE v.1.14.0 (OKONECHNIKOV et al. 2012) and CLC Genomics Workbench v.7.0.3
(http://www.clcbio.com) were strongly employed. Own blast pools had to be compiled as the
number of genomes offering blast functions with the respective modulation functions for self-
made data are limited. In the majority of cases only up to a maximum of five Brassicaceae
genomes are available which can often only be searched for known regions or genes and not
against imported data. All species duplicates were individually blasted against each of the
provided genomes in the respective tool.
10.4 Synonymous substitution rates
Analysis of synonymous substitution rates were estimated, which equal the number of
substitutions per synonymous site in a coding sequence. Synonymous substitution are
nucleotide changes that do not alter the amino acid encoded and are therefore assumed to
accumulate in a neutral manner - not under selection - at a constant rate that is similar to the
background mutation rate. Substitutions at synonymous sites, being selectively neutral, should
evolve at a rate similar to the mutation rate (LYNCH & FORCE 2000) and can thus be used to
estimate the age of homolog divergence. Higher Ks values correspond to longer periods of time
since the original duplication event. Therefore a Ks value higher than 1 results from the fact
that a site can change over and over again during a longer evolutionary time. Ka and Ks between
the duplicated gene pairs were estimated by the ML method implemented in PAML (YANG
1997). Afterwards a relative rate test (RRT) was utilised to ω values different from 1.
10.4.1 Relative rate test (Tajima’s D)
This test, also known as Tajima’s D (TAJIMA 1993), is implied in MEGA 5 and tests the
hypothesis whether a clockwise rate, meaning a constant rate of molecular evolution, can be
applied on two samples. Pairs of duplicated genes, each with an outgroup, are built and their
differences in configurations are counted. The RRT uses a likelihood ratio (LR) statistic to test
the null hypothesis. H0 claims that the observed number of sites in both sequences are the same,
irrespective of the model of substitution and the respective rate, meaning that two sequences
evolve at equal rates (MUSE & WEIR 1992).
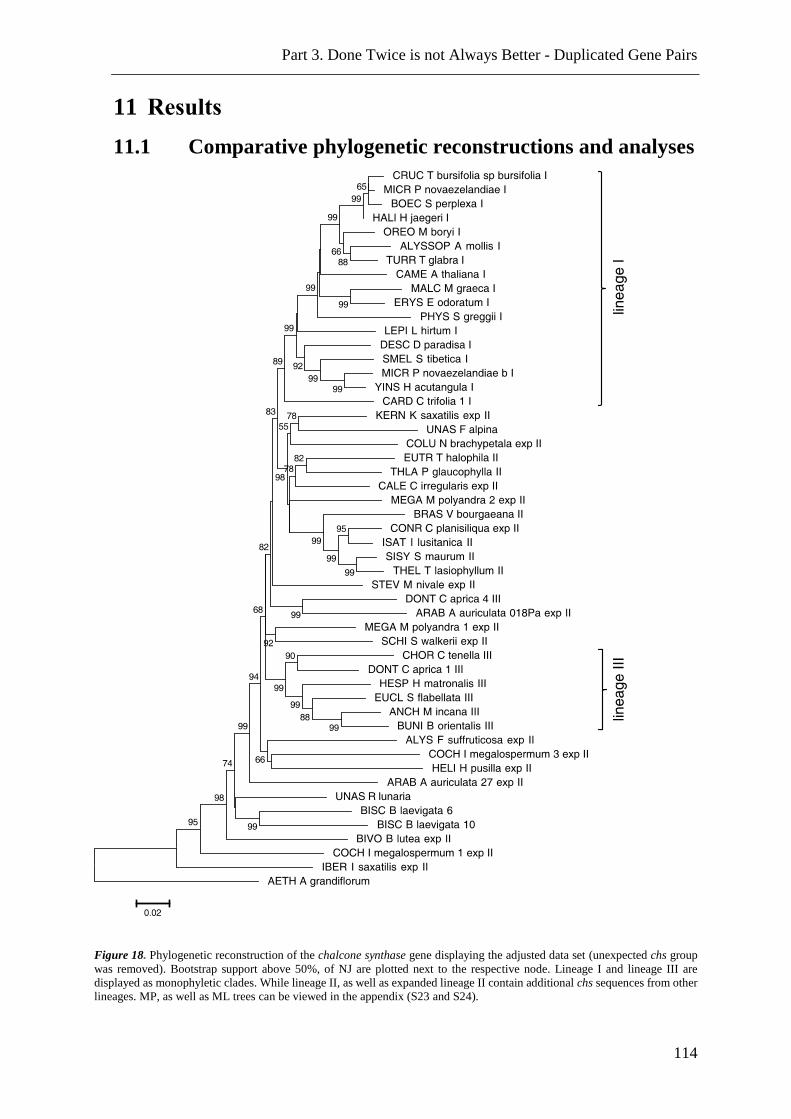
Part 3. Done Twice is not Always Better - Duplicated Gene Pairs
114
11 Results
11.1 Comparative phylogenetic reconstructions and analyses
Figure 18. Phylogenetic reconstruction of the chalcone synthase gene displaying the adjusted data set (unexpected chs group
was removed). Bootstrap support above 50%, of NJ are plotted next to the respective node. Lineage I and lineage III are
displayed as monophyletic clades. While lineage II, as well as expanded lineage II contain additional chs sequences from other
lineages. MP, as well as ML trees can be viewed in the appendix (S23 and S24).
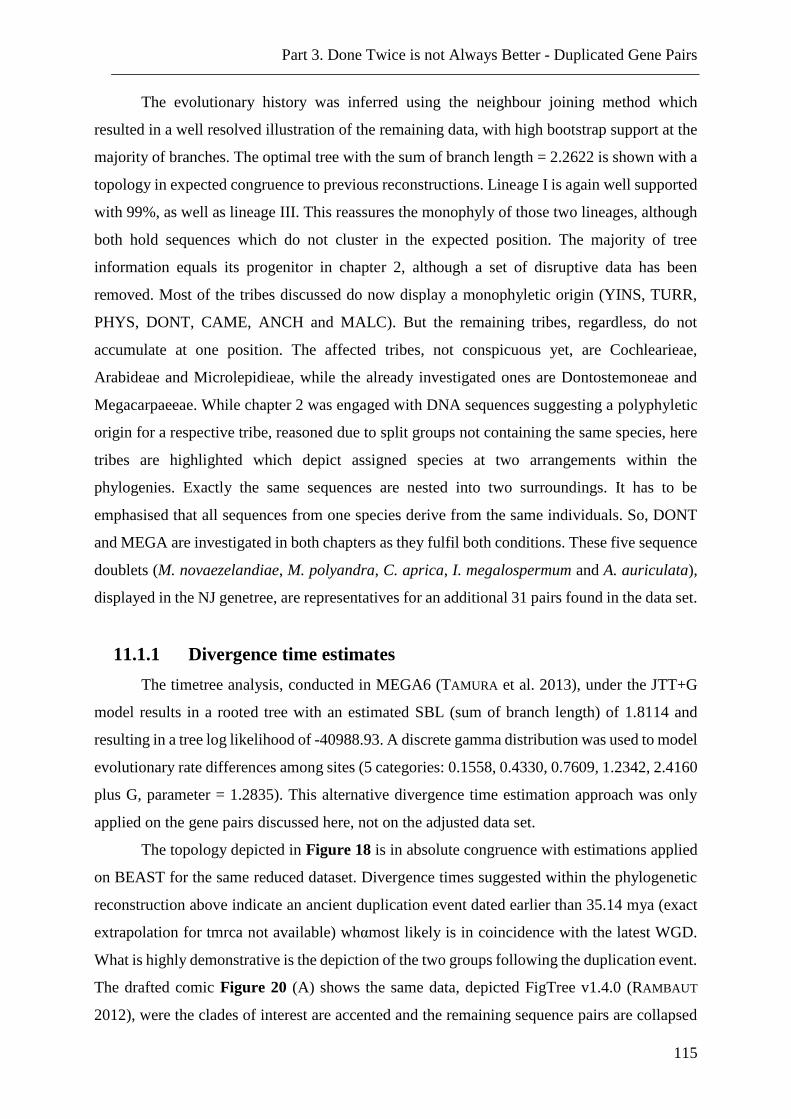
Part 3. Done Twice is not Always Better - Duplicated Gene Pairs
115
The evolutionary history was inferred using the neighbour joining method which
resulted in a well resolved illustration of the remaining data, with high bootstrap support at the
majority of branches. The optimal tree with the sum of branch length = 2.2622 is shown with a
topology in expected congruence to previous reconstructions. Lineage I is again well supported
with 99%, as well as lineage III. This reassures the monophyly of those two lineages, although
both hold sequences which do not cluster in the expected position. The majority of tree
information equals its progenitor in chapter 2, although a set of disruptive data has been
removed. Most of the tribes discussed do now display a monophyletic origin (YINS, TURR,
PHYS, DONT, CAME, ANCH and MALC). But the remaining tribes, regardless, do not
accumulate at one position. The affected tribes, not conspicuous yet, are Cochlearieae,
Arabideae and Microlepidieae, while the already investigated ones are Dontostemoneae and
Megacarpaeeae. While chapter 2 was engaged with DNA sequences suggesting a polyphyletic
origin for a respective tribe, reasoned due to split groups not containing the same species, here
tribes are highlighted which depict assigned species at two arrangements within the
phylogenies. Exactly the same sequences are nested into two surroundings. It has to be
emphasised that all sequences from one species derive from the same individuals. So, DONT
and MEGA are investigated in both chapters as they fulfil both conditions. These five sequence
doublets (M. novaezelandiae, M. polyandra, C. aprica, I. megalospermum and A. auriculata),
displayed in the NJ genetree, are representatives for an additional 31 pairs found in the data set.
11.1.1 Divergence time estimates
The timetree analysis, conducted in MEGA6 (TAMURA et al. 2013), under the JTT+G
model results in a rooted tree with an estimated SBL (sum of branch length) of 1.8114 and
resulting in a tree log likelihood of -40988.93. A discrete gamma distribution was used to model
evolutionary rate differences among sites (5 categories: 0.1558, 0.4330, 0.7609, 1.2342, 2.4160
plus G, parameter = 1.2835). This alternative divergence time estimation approach was only
applied on the gene pairs discussed here, not on the adjusted data set.
The topology depicted in Figure 18 is in absolute congruence with estimations applied
on BEAST for the same reduced dataset. Divergence times suggested within the phylogenetic
reconstruction above indicate an ancient duplication event dated earlier than 35.14 mya (exact
extrapolation for tmrca not available) whαmost likely is in coincidence with the latest WGD.
What is highly demonstrative is the depiction of the two groups following the duplication event.
The drafted comic Figure 20 (A) shows the same data, depicted FigTree v1.4.0 (RAMBAUT
2012), were the clades of interest are accented and the remaining sequence pairs are collapsed
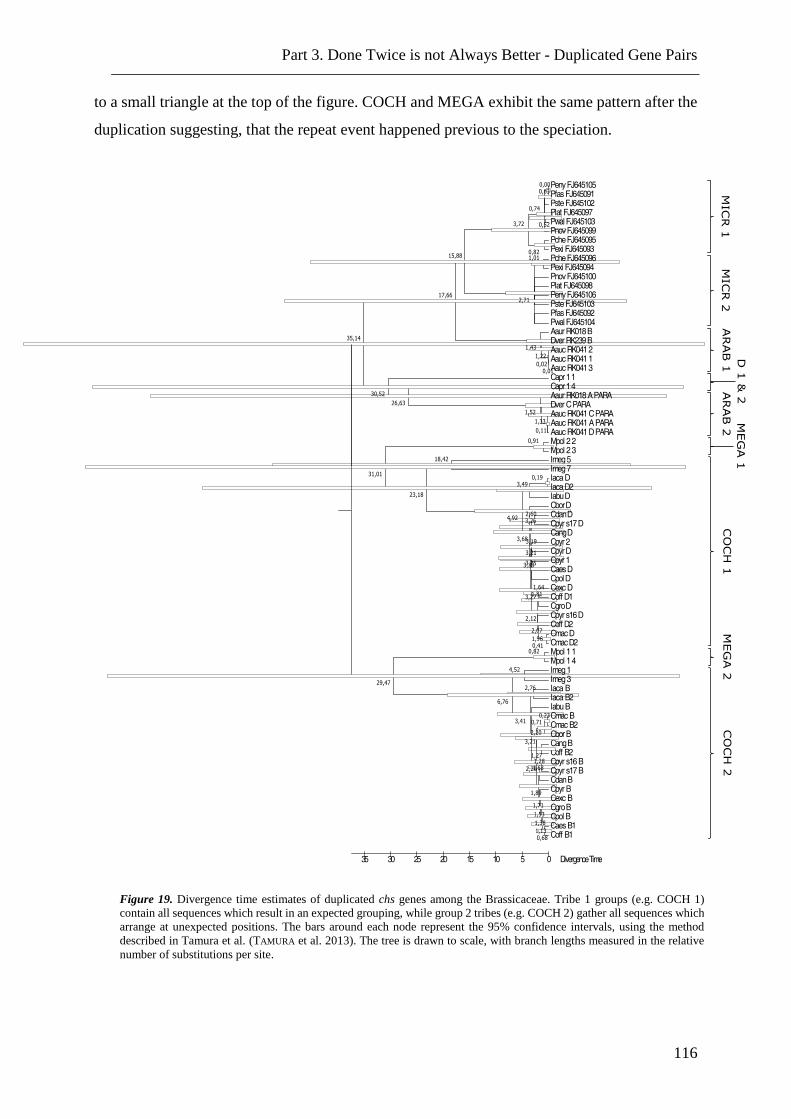
Part 3. Done Twice is not Always Better - Duplicated Gene Pairs
116
to a small triangle at the top of the figure. COCH and MEGA exhibit the same pattern after the
duplication suggesting, that the repeat event happened previous to the speciation.
Figure 19. Divergence time estimates of duplicated chs genes among the Brassicaceae. Tribe 1 groups (e.g. COCH 1)
contain all sequences which result in an expected grouping, while group 2 tribes (e.g. COCH 2) gather all sequences which
arrange at unexpected positions. The bars around each node represent the 95% confidence intervals, using the method
described in Tamura et al. (TAMURA et al. 2013). The tree is drawn to scale, with branch lengths measured in the relative
number of substitutions per site.
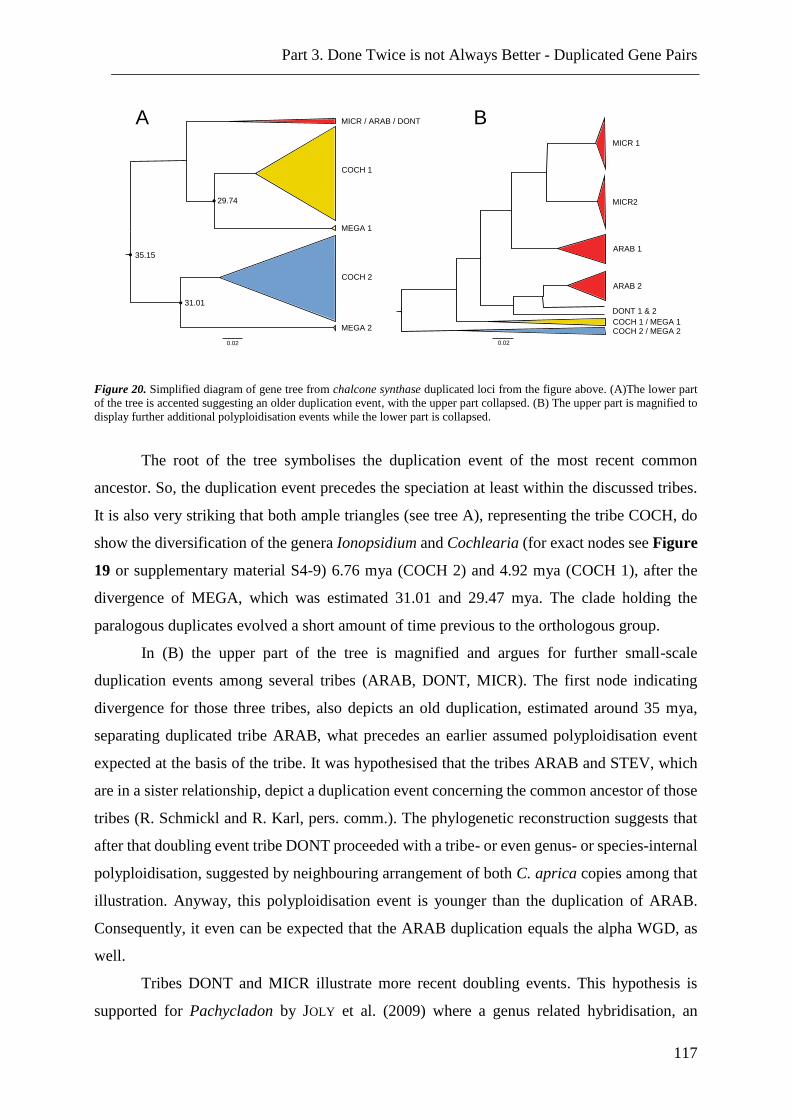
Part 3. Done Twice is not Always Better - Duplicated Gene Pairs
117
Figure 20. Simplified diagram of gene tree from chalcone synthase duplicated loci from the figure above. (A)The lower part
of the tree is accented suggesting an older duplication event, with the upper part collapsed. (B) The upper part is magnified to
display further additional polyploidisation events while the lower part is collapsed.
The root of the tree symbolises the duplication event of the most recent common
ancestor. So, the duplication event precedes the speciation at least within the discussed tribes.
It is also very striking that both ample triangles (see tree A), representing the tribe COCH, do
show the diversification of the genera Ionopsidium and Cochlearia (for exact nodes see Figure
19 or supplementary material S4-9) 6.76 mya (COCH 2) and 4.92 mya (COCH 1), after the
divergence of MEGA, which was estimated 31.01 and 29.47 mya. The clade holding the
paralogous duplicates evolved a short amount of time previous to the orthologous group.
In (B) the upper part of the tree is magnified and argues for further small-scale
duplication events among several tribes (ARAB, DONT, MICR). The first node indicating
divergence for those three tribes, also depicts an old duplication, estimated around 35 mya,
separating duplicated tribe ARAB, what precedes an earlier assumed polyploidisation event
expected at the basis of the tribe. It was hypothesised that the tribes ARAB and STEV, which
are in a sister relationship, depict a duplication event concerning the common ancestor of those
tribes (R. Schmickl and R. Karl, pers. comm.). The phylogenetic reconstruction suggests that
after that doubling event tribe DONT proceeded with a tribe- or even genus- or species-internal
polyploidisation, suggested by neighbouring arrangement of both C. aprica copies among that
illustration. Anyway, this polyploidisation event is younger than the duplication of ARAB.
Consequently, it even can be expected that the ARAB duplication equals the alpha WGD, as
well.
Tribes DONT and MICR illustrate more recent doubling events. This hypothesis is
supported for Pachycladon by JOLY et al. (2009) where a genus related hybridisation, an
MICR / ARAB / DONT
0.02 0.02
A B
COCH 1
MEGA 1
COCH 2
MEGA 2
29.74
31.01
MICR 1
MICR2
ARAB 1
ARAB 2
DONT 1 & 2
COCH 1 / MEGA 1COCH 2 / MEGA 2
35.15
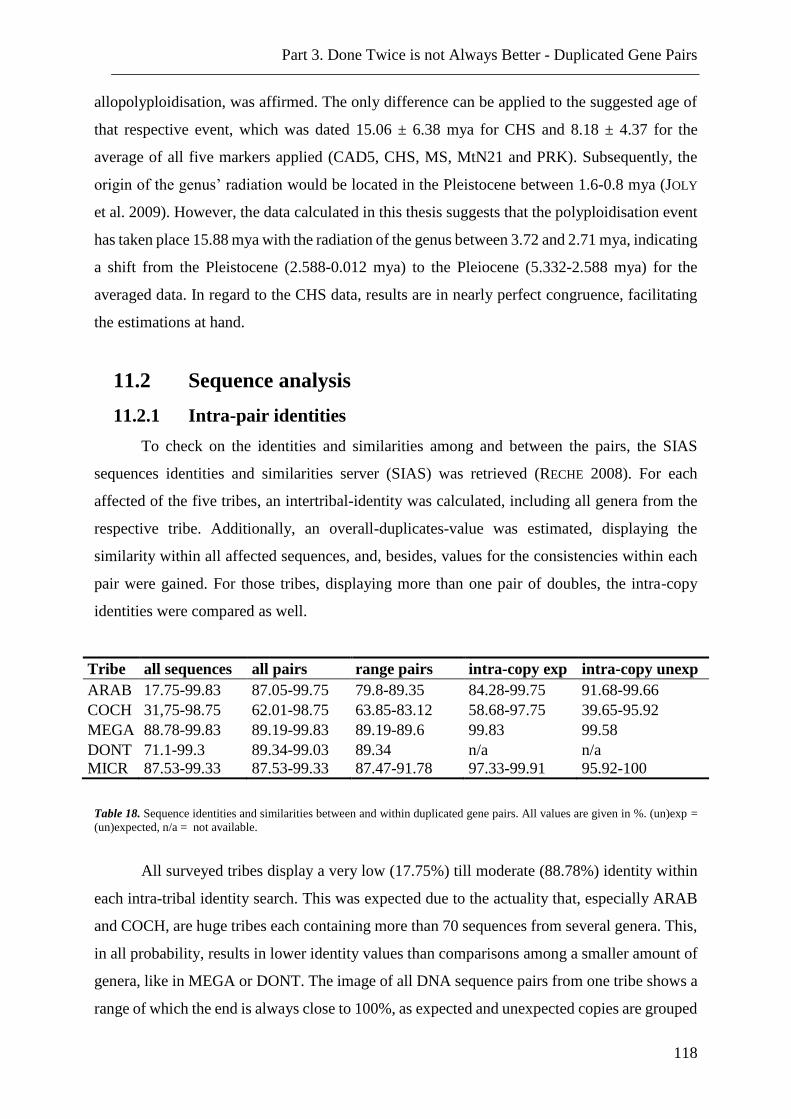
Part 3. Done Twice is not Always Better - Duplicated Gene Pairs
118
allopolyploidisation, was affirmed. The only difference can be applied to the suggested age of
that respective event, which was dated 15.06 ± 6.38 mya for CHS and 8.18 ± 4.37 for the
average of all five markers applied (CAD5, CHS, MS, MtN21 and PRK). Subsequently, the
origin of the genus’ radiation would be located in the Pleistocene between 1.6-0.8 mya (JOLY
et al. 2009). However, the data calculated in this thesis suggests that the polyploidisation event
has taken place 15.88 mya with the radiation of the genus between 3.72 and 2.71 mya, indicating
a shift from the Pleistocene (2.588-0.012 mya) to the Pleiocene (5.332-2.588 mya) for the
averaged data. In regard to the CHS data, results are in nearly perfect congruence, facilitating
the estimations at hand.
11.2 Sequence analysis
11.2.1 Intra-pair identities
To check on the identities and similarities among and between the pairs, the SIAS
sequences identities and similarities server (SIAS) was retrieved (RECHE 2008). For each
affected of the five tribes, an intertribal-identity was calculated, including all genera from the
respective tribe. Additionally, an overall-duplicates-value was estimated, displaying the
similarity within all affected sequences, and, besides, values for the consistencies within each
pair were gained. For those tribes, displaying more than one pair of doubles, the intra-copy
identities were compared as well.
Tribe all sequences all pairs range pairs intra-copy exp intra-copy unexp
ARAB 17.75-99.83 87.05-99.75 79.8-89.35 84.28-99.75 91.68-99.66
COCH 31,75-98.75 62.01-98.75 63.85-83.12 58.68-97.75 39.65-95.92
MEGA 88.78-99.83 89.19-99.83 89.19-89.6 99.83 99.58
DONT 71.1-99.3 89.34-99.03 89.34 n/a n/a
MICR 87.53-99.33 87.53-99.33 87.47-91.78 97.33-99.91 95.92-100
Table 18. Sequence identities and similarities between and within duplicated gene pairs. All values are given in %. (un)exp =
(un)expected, n/a = not available.
All surveyed tribes display a very low (17.75%) till moderate (88.78%) identity within
each intra-tribal identity search. This was expected due to the actuality that, especially ARAB
and COCH, are huge tribes each containing more than 70 sequences from several genera. This,
in all probability, results in lower identity values than comparisons among a smaller amount of
genera, like in MEGA or DONT. The image of all DNA sequence pairs from one tribe shows a
range of which the end is always close to 100%, as expected and unexpected copies are grouped
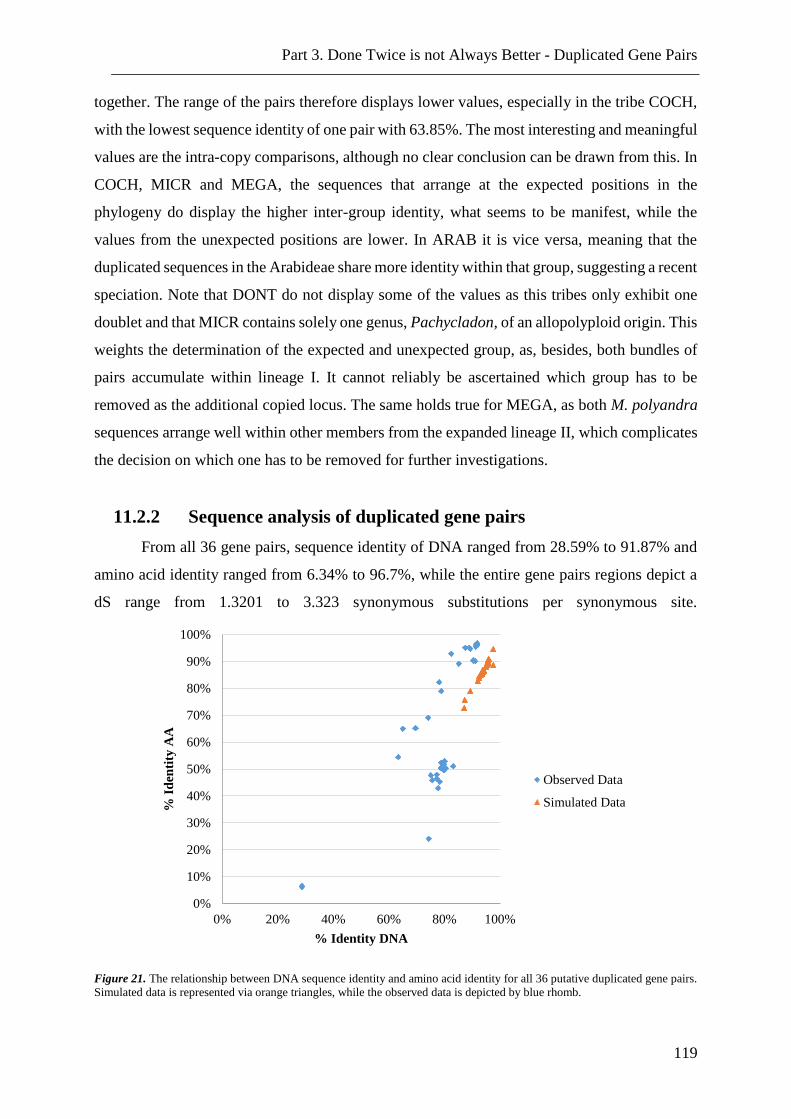
Part 3. Done Twice is not Always Better - Duplicated Gene Pairs
119
together. The range of the pairs therefore displays lower values, especially in the tribe COCH,
with the lowest sequence identity of one pair with 63.85%. The most interesting and meaningful
values are the intra-copy comparisons, although no clear conclusion can be drawn from this. In
COCH, MICR and MEGA, the sequences that arrange at the expected positions in the
phylogeny do display the higher inter-group identity, what seems to be manifest, while the
values from the unexpected positions are lower. In ARAB it is vice versa, meaning that the
duplicated sequences in the Arabideae share more identity within that group, suggesting a recent
speciation. Note that DONT do not display some of the values as this tribes only exhibit one
doublet and that MICR contains solely one genus, Pachycladon, of an allopolyploid origin. This
weights the determination of the expected and unexpected group, as, besides, both bundles of
pairs accumulate within lineage I. It cannot reliably be ascertained which group has to be
removed as the additional copied locus. The same holds true for MEGA, as both M. polyandra
sequences arrange well within other members from the expanded lineage II, which complicates
the decision on which one has to be removed for further investigations.
11.2.2 Sequence analysis of duplicated gene pairs
From all 36 gene pairs, sequence identity of DNA ranged from 28.59% to 91.87% and
amino acid identity ranged from 6.34% to 96.7%, while the entire gene pairs regions depict a
dS range from 1.3201 to 3.323 synonymous substitutions per synonymous site.
Figure 21. The relationship between DNA sequence identity and amino acid identity for all 36 putative duplicated gene pairs.
Simulated data is represented via orange triangles, while the observed data is depicted by blue rhomb.
0%
10%
20%
30%
40%
50%
60%
70%
80%
90%
100%
0% 20% 40% 60% 80% 100%
% I
den
tity
AA
% Identity DNA
Observed Data
Simulated Data
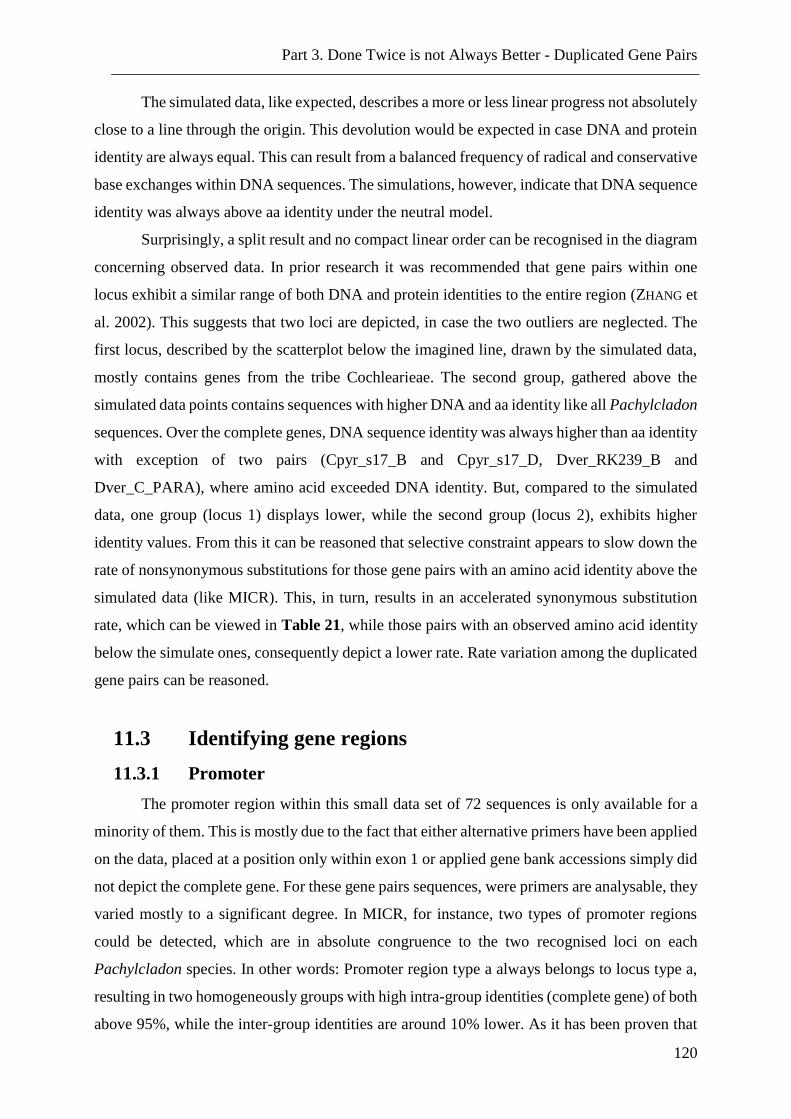
Part 3. Done Twice is not Always Better - Duplicated Gene Pairs
120
The simulated data, like expected, describes a more or less linear progress not absolutely
close to a line through the origin. This devolution would be expected in case DNA and protein
identity are always equal. This can result from a balanced frequency of radical and conservative
base exchanges within DNA sequences. The simulations, however, indicate that DNA sequence
identity was always above aa identity under the neutral model.
Surprisingly, a split result and no compact linear order can be recognised in the diagram
concerning observed data. In prior research it was recommended that gene pairs within one
locus exhibit a similar range of both DNA and protein identities to the entire region (ZHANG et
al. 2002). This suggests that two loci are depicted, in case the two outliers are neglected. The
first locus, described by the scatterplot below the imagined line, drawn by the simulated data,
mostly contains genes from the tribe Cochlearieae. The second group, gathered above the
simulated data points contains sequences with higher DNA and aa identity like all Pachylcladon
sequences. Over the complete genes, DNA sequence identity was always higher than aa identity
with exception of two pairs (Cpyr_s17_B and Cpyr_s17_D, Dver_RK239_B and
Dver_C_PARA), where amino acid exceeded DNA identity. But, compared to the simulated
data, one group (locus 1) displays lower, while the second group (locus 2), exhibits higher
identity values. From this it can be reasoned that selective constraint appears to slow down the
rate of nonsynonymous substitutions for those gene pairs with an amino acid identity above the
simulated data (like MICR). This, in turn, results in an accelerated synonymous substitution
rate, which can be viewed in Table 21, while those pairs with an observed amino acid identity
below the simulate ones, consequently depict a lower rate. Rate variation among the duplicated
gene pairs can be reasoned.
11.3 Identifying gene regions
11.3.1 Promoter
The promoter region within this small data set of 72 sequences is only available for a
minority of them. This is mostly due to the fact that either alternative primers have been applied
on the data, placed at a position only within exon 1 or applied gene bank accessions simply did
not depict the complete gene. For these gene pairs sequences, were primers are analysable, they
varied mostly to a significant degree. In MICR, for instance, two types of promoter regions
could be detected, which are in absolute congruence to the two recognised loci on each
Pachylcladon species. In other words: Promoter region type a always belongs to locus type a,
resulting in two homogeneously groups with high intra-group identities (complete gene) of both
above 95%, while the inter-group identities are around 10% lower. As it has been proven that
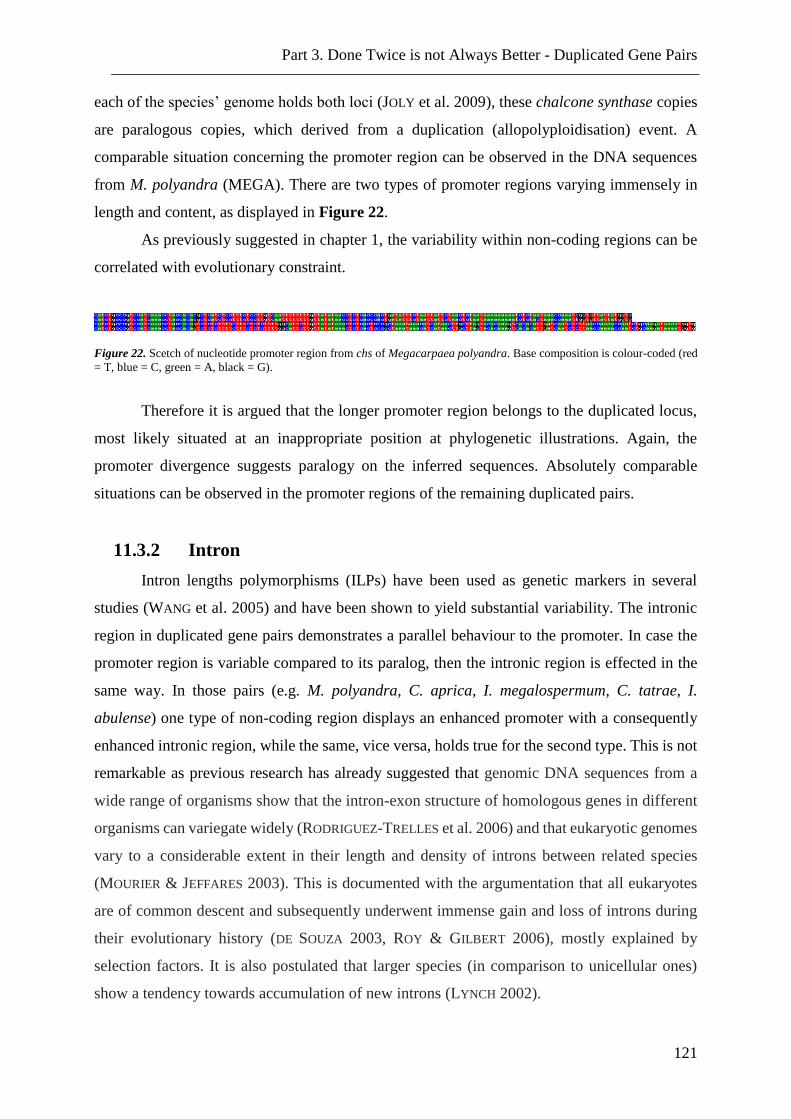
Part 3. Done Twice is not Always Better - Duplicated Gene Pairs
121
each of the species’ genome holds both loci (JOLY et al. 2009), these chalcone synthase copies
are paralogous copies, which derived from a duplication (allopolyploidisation) event. A
comparable situation concerning the promoter region can be observed in the DNA sequences
from M. polyandra (MEGA). There are two types of promoter regions varying immensely in
length and content, as displayed in Figure 22.
As previously suggested in chapter 1, the variability within non-coding regions can be
correlated with evolutionary constraint.
Figure 22. Scetch of nucleotide promoter region from chs of Megacarpaea polyandra. Base composition is colour-coded (red
= T, blue = C, green = A, black = G).
Therefore it is argued that the longer promoter region belongs to the duplicated locus,
most likely situated at an inappropriate position at phylogenetic illustrations. Again, the
promoter divergence suggests paralogy on the inferred sequences. Absolutely comparable
situations can be observed in the promoter regions of the remaining duplicated pairs.
11.3.2 Intron
Intron lengths polymorphisms (ILPs) have been used as genetic markers in several
studies (WANG et al. 2005) and have been shown to yield substantial variability. The intronic
region in duplicated gene pairs demonstrates a parallel behaviour to the promoter. In case the
promoter region is variable compared to its paralog, then the intronic region is effected in the
same way. In those pairs (e.g. M. polyandra, C. aprica, I. megalospermum, C. tatrae, I.
abulense) one type of non-coding region displays an enhanced promoter with a consequently
enhanced intronic region, while the same, vice versa, holds true for the second type. This is not
remarkable as previous research has already suggested that genomic DNA sequences from a
wide range of organisms show that the intron-exon structure of homologous genes in different
organisms can variegate widely (RODRIGUEZ-TRELLES et al. 2006) and that eukaryotic genomes
vary to a considerable extent in their length and density of introns between related species
(MOURIER & JEFFARES 2003). This is documented with the argumentation that all eukaryotes
are of common descent and subsequently underwent immense gain and loss of introns during
their evolutionary history (DE SOUZA 2003, ROY & GILBERT 2006), mostly explained by
selection factors. It is also postulated that larger species (in comparison to unicellular ones)
show a tendency towards accumulation of new introns (LYNCH 2002).
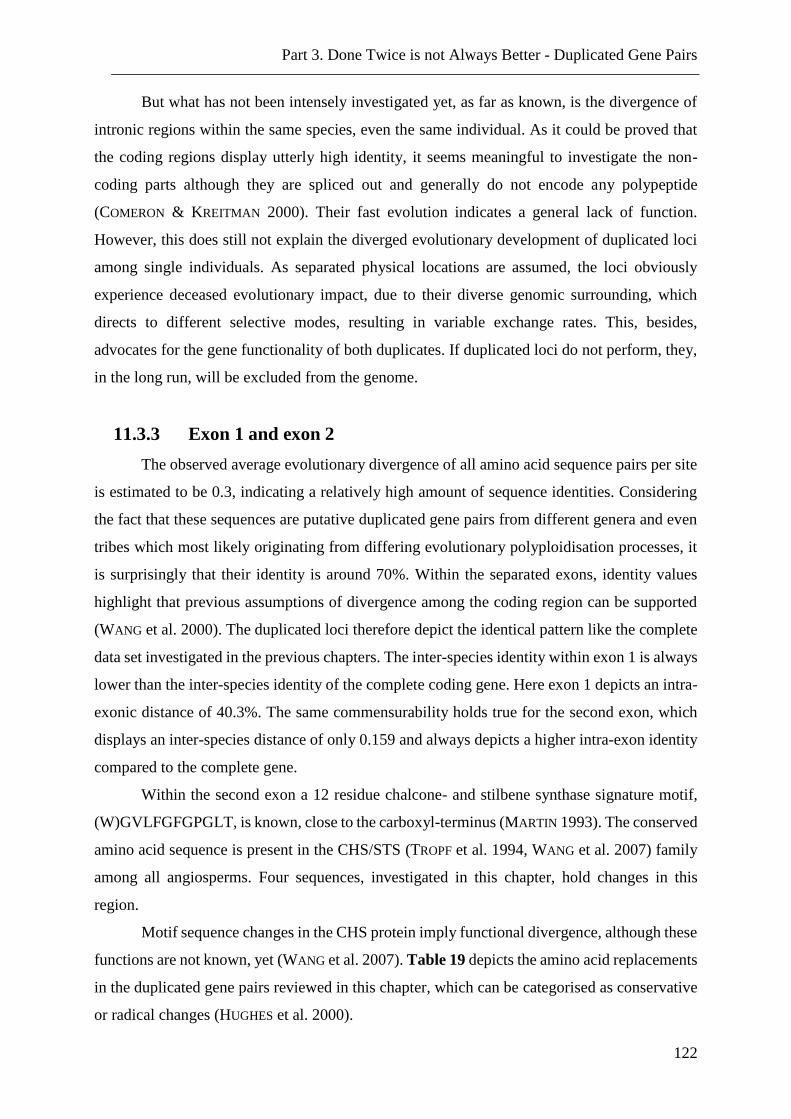
Part 3. Done Twice is not Always Better - Duplicated Gene Pairs
122
But what has not been intensely investigated yet, as far as known, is the divergence of
intronic regions within the same species, even the same individual. As it could be proved that
the coding regions display utterly high identity, it seems meaningful to investigate the non-
coding parts although they are spliced out and generally do not encode any polypeptide
(COMERON & KREITMAN 2000). Their fast evolution indicates a general lack of function.
However, this does still not explain the diverged evolutionary development of duplicated loci
among single individuals. As separated physical locations are assumed, the loci obviously
experience deceased evolutionary impact, due to their diverse genomic surrounding, which
directs to different selective modes, resulting in variable exchange rates. This, besides,
advocates for the gene functionality of both duplicates. If duplicated loci do not perform, they,
in the long run, will be excluded from the genome.
11.3.3 Exon 1 and exon 2
The observed average evolutionary divergence of all amino acid sequence pairs per site
is estimated to be 0.3, indicating a relatively high amount of sequence identities. Considering
the fact that these sequences are putative duplicated gene pairs from different genera and even
tribes which most likely originating from differing evolutionary polyploidisation processes, it
is surprisingly that their identity is around 70%. Within the separated exons, identity values
highlight that previous assumptions of divergence among the coding region can be supported
(WANG et al. 2000). The duplicated loci therefore depict the identical pattern like the complete
data set investigated in the previous chapters. The inter-species identity within exon 1 is always
lower than the inter-species identity of the complete coding gene. Here exon 1 depicts an intra-
exonic distance of 40.3%. The same commensurability holds true for the second exon, which
displays an inter-species distance of only 0.159 and always depicts a higher intra-exon identity
compared to the complete gene.
Within the second exon a 12 residue chalcone- and stilbene synthase signature motif,
(W)GVLFGFGPGLT, is known, close to the carboxyl-terminus (MARTIN 1993). The conserved
amino acid sequence is present in the CHS/STS (TROPF et al. 1994, WANG et al. 2007) family
among all angiosperms. Four sequences, investigated in this chapter, hold changes in this
region.
Motif sequence changes in the CHS protein imply functional divergence, although these
functions are not known, yet (WANG et al. 2007). Table 19 depicts the amino acid replacements
in the duplicated gene pairs reviewed in this chapter, which can be categorised as conservative
or radical changes (HUGHES et al. 2000).
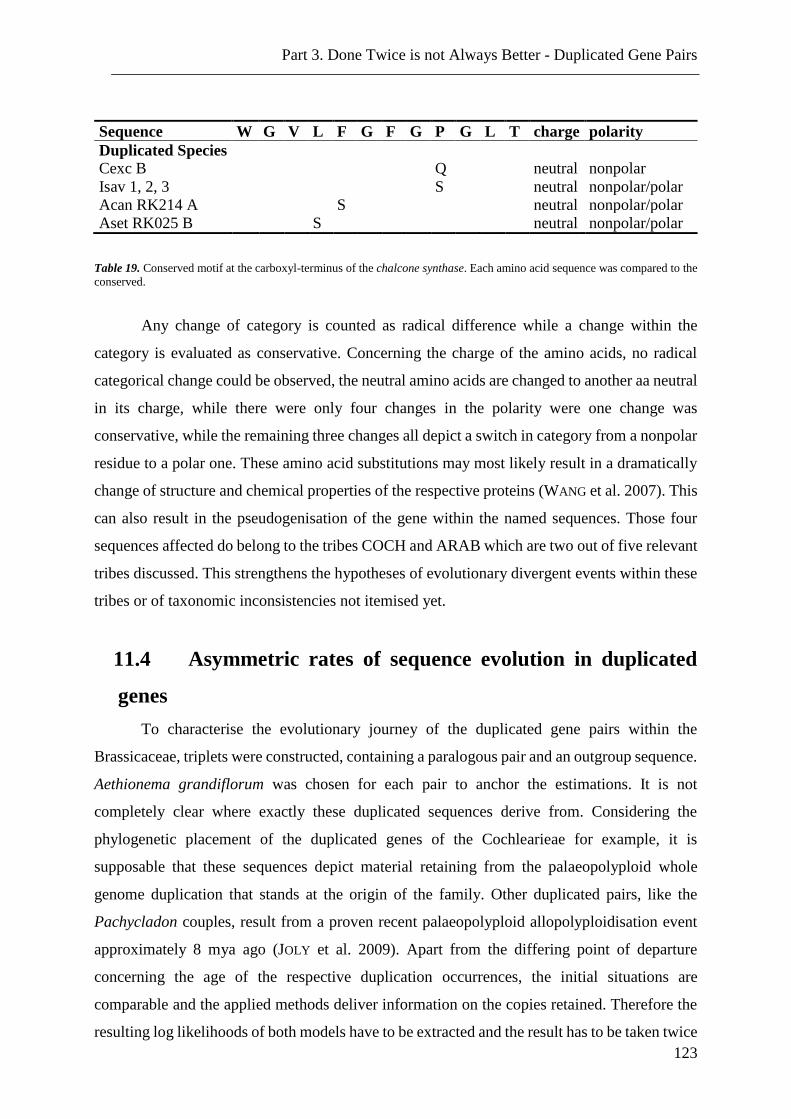
Part 3. Done Twice is not Always Better - Duplicated Gene Pairs
123
Sequence W G V L F G F G P G L T charge polarity
Duplicated Species
Cexc B Q neutral nonpolar
Isav 1, 2, 3 S neutral nonpolar/polar
Acan RK214 A S neutral nonpolar/polar
Aset RK025 B S neutral nonpolar/polar
Table 19. Conserved motif at the carboxyl-terminus of the chalcone synthase. Each amino acid sequence was compared to the
conserved.
Any change of category is counted as radical difference while a change within the
category is evaluated as conservative. Concerning the charge of the amino acids, no radical
categorical change could be observed, the neutral amino acids are changed to another aa neutral
in its charge, while there were only four changes in the polarity were one change was
conservative, while the remaining three changes all depict a switch in category from a nonpolar
residue to a polar one. These amino acid substitutions may most likely result in a dramatically
change of structure and chemical properties of the respective proteins (WANG et al. 2007). This
can also result in the pseudogenisation of the gene within the named sequences. Those four
sequences affected do belong to the tribes COCH and ARAB which are two out of five relevant
tribes discussed. This strengthens the hypotheses of evolutionary divergent events within these
tribes or of taxonomic inconsistencies not itemised yet.
11.4 Asymmetric rates of sequence evolution in duplicated
genes
To characterise the evolutionary journey of the duplicated gene pairs within the
Brassicaceae, triplets were constructed, containing a paralogous pair and an outgroup sequence.
Aethionema grandiflorum was chosen for each pair to anchor the estimations. It is not
completely clear where exactly these duplicated sequences derive from. Considering the
phylogenetic placement of the duplicated genes of the Cochlearieae for example, it is
supposable that these sequences depict material retaining from the palaeopolyploid whole
genome duplication that stands at the origin of the family. Other duplicated pairs, like the
Pachycladon couples, result from a proven recent palaeopolyploid allopolyploidisation event
approximately 8 mya ago (JOLY et al. 2009). Apart from the differing point of departure
concerning the age of the respective duplication occurrences, the initial situations are
comparable and the applied methods deliver information on the copies retained. Therefore the
resulting log likelihoods of both models have to be extracted and the result has to be taken twice
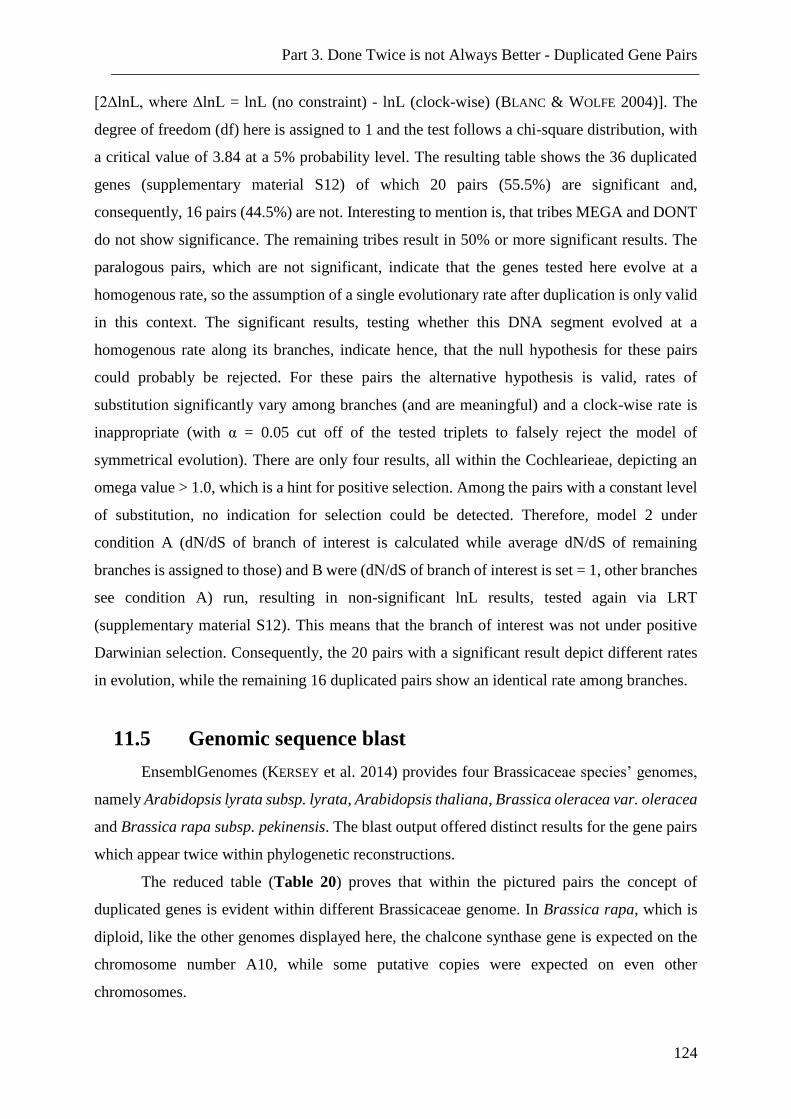
Part 3. Done Twice is not Always Better - Duplicated Gene Pairs
124
[2∆lnL, where ∆lnL = lnL (no constraint) - lnL (clock-wise) (BLANC & WOLFE 2004)]. The
degree of freedom (df) here is assigned to 1 and the test follows a chi-square distribution, with
a critical value of 3.84 at a 5% probability level. The resulting table shows the 36 duplicated
genes (supplementary material S12) of which 20 pairs (55.5%) are significant and,
consequently, 16 pairs (44.5%) are not. Interesting to mention is, that tribes MEGA and DONT
do not show significance. The remaining tribes result in 50% or more significant results. The
paralogous pairs, which are not significant, indicate that the genes tested here evolve at a
homogenous rate, so the assumption of a single evolutionary rate after duplication is only valid
in this context. The significant results, testing whether this DNA segment evolved at a
homogenous rate along its branches, indicate hence, that the null hypothesis for these pairs
could probably be rejected. For these pairs the alternative hypothesis is valid, rates of
substitution significantly vary among branches (and are meaningful) and a clock-wise rate is
inappropriate (with α = 0.05 cut off of the tested triplets to falsely reject the model of
symmetrical evolution). There are only four results, all within the Cochlearieae, depicting an
omega value > 1.0, which is a hint for positive selection. Among the pairs with a constant level
of substitution, no indication for selection could be detected. Therefore, model 2 under
condition A (dN/dS of branch of interest is calculated while average dN/dS of remaining
branches is assigned to those) and B were (dN/dS of branch of interest is set = 1, other branches
see condition A) run, resulting in non-significant lnL results, tested again via LRT
(supplementary material S12). This means that the branch of interest was not under positive
Darwinian selection. Consequently, the 20 pairs with a significant result depict different rates
in evolution, while the remaining 16 duplicated pairs show an identical rate among branches.
11.5 Genomic sequence blast
EnsemblGenomes (KERSEY et al. 2014) provides four Brassicaceae species’ genomes,
namely Arabidopsis lyrata subsp. lyrata, Arabidopsis thaliana, Brassica oleracea var. oleracea
and Brassica rapa subsp. pekinensis. The blast output offered distinct results for the gene pairs
which appear twice within phylogenetic reconstructions.
The reduced table (Table 20) proves that within the pictured pairs the concept of
duplicated genes is evident within different Brassicaceae genome. In Brassica rapa, which is
diploid, like the other genomes displayed here, the chalcone synthase gene is expected on the
chromosome number A10, while some putative copies were expected on even other
chromosomes.
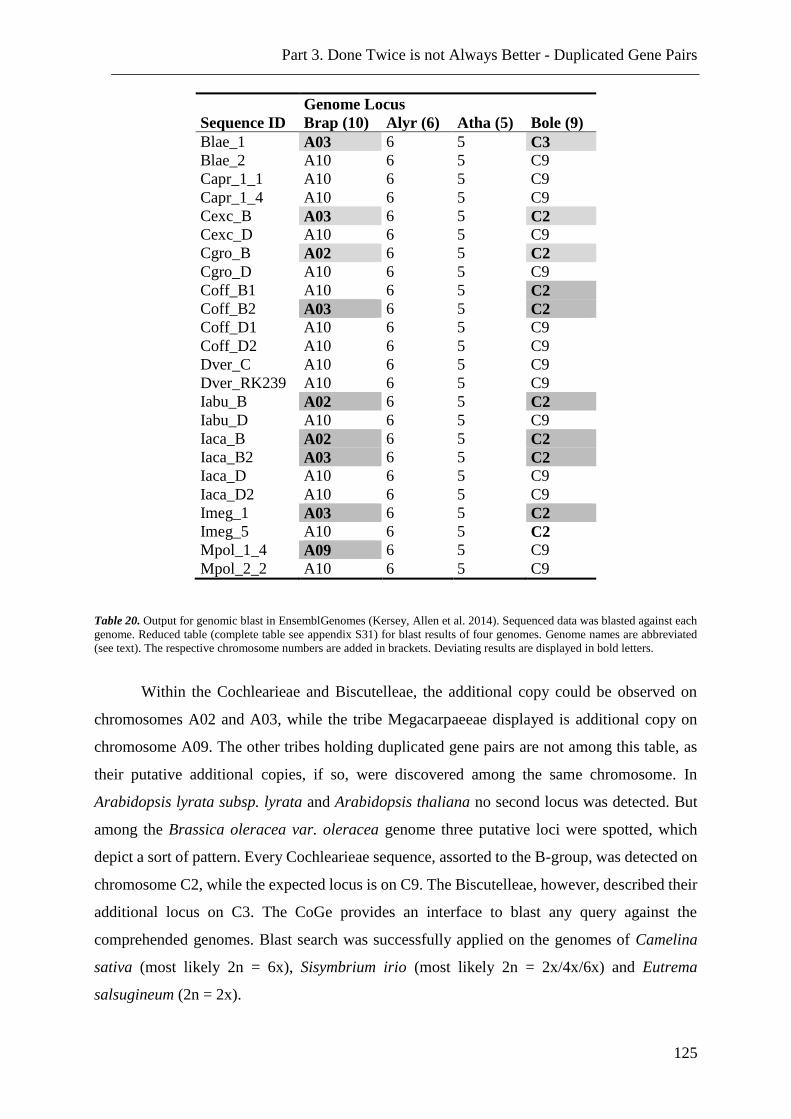
Part 3. Done Twice is not Always Better - Duplicated Gene Pairs
125
Genome Locus
Sequence ID Brap (10) Alyr (6) Atha (5) Bole (9)
Blae_1 A03 6 5 C3
Blae_2 A10 6 5 C9
Capr_1_1 A10 6 5 C9
Capr_1_4 A10 6 5 C9
Cexc_B A03 6 5 C2
Cexc_D A10 6 5 C9
Cgro_B A02 6 5 C2
Cgro_D A10 6 5 C9
Coff_B1 A10 6 5 C2
Coff_B2 A03 6 5 C2
Coff_D1 A10 6 5 C9
Coff_D2 A10 6 5 C9
Dver_C A10 6 5 C9
Dver_RK239 A10 6 5 C9
Iabu_B A02 6 5 C2
Iabu_D A10 6 5 C9
Iaca_B A02 6 5 C2
Iaca_B2 A03 6 5 C2
Iaca_D A10 6 5 C9
Iaca_D2 A10 6 5 C9
Imeg_1 A03 6 5 C2
Imeg_5 A10 6 5 C2
Mpol_1_4 A09 6 5 C9
Mpol_2_2 A10 6 5 C9
Table 20. Output for genomic blast in EnsemblGenomes (Kersey, Allen et al. 2014). Sequenced data was blasted against each
genome. Reduced table (complete table see appendix S31) for blast results of four genomes. Genome names are abbreviated
(see text). The respective chromosome numbers are added in brackets. Deviating results are displayed in bold letters.
Within the Cochlearieae and Biscutelleae, the additional copy could be observed on
chromosomes A02 and A03, while the tribe Megacarpaeeae displayed is additional copy on
chromosome A09. The other tribes holding duplicated gene pairs are not among this table, as
their putative additional copies, if so, were discovered among the same chromosome. In
Arabidopsis lyrata subsp. lyrata and Arabidopsis thaliana no second locus was detected. But
among the Brassica oleracea var. oleracea genome three putative loci were spotted, which
depict a sort of pattern. Every Cochlearieae sequence, assorted to the B-group, was detected on
chromosome C2, while the expected locus is on C9. The Biscutelleae, however, described their
additional locus on C3. The CoGe provides an interface to blast any query against the
comprehended genomes. Blast search was successfully applied on the genomes of Camelina
sativa (most likely 2n = 6x), Sisymbrium irio (most likely 2n = 2x/4x/6x) and Eutrema
salsugineum (2n = 2x).
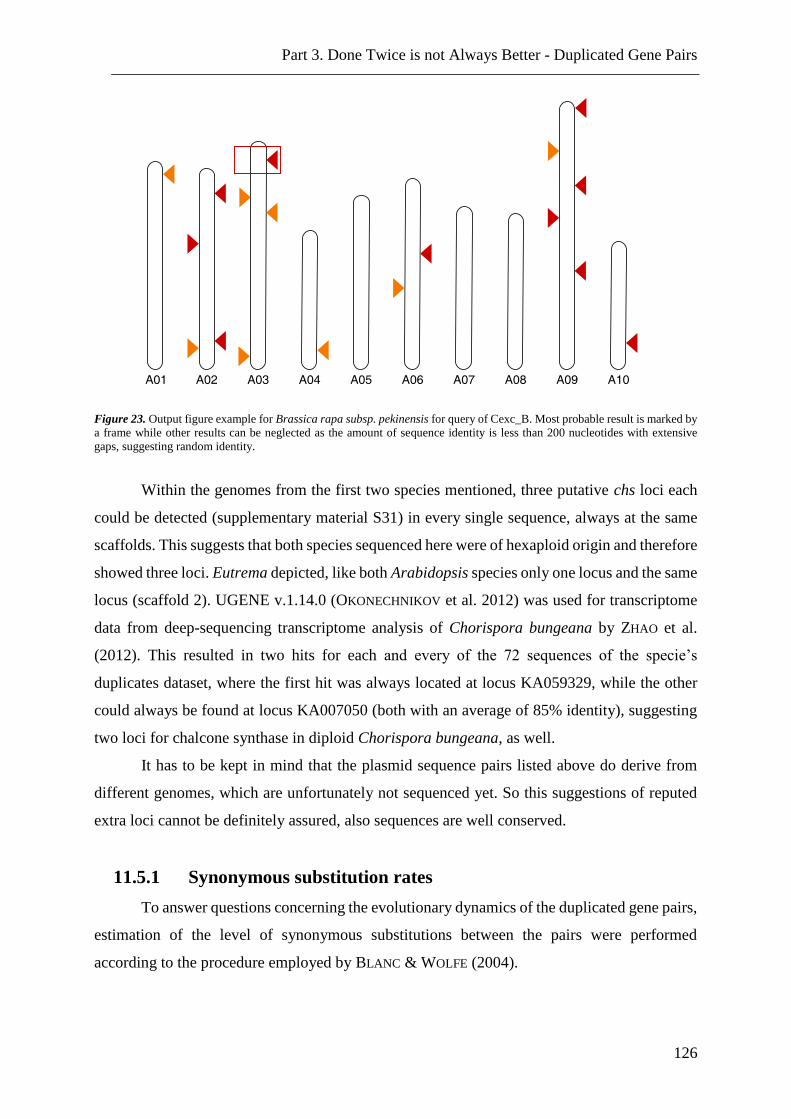
Part 3. Done Twice is not Always Better - Duplicated Gene Pairs
126
Figure 23. Output figure example for Brassica rapa subsp. pekinensis for query of Cexc_B. Most probable result is marked by
a frame while other results can be neglected as the amount of sequence identity is less than 200 nucleotides with extensive
gaps, suggesting random identity.
Within the genomes from the first two species mentioned, three putative chs loci each
could be detected (supplementary material S31) in every single sequence, always at the same
scaffolds. This suggests that both species sequenced here were of hexaploid origin and therefore
showed three loci. Eutrema depicted, like both Arabidopsis species only one locus and the same
locus (scaffold 2). UGENE v.1.14.0 (OKONECHNIKOV et al. 2012) was used for transcriptome
data from deep-sequencing transcriptome analysis of Chorispora bungeana by ZHAO et al.
(2012). This resulted in two hits for each and every of the 72 sequences of the specie’s
duplicates dataset, where the first hit was always located at locus KA059329, while the other
could always be found at locus KA007050 (both with an average of 85% identity), suggesting
two loci for chalcone synthase in diploid Chorispora bungeana, as well.
It has to be kept in mind that the plasmid sequence pairs listed above do derive from
different genomes, which are unfortunately not sequenced yet. So this suggestions of reputed
extra loci cannot be definitely assured, also sequences are well conserved.
11.5.1 Synonymous substitution rates
To answer questions concerning the evolutionary dynamics of the duplicated gene pairs,
estimation of the level of synonymous substitutions between the pairs were performed
according to the procedure employed by BLANC & WOLFE (2004).
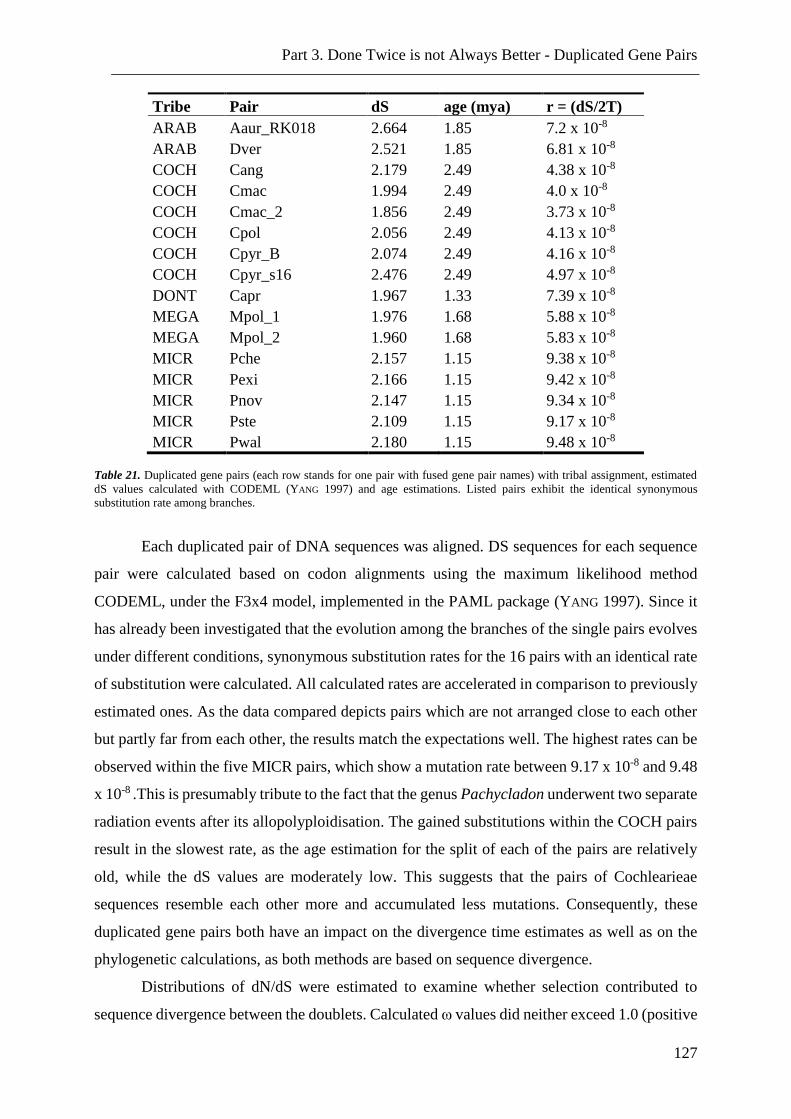
Part 3. Done Twice is not Always Better - Duplicated Gene Pairs
127
Tribe Pair dS age (mya) r = (dS/2T)
ARAB Aaur_RK018 2.664 1.85 7.2 x 10⁻⁸
ARAB Dver 2.521 1.85 6.81 x 10⁻⁸
COCH Cang 2.179 2.49 4.38 x 10⁻⁸
COCH Cmac 1.994 2.49 4.0 x 10⁻⁸
COCH Cmac_2 1.856 2.49 3.73 x 10⁻⁸
COCH Cpol 2.056 2.49 4.13 x 10⁻⁸
COCH Cpyr_B 2.074 2.49 4.16 x 10⁻⁸
COCH Cpyr_s16 2.476 2.49 4.97 x 10⁻⁸
DONT Capr 1.967 1.33 7.39 x 10⁻⁸
MEGA Mpol_1 1.976 1.68 5.88 x 10⁻⁸
MEGA Mpol_2 1.960 1.68 5.83 x 10⁻⁸
MICR Pche 2.157 1.15 9.38 x 10⁻⁸
MICR Pexi 2.166 1.15 9.42 x 10⁻⁸
MICR Pnov 2.147 1.15 9.34 x 10⁻⁸
MICR Pste 2.109 1.15 9.17 x 10⁻⁸
MICR Pwal 2.180 1.15 9.48 x 10⁻⁸
Table 21. Duplicated gene pairs (each row stands for one pair with fused gene pair names) with tribal assignment, estimated
dS values calculated with CODEML (YANG 1997) and age estimations. Listed pairs exhibit the identical synonymous
substitution rate among branches.
Each duplicated pair of DNA sequences was aligned. DS sequences for each sequence
pair were calculated based on codon alignments using the maximum likelihood method
CODEML, under the F3x4 model, implemented in the PAML package (YANG 1997). Since it
has already been investigated that the evolution among the branches of the single pairs evolves
under different conditions, synonymous substitution rates for the 16 pairs with an identical rate
of substitution were calculated. All calculated rates are accelerated in comparison to previously
estimated ones. As the data compared depicts pairs which are not arranged close to each other
but partly far from each other, the results match the expectations well. The highest rates can be
observed within the five MICR pairs, which show a mutation rate between 9.17 x 10⁻⁸ and 9.48
x 10-8 .This is presumably tribute to the fact that the genus Pachycladon underwent two separate
radiation events after its allopolyploidisation. The gained substitutions within the COCH pairs
result in the slowest rate, as the age estimation for the split of each of the pairs are relatively
old, while the dS values are moderately low. This suggests that the pairs of Cochlearieae
sequences resemble each other more and accumulated less mutations. Consequently, these
duplicated gene pairs both have an impact on the divergence time estimates as well as on the
phylogenetic calculations, as both methods are based on sequence divergence.
Distributions of dN/dS were estimated to examine whether selection contributed to
sequence divergence between the doublets. Calculated ω values did neither exceed 1.0 (positive
Part 3. Done Twice is not Always Better - Duplicated Gene Pairs
128
selection) nor depict strict neutral evolution (dN/dS = 1.0), as values between 0.02073 and
0.04613 were calculated. Hence, neither positive nor neutral evolution were governing the
sequence divergence of the gene pairs, which is in congruence with the analysis of DNA and
amino acid identity.
11.5.2 Relative rate test (Tajima’s D)
The test of equality of evolutionary rate between sequences resulted in partly significant
values, with p ≤ 0.05. Sequence pairs from the Cochlearieae (p between 0.00004 and 0.00432)
as well as all Arabideae (p between 0.0 and 0.00284) doublets are affected. For these pairs the
null hypothesis is rejected in favour of the alternate hypothesis, meaning that rates among that
pairs deviate significantly from each other. Note that the sequences from COCH, which display
a significant RRT are those with differing mutation rates between the pairs and are therefore
not listed in Table 21. For the remaining pairs, the null hypothesis, meaning there is no
significant difference between the doublets, is valid. This effect underpins the hypothesis, that
the tested duplicates do not derive from the same duplication event, e.g. At α WGD, but from
at least two events, varying significantly in their date of appearance, which is reflected in the
variation of sequence similarity. It can be concluded that the significant values can be assigned
to a more ancient event, illustrating an appropriate time frame to allow one of the copies to
diversify significantly from its counterpart.
11.5.3 Amino acid composition
A surprising outcome can be observed while comparing the amino acid occurrence
frequencies (compositions) of all sites between the particular gene pair parts. The resulting
output data suggests an intensive use of only five out of 20 amino acids (alanine, cysteine,
glycine, asparagine and threonine) among all 36 sequences among the expected group with a
percentaged use between 18.2% (threonine) and 23.3% (glycine). The other half of the
duplicated sequence pairs show only a slightly increased amount of amino acid bias, suggesting
the use of an additional two amino acids (histidine and aspartate), but only with a marginal
usage of each 0.0149% and only among duplicated COCH sequences. The evolutionary origin
of amino acid occurrence frequencies is yet not fully understood and divers theories, like protein
composition work alongside the genetic code (HORMOZ 2013), have been brought up. Amino
acid composition have proven to be well-conserved from species to species (GILIS et al. 2001,
ITZKOVITZ & ALON 2007). Therefore any given organism is expected to display a representative
averaged composition similar to the amino acid frequency in its proteome set. Deviations from
Part 3. Done Twice is not Always Better - Duplicated Gene Pairs
129
this average composition have been found and linked to cellular organisation and enhancement
of protein stability (LOBRY & GAUTIER 1994, MAZEL & MARLIERE 1989). But the rapid
reduction of amino acid use observed here cannot be connected to simple aa exchange events,
although functional constraints of course influence the interchangeability and its respective
impact on the functionality. Though it most likely cannot solely explain the finding. It is not in
question that the COCH sequences here are truncated, although they all at least depict the
complete second exon (around 1,000 bp) which forecloses the length factor as initiator. Besides,
both gene pair groups are affected to a similar extend and, moreover, the synonymous
substitution rate seems not to be vastly accelerated, ranging from 3.73 x 10⁻⁸ to 4.97 x 10⁻⁸.
Although this heavy reduction of amino acid bias suggests a vast amount of accumulated
mutations or the loss of functionality, no evidence for negative inducement of the gene’s
function could be found.
12 Discussion
Analyses within this chapter have demonstrated that the chalcone synthase gene could
be synthesised twice in the discussed species within five (ARAB, COCH, DONT, MEGA,
MICR) of the 39 investigated tribes. Divergence time estimates of those taxa pairs support the
theory of a huge-scaled duplication preceding the speciation of those tribes. Tribes COCH,
MEGA and ARAB are assigned to expanded lineage II, what immediately directs to the
hypothesis that this reduced delineation illustrates the fate of all expanded lineage II members
meaning that two loci were existend within those tribes. On that aasumption, the duplication
event should have occurred prior to the lineage divergence. It can be argued that all other tribes
assigned to that lineage have undergone a subsequent diploidisation event resulting in the loss
of the additional gene loci. Whether this duplication is identical with the At-α cannot certainly
be confirmed.
Tribes DONT and MICR, indicated by the chs gene tree phylogenies, as well as by
divergence time estimates, suggestedly illustrate more recent doubling events, effecting the
tribe if not only the genera, at maximum. This hypothesis is supported for Pachycladon by JOLY
et al. (2009) where a genus related hybridisation, an allopolyploidisation, was affirmed. High
sequence identities and similarities (compare Table 18) additionally support the hypothesis of
recent duplications within those two tribes, as well as highly conserved coding regions,
especially among the carboxyl terminus. Whereas the diverged non-coding regions are evidence
for duplication events which have happend recently (XU et al. 2012), although not much is
known about structural divergence among duplicated genes.
Part 3. Done Twice is not Always Better - Duplicated Gene Pairs
130
Within the following passages, individual scenarios will be discussed for every
investigated tribe from this chapter.
12.1 Arabideae
The tribe Arabideae is assigned to the expanded lineage II (FRANZKE et al. 2009), which
still contains a huge amount of unresolved relationships between and within this lineage.
Besides, this tribe is the largest in the Brassicaceae family (AL-SHEHBAZ 2012) and varies
widely in evolutionary character traits like life cycle history or amount of polyploid species. A
profound insight into the tribe’s phylogenetics, biogeography and trait evolution was recently
demonstrated (KARL & KOCH 2013). Discovered internal evolutionary patterns, like shifts in
life cycles, are potentially capable to be applied on the whole family (KARL et al. 2012).
Concerning phylogeny, it could be demonstrated that tribe Stevenieae is sister to ARAB
(GERMAN et al. 2009), what is supported via chs data at hand. This validated information, as
well as the location of the additional ARAB clade in the gene tree reconstruction simplify the
commitment on whether which group represents the orthologous loci, derived via speciation.
The duplicated clade in the complete data set is associated to DNA sequences from other tribes
(ANAS, DONT) assigned to different lineages (see Figure 3), as well as the putative outgroup,
showing no noticeable structure or allegeable phylogeny. All members of this very group,
supported by a bootstrap value of 99%, have been excluded from the data. Supposedly all
members of that clade derive from a paralogous origin. The nuclear encoded chs therefore hints
to have undergone a polyploidisation event precedingly to the respective tribal speciation,
defining those paralogs, sensu KOONIN (2005), as outparalogs. The duplication event was
previously discussed to have happened to the common ancestor of sistered tribes ARAB and
STEV (R. Schmickl, pers. comm.), individually. Gene tree reconstructions present argue for a
postponed duplication event, including an increased amount of tribes.
As members from lineage III, as well as expanded lineage II are associated with Cleome,
detached from all remaining groups, this could evidence not only for ancient gene copies of chs
deriving from the At-α WGD, but maybe already from the more ancient At-β. The diverged
DNA sequences from the ARAB paralogs, the association with Cleome, as well as the increased
dS values argue for older duplications of the locus.
Sequences from DONT demonstrate highly divergence as well, which will be discussed
in 12.3. Like previously explained, ARAB paralogs could only be sequenced due to modified
primer combinations which could not be applied on any other tribe employed here, once again
arguing for an older age of the loci and demonstrating inter-as well as intra-species divergence.
Part 3. Done Twice is not Always Better - Duplicated Gene Pairs
131
In other words: Paralogous ARAB copies vary to such an amount from their orthologs, as well
as further paralogs that individual primer pairs needed to be designed for putatively ever tribe.
Therefore it is conceivable that any of the tribes implemented still contains additional degraded
chs information remaining within the genome. However, the primer pairs employed for
sequencing were not capable of amplifying those highly diverged loci. Assumed that the
promoter region primarily accumulates mutational changes, this presumption accounts for the
reputed presence of ancient highly mutated chs loci within a certain amount of Brassicaceae
genomes.
12.2 Cochlearieae
The tribe Cochlearieae comprises only genus Cochlearia and Ionopsidium and is with
circa 30 species moderately sized. Although the tribe has long obtained minor interest, the
application of nuclear chalcone synthase on those genera has revealed an active history of, at
least, that respective locus.
Although B. luteae has been proven to both describe a monophyletic tribe on its own
(BIVO) and, additionally, to be not closely related to tribe COCH (KOCH 2012), demonstrated
via the application of chloroplast trnLF and nuclear ribosomal ITS, the original chs data set
(Figure 3) suggested a neighbouring position to one group of COCH. After thorough
investigations this very group was excluded from the chs data as putatively duplicated and
interacting with the remaining sequences. Admittedly, KOCH & MARHOLD (2012) demonstrated
that the utilisation of markers ITS and trnLF result in a congruent single locus illustration of
the tribe Cochlearieae at a very basal position not associated with BIVO. The tribe has been
placed to expanded lineage II as a synopsis of various reviews suggested a placing outside
lineages I to III. This argues for the correct respectively orthologous chs locus which was
facilitated in the work at hand. Together with HELI and ALYS the Cochlearieae are associated
in a small expanded lineage II group. Consequently, either the two applied markers do also
demonstrate duplication events of the respective loci or the diverse marker systems do not
depict congruent outcome due to additional impact not concerned here. It is argued that those
conflicting results originate from deployment of DNA sequence information descendent from
different genome types (mt, cp, n) (KOCH 2012), which are also known to show high variety
among silent substitution rates (WOLFE et al. 1987). Further investigations suggest diverse
outcome for the placement of the COCH. Different sister relationships were observed, either to
tribe COLU (COUVREUR et al. 2010) or to ISAT (BEILSTEIN et al. 2010, LYSAK et al. 2009),
which can neither be underpinned with chs data. Splits of COCH from any other tribe are dated
Part 3. Done Twice is not Always Better - Duplicated Gene Pairs
132
between 23.6 mya (fossil calibration) and 11.5 mya (synonymous substitution rate) according
to the respective BEAST analysis and are therefore dated forward compared to prior estimations
which dated the split to a minimum of 30 mya. This supports the hypothesis that the tribe
describes a position along a yet unresolved basal polytomy (FRANZKE et al. 2011) drawing
support to its expected antiquity (KOCH 2012). Moreover, the tendency of the genus Cochlearia
to polyploidisation, which is based on a well-defined diploid species level of 2n = 2x = 12,
results in species with tetra-, hexa- and even octoploid cytogenetic data (KOCH 2012). This as
well as uncertain or variable ploidiy levels in some species handicap a thoroughgoing
designation of orthologous and paralogous gene copies. The supposed polyploidisation in
Ionopsidium demonstrated by a duplicated base chromosome number of n = 12, compared to
Cochlearia with n = 6 (7) is indicative for further duplication events.
It has to be reminded that within this chs estimations the basal COCH group was
excluded which expectedly results in younger estimations. In case the removed COCH clade
should really depict the original chs locus, than the estimated divergence of that split is
dated to 31.15 mya ago (see Figure 19) suggested by estimations via RelTime ML and
arranging among the recommended split age. However, argumentations cited earlier in this
thesis propose that this postponed split from any other Brassicaceae tribe equals the most
recent WGD event as origin of all Brassicaceae (SCHRANZ & MITCHELL-OLDS 2006). The
subsequent gene duplication in COCH, at least in chs, argues for the facilitations of both
copies with the more recent dated one as functionally working and encoding the orthologous
gene. For this hypothesis the divergence between genus Cochlearia and Ionpsidium is dated
9.64 mya (see
Table 22), based on angiosperm calibrations, to an after borne age. Although in
otherwise complete analogy to the chs chronogram of the coding region presented by KOCH &
MARHOLD (2012) the placement of that tribe seems not absolutely verified. However, the chs
data here argues for an eraly duplication event in the respective tribe, leaving at least two
functional loci within the genome. Actually, no tendency for silencing or gene loss to any extant
could be detected.
12.3 Dontostemoneae
This tribe and its situation has already been touched in the previous chapter. As genes
are continuously being created, mostly via polyploidisation, they also get rapidly destroyed by
mutations, resulting in the re-diploidisation of the genome, mostly keeping only the smallest
Part 3. Done Twice is not Always Better - Duplicated Gene Pairs
133
percentage of the duplicated gene pairs. The calculated half-value period is supposed to arrange
within 3-7 mya (SANKOFF & NADEAU 2000). As the DONT did not only demonstrate a split up
tribe, arranging at two diverse standings within the gene tree what indicates different scenarios
like the remaining of different gene versions within different species, it also shows a diverse
arrangement of one species, namely Clausia aprica. The real Dontostemoneae copy was closely
associated with Hesperideae (Hesperis matronalis), which already was demonstrated by Liu et
al., (2012), as well as the close relationship between the tribes Anchonieae and Euclideae. The
Buniadeae, which arrange even closer to the Anchonieae as any genera from Euclideae, were
not discussed extensively before.
There is evidence that an exclusive duplication event can be found in this tribe, dated
around 13.3 mya, suggested by BEAST analyses (see supplementary S6). Referring to that
estimated date stamping this polyploidisation event is supposed to appear after the last whole
genome duplication. If this holds true, then the Clausia aprica copies obtained here retained
considerably longer within the genome than expected. This, however, indicates, that the two
loci for chalcone synthase among at least that species, if not genus or even tribe are functional
and are essential for the organism. Unfortunately, there is only evidence for Clausia aprica to
depict an additional locus, which is the reason for the suggestion of an intra-genus (Clausia)
duplication event, which would postpone the duplication to have taken place after the speciation
of the genus. But positive evidence for the extent to which the data is affected by this event is
not available. This last-mentioned species moreover depicts different recess from several
chromosome counts (BELAEVA & SIPLIVINSKY 1975, YURTSEV & ZHUKOVA 1982) which all
derive from samplings from Russia. Here the outcome suggests that Clausia aprica is of
neopolyploid origin with one count 2n = 2x = 14 and another count revealing a tatraploid origin
with 2n = 4x = 28. Additional information on chromosome numbers for species discussed were
obtained from a database (WARWICK & AL-SHEHBAZ 2006) as well as by the cytogenetic search
tool implemented in BrassiBase (KIEFER et al. 2014). This shows a fourth count done as part of
the BrassiBase project, which offers additional information of the haploid genome size (1C),
which here arranged at 3.97 and a monoploid size of 1.99 (1Cx) suggesting an even diploid
origin of the respective species. If this specimen is of tetraploid origin, up to four varying alleles
are expected, which the additional loci are most likely the outcome from the polyploidisation
event, which, without difficulty, can be arranged on two different loci.
As is commonly believed that strict autosyndesis in allopolyploids leads to independent
segregations of alleles on homeologous chromosomes and hence fixed heterozygosity is
inherited in a disomic manner, split arrangement of polyploidy genera seems substantial.
Part 3. Done Twice is not Always Better - Duplicated Gene Pairs
134
Granted, but in case the genus is diploid these are additional loci which are kept for a
remarkably long time span, as the Brassicaceae show a tendency for relatively rapid
diploidisation after polyploidisation occurred (LYSAK et al. 2009). To sum it up, an independent
duplication event, prior to the speciation of the species (at least) is suggested resulting in two
groups, of which one exclusively holds Clausia aprica, while the other additionally contains
extra species. Most likely this tribe experienced a duplication event previous to its speciation.
If the duplication took place after the speciation, it would be expected that the sequences
arrange relatively close to each other in the gene tree, as a) the duplication must be very recent
and b) the duplicates are redundant immediately after its duplication. If the sequence data is
compared, this additional, votes for the polyploidisation after the alpha WGD but before
speciation of the genus.
12.4 Megacarpaeeae
The Megacarpaeeae have also already been reviewed in 9.5. As they depict no clear
evolutionary pattern, they show up in both large-scale analysis drafts. They not only can be
observed at the expected but also at an unexpected placing in the cladogram. They, moreover,
are not clearly diversified via species boundaries, meaning, that one species nests at one
surrounding, while the second employed species arranges at the second surrounding. This tribe,
additionally shows a split species (M. polyandra) where one splinter is clustering with the
second MEGA species (P. pterocarpum), while the other splinter stands on its own. The
situation resembles this of the DONT. In case the tribe underwent an additional duplication why
is it that only Megacarpaea polyandra shows a second locus? If the second locus derives from
WGD α, how come it still remains within the genome? And why only exclusively within one
species? The evolutionary development of chs within this tribe, on the first sight, seems to be
very thoroughgoing, but if the questions above are considered, the journey of the gene does not
seem to be that straightforward.
12.5 Microlepidieae
One genus from this tribe, namely Pachycladon, has already been extensively
investigated by JOLY et al. (2009)demonstrating that Pachycladon is of an allopolyploid origin
(2n = 20), thus keeping two genome copies with duplicated chs (and other) genes. The A
(rabidopsis) lineage holds one, while the B(rassica) lineage (JOLY et al. 2009) contains the
second copy. The lineages received their name due to the phylogenetic placement of both copies
detected. The A genome copy depicts Pachycladon in a close relationship to the
Part 3. Done Twice is not Always Better - Duplicated Gene Pairs
135
Crucihimalayeae and the Boechereae, which can immediately be supported from the results
presented here (Figure 3, Figure 8 and Figure 18). While the B genome copy is propagated do
be close to the split between the Arabidopsis and Brassica lineage, which cannot be affirmed
here. In the phylogenetic representation presented in this study, the second copy is well within
lineage I sensu BEILSTEIN et al. (2008) and not even close to the split suggested by JOLY et al.
(2009). The placement of the B-copy indicates a close relationship to the tribe Yinshanieae,
sistered by the Smelowskieae and the Descuraineae. This group of four tribes is most likely to
reveal the real placement of the second genomic copy of chs. The split of this group and the
group occupying the other copy, supported with a bootstrap value of 97, presumably show the
hybridisation event of the genus Pachycladon dated 8 mya. The different results of the
“Brassica” copy originate from data sampling. As references for Pachycladon are mostly genera
from the same lineage, namely lineage I, were consulted, resulting in a phylogeny which is not
representative for the complete family. Genera from the tribe Lepidieae are confirmed to pose
at a position basal and sister to the lineage (BEILSTEIN et al. 2006, BEILSTEIN et al. 2008, JOLY
et al. 2009). And there, additionally, is some evidence (in study at hand), that the Cardamineae
(typified by the genera Rorippa, Cardamine and Barbarea) are as well standing at a basal
position outside the core of lineage I. The four genera representing lineage II (Brassica,
Sisymbrium, Thlaspi, Thellungiella) are nested within the phylogeny which does not underpin
the expected resolution.
The polyploidy event of the Australian Pachycladon genera most likely occurred before
the genus diverged. If the duplication event would have happened independently after the
divergence of Pachycladon, it would be very unlikely that the genome copies were in similar
positions in the respective gene trees. Besides, the tribes closely related to the genus are not
affected by signs of paralogy, i.e. a second divergent genome copy. This image of Pachycladon
could still be explained by the fact that a small-scale duplication of a part of the chromosome
took place is confuted by the fact that all five markers employed in this study were duplicated
and are distantly located on the complete genome (JOLY et al. 2009). So, consequently, the
allopolyploid Pachycladon genera underwent a tribal internal polyploidisation, respectively
allopolyploidisation, event before the genus but after the lineage diversification.
The duplicated gene pairs investigated presumably describe duplicated gene loci, on a
physically different location. This is one factor cited as contributing to rate variation among
genes. GC content, as well as codon usage bias do also count as a factors showing impact, while
differing levels of selective constraint on amino acid substitutions are named as the fourth
reason (TICHER & GRAUR 1989, TSUNOYAMA et al. 2001, ZHANG et al. 2002).
Part 3. Done Twice is not Always Better - Duplicated Gene Pairs
136
As a consequence, the parts of the duplicated 36 gene pairs (corresponding to 72 DNA
sequences) causing disorder among the data analysis were removed (compare Figure 3, colour-
coded squares) for further investigations. This resulted in the delimitation of 36 sequences while
the other half, as putative orthologous locus was kept. The analysis applied on the data at hand
implicitly suggests that great importance has to be attached to the material worked with. It is
beneficial to compare only accurately investigated data in order to assure comparability. This
analysis demonstrates the impact of genetic sequences, on which evolution had worked to a
certain extent.
The following chapter will focus on the remaining colour-coded sequences, namely the
squares. Asterisks (see part 2: Trouble with the Tribal Arrangement), as well as circles (see part
3: Done Twice is not Always Better) have been discharged.

Part 4: No End of Trouble
Part 4: No End of Trouble
138
After the exclusion of around 70 functional DNA sequences from the original data set
utilised (representatives were symbolised with colour-coded squares, see Figure 3), a final set
of 600 sequences is left. In case any disorders and derangements could be organised, a
thoroughgoing data set, holding only homologous gene copies, resulting in straightforward
output data is expected. A first impression should be gained via the phylogenetic
reconstructions.
13 Material und methods
13.1.1 Comparative phylogenetic reconstructions and analyses
Like previously deployed, different phylogenetic analysis methods have been applied
on the data to assure the solidity and reproducibility. Therefore NJ and MP as well as ML
analyses were utilised to compare the phylogenetic reconstructions with those from prior
analysis. Bioinformatic programmes and settings are identical compared to previous
applications.
13.1.2 Divergence time estimates
The identical three approaches, described in 4.3.2.1 (synonymous substitution rate,
fossil calibration and angiosperm split ages), were (direct and secondary calibration) applied on
the reduced data set, to produce comparable output estimations. All settings were in absolute
congruence to previous computations. For each approach four files were created which were
each run for 50 million generations on the CIPRES science gateway in the San Diego
Supercomputer centre (MILLER et al. 2010).
13.1.3 Transition/transversion ratio
As the amount and pattern of homoplasy influences the accuracy of the phylogeny a
further test on the DNA evolution with DAMBE (XIA 2013) was employed. The dataset was
stepwise cleaned from distortion via exclusion of evolutionary “leftovers”. As high levels of
genetic divergence result in a decreased transition/transversion ratio, like it could be examined
in 0, the illustration from the reduced data is expected to depict a much steeper diagram, because
the genetic distance is shorter. Therefore the transition/transversion bias was calculated using
DAMBE’s 5.3.115 (XIA 2013) tool for sequence analysis on third codon position estimating
nucleotide substitution patterns, depicting a detailed output with patterns and lines.
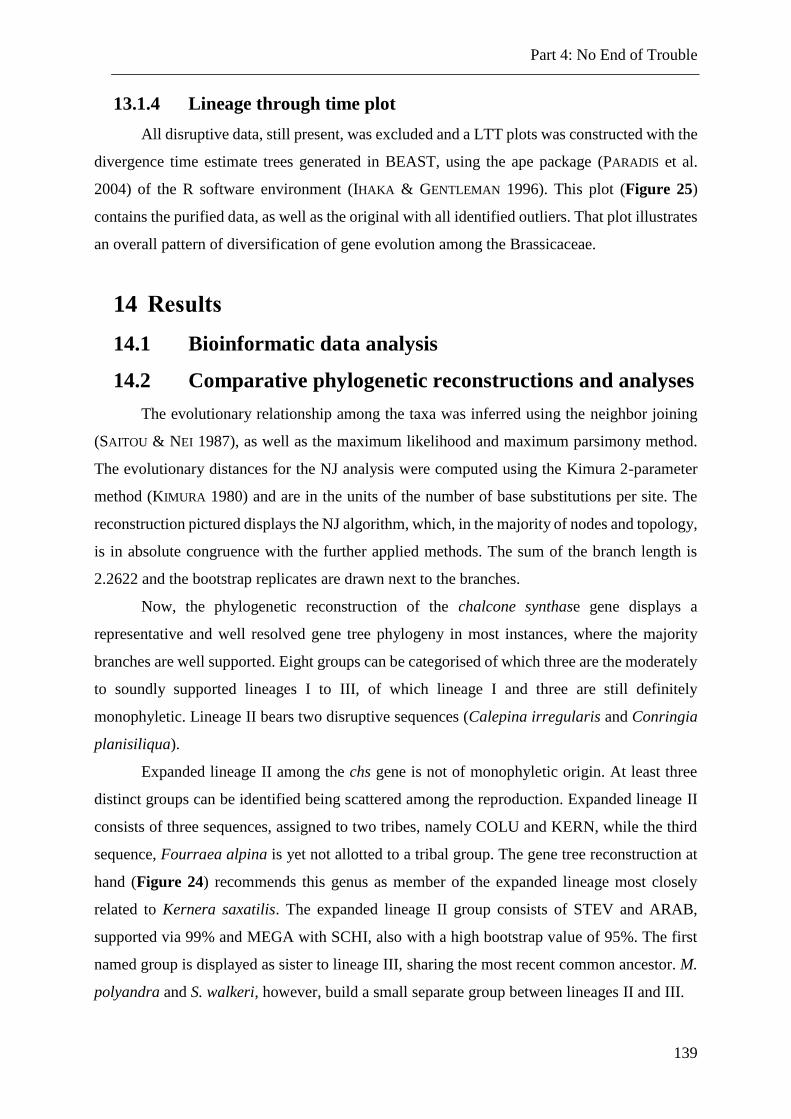
Part 4: No End of Trouble
139
13.1.4 Lineage through time plot
All disruptive data, still present, was excluded and a LTT plots was constructed with the
divergence time estimate trees generated in BEAST, using the ape package (PARADIS et al.
2004) of the R software environment (IHAKA & GENTLEMAN 1996). This plot (Figure 25)
contains the purified data, as well as the original with all identified outliers. That plot illustrates
an overall pattern of diversification of gene evolution among the Brassicaceae.
14 Results
14.1 Bioinformatic data analysis
14.2 Comparative phylogenetic reconstructions and analyses
The evolutionary relationship among the taxa was inferred using the neighbor joining
(SAITOU & NEI 1987), as well as the maximum likelihood and maximum parsimony method.
The evolutionary distances for the NJ analysis were computed using the Kimura 2-parameter
method (KIMURA 1980) and are in the units of the number of base substitutions per site. The
reconstruction pictured displays the NJ algorithm, which, in the majority of nodes and topology,
is in absolute congruence with the further applied methods. The sum of the branch length is
2.2622 and the bootstrap replicates are drawn next to the branches.
Now, the phylogenetic reconstruction of the chalcone synthase gene displays a
representative and well resolved gene tree phylogeny in most instances, where the majority
branches are well supported. Eight groups can be categorised of which three are the moderately
to soundly supported lineages I to III, of which lineage I and three are still definitely
monophyletic. Lineage II bears two disruptive sequences (Calepina irregularis and Conringia
planisiliqua).
Expanded lineage II among the chs gene is not of monophyletic origin. At least three
distinct groups can be identified being scattered among the reproduction. Expanded lineage II
consists of three sequences, assigned to two tribes, namely COLU and KERN, while the third
sequence, Fourraea alpina is yet not allotted to a tribal group. The gene tree reconstruction at
hand (Figure 24) recommends this genus as member of the expanded lineage most closely
related to Kernera saxatilis. The expanded lineage II group consists of STEV and ARAB,
supported via 99% and MEGA with SCHI, also with a high bootstrap value of 95%. The first
named group is displayed as sister to lineage III, sharing the most recent common ancestor. M.
polyandra and S. walkeri, however, build a small separate group between lineages II and III.
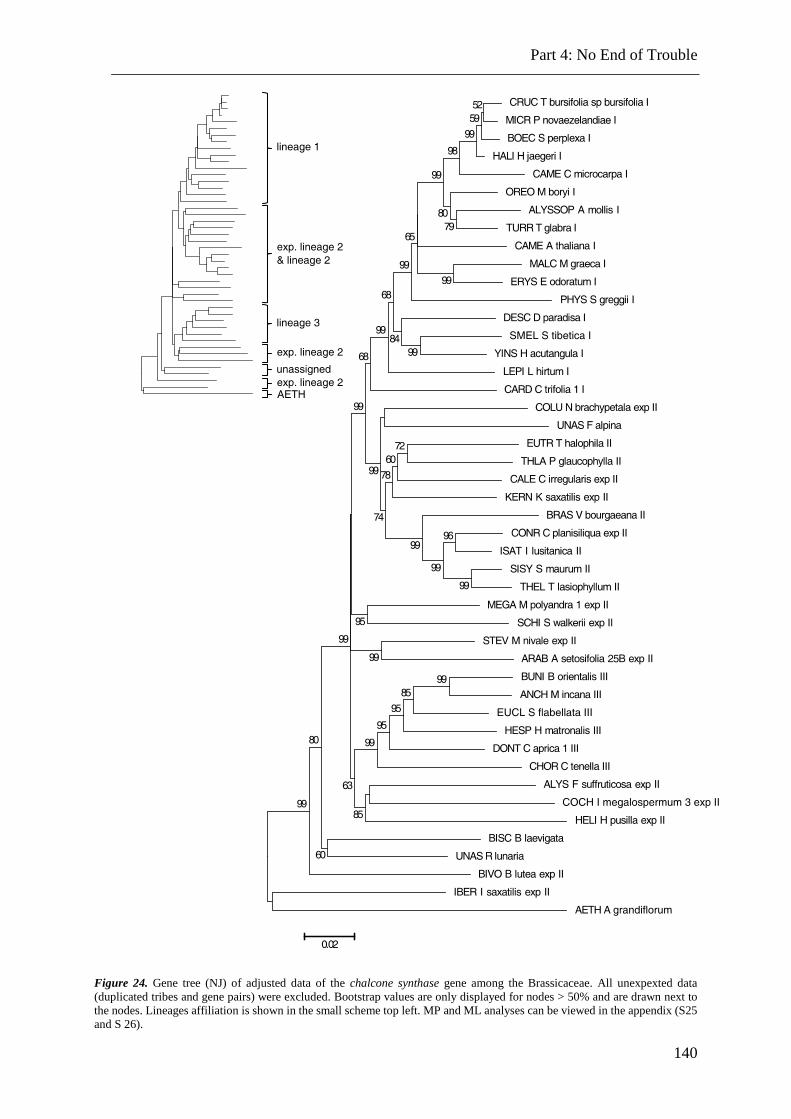
Part 4: No End of Trouble
140
Figure 24. Gene tree (NJ) of adjusted data of the chalcone synthase gene among the Brassicaceae. All unexpexted data
(duplicated tribes and gene pairs) were excluded. Bootstrap values are only displayed for nodes > 50% and are drawn next to
the nodes. Lineages affiliation is shown in the small scheme top left. MP and ML analyses can be viewed in the appendix (S25
and S 26).
Part 4: No End of Trouble
141
Expanded lineage II is a basal group of three with a moderate support value of 75% and
a divergence support of 99%. HELI, ALYS and COCH are arranged in a sister group
relationship to lineage III. Iberis saxatilis, also expanded lineage II, displays a much unexpected
basal positioning close to Aethionema grandiflorum. In the aggregate, the adjusted phylogenetic
reconstructions of the chalcone synthase gene represent in most instances a congruent
appearance compared to other molecular marker phylogenies like ITS.
Thus, the addressed data from tribes BISC, BIVO, CALE, CONR, IBER and the
unassigned genera, all marked with colour-coded squares in Figure 3 will be investigated in
this chapter.
14.3 Divergence time estimates
The results of the divergence time calculations are listed in Table 22. The most probable
origin of the Brassicaceae as well as different divergence estimations cannot be set to certain
age. This is due to the fact that both varying approaches have been applied on varying data sets.
The indication of this effort was to demonstrate the impact of either of the factors. It is essential
to investigate the employed data accurately prior to perform calculations upon it and before
drawing conclusions. It can persuadingly be observed what immense impact even one imprecise
chosen DNA sequence (C. spinosa) can have on the whole estimations (compare results 669
and 668). But still, after justification and exclusion of inappropriate sequences, the remaining
data does demonstrate a vast range of estimated divergence times generated by the diverse drafts
applied on the identical data. Note that the divergence estimates induced by synonymous
substitution rates always resulted in the most recent calculations while the fossil constraints
always postponed the divergence even up to double the age, e.g.from 19.6 mya (tmcra Bras,
synonymous substitution rate) to 37,89 mya (tmrca Bras, fossil constraint). The estimations via
angiosperm splits seems to be highly appropriate as they constantly arrange between the other
deliverables and also are relatively stable. Therefore, the suggested crown age of the
Brassicaceae arranges between 37.89 and 19.60 mya, most likely settles somewhere between
those boundaries. It can be concluded that divergence times via synonymous substitution rates
underestimate while fossil constraints supposable result in overestimations of age estimations.
Divergence times from the nuclear chalcone synthase gene tend to be somewhat older
compared to plastid or mitochondrial genome data. Even compared to other nuclear single-or
low-copy nuclear genes, chs produces by far the most predated age estimations (JOLY et al.
2009). This might indicate a different evolutionary history of the plastid or mitochondrial
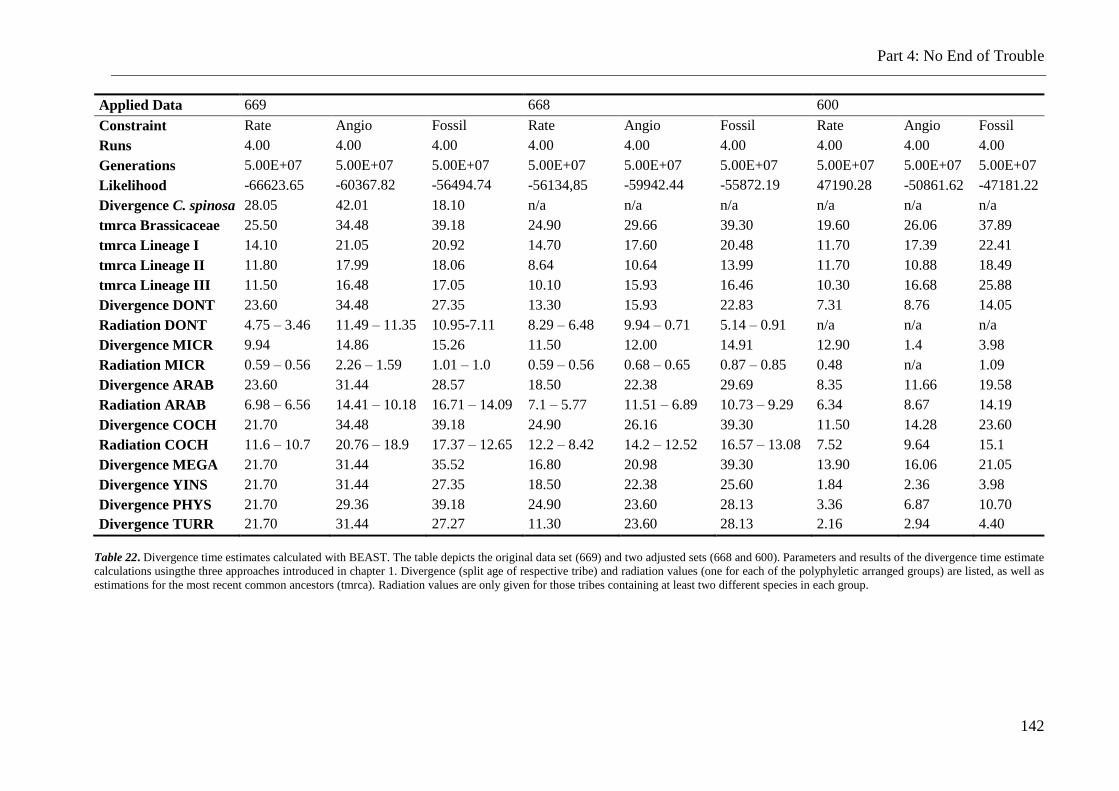
Part 4: No End of Trouble
142
Applied Data 669 668 600
Constraint Rate Angio Fossil Rate Angio Fossil Rate Angio Fossil
Runs 4.00 4.00 4.00 4.00 4.00 4.00 4.00 4.00 4.00
Generations 5.00E+07 5.00E+07 5.00E+07 5.00E+07 5.00E+07 5.00E+07 5.00E+07 5.00E+07 5.00E+07
Likelihood -66623.65 -60367.82 -56494.74 -56134,85 -59942.44 -55872.19 47190.28 -50861.62 -47181.22
Divergence C. spinosa 28.05 42.01 18.10 n/a n/a n/a n/a n/a n/a
tmrca Brassicaceae 25.50 34.48 39.18 24.90 29.66 39.30 19.60 26.06 37.89
tmrca Lineage I 14.10 21.05 20.92 14.70 17.60 20.48 11.70 17.39 22.41
tmrca Lineage II 11.80 17.99 18.06 8.64 10.64 13.99 11.70 10.88 18.49
tmrca Lineage III 11.50 16.48 17.05 10.10 15.93 16.46 10.30 16.68 25.88
Divergence DONT 23.60 34.48 27.35 13.30 15.93 22.83 7.31 8.76 14.05
Radiation DONT 4.75 – 3.46 11.49 – 11.35 10.95-7.11 8.29 – 6.48 9.94 – 0.71 5.14 – 0.91 n/a n/a n/a
Divergence MICR 9.94 14.86 15.26 11.50 12.00 14.91 12.90 1.4 3.98
Radiation MICR 0.59 – 0.56 2.26 – 1.59 1.01 – 1.0 0.59 – 0.56 0.68 – 0.65 0.87 – 0.85 0.48 n/a 1.09
Divergence ARAB 23.60 31.44 28.57 18.50 22.38 29.69 8.35 11.66 19.58
Radiation ARAB 6.98 – 6.56 14.41 – 10.18 16.71 – 14.09 7.1 – 5.77 11.51 – 6.89 10.73 – 9.29 6.34 8.67 14.19
Divergence COCH 21.70 34.48 39.18 24.90 26.16 39.30 11.50 14.28 23.60
Radiation COCH 11.6 – 10.7 20.76 – 18.9 17.37 – 12.65 12.2 – 8.42 14.2 – 12.52 16.57 – 13.08 7.52 9.64 15.1
Divergence MEGA 21.70 31.44 35.52 16.80 20.98 39.30 13.90 16.06 21.05
Divergence YINS 21.70 31.44 27.35 18.50 22.38 25.60 1.84 2.36 3.98
Divergence PHYS 21.70 29.36 39.18 24.90 23.60 28.13 3.36 6.87 10.70
Divergence TURR 21.70 31.44 27.27 11.30 23.60 28.13 2.16 2.94 4.40
Table 22. Divergence time estimates calculated with BEAST. The table depicts the original data set (669) and two adjusted sets (668 and 600). Parameters and results of the divergence time estimate
calculations usingthe three approaches introduced in chapter 1. Divergence (split age of respective tribe) and radiation values (one for each of the polyphyletic arranged groups) are listed, as well as
estimations for the most recent common ancestors (tmrca). Radiation values are only given for those tribes containing at least two different species in each group.
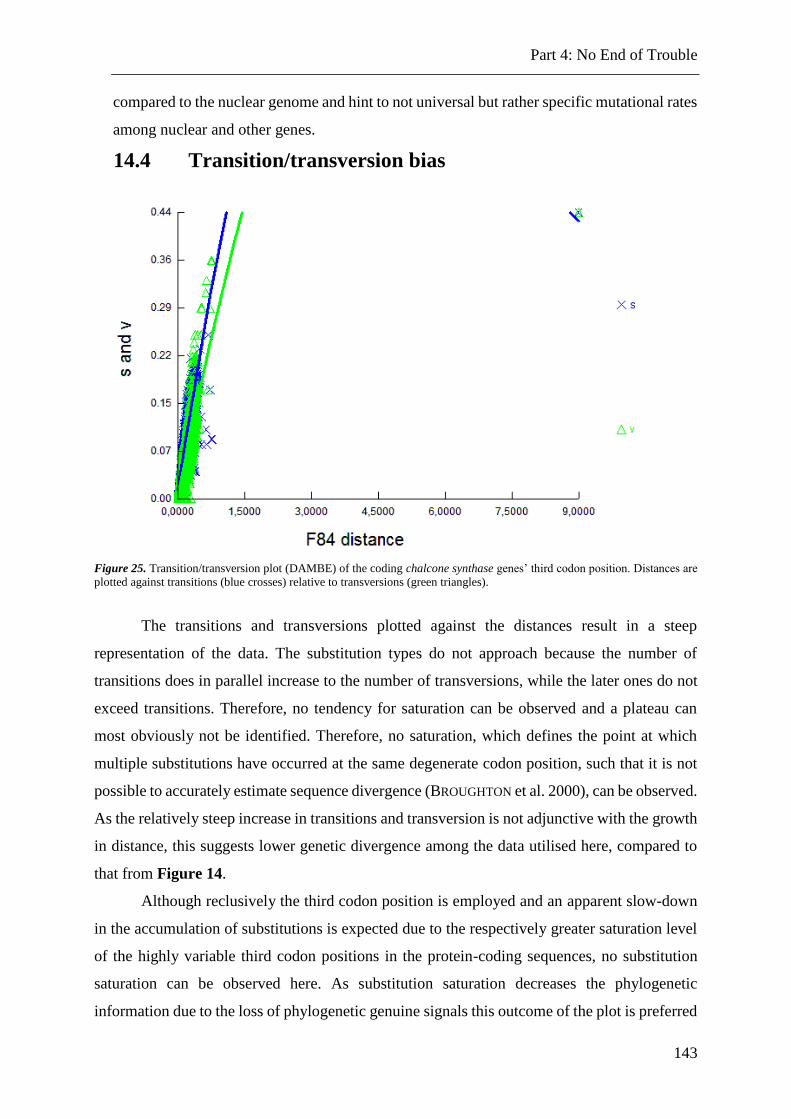
Part 4: No End of Trouble
143
compared to the nuclear genome and hint to not universal but rather specific mutational rates
among nuclear and other genes.
14.4 Transition/transversion bias
Figure 25. Transition/transversion plot (DAMBE) of the coding chalcone synthase genes’ third codon position. Distances are
plotted against transitions (blue crosses) relative to transversions (green triangles).
The transitions and transversions plotted against the distances result in a steep
representation of the data. The substitution types do not approach because the number of
transitions does in parallel increase to the number of transversions, while the later ones do not
exceed transitions. Therefore, no tendency for saturation can be observed and a plateau can
most obviously not be identified. Therefore, no saturation, which defines the point at which
multiple substitutions have occurred at the same degenerate codon position, such that it is not
possible to accurately estimate sequence divergence (BROUGHTON et al. 2000), can be observed.
As the relatively steep increase in transitions and transversion is not adjunctive with the growth
in distance, this suggests lower genetic divergence among the data utilised here, compared to
that from Figure 14.
Although reclusively the third codon position is employed and an apparent slow-down
in the accumulation of substitutions is expected due to the respectively greater saturation level
of the highly variable third codon positions in the protein-coding sequences, no substitution
saturation can be observed here. As substitution saturation decreases the phylogenetic
information due to the loss of phylogenetic genuine signals this outcome of the plot is preferred
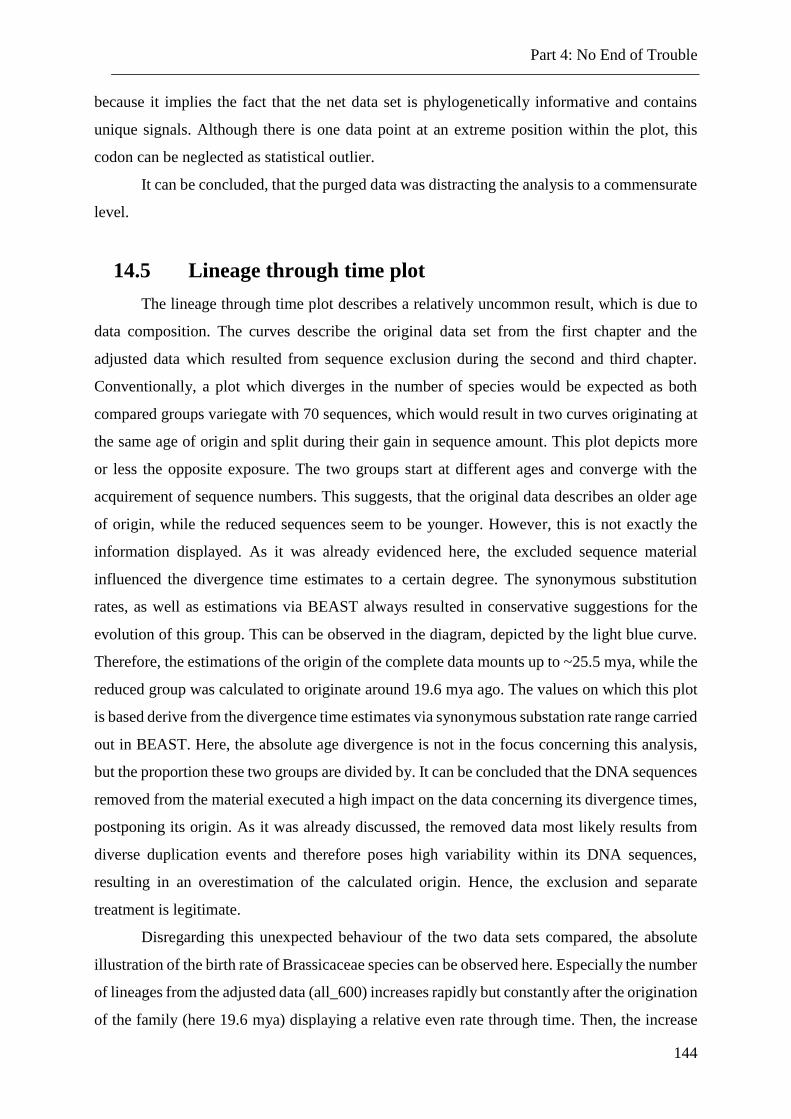
Part 4: No End of Trouble
144
because it implies the fact that the net data set is phylogenetically informative and contains
unique signals. Although there is one data point at an extreme position within the plot, this
codon can be neglected as statistical outlier.
It can be concluded, that the purged data was distracting the analysis to a commensurate
level.
14.5 Lineage through time plot
The lineage through time plot describes a relatively uncommon result, which is due to
data composition. The curves describe the original data set from the first chapter and the
adjusted data which resulted from sequence exclusion during the second and third chapter.
Conventionally, a plot which diverges in the number of species would be expected as both
compared groups variegate with 70 sequences, which would result in two curves originating at
the same age of origin and split during their gain in sequence amount. This plot depicts more
or less the opposite exposure. The two groups start at different ages and converge with the
acquirement of sequence numbers. This suggests, that the original data describes an older age
of origin, while the reduced sequences seem to be younger. However, this is not exactly the
information displayed. As it was already evidenced here, the excluded sequence material
influenced the divergence time estimates to a certain degree. The synonymous substitution
rates, as well as estimations via BEAST always resulted in conservative suggestions for the
evolution of this group. This can be observed in the diagram, depicted by the light blue curve.
Therefore, the estimations of the origin of the complete data mounts up to ~25.5 mya, while the
reduced group was calculated to originate around 19.6 mya ago. The values on which this plot
is based derive from the divergence time estimates via synonymous substation rate range carried
out in BEAST. Here, the absolute age divergence is not in the focus concerning this analysis,
but the proportion these two groups are divided by. It can be concluded that the DNA sequences
removed from the material executed a high impact on the data concerning its divergence times,
postponing its origin. As it was already discussed, the removed data most likely results from
diverse duplication events and therefore poses high variability within its DNA sequences,
resulting in an overestimation of the calculated origin. Hence, the exclusion and separate
treatment is legitimate.
Disregarding this unexpected behaviour of the two data sets compared, the absolute
illustration of the birth rate of Brassicaceae species can be observed here. Especially the number
of lineages from the adjusted data (all_600) increases rapidly but constantly after the origination
of the family (here 19.6 mya) displaying a relative even rate through time. Then, the increase
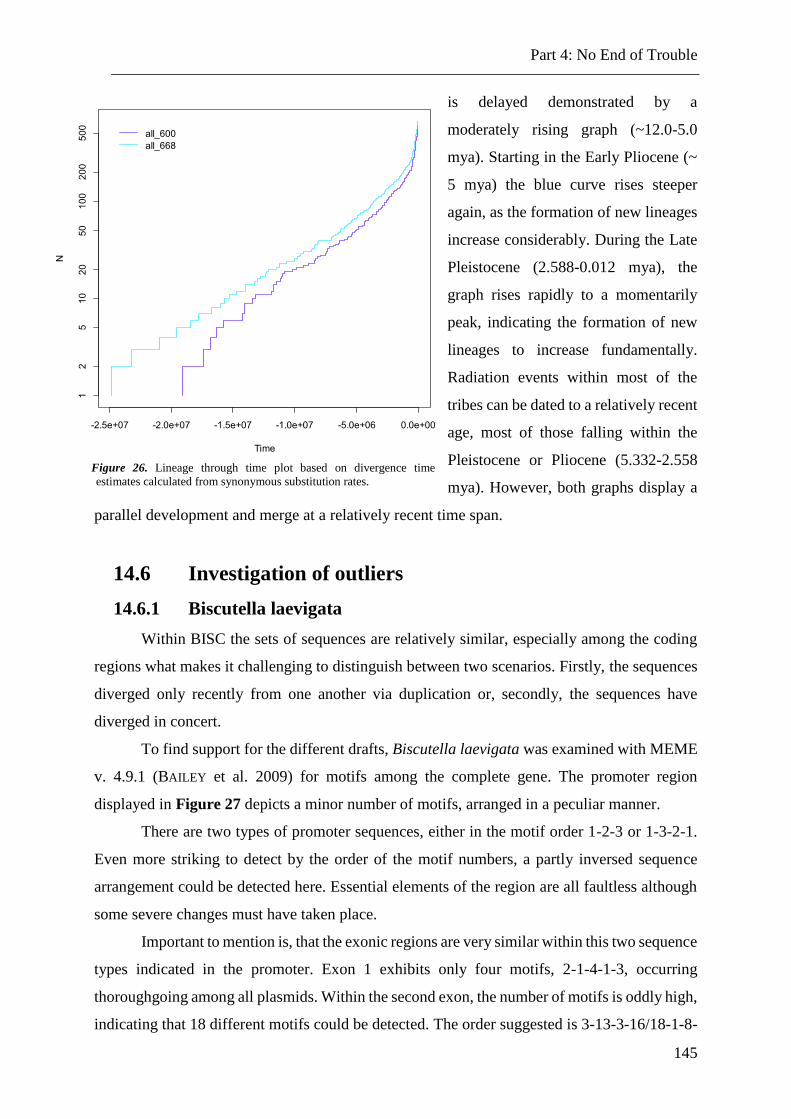
Part 4: No End of Trouble
145
is delayed demonstrated by a
moderately rising graph (~12.0-5.0
mya). Starting in the Early Pliocene (~
5 mya) the blue curve rises steeper
again, as the formation of new lineages
increase considerably. During the Late
Pleistocene (2.588-0.012 mya), the
graph rises rapidly to a momentarily
peak, indicating the formation of new
lineages to increase fundamentally.
Radiation events within most of the
tribes can be dated to a relatively recent
age, most of those falling within the
Pleistocene or Pliocene (5.332-2.558
mya). However, both graphs display a
parallel development and merge at a relatively recent time span.
14.6 Investigation of outliers
14.6.1 Biscutella laevigata
Within BISC the sets of sequences are relatively similar, especially among the coding
regions what makes it challenging to distinguish between two scenarios. Firstly, the sequences
diverged only recently from one another via duplication or, secondly, the sequences have
diverged in concert.
To find support for the different drafts, Biscutella laevigata was examined with MEME
v. 4.9.1 (BAILEY et al. 2009) for motifs among the complete gene. The promoter region
displayed in Figure 27 depicts a minor number of motifs, arranged in a peculiar manner.
There are two types of promoter sequences, either in the motif order 1-2-3 or 1-3-2-1.
Even more striking to detect by the order of the motif numbers, a partly inversed sequence
arrangement could be detected here. Essential elements of the region are all faultless although
some severe changes must have taken place.
Important to mention is, that the exonic regions are very similar within this two sequence
types indicated in the promoter. Exon 1 exhibits only four motifs, 2-1-4-1-3, occurring
thoroughgoing among all plasmids. Within the second exon, the number of motifs is oddly high,
indicating that 18 different motifs could be detected. The order suggested is 3-13-3-16/18-1-8-
Figure 26. Lineage through time plot based on divergence time
estimates calculated from synonymous substitution rates.
Part 4: No End of Trouble
146
2-14-6-4-2-11-2-15/17-1-7-3-5-3-10-1-4-12-1-9-5. Two positions display different motifs
(16/18 and 15/17). Motifs 1, 2, 3 and 5 are repetitive.
Figure 27. Combined block diagram of notified motifs from promoter region of Biscutella laevigata. Non-overlapping sites
with a p-value better than 0.0001 are displayed. The height of the respective motif block is proportional to -log (p-value),
truncated at the height for a motif with a p-value of 1e-10 (BAILEY et al. 2009).
The intron shows again two distinctive sorts of sequences, parallel to that of the
promoter. There is either the motif order 2-5-3 or 2-1-4 to detect, indicating that the beginning
of the intron resembles in both sequence types, while the remaining sequence is more diverse.
These results hint to the fact that Biscutella laevigata possesses two chs copies, each of them
very conserved, but with an estimated p-distance of 0.253.
14.6.2 Bivonaea lutea
This specimen shows an intra-species identity of 99.48% among the complete as well
as for the coding gene, indicating a very high identity between the sequences, which most likely
display the two alleles of the B. lutea. It is even possible, due to the high similarity between the
DNA data that even one allele is displayed holding some sequencing or PCR based differences,
which are no actual mutations. This species is assigned to expanded lineage II, which, together
with some other tribe representatives (IBER, COCH, MEGA), arranges at this basal position.
Previously reviewed affinities tribes from lineage II (SISY, BRAS, THEL, and ISAT) or closely
associated EUTR and THLA could not be affirmed. The uncertain position of Bivonaea lutea
therefore seems still to be not revealed. The sequences do not display any peculiarities which
provide a common explanation for the unexpected position within the phylogenetic
representations.
Part 4: No End of Trouble
147
14.6.3 Calepina irregularis and Conringia planisiliqua
Calepina irregularis displays a divergence between the plasmids of the coding region
between 97.63 and 99.57% and 95.44-99.65% within the complete gene, suggesting a high
similarity between the respective sequences. However, divergence above 1% is suggested to
imply not only allelic variation but diverged loci within the genome. This is also supported by
the DNA sequences itself, depicting highly conserved coding, as well as promoter region, while
the intron displays a variable length. The deletion of 15 nucleotides proves that it is most likely
that a duplication event took place. It is assumed that Calepina underwent this event very
recently, as firstly, only the intronic region is moderately effected and, secondly, this variability
cannot be observed within the phylogenetic reconstructions. Therefore, the discussed
arrangement of that genus is not going to change due to the fact of a duplication.
Conringia planisiliqua, moreover, displays a sequence similarity above 99%,
suggesting allelic variation among the data. Its placement is consequently legitimated.
14.6.4 Iberis saxatilis
The Iberideae are represented by the species Iberis saxatilis, sharing mediocre
similarity, of 78% within the complete gene, with the second species from the same genus, I.
semperflorens. Comparison of the coding regions of both species resulted in a much higher
output similarity of 94%. Hence, both DNA sequence groups cluster closely together. While I.
saxatilis displays only minor difference between its plasmid sequences, I. semperflorens owns
two highly divers intronic regions and promoters, varying immensely in length and
composition. Therefore it is also suggested, like explained in C. irregularis, that this species
underwent a recent gene duplication event, maybe also present in other species of this tribe,
which could not be observed. As neither the coding region is effected by mutational influences
to any extend nor is the promoter, a close-by silencing resulting in the exclusion of the locus
from the genome is not expected. A species-specific duplication could also derive from
hybridisation events (allopolyploidisation), but clear evidence can neither be named due to not
appropriate methods applied here nor are they central to the investigation goals.
14.6.5 Unassigned taxa Fourraea alpina and Ricotia lunaria
Both unassigned genera display a highly intra-species identity above 98%, which are
moderately distributed among the complete gene. This indicates that the divergence verisimilar
originates from sequencing lapses, showing mutational accumulations which are not authentic.
As the promoter regions a nearly sequence identical, functionality, as well as single locus
Part 4: No End of Trouble
148
appearance are confirmed. The arrangement among phylogenies can neither be approved nor
rejected because the taxonomic surrounding is not yet ascertained.
15 Discussion
15.1 Biscutella laevigata
In case the B. laevigata copies have only diverged recently what is suggested via
phylogenetic and divergence-times approach, then the reason for their resemblance is simply a
lack of time as duplicates initially are redundant. Within the last 8 mya (see supplementary
material S1-S9) Biscutella laevigata copies separated and started to diverge only around 0.5
mya. This time-span was not sufficient to accumulate an appropriate number of mutations to
apparently let the sequences appear diverged.
If they have evolved via concerted evolution, the two sequence groups of Biscutella
laevigate depict a more ancient duplication event followed by recombination and gene
conversion. Ectopic or nonallelic gene conversion is said to be found among all species among
all loci examined in detail (GRAUR 1985), where biased gene conversion appears more often
than unbiased, meaning that chances of converting a sequence into another are equally
distributed. This mode of evolution describes the fact that repeats within a genome appear more
related to each other than the respective orthologs in neighbouring species. The molecular
process which is responsible for this is homogenisation (DOVER 1982) of a set of nonallelic
(ectopic) homologous sequences.
The third hypothesis which could be applied on the history of B. laevigata derives from
an observation already executed in the late 1960s (BRESINSKY & GRAU 1970, SCHÖNFELDER
1968). It could be observed that Biscutella laevigata depicts two patterns with reference to its
ploidy level. Outside the Alps any B. laevigata examined showed a simple diploid genome with
2n = 2x = 18, while populations distributed among the Alps depict a tetraploid genome, most
likely due to autopolyploidisation (mesoneopolyploid). Therefore it is expected that the two
sets of Biscutella present in the analysis at hand depict allelic variation of the chalcone synthase
gene. As duplication events are accompanied by chromosomal rearrangements, it is suggested
that the variance among the two sets is due to the effect. Alternatively, selective pressure acts
differently on the duplicated loci after the polyploidisation event.
One gene is not in responsibility for only one function, but is capably of
multifunctionalisation (CONRAD & ANTONARAKIS 2007). Hence, subfunctionalisation, the
division of the ancestral functions by maintaining different parts of the gene, is thought to
appear more often than previously expected (DE SMET & VAN DE PEER 2012). This partitioning
Part 4: No End of Trouble
149
event is accompanied by segmental gene silencing subsequently leading to the formation of
paralogs that are no longer duplicates (CONRAD & ANTONARAKIS 2007), as each gene is
carrying its individual function. Both outcomes of functional divergence support the draft that
either B. laevigata versions will be kept within the genome. The two sequence types deviate
from each other but within each type they show highly conserved progression.
This suggests that both copies are functional versions, either coding a slightly different
function, suggesting that the chs gene in Biscutella underwent functional divergence leading to
neofunctionalisation (DICKINSON et al. 2012). This adaptive mutational process resulting in the
preservation of an additional function, not abounding the ancestral gene (OHNO et al. 1968). As
this occurrence is thought to be free of selective pressure due to the fact that one copy
accumulates the mutations while the other retains the ancestral gene function (RUBY et al. 2007,
SEMON & WOLFE 2008). This is promoted by the fact that ten point mutations in the coding
region could be detected, all perfectly assignable to the two respective sequence types. An
amount of 75% sequence identity is definitely speaking for the fact that allelic variation among
one locus is not sufficient to explain the gene tree phylogeny regarding BISC.
15.2 Bivonaea lutea
Bivonaea is assigned to the monotypic tribe Bivoneeae and its unique status was recently
demonstrated outside the tribe Cochlearieae (KOCH 2012, KOCH & MARHOLD 2012, WARWICK
et al. 2010). However, it was shown that B. lutaea regardless describes affinities to Cochlearia
and Ionopsidium and tribes from lineage II. This, partly, can be confirmed here, as BIVO and
COCH depict a close sister relationship with a bootstrap value of 96% (NJ), but only within the
not adjusted datasets. One arrangement of Cochlearieae and Bivoneeae are placed at a relatively
basal position outside the core lineages I to III. As COCH is officially assigned to the expanded
lineage II (FRANZKE et al. 2011). In the data at hand only one B. lutaea collocation could be
observed what consequently leads to the question which of the supposed arrangement situations
describes the authentic chalcone synthase. Argumentations can be drawn from different angles
of view. Either the basal position outside the majority of expanded lineage II members is correct
and, consequently, the rejected COCH positioning was misleadingly be excluded or the
establishment of Bivonaea describes a chs-like copy while the expected position is near the
other COCH DNA sequence within the majority of expanded lineage II members. A third
argumentation would be in favour of the duplication theory. In case Bivonaea lutea had
undergone an individual duplication event or maybe in concerted manner with COCH, than its
arrangement would suggest that the second locus is still available in the genome but was plainly
Part 4: No End of Trouble
150
not attained in the experimental phase. This rather suggests that both loci are functional as
remaining in the genome. Considering the fact that the sequence locality of Bivonaea gained,
displays an actuality, then this locus is rather unexpected while most likely resulting from an
ancient WGD. For an unsettled reason this tribe retained the duplicated chs locus while the
standard locus was excluded from the genome.
It has already been suggested that the most evident back drop for this situation derives
from either the fact that both chs loci of that species or even tribe were kept within genome.
This hides to functional divergence, more precise, subfunctionalisation.
But as the phylogenetic positions was recently proposed to be still uncertain (WARWICK
et al. 2010), no terminal conclusions can be drawn, least concerning taxonomic consequences.
15.3 Calepina irregularis and Conringia planisiliqua
The monotypic genus Calepina was traditionally placed outside the Brassiceae, while
Conringia has been separated from the tribe. Both have been demonstrated to not have
undergone the allohexaploidy event (triplication) which could be verified for the BRAS (KOCH
et al. 2001, WARWICK & SAUDER 2005) around 7.9-14.6 mya (LYSAK et al. 2005). Calepina as
well as Conringia are assigned to the expanded lineage II which, in ITS phylogeny, arranges
most obviously not within lineage II. The chalcone synthase phylogeny suggests that both tribes
integrate into lineage II but as independent tribes. The internal branching pattern of that group
confirms the core lineage (BRAS, ISAT, SISY, THEL), approved with 99% bootstrap and the
corresponding sister relationship of the tribes EUTR and THLA (90%). Calepina arranges
among the sister group, while Conringia clusters next to ISAT, supporting previous hypotheses
based on trnF (KOCH et al. 2007). C. planisiliqua has been discussed intensively in previous
studies (ANDERSON & WARWICK 1999, WARWICK & SAUDER 2005) but could not be
meaningfully be associated to another position than a member of expanded lineage II.
15.4 Iberis saxatilis
Although diverse sequence residues among I. semperflorens could be detected and a
duplication event is suggested, the tribe IBER is monophyletic in all illustrations and
estimations and consequently holds the identical basal rank in all models applied. IBER
arranges outside the core phylogeny and argues for a shared most recent common ancestor with
Aethionemeae, which is quite unexpected, as the latter named is expected to be the most basal
genus among the Brassicaceae. Although it was recently suggested that the AETH also
underwent the last whole genome duplication (HAUDRY et al. 2013), his indicates that both
Part 4: No End of Trouble
151
chalcone synthase copies from IBER and AETH derive from the same whole genome
duplication event (At-α). Both tribes do not come up with additional loci arranged at another
position within the gene trees. Because the Iberideae are assigned to expanded lineage II, a
more recent directive, near other tribes determined as expanded lineage II members, would be
awaited. This either implies that the sequences of the genus Iberis, or even tribe IBER, hold an
additional locus for the chalcone synthase gene which could not be isolated and identified
during the experimental phase, or, this tribe (or genus) plainly maintained one of the paralogs
after the duplication event, like most of the other tribes, as well. The difference with IBER
therefore is, that the other locus, compared to the majority of all mustards, remained within the
genome. Immediately after the polyploidisation, paralogs are redundant, as they are genes
related via duplication (KOONIN 2005). Therefore, it should not have any consequences which
of the loci is chosen to remain within the genome. The phylogenetic estimations argue for the
fact that the decision which locus to keep does not happen accidentally, otherwise a complete
rearrangement of the gene tree would be the outcome. The original locus, which serves as
matrix, is determined as the preferred one. As the tribe stood out with its high AT content, it
can be argued that this resulted in lower amount of possible nucleotide combinations yielding
to a diverged DNA sequence. However, the source for this increased AT content cannot be
appointed. Cause and effect cannot clearly be distinguished.
In case the available chalcone synthase sequences display only one member of a gene
family and another assumed member would be co-resident, the here available data would
expose an accelerated synonymous substitution rate, due to the fact that evolutionary pressure
would not appeal on the paralog. However, the estimated rate mounts up to 4.77 x 10⁻⁹
synonymous substitutions per site per year. This rate is even slower than calculated rates from
the study at hand and close to the slowest rate (8 x 10⁻⁹) published for that gene.
To make meaningful interpretation of the outcome, a duplication event leaving both
copies among the genome can be excluded while it is argued for a single copy locus, which
exclusively experienced evolutionary incidents, leaving its traces via mutations on the
discussed copy.
15.5 Unassigned taxa Fourraea alpina and Ricotia lunaria
Whether Fourraea alpina’s arrangement among the chalcone synthase cladogram
complies its real position within the Brassicaceae family cannot be revealed here. This is due
to the fact, that the nuclear marker gene, like demonstrated in the employment at hand, has to
be handled with a certain care and should not be addressed as stand-alone reference for
Part 4: No End of Trouble
152
phylogenetic re-arrangements. Moreover, the amount of data for that species is only moderate
and therefore not appropriate to draw valid conclusions from. Though, Fourraea alpine has
been employed in previous reviews, its position is not completely unravelled, yet. Besides, this
is not meant to be a phylogenetic study, so no additional information about morphological data
is available to conclude with reasonable statements. The majority of research, although the
species has not been intensively under examination, suggests an arrangement in the nearer
surrounding of lineage II, close to Sisymbrieae (HEENAN et al. 2002, KOCH et al. 2001).
Rotation of the sequences around the node from lineage II also results in the arrangement of
Fourraea close to SISY.
Ricotia lunaria, which is also net assigned to a tribe yet. Judging on amount of released
announcements, Ricotia is not in the centre of interest, which hampers the evaluation of the
findings received here. From the results gained in this study, the molecular marker chs suggests
for the unassigned specimen Ricotia lunaria an arrangement close to BISC, which does also
not account to a lineage or tribe. Biscutella laevigata, the representative utilised, arranges at a
very basal position outside the core phylogeny.

Part 5: All Done and Dusted – the End of Trouble?
Part 5: All Done and Dusted – the End of Trouble?
154
16 Pitfalls – do always look twice
All tribes and genera causing ambiguities at the phylogenetic level have been
investigated and, where necessary, been excluded from the analysis. This effort resulted in an
adjusted data set, which is supposed to unravel inter- and intra-tribal relationships among the
Brassicaceae family. Some undissolved taxonomic and phylogenetic peculiarities have been
remaining in the data at hand, leaving projection for further investigations.
However, this is due to the fact that phylogenetic reconstructions were all based on the
nuclear-coding chs gene, as this is state of the art. Although it has already been figured out in
the employment at hand that variability, especially among the non-coding gene parts, are
present in some if not in many of the sustained sequences. Therefore, a second view on the
investigated data is inevitable in case it is designated to attach importance to the complete
information provided by the DNA material.
Thus all DNA sequences were screened separately to find intra-species delimitation.
This initially was done by visual inspection of each group of sequences assigned to one species.
Especially the comparison of the complete gene promptly reveals potential candidates showing
off sequence divergence. This, firstly, can be spotted by variations in the sequence length
(mostly insertions and/or deletions) and, secondly by nucleotide composition. An absolute
threshold can hardly be defined, as the range of DNA sequences at hand displays a huge amount
of species with no appropriate background information. No rule of thumb or definitions are
reliably confirmed to clearly discriminate whether gene sequence divergence derives from a
recent or ancient duplication event or from a single ancestral gene in the last common ancestor.
The evolutionary history of genes and genomes depicts combinations of speciation and
duplication events, intermingled with horizontal gene transfer (HGT), gene gain and loss as
well as rearrangement events aggravating to keep track with individual incidences. These
complex webs of relationships can best be understood if the usage and application of imprinted
key terms proceed coherently.
Thus, it is of fundamental priority to distinct at least between the two subcategories of
homologs, namely orthologs and paralogs, as it is critical for reconstructions of robust
evolutionary classifications of genes.
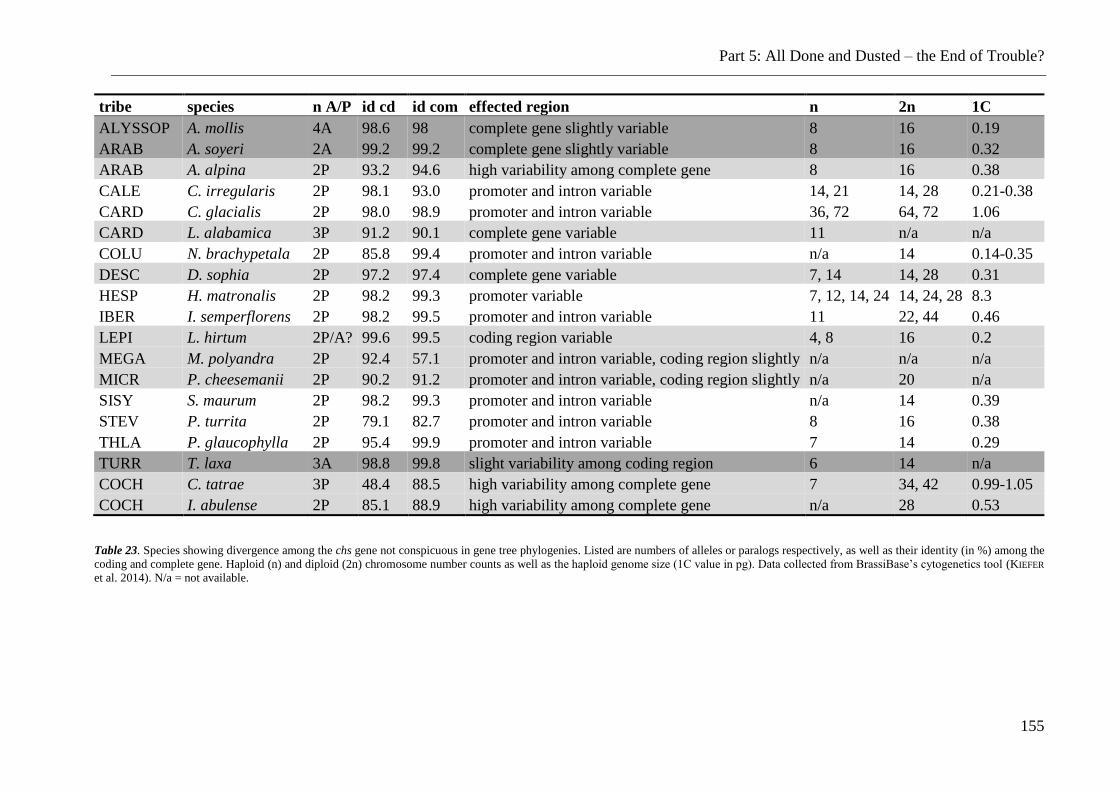
Part 5: All Done and Dusted – the End of Trouble?
155
tribe species n A/P id cd id com effected region n 2n 1C
ALYSSOP A. mollis 4A 98.6 98 complete gene slightly variable 8 16 0.19
ARAB A. soyeri 2A 99.2 99.2 complete gene slightly variable 8 16 0.32
ARAB A. alpina 2P 93.2 94.6 high variability among complete gene 8 16 0.38
CALE C. irregularis 2P 98.1 93.0 promoter and intron variable 14, 21 14, 28 0.21-0.38
CARD C. glacialis 2P 98.0 98.9 promoter and intron variable 36, 72 64, 72 1.06
CARD L. alabamica 3P 91.2 90.1 complete gene variable 11 n/a n/a
COLU N. brachypetala 2P 85.8 99.4 promoter and intron variable n/a 14 0.14-0.35
DESC D. sophia 2P 97.2 97.4 complete gene variable 7, 14 14, 28 0.31
HESP H. matronalis 2P 98.2 99.3 promoter variable 7, 12, 14, 24 14, 24, 28 8.3
IBER I. semperflorens 2P 98.2 99.5 promoter and intron variable 11 22, 44 0.46
LEPI L. hirtum 2P/A? 99.6 99.5 coding region variable 4, 8 16 0.2
MEGA M. polyandra 2P 92.4 57.1 promoter and intron variable, coding region slightly n/a n/a n/a
MICR P. cheesemanii 2P 90.2 91.2 promoter and intron variable, coding region slightly n/a 20 n/a
SISY S. maurum 2P 98.2 99.3 promoter and intron variable n/a 14 0.39
STEV P. turrita 2P 79.1 82.7 promoter and intron variable 8 16 0.38
THLA P. glaucophylla 2P 95.4 99.9 promoter and intron variable 7 14 0.29
TURR T. laxa 3A 98.8 99.8 slight variability among coding region 6 14 n/a
COCH C. tatrae 3P 48.4 88.5 high variability among complete gene 7 34, 42 0.99-1.05
COCH I. abulense 2P 85.1 88.9 high variability among complete gene n/a 28 0.53
Table 23. Species showing divergence among the chs gene not conspicuous in gene tree phylogenies. Listed are numbers of alleles or paralogs respectively, as well as their identity (in %) among the
coding and complete gene. Haploid (n) and diploid (2n) chromosome number counts as well as the haploid genome size (1C value in pg). Data collected from BrassiBase’s cytogenetics tool (KIEFER
et al. 2014). N/a = not available.
Part 5: All Done and Dusted – the End of Trouble?
156
First hint to decide whether a sequence infers orthology is the functionality of the
promoter region which was investigated prior in the work at hand. Intra-species diverged
promoter regions therefore allude to conflicting evolutionary scenarios requiring further
investigations (“promoter-argument”). In addition to that, intra-species sequence identities are
supposed to be very high among orthologous sequences. As already mentioned, a value could
not be finalised to a certain boundary thoroughly indicating vertical descent from an single
ancestral gene (KOONIN 2005). But previous work (KOCH et al. 2000) argues for a
differentiation boarder dividing sequences via estimated identities into alleles or diverged loci.
An intra-species distance p < 1.0 argues for allelic variation among two DNA sequences of one
species, meaning that both slightly diverged homologs display two alleles of one locus and
therefore are orthologs (“identity-argument”). In case the sequences divergence exceeds this
latitude, it can be indicated that two diverged loci within a gene family are present among one
genome, automatically plead for a duplication event. Thus, these sequences typically
characterise paralogous genes. Though, a clear distinction, even coherently defined in theory,
is not absolutely decisive.
Table 23 investigated species which stood out after visual inspection. Note that a certain
amount of tribes listed has already been investigated within another context (ARAB, MEGA,
MICR, IBER, COCH) due to the fact that their moderately identity was obviously present in
gene tree representations. However, examples listed in that table are all those copies which were
not suspected to bear troublesome content.
A. soyeri, A. mollis, as well as T. laxa, marked in dark grey did not appear to hold
unexpected evolutionary incident resulting from its phylogenetic gene tree reconstructions.
Although ARAB as well as TURR, however, demonstrated intra-tribal complications, those
species arranged well within the tree. Only via visual inspection differences became peculiar.
In spite of variability among the complete gene, including the coding parts, it is concluded that
those species solely show allelic variation as no additional evidence could be gathered to
argument for the opposite.
The collected data hints to several, partly contradicting theories. All species in the non-
marked fields depict variations within the non-coding regions, namely the promoter as well as
the intron in the majority of species. Following the argumentations made, these species depict
paralogous chs copies and therefore underwent a duplication event. It can be argued that the
amount of divergence, here identity, can be adducted for a rough determination for the
duplication event. As the accumulation of mutations takes a certain amount of time, a
thoroughgoing argumentation can be drawn: the more the genes are diverged, the longer the
Part 5: All Done and Dusted – the End of Trouble?
157
duplication event dates back. Obviously, no absolute numbers can be named here. Therefore
Pseudoturritis turrita (82.7% identity), as well as Calepina irregularis (93% identity)
underwent a more ancient duplication than the remaining marked species. Actually, some of
these data show identities above the suggested 99% agreeing in one argument, disagreeing in
the other. However, the identities of the complete gene show slightly up to moderately less
identity, most likely indicating recent polyploidisation events. The sequences of the duplicated
loci are also named inparalogs (symparalogs) as they evolved recently and subsequent to a
speciation event.
All species highlighted in light grey display further diverged sequences ranging from
slight variability among the complete gene, over modifications only concerning the coding
region up to complete highly diverged intra-species sequences. They were combined in one
group as they all demonstrate variability having reached the coding exonic gene parts. As the
exonic region encodes the protein, changes and substitutions within its sequences can result in
severe transformations of the gene’s function and functionality. Hence, mutations can only be
accumulated in an evolutionary neglected copy of the functional gene wrecking its capacity.
With exception of L. hirtum, which a) shows a very high sequence identity and b) depicts only
variability within the coding region, all other marked data from that grouping most definitely
portrays two, partly even three, paralogous sequences., while Lepidium could also illustrate
allelic variation. Within these species chs is actually not single-copy. For Leavenworthia
alabamica, e.g., three syntenic chs loci have been detected which derive from three genomic
regions describing the outcome of a triplication event (Schranz, pers. comm.), also supported
via adh (alcohol dehydrogenase). It is argued that the genus Leavenworthia (CHARLESWORTH
et al. 1998) underwent the polyploidisation event after its speciation (KOCH et al. 2000), making
it symparalogs. Granted, but measured on their advanced divergence, it is feasible that the
duplicated copies will undergo functional divergence resulting in pseudogenisation and gene
loss. With Arabis alpina, the interpretation is straight forward. The distinct chs loci derive from
different accessions originating from Europe (AF112084) and Africa (AF112083), comparing
different populations instead of intra-genomic data (KOCH et al. 2000).
To sum this up, patterns of diversity cannot directly be applied on certain evolutionary
events. As is also cannot immediately be concluded from the known ploidy level whether a
locus can or cannot be existent as duplicated. As it has been proven that the Brassicaceae depict
a tendency for polyploidisation as well as subsequent polyploidisation (KASHKUSH et al. 2002,
LYNCH & CONERY 2000, MA & GUSTAFSON 2005, WOLFE 2001) it can be argued that single
gene loci demonstrate a comparable behaviour. A certain trend can be observed showing that
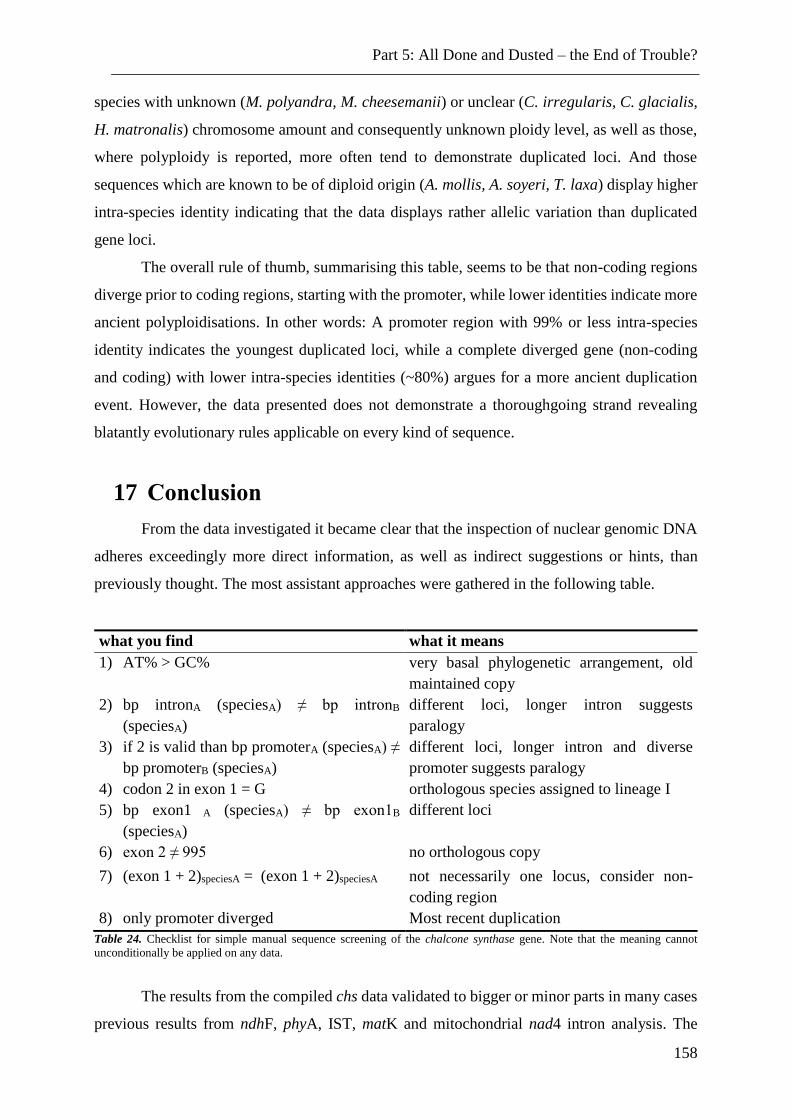
Part 5: All Done and Dusted – the End of Trouble?
158
species with unknown (M. polyandra, M. cheesemanii) or unclear (C. irregularis, C. glacialis,
H. matronalis) chromosome amount and consequently unknown ploidy level, as well as those,
where polyploidy is reported, more often tend to demonstrate duplicated loci. And those
sequences which are known to be of diploid origin (A. mollis, A. soyeri, T. laxa) display higher
intra-species identity indicating that the data displays rather allelic variation than duplicated
gene loci.
The overall rule of thumb, summarising this table, seems to be that non-coding regions
diverge prior to coding regions, starting with the promoter, while lower identities indicate more
ancient polyploidisations. In other words: A promoter region with 99% or less intra-species
identity indicates the youngest duplicated loci, while a complete diverged gene (non-coding
and coding) with lower intra-species identities (~80%) argues for a more ancient duplication
event. However, the data presented does not demonstrate a thoroughgoing strand revealing
blatantly evolutionary rules applicable on every kind of sequence.
17 Conclusion
From the data investigated it became clear that the inspection of nuclear genomic DNA
adheres exceedingly more direct information, as well as indirect suggestions or hints, than
previously thought. The most assistant approaches were gathered in the following table.
what you find what it means
1) AT% > GC% very basal phylogenetic arrangement, old
maintained copy
2) bp intronA (speciesA) ≠ bp intronB
(speciesA)
different loci, longer intron suggests
paralogy
3) if 2 is valid than bp promoterA (speciesA) ≠
bp promoterB (speciesA)
different loci, longer intron and diverse
promoter suggests paralogy
4) codon 2 in exon 1 = G orthologous species assigned to lineage I
5) bp exon1 A (speciesA) ≠ bp exon1B
(speciesA)
different loci
6) exon 2 ≠ 995 no orthologous copy
7) (exon 1 + 2)speciesA = (exon 1 + 2)speciesA not necessarily one locus, consider non-
coding region
8) only promoter diverged Most recent duplication
Table 24. Checklist for simple manual sequence screening of the chalcone synthase gene. Note that the meaning cannot
unconditionally be applied on any data.
The results from the compiled chs data validated to bigger or minor parts in many cases
previous results from ndhF, phyA, IST, matK and mitochondrial nad4 intron analysis. The
Part 5: All Done and Dusted – the End of Trouble?
159
overall tree topology based on chs sequences agreed, after selectively sorting the data, quite
well with molecular phylogenies of the family published to date. In other words: the majority
of the tribes were assigned to lineages I to III, which represent the most well supported groups
above the tribal level in any family-based phylogenetic study these days (LIU et al. 2012).
However, this indicates that the molecular marker discussed here is not perfectly appropriate to
reveal phylogenetic relationships on the genus and species level, at least not without additional
marker systems resolving the data on a small-scale register. Chs is not suitable for resolving
deep phylogenetic relationships between tribes and between groups of tribes. But, as mentioned
right at the beginning, it was never intended to employ a single-locus study for phylogenetic
resolutions.
Moreover, it was intended to combine phylogenetic and molecular genetic perspectives
to gain insight into the gene and genome evolution of the Brassicaceeae. Fundamental
mechanisms were illuminated which could have led to the present situations investigated at the
data at hand. This nuclear encoded gene is capable of delivering further insight into processes
affecting the evolutionary fate of duplicated genome regions and to draw conclusion from.
Divers evolutionary steps within the cyclical process of duplication and divergence can be
described within the tribes of the mustard family, which is of major help to resolve and redraw
the tribal or even taxa specific evolutionary history.
Acknowledgements
160
Acknowledgements
My sincere gratitude goes to Professor Marcus Koch for his support and for offering me
the opportunity to do my dissertation at his department. I am really thankful and appreciate that
decision.
I also want to thank Professor Claudia Erbar for her constructive critique and her
positive and honest feedback and Dr. Andreas Franzke for agreeing to be part of my TAC and
for taking this absolutely seriously. The digital and live discussions were inspiring and of great
help, and also fun.
I also want to thank all members of the lab for manifold kinds of assistance, not only in
terms of help with contrarieties and troubleshooting but also with support in every day business.
Especially I want to thank Dr. Anja Betzin for being my oldest friend in that department, Dr.
Robert Karl for his unbroken will to introduce me over and over again to the ambitious
programme BEAST (etc), the girls from next door (including Florian Michling and those who
already left, like Dr. Paola Ruiz-Duarte) for the friendly relationships, encouragement and
Feierabendbier and, of course, Dr. Roswitha Schmickl for introducing me to scientific practical
and theoretical work. We are/were all in the same boat, thanks for sharing this challenging and
non-recurring time with me.
A special thanks goes to all (Dr. Christina Czajka, Dr. Paola Ruiz-Duarte, Anja Betzin,
Dr. Eileen Schütze, Annika Hoffmann, Dr. Andreas Franzke, Dr. Paul Ding and Dirk Schramm)
who invested a considerable amount of time for proofreading, discussions, as well as critical
and constructive help.
For data support I want to thank Dr. Sara Fuentes Sariano (chs data and discussion),
who previously worked at Missouri Botanical Garden, Facultad de Ciencias, UNAM, Prof. J.
Chris Pires and Dr. Patrick Edger from the University of Missouri (transcriptome data of
Cochlearia pyrenaica).
Moreover, I have to say thanks to Dr. Markus Kiefer for his support with fiddly IT issues
as well for re-establishment of important and accidentally deleted files.
Thanks to the technician, Lisa Kretz, who shared her knowledge, laboratory journal and
agarose gel with me.
I want to thank everyone, not mentioned personally, who supported me somewhere,
sometime if only with the smallest gesture. It is appreciated!
Acknowledgements
161
Besides, I just want to say thank you to my friends in Heidelberg and Mosbach,
especially Dr. Christina Czajka for motivation, advice and her immense assistance with
formatting this thesis, and to Annika Hoffmann for her permanent interest in my progress and
her clear sense of direction helping me to keep track.
My major thankfulness goes to my family, especially to my parents and brother for their
unconditionally support, interest and believe. Thanks for always finding the right words and
telling me that I made the right decisions.
Last but not least, I want to address my deepest gratitude to my fiancé Dirk for just
everything. I couldn’t have made this without your constant support.
Funding of the research project was provided by the Deutsche Forschungsgemeinschaft
(DFG).
An anagram of nuclear is unclear (Karl, pers. comm.).
Literature
162
Literature
AL-SHEHBAZ, I. A. (2006). "The genus Sisymbrium in South America, with synopsesof the
genera Chilocardamum, Mostacillastrum, Neuontobotrys, and Polypsecadium
(Brassicaceae)." Darwiniana, nueva serie 44: 341-358.
AL-SHEHBAZ, I. A. (2012). "A generic and tribal synopsis of the Brassicaceae (Cruciferae)."
Taxon 61(5): 931-954.
AL-SHEHBAZ, I. A. et al. (2006). "Systematics and phylogeny of the Brassicaceae (Cruciferae):
an overview." Plant Systematics and Evolution 259(2-4): 89-120.
AL-SHEHBAZ, I. A. et al. (2011). "Nomenclatural adjustments in the tribe Arabideae
(Brassicaceae)." Plant Diversity and Evolution 129(1): 71-76.
AL-SHEHBAZ, I. A. et al. (2014). "Systematics, Tribal Placements, and Synopses of the
Malcolmia S.L. Segregates (Brassicaceae)." Harvard Papers in Botany 19(1): 53-71.
AL-SHEHBAZ, I. A. et al. (1998). "DELIMITATION OF THE CHINESE GENERA
YINSHANIA, HILLIELLA, AND COCHLEARIELLA (BRASSICACEAE)." Harvard
Papers in Botany 3(1): 79-94.
AL-SHEHBAZ, I. A. & O'KANE, S. L., JR. (2002). "Taxonomy and phylogeny of Arabidopsis
(brassicaceae)." Arabidopsis Book 1: e0001.
AL-SHEHBAZ, I. A. et al. (1999). "Generic Placement of Species Excluded from Arabidopsis
(Brassicaceae)." Novon 9(3): 296-307.
AL-SHEHBAZ, I. A. & WARWICK, S. I. (2007). "TWO NEW TRIBES (DONTOSTEMONEAE
AND MALCOLMIEAE) IN THE BRASSICACEAE (CRUCIFERAE)." Harvard
Papers in Botany 12(2): 429-433.
AMTMANN, A. (2009). "Learning from evolution: Thellungiella generates new knowledge on
essential and critical components of abiotic stress tolerance in plants." Mol Plant 2(1):
3-12.
ANDERSON, J. & WARWICK, S. (1999). "Chromosome number evolution in the tribeBrassiceae
(Brassicaceae): Evidence from isozyme number." Plant Systematics and Evolution
215(1-4): 255-285.
APPLE, O. & AL-SHEHBAZ, I. (2002). Cruciferae. The Families and Genera of Vascular Plants
K. Kubitzki. Berlin, Heidelberg, New York, Springer Verlag: 75-174.
Literature
163
AUSTIN, M. B. & NOEL, J. P. (2003). "The chalcone synthase superfamily of type III polyketide
synthases." Nat Prod Rep 20(1): 79-110.
BAILEY, C. D. et al. (2006). "Toward a global phylogeny of the Brassicaceae." Mol Biol Evol
23(11): 2142-2160.
BAILEY, T. L. et al. (2009). "MEME SUITE: tools for motif discovery and searching." Nucleic
Acids Res 37(Web Server issue): W202-208.
BARKER, M. S. et al. (2009). "Paleopolyploidy in the Brassicales: analyses of the Cleome
transcriptome elucidate the history of genome duplications in Arabidopsis and other
Brassicales." Genome Biol Evol 1: 391-399.
BEILSTEIN, M. A. et al. (2006). "Brassicaceae phylogeny and trichome evolution." Am J Bot
93(4): 607-619.
BEILSTEIN, M. A. et al. (2008). "Brassicaceae phylogeny inferred from phytochrome A and
ndhF sequence data: tribes and trichomes revisited." Am J Bot 95(10): 1307-1327.
BEILSTEIN, M. A. et al. (2010). "Dated molecular phylogenies indicate a Miocene origin for
Arabidopsis thaliana." Proc Natl Acad Sci U S A 107(43): 18724-18728.
BELAEVA, V. A. & SIPLIVINSKY, V. N. (1975). "Chromosome numbers and taxonomy of some
species of Baikal flora." Bot. Zhurn. 60: 864-872.
BELL, C. D. et al. (2010). "The age and diversification of the angiosperms re-revisited." Am J
Bot 97(8): 1296-1303.
BENSON, D. A. et al. (2009). "GenBank." Nucleic Acids Res 37(Database issue): D26-31.
BHIDE, A. et al. (2014). "Analysis of the floral transcriptome of Tarenaya hassleriana
(Cleomaceae), a member of the sister group to the Brassicaceae: towards understanding
the base of morphological diversity in Brassicales." BMC Genomics 15: 140.
BHIDE, S. A. et al. (2009). "Radiation-induced Xerostomia: Pathophysiology, Prevention and
Treatment." Clinical Oncology 21(10): 737-744.
BLANC, G. et al. (2003). "A recent polyploidy superimposed on older large-scale duplications
in the Arabidopsis genome." Genome Res 13(2): 137-144.
BLANC, G. & WOLFE, K. H. (2004). "Functional divergence of duplicated genes formed by
polyploidy during Arabidopsis evolution." Plant Cell 16(7): 1679-1691.
BOSS, P. K. et al. (1996). "Analysis of the Expression of Anthocyanin Pathway Genes in
Developing Vitis vinifera L. cv Shiraz Grape Berries and the Implications for Pathway
Regulation." Plant Physiol 111(4): 1059-1066.
BOWERS, J. E. et al. (2003). "Unravelling angiosperm genome evolution by phylogenetic
analysis of chromosomal duplication events." Nature 422(6930): 433-438.
Literature
164
BOWMAN, J. L. et al. (1999). "Evolutionary Changes in Floral Structure within Lepidium L.
(Brassicaceae)." Int J Plant Sci 160(5): 917-929.
BRESINSKY, A. & GRAU, J. (1970). Zur Chorologie und Systematik von Biscutella im
Bayerischen Alpenvorland. Ber. Bayer. Bot. Ges. Munich, Germany. 42: 101-108.
BRESSAN, R. A. et al. (2001). "Learning from the Arabidopsis experience. The next gene search
paradigm." Plant Physiol 127(4): 1354-1360.
BROCHMANN, C. (1992). "Pollen and seed morphology of Nordic Draba (Brassicaceae):
phylogenetic and ecological implications." Nordic Journal of Botany 12(6): 657-673.
BROOKS, D. R. (1999). "Phylogenies and the Comparative Method in Animal Behavior, Edited
by Emiia P. Martins, Oxford University Press, 1996. X+415 pp., ISBN 0-19-509210-
4." Behav Processes 47(2): 135-136.
BROUGHTON, R. E. et al. (2000). "Quantification of homoplasy for nucleotide transitions and
transversions and a reexamination of assumptions in weighted phylogenetic analysis."
Syst Biol 49(4): 617-627.
CAIN, C. C. et al. (1997). "Expression of chalcone synthase and chalcone isomerase proteins in
Arabidopsis seedlings." Plant Mol Biol 35(3): 377-381.
CAO, J. & SHI, F. (2012). "Evolution of the RALF Gene Family in Plants: Gene Duplication and
Selection Patterns." Evol Bioinform Online 8: 271-292.
CHARGAFF, E. et al. (1952). "Composition of the desoxypentose nucleic acids of four genera of
sea-urchin." J Biol Chem 195(1): 155-160.
CHARLESWORTH, D. et al. (1998). "The evolution of the alcohol dehydrogenase gene family by
loss of introns in plants of the genus Leavenworthia (Brassicaceae)." Mol Biol Evol
15(5): 552-559.
CLEAL, C. J. et al. (2001). Mesozoic and Tertiary Palaeobotany of Great Britain. Peterborough.
COBERLY, L. C. & RAUSHER, M. D. (2003). "Analysis of a chalcone synthase mutant in Ipomoea
purpurea reveals a novel function for flavonoids: amelioration of heat stress." Mol Ecol
12(5): 1113-1124.
COMERON, J. M. & AGUADE, M. (1998). "An evaluation of measures of synonymous codon
usage bias." J Mol Evol 47(3): 268-274.
COMERON, J. M. & KREITMAN, M. (2000). "The correlation between intron length and
recombination in drosophila. Dynamic equilibrium between mutational and selective
forces." Genetics 156(3): 1175-1190.
Literature
165
CONNER, J. K. et al. (2009). "Tests of adaptation: functional studies of pollen removal and
estimates of natural selection on anther position in wild radish." Ann Bot 103(9): 1547-
1556.
CONRAD, B. & ANTONARAKIS, S. E. (2007). "Gene duplication: a drive for phenotypic diversity
and cause of human disease." Annu Rev Genomics Hum Genet 8: 17-35.
COSTANTINI, M. & BERNARDI, G. (2008). "The short-sequence designs of isochores from the
human genome." Proc Natl Acad Sci U S A 105(37): 13971-13976.
COUVREUR, T. L. et al. (2010). "Molecular phylogenetics, temporal diversification, and
principles of evolution in the mustard family (Brassicaceae)." Mol Biol Evol 27(1): 55-
71.
COUVREUR, T. L. P. et al. (2010). "Molecular Phylogenetics, Temporal Diversification, and
Principles of Evolution in the Mustard Family (Brassicaceae)." Molecular Biology and
Evolution 27(1): 55-71.
CREPET, W. & NIXON, K. (1998). "Fossil Clusiaceae from the late Cretaceous (Turonian) of
New Jersey and implications regarding the history of bee pollination." Am J Bot 85(8):
1122.
CRONQUIST, A. (1981). An Integrated System of Classification of Flowering Plants, Columbia
University Press.
CROSBY, K. C. et al. (2011). "Forster resonance energy transfer demonstrates a flavonoid
metabolon in living plant cells that displays competitive interactions between enzymes."
FEBS Lett 585(14): 2193-2198.
DAUGHERTY, L. C. et al. (2012). "Gene family matters: expanding the HGNC resource." Hum
Genomics 6(1): 4.
DE BODT, S. et al. (2005). "Genome duplication and the origin of angiosperms." Trends Ecol
Evol 20(11): 591-597.
DE MEAUX, J. et al. (2005). "Allele-specific assay reveals functional variation in the chalcone
synthase promoter of Arabidopsis thaliana that is compatible with neutral evolution."
Plant Cell 17(3): 676-690.
DE SMET, R. & VAN DE PEER, Y. (2012). "Redundancy and rewiring of genetic networks
following genome-wide duplication events." Curr Opin Plant Biol 15(2): 168-176.
DE SOUZA, S. J. (2003). "The emergence of a synthetic theory of intron evolution." Genetica
118(2-3): 117-121.
DICKINSON, H. et al. (2012). "Epigenetic neofunctionalisation and regulatory gene evolution in
grasses." Trends Plant Sci 17(7): 389-394.
Literature
166
DOBES, C. H. et al. (2004). "Extensive chloroplast haplotype variation indicates Pleistocene
hybridization and radiation of North American Arabis drummondii, A. x divaricarpa,
and A. holboellii (Brassicaceae)." Mol Ecol 13(2): 349-370.
DOPAZO, J. (1994). "Estimating errors and confidence intervals for branch lengths in
phylogenetic trees by a bootstrap approach." J Mol Evol 38(3): 300-304.
DOVER, G. (1982). "Molecular drive: a cohesive mode of species evolution." Nature 299(5879):
111-117.
DOYLE, J. J. & DOYLE, J. L. (1987). "A rapid DNA isolation procedure for small quantities of
fresh leaf tissue." Phytochemical Bulletin 19: 11-15.
DOYLE, J. J. et al. (2008). "Evolutionary genetics of genome merger and doubling in plants."
Annu Rev Genet 42: 443-461.
DRUMMOND, A. J. et al. (2006). "Relaxed phylogenetics and dating with confidence." PLoS
Biol 4(5): e88.
DRUMMOND, A. J. & RAMBAUT, A. (2007). "BEAST: Bayesian evolutionary analysis by
sampling trees." BMC Evol Biol 7: 214.
DRUMMOND, A. J. et al. (2012). "Bayesian phylogenetics with BEAUti and the BEAST 1.7."
Mol Biol Evol 29(8): 1969-1973.
DURBIN, M. L. et al. (1995). "Evolution of the chalcone synthase gene family in the genus
Ipomoea." Proc Natl Acad Sci U S A 92(8): 3338-3342.
DURBIN, M. L. et al. (2000). "Molecular evolution of the chalcone synthase multigene family
in the morning glory genome." Plant Mol Biol 42(1): 79-92.
EDGAR, R. C. (2004). "MUSCLE: multiple sequence alignment with high accuracy and high
throughput." Nucleic Acids Res 32(5): 1792-1797.
EDGER, P. P. et al. (2014). "Secondary Structure Analyses of the Nuclear rRNA Internal
Transcribed Spacers and Assessment of Its Phylogenetic Utility across the Brassicaceae
(Mustards)." PLoS One 9(7): e101341.
ELSON, D. & CHARGAFF, E. (1952). "On the desoxyribonucleic acid content of sea urchin
gametes." Experientia 8(4): 143-145.
ERMOLAEVA, M. et al. (2003). "The age of the Arabidopsis thaliana genome duplication." Plant
Molecular Biology 51(6): 859-866.
ESWAR, N. et al. (2007). "Comparative protein structure modeling using MODELLER." Curr
Protoc Protein Sci Chapter 2: Unit 2 9.
EYRE-WALKER, A. & HURST, L. D. (2001). "The evolution of isochores." Nat Rev Genet 2(7):
549-555.
Literature
167
FARZAD, M. et al. (2005). "Molecular evolution of the chalcone synthase gene family and
identification of the expressed copy in flower petal tissue of Viola cornuta." Plant
Science 168(4): 1127-1134.
FAWCETT, J. A. et al. (2009). "Plants with double genomes might have had a better chance to
survive the Cretaceous-Tertiary extinction event." Proc Natl Acad Sci U S A 106(14):
5737-5742.
FELSENSTEIN, J. (1978). "The Number of Evolutionary Trees." Systematic Zoology 27(1): 27-
33.
FELSENSTEIN, J. (1985). "Confidence Limits on Phylogenies: An Approach Using the
Bootstrap." Evolution 39(4): 783-791.
FITCH, W. M. (1970). "Distinguishing homologous from analogous proteins." Syst Zool 19(2):
99-113.
FLAVELL, R. B. et al. (1998). "Transgene-promoted epigenetic switches of chalcone synthase
activity in petunia plants." Novartis Found Symp 214: 144-154; discussion 154-167.
FORSDYKE, D. R. (2004). "REGIONS OF RELATIVE GC% UNIFORMITY ARE
RECOMBINATIONAL ISOLATORS." Journal of Biological Systems 12(03): 261-
271.
FRANZKE, A. et al. (2009). "<i
xmlns="http://pub2web.metastore.ingenta.com/ns/">Arabidopsis</i> family ties:
molecular phylogeny and age estimates in Brassicaceae." Taxon 58(2): 425-437.
FRANZKE, A. et al. (2011). "Cabbage family affairs: the evolutionary history of Brassicaceae."
Trends Plant Sci 16(2): 108-116.
FUENTES-SORIANO, S. & AL-SHEHBAZ, I. (2013). "Phylogenetic Relationships of Mustards with
Multiaperturate Pollen (Physarieae, Brassicaceae) Based on the Plastid ndhF Gene:
Implications for Morphological Diversification." Systematic Botany 38(1): 178-191.
FUSSY, Z. et al. (2013). "Imbalance in expression of hop (Humulus lupulus) chalcone synthase
H1 and its regulators during hop stunt viroid pathogenesis." J Plant Physiol 170(7): 688-
695.
GERMAN, D. et al. (2009). "Contribution to ITS phylogeny of the Brassicaceae, with special
reference to some Asian taxa." Plant Systematics and Evolution 283(1-2): 33-56.
GERMAN, D. A. & AL-SHEHBAZ, I. A. (2010). "Nomenclatural novelties in miscellaneous Asian
Brassicaceae (Cruciferae)." Nordic Journal of Botany 28(6): 646-651.
GILIS, D. et al. (2001). "Optimality of the genetic code with respect to protein stability and
amino-acid frequencies." Genome Biol 2(11): RESEARCH0049.
Literature
168
GOJOBORI, T. (1983). "Codon substitution in evolution and the "saturation" of synonymous
changes." Genetics 105(4): 1011-1027.
GOODSTEIN, D. M. et al. (2012). "Phytozome: a comparative platform for green plant
genomics." Nucleic Acids Res 40(Database issue): D1178-1186.
GRAUR, D. (1985). "Amino acid composition and the evolutionary rates of protein-coding
genes." J Mol Evol 22(1): 53-62.
HALL, B. G. (2006). "Simple and accurate estimation of ancestral protein sequences." Proc Natl
Acad Sci U S A 103(14): 5431-5436.
HALL, B. G. (2011). Phylogenetic Trees Made Easy: A How-To Manual. Massachusetts,
Sinauer Associates, Inc. Publishers.
HALL, J. C. et al. (2002). "Phylogeny of Capparaceae and Brassicaceae based on chloroplast
sequence data." Am J Bot 89(11): 1826-1842.
HAUDRY, A. et al. (2013). "An atlas of over 90,000 conserved noncoding sequences provides
insight into crucifer regulatory regions." Nat Genet 45(8): 891-898.
HAYEK, A. (1911). "Entwurf eines Cruciferensystemes auf phylogenetischer Grundlage."
Beihefte Botanisches Centralblatt 27: 127-335.
HEENAN, P. B. et al. (2002). "Molecular systematics of the New Zealand Pachycladon
(Brassicaceae) complex: Generic circumscription and relationships to Arabidopsis sens.
lat. and Arabis sens. lat." New Zealand Journal of Botany 40(4): 543-562.
HEMLEBEN, V. et al. (2004). "Characterization and structural features of a chalcone synthase
mutation in a white-flowering line of Matthiola incana R. Br. (Brassicaceae)." Plant Mol
Biol 55(3): 455-465.
HO, M. R. et al. (2010). "Gene-oriented ortholog database: a functional comparison platform
for orthologous loci." Database (Oxford) 2010: baq002.
HO, S. Y. M. (2007). "Calibrating molecular estimates of substitution rates and divergence times
in birds." Journal of Avian Biology 38(4): 409-414.
HORMOZ, S. (2013). "Amino acid composition of proteins reduces deleterious impact of
mutations." Sci. Rep. 3.
HOWLES, P. A. et al. (1995). "Nucleotide sequence of additional members of the gene family
encoding chalcone synthase in Trifolium subterraneum." Plant Physiol 107(3): 1035-
1036.
HU, T. T. et al. (2011). "The Arabidopsis lyrata genome sequence and the basis of rapid genome
size change." Nat Genet 43(5): 476-481.
Literature
169
HUANG, L. et al. (2012). "Differential expression of benzophenone synthase and chalcone
synthase in Hypericum sampsonii." Nat Prod Commun 7(12): 1615-1618.
HUGHES, A. L. et al. (2000). "Adaptive diversification within a large family of recently
duplicated, placentally expressed genes." Proc Natl Acad Sci U S A 97(7): 3319-3323.
HURKA, H. et al. (1989). "Aspartate aminotransferase isozymes in the genus Capsella
(Brassicaceae): subcellular location, gene duplication, and polymorphism." Biochem
Genet 27(1-2): 77-90.
IHAKA, R. & GENTLEMAN, R. (1996). "R: A Language for Data Analysis and Graphics." Journal
of Computational and Graphical Statistics 5(3): 299-314.
INAN, G. et al. (2004). "Salt cress. A halophyte and cryophyte Arabidopsis relative model
system and its applicability to molecular genetic analyses of growth and development
of extremophiles." Plant Physiol 135(3): 1718-1737.
INGROUILLE, M. J. & SMIRNOFF, N. (1986). "THLASPI CAERULESCENS J. & C. PRESL. (T.
ALPESTRE L.) IN BRITAIN." New Phytologist 102(1): 219-233.
INNAN, H. (2011). "Special Issue: Gene Conversion in Duplicated Genes." Genes 2(2): 394-
396.
IRWIN, R. E. et al. (2003). "The Role of Herbivores in the Maintenance of a Flower Color
Polymorphism in Wild Radish." Ecology 84(7): 1733-1743.
ITZKOVITZ, S. & ALON, U. (2007). "The genetic code is nearly optimal for allowing additional
information within protein-coding sequences." Genome Res 17(4): 405-412.
JACKSON, R. C. & CASEY, J. (1979). "Cytogenetics of polyploids." Basic Life Sci 13: 17-44.
JAILLON, O. et al. (2007). "The grapevine genome sequence suggests ancestral hexaploidization
in major angiosperm phyla." Nature 449(7161): 463-467.
JANCHEN, E. (1942). "Das System der Cruciferen." Österreichische botanische Zeitschrift 91(1):
1-28.
JEZ, J. M. & NOEL, J. P. (2000). "Mechanism of chalcone synthase. pKa of the catalytic cysteine
and the role of the conserved histidine in a plant polyketide synthase." J Biol Chem
275(50): 39640-39646.
JIAO, Y. et al. (2012). "A genome triplication associated with early diversification of the core
eudicots." Genome Biology 13(1): R3.
JOHNSTON, J. S. et al. (2005). "Evolution of genome size in Brassicaceae." Ann Bot 95(1): 229-
235.
Literature
170
JOLY, S. et al. (2009). "A Pleistocene inter-tribal allopolyploidization event precedes the species
radiation of Pachycladon (Brassicaceae) in New Zealand." Mol Phylogenet Evol 51(2):
365-372.
JONES, D. T. et al. (1992). "The rapid generation of mutation data matrices from protein
sequences." Comput Appl Biosci 8(3): 275-282.
JOOS, H. J. & HAHLBROCK, K. (1992). "Phenylalanine ammonia-lyase in potato (Solanum
tuberosum L.). Genomic complexity, structural comparison of two selected genes and
modes of expression." Eur J Biochem 204(2): 621-629.
KARL, R. et al. (2012). "Systematics and evolution of Arctic-Alpine Arabis alpina
(Brassicaceae) and its closest relatives in the eastern Mediterranean." Am J Bot 99(4):
778-794.
KARL, R. & KOCH, M. A. (2013). "A world-wide perspective on crucifer speciation and
evolution: phylogenetics, biogeography and trait evolution in tribe Arabideae." Ann Bot
112(6): 983-1001.
KARLIN, S. et al. (1998). "Comparative DNA analysis across diverse genomes." Annu Rev
Genet 32: 185-225.
KARLIN, S. & LADUNGA, I. (1994). "Comparisons of eukaryotic genomic sequences." Proc Natl
Acad Sci U S A 91(26): 12832-12836.
KARLIN, S. et al. (1994). "Heterogeneity of genomes: measures and values." Proc Natl Acad Sci
U S A 91(26): 12837-12841.
KASHKUSH, K. et al. (2002). "Gene loss, silencing and activation in a newly synthesized wheat
allotetraploid." Genetics 160(4): 1651-1659.
KELLIS, M. et al. (2004). "Proof and evolutionary analysis of ancient genome duplication in the
yeast Saccharomyces cerevisiae." Nature 428(6983): 617-624.
KERSEY, P. J. et al. (2014). "Ensembl Genomes 2013: scaling up access to genome-wide data."
Nucleic Acids Res 42(Database issue): D546-552.
KHALIK, K. A. (2002). "SEED MORPHOLOGY OF SOME TRIBES OF BRASSICACEAE
(IMPLICATIONS FOR TAXONOMY AND SPECIES IDENTIFICATION FOR THE
FLORA OF EGYPT)." Blumea 47(2): 363-383.
KIEFER, M. et al. (2014). "BrassiBase: introduction to a novel knowledge database on
Brassicaceae evolution." Plant Cell Physiol 55(1): e3.
KIMURA, M. (1980). "A simple method for estimating evolutionary rates of base substitutions
through comparative studies of nucleotide sequences." J Mol Evol 16(2): 111-120.
Literature
171
KOCH, M. et al. (2001). "Molecular systematics of the Brassicaceae: evidence from coding
plastidic matK and nuclear Chs sequences." American Journal of Botany 88(3): 534-
544.
KOCH, M. et al. (2001). "Molecular systematics of the Brassicaceae: evidence from coding
plastidic matK and nuclear Chs sequences." Am J Bot 88(3): 534-544.
KOCH, M. & MUMMENHOFF, K. (2001). "Thlaspi s.str. (Brassicaceae) versus Thlaspi s.l.:
morphological and anatomical characters in the light of ITS nrDNA sequence data."
Plant Systematics and Evolution 227(3-4): 209-225.
KOCH, M. A.-S., IHSAN A (2000). "Molecular Systematics of the Chinese Yinshania
(Brassicaceae): Evidence from Plastid and Nuclear Its DNA Sequence Data." Annals of
the Missouri Botanical Garden 87.
KOCH, M. A.-S., IHSAN A MUMMENHOFF, KLAUS (2003). "Molecular Systematics, Evolution,
and Population Biology in the Mustard Family (Brassicaceae)." Annals of the Missouri
Botanical Garden 90.
KOCH, M. A. (2012). "Mid-Miocene divergence of <i>Ionopsidium</i> and <i>Cochlearia</i>
and its impact on the systematics and biogeography of the tribe Cochlearieae
(Brassicaceae)." Taxon 61(1): 76-92.
KOCH, M. A. & AL-SHEHBAZ, I. (2009). "Molecular systematics and evolution of “wild”
crucifers (Brassicaceae or Cruciferae)." Biology and Breeding of Crucifers: 1-18.
KOCH, M. A. et al. (2007). "Supernetwork identifies multiple events of plastid trnF(GAA)
pseudogene evolution in the Brassicaceae." Mol Biol Evol 24(1): 63-73.
KOCH, M. A. et al. (2005). "Evolution of the trnF(GAA) gene in Arabidopsis relatives and the
brassicaceae family: monophyletic origin and subsequent diversification of a plastidic
pseudogene." Mol Biol Evol 22(4): 1032-1043.
KOCH, M. A. et al. (2003). "Multiple hybrid formation in natural populations: concerted
evolution of the internal transcribed spacer of nuclear ribosomal DNA (ITS) in North
American Arabis divaricarpa (Brassicaceae)." Mol Biol Evol 20(3): 338-350.
KOCH, M. A. & GERMAN, D. (2013). "Taxonomy and systematics are key to biological
information: Arabidopsis, Eutrema (Thellungiella), Noccaea and Schrenkiella
(Brassicaceae) as examples." Frontiers in Plant Science 4.
KOCH, M. A. & GERMAN, D. A. (2013). "Taxonomy and systematics are key to biological
information: Arabidopsis, Eutrema (Thellungiella), Noccaea and Schrenkiella
(Brassicaceae) as examples." Front Plant Sci 4: 267.
Literature
172
KOCH, M. A. et al. (2000). "Comparative evolutionary analysis of chalcone synthase and alcohol
dehydrogenase loci in Arabidopsis, Arabis, and related genera (Brassicaceae)." Mol
Biol Evol 17(10): 1483-1498.
KOCH, M. A. & MARHOLD, K. (2012). "Phylogeny and systematics of Brassicaceae —
Introduction." Taxon 61(5): 929-930.
KOCH, M. A. & MUMMENHOFF, K. (2006). "Editorial: Evolution and phylogeny of the
Brassicaceae." Plant Systematics and Evolution 259(2-4): 81-83.
KODURI, P. K. et al. (2010). "Genome-wide analysis of the chalcone synthase superfamily genes
of Physcomitrella patens." Plant Mol Biol 72(3): 247-263.
KOES, R. et al. (2005). "Flavonoids: a colorful model for the regulation and evolution of
biochemical pathways." Trends Plant Sci 10(5): 236-242.
KOES, R. E. et al. (1989). "The chalcone synthase multigene family of Petunia hybrida (V30):
differential, light-regulated expression during flower development and UV light
induction." Plant Mol Biol 12(2): 213-225.
KOONIN, E. V. (2005). "Orthologs, paralogs, and evolutionary genomics." Annu Rev Genet 39:
309-338.
KOOTSTRA, A. (1994). "Protection from UV-B-induced DNA damage by flavonoids." Plant
Mol Biol 26(2): 771-774.
KOZAK, M. (1999). "Initiation of translation in prokaryotes and eukaryotes." Gene 234(2): 187-
208.
KRAMER, U. (2010). "Metal hyperaccumulation in plants." Annu Rev Plant Biol 61: 517-534.
KUIKEN, C. et al. (2005). "The Los Alamos HCV Sequence Database." Bioinformatics 21(3):
379-384.
LAMESCH, P. et al. (2012). "The Arabidopsis Information Resource (TAIR): improved gene
annotation and new tools." Nucleic Acids Res 40(Database issue): D1202-1210.
LAROCHE, J. et al. (1997). "Molecular evolution of angiosperm mitochondrial introns and
exons." Proc Natl Acad Sci U S A 94(11): 5722-5727.
LEE, J. Y. et al. (2002). "Allopolyploidization and evolution of species with reduced floral
structures in Lepidium L. (Brassicaceae)." Proc Natl Acad Sci U S A 99(26): 16835-
16840.
LEWIS, W. H. (1979). "Polyploidy in angiosperms: dicotyledons." Basic Life Sci 13: 241-268.
LIHOVA, J. et al. (2006). "Worldwide phylogeny and biogeography of Cardamine flexuosa
(Brassicaceae) and its relatives." Am J Bot 93(8): 1206-1221.
Literature
173
LIHOVA, J. et al. (2006). "Allopolyploid origin of Cardamine asarifolia (Brassicaceae):
incongruence between plastid and nuclear ribosomal DNA sequences solved by a single-
copy nuclear gene." Mol Phylogenet Evol 39(3): 759-786.
LIU, L. et al. (2012). "PHYLOGENETIC RELATIONSHIPS OF BRASSICACEAE SPECIES
BASED ON MATK SEQUENCES " Pakistan Journal of Botany 44(2): 619-626.
LIU, L. et al. (2012). "PHYLOGENETIC RELATIONSHIPS OF BRASSICACEAE SPECIES
BASED ON MATK SEQUENCES." Pak J Biol Sci 44(2): 619-626.
LIU, T. et al. (2013). "[Relationship between expression of chalcone synthase gene (CHS) and
scutellarin content in Erigeron breviscapus]." Zhongguo Zhong Yao Za Zhi 38(14):
2241-2244.
LOBREAUX, S. et al. (2014). "Development of an Arabis alpina genomic contig sequence data
set and application to single nucleotide polymorphisms discovery." Mol Ecol Resour
14(2): 411-418.
LOBRY, J. R. & GAUTIER, C. (1994). "Hydrophobicity, expressivity and aromaticity are the
major trends of amino-acid usage in 999 Escherichia coli chromosome-encoded genes."
Nucleic Acids Research 22(15): 3174-3180.
LYNCH, M. (2002). "Intron evolution as a population-genetic process." Proc Natl Acad Sci U S
A 99(9): 6118-6123.
LYNCH, M. & CONERY, J. S. (2000). "The evolutionary fate and consequences of duplicate
genes." Science 290: 1151-1155.
LYNCH, M. & FORCE, A. (2000). "The probability of duplicate gene preservation by
subfunctionalization." Genetics 154(1): 459-473.
LYONS, E. & FREELING, M. (2008). "How to usefully compare homologous plant genes and
chromosomes as DNA sequences." Plant J 53(4): 661-673.
LYONS, E. et al. (2008). "Finding and comparing syntenic regions among Arabidopsis and the
outgroups papaya, poplar, and grape: CoGe with rosids." Plant Physiol 148(4): 1772-
1781.
LYSAK, M. A. et al. (2009). "The dynamic ups and downs of genome size evolution in
Brassicaceae." Mol Biol Evol 26(1): 85-98.
LYSAK, M. A. et al. (2005). "Chromosome triplication found across the tribe Brassiceae."
Genome Res 15(4): 516-525.
LYSAK, M. A. & LEXER, C. (2006). "Towards the era of comparative evolutionary genomics in
Brassicaceae." Plant Systematics and Evolution 259(2-4): 175-198.
Literature
174
MA, X. F. & GUSTAFSON, J. P. (2005). "Genome evolution of allopolyploids: a process of
cytological and genetic diploidization." Cytogenet Genome Res 109(1-3): 236-249.
MANDAKOVA, T. et al. (2010). "Fast diploidization in close mesopolyploid relatives of
Arabidopsis." Plant Cell 22(7): 2277-2290.
MARTIN, C. R. (1993). "Structure, function, and regulation of the chalcone synthase." Int Rev
Cytol 147: 233-284.
MASTERSON, J. (1994). "Stomatal size in fossil plants: evidence for polyploidy in majority of
angiosperms." Science 264(5157): 421-424.
MATOUSEK, J. et al. (2006). "Sequence analysis of a "true" chalcone synthase (chs_H1)
oligofamily from hop (Humulus lupulus L.) and PAP1 activation of chs_H1 in
heterologous systems." J Agric Food Chem 54(20): 7606-7615.
MAZEL, D. & MARLIERE, P. (1989). "Adaptive eradication of methionine and cysteine from
cyanobacterial light-harvesting proteins." Nature 341(6239): 245-248.
MILLER, M. A. et al. (2010). Creating the CIPRES Science Gateway for inference of large
phylogenetic trees. Gateway Computing Environments Workshop (GCE), 2010.
MING, R. et al. (2008). "The draft genome of the transgenic tropical fruit tree papaya (Carica
papaya Linnaeus)." Nature 452(7190): 991-996.
MITCHELL-OLDS, T. et al. (2004). Crucifer Evolution in the Post-Genomic Era. Plant Diversity
and Evolution, Genotypic and Phenotypic Variation in Higher Plants. R. Henry, CABI
Press: 119 - 138.
MONDRAGON-PALOMINO, M. & GAUT, B. S. (2005). "Gene conversion and the evolution of
three leucine-rich repeat gene families in Arabidopsis thaliana." Mol Biol Evol 22(12):
2444-2456.
MOURIER, T. & JEFFARES, D. C. (2003). "Eukaryotic intron loss." Science 300(5624): 1393.
MUMMENHOFF, K. et al. (1997). "Molecular data reveal convergence in fruit characters used in
the classification ofThlaspi s. l.(Brassicaceae)." Botanical Journal of the Linnean
Society 125(3): 183-199.
MUSE, S. V. & GAUT, B. S. (1994). "A likelihood approach for comparing synonymous and
nonsynonymous nucleotide substitution rates, with application to the chloroplast
genome." Mol Biol Evol 11(5): 715-724.
MUSE, S. V. & WEIR, B. S. (1992). "Testing for equality of evolutionary rates." Genetics 132(1):
269-276.
NEI, M. & GOJOBORI, T. (1986). "Simple methods for estimating the numbers of synonymous
and nonsynonymous nucleotide substitutions." Mol Biol Evol 3(5): 418-426.
Literature
175
NEI, M. & KUMURA, S. (2000). Molecular Evolution and Phylogenetics. New York, Oxford
University Press.
NEI, M. et al. (2000). "Purifying selection and birth-and-death evolution in the ubiquitin gene
family." Proc Natl Acad Sci U S A 97(20): 10866-10871.
NIIMURA, Y. et al. (2003). "Comparative analysis of the base biases at the gene terminal portions
in seven eukaryote genomes." Nucleic Acids Res 31(17): 5195-5201.
NIXON, K. C. (1999). "The Parsimony Ratchet, a New Method for Rapid Parsimony Analysis."
Cladistics 15(4): 407-414.
O'KANE, S. L., JR. (2003). "Phylogenetic position and generic limits of Arabidopsis
(Brassicaceae) based on sequences of nuclear ribosomal DNA." Annals of the Missouri
Botanical Garden v. 90 2003.
OGDEN, T. H. & ROSENBERG, M. S. (2006). "Multiple sequence alignment accuracy and
phylogenetic inference." Syst Biol 55(2): 314-328.
OHNO, S. et al. (1968). "Evolution from fish to mammals by gene duplication." Hereditas 59(1):
169-187.
OKADA, Y. et al. (2003). "Construction of gene expression system in hop (Humulus lupulus)
lupulin gland using valerophenone synthase promoter." J Plant Physiol 160(9): 1101-
1108.
OKADA, Y. et al. (2004). "Enzymatic reactions by five chalcone synthase homologs from hop
(Humulus lupulus L.)." Biosci Biotechnol Biochem 68(5): 1142-1145.
OKONECHNIKOV, K. et al. (2012). "Unipro UGENE: a unified bioinformatics toolkit."
Bioinformatics 28(8): 1166-1167.
OMLAND, K. E. (1999). "The Assumptions and Challenges of Ancestral State Reconstructions."
Systematic Biology 48(3): 604-611.
OWENS, D. K. et al. (2008). "Functional Analysis of a Predicted Flavonol Synthase Gene Family
in Arabidopsis." Plant Physiology 147(3): 1046-1061.
PARADIS, E. et al. (2004). "APE: Analyses of Phylogenetics and Evolution in R language."
Bioinformatics 20(2): 289-290.
PAULSEN, I. T. et al. (2005). "Complete genome sequence of the plant commensal Pseudomonas
fluorescens Pf-5." Nat Biotechnol 23(7): 873-878.
PIEPER, U. et al. (2011). "ModBase, a database of annotated comparative protein structure
models, and associated resources." Nucleic Acids Res 39(Database issue): D465-474.
Literature
176
PIRES, J. C. et al. (2004). "Flowering time divergence and genomic rearrangements in
resynthesized Brassica polyploids (Brassicaceae)." Biological Journal of the Linnean
Society 82(4): 675-688.
POND, S. L. et al. (2005). "HyPhy: hypothesis testing using phylogenies." Bioinformatics 21(5):
676-679.
PORCEDDU, A. & CAMIOLO, S. (2011). "Spatial analyses of mono, di and trinucleotide trends in
plant genes." PLoS One 6(8): e22855.
POSADA, D. (2003). "Using MODELTEST and PAUP* to select a model of nucleotide
substitution." Curr Protoc Bioinformatics Chapter 6: Unit 6 5.
POSADA, D. & CRANDALL, K. A. (1998). "MODELTEST: testing the model of DNA
substitution." Bioinformatics 14(9): 817-818.
POZZOLI, U. et al. (2008). "Both selective and neutral processes drive GC content evolution in
the human genome." BMC Evolutionary Biology 8(1): 99.
R CORE TEAM (2014). R: A Language and Environment for Statistical Computing. Vienna,
Austria.
RABOSKY, D. L. & LOVETTE, I. J. (2008). "Explosive evolutionary radiations: decreasing
speciation or increasing extinction through time?" Evolution 62(8): 1866-1875.
RAMBAUT, A. (2012). "http://tree.bio.ed.ac.uk/software/figtree/."
RECHE, P. (2008, 18 February 2013). "SIAS Sequence identity and similarity server."
RESETNIK, I. et al. (2013). "Phylogenetic relationships in Brassicaceae tribe Alysseae inferred
from nuclear ribosomal and chloroplast DNA sequence data." Mol Phylogenet Evol
69(3): 772-786.
RODRIGUEZ-TRELLES, F. et al. (2006). "Origins and evolution of spliceosomal introns." Annu
Rev Genet 40: 47-76.
RONQUIST, F. (2004). "Bayesian inference of character evolution." Trends Ecol Evol 19(9):
475-481.
ROY, S. W. & GILBERT, W. (2006). "The evolution of spliceosomal introns: patterns, puzzles
and progress." Nat Rev Genet 7(3): 211-221.
RUBY, J. G. et al. (2007). "Evolution, biogenesis, expression, and target predictions of a
substantially expanded set of Drosophila microRNAs." Genome Res 17(12): 1850-
1864.
RZHETSKY, A. & NEI, M. (1992). "A Simple Method for Estimating and Testing Minimum-
Evolution Trees." Molecular Biology and Evolution 9(5): 945.
Literature
177
SAITOU, N. & IMANISHI, T. (1989). "Relative Efficiencies of the Fitch-Margoliash, Maximum-
Parsimony, Maximum-Likelihood, Minimum-Evolution, and Neighbor-Joining
Methods of Phylogenetic Tree Construction in Obtaining the Correct Tree." Molecular
Biology and Evolution 6(5): 514-525.
SAITOU, N. & NEI, M. (1987). "The neighbor-joining method: a new method for reconstructing
phylogenetic trees." Mol Biol Evol 4(4): 406-425.
SANKOFF, D. & NADEAU, J. H. (2000). Comparative Genomics: Empirical and Analytical
Approaches to Gene Order Dynamics, Map Alignment and the Evolution of Gene
Families, Kluwer Academic Publisher.
SAWYER, S. (1989). "Statistical tests for detecting gene conversion." Mol Biol Evol 6(5): 526-
538.
SAYERS, E. W. et al. (2009). "Database resources of the National Center for Biotechnology
Information." Nucleic Acids Res 37(Database issue): D5-15.
SCHEMSKE, D. W. & BIERZYCHUDEK, P. (2001). "Perspective: Evolution of flower color in the
desert annual Linanthus parryae: Wright revisited." Evolution 55(7): 1269-1282.
SCHMELZER, E. et al. (1988). "In situ localization of light-induced chalcone synthase mRNA,
chalcone synthase, and flavonoid end products in epidermal cells of parsley leaves."
Proc Natl Acad Sci U S A 85(9): 2989-2993.
SCHÖNFELDER, P. (1968). Chromosomenzahlen einiger Arten der Gattung Biscutella L.
SCHRANZ, M. E. & MITCHELL-OLDS, T. (2006). "Independent ancient polyploidy events in the
sister families Brassicaceae and Cleomaceae." Plant Cell 18(5): 1152-1165.
SCHRANZ, M. E. et al. (2002). "Characterization and effects of the replicated flowering time
gene FLC in Brassica rapa." Genetics 162(3): 1457-1468.
SCHULZ, O. E. (1936). Cruciferae. Die natürlichen Pflanzenfamilien A. Engler and H. Harms.
Leipzig, Verlag von Wilhelm Engelmann. 17 B: 227-658.
SEMON, M. & WOLFE, K. H. (2008). "Preferential subfunctionalization of slow-evolving genes
after allopolyploidization in Xenopus laevis." Proc Natl Acad Sci U S A 105(24): 8333-
8338.
SHARP, P. M. et al. (2005). "Variation in the strength of selected codon usage bias among
bacteria." Nucleic Acids Research 33(4): 1141-1153.
SHAUL, S. & GRAUR, D. (2002). "Playing chicken (Gallus gallus): methodological
inconsistencies of molecular divergence date estimates due to secondary calibration
points." Gene 300(1-2): 59-61.
Literature
178
SOLTIS, D. E. et al. (2009). "Polyploidy and angiosperm diversification." Am J Bot 96(1): 336-
348.
SOLTIS, D. E. et al. (1993). "Molecular Data and the Dynamic Nature of Polyploidy." Critical
Reviews in Plant Sciences 12(3): 243-273.
SOLTIS, P. S. & SOLTIS, D. E. (2000). "The role of genetic and genomic attributes in the success
of polyploids." Proc Natl Acad Sci U S A 97(13): 7051-7057.
SUEOKA, N. (1961). "CORRELATION BETWEEN BASE COMPOSITION OF
DEOXYRIBONUCLEIC ACID AND AMINO ACID COMPOSITION OF
PROTEIN." Proc Natl Acad Sci U S A 47(8): 1141-1149.
SUN, X. et al. (2013). "An improved implementation of effective number of codons (nc)." Mol
Biol Evol 30(1): 191-196.
SWOFFORD, D. L. (2011). "PAUP*: phylogenetic analysis using parsimony, version 4.0b10."
SYVANEN, M. et al. (1994). "Glutathione transferase gene family from the housefly Musca
domestica." Mol Gen Genet 245(1): 25-31.
TAJIMA, F. (1993). "Simple methods for testing the molecular evolutionary clock hypothesis."
Genetics 135(2): 599-607.
TAMURA, K. et al. (2012). "Estimating divergence times in large molecular phylogenies." Proc
Natl Acad Sci U S A 109(47): 19333-19338.
TAMURA, K. et al. (2004). "Prospects for inferring very large phylogenies by using the neighbor-
joining method." Proc Natl Acad Sci U S A 101(30): 11030-11035.
TAMURA, K. et al. (2011). "MEGA5: molecular evolutionary genetics analysis using maximum
likelihood, evolutionary distance, and maximum parsimony methods." Mol Biol Evol
28(10): 2731-2739.
TAMURA, K. et al. (2013). "MEGA6: Molecular Evolutionary Genetics Analysis version 6.0."
Mol Biol Evol 30(12): 2725-2729.
THOMPSON, J. D. et al. (1994). "CLUSTAL W: improving the sensitivity of progressive multiple
sequence alignment through sequence weighting, position-specific gap penalties and
weight matrix choice." Nucleic Acids Res 22(22): 4673-4680.
THOMPSON, J. D. et al. (1999). "A comprehensive comparison of multiple sequence alignment
programs." Nucleic Acids Res 27(13): 2682-2690.
TICHER, A. & GRAUR, D. (1989). "Nucleic acid composition, codon usage, and the rate of
synonymous substitution in protein-coding genes." J Mol Evol 28(4): 286-298.
TROPF, S. et al. (1995). "Reaction mechanisms of homodimeric plant polyketide synthase
(stilbenes and chalcone synthase). A single active site for the condensing reaction is
Literature
179
sufficient for synthesis of stilbenes, chalcones, and 6'-deoxychalcones." J Biol Chem
270(14): 7922-7928.
TROPF, S. et al. (1994). "Evidence that stilbene synthases have developed from chalcone
synthases several times in the course of evolution." J Mol Evol 38(6): 610-618.
TSUNOYAMA, K. et al. (2001). "Intragenic variation of synonymous substitution rates is caused
by nonrandom mutations at methylated CpG." J Mol Evol 53(4-5): 456-464.
TUSKAN, G. A. et al. (2006). "The genome of black cottonwood, Populus trichocarpa (Torr. &
Gray)." Science 313(5793): 1596-1604.
TUTEJA, J. H. et al. (2004). "Tissue-specific gene silencing mediated by a naturally occurring
chalcone synthase gene cluster in Glycine max." Plant Cell 16(4): 819-835.
VAN DEN HOF, K. et al. (2008). "Chalcone synthase gene lineage diversification confirms
allopolyploid evolutionary relationships of European rostrate violets." Mol Biol Evol
25(10): 2099-2108.
VAN DER KROL, A. R. et al. (1990). "Flavonoid genes in petunia: addition of a limited number
of gene copies may lead to a suppression of gene expression." Plant Cell 2(4): 291-299.
WADE, H. K. et al. (2001). "Interactions within a network of phytochrome, cryptochrome and
UV-B phototransduction pathways regulate chalcone synthase gene expression in
Arabidopsis leaf tissue." Plant J 25(6): 675-685.
WAKELEY, J. (1993). "Substitution rate variation among sites in hypervariable region 1 of
human mitochondrial DNA." J Mol Evol 37(6): 613-623.
WALTHER, H. (1995). "MAI, D. H., Tertiäre Vegetationsgeschichte Europas. Methoden und
Ergebnisse. 691 S., 257 Abb., 14 Taf., 23 Tab. Gustav Fischer Verlag, Jena, Stuttgart,
New York, 1995. ISBN 3-334-60456-X. Preis: DM 238,–." Feddes Repertorium 106(3-
4): 331-331.
WANG, H. et al. (2009). "Rosid radiation and the rapid rise of angiosperm-dominated forests."
Proc Natl Acad Sci U S A 106(10): 3853-3858.
WANG, J. et al. (2000). "Molecular evolution of the exon 2 of CHS genes and the possibility of
its application to plant phylogenetic analysis." Chinese Science Bulletin 45(19): 1735-
1742.
WANG, W. K. et al. (2007). "Diverse selective modes among orthologs/paralogs of the chalcone
synthase (Chs) gene family of Arabidopsis thaliana and its relative A. halleri ssp.
gemmifera." Mol Phylogenet Evol 44(2): 503-520.
WANG, X. et al. (2005). "Genome-wide investigation of intron length polymorphisms and their
potential as molecular markers in rice (Oryza sativa L.)." DNA Res 12(6): 417-427.
Literature
180
WANG, Y. et al. (2011). "Modes of gene duplication contribute differently to genetic novelty
and redundancy, but show parallels across divergent angiosperms." PLoS One 6(12):
e28150.
WARWICK, S. et al. (2010). "Closing the gaps: phylogenetic relationships in the Brassicaceae
based on DNA sequence data of nuclear ribosomal ITS region." Plant Systematics and
Evolution 285(3-4): 209-232.
WARWICK, S. I. & AL-SHEHBAZ, I. A. (2006). "Brassicaceae: Chromosome number index and
database on CD-Rom." Plant Systematics and Evolution 259(2-4): 237-248.
WARWICK, S. I. & SAUDER, C. A. (2005). "Phylogeny of tribe Brassiceae (Brassicaceae) based
on chloroplast restriction site polymorphisms and nuclear ribosomal internal transcribed
spacer and chloroplast trnL intron sequences." Canadian Journal of Botany 83(5): 467-
483.
WARWICK, S. I. et al. (2007). "Phylogenetic Relationships in the Tribes Anchonieae,
Chorisporeae, Euclidieae, and Hesperideae (Brassicaceae) Based on Nuclear Ribosomal
ITS DNA Sequences." Annals of the Missouri Botanical Garden 94(1): 56-78.
WARWICK, S. I. et al. (2009). "Phylogenetic relationships in the tribes Schizopetaleae and
Thelypodieae (Brassicaceae) based on nuclear ribosomal ITS region and plastid ndhF
DNA sequences." Botany 87(10): 961-985.
WENDEL, J. & DOYLE, J. (1998). Phylogenetic Incongruence: Window into Genome History
and Molecular Evolution. Molecular Systematics of Plants II. D. Soltis, P. Soltis and J.
Doyle, Springer US: 265-296.
WENDEL, J. F. (2000). "Genome evolution in polyploids." Plant Mol Biol 42(1): 225-249.
WHITE, T. et al. (1990). Amplification and direct sequencing of fungal ribosomal RNA genes
for phylogenetics. PCR Protocols: A Guide to Methods and Applications. M. Innis, D.
Gelfand, J. Shinsky and T. White, Academic Press: 315-322.
WICKHAM, H. (2007). "Reshaping Data with the {reshape} Package." Journal of Statistical
Software 21(12): 1-20.
WICKHAM, H. (2009). ggplot2: elegant graphics for data analysis, Springer new York.
WIKSTROM, N. et al. (2001). "Evolution of the angiosperms: calibrating the family tree." Proc
Biol Sci 268(1482): 2211-2220.
WINKEL-SHIRLEY, B. (2001). "Flavonoid biosynthesis. A colorful model for genetics,
biochemistry, cell biology, and biotechnology." Plant Physiol 126(2): 485-493.
WINKEL-SHIRLEY, B. (2002). "Biosynthesis of flavonoids and effects of stress." Curr Opin Plant
Biol 5(3): 218-223.
Literature
181
WOLFE, K. H. (2001). "Yesterday's polyploids and the mystery of diploidization." Nat Rev
Genet 2(5): 333-341.
WOLFE, K. H. et al. (1987). "Rates of nucleotide substitution vary greatly among plant
mitochondrial, chloroplast, and nuclear DNAs." Proceedings of the National Academy
of Sciences 84(24): 9054-9058.
WOLFE, K. H. et al. (1989). "Mutation rates differ among regions of the mammalian genome."
Nature 337(6204): 283-285.
XIA, X. (2013). "DAMBE5: a comprehensive software package for data analysis in molecular
biology and evolution." Mol Biol Evol 30(7): 1720-1728.
XU, G. et al. (2012). "Divergence of duplicate genes in exon–intron structure." Proceedings of
the National Academy of Sciences 109(4): 1187-1192.
XU, X. Z. et al. (2008). "Analysis of synonymous codon usage and evolution of
begomoviruses." J Zhejiang Univ Sci B 9(9): 667-674.
YANG, J. et al. (2002). "Duplication and adaptive evolution of the chalcone synthase genes of
Dendranthema (Asteraceae)." Mol Biol Evol 19(10): 1752-1759.
YANG, Z. (1997). "PAML: a program package for phylogenetic analysis by maximum
likelihood." Comput Appl Biosci 13(5): 555-556.
YANG, Z. & YODER, A. D. (1999). "Estimation of the transition/transversion rate bias and
species sampling." J Mol Evol 48(3): 274-283.
YUE, J.-P. et al. (2009). "Molecular phylogeny of Solms-laubachia (Brassicaceae) s.l., based on
multiple nuclear and plastid DNA sequences, and its biogeographic implications."
Journal of Systematics and Evolution 47(5): 402-415.
YURTSEV, B. A. & ZHUKOVA, P. G. (1982). "Chromosome numbers of some plants of the
northeastern Yakutia (the drainage of the Indigirka River in its middle reaches)." Bot.
Zhurn. 67.
ZHANG, L. et al. (2002). "Patterns of nucleotide substitution among simultaneously duplicated
gene pairs in Arabidopsis thaliana." Mol Biol Evol 19(9): 1464-1473.
ZHAO, B. et al. (2010). "Analysis of phylogenetic relationships of Brassicaceae species based
on Chs sequences." Biochemical Systematics and Ecology 38(4): 731-739.
ZHAO, Z. et al. (2012). "Deep-sequencing transcriptome analysis of chilling tolerance
mechanisms of a subnival alpine plant, Chorispora bungeana." BMC Plant Biol 12: 222.
ZHOU, B. et al. (2013). "Chalcone synthase family genes have redundant roles in anthocyanin
biosynthesis and in response to blue/UV-A light in turnip (Brassica rapa;
Brassicaceae)." Am J Bot 100(12): 2458-2467.
Literature
182
ZUNK, K. et al. (2000). "Phylogenetic relationships in tribe Lepidieae (Brassicaceae) based on
chloroplast DNA restriction site variation." Canadian Journal of Botany 77(10): 1504-
1512.
Appendix
183
Appendix
provided on DVD
Figures
All figures listed in this thesis (see list of figures) are displayed in graphical format (svg
or png)
Tables
All tables listed in this thesis (see list of tables) are displayed as pdf.
Supplementary Material
Supplementary material contains figures, as well as tables, referred to in this thesis. Data
format see above. Supplementary material is numbered consecutively with prefixed
capital S.