Isotope studies on plant productivity - OSTI.GOV
203
IAEA-TECDOC-889 XA9642755 Isotope studies on plant productivity Results of a co-ordinated research programme organized by the Soil Fertility, Irrigation and Crop Production Section, Joint FAO/IAEA Division of Nuclear Techniques in Food and Agriculture INTERNATIONAL ATOMIC ENERGY AGENCY
-
Upload
khangminh22 -
Category
Documents
-
view
2 -
download
0
Transcript of Isotope studies on plant productivity - OSTI.GOV

IAEA-TECDOC-889
XA9642755
Isotope studies on plant productivity
Results of a co-ordinated research programmeorganized by the
Soil Fertility, Irrigation and Crop Production Section, Joint FAO/IAEA Division of Nuclear Techniques in Food and Agriculture
INTERNATIONAL ATOMIC ENERGY AGENCY

The originating Section of this publication in the IAEA was:
Soil Fertility, Irrigation and Crop Production Section Joint FAO/IAEA Division
International Atomic Energy Agency Wagramerstrasse 5
P.O. Box 100 A-1400 Vienna, Austria
ISOTOPE STUDIES ON PLANT PRODUCTIVITY IAEA, VIENNA, 1996 IAEA-TECDOC-889
ISSN 1011-4289© IAEA, 1996
Printed by the IAEA in Austria July 1996

The IAEA does not normally maintain stocks of reports in this series. However, microfiche copies of these reports can be obtained from
INIS ClearinghouseInternational Atomic Energy AgencyWagramerstrasse 5P.0. Box 100A-1400 Vienna, Austria
Orders should be accompanied by prepayment of Austrian Schillings 100, in the form of a cheque or in the form of IAEA microfiche service coupons which may be ordered separately from the INIS Clearinghouse.

FOREWORD
The world population may grow to 7.2 billion by the year 2010, up from the 5.3 billion of 1990 and the 3.7 billion of only 20 years ago. Almost 95% of this increase will be in the developing countries and Sub-Saharan Africa alone will contribute 3.2% per annum to this increase. Already there are food deficits in these countries and it is against this background that food production has to be increased and sustained. In developing countries, low soil resources and fragile soils are the major limitations to agricultural productivity. Two of the most common and serious soil limitations are low soil moisture and low soil nutrients, especially phosphorus and nitrogen. For economic reasons, these problems can rarely be solved in developing countries by expensive soil inputs. A more effective approach would be to identify genotypes of commonly used crop and tree species which are highly efficient in the use of the soil resources for plant productivity and to integrate these with only minimum inputs of fertilizers where necessary. In order to explore this approach, a Co-ordinated Research Programme (CRP) on the Use of Isotope Studies for Increasing and Stabilizing Plant Productivity in Low Phosphate and Semi-arid and Sub-humid Soils of the Tropics and Sub-tropics was initiated in October 1989 and completed in October 1994.
Almost half of the work carried out under this programme concentrated on water use efficiency and the rest on phosphate use efficiency. Egypt, Morocco and Tunisia focused on wheat; Nigeria and Sierra Leone on cowpea; Kenya, Sudan and the United Republic of Tanzania on nitrogen fixing trees such as Prosopis, Acacia and Gliricidia; and Viet Nam on rice. Experiments conducted in the field showed that there is a wealth of genetic diversity among the genotypes/provenances of crop and tree species in their capacity for uptake and use of phosphorus and water from soils limited in resources. Several elite genotypes/provenances were identified which are highly efficient in water or phosphate use. In a few cases, the high water use efficiency (or the high phosphorus use efficiency) feature was seen in the same genotype where the grain yield was also high. Morphological parameters responsible for making some genotypes superior in their capacity to use phosphorus or water have also been investigated. It is our hope that the findings reported in this publication will help agricultural scientists in the Member States, particularly in Africa, in their quest of finding solutions to problems of food security.
The Joint FAO/IAEA Division of Nuclear Techniques in Food and Agriculture wishes to express its gratitude to the Swedish Government for its generous financial support of this programme through the Swedish International Development Authority (SIDA), which made the implementation of this programme possible. This publication was prepared by the Project Officer S. Kumarasinghe.

EDITORIAL NOTE
In preparing this publication for press, staff of the IAEA have made up the pages from the original manuscripts as submitted by the authors. The views expressed do not necessarily reflect those of the governments of the nominating Member States or of the nominating organizations.
Throughout the text names of Member States are retained as they were when the text was compiled.
The use of particular designations of countries or territories does not imply any judgement by the publisher, the IAEA, as to the legal status of such countries or territories, of their authorities and institutions or of the delimitation of their boundaries.
The mention of names of specific companies or products (whether or not indicated as registered) does not imply any intention to infringe proprietary rights, nor should it be construed as an endorsement or recommendation on the part of the IAEA.
The authors are responsible for having obtained the necessary permission for the IAEA to reproduce, translate or use material from sources already protected by copyrights.

CONTENTS
INTRODUCTION............................................................................................................................ 7
PART I. PHOSPHATE USE EFFICIENCY STUDIES
Studies on phosphate use efficiency of wheat in Egypt ........................................................ 13Af. Abdou
Performance of Acacia tortilis, Prosopis juliflora and Casuarina equisetifoliaprovenances in soils low in phosphorus .......................................................................... 25D.O. Nyamai, P.O. Juma
Identification of cowpea cultivars for low phosphorus soils of Nigeria.............................. 33N.O. Afolabi, B.A. Ogunbodede, J.A. Adediran
Genotypic differences in yield formation, phosphorus utilization and nitrogenfixation by cowpeas in Sierra Leone .................................................................................. 39D. S. Amara, D.S. Suale
Phosphorus use efficiency of the gum arabic tree (Acacia Senegal (L) Willd)in Sudan........................................................................................................................................ 53K.H. Elamin, A.F. Mustafa
Genotypic differences in phosphorus use efficiency and yield ofwetland rice of southern Viet Nam ....................................................................................... 63Bui Thi Hong Thanh, Le Doc Lieu, Luong Thu Tra,Mai Thanh Son, Nguyen Dang Nghia, Do Trung Binh
Genotypic differences in acquisition and utilization of phosphorus in wheat.................. 73W.J. Horst, F. Wiesler, M. Abdou
Evaluation of hedgerow trees in alley cropping for phosphorus use efficiencyand N2 fixation in low P soils in moist savanna in Nigeria......................................... 89N. Sanginga, S.K.A. Danso, F. Zapata, G.D. Bowen
Tracer methods to quantify nutrient uptake from plough layer, sub-soil andfertilizer: Implications on sustainable nutrient management.......................................... 99E. Haak
PART H. WATER USE EFFICIENCY STUDIES
Studies on water use efficiency of wheat in Egypt................................................................. 107M. Abdou
Studies on 13C isotope discrimination for identifying tree provenances efficient inwater use under water deficit conditions in Kenya........................................................ 113D.O. Nyamai, P.O. Juma
Carbon-13 discrimination as a criterion for identifying high water useefficiency wheat cultivars under water deficit conditions............................................ 123M. Bazza
Water use efficiency studies of Acacia Senegal (L.) Willd provenances in Sudan .... 131 A.F. Mustafa, K.H. Elamin, A.A. Salih
The 13C isotope discrimination technique for identifying durum wheatcultivars efficient in uptake and use of water ................................................................. 137Af. Mechergui, M.H. Snane

PART in. ASSOCIATED RESEARCH
Effect of phosphorus sources on phosphorus and nitrogen utilization bythree sweet potato cultivars................................................................................................. 147A. Montanez, F. Zapata, K.S. Kumarasinghe
Carbon isotope discrimination as a selection tool for high water use efficiencyand high crop yields ............................................................................................................. 155K.S. Kumarasinghe, C. Kirda, G.D. Bowen, F. Zapata, K.O. Awonaike,E. Holmgren, A. Arslan, E.C. de Bisbal, A.R.A.G. Mohamed, A. Montenegro
Genotypic differences in phosphate nutrition of rice (Oryza sativa L.).............................. 171Bui Thi Hong Thanh, F. Zapata, G.D. Bowen, K.S. Kumarasinghe
SUMMARY AND CONCLUSIONS ........................................................................................ 181
APPENDIX .................................................................................................................................... 185
LIST OF PARTICIPANTS.......................................................................................................... 209
RECENT IAEA PUBLICATIONS IN SOIL FERTILITY, IRRIGATIONAND CROP PRODUCTION.............................................................................................. 213

INTRODUCTION
In Africa, population growth has outstripped food production in 35 out of 44 sub-Saharan countries and by the year 2000, the per capita arable land is likely to be reduced by nearly one half from what it was about 4 decades ago. Food and fuelwood production will therefore have to be increased and sustained against a background of limited resources, indeed a background of reduced soil nutrients. Further, because of intensive cropping, shorter fallow periods and the removal of nutrients in the produce, yields are often reduced to one third within one to two years.
The Co-ordinated Research Programme (CRP) on the use of isotope studies for increasing and stabilizing plant productivity in low phosphate and semi-arid and sub-humid soils of the tropics and sub-tropics focused on Africa. In this continent, semi-arid soils with an average rainfall of 400 to 600 mm and dry sub-humid soils (rainfall 600-1000 mm) occupy some 30% of the land surface and much of these soils are in relatively highly populated areas. They are always at risk of water deficits for crop production. In drier areas, overgrazing and harvesting of trees for fuelwood have been a major factor responsible for reduced productivity, increased soil erosion and desertification. Recent reports indicate that desertification occurs at a rate of 6 million ha per annum. Together with this, large parts of the developing world have acute deficiencies of fuelwood, a major source of energy and largely irreplaceable by other sources. This serious situation is likely to increase, and World Bank figures suggest that by the year 2000, approximately 3 million people will be living in areas where fuelwood is acutely scarce or has to be obtained elsewhere. This programme focused on the identification of food and tree species capable of growing and producing well on soils low in resources, mainly phosphorus and water.
1. Phosphorus use efficiency
Phosphorus, an essential element of plant growth, is grossly deficient in more than 60% of African soils. Many soils also fix phosphorus in forms unavailable to plants. Extensive, particularly in the humid areas, are the soils of tropical lowlands with their associated problems of acidity, low nutrient retention capacity, aluminium toxicity and low initial phosphate and potassium contents. Little response is obtained to small applications so that massive basal doses may be required to permit plants to benefit. Addition of superphosphate fertilizers is one answer to the problem but this is often beyond the economic reach of small farmers. In such situations the efficiency and sustainability of yield depends on having cultivars yielding well on low soil resources and using small amounts of added fertilizer (where necessary and where possible) with maximum effectiveness.
The effective use of soil resources for productivity is dependent on nutrient acquisition and on efficiency of use of that acquired nutrient. Several nutrient/soil conditions are of particular interest in tropical soils, especially phosphorus deficiency and nitrogen deficiency. Large genotypic differences within species have been shown with respect to each of these. There are some examples which illustrate genotypic differences in soybean (18%), maize (36%), sorghum (56%) and oat (75%). Although the projected studies in this CRP focused primarily on phosphate and water, where appropriate studies have been included on nitrogen use efficiency as well, especially on nitrogen fixation by legumes.
A good deal of the work on varietal differences in phosphorus nutrition has not satisfactorily established whether the causal effect is basically metabolic or whether it is due to differences in size and type of roots and rooting patterns. This applies to many elements but it is particularly relevant to phosphorus where root interception and contact, plus diffusion, are the important mechanisms of supply. It has been found that phosphorus efficiency is directly related to the high ratio of secondary to primary roots. Other reports indicate that phosphorus acquisition in maize can be increased by development and selection of hybrids with more fibrous root systems. Investigations of root systems as a contributory factor in varietal differences in nutritional response have not received as much attention as their importance warrants, although an extensive rooting system can be valuable to take advantage of the largest possible volume of soil both for nutrients and water. This emphasizes the importance of root systems and the opportunity provided by genetic selection for increased phosphate uptake.
7

Mycorrhizal symbioses is another important aspect which has been shown to increase phosphorus absorption from soil considerably. However, the practical introduction of mycorrhizal fungi into crop plants has been found to be difficult because the fungus cannot be grown easily in laboratory media and cannot be produced on plants in large enough quantities for large scale inoculation. However, because of the ability to manipulate inoculum in nurseries providing trees for planting, this field of study is considered a rewarding and important subsidiary area of research probably with large practical impacts.
2. Water use efficiency
In many semi-arid regions, deep percolation is a significant component of the water balance and water frequently remains in the soil profile at the end of crop growth. For example, about 10% of rainfall may be lost as drainage and substantial amounts of water may remain in the soil profile after harvest of the monsoon season crop in the tropics. These reserves of water might be exploited in two ways. The first is to effectively extend the period of growth by planting another crop that extends the period of water extraction. This is achieved by relay cropping, intercropping and agroforestry although there are few published examples quantifying the amounts of water utilized by each component of these typically mixed cropping systems. The second way is to identify genotypes of plants with deep root systems which are capable of better use of the limited water available in the soil. Many trees of savannah regions have deep root systems that allow the exploitation of deep water reserves. In crop plants, greater rooting density and deeper rooting depths would increase the amount of soil water that is extractable. Variation in rooting depth is known in several species including millet, sorghum and rice so that improvements in root systems might be possible.
There are several examples in the literature of genotypic differences in water uptake within species. Significant differences have been demonstrated between upland rice varieties in the removal of soil water from subsoil, as a function of rooting concentration at depths. Quantitative genetic differences also occur within tree species in their rooting habits and this would be expected to be important not only for growth of the species itself but also in its compatibility with associated crop plants, especially with regard to the surface 50 cm where the majority of roots are to be found.
A more recent development in this field is the observation that water use efficiency is correlated with the 13C/I2C ratios of the plant carbon. The basis of this is physiological. Although factors such as nutrition affect water use efficiency, a more intensive study of 13C/12C ratios may be an extremely important way to screen genotypes of plant species of interest to developing countries for water use efficiency. Some aspects of this hypothesis have been verified under field conditions within this programme.
3. Project objectives
The primary objective was to make a substantial contribution to increase productivity of food crops and of fiielwood with minimum inputs, in a framework of sustainable integrated farming systems.
The approach was to identify genotypes of important economic crop and tree species with a high efficiency for uptake and use of water and phosphate to optimize production in lower rainfall and low soil phosphate areas.
To identify the morphological and physiological plant parameters which breeders should be selecting for high efficiency of uptake and use of water and phosphate.
To assist the target beneficiaries (farmers) through the direct recipients (scientists), in their efforts to increase the socio-economic levels to the benefit of the nation and the region as a whole, as production of foods and other products increase.
8

4. Operational mode
This project was operated as a Co-ordinated Research Programme (CRP), developed around well defined research and development topics on which soil/plant research institutes and universities collaborated with the staff of the Soil Fertility, Irrigation and Crop Production Section of the Joint FAO/IAEA Division of Nuclear Techniques in Food and Agriculture, and the Soils Unit of the FAO/IAEA Agriculture and Biotechnoly Laboratory at Seibersdorf. An important by-product of the studies was the enhancement of regional activities in this area of research and strengthening of regional co-operation. The vehicle for strengthening regional co-operation was the uniform methodology and research strategy that was employed, and the frequent exchange of results via the Research Co-ordination meetings (RCM). Four RCMs were held. The first and last RCMs were held in Vienna (Austria), the second in Nairobi (Kenya), and the third in Tunis (Tunisia). These meetings encouraged close contact between participants and provided a forum for information exchange between the scientists and institutes involved, as well as providing a uniform approach both to the development and the practical utilization of appropriate techniques. This CRP included contract holders from Egypt (M. Abdou), Ghana (I. Ofori), Kenya (D O. Nyamai), Morocco (M. Bazza), Nigeria (N O. Afolabi/B.A. Ogunbodede), Senegal (L. Sisse), Sierra Leone (D. Amara), Sudan (A.R. Mustafa/K.H. Elamin), the United Republic of Tanzania (L.L. Lulandala), Tunisia (M. Mechergui), Viet Nam (B.T.H. Thanh) and agreement holders from France (G. Vachaud), Germay (W. Horst), Nigeria (N. Sanginga), New Zealand (A. Haystead), Sweden (P. Hogberg and K. Johanson/E. Haak). The programme was implemented over a period of 5 years from October 1989 to October 1994. During the course of this programme, several scientists received training through fellowships and by attendance at interregional and regional training courses organized by the Soil Fertility, Irrigation and Crop Production Section. 13C/12C ratios in plant samples were analysed at the Waikato Stable Isotope Unit, University of Waikato, Hamilton, New Zealand, and the l5N/14N ratios were analysed at the Soils Science Unit of the FAO/IAEA Agriculture and Biotechnolgy Laboratory. K.S. Kumarasinghe of the Soil Fertility, Irrigation and Crop Production Section of the Joint FAO/IAEA Division of Nuclear Techniques in Food and Agriculture was the Project Officer who also acted as the Scientific Secretary at the RCMs. This report contains the results generated during the five years of implementation of this programme.

Part I
PHOSPHATE USE EFFICIENCY STUDIES
85EXT PAGE(S) left BLANK

STUDIES ON PHOSPHATE USE EFFICIENCY OF WHEAT IN EGYPT
M. ABDOUSoil and water Department, Suez Canal University, Ismailia, Egypt
XA9642756
Abstract
STUDIES ON PHOSPHATE USE EFFICIENCY OF WHEAT IN EGYPT.(A) Genotypic differences in phosphate use efficiency and yield of different wheat cultivars.
Genotypic differences in the efficiency of use of phosphorus and other nutrients in wheat was evaluated in a field sstudy. The experiment was conducted during the 1991/92 and 1992/93 seasons on a virgin loamy sandy soil (pH 7.9) with low available phosphorus, in Ismailia, Suez Canal, Egypt. The experiment included 18 modem and tradional Egyptian wheat varieties (Triticum aestivum L), and 3 phosphorus levels applied as superphosphate fertilizer. Because of arid climate, water was applied through sprinkler irrigation throughout the growing period (November to May). Shoot samples were taken at four developmental stages. Results show that there are substantial differences in phosphorus use efficiency of wheat. Whereas some of the cultivars produced good biomass and grain yield at the high phosphorus supply level, other cultivars were depressed even in growth. Biomass production, grain yield, straw yield, number of ears per m1 2, and the number of grain per ear differed substantially at different phosphorus levels but there was no major difference in the 1000 grain weight. Wheat cultivars also showed significant differences in their P, K, Ca, and Mg contents.(B) Root characteristics and vesicular-artuscular mycorrhiza infection of different wheat cultivars as influenced by
phosphate supply.Eighteen local wheat cultivars (Triticum aestivum L.) were grown in the field to obtain information about root
characteristcs and vesicular-arbiscular mycorrhiza fungi infection that known to play a role in phosphate use efficiency of crops. Three different phosphate levels were used, viz., insufficient, sufficient, and excessive, corresponding to 1/3, 1 and 3 times the recommended phosphate application rate in the area. Some root parameters such as root volume, root dry matter, root length and vesicular-arbiscular mycorrhiza infection rate were measured at three development stages. In addition, root diameter and root denisty were also measured. Wheat cultivars efficient in phosphorus use have a high root density in the sub soil region and this is accompanied with a high vesicular-arbiscular mycorrhiza infection rate. Cultivars showed differences in root morphology and vesicular-arbiscular mycorrhiza infection rate. Some cultivars had a low root density and vesicular-arbiscular mycorrhiza infection rate and these cultivars exhibited a high phosphorus use efficiency. This was particularly true with cultivars 14,16, and 18. This information may be useful to plant breeders in their attempts to breed wheat cultivars efficient in phosphate uptake and use.
1. INTRODUCTION
As world pressures on food production increase, more land with adverse fertility status is being brought into production. Large areas of this new land are of low phosphorus status. This coupled with the increased costs of phosphatic fertilizers means that greater efforts need to be made in increasing the efficiency of utilization of both native and applied phosphorus. Wheat is a major food grain in the world, and characteristically, wheat selection programmes are undertaken at a standard fertility level (usually phosphorus non-limiting). On the other hand breeding for nutritional characters is not common in cereal improvement programms. This may be seen as attributed to agronomists who have successfully modified the soil environment with fertilizers to suit the plants that breeders have produced, thus allowing the latter to concentrate on the more pressing problems of yield, climatic adaptation, quality, and resistance to pests and diseases [1,2]. Earlier work [3,4,5,6] has shown major varietal differences in response of wheat to phosphorus. Thus, it is probable that
13

the price of phosphorus fertilizer will rise dramatically, and in the future, scarcity of phosphorus will be a serious problem.
The development of root systems is characterized by a very high adaptability and involves complex interactions between roots and shoots and between roots and their environment. Root growth and development is controlled by genetic and hormonal factors. Also, environmental factors such as the supply of mineral nutrients as well as soil mechanical factors greatly influence root growth.
The distribution of roots in soil profile can be modified by the placement of fertilizers. Rooting density is reported to increase several fold in zones where the concentration of nutrients especially nitrogen is high [23]. Placement of phosphorus fertilizers is common and an effective practice in soils low in readily available phosphorus and in order to ensure a sufficient supply to the roots especially in the early growing stages when soil temperatures are low in winter [24]. High rooting density is known to be an important factor in the uptake of nutrients supplied by diffusion such as phosphorus [25].
Infection of the roots by vesicular-arbuscular mycorrhiza (VAM) fungi has been shown to improve productivity of numerous crop plants in soils of low fertility [26]. This response is usually attributed to enhanced uptake of immobile nutrients such as P, Zn, and Cu [25,27,28,29,30,31]. In soils with adequate levels of these nutrients, VAM fungi may not contribute significantly to plant growth [24].
Wheat cultivars can benifit considerably from VAM when the availability of soil phosphorus is limited [32]. VAM is known to increase the phosphorus uptake by plant on phosphorus efficient soils [33]. This is commonly attributed to extention of the root system by the fine mycorrhizal hyphae, especially improving plant access to less mobile mineral elements like phosphorus, zinc or ammonium nitrogen.
The aim of this work was to assess genotypic differences in grain, straw yields and phosphate use efficiency of 18 wheat cultivars grown under limiting, sufficient, and high phosphorus conditions. Attempts have also been made to investigate (1) morphological characteristics of roots among efficient and inefficient cultivars (2) physiological reasons for differences in phosphate use efficiency, and (3) effect of infection rate and species of VAM fungus on the dry matter and phosphate uptake by different wheat cultivars.
2. MATERIALS AND METHODS
2.1. Studies on genotypic differences in phosphate use efficiency and yield of different wheatcultivars.A field experiment was conducted with wheat (Triticum aestivwn L.) at the Faculty of
Agriculture, Suez Canal University at Ismailia. The experiment was a complete randomize block design with four replicates. Soil samples were collected from each sub- plot (20 m2), at 0-30 cm depth. Samples were air dried and representative sub-samples were prepared after mixing them together. Soil chemical characteristics were determined in the saturated soil paste as described in the US Department of Agriculture handbook [7], Potassium and sodium were determined by a flame photometry and calcium bt atomic absorption spectrometry. Total soluble salts were determined by measuring the electrical conductivity of the saturated water extract (ECe), and total carbonate was estimated volumetrically by means of Collin’s calcimeter and calculated as calcium carbonate (Appendix Table I).
14

The experimental field has not been fertilized with P because the area had not been cultivated for at least 30 years. Available phosphate was extracted according to Olsen and Sommers [8], and determined colorimetrically [9] with molybdo-vanadate method. Before sowing, K fertilizer was added in single applications of K2S04 at a rate of 100 kg ha"1 and phosphate fertilizer was added as superphosphate (15.5% P203) in three levels viz., 8.3, 25 and 75 kg P ha"1 in both seasons. Nitrogen was applied as ammonium nitrate at a rate of 120 kg N ha"1 in four splits (20% at seedling, 40% at shooting, 20% at flag leaf emergence and 20% at flowering). The seeding rate per sub-plot (20 m2) in both seasons was as shown in Appendix Table II. The seeds were sown in November in both seasons with a 15 cm row spacing and 5 cm plant spacing.
During the growing seasons, wheat shoots were sampled at four developmental stages [10]: (1) at Shooting, when the main stem had only one node, (2) at appearance of flag leaves , (3) at 50% flowering and (4) at physiological maturity. The harvest area per replicate was 2.4 m2. The number of spikes per unit area was recorded. The grains were dried and cleaned before weighing to determine the grain yield. Hundred grain weight and the number of grains per spike were estimated. The shoots were ground shoot and samples were digested in H2SO4 - H202 [11] and analysed for N using the Kjeldahl method [12]. Phosphorus was determined using molybdo-vanadate spectrophotometric method [9]. Calcium and magnesium were measured by atomic absorption spectrometry and potassium by flame spectrophotometry. Data of both seasons were subjected to analysis of variance using the SAS statistic programme.
2.2. Studies on root characteristics and vesicular-arbuscular mycorrhiza inflection of differentwheat cultivars as influenced by phosphate supply.
2.2.1. Field experimentA field experiment was conducted with wheat {Triticum aestivum L.) at the Faculty of
Agriculture, Suez Canal University at Ismailia. The experiment was a complete randomize block design with four replicates. Soil samples were collected from each sub- plot (20 m2), at 0-30 cm depth. Samples were air dried and representative sub-samples were prepared after mixing them together. Soil chemical characteristics were determined in the saturated soil paste as described in the US Department of Agriculture handbook [7], Potassium and sodium were determined by a flame photometry and calcium bt atomic absorption spectrometry. Total soluble salts were determined by measuring the electrical conductivity of the saturated water extract (ECe), and total carbonate was estimated volumetrically by means of Collin’s calcimeter and calculated as calcium carbonate (Appendix Table I).
The experimental field has not been fertilized with P because the area had not been cultivated for at least 30 years. Available phosphate was extracted according to Olsen and Sommers [8], and determined colorimetrically [9] with molybdo-vanadate method. Before sowing, K fertilizer was added in single applications of K2S04 at a rate of 100 kg ha'1 and phosphate fertilizer was added as superphosphate (15.5% P2Os) in three levels viz., 8.3, 25 and 75 kg P ha'1 in both seasons. Nitrogen was applied as ammonium nitrate at a rate of 120 kg N ha'1 in four splits (20% at seedling, 40% at shooting, 20% at flag leaf emergence and 20% at flowering). The seeding rate per sub-plot (20 m2) in both seasons was as shown in Appendix Table II. The seeds were sown in November in both seasons with a 15 cm row spacing and 5 cm plant spacing.
During the growing seasons, wheat roots were sampled three times at shooting, flag leaf formation and flowering [10]. Root samples were taken with a hand auger (diameter 7.5 cm) within and between plant rows at a distance of about 3 cm from plant shoots. The samples were collected
15

at 20 cm intervals downwards upto 60 cm soil depth. Two cores were taken from each plot and averages were soaked overnight in water and the roots subsequebtly separated by washing the soil through a 2 mm sieve. Live roots were distinguished from dead ones by an inspection based mainly on colour [24].
2.2.2. Nutrient solution experimentTen wheat cultivars were selected from the 18 previously used in the preliminary study for
phosphate use efficiency. These were identified into 3 groups depending on their phosphate use efficiency abilities. They are: (1) efficient cultivars (Giza 160, Giza 165, Sakah 8, and Sakah 61), moderately efficient cultivars (Giza 157, and Giza 164), and inefficient cultivars (Giza 158, Giza 163, Sakah 92, and Sohag 1). The selected cultivars were germinated for 3 days in 10 um CaS04, then, 50 uniform seedlings were selected and suspended, five per pot from each genotype, in 59-liter plastic containers in a growth chamber at the Institute of Plant Nutrition, University of Hannover. Composition of the nutrient solution used was as follow: 450 (iM CafNO,^; 375 /iM K^SO*; 325 /iM MgS04; 100 /*M NH4C1; 40 /iM Fe-Sequenstren, 4 /*M H3B04; 1/iM MnS04; 0.4 /*M ZnS04; 0.2 /xM CuS04; 0.1 /tM (NHJgMoyO^; and the phosphorus was added in two levels (1 and 10 /iM P) askh2po4.
Nutrient solutions were changed every 5 days. Between changes the solution nutrient levels and pH were monitored and additions made as needed to maintain nutrient and pH levels. The maximum reductions in nutrient levels that occured before renewal were: 50% for N, 10% for P, 30% for K, 30 for Ca, and 20 for Mg. The pH of the solution was adjusted between 5.8 to 6.0. The plants were grown upto an age of 15 days. The plants were then harvested and prepared for analysis as discussed above in 2.1.
3. RESULTS AND DISCUSSION
3.1. Studies on genotypic differences in phosphate use efficiency and yield of different wheat cultivars.Growth conditions, such as phosphate supply, clearly influnced growth and yield of the 18
wheat cultivars. There was large variation among genotypes for phosphate response or differences among cultivars under the same phosphate level for all characters measured.
As shown in Appendix Table III, low phosphate supply resulted in a severe reduction in the total biomass comparing with the high phosphorus supply. However at both low and high phosphorus supply levels, the total biomass of cultivars 5, 9, 10, and 11 were high. On the other hand, the total biomass of cultivars 4, 7, 13, and 14 were reduced under limiting phosphorus but responded to produce a high biomass under high phosphorus supply. The main effects of phosphorus supply were on the number of tillers per unit area or per plant (Table I) and the length of the development stage. Wheat cultivars are known to differ widely in growth duration [6,13].
The data for nutrient contents of shoots at successive harvest stages are shown in Table II and Appendix Table IV, as means for the two seasons. Nutrient concentrations in shoots generally decreased with the time in the growing seasons (Table II), presumably due to dilution as growth progressed [14]. Nutrient concentration, expressed in mg g"1 dry matter shows pronounced differences in at vegetative stage. However, the differences among cultivars during vegetative stage were not significant for all nutrients. But in the nutrient solution culture, all cultivars showed more limited growth and obvious deficiency symptoms at 1 /iMP.
16

TABLE I. YIELD AND YIELD COMPONENTS OF 18 WHEAT CULTTVARS GROWN IN THE FIELD AT LOW P SUPPLY (8.3 KG HA1)
Cultivar Yield Yield components
Grain Straw No. of ears No. of grainsper m2 per ear
kg ha"1 kg ha"1
10 4420 4060 196 44.311 4060 4920 205 32.05 3920 2980 168 43.017 3840 3530 163 21.812 3780 3230 196 36.59 3740 4190 184 21.31 3540 4440 163 37.88 3520 4460 171 38.013 3320 4180 167 26.96 3200 3990 134 ■ 29.215 3080 4630 179 44.514 3000 3630 142 34.516 2840 2620 127 42.518 2700 4830 156 18.13 2540 3600 142 34.02 2460 3210 114 35.87 2260 3840 170 33.34 2140 2380 134 34.0
TABLE II. EFFECT OF P SUPPLY ON NUTRIENT CONCENTRATIONS IN THE ABOVE GROUND PLANT PARTS AT 4 DEVELOPMENTAL STAGES OF WHEAT GROWN IN THE FIELD
P supply kg ha '
Growthstage
Pmg g' dw
Kmg g ' dw
Camg g1 dw
Mgmg g"' dw
8.3 Tillering 1.38 81.8 8.45 5.46Flag leaf 1.39 66.1 8.23 7.13AnthesisMaturity
1.28 40.6 7.05 2.28
Straw 0.59 7.56 2.09 0.61Grain 2.23 6.80 1.25 1.37
25.0 Tillering 1.54 78.9 8.32 5.21Flag leaf 1.46 63.1 9.47 6.98AnthesisMaturity
1.40 40.8 6.21 2.58
Straw 0.78 7.42 2.17 0.61Grain 2.50 6.59 1.19 1.21
75.0 Tillering 1.74 79.7 8.69 5.02Flag leaf 1.53 62.5 8.38 6.71AnthesisMaturity
1.54 42.9 6.08 2.63
Straw 0.86 75.3 1.98 0.69Grain 2.76 6.78 1.24 1.09
Values are means of 18 cultivars
17

TABLE III. EFFECT OF P SUPPLY ON GRAIN YIELD AND YIELD COMPONENTS OF WHEAT GROWN IN THE FIELD
P supply kg ha"1
Grain yields kg ha*1
Straw yields kg ha"1
No. of ears per m2
No. of grains per ear
1000 grain weight
g
8.3 3242 3818 162 33.8 48.825.0 3592 4481 196 33.8 49.675.0 4000 4797 216 43.7 50.2
Values are means of 18 cltivars
The phosphorus concentration in the shoot tissue of different cultivars ranged from 0.8 to 2.3 mg P g1 dry matter at shooting stage. However, the phosphorus-concentration under nomal field conditions vary between 3.0 to 5.0 mg P g'1 dry matter [15].
Grain yield increased with increasing phosphorus fertilization (Table III). At 8.3 kg P ha'1, cultivars 5, 9, 10, and 11, were superior to the others whereas at high phosphate levels (75 kg P ha*1) cultivars 7, 8, 10,13 outyielded the the rest. Similarly, the number of spikes per square meter (TableI) , weight of 100 grains, spike number per unit area and grain number per spike observed to be largely affected by phosphate fertilizer.
The grain nutrient yield is known to be a function of the export of nutrients from soil and their retranslocation from shoots to the grains. Application of phosphate fertilizer increased the phosphorus concentration in grains and straw but had no effect on other nutrient concentrations in mature plants (Table II). Fertilizer phosphorus increased the concentration of phosphorus in grains by 20%. The most notable variations observed in this study were in the concentrations of phosphorus in the grains of different cultivars. Phosphorus uptake, and phosphorus distribution in grains and straw were calculated using the dry matter and phosphate concentration in the plants.
As suggested by Gerloff and Gabelman [16], a genotype to be regarded as inefficient under a nutrient stress should appear normal and approximately the same as efficient genotypes under optimum supplies of the element. Also, it would be desirable to have a cultivar that grow and accumulate a high biomass at low phosphorus levels and also responds to optimum or luxurious (high) phosphate supply.
The study of wheat genotypes grown in the field and in the nutrient solution shown that the biomass and the yield at vegetative and reproductive stages for some genotypes were higher than the others. From an agronomic point of view, genotypic differences in phosphate use efficiency of wheat are usually defined by the difference in the relative growth rates or from the yield. When grown in a soil defficient in in phosphorus, phosphorus use efficiency is reflected by the ability to produce a high yield in a soil that is limiting in phosphorus or other nutrients for any given genotype [17]. Genotypic differences in phosphorus efficiency occur for number of reasons, these being related to uptake, transport, and utilization of nutrient within plants.
The results obtained shows that there are four phosphate efficient genotypes (5, 9, 10, andII) , and four inefficient genotypes (4, 7, 13, and 14). Genotypes 9 was the best in terms of phosphate use efficiency. The phosphate use efficiency parameter is an important characteristic for the selection and breeding of genotypes suitable for cultivation in soils low in availabile phosphorus [18].
18
The study of wheat cultivars showed that the grain yield improved with increasing phosphorus fertilizer application. Cultivars differed in their response to phosphorus fertilizers application. Field studies by Jessop and Palmer [4] and Batten et al [19] have shown significant differences in wheat genotypes in the response to phosphate fertilizer application. It has been reported that the increase in phosphorus application results in a positive effect on the tillering [20,21].
The present experiments also examined the concentration of N, P, Ca, and Mg in wheat shoots at different phosphorus levels. It was found that K, N, P, Ca, and Mg decreased with increasing plant age. Further, it was interesting to observe that the genotypes that produced high grain and/or biomass yield had low concentrations of most nutrients. Similar observations have been made by Saric’ et al. [22] but in different wheat cultivars.
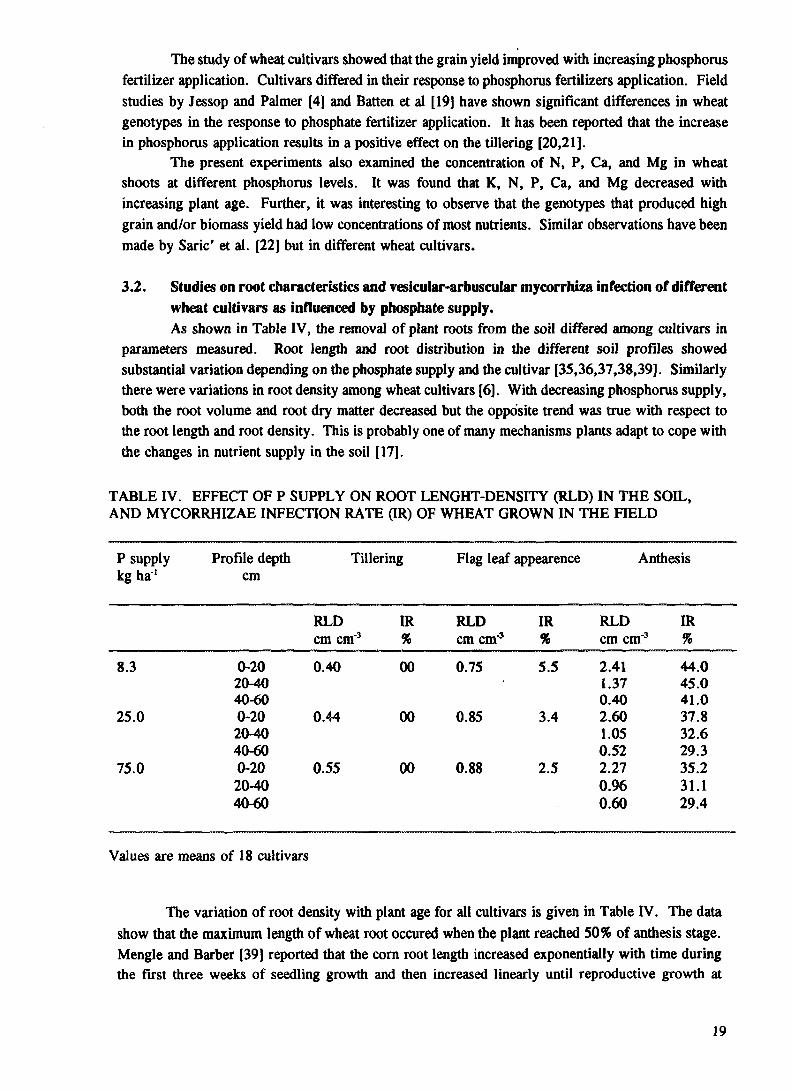
3.2. Studies on root characteristics and vesicular-arbuscular mycorrhiza infection of different wheat cultivars as influenced by phosphate supply.As shown in Table IV, the removal of plant roots from the soil differed among cultivars in
parameters measured. Root length and root distribution in the different soil profiles showed substantial variation depending on the phosphate supply and the cultivar [35,36,37,38,39]. Similarly there were variations in root density among wheat cultivars [6]. With decreasing phosphorus supply, both the root volume and root dry matter decreased but the opposite trend was true with respect to the root length and root density. This is probably one of many mechanisms plants adapt to cope with the changes in nutrient supply in the soil [17].
TABLE IV. EFFECT OF P SUPPLY ON ROOT LENGHT-DENSITY (RLD) IN THE SOIL, AND MYCORRHIZAE INFECTION RATE (IR) OF WHEAT GROWN IN THE FIELD
P supply kg ha"1
Profile depth cm
Tillering Flag leaf appearence Anthesis
RLD IR RLD IR RLD IRcm cm"3 % cm cm"3 % cm cm"3 %
8.3 0-20 0.40 00 0.75 5.5 2.41 44.020-40 1.37 45.040-60 0.40 41.0
25.0 0-20 0.44 00 0.85 3.4 2.60 37.820-40 1.05 32.640-60 0.52 29.3
75.0 0-20 0.55 00 0.88 2.5 2.27 35.220-40 0.96 31.140-60 0.60 29.4
Values are means of 18 cultivars
The variation of root density with plant age for all cultivars is given in Table IV. The data show that the maximum length of wheat root occured when the plant reached 50% of anthesis stage. Mengle and Barber [39] reported that the corn root length increased exponentially with time during the first three weeks of seedling growth and then increased linearly until reproductive growth at
19

eightieth day, after sowing. Therefore, the root sapmples in this study were taken till 50% of anthesis. Fig. 1. shows that the cultivars 3, 6, 14, and 18 has the highest total root density at low phosphorus supply, at anthesis stage.
Table IV also shows the root length densities at different soil depths. Data show that, the efficient cultivars (9 and 10) had a high root density in the 40-60 cm sub-soil region. This means that both cultivars can take up the nutrients from the sub-soil region and they propably have the root characteristics which allows them to be adapted to arid area in Egypt. On the other hand root distribution was affected by differences in chemical and physical properties between surface soil and sub-soil. Some sub-soils may be so compact that roots cannot pentrate them [40] or may be they cannot grow because of chemical factors [41]. Relative moisture levels in the surface soil and sub-soil may also affect root distribution in the soil profile. In more than half of the wheat cultivars, roots grew in the top 0-20 cm of soil profile at the stage of anthesis. Johnson [37] reported that the roots of red canary grass were concentrated near the soil surface. Root density was greater in the 0-20 cm region than in the 20-40 cm depth.
In addition to differences due to cutivars, root distribution was affected by phosphate supply. The data showed that increasing phosphate supply decreased the root density (Appendix Table V) particularly in the top soil (surface layer, 0-20 cm), possibly because this region had enough phosphate and other nutrients. The data from nutrient solution experiment (Appendix Table VI)
500
400
o>g 300
uT 2003
100
17 8 7 11 15 16 5 4 10 2 12 6Wheat cultivars
1 13 14 3 18 9
FIG. 1. Genotypic differences in phosphate use efficiency of 18 wheat cultivars grown in the field at low P supply (8.3 kg ha1).
20

Infe
ctio
n rat
e (%
) R
oot l
engt
h de
nsity
(cm
.
3
2.5
?2
1.5
1
0.5
0 <w m
70
60
11 12 7 5 16 8 1 10 15 9 13 17 2 4 6 3 14 18Wheat cultivar
FIG. 2. Genotypic differences in root length density and mycorrhiza infection rate of 18 wheat cultivars grown in the field at low P supply (8.3 kg ha1).
21

showed that the 10 selected cultivars used differed in root length and root biomass. Both characters increased with increasing the phosphate supply. Anghinoni and Berber [4] reported that the root distribution decreased with increasing phosphate supply in corn.
In all cultivars, more than 25% of root length was infected with mycorrhiza [VAM] at the until beginning of the reproductive stage (anthesis). But, at the early stages (vegetative stage), the infection was not more than 17% in all cultivars. Mycorrhiza infection in the top soils (0-20 cm) was more than the infection in the sub-soil (20-60) in all cultivars. This is also because the top soils were more occupied by roots tha the otehr regions in the soil profile. The growth of the root system in the early developmental stages was relatively little compared to the stages of flag leaf emergence and anthesis (Appendix Table V). In cultivars 3, 6, and 18, the root length density increased in the most rapidly during the vegetative stages. Howevr, in cultivars 7,10, 11 and 16, this parameter increased little until flag leaf emergence stage but increased rapidly thereafter.
REFERENCES
[1] SANCHEZ, P.A., SALLANS, G., Low input technology for managing oxisols and ultisols in tropical America, Adv. Agron., 34 (1981) 280-406.
[2] MARSCHNER, H , Mineral nutrition of higher plants. Academic Press, London, (1986) 369-371.[3] BEECH, D.F., NORMAN, M.J.T, A preliminary assessment of the adaptation of the semi-dwarf wheat varieties
to the Ord River Vally. Australian Journal of Experimental Agric. and Animal Husbandry, 8 (1968) 349-357.[4] JESSOP, R.S. PALMER, B , Seasonal dependence of cultivar of wheat yield response to superphosphate.
Australian Houmal Husbandry 14 (1976) 387-390.[5] HORST, W.J., WIESLER, F., Genotypishe unterschiede in den Anspruchen an des phosphate angebot bei
Sommarweizen, VDLUFA-Schrieftreihe 20 (1986).[6] ABDOU, M , Genotypische untershicde in der phosphateflizienz bei sommer weizen Diss Uni. Hohenheim-
Stuttgat (1989).[7] United States Salinity Laboratory Staff, Diagnosis and improvement of saline and alkali soils. U S. Dept. Agr.
Handb. 60, U S. Govt. Printing Office, Washington, D C. (1989) 160.[8] OLSEN, S.R., SOMERS, L.E., Phosphorus. In: A.L. Page, R.H. Miller and D.R. Keeney (Eds), Methods of
soil Analysis, part 2: Chemical and microbiological properties, 2nd ed.. American Society of Agronomy, Madison, USA (1982) 403-430.
[9] GER1CKE, S., KURMIES, B., Diekolorimetrischephosphorsaurebestimmung milammonium-vanadat-molybdat und ihre anwendung in der pflanzenanalyse. Z. pflanzenemahrung und Bodenk. 59 (1953) 235 - 247.
[10] ZADOKS, J.C., T.T. CHANG, KNOZAK, C.F., A decimal code for the growth stages of cereals, Eucarpia- Bulletin Nr. 7 (1974).
[11] THOMAS, R.L., SHEARD, R.W., MOYER, J R , Comparison of conventional and automated procedures for nitrogen, phosphorus and potassium analysis of plant material using a single digestion, Agron. J. 5 (1967) 240- 243.
[12] BLACK, C.A., Methods of Soil Analysis-Part 2 ASA pub., Madison, WI (1965) 771-1572.[13] AUFHAMMER, W., Zur Bedutung der kompensations fahigkeit eines weizenbestandes, Kali-Brief (Buntehof)
18 (1986) 357-370.[14] SOON, Y K , Nutrient uptake by barely roots under field conditions. Plant and soil 109 (1988) 171-179.[15] BERGMANN, W , Emahrungsstorungen bei Kulturepilanzen, Veb Gustav Fischer Verlag Jena, (1986) 24-25.[16] GERLOFF, G.C., GABELMAN, W.H., Genetic basis of inorganic plant nutrition. In Encyclopedia of plant
physiology, (Lauchli, A., Bieleeski, R I , Eds.) Spring-Verlag, New York. New Series Vol. 15 B (1983) 453- 480.
[17] GRAHAM, R.D., Breeding for nutritional Characteristics in creals. In Advances in plant nutrition, (Tinker P.B., Lauchli, A., Eds ), Praeger, New york, Vol. 1 (1984) 57-102.
[18] BARROW, N.J., Problems of efficient fertilizer use, Inf. Ser - N.Z. Dep. Sci. Ind. Res. 134 (1978) 37-52.[19] BATTEN, G.D., KHAN, M.A., CULLIS, B R , Yield responses by modem wheat genotypes to phosphate
fertilizer and their implications for breeding, Euphytica 33 (1984) 81-89.
22

[20]
[21]
[22]
[23]
[24][25]
[26][27]
[28]
[29]
[30]
[31]
[32[
[33]
[34]
[35]
[36]
[37][38]
[39]
[40]
[41]
BLACK, A.L., Adventitious roots, tillers, and grain yields of spring wheat as influenced by N-P fertilization, Agron. J. 62 (1970) 32-36.KNAPP, W.R., and KNAPP, J.S., Responses of winter wheat to date of planting and fall fertilization, Agron. J. 70 (1978) 1048-1053.SARIC’, MR.; KRST1C’, B , STANKOVC’, Z., Genetic aspects of mineral nutrition of wheat. I. Concentrations of N, P, K, Ca, and Mg in leaves, Journal of plant Nutrition, 10 (1987) 1539-1545.GARWOOD, E.A., AND WILLIAMS, T.E., Growth water use and nutrient uptake from the subsoil by grass swards. J. Agric. Sic., 69 (1967) 125-130.BOHM, W., Methods of Studing Root Systems, Spring-Verlag, Berlin (1979).NYE, P.H., TINKER, P.B., Solute movement in the soil-root system. Blackwell scientific publishers, Oxford (1977).JEFFRIES, P., Use of mycorrhiza in agriculture. Crit. Rev. Biotechnol., 5 (1987) 319-357.NELSEN, C.E., SAFIR, G.R., The water relations of well watered, mycorrhizal, and non-mycorrhizal onion plants. J. Am. Soc. Hoit. Sci., 107 (1982) 271-274.HUANG, R S , SMITH, W K , YOST, R.S., Influcence of vesicular-arbuscular mycorrhiza on growth, water relations and leaf orientation in Leucaena leucocephala (Lam.) De Wit. New Phytol. 99 (1985) 229-243. NELSEN, C.E., Water relations of vesicular-arbuscular mycorrhizal systems. In Ecophysiology of VA- mycorrhizal plants, (Safir, G.R., Ed.) CRC Press, Boca Raton, USA (1987) 71-91.FABER, B.A., ZASOSKI, R.J., BURAU, R G , URIU, K , Zinc uptake by com as affected by vesicular - arbuscular mycorrhiza. Plant Soil, 129 (1990) 121-130.KOTHARI, S K , MARSCHNER, H , GEORGE, E., Effect of VA-mycorrhizal fungi and rhizosphere miroorganisms on root and shoot morphology, growth and water relations in maize. New Phytol., 116 (1990) 303-
DAFT, M.J., OKUSANYA, BO, Effect of Endogone mycorrhiza on plant growth. VI. Influence of infection on the anatomy and reproductive development in four hosts. New phytol., 72 (1973) 1333-1339.MOSSE, B., Plant growth responses to vesicular-arbuscular mycorrhiza in soil given additional phosphate. New Phytol., 72 (1973) 127-136.TENNANT, D., A test of a modified line intercept method of estimating root length. J. Ecol., 63 (1975) 995-1001.
MENGEL, D B , BARBER, S.A., Development and distribution of the com root system under field conditions. Agron. J. 66 (1974) 341-344.SCHENK, M K , BARBER, S.A., Potassium and phosphorus uptake by com genotypes grown in the field as inlfuenced by root characteristics. Plant and Soil 54 (1980) 65-76.JOHNSON, K.D., Tall fescue (Festuca arundinacea) root relationships. Ph.D. Thesis, Purdue University (1981). WELBANK, P.J., GIBB, M.J., TAYLOR, P.J., WILLIAMS, ED, Root growth of cereal crops. Ann. Rep. Roth. Exp. Sta. (1974) 26-66.MENGEL, D B , BARBER, S.A., Rate of nutrient uptake per unit of com under field conditions. Agron. J., 66 (1974) 399-402.TAYLOR, H.M., Root behavior as affected by soil structure and strength. In The plant root and its environment, (Carson, E.W., Ed.) University press of Virginia, Charlottesville (1974) 271-291.PEARSON, R.W., Significance of rooting pattern to crop production and some problems of root research, In The plant root and its environment, University Press of Virginia, Charlottesville, (Carson, E.W., Ed.) 247-270.
[20]
[21]
[22]
[23]
[24][25]
[26][27]
[28]
[29]
[30]
[31]
[32[
[33]
[34]
[35]
[36]
[37][38]
[39]
[40]
[41]
23

PERFORMANCE OF ACACIA TORTIUS, PROSOPIS JUUFLORA AND CASUARINA EQVISETIFOUA PROVENANCES IN SOILS LOW IN PHOSPHORUS
D O. NYAMAI, P.0. JUMA Agroforestry Research Programme, Kenya Forestry Research Institute, Nairobi, Kenya
XA9642757
Abstract
PERFORMANCE OF A CA CIA TORTUS, PROSOPIS JUUFLORA AND CASUARINA EQVISETIFOUA PROVENANCES IN SOILS LOW IN AVAILABLE PHOSPHORUS.
Acacia tortilis, Prosopis juliflora and Casuarina equisetifolia provenances were screened to determine their potential for adaptability under P limiting conditions as a strategy to exploit genotypic differences in terms of utilization and uptake efficiencies. The experiment was conducted in the greenhouse at the Kenya Forestry Research Institute using soils taken from the field which are critically low in available P The experimental treatments comprised of P application at 0 and 60 Kg PzOJ/ha for 11 provenances of Acacia, 6 Prosopis and 4 Casuarina spp. Trait for adaptability to P deficiency was determined by measuring the growth performance, P uptake and utilization efficiencies at zero and moderate application of P. The results indicated considerable differences in the growth performance and phosphorus use efficiency (PUE). Acacia provenances showed the highest PUE compared with Prosopis and Casuarina spp although this was not reflected in the total dry matter yield. However, it was observed that P application resulted in an increase in shoot dry matter, height, root collar diameter and root dry matter in the case of Casuarina. Similarly, the highest total P uptake was obtained in Casuarina and Prosopis spp. The results further indicated that P application probably contributed to the reduction in root dry matter and root:shoot ratios of Acacia and Prosopis but not Casuarina spp. 1
1. INTRODUCTION
Kenya is an agricultural country where 90% of the population which live in rural areas depend directly on small-scale agriculture for their livelihood. The sector is a major contributor to the country’s GDP and an important source of formal and informal employment. However, farmers have reported steady decline in soil productivity over the last twenty years owing to continuous decrease in soil fertility, coupled with low nutrient inputs in manure and limited use of fertilizers.
Predominant soils are mainly low activity clays such as Acrisols, Cambisols, ferralsols and Luvisols [1]. These soils are low in available soil phosphorus, due to fixation of P into insoluble iron, aluminium and manganese hydroxy phosphates. This problem limits their ability to sustain agricultural production without supplementation with inorganic P fertilizers. However, owing to the inability of small scale farmers to purchase fertilizer inputs, agroforestry technologies involving use of woody perennials in cropping and pasture land use systems offer potential solutions as low input cropping strategy.
The main objective of this study was to identify Multi-Purpose Tree germplasm and provenances/genotypes which are adapted to phosphorus deficiency in the tropics. The following criteria were important in the choice of species for investigation: proven ability to grow in arid lands, existence in a wide ecological range, N2-fixation ability, possession of adequate sizes of population and significant genetic variation within the species and between the provenances. Acacia and Prosopis spp provide an excellent opportunity taking into consideration the above criteria. A third choice was Casuarina spp which in recent times has been introduced in a wider ecological range in the tropics. More specifically, this study focused on the performance of three important species for arid and semi
25

arid; A. tortilis, P. juliflora and C. equisetifolia at zero and moderate rates of P application. The characteristics and importance of these species have been underscored by many workers [2], [4], [5], [6], [7], [8], [9], [10],
2. MATERIALS AND METHODS
2.1. The greenhouse conditionsThe pot experiment was conducted in the greenhouse at the Kenya Forestry Research Institute
using soils taken from semi arid area at Machakos, Kenya which are classified as Ferralsols and Chromic Luvisols (Table I).
Acacia and Prosopis tree seeds were obtained from Oxford Forestry Institute in the U.K., while Casuarina equisetifolia seeds were provided by the Center Technique Forester Tropical (CTFT) in France. The Acacia and Prosopis seedlings were inoculated with a multistrain Rhizobium inoculant prepared by the Microbiological Research Centre (MIRCEN), Nairobi while Casuarina seedlings were inoculated with Frankia strain which was provided with the seeds from Center Technique Forestier Tropical (CTFC), France. Soil chemical analyses were determined prior to planting only for purposes of soil characterization. The soils were thoroughly mixed before filling the pots. A representative soil sample was then taken from each pot, mixed again, air-dried and sieved to pass through a 2mm screen. The seeds were germinated in trays and later pricked out and planted in the pots for the greenhouse.
TABLE I. CHARACTERIZATION OF SOIL FROM KATUMANI SITE USED IN GREENHOUSE EXPERIMENT
Parameter Quantity
pH 5.6 ±0.1
Total N (%) 0.2 ±0.01
Organic C 1.3 ±0.5
Available P (ppm) 7.4 ±2.0
Exchangeable K (ppm) 12.2 ±1.2
Exchangeable Ca (ppm) 13.4 ±1.2
Exchangeable Na (ppm) 2.9 ±0.5
Exchangeable Mg (ppm) 3.8 ±1.5
2.2. Experimental design and samplingThe greenhouse experiment was laid out in a Randomized Complete Block Design (RCBD).
The treatments comprised of P application at 0 and 60 Kg P205 /ha (equivalent to 0.6 g P20$/hole at a plant population of 10,000/ha), 11 provenances of Acacia, 6 Prosopis and 4 Casuarina spp. The
26

experiment was replicated three times. Standard pots measuring 20 cm in height by 20 cm top diameter and 10 cm bottom diameter were used. The average volume of soil per pot was 1.8 litres. Temperature, relative humidity and ventilation in the greenhouse were maintained to simulate the ambient temperature and humidity of the surrounding environment. The average day temperature was approximately 27°C while the relative humidity fluctuated between 70-80%. Watering of the seedlings in pots was regulated as the demand rose with the growth of trees.
The plant parameters measured included shoot and root dry matter yield, height, root collar diameter, rootishoot ratios, total P uptake and P use efficiency (PUE). Three randomly selected pots in each treatment per sub-plot (representing 50% of the total plant population) were used for the assessments. Total P concentration in the plant sample was determined by taking samples from the entire plant and mixing them together. The samples were then dried in a ventilated oven at 80°C for 24 hours and then ground with a Wiley mill. In the case of total P uptake, the samples were analysed calorimetrically using the Venado-molybdate method [11].
Dry matter yield was determined 12 months from planting time by destructive sampling followed by drying in a ventilated oven at 80°C for 24 hours. Total height was measured to the nearest centimeter while root collar diameter was recorded in millimeter.
2.3. Statistical analysis of dataWith the exception of total P uptake and PUE, all the experimental data from the greenhouse
experiment have been analysed on a species by species basis since more than one tree species was studied. This made it necessary for each species to be tested separately for variables such as growth parameters which cannot be compared. For the analysis of variance, experimental data were analysed as Randomized Complete Block Design (RCBD) for the traits which were tested to enable comparisons between the species and the provenances.
3. RESULTS AND DISCUSSION
The response to P by the different species and provenances are summarized in Table II and are further illustrated in Fig. 1. Generally, the application of phosphorus at medium level resulted in increased growth with regards to shoot dry matter, height and root collar diameter (Table II and Fig. 1). Both Acacia and Prosopis species showed reduced root dry matter production with application of P although in the case of Casuarina provenances a significant increase in root dry matter was observed as demonstrated by the results (Table II).
The results further showed that the application of P resulted in increased P uptake (Table II). Acacia provenances showed the highest PUE (Table II) compared with Prosopis and Casuarina spp although this trait was not reflected in the total dry matter production. Acacia provenances G8, G6, G7 and G5 (Table II), in this order were outstanding. This observation suggests that these provenances/genotypes can be grown in soils low in available P with minimum input of P. The high P uptake obtained in Casuarina appears to be positively correlated with root dry matter production following P application at moderate level. This probably indicates that high P absorbing genotypes are characterized by a higher root biomass. Available information from empirical and simulated data have shown that P uptake is related to changes in root growth, [12] and that differences among cultivars particularly at low P can be attributed to the degree of root growth [13] and [14].
27

TABLE n. EFFECTS OF P APPLICATION ON THE ROOT AND ABOVE GROUND (SHOOT) DRY MATTER, ROOT COLLAR DIAMETER, AND FOLIAR P CONCENTRATION OF ACACIA TORTILIS, PROSOPIS JUUFLORA AND CASUARINA EQU1SEHFOUA PROVENANCES AT 12 MONTHS AFTER PLANTING
Code Specie! Provenance Source Root dry matter (g/plant)
Shoot dry matter (g/plant)
Foliar P cone. (%)
Root collar diameter (mm)
Height(cm)
Root:Shoot ratio
p +P -P +P -P +P -P +P -P +P P +P
G1 Acacia tortUis spirocarpa Yemen 18.7 15.4 43.8 50.3 0.19 0.21 18.4 20.7 40.2 50.1 0.42 0.30G2 Aacacia tortUis spirocarpa G.Sudan 21.0 17.5 36.4 48.4 0.18 0.24 18.5 18.3 43.4 48.3 0.58 0.35G3 Acacia tortUis spirocarpa N.KSudan 13.2 15.5 33.3 50.6 0.16 0.24 19.2 22.6 63.5 65.2 0.39 0.30G4 Acacia tortilis spirocarpa Israel 15.7 14.2 40.5 52.0 0.20 0.21 20.1 19.0 57.3 55.5 0.37 0.27G5 Acacia tortUis spirocarpa Sudan 17.8 17.3 37.0 38.2 0.20 0.20 19.8 18.3 50.0 56.2 0.46 0.45G6 Acacia tortilis tortilis India 20.2 18.0 48.1 60.1 0.17 0.19 18.0 23.4 62.3 78.1 0.42 0.30G7 Acacia tortUis raddian Somalia 22.0 15.3 47.2 50.3 0.19 0.19 18.1 19.2 45.2 57.1 0.81 0.50G8 Acacia tortilis raddiana Niger 16.0 18.4 40.1 47.4 0.18 0.18 22.1 22.4 60.9 58.0 0.40 0.38G9 Acacia tortUis raddiana Rao Senegal 25.1 20.9 47.2 63.2 0.17 0.22 22.4 21.9 74.8 60.9 0.53 0.32G10 Acacia tortUis heteracantta Zimbabwe 23.8 18.1 58.5 70.5 0.17 0.22 21.2 23.0 75.9 74.2 0.40 0.26G11 Acacia tortilis hcteracantha Zimbabwe 15.9 12.0 44.7 61.0 0.19 0.23 17.0 20.1 61.0 73.5 0.36 0.20
Mean 20.6 16.6 46.1 55.0 0.18 0.21 19.7 20.8 59.0 63.2 0.47 0.33
G12 Prosopis itdiftora Costarica 21.9 19.8 48.2 66.5 0.29 0.28 19.5 21.3 72.2 84.3 0.44 0.30G13 Prosopis juiiflora Panama 25.8 23.2 53.8 80.8 0.26 0.25 20.0 22.8 68.7 77.6 0.47 0.30G14 Prosopis juhflora Columbia 19.7 18.9 55.6 75.0 0.22 0.30 17.8 22.0 69.8 80.3 0.35 0.25G1S Prosopis juhflora Honduras 20.5 22.0 60.0 71.8 0.24 0.25 17.6 20.1 66.9 77.6 0.34 0.31G16 Prosopis juhflora Kenya 23.7 20.6 58.5 69.8 0.25 0.29 18.8 20.6 73.2 81.4 0.40 0.30GI7 Prosopis juhflora Peru 23.6 19.1 60.8 70.7 0.28 0.31 19.3 19.0 75.0 86.3 0.39 0.27
Mean 22.5 20.6 56.2 72.4 0.26 0.28 18.8 21.0 71.0 81.3 0.40 0.29
G18 Casuarina equisettfolia Senegal Kayar 25.2 35.4 75.5 141.2 0.25 0.27 25.0 35.7 80.3 105.2 0.33 0.25G19 Casuarina equisettfolia Kenya-R.Island 30.2 33.7 68.7 128.0 0.28 0.29 27.0- 38.2 85.1 110.7 0.44 0.26G20 Casuarina equisettfolia Senegal Dakar 27.8 40.0 72.9 135.3 0.24 0.30 24.4 32.1 78.0 104.5 0.38 0.29G21 Casuarina equisettfolia Australia 28.5 34.7 74.0 134.9 0.25 0.27 25.3 33.8 82.0 115.2 0.38 0.24
Mean 28.0 36.0 72.8 134.9 0.26 0.28 25.4 35.0 81.4 109.0 0.38 0.26
LSD P <0.05
i) For difference! between specie: 11.2 14.1 0.10 2.1 19.9 0.2
ii) For difference between treatments/ species 10.7 5.5 0.05 1.8 13.0 0.1
iii) For differences between treatments forthe same species/provenances 5.0 10.1 0.06 2.7 5.9 0.1

FIG. 1.
Genotypic differences in total dry m
atter production of (A) Acacia provenances (1-11), and
(B) Prosopis provenances (1-6), and C
asuarina provenances (7-10).
%$
\o 00 Ln
I II i
1£ f
K. Sr ** a-& ST g
S’ P'i
M M ^ 00 vj ON til
b> bI
t
l S?1^ |i||
100

The highest rate of response for shoot dry matter and height growth was obtained in the Casuarina provenances which was estimated to be 90% and 34% higher than treatments where P was not applied, respectively. In contrast with the above ground growth performance parameters, the results showed that Acacia and Prosopis species/provenances which did not receive P application produced higher root dry matter production which resulted in a low root/shoot ratio (Table II).
From the results, it is noted that P application conferred beneficial effects on the growth performance with the exception of root dry matter production for Acacia and Prosopis spp which appeared depressed following P application at moderate rate. These results therefore suggest that Acacia and Prosopis are more efficient in P uptake as shown clearly by their ability for increased root growth under P stress conditions. Smith [15] stated that an increase in root/shoot ratio often accompanies P deficiency which agrees with the results obtained in this study (Table II).
However, the application of these results at the moment may be limited taking into consideration that they are confounded by several factors, for instance, the relative degrees and trends in growth performance in the greenhouse could have been greatly influenced by the conditions existing in the greenhouse which are usually very different from those observed in the field. Furthermore, detailed agronomic/silvicultural and physiological analysis are extremely necessary in order to optimize the performance of genotypic differences at low, moderate and high conditions.
4. CONCLUSIONS
Although these results provide valuable information, they however, need cautious interpretations if they are to be used for formulating recommendations for provenance/genotypes choice for field application. Perhaps, the most immediate and logical step forward would be to confirm these results under field conditions to validate and prove consistency.
ACKNOWLEDGEMENTS
This work was supported and conducted under the FAO/IAEA/SIDA Coordinated Research Programme on water and phosphorus use efficiency, for which we are very grateful. The authors would like to thank Dr. K. S. Kumarasinghe of the Joint F AO/IAEA Division of Nuclear Techniques in Food and Agriculture for his support and valuable contribution throughout the period of this investigation.
REFERENCES
[1] FAO/UNESCO Soil map of the world, Revised volume (1988) UNESCO, Paris.[2] OLNG’OTIE, D.A.S., Genetic distribution of Acacia tortilis, Thesis D.Phil (1992) University of Oxford.[3] NAS Firewood crops: Shrubs and tree species for energy production, National Academy of Science, Washington
D. C. (1980) 237.[4] HARLEVY, G., ORSHAN, G., Ecological studies on Acacia species in the Negev and Sinai, I. Distribution of
Acacia raddiana, A. tortilis and A. gerrardii spp. negevensis as related to environmental factors, Israel Journal of Botany 21 (1972) 197-208.
[5] MAYDELL, von H. J., Trees and shrubs of the Sahel: their characteristics and uses, Schriftenreihe der GTZ, 196 (1986).
30

[6] LEAKEY, R.R.B., WILSON, J., MANSON, P. A., Agroforestry and mycorrhizal research for semiarid lands of East Africa, Institute of Terrestrial Ecology, Annual Report , Overseas Development Administration, London, England (1987).
[7] NAS Tropical Legumes: Resources for the future, National Academy of Science, Washington D C. (1979) 331.[8] FELKER, P., Mesquite - an all purpose leguminous and land tree, Economic Botany 36 (1982).[9] FELKER, P., BANDURSKI R. S., Uses and potential uses of leguminous trees for minimal energy input
agriculture, Economic Botany, 33 (1979) 172-184. •[10] Casuarinas: Nitrogen fixing trees for Adverse Sites, Australian Academy of Sciences, (1984) 16-33.[11] Methods of analysis, Association of Official Analytical Chemists, 11th Ed. Washington D C (1970).[12] Soil nutrient bioavailability (BARBER, S.A., Ed) John Wiley and Sons, Inc. USA (1984)[13] BARBER, S.A., MAC KAY A.D., Root growth and phosphorus and potassium uptake by two com genotypes
in the field, Pert. Res. 10 (1986) 217-230.[14] ROMER, W., AGUSTIN, J., SCHILLING, G., The relationship between phosphate absorption and root length
in nine wheat cultivars, Plant and Soil, 111 (1988) 199- 201.[15] SMITH F. W., Mineral Nutrition of legumes, In Nitrogen fixation of Legumes (Vincent, J. M., Ed) Academic
Press, New York (1982) 155-172.
WEXT PAOEIS) left BLANK
31

IDENTIFICATION OF COWPEA CULTIVARS FOR LOW PHOSPHORUS SOILS OF NIGERIA
N O. AFOLABI, B.A. OGUNBODEDE, J.A. ADEDIRAN Institute of Agricultural Research and Training,Obafemi Awolowo University,Ibadan, Nigeria
Abstract
XA9642758
IDENTIFICATION OF COWPEA CULTIVARS FOR LOW PHOSPHORUS SOILS OF NIGERIA.Twenty cultivars of cowpea, Vigna unguiculata, adapted to the Nigerian ecologies were screened to identify
cultivars which can give high and sustainable yields when grown on soils with low available phosphorus in a sub-humid climate. Some cultivars including TVX3236, AFB1757, Ogunfowokan and K-28 gave three to four times higher grain yields than the other cultivars at zero phosphorus supply. While phosphorus application reduced grain yield in most of the cultivars with marked reduction in the higher yielding cultivars, low yielding cultivars tended to show some yield increase. Phosphorus use efficiency of the roots, stem or leaves was not significantly correlated with grain yield when 60 KgP/ha was applied. Reduction in yield due to phosphorus application might be due to induced Zn deficiency as Zn supply in these soils has been found to be inherently low. High grain yielding capacity without fertilizer phosphorus application was generally positively correlated with high vegetative shoot dry matter production. However, no clear relationship could be found between grain yield and root dry matter at maturity. It is concluded that selection for phosphorus efficiency in cowpea can substantially ontribute to higher cowpea productivity and the farmers income on soils low in available phosphorus in the sub-humid areas of Nigeria.
INTRODUCTION
Cowpea, Vigna unguiculata (L.) Walp, is a major source of cheap and good quality protein for the low income people of Nigeria. Also, for people who, for religious reasons, abstain from animal protein, cowpea remains the main source of protein. In the sub-humid zone of Nigeria, cowpea is widely grown under rainfed conditions. However, within the last few years, rainfall pattern has become quite erratic. Thus, during the cropping season in this zone, rainfall is poorly distributed and varied within seasons. Also dry spells of 7-14 days are frequent during the begiming and towards the end of the cropping season. Since phosphorus availability is drastically reduced in dry soils this amplifies the consequences of the inherent low phosphorus supply of these soils on crop yields [1], Low phosphorus supply may result in severe seed yield losses especially during dry years. To be able to increase productivity on such soils, therefore, farmers could be advised to supplement the nutrient status with inorganic fertilizers. However, owing to the ever increasing cost and often unavailability of this comodity, most farmers find it difficult (if not impossible) to purchase adequate quantities of fertilizer.
There is, therefore, a compelling need to identify alternative ways to increase agricultural productivity without necessarily using inorganic fertilizers. Consequently, identification of cowpea cultivars that can be profitably grown on these depleted soils will be a step in the right direction. The use of nuclear and other techniques to determine the factors responsible for this important attribute will greatly assist the plant breeder to develope improved varieties of this important crop to enhance the achievement of the national objective of self-sufficiency in food production at the shortest possible time.
The major objectives of this study were: (a) identify cowpea cultivars which can give high and sustainable yields when grown under rainfed and low phosphorus conditions and (b) identify the characters responsible for the better performance observed.
MATERIALS AND METHODS
Twenty (20) cowpea cultivars (Appendix Table 21) were sown in the field at Ilora in the guinea savanna ecological zone on Nigeria under rainfed conditions in accordance with the guidelines agreed upon at the RCM. In each of the blocks the twenty cultivars were randomly distributed into plots of 10 square meters. The experimental design was a complete randomized block with two
33

phosphorus treatments and four replications. The plot size was 4 rows 5m long with distance between and within the rows 0.5 and 0.2m respectively to give a plant population of 100,000 plants per hectare. The treatment with phosphorus received at 60 kg per hectare in the form of single super phosphate. The fertilizer was well mixed with the surface soil by hand raking before plantig. Sowing of the crop was done mid-August.
All other cultural practices including pesticide application were carried out as recommended for the zone. Climatic data such as temperature, humidity and precipitation were recorded throughout the experimental period. Some characteristics of the soil of the experimental site are given in Appendix Table 22. At flowering and physiological maturity stages, data Of fresh and dry weights (48 hours at 5°C) of roots, stems and leaves were recorded. Observations were taken on five randomly picked plants in the two central rows. Means of these were used for the statistical analysis. Data were recorded on days to flowering, days to maturity, grain yield (g/plant), dry plant weight (g) number of pods per plant, 100 seed weight and threshing percentage. Phosphorus use efficiency based on dry matter yield/kg P was calculated following the procedures suggested by Siddiqi and Glass [2], and Isreal and Rufty [3].
RESULTS AND DISCUSSION
The cultivars included in the study show highly significant differences in grain yield when grown at zero P as well as when 60 kg/ha P was applied (Fig. 1). Cultivars K-28, AFB 1757 and Ogunfowokan gave three to four times higher grain yields than cultivars Ife BPC, 4113-4 and L-72 at zero phosphorus supply (Table I). The highest grain yield was however, obtained from TVX 3236 which gave up to 25-38% grain yield higher than the three high yielding cultivars. Surprisingly, phosphorus application reduced grain yield for most of the cultivars (Table I, Fig.l). The reduction was specially marked for the high yielding cultivars, whereas the low yielding cultivars tended to show some yield increase. The yield of cultivars TVX 3236 was reduced by 43% on phosphorus application, while for other promising cultivars, the yields decreased by 25-50%. However,
TABLE 1. CHARACTERISTICS OF COWPEA CULTIVARS STUDIES IN ILORA 1990-1992
Cultivar Source of cultivar Habit Growth duration
Ife Brown I.A.R.T. Erect MediumIfe B P C "AFB 1757 SpreadingA9Ogunfowokan ErectK-28 N.C.R.I.K-39K-59 EarlyL-72 MediumL-80 " "IAR48 I.A.R. " "IAR-11/48-2 " "IT86D-957 I.I.T.A. " nIT86D-715 " 11IVX 3236IT86D-721IT84S-224.6-4 EarlyIT86D-719 MediumH 113-4 O.A.U.H 64-3 O.A.U.
34

40H 0 kg P205/ha □ 60 kg P205/ha
9 15 13 3 11 14 4 1 19 20 6 5 18 16 17 7 2 12 10 8Cowpea genotypes
1. Ife Brown2. K-283. IT86D-7155274. K-395. IT86D-9576. IK 4087. K-598. TVX32369. Ife BPC10. AFB 17511. A912. OGUNFO13. L-7214.483 IAR 11/4815. HK3-416. H64-317. IT845-22418. H64-319. L-8020. IT86D-719
FIG. I. Genotypic differences in grain yield of cowpea.

phosphorus application resulted in grain yield increase by 30-80% for some medium yielding cultivars such as K-39, IAR 11/48-2, IT86D-715, Ife BPC and HI 13-4. Cultivars L-80, L-72, A9, Ife Brown and IT86D-719 seemed to be low yielding at zero phosphorus supply and also, these varieties showed little or no response to phosphorus application.
The highest phosphorus use efficiency (PUE) values were recorded for most of the low low yielding cultivars while the lowest values were obtained from the high yielding ones (Fig. 2). Interestingly, this supports the fact that the most most prominent cultivars at zero phosphorus application could not utilize phosphorus efficiently for grain formation when the element was supplied. This indicated that there was no close relationship between FUE and the grain produced. Correlation at 60 kg P/ha between PUE in root, shoot and grain yields were rather negative and low (r=0.05 and r=0.241, respectively. It could rather be deduced from these results that, the most efficient cultivars showed no response to phosphorus application. This indicated that such cultivars have the capacity to produce high yields under low phosphorus conditions. Also, phosphorus application to these cultivars might induce vegetative growth rather than high grain yield production.
Reduction in grain yield due to phosphorus application might be due to induced Zn deficiency as Zn supply in these soils has been found to be inherently low [4]. Since Zn requirements is much higher for higher yielding cultivars, these responded more sensitively to phosphorus induced Zn deficiency. The positive response of the low yielding cultivars to phosphorus application indicate that, at least for these cultivars, phosphorus limited growth at the zero phosphorus treatment and thus yielding capacity at zero phosphorus might indicate differences between the cultivars in phosphorus use efficiency
Grain yield at zero phosphorus supply was highly positively correlated to vegetative dry matter accumulation at maturity (Table II). Aggarwal and Halley [5] made similar observations where the total dry matter yield was significantly correlated with grain yield: These authors concluded that plants with more vigour (dry matter) are better adapted to the environment. Differences in phosphorus use efficiency could be due to differences in phosphorus uptake owing to a more extensive root system. Therefore, root growth was assessed at flowering (Table II). Obviously, root dry matter was not closely related to grain yield formation. Only two of the phosphorus efficient cultivars (Cultivars K-28 and AFB1757) also were among the two highest rooting cultivars. However, root dry weigh might not be a suitable parameter for phosphorus acquisition which is much more dependent on root surface area and thus root length. 1 11
o.tTJ3UJ2
800
2 7 15 11 6 5 8 14 9 12 10 3 17 20 4 1 15 13 18 19
Genotypes
1. Ife Brown2. K-283. IT86D-7155274. K-395. IT86D-9576. IK 4087. K-598. TVX 32369. Ife BPC10. AFB17511. A912. OGUNFO13. L-7214.483 IAR 11/4815. HK3-416. H64-317.1T845-22418. H64-319. L-8020. IT86D-719
FIG. 2. Genotypic differences in phosphorus use efficiency (PUE) of cowpea.
36

TABLE II. SOME SOIL CHARACTERISTICS OF THE EXPERIMENTAL FIELD
Parameter Quantity
Sand (%) 75.8
Silt (%) 12.8
Clay (%) 11.4
Ca2+ (meq/lOOg) 4.90
Mg2+ (meq/lOOg) 3.27
CEC (meq/lOOg) 9.15
KC1 acidity (meq/lOOg) 0.40
Base saturation (%) 99
pH (KC1) 6.55
N (%) 0.08
P (Bray 1) mg kg"1 4.95
REFERENCES
[11 Ayanduba, E.T. and J.A. Adepetu (1983). Predicting the phosphorus fertilization need of tropical soils;sigificance of the relationship between critical solution P requirement of cowpea, P sorption potential of free iron content of soil. J. Trop. Agric. Vet. Sci. 21(l):21-30. W.O. and W. A. Moore (1966). Phosphate status in some Nigerian Soils. Soils. Soil Sci. 102: 322 - 327
[2] Siddiqi, M Y and ADM Glass (1981). Utilization index: A modified approach to the estimation and comparison of nutrient utilization efficiency in plants. J. Plant Nutr. 4: 289 - 302.
[3] Israel, D.W. and T.W. Rufty (1988). Influence of phosphorus nutrition on phosphorus and nitrogen utilization efficiencies and associated physiological responses in Soybean. Crop Sci. 28:954-960.
[4] Aggarwal, V.D., R.B. Ntarc and J.B. Smithson (1982). The relationshi among yield and other characters in vegetative cowpea and effect of different trelis management systems on pod yield. Tropical Grain Legume Bulletin. 25:8-14.
[5] Aggarwal, V.D. and S.D. Halley (1985). Varietal evaluation of cowpea to determine characters associated it’, adaptation to dry areas Africa. In: S.R. Singh nd K.O. Rachic (eds.). Cowpea Research, Production and Utili.ation. John Wile and Sons, Ltd., New York.
37

GENOTYPIC DIFFERENCES IN YIELD FORMATION, PHOSPHORUS UTILIZATION AND NITROGEN FIXATION BY COWPEAS IN SIERRA LEONE
D.S. AMARADepartment of Soil Science, Njala University College, University of Sierra Leone
D.S. SUALfcInstitute of Agricultural Research
Freetown, Sierra Leone
XA9642759
Abstract
GENOTYPIC DIFFERENCES IN YIELD FORMATION, PHOSPHORUS UTILIZATION AND NITROGEN FIXATION BY COWPEAS IN SIERRA LEONE.
Available phosphorus (P) and nitrogen (N) generally occur in very low amounts in soils of the tropics and subtropics. Under such conditions, most crops would require the addition of N and P fertilizers. This is not possible for small- scale farmers who cannot afford or have limited access to fertilizers, and therefore depend on low-input cropping systems. The selection of cultivars adapted to low soil nutrient conditions would sustain the production levels of subsistence farmers.
Experiments were therefore conducted over a five-year period to identify cowpea cultivars with high phosphorus use efficiency and nitrogen fixation. Two of such cultivars-IT86D-1010 and IT86D-719 have been identified. Root morphological characteristics such as root length, root fineness and vesicular-arbuscular mycorrhizae are responsible for high P uptake and use efficiency. Multilocational testing of the cultivars showed that they cannot do well in areas with low rainfall. They have been distributed to farmers through the extension services for large scale production in southern Sierra Leone.
1. INTRODUCTION
Traditional food production systems depend largely on the restorative capacity of the fallow period. Increasing population pressure on land has resulted in shortening of the fallow period and traditional practices can no longer maintain soil fertility [1]. Nutrient management in these "fragile" soils is of critical importance for sustained production. Under these conditions, and considering the high cost of fertilizers [2]. greater efforts need to be made in increasing the efficiency of utilization of both native soil and applied nutrient.
Exploiting genetic differences among cowpea cultivars for phosphorus uptake and use efficiency and nitrogen fixation can improve their productivity on phosphorus and nitrogen deficient soils. This is important in plant introduction, selection and breeding. Where phosphorus fertilizer application for maximum yield is a must, plant species or cultivars better able of extracting soil phosphorus or applied phosphorus fertilizers more efficiently will be needed [3,4].
Available P and N generally occur in very low amounts in soils of the tropics and sub-tropics. Under such conditions, most crops would require the addition of N and P fertilizers. This is not possible for small-scale farmers who cannot afford or have limited access to fertilizers, and therefore depend on low-input cropping systems. The selection of cultivars adapted to low soil nutrient conditions would sustain the production levels of subsistence farmers. Therefore the objectives of the study were: i) to identify cowpea cultivars with high phosphorus use efficiency (PUE) under low and high P; ii) to investigate the grain and straw P use efficiency of the cultivars at low and high P levels; iii) to study the relationship between P use efficiency and other growth related parameters; iv) to study the relationship between nitrogen fixation and P use efficiency; and v) to assess the growth and yield potential of the elite cultivars under different soil and climatic conditions in the field and vi) to identify the factors responsible for P uptake and use efficiency .
39

2. MATERIALS AND METHODS
2.1. Experiment 1This field experiment was carried out in September, 1990 to identify cowpea cultivars with
high phosphorus use efficiency (PUE) under low and high P. The treatments included 11 cowpea cultivars (Appendix Table 1) obtained from the gene bank of the Institute of Agricultural Research, and 2 P levels: Low-P = 0 kg P/ha and high-P = 15 kg P/ha. The higher P rate is the recommended rate for cowpea. A factorial combination of cultivars and P levels (11 cultivars x 2 P levels = 22 treatments) were established in a split design with 4 replications. The P levels were the main-plot and cultivars the sub-plot. The plot size was 2m x 6m and a plant spacing of 10cm x 50cm within and between rows respectively, giving a total of 20,000 plants/ha. A basal dose of 12.4 kg k/ha was applied to all treatments. Harvesting was done at physiological maturity by cutting the shoot about 3-5cm above the ground. The grain and vegetative parts were chopped into pieces, a weighed subsample dried in an oven at 65-70°C for 48 hrs, and weight recorded. A portion of the dried material was ground and total P determined.
2.2. Experiment 2This was a repeat of experiment 1 in September, 1991 in which tha same 11 cowpea cultivars
(Table 1) and 2 P levels were again used. The methology followed was the same as in experiment 1 except that harvesting was done at flowering and physiological maturity and yield parameters and P determined as before.
Five experiments were conducted between 1990 and 1994. Except where otherwise indicated,all the experiments were carried out on the Njala soil series (Typic haplustox) a sandy clay loam soilwith the following characteristics: pH(H20)-5.4, total N-0.5%, effective CEC-15 meq/lOOg soil, andavailable P-4.78 ppm. The cowpea cultivars used are listed in Appendix Table 1, and details of eachexperiment are given as follows:
TABLE I. EFFECT OF P SUPPLY ON GRAIN YIELDS OF 5 COWPEA CULTIVARS
P rate(kg/ha)Cultivars 0 15 30 60 MEAN
IT86D-1010(B)* 337.5 583.3 626.8 647.5 548.8IT86D-719(E) 308.5 595.0 602.5 626.8 533.2IT81D-832(IB)* 284.0 500.0 509.8 541.8 458.2IT87S-1462(I)* 241.0 409.3 420.0 437.5 378.0TEMNE(local check/I) 154.8 298.3 356.0 376.5 296.4
MEAN 265.2 477.2 503.0 526.0
Lsd(0.05: Cultivar = 59.7, P rate = 44.5, C x P = NS * E— Efficient, IE = Intermediate Efficient, I = Inefficient
2.3. Experiment 3Cowpea cultivars were selected from experiments 1 and 2 on the basis of their contrasting
phosphorus use efficiencies and used in this experiment which was conducted in September, 1992. The treatments included 5 cultivars (see Appendix Table 1), and 4 P levels in kg/ha: 0-very deficient, 15-deficient, 30-slightly deficient and 60-non-limiting phosphorus using single superphosphate. A factorial combination of cultivars and P levels (5 x 4 = 20 treatments) were established in a split-plot design with 4 replications. The P levels were the main-plot and cultivars the sub-plot. The seeds were planted as described in experiment 1. A 2m x lm 15N microplot was demarcated in each plot in order to measure N2 fixation. Lebelled fertilizer in the form of urea with 10% atom l3N excess was applied at the rate of 20 kg N/ha. Maize was planted as the reference in each replicate. Harvesting was done at 14 days after emergence (DAE), 50% flowering, and physiological maturity.
40

2.4. Experiment 4A trial was carried out in different agroecological zones in 1993 to assess the growth and
yield potentials of the cultivars under different soil and climatic conditions in the field (Appendix Table 2). They were grown in 3 locations without any P application, at Njala and Hendobu in the south and Makeni in the north of Sierra Leone. The plot size was 10m x 10m and the experimental design was a randomized complete block with 4 replications. A basal dose of muriate of potash was applied to all the plots at each location at the rate of 12.4 kg/ha. Harvesting was done at physiological maturity and grain, dry matter, and total P yields recorded.
2.5. Experiment 5A pot study was carried out in 1994 using three cultivars with contrasting P use efficiencies
(see Appendix Table 1). Two P levels 0 and 60 kg P/ha were used. The soil used in the pots was collected from the Njala soil series i.e., the same soil on which the field experiments were conducted. Four seeds of each cultivar were planted/pot and thinned to 2/pot one week after emergence. The treatments were completely randomized and the plants were exposed to natural light intensity, temperature, humidity, and day length conditions throughout the entire course of the experiment. The plants were harvested after 21 days and the parameters recorded were root length measured according to Tennant’s method [5], Root finess(root length/unit root weight), shoot and root dry weights, root- shoot ratios and VA mycorrhizal infection.
2.6. CalculationsPhosphorus use efficiency was calculated as grain or dry matter yield/kg of P in grain or dry
matter [6]. The proportion and amount nitrogen fixed was estimated by the isotope dilution method[7], i.e.,
%Ndfa/ P
**fixing cropp
v, fixing cropX 100
Where R — atom %,5N excess
2.7. Statistical analysesAll the results are expressed as means and graphs were produced using the "Harvard
Graphics" Version 2.3. Data was subjected to an analysis of variance using the MSTATC statistical package [8]. For the field experiment, the split-plot model was used to c#ry out analysis of variance in randomized complete block design (RCB). The pot experiment consisted of a 2x3 factorial combination of treatments in a completely randomized design (CRD) with four replications. Least significant differences (Lsd) at 5% was used to compare treatment effects.
3. RESULTS AND DISCUSSION
3.1. Experiments 1 and 2All the cultivars responded to P application, indicating the importance of P in cowpea
nutrition. Genotypic differences in dry matter production and total phosphorus use efficiency (PUE) are given in Figures 1-3. In general, the cultivars which gave the best dry matter yield per unit area or phosphorus are IT86D-1010, IT86D-719 and IT81D-832 (i.e. cultivars 2, 3, and 10 in Appendix Table 1). Based on their demonstrated performance (Figs. 1 and 2) the cultivars were ranked as efficient (cultivars 2 and 3) intermediate efficient (cultivar 10), and Inefficient (cultivars 5 and 11). These cultivars were then used in the detailed studies which followed.
41

1 2 3 4 5 6 7 8 9 10 11
Total PUE(kg DM/kgP) 1990 800 n----------------------------------------------
1 23456789 10 11i
Genotypes
FIG. 1. Genotypic differences in dry matter yields and PUE of 11 cowpea cultivars during the 1990 cropping season
42
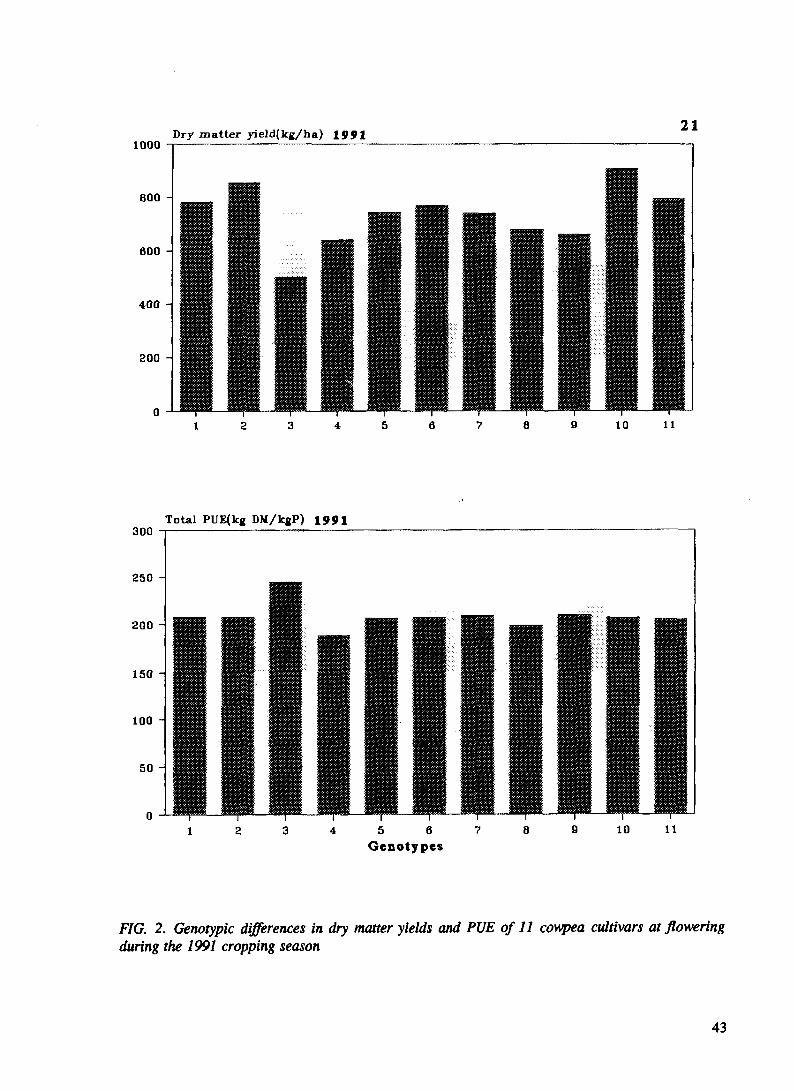
Dry matter yield(kg/ha) 1991 211000
800
600
400
200
0123456789 10 11
Total PUE(kg DM/kgP) 1991
Genotypes
FIG. 2. Genotypic differences in dry matter yields and PUE of 11 cowpea cultivars at flowering during the 1991 cropping season
43

700
CO
s
600 -
600 -
400 -
Lad(O.OS)(location)
I Lsd(O.OS)(cultivar)
tv3
>»22tS
600
NJALA
ITB6D-1010
MAKENI
■ 'Taeo-719
HENDOBU
TEMNEUlocal check)
FIG. 3. Grain and dry matter yields of 3 cowpea cultivars at 3 locations
44

3.2. Experiment 3
3.2.1. Grain and dry matter yieldsThe grain and dry matter yield of the five cowpea cultivars are presented in Tables I and II,
respectively. There was a significant effect of P on grain yield which increased with increasing rates of P application. The response to P was greatest between 0 and 15 kg P/ha. Beyond 15 kg P/ha, increase in yield was not significantly different except for the local cultivar which responded to P application up to 30 kg P/ha. Application of 60 kg P/ha resulted in 2-fold increase in grain yields
TABLE n. EFFECT OF P SUPPLY ON DRY MATTER YIELDS OF 5 COWPEA CULTIVARS AT DIFFERENT STAGES OF GROWTH
P rate(kg\ha)Cultivars 0 15 30 60 MEAN
14DAEIT86D-1010(E)* * 24.00 26.75 28.00 29.50 27.06IT86D-719(E) 10.50 25.25 26.75 29.00 22.88IT81D-832(IE)* 10.00 20.25 22.25 24.75 19.3117878-1462(1)* 9.00 19.25 22.00 24.25 18.63TEMNE(local check/I) 9.50 18.75 22.25 25.00 18.88MEAN 12.60 22.05 24.25 26.50
50% floweringIT86D-1010 380.50 448.50 515.75 545.00 472.44IT86D-719 563.00 720.00 766.50 801.25 712.691T81D-832 342.75 385.50 437.00 515.75 420.25IT87S-1462 299.25 313.50 345.00 391.00 337.19TEMNE(local check) 217.00 230.50 253.75 442.00 285.81MEAN 360.50 419.60 463.60 539.00
MaturityIT86D-1010 775.00 858.50 1000.00 1553.25 1047.19IT86D-719 1067.50 926.25 1426.50 1730.00 1287.56IT81D-832 606.50 748.75 853.50 1095.50 826.06IT87S-1462 510.00 589.50 930.50 1000.50 757.63TEMNE(local check) 421.00 599.00 506.50 510.00 509.13MEAN 675.00 744.40 943.80 1177.85
Lsd (0.05) 14DAE 50% flowering MaturityCultivar 4.17 149.2 224.0P rate 4.36 NS 196.0C x P NS NS NS
* E = Efficien, IE = Intermediate Efficient, 1= Inefficient
of all cultivars when compared with 0 kg P/ha. The efficient cultivars IT86D-1010 and IT86D-719, and the intermediate cultivar IT81D-832 gave the higest yields under low and high P with average yields of 548.2, 533.2 and 458.2 kg/ha, respectively. On the average phosphorus requirement for grain production appears to be around 15 or 30 kg P/ha.
There was a significant effect of P on dry matter (Table II) and an expression of genotypic differences at all stages of growth, except at 50% flowering where the effect of P was not significant. The efficient cultivars gave higher yields at low and high P levels. There was a consistent increase in the yield of all cultivars at all stages of growth as the P level increased. The genotype x phosphorus interaction was not significant.
The large P response in yield confirms that one of the main growth limiting factors in this soil is P deficiency. Similar responses to P application have been observed [9,10,11,12].
45

3.2.2. Toted phosphorus uptake and use efficiencyPhosphorus accumulation by the cultivars followed a similar pattern as dry matter production
(Table III). Significantly higher P accumulation occurred at higher P levels, with IT86D-1010, IT86D-719 and IT81D-832 taking up higher P at all stages of growth. The high P uptake by IT86D- 1010, IT86D-719 and IT81D-832 may result from: a) greater supplies of metabolites to the roots and hence greater nutrient uptake, or b) increased nutrient demand by the shoot, or c) synthesis of more carriers [13,14,15] found that, when not grossly deficient, the rate of P uptake was regulated more by internal factors, i.e. demand, rather than by external factors, i.e. supply.
Phosphorus use efficiency was calculated by the method of Loneragan and Asher [16] and Israel and Rufty [17]. There was a significant effect of P on P use efficiency at all stages of growth except at 50% flowering where the effect of P was not significant (Appendix Table 14). At all stages of growth, P utilization decreased with increasing P application. Higher PUE was generally observed at low P application.
TABLE III. EFFECT OF P SUPPLY ON P YIELDS (KG/HA) OF 5 COWPEA CULTIVARS AT DIFFERENT STAGES OF GROWTH
Cultivars 0
P rate (kg\ha)
15 30 60 MEAN
14 DAEIT86D-1010(E)* 0.12 0.14 0.15 0.17 0.14IT86D-719(E) 0.06 0.13 0.14 0.15 0.12IT81D-832(IE) 0.05 0.10 0.11 0.14 0.10IT87S-1462(I) 0.04 0.10 0.12 0.14 0.10TEMNE(local check/I) 0.05 0.10 0.13 0.15 0.10MEAN 0.06 0.11 0.13 0.15
50% floweringIT86D-1010 0.82 1.08 1.32 1.44 1.16IT86D-719 1.19 1.66 1.89 2.12 1.71IT81D-832 0.76 0.83 1.05 1.43 1.02IT87S-1462 0.70 0.85 1.01 1.16 0.93TEMNE(local check) 0.56 0.56 0.61 1.33 0.76MEAN 0.81 1.00 1.17 1.50
MaturityIT86D-1010 1.24 1.67 1.93 3.33 2.04IT86D-719 1.64 2.00 2.63 3.66 2.48IT81D-832 0.87 1.16 1.56 1.97 1.39IT87S-1462 0.78 1.05 1.36 2.01 1.30TEMNEflocal check) 0.74 0.87 0.97 1.27 0.96MEAN 1.05 1.35 1.69 2.44
Lsd (0.05) 14DAE 50% flowering MaturityCultivar 0.02 0.43 0.40P rate 0.02 NS 0.57Cx P NS NS NS* E = Efficient, IE = Intermediate Efficient, I Inefficient
3.2.3. Grain P uptake and use efficiencyThese parameters are calculated for four cultivars (Appendix Table 15). Grain P yield for
IT86D-1010 and IT86D-719 were again significantly higher at high than at low P. These cultivars gave mean P yields of 1.9 and 2.0 kg P/ha, respectively. For all cultivars, there was higher grain PUE at low P level than at high P level. Similar observations were made for total PUE. IT86D-1010 and IT87S-1462 gave significantly higher grain PUE compared to IT86D-719 and Temne (local Check).
46

3.2.4. Correlation between total and grain P use efficiency and some yield parametersThere was no signficant correlation between total PUE and yield parameters at the different
stages of growth (Appendix Table 16). The correlation coefficients for these parameters range from r = -0.04 to r = -0.53. There was again no significant correlation between grain PUE and yield parameters at physiological maturity. The correlation coefficients range between r = -0.35 to r = -0.60.
3.2.5. Nitrogen uptake, nodulation, and proportion and amount of nitrogen fixedThere were significant differences in nitrogen accumulation between P levels and cultivars
(Table IV). Higher nitrogen accumulation occurred at higher P levels for all genotypes. The efficient cultivars accumulated higher nitrogen than the inefficient ones at-all stages of growth. However, at maturity, nitrogen accumulation under limiting P was significantly different for all the cultivars.
Some plant growth parameters are more sensitive to low P than others [3,17]. Under low soil P conditions plants generally form fewer and smaller nodules [18,19,20]. Nodule number and dry weight were significantly high at the higher P levels (Appendix Table 17). The efficient cultivars produced more and heavier nodules ranging from 22 to 26 nodules/plant and mean nodule dry weight ranging from 31 to 77 mg/plant. Tewari [21] did not observe any significant effect of P application on the number of nodules formed on cowpea, while positive responses in nodule weights to increasing P have been reported for some legumes [6,22].
TABLE IV. EFFECT OF P SUPPLY ON N YIELDS OF 5 COWPEA CULTIVARS AT DIFFERENT STAGES OF GROWTH
P rate (kg\ha)
Cultivars 0 15 30 60 MEAN
14DAEIT86D-1010 (E)* 0.995 1.155 1.255 1.323 1.182IT86D-719(E) 0.417 1.102 1.233 1.455 1.052IT81D-832(IE) 0.375 0.827 0.910 1.060 0.793IT87S-1462(I) 0.417 0.898 1.043 1.152 0.878TEMNE(local check/I) 0.380 0.798 0.968 1.155 0.824MEAN 0.517 0.956 1.080 1.229
50% floweringIT86D-1010 10.92 13.14 15.30 16.44 13.95IT86D-719 15.68 21.66 25.53 27.55 22.60IT81D-832 11.05 12.50 14.06 16.71 13.57IT87S-1462 9.78 10.59 11.80 14.20 11.59TEMNE(local check) 5.26 6.06 7.96 14.21 8.37MEAN 10.54 12.79 14.93 17.82
MaturityIT86D-1010 16.72 23.46 27.88 44.05 28.03IT86D-719 13.19 26.89 36.27 55.95 33.07IT81D-832 13.22 17.09 22.77 25.24 19.58IT87S-1462 13.59 17.49 27.88 33.14 23.02TEMNEflocal check/I) 12.02 14.27 14.34 17.98 14.65MEAN 13.75 19.84 25.83 35.27
Lsd(0.05) 14DAE 50% flowering MaturityCultivar 0.21 5.09 6.51Prate 0.21 NS 8.27C x P NS NS NS* E= Efficient, IE = Intermediate Efficient, 1= Infficient
47

Pereira and Bliss [20] reported that in common bean, the ability to fix nitrogen, and changes in the symbiotic capacity accompanying P application were strongly influenced by the plant cultivar. A similar observation was made in this study. The best cultivars in terms of both proportion and amount of N fixed under all P conditions were the efficient cultivars IT86D-1010 and IT86D-719 with 37-39% of the nitrogen derived from fixation at the early stages of growth and 76-85% of the nitrogen fixed between flowering and physiological maturity (Table V). The inefficient cultivars fixed 24-28% and 66-80% in the early and later stages of growth, respectively. With regards to the amount of nitrogen fixed, the effect of P and genotypic differences exhibited are shown in Table VI. The relative amount of nitrogen fixed by the efficient cultivars was higher than the less efficient cultivars at all stages of growth. They fixed an average of 10-28 kg N/ha between flowering and physiological maturity, whereas the less efficient cultivars fixed an average of 5-18 kg N/ha. The higher total N assimilated by the efficient cultivars was solely due to their higher N2 fixing ability as also shown by Eskew et al. [18].
TABLE V. EFFECT OF P SUPPLY ON PERCENT N DERIVED FROM FIXATION BY 5 COWPEA CULTIVARS AT DIFFERENT STAGES OF GROWTH
Cultivars 0P rate(kg/ha)
15 30 60 MEAN14 DABIT86D—1010(B) * 32.0 40.5 41.0 44.0 39.4IT86D-719(B) 30.8 40.3 40.0 45.0 39.0IT81D-832(IB)* 31.0 39.0 38.5 41.0 37.4IT87S-1462(I)* 20.0 22.5 31.3 38.0 27.9TEMNE(local check/I) 20.0 23.0 25.5 27.3 23.9MEAN 26.8 33.1 35.3 39.150% floweringIT86D-1010 66.0 73.8 81.8 82.5 76.0IT86D-719 67.8 80.0 80.3 85.0 78.3IT81D-832 62.0 73.5 81.8 84.0 75.3IT87S-1462 47.5 71.3 76.8 79.5 68.8TEMNE(local check) 57.0 62.0 67.5 81.0 66.9MEAN 60.1 72.1 77.6 82.4MaturityIT86D-1010IT86D-719 77.8 79.5 82.0 90.0 82.3IT81D-832 78.0 80.8 88.3 92.5 84.9IT87S-1462 69.5 79.5 80.8 89.3 79.8TEMNE(local check) 79.0 78.0 79.5 83.8 80.1MEAN 83.0 68.3 78.0 80.8 70.0
71.5 77.2 81.7 87.3
Led(0.05) 14DAE 50% flowerina MaturityCultivar 6.78 6.14 6.32P rate 6.11 7.35 5.20C x P NS NS NS* E = Efficient, IB = Intermediate Efficient, I = Ineffic
3.2.6. Correlation between total and grain P use efficiency and N2 fixationThere is no significant correlation between P use efficiency and nitrogen fixation at all stages
of growth. The correlation coefficients values range from r = 4). 16ns to r = -0.40ns (Appendix Table 18). There is also no significant correlation between grain P use efficiency and nitrogen fixation (r = -0.48ns).
48

TABLE VI. EFFECT OF P SUPPLY ON NITROGEN FIXED(KG/HA) BY 5 COWPEA CULTIVARS AT DIFFERENT STAGES OF GROWTH
P rate(kg/ha)Cultivars 0 15 30 60 Mean
14DAEIT86D-1010(E)* 0.318 0.470 0.520 0.575 0.471IT86D-719(E) 0.127 0.415 0.492 0.657 0.423IT81D-832(IE) 0.113 0.307 0.347 0.425 0.298IT87S-1462(1) 0.085 0.215 0.350 0.440 0.272TEMNE(local check/I) 0.075 0.190 0.255 0.345 0.216
MEAN 0.144 0.319 0.393 0.488
50% floweringIT86D-1010 7.24 9.83 12.45 13.75 10.82IT86D-719 10.33 17.78 20.60 23.06 17.94IT81D-832 6.80 10.23 11.45 14.06 10.64IT87S-1462 4.86 7.66 8.83 11.45 8.20TEMNE(local check) 2.86 3.79 5.37 11.50 5.88MEAN 6.42 9.86 11.74 14.76
MaturityIT86D-1010 13.02 18.98 25.26 28.81 21.52IT86D-719 10.07 21.56 32.25 51.84 28.93IT81D-832 9.75 13.57 18.20 22.66 16.05IT87S-1462 10.76 13.50 21.64 28.29 18.55TEMNE(local check) 6.31 9.26 11.33 14.53 10.36MEAN 9.98 15.37 21.74 29.23
Lsd (0.05) 14DAE 50% flowering MaturityCultivar 0.10 4.04 5.92Prate 0.08 5.26 7.63C x P NS NS NS
*E = Efficient, IE = Intermediate Efficient, I = Inefficient
3.3. Experiment 4
3.3.1. Dry matter and grain yieldsDry matter and grain yields are shown in Fig. 3. There were significant genotypic and
location differences in these yield parameters. The efficient cultivars IT86D-1010 and IT86D-719 yielded higher than the inefficient local cultivar. The average dry matter yields for IT86D-1010 and IT86D-7I9 and the local cultivar (Ternne) were 343, 378, and 238 kg/ha, respectively. Their corresponding mean grain yields are 331, 376, and 251 kg/ha. The yields obtained in Njala and Hendobu in the south were significantly higher than those obtained in Makeni in the north, with the highest overall yields obtained in Hendobu.
3.3.2. Shoot and grain P yieldsThese yield parameters are shown in Fig. 4. The genotypic differences in P yield are
significant both within and between locations. The efficient cultivars accumulated significantly higher P than the local cultivar in each location. The efficient cultivars also gave higher P yields at Hendobu than at the other sites.
3.3.3. Total and grain phosphorus use efficiencyThere were genotypic differences in total and grain P use efficiencies both within and between
locations, with the efficient cultivars exhibiting higher P use efficiency than the local check (Fig. 4). The mean total P use efficiencies of the cultivars were 615.7, 630.8, and 604.2 kg dry matter/kgP
49

2.6
NJALA MAKENI HENDOBU
TB6D-1010 M ITB6D-719 TEMNEldocal check)
FIG. 4. Shoot and grain P yields of 3 cowpea cultivars at 3 locations
for IT86D-1010, IT86D-719, and Temne, respectively. The corresponding grain P use efficiencies of these cultivars were 292.9, 267.8, and 252.3 kg grain/kgP. The better performance of these elite cultivars at Njala and Hendobu in the south than at Makeni in the north is attributed to the higher rainfall and temperature and relatively higher available P in Njala and Hendobu than in Makeni (Appendix Table 12). These cultivars have been distributed to farmers through the extension services for large scale production in these areas.
3.4. Experiment 5
3.4.1. Shoot and Root dry weights, and Root-shoot (R/S) ratioThe results of these parameters are presented in Appendix Table 19. Significant genotypic
differences were observed for all of these parameters measured. The efficient and intermediate efficient cultivars exhibited higher shoot and root dry weights than the inefficient one.
50

There was a significant effect of P on all the parameters except shoot dry weight under limiting and non-limiting P. The efficient and intermediate efficient cultivars performed better in terms of shoot and root dry weights than the inefficient cultivar. The root-shoot ratio was significantly higher for the inefficient cultivar than the efficient and the intermediate efficient cultivar. At both limiting and non-limiting P supplies, the shoot dry weight was reduced for the inefficient cultivar. However, the root dry weight was relatively higher. This could have led to a much higher root-shoot ratio at both P levels. Root:Shoot ratio as an important factor of uptake efficiency, not only varies among species but also depends on soil phosphate content. Usually at low phosphate application the proportion of root produced increases. This phenomenon has been observed for many species [20,23,24,25,26]. This is an adaptation mechanism of plants to improve their uptake efficiency when P is a limiting factor for growth.
3.4.2. Root length, Root fineness and VA mycorrhizal infectionIn order to identify some of the factors responsible for P use efficiency, root length, root
fineness and VA mycorrhizal infection were evaluated at the two P levels for the three contrasting cultivars (Appendix Table 20). There was a significant effect of P on the these parameters. For the efficient cultivars, root length, root fineness and mycorrhizal infection were higher under low and high P than the inefficient cultivar. Under limiting soil P conditions IT86D-1010 and IT81D-832 developed better root systems and higher percentage VA mycorrhizal infection which enabled them to absorb P more efficiently than the other cultivar. Nye and Tinker [27] and Kwasawa and Copeland [1] asserted that in soils, P uptake and fertilizer P requirements by plants are dependent on root growth and mycorrhizal infection. Diversity in root traits among cultivars and their influence on P uptake have been observed in other crops [28].
4. CONCLUSIONS
Large genotypic differences were found in almost all the major parameters (grain and dry matter yields, phosphorus uptake and use efficiency, nitrogen accumulation, nodulation and nitrogen fixation). The cultivars also differed in their P requirement for growth. The efficient cultivars were the best in almost all parameters examined. IT86D-1010 and IT86D-719 with high N2-fixation under low P should be ideal for soils deficient in the two major elements, N and P. However, these cultivars also removed the largest amount of P from the soil; it will be interesting to examine what effect this will have on subsequent growth of other crops grown in rotation. There was no significant correlation between yield and nitrogen fixation parameters and phosphorus use efficiency.
Root morphological characteristics such as root length, root fineness, as well as mycorrhizal infection are most important in determining the efficiency of uptake of slowly mobile nutrients like P in soil. Under limiting soil P conditions, IT86D-1010 and IT86D-832 developed better root systems and higher mycorrhizal infection which enabled them to absorb P more efficiently than the other cultivar. Therefore, the capacity of these cultivars to use P efficiently could be attributed to their rooting characteristics as well as mycorrhizal infection.
Multilocational testing has shown that the cultivars selected cannot do well in areas with low rainfall in Sierra Leone.
ACKNOWLEDGEMENTS
This research was carried under the F AO/IAEA/SID A Co-ordinated Research Programme (Research Contract No. 5576) on the Use of Isotope Studies on Increasing and Stabilizing Plant Productivity in Low Phosphate and Semi-arid and Sub-humid Soils of the Tropics and Sub-tropics. Funds and equipment provided by the donors are gratefully acknowledged. The input of Messrs Rashid Sesay, Donald Kuve and David Suald who worked on various aspects of the research objectives to fulfil thesis requirements for their degrees is recognized. Many thanks are due Ms. Helga Axmann and her group at the IAEA Agriculture and Biotechnology Laboratory at Seibersdorf, Austria for analyzing the samples for 13N.
51

REFERENCES
[1] Food and Agricultural Organization of the United Nations (FAO), Bush fallow in Sierra Leone, FAO, Rome, Italy(1980).
[2] Food and Agricultural Organization of the United Nations (FAO), Fertilizers and food production, FAO, Rome, Italy (1989).
[3] FOHSE, D., CLAASEN, N., JUNGK, A., Phosphorus efficiency of plants, Plant and Soil 110 (1988) 101-109.[4] THIND, S.S., R1SHI, A.K., GOSWARRIC, M.N., Utilization of applied phosphorus by green gram (Vigna
radiata L Wekzek), Bengel gram (Cicer ariefinum L) and Cowpea (Vigna unguiculata L Walp) in soils of Delhi, J. of Nuclr. Agric. Biol. 19 (1990)152-156.
[5] TENNANT, D. A., Test of a modified line intercept method of estimating root length, J. Ecol. 63 (1975) 995-1001.
[6] JAKOBSEN, I., The role of Phosphorus in nitrogen fixation by young pea plants (Pisum sativum), Physiol. Plant 64(1985) 190-196.
[7] FRIED, M., MIDDELBOE, V., Measurement of amount of N2-fixed by a legume crop, Plant and Soil 47(1977) 713-715.
[8] FREED, R.D., Statical packages for agronomic experiments, Michigan State University, USA(1992).[9] CADISCH, G , Sylvester-Bradley and Nosberger J.Variation in growth and N2 fixation within and among
Centrosema spp in response to phosphorus supply, Tropical Grasslands 26 (1992) 226-234[10] GUNAWARDENA, S.F.B.N., DAN SO, S.K.A., ZAPATA, F , Phosphorus requirements and nitrogen
accumulation by three mungbean Vigna radiata L Welzek) cultivars, Plant and Soil 147 (1992) 267-274.[11] SANGINGA, N., BOWEN, G.D., DANSO, S.K.A., Intraspecific variation in growth and P accumulation of
Leucaena leucocephala and Gliricidia septum as influenced by soil phoshpate status, Plant and soil 133 (1991) 201-208.
[12] SINGH, K.A., Influence of P on dry matter accumulation, nodulation and plant composition in Gfycine javanic, Ind. J. Agric. Sci. 55 (9) (1985) 586-590.
[13] CHAPIN, E.S., The mineral nutrition of wild plants, Annu. Rev. Ecol. Syst. 11(1980), 233-260.[14] WHITE, R.E., Studies on mineral ion absorption by plants. I. The absorption and utilization of phosphate by
Stylosantkes humilis, Phaseolus atropurpureus and Desmodium intortUm, Plant and Soil 36 (1972) 427-447.[15] WILLIAMS, R P , The effect of phosphorus supply on the rates of intake of phosphorus and nitrogen and upon
certain aspects of phoshorus metabolism in graminaceous plants, Aust. J. Sci. Res. 131 (1948) 333-361.[16] ISRAEL, D.W., Investigation of the role of phosphorus in symbiotic dinitrogen fixation, Plant Phylsiol. 84
(1987) 867-840.[17] ISRAEL, D.W., RUFTY, Jr. W., Influence of phosphorus nutrition on phosphorus and nitrogen utilization
efficiencies and associated physiological responses in soybean, Crop Sci. 28 (1988) 954-960.[18] ESKEW, D L , KAPUYA, J., DAN SO, S.K.A., Nitrate inhibition of nodulation and nitrogen fixation by super-
nodulating nitrate-tolerant symbiosis mutants of soybean, Crop Sci. 29 (1989) 1491-1496.[19] OLAFINTOYE, J.A., Cowpea (Vigna unguiculata (L) Walp) response to different levels of Phosphorus and
nitrogen in the Guinea Savana of Nigeria, Phil. Agric. 69(1986) 411-418.[20] PEREIRA, P A A., BLISS, F A , Nitrogen fixation and plant growth of common bean (Phaseolus Vulgaris L)
at different levels of phosphorus availability, Plant and Soil 104 (1987) 79-84[21] TEWARI, G.P., Effects of nitrogen, phosphorus and potassium on nodulation in cowpea, Expt. Agric. 1 (1965)
257-259.[22] OGATA, S., ADU-GYAMFI, J., FUJITA, K., Effect of Phosphorus and pH on dry matter production,
dinitrogen fixation and critical Phosphorus concentration in Pigeon-pen (Cajanus cajan(L)) Millsp, Soil Science plant Nutr. 34 (1988) 55-64.
[23] ANGHINONI, I , BARBER, S.A., Phosphorus application rate and distribution in the soil and phosphorus uptake by com, Soil Sci. Amer. J. 44 (1980) 1041-1044.
[24] ATKINSON, D , Some general effects of phosphorus deficiency on growth and development, New Phytol. 72 (1973) 101-111.
[25] BOHM, W., Methods of studying root systems. Spring-Verlag, Berlin (1979).[26] HAYES, R.J., LUDECKE, T.E., Yield, root morphology and chemical composition of two pasture legumes as
affected by lime and phosphorus application to an acid soil, Plant and Soil 62 (1981) 241-254.[27] NYE, PH, TINKER, P.B., Solute movement in the soil-root system, Blackwell Scientific Publishers, Oxford
(1977).[28] SCHENCK, M.K., BARBER, S.A., Phosphate uptake by com as affected by soil characteristics and root
morphology, Soil Sci. Soc. Am. J. 43 (1979) 880-883.
52

PHOSPHORUS USE EFFICIENCY OF THE GUM ARABIC TREE (Acacia Senegal (L) Willd) IN SUDAN
K.H. ELAMIN, A.F. MUSTAFA Forestry Research Section,Gezira Agricultural Research Centre, Wad Medani, Sudan
XA9642760
Abstract
PHOSPHORUS USE EFFICIENCY OF THE GUM ARABIC TREE (Acacia Senegal (L) Willd) IN SUDAN.This study was conducted to identify gum arable tree (Acacia Senegal L. Willd) provenances with high efficiency
for phosphorus uptake and use. Thirteen provenances were collected from different habitats within the gum belt of the Sudan. A preliminary trial was conducted during the period 1989-1992 at the Gezira Agricultural Research Station in Wad Medani. This study revealed that there are clear genotypic differences in phosphorus use efficiency, nitrogen yield and dry matter production. All the provenances tested also exhibited a high ability for survival under the dry climatic conditions as prevailing in the gum belt of Sudan. Based on differences in phosphorus use efficiency observed in the preliminary study, 4 provenances were selected for a detailed study. Provenance 11 and 2 represented the highly efficient group, provenance 7 the moderately efficient group and provenance 13 the low efficient group. The detailed study revealed that provenance 11 is superior to all others in terms of biomass production as well as in phosphorus use efficiency. Although the ability to take up phosphorus was low, this was compensated by having a high root length density enabling the tree to take up a quantity of phosphorus similar to that taken up by other provenances. The high ability to convert the absorbed phosphorus into a greater quantity of dry matter made this provenance the best in phosphorus use efficiency. These results suggest that provenance 11 may be a suitable candidate to be introduced into the gum belt of Sudan in support of its rehabilitation programme. 1
1. INTRODUCTION
Sudan extends between latitudes 4° and 22° N, and 22° and 38° E, covering an area of about 2.56 million square kilometres. This wide extension is characterized by variable ecological zones ranging from tropics in the south through deciduous savannah woodlands in the centre to the sub- desert and desert in the north. The gum arabic tree (Acacia Senegal L. Willd) (locally known as hashab tree) occurs on clay and sandy soils [1] in a natural belt extending between latitudes 10° and 14° N (Fig. 1). Within this zone rainfall varies between 250 and 800 mm distributed in three months leaving nine dry months in a year where maximum temperature can reach 45°c in the summer. The terrain is flat and soils are dark and appears to be of alluvial origin. They are alkaline (pH 9) and have a high clay content (60%). On drying, the soil shrinks and a wide network of cracks are formed [2], The sandy soils are coarse textured with 90% sand. The top soil is characterized by lack of finer fractions, little or no minerals and or organic matter. The soils are generally poor in both macro (especially phosphorus) and micro nutrients [3].
At present a rehabilitation programme on restocking of the sum belt for desertification control is in progress in Sudan funded by UNDP. The objectives of the present FAO/IAEA project are very much complementary to those of the UNDP funded project in that both if effectively implemented will contribute to successful rehabilitation of the gum belt. A. senega! is 5 to 7 m in hieght. It is the main gum producing tree species, accounting for 90% of the world gum arabic production [1], A. Senegal is therefore economically important to Sudan and the world at large. Annually, Sudan exports about 85% of the world’s gum arabic consumption. This contributes 11% to the national income.
53

In addition, it plays an important role in combating erosion and desertification, hence contributing to preservation of the ecosystem and the environment. The traditional land use system for A. Senegal is basically a kind of shifting cultivation commonly known as the-gum cultivation cycle. This cycle could rage from 15 to 20 years and consists of: (1) clearance of the thorn savannah, (2) cultivation of agricultural crops for 4 to 6 years, (3) a bush-fallow period in which A. Senegal is the most vigorous tree colinizer, (4) tree taping commencing when trees are 4 to 5 years old with maximum yield when the trees are around 9 years old, and (5) bush clearing at 12 to 15 years [1]. According to the 1989 Annual Report of the Gum Arabic Company of Sudan [1] three concomitant problems has recently disturbed the traditional land use system for gum arabic production drastically reducing its yield from 29,000 to 11,000 tons per year. First, the bush-fallow cycle was reduced to one or two years due to population increase and as a result the increased demand for agricultural produce and fuel wood. The 3% upward demographic trend in the Sudan is one of the highest in the world. Estimates based on a World Bank Report [4] has shown that the national fuelwood consumption has crossed the sustainable yield threshold somewhere around 1965. Secondly, overgrazing has led to elimination of seedlings thus reducing the possibilities for natural regeneration of A. Senegal. Goat browsing is considered as the main cause of the disappearance of A. Senegal from many sites in its natural habitat. The third problem arose from successive years (1960-1974) of rainfall decline in the savannah and semi-arid zones which culminated in the recent Sahelian drought.
The steady deterioration of the gum arabic belt coupled with the expansion of the desert into the southern semi desert and savannah belt called for an emergency restoration plan to stop the advancing desert and to revive the trees in the deteriorated gum belt. The objective of this study was to identify provenances of A. Senegal which are high in efficiency of uptake and use of phosphorus, and capable of growing and yielding well under the environmental and soil conditions as prevailing in the gum belt of Sudan. The findings of this project will be invaluable to the UNDP funded gum belt rehabilitation programme undertaken by the National Forestry Corporation of Sudan.
2. MATERIAL AND METHODS
2.1. Preliminary screeningThirteen A. Senegal provinances (Appendix Table XXIII) were collected from different
locations in Sudan. These were used in the preliminary screening for phosphorus use efficiency. During the collection campaign, records were made of the differences in the habitat and the location. The experiment was conducted at the Gezira Agricultural Research Station farm at Wad Medani just above the northern part of the gum belt. The soil in this region is a dark clay type. Climate is dry and hot most of the year and the maximum temperature sometimes approaches 40-42°c during summer months. No rainfall was recorded during the year of the experiment. A minimum irrigation was however provided when necessary. The soil contains 7 ppm available P which is equivalent to 22.1 kg P/ha. The treatments consisted of 2 phosphorus levels. P„ where no P was applied and P, which received an application of phosphorus at the rate of 21.5 kg/ha in the form of triple super phosphate. Phosphorus fertilizaer was incorporated into the soil as granules. The experiment consisted of a randomized block design with 4 replicates. Each sub-plot was 4 x 4 m and consisted of 9 trees in the harvest area with a plant spacing and row spacing of 1 m. The sub-plots also had a spacing of 2 m inbetween. Tree seedlings were raised in the nursery in polythene bags. About 5 weeks after germination, the seedlings were graded to achieve uniformity in size and growth. Ten week old plants were then transplanted in the field in August 1990. Shoot hieght was measured 5 and 9 months
54

after transplanting. The trees were harvested 12 months after transplanting and the dry matter yield of shoots was determined which included branches and leaves. Total nitrogen in the shoot was determined by the Kjeldahl method [6] and phosphorus by the method described Olsen and Watanabe [7].
2.2. Detailed studyBased on the results of the preliminary screening, 4 provenances were selected for a detailed
study in order to investigate the morphological and/or physiological reasons for the differences among provenances for phosphorus use efficiency. Provenances 11 and 2 represented the group highly efficient in phosphorus use, provenance 7 the moderatly efficient group and provenance 13 the low efficient group. The site selected for this experiment was at Elobeid (latitude 13° N and longitude 30° E ) where the soil is an undulating sand dune of low phosphorus availability (< 4ppm). The annual rainfall in this region ranges from 250-280 mm. The treatments consisted of two phosphorus levels, P„ where no P fertilizer was added and P, where an amount of 21 Kg/ha phosphorus fertilizer as triple super phosphate was applied. The experiment consisted of a split plot design with 3 replicates. Blocks were laid parallel to each other and divided into 2 main plots for treatments. The main plots were further divided into 4 sub-plots (4 x 4m) for the 4 provenances. Twenty five 10 week old seedlings were transplanted in each sub plot. Trees were destructively sampled 4 months after transplanting. The samples were oven dried at 80° C for 24 hours and the shoot, root and total dry matter yields were determined, phosphorus accumulated in the different plant parts was determined by Olsen methd [7]. Phosphorus use efficiency was calculated as gm dry matter produced per gm phosphorus in dry matter. Root length density was determined by the intercept method as described by Newman [9]
3. RESULTS AND DISCUSSION
3.1. Preliminary studiesThe ability of A. Senegal provenances to survive under field conditions was tested at 2 and
4 month intervals. Of the 13 provenances examined there was almost 100% success in the survival rate in both treatments, with and without added phosphorus. He success of early establishment under field conditions is an important factor that would determine the subsequent growth of trees. The data suggest that all the A. Senegal provenances tested are generally well adapted to growing under conditions as prevailing in the gum belt of Sudan; Shoot height was measured at 5 and 9 months after transplanting in the field. It appears that there are significant differences among provenances in growth (Figs. 1 and 2). These differences were observed at both growth stages suggesting that the differences are more due to differences in their genetic make up than to soil and other environmental factors. Based on the shoot height, the trees can be ranked (Tukey’s method) into three categories, viz., (1) short (2) medium , and (3) tall. The provenances collected from clay soils generally fell into the first category while those from sandy areas (particularly provenances 12 and 13) were tall and exhibited a high growth capacity. Air-dried biomass of wood of one year old A. Senegal trees are shown in Table I and Fig. 2. The results show that there is more than two-fold genotypic variation in dry matter production among the provenances tested. It would be interesting to see if these differences plant productivity are maintained as trees become mature when they capable of producing gum. A tree with a larger shoot biomass will also be in a position to produce more gum because of higher photosynthetic capacity and a greater network of gum containing laticifers in the trunk. The
55

60
100
80
§I
60
8 40w
20
03 1 5 4 2 7 9 8 12 13 11 6 10
Provenances
FIG. 1. Shoot height of Acacia Senegal provenances at 5 months (A), and 9 months (B) in the presence (P-1) and absence (P-O) of applied phosphorus.
56

500
400
3•g 300o
©
s100
012 6 11 3
I P-0 M P-1
9 1 13 10 5 7 8 2 4Provenances
FIG. 2. Dry matter yield of 1 year old Acacia senegalprovenances in the presence (P-1) and absence (P-0) of applied phosphorus.
TABLE 1. EFFECT OF P TREATMENT ON DRY MATTER YIELD OF ACACIA SENEGAL PROVENANCES 1 YEAR AFTER TRANSPLANTING
ProvenancesTreatments
Po P, Average
1 315.8 288.6 301.8
2 426.8 367.6 397.2
3 292.5 330.4 311.4
4 457.2 443.1 450.2
5 387.2 437.4 412.3
6 387.4 437.5 412.3
7 403.2 392.4 397.8
8 425.4 379.1 402.2
9 303.4 261.2 282.3
10 330.4 289.6 310.0
11 246.0 207.3 226.6
12 204.6 364.8 284.7
13 326.2 320.5 323.4
Mean 335.7 333.8
P„ = 0 kg P/ha; Pt = 21.5 kg P/ha
57

dry matter yield did not appear to be closely ralated to the shoot hight. On the contrary, the provenances with high biomass (2,3,4,5,7 and 8) yield were those that originated from the clay soil sites where the shoot height was short. However, provenance 13 which was superior in shoot height was also superior in biomass production. This provenance may be considered for introduction into the gum belt of Sudan in support of its rehabilitation programme.
There were almost two-fold differences in phosphorus uptake among the provenances. There were also differences in phosphorus use efficiency among provenances (Fig. 3) but these were not big indicating that all provenances in general had a high ability to convert a given amount of phosphorus into biomass. The occurence of large differences in the rate of absorption of phosphorus from solution by different genotypes of Pinus radiata has been shown by Bowen [9]. However, such observations in trees grown under field conditions are limited. Moreover, there were no apparent benefits of applying phosphorus to A. Senegal trees, at least during the early stages of there establishment. In this study the amount of phosphorus applied was low (21.5 kg P/ha) which might explain the lack of a positive response. The fact that trees often respond to the application of phosphorus has been discussed by Bowen [9].
1000
Provenances
FIG. 3. Genotypic differences in phosphorus use efficiency (FUE) of Acacia Senegal provenances.
Nitrogen yield of the different A. Senegal provenances are shown in Fig. 4. Again there were more than two-fold differences in nitrogen yield among provenances and this may be related to the differences in nitrogen fixing ability of the these tree species. In this study however, the plants were not inoculated with Rhizobium so any differences in the nitrogen yield indicates the differences in the ability of different tree provenances to form effective symbiotic associations with the native Rhizobium strains in the soil. The provenances with high nitrogen yields also had high dry matter yields which suggests that the differences in nitrogen yield are more a result of differences in dry matter production than due to possible differences in the capacity for nitrogen fixation. This aspect warrants further studies in future research programmes as the genotypes with a higher capacity for nitrogen fixation may have an advantage over others in growing in harsh environments as prevailing in the gum belt of Sudan.
58

10
11 6 9 12 1 13 10 3 2 7 8 5 4Tree provenances
FIG. 4. Genotypic differences in nitrogen yield of Acacia Senegal provenances.Viv©
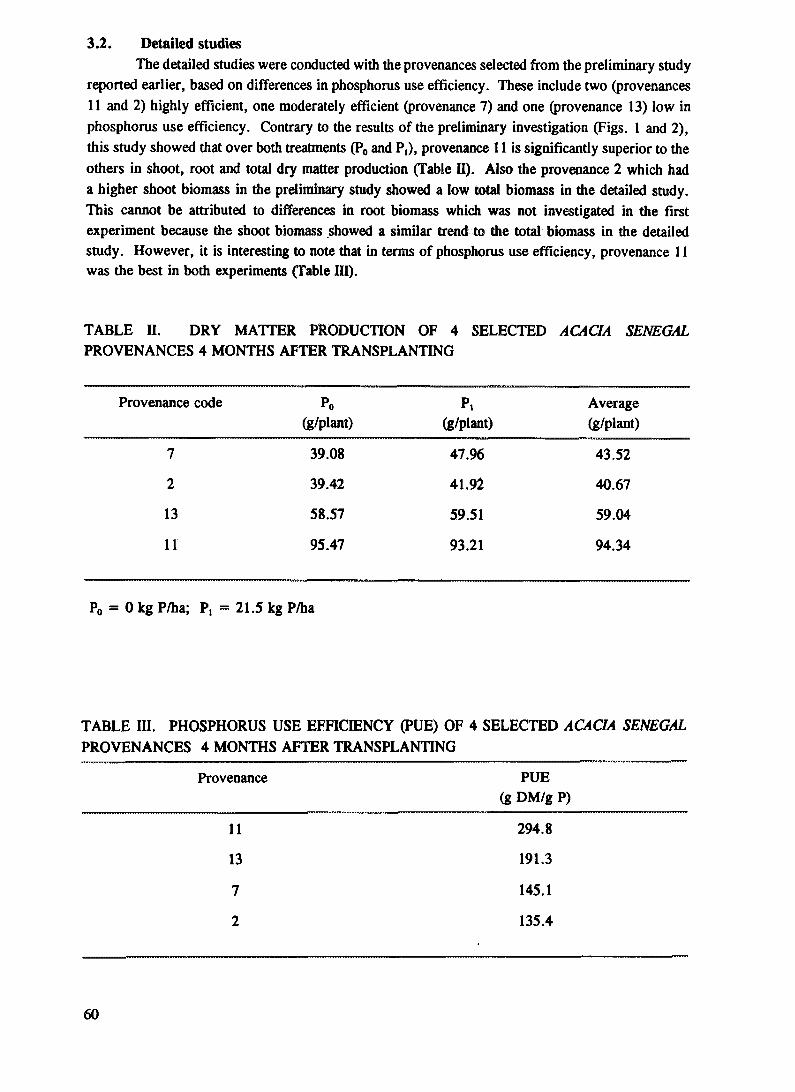
3.2. Detailed studiesThe detailed studies were conducted with the provenances selected from the preliminary study
reported earlier, based on differences in phosphorus use efficiency. These include two (provenances 11 and 2) highly efficient, one moderately efficient (provenance 7) and one (provenance 13) low in phosphorus use efficiency. Contrary to the results of the preliminary investigation (Figs. 1 and 2), this study showed that over both treatments (P0 and P,), provenance 11 is significantly superior to the others in shoot, root and total dry matter production (Table II). Also the provenance 2 which had a higher shoot biomass in the preliminary study showed a low total biomass in the detailed study. This cannot be attributed to differences in root biomass which was not investigated in the first experiment because the shoot biomass showed a similar trend to the total biomass in the detailed study. However, it is interesting to note that in terms of phosphorus use efficiency, provenance 11 was the best in both experiments (Table III).
TABLE II. DRY MATTER PRODUCTION OF 4 SELECTED ACACIA SENEGAL PROVENANCES 4 MONTHS AFTER TRANSPLANTING
Provenance code Po(g/plant)
P,(g/plant)
Average(g/plant)
7 39.08 47.96 43.52
2 39.42 41.92 40.67
13 58.57 59.51 59.04
11 95.47 93.21 94.34
P0 = 0 kg P/ha; P, = 21.5 kg P/ha
TABLE III. PHOSPHORUS USE EFFICIENCY (PUE) OF 4 SELECTED ACACIA SENEGAL PROVENANCES 4 MONTHS AFTER TRANSPLANTING
Provenance PUE(g DM/g P)
11 294.8
13 191.3
7 145.1
2 135.4
60
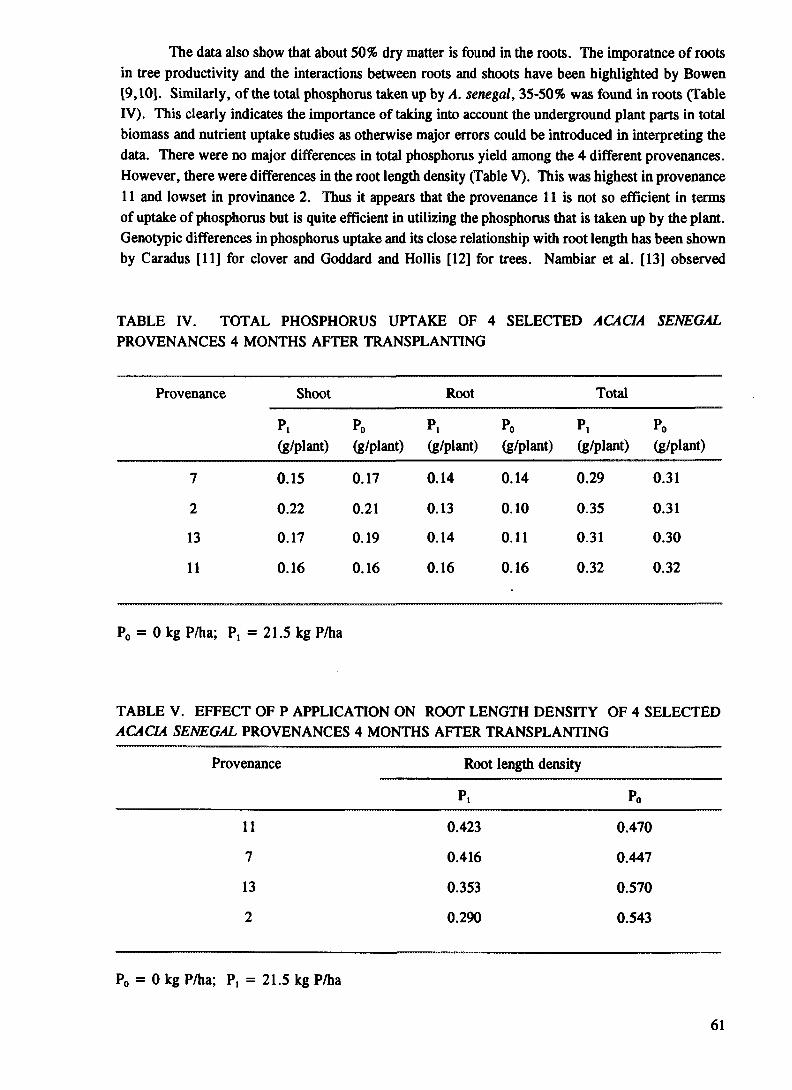
The data also show that about 50% dry matter is found in the roots. The imporatnce of roots in tree productivity and the interactions between roots and shoots have been highlighted by Bowen [9,10]. Similarly, of the total phosphorus taken up by A. Senegal, 35-50% was found in roots (Table IV). This clearly indicates the importance of taking into account the underground plant parts in total biomass and nutrient uptake studies as otherwise major errors could be introduced in interpreting the data. There were no major differences in total phosphorus yield among the 4 different provenances. However, there were differences in the root length density (Table V). This was highest in provenance 11 and lowset in provinance 2. Thus it appears that the provenance 11 is not so efficient in terms of uptake of phosphorus but is quite efficient in utilizing the phosphorus that is taken up by the plant. Genotypic differences in phosphorus uptake and its close relationship with root length has been shown by Caradus [11] for clover and Goddard and Hollis [12] for trees. Nambiar et al. [13] observed
TABLE IV. TOTAL PHOSPHORUS UPTAKE OF 4 SELECTED ACACIA SENEGAL PROVENANCES 4 MONTHS AFTER TRANSPLANTING
Provenance Shoot Root Total
P,(g/plant)
Po(g/plant)
P,(g/plant)
Po(g/plant)
P,(g/plant)
Po(g/plant)
7 0.15 0.17 0.14 0.14 0.29 0.31
2 0.22 0.21 0.13 0.10 0.35 0.31
13 0.17 0.19 0.14 0.11 0.31 0.30
11 0.16 0.16 0.16 0.16 0.32 0.32
P0 = 0 kg P/ha; P, = 21.5 kg P/ha
TABLE V. EFFECT OF P APPLICATION ON ROOT LENGTH DENSITY OF 4 SELECTED ACACIA SENEGAL PROVENANCES 4 MONTHS AFTER TRANSPLANTING
Provenance Root length density
P, Po
11 0.423 0.470
7 0.416 0.447
13 0.353 0.570
2 0.290 0.543
P0 = 0 kg P/ha; P, = 21.5 kg P/ha
61

100% differences in Finns radiata provenances in their length per unit weight of regenerating lateral roots and concluded that selection for thinner roots might be advantageous for enhanced nutrient uptake. The low ability to take up phosphorus in this provenance 11 appears to be compensated by its ability to increase its root length density thus allowing the root system to explore a greater mass of the soil for phosphorus. Although provinance 11 may have difficulties in taking up phosphorus, once taken in this provenance has the highest ability to convert phosphorus into dry matter and this may be related to differences in the physiology of phosphorus metabolism in this provenance. This feature may make provenance 11 an ideal candidate for direct introduction into the rehabilitaion programme of the gum belt in Sudan. Further, the provinance will be invaluable for future studies, particularly for grafting into root stocks with a high ability for phosphorus uptake, or for future breeding programmes of A. Senegal aimed at developing provenances capable of growing in soils low in phosphorus resources. Provenance 11 could also provide useful material for modem molecular biology studies involved in identifying genes responsible for high phosphorus use efficiency in trees.
REFERENCES
[1] ANNUAL REPORT, Gum Arabic Company, (1989) Khartoum, Sudan.[2] EL HOURI, A.A., Some aspects of dry land afforestation in the Sudan with special refemce to Acacia tortiUs,
Acacia Senegal and Prosopis chilensis, Forest Ecol. and Managment 16 ( 1986 ) 209-221.[3] LUUKKANEN, O., SAARAINEN, T., ( 1985 ) Hydorology of soil and initial developement of Acacia Senegal
plantations at Tendalti area in The Sudan, Thechnical report No. 9, (1985) Sudan Finland cosuiting programme in forestry, Khartoum Sudan.
[4] NEWMAN, E.I., A method of estimating the total length of root in a sample, J. App. Ecol. 3 (1966) 139-145.[5] WORLD BANK REPORT, Forestry sector review, National Forest Corporation, (1985) Sudan.
[6] AOAC, Official methods of analysis, 13th Edition, AO AC, Arlington (1980) 7.025-7.031.[7] WAT AN ABE, F.S., OLSEN, SR, Tests of an ascorbic acid method for determining phosphorus in water and
NaHCO, extracts from soils, Soil Sci. Soc. Am. Proc. 29, 677-678.[8] OLSEN, SR, COLE, C.V., WATANABE, F.S., DEAN, L.A., Estimation of available phosphorus in soils by
extraction with sodium bicarbonate, United States Department of Agriculture, Circular No. 939 (1954) 19.[9] BOWEN, G.D., Tree roots and the use of soil nutrients, Nutrition of plantation forests (Bowen, G.D. Nambiar,
E.K.S. Eds) Academic Press, London (1984) 147-179.[10] BOWEN, G.D , Roots as a component of tree productivity, (Cannell, M.G.R., ..Eds ), Institute of Terrestrial
Ecology (1985) Great Britain, 303-315.[11] Caradus, J.R., Genetic differences in phosphorus absorption among white clover populations, Plant and Soil, 72
(1979) 379-383.[12] Goddard, R.E., Hollis, C.A., The genetic basis of forest tree nutrition, Nutrition of plantation forests, (Bowen,
G.D , Nambiar, E.K.S., Eds.) Academic Press, London (1984) 237-258.[13] Nambiar, E.K.S., Cotterill, P.P., Bowen, G.D , Genetic differences in the root regeneration of radiata pine, J.
Exp. Bot., 33 (1982) 170-177.
62

Xrfit'rtK >
GENOTYPIC DIFFERENCES IN PHOSPHORUS USE EFFICIENCY AND YIELD OF WETLAND RICE OF SOUTHERN VIET NAM
BUI THI HONG THANH, LE DAC LIEU, LUONG THU TRA, MAI THANH SON Center of Nuclear Techniques
NGUYEN DANG NGHIA, DO TRUNG BINH Agricultural Science Institute XA9642761
Ho Chi Minh City, Viet Nam
Abstract
GENOTYPIC DIFFERENCES IN PHOSPHORUS USE EFFICIENCY AND YIELD OF WETLAND RICE OF SOUTHERN VIET NAM.
This study was conducted during 1992 to 1994 with the objective of assessing genotypic differences in phosphorus use efficiency of wetland rice (Oriza saliva L.) and to select genotypes which grow well on soils low in available P or requiring only small amounts of added phosphorus fertilizer. In the first experiment, 24 genotypes of rice were screened under field conditions at low P (0 P added) and high P (90 kg P205/ha) on a gray soil of South Viet Nam. Significant genotypic differences were found in straw and grain yield, total P uptake, plant height and phosphorus use efficiency. Grain yield was highly correlated with phosphorus use efficiency. The effect of P supply was generally small. On average P supply decreased straw yield and increased grain yield . In the second experiment, four genotypes selected from the first experiment were grown under greenhouse conditions for four weeks supplied with 0, 30 and 90 ppm P. Dry weight of shoots did not respond to P fertilization, but dry weight of roots increased with increasing P supply. The two efficient genotypes, G6 and G22, showed a higher root/shoot ratio than the two inefficient genotypes, Gil and G19. This indicates a higher potential for P acquisition of G6 and G22. In the third experiment, the same contrasting genotypes, and G18 with intermediate efficiency, were grown under field conditions at 0, 30, 60, 90 and 120 kg PjOj/ha. Of the two inefficient genotypes, Gil gave the highest grain yield at 60 and G19 at 90 kg P205/ha; G18 gave a clear response up to 60 kg P20s /ha. Based on the information obtained in this study we conclude that G6 and G22 are efficient and well adapted rice genotypes to gray soils of South Viet Nam, low in available P. At low P supply G6 may be slightly better than G22. Further, the ,5N tracer study showed that for G6, a small P supply (30 kg P20j/ha) can increase the % N recovery from urea applied at 120 kg N/ha. 1
1. INTRODUCTION
Differences in nutrient acquisition and use of rice genotypes are well known [1,2,3,4], Two major factors contributing to this under field conditions are rooting pattern in the soil and transfer of nutrients to grain [5,6]. As determined by the plants physiology, their interaction with P deficiency results in limiting yields. This problem is common with soils low in available P.
On many fields in South Viet Nam, especially those of small holder farmers, not only P but N is also deficient. Corrective P and N fertilization to increase rice yields is often not possible, for economical reasons. Water erosion also results in substantial P losses. Modem molecular biology techniques and integrated fertilizer management practices would be of great value to improve the yield potential of cultivars efficient in phosphorus use.
The objective of this study was to screen rice genotypes for phosphorus use efficiency and high grain yield. Phosphorus use efficiency is here denoted as grain yield per unit of P taken up by the plant. The study comprise of one large field experiment with 24 rice genotypes, two experiments with 4 and 5 genotypes of contrasting yield and phosphorus use efficiency characteristics as selected from the first experiment and a third experiment to investigate the response to N fertilizer application using BN as a tracer.
63

2. MATERIALS AND METHODS
The experiments were conducted on gray soil representative for the Cuchi district, Ho Chi Minh City. As shown in Appendix Table XXVI, the soil is a loamy sand low in nutrients especially phosphorus. The soil contained only 10 ppm (Bray II) soluble P. Differences in nutrient levels between the 0-20 and 20-50 cm soil layers were small. The total carbon content corresponds to 2.8 and 2.2 percent organic matter. This is common for flooded rice fields in this region.
2.1. Experiment 1This field experiment was conducted under wetland conditions using a sub-plot size of 2 x 1
m for each genotype. The 24 genotypes (Appendix Table XXVII) were randomly distributed within the eight main plots, four unfertilized and four fertilized with superphosphate at 90 kg P205/ha. All plots received 60 kg K/ha potassium as KC1 at transplanting and 120 kg N as urea, split in three equal doses at transplanting, tillering and 7 days before panicle initiation.
The 24 rice genotypes were first sown in a nursery and grown for 20 days. Uniform seedling were then transplanted to the sub-plots, spaced 15 cm between hills and 20 cm between rows. At maturity straw and grain were harvested.
2.2. Experiment 2This pot experiment was conducted with four genotypes, two efficient (G6 and G22), and two
inefficient (Gil and G19), as selected from the field experiment. Surface soil (0-10 cm) was collected and homogenized. Air dried soil (1 kg) was mixed with fertilizer and placed in plastic pots. Each genotype and P rate were replicated four times. The P rates were 0, 30 and 90 ppm P. All pots received 60 ppm K as KCL and 80 ppm N as urea. Three uniform seedlings were transplanted per pot and grown in a glass house under submerged water conditions at 12,000 lux 12 hours per day. Mean day and night temperatures were kept at 32°C and 28°C respectively. Plants were harvested 4 weeks after planting. Roots were removed from the pots using a water jet. They were then washed, first with tap water and finally with distilled water.
2.3. Experiment 3This is a field experiment w as in the pot experiment together with a genotype classified
intermediate (G18) in phosphorus use efficiency. The sub-plot size was 3 x 2 m. The experiment consisted of the five genotypes with four replicates at 5 P rates (0, 30, 60, 90 and 120 kg P205/ha). All sub-plots received 60 kg/ha K as KCL and 120 kg N/ha as urea, split in three equal doses at transplanting, tillering and 7 days before panicle initiation. The G6 sub-plots were fertilized with ,3N labelled urea at the rate of 120 kg N/ha and with an enrichment of 5% atom excess. These subplots were surrounded by steel frames of 0.8 x 0.8 x 0.35 m. The plants were harvested at flowering and at maturity and were separated straw and grain. Plant samples were dried to constant weight and ground for analysis. The P content in the tissue was determined using the P yellow method [7] after wet digestion with a 2:1 mixture of nitric and perchloric acid. The total N content was determined by the Kjeldahl method and UN a.e by emission spectrometry (NOI-6e) [7],
64

3. RESULTS AND DISCUSSION
In experiment 1 (field screening), there was a large genotypic effect on dry matter yield for both straw and grain (Appendix Table XXVIII, Fig. 1). The range for the 24 genotypes in kg/plot was 0.423 to 0.788 for straw and 0.245 to 0.534 for grain. The effect of P supply on dry matter yield was small except in a few genotypes as in genotype 19. On average, application of 90 kg P205/ha slightly decreased the straw yield and slightly increased the grain yield. Plant height varied with genotype but was hardly affected by the P supply.
The effect of P supply on total phosphorus uptake and P concentration was also small but generally positive (Table I). On average, P supply increased the P concentration from 0.151 to 0.165 % and phosphorus uptake from 1.48 to 1.60 g per plot. As regards genotypic differences, phosphorus uptake varied more than P concentration. On soils not fertilized with P, phosphorus uptake ranged from 1.27 to 1.88 g/plot and P concentration from 0.138 to 0.171 %. On P fertilized soil, phosphorus uptake ranged from 1.36 to 1.91 g per plot and P concentration from 0.148 to 0.191 %.
0.55-kgZplot
0.5 4
0.45
0.4-
0.35<oIk2-
” 0.3OCD
’co
O 0.25
0.2
Group l6
24m9
1■ 22
Group II 3■a 7
■•
2i )115■
16
4
21■18■
lS10■ 2■
Group III17
„ " V■
0.25 0.3 0.35 0.4GY at 0 kg PgOg/ha
0.45 0.5 0.55kg/plot
FIG. 1. Grain yield of 24 rice genotypes grown on soil fertilized and unfertilized with P.
65
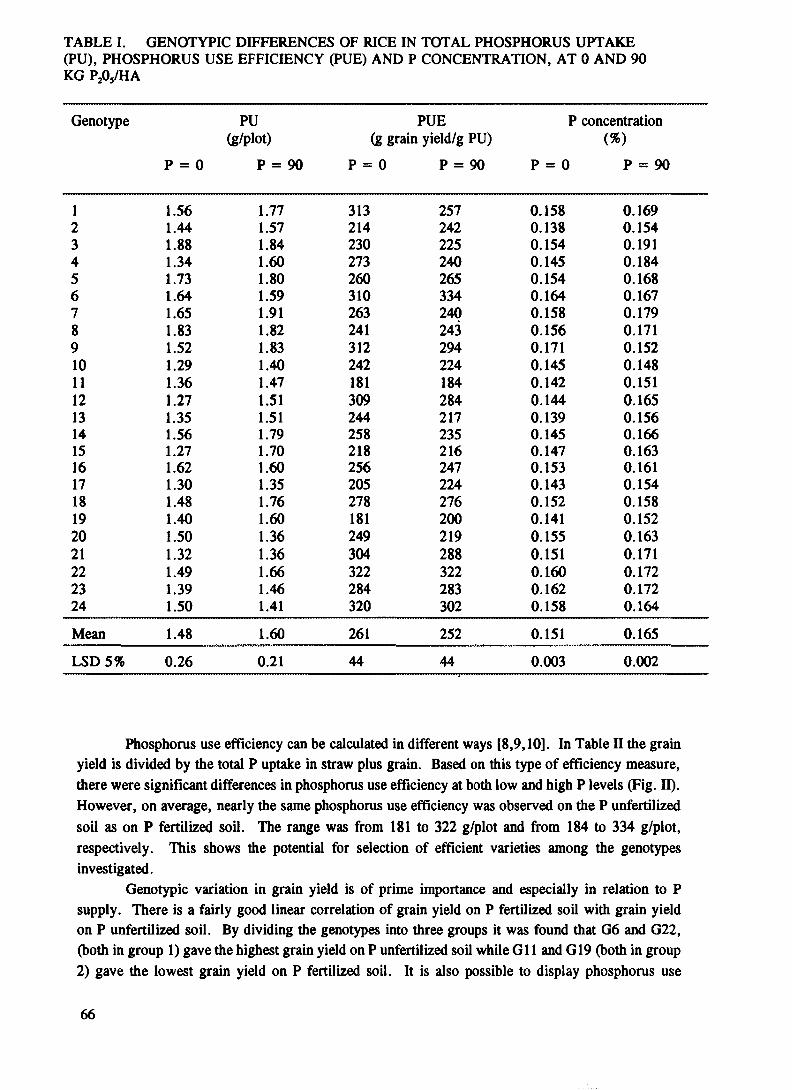
TABLE I. GENOTYPIC DIFFERENCES OF RICE IN TOTAL PHOSPHORUS UPTAKE (PU), PHOSPHORUS USE EFFICIENCY (PUE) AND P CONCENTRATION, AT 0 AND 90 KG PA/HA
Genotype
P = 0
PU(g/plot)
P = 90
PUE(g grain yield/g PU)
P = 0 P = 90
P concentration (%)
P = 0 P = 90
1 1.56 1.77 313 257 0.158 0.1692 1.44 1.57 214 242 0.138 0.1543 1.88 1.84 230 225 0.154 0.1914 1.34 1.60 273 240 0.145 0.1845 1.73 1.80 260 265 0.154 0.1686 1.64 1.59 310 334 0.164 0.1677 1.65 1.91 263 240 0.158 0.1798 1.83 1.82 241 243 0.156 0.1719 1.52 1.83 312 294 0.171 0.15210 1.29 1.40 242 224 0.145 0.14811 1.36 1.47 181 184 0.142 0.15112 1.27 1.51 309 284 0.144 0.16513 1.35 1.51 244 217 0.139 0.15614 1.56 1.79 258 235 0.145 0.16615 1.27 1.70 218 216 0.147 0.16316 1.62 1.60 256 247 0.153 0.16117 1.30 1.35 205 224 0.143 0.15418 1.48 1.76 278 276 0.152 0.15819 1.40 1.60 181 200 0.141 0.15220 1.50 1.36 249 219 0.155 0.16321 1.32 1.36 304 288 0.151 0.17122 1.49 1.66 322 322 0.160 0.17223 1.39 1.46 284 283 0.162 0.17224 1.50 1.41 320 302 0.158 0.164
Mean 1.48 1.60 261 252 0.151 0.165
LSD 5% 0.26 0.21 44 44 0.003 0.002
Phosphorus use efficiency can be calculated in different ways [8,9,10]. In Table II the grain yield is divided by the total P uptake in straw plus grain. Based on this type of efficiency measure, there were significant differences in phosphorus use efficiency at both low and high P levels (Fig. II). However, on average, nearly the same phosphorus use efficiency was observed on the P unfertilized soil as on P fertilized soil. The range was from 181 to 322 g/plot and from 184 to 334 g/plot, respectively. This shows the potential for selection of efficient varieties among the genotypes investigated.
Genotypic variation in grain yield is of prime importance and especially in relation to P supply. There is a fairly good linear correlation of grain yield on P fertilized soil with grain yield on P unfertilized soil. By dividing the genotypes into three groups it was found that G6 and G22, (both in group 1) gave the highest grain yield on P unfertilized soil while Gil and G19 (both in group 2) gave the lowest grain yield on P fertilized soil. It is also possible to display phosphorus use
66

0.3*
0.32
0.3
0.28 -
co5 0.26 - o’CL1 CD 0 24 -
o o>% 0.22UJ 3 CL 0.2*
0.180
Group III
19■
11
Group U 2318
16
1* 7 4
17-e- 3 1015
16 0.16 02r~
0.22...T...024
i026 028
RUE at 0 kg P205/ha
Group 122
24
21■ 12
i0.3 0.32 0.34
FIG. 2. Phosphorus use efficiency of 24 rice genotypes grown on soil fertilized and unfertilized with P.
efficiency of grain on P fertilized soil versus phosphorus use efficiency of grain on P unfertilized soil. Using a similar classification of genotypes we see again that G6 and G22 are in group I and Gil and G19 in group 11. Another criteria for selection of genotypes is to relate phosphorus use efficiency of grain to grain yield. This is done for P unfertilized soil in Figure 3 and for P fertilized soil in Figure 4. As shown, there is a good linear relation and a high correlation between phosphorus use efficiency and grain yield. Based on this data, it can be concluded that G6 and G22 are the most efficient and Gil and G19 are the least efficient genotypes for rice cultivation on this soil.
It was therefore of interest to study shoot and root characteristics of the two most efficient genotypes, G6 and G22, and of the two least efficient genotypes, G11 and G19, in more detail. This was done under greenhouse conditions in experiment 2. After transplanting, the four selected genotypes were grown for four weeks and at increased rate of P application. As seen from the data presented in Tables I and Appendix Table XXIX, the effect of P supply was small except for an increase in P uptake of roots at 90 ppm of P application and a decrease in phosphorus use efficiency of shoots with increasing rate of P application. Important genotypic differences were found. Dry weight of roots and also root/shoot ratios (R/S) were higher for G6 and G22 than for Gil and G19. This is considered as a valuable trait [11,12], A higher R/S ratio indicates a larger potential for P acquisition of G6 and G22 than Gil and G19. If we compare phosphorus use efficiency of shoots, these values are usually slightly higher for G6 and G22 than for Gil and G19 independent of the rate of P application (Appendix Table XXX). This is an early indication of genotypic differences in phosphorus use efficiency.
67

0.32 -y = 0.467 x +■ 0.0777
0.820.3 ~
0.28 -
0.26 -
0.24 -
0.22 -
0.2 -
0.35 0.4Grain yield (kgZplot)
FIG. 3. Relationship between grain yield and phosphorus use efficiency of 24 rice genotypes grown on soil unfertilized with P.
0.34 t
0.32 -
y = 0.4572x + 0.06610.3 -
0.28 -
0.26 -
0.24-17 10
0.22 -
0.2 -
0.4 IGrain yield (kg/plot)
FIG. 4. Relationship between grain yield and phosphorus use efficiency of 24 rice genotypes grown on soil fertilized with 90 kg P2Os/ha.
68

With this background it was further of interest to study the effect of P supply in more detail under wetland field conditions and to follow its cause during crop development. This was done in experiment 3 with the same four contrasting genotypes as in experiment 2 together with the intermediate efficient genotype, G18. Five P rates (0, 30, 60, 90 and 120 kg P/ha) were applied. The five genotypes were sampled and analysed at flowering stage and at maturity (Appendix Table XXXI and Table II). On average there was a small but positive effect of P supply on vegetative growth and P uptake, both in shoots at flowering and in straws at maturity. The effect of P supply on grain yield varied with genotype. From flowering to maturity there was a considerable increase of dry matter and P uptake in the rice genotypes but the distribution between straw and grain differed markedly. Obviously the two efficient genotypes G6 and G22 have a much higher sink strength of assimilates transferred to grain than the two inefficient genotypes G11 and G22 with genotype G18 lying between.
TABLE H. GENOTYPIC DIFFERENCES OF RICE IN P UPTAKE (G/M 2) OF STRAW AT FLOWERING (PF) AND OF STRAW (PS) AND GRAIN (PG) AT MATURTY
Genotype Yieldcomponent
P rate (kg P20s/ha)
Mean
0 30 60 90 120
G6 Flowering 1.29 1.47 1.45 1.47 1.39 1.41Straw 1.05 1.38 1.56 1.53 1.55 1.41Grain 1.18 1.22 1.17 1.18 1.14 1.17
G22 Flowering 1.16 1.27 1.58 1.43 1.43 1.37Straw 0.70 0.84 0.84 0.83 0.82 0.80Grain 1.17 1.23 1.18 1.09 1.06 1.14
G18 Flowering 1.21 1.22 1.32 1.29 1.32 1.27Straw 0.82 0.83 1.06 0.93 0.93 0.91Grain 0.70 0.81 0.99 0.97 0.83 0.86
Gil Flowering 1.01 1.14 1.28 1.26 1.38 1.21Straw 1.35 1.55 1.45 1.42 1.64 1.48Grain 0.53 0.48 0.62 0.53 0.44 0.52
G19 Flowering 1.09 1.20 1.34 1.28 1.31 1.24Straw 1.25 1.24 1.45 1.36 1.76 1.41Grain 0.46 0.52 0.50 0.57 0.40 0.49
Mean Flowering 1.15 1.26 1.39 1.34 1.36 -
Straw 1.03 1.16 1.27 1.21 1.34 -
Grain 0.80 0.85 0.89 0.86 0.77 -
LSD 5% Flowering 0.19 0.20 0.17 0.20 - -
Straw 0.11 0.10 0.10 0.10 - -
Grain 0.05 0.07 0.10 0.07 - -
Grain yield is related to P rate as seen in Figure 5. When judged from this graph and from Appendix Table XXXII, the response to P application varied with genotype. Of the two efficient genotypes, G22 did not respond to P supply and G6 gave the highest grain yield at the lowest P rate. Of the two inefficient genotypes Gil gave the highest grain yield at the third P rate and G19 at the fourth P rate. G18 gave a clear response up to the third P rate.
69

Gra
in y
ield
(kg/
m2)
0.6
0.5
0.4
0.3
0.2
0.1
0
■ 0 kg P205/ha * 30 kg P205/ha 0 60 kg P205/ha M 90 kg P205/ha H 120 kg P205/ha
G19 G11 G18 G22 G6Rice genotypes
FIG. 5. Genotypic differences in grain yield of rice at increasing rate of P application.
TABLE III. N DERIVED FROM FERTILIZER (NDFF), N FERTILIZER YIELD AND N RECOVERY IN STRAW AND GRAIN OF RICE AT INCREASING P RATE.
P rate(kg P205/ha)
Ndff(%)
Straw Grain
N fertilizer yield (g/m2)
Straw Grain
N recovery (%)
0 45.9 48.6 2.55 3.04 49.830 47.7 52.3 3.17 3.63 56.760 47.0 49.3 3.13 3.21 52.890 4.72 49.4 2.73 3.30 50.2120 46.3 48.6 3.14 3.04 51.6
LSD 5% 2.0 1.6 1.6 0.44 2.8
In Figure 6, the phosphorus use efficiency of grain is shown for the five genotypes. Based on this criteria, G22 should be the best genotype. On P fertilized soil the order between G18 and G6 is reversed compared to the grain yield in Figure 6. Based on all the information obtained from this study, G6 and G22 should be considered the best and about equally good on soil low in available P. At low P supply G6 may be slightly better than G22. G18 may be an alternative genotype at higher P supply if G6 or G22 is not available for cultivation.
70

0.25
oT 0.2
0 kg P205/ha ■ 30 kg P205Zha 90 kg P205/ha E 120 kg P205/ha
60 kg P205/ha
G19 G11 G6Rice genotypes
G18 G22
FIG. 6. Genotypic differences in phosphorus use efficiency
In experiment 3, ,5N labelled urea was also applied to investigate directly the N fertilizer uptake by the G6 genotype. As seen in Appendix Table XXXII and Table III, increasing P supply from 0-120 kg P205/ha did not increase the %N and the %Ndff in straw or grain but increased the total N in straw. There was however, no corresponding increase in the total N uptake by grain. The %N recovery was highest (54%0 at 30 P203/ha. This is additional proof that G6 is an efficient rice genotype, well adopted for cultivation on this gray soil of South Viet Nam.
REFERENCES
[1] ATANASIU, N., SAMY, M., Rice - Effective Use of Fertilizers, CEA, (1986) Center d*Azote Bleicherweg 33, 8002, Zurich, Switzerland.
[2] BARBER, S., Mechanism of Phosphorus Uptake Plants and their Application of Plant Selection for Improved Phosphorus Uptake Efficiency. 3rd Intern. Congress on Phosphorus Compounds, (1983) Brussels.
[31 BATTEN, G.D., WARDLAW, I F., ASTON, M l., Growth and distribution of phosphorus in wheat development under various phosphorus and temperature regime. Aust. J. Agric. Res. 37 (1986) 459-469.
[4) FAGERIA, N.K., WRIGHT, R.J., BAL1GAR, V.C., Rice cultivar evaluation for phosphorus use efficiency, Plant and Soil 111 (1988) 105-109.
[5) FOHSE, D., CLAASEN, N., JUNK, A., Phosphorus efficiency of plants 1. External and Internal P requirement and P uptake efficiency of different plant species. Plant and Soil 110 (1988) 101-109.
[6] FOHSE, D., CLAASEN, N., LUNGK, A., Phosphorus efficiency of plants. 11. Significance of root radius, root hair and cation balance for phosphorus influx in seven species, Plant and Soil, 132 (1991) 261-272.
[7] IAEA, Use of Nuclear Techniques in Studies of Soil-Plant Relationship. Vienna, (1987, 1990)
71

[8] JESSOP, R.S., JONES, G.P., BLAIR, G.J., Performance of 22 wheat varieties under low and high phosphorus conditions and Implications for the Selection of P-Efficient Varieties. 3rd Intern. Congress on Phosphorus Compounds, (1983) Brussels.
[9] JONES, G P.D , LESSOP, R.S., BLAIR, G.J., Alternative methods for the selection of phosphorus efficiency in wheat, Field Crops Res. 30 (1992) 29-30.
[10] PIPER C.S.AND DE VRIES M P C., The residual value of superphosphate on a redbrown earth in South Australia. Austral. J. Agric. Res. 15 (1964) 234-272.
[11] ROMER, W., AUGUSTIN, J., SCHILLING, G. The relationship between phosphate absorption and root length in nine wheat cultivars, Plant and Soil, 111 (1988) 109-201.
[12] YOST, R.S., KAMPRATH, E.J., LOB ATE, E., NADERMAN, G.C., Phosphorus response of com on an oxisol as influenced by rates and placement, Soil Set. Am. J. 43 (1979) 338-343.
72

GENOTYPIC DIFFERENCES IN ACQUISITION AND UTILIZATION OF PHOSPHORUS IN WHEAT
W.J. HORST, F. WIESLER Institute for Plant Nutrition, University of Hannover, Hannover, Germany
M. ABDOUSoil and Water Department, Suez Canal University, Ismailia, Egypt
XA9642762
Abstract
GENOTYPIC DIFFERENCES IN ACQUISITION AND UTILIZATION OF PHOSPHORUS IN WHEAT.In an attempt to evaluate whether breeding and selection for high yielding capacity changed the P requirement of
modem wheat cultivars, the response of two wheat cultivars to different levels of P supply was investigated. A traditional cultivar (Peragis) and a modem cultivar (Cosir) were cultivated in a C-loess low in available P and high in CaC03 in 120 cm high PVC tubes. In addition and for comparison, nutrient solution experiments were also conducted. Shoot growth, root growth, P uptake, P translocation and P distribution within the shoot at different developmental stages were compared. The grain yield of the modem cultivar Cosir was higher at limiting and non-limiting P supply and, therefore, this cultivar can be considered as more P-cfficient than the traditional cultivar. Grain yield reduction at low P supply was mainly due to an inhibition of tillering and thus lower number of ears per plant, whereas the number of grains per ear was hardly affected. Reduced tillering at low P supply could not be related to P concentrations in the shoot meristematic tissues which were generally much higher than in other plant tissues and kept at an elevated level even at limiting P supply. Root branching (1" order laterals) was reduced at limiting P supply in Cosir but not in Peragis which, generally, had lower numbers of laterals at the beginning of tillering.
From the results it can be concluded that the main factors contributing to the higher P efficiency of the modem cultivar Cosir are (i) efficient use of assimilates for root-growth characteristics which enhance P acquisition: enhanced root branching and thus smaller mean root diameter and longer root hairs, (ii) an efficient P uptake system, (iii) efficient remobilization of P from vegetative plant organs to the grains, and most importantly (iiii) lower P requirement for grain yield formation because of lower ear number per plant but higher grain number per ear. 1
1. INTRODUCTION
For the expression of the high yielding capacity of modem wheat cultivars a higher P supply is necessary than for low yielding cultivars [1]. However, concern has been expressed about the low productivity of such cultivars at low nutrient supply [2] and the adjustment of higher available P levels in soils for high yielding cultivars has been advocated [3], [4]. One reason for a lower P efficiency of high yielding cultivars may be selection for less assimilate transport to the roots, a concern that has been already expressed by Opitz [5]. Ruckenbauer 6 found a decrease in root weight and root/shoot (w/w) ratio with increasing breeding intensity in wheat.
Differences among cultivars [7], [8], [9] in P uptake can be explained to a large degree by differences in root growth. The importance of the root size in explaining genotypical differences in P efficiency was especially well demonstrated by Sattelmacher et al. [10] with maize isolines differing in the gene ’rootless’. However, the most efficient way of increasing the absorbing root surface area is the formation of root hairs [11]. Genetic variation in root-hair length has been reported by Dittmer [12] as well as by Caradus [13]. Not only the efficiency of absorbing soil/fertilizer P, but also the efficiency with which P is utilized within the plant may contribute to overall P efficiency [10].
73

The objective of the present study was to compare wheat cultivars with regard to their yield response to non-limiting and limiting P supply and their P acquisition and utilization efficiency.
2. MATERIALS AND METHODS
Seeds of the spring wheat cultivars (Triticum aestivum L.) were originally supplied by FAL, Braunschweig, FRG. Among 10 cultivars Peragis I (Peragis) and Cosir were selected representing tall traditional and short modem cultivars, respectively.
2.1. Soil culturePot experiments were conducted using 120 cm high PVC tubes covered with aluminium foil
and filled with 138 kg of C-loess (23 % CaC03, 4.4 mg kg ' Ca-acetate-lactate P, CAL-P) layerwise carefully compacted to 1.39 g cm-3 bulk density. P was supplied on the basis of 25, 50, 100, and 250 % of the expected P requirement (84, 167, 334, and 825 mg P per pot giving 6, 12, 24, and 60 mg P kg ' soil) as Ca^jPOJj and uniformly mixed with the soil. At the onset of the experiment CAL-P was 10, 13, 22, and 35 mg kg ' and P concentration of the equilibrium soil solution (centrifugation) was 12, 16, 32, and 435 /xg 1'. Other nutrients were supplied as basal dressing (per pot): 1200 mg K, 200 mg Mg, 30 mg Zn, 15 mg Cu and 2000 mg N in 4 dressings (800 mg before planting, 400 mg at tillering, 400 mg at shooting, and 400 mg at anthesis). Soil moisture was controlled by applying deionized water to the bottom of the columns as required and to the soil surface to give tensiometer reading of pF 2.2 at 25 cm depth. Plants were seeded in early spring. Harvests were taken at the cultivar-specific development stages [14], tillering (25), shooting (31), anthesis (61), and maturity (92). Length of soil-free washed roots was determined using the line-intersection method [15]. P uptake was calculated according to Williams [16]. Root-hair length was measured in glassfaced root boxes filled with soil treated and cultivated exactly as described above.
2.2. Solution culture
2.2.1. Experiment 1For the determination of P uptake characteristics and root growth and morphology as affected
by P supply, nutrient-solution experiments were conducted in a growth chamber at 25/20* C day/night temperatures, 70% relative humidity and a light intensity of 200 W for 16 h. 2 days old seedling of the 2 wheat cultivars were transferred to 22 1 plastic pots filled with nutrient solution with the following composition (mM): 0.5 CaS04, 0.75 KN03, 0.325 Mg(N03)2, 2x 10⁻⁴ ZnS04, 2x10"* CuS04, 2x10"* MnS04, 8xl0'3 H3B03, 2xl0"4(NH4)6Mo7O24 and 4xl0"2 Fe as FeEDDHA (Sequestren). The pH was kept constant at 5.5 ( 0.1) using automatic titration of NaOH or HC1. The P concentrations were 1 or 10 /xM which were adjusted daily. After 14 days, part of the plants were harvested for assessment of root and shoot characteristics. The rest of the plants were used for P uptake studies using the P depletion technique [17]. Briefly, 10 plants each were transferred to 1.2 1 nutrient solution containing 20 /xM P. Every 15 minutes a subsample of the solution was taken for the measurement of the P concentration. Root length was estimated at the beginning and the end of the experiment as described above. P uptake rate was calculated according to Claassen and Barber [17]. Ima* and Kg, were determined using the Eadie-Hofstee procedure described by Lehninger [18].
74

2.2.2. Experiment 2The 2 wheat cultivars were grown in solution culture (composition see above) using 58 1
plastic pots in a greenhouse. 4 P concentrations ranges 0.25-1.25, 0.50-2.50; 2.50-3.75; 50 pM) were maintained over the whole experimental period by daily adjustment. Plants were harvested at the beginning of tiller formation (23 days after planting [DAP]) and at the beginning of shooting 48 (Cosir) and 59 (Peragis) DAP. At the beginning of tillering plants were separated into different plant parts for the determination of P tissue concentrations and root morphological characteristics assessed. The 5 mm basal stem section comprizing the tiller primordia were considered as meristematic tissue. P concentration in plant tissue was determined after dry ashing of the plant material using the P yellow method [19], P concentration in the nutrient solution using the P blue method [20].
3. RESULTS
At low P supply, yields of both cultivars were severely reduced (Fig. 1). However, at both the non-limiting and at the limiting P supply, grain yields of the modem cultivar Cosir were higher and straw yields lower than those of the cultivar Peragis. Grain yields at sub-optimum P supply were
PeragisCosir
100 -
P supply [mg P/kg soil]
Fig. 1. Effect of P supply on grain and straw yields of 2 wheat cultivars grown in soil culture
75

reduced mainly because of lower number of ears per plant (Table I), whereas grain number per ear and grain weight were hardly affected. Clear differences in yield structure existed between the cultivars. While the traditional cultivar Peragis produced 15 % more ears/pot with 120% heavier grains, it was outyielded by the modem cultivar Cosir which had 74-85 % more grains per ear. Higher P content of the grains in Cosir compared to Peragis at low P supply (Fig. 2) was not due to higher P uptake during the reproductive growth stage but to more efficient mobilization of P from vegetative plant organs especially the glumes. At high P supply the higher P content of the grains can be explained mainly by more efficient P uptake. Retranslocation of P from vegetative plant organs to the grains during reproductive growth at low (high) P supply was 81 % (73 %) for Cosir and 63 % (81 %) for Peragis. The more efficient retranslocation of P in cultivar Cosir is mainly responsible for its more efficient P utilization for grain formation (Fig. 3). P utilization for total dry matter production, however, was more efficient in cultivar Peragis.
Since P deficiency mainly affected grain yield by reducing tillering (see Table I) emphasis was laid on early growth stages in subsequent experiments. Dry matter accumulation of shoots was higher in cultivar Cosir than in Peragis (Table II) at tillering, whereas at beginning of shooting, Peragis substantially outyielded Cosir. Relative reduction of dry matter production at limiting P supply compared to unlimited P supply was greater in Peragis than in Cosir at both development stages. Cumulative P uptake followed the same pattern as dry matter accumulation (not shown). Differences in P uptake between the cultivars could be due to differences in root growth and morphology. At tillering root length as well as root dry weight were hardly affected by P supply (Fig. 4). Root length (Fig. 4A) but not root dry weight (Fig. 4B) of Cosir was greater than that of Peragis. At beginning of tillering Peragis had produced much longer and heavier roots. However, wereas at low P supply root growth was clearly depressed in Peragis, root length and less clearly root dry weight was enhanced in Cosir. In addition to root growth, root morphology was affected by P supply and differed between the cultivars. Specific root length which is a measure of the fineness of the roots increased at lower P supply and was much greater in Cosir at tillering, but not at beginning of shooting (Fig. 5). Also, Cosir had longer root hairs than Peragis and root-hair length tended to decrease at high P supply (Table III).
TABLE I. EFFECT OF P SUPPLY ON YIELD STRUCTURE OF 2 SPRING WHEAT CULTIVARS
Cultivar P supply
[mg/kg soil]
Ears/pot Grains/ear TGW
[g]
Peragis 12 17.9 38.1 42.7
60 38.6 42.5 39.3
Cosir 12 15.0 68.8 36.2
60 34.3 70.0 39.3
76

Peragis Cosir * P uptake from soil**
M 64.8
310.7
156.2366.9
152.2
167.3
P retranslocation from halms into the grainsP retranslocation from glumes into the grainsP content in grains
P supply:12 mg P/kg soil
P supply:60 mg P/kg soil
Fig. 2. Phosphorus uptake and redistribution from vegetative plant organs to the grains between anthesis and maturity as affectd by wheat cultivar and P supply - Soil culture
77

P ut
iliza
tion [
g DW
/mg P
j Peragis
12 60 12 60 12 60 P supply [mg P/kg soil]
F/g. J. Phosphorus utilization of 2 wheat cultivars grown in soil culture as affected by P supply (A - Total shoot dry matter production per unit total shoot P, B - Grain dry matter production per unit total shoot P, and C - Grain dry matter per unit grain)
TABLE II. EFFECT OF P SUPPLY ON SHOOT DRY MATTER OF 2 SPRING WHEAT CULTIVARS AT TILLERING AND AT SHOOTING
Cultivar P supply
[mg/kg soil]
Shoot dry-matter [g/pot]
Tillering Shooting
Peragis 6 0.58 0.08
12 0.99 1.39
24 1.24 1.66
60 1.47 1.71
Cosir 6 13.20 8.80
12 20.20 9.70
24 22.50 12.50
60 26.80 13.30
78

6 12 24 60 6 12 24 60
B
0CLS
JCO)1
e>-o*=<oo0£
Fig. 4. Effect of P supply on root dry weight (A) and root length (B) of 2 wheat cultivars grown in soil culture at 2 developmental stages
79

Roo
t len
gth/
unit
root
dry
wei
ght
O)
PeragisCosir800 -
Shooting
600 - Tillering
6 12 24 60P supply [mg P/kg soil]
6 12 24 60
Fig. 5. Effect of P supply on specific root length of 2 wheat cultivars grown in soil culture at 2 developmental stages
TABLE HI. EFFECT OF P SUPPLY ON MEAN ROOT HAIR LENGTH OF OF 2 SPRING WHEAT CULTIVARS
Mean root-hair length [mm]
CultivarP supply
[mg/kg soil]6 60
Peragis1.19 0.87
Cosir 1.37 1.02
80

The effect of P supply on root growth and morphology could be confirmed in a nutrient solution experiment (Table IV). At low P supply shoot dry matter production was reduced. However, root dry weight and even more root length was considerably greater than at high P supply leading to much higher root/shoot ratios at limiting P supply. Specific root length was increased and root radius decreased at low P supply. Root growth and morphology was not much different between the cultivars in this nutrient solution experiment.
TABLE IV. DRY WEIGHT PRODUCTION OF SHOOTS (DWS) AND ROOTS (DWR) . ROOT LENGTH (RL), ROOT/SHOOT RATIO (RIS), SPECIFIC ROOT LENGTH (SRL) . AND P CONCENTRATIONS OF 2 SPRING WHEAT CULTIVARS GROWN IN SOLUTION CULTURE
Cultivar P cone.UM?) •
DWS
[mg/10plants]
DWR
[mg 10plants]
RL
[m/10 plants] [mg DWR/mg DWS]
R/S[cmRL
/mg DWS]
SRL
[cm RL/mg DWR]
radius[mm]
P concentration
[mg P/g DW]
Shoot Root
Peragis 1 1488 797 352 54 24 44 113 2.70 0.46
10 1680 564 214 34 13 38 125 4.96 2.50
Cosir l 1680 839 371 50 22 44 110 2.64 0.80
10 2032 609 204 30 10 36 140 4.90 2.83
Based on the measurement of root length and P uptake, P uptake rates could be calculated from the soil-culture pot-experiment (Fig. 6). P uptake rates increased with increasing P supply but decreased with development. Cultivar Cosir had much greater uptake rates especially at the 2 higher P supplies. At the lower P supply the cultivars did not differ much. Hie kinetic parameters of P uptake derived from the P depletion experiment also clearly show that P uptake capacity (as indicated by higher is greatly increased in P-starved plants (Table V). They also indicate a higher P uptake capacity of cultivar Cosir compared to Peragis, although the picture for the ’low P plants’ is less clear, because of the increased for Cosir.
Cosir
Peragis
Cosir
Peragis
P supply [mg P/kg soil]Fig. 6. Effect of P supply on P uptake rate of 2 spring wheat cultivars grown in solution soil culture at 2 developmental stages
81

TABLE V. PARAMETERS OF P UPTAKE KINETICS OF 2 SPRING WHEAT CULTTVARS GROWN IN SOLUTION CULTURE AS AFFECTED BY THE P SUPPLY DURING PRECULTURE
Cultivar P cone.
[MP]
vT max
[pmol P/cm/s]
K.
[MP]
Cmin
[MP]
Peragis 1 0.199 4.8 0.03
10 0.083 4.2 0.10
Cosir 1 0.283 8.5 0.04
10 0.090 3.1 0.12
In order to establish a causal relationship between P uptake and distribution in the plant, root growth and morphology and reduced tillering at low P supply a second nutrient solution experiment was conducted. The most dramatic effect of P supply on tillering could be confirmed (Fig. 7). This is in agreement with greatly reduced P concentrations on the total shoot basis (Fig. 8A). Cultivar Cosir had consistently higher P concentrations than Peragis confirming its higher P uptake capacity. P concentrations in the meristematic tissue (Fig. 8B) were much higher and responded less to the P supply.
Reduced tiller formation could be due to a lack of cytokinins produced in root tips and transported to the shoot. Since the number of root tips mainly depends on root branching, lateral root formation was determined (Fig. 9). The number of laterals was much higher in Cosir than in Peragis. Lateral root formation was only reduced in Cosir at the 2 lower P supplies but not in Peragis.
4. DISCUSSION
Grain yield reduction at suboptimum P supply was mainly due to inhibition of tillering leading to fewer ears per plant. Other yield components were hardly affected (Tab. 1) indicating a high P requirement for the expression of this yield component. This finding is in agreement with results of Sherchand and Paulsen [21] and ROmer and Schilling [22] showing that grain yield is more affected by P nutrition before than after anthesis. However, since the plants tend to preferentially supply P to the meristematic tissues (Fig. 8) and no clear relationship existed between number of tillers and P concentrations, it appears unlikely that P directly limited the initiation of tillers.
Formation of tillers is under phytohormonal control. The ratio of cytokinins produced in the root apices and auxins produced in the shoot apices is of special importance [23]. Increased cytokinin production and transport to the shoot enhances tillering [24]. Since a close positive correlation between number of lateral roots, root apices and cytokinin production can be expected, root branching was studied (Fig. 9). No clear relationship between numbers of first order laterals and tillering as affected by genotype and P supply could be established. At beginning of tillering second order laterals just started to emerge, but could not be counted reliably. Therefore, it can not be excluded, that they contribute to the differences in numbers of tillers.
82

3
] Peragis
P 1 P 2 P 3 P 4
18
15 -
c 12COd
B e 9
p 6
3 -
P 1 P 2 P 3 P 4P supply
Fig. 7. Effect of P supply on number of tillers per plant at beginning of tillering (A) and beginning of shooting (B) of 2 wheat cultivars grown in solution culture
83

P co
ncen
tratio
n [m
g/g D
W]
P co
ncen
trat
ion [
mg/
g DW
] 14
12 ] Peragis
10 - mm Cosir
8 -
6 -
4 -
20
P 1 P 2 P 3 P 4
P 1 P 2 P 3 P 4
P supply
Fig. 8. Effect of P supply on P concentrations in total shoot (A) and meristematic tissue (B) at the beginning of tillering of 2 wheat cultivars grown in solution culture
84

v> 4002 350| 3001 250
? 2000)| 150c 100(0
Peragis
500
p 1 P 2 P 3 P 4
P supply
Fig. 9. Effect of P supply on total number of first order lateral roots per plant at the beginning of tillering of 2 wheat cultivars grown in solution culture
Among all plant organs, the P concentrations of the leaves most sensitively responded to the P supply (not shown), leading to the conclusion that they best reflected the P nutritional status of the plants. In consequence, the source capacity of the plant is greatly reduced under P deficiency. Since the root represents a strong sink for assimilates under these conditions (Table. IV) it may be assumed that a lack of assimilates is primarily responsible for the observed strong inhibition of tillering at limiting P supply.
According to the agronomic definition of nutrient efficiency [25] the modern cultivar Cosir can be classified as more P-efficient than the traditional cultivar Peragis. Although the comparison of only 1 cultivars in each group does not allow generalization, these results support conclusions by Batten and Khan [26] and Jones [27] that, in contrast to the suspicion expressed earlier (see Introduction), breeding for grain yield has not necessarily decreased P efficiency. These authors showed that this was mainly due to better P utilization for grain formation (higher P harvest index) a factor which was also important in this study (Fig. 2) [28].
The above and below-ground vegetative growth of the traditional cultivar Peragis was typically 6 much more vigorous at the beginning of shooting. However, early growth was more rapid in Cosir (Fig. 4). The modern cultivar Cosir made more efficient use of the assimilates transported to the roots for the expression of root morphological characteristics (high specific root length/thin roots (Fig. 5) and longer root hairs (Table HI)) which are decisive for efficient P acquisition from soil 8,11. As a general adaptive mechanism to low P supply a higher ratio of root to shoot growth rate [29] (Table IV), an absolute increase in root length at moderate P deficiency 8 (Fig. 4), and an increased root-hair length [30] (Table III) could be confirmed.
85

However, neither P remobilization and transport to the grains nor P uptake can satisfactory explain the differences in P efficiency between the cultivars. The results indicate that yield structure is of foremost importance for P efficiency: Cultivars with emphasis on grain number per ear as yield component appear to be less reduced in grain yield at low P supply than cultivars more dependent on number of ears per plant.
REFERENCES
[1] BATTEN, G. D , Khan, M. A., Cullis, B. R , Yield responses by modem wheat genotypes to phosphate fertilizer and their implications for breeding, Euphytica, 33 (1984) 81-89.
[2] BUCHTING, A., ELMSHEUSER, H. A., Einige Aufgaben der Pflanzenzfichtung angesichts kunftiger Restriktionen im Bereich der Agrarproduktionsmittel, Berichte fiber Landwirtschaft 56 (1978) 690-711.
[3] MUNK, H , Die Stellung der Phosphorsaure in der Pflanze, Bodenkultur 27 (1976) 229-243.[4] BUCHNER, A., Die Ertragswirkung der Phosphate fruiter und heute, Bodenkultur 27 (1976) 244-255.[5] OPITZ, K , Untersuchungen fiber Bewurzelung und Bestockung einiger Getreidearten, Mittl. d. Landw. Inst. d.
Konigl. Uni vers itat Breslau 2 H4 (1904) 749-816.[6] RUCKENBAUER, P , Die Beuiteilung der Leistungsfahigkeit von Winterweizensorten nach bestimmten
Organrelationen, Z. Acker- und Pflanzenbau 130 (1969) 273-290.[7] BARBER, S.A., MACKEY, A D., Root growth and potassium uptake by two com genotypes in the field,
Fertilizer Res. 10 (1986) 217-231.[8] RdMER, W., AUGUSTIN, J., SCHILLING, G., The relationship between phosphate absorption and root length
in nine wheat cultivars, Plant and Soil 111 (1988) 199-201.[9] KRAMNITZ, P G , AARSSEN, L. W., LEFEBVRE, D.D., Relationship between physiological and morphological
attributes related to phosphate uptake in 25 genotypes of Arabidopsis thaliana, Plant and Soil 133 (1991) 169-175.[10] SATTELMACHER, B , HORST, W.J., BECKER, H C , Factors that contribute to genetic variation for nutrient
efficiency of crop plants. Z. Pflanzenemahr, Bodenk. 157 (1994) 215-224.[11] FOHSE, D., CLAASSEN, N., JUNGK, A., Phosphorus efficiency in plants. II. Significance of root radius, root
hairs and cation-anion balance for phosphorus influx in seven plant species, Plant and Soil 132 (1991) 261-272.[12] D1TTMER, H.J., Root-hair variation in plant species, Am. J. Bot. 36 (1949) 152-155.[13] CARADUS, J.R., Genetic differences in the length of root-hairs in white cloverand their effect on phosphorus
uptake, Proc. 9th Plant Nutr. Coll. (Scaife, A., Ed.) Warwick, England, CAB (1982) 84-88.[14] ZADOKS, J.C., CHANG, T.T., KONZAK, C.F., A decimal code for the growth stages of cereals, Weed
Research 14 (1974) 415-421.[15] TENNANT, D , A test of a modified line intersect method for estimating root length, J. Ecology 63 (1975) 995-
1001.
[16] WILLIAMS, R.F., The effects of phosphorus supply on the rates of intake of phosphorus and nitrogen upon certain aspects of phosphorus metabolism in gramineous plants, Aust. J. Sci. Res. 1 (1948) 33-361.
[17] CLAASSEN, N., BARBER, S.A., A method for characterizing the relation between nutrient concentration and flux into roots of intact plants, Plant Physiol. 54 (1974) 564-568.
[18] LEHNINGER, A. L., Enzyme Kinetik und Hemmung, Biochemie, Verlag Chemie, Weinheim, New York (1977) 147-174.
[19] GERICKE, S., KURMIES, B., Diekolorimetrische Phosphorsaurebestimmung mit Ammonium-Vanada-Molybdat und ihrc Anwendung in der Pflanzenanalyse, Z. Pflanzenemahr. Bodenk. 59 (1952) 235-247.
[20] MURPHY, J., RILEY, J.P., A modified single solution method for the determination of phosphate in natural waters, Anal. Chim. Acta (1962) 31-36.
[21] SHERCHAND, K , PAULSEN, G.M., Partitioning of phosphorus in different height isolines of winter wheat, J.Plant Nutr. 8 (1985) 1147-1160.
[22] RdMER, W., SCHILLING, G., Phosphorus requirements of the wheat plant in various stages of its life cycle, Plant and Soil 91 (1986) 221-229.
[23] MICHAEL, G., BERINGER, H., The role of hormones in yield formation, Internal. Potash Institute, Physiological Aspects of Crop Productivity, Proc. 15th Colloq. Int. Potash. Inst.,Bern (1980) 85-115.
[24] LANGER, R.H., PRASAD, P C., LAUDE, H.M., Effect of kinetin on tiller bud elongation in wheat, Ann. Bot. 37 (1973) 565-571.
86

[25] GRAHAM, R.D., Breeding for nutritional characteristics in cereals (Tinker, P B , Lauchli, A., Eds.) Adv. Plant Nutr. 1 (1984) 57-102.
[26] BATTEN, G.D., KHAN, M A , Uptake and utilization of phosphorus and nitrogen by bread wheats grown under natural rainfall, Aust. J. Exp. Agric. 27 (1987) 405-410.
[27] JONES, G.P.D., BLAIR, G.J., JESSOP, R.S., Phosphorus efficiency in wheat - a useful selection criterion? Field Crops Res. 21 (1989) 257-264.
[28] HORST, W.J., ABDOU, M , WIESLER, F., Genotypic differences in phosphorus efficiency of wheat, Plant and Soil 155/156 (1993) 293-296.
[29] FOHSE, D., CLAASSEN, N., JUNGK, A. Phosphorus efficiency of plants, I. ExtemaL and internal P requirement and P uptake efficiency of different plant species, Plant and Soil 110 (1988) 101-109.
[30] FOHSE, D , JUNGK, A., Influence of phosphate and nitrate supply on root hair formation of rape, spinach and tomato plants, Plant and Soil 74 (1983) 359-368.
87
EVALUATION OF HEDGEROW TREES IN ALLEY CROPPING FOR PHOSPHORUS USE EFFICIENCY AND N2 FIXATION IN LOW P SOILS IN MOIST SAVANNA IN NIGERIA
N. SANGINGAInternational Institute of Tropical Agriculture, Ibadan, Nigeria
XA9642763
S K A. DANSOSoil Fertility, Irrigation and Crop Production Section,Joint FAO/IAEA Division of Nuclear Techniques in Food and Agriculture, International Atomic Energy Agency,Vienna
F. ZAPATA Soils Science Unit,FAO/IAEA Agriculture and Biotechnology Laboratory, International Atomic Energy Agency,Seibersdorf
G.D. BOWEN Division of Soils,Commonwealth Scientific and Industrial Research Organization, Glen Osmond, Australia
Abstract
EVALUATION OF HEDGEROW TREES IN ALLEY CROPPING FOR PHOSPHORUS USE EFFICIENCY AND N2 FIXATION IN LOW P SOILS IN MOIST SAVANNA IN NIGERIA.
Soils low in P and N are common in the moist savanna climatic zones and consequently growth of hedgerow trees in alley cropping systems might require addition of N and P fertilizers. This is difficult for small scale farmers who have limited access to fertilizers and therefore depend only on limited input cropping systems. Exploiting genetic differences in P use efficiency and using hedgerow trees selected for high N2 fixation ability can improve tree establishment and growth on N and P poor soils, restore soil fertility and preserve soil from degradation.
Field experiments carried out at Fashola (moist savanna) have shown that large differences in growth and P use efficiency occurred between N2 fixing trees such as Gtiricidia sepium, and non N2-fixing trees such as Senna siamea and Senna spectabiUs. Provenances or isoline differences in P use efficiency also occurred within species and was also influenced by level of P and period of growth. Differences between species and provenances in P uptake and growth were largely related to differences in physiological P-use efficiency (PPUE), root length and VAM infection rate, especially at low P.
In general, nodulation was improved by P application, but varied among provenances. Gliricidia Sepium fixed about 61% of its N from atmospheric N2 in the pot experiment and 40% in the field. The percentage of N fixed was not affected by the rate of P application.
Differences in P and N accumulation and use efficiency were also influenced by management practices such as pruning. The distribution of total P followed the same trend as that of dry matter yield, while no significant correlations were found between partitioning of dry matter and total N. Uncut and cut G. Sepium derived 35 and 54% respectively of their N from atmospheric N2. About 54% of the fixed N2 was partitioned to shoots and roots and this was not proportional to the size of these organs relative the whole plant. 1
1. INTRODUCTIONExploiting genetic differences among trees which fix N2 can improve tree establishment and
growth on N-poor soils and preserve soil from degradation [1]. This is important for agroforestry systems, e.g., alley cropping AC) where trees such as G. sepium are used as a source of N for associated food crop or/and livestock because of their N2 fixing abilities [2,3]. However, N2 fixation
89
does not account for benefits in AC and not all the productive AC systems include N2-fixing hedgerow trees.
Non N2-fixing trees such as Senna siamea, S. spectabilis and Dactyladenia barteri (Acioa barteri) have been used in AC systems. For N2 fixing trees, N is a renewable resource while P is not. Sanginga et al. [4,5] have indicated a greater requirement of P for symbiotic N2-fixation than for growth of non-legume N2-fixing trees, such as Casuarina equisetifolia and legume N2-fixing trees, e g. Gliricidia sepium and Leucaena leucocephala, when soil P was low. Alley cropping, including both non-N2 and N2-fixing trees is similarly limited by P deficient conditions [6].
Low soil P and N are common in most sub-Saharan tropical soils and improved establishment and growth of leguminous trees used in agroforestry systems or in plantation might result from P and N additions to the soil. For economic reason, however, small-scale farmers using AC systems have limited access to P and N fertilizers, even for their main food crops like maize, rice and cassava. Under these circumstances, the selection of tree species or provenances with low P requirements and high N2 fixation would be beneficial. The objectives of this study were, to: (i) identify provenances of N2 fixing trees such as G. sepium, L. leucocephala and non-N2 fixing trees, e.g., S. siamea andS. spectabilis, efficient in P utilization for biomass production, (ii) determine principal physiological mechanisms of tolerance to low P (iii) examine the effect of P on biological N2 fixation and (iv) assess the effect of pruning management on the distribution and use efficiency of P within the different plant parts of N2 and non-N2 fixing trees grown in the field.
2. MATERIALS AND METHODS
Two experiments were conducted, one in a glasshouse at the International Institute of Tropical Agriculture (HTA) Ibadan using an Alfisol soil collected from Fashola and the other in the field at Fashola (savanna area, 70m North of IITA, Ibadan) in Southwestern Nigeria. The soil had the following characteristics: total N, 0.04%; extractable P (Bray I), 3.8 ug.g"1 soil; organic carbon,0.48%' pH, 6 (in H20); and > 103 Rhizobium cells g"1 soil.
2.1. Pot experimentAn earlier pot experiment [5] conducted in the greenhouse at the IAEA laboratories,
Seiberdorf, Austria examined growth 23 provenances of G. sepium under two P rates, (20 and 80 mg P kg-1 soil). The present experiment was designed to validate these results in Nigeria.
The pot experiment using Fashola soil was designed as a 4 x 5 factorial with 4 levels of P, 0, 20 40 and 80 mg P kg'1, designated P„, P,, P2 and P3, respectively. Five provenances selected from a previous experiment [5] included three N2-fixing G. sepium provenances, G, (13/86), G2(ILG55), G3(34/85) selected from the earlier pot experiment [5] and two non N2-fixing reference plants, Senna spectabilis and S. .siamea. The treatments were laid out in a randomized complete block design with four replications, yielding 96 experimental pots.
Seeds of S. spectabilis and S. siamea were scarified in concentrated H2S04 for 30 min., while those of G. sepium were surface sterilized with H202 for one minute. Seeds were then thoroughly rinsed in sterile water and planted two per pot. Inoculation was not performed since the soil contained effective Rhizobium strains (Sanginga, unpublished results).
Twenty milligrams of N kg"1 soil as 10 atom % N-15 excess ammonium sulphate was applied to all treatments 2 weeks after planting. Senna spectabilis is used as reference plants to calculate the percentage and amounts of N derived from atmospheric N2.
90

At harvest, 12 weeks after planting, the above-ground plant parts were cut at soil level, soil was gently washed from the roots and nodules were collected and counted. Root length measurements and mycorrhizal infection counts were performed on the fine fresh roots (5 1mm diameter). Fresh roots of all G. sepium provenances were evaluated for mycorrhizal infection using trypan blue in lactophenol. Percentage VAM colonization roots was estimated by the gridline intersect method observing 200 intersection points per sample [7], Stem plus shoots, roots and nodules were oven- dried separately for 72h at 70°C and weighed. The dried samples were ground to pass through a0.5mm sieve and analyzed for total N and atom % l5N on an automatic Nitrogen Analyser (1500 Carlo Erba) coupled to a SIRA mass 1 pedrometer [8] The isotope dilution equation [9] was used to calculate % and total N fixed, with S. siamea and S. spectabilis as reference plants. Total P in the difference. Plant parts was analysed using the vanadomolybdate yellow method [10].
The field study was conducted at Fashola over two growing season, beginning May 1990 to 1992. The experimental design was a 4 x 5 factorial with four P rates, 0,20,40 and 80 kg P ha'1 (as single super phosphate fertilizer) and five tree genotypes (consisting of three G. sepium provenances and two non N2-fixing reference plants S. siamea and S. spectabilis). The experiment was laid out as a split plot design with P levels as the main treatment and plant provenances as sub-treatments. Main plots measured 320 m2 and sub-plots 80 m2 with a row spacing of 2m and a planting distances of 1 m within rows. Twenty kg of N per ha as ammonium sulphate with 10 atom % 15N was applied to the four middle plants (40m2) in each treatment at thinning, 1 month after planting. The application of 20 kg ha"1 of labelled N was repeated after the first cut during the rainy season of May1991.
Soil and plant sampling was performed twice a year, at 6 months after planting (end of rainy season) and at the end of the dry season (6 months later) in 1991. This schedule was repeated in1992. At each sampling the above-ground plant material (leaves, stem, branches) and the belowground plant materials (roots and nodules) were harvested. Root length measurements and mycorrhizal infection counts were made as described above on fresh roots. The other plants parts were separated, chopped into 10 to 20 cm pieces and then oven-dried, weighed and ground for total N, total P, and atom % 15N analysis.
2.2 Statistical AnalysesA two-way analysis of variance was carried out for each provenance and P treatment
combination to determine main treatments and interaction effects. When a significant (P < 0.05) treatment effect was found, the least significant difference (LSD) was calculated in order to compare treatment means.
3. RESULTS AND DISCUSSION
3.1. Field validation of intraspecific variation in phosphorus use efficiency and nitrogenfixation by provenances of Gliricidia sepium grown in low P soilsResults presented in Fig. 1A show that at the low P level, large differences in growth
occurred among the G. sepium provenances; differences in P response were also noted at the higher P rate. Growth responses of the three provenances to increasing P levels were linear in the pot experiment but variable (linear and quadratic) in the field experiment. The results of the pot experiment were not therefore completely duplicated in the field experiments. This is not surprising considering the confinement of roots in pots. The modified approach proposed by Siddiqi and Glass [11] is based on calculating utilization efficiency in a way that takes into account various
91

Phosphorus level (kg P/ha)
FIG. 1. Phosphorus effects (A), and phosphorus requirements (B) of Gliricidia sepium provenances in low phosphorus soils.
92

morphological, physiological and biochemical, including genetic factors all of which are associated with the efficiency of nutrient utilization might probably be the non-appropriate for comparing the nutrient utilization efficiency differences between the genotypes and treatments. Field data show that the growth of one provenance (G,) did not respond to P application while provenance G3 required 80 kg P ha*1 to achieve maximum biomass. Provenance G2 responded to P application up to 40 kg P ha"1 and further addition of P depressed its growth, P uptake and N2 fixation.
Differences between G. sepiwn provenances in P uptake (Fig. IB) and growth (Fig. 1 A) were largely related to differences in physiological P use efficiency (PPUE) (Fig. 2A) and root length, especially at low P, both in the pot and field experiments. In general plants able to use absorbed P more efficiently for the production of biomass should be better adapted to low P soils (Sanginga et al. 1990).
0 GUrickfa ■ S. siamea 0 S. spectabilis800
0 20 40 80Phosphorus level (kg P/ha)
FIG. 2. Phosphorus use efficiency of Gliricidia sepium in low phosphorus soils (A), and the effects of different phosphorus rates on shoot dry matter yield (B).
93

The influence of mycorrhizal forming fungi on the P nutrition of the G. sepium provenances used in this study was evaluated. The field experiment data indicated that plants such as G„ which did not respond to P, had a relatively higher percentage of mycorrhizal infection than the responsive ones when P was not applied (Table I). However, no such trend was observed when P was applied. Some workers [12] have indicated that plants which develop an effective mycorrhizal association Sanginga, incomplete. However, as indicated above, provenance G, had inherently low yielding capacity despite a high mycorrhizal infection. Modulation was improved by P application, but this varied among provenances (Appendix Table XXIV). G. sepium fixed about 60 and 40% of its N from atmospheric N2 in pot and field, respectively (Table 2). The percentage of N fixed was increased by the low rate of P application 20 kg P ha"1, at high of rate P no further increase in % N fixed occurred, and a reduction in N2 fixed at high P rate occurred in provenances (G3). This indicates that although the P effect on plant growth is a major factor increasing N2 fixation, it is not the only factor. For example at low P levels, the requirement for the symbiotic system could be greater than for plant growth.
TABLE 1. EFFECTS OF DIFFERENT P RATES ON PHYSIOLOGICAL P USE EFFICIENCY (PPUE) OF GLIRICIDIA SEPIUM, SENNA SIAMEA AND SENNA SPECTABILIS AT 24 AND 48 WEEKS AFTER PLANTING IN THE FIELD AT FASHOLA
Rate of P (Kg P ha'1) application
Tree species 24 WAP 48 WAP
0 20 40 80 Mean 0 20 40 80 Mean
G. sepium 0.27 0.37 0.35 0.30 0.32 0.67 0.71 0.68 0.79 0.71
S. siamea 0.61 0.48 0.53 0.45 0.52 0.94 0.81 0.97 0.73 0.86S. spectabilis 0.58 0.47 0.37 0.43 0.46 0.63 0.72 0.72 0.72 0.76
LSD 5% 0.25 0,18
Physiological P use efficiency (PPUE) in g shoot mg ' P
TABLE 11. EFFECTS OF DIFFERENT P RATES ON THE PROPORTION AND AMOUNT OF N DERIVED FROM ATMOSPHERE OF GLIRICIDIA SEPIUM, SENNA SIAMEA AND SENNA SPECTABILIS AT 24 AND 48 WEEKS AFTER PLANTING IN THE FIELD AT FASHOLA
Rate of P application
Provenance Greenhouse (mg P kg ' soil) Field (kg ha"1)
0 20 40 80 Mean 0 20 40 80 Mean
% Ndfa
G, 65 65 65 67 66 20 55 45 47 42
G, 60 58 54 64 59 29 48 63 30 43
G, 46 60 64 64 59 35 47 48 31 41
Mean 57 61 61 65 28 50 52 36
LSD 5% 7 11N, fixed (mg plant"')
G, 276 233 318 423 313 660 1683 977 1664 1246
G, 258 278 228 298 266 1146 2890 4460 753 2312
G, 129 305 340 437 303 1358 2293 3336 1776 2191Mean 221 272 295 386 1055 2289 2924 1398LSD 5% 111 589
94

3.2. Comparative study on P and uptake and use efficiency between N, fixing and non-infixing leguminuous trees growing in low P soilsSignificant differences were observed between N2-fixing and non-N2-fixing trees in their
growth response to P application and these were influenced by the age of the plant (Fig. 2B). Growth of G. sepium responded to P application at both 24 and 48 weeks after planting (WAP) and an average yield increase of 81 % was produced by application of 40 kg P ha"1.Such P response was not found in S. siamea and S. spectabilis and establishment of these trees at early stage of growth was poor. G. sepium accumulated more P (on average 162) than S. siamea andS. spectabilis at 24 WAP and had more root length and higher percentage of mycorrhizal infection. At 48 WAP S. siamea had 2.5 times more P than G. sepium. Differences in the physiological P use efficiency (PPUE) between G. sepium and the non N2-fixing trees were significant (Table I); being higher for S. siamea (0.69 g shoot mg ') on average and low for G. sepium (0.52 g shoot mg"1 P). This correlated well with % P distribution in the shoots.
The ability to absorb P appeared to be more important than PPUE in enhancing growth of G. sepium while the reverse was true for S. siamea and S. spectabilis, G. sepium for biomass production. For instance, for 5. siamea, irrespective of the amount of P applied, about 92% of the amount of absorbed P was located in the tops, while G. sepium had an average of 82% in the same aboveground organs. Senna siamea and S. spectabilis had a higher top versus roots ratio (5.0) than G. sepium (1.4). The distribution of P between shoots and roots was not simply caused by the ratio of dry matter from shoots and roots and the linear relationship between the plant weight and P accumulated. In this case, P translocation and P-use efficiency influence dry-matter production, especially in S. siamea. One of the reasons for the lower PPUE of G. sepium could be the use of P for N2 fixation since a large proportion of P could be translocated to roots and nodules.
Total N accumulation correlated well with total plant dry matter (r =0.91;P <0.05). Gliricidia sepium had lower atom % 1SN at all levels of P application except at 80 kg P ha"1 and at 48 WAP where similar values with S. siamea were obtained. Gliricidia sepium fixed an average of 35% and 54% of its N at 24 and 48 WAP, respectively. Percentage and amount of N2 fixed were however, influenced by P rate (i.e. lower 20 kg P ha"1), and the reference plant. A higher variability of N2 fixed (CV>60% was obtained with S. siamea than with S. spectabilis (CV<20%).
3.3. Influence of cutting management on P and N distribution and use efficiency by N2-fixing and non N,-fixing trees used in alley cropping systemsCutting of hedgerow trees constitutes the most important management practice for a successful
alley cropping system. Phosphorus application did not influence the partitioning of total P or 15N uptake among the different plant parts of both N2 and non-N2 fixing trees. Cut plants distributed more biomass to stems (40%) than shoots (27%) while for uncut plants 27% and 39% were partitioned to stems and shoots, respectively. Different patterns of N and P distribution in relation to dry matter partitioning was shown. Distribution of total P followed the same trend as that of dry matter yield (r =0.88;P,0.05). This correlation indicated that the major factor determining P uptake and distribution appears to be the P demand of each organ or its ability to dilute out absorbed P throughout photosynthesis and growth.
Cut plants distributed about 130% more total P to branches and had higher P use efficiency than uncut plants (Appendix Table XXV). There were no significant correlations between partitioning of dry matter and total N. Shoots were the biggest storage of total N with the non-N2-fixing trees averaging 66% compared to 52% for G. sepium. Total N distribution in roots of G. sepium was
95

about twice that in S. siamea and S, spectabilis. The forms, origin (soil N, N2 fixation, and N reserves and utilation of N in the different plant organs are thought to cause some of the differences in N distribution and lack of relationships with dry matter distribution observed in this study. In contrast to total N distribution atom % l5N excess was similarly distributed in the different plant parts. 15N values of cut plants were lower but indicated translocation of 15N from shoots and roots to stems and branches. Uncut and cut G. sepiwn derived 35 and 54% respectively of their N from atmospheric N2. About 54% of fixed N2 was partitioned to shoots and roots and this was not attributed to the size of these organs in relation to others.
The roots and shoots of cut plants accumulated 54% of their total N from fixation; a similar pattern did not occur for N derived from fertilizer or soil. The greater partitioning of N from these different N sources in the roots was not attributed to the size of roots in relation to other plant parts. Estimates of N2 fixation in N2 fixing trees have mostly been based on the above-ground parts [13,14,15,], and thus exclude roots and nodules. This is based on the knowledge that most of the fixed N2 is translocated into fine stems and leaves [16,17]. As illustrated in the present study, due to differences in 1$N enrichment between roots and other plant parts, exclusion of the roots may give an unacceptably large error in N uptake and fixation especially after cutting treatment.
4. CONCLUSIONS
In conclusion, large differences were found among provenances in almost all the major growth parameters. One cultivar, G3, responded to P application. The most tolerant to low soil P of the three provenances used in this study, G2, gave more consistent satisfactory yields with or without P fertilization, and had a high N2 fixation potential. This cultivar should be ideal for soils deficient in the two major elements, N and P. Provenance G, was genetically a low yielding provenance and had a lower P requirement than G2 and G3. These results confirm the need to seriously consider the P requirements of plants account plant introduction, selection and breeding strategies.
ACKNOWLEDGEMENT
The authors gratefully acknowledge the technical assistance of Ms. Helga Axman and the staff of the Soil Science Unit, IAEA Seibersdorf Laboratory, Austria; Mr. James Oyedipe, and Ms. Oti Bajah NET project at IITA, Ibadan, Nigeria for their technical assistance. We thank Dr. J.L. Stewart of Oxfort Forestry Institute for providing G. sepium seeds of various provenances. We wish to thank Mrs Omolara Orowale for secretarial services.
REFERENCES
[1] DANSO, SKA, BOWEN, G.D., Sanginga, N., Biological nitrogen fixation in trees in agroecosystem. Plant Soil, 141 (1992) 177-196.
[2] KANG, B.T. GRIMME, H., LAWSON, T.L., Alley cropping sequentially cropped maize and cowpea with Leucaena on sandy soil in Southern Nigeria. Plant Soil, 85 (1985) 267-277.
[3] MULONGOY, K., VAN DER MEERSCH, M.K., N2 contribution by leucaena (L. leucocephala) prunnings to maize in an alley cropping system. Biol. Pert, of Soils, 6 (1988) 282-285.
96

[4] SANGINGA, N., BOWEN, G.D., DANSO, S.K.A., Nodulation and growth response of Allocasuarina and Casuarina species to P fertilisation. Plant Soil, 118 (1989) 125-132.
[5] SANGINGA, N., BOWEN, G.D., DANSO S.K.A., Intra-specific variation in growth and N2-fixation ofLeucaena leucocephala and Gliricidia sepium at low levels of soil P. Plant Soil, 133 (1991) 201-208.
[6] SANGINGA, N., DANSO, S K A., ZAPATA, F., BOWEN, G.D., Influence of prunning management on P and N distribution and use efficiency by N2 fixing and non-N2 fixing ties used in alley cropping systems. Plant and Soil 167(1994") 219-226.
[7] GIOVANNETTT, M., MOSSE, B., An evaluation of method for measuring vesicular-arbuscular infection in roots. New Phyt., 84 (1980) 489-500.
[8] AXMAN, H. Methodology of ISN determination. In: use of Nuclear Techniques in Studies of Soil-Plant Relationships. G. Hardarson (Editor) International Atomic Energy Agency (IAEA) Vienna. (1990) 55-59.
[9] FRIED, M., MIDDELBOE, V., Measurement of amount of N2-fixed by a legume crop. Plant Soil, 47 (1977) 713-715.
[10] ALLEN, S.A., Chemical analysis of ecological material. Blackwell Scientific Publication, Oxford, England (1974)
[11] SIDDIQI, M.Y., GLASS, A.D M., Utilization indes: A modified approach to the estimation and comparison of nutrient efficiency in plants, J. Plant Nutr. 4 (1981) 289-302.
[12] HABTE, M., MANJUNATH, A., Soil solution P status and mycorrhizal depency in L. leucocephala Applied Environ. Microbiol, (53) 4 (1987) 797-801.
[13] NDOYE, I., DREYFUS, B., N2 fixation by Sesbania rostrata and Sesbania sesban estimated using 15N and total N difference methods. Soil Biol. Biochem, 20 (1988) 209-213.
[14] SANGINGA, N., BOWEN, G.D., DANSO, S.K.A., Assessment of genetic variability for N2 fixation between and within provenances Leucaena leucocephala and Acacia albida estimated by the ISN labelling techniques. Plant soil, 127 (1990) 169-178.
[15] WOOMER, P , BAJAH, O., ATTA-KRAH, A. N., SANGINGA, N., Analysis and interpretation of Alley Cropping Farming Network data from Tropical Africa (AFNETA). Agroforestry System (1994).
[16] SANGINGA, N., DANSO, S.K.A., ZAPATA, F., BOWEN, G.D., Phosphorus requirements and nitrogen accumulation by N2 fixing and non-N2 fixing leguminous trees growing in low P sois Biol Fertility Soils 20 (1995) 205-211.
[17] SANGINGA, N., DANSO, SKA, ZAPATA, F., BOWEN, G.D., Field validation of intraspecific variationin phosphorus use efficiency and nitrogen fixation by provenances of Gliricidia sepium grown in low P soils. Applied Soil Ecology 1 (1994b) 127-138.
mxj PA«E(S) left BLA33K
97

TRACER METHODS TO QUANTIFY NUTRIENT UPTAKE FROM PLOUGH LAYER, SUB-SOIL AND FERTILIZER: IMPLICATIONS ON SUSTAINABLE NUTRIENT MANAGEMENT
E. HAAKDepartment of Radioecology,Swedish University of Agricultural Sciences, Uppsala, Sweden
XA9642764
Abstract
TRACER METHODS TO QUANTIFY NUTRIENT UPTAKE FROM PLOUGH LAYER, SUBSOIL AND FERTILIZER. IMPLICATIONS ON SUSTAINABLE NUTRIENT MANAGEMENT.
Two soil injection methods are presented. The first method consists of homogenously labelling the whole plough layer with carrier free tracers. This is done in two treatments, (1) a reference treatment without connection with the sub-soil and (2) an experimental treatment where the sub-soil is freely accessible for root penetration. The second method, which is now under development, consists of using isotope labelled fertilizers instead of carrier free tracers.
By application of the A-value concept it is possible to quantify (by the first method) the plant uptake of nutrients from plough layer and sub-soil, and from the second method, the uptake of nutrients from from the applied fertilizer. A fertilizer strategy for phosphorus is discussed based on data obtained from tracer experiments in the field, and soil survey of specific field sites..
1. INTRODUCTION
Developement of a field crop is strongly related to its rooting capacity in the soil profile. The rooting capacity is determined by genetic factors and their interaction with physical, chemical and biological factors in the soil. This is also dependent on nutrient uptake which vary with site and with crop ontogenesis. The extent to which roots are able to penetrate and utilize different soil layers for nutrient uptake is also affected by management practices such as fertilization and preparation of the field site.
Information on rooting in the soil profile can indirectly be obtained by determining soil water content at different depths or by the use of tracers. The use of tracers can also provide information on nutrient uptake from different soil layers. Thus, according to the A-value concept [1] and its extension [2], the plant will absorb nutrients from different sources (soil or applied labelled fertilizer) in direct proportion to the amounts available.
The tracer, either radioactive or stable, can either be injected into the plant and assayed in the soil [3] or be injected into the soil and assayed in the plant [4,5]. Two methods based on the latter procedure will be discussed here. The aim is to quantify nutrient uptake from the different nutrient sources available in the soil profile and use this data to formulate sustainable nutrient management practices.
2. METHODS AND MATERIALS
The first method consists of homogenously contaminating the plough layer with carrier-free tracers in two treatments prior to seeding a crop. This is done in a reference treatment without connection with subs-oil and in an experimental treatment where the under lying sub-soil is freely accessible for rooting and nutrient uptake as shown in Figs. 1 and 2.
99

S„ s ra+a
M
A
FIG. 1. Plough layer (M) and the sub-soil (A) in reference (SJ and experimental treatments (Sm+J
Sm+g sm+g+a
M + G M + G
A
FIG. 2. Plough layer + fertilizer layer (M+G) and the sub-soil in reference (Sm+g) and experimental treatments (Sm+g+J
100

Specific activities or isotope ratios are determined for the crop in both treatments. Based on the inverse isotope dilution principle and as derived from the A-value concept [1] or from the fractional utilization ratio [6], the integrated mineral uptake values can be calculated as M(%) from plough layer, A(%) from sub-soil in percentages as well as in kg per hectare (M refers to plough layer and A to sub-soil). This relationship is shown in equations la, lb, 2a and 2b below.
M(%)
A (%)
‘-'ra+a100------
Sm
Sm+a
100 (1 —------)Sm
(la) ;
(2a) ;
M NYS ro+a
sm
A = NY (1
(lb)
(2b)
where Sm and S.+, are specfic activities or isotope ratios in plant samples taken in the reference treatment (left) and in the experimental treatment (right) respectively (Fig. 1). NY is the nutrient yield in the latter treatment.
The second method is a new version or an extension of the first one. In analogy, it consists of homogenously labelling the plough layer. In this case labelled fertilizers are used. They areapplied in a reference treatment without connection with the sub-soil and in an experimental treatment where the sub-soil is available for rooting and nutrient uptake. In this case we also must know or determine the initial specific activity or istope ratio of the labeled nutrient in the applied fertilizer.
As before, specific activities or isotope ratios are determined in the crop for both treatments (Fig. 2). Again, based on the inverse isotope dilution equation derived from the A-value concept [2,7], or the fractional utilization ratio [6], the integrated nutrient uptake values can be calculated as M(%) and G(%), both from the plough layer, and A(%) from the sub-soil. If we know or determine NY, we can calculate also the nutrient uptake in kg per hectare, as M, G and A. (M refers to plough layer, G to fertilizer and A to sub-soil). These relationships are shown in equations 3a, 3b, 4a, 4b, 5a, 5b, 6a and 5b below.
M +
c*"^m+g+a
G(%) — 100 ----------- (3a) ; Mc^m+g+a
+ G — NY ----------- (3b)Sm+g Sm+g
A (%)
c■BHflH-a
— 100 (1 —----------- ) (4 a) ; A = NY (1 -
6nrtg+a
(4b)Sm Sn+g
G (%)
Sg^g+a
= 100 —-------- (5a) ;
q‘“'m+g+a
G — NY------------ (5b)Sm S„
M (%)
Sjn+tj+a S^+g+a
— 100 (——— —------- (6a) ;
q•^m+g+a
M = NY------------
qljra+g+a
(6b)Sm+g Sg Sm+g Sg
101
where Sg is the initial specific activity or isotope ratio in the fertilizer and Sg+m and Sg+m+, are the final specific activities or isotope ratios in plant samples taken in the reference treatment and in the experimental treatment respectively. NY is as before the nutrient yield in the latter treatment.
3. DISCUSSION
Under field conditions soil moisture content and the soil structure largely determine the depth of the root system and branching of lateral roots. Supply of nutrients interact in a complex manner. There is no direct correlation between root distribution, root length or root weight and nutrient uptake, since the efficiency of uptake varies with root number, age and fineness. The concealment of roots by the soil makes root measurements a laborious task. Tracer methods can to some extent overcome this situation, and as shown, simultaneously quantify the nutrient uptake from different soil layers.
The first tracer method, a carrier free method, has been extensively used in researh to quantify the uptake of Ca, P and K from plough layer and sub-soil in Sweden [4,8] and for P and K uptake studies in Germany [5]. The radioactive nuclides “Sr, 32P and “Rb have been used as tracers for Ca, P and K, respectivly. As 32P, and “Rb have nearly the same half-life and beta decay energy, the stable nuclide of Rb is often used instead of “Rb. In this way, the beta-decaying 3ZP as tracer for P, the stable Rb as tracer for K and the gamma decaying “Sr as tracer for Ca, can be conveniently used in the same experimental set-up. As shown by Haak [4], the uptake of Ca from plough layer and subs-oil is apparently related to water uptake in the soil profile.
The investigations with cereals [4,5] thus give data on percentage and absolute utilization of the plough layer and sub-soil as nutrient sources for Ca, P and K based on the A-value concept [1,2]. Results obtained from the present studies indicate the value of optimizing root developement in the soil profile and the value of cultivation measures such as early sowing and selection of deep rooted cultivars to increase nutrient and water uptake from the sub-soil.
As reported in previous studies [4,8], early root penetration of the plough layer provides a later extensive root bioactivity in the sub-soil which enhances shoot developement. Increased photosynthesis and shoot developement are by themselves driving forces to use distant sources of water and nutrients in the sub-soil which certainly have economical and ecological consequences. Root bioactivity in the subsoil contributes considerably to crop uptake of P and K [4] and decreases leaching of N [5],
In the field situation, we must know or be able to estimate, the root depth and intensity in the soil profile. Minimum requirement for this would be a knowledge of the organic matter content, soil texture, and the status with respect to lime etc. in both plough layer and in the sub-soil. Most of these data can be obtained from a survey of soil in the specific field. As regards plant nutrients are concerned, the content of available nutrients in both layers must be determined.
The basic strategy of sustainable nutrient management is to attain and maintain an optimal nutrient level in the plough layer. In the field situation this can be achieved by optimal fertilization of the crops grown in the rotation. In Table I, an approach is illustrated for P fertilization of field crops based on data obtained from soil surveys and tracer experiments [9],
The columns to the left in this table shows the classes of easily soluble phosphorus for the plough layer and the sub-soil respectively. The P-AL-values are based on the ammonium-lactate method [10]. The classses of P-AL correspond to <2, 2-4, 4-8, 8-16 and > 16 mg P per 100 g soil in class I, II III, IV and V respectively according to the agricultural soil survey system in Sweden. To obtain the P fertilizer rate, the factors listed in Table I should be multiplied by the calculated P removal by the target crop, i.e. dry weight times P concentration. As can be seen, the factors in Table I vary with root intensity and root depth. In the practical situation, this is an attemp to answer the farmer’s two most pertinent questions: Should field be fertilized with more, equal or less of P than the amount removed by the predicted yield of the crop at harvesting; and also can one maintain an optimum P fertility level in the soil in the long term. The second question is of course the most difficult one to answere. A logical approach is a fresh soil survey of the plough layer only, say, prior
102

TABLE I. ROOT INTENSITY, ROOT DEPTH (cm) AND P-AL CLASSES IN THE PLOUGH LAYER AND SUB-SOIL RELATED TO P-FERTILIZATION
P-ALclass
P-ALclass
Low root intensity High root intensityploughlayer
sub-soil60 90 120 60 90 120
V V 0.1 oo oo 0.0 0.0 o o
IV 0.3 0.2 0.1 0.2 0.0 0.0III 0.5 0.4 0.3 0.4 0.2 0.0II 0.7 0.6 0.5 0.6 0.4 0.2I 0.9 0.8 0.7 0.8 0.6 0.4
IV V 0.6 0.5 0.4 ‘ 0.5 0.3 0.1IV 0.8 0.7 0.6 0.7 0.5 0.3
III 1.0 0.9 0.8 0.9 0.7 0.5II 1.2 1.1 1.0 1.1 0.9 0.7I 1.4 1.3 1.2 1.3 1.1 0.9
III V 1.1 1.0 0.9 1.0 0.8 0.6IV 1.3 1.2 1.1 1.2 1.0 0.8
III 1.5 1.4 1.3 1.4 1.2 1.0II 1.7 1.6 1.5 1.6 1.4 1.2I 1.9 1.8 1.7 1.8 1.6 1.4
II V 1.6 1.5 1.4 1.5 1.3 1.1IV 1.8 1.7 1.6 1.7 1.5 1.3
III 2.0 1.9 1.8 1.9 1.7 1.5II 2.2 2.1 2.0 2.1 1.9 1.7I 2.4 2.3 2.2 2.3 2.1 1.9
I V 2.1 2.0 1.9 2.0 1.8 1.6IV 2.3 2.2 2.1 2.2 2.0 1.8
III 2.5 2.4 2.3 2.4 2.2 2.0II 2.7 2.6 2.5 2.6 2.4 2.2I 2.9 2.8 2.7 2.8 2.6 2.4
to cultivating the most P responsive crop in next crop rotation. This provides a check to be made, which, if necessary, can be repeated regularly in the future. The determination of the fraction of P recovered from the last fertilizer addition (by the tracer method) will also be helpful in choosing the optimum P fertilization rate.
A similar approach has been worked out with K fertilization under Swedish field conditions, in this case taking into consideration both the content of easily soluble potassium, K-AL, and the content of slightly soluble potassium, K-HC1, in plough layer and in the sub-soil. Different K fertilization regimes are recommended based on the ratio between K-HC1 and the clay content in different parts of Sweden [7],
103

REFERENCES
[1] FRIED, M., DEAN, L. A., A concept concerning the measu-rement of available soil nutrients, Soil Sci. 73 (1952) 263-271.
[2] FRIED, M., MIDDLEBOE, V., Measurement of amount of nitrogen fixed by a legume crop, Plant and Soil 47 (1977) 713-715.
[3] MASCANZONI, D., Field equipment for determination of radioactivity in plant-root studies, Int. J. Radial. Isot. 36 (1970) 925-929.
[4] HAAK, E., Studier av str&sads rotutveckling och mineral-amnesupptag (Studies on cereal root developement and mineral uptake in Swedish), Dept, of Radioecology, SUAS, Uppsala, IRB Report (1978) 44-46.
[5] ZAPATA, F., Isotope techniques in soil fertility and plant nutrition studies, Use of nuclear techniques in studies of soil-plant relationships (Hardaraon, G., Ed ), IAEA (1990) Vienna, Austria.
[6] HAAK, E., Rotens morfology och fysiologi i relation till alvens funktion, (Root morphology and physiology in relation to the function of subsoil, [in Swedish]). K Skogs-o. Lantbr. akad. Tidskr 133, 5 (1994) 9-23.
[7] EGN6r, H., RIEHM, H , DOMINGO, W.R., Untersuchungen ber die chemische Grundlage fur die Beurteilung des Nahr-stoffzustandes der Boden, II. Chemische Extraktionsmethoden zur Phosphor- und Kaliumbestimmung, Ann. Agr. Coll., Sweden 26 (1960) 199-215.
104

Part II
WATER USE EFFICIENCY STUDIES
MEXTleft BLAMK
PH55H3FSTF5
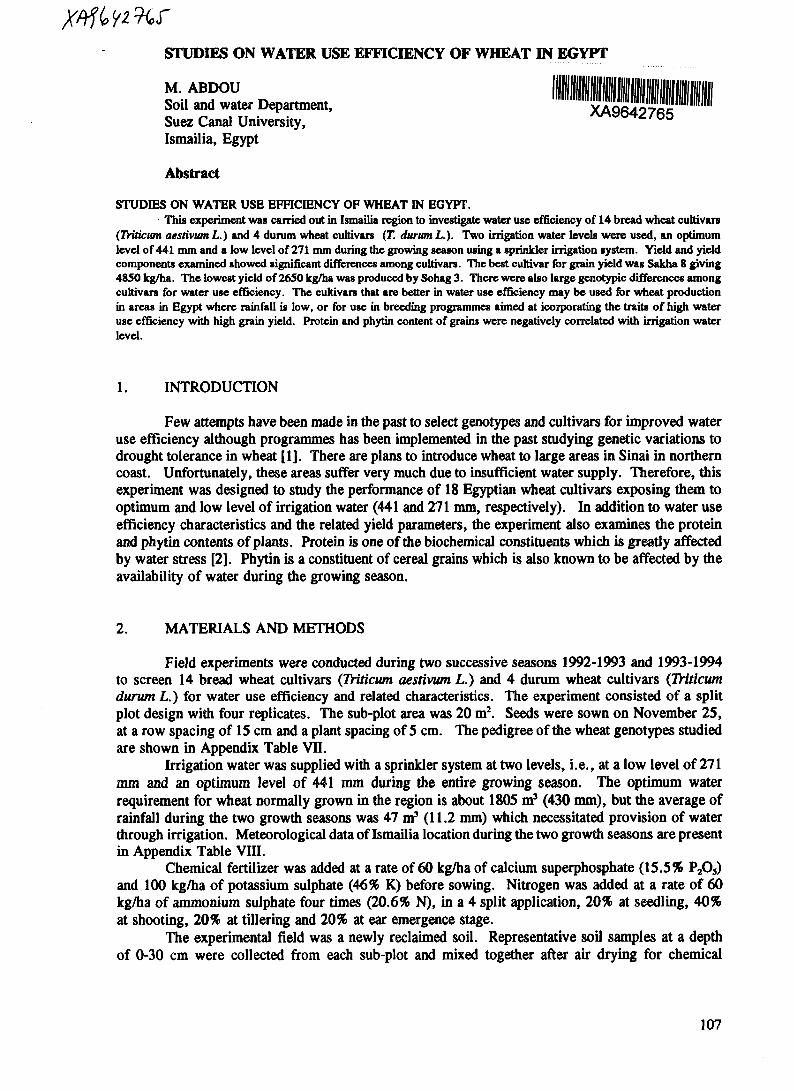
STUDIES ON WATER USE EFFICIENCY OF WHEAT IN EGYPT
M. ABDOUSoil and water Department, Suez Canal University, Ismailia, Egypt
XA9642765
Abstract
STUDIES ON WATER USE EFFICIENCY OF WHEAT IN EGYPT.This experiment was carried out in Ismailia region to investigate water use efficiency of 14 bread wheat cultivars
(Triticum aestivum L.) and 4 durum wheat cultivars (T. durum L.). Two irrigation water levels were used, an optimum level of 441 mm and a low level of 271 mm during the growing season using a sprinkler irrigation system. Yield and yield components examined showed significant differences among cultivars. The best cultivar for grain yield was Sakha 8 giving 4850 kg/ha. The lowest yield of2650 kg/ha was produced by Sohag 3. There were also large genotypic differences among cultivars for water use efficiency. The cultivars that are better in water use efficiency may be used for wheat production in areas in Egypt where rainfall is low, or for use in breeding programmes aimed at icorporating the traits of high water use efficiency with high grain yield. Protein and phytin content of grains were negatively correlated with irrigation water level.
1. INTRODUCTION
Few attempts have been made in the past to select genotypes and cultivars for improved water use efficiency although programmes has been implemented in die past studying genetic variations to drought tolerance in wheat [1], There are plans to introduce wheat to large areas in Sinai in northern coast. Unfortunately, these areas suffer very much due to insufficient water supply. Therefore, this experiment was designed to study the performance of 18 Egyptian wheat cultivars exposing them to optimum and low level of irrigation water (441 and 271 mm, respectively). In addition to water use efficiency characteristics and the related yield parameters, the experiment also examines the protein and phytin contents of plants. Protein is one of the biochemical constituents which is greatly affected by water stress [2]. Phytin is a constituent of cereal grains which is also known to be affected by the availability of water during the growing season.
2. MATERIALS AND METHODS
Field experiments were conducted during two successive seasons 1992-1993 and 1993-1994 to screen 14 bread wheat cultivars (Triticum aestivum L.) and 4 durum wheat cultivars (Triticum durum L.) for water use efficiency and related characteristics. The experiment consisted of a split plot design with four replicates. The sub-plot area was 20 m2. Seeds were sown on November 25, at a row spacing of 15 cm and a plant spacing of 5 cm. The pedigree of the wheat genotypes studied are shown in Appendix Table VII.
Irrigation water was supplied with a sprinkler system at two levels, i.e., at a low level of 271 mm and an optimum level of 441 mm during the entire growing season. The optimum water requirement for wheat normally grown in the region is about 1805 m3 (430 mm), but the average of rainfall during the two growth seasons was 47 m3 (11.2 mm) which necessitated provision of water through irrigation. Meteorological data of Ismailia location during the two growth seasons are present in Appendix Table VIII.
Chemical fertilizer was added at a rate of 60 kg/ha of calcium superphosphate (15.5% P203) and 100 kg/ha of potassium sulphate (46% K) before sowing. Nitrogen was added at a rate of 60 kg/ha of ammonium sulphate four times (20.6% N), in a 4 split application, 20% at seedling, 40% at shooting, 20% at tillering and 20% at ear emergence stage.
The experimental field was a newly reclaimed soil. Representative soil samples at a depth of 0-30 cm were collected from each sub-plot and mixed together after air drying for chemical
107

analysis. Soil chemical characteristics were determined in the saturated soil paste as described in the US Department of Agriculture handbook [3]. Potassium and sodium were determined by a flame photometry and calcium bt atomic absorption spectrometry. Total soluble salts were determined by measuring the electrical conductivity of the saturated water extract (ECe), and total carbonate was estimated volumetrically by means of Collin’s calcimeter and calculated as calcium carbonate (Appendix Table I).
Plants were harvested at physiological maturity and the yield and yield components (grain yield, straw yield/ha., number of spike/m2, number of grains/spike and 1000 grain weightwere determined ). Flour from milled grains was used for chemical analysis. Protein content was calculated by multiplying the total nitrogen by a factor of 5.7. Phytin content was determined according to Haug and Lantzsch [4], Changes in the soil water status within the plant rooting zone during the growing season was recorded using a neutron probe. The water balance approach was used to estimate the crop water consumption of wheat cultivars. The water use efficiency (WUE) was calculated according to the following equation of Israelsen and Hansen [5].
WUE - grain yield (kg/ha)/water consumptive use (mm/ha)
3. RESULTS AND DISCUSSION
Results in Table I show significant differences among genotypes for parameters studied. There was wide genotypic variation in biomass production and grain yield. This ranged from 5715 kg/ ha for Beniswef 1 to 9395 kg/ha for Sakha 8 and Sakha 61. Similarly, the grain yield ranged from 2650 kg/ha for Sohag 3 and to 4850 kg/ha for Sakha 8. However, these same cultivars did not end up producing the lowest and the highest amounts of straw. The lowest yield of straw (2725 kg/ha) was produced by Beniswef 1 while the highest yield (5255 kg/ha) was produced by Sakha 61.
The number of grains per spike also greatly varied among the cultivars. This was 45.3 for Sakha 3 and 18.3 for Sohag 3. Also, Table I shows that the average number of spikes per m2 for Sakha 61 and Sakha 8 was high being 213 and 238 respectively compared to 119 and 151 for Giza 156 and Beniswef 1. These data are in agreement with those of Henckel [6] and Abd El-Rahman [7] who showed similar variations in the number of spikes per m2 in different varieties of wheat.
The cultivars also differed significantly in their protein content. This was high in some cultivars as Giza 158, Sohag 3 and Beniswef 1, whereas it was low in Sakha 61 and Sakha 69, as shown in Table I. Significant differences among cultivars in protein content have been reported by Bassisuny [8] and Ramadan [9]. The protein content is negatively correlated with grain yield, a trend that is in agreement with those reported by Gaffer [10]. Table I also shows significant differences between cultivars in the phytin content. Gemmiza 1 contains the highest (4.02) phytin content whereas Giza 156 was the lowest (2%) in phytin content.
As shown in Table I and Fig. 1, there were significant differences among cultivars for water use efficiency. This ranged from 14 kg/ha for Sakha 8 to 7.75 kg/ha for Giza 158 (Appendix Table 9).
Table X in the Appendix shows the responses of wheat in terms of yield, yield components, protein content, phytin concentration of grains, and water use efficiency at the two irrigation water levels. Grain yield was significantly decreased at the low irrigation water level (271 mm) but the number of grains/spike was not affected. The protein content and the phytin content of grains, and the water use efficiency were increased at the low level of irrigation water. These results show that response to irrigation water level differed depending on the cultivar. Based on these data, Sakha 8 and Sakha 61 were the best cultivar for wheat production at the low level of irrigation of 271 mm water, in terms of water use efficiency. With respect to grain yield under low level of irrigation, cultivars can be divided into three groups: (1) tolerant cultivars (Sakha 8, Sakha 61, Sakha 69, Gemmeiza 1, Giza 155, Giza 160, Giza 164, Giza 157 and Giza 165) producing more than 3500 kg/ha, (2) moderately tolerant cultivars (Giza 156, Sakha 92, Sohag 1, Sohag 2, Sohag 3 and Beniswef 1) producing 2500-3500 kg/ha and (3) non-tolerant cultivars (Giza 158 and Giza 163) which are capable of producing only less than 2500 kg/ha. In conclusion, considerable wheat production can be achieved at low level of irrigation provide appropriate cultivars are selected.
108

Wat
er u
se ef
ficie
ncy (
kg/m
m)
20
4 7 2 3 18 17 6 16 15 13 1 12 5 8 14 11 9 10Wheat cultivars
S FIG. 1. Genotypic differences in water use efficiency of 18 wheat cultivars grown in the field at low irrigation water level (271 mm).

TABLE I. COMPARISON OF RESPONSES OF WHEAT CULTIVARS TO THE TWO IRRIGATION REGIMES
Cultivar Treatment Grain yield kg/ha
Straw yield kg/ha
1000grains per
spike
No. of grains per
spikes
No. of spikes per
m2
Total biomas s kg/ha
Protien%
Phytin%
WUEkg/mm
Giza 155 W1 3510 4440 45.9 37.8 163 7980 12.09 3.34 13.20W2 3660 6010 50.3 38.3 180 9670 11.39 3.35 8.30
Giza 156 W1 2660 3210 40.0 35.8 114 5670 11.58 1.76 9.30W2 3280 3250 40.7 36.1 124 6530 11.01 2.24 7.#
Giza 157 W1 2540 3600 42.1 34.0 142 61# 12 09 3.16 9.50W2 3260 5420 47.0 36.5 223 8690 10.83 3.25 7#
Giza 158 W1 2140 2380 51.4 34.0 134 4520 11.90 2.66 8.10W2 3260 4080 52.9 38.3 184 73# 15.38 2.68 7.#
Giza 160 W1 3920 2980 49.0 43.0 168 6900 11.83 3.43 14.30W2 4560 5050 55.0 45.8 236 9610 9.13 1.75 10.30
Giza 162 W1 3200 3990 41.0 29.2 134 7190 12.33 3.80 11.10W2 4000 4190 41.8 29.5 159 8190 7.77 2.42 9.10
Giza 163 W1 2260 3840 48.0 33.3 170 6100 10.51 4.02 8.70W2 4900 4630 48.0 39.5 262 9530 12.32 2.29 11.10
Giza 164 W1 3520 4460 50.0 38.0 171 7980 11.47 2.80 14.40W2 4500 4980 51.0 39.8 230 9480 10.34 3.87 10.2
Giza 165 W1 3740 4190 47.8 21.3 184 7930 11.99 3.87 15.30W2 4160 4620 48.0 17.9 241 8780 9.38 2.12 9#
W1 = 271 mm irrigation water supply; W2 = 441 mm irrigation water supply

Sakha 8 W1 4420 4060 47.2 44.3 196 8480 11.71 3.12 16.00W2 5280 5030 42.1 46.3 231 10310 8.28 2.72 12.00
Sakha 61 W1 4060 4920 54.4 32.0 205 8980 9.47 4.12 15.00W2 4220 5590 54.5 33.0 272 9810 7.22 2.82 9.57
Sakha 69 W1 3780 3230 55.6 36.5 196 7010 10.56 4.00 14.10W2 4180 4810 55.7 37.5 230 8990 8.56 2.61 9.50
Sakha 92 W1 3320 4810 36.7 26.9 167 7510 11.65 3.10 12.10W2 4780 3730 38.8 24.9 261 8510 10.61 2.34 10.80
Gemmeiza 1 W1 3840 3530 52.1 21.8 163 6770 12.49 4.08 14.60W2 4100 4480 54.5 16.1 235 8580 9.96 3.46 9.30
Sohag 1 W1 3000 3630 36.2 34.5 142 6630 11.93 3.33 11.90W2 4220 3610 65.0 36.0 205 7830 8.61 2.12 9.60
Sohag 2 W1 3080 4630 52.2 44.5 179 7710 12.34 3.70 11.20W2 3900 5590 52.1 45.0 200 9590 9.22 3.53 8.80
Sohag 3 W1 2700 4830 46.1 18.1 156 7530 13.48 2.69 10.70W2 2600 6390 47.6 18.5 176 8990 11.82 2.69 5.90
Beniswef 1 W1 2840 2620 56.1 42.5 127 5460 12.91 2.85 10.13W2 3140 2830 58.2 44.3 175 5970 13.29 3.53 7.10
L.S.D.5%
1824.0 975.8 5.93 10.18 92.9 827.32 1.95 0.81 0.16
W1 = 271 mm irrigation water supply; W2 = 441 mm irrigation water supply

REFERENCES
[1] HENCKEL, P A 1964. Physiology of plants under drought Ann. Rev. Plant Physiol, 16 (1964) 363-386.[2] ANGHINONI, I., BARBER, S.A., 1980. Phosphorus application rate and distribution on the soil and phosphorus
uptake by com. Soil Sci. Soc. Amer. J., 44 (1980) 1041-1044.[3] United States Salinity Laboratory Staff, Diagnosis and improvement of saline and alkali soils. U S. Dept. Agr.
Handb. 60, U S. Govt. Printing Office, Washington, D C. (1989) 160.[4] OBERLEAS, D., M E. MUHRER, B.L., O’DELL, B.L., KINTER, D.L., 1961. Effect of phytic acid on zinc
availability in rats and swine. T. Anima Sci. 20 (1961) 945.[5] Reinhold, J.G., Nasr, K., Lahimgarzadeh, A., Hedayati, H., Effect of purified phytate and phytate-rich bread
upon metabolism of zinc, calcium, phosphorus and nitrogen in man, Lancet 1 (1973) 283-291.[6] PEARSON, R.W., Significance of rooting pattern to crop production and some problems of root research, In
The plant root and its environment, University Press of Virginia, Charlottesville, (Carson, E.W., Ed.) 247-270.[7] ABD EL RAHMAN, A.A., SHALABY, A.F., MONAYER, M.O., 1973. Effect of moisture stress of plants.
Phyton, Austria 15 (1973) 67-86.[8] BASSIOUNY, A.H.M., Studies on yield potentiality in wheat. Ph D. Thesis, Fac. of Agric.
Zagazig Univ. (1985).[9] RAMADAN, R.A.R., Evaluation of some local and introduced wheat genotypes under
different environments, M. Sc. Thesis, Fac. of Agric. Suez Canal Univ. (1994).[10] GAAFAR, E.M., Biochemical studies on drought in some plants. Ph. D. Thesis, Fac. of
Agric. Zagazig Univ. (1990).
112

STUDIES ON 13C ISOTOPE DISCRIMINATION FOR IDENTIFYING TREE PROVENANCES EFFICIENT IN WATER USE UNDER WATER DEFICIT CONDITIONS IN KENYA
D O. NYAMAI, P.O. JUMA Agroforestry Research Programme, Kenya Forestry Research Institute, Nairobi, Kenya
XA964276
Abstract
STUDIES ON 13C ISOTOPE DISCRIMINATION FOR IDENTIFYING TREE PROVENANCES EFFICIENT IN WATER USE UNDER WATER DEFICIT CONDITIONS IN KENYA.
Screening for drought resistance traits was conducted in a semi-arid site in Machakos using 11 provenances of Acacia tortiUs, 6 provenances of Prosopisjuliflora and 4 provenances of Casuarina equisetifolia. Tolerance to drought was assessed by the 13C isotope discrimination (a) technique as well as by determining the water use efficiency (WUE). Measurements of dry matter and early growth performance were also taken as indicators of drought resistance. The results showed significant differences in the l3C Isotope discrimination, water use efficiency and dry matter yields by the different provenances tested. Generally, the results indicated that there were significant linear negative relationships between 13C discrimination with water use efficiency as well as dry matter yield. The results further showed highly significant positive relationship between dry matter yield and water use efficiency. Acacia tortitis provenances from middle East and neighbouring North Eastern Africa region appear to possess the greatest abilities for drought resistance in comparison with those from sub-saharan Africa as indicated by their l3C Isotope discrimination levels, dry matter yield and water use efficiency. However, Acacia provenance from Israel had the highest drought resistance trait. Prosopis provenance from Costa Rica and Casuarina from Dakar region in Senegal also emerged as the best provenances in terms of drought tolerance as shown by the l3C isotope discrimination and dry matter traits.
1. INTRODUCTION
Acacia tortilis, Prosopis juliflora and Casuarina equisetifolia are among the important multipurpose trees and shrubs in arid lands in the tropics which are often integrated with crops and pastures in agroforestry systems. Owing to the limited available moisture in semi-arid and arid environments, the growth and productivity of these species are generally limited. Use of supplementary irrigation is not feasible for the resource-poor farmers who live in these environments. Part of the solution to this problem would be to identify provenances that are drought tolerant as well as having low demand on soil nutrients. The following criteria were crucial in the choice for the above species: proven ability to grow in arid lands, a wide ecological range, N2-fixation ability, possession of adequate sizes of population and significant genetic variation within the species and between the provenances. However, there is a gap in our knowledge regarding important traits that consitutes a screening criteria. Most of the conventional physiological parameters which depicts plant - water relationships are based on a particular time reaction and therefore does not take into consideration the entire plant metabolic processes during the growth cycle [1],
More recently, the proportion of 13C in a plant has been indicated to have a relationship with its water use efficiency. The differential uptake of 13C isotope during fixation of carbon dioxide in plants, particularly C-3 plants has been investigated by [2] among others. For instance, in a pot study, it has been found that under conditions where water is not limited, water use efficiency (WUE) is negatively correlated with 13C discrimination (a) for a number of crops belonging to the C-3
113

metabolic group [3, 4 & 5], Further studies have also established that the relationship between dry matter production and 13C discrimination is variable depending on the type of the plant [6]. These investigations do suggest that l3C discrimination can be adopted as a screening criteria for genotypes/provenances that possess traits for water use efficiency and higher yields. Although the criteria of 13C discrimination appear to suggest that there is a relationship with WUE and dry matter production, it is yet to be widely tested with trees and shrubs that thrives in arid lands for genetic selection for superior genotypes. The objective of the present study, therefore was to evaluate the suitability of this criteria to screen a few drought adapted trees in the semi-arid area of Machakos District in Kenya.
2. MATERIALS AND METHODS
2.1. Experimental siteThe experiment was carried out in the field at the Kenya National Dryland Farming Research
Centre (NDFRC) farm in Mamba, Katumani, Machakos. Machakos is situated at an altitude of 1590 m, MO'S and 37° 14’E. The mean annual rainfall ranges from 500-800mm. It is bimodally distributed resulting in two distinct seasons; colloquially termed "long rains" and "short rains". The long rains last from October to December, while the short rains starts from April to June. The temperatures range from 16°C to 30°C and the average potential evapotranspiration rate is 1900mm/year. The annual relative humidity ranges from 30-85%. Soils are classified as Ferralsols and chronic Luvisols [7], The site has a slope of 8-10%.
Prior to the commencement of the field experiment, the Katumani site was previously under food crops, which alternated with pasture grass although the reports indicate that no previous records are available concerning crop and pasture management. The original vegetation before the introduction of pasture and food crops was mainly savannah-bushland with Acacia spp as the dominant tree vegetation.
2.2. Preparatory operations to the field experimentAcacia and Prosopis tree seeds were obtained from Oxford Forestry Institute in the U.K.,
while Casuarina equisetifolia seeds were provided by the Center Technique Forester Tropical (CTFT) in France.
The experimental site was cleared by hand and then ploughed and harrowed, staking and pitting in preparation for planting the trees followed shortly after. The seedlings were raised in the nursery for approximately four months prior to planting out in the field. The seedlings were ready for planting by the onset of rains at the beginning of November 1990. The Acacia and Prosopis seedlings were inoculated with a multistrain Rhizobium inoculant prepared by the Microbiological Research Centre (MIRCEN), Nairobi while Casuarina seedlings were inoculated with Frankia strain which was provided with the seeds from Center Technique Forestier Tropical (CTFC) France.
Soil chemical analyses were determined only for purposes of site characterization as reported in Table I by taking composite samples from 0-30cm deep using a soil auger. The samples were mixed thoroughly, dried, ground and sieved, before a representative sample was taken for chemical analysis. The seeds were germinated in trays pricked out and planted in the tubes before planting out in the field.
114

TABLE I. CHARACTERIZATION OF SOIL FROM KATUMANI SITE
Parameter Quantity
pH 5.8 ±0.1
Total N (%) 0.1 ±0.01
Organic C 1.5 ±0.5
Available P (ppm) 5.2 ±1.0
Exchangeable K (ppm) 10.2 ±1.2
Exchangeable Ca (ppm) 11.9 ±1.2
Exchangeable Na (ppm) 1.6 ±0.5
Exchangeable Mg (ppm) 3.5 ±1.2
2.3. Experimental design and sampling techniquesThe experiment was laid out in a Randomized Complete Block Design (RCBD). The studied
genotypes comprised, 21 provenances of Acacia, 6 provenances of Prosopis and 4 provenances of Casuarina spp (Table II) and were replicated three times. The size for each sub-plot was 3m x 3m, on which 18 seedlings were spaced at lm x lm. The plots were separated from each other at a distance of 1.5m. The total experimental area was 1260m2.
Access tubes for the neutron moisture gauge (CPN model) were installed in the sub-plots to monitor regularly the changes in soil moisture status within the plant rooting zone for a period of 18 months which constituted assessment at juvenile growth period. The water balance method was used to estimate the total water consumption of the different tree provenances.
The experiment was harvested 18 months after planting in which dry matter yield was determined by destructive sampling followed by drying in a ventilated oven at 80°C for 24 hours. General growth and phonological characteristics i.e height, root collar diameter and canopy radius were recorded 9 months after planting to determine juvenile growth performance of the different species and provenances. Total height and canopy radius were measured to the nearest centimetre (cm) while root collar diameter was recorded in millimetres (mm). Unless indicated otherwise, six randomly selected plants (approx. 25% of the population) in each sub-plot (provenances) were used for the assessment. Plant samples were analysed for 13C/12C ratios at the Waikato Stable Isotope Unit, University of Waikato, Hamilton, New Zealand. The A13C-discrimination was calculated from the measurements of the difference in carbon isotope ratio of the air and that of the plant material [8] taking the ratio of the air as -7.6% on the PBD.
Foliar samples were taken at 18 months after planting for the determination of a13C isotope determination. The samples were taken from both upper leaves (actively growing) and the older, lower leaves (less actively growing) mixed thoroughly before taking a representative sample. These samples were then oven-dried at 80°C for about 24-48 hours, and ground into powder form for analysis.
115

TABLE II. GROWTH PERFORMANCE (HEIGHT, ROOT COLLAR DIAMETER AND CANOPY RADIUS) AT 9 MONTHS OF THE THREE SPECIES AND THEIR PROVENANCES
Code Species Provenance Source Height Root collar diamter Cannopy radius (cm) (mm) (cm)
a) Acacia tortUisG1 Acacia tortilis spirocarpa Yemen 53.1 8 46.4G2 Acacia tortilis spirocarpa G.Sudan 37.79 6 24.5G3 Acacia tortilis spirocarpa N.K.Sudan 61.3 8 45.5G4 Acacia tortilis spirocarpa Israel 74.6 11 51.9G5 Acacia tortilis spirocarpa K.Sudan 55.1 8 43.3G6 Acacia tortilis tortilis India 47.8 7 30.8G7 Acacia tortilis raddiana Somalia 41.5 7 29.8G8 Acacia tortilis raddiana Niger 48.2 11 9.6G9 Acacia tortilis tortilis R. Senegal 46.7 7 31.2G10 Acacia tortilis heteracantha Zimbabwe 58.3 8 38.2Gil Acacia tortilis heteracantha Zimbabwe 79.5 11 58.2Mean 54.9 8.4 37.3
b) Prosopis julifloraG12 Prosopis juliflora Castarica 76.8 10 58.6G13 Prosopis juliflora Panama 51.2 8 37.0G14 Prosopis juliflora Columbia 55.7 7 22.9G15 Prosopis juliflora Honduras 36.7 7 23.2G16 Prosopis juliflora Kenya 52.8 8 43.1G20 Prosopis juliflora Peru 60.9 7 43.1Mean 54.9 8.4 37.3
c) Casuarina equisetofoliaG17 Casuarina equisetofolia Kayar Senegal 52.1 20.6 40.7G18 Casuarina equisetofolia Dakar Senegal 60.2 13.8 32.6G19 Casuarina equisetofolia R. I. Kenya 62.8 12.9 30.7G21 Casuarina equisetofolia Australia 46.1 10.5 26.2
Mean 55.3 14.5 32.6
LSD P< 0.05
i) For differences between tree species 10.6 1.2 8.7ii) For differences between treatments (provenances)
for differences species 7.6 0.9 6.0iii) For differences between treatment (provenances)
for the same species/provenances 3.5 0.8 4.4
2.4. Statistical analysis of dataExperimental data has been analysed taking into consideration the differences in the
parameters measured which are brought about by the species studied. For example, growth parameters which cannot be compared were analysed separately to enable comparison between the different tree species.
116

3. RESULTS AND DISCUSSION
3.1. Assessment of growth performance and evaluation for drought resistanceThe results of early growth and phonological characteristics taken 9 months after planting are
presented in Table II. The results showed significant differences (P< 0.05) in the rate of growth within and between the different species. Similarly, the results of dry matter yield, 13C determination (Fig. 1), and water use efficiency at 18 months indicated significant differences between the different tree species and their provenances (Table III). Acacia tortilis (provenance - heterecantha) from Zimbabwe had the greatest overall growth with regards to height, root collar diameter and canopy radius at 9 months in the field, followed by Acacia tortilis from Israel, Acacia tortilis from Northern Khartoum in Sudan, and those from Yemen and Sudan (Table E). The lowest juvenile growth within the Acacia provenances was recorded in the species from Gezira region in Sudan. However, it was noted that the performance trend changed at 18 months when the dry matter yield was determined. Acacia tortilis (provenance - spirocarpa) from Israel scored the highest dry matter yield followed by provenances from Somalia, N. Khartoum and Yemen (Table III). The lowest dry matter yield was obtained from the Niger provenance followed by the ones from Rao in Senegal and Gezira in Sudan. It was suprising to note that at 9 months, the Acacia provenances from Zimbabwe and those from other Sub-Saharan Africa had shown considerable early growth rates but dropped sharply at 18 months after establishment which probably suggest poor adaptation to arid conditions. The Prosopis provenances also showed significant differences (P< 0.05) in early growth (Table II). The Prosopis provenance from Costa Rica emerged the best, followed by the one from Peru. There were little difference between the provenances from Panama, Kenya and Columbia. The provenance from Honduras had the lowest growth in all the parameters that were measured.
Consistent with the early growth performance trend, Prosopis from Costa Rica again obtained the highest dry matter production as assessed at 18 months although this trend was not observed in the other provenances. Like in the Acacia provenances, some of the Prosopis provenances which showed better early growth performance later exhibited reduced growth rates in terms of dry matter yield at 18 months. The provenances falling under this category included those from Peru and Panama. However, the provenance from Honduras suprisingly produced the highest dry matter production after a poor start in growth performance (Table III).
The Casuarina provenances showed medium to high growth rates. The provenance from Dakar in Senegal obtained the highest early growth rate, dry matter yield and WUE compared with the other provenances which were tested (Tables II & III) followed by those from Kenya and Kayar in Senegal. The lowest performance was recorded in the provenance from Australia. A significantly positive linear correlation R2=0.69 was obtained between dry matter production and WUE among the species studied (Fig. 2). The results (Table III), also showed that there were significant differences (P< 0.05) in 13C discrimination between the different tree species and among genotypes within Casuarina and Prosopis. There were however, no significant differences in 13C discrimination among the Acacia genotypes tested. Casuarina from Dakar Senegal and Prosopis from Honduras showed the lowest 13C discrimination compared with the other provenances. Of significance, was that the same Casuarina species from Dakar Senegal also produced the highest dry matter yield and WUE. A similar trend also occurred in the Prosopis from Honduras which also recorded the second highest ,3C discrimination rate and also ranked among the top in WUE. From these studies, it is evident that genotypes of tree species with high WUE are rare and as such one needs to have a large germplasm base for screening in order not to lose those with the desired traits.
117
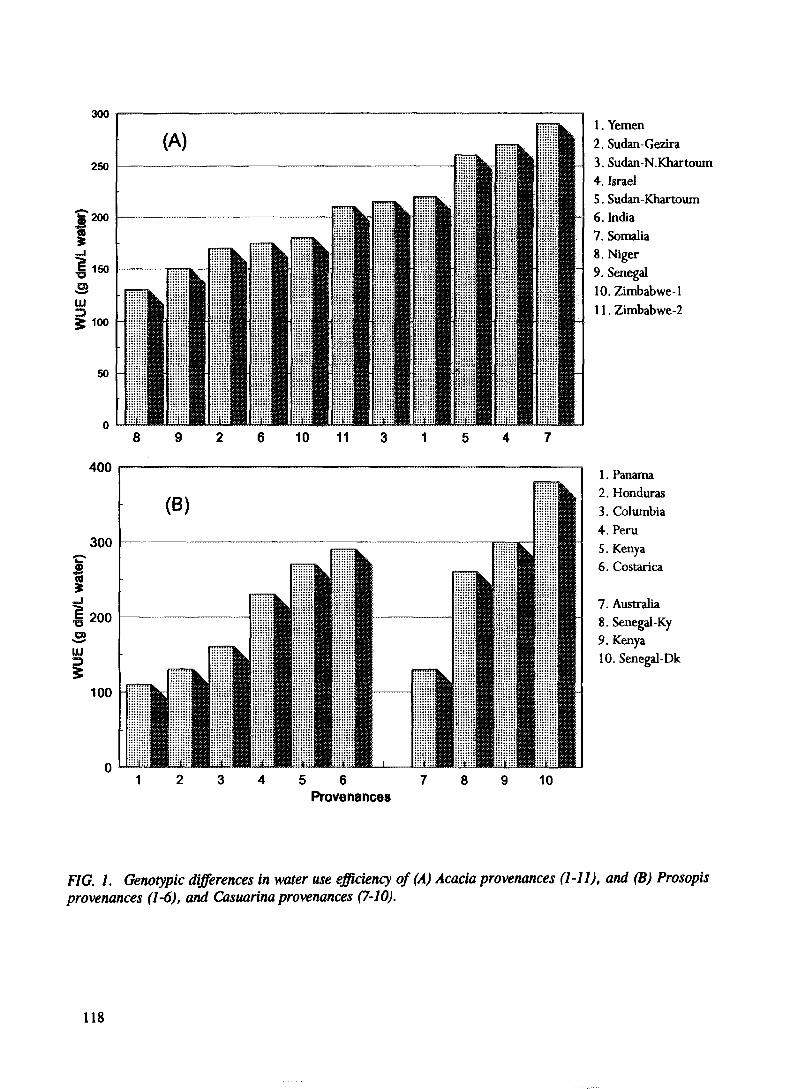
300
8926 10 11 31 547
1. Yemen2. Sudan-Gezira3. Sudan-N.Khartoum4. Israel5. Sudan-Khartoum6. India7. Somalia8. Niger9. Senegal10. Zimbabwe !11. Zimbabwe-2
400
123456 789 10Provenances
1. Panama2. Honduras3. Columbia4. Peru5. Kenya6. Costarica
7. Australia8. Senegal-Ky9. Kenya10. Senegal-Dk
FIG. 1. Genotypic differences in water use efficiency of (A) Acacia provenances (1-11), and (B) Prosopis provenances (1-6), and Casuarina provenances (7-10).
118

TABLE III. THE PERFORMANCE OF DIFFERENT SPECIES AND PROVENANCES WITH RESPECT TO C-13 DISCRIMINATION, WATER USE EFFICIENCY (WUE)DRY MATTER YIELD AND P UPTAKE AT 18 MONTHS
Code Species Provenance Source 13C discrimination (A)
WUE (g dm/ml)
Dry matter (g/plant)
(a) Acacia tortilisG1 Acacia tortilis spirocarpa Yemen 20.99 0.22 1065G2 Acacia tortilis spirocarpa Gezira Sudan 20.99 0.17 776G3 Acacia tortilis spirocarpa N.Khart.Sudan 20.25 0.21 1319G4 Acacia tortilis spirocarpa Israel 19.94 0.27 1776G5 Acacia tortilis spirocarpa Kh art. Sudan 20.99 0.26 1450G6 Acacia tortilis tortilis India 21.72 0.17 882G7 Acacia tortilis raddiana Somalia 19.94 0.28 1672G8 Acacia tortilis raddiana Niger 21.51 0.13 471G9 Acacia tortilis tortilis Rao Senegal 20.99 0.15 701G10 Acacia tortilis heteracantha Zimbabwe 20.78 0.18 934Gil Acacia tortilis heteracantha Zimbabwe 21.63 0.21 977Mean 20.83 0.20 1090
(b) Prosopis julifloraG12 Prosopis juliflora Castarica 18.68 0.29 1979G13 Prosopis juliflora Panama 18.89 0.11 882G14 Prosopis juliflora Columbia 19.94 0.16 860G15 Prosopis juliflora Honduras 16.62 0.13 1630G16 Prosopis juliflora Kenya 20.88 0.27 1396G17 Prosopis juliflora Peru 19.10 0.23 940Mean 19.03 0.20 1282
(c) Casuarina equisetofoliaG18 Casuarina equisetofolia Kayar Senegal 20.25 0.26 1370G19 Casuarina equisetofolia Dakar Senegal 11.10 0.38 2415G20 Casuarina equisetofolia R.I. Kenya 18.68 0.30 1674G21 Casuarina equisetofolia CSIRO Austr. 18.68 0.13 244Mean 17.18 0.27 1426
LSD PC0.05i) For differences between tree species 6.9 0.13 25.3ii) For differences between treatments (provenances)
for differences species 0.4 0.11 16.2iii) For differences between treatment (provenances)
for the same species/provenances 3.5 0.13 5.9
119

y = 8.0234e-2 + 1.1117e-4x
RA2 = 0.691
3000
Dry matter yield (g/plant)
FIG. 2. Relationship between dry matter yield and water use efficiency of Acacia tortilis (11 provinances), Prosopis julijlora (6 provenances), and Casuarina equisitifolia (4 provenances).
The results of dry matter production and l3C discrimination appear to confirm the findings of Hubick and Farquhar [5] and Wright et al. [8] who observed a negative correlation between 13C discrimination with, dry matter yield and WUE. On the contrary, Condon et al. [6] observed that 13C discrimination is positively correlated with grain yield and dry matter production in field grown wheat. Although there were a few incosistencies in the results, the majority of the provenances showed that l3C discrimination is negatively correlated with dry matter and WUE (Figs. 3 and 4). The results indicated that Acacia tortilis provenances from Israel, Somalia, Khartoum region are the best in terms of water use efficiency. Although these results can be used as a criteria for future selection of germplasm for drought resistance in semi-arid sites, they may still need further screening and validation on the basis of other environmental factors over a wide range of moisture stress conditions before they can be recommended for large scale reforestation programmes.
Although there were no significant differences in l3C discrimination in Acacia provenances, it was interesting to note that among the Acacia provenances examined, the provenances which performed the best in terms of dry matter production (Israel), and had a relatively low 13C discrimination and a high WUE, which is the most important agronomic characteristic under discussion in this paper (Table III). It is therefore possible to speculate that Acacia provenances fromN. Africa and Middle East being located in a desert region, have adapted to moisture stress. However, the same degree of adaptation was not observed among the Prosopis and Casuarina provenances. The results suggest that future species and provenances evaluations for selection and breeding could benefit much more from the Middle East and Northern Africa Acacia provenances which appear to possess greater potential for drought resistance. Similarly, Prosopis species from Costa Rica and Honduras as well as Casuarina equisitifolia from Dakar, Senegal and Kenya, also appeared to have drought resistance traits and could also be considered for future selection and breeding.
120

30001
2000-
y = 3889.8 - 136.40X
RA2 = 0.3621000"
13C discrimination (a)
FIG. 3. Relationship between ,3C isotope discrimination (a) and dry matter yield of Acacia tortilis (11 provinances), Prosopis juliflora (6 provenances), and Casuarina equisitifolia (4 provenances).
y = 0.47255 - 1.3122e-2x
13C discrimination (a)
FIG. 4. Relationship between UC isotope discrimination (a) and water use efficiency of Acacia tortilis (11 provinances), Prosopis juliflora (6 provenances), and Casuarina equisitifolia (4 provenances).
121

ACKNOWLEDGEMENTS
The authors would like to thank Dr. A. Haystead of the Department of Applied Science, Auckland Institute of Technology, New Zealand, who carried out the 13C/12C ratio analysis of plant samples for a13C determinations.
REFERENCES
[1] JOHNSON, D.A., ASAY, K.H., TIESZEN, L.L., EHLER1NGER, J.R., JEFFERSON, P.G., Carbon istope discrimination: Potential in screening cool-season grasses for water-limited environments, Crop Sci. 30 (1990) 338-343.
[2] FARQUHAR, G D , EHLERINGER, JR, HUBICK, K.T., Carbon isotope discrimination and photosynthesis, Ann.Rev. Plant Physiol. 40 (1989) 503-537.
[3] FARQUHAR, G.D., RICHARDS, R. A.. Isotopic composition of plant carbon correlates with water-use efficiency of wheat genotypes, Aust. J. Plant Physiol.il (1984) 539-552.
[4] HUBICK, K.T., FARQUHAR, G.D , SHORTER, R., Correlation between Water Use Efficiency (WUE) and carbon isotope discrimination in diverse peanut (Arachishypogea) germplasm, Aust. J. plant physiolo. 13 (1986) 803-16.
[5] HUBICK, K. T., FARQUHAR, G. D , Carbon istope discrimination selecting for water use efficiency, Aust. Cotton growers 8 (1987) 66-68.
[6] CONDON, A. G., RICHARDS, R. A., FARQUHAR, G.D., Carbon Isotope discrimination is positively correlated to grain yield and dry matter production in field-grown wheat, Crop Science 27 (1987) 996-1001.
[7] FAO/UNESCO Soil map of the world. Revised Volume, UNESCO, Paris (1988).[8] WRIGHT G. C., Hubick, K. T., FRAQUAHAR, G.D., Discrimination in carbon isotope in leaves correlates with
water use efficiency of field grown peanut cultivars, Australian Journal of Plant Physiology, 15 (1988) 815-25.
122

CARBON-13 DISCRIMINATION AS A CRITERION FOR IDENTIFYING HIGH WATER USE EFFICIENCY WHEAT CULTIVARS UNDER WATER DEFICIT CONDITIONS
M.BAZZAInstitut Agronomique et Vdtdrinaire Hassan II, Rabat-Instituts,Rabat, Morocco
XA9642767
Abstract
CARBON-13 DISCRIMINATION AS A CRITERION FOR IDENTIFYING HIGH WATER USE EFFICIENCY WHEAT CULTIVARS UNDER WATER DEFICIT CONDITIONS.
During four consecutive years, 20 durum wheat (Triticum durum Desf) and bread wheat (Triticum aestrivum L.) cultivate were grown under rain-fed conditions and supplementary irrigation with the objective of assessing the possibility of using l3C discrimination (A) as a criterion to screen for wheat cultivate that produce high yields and have a better water use efficiency under water deficit conditions. In all four growing seasons, both treatments were subjected to some water stress which was higher under rain-fed conditions and varied according to the intensity and time of rainfall. During the first growing season, and despite small differences between the two treatments in terms of the amounts of water used, the grain and straw yields as well as A were significantly higher in the treatment which received an irrigation at installation than in the one without irrigation. There was substantial genotypic variation in A. When both treatments were considered, the total aboveground dry matter yield and grain yield were positively correlated with A although the correlation coefficient of grain yield versus A was not high (< 0.45**). Moreover, the A value was also correlated positively with water use efficiency. This is in contrast to greenhouse experiments with wheat where plant water use efficiency and A were negatively correlated. The data suggest that high A values can be used as a criterion for selecting cultivars of wheat that have a relatively higher grain yield potential and high water use efficiency under water deficit conditions. Eleven cultivars were identified using this technique. During the second growing season, the grain yield and A were similar to that of the previous season. Their linear relationship was loose, but significant (r = 0.34**); this became more evident when straw (r = 0.41**) or the total dry matter (0.49***) was used. From this second season study, 13 cultivars were selected as potentially suitable candidates for water deficit conditions on the basis of their high yield and A values. All the cultivars selected during the first season were also among this second selection. During the last 2 years of the 4 year experiment, grain yield data were used to validate the selection performed during the first two seasons. However, a very high inconsistency was noted between the genotype performances in terms of A during the first two seasons and the yield during the last two seasons. Of the cultivars tested, only three were among the best in terms of grain yield during the last two seasons. Three cultivars produced noncompetitive yields thereafter. Four cultivars only produced a good yield in one of the last 2 seasons. Three cultivars that were not selected also produced high yields during at least one of the last two seasons. The data suggest that while a high A value may be used as a criterion for selection of cultivars of wheat with potential for high yield and high water use efficiency in wheat under field conditions, caution must be exercised in the selection process as the size of the canopy and the changes in environmental factors mainly soil water content, can result in changes in A and the yield of a cultivar. However, A of a genotype can also provide valuable information with respect to plant parameters responsible for the control of A and this information can be usefully employed in breeding programmes aimed at developing wheat cultivars high in yield and high in water use efficiency, and suitable for cultivation in arid and semi-arid regions of the tropics and subtropics. 1
1. INTRODUCTION
Wheat is one of the most important sources of food in many countries. In Morocco, it is produced mostly in rain-fed areas of arid and semi-arid climates, where precipitation during the growing season is inadequate and varies drastically both within one growing season and from year to year. The land under wheat receives less than 600 mm of rainfall annually, and more than 50%
123

of this area receives less than 400 mm. As water is scarce and resources are becoming more and more limited, it is not possible to provide supplementary irrigation for the large areas of wheat cultivated annually. Therefore it is essential that a solution be found for identifying cultivars that are drought tolerant and that can maximize water use efficiency and produce relatively better yields on the limited amounts of water available. However, the plant attributes to be used as selection criteria, i.e., producing good yields under adverse environmental conditions, have yet to be identified [1]. Most of the physiological characteristics used to date, such as photosynthetic activity, transpiration rate, P/P. (ratio of intercellular and ambient partial pressures of 00%) and other parameters describing plant-water relationships, are instantaneous measurements that do not integrate overall plant metabolic performance during the growth cycle [2],
It has recently been shown that the proportion of 13C in a plant is an indicator of its water use efficiency. Carbon is found in the atmosphere in the form of two stable isotopes, 13C and 12C, with the latter representing about 98.9% of the total. This proportion is, however, different from that found in plants owing to discrimination against 13C during carbon dioxide uptake by crops, particularly C-3 plants [3]. In pot experiments, several authors have found that under conditions where water is not limited, water use efficiency is negatively correlated with A for various crops belonging to the C-3 type, e.g. wheat, peanuts and cotton [4-6]. The relationship between dry matter yield and A is however variable depending on plant type. In wheat, this correlation is positive [7] while in peanut this is negative [8]. These results have led investigators to suggest that A can be used as a criterion for selecting cultivars that have a relatively better water use efficiency and higher yields. Johnson et al [2] suggested that A is a plant characteristic that integrates the overall metabolic performance during the entire cycle and, hence, would constitute, an adequate criterion for selecting plants for their water use efficiency in water limited environments. More recently, Kirda et al [9] found that for four spring wheat cultivars grown under different irrigation regimes, the A value measured at late stem elongation correlated positively with the total dry matter yield and water use efficiency. These authors concluded that early measurements of A may prove a useful tool for rapid and early screening of cultivars for high yield and high water use efficiency.
The present study was conducted with the objectives of assessing the possibility of using A as a criterion to screen wheat cultivars that produce high yields and have a better water use efficiency under water deficit field conditions as in the arid and semi-arid regions of Morocco.
3. MATERIALS AND METHODS
For four consecutive years, all the durum wheat (Triticum durum Desf) and bread wheat (Triticum aestivum L.) cultivars available in Morocco were grown under both rain-fed and supplementary irrigation conditions ,i.e., 24, 20, 22 and 25 cultivars were used during the four seasons respectively. The climate of the region is of the semi-arid type, with a temperate winter. Precipitation is characterized by a large variability within and between years, with an annual mean of 320 mm. The mean annual temperature is 18°C, with large differences between winter and summer; the mean annual relative humidity is between 75 and 80%. Mean class A pan evaporation is around 1700 mm, with daily values ranging from 2 mm in winter to more than 8 mm in summer. The experiments were laid out in a randomized block design with 4 replicates for each of the irrigated and rain-fed treatments. The sub-plot size was 5 m x 2 m. Seeds were planted at a density of 250 g/m2. Access tubes for the neutron moisture gauge (CPN Model) were installed in the sub-plots to
124

monitor changes of soil water status within the plant rooting zone during the growing season. The water balance approach was used to estimate the crop water consumption of the wheat cultivars.
Owing to the lack or inadequacy of precipitation at planting during the last 3 years, light irrigation (20-40 mm depending on the growing season) was applied to both treatments, after planting. During the first year, only cultivars in the the irrigated treatment received this supplementary water. During the last three growing seasons, in addition to the initial irrigation of 20 to 40 mm, two to three water applications were made totaling 120, 100 and 120 mm for the first, second and third seasons, respectively. Except for irrigation, all the treatments were conducted in the same manner and all the cultural practices were the same as those recommended for maximum production in the region.
The experiment was harvested at full maturity. Dry matter yield of grain and straw were recorded and plant samples were analysed for 13C/12C ratios at the Waikato Stable Isotope Unit, University of Waikato, Hamilton, New Zealand. The A was calculated from the measurements of the difference in carbon isotope ratio of the air and of plant material [10] taking the ratio of air as - 7.6 %o on the PDB (Pee Dee Belemnite) scale [5].
4. RESULTS AND DISCUSSION
The first growing season was much more humid than normal and precipitation was relatively well distributed over the cycle, except for February which was completely dry. Total precipitation during the last three months of the crop cycle amounted to only 116 mm which subjected both treatments to some water stress. The intermediate value of the water content between the field capacity and the permanent wilting point, set as a threshold value for applying water to the irrigated treatment, was never reached. Hence, the only difference between the two treatments was the initial irrigation applied at planting. Nevertheless, this resulted in earlier and better uniformity of germination, which induced a higher number of tillers with ears per unit area. From 27 January to harvest in late April, the soil water content in the root zone of both treatments followed the precipitation pattern and varied from a maximum of 0.30 cm3/cm3 in late January to a minimum of0.20 cm3/cm3 in April. However, water consumptive use was 12% higher in the treatment that received an irrigation.
The results show that during the 1989-90 season, the mean grain and straw yields were 2.27 and 2.81 t/ha in the irrigated treatment and 1.47 and 1.93 t/ha under rain-fed conditions, respectively (Table I). These yields were lower than the potential of the region because of the water deficit especially during the month of February which resulted in an attack of Hessian fly during the month of March. In addition to the yield differences between the two treatments, the A values were also significantly higher (P < 0.001) in the treatment that received an irrigation treatment at planting. As discussed by Farquhar [11], a greater availability of soil moisture could result in higher stomatal conductance and hence higher A values and higher yields. There was also high variability of A within treatments which attests to the genotypic difference in carbon discrimination. The difference between the two treatments shows that the A value of a genotype is a parameter that is very sensitive to water stress.
The mean water consumptive use of both treatments was about 180 mm, which corresponds to a daily mean of 2.07 mm, while the potential evapotranspiration was about 3.8 mm/d. Although the mean yield and water consumptive use were significantly higher in the irrigated treatment, the differences between the two treatments were not very significant, especially for water consumptive use which on average varied by only 20 mm. Moreover, both treatments were exposed to water
125

TABLE I. GRAIN YIELD (t/ha) AND A (%o) UNDER SUPPLEMENTARY IRRIGATION AND RAIN FED CONDITIONS (1989-1990 AND 1990-1991)
Genotype
Season 1989-1990 Season 1990-1991
Irrigated Rain fed Irrigated Rain fed
Yield A Yield A Yield A Yield A
Kyperounda 2.25 20.18 1.26 18.16 2.68 21.03 3.08 20.64Cocorit 2.16 19.66 1.13 18.02 3.04 20.26 3.15 19.56Jon 2.52 19.96 1.89 18.28 3.17 19.88 2.19 19.32Marzak 2.54 19.25 1.09 17.73 3.63 20.13 3.55 19.73Karim 18.5 19.90 1.73 18.89 4.06 20.53 2.61 19.81Acsad 65 2.33 18.90 1.06 18.57 3.53 19.84 3.36 20.31Oumrbia 2.43 19.08 1.59 19.28 3.09 20.89 3.15 20.57Sarif 2.59 18.99 1.83 19.80 4.39 19.98 3.11 19.51Massa 3.23 19.59 2.23 — 3.36 19.79 2.43 19.47Isly 1.67 19.04 1.46 17.08 3.39 20.14 3.84 19.17Tassaout 1.95 19.39 2.20 19.10 4.19 19.80 3.60 19.86Nesma 149 2.69 19.10 1.88 18.13 1.58 20.40 1.42 19.92Siete Cerros 2.08 18.88 1.43 18.76 1.10 19.59 2.13 19.70Teggey 32 2.73 18.92 1.37 19.13 2.79 19.54 2.51 19.15Jouda 1.94 19.51 1.17 17.70 1.49 19.90 1.50 19.87Marchouch 8 2.66 19.50 1.37 19.05 3.27 20.28 2.26 19.34Acsad 59 2.48 17.20 1.36 19.39 1.30 19.08 1.31 18.61Saada 1.94 19.50 1.69 19.33 2.31 20.38 2.76 19.50272 — — — — 3.50 20.58 2.53 19.73Belbachir — — — — 3.45 20.60 2.98 19.45Zeramek 0.83 18.95 0.42 17.93 — — — —
Sebou 2.00 19.61 1.68 — — — — —
Tensift 2.84 19.25 1.47 18.65 — — — —E 14 2.42 18.95 2.02 — — — — —
Sais 2.37 18.82 1.37 18.74 — — — —
Potam 2.03 19.85 0.48 18.26 — — — —
Mean 2.27 19.25 1.47 18.57 2.96 20.13 2.67 19.66
stress during the most critical stages of growth. Hence, it should be reasonable to consider the relationship between dry matter production and A, taking both treatments into account. When doing so, total dry matter was related to water use efficiency (r = 0.55"*). Thus, the observed variation in water consumptive use between the cultivars contributed significantly to the difference in total dry matter production. Further, the following correlation coefficients were obtained with A:
All cultivars Durum wheat cultivars
Total dry matter vs A : 0.35" Total dry matter vs A : 0.39Grain yield vs A : 0.44" Grain yield vs A : 0.60Water use efficiency vs A : 0.41" Water use efficiency vs A : 0.56*
The positive and significant correlation between the A and grain yield tends to suggest that cultivars with high A values are more suitable for cultivation under water deficit conditions. In addition, it was interesting to note that in this field study the A is also postively correlated with water use use efficiency of wheat. This is in contrast to the observations made in greenhouse experiments
126

with wheat [4], peanut [5] and cotton [6] in which plant water use efficiency and A were negatively correlated when water supply was limiting as expected from leaf gas exchange theory [11]. The fact that the correlation between water use efficiency and A is positive implies that the A of field grown wheat is dependent more on changes in stomatal conductance (P;/PJ than on the photosynthetic capacity. This makes the aerodynamic resistance of the crop to transpiration an important aspect for consideration. In relatively large field plots as used in this study (sub-plot area = 10 m2), where the canopy and boundary layer resistance are large, there is the possibility that a genotype with a greater stomatal conductance than another otherwise identical genotype will have a greater water use efficiency, despite also having a greater A. On the basis of this criteria, 11 cultivars having A values over 19 %o produced grain yields greater than 2 t/ha. However, because of the low correlation between the two variables, not all highly productive lines necessarily have high A values; some of the cultivars that fall into this category may also be suitable for water limiting conditions, but they were not selected with this technique. Six cultivars fell into this category. It would be interesting to check whether the same cultivars give a negative correlation between water use efficieny and A in a pot experiment under controlled environmental conditions, and if so whether the cultivars with a low A value but high water use efficiency would correspond to those with a high A value and high water use efficiency under field conditions.
During the second growing season, the late stages, particularly that of grain filling, were subjected to a high water deficit. The A values were lower under rain-fed conditions than under irrigated conditions (Table I). As discussed by Condon et al. [7] a greater water stress under rain-fed conditions is likely to result in a lower P/P, leading to lower A values. Both the grain yield and A were higher during this season than during the first season, which points to the the close relationship that exists between the two parameters. The linear relationship between grain yield and A was loose, but significant (r = 0.34”) and became more evident when straw (r = 0.41”) or the total dry matter production (r = 0.49*”) was used. On the basis of these results, 10 cultivars with grain yields higher than 3 t/ha and A values greater than 20 %o were selected. The positive correlation between A and grain yield and between A and water use efficiency was also confirmed from another trial where four cultivars were grown under five supplementary irrigation regimes during the second season (Figures 1 and 2).
During the last two growing seasons, the grain yield of the different cultivars (Table II) was utilized for testing the validity of the selection performed during the two previous seasons based on yield and A. Of the cultivars tested this season, eight were not available consistently in addition to inadequate data on their behaviour and were therefore excluded from further testing. Of the other cultivars selected during the first two seasons, three were among the best in terms of grain yield during the last two seasons. Three other cultivars produced a non-competitive yield thereafter. Four cultivars only produced a good yield in one of the last two seasons. On the other hand, three cultivars that were not selected produced a high yield during at least one of the last two seasons whereas one did not do well in all four seasons. The performance of other cultivars was not consistent with respect to A and yield during the last two seasons. The data show that the use of A for selection of cultivars of wheat high in water use and high in yield under field conditions need careful study because of the sensitivity of this parameter to environmental changes that often occur from season to season even in the same locality. For instance, the correlation between A and water use efficiency gets looser with increasing water deficit during the crop cycle and eventually disappears under severe water stress. Yet A of a genotype can provide useful information with respect to the plant parameters (whether stomatal conductance or photsynthetic capacity) that affect its changes which will be useful in breeding programmes aimed at developing improved cultivars.
127

5.5 -
® 3.5
Genotype
2.5 -
FIG. 1. Grain yield versus A of four wheat genotypes grown under five irrigation regimes
Genotype• 1
FIG. 2. Wtare use efficiency for grain production versus A of four wheat genotypes grown under five irrigation regimes
128
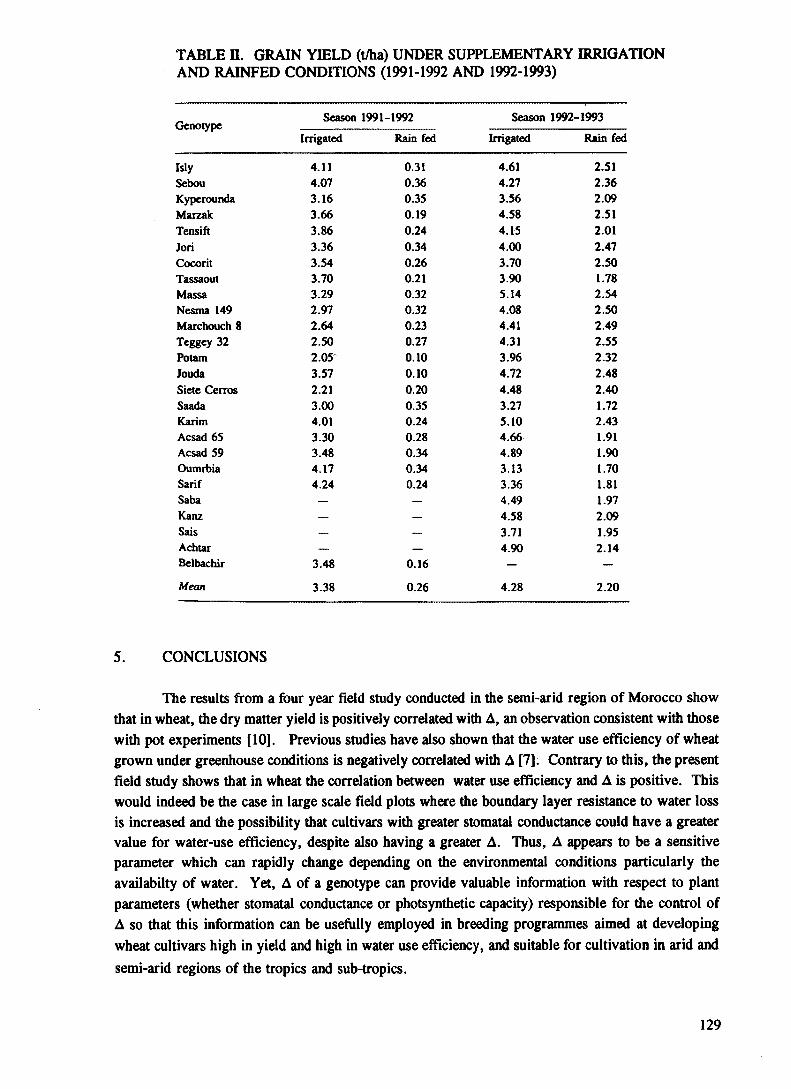
TABLE n. GRAIN YIELD (t/ha) UNDER SUPPLEMENTARY IRRIGATION AND RAINFED CONDITIONS (1991-1992 AND 1992-1993)
GenotypeSeason 1991-1992 Season 1992-1993
Irrigated Rain fed Irrigated Rain fed
Isly 4.11 0.31 4.61 2.51Sebou 4.07 0.36 4.27 2.36Kyperounda 3.16 0.35 3.56 2.09Marzak 3.66 0.19 4.58 2.51Tensift 3.86 0.24 4.15 2.01Jon 3.36 0.34 4.00 2.47Cocorit 3.54 0.26 3.70 2.50Tassaout 3.70 0.21 3.90 1.78Massa 3.29 0.32 5.14 2.54Nesma 149 2.97 0.32 4.08 2.50Marchouch 8 2.64 0.23 4.41 2.49Teggey 32 2.50 0.27 4.31 2.55Potam 2.05 0.10 3.96 2.32Jouda 3.57 0.10 4.72 2.48Siete Cerros 2.21 0.20 4.48 2.40Saada 3.00 0.35 3.27 1.72Karim 4.01 0.24 5.10 2.43Acsad 65 3.30 0.28 4.66 1.91Acsad 59 3.48 0.34 4.89 1.90Oumrbia 4.17 0.34 3.13 1.70Sarif 4.24 0.24 3.36 1.81Saba — — 4.49 1.97Kanz — — 4.58 2.09Sais — 3.71 1.95Achtar — — 4.90 2.14Belbachir 3.48 0.16 — —
Mean 3.38 0.26 4.28 2.20
5. CONCLUSIONS
The results from a four year field study conducted in the semi-arid region of Morocco show that in wheat, the dry matter yield is positively correlated with A, an observation consistent with those with pot experiments [10]. Previous studies have also shown that the water use efficiency of wheat grown under greenhouse conditions is negatively correlated with A [7]. Contrary to this, the present field study shows that in wheat the correlation between water use efficiency and A is positive. This would indeed be the case in large scale field plots where the boundary layer resistance to water loss is increased and the possibility that cultivars with greater stomatal conductance could have a greater value for water-use efficiency, despite also having a greater A. Thus, A appears to be a sensitive parameter which can rapidly change depending on the environmental conditions particularly the availabilty of water. Yet, A of a genotype can provide valuable information with respect to plant parameters (whether stomatal conductance or photsynthetic capacity) responsible for the control of A so that this information can be usefully employed in breeding programmes aimed at developing wheat cultivars high in yield and high in water use efficiency, and suitable for cultivation in arid and semi-arid regions of the tropics and sub-tropics.
129

REFERENCES
[1] LUDLOW, M.M., MUCHOW, R.C., "A critical evaluation of traits for improving crop yields in water-limited environments*, In Advances in Agronomy (Brady, N.C. Ed.), Academic Press, New York (1990) 107-153.
[2] JOHNSON, D.A., ASAY, K.H., TIESZEN, L.L., EHLERINGER, J.R., JEFFERSON, P.G., Carbon isotope discrimination: Potential in screening cool-season grasses for water-limited environments, Crop Sci. 30 (1990) 338-343.
[3] FARQUHAR, G.D., EHLERINGER, J R HUBICK, K.T., Carbon isotope discrimination and photosynthesis, Ann. Rev. Plant Physiol. 40 (1989) 503-537.
[4] FARQUHAR, G.D., RICHARDS, R. A.. Isotopic composition of plant carbon correlates with water-use efficiency of wheat genotypes, Aust. J. Plant Physiol. 11 (1984) 539-552.
[5] HUBICH, K. T., FARQUAR, G.D , SHORTER, R., Correlation between water-use efficiency and carbon isotope discrimination in diverse peanut (Arachis hypogea ) germplasm. Aust. J. Plant Physiol. 13 (1986) 803.
[61 HUBICK, K.T., FARQUHAR, G.D , Carbon isotope discrimination-selecting for water-use efficiency. Aust. Cotton Grower, 8 (1987) 66-68.
[7] CORDON, A.G., RICHARDS, R A , FARQUAR, G D , Carbon isotope discrimination is positively correlated with grain yield and dry matter production in field-grown wheat, Crop Sci. 27 (1987) 1001.
[8] WRIGHT, G.C., HUBICK, K.T., FARQUHAR, G. D , Discrimination in carbon isotopes of leaves correlates with water use efficiency of field grown peanut cultivars, Aust. J. Plant Physiol., 15 (1988) 815-825
[9] KIRDA, C., MOHAMED, A.R.A.G., KUMARASINGHE, K.S., MONTENEGRO, A., ZAPATA, F., 1992. Carbon isotope discrimination at vegetative stage as an indicator of yield and water use efficiency of spring wheat (Triticum lurgidum L. var. durum), Plant and Soil xx (1992) .
[10] FARQUHAR, G.D., EHLERINGER, J.R., HUBICK, K.T., Carbon isotope discrimination and photosynthesis, Ann. Rev. Plant Physiol, and Mol. Biol. 40 (1989) 503-537.
[11] FRAQUHAR, G.D , Use of stable isotopes in evaluating plant water use efficiency, Proc. Symp. on Stable Isotopes in Plant Nutrition, and Soil Fertility and Environmental Studies, IAEA (1991) 475-488.
130
WATER USE EFFICIENCY STUDIES OF Acacia Senegal(L.) WILLD PROVENANCES IN SUDAN
A.F. MUSTAFA, K.H. ELAMIN Forestry Research Section
A. A. SALIH Soil Science Section
Wad Medani, Sudan
XA9642768
Abstract
WATER USE EFFICIENCY STUDIES OF Acacia Senegal L. WILLD PROVENANCES IN SUDAN.An experiment was conducted in 1989 to screen Acacia Senegal L Willd provenances collected from within the natural
gum belt for high water use efficiency. Thirteen provenances were tested for water use efficiency and consequently 6 out of them were selected for further screening. The selection was based on their performance in the preliminary screening. Both the preliminary and the detailed study revealed that provenances 7, 3 and 11 combine high dry matter production with high water use efficiency. Water use efficiency and dry matter production appears to be negatively correlated with root length density and root/shoot ratios. Provenance 7 which exhibited the highest water use efficiency and dry matter yield had the lowest root/shoot ratio and also a low root length density. Based on these studies provenance 7 can be considered a suitable candidate for introduction into gum-belt of Sudan through for rehabilitation of this region.
1. INTRODUCTION
Sudan extends between latitudes 4° and 22° N and longitude 22° and 38° E , in an area of about 2.56 million square kilometre. This wide extension is characterized by variable ecological zones, ranging from the tropics in the south through deciduous savanna woodlands in the centre, to the sub- desert and desert in the north.
The question posed in this study relate to the rehabilitation of the deteriorated conditions of the gum belt in the aftermath of the Sahel drought. Gum arable production decreased from 29000 to 11000 tons [1], Acacia Senegal (L) Willd "Hashab" is a tree of about 5-7 m in height. It occurs in the Savanna belt of Africa and in drier parts of India. In the Sudan form forms, together with other species , extensive stands on both sands and clays between latitudes 10° and 14°, where rainfall varies from 250 mm in the north and 800 mm in the south [2]. Hashab is the main source of gum arable, accounting for about 90 % of the world’s production ofgum . Gum arable is widely used in different food products, beverages, pharmaceutical, dentistry, adhesives, textiles, plastics, lithography and other industries. About 70 to 85 of the world total consumption of gum arable is produced in the Sudan [3], The traditional land use system for hashab is basically a kind of shifting cultivation commonly known as the gum cultivation cycle. This cycle could range from 15 to 20 years and consists of (a) clearance of thorn Savanna, (b) cultivation of agricultural crops for 4 to 6 years, (c) bush-fallow, in Which hashab is the most vigorous tree colonizer, (d) hashab tapping which commences at 4 to 5 years with maximum yield at 9 years, and (e) bush clearing at 12 to 15 years .
Recently, three concomitant problems disturbed the traditional land use system for gum production. First, due to overpopulation and the increased demand for agricultural produce, the bush - fallow cycle was reduced to one or two years only. The 3 % upward demographic trend in the Sudan is one of the highest in the world. Sudan’s wood imbalance illustrate the interaction between it’s rapidly increasing population and it’s biological support system. Estimates based on world bank data indicated that national fuelwood consumption crossed the sustainable yield threshold somewhere around 1965. from then on, fuelwood consumption exceeded new tree growth [4]. Second, overgrazing led to elimination of seedlings, thus reducing the possibilities of natural regeneration of hashab which eventually died of old age or, otherwise cut down by Man to meet the fuelwood demand. Seif el Din et al. [3] considered goat browsing as the main cause of the disappearance of hashab from many sites in it’s natural habitat. The third problem arose from successive years (1960 -
131
1974) of rainfall decline in the Savanna and semi - desert zones which culminated in the recent Sahel drought. The shortage of water supply adversely affected the gum - gardens which deteriorated and were finally abandoned. The steady deterioration of the hashab belt coupled with the southern expansion of the desert into the semi - desert and Savanna belts called for an emergency restoration plan to stop the advancing desert and revive the trees of the affected gum belt.
The objective of this study was to screen Acacia senegal (L) Willd genotypes for high water use efficiency, and capable of growing well in dry arid environments. The findings will be invaluable for gum arabic rehabilitation programme which is being undertaken by the National Forest Corporation of Sudan.
2. MATERIAL AND METHODS
2.1. Preliminary screening experimentThirteen A. Senegal provinances (Appendix Table XXIII) were collected from different
locations in Sudan. These were used in the preliminary screening for water as well as phosphorus use efficiency. During the collection campaign, records were made of the differences in the habitat and the location. The experiment was conducted at the Gezira Agricultural Research Station farm at Wad Medani just above the northern part of the gum belt. Die soil in this region is a dark clay type. Climate is dry and hot most of the year and the maximum temperature sometimes approaches 40-42°c during summer months. No rainfall was recorded during the year of the experiment. A minimum irrigation was however provided when necessary. The soil contains 7 ppm available P which is equivalent to 22.1 kg P/ha. Each sub-plot was 4 x 4 m and consisted of 9 trees in the harvest area with a plant spacing and row spacing of 1 m. The sub-plots also had a spacing of 2 m inbetween.Tree seedlings were raised in the nursery in polythene bags. About 5 weeks after germination, theseedlings were graded to achieve uniformity in size and growth. Ten week old plants were then transplanted in the field in August 1990. The trees were harvested 12 months after transplanting and the dry matter yield of shoots was determined which included branches and leaves. The daily evapotranspiration was measured using a neutron probe (Model: CPN) using access tubes installed vertically in each sub-plot. Readings were taken at 15 cm intervals upto a depth of 60 cm before and after irrigation.
2.2. Detailed studyThe test material was 6 provenances selected from within the 13 provenances tested in the
preliminary screening. The selection was based on their performance with respect to water use efficiency. Provenances 7 and 8 representing the highly efficient, provenances 3 and 10, representing the moderately efficient and provenances 6 and 11 representing the low efficient in water use efficiency (Fig. 1). Seeds of the selected provenances were collected in November 1993 and seedling were raised in polythene bags for 10 weeks and then transplanted to the field. The experiment was conducted at the Gezira Agricultural Research Station farm at Wad Medani, where the soil was a dark clay and the weather is dry hot with maximum temperature about 45° C during summer months. During the duration of experiment the site recieved tow showers amount to 64 mm and hence a supplementary irrigation was applied to simulate 200 mm rainfall distributed through out the experimental period of 4 months.
The experiment was a split-plot design with 4 replicates. It consisted of 4 blocks each 75 x 10 m laid parally 3m apart along a gentle slope. Each block was devided in to 6 plots 10 x 10 m and 3 m apart. Thirty six seedlings were planted per plot with plant .spacing of 2 x 2 m.
Shoot, root and the total dry matter yield was recorded after oven drying at 80°c for 24 hours. The daily evapotranspiration was measured using a neutron probe (Model: CPN) using access tubes installed vertically in each sub-plot. Readings were taken at 15 cm intervals upto a depth of 100 cm before and after irrigation.
The root length density was measured in cm of root per cubic cm of soil using the intercept method described by Newman [5]
132

0.4
Provenances
FIG. 1. Genotypic differences in water use efficiency of Acacia Senegal provenances grown in the field in Sudan.
3. RESULTS AND DISCUSION
The preliminary screening showed larged genotypic variations in water use efficiency among the 13 Acacia Senegal provinances studied (Fig. 1). The values ranged from 165 g dm/1 water to 340 g dm/1 water making genotypes 7 and 8 about 2-fold superior in water use efficiency compared to genotypes 6 and 11 which can be considered as the poor in water use efficiency. Of the other genotypes that were tested 1,2,4 and 5 also showed characteristis of high water use efficiency. The results indicate that screening for water use efficiency may be a good approach for selecting Acacia Senegal provinances suitable for introduction into dry semi-arid areas of the gum-belt of Sudan where rainfall is low.
Six provenances with contrasting water use efficiency characteristics were selected for the detailed study. Provenances 7 and 8 represents the highly efficient, provenances 3 and 10, represents the moderately efficient and provenances 6 and 11 represents the low efficient groups in water use efficiency The study revealed that the 6 provenances reacted differently to low water availability. There were significant differences between the provenances in shoot, root and total dry matter (Table I). Both shoot and root systems ad similar dry matter yield probably because the trees were harvested when they were only 4 months old. Provenances 3 and 7 were superior in shoot dry matter production where as provenances 3 and 11 were the more efficient in terms of root dry matter production. Interestingly, provenances 3 and 11 also turned out to be the superior genotypes in total dry matter production. It is possible that in trees growing in dry areas, the root systems contribute substantially to total biomass yield probably because of the need to develop an extensive root systems capable of reaching deeper layers of the soil profile in search of water.
Of the 2 genotypes (7 and 8) selected from the preliminary study for high water use efficiency, only the genotype 7 proved to be high in water use efficiency in the detailed study as well. In fact, die genotype 7 was the best in terms of water use efficiency in this study (Table II). While the two experiments were conducted in the same location, the environmental conditions were somewhat different during the two seasons. Although irrigation was provided to prevent water deficits, different provinances appear to perceive the soil water availability in different ways and react in different ways. Clearly, provenance 7 shows better adapted in terms of water use efficiency, compared with the provenance 8 which appears to be very sensitive to subtle changes in this parameter.
The root length density and root/shoot ratio measurements are shown in Table III. The general observation is that those provenances with a high dry matter yield and high water use efficiency have a smaller root length density and a root/shoot ratio. Provenance 7 again falls into this category having in fact the smallest root/shoot ratio.
133

TABLE I. DRY MATTER PRODUCTION OF ACACIA SENEGAL PROVENANCES 4 MONTHS AFTER TRANSPLANTING
Provenance Shoot dry matter (g/plant)
Root dry matter (g/plant)
Total dry matter (g/plant)
7 32.8 21.4 54.2
3 28.2 29.2 56.4
11 23.3 32.6 55.9
6 26.3 22.2 48.5
8 24.6 22.1 46.7
10 25.7 20.8 46.5
TABLE II : WATER USE EFFICIENCY OF ACACIA SENEGAL PROVENANCES 4 MONTHS AFTER TRANSPLANTING
Provenance Water use efficiency (g dm/I water)
7 187
11 182
3 182
8 157
10 147
6 134
TABLE HI. ROOT LENGTH DENSITY AND ROOT/SHOOT RATIOS OF ACACIA SENEGAL PROVENANCES 4 MONTHS AFTER TRANSPLANTING
Provenance Root length density (cm root/cm3 soil)
Root/shoot ratio
11 0.392 1.399
3 0.403 1.030
8 0.346 0.898
7 0.124 0.652
6 0.110 0.849
10 0.100 0.809
134

From on these findings, we conclude that large genotypic differences exist in Acacia Senegal tree provenances with respect to water use efficiency and dry matter yield and that these characteristics may be linked to differences in the root systems. Further studies are however needed to make any definite conclusions with respect to the root parameters, but root length density appears to play a key role in determining the water use efficiency of trees. Based on these studies provenance 7 can be considered a suitable candidate for introduction into gum-belt of Sudan through for rehabilitation of this region.
REFERENCES
[1] ANNUAL REPORT, Gum Arabic Company, (1989) Khartoum, Sudan.[2] HOUR], A., Some aspects of dry land afforestation in the Sudan with special reference to Acacia tortitis, Acacia
Senegal and Prosopis chilensis. Forest Ecol. and Mangt., 16, (1986) 209-221.[3] SEIF EL DIN, A., OBEID, M., An attempts towards the restocking of the gum belt of Sudan, Sudan Silva, 18
(1979) 4-12.[4] MUSNAD , H , Fuel wood situation in Sudan. Sudan Silva, 21 (1982) 17-24.[5] NEWMAN, E.I., A method of estimating the total length of root in a sample, J. App. Ecol. 3 (1966) 139-145.
NEXT PAGE(S) left BLANK
135
THE °C ISOTOPE DISCRIMINATION TECHNIQUE FOR IDENTIFYING DURUM WHEAT CULTIVARS EFFICIENT IN UPTAKE AND USE OF WATER
M. MECHERGUI, M.H. SNANE Institut National Agronomique de Tunisia, Ddpartement de Gdnie Rural at das Eaux at Forfits, Tunis, Tunisia
XA9642769
Abstract
THE l3C ISOTOPE DISCRIMINATION TECHNIQUE FOR IDENTIFYING DURUM WHEAT CULTIVARS EFFICIENT IN UPTAKE AND USE OF WATER.
The water balance model using a neutron moisture probe and the '3C isotope discrimination method were used in this field to rank durum wheat genotypes for water use efficiency. The results presented focus on the first two years of a five-year study. Eighteen durum wheat cultivars were used in the first experiment. The l3C/,2C ratio was measured to examine the correlation between this ratio and the water use efficiency. Total water consumption was calculated and the grain and straw yields and other parameters were also recorded. The results show differences between cultivars with respect to water use efficiency, l3C discrimination and grain yield. From this experiment, four cultivars were selected for a detailed study in the second year. The data from this study show that there is a positive correlation between grain water use efficiency and A. Thus, it may be possible to use A as a tool for screening out water use efficient cultivars in semi-arid regions.
1. INTRODUCTION
In Tunisia, only about 2% of the land is irrigated and the country has a semi-arid to arid climate. Cereals are the main staple food crops. Even if all the irrigated land were to be cropped with cereals, the needs of the population would still not be satisfied. This is the reason why agriculture is based on rain fall. However, under these conditions, precipitation during the growing season varies drastically from region to region and from year to year. Cereal yields follow the same pattern [1], Agricultural productivity is limited by water availability. The first solution to this problem would be to irrigate, but this method has been eliminated because of the costs involved [2]. Therefore, this solution applies only to those areas that can be irrigated economically. Many other solutions could be proposed, but they are related to the availability of water.
Because limited water availability is of major concern for the cultivation of crops and appears to limit the productivity of most, if not all, of the indigeneous plants in Tunisia, the best solution in rain-fed areas is to screen for genotypes that are efficient in water use. Water use efficiency (WUE) has been defined by many authors [3,4]. It can be approached at many levels and care is needed in defining its use. In the present study, TWUE and GWUE refer respectively to the ratio of the total yield to the total consumption of water and the ratio of the grain yield to the total consumption of water.
Although progress has been made in identifying genetic variation in drought response, including WUE, among many species particularly peanuts, only a few attempts have been made to select genotypes of durum wheat for improved WUE. It is believed that the main reason for so few studies is the difficulty of making accurate measurements of water use in the field [3, 5]. However, a new approach has recently been proposed for investigating variation in WUE in C-3 plants, namely discrimination against l3C by leaves during photosynthesis [6,7,9]. Farquhar and Richards [7] have shown good correlations between transpiration efficiency and the ratio of the carbon isotopes l3C/12C
137

in plants; similar results have also been shown by Condon et al [8]. The main objectives of this study were to screen out the genotypes that have high WUE, and to examine the correlation between WUE and the 13C isotope discrimination in the plant and to determine the parameters responsible for high WUE in different cultivars.
2. MATERIALS AND METHODS
During the 5 year programme, 3 successive experiments were conducted, and the results of 2 experiments are presented here.
2.1. Experiment 1Primary objective of this experiment was to screen out genotypes with a high WUE. The
experiment was carried out at the field station of the Institut National agronomique de Tunisie (INAT), which is characterized by a semi-arid Mediterranean climate. The mean annual rainfall in the region is 459 mm. The soil is vertic xerochrept of fine texture (40% clay), and alkaline (pH 8) with a 2% organic matter content. The experiment consisted of screening out 16 durum wheat genotypes and two triticale cultivars for WUE. These were divided into two groups: low yielding cultivars, which are indigenous to Tunisia, and high yielding cultivars, which have been introduced to the country. The cultivars were sown in a randomized block design with four replicates. The experiment consisted of irrigated and non-irrigated treatments. The plots, (2m x lm) contained three rows, 2 m long and 50 cm apart. Seeding took place on 11 November 1989 at a density of 250 seeds/m2, with a 25 cm space on both sides. Ammonuim nitrate 33 fertilizer was broadcast twice at the rate of 60 kg/ha at germination and tillering stages. Phosphate was not added because of its high concentration in the soil (33 ppm).
At the beginning of the experiment, 16 core samples were taken every 15 cm to the depth of 110 cm to determine the water consumption. The bulk density was also measured. The rainfall data and the irrigation supply were recorded each time they took place.
Plants were harvested at physiological maturity by cutting the shoots about 3-5 cm above ground; the vegetative and grain parts were separated. Five grams of dried plant samples were ground and analysed for ,3C discrimination. The total and grain yields were recorded. Soil water content was measured in the same manner as during crop installation and the water consumption was calculated using the water balance model; finally, the WUE was determined.
2.2. Experiment 2From the 18 cultivars studied during the first experiment, four cultivars were selected for
having high (Razzak), intermediate (INRAT 69 and Karim) and low (Chili) WUE. The objective of this second experiment was to analyse the performance of these selected genotypes with respect to water use and l3C discrimination. The plots (3m x 3m) were arranged in a randomized block design with five replicates. Seeds were sown (broadcast) on 13 November 1991. The experiment was designed for irrigated and non-irrigated conditions, but as there had been a good rainy season, supplementary irrigation was not carried out. Fertilizer was added as ammonium nitrate 33. It was broadcast twice at a rate of 75 kg/ha at the germination and tillering stages. Phosphate was added as super phosphate 45 at a rate of 150 kg/ha. The soil moisture was monitored by a neutron probe (CPN Model 503) through an access tube dug into the soil at the centre of each plot down to a depth of 150 cm. The soil moisture and rainfall were recorded over the entire growing season. The
138
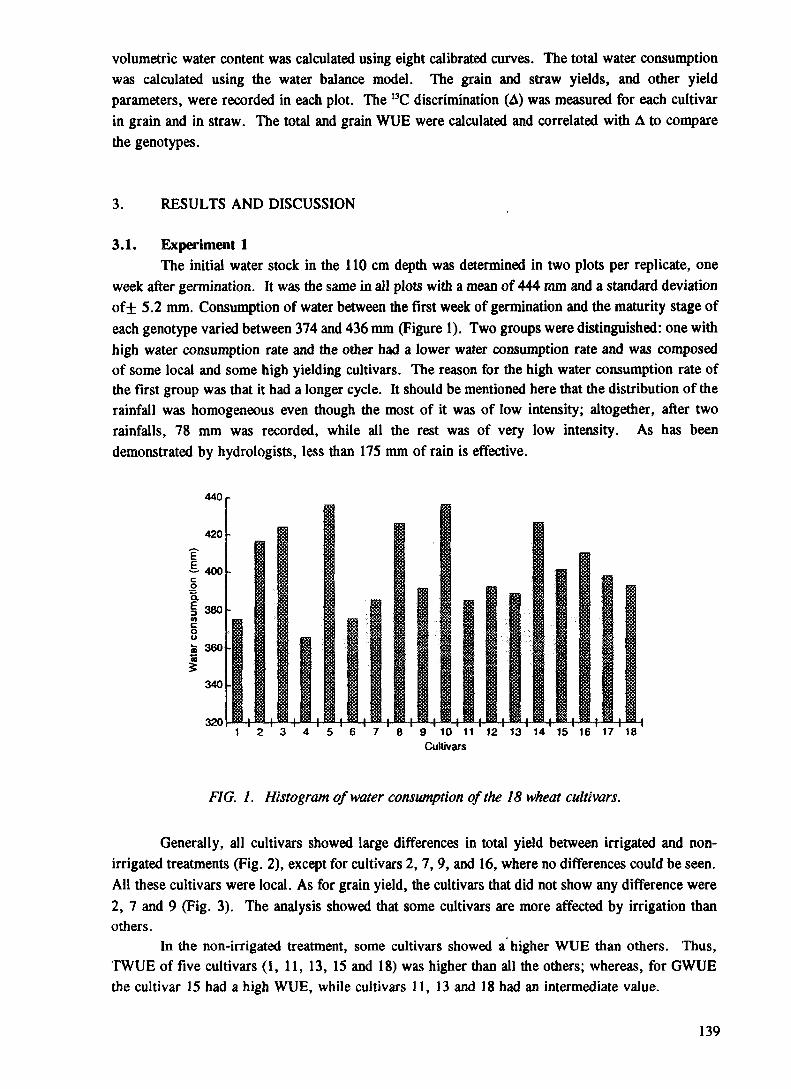
volumetric water content was calculated using eight calibrated curves. The total water consumption was calculated using the water balance model. The grain and straw yields, and other yield parameters, were recorded in each plot. The I3C discrimination (A) was measured for each cultivar in grain and in straw. The total and grain WUE were calculated and correlated with A to compare the genotypes.
3. RESULTS AND DISCUSSION
3.1. Experiment 1The initial water stock in the 110 cm depth was determined in two plots per replicate, one
week after germination. It was the same in all plots with a mean of 444 mm and a standard deviation of+ 5.2 mm. Consumption of water between the first week of germination and the maturity stage of each genotype varied between 374 and 436 mm (Figure 1). Two groups were distinguished: one with high water consumption rate and the other had a lower water consumption rate and was composed of some local and some high yielding cultivars. The reason for the high water consumption rate of the first group was that it had a longer cycle. It should be mentioned here that the distribution of the rainfall was homogeneous even though the most of it was of low intensity; altogether, after two rainfalls, 78 mm was recorded, while all the rest was of very low intensity. As has been demonstrated by hydrologists, less than 175 mm of rain is effective.
440
Cultivars
FIG. 1. Histogram of water consumption of the 18 wheat cultivars.
Generally, all cultivars showed large differences in total yield between irrigated and non- irrigated treatments (Fig. 2), except for cultivars 2, 7, 9, and 16, where no differences could be seen. All these cultivars were local. As for grain yield, the cultivars that did not show any difference were 2, 7 and 9 (Fig. 3). The analysis showed that some cultivars are more affected by irrigation than others.
In the non-irrigated treatment, some cultivars showed a higher WUE than others. Thus, TWUE of five cultivars (1, 11, 13, 15 and 18) was higher than all the others; whereas, for GWUE the cultivar 15 had a high WUE, while cultivars 11, 13 and 18 had an intermediate value.
139

1 2 3 4 5 6 7 8 9 10 11 12 13 14 15 16 17 18Cultivars
FIG. 2. Total yield in irrigated and non-irrigated treatments for 18 wheat cultivars (data for irrigated treatment of cultivar 13 were not available).
1 2 3 4 5 6 7 8
00 Non-irrigated treatments
9 10 11 12 13 14 15 16 17 18 Cultivars
FIG. 3. Grain yield in irrigated and non-irrigated treatments for 18 wheat cultivars (data for irrigated treatment of cultivar 13 were not available).
The differences in A observed between cultivars were, in general, small. When A in straw was considered, it allowed for 3 groups of cultivars to be identified: one with high A (cultivars 5 and 8), one with intermediate A (cultivars 3, 7, 9, and 16) and one with low A (cultivars 14 and 17). Similarly, A in grain allowed for three groups to be identified: high (cultivars 7, 9 and 15), intermediate (cultivars 3 and 8) and low (cultivars 6 and 17). Because, high grain yielding cultivars were of interest, the A in grain was used for the rest of the analysis.
The correlation between grain yield and A in grain was negative, but the correlation coefficient is low (r2=0.46). This negative correlation is different from what has been previously
140

observed in pot experiment with wheat [7,12]. The correlation of TWUE (Fig.4) as well as GWUE with A in grain were also fended to be negative. These results with respect to WUE and A are similar to those refered by other investigators [3, 7,12] for wheat suggesting that the smaller plot size and the large row spacing probably made these wheat plants as in pot experiment.
30
16.2 16.4 16.6 16.815.2 15.4 15.6 15.8A in grain
FIG. 4. Relationship between total water use efficiency and a in grain.
3.2. Experiment 2Seeds of different cultivars were sown on 14 November 1991 for this experiment. The
cultivars Rezzek, INRAT 69, Chili and Karim reached maturity on 10 May, 17 May, 17 June and 10 May, respectively. In the case of the cultivar Rezzak, the stock of water 4 months after sowing varied from 434 to 466 mm with a mean of 439 mm. For the cultivar INRAT 69, it varied from 425 to 456 mm with a mean of 439 mm. Under Chili, it varied from 499 to 419 mm, with a mean of 499 mm. Finally, under Karim it varied from 478 to 432 mm, with a mean of 447 mm. This variability in soil water content was due to both natural variability of the soil and that of water uptake by the different cultivars, although the former was higher than the latter. The same conclusion could be drawn from the final water stock, even though the maturity stage timing differed between genotypes. The waterstock at the maturirty stage under Rezzek varied between 320 and 337 mm (mean of 330 mm). The same stock under INRAT 69 Chili and Karim varied between 310 and 370 mm, 274 and 354 mm and 309 and 359 mm, respectively. This spatial variability affects the yield for the plots that had the same genotype. For this reason, a reasnable number of replications were needed.
Water consumption for each genotype and for each replicate during the period between 1 February and maturity stage was calculated. The mean consumption rates for Rezzek, INRAT 69, Chili and Karim were 355, 307, 398 and 290 mm, respectively. Chili appeared to be a large consumer while INRAT 69 and Karim consumed less water. In other words, Chili profited greatly from the soil water. The same results were obtained in the first experiment [11]. The mean consumption rate in replicates 5 and 6 for all the genotypes was less than that for the rest of the replicates. This was because these replicates were protected by a windbreak and it is known that under such conditions evapotranspiration is less [11].
141

Between cultivars, there were variations in grain yield and total yields. The mean grain yields obtained for Rezzak, INRAT69, Chili and Karim were 4.94,5.01,3.91 and 3.8 tons/ha respectively; Rezzak and INRAT69 had the same yield, with a 5% confidence level, and Chili and Karim also had the same yield. The mean total yields obtained for the same order of cultivars listed above were 12.07,15.16,15.63 and 9.68 tons/ha. INRAT69 and Chili also had the same total yield.
Regarding both yields, INRAT69 had high grain and total yield; Rezzak had a high grain yield and low total yield; Chili had a low grain yield and a high total yield; and Karim had low grain and total yields. The total and grain yields were high for all the cultivars in replicates 5 and 6, for the reason mentioned above [11].
The mean TWUE values for Rezzek, INRAT69, Chili and Karim were 36.2, 51.7, 40.9 and 33 kg/m3 respectively. The GWUE values for these cultivars were 14.7, 17.4, 9.0 and 13.3 kg/m3, respectively. There was a great variation between replicates in TWUE and GWUE, except for replicates 5 and 6, for the reasons already mentioned. With respect to TWUE, INRAT69 had a high WUE and ranked after Rezzek, Chili and Karim. Karim had the lowest WUE. For GWUE, INRAT69 still had the highest value, ranking after Rezzek and Karim; Chili had the lowest TWUE.
There was a high correlation between A in straw and A in grain. Therefore, only A in grain was used for comparisons. In this experiment the correlation between GWUE and A was positive, but with a small and significant correlation coefficient (Fig. 5). Similar observations have been made by Bazza [10]. INRAT69 had a high WUE and high A in grain.
TABLE 1. LIST OF WHEAT CULTIVARS USED IN EXPERIMENTS AT INAT
StrainNo.
United States Department of Agriculture No.
CultivarWeight of
1000 grains (8)
Plantationdose
(kg/ha)
1 73 Mahmoudi 48.0 120
2 62 Medea AC3 45.0 113
3 — Chili 54.6 137
4 — Triticale 56.0 140
5 13 Adjini AC1 48.1 120
6 — Ben Bechir 47.8 120
7 — Triticale 33.7 84
8 15 Agili Glabre 45.6 115
9 — Karim 38.9 98
10 — Louria 65.3 162
11 — 122 Chen/Altar 51.3 128
12 53 Jenah Khetifa 35.2 88
13 42 Hamira AC 16 56.5 141
14 55 Lebei Pubescent 43.9 110
15 — Rezzek 48.5 123
16 39 Debassi 47.0 118
17 6 INRAT69 42.1 105
18 34 Biscri GlabreRP2
40.3 100
142

18
14 -
17.35 17.4 17.45 17.5 17.55 17.6 17.65 17.7 17.75A in grain
FIG. 5. Relationship between grain water use efficiency and a in grain.
4. COMPARISON BETWEEN THE RESULTS OF EXPERIMENTS 1 AND 2
Data from experiments 1 and 2 show that the A in straw was always higher than that in grain. The A increases from a dry year to a wet year. The difference between the A in straw in a dry year and that in a wet year was the same as the a in grain in a dry year and that in a wet year, i.e. 1.315. The difference between the A in straw and in grain of a dry year is the same as that between A in straw and the A in grain of a wet year, i.e. 3.59. The same results have also been obtained by Bazza in Morroco [10]. The a depends on the quantity of rain or on the supply of irrigation.
5. CONCLUSIONS
In this investigation, l3C isotope discrimination by the plant was used to rank genotypes for WUE. A negative correlation was observed between grain yield and A, WUE and A. In the second year experiment the results showed a trend opposite to those obtained in the first year. Those were two main differences in the treatments during the first year and the second year. Firstly, the amount of water available was different, rain fall was 330 mm in the first year and 480 mm in the second year). Thus, the plants were less water stressed in the second year. Secondly, the plot size was larger and plants were grown much closer together in the second year thus possibly leading to a higher boundary layer resistance because of the larger canopy. This could explain the positive correlation in WUE and A in wheat grown under semi-arid field conditions. Thus, whyle A can be used a valuable tool in identifying cultivars of wheat high in WUE and yield, caution must be exercised in the selection process as several parameters have to be taken into consideration particulary the specific environmental conditions under which the experiment was conducted, those conditions.
REFERENCES
in MECHERGUI, M., Relationship between phosphate absorbed by the plant and its consumptive use: how it is affected by plant genotypes, Proceedings of the SCOPE/UNEP Workshop on phosphorus cycles in terrestrial and aquatic ecosystems (Tiessen, H., Frossard, E., Eds.) Nairobi, Kenya, 211-215.
143

[2] CHRISTIANSEN, M.N., World environmental limitations to food and fiber culture, Breeding Plant for less Favourable Environments (Lewis, C.F., Ed.) John Willey, New York (1982) 1-11.
[3] HUB1CK, K.T., FARQUAR, T.R., SHORTER,R., Correlation between water-use efficiency and carbon isotope discrimination in diverse peanut (arachis) germoplasm, Aust. J. Plant Phisiol. 13 (1986) 803-16.
[4] TANNER, C B , SINCLAIR, T.R., Efficient water-use in crop production, Res. J. (1983) 1-27.[5] MECHERGUI, M., SNANE, M.H., DAALOUL, A., Identification of durum wheat genotypes with efficiency
on the uptabe and use of water using carbon-13 discrimination and neutron moisture meter, Proc. 2"d Arab Atomic Energy Symposium, Cairo (1994) 12.
[6] FARQUHAR, G.D., O’LEARY, M.H., BERRY, J.A., On the relationship between carbon isotope discrimination and the intercellular carbon dioxide concentration in leaves, Aust. J. Plant Physiol. 9 (1982) 121-37.
[7] FARQUHAR, G.D., RICHARDS, R.A. Isotopic composition of plant carbon correlates with water-use efficiency of wheat genotypes, Aust. J. Plant Phisiol. 11 (1984) 539-52.
[8] CONDON, A.G., RICHARDS, R.A., FARQUHAR, G.D., Carbon isotope discrimination is positively correlated with grain yield grown wheat, Crop Sci. 27 (1987) 996-1000.
[9] WHITE, J. HOOGENBOOM, G. IBARRA, F., SINGH, S.P., Research on drought tolerance in common bean, Proc. Int. Bean Drought Workshop, Cali, Columbia (1987) 165-191
[10] BAZZA, M., KUMARASINGHE, K.S., "Carbon-13 discrimination as a criterion for identifying high water use efficiency wheat genotypes under water deficit conditions", Proc. Int. Symp. on Nuclear Techniques in Soil-Plant Studies for Sustainable Agriculture and Environmental Preservation, IAEA, Vienna, Austria (1995) 429-439.
[11] MECHERGUI, M. MELLOULI, M.H., Competition between windbreak and irrigated crop, Windbreak Technology Proc. (1986) 263-269.
[12] FARQUHAR, G.D., Use of stable isotopes in evaluating plant water use efficiency, Proceedings of Symposium on Stable isotopes in Plant Nutrition, IAEA, Vienna, Austria (1991) 475-88.
144

Part III
ASSOCIATED RESEARCH
::ex i PAescs)left BLANK

Xftf<onWEFFECT OF PHOSPHORUS SOURCES ON PHOSPHORUS AND NITROGEN UTILIZATION BY THREE SWEET POTATO CULTIVARS
A. MONTANEZ, F. ZAPATA Soils Science Unit,FAO/IAEA Agriculture and Biotechnology Laboratory, International Atomic Energy Agency,Seibersdorf
XA9642770
K.S. KUMARASINGHESoil Fertility, Irrigation and Crop Production Section,Joint FAO/IAEA Division of Nuclear Techniques in Food and Agriculture, Intenational Atomic Energy Agency,Vienna
Abstract
EFFECT OF PHOSPHORUS SOURCES ON PHOSPHORUS AND NITROGEN UTILIZATION BY THREE SWEET POTATO CULTIVARS.
A greenhouse experiment was conducted at the FAO/IAEA Agriculture and Biotechnology Laboratory in Seibersdorf, Austria using three sweet potato cultivars, TIS 2, TIS 3053 and TIS 1487. The three sweet potato cultivars were grown at two levels of phosphorus (0 kg P/kg soil and 60 kg P/kg soil). The fertilizer treatments consisted of two sources of phosphorus, Gafza rock Phosphate and triple super phosphate with 14.19 and 19.76% total phosphorus, respectively. I5N labelled urea was used to study the nitrogen recovery in tubers from the applied nitrogen fertilizer. The results from these preliminary studies indicate that there is considerable genotypic variation among cultivars in the efficiency with which phosphorus and nitrogen are taken up and used to produce biomass. Their response to different sources of phosphorus are also variable. TIS-2 and TIS-1487 have a greater ability to absorb phosphorus from Gafza rock phosphate and produce higher tuber yields indicating their greater potential for using alternative sources of natural phosphate fertilizers more effectively. Gafza rock phosphate also increased accumulation of nitrogen in TIS-1487, a characteristic which will place this cultivar at an advantage when growing in soils low in nitrogen. On an overall basis taking into account tuber yield, phosphorus use efficiency, and nitrogen use efficiency, TIS-2 may be considered the better candidate for introduction into soils poor in resources particularly phosphorus. This study was conducted with a limited number of cultivars due to limitation in the availability of germplasm. In spite of this, the differences in their abilities for phosphorus and nitrogen uptake and use are clearly visible which justifies large scale screening experiments using a broader germplasm base, in the future. 1
1. INTRODUCTION
In intensive agricultural production, the primary aim is to increase productivity by the high application of agricultural inputs. It is in relatively recent years that the emphasis is shifting towards the search of such plants which may give high yields with minimum fertilizer application. These plants should obviously combine the two traits: efficiency of absorption and efficiency of utilization to produce sustainable yields.
Sweet potato (Ipomoea batata) has great potential as a high starch human food and as a raw material for ethanol production [1,2]. It is a major root crop produced and consumed in developing countries of which Africa represents a major region. However, their average yields are far below the potential that could be reached primarily due to the low fertility of the soils in which they are usually grown. Being a subsistence crop, application of chemical fertilizers is not common and in many cases fertilizers are either not easily available or are not within the reach of farmers for economic reasons. Of the nutrients, phosphorus is a critical element in early stages of growth and development of the sweet potato plant. Previous studies have shown that phosphorus limitation affects nitrogen assimilation processes, therefore phosphorus sources could affect it as well. One possible means of alleviating the problem of phosphorus deficiency would be the exploitation of genetic variation in response to phosphorus. Earlier reviews have indicated that within many species there is substantial intra-specific variation in response to phosphorus and that scope exist for selection of accessions with improved phosphorus efficiency [3,4]. Where small amounts of phosphate fertilizers
147

are needed for optimum yield, rock phosphates could provide a relatively cheap and an ideal substitute for the expensive soluble phosphate fertilizers particularly in acid soils [5,6,7], Rock phosphate deposits occur in several countries of Asia, Africa and Latin America. Some of these rock phosphates are reactive and can be used directly without pretreatments.
In order to develop better selection criteria for agronomists, preliminary investigations of basic principles at the species levels may be useful. At present there is very little information on phosphorus uptake and its utilization by this crop. As sweet potato tubers start to enlarge at the early growth stage (around 40 days after planting) they develop in parallel with the growth of shoot (leaf and steam) for a long period of time. As a result, it is considered that the shoot may compete with the tubers for photosynthates and nutrients such as nitrogen and phosphorus during most of their growth period.
The objective of this experiment was to evaluate the phosphorus and nitrogen use efficiency of three cultivars of sweet potato in the presence and absence of phosphorus applied as triple super phosphate (TSP) and rock phosphate (PR).
2. MATERIALS AND METHODS
A greenhouse experiment was conducted at the FAO/IAEA Agriculture and Biotechnology Laboratory in Seibersdorf, Austria using three sweet potato cultivars, TIS-2, TIS-3053 and TIS-1487. The plants were brought from the International Institute of Tropical Agriculture (HTA) in Ibadan, Nigeria and multiplied by stem cutting. Uniform apical stem cuttings with about three fully expanded leaves were obtained from the same source. A single-stem cutting was transplanted in the month of August in each pot. Experimental units were 10 kg plastic pots. At transplanting a homogeneous sample of 6 plants per variety were taken to measure dry weight and initial phosphorus content. The three sweet potato cultivars were grown at two levels of phosphorus (0 kg P/kg soil and 60 kg P/kg soil). Two sources of phosphorus were used, Gafza rock phosphate (GRP) with 14.19% total phosphorus and triple super phosphate with 19.76% total phosphorus. Phosphate fertilizers were applied to each pot by prior mixing with the soil.
15N labelled urea of 10% atom excess was added at planting to each pot in quantities equivalent to 37 mg N/kg soil. Potassium is especially important to promote swelling of the tubers. Potassium and others nutrients were applied as nitrogen/phosphorus free Hoagland nutrient solution at the rate of 30 ml/pot, each week.
The soil used was non-sterilized soil and each pot was filled with 10 kg of 1:2 mixture of sand and soil classified as Brown earth, having a pH (KC1) of 4.38 and low available P. Pots were maintained at a moisture content near field capacity throughout the experiment. Plants were maintained in the greenhouse at a mean day/night temperature of 28/20°C and 50 to 70% humidity.
Sequential harvests were performed at 35, 60 and 90 days after planting. At each harvest, the fibrous roots and tubers were carefully picked by hand from the soil and the roots were washed with tap water and fibrous roots and tubers were separated. Dry weight of shoots, tubers and fibrous roots were obtained after chopping and drying in an oven at 70°C for 48 h. Total phosphorus was determined using the phospho-vanadomolybdate yellow method [8] and the 15N was used as a tracer [9] to measure nitrogen uptake and use by different cultivars. Plant samples were analysed for %N on a Kjeldahl digest [10] and the 15N isotope ratio analysis was performed on a VG-isogas mass spectrometer using Dumas Combustion method [11]
Vesicular-arbuscular mycorrhizal (VAM) root infection was also determined. Fibrous roots were cut into 1 cm long pieces, cleared with 10% KOH and stained with Trypan Blue according to procedures as described by Philips and Hayman [12].
The phosphorus uptake was calculated taking into account the total phosphorus accumulated in the plant. Nitrogen uptake was calculated directly through the use of ,SN as a tracer [9]. Physiological nutrient use efficiency of phosphorus and nitrogen was determined as the biomass per unit of tissue nutrient concentration, as described by Siddiqi and Glass [13]. According to this: E =
148

W/C and C = NZW thus E = 2W/N where E is efficiency of utilization, W is biomass, C is tissue concentration and nitrogen is amount of nutrient in biomass. The percent of fertilizer nutrient utilization (FNU) or recovery has been calculated as: FNU = Nitrogen uptake/Nitrogen applied x 100
Analysis of variance was performed to assess the effects of phosphorus sources and cultivars on nitrogen and phosphorus uptake and utilization. A split-split plot design with randomized complete block was used, with phosphorus sources as main plot and cultivars and harvest as sub-plot and subsub plot respectively. Treatments were replicated three times. Comparisons between means of treatments for various measured parameters were made by the least significance difference (LSD) test (PC0.05).
3. RESULTS AND DISCUSSION
3.1. Dry matter yieldDry matter yield of different varieties of sweet potatoes at three growth stages are presented
in Table I. There were significant differences in dry matter yield between phosphorus sources and cultivars at harvest 1, 2 and 3. Therefore the cultivars differed among themselves in their response to availability of phosphorus. Application of phosphorus either in the form of triple super phosphate or Gafza rock phosphate, resulted in significant increase in dry matter yield of TIS-1487, TIS-2 and TIS-3053 over control (OP). Dry weight of fibrous roots, shoots and tubers increased with time and phosphorus application. The phosphorus source x time x cultivar interaction was not significant. Among the sweet potato cultivars tested, TIS-1487 had a high capacity to grow in the absence of added phosphorus at harvest 1 and harvest 2 but this cultivar was low in total yield with Gafza rock phosphate fertilizer at harvest 1. However all the cultivars responded strongly to the triple super phosphate fertilizer.
Tuberization started first in cultivar TIS-1487 at 35 days after planting and the highest tuber dry weight was observed in cultivars TIS-1487 and TIS-2 at harvest 3. On the basis of tuber yield response the susceptibility of sweet potato to phosphorus stress at harvest 3 was in the order TIS- 3053 > TIS-2 > TIS-1487. From a practical point of view the cultivars which produced well under a low level of phosphorus and responded well to added phosphorus are the most desirable. Cultivars TIS-1487 and TIS-2 fall into this category.
TABLE I. EFFECT OF PHOSPHORUS SOURCE ON DRY MATTER YIELD OF SHOOT, ROOT AND TUBERS OF THREE SWEET POTATO CULTTVARS
Harvest 1 Harvest 2 Harvest 3p Cultivars Dry matter yield (g/plant)
sources Shoot Root Shoot Root Tubers Shoot Root TubersOP TIS 1487 2.28 0.48 4.87 0.68 8.74 8.01 1.09 13.88
TIS 2 1.61 0.41 7.30 3.36 9.55 2.07 16.87TIS 3053 1.36 0.41 8.81 3.11 13.54 4.01 3.36
TSP ITS 1487 2.84 0.49 7.32 1.32 8.79 11.88 1.91 22.65TIS 2 1.85 0.30 10.20 4.23 12.76 2.99 19.44US 3053 1.68 0.33 11.78 4.50 19.30 8.28 7.74
GPR US 1487 1.82 0.34 5.31 0.79 8.82 7.85 1.46 22.72US 2 1.99 0.40 8.94 4.73 10.72 2.79 20.33TIS 3053 2.05 0.47 9.67 3.92 15.50 5.54 6.71
* LSD at the 0.05 level of probability to compare P sources (P), cultivars (C), harvest (H) and any two means, respectively.LSD (p<0.05) shoot; P: 1.25; C:1.06; H: 0.82; PxH: 1.42; CxH; 1.42.
LSD (p<0.05) root; C:0.39; H: 0.61; PxH; 1.05; CxH; 1.05.
LSD (p<0 05) tubers; P: 59; C: 5.7.
149

3.2. Phosphorus P uptakeThe results showing the total uptake of phosphorus by different cultivars are presented in
Table II. These data indicate that phosphorus uptake from the two sources used differed widely among cultivars, with triple super phosphate providing the marginally better values. Accumulation of phosphorus varied significantly within sweet potato cultivars at each harvest showing that cultivars may differ in their ability to utilize the phosphorus applied as fertilizer. At earlier growth stages with triple super phosphate application, the total uptake of phosphorus was highest in TIS-1487 cultivar. However at harvest 2 and 3 greater amount of phosphorus was absorbed by TIS-2 and TIS-3053 showing a better performance to triple super phosphate fertilization. The cultivar which accumulated less phosphorus at early stages (TIS-3053) showed high susceptibility to phosphorus stress. However the best performance at OP level was TIS-1487 but at 90 days after planting with T-1487 and TIS-2 showed high phosphorus uptake at all phosphorus sources. However, high shoot and tuber growth and high phosphorus uptake of these cultivars was not associated with high fibrous root growth. This indicates that phosphorus uptake efficiency may not be directly related to growth of the fibrous roots at least in plants where roots develop into storage organs as in sweet potatoes.
With the rising cost of phosphorus fertilizer, the potential of using cultivars efficient in use of nutrients in order to increase and/or stabilize crop production is becoming increasingly attractive. Results of this study indicate that sweet potato cultivars differ significantly in their phosphorus requirements and phosphorus utilization from different sources.
TABLE II. EFFECT OF PHOSPHORUS SOURCE ON PHOSPHORUS ACCUMULATION IN SHOOT, ROOT AND TUBERS OF THREE SWEET POTATO CULTIVARS
psources
CultivarsHarvest 1 Harvest 2 Harvest 3
Shoot Root ShootP uptake (mg P/plant)
Root Tubers Shoot Root TubersOP TIS 1487 6.97 1.08 10.08 0.77 11.36 16.37 1.31 28.15
ns 2 4.34 0.91 8.92 3.36 11.47 2.48 19.94ITS 3053 2.82 0.76 13.71 4.05 21.92 1.87 5.15
TSP ns 1487 10.41 1.38 14.99 1.61 11.76 23.99 2.10 46.25ns 2 6.02 0.75 22.40 9.71 27.98 5.46 42.86ns 3053 4.20 0.81 25.26 8.24 41.77 6.61 17.20
GPR ns 1487 6.31 0.87 13.61 1.04 12.93 19.97 3.72 57.97ns 2 6.54 0.97 20.10 10.58 24.29 6.77 45.26ns 3053 5.26 1.06 18.07 5.71 28.67 7.27 12.75
* LSD at the 0.05 level of probability to compare P-sources(P), cultivars (C), harvest (H) and any two means, respectively.LSD (p<0.05) shoot; P: 3.3; C;2.i; H: 1.8; PxH: 3.2; CxH: 3.2.LSD 0X0.05) root;: C: 1.1; H: 1.2; CxH: 2.2.LSD(p<0.05) tuber, P: 11.6; C:12.3.
At low phosphorus and nitrogen levels in the soil, sweet potatoes are usually colonized by VAM fungi [14]. The magnitude of the growth response is affected by the soil phosphorus and nitrogen contents, inherent effectiveness of the VAM fungi, and inherent differences among sweet potato cultivars [8], Recent experiments have shown increases in plant growth, P/N incorporation, and tuber yields when the sweet potato plants were inoculated with VAM fungi. The potential inoculum in the soil used in this experiment was low and as a result the plants even at OP level were not infected by the native mycorrhizas. The results are therefore not reported here.
3.3 Phosphorus use efficiencyThe results on phosphorus use efficiency of the three sweet potato cultivars in the presence
of the different phosphorus sources are shown in Fig. la and Appendix Table XXXIII. The phosphorus use efficiency was highest in the absence of applied phosphorus followed by triple super phosphate and the rock phosphate indicating that there are pronounced differences in phosphorus
150

Nitr
ogen
use
effic
ienc
y (g
dw
2/m
g N) Phosphorus u
se ef
ficie
ncy
(g d
w2/
mg
Q- 16
Phosphorus source12
OP TSP GRPPhosphorus source
FIG. 1. Genotypic differences in phosphorus use efficiency (a) and nitrogen use efficiency of three cultivars of sweet potato in the presence of triple super phosphate (TSP), Gajza rock phosphate (GRP), and in the absence of applied phosphorus (OP).
151

nutrition between sweet potato cultivars. TIS-1487 and TIS-2 appear to have access to a source of phosphorus in Gafza rock phosphate that was less available to the other cultivars. In the earlier harvest there was little interaction between cultivars performance and phosphorus sources. Cultivars which grow well with phosphorus application also performed well at OP level. This indicates that the differences in performance between cultivars at OP and phosphorus application were related more to differences in the efficiency with which the absorbed phosphorus is utilized for growth than to inherent differences in ability to absorb phosphorus. Growth of TIS-3053 rapidly increases at later stages producing high amount of dry weight of shoot compared with dry weight of tuber at harvest 3. TIS-3053 is also much slower to establish than TIS-2 and TIS-1487, and this may be related to its poor ability for phosphorus uptake and use.
The magnitude of the differences in phosphorus nutrition between cultivars observed in this study has important implications, as scarcity of phosphorus fertilizers is likely to become a major problem in the future. The fact that TIS-2 and IIS-1487 are able to absorb phosphorus better from Gafza rock phosphate and produce higher tuber yields indicate their greater potential for using alternative sources of natural phosphate fertilizers more effectively.
3.4 N uptake and nitrogen use efficiencyThe results (Appendix Table XXXIV) show that nitrogen uptake by shoots although
significantly different among cultivars and between phosphorus treatments, these differences became less obvious at harvest 3 when plants were more developed. On the other hand, nitrogen accumulation in tubers showed marked differences with TIS-1487 being superior to other cultivars and in all phosphorus treatments. Application of Gafza rock phosphate clearly increased accumulation of nitrogen in TIS-1487, a characteristic which will have great advantage for cultivation in areas low in soil nitrogen.
The %Ndff in tubers (Fig. lb and Appendix Table XXXV) did not show much of a difference between harvests 2 and 3. In the 3rd harvest, the values ranged from 57 to 66. The %Ndff was in general similar in shoots and in tubers. However, the recovery of nitrogen showed significant differences between shoots and tubers, the recovery in tubers being lower than in the shoots. Much of the nitrogen applied as fertilizer accumulated more in the shoots and less in tubers probably because tubers accumulate more carbohydrates than nitrogenous compounds. This is also evidenced by the fact that the total nitrogen in tubers is usually about half that of the shoots. The nitrogen use efficiency of the tubers (Table III) varied significantly between cultivars and within cultivars depending on the phosphorus source. TIS-2 showed the best nitrogen use efficiency in the presence of Gafza rock phosphate followed by TIS-1487 in the presence of TSP. The nitrogen use efficiency of TIS-3053 was the lowest (1.07) in the absence of applied phosphorus but improved in the presence of triple super phosphate and GRP. On an overall basis taking into account tuber yield, phosphorus use efficiency, and nitrogen use efficiency, TIS-2 may be considered a good candidate for introduction into soils poor in resources particularly phosphorus. 4
4. CONCLUSIONS
The results from these preliminary studies indicate that there is much genotypic differences in the efficiency with which phosphorus and nitrogen are taken up and used by different cultivars of sweet potatoes. Their response to different sources of phosphorus are also variable. TIS-2 and TIS- 1487 have a greater ability to absorb phosphorus from Gafza rock phosphate and produce higher tuber yields indicating their greater potential for using alternative sources of natural phosphate fertilizers more effectively. Gafza rock phosphate also increased accumulation of nitrogen in TIS-1487, a characteristic which will place this cultivar at an advantage when growing in soils low in nitrogen. On an overall basis taking into account tuber yield, phosphorus use efficiency, and nitrogen use efficiency, TIS-2 may be considered the better candidate for introduction into soils poor in resources particularly phosphorus. This study was conducted with a limited number of cultivars due to limitation in the availability of germplasm. In spite of this, the differences in their abilities for phosphorus and nitrogen uptake and use are clearly visible which justifies large scale screening experiments using a broader germplasm base, in the future.
152

TABLE III. EFFECT OF PHOSPHORUS SOURCE ON TOTAL N, %NDFF AND %N RECOVERY (%FNU) IN SHOOT, ROOT AND TUBERS OF THREE SWEET POTATO CULTIVARS
Harvest 1 Harvest 2 Harvest 3p Cultivars Total N (mg N/plant)
sources Shoot Shoot Tubers Shoot TubersOP TIS 1487 108.18 126.38 226.51 123.14 66.22
TIS 2 68.89 127.77 131.37 67.66TIS 3053 58.23 158.54 141.79 18.01
TSP TIS 1487 125.02 142.90 170.50 155.58 78.22TIS 2 80.38 137.71 141.40 65.82TIS 3053 67.67 169.96 166.62 28.82
GPR TIS 1487 83.29 126.90 211.17 127.04 100.00TIS 2 88.17 146.44 136.78 69.22
TIS 3053 84.72 142.59 - 147.62 29.93
%Ndff
OP TIS 1487 78.56 69.16 70.31 64.68 65.79TIS 2 71.01 66.36 62.32 62.69TIS 3053 70.64 65.79 62.59 58.98
TSP TIS 1487 79.07 68.08 67.81 64 07 65.22TIS 2 67.75 65.12 61.64 59.79TIS 3053 60.63 67.41 62.35 56.52
GPR TIS 1487 68.25 66.70 65.89 58.21 61.31TIS 2 69.70 66.70 57.94 56.12TIS 3053 69.80 65.32 - 61.21 58.00
% FNU
OP TIS 1487 22.82 23.48 42.76 21.37 11.73TIS 2 13.18 22.77 21.99 11.47TIS 3053 11.09 28.05 23.85 2.83
TSP TIS 1487 26.48 26.21 31.48 26.80 13.72TIS 2 14.74 24.14 23.41 10.58TIS 3053 11.06 30.80 27.91 4.35
GPR TIS 1487 15.37 22.75 37.37 19.76 16.39TIS 2 16.51 26.23 21.24 10.24TIS 3053 15.92 25.04 _ 24.36 472.00
153
ACKNOWLEDGEMENTS
This work was carried out at the FAO/IAEA Agriculture and Biotechnology Laboratory in Seibersdorf, Austria as part of back-up research in support of the FAO/IAEA/SIDA Co-ordinated Research Programme on The Use of Isotope Studies on Increasing and Stabilizing Plant Productivity in Low Phosphate and Semi-arid and Sub-humid Soils of the Tropics and Sub-tropics (D 1.50.02). The authors thank Ms. Helga Axmann for her assistance in 15N analytical services.
REFERENCES
[1] DANGLER J. M., LOCASCIO S. J., HALSEY L. N., Sweet potato, for biomass. Biomass 4 (1984) 253-261.[2] LOCASCIO S. J., DANGLER J. M., Starch and mineral nutrient accumulation by sweet potato cultivars. In
Smith V. H. (ed.). Biomass energy development. Plenum Press, New York, (1986) 197-205.[3] AHLOOWALIA,B. S.,KUMARASINGHE, K. S.,S1GURBJOERNSSON, B., MALUSZYNSKI, M., Genotypic
selection for improved phosphorus utilization in crop plants, Genetic manupulation of crop plants to enhance inegrated nutrient management in cropping systems!, Phosphorus: Proc. of an FAO/ICRISAT Expert Consultancy Workshop, 15-18 March 1994, ICR1SAT Asia Centre, India (Johansen, C., Lee, K.K. Sharms, K K , Subbarao, G.V., Kueneman, E.A., Eds) (1995) 49-54.
[4] FdHSE, D , CLAASEN, N., JUNGK, A., Phosphorus efficiency of plants, Plant and Soil 110 (1988) 101-109.[5] Mahotra C. L., Efficiency of rock phosphates compared to super phosphates. Pert. News. 13 (9) (1986) 27-32.[6] LEON L. A., FENSTER W. E., HAMMOND L. L., Agronomic potential of eleven phosphate rocks from Brazil,
Colombia, Peru and Venezuela. Soil. Sci. Am. J. 50 (1986) 798-802.[7] HAMMOND D. T., CHIEN S.H., MOKWUNYE A. U., Agronomic values of unacidulated and partially
acidulated phosphate rocks indigenous to the tropics. Adv. Agron. 40 (1986) 89-140.[8] HUNG L. L., SYLVIA D. M., O’KEEFE D M., Isolate selection and phosphorus interaction of vesicular
arbuscular mycorrhizal fungi in biomass crops. Soil Sci. Am. J. 54 (1990) 762-768.[9] ZAPATA F., Isotope techniques in soil fertility and plant nutrition studies of soil-plant relationships. International
Atomic Energy Agency (1990) Vienna.[10] EASTTN, F. F , Total nitrogen determination for plant materials, Anal. Biochem , 85 (1978) 591-594.[11] FIEDLER, R , PROKSCH, G., The determination of N-15 by emission spectrometry in biochemical analysis, A
Review, Anal. Chim. Acta 78 (1975) 1-62.[12] PHILLIPS!. M., HAYMANN D. S., Improved procedures for clearing roots and staining parasitic and vesicular-
mycorrhizal fungi for rapid assessment of infection, trans. British. Mycol. Soc. 55 (1970) 158-160.[13] SIDDIQIM Y., GLASS A. D. M., Utilization index: a modified approach to the estimation and comparison of
nutrient utilization efficiency in plants. Journal of Plant Nutrition. 4(3) (1981) 289-302.[14] NGEVE J. M., RONCADOR1 R. W., The interactions of vesicular-arbuscular mycorrhizae under aseptic
conditions. J. Gen. Microbiol. 27 (1985) 509-520.
154

CARBON ISOTOPE DISCRIMINATION AS A SELECTION TOOL FOR HIGH WATER USE EFFICIENCY AND HIGH CROP YIELDS
K.S. KUMARASINGHE, C. KIRDA1, G.D. BOWEN2,Soil Fertility, Irrigation and Crop Production Section,Joint FAO/IAEA Division of Nuclear Techniques in Food and Intenational Atomic Energy Agency,Vienna
XA9642771
Agriculture,
F. ZAPATA, K.O. AWONAIKE, E. HOLMGREN3, A. ARSLAN4, E C. DE BISBAL5, A.R.A.G. MOHAMED6, A. MONTENEGRO7 Soils Science Unit,FAO/IAEA Agriculture and Biotechnology Laboratory,International Atomic Energy Agency,Seibersdorf
Abstract
CARBON ISOTOPE DISCRIMINATION AS A SELECTION TOOL FOR HIGH WATER USE EFFICIENCY AND HIGH CROP YIELDS.
Results of back-up research conducted at the FAO/IAEA Agriculture and Biotechnology Laboratory in support of the FAO/IAEA Co-ordinated Research Programme on the Use of Isotope Studies on Increasing and Stabilizing Plant Productivity in Low Phosphate and Semi-arid and Sub-humid Soils of the Tropics and Sub-tropics, are presented here. This work mainly focused on field validation, using neutron probes, of the recently developed l3C discrimination (A) technique, considered a possible future tool for screening and selection of crop species for high water use efficiency (WUE) and high yields. 1SC discrimination in leaves is a plant trait indicative of drought adaptability. Both field and glasshouse experiments were carried out involving food crops and tree species. In addition to experiments solely conducted by the research staff of the laboratory, research fellows themselves as part of their training at the laboratory, carried out experiments which have generated very valuable information.
Neutron probe measurements confirmed the earlier reports of a strong correlation of A with grain yield and water use efficiency of wheat. High soil gypsum content and soil salinity, a wide spread problem in soils of arid and semi-arid climatic zones, do not interfere with the association of A with crop yields, provided plants are grown in similar soil water status and soil fertility level. Results of a glasshouse experiment using selected cowpea genotypes showed that A values measured at flowering stage positively correlated with total dry matter production and percent N2 derived from atmosphere (%Ndfa), contributing to an earlier report from the laboratory that it may be possible to use A values for screening of leguminous crops for high N2 fixation potential. I3C isotope discrimination in the leaves of Gliricidia septum was measured to examine if the technique could be extended to studies with trees. Results of a glasshouse experiment with 18 provenances of Gliricidia sepium showed highly significant correlations of A with total dry matter production, water use efficiency and total N accumulated through biological nitrogen fixation. Although the correlations of A with water use efficiency and dry matter yield are reatively clear and better understood, the correlation with nitrogen fixation still needs a closer examination under different environmental conditions and with different species. While ,3C isotope discrimination may be a valuable tool for identifying annual crops with high water use efficiency and high yield potential, it may be more attractive for tree species considering the long growth periods taken for trees to produce economic yields either for food, fodder or for fuelwood.
1. INTRODUCTION
Identifying genotypes with high water use efficiency and high yield has become an important issue as environmentally friendly and sustainable agricultural practices receive high priority in all
Present address: ‘Faculty of Agriculture, University of Cukurova, 01330 Adana, Turkey; "Division of Soils, Commonwealth Scientific and Industrial Research Organization, Glen Osmond, Australia; 3FAO Regional Office for Africa, Accra, Ghana; 4Syrian Arab Republic, Atomic Energy Commission Damascus, Syrian Arab Republic; 5Centro Nacional de Investigaciones Agropecuarias (FONAIAP-CENIAP), Aerea Universitaria, Apartado Postal 4653, El Limdn, Maracay 2101, Venezuela; "Atomic Energy Authority, Nuclear Research Center, Cairo, Egypt; ; 7National Institute for Agr. and Livestock Research, Exp. Station Carillanca, Temuco, Chile.
155

countries. For the initial screening process, rapid but reliable greenhouse or field methods for assessing the yield potential, particularly under water limited environments, would be invaluable [1], Water stress is the most important limitation to crop productivity in water scarce arid and semi-arid regions of the world. Although agronomic practices are important under water deficit agricultural areas, cultivar improvement is usually seen as the most promising approach to increase yields [2]. Plant breeders and plant physiologists believe that better adapted and high yielding varieties could be bred more efficiently and effectively if plant attributes which are indicative of high yields under water limited conditions could be identified and used as selection criteria [3]. Therefore identification of plant attributes contributing to superior performance of crop plants under drought conditions has been a long-term goal of plant scientists. Water use efficiency is a trait which can contribute to crop productivity in the areas where water resources are scarce [4] because it is considered an important component of adaptation to drought [5]. Water use efficiency, in general terms, is the ratio of productivity to water loss by a plant. It is defined as the molar ratio of photosynthesis to transpiration (short-term measurements) or as the ratio of biomass produced to water consumed (long-term measurements) [6].
One of the difficulties in using plant water use efficiency as a trait for identifying genotypes superior in performance under drought conditions is the difficulty of accurately assessing water use efficiency in large scale field experiments. Faquhar et al. [6] have shown that genotypic variability in intrinsic water use efficiency (mole of C fixed per mole of water transpired) is closely associated with 13C discrimination (A) in C3 plants. Subsequent studies demonsted that the extent of l3C isotope discrimination is a reliable indicator of water use efficiency and that substantial genotypic variability exits in this character [6], In wheat [1,7, 8], cowpea [9], peanut [10], cotton [11], tomato [12], grasses [13, 14], and in upland rice [15], l3C discrimination has shown a negative correlation with field water use efficiency (dry matter produced per unit amount of water used). It was also shown that A correlates significantly with grain yield of wheat and barley [1, 16, 17], and dry matter yield of cowpea [9], and forage grasses [13]. The carbon isotope discrimination has also shown a close association with other plant characteristics other than the yield attributes. For example, Masle and Farquhar [18] reported that A correlates positively with the leaf mineral content in C3 species, and negatively in sorghum, a C4 species. Kumarasinghe et al. [19] found a negative correlation of A with biological nitrogen fixation in soybeans.
Although there are reports on the potential use of A as a screening tool for annual crops for high water use efficiency and high crop yields in drought conditions, very little information is available at present (with the exception of the work of Meinzer et al. [20]) on the possible uses of this technique for identifying tree species with high water use efficiency and high biomass production. Meinzer et al. [20] demonstrated a close correlation between A and yield of coffee. Studies conducted under an IAEA Technical-Co-operation project in Sri Lanka (SRL/5/026) have shown that l3C isotope discrimination in leaves of coconut is negatively correlated with water use efficiency and also with dry matter yield. These preliminary studies indicate that 13C isotope discrimination could be used as a valuable tool to select coconut cultivars efficient in water use and high in yield so that they could be recommended for cultivation in areas with low water resources. The methods also has the additional advantage in that the long experimental periods commonly required for tree crops like coconut, oil palm, rubber, tea, and coffee can be substatially reduced saving considerably on experimental inputs including labour.
The Soil Fertility, Irrigation and Crop Production Section of the Joint FAO/IAEA Division of of Nuclear Techniques in Food and Agriculture implemented a Co-ordinated Research Program on the Use of Isotope Studies on Increasing and Stabilizing Plant Productivity in Low Phosphate and Semi-arid and Sub-humid Soils of the Tropics and Sub-tropics which included a major component on water use efficiency studies. The validity of the 13C isotope discrimination technique was investigated in greenhouse and field experiments involving annual crops and perrenial tree species. The program was funded by the Swedish International Development Authority (SIDA), in Sweden. Back-up research at the FAO/IAEA Agriculture and Biotechnology Laboratory in Seibersdorf was conducted by the staff as well as by IAEA Fellows. Highlights of the research carried out in the laboratory are presented here.
156

2. ANNUAL CROPS
2.1. Wheat
2.1.1 Carbon isotope discrimination at vegetative stage as indication of yield and water useefficiency of spring wheatA.R A G. Mohamed, Atomic Energy Authority, Nuclear Research Center, Cairo, Egypt: A
field experiment was conducted to investigate if A measured at vegetative stage of spring wheat (Triticum turgidum L. var. durum) is related with the yield and field water use efficiency at repining. A line source sprinkler irrigation system exposed the wheat genotypes to different levels of watering, from rainfed to full irrigation. The results of A values measured at late stem elongation stage, 60 days after planting, shows strong positive correlation with total dry matter yield (Fig. 1), and highly significant negative correlation with water use efficiency measured at ripening 105 DAP (Fig. 2). The data (also published elsewhere [1]), suggest that the imprints of A measured at vegetative stage persists throughout the entire growth period, until maturity
P-3502
aONAOUR
CRANDUR
COLOUR
WATER USED, ET (CM)FIG. 1. Total dry matter yield of spring wheat (Triticum turgidum L. var. Durum) genotypes at ripening stage (105 DAP) and the carbon isotope discrimination, measured at 60 DAP, are positively correlated with plant water consumption (ET) during the early growth period until 60 DAP (After Kirda et. al. [1]).
157

0.067X + 1.740.755
DISCRIMINATION, A x1 0
O P—3502
A BONADUR
□ GRANDUR
COLOUR
FIG. 2. Water use efficiency of four spring wheat (Triticum turgidum L. var. Durum) genotypes at ripening (105 DAP) gives strong association with cabon isotope discrimination measured at 60 DAP (After Kirda et al. flj).
2.1.2 Carbon isotope discrimination as an indicator of yield and water use efficiency of springwheat grown in salt-affected gypsiferous soilsA. Arslan, Syrian Arab Republic, Atomic Energy Commission, Damascus, Syria: In a pot
study, the relationship between A and water use efficiency of six wheat cultivars grown in Syria (Buhuth 1, Daki, L43, Cham 3, Cham 4, and L92-6) was examined in salt affected gypsiferous soils, common and wide spread in the Euphrates basin. Soil treatments were of a non saline gypsum-free soil (SOGO), and the same soil but amended with gypsum (S0G1), with salts alone (S1G0), and with gypsum and salts (S1G1). Treatments with gypsum (S0G1 and S1G1) had 14 % industrial gypsum. Saline treatments (SIGO, S1G1) were prepared using either NaCl or CaCl2 at a rate of 9 g salt per kg of soil sample. Some key data on chemical analysis of the experimental soils are given in Table 1. The results showed that neither gypsum nor salinity affected potential use of A for screening for high crop yields and water use efficiency. Figure 3 shows a significant negative correlation between A and water use efficiency as commonly reported [1,7,8]. A negative correlation also existed with dry matter production and A (Figure 4) indicating that biological yield of wheat varieties tested was predominantly controlled by different photosynthetic capacities [1, 2]. The existence of a positive correlation in A and water use efficiency in wheat has been previously shown by Hubick et al [21]. Farquhar and Richards [7] also reported a similar negative correlation between A and dry matter production under wet soil conditions where plants were not exposed to water stress as was the case in this work.
158

TABLE I. CHEMICAL ANALYSIS OF THE EXPERIMENTAL SOILS
Treatments
Measurement SOGO SI GO S0G1 S1G1
0M(%) 2.5 1.9 1.7 2.1EC. (dS.m-1) 0.8 8.9 2.6 10.3pH 7.7 7.5 7.5 7.4CaCOj (%) 5.2 4.7 3.2 4.7Gypsum (%) T T 14.8 13.3Cations (me. I"1) 10.1 104.7 46.0 137.8SAR 0.38 16.19 0.18 11.21
cr>
>xoc«*o
a>mD0)■Ho
SOGO r*—0.897r=—0.803
Discrimination (ax103)
FIG. 3. Regression lines for water use efficiency versus A as influenced by soil salinity and soil gypsum content.
159

15.0-1E
O□
e S0G0 o S0G1 o S1G1
r=-0.977 r=-0.699 r= -0.856
o
Discrimination (ax 103)
FIG. 4. Regression lines for total dry matter production versus A as influenced by soil salinity and soil gypsum content.
2.1.3. Effects of water stress during different growth stages of wheat on N fertilizer uptake, yield andUC discriminationE. Holmgren, Soil Science Unit, FAO/IAEA Agriculture and Biotechnology Laboratory,
Seibersdorf, Austria: A greenhouse experiment was conducted with the objective of assessing how water stress imposed at selected growth stages of wheat would influence A, N fertilizer uptake and yield of 8 different wheat varieties. Correlations between A and water use efficiency measured with conventional methods (i.e., water balance), yield and N fertilizer uptake, measured with 15N dilution technique [22], were investigated .
Eight spring wheat (Triticum turgidum L. var. durum) varieties, four from Austria (Goldur, Bonadur, Grandur and P3502-85), two from Egypt (Sakka 8 and Giza 163) and two from Chile (Naofen and Dalcahue) were used. The seeds were sown in plastic pots (16.5 cm diameter, 17.5 cm deep) containing 4.5 kg of soil-sand mixture. The soil used is classified as Typic Eutrocrets (pH 7.4, 0.3 % N, clay loam), and it was mixed with washed sand at 2:1 soil-sand ratio. Field capacity and wilting point of the soil mixture were found to be 0.22 and 0.66 g.g"1- respectively. Each pot had 4 plants. Ammonium sulfate solution (1 % l5N atom excess) was applied to supply 100 mg N.kg"1 soil. Four watering programs, consisting of a control (i.e. no stress) and water stress imposed at mid vegetative, flowering and at yield formation stages (Fig. 5). The treatments were imposed when half of the plots had reached the selected growth stage. Soil water content in the pots with the stressed plants was kept within the range from 25 to 40 % of field capacity; whereas, the pots of the non stressed plants had a water content of 80 to 100 % field capacity. Soil water content of the pots were controlled by weighing the pots every two days. Weighing of the pots also facilitated calculation of total water usage and thereby of measuring water use efficiency. The experiment was arranged in a completely randomized block design with three replicates. Plants were harvested 1-2 cm above ground and all relevant yield attributes were measured. Plant samples were prepared and anlyzed for 15N and the A values.
With the provision of adequate watering during the establishment period, it was revealed that the most critical period for water deficit was the flowering stage. Both grain yield and water use efficiency were significantly reduced with water stress imposed at flowering stage. Results showed that there are highly significant genotypic differences with respect to grain yield, water use efficiency,
160

FIG. 5. Vegetative (Tl), flowering(T2) and yield formation (T3) stages of wheat when water stress was imposed.
% N derived from fertilizer (% N dff) and 13C discrimination (Table II). There are also highly significant negative correlations between A, water use efficiency and % N dff (Table III). However, no association between A and yield existed possibly because of very narrow range of variation observed in both yield and A values of the 8 wheat varieties tested.
The results obtained from this greenhouse experiment suggest that A measurements can usefully be used for selecting of wheat genotypes with high water use efficiency and effective use of applied N fertilizer.
TABLE II. WATER STRESS TREATMENT EFFECTS ON YIELD, WATER USE EFFICIENCY (WUE), % Ndff AND A VALUES OF SPRING WHEAT VARIETIES.
Yield WUE % Ndff A
Treatment *** *** «** ***Genotype *** *** *** $**Interaction NS NS NS **
161
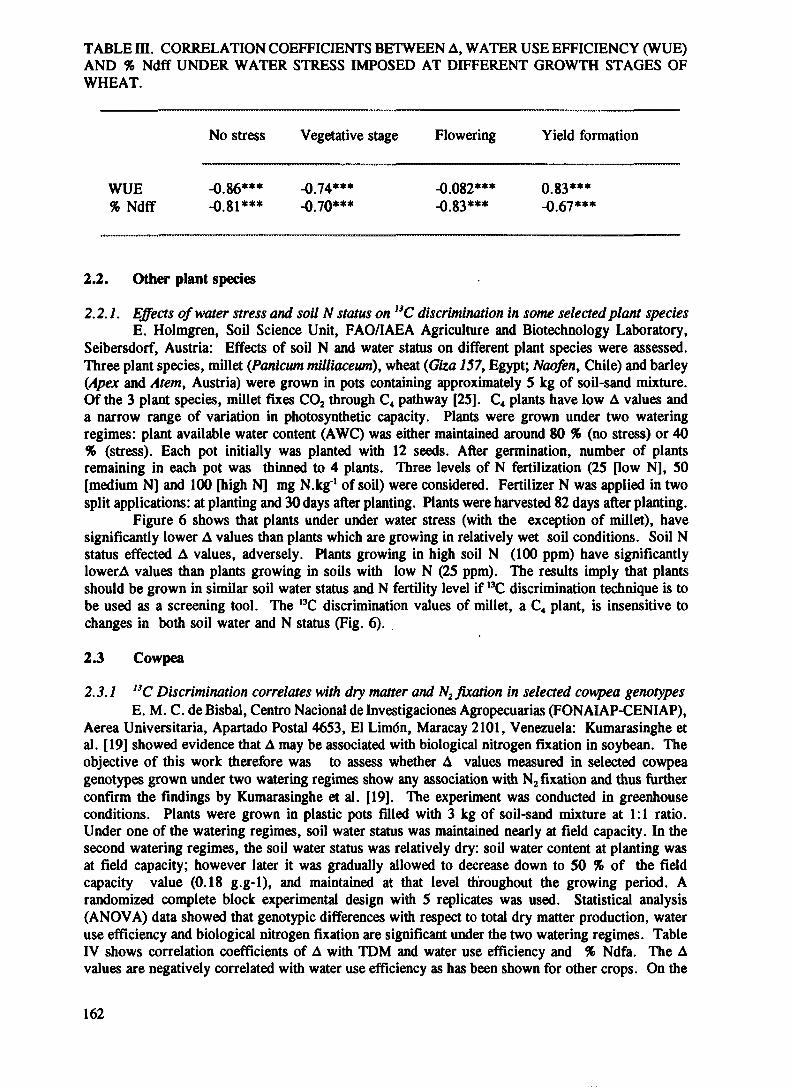
TABLE HI. CORRELATION COEFFICIENTS BETWEEN A, WATER USE EFFICIENCY (WUE) AND % Ndff UNDER WATER STRESS IMPOSED AT DIFFERENT GROWTH STAGES OF WHEAT.
No stress Vegetative stage Flowering Yield formation
WUE -0.86*** -0.74*** -0.082*** 0.83***% Ndff -0.81*** -0.70*** -0.83*** -0.67***
2.2. Other plant species
2.2.1. Effects of water stress and soil N status on 13 C discrimination in some selected plant species E. Holmgren, Soil Science Unit, FAO/IAEA Agriculture and Biotechnology Laboratory,
Seibersdorf, Austria: Effects of soil N and water status on different plant species were assessed. Three plant species, millet (.Patdcum milliaceum), wheat (Giza 157, Egypt; Naofen, Chile) and barley (Apex and Atem, Austria) were grown in pots containing approximately 5 kg of soil-sand mixture. Of the 3 plant species, millet fixes C02 through C4 pathway [25]. C4 plants have low A values and a narrow range of variation in photosynthetic capacity. Plants were grown under two watering regimes: plant available water content (AWC) was either maintained around 80 % (no stress) or 40 % (stress). Each pot initially was planted with 12 seeds. After germination, number of plants remaining in each pot was thinned to 4 plants. Three levels of N fertilization (25 [low N], 50 [medium N] and 100 [high N] mg N.kg"1 of soil) were considered. Fertilizer N was applied in two split applications: at planting and 30 days after planting. Plants were harvested 82 days after planting.
Figure 6 shows that plants under under water stress (with the exception of millet), have significantly lower A values than plants which are growing in relatively wet soil conditions. Soil N status effected A values, adversely. Plants growing in high soil N (100 ppm) have significantly lowerA values than plants growing in soils with low N (25 ppm). The results imply that plants should be grown in similar soil water status and N fertility level if 13C discrimination technique is to be used as a screening tool. The ,3C discrimination values of millet, a C4 plant, is insensitive to changes in both soil water and N status (Fig. 6).
2.3 Cowpea
2.3.1 13C Discrimination correlates with dry matter and N2 fixation in selected cowpea genotypesE. M. C. deBisbal, Centro National de Investigaciones Agropecuarias (FONAIAP-CENIAP),
Aerea Universitaria, Apartado Postal 4653, El Limdn, Maracay 2101, Venezuela: Kumarasinghe et al. [19] showed evidence that A may be associated with biological nitrogen fixation in soybean. The objective of this work therefore was to assess whether A values measured in selected cowpea genotypes grown under two watering regimes show any association with N2 fixation and thus further confirm the findings by Kumarasinghe et al. [19]. The experiment was conducted in greenhouse conditions. Plants were grown in plastic pots filled with 3 kg of soil-sand mixture at 1:1 ratio. Under one of the watering regimes, soil water status was maintained nearly at field capacity. In the second watering regimes, the soil water status was relatively dry: soil water content at planting was at field capacity; however later it was gradually allowed to decrease down to 50 % of the field capacity value (0.18 g.g-1), and maintained at that level throughout the growing period. A randomized complete block experimental design with 5 replicates was used. Statistical analysis (ANOVA) data showed that genotypic differences with respect to total dry matter production, water use efficiency and biological nitrogen fixation are significant under the two watering regimes. Table IV shows correlation coefficients of A with TDM and water use efficiency and % Ndfa. The A values are negatively correlated with water use efficiency as has been shown for other crops. On the
162

13C
DIS
CR
IMIN
ATI
ON
25STRESS NO STRESS
25
20
15
10
5
0MILLET WHEAT, N AO FEN BARLEY, ATEM
WHEAT, GIZA BARLEY, APEX
FIG. 6. Effects of water stress and soil N status on A values of different plant species.
163
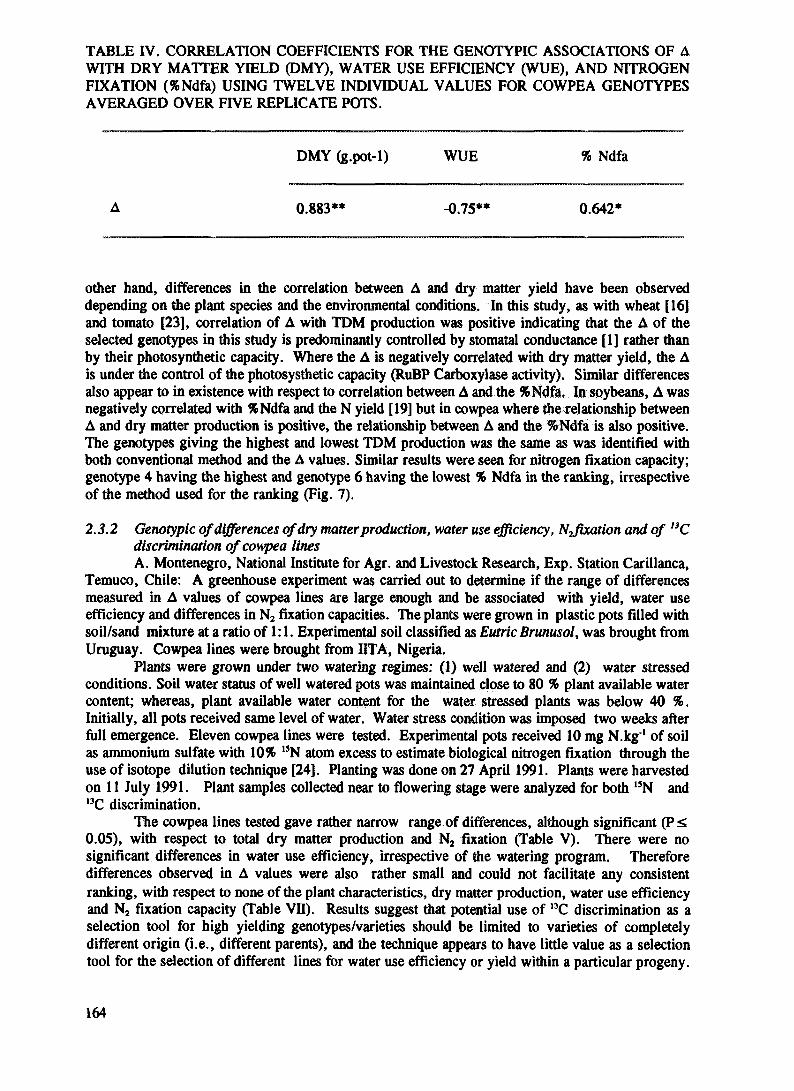
TABLE IV. CORRELATION COEFFICIENTS FOR THE GENOTYPIC ASSOCIATIONS OF A WITH DRY MATTER YIELD (DMY), WATER USE EFFICIENCY (WUE), AND NITROGEN FIXATION (%Ndfa) USING TWELVE INDIVIDUAL VALUES FOR COWPEA GENOTYPES AVERAGED OVER FIVE REPLICATE POTS.
DMY (g.pot-1) WUE % Ndfa
A 0.883** -0.75** 0.642*
other hand, differences in the correlation between A and dry matter yield have been observed depending on the plant species and the environmental conditions. In this study, as with wheat [16] and tomato [23], correlation of A with TDM production was positive indicating that the A of the selected genotypes in this study is predominantly controlled by stomatal conductance [1] rather than by their photosynthetic capacity. Where the A is negatively correlated with dry matter yield, the A is under the control of the photosysthetic capacity (RuBP Carboxylase activity). Similar differences also appear to in existence with respect to correlation between A and the %Ndfa, In soybeans, A was negatively correlated with %Ndfa and the N yield [19] but in cowpea where the relationship between A and dry matter production is positive, the relationship between A and the % Ndfa is also positive. The genotypes giving the highest and lowest TDM production was the same as was identified with both conventional method and the A values. Similar results were seen for nitrogen fixation capacity; genotype 4 having the highest and genotype 6 having the lowest % Ndfa in the ranking, irrespective of the method used for the ranking (Fig. 7).
2.3.2 Genotypic of differences of dry matter production, water use efficiency, NJixation and of * 13 Cdiscrimination of cowpea linesA. Montenegro, National Institute for Agr. and Livestock Research, Exp. Station Carillanca,
Temuco, Chile: A greenhouse experiment was carried out to determine if the range of differences measured in A values of cowpea lines are large enough and be associated with yield, water use efficiency and differences in N2 fixation capacities. The plants were grown in plastic pots filled with soil/sand mixture at a ratio of 1:1. Experimental soil classified as Eutric Brunusol, was brought from Uruguay. Cowpea lines were brought from IITA, Nigeria.
Plants were grown under two watering regimes: (1) well watered and (2) water stressed conditions. Soil water status of well watered pots was maintained close to 80 % plant available water content; whereas, plant available water content for the water stressed plants was below 40 %. Initially, all pots received same level of water. Water stress condition was imposed two weeks after full emergence. Eleven cowpea lines were tested. Experimental pots received 10 mg N.kg*1 of soil as ammonium sulfate with 10% l3N atom excess to estimate biological nitrogen fixation through the use of isotope dilution technique [24]. Planting was done on 27 April 1991. Plants were harvested on 11 July 1991. Plant samples collected near to flowering stage were analyzed for both 13N andl3C discrimination.
The cowpea lines tested gave rather narrow range Of differences, although significant (P ^ 0.05), with respect to total dry matter production and N2 fixation (Table V). There were no significant differences in water use efficiency, irrespective of the watering program. Therefore differences observed in A values were also rather small and could not facilitate any consistent ranking, with respect to none of the plant characteristics, dry matter production, water use efficiency and N2 fixation capacity (Table VII). Results suggest that potential use of 13C discrimination as a selection tool for high yielding genotypes/varieties should be limited to varieties of completely different origin (i.e., different parents), and the technique appears to have little value as a selection tool for the selection of different lines for water use efficiency or yield within a particular progeny.
164

TOTA
L D
RY
MA
TTER
, G/P
OT
% N
dfa
Y = -143.36+11.10X r = 0.704**
15 16 17 18 19 20
r = 0.883
COWPEA1. CBS 4. TVx3092. CB46 5. 79643. JT882E 6. 8517
4/o 1
13C DISCRIMINATION
F/G. 7. Unear correlation between A wifA total dry matter (TDM) and % AW/a of six cowpea genotypes. Shaded areas designate genotypes with highest and lowest TDM production and nitrogen fixation capacities, based on A and conventionally measured TDM and % Ndfa.
165

TABLE V. DRY MATTER YIELD (DMY), N2 FIXATION (%Ndfa), AND A VALUES OF COWPEA LINES GROWN UNDER TWO WATERING REGIMES (WELL WATERED AND STRESSED CONDITIONS).
Cowpealines
DMY(g.pot-1)
%Ndfa
A
Wellwatered
Stressed Wellwatered
Stressed Wellwatered
Stressed
T86D-627 6.84 e 4.68 ab 64.1 ab 31.3 efg 17.45 a 16.09 aT85D-3850 9.29 d 5.46 ab 74.1 ab 58.4 ab 17.93 a 16.17 aT86D-472 11.65 abc 4.70 ab 72.1 ab 48.8 abc 17.83 a 16.18 aT86D-792 11.87 ab 5.44 ab 73.6 ab 36.4 bed 17.94 a 16.34 aT86D-1056 9.70 cd 5.40 ab 74.2 a 53.7 ab 17.75 a 16.27 aT86D-535 8.70 de 4.88 ab 69.9 ab 25.1 fgh 17.87 a 16.74 aT82 E-32 9.50 d 5.36 ab 67.8 ab 42.7 bed 18.44 a 16.14 aT86D-392 8.14 de 4.78 ab 63.4 b 19.2 gh 18.51 a 16.49 aTUX 3236 8.15 de 4.20 ac 70.3 ab 17.9. h 17.95 a 16.09 aT84D-448 10.09 bed 5.79 be 72.7 ab 49.0 abc 17.64 a 15.86 aT84D-449 9.89 bed 6.09 be 68.2 ab 47.0 abc 18.44 a 15.81 a
The data in rows fallowed by the same letter are not significantly different (Pk 0.05).
TABLE VI. ACCESSION NUMBERS AND COUNTRY OF ORIGIN OF GURICIDIA SEPIUM PROVENANCES
Accession No. Countrty of origin Accession No. Country of origin
1. G12/86 Costa Rica 10. G16/84 Guatemala2. G25/84 Honduras 11. G34/85 Mexico3. G14/84 Guatemala 12. G29/84 Nicaragua4. G14/86 Guatemala 13. G40/85 Mexico5. Gll/86 Costa Rica 14. G30/84 Nicaragua6. G17/84 Guatemala 15. G13/86 Panama7. G44/85 Mexico 16. G13/84 Guatemala8. G33/85 Mexico 17. G13/86 Venezuala9. G15/84 Guatemal 18. G13/84 Hondras
166

TABLE VH. CORRELATION COEFFICIENTS BETWEEN A, WATER USE EFFICIENCY (WUE) AND DRY MATTER YIELD BY GURICIDIA AND SPEARMAN’S COEFFICIENT OF RANK CORRELATIONS (RJ WITH A
DMY (g.plant"1) WUE Nfixed (mg N.plant"1)
AR.
-0.640** -0.579** -0.583**-0.534** -0.530** -0.593** * VI.
3. PERENNIAL CROPS
3.1. Gliricidia sepium
3.1.1. Carbon isotope discrimination of Gliricidia sepium correlates with total dry matter production,water use efficiency and nitrogen fixationF. Awonaike, Soil Science Unit, FAO/IAEA Agriculture and Biotechnology Laboratory,
Seibersdorf, Austria: The experiment was conducted in a glasshouse at the FAO/IAEA Agriculture and Biotechnology Laboratory in Seibersdorf, Austria. The growth medium consisted of Seibersdorf soil (Typic Eutrocrets) and sand filled in pots. The soil, (pH 8.3; total N, 0.3% ; plant extractable P = 55.8 ppm; and organic matter, 6.7%) was air-dried and sieved to pass through 2.0 mm sieve. Each pot had 4.5 kg of the mixture. A basal application of 20 mg P as single super phosphate, 50 mg K as muriate of potash and 1 ml of a micronutrient solution (B, 0.05 %; Mg, 0.05 %; Zn, 0.005 %; Mo, 0.005 % and Cu, 0.002 %) per kg of growth medium was applied to all pots before the planting.
Seeds of twenty provenances of Gliricidia sepium (kindly provided by the Oxford Forestry Institute, South Parks Road, Oxford, UK) were scarified and sterilized in concentrated H2S04 for 30 minutes. They were then thoroughly rinsed with distilled water and germinated on sand. Pregerminated seedlings of identical vigor were transplanted to the soil/sand growth medium. A mixture of sp 35, sp 44 and sp 45 strains of Rhizobium which had been tested to effectively nodulateG. sepium [24] was used to inoculate the seedlings while transplanting. Each pot had two seedlings. The accession numbers and countries of origin of the 20 G. sepium provenances are listed in TableVI. The 20 provenances of G. sepium were arranged randomly in blocks and replicated twice. A single application of 10 ppm N as ammonium sulfate with approximately 10 % 15N atom excess was applied to all pots as tracer to facilitate estimation of biological nitrogen fixation by G. sepium, using isotope dilution technique [23]. Eucalyptus camaldulensis was used as the reference crop.
Before transplanting, all pots were watered with dionized water to approximately field capacity of the mixture (0.22 g.g"1). During the course of the experiment, the same volume of water was added to each pot. However, at least once every week, each pot was weighed and an appropriate volume of water was added to attain the original weight at the start of the experiment. The initial weight of the pots subtracted from the cumulative water added to each pot until harvest gave the total water consumption (i.e., evapotranspiration, ET) of the two trees planted in each pot. Water use efficiency of the trees (i.e., dry matter produced per liter of water used, g. I1) was calculated using the equation:
DMET (1)
where DM = total dry matter yield of the whole tree (g), and ET is water consumption (L) throughout the experiment (1).
Plants samples were dried, ground and analyzed for total N and N isotope ratios on a Carlo-Erba Analyser (N-1500) coupled to a VG-Isogas Mass Spectrometer. Percent N derived from
167

atmosphere (% Ndfa) was estimated using the isotope dilution technique [25]. Total N fixed was calculated with the following equation
W= loo(2)
The stem samples from about 1 cm above the base of the shoots were analyzed for carbon isotope composition, and 13C discrimination was calculated as described by Farquhar and Richards [7] and Hubick et al. [10]. Results show a highly significant correlation between carbon discrimination (A) and total dry matter yield, water use efficiency and total N fixed, in 6 months old Gliriddia (Table V). Ranking of G. septum provenances simply based on A values gave significant Spearman’s coefficient of rank correlations [26] with rankings based on conventionally measured dry matter production, water use efficiency and total N fixed (Table VII), indicating therefore the potential use of A as a screening tool for high dry matter production and nitrogen fixation capacity, as well as high water use efficiency. Although only a preliminary screening can be achieved using A values, the provenances which possess the bse characteristics for a particular trait must be subjected to further field screening with conventional methods. For example, provenences 2,3 and 10 which have a high dry matter yield also exhibited high water use efficiency charateristics (Fig. 8). These also had promising features with respect nitrogen fixation. The results reported here show that for trees, A of plant organs collected during crop growth can provide valuable information with respect to drought adaptability and biomass production potential. The A also appears to indicate the N2 fixing ability [19]. The method, subject to further validation for other tree species, could provide a very valuable tool especially for the selection of tree provenances capable of high fuelwood production and drought tolerance.
4. CONCLUSIONS
Neutron probe measurements confirmed the earlier reports of a strong correlation of A with grain yield and water use efficiency of wheat. High soil gypsum content and soil salinity, a wide spread problem in soils of arid and semi-arid climatic zones, do not interfere with the association of A with crop yields, provided plants are grown in similar soil water status and soil fertility level. Results of a glasshouse experiment using selected cowpea genotypes showed that A values measured at flowering stage positively correlated with total dry matter production and percent N2 derived from atmosphere (%Ndfa), contributing to an earlier report from tile laboratory that it may be possible to use A values for screening of leguminous crops for high N2 fixation potential. 13C isotope discrimination in the leaves of Gliricidia septum was measured to examine if the technique could be extended to studies with trees. Results of a glasshouse experiment with 18 provenances of Gliricidia sepium showed highly significant correlations of A with total dry matter production, water use efficiency and total N accumulated through biological nitrogen fixation. While the correlations of A with water use efficiency and dry matter yield are reatively clear and better understood, the correlation with nitrogen fixation still needs further study and confirmation under different environments and different species. 13C isotope discrimination as a tool for identifying plants with a high water use efficiency and high yield potential would indeed be more attractive for tree species than for annuals considering the often long periods of time taken for trees to grow and produce economic yields either for food, fodder or for fuelwood.
168

3.0
LU3$
Y - 3. 943-0.101Xr = -0.579
1.5
10
89.2 - 2.65X-0.640
13C DISCRIMINATION
FIG. 8. Linear correlation between A with total dry matter (TDM) and water use efficiency of 6 months old diricidia species. Shaded areas designate half of the best provenances sleeted based on A and conventionally measured water use efficiency and TDM (upper and lower figures respectively). Numbers next to the data points show the provenances listed in Table VI.
169

REFERENCES
[1] KIRDA, C„ MOHAMED, A.R.A.G., KUMARASINGHE, S., MONTENEGRO, A., ZAPATA, F. Carbon isotope discrimination at vegetative stage as an indicator of yield and water use efficiency of spring wheat (Triticum turgidum L. var. durum). Plant and Soil. 147 (1992) 217-223.
[2] WHITE, J.W., CASTILLO, J.A., EHLERINGER, J.R., CARCIA-C, J.A., SINGH, S.P. Relations of carbon isotope discrimination and other physiological traits to yield in common bean (Phaseolus vulgaris) under rain fed conditions. J. Agr. Sci. 122 (1994) 275-284.
[3] LUDLOW, MM, MUCHOW, R.C. A critical evaluation of traits for improving crop yields in water- limited environments. Advances in Agronomy 43(1990) 107-153.
[4] WRIGHT, G.C., NAGESWARA, R , FARGUHAR, G.D. Water-use efficiency and carbon isotope discrimination in peanut under water deficit conditions. Crop Sci. (1994) 92-97.
[5] EHDAIE, B., WAINES, LG. Variation in water use efficiency and its components in wheat: I. Well- watered pot experiment. Crop Sci. 33(1993) 294-299.
[6] FARQUHAR, G.D., EHLINGER, JR, HUBICK, K.T. Carbon isotope discrimination and photosynthesis, Annual Review of Plant Physiology and Molecular Biology 40 (1989) 503-537.
[7] FARQUHAR, G.D., RICHARDS, R A Isotopic composition of plant carbon correlates with water-use efficiency of wheat genotypes. Aust. J. Plant Physiol. 11(1984) 530-552.
[8] EHDAIE, B., HALL , A.E., FARQUHAR, G.D., NGUYEN, H.T., WAINES, J.G. Water-use efficiency and carbon isotope discrimination in wheat. Crop Sci. 31 (1991) 1282-1288.
[9] ABDELBAGI, M. A., HALL, A.E. Inheritance of carbon isotope discrimination and water-use efficiency in cowpea. Crop Sci. 33 (1993) 498-503.
[10] HUBICK, K.T., FARQUHAR, G.D., SHORTER, R. Correlation between water-use efficiency and carbon discrimination in diverse peanut (Arachis) germplasm. Aust. J. Plant Physiol. 13 (1986) 803-816.
[11] HUBICK, K.T., FARQUHAR, G.D. Carbon isotope discrimination-selecting for ware-use efficiency. Aust. J. Plant Physiol. 8 (1987) 66-68.
[12] MARTIN, B , THORSTENSON, Y.R. Stable isotope composition ("C), water use effciency, and biomass productivity of Lycopersicon esculentum, Lycopersicumpennelti, and the F, hybrid. Plant Physiol. 88 (1988) 213-217.
[13] JOHNSON, A.D., ASAY, K.H., TIESZEN, L.L., EHLERINGER, J R., JEFFERSON, P.G. Corbon isotope discrimination: Potential in screening cool-season grasses for water-limited environments. Crop Sci. 30 (1990) 338-343.
[14] READ, J J., JOHNSON, D.A., ASAY, K H , TIESZEN, L.L. Carbon isotope discrimination, gas exchange, and water-use efficiency in crested wheatgrass clones. Crop Sci. 31 (1991) 1203-1208.
[15] DINGKUHN, M., FARQUHAR, G.D., DE DATTA, S K , O'TOOLE, J.C. Discrimination of ,3C among upland rices having different water use efficiency. Aust. J. Plant Physiol. 42 (1991) 1123-1131.
[16] CONDON, A.G., RICHARDS, R A , FARQUHAR, G.D. Carbon isotope discrimination is positively correlated with grain yield and dry matter production in field-grown wheat. Crop Sci. 27 (1987) 996-1001.
[17] CRAUFURD, P Q , AUSTIN, R B , ACEVEDO, E., HALL, M.A. Carbon isotope discrimination and grain-yield in barley. Field Crops Research 27 (1991) 301-317.
[18] MASLE, J., FARQUHAR, G.D. Transpiration ratio and plant mineral content are related among genotypes of a range of species. Submitted to Aust. J. Plant Physiol. (1992)
[19] KUMARASINGHE, S., KIRDA, C , MOHAMED, A.R.A.G., ZAPATA, F., DANSO, S K A. »C discrimination correlates with biological nitrogen fixation in soybean (Glycine max (L.) Merill). Plant and Soil 139 (1992) 145-147.
[20] MEINZER, F.C., GOLDSTEIN, G., GRANTZ, D A. Carbon isotope discrimination in coffee genotypes grown under limited water supply. Plant Physiol. 92 (1990) 130-135.
[21] HUBICK, K.T , FARQUHAR, G.D., SHORTER, R., Correlation between water use efficiency and carbon isotope discrimination in diverse peanut (Arachis hypogea) germplasm, Aust. J. Plant Physiol., 13 (1986) 803-816.
[22] ZAPATA, F. Isotope techniques in soil fertility studies and plant nutrition studies. IN: Use of Nuclear Techniques in Studies of Soil-plantrelationships. Training Course Series No. 2 (1990), IAEA, Vienna, Austria
[23] MARTIN, B., THORSTENSON, Y R , Stable carbon isotope composition, water use efficiency, and biomass production of Lycopersicon esculentum, Lycopersicon pennellii, and the FI hybrid, Plant Physio. 88 (1988) 213-217.
[24] AWONAIKE, K.O., HARD ARSON, G., KUMARASINGHE, S. Biological nitrogen fixation of Gliricidia sepium/Rhizobium symbiosis as influenced by plant genotype, bacterial strain and their interactions. Tropical Agriculture 69 (1992) 381-389.
[25] FRIED, M., BROESHART, H. An independent measurement of the amount of nitrogen fixed by a legume crops. Plant and Soil 43 (1975) 707-711.
[26] STEEL, G.D., TORRIE, J.H. Principles and Procedures of Statistics. McGrow-Hill Book Company, New York, (1960) pp 481.
[27] WONG, S.C., COWAN, I.R., FARQUHAR, G.D. Stomatal conductance correlates with photosythetic capacity. Nature 282 (1979) 424-426.
170

GENOTYPIC DIFFERENCES IN PHOSPHATE NUTRITION OF RICE (ORYZA SATTVA L.)
BUI THI HONG THANH1, F. ZAPATA Soils Science Unit,FAO/IAEA Agriculture and Biotechnology Laboratory, International Atomic Energy Agency,Seibersdorf
XA9642772
G.D. BOWEN* 1 2, K.S. KUMARASINGHESoil Fertility, Irrigation and Crop Production Section,Joint FAO/IAEA Division of Nuclear Techniques in Food and Agriculture, Intenational Atomic Energy Agency,Vienna
Abstract
GENOTYPIC DIFFERENCES IN PHOSPHATE NUTRITION OF RICE (ORYZA SATIVA L.)Phosphate uptake and use by five genotypes of paddy rice were studied at five phosphate levels in pot studies for
49 days. For all five P levels there were marked genotypic differences in shoot growth, plant dry weight, root/shoot ratios, phosphate uptake and translocation, P content of roots and shoots, and phosphorus use efficiency of shoots (PUB, g shoot mg P 1 in shoot). There were significant genotypic differences in root weight (4 P levels) and in uptake/mg root (all P levels). These latter may have resulted from differences in root weight/root length conversion, root hair development or uptake characteristics, factors which were not studied specifically. Differences between genotypes and P levels in the percentage translocation were partly explicable by differences in P uptake/plant (r = 0.72) but especially by differences in root/shoot ratios (r = 0.89). Differences in PUE were largely a factor of P percentage of the tops (r = 0.94) but significant differences between genotypes were shown as a function of % P. Differences in net photosynthesis rates were largely, but not entirely, due to differences in P % of the shoots. Key factors in P uptake and use and genotypic differences are root growth, uptake/mg root, root/shoot ratios and PUE.
1. INTRODUCTION
Differences in nutrient relations between genotypes within a species are well known [1,2,3]. Two possible major components of such differences are the uptake of the nutrient from soil and physiological differences in use of the nutrient in the plant. The former is determined by root dynamics and/or the physiology of nutrient uptake by the root. The components of the latter, collectively defined as physiological nutrient use efficiency (g dry matter/mg absorbed nutrient) include transaction of the nutrient to shoots (and its dynamics), effects on net photosynthesis and eventually the distribution of assimilates from leaf to other plant parts. This paper exmamines some of these components with five genotypes of rice (Oryza sativa L.) varying in their ability to grow in phosphate deficient soils. Their behaviour at 5 levels of phosphate was examined.
Present addresses:1 Center of Nuclear Techniques, Ho Chi Minh City, Viet Nam.2 42 Thirkell Avenue, Beaumont, South Australia 5066
171

2. MATERIALS AND METHODS
2.1. GenotypesFive genotypes were: Lalka Motka, Pokkali, IR-9884-543-IE-PI (subsequently referred to
as IR-9844), IR-42 and Khao Dawk Mali 105 (subsequently referred to as KDM-105). All varieties were kindly supplied by the International Rice Research Institute, Los Banos, the Philippines.
Earlier studies using 25 genotypes had indicated the first three to perform well in a soil with a moderate application of phosphate while the last two performed poorly.
2.2. Soils and plant growthPlants were grown in pots in 1.0 kg of a 1:1 mixture of sand and a soil from Weschel,
Eastern Austria, with the composition pH 6.5, total N 0.3%, available P 7.9 ppm (Bray 1) and 7.8% organic matter. Urea was added to give 60 ppm N, potassium chloride to give 50 ppm K, and a micro nutrient mixture containing Boron, Zinc, Copper and Molybdenum. Phosphorus additions of 0, 20 ppm, 40 ppm, 80 ppm and 120 ppm were made by thoroughly mixing potassium dihydrogen phosphate with the soil before potting. The soil had little phosphate fixing ability.
The pots were watered daily with de ionized water to field capacity to simulate paddy conditions. The plants were grown in a glasshouse with approximately 10,000 lux 12 hr day, with mean day and night temperatures of 28°C and 20°C, respectively; relative humidity varied between 60 and 70%.
Four replicate pots each with two plants were employed for each of the 5 genotypes at each of the 5 phosphate levels, and the plants were harvested after 49 days growth.
2.3. Measurements(i) After harvesting the shoots, the roots were removed from the pots using a water jet and
subsequently washed throughly in tap water and finally in distilled water. The shoot and the root samples were then dried to constant weight in an oven at 70°C before recording the dry weights. The plant samples were then ground, digested with a 2:1 mixture of nitric and perchloric acid and analysed for P using a colorimeter. This enabled the calculation of root/shoot ratios, total P uptake, % P translocated to the shoots and phosphorus use efficiency in the shoots (g shoot d.m./mg P in the shoots).
(ii) Measurement of net photosynthetic rates: The net photosynthetic rate of the youngest frilly expanded leaf was measured on each of three replicate plants in each treatment. The measurements were made using an Infra Red Gas Analyser (IRGA) fitted with a Parkinson leaf chamber (Analytical Development Company, Hoddesdon, Herts, England).
3. RESULTS
3.1. Plant growth experiment
3.1.1. Shoot weightTable I, indicaes Lalka Motka and Pokkali to have significantly greater shoot growth than
IR-9884 and IR-42 at all P levels and KDM 105 at most P levels. Pokkali had 60% more shoot growth than IR-42 at 0 added P (control) and 27% more at 120 ppm. Pokkali was significantly better than Lalka Motka only at 120 ppm, having 13.6% greater shoot weight.
172

Within all genotypes, growth at 20 ppm was significantly greater than in the control soil but, with the exception of IR-42 there was no significant difference between 20 ppm and higher P additions. The growth of IR-42 increased throughout the range of P additions but significant differences from 20 ppm occurred only at 120 ppm added phosphate.
3.1.2. Root weightRoot dry weight (Table I) behaved differently from shoot dry weight. There were no
significant differences between 5 P levels with Pokkali and KDM-105; but with Lalka Motka and IR- 9884 root growth was significantly greater by some 38% and 26% respectively at 20 ppm than at 0 added P; root growth at other levels being equivalent to that at 20 ppm. By contrast, root growth of IR-42 increased by 55% up to 40 ppm and a significant decline occurred between 80 ppm and 120 ppm. Interesting differences occurred between genotypes: in contrast to shoot growth, at 0 added P root growth of Lalka Motka was 33% less than that of Pokkali (significant at P = 0.01) and root growth of IR-42 was significantly less than that of IR-9884 (33% less). Root growth of IR-42 tended to be less than that of all other genotypes at 20 ppm and above (significantly so at 20 ppm).
3.1.2. Whole plantPokkali was significantly greater than all other genotypes in whole plant dry weight (Table
I) at 0 added P and was the greatest at all P levels, being consistently significantly greater than IR-42 and KDM-105 at 20 ppm and above.
3.1.3. Root/shoot (R/S) ratiosRoot/shoot ratios decreased with all genotypes up to 20 ppm but little beyond that. Significant
differences occurred between genotypes (Fig. 1) at all P levels IR-9884 being consistently greater than all other genotypes and Lalka Motka being consistently smaller. At 0 added P, the R/S ratio of Lalka Motka was 40% less than that of IR-9884 and at 40 ppm it was 30% less.
3.1.4. P content of shoots and rootsNot surprisingly, total P and % P of shoots and roots (Table II) increased with increasing P
application. Few generalises can be drawn between genotypes in P content and %P of shoots, except that the P content tended to mimic shoot growth although that of IR-9884 IR-42 was disproportionally higher than shoot growth and at least in O P and 20 ppm P the % P in the shoot of Lalka Motka and Pokkali (the highest shoot growth) was consistently lower than that of other genotypes. Suprisingly, KDM-105, an intermediate performer had significantly higher % P in shoots than other genotypes at 0, 20 and 40 ppm added P.
The P content of the roots of IR-9884 with poor shoot growth was consistently higher than all other genotypes and that of IR-42 - another with poor shoot growth - had consistently lower P content in the roots. At 0 P, Lalka Motka and Pokkali (high shoot growth) had significantly lower % P in the shoots.
3.1.5. Total P uptakeThe total P uptake (Table II) of IR-42 was significantly lower than that of all other genotypes
at all P levels, among which no significant differences occurred at each P level. The P content of IR-42 was usually some 25% lower than that of Pokkali. The total P uptake increased continually with increases in P applied for each genotype.
173

TABLE I. THE INFLUENCE OF P LEVELS ON SHOOT, ROOT AND TOTAL DRY MATTER YIELD OF RICE
Plant P Level LSDGenotype part
Control 20 ppm 40 ppm 80 ppm 120 ppm5%
Shoot 3.70 5.54 5.58 5.35 5.37 0.71
Laika MoktaRoot 1.68 2.31 2.31 2.25 2.12 0.35
Total 5.38 7.85 7.89 7.59 7.49 0.53
Shoot 4.37 5.81 5.83 5.89 6.12 1.10
PokkaliRoot 2.50 2.53 2.41 2.70 2.64 0.90
Total 6.87 8.34 8.24 8.59 8.75 0.91
Shoot 2.84 4.25 4.56 4.30 4.68 0.51
IR-9884Root 2.11 2.67 2.70 2.42 2.50 0.46
Total 4.95 6.93 7.24 6.72 7.18 0.49
Shoot 2.71 3.85 4.34 4.42 4.82 0.62
IR-42Root 1.39 1.68 2.16 2.39 1.94 0.34
Total 4.11 5.53 6.49 6.82 6.76 0.48
Shoot 3.13 4.17 3.70 4.83 4.52 1.01
Root 1.94 2.11 1.74 2.27 2.09 0.61
Total 5.07 6.27 5.44 7.10 6.60 0.80KDM-105
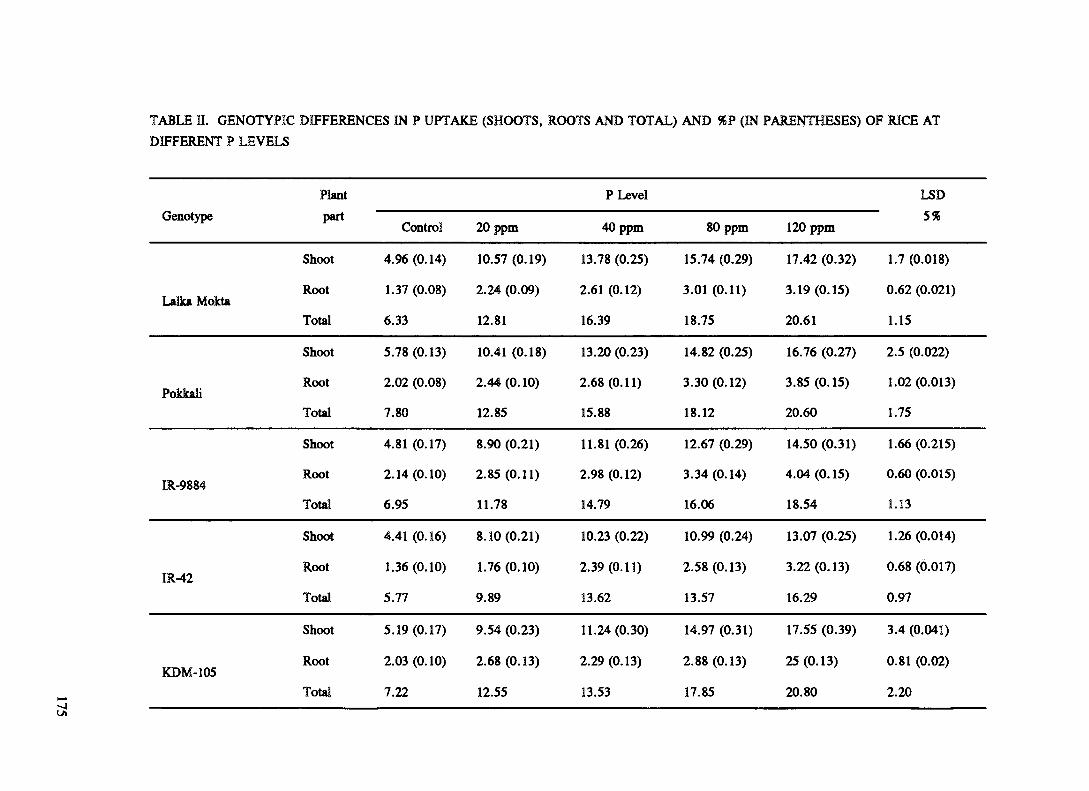
TABLE H. GENOTYPIC DIFFERENCES IN P UPTAKE (SHOOTS, ROOTS AND TOTAL) AND %P (IN PARENTHESES) OF RICE AT DIFFERENT P LEVELS
Plant P Level LSDGenotype part
Control 20 ppm 40 ppm 80 ppm 120 ppm5%
Shoot 4.96 (0.14) 10.57 (0.19) 13.78 (0.25) 15.74 (0.29) 17.42 (0.32) 1.7 (0.018)
Lalka MoktaRoot 1.37 (0.08) 2.24 (0.09) 2.61 (0.12) 3.01 (0.11) 3.19 (0.15) 0.62 (0.021)
Total 6.33 12.81 16.39 18.75 20.61 1.15
Shoot 5.78 (0.13) 10.41 (0.18) 13.20 (0.23) 14.82 (0.25) 16.76 (0.27) 2.5 (0.022)
PokkaliRoot 2.02 (0.08) 2.44(0.10) 2.68 (0.11) 3.30(0.12) 3.85 (0.15) 1.02 (0.013)
Total 7.80 12.85 15.88 18.12 20.60 1.75
Shoot 4.81 (0.17) 8.90 (0.21) 11.81 (0.26) 12.67 (0.29) 14.50 (0.31) 1.66 (0.215)
IR-9884Root 2.14(0.10) 2.85 (0.11) 2.98 (0.12) 3.34(0.14) 4.04 (0.15) 0.60 (0.015)
Total 6.95 11.78 14.79 16.06 18.54 1.13
Shoot 4.41 (0.16) 8.10(0.21) 10.23 (0.22) 10.99 (0.24) 13.07 (0.25) 1.26 (0.014)
IR-42Root 1.36(0.10) 1.76 (0.10) 2.39 (0.11) 2.58 (0.13) 3.22(0.13) 0.68 (0.017)
Total 5.77 9.89 13.62 13.57 16.29 0.97
Shoot 5.19 (0.17) 9.54 (0.23) 11.24(0.30) 14.97 (0.31) 17.55 (0.39) 3.4 (0.041)
KDM-105Root 2.03 (0.10) 2.68 (0.13) 2.29 (0.13) 2.88 (0.13) 25(0.13) 0.81 (0.02)
Total 7.22 12.55 13.53 17.85 20.80 2.20a

r= 0.892
y = -41.2+ 100.3
R/S ratioFig. 1. The relationship between R/S ratio and % P translocation to shoot in rice.
3.1.6. P uptake efficiencyThe P uptake efficiency (mg P uptake g root dry matter) is given in Appendix Table
XXXVI. Across P levels, all genotypes had significantly greater P uptake/mg root at 20 ppm and greater again at 40 ppm (80 ppm in the case of IR-42). However, for Pokkali, IR-9884 and IR-42 the P uptake mg root changed little in the P levels 40, 80 and 120 ppm. By contrast P uptake mg * 1 root of Lalka Motka continually increased over all five P/levels.
At 0 P, with the exception of IR-42 which had significantly higher uptake than Pokkali and IR-9884, there was little differece between the other 4 genotypes. At 120 ppm IR-9884 was significantly lower than all other genotypes and at 40, 80 and 120 ppm IR-9884 and IR-42 were consistently lower than the other 3 genotypes, often significantly so. At 20 to 120 ppm Lalka Motka and KDM-105 were consistently higher.
3.1.7. % P translocated to shootsThe % P translocated to the shoots (Appendix Table XXXVII) shows significant increases in
each genotype between 0 and 20 ppm, but no difference beyond 40 ppm.Interestingly, at each P level significant differences occured between various genotypes with
IR-9884 consistently translocating less to the shoot. Only moderately good correlation (r = 0.723, y = 0.623x + 71.2) was obtained between % P translocated and total P uptake (Fig. 1) with no significant differences in the slope between the genotypes, possibly due to there being only 5 points for each genotype. On the other hand there was a high correlation (r = 0.892s) between % P translocated and R/S ratio (Fig. 1). The relationships for the 5 genotypes were not significantly different: IR-9884 had significantly higher R/S ratios than all other genotypes at all P levels.
176

PUE
(g sh
oot d
m/m
g P sh
oot)
3.1.8. Phosphate Use EfficiencyAs expected PUE (Table III) of the shoot decreased with increasing P levels and increasing
%P. Genotypic difference apparently occurred between genotypes, but this was largely due to differences in % P in the shoots.
However, while PUE was highly (negatively) correlated (r = 0.940*, y = -1.97x + 0.917) with % P in the shoots for all genotypes considered together (Fig. 2), the slope of the relationship
TABLE IB. GENOTYPIC DIFFERENCES IN PHOSPHATE USE EFFICIENT OF RICE AT DIFFERENT P LEVELS
P Level LSDGenotype
Control 20 ppm 40 ppm 80 ppm 120 ppmat 5%
Lalka Mokta
g dry matter yield in shoot mg P 1 in shoot
0.75 0.53 0.40 0.43 0.31 0.05
Pokkali 0.75 0.56 0.44 0.39 0.36 0.07
IR-9884 0.59 0.48 0.38 0.34 0.32 0.03
IR-42 0.61 0.47 0.42 0.40 0.36 0.02
KDM-105 0.60 0.43 0.33 0.32 0.26 0.04
LSD at 5% 0.08 0.03 0.03 0.03 0.02
r = 0.940y =-1.972+ 0.017
P (%)Fig. 2. The correlation between % P and phosphate use efficiency in rice.
177
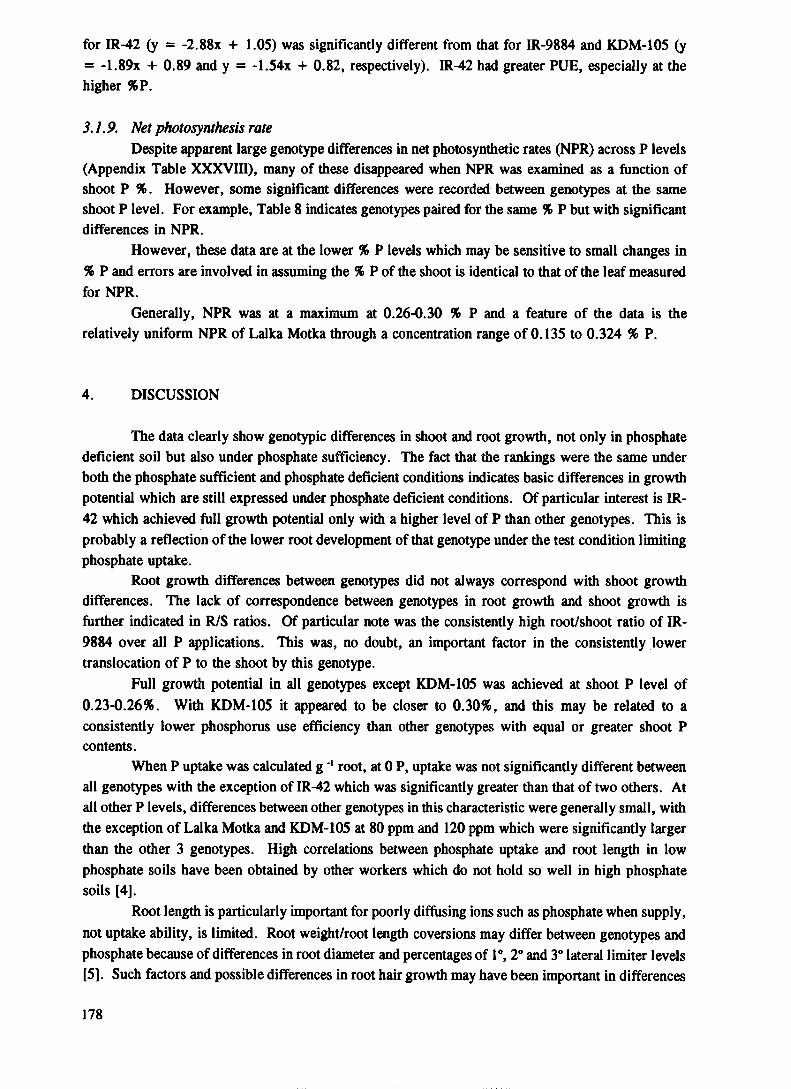
for IR-42 (y = -2.88x + 1.05) was significantly different from that for IR-9884 and KDM-105 (y = -1.89x + 0.89 and y = -1.54x + 0.82, respectively). IR-42 had greater PUE, especially at the higher %P.
3.1.9. Net photosynthesis rateDespite apparent large genotype differences in net photosynthetic rates (NPR) across P levels
(Appendix Table XXXVIII), many of these disappeared when NPR was examined as a function of shoot P %. However, some significant differences were recorded between genotypes at the same shoot P level. For example, Table 8 indicates genotypes paired for the same % P but with significant differences in NPR.
However, these data are at the lower % P levels which may be sensitive to small changes in % P and errors are involved in assuming the % P of the shoot is identical to that of the leaf measured for NPR.
Generally, NPR was at a maximum at 0.26-0.30 % P and a feature of the data is the relatively uniform NPR of Lalka Motka through a concentration range of 0.135 to 0.324 % P.
4. DISCUSSION
The data clearly show genotypic differences in shoot and root growth, not only in phosphate deficient soil but also under phosphate sufficiency. The fact that the rankings were the same under both the phosphate sufficient and phosphate deficient conditions indicates basic differences in growth potential which are still expressed under phosphate deficient conditions. Of particular interest is IR- 42 which achieved full growth potential only with a higher level of P than other genotypes. This is probably a reflection of the lower root development of that genotype under the test condition limiting phosphate uptake.
Root growth differences between genotypes did not always correspond with shoot growth differences. The lack of correspondence between genotypes in root growth and shoot growth is further indicated in R/S ratios. Of particular note was the consistently high root/shoot ratio of IR- 9884 over all P applications. This was, no doubt, an important factor in the consistently lower translocation of P to the shoot by this genotype.
Full growth potential in all genotypes except KDM-105 was achieved at shoot P level of 0.23-0.26%. With KDM-105 it appeared to be closer to 0.30%, and this may be related to a consistently lower phosphorus use efficiency than other genotypes with equal or greater shoot P contents.
When P uptake was calculated groot, at 0 P, uptake was not significantly different between all genotypes with the exception of IR-42 which was significantly greater than that of two others. At all other P levels, differences between other genotypes in this characteristic were generally small, with the exception of Lalka Motka and KDM-105 at 80 ppm and 120 ppm which were significantly larger than the other 3 genotypes. High correlations between phosphate uptake and root length in low phosphate soils have been obtained by other workers which do not hold so well in high phosphate soils [4].
Root length is particularly important for poorly diffusing ions such as phosphate when supply, not uptake ability, is limited. Root weight/root length coversions may differ between genotypes and phosphate because of differences in root diameter and percentages of 1°, 2° and 3° lateral limiter levels [5]. Such factors and possible differences in root hair growth may have been important in differences
178

between genotypes in uptake mg root and require further study. Nevertheless, it may be that at higher P levels, supply of phosphate to the root is less limiting and differences in uptake potential of the root become more important [6], this leading to a lowering of correlation between root length and uptake of phosphate. The probable importance of physiological differences in phosphate uptake ability in medium to higher phosphate soils has been indicated by Nielsen and Schjerring [3] and Rdmer et al [4],
The amounts of nutrient transported to the shoot are all important for shoot growth and photoassimilation. Genotypes differed in this at all P/levels. These, however, are not likely to reflect basic differences in physiology for translocation appears to be determined by root/shoot ratio and total P uptake. Genotype IR-9884 had consistently higher root/shoot ratios and lowered % translocations. Similarly, there was increasing translocations with increased P uptake.
This study has also indicated some genotypic differences in phosphate use efficiency within the shoots and these may or may not be related to possible differences in NPR vs %P - a factor which needs to be examined more precisely than was possible in this study. The distribution of assimilate is a further important aspect for study. Indeed, it is essential that studies such as the above be performed in the field and upto grain production. For example, genotype differences have been found in wheat in uptake of nitrogen following anthesis [7] and in nitrogen redistribution in maize hybrids [8].
Referring to the two genotypes in this study with significantly higher shoot growth, Lalka Motka and Pokkali, how did they achieve their success? They both had relatively low root/shoot ratios ensuring a high translocation of P to the shoot and a relatively good PUE. They both had greater P uptake than two of the poor performers (IR-9884 and KDM-105), in one case achieved by greater root growth and in the other by enhanced P uptake mg root, especially at higher P levels. The study shows there are genotypic differences in root growth, P uptake mg root (especially in the medium to high P applications), differences in R/S ratios which flows on to translocation of absorbed P and in physiological phosphate use efficiencies, all of which would be valuable selection criteria [9] in selecting/breeding for P efficient genotypes.
ACKNOWLEDGEMENTS
This study was conducted while Ms. B. Thi Hong Thanh was at the FAO/IAEA Agriculture and Biotechnology Laboratory in Seibersdorf, Austria on a fellowship awarded by the IAEA in support of the FAO/IAEA CRP on the Use of Isotope Studies on Increasing and Stabilizing Plant Productivity in Low Phosphate and Semi-arid and Sub-humid Soils of the Tropics and Sub-tropics (D 1.50.02) and the IAEA Technical Co-orporation project Isotope Techniques in Soil/Plant Studies (VIE/5/011) implemented at the Center of Nuclear Techniques, Ho Chi Minh City, Viet Nam.
REFERENCES
1. GABELMAN, H. W., LOUGHMAN, B. C., Genetic aspects of Plant Mineral Nutrition, Martinus Nijhoff, Dordrecht/Boston/Lancaster (1987).
2. GERLOFF, G. C., Intact-plant screening for tolerance of nutrient-deficiency stress, Plant and Soil 99 (1987) 3-16.
3. NIELSEN, N. E., SCHJORRING, J. K , Efficiency and kinetics of phosphorus uptake from soil by various barley genotypes, Plant and Soil 72 (1983) 225-230.
179

4. ROMER, W., AUGUSTIN, J., SCHILLING, G., The relationship between phosphate absorption and root length in nine wheat cuhivars, Plant and Soil 111 (1988) 199-201.
5. BOWEN, G. D., Tree roots and the use of soil nutrients, Nutrition of plantation forests (Bowen, G.D., Nambiar, E.K.S., Eds) Academic Press, London (1984) 147-179.
6. CALDWELL, M. M., DUDLEY, L. M., LIL1BHOLM, B., Soil solution phosphate, root uptake kinetics and nutrient acquisition: implications for a patchy soil environment, Oecologia 89 (1992) 305-309.
7. COX, M. C., QUALSET, C. O., RAINS, D. W , Genetic variation for nitrogen assimilation and translocation in wheat I: Dry matter and nitrogen accumulation, Crop Sci. 25 (1988) 430-435.
8. MOLL, R. H , KAMBRATH, E. J., JACKSON, W. A., Analysis and interpretation of factors which contribute to efficiency of nitrogen utilization. Agron. J. 74 (1982) 562-564.
9. SANGINGA, N., BOWEN, G. D., DANSO, S. K. A., Intra-specific variation in growth and P accumulation of Leucaena leucocephala and Gliricidia septum as influenced by soil phosphate status, Plant and Soil 133 (1991) 201-208.
180

SUMMARY AND CONCLUSIONS
Developing countries in Africa struggling to increase food production face a dilemma in the form of limited essential physical resources such as arable land, water, nutrients and energy, and the limited availability of proper technologies. The situation is exacerbated by high population growth rates which make it even more challenging for Governments to achieve the elusive goal of food security and alleviating poverty. Due to intensive cropping, shorter fallow periods and the removal of nutrients in the produce, yields are often reduced to one third within one to two years. For economic reasons, farmers in many developing countries cannot afford the luxury of expensive soil inputs. In this situation, a more rational approach would be to identify genotypes of species which are efficient in the uptake and use of soil resources for plant productivity and to integrate these with minimum inputs of fertilizers where necessary. In order to investigate this approach, a Co-ordinated Research Programme on the use of isotope studies on increasing and stabilizing plant productivity in low phosphate and semi-arid and sub-humid soils of the tropics and sub-tropics was initiated in October 1989 and completed in October 1994. The programme was reviewed annually by a team from the Swedish International Development Authority (SIDA) which funded this CRP. In addition, a mid-term review was conducted by Dr. V. Middelboe of the Department of Mathematics and Physics, Royal Veterinary and Agricultural University, Fredereiksberg, Denmark from 5-20 December 1991. The Soil Science Unit of the FAO/IAEA Agriculture mid Biotechnology Laboratory at Seibersdorf, Austria carried out back-up research in support of this CRP with assistance from its staff members as well as from collaborators in this programme who visited the laboratory as IAEA Fellows.
1. Phosphorus use efficiency
In Sierra Leone, experiments conducted over the five year period showed large differences in phosphorus use efficiency and in nitrogen fixation among cowpea (Vigna unguiculata) cultivars. Two such cultivars IT86D-1010 and IT86D-719 have been identified as exceptionally superior to others in their performance. Root morphological characteristics such as root length, root fineness and vesicular-arbuscular mycorrhizae appear to be responsible for high phosphorus uptake and use efficiency. Multi-locational testing of the cultivars showed that they cannot do well in areas with low rainfall. These cultivars have now have been distributed to farmers through the extension services for large scale production in southern Sierra Leone. It will be possible to assess the economic benefits to farmers and the impact of implementation of this programme will have in the near future in Sierra Leone.
In Egypt, substantial differences in phosphorus use efficiency of wheat (Triticum aestivum L.) were observed under field conditions. Detailed studies related to the work in Egypt were conducted in Germany in order to examine the morphological and physiological parameters responsible for high phosphorus use efficiency of wheat. From these results it can be concluded that the main factors contributing to higher phosphorus use efficiency of wheat are: (i) efficient use of assimilates for root- growth which enhance phosphorus acquisition and root branching and thus smaller mean root diameter and longer root hairs, (ii) an efficient phosphorus uptake system, (iii) efficient remobilization of phosphorus from vegetative organs to the grains, and most importantly, (iv) lower phosphorus requirement for grain yield formation because of lower ear number per plant but higher grain number per ear. This information would be invaluable to plant breeders involved in programmes aimed at developing wheat cultivars efficient in phosphorus use and higher grain yields.
In Kenya, Acacia tortilis, Prosopis juliflora and Casuarina equisetifolia provenances were screened to determine their potential for adaptability under phosphorus limiting conditions as a strategy to exploit genotypic differences in terms of uptake and utilization efficiencies. The results show considerable differences in growth performance and phosphorus use efficiency. Acacia provenances show the highest phosphorus use efficiency compared with Prosopis and Casuarina spp although this was not reflected in the total dry matter yield. However, it was observed that phosphorus application caused an increase in shoot dry matter, height, root collar diameter and root dry matter in the case of Casuarina. Similarly, the highest total phosphorus uptake was observed in Casuarina and Prosopis spp. The results show that phosphorus application probably contributed to
181
reduction in root dry matter and root:shoot ratios of Acacia and Prosopis but not Casuarina spp. Based on these data, Prosopis provenances from Zimbabwe (9 and 10), India (6) and Somalia (7) can be considered suitable for introduction into areas where the soils are poor in phosphorus.
In Sudan, studies were concentrated on identification of gum arabic tree (Acacia Senegal L. Willd) provenances with high efficiency for phosphorus uptake and use. Thirteen provenances were collected from different habitats within the gum belt of the Sudan and a preliminary trial was conducted during the period 1989-1992 at the Gezira Agricultural Research Station at Wad Medani. This study revealed that provenances of Acacias differ widely in phosphorus use efficiency, nitrogen yield and dry matter production. All the provenances tested also exhibited a high ability for survival under the dry climatic conditions prevailing in the gum belt of Sudan. Based on differences in phosphorus use efficiency observed in the preliminary study, 4 provenances were selected for a detailed study. The detailed study revealed that provenance 11 (from Goz Asher Forest) is superior to all others in terms of biomass production as well as in phosphorus use efficiency. Although the ability to take up phosphorus was low, this was compensated by having a high root length density enabling the tree to take up a quantity of phosphorus similar to that taken up by other provenances. The ability to convert the absorbed phosphorus into a greater quantity of dry matter made this provenance the best in phosphorus use efficiency. The results suggest that provenance 11 may be a suitable candidate for introduction into the gum belt through its rehabilitation programme in Sudan
Studies conducted at the International Institute of Tropical Agriculture (IITA) in Ibadan, Nigeria have shown that exploiting genetic differences in phosphorus use efficiency and using hedgerow trees selected for high N2 fixation ability can improve tree establishment and growth on nitrogen and phosphorus poor soils, restore soil fertility and preserve soil from degradation. Soils low in phosphorus and nitrogen are common in the moist savanna climatic zones and consequently growth of hedgerow trees in alley cropping systems might require addition of nitrogen and phosphorus fertilizers. This is difficult for small scale farmers who have limited access to fertilizers and therefore depend only on limited input cropping systems. Field experiments carried out at Fashola (moist savannah) showed large differences in growth and phosphorus use efficiency between N2 fixing trees such as Gliricidia sepium, and non N2 fixing trees such as Senna siamea and Senna spectabilis. Provenances or isoline differences in phosphorus use efficiency also occurred within species and were also influenced by level of phosphorus and period of growth. Differences between species and provenances in phosphorus uptake and growth were largely related to differences in physiological phosphorus use efficiency, root length and VAM infection rate, especially in low phosphorus soils. Based on the results generated from this study, Gliricidia sepium provenances GS1 and GS2 can be considered as ideal for inclusion into agroforestry systems in areas where the soils are poor in phosphorus.
At the FAO/IAEA Agriculture and Biotechnology Laboratory, three sweet potato cultivars (TIS 2, TIS 3053 and TIS 1487) were tested for phosphorus and nitrogen use efficiency in the presence of two sources of phosphorus, Gafza rock phosphate and triple super phosphate. The results of these preliminary studies indicate that there is considerable genotypic variation among cultivars in the efficiency with which phosphorus and nitrogen are taken up and used to produce biomass. Their response to different sources of phosphorus are also variable. TIS-2 and TIS-1487 have a greater ability to absorb phosphorus from Gafza rock phosphate and produce higher tuber yields indicating their greater potential for using natural sources of phosphate fertilizer more effectively. Gafza rock phosphate also increased accumulation of nitrogen in TIS-1487, a characteristic which will place this cultivar at an advantage when growing in soils low in nitrogen. On an overall basis taking into account tuber yield, phosphorus use efficiency, and nitrogen use efficiency, TIS-2 may be considered the best candidate for introduction into soils poor in nutrients, particularly phosphorus. This study was conducted with a limited number of cultivars due to limited availability of germplasm. In spite of this, the differences in their abilities for phosphorus and nitrogen uptake and use are clearly visible which justifies the need for further research using a broader germplasm base.
2. Water use efficiency
Water is one of the most important limiting factors for crop production in rainfed areas particularly in the arid and semi-arid regions. In Africa, semi-arid soils with an average rainfall of
182

400 to 600 mm rain and dry sub-humid soils with a rainfall of 600-1000 mm account for some 30 per cent of the land area. Many of these are in relatively highly populated areas which are always at risk of water shortages for crop production. In these areas, overgrazing and harvesting of trees for fuelwood have been a major factor responsible for reduced productivity, increased soil erosion and desertification. Desertification is known to occur at a rate of 6 million ha per annum. Large parts of the developing world also have acute shortages of fuelwood which is the primary source of energy in rural areas and largely irreplaceable by other sources. Recent World Bank figures suggest that by the year 2000, approximately 3 million people will be living in areas where fuelwood is acutely scarce or has to be obtained from elsewhere. In this situation, introduction of tree and crop species with a high efficiency of uptake and use of the limited resources of water would certainly be an asset to increasing plant productivity.
Plant water use efficiency is an important factor for determining crop yields. A recent development in this field is the observation that water use efficiency is correlated with the l3C/l2C ratios of the plant carbon. The basis of this is physiological. Although factors such as nutrition affect water use efficiency, a more intensive study of 13C/12C ratios may be an extremely important way to screen genotypes of plant species for water use efficiency. The method is rapid, non-destructive and relatively inexpensive. In this programme we verified some aspects of this techniques in experiments conducted under field conditions.
In Morocco, during four consecutive years, 20 durum wheat (Triticum durum Desf) and bread wheat (Triticum aestrivum L.) cultivars were grown under rain-fed conditions and supplementary irrigation with the objective of assessing the possibility of using ,3C discrimination (A) as a criterion to screen for wheat cultivars that produce high yields and have a better water use efficiency under water deficit conditions. In all four growing seasons, both treatments were subjected to some water stress which was higher under rain-fed conditions and varied according to the intensity and time of rainfall. There was substantial genotypic variation in 13C discrimination. The total aboveground dry matter yield and grain yield were positively correlated with ,3C discrimination. Moreover, the 13C discrimination value was also correlated positively with water use efficiency. This is in contrast to greenhouse experiments with wheat where plant water use efficiency and l3C discrimination were negatively correlated. The data suggest that high 13C discrimination values can be used as a criterion for selecting cultivars of wheat that have a relatively higher grain yield potential and high water use efficiency under water deficit conditions. The results of these field experiments are, however, preliminary and may warrant further research, probably under more controlled conditions, before these elite cultivars can be recommended for use by the farmers.
In Tunisia, as in Morocco, the water balance model using a neutron moisture probe and the 13C isotope discrimination methods were used in the field to rank durum wheat genotypes for water use efficiency. The results show differences between cultivars with respect to water use efficiency, l3C discrimination and grain yield. There is again a positive correlation between grain water use efficiency and 13C discrimination.
Studies on water use efficiency of trees were conducted in Kenya and in Sudan. In Kenya, 11 provenances of Acacia tortilis, 6 provenances of Prosopis juliflora and 4 provenances of Casuarina equisetifolia were screened for drought tolerance in a semi-arid site in Machakos. Tolerance to drought was assessed by determining the water use efficiency and 13C isotope discrimination by leaves. The results showed significant differences in ,3C discrimination, water use efficiency and dry matter yield by the different provenances tested. There were significant negative linear relationships between l3C discrimination and water use efficiency as well as between l3C discrimination and dry matter yield. The results also show a significant positive relationship between dry matter yield and water use efficiency. Acacia tortilis provenances from the Middle East and the neighbouring North Eastern Africa region appear to possess the greatest abilities for drought resistance in comparison with those from sub-Saharan Africa, as indicated by their 13C isotope discrimination levels, dry matter yield and water use efficiency. Prosopis provenance from Costa Rica and Casuarina from the Dakar region of Senegal also emerged as the best provenances in terms of drought tolerance as shown by the 13C isotope discrimination and dry matter traits.
The study in Sudan concentrated on the gum arabic tree Acacia Senegal ( L ) Willd. An experiment was conducted in 1989 to screen Acacia Senegal provenances collected from within the natural gum belt for high water use efficiency. Thirteen provenances were tested and later 6 of them
183

were selected for further screening. Both the preliminary and the detailed study revealed that provenances 7, 3 and 11 have the combined characteristics of high dry matter production and high water use efficiency. Based on these studies, provenance 11 (which is also efficient in phosphorus use) can be recommended as a suitable candidate for introduction into the gum-belt of Sudan through its rehabilitation programme.
Studies conducted at the Soil Science Unit of the FAO/IAEA Agriculture and Biotechnology Laboratory confirmed the earlier reports of a strong correlation of A with grain yield and water use efficiency of wheat. High soil gypsum content and soil salinity, a widespread problem in soils of arid and semi-arid climatic zones, do not interfere with the association of A with crop yields, provided plants are grown with a similar soil water status and soil fertility level. Results of a greenhouse experiment using selected cowpea genotypes showed that A values measured at the flowering stage positively correlated with total dry matter production and per cent N2 derived from atmosphere (%Ndfa), contributing to an earlier report from the laboratory that it may be possible to use A values for screening of leguminous crops for high N2 fixation potential. ,3C isotope discrimination in the leaves of Gliricidia sepium was measured to examine if the technique could be extended to studies with trees. Results of a greenhouse experiment with 18 provenances of Gliricidia sepium showed highly significant correlations of A with total dry matter production, water use efficiency and total N accumulated through biological nitrogen fixation. While the correlations of A with water use efficiency and dry matter yield are reatively clear and better understood, the correlation with nitrogen fixation still needs a closer examination under different environmental conditions and with different species. In some ways, l3C isotope discrimination as a tool for identifying plants with a high water use efficiency and high yield potential would be more attractive for tree species than for annuals considering the often long periods of time taken for trees to grow and produce economic yields either for food, fodder or fuelwood.
The data from experiments conducted in this programme in Morocco, Tunisia, Kenya and at the Soil Science Unit of the FAO/IAEA Agriculture and Biotechnology Laboratory suggest that while l3C discrimination may be used as a criterion for selection of cultivars with high water use efficiency and potential for high yield, caution must be exercised in the selection process as the size of the canopy and the changes in environmental factors, mainly soil water content, can result in changes in the extent of 13C discrimination and the yield of a cultivar. Nevertheless, l3C discrimination of a genotype can provide valuable information with respect to plant parameters responsible for the control of 13C discrimination and this information can be usefully employed in breeding programmes aimed at developing cultivars high in water use efficiency, high in yield, and suitable for cultivation in arid and semi-arid regions of the tropics and sub-tropics.
In conclusion, this five year programme has shown that there is a wealth of genetic diversity among the genotypes of crop and tree species in their capacity for uptake and use of phosphorus and water from soils limited in resources. Morphological as well as physiological parameters of the root system appear to play a significant role in making some genotypes superior to others in their ability to acquire phosphorus and water but the final conversion into dry matter probably depends on other inherent genetic characteristics as well. In Sierra Leone, cowpea cultivars were identified which are high in phosphorus use efficiency. Action has already been taken to multiply the seeds and distribute them to farmers through the agricultural extension services for large scale production in southern Sierra Leone. It will be possible to assess the economic benefits to farmers and the impact of implementation of this programme in Sierra Leone in the near future. In Sudan, an Acacia Senegal provenance (provenance 11) has been identified which possess the combined characteristics of high water use efficiency and high dry matter yield. This provenance which is also efficient in phosphorus use can be recommended as a suitable candidate for introduction into the gum-belt of Sudan as a contribution to its rehabilitation programme. In other countries, the genotypes of crop and tree species identified should prove to be valuable starting material for plant breeding programmes aimed at developing varieties capable of growing and producing well in soils poor in phosphorus and water, particularly in Africa.
184

APPENDIX
APPENDIX - EGYPTTABLE I. SOIL ANALYSIS DATA
Property Estimate
CaC03 % 02.2pH 07.9EC.dS m1 02.2Ca+2 meq V* 04.4Mg+2 meq V1 02.8Na+ meq 1' 13.4K+ meq l"1 00.8HCOj meq l1 03.5Cl" meq V1 08.6SO/2 meq l "1 07.3NaHCOj extractable - mg P 100g ' 00.5Sand % 86.0Silt % 07.8Clay % 06.2Textural class Loamy sand
APPENDIX - EGYPTTABLE II. SEEDING RATE, PLANT MIGHT, AND WEIGHT OF 100 GRAINS
No Cultivar Seeding rate g 20m 2
Plant height cm
Weight of 100 grains g
1 Giza 155 138.2 104 5.032 Giza 156 137.6 112 4.693 Giza 157 126.0 088 4.444 Giza 158 147.4 100 5.145 Giza 160 142.4 106 5.076 Giza 162 119.2 110 4.077 Giza 163 132.4 110 4.868 Giza 164 142.8 120 5.099 Giza 165 145.0 115 4.7810 Sakha 8 140.6 100 4.6911 Sakha 61 151.4 099 5.4512 Sakha 69 150.0 088 5.5713 Sakha 92 098.8 095 3.6714 Sohag 1 172.2 088 6.3315 Sohag 2 163.8 095 5.2216 Baniswef 1 158.4 095 5.7617 Gemaza 1 173.8 099 5.4118 Sohag 3 137.6 100 4.80
185

APPENDIX - EGYPTTABLE III. EFFECT OF P SUPPLY (KG P HA1) ON THE TOTAL DRY BIOMASS (KG M2) AND THE NUMBER OF SPIKES PER SQUARE METER, AT DIFFERENT DEVELOPMENT STAGES OF 18 WHEAT GENOTYPES UNDER FIELD CONDITION
Development stages
Gen.P
ShootingA
FLEA
AntheslsB A
MaturityB A
PI 0.114 0.358 227 0.71 J63 0.7981 P2 0.144 0.358 273 0.81 175 0.960
P3 0.162 0.360 285 0.65 180 0.967
PI 0.101 0.383 256 0.51 114 0.5672 P2 0.117 0.650 288 0.68 177 0.760
P3 0.138 0.721 293 0.64 187 0.847
PI 0.130 0.211 174 0.58 142 0.6143 P2 0.131 0.228 199 0.75 160 0.840
P3 0.159 0.287 211 0.77 223 0.869
PI 0.135 0.251 232 0.50 134 0.4524 P2 0.138 0.294 333 0.66 182 0.675
P3 0.151 0.306 289 0.65 184 0.734
PI 0.117 0.333 171 0.50 168 0.6905 P2 0.127 0.340 202 0.73 220 0.907
P3 0.151 0.343 226 0.77 - 236 0.961
PI 0.119 0.356 172 0.70 134 0.7196 P2 0.124 0.364 201 0.91 148 0.797
P3 0.127 0.367 214 0.96 159 0.819
PI 0.124 0.321 180 0.67 170 0.6107 P2 0.135 0.322 237 0.90 229 0.790
P3 0.141 0.333 240 0.93 262 0.953
PI 0.127 0.271 188 0.70 171 0.7988 P2 0.129 0.292 205 0.92 227 0.908
P3 0.129 0.320 217 0.95 230 0.948
PI 0.145 0.295 214 0.76 184 0.7939 P2 0.162 0.299 218 0.77 202 0.832
P3 0.167 0.321 219 0.83 241 0.878
PI 0.126 0.202 192 0.91 196 0.84810 P2 0.184 0.272 219 0.94 222 0.899
P3 0.164 0.282 249 1.05 231 1.031
PI 0.127 0.242 214 0.75 205 0.89811 P2 0.126 0.258 219 0.84 269 0.949
P3 0.147 0.283 220 0.86 272 0.981
PI 0.112 0.280 177 0.72 196 0.70112 P2 0.126 0.287 200 0.91 222 0.872
P3 0.138 0.291 202 0.99 230 0.899
PI 0.132 0.236 181 0.59 167 0.75113 P2 0.139 0.252 184 0.69 200 0.825
P3 0.140 0.258 203 0.70 261 0.851
PI ' 0.121 0.161 176 0.43 142 0.66314 P2 0.122 0.229 179 0.65 164 0.745
P3 0.125 0.238 178 0.67 205 0.783
186

APPENDIX - EGYPT TABLE III. Continued
PI 0.094 0.201 185 0.65 179 0.77115 P2 0.114 0.201 186 0.67 198 0.816
P3 0.117 0.209 208 0.70 200 0.959
PI 0.079 0.247 200 0.49 127 0.54616 P2 0.114 0.340 206 0.53 166 0.573
P3 0.115 0.368 195 0.61 175 0.597
PI- 0.112 0.236 151 0.63 163 0.67717 P2 0.121 0.238 174 0.71 204 0.736
P3 0.125 0.250 175 0.73 ‘ 235 0.858
PI 0.111 0.259 130 0.41 156 0.75318 P2 0.115 0.264 137 0.43 165 0.757
P3 0.119 0.270 136 0.44 176 1.053
LSDoi 05 0.0289 0.0573 23.1 0.021 46.3 0.0760.0139 0.0275 14.2 0.009 21.9 0.019
A = Dry weight, and B * number of spikes.FLE = Flag leaf emergence
APPENDIX - EGYPTTABLE IV. SHOOT BIOMASS AT 4 DEVELOPMENTAL STAGES OF WHEAT GROWN INTHE FIELD AS AFFECTED BY P SUPPLY
P supply kg ha"1
Shoot biomass production kg dry matter ha"1
Tillering Flag leaf appearance
Anthesis Maturity
8.3 1181 2691 6228 702725.0 1299 3049 7500 813475.0 1398 3226 7922 8882
Values are means of 18 cultivars
187

APPENDIX - EGYPTTABLE V. EFFECT OF P-SUPPLY ON THE ROOT DENSITY (CM-CM3) VESICULAR- ARBUSCULAR MYCORRHIZA INFECTION (%) OF WHEAT CULTIVARS UNDER FIELD CONDITIONS, AT DIFFERENT PLANT DEVELOPMENT STAGES
Gen.
PShooting
A BFlagA
leaf appearance B
AntheelsA B
1 0.12 00 0.61 6 0.73 281 2 0.22 00 0.82 3 1.36 27
3 0.64 00 0.84 <2 1.26 27
1 0.44 00 0.67 <2 1.82 262 2 0.19 00 1.00 6 1.40 16
3 0.24 00 0.68 <2 1.02 10
1 0.99 00 1.62 7 2.37 283 2 0.44 00 1.01 <2 1.38 23
3 0.68 00 1.09 <2 2.38 14
1 0.36 00 1.00 9 1.48 194 2 0.99 00 1.66 3 2.11 13
3 0.22 00 0.61 3 0.70 10
1 0.43 00 1.00 6 1.27 666 2 0.11 00 0.24 3 0.66 27
3 0.68 00 0.92 3 1.16 26
1 0.89 00 2.00 1 3.42 616 2 0.21 00 0.62 8 1.01 28
3 0.81 00 0.90 6 1.16 16
1 0.11 00 0.16 17 0.37 347 2 0.33 00 0.46 7 0.87 18
3 0.79 00 1.36 <2 1.70 13
1 0.16 00 0.28 4 0.69 668 2 0.87 00 1.11 4 1.93 44
3 0.81 00 0.68 <2 0.79 08
1 0.42 00 0.88 1 1.28 688 2 0.36 00 0.99 4 1.71 36
3 0.63 00 0.76 4 1.24 33
1 0.44 00 0.66 4 1.06 6110 2 0.71 00 0.79 6 0.92 16
3 0.19 00 0.81 3 1.67 14
1 0.19 00 0.26 16 0.66 6211 2 0.43 00 0.66 4 0.92 28
3 0.24 00 0.61 <2 0.82 28
1 0.28 00 0.66 11 0.97 7012 2 0.31 00 0.41 4 0.62 66
3 0.26 00 0.80 <2 1.34 33
1 0.16 00 0.61 2 1.00 3313 2 0.71 00 0.93 3 1.76 21
3 0.66 00 0.98 2 1.24 18
1 0.97 00 1.42 <2 2.41 3314 2 0.66 00 1.09 <2 2.84 29
3 0.80 00 1.00 <2 1.19 08
1 0.34 00 0.69 <2 1.03 4316 2 0.62 00 0.87 <2 1.42 21
3 0.87 00 0.97 <2 1.67 27
1 0.40 00 0.67 <2 1.01 3018 2 0.26 00 0.44 <2 1.11 26
3 0.36 00 0.66 <2 0.99 13
1 0.26 00 0.39 <2 1.06 6617 2 0.39 00 0.63 <2 0.78 26
3 0.36 00 0.67 <2 1.41 18
A = Root density, and B = VAM infection rate (%).
188

APPENDIX - EGYPTTABLE VI. EFFECT OF P SUPPLY ON TOTAL ROOT VOLUME, ROOT DRY MATTER, ROOT DENSITY, AND VAM INFECTION RATE OF WHEAT UNDER FIELD CONDITIONS, AND ROOT VOLUME, ROOT DRY MATTER, AND ROOT LENGTH OF WHEAT GROWN IN NUTRIENT SOLUTION
Field experiment Nutrient solution
Geno P type level
Volume (cm3!')
Dry matter Density VAM(mg pi."1) (cm cm3) (%)
Volume (cm31"1)
Dry matter (mg pi."1)
Length (m pi."1)
1 3.00 356 0.73 281 2 3.41 491 1.35 27 . • -
3 4.79 584 1.26 27 - * *
i 1.71 228 1.82 262 2 2.62 289 1.40 16 . - -
3 1.90 283 1.02 10 - - -i 2.92 400 2.37 28 0.487 27.34 09.38*
3 2 4.93 338 1.38 23 . - -3 3.22 434 2.38 14 0.971 43.38 12.73**
1 2.32 402 1.48 19 0.492 30.85 10.96*4 2 3.43 520 2.11 13 . - -
3 2.30 409 0.70 10 1.290 47.47 10.66**
1 2.01 400 1.27 65 0.603 38.71 13.25*5 2 2.60 326 0.56 27 . - .
3 3.17 588 1.15 25 1.237 46.32 13.68**
1 2.91 480 3.42 51 . . .
6 2 2.06 279 1.01 28 • -3 2.33 346 1.15 16 - - -
i 2.76 053 0J7 34 0.485 31. 10.19*7 2 1.94 214 0.87 18 - - -
3 2.07 292 1.70 13 0.933 37.40 08.23**
1 2.13 240 0.59 65 0.494 29.55 07.21*8 2 2.47 362 1.93 44 . - -
3 1.62 166 0.79 08 1.058 43.10 12.74**
1 3.19 537 1.28 58 0.449 25.00 8.10*9 2 3.46 335 1.71 36 . - -
3 2.62 219 1.24 33 0.965 38.61 08.25**
1 3.37 155 1.06 51 0.507 28.68 8.80*10 2 1.87 233 0.92 16 . - -
3 3.09 413 1.57 14 1.131 44.343 11.57**
i 3.41 295 0.65 52 0.590 35.00 10.49*11 2 3.27 178 0.92 28 . - -
3 3.41 141 0.82 28 1.129 47.37 09.73**
1 1.86 233 0.97 7012 2 IM 162 0.52 56 . - -
3 1.76 261 0.34 33 - - -
1 2.90 301 1.00 33 0.467 2852 10.31*13 2 2.70 234 1.75 21 - . .
3 2.28 316 1.24 18 0.827 35.30 10.12**
1 2.67 287 2.41 33 0.466 29.68 05.77*14 2 2.88 329 2.84 29 - - -
3 2.14 196 1.19 08 0.860 36.93 07.76**
1 3.19 331 1.03 43 .
13 2 2.17 381 1.42 21 .3 2.95 413 1.67 27 - •
16 1 2.20 353 1X11 30 . .
2 2.73 422 111 26 - .3 2.53 453 0.99 13 - *
, 1.75 161 1.06 5517 2 2.05 236 0.78 26 - -
3 2.16 321 1.41 18 - •
1 2.83 269 2.19 2218 2 2.65 342 2.32 17 . .
3 1.78 273 3.02 12
189

APPENDIX - EGYPTTABLE VH. ORIGIN OF WHEAT GENOTYPES
No. Genotype Origin Year Species Yieldt/ha
1 Giza 155 Regent/2 *Giza 139//Mida-Cadet/2*Hindi 62
. 1968 W 4.0
2 Giza 156 Rio Negro/2*Mentane// Kenya/3/*2Giza 135/1 ino 950
1972 W 4.2
3 Giza 157 Giza 155/pit 62/LR 64/3/Tzpp/Knott 1977 W 5.1
4 Giza 158 Giza 156/7C 1977 W 4.4
5 Giza 160 Chemab 70/ G. 155 1982 W 5.3
6 Giza 162 Vcm/Cno 67"5" 7C/3/Kal/ Bb Pavon "S" CM 8290D-4M 3M-3m-14-l m
1987 w 6.0
7 Giza 163 T. aestivumfBcmIConHC 1987 w 6.3
8 Giza 164 Kvz/Buha "S7/Kal/Bb-Veery "S" 1987 w 5.3
9 Giza 165 Cno/Mfd/Man "S" 1991 w 6.3
10 Sakha 8 Indus/Noreno "S" 34/8-65-l-sw-05 1977 w 4.7
11 Sakha 61 Inia / 4220//7C/Yr "S" 1980 w 5.6
12 Sakha 69 — 1980 w 6.0
13 Sakha 92 Napo 63/Inia 66/ Wern "S" 1551-15-15 1987 w 5.7
14 Gemmeizal Maya 74 "S" //Kal/Bb=Veery "S" 1987 w 6.5
15 Sohag 1 Gdo vz 469/JO "S7/61.130-Lds 1977 D 6.7
16 Sohag 2 Cr "S7 Pelicano //Cr"S7G "S" shl9- lsh-osh.
1987 D 6.6
17 Sohag 3 Mexi "S" Mgha/51792//Durum 6 1991 D 6.0
18 Beni Swief 1 Jo "S7AA "S" II Fg "S" 1987 D 5.9
W = Triticum aestivum; D = Triticum durum
190

APPENDIX - EGYPTTABLE VIII. MONTHLY METEOROLOGICAL DATA OF ISMAILIA LOCATION DURING 1992- 93 AND 1993-94 SEASONS
Season MonthTemperature (°C) Relative Rain fall
(mm)Max. Min. Mean
humidity(%)
November 23.6 11.9 17.8 65.3 0.0December 19.4 8.7 14.1 69.0 1.6
1992-93 January 17.8 6.9 12.4 69.0 2.1February 15.3 6.8 11.1 71.0 6.4March 22.0 10.1 16.1 58.7 1.1April 24.8 11.6 18.2 58.0 0.0
November 25.9 14.6 20.3 65.3 0.0December 22.2 11.4 16.8 75.7 2.2
1993-94 January 20.6 10.2 15.4 70.0 2.7February 21.1 9.1 15.1 63.1 5.5March 22.7 10.6 16.7 63.0 0.9April 26.9 11.2 19.1 62.0 0.0
Data - Courtesy: Water Requirement Section, Agricultural Research Center, Suez Canal.
191

APPENDIX - EGYPTTABLE IX. PERFORMANCE FOR WHEAT CULT!VARS BASED ON RESULTS OF TWO SEASONS
S
Cukivars Grain yield kg/ha
Straw yield g/ha
1000 grains weight g
No. of grains per spike
No. of spikes per m2
Total biomass kg/ha
Protein % Phytin WUEkg/mm
Giza 155 3600 5225 48.1 38.1 171.5 8825 11.74 3.34 10.75
Giza 156 2870 3230 40.4 36.0 119.0 6100 11.29 2.0 8.35
Giza 157 2900 4515 44.5 35.3 182.5 7415 11.47 3.21 08.50
Giza 158 2700 3230 52.2 36.1 159.0 5930 13.64 2.67 7.75
Giza 160 4240 4015 52.0 44.4 202.0 8255 10.48 2.59 12.30
Giza 162 3600 4090 41.4 29.4 146.5 7690 10.05 3.11 10.10
Giza 163 3580 4235 48.0 36.4 216.0 7815 11.42 3.15 9.90
Giza 164 4010 4720 50.5 38.9 200.5 8730 10.75 3.34 12.30
Giza 165 3950 4405 47.9 19.6 212.5 8355 10.69 2.99 12.35
Sakha 8 4850 4545 44.7 45.3 213.5 9395 10.00 2.99 14.00
Sakha 61 4140 5255 54.5 37.5 238.5 9395 8.34 3.47 12.28
Sakha 69 3980 4020 55.7 37.0 213.0 8000 9.56 3.31 11.80
Sakha 92 4050 3955 37.8 25.9 214.0 8010 11.13 1 2.72 11.45
Gemmeiza 1 3970 4005 53.3 19.0 199.0 7675 11.23 4.02 10.75
Sohag 1 3610 3620 64.1 35.3 173.5 7230 10.27 2.72 10.00Sohag 2 3490 5160 52.1 44.8 189.5 8650 10.78 3.72 08.62
Sohag 3 2650 5610 46.9 18.3 166.0 8260 12.65 2.82 11.95
Beniswef 1 340 2725 47.1 43.4 151.0 5715 13.11 3.22 08.30
L S D. 5% 1000 1310 02.8 05.1 046.3 0716 01.43 0.42 00.11

APPENDIX - EGYPTTABLE X. EFFECT OF IRRIGATION LEVEL ON GROWTH AND YIELD PARAMETERS, AND WATER USE EFFICIENCY (WUE)
Treatment Grain yield kg/ha
Straw yield kg/ha
1000 grains weight
g
No. of grains per
spike
No. of spikes per
m2
Totalbiomass
kg/ha
Protein%
Phytin%
WUEkg/mm
W1 3468 3818 48.8 33.75 161.7 7462 11.80 3.34 12.21
W2 4000 4689 50.2 34.63 212.4 8689 10.27 2.80 09.07
LSD. 0430 0230 01.40 02.40 021.9 0195 00.46 0.19 00.045%
W1 = 271 mm irrigation water supply; W2 = 441 mm irrigation water supply
APPENDIX - SIERRA LEONETABLE XI. COWPEA CULTTVARS USED IN EXPERIMENTS CONDUCTED FROM 1990 TO 1994
1990 1991 1992* 1993* 1994*
1 IT82E-32 IT82E-32 IT86D-1010(E) IT86D-1010 IT86D-10102 IT86D-1010 IT86D-1010 IT86D-719(E) IT86D-719 IT81D-8323 IT86D-7194 IT82D-6995 IT87S-14626 IT85D-35777 IT87S-14518 IT83S-8729 IT85E-2687
10 IT81D-83211 TEMNE(local)
IT86D-719IT82D-699IT87S-1462IT85D-3577IT87S-1451IT83S-872IT85E-2687IT81D-832TEMNE(local)
IT81D-832(IE)IT87S-1462(I)TEMNE(local)(D
TEMNE(3ocal) TEMNEflocal)
*Cu2tivars with contrasting P use efficiencies were used: E = Efficicient; EE = Intermediate efficient; I = Inefficient

t APPENDIX - SIERRA LEONETABLE XII. CLIMATIC DATA OF THE TRIAL SITES
Location September October November December
Rainfall (mm) 1993
South Njala Hendobu 681.0 481.6 130.0 13.0
North Makeni 559.6 443.3 93.0 0.0
Temp. (*01993 Min. Max. Min. Max. Min. Max. Min. Max.
South Njala Hendobu 21.5 31.6 21.4 30.2 21.9 32.8 20.5 33.2
North Makeni 20.7 29.7 21.3 31.7 21.0 32.5 16.0 32.8
APPENDIX - SIERRA LEONE TABLE XIII. SIOL ANALYSIS DATA
Trial site pH Available P (ppm)
%N %OM
Njala 4.9 7.05 0.33 6.76Hendobu 5.1 7.98 0.17 2.69Makeni 6.7 5.71 0.27 3.73
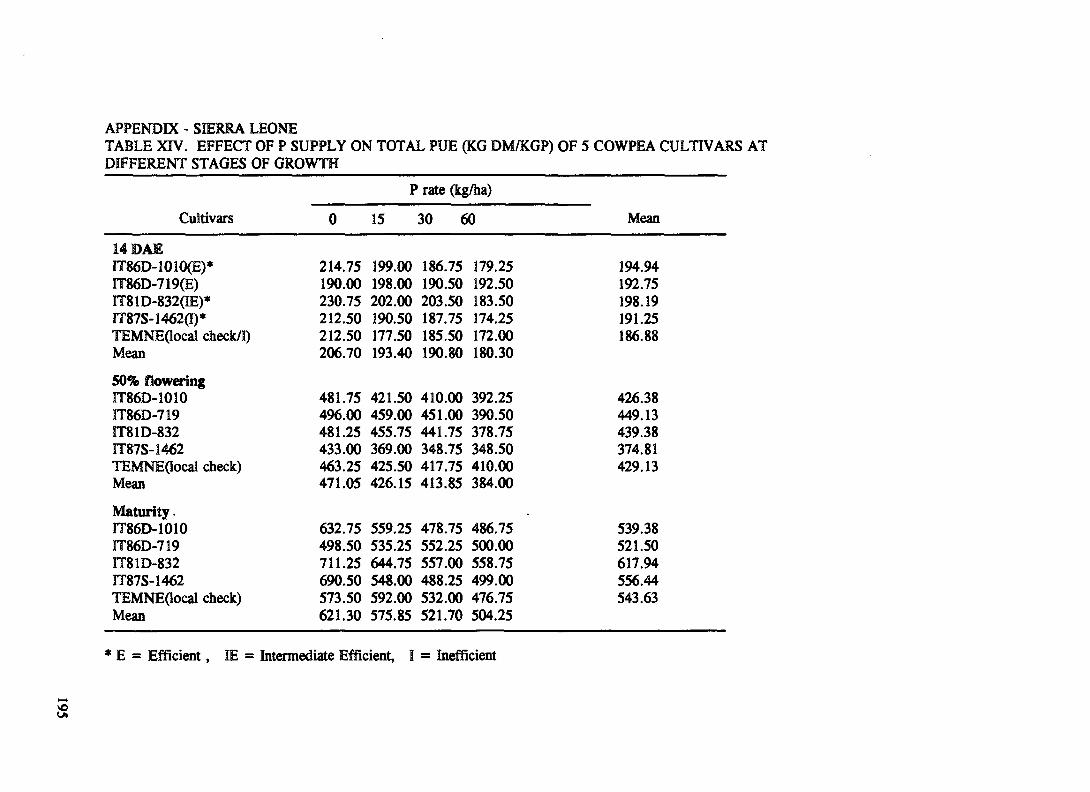
APPENDIX - SIERRA LEONETABLE XIV. EFFECT OF P SUPPLY ON TOTAL PUE (KG DM/KGP) OF 5 COWPEA CULTIVARS AT DIFFERENT STAGES OF GROWTH
P rate (kg/ha)
Cultivars 0 15 30 60 Mean
14 DAEIT86D-1010(E)* 214.75 199.00 186.75 179.25 194.94IT86D-719(E) 190.00 198.00 190.50 192.50 192.75IT81D-832(IE)* 230.75 202.00 203.50 183.50 198.19IT87S-1462(1)* 212.50 190.50 187.75 174.25 191.25TEMNE(local check/I) 212.50 177.50 185.50 172.00 186.88Mean 206.70 193.40 190.80 180.30
50% floweringIT86D-1010 481.75 421.50 410.00 392.25 426.38IT86D-719 496.00 459.00 451.00 390.50 449.13FT81D-832 481.25 455.75 441.75 378.75 439.38IT87S-1462 433.00 369.00 348.75 348.50 374.81TEMNE(local check) 463.25 425.50 417.75 410.00 429.13Mean 471.05 426.15 413.85 384.00
Maturity.IT86D-1010 632.75 559.25 478.75 486.75 539.38IT86D-719 498.50 535.25 552.25 500.00 521.50IT81D-832 711.25 644.75 557.00 558.75 617.94IT87S-1462 690.50 548.00 488.25 499.00 556.44TEMNE(local check) 573.50 592.00 532.00 476.75 543.63Mean 621.30 575.85 521.70 504.25
* E = Efficient, IE = Intermediate Efficient, I = Inefficient

APPENDIX - SIERRA LEONETABLE XV. EFFECT OF P SUPPLY ON GRAIN P YIELD AND PUE OF 4 COWPEA CULTIVARS
CultivateP rate(kg/ha)
0 15 Mean 0 15 MeanGrain P yield(kq/hal Grain PUBfko crrain/kcrP)
IT86D-1010(E)* 1.2 2.6 1.9 292.3 227.5 259.9IT86D-719(E) 1.2 2.8 2.0 267.5 210.8 239.2IT87S-1462(I)* 0.8 1.7 1.3 294.8 238.0 266.4TEMNB(local check/I) 0.6 1.3 1.0 252.8 222.5 237.7Mean 0.9 2.1 276.9 224.7
Lsd(O.OS) Cultivar P rate C x P* E= Efficient 1=
Grain P yield0.50.7NS
Inefficient
Grain PUE11.430.916.2
APPENDIX - SIERRA LEONETABLE XVI. CORRELATION BETWEEN TOTAL AND GRAIN P USE EFFICIENCY AND SOME YIELD PARAMETERS OF COWPEA CULTIVARS AT DIFFERENT STAGES OF GROWTH
Cultivars Total PUE Grain PUE
14 DAEDry matter yield(kg/ha) -0.47nsP yield(kg/ha) -0.57ns
50% FloweringDry matter yield(kg/ha) -0.04nsP yield(kg/ha) -0.19ns
MaturityGrain yield(kg/ha) -0.33ns -0.60nsDry matter(Kg/ha) -0.46ns -0.60nsP yield(kg/ha) -0.53ns -0.35ns
ns means not significant at P > 0.05
APPENDIX - SIERRA LEONETABLE XVII. EFFECT OF P SUPPLY ON NODULATION OF 5 COWPEA CULTIVARS AT FLOWERING
CultivarsP rate (kg/ha)
0 15 30 60 MEAN 0 15 30 60 MEANNodule drv wt.(ma/olant)
IT86D-1010(B)* 15 18 33 38 26 22.5 22.5 52.5 62.5 40.0IT86D-719(E) 22 23 26 36 26 28.8 53.8 88.8 140.0 77.9IT81D-832(IE)* 17 20 26 26 22 16.3 26.3 38.8 43.8 31.3IT87S-1462(I)* 11 12 18 20 15 13.8 16.3 28.8 36.3 23.8TEMNE(local check/I) 14 15 20 24 18 15.0 20.0 36.3 43.3MEAN 16 18 25 28 19.3 27.8 49.0 62.3
* E= Efficient, IB* Intermediate Efficient, 1= Infficient
196

APPENDIX - SIERRA LEONETABLE XVIII. CORRELATION BETWEEN TOTAL AND GRAIN P USE EFFICIENCY AND NITROGEN FIXATION OF COWPEA CULTIVARS AT DIFFERENT STAGES OF GROWTH
Parameter Total PUE Grain PUE
14 DAEN fixed(kg/ha) -0.40ns
50% floweringN fixed(kg/ha) -0.16ns
MaturityN fixed(kg/ha) -0.49ns -0.48ns
ns means not significant at P > 0.05
APPENDIX - SIERRA LEONETABLE IXX. SHOOT AND ROOT DRY MATTER YIELDS AND ROOT:SHOOT RATIO OF 3 COWPEA CULTIVARS UNDER LOW AND HIGH P
P rate(mg P/kg soil)Cultivars 0 30 0 30 0 30
Shoot DW(g/pot) Root DW(g/pot) Root:shoot ratioIT86D-1010(E) 1.05 1.16 0.24 0.29 0.22 0.26IT81D-832(IE) 0.81 0.97 0.25 0.28 0.29 0.29TEMNE(I) 0.34 0.42 0.14 0.16 0.42 0.40Mean 0.73 0.85 0.21 0.24 0.31 0.31Lsd(0.05)Cultivar 0. 17 0 .03 0.07P-rate NS 0 .03 NSC x P NS NS NS
E = Efficient, IE = Intermediate Efficient, I = Inefficient
APPENDIX - SIERRA LEONETABLE XX. ROOT LENGTH(CM/POT), ROOT FINENESS(CM/G/POT) AND MYCORRHIZAL INFECTION(%) OF 3 COWPEA CULTIVARS UNDER LOW AND HIGH P
Cultivars 0 30P rate 0
(mg P/kg soil) 30 0 30
Root length Root fineness VAM infectionIT86D-1010(B) 421.2 648.9 1745.1 2225.9 40.3 59.3IT81D-832(IE) TEMNE(I) 468.1 598.2 1876.8 2155.8 42.3 61.3Mean 182.2 248.8 1356.6 1669.2 29.8 33.5
357.2 498.6 1659.4 2016.9 37.5 51.4Lsd(0.05)CultivarP-rateC x P
71.4958.37NS
348.9314.3NS
6.65.4NS
E = Efficient, IE = Intermediate Efficient, I = Inefficient
197

APPENDIX - NIGERIATABLE XXI. COMPARISON OF DIFFERENT PLANT CHARACTERS OF 20 COWPEA VARIETIES AT ILORA, NIGERIA, 1990-1992 WITH RESPECT TO ADAPTATION IN DRY AREA AND LOW SOIL PHOSPHORUS
Code cultivarGrain yield g/plant
+P -P
Number of pods/plant
+P -P
100 SeedWt. (g)
+P -P
V, Ife Brown 9.0 11.3 26.0 27.0 14.0 14.0V2 K - 28 14.5 25.6 24.0 38.6 15.1 14.2V, IT86D-715 15.4 10.3 20.5 18.9 15.0 14.1V, K - 39 17.0 11.2 30.2 26.7 14.0 13.5V, IT86D-957 16.8 15.9 35.6 20.2 13.2 12.4V6 IAR48 12.4 14.5 25.2 21.5 15.1 14.0V7 K - 59 14.7 19.4 30.8 35.8 11.0 11.0V, TVX 3236 20.0 35.4 40.1 50.7 12.1 11.4V, IFE BPC 15.6 7.9 22.8 19.4 13.5 14.0V10 AFB 1757 14.4 28.4 25.6 39.4 22.0 21.3V„ A* 10.8 10.7 17.5 16.3 20.0 20.0V,2 OGUNFOWOKAN 15.4 25.7 25.3 36.1 15.1 15.2V„ L - 72 12.0 9.6 23.6 20.1 14.0 14.0V„ IARIAR 11/48-2 20.0 111 32.1 24.8 14.1 15.0V,5 H 113 -4 12.3 9.6 27.0 17.0 13.3 14.0V„ IT 80D-721 16.5 17.9 32.0 30.6 . 14.0 15.0V„ IT845 - 2246-4 11.2 17.9 27.0 26.1 14.4 14.2V„ H 64 - 3 14.2 16.7 28.0 25.0 14.0 14.0V„ L - 80 9.1 11.9 14.8 16.7 14.1 13.1V„ IT 86D - 719 7.2 13.5 23.7 20.8 14.0 14.0
Mean 13.9 16.2 26.4 24.3 14.53 14.30Standard Error 1.6 3.6 2.5 5.1 1.19 1.17
198

APPENDIX - NIGERIATABLE XXII. DRY MATTER PRODUCTION OF 20 COWPEA VARIETIES PLANTED AT ILORA, NIGERIA IN 1990-1992
Code cultivar
+P
Root
-P
Shoot
Dry weight
+P -P
Leaf
(g)*
+P -P
Pod
+P -P
Total
+P -P
1 Ife Brown 2.4 5.8 26.6 51.5 14.8 25.7 14.4 19.2 55.8 71.72 K - 28 4.1 7.3 26.1 52.5 18.9 26.2 24.0 39.5 691 81.83 IT86 - 715 4.6 3.9 24.9 35.0 16.8 17.5 18.9 20.5 59.6 47.14 K - 39 2.4 4.0 27.2 35.9 16.4 17.9 32.0 20.2 75.6 46.35 IT86D-957 3.6 3.4 35.7 35.2 36.2 35.2 33.0 25.2 105.2 44.56 IAR48 4.8 4.0 34.3 40.2 22.0 20.1 21.5 24.0 77.8 50.17 K - 59 3.5 3.6 30.5 37.0 25.8 18.5 29.2 33.8 85.6 53.98 TVX 3236 4.6 4.0 28.8 64.3 28.8 32.1 33.3 56.1 90.0 87.19 IFEBPC 2.3 3.2 15.0 30.8 22.8 15.4 23.7 18.1 61.6 43.6
10 AFB 1757 4.9 8.2 27.4 53.4 17.2 26.7 22.6 37.7 65.0 83.211 A» 4.5 4.5 25.2 31.3 20.9 15.6 15.9 15.8 62.1 41.312 OGUNFOWOKAN 2.6 4.6 20.1 44.3 18.0 22.1 22.6 39.1 58.5 65.813 L - 72 2.8 3.9 7.1 35.5 17.7 17.7 21.6 18.1 64.2 41.814 IAR 11/48-2 3.3 4.6 18.7 39.1 17.7 19.5 30.2 17.1 66.4 46.115 H 113 -4 2.6 3.7 29.1 46.0 15.6 23.0 20.7 17.0 65.5 53.916 IT86D-721 4.5 3.4 15.8 47.6 16.4 23.8 26.8 30.0 59.0 57.017 IT 845-2246-4 4.4 3.9 15.3 35.6 17.0 17.8 17.6 27.1 50.1 51.618 H 64 - 3 3.0 3.4 36.3 48.9 17.0 24.4 25.0 28.0 78.3 63.519 L- 80 4.4 4.0 31.0 43.1 16.3 21.5 14.8 17.5 62.4 55.620 IT 86D -719 2.6 3.0 18.1 31.9 16.8 15.9 24.5 22.8 46.2 40.2
Mean 3.6 4.3 25.7 42.0 16.6 21.0 23.6 26.1 67.4 56.3S E 0.2 0.2 1.2 2.2 1.0 2.1 1.4 1.3 2.0 4.4
♦Mean of 5 plants.

APPENDIX - SUDANTABLE XXffl. HABITAT DISCRIPTION OF ACACIA SENEGAL PROVENANCES
code Origin Soil type Topography Rainfall(mm)
1 Rawashda Forest Kassala Province clayey plain 450
2 Wad Delta Gadarif Province clayey plain 473
3 Wad Bashier Forest Kassala clayey plain 485
4 Om Garre forest Hawata Circle clayey plain 490
5 Okalma Forest Blue Nile clayey plain 450
6 Dali Forest Blue Nile Province clayey plain 400
7 Khor Donia Blue Nile Province clayey plain 500
8 Bout Forest Blue Nile Province clayey plain 500
9 Om Naam Tendalti White Nile sandy undulated 300
10 Om Rawaba Forest Kordofan sandy undulated 300
11 Goz Ashger Forest Kordofan sandy undulated 280
12 Bare Forest Kordofan sandy undulated 295
13 El Nuhoud Kordofan sandy undulated 320
APPENDIX - NIGERIA -IITATABLE XXIV. EFFECTS OF DIFFERENT P RATES ON NODULE NUMBER AND NODULE DRY WEIGHT OF THREE GL1RICIDIA SEPIUM PROVENANCES AT 12 AND 24 WEEKS AFTER PLANTING IN THE GREENHOUSE AND IN THE FIELD
Provenance
Rale of P application
Greenhouse (mg P Kg"1 soil) Field (kg ha'1)
0 20 40 80 Mean 0 20 40 80 Mean
Nodule number plant'1
G, 102 176 88 121 122 10 27 19 69 31
G, 145 170 111 101 132 9 73 66 12 40
G, 92 126 188 197 10 18 63 98 47
Mean 113 157 194 137 15 34 49 60
LSD 5% 105 58Nodule dry weight (mg plant'1)
G, 426 456 611 544 509 70 175 145 640 257
G, 575 582 595 269 505 25 312 458 103 225
G, 345 815 1826 723 930 150 110 582 642 371
Mean 452 618 1011 512 117 164 395 462
LSD 5% 384 404 ,
200

APPENDIX - NIGERIA - IITATABLE XXV. EFFECT OF CUTTING MANAGEMENT ON PHYSIOLOGICAL P USE EFFICIENCY (PPUE) OF GL1RICIDU SEP1UM, SENNA SIAMEA AND SENNA SPECTABILIS GROWN IN THE FIELD AT FASHOLA, ONE YEAR AFTER PLANTING
Tree species CutManagement practices
UncutG. sepium 0.71 0.32S. siamea 0.86 0.52
S. speciabilis 0.7 0.46
Mean 0.78 0.43
LSD 5% (1) 0.19
(2) 0.18
Physiological P use efficiency (PPUE) in g shoot mg ' P
APPENDIX - VIET NAMTABLE XXVI. SOIL PROPERTIES OF THE EXPERIMENTAL SITE
Parameter
Depth
0 - 20 cm 20 - 50 cm
pH (H20) 4.9 5.2
pH (KC1) 5.1 5.3
Ca++ (meq/100 g of soil 1.6 1.3
Mg++ " 0.4 0.2
K+ 1.22 1.02
Na+ 0.65 0.71
Bray II soluble P (ppm) 7.0 6.0
C (total, % 1.6 1.3
Total N (%) 0.12 0.1
Sand (%) 69.3 -
Clay (%) 11.6 -
Silt (%) 19.1 -
201

APPENDIX - VIET NAMTABLE XXVII. RICE GENOTYPES USED IN THE EXPERIMENTS
Number Genotype Origin
Group I (Growth period: 90 days)
1 OM 43-26 Stick rice IR 19794
2 OM 90-9 IR 35546-17
3 OM 74-14 IR 23843/OM 26/9R 25587-1334 - -5 - -6 - -7 - -8 -
9 MTL 103 -
10 IR 26 -
Group 2 (Group period: 105 days)
11 OM 16 B -
12 OM 269-65 IR 32843/NN 6A
13 OM 723-11 E NN 6 A/A 69-1
14 OM 90-2 Trangchum/A 69/1
15 IR 72 IR 19661/IR 15795-199/IR 9124-209
16 IR 53915-29 -
17 IR 44592.62 IR 64/IR 1905-81/IR 28/28/45
18 IR 50401-77 IR 33021-39/IR 31802-48
19 WC2 -
20 IR 56382-123 IR 28239-94/IR 24632-34
21 IR 64 IR 5657-33/IR 2061-455
22 IR 13240-108 -
23 KSB 212-85-2 -
24 KSB 212-46-1-2-3 -
202

APPENDIX - VIET NAMTABLE XXVIII. GENOTYPIC DIFFERENCES IN STRAW YIELD (SY), GRAIN YIELD (GY), AND PLANT HEIGHT AT CONTROL AND 90 KG P205 HA1. EXPERIMENT 1.
GenotypeSY
(kg/plot)P - 0 P - 90
GY(kg/plot)
P - 0 P - 90
Plant height (cm)
P - 0 P-90
1 0.504 0.569 0.489 0.488 78.5 82.72 0.744 0.642 0.309 0.380 86.5 88.03 0.788 0.551 0.435 0.415 84.0 84.74 0.557 0.495 0.366 0.385 81.5 81.25 0.675 0.592 0.452 0.478 81.3 80.76 0.495 0.423 0.511 0.534 84.5 84.07 0.618 0.608 0.435 0.459 92.2 90.08 0.738 0.638 0.442 0.445 87.7 93.59 0.446 0.561 0.475 0.450 86.0 86.2
10 0.575 0.632 0.311 0.314 68.7 75.711 0.708 0.713 0.245 0.271 96.7 97.512 0.489 0.485 0.392 0.430 88.5 86.213 0.642 0.642 0.329 0.329 82.2 79.714 0.670 0.661 0.401 0.421 84.5 85.515 0.751 0.675 0.355 0.366 86.2 85.216 0.646 0.614 0.414 0.396 83.7 85.017 0.647 0.575 0.267 0.303 91.2 88.218 0.561 0.632 0.413 0.486 84.2 79.519 0.737 0.736 0.253 0.320 86.2 89.220 0.590 0.608 0.373 0.337 83.0 80.521 0.476 0.461 0.402 0.443 92.0 89.022 0.452 0.433 0.481 0.534 84.2 83.023 0.461 0.437 0.394 0.414 84.5 82.024 0.451 0.433 0.463 0.427 91.7 91.5Mean 0.600 0.576 0.392 0.409 85.4 85.8LSD 5% 0.100 0.090 0.079 0.089 5.7 5.0
APPENDIX - VIET NAMTABLE XXIX. GENOTYPIC DIFFERENCES OF RICE IN P UPTAKE OF SHOOT (PSH) AND ROOT (PR), (GP/POT), AND IN PHOSPHORUS USE EFFICIENCY (PUE)(G SY/G PSH)
Genotype
PSH
0
PR
PPmP
PUB PSH
30 ppmP
PR PUB PSH
90 ppmP
PR RE
G6 12.0 1.46 290 12.7 1.35 275 13.3 2.26 260G22 11.3 1.24 282 14.4 1.82 261 16.1 2.65 238Gil 12.9 1.40 263 15.1 1.28 242 17.1 2.32 214G19 12.7 1.11 261 13.9 1.15 234 14.7 2.54 243
LSD 5$ NS 0.19 15 2.3 0.22 15 2.1 0.35 16
203

APPENDIX - VIET NAMTABLE XXX. GENOTYPIC DIFFERENCES OR RICE IN SHOOT DRY MATTER YIELD (SY), ROOT DRY MATTER YIELD (RY) (G/POT), AND ROOT/SHOOT RATIO (R/S) AT INCREASING P RATES
Genotype 0 ppmP 30 ppmP 90 ppmPSY RY R/S SHY RY R/S- SHY RY
06 3.59 1.71 0.47 3.44 1.52 0.44 3.47 1.91G22 3.22 1.56 0.48 3.40 1.58 0.46 3.46 2.09Gil 3.33 1.36 0.41 3.75 1.42 0.36 0.36 1.66G19 3.31 1.30 0.38 3.26 1.35 0.40 0.40 1.59LSD 5% NS 0.26 0.08 0.30 0.20 0.06 0.06 0.35
APPENDIX - VIET NAMTABLE XXXI. GENOTYPIC DIFFERENCES OF RICE IN DRY WEIGHT OF SHOOT (G/M"2) AT FLOWERING, AND OF STRAW AND GRAIN AT MATURITY
GenotypeYieldcomponent
P rate kg P205/ha
0 30 60 90 120
G6 Flowering 559 581 548 551 531Straw 629 665 669 598 623Grain 420 481 397 396 393
G22 Flowering 480 528 608 576 550Straw 466 435 410 397 405Grain 416 410 388 374 376
G18 Flowering 508 533 559 526 552Straw 535 483 580 511 506Grain 249 293 342 337 297
Gil Flowering 468 494 530 516 560Straw 766 816 744 715 765Grain 178 159 211 193 159
G19 Flowering 519 533 543 546 548Straw 726 650 643 666 733Grain 149 166 169 181 144
Mean Floweing 506 533 557 508 548Straw 624 609 609 577 606Grain 282 301 302 296 273
LSD 5% Flowering 60 58 59 NS NSStraw 42 40 43 40 42Grain 19 18 18 18 16
204
SSS6

APPENDIX - VIET NAMTABLE XXXn. DRY MATTER YIELD (DM), N CONCENTRATION AND N UPTAKE IN STRAW AND GRAIN OF RICE AT INCREASING P RATE
P rate,(kg P20j/ha)
DM(given2)
N(%)
N uptake (given2)
Straw Grain Straw Grain Straw Grain
0 529 397 0.91 1.55 5.59 6.1530 665 418 0.99 1.66 6.63 6.9760 669 433 0.99 1.64 6.66 6.5190 629 396 0.93 1.55 6.77 6.77120 623 393 1.09 1.59 6.79 6.27
LSD 5% 105 48 0.09 0.10 0.12 0.97
APPENDIX - FAO/IAEA AGRICULTURE AND BIOTECHNOLOY LABORATORY, SEIBERSDORFTABLE XXXHI. EFFECT OF PHOSPHORUS SOURCE ON PHOSPHORUS USE EFFICIENCY OF SHOOT, ROOT AND TUBERS OF THREE SWEET POTATO CULTIVARS
Psources
CultivarsHarvest 1 Harvest 2 Harvest 3
Shoot RootPhosphorus use efficiency (g DWVmg P) Shoot Root Tubers Shoot Root Tubers
0P US 1487 0.75 0.21 2.40 0.60 7.03 3.99 0.91 6.99US 2 0.63 0.19 6.05 3.36 8.05 1.74 14.44ns 3053 0.70 0.23 5.83 2.44 8.64 9.98 2.22
TSP ns 1487 0.78 0.18 3.59 1.08 6.80 5.90 1.73 11.13ns 2 0.57 0.12 4.66 2.05 5.85 1.64 8.85ns 3053 0.68 0.14 5.56 2.54 9.03 13.26 3.52
GPR ns 1487 0.53 0.13 2.08 0.60 6.02 3.10 0.75 8.95ns 2 0.63 0.17 3.99 2.32 4.75 1.49 9.16
ns 3053 0.80 0.21 5.20 2.69 8.42 4.30 3.55
* LSD at the 0.05 level of probability to compare P-sources(P), cultivars (C), harvest (H) and any two means, respectively.LSD 0X0.03) shoot; C 0J; H: 0.3; OH: OS.LSD0X0.03)root C 1.1; H: 1.1 ;OH: IS.LSD( 1X0.03)tuber. Cl9.
205
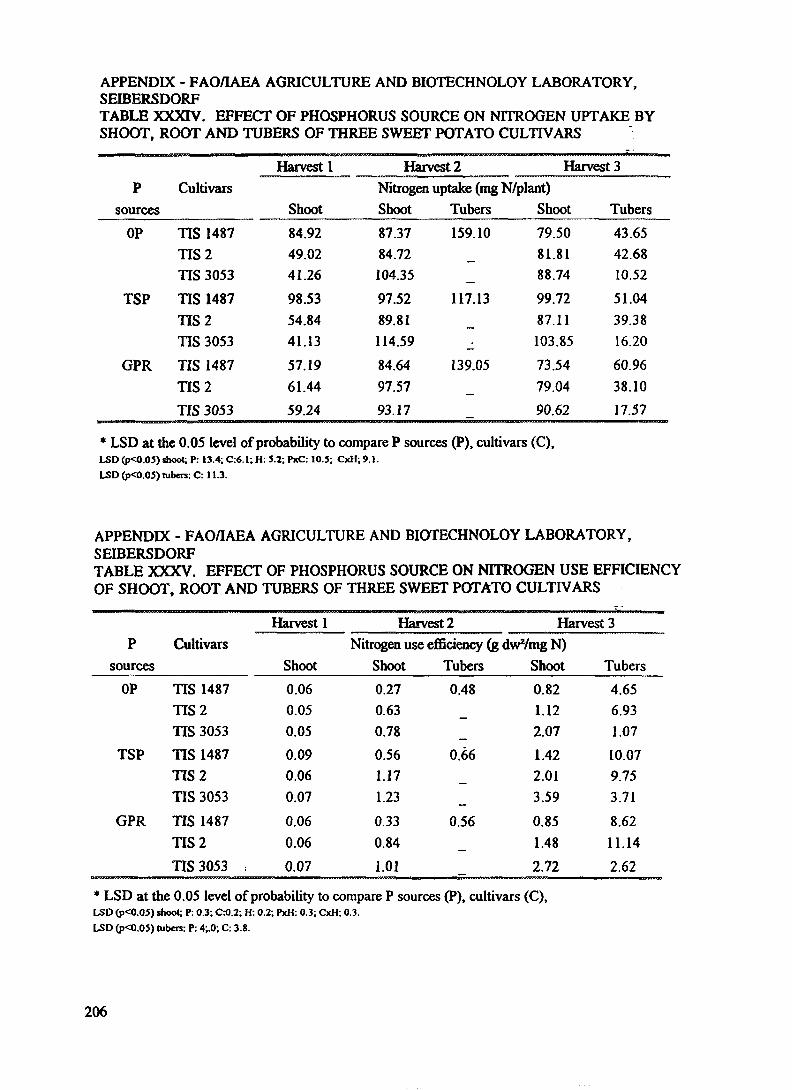
APPENDIX - FAO/IAEA AGRICULTURE AND BIOTECHNOLOY LABORATORY,SEIBERSDORFTABLE XXXIV. EFFECT OF PHOSPHORUS SOURCE ON NITROGEN UPTAKE BYSHOOT, ROOT AND TUBERS OF THREE SWEET POTATO CULTIVARS
Psources
CultivarsHarvest 1 Harvest 2 Harvests
ShootNitrogen uptake (mg N/plant)Shoot Tubers Shoot Tubers
OP TIS 1487 84.92 87.37 159.10 79.50 43.65TIS 2 49.02 84.72 81.81 42.68TIS 3053 41.26 104.35 88.74 10.52
TSP TIS 1487 98.53 97.52 117.13 99.72 51.04ITS 2 54.84 89.81 87.11 39.38TIS 3053 41.13 114.59 103.85 16.20
GPR TIS 1487 57.19 84.64 139.05 73.54 60.96TIS 2 61.44 97.57 79.04 38.10TIS 3053 59.24 93.17 90.62 17.57
* LSD at the 0.05 level of probability to compare P sources (P), cultivars (C),LSD 0X0.05) shoot; P: 13.4; C:6.1; H: 5.2; PxC: 10.5; CxH; 9.1.LSD 0X0.05) tubers: C: 11.3.
APPENDIX - FAO/IAEA AGRICULTURE AND BIOTECHNOLOY LABORATORY, SEIBERSDORFTABLE XXXV. EFFECT OF PHOSPHORUS SOURCE ON NITROGEN USE EFFICIENCY OF SHOOT, ROOT AND TUBERS OF THREE SWEET POTATO CULTIVARS
Harvest 1 Harvest 2 Harvest 3P Cultivars Nitrogen use efficiency (g dwVmg N)
sources Shoot Shoot Tubers Shoot TubersOP TIS 1487 0.06 0.27 0.48 0.82 4.65
TIS 2 0.05 0.63 1.12 6.93TIS 3053 0.05 0.78 2.07 1.07
TSP TIS 1487 0.09 0.56 0.66 1.42 10.07TIS 2 0.06 1.17 2.01 9.75TIS 3053 0.07 1.23 3.59 3.71
GPR TIS 1487 0.06 0.33 0.56 0.85 8.62TIS 2 0.06 0.84 1.48 11.14ITS 3053 , 0.07 101 2.72 2.62
* LSD at the 0.05 level of probability to compare P sources (P), cultivars (C),LSD (p<0.05) shoot; P: 0.3; C:0.2; H: 0.2; PxH: 0.3; CxH; 0.3.LSD (|X0.05) tubers: P: 4;.0; C: 3.8.
206

APPENDIX - FAO/IAEA AGRICULTURE AND BIOTECHNOLOGY LABORATORY, SEIBERSDORFTABLE XXXVI. GENOTYPIC DIFFERENCES IN P UPTAKE EFFICIENCY (mg P/ g ROOT DRY MATTER) OF RICE AT DIFFERENT LEVELS OF APPLED P
GenotypeP Level LSD
at 5%Control 20 ppm 40 ppm 80 ppm 120 ppm
Lalka Mokta 3.78 5.59 7.01 8.33 9.70 0.62
Pokkali 3.24 5.13 6.75 6.95 7.83 1.15
IR-9884 3.31 4.41 5.92 6.72 6.87 0.93
IR-42 4.41 5.88 5.87 6.72 6.81 0.48
KDM-105 3.57 5.96 7.91 7.98 9.90 1.30
LSD at 5% 0.62 0.78 1.13 1.16 0.96 -
APPENDIX - FAO/IAEA AGRICULTURE AND BIOTECHNOLOGY LABORATORY, SEIBERSDORFTABLE XXXVII. GENOTYPIC DIFFERENCES IN P TRANSLOCATION (%) TO SHOOT FROM ROOT AT DIFFERENT LEVELS OF APPLIED P
GenotypeP Level LSD
at 5%Control 20 ppm 40 ppm 80 ppm 120 ppm
Lalka Mokta 78.4 82.4 84.1 83.9 84.4 3.1
Pokkali 74.4 81.1 83.2 82.0 81.3 4.0
IR-9884 69.2 75.5 79.8 79.2 78.1 3.1
IR-42 76.0 82.2 81.1 81.0 80.4 4.1
KDM-105 71.8 78.5 83.1 83.7 84.1 4.0
LSD at 5% 4.2 4.7 2.6 3.4 3.7
207

APPENDIX - FAO/IAEA AGRICULTURE AND BIOTECHNOLOGY LABORATORY,SEIBERSDORFTABLE XXXVIII. THE INFLUENCE OF P LEVELS ON NET PHOTOSYNTHETICRATES OF RICE
GenotypeP Level LSD
Control 20 ppm 40 ppm 80 ppm 120 ppmat 5%
Lalka Mokta 21.69
mg C02 dm 2
22.49 22.89
h '
25.31 23.75 3.64
Pokkali 16.60 20.89 21.15 23.00 23.31 3.53
IR-9884 19.60 22.49 22.90 20.08 21.29 1.55
IR-42 24.64 22.85 24.99 22.83 24.27 3.72
KDM-105 14.86 19.68 24.91 28.92 26.91 3.14
LSD 5% 3.82 4.69 3.90 5.75 4.45
208

LIST OF PARTICIPANTS
RESEARCH CONTRACTS
EGYPT M. AbdouSoil and Water Department, Faculty of Agriculture,Suez Canal University,Ismalia
GHANA 1. OforiDepartment of Crop and Soil Sciences, Faculty of Agriculture, University of Ghana,Legon-Accra
KENYA D O. NyamaiBiotechnology Division,Kenya Forestry Research Institute,P.O. Box 20412, Nairobi
MOROCCO M. BazzaDepartement Hydraulique et Equipment,Institut Agronomique et V6t6rinaire Hassan II,B. P. 6202, Rabat
NIGERIA N O. AfolabiInstitute of Agricultural Research and Training,Obafemi Awolowo University,P.M.B. 5029, Ibadan
B.A. OgunbodedeInstitute of Agricultural Research and Training,Obafemi Awolowo University,P.M.B. 5029, Ibadan
SENEGALL. CisseDepartement de Recherches sur les Systemes Agraires,Centre National de Recherches Agronomiques de Bambey,P.O. Box 53, Bambey
SUDANA. F. MustafaForestry Research Section,Agricultural Research Corporation,P.O. Box 126, Wad Medani
K. H. ElaminForestry Research Section,Agricultural Research Corporation,P.O. Box 126, Wad Medani
SIERRA LEONE D.S. AmaraFaculty of Agriculture, Njala University College, University of Sierra Leone,Private Mail Bag, Freetown
UNITED REPUBLIC OF TANZANIAL. L. LulandalaDepartment of Forest Biology,Sokoine University of Agriculture,P.O. Box 3010, Chuo Kikuu-Morogoro
TUNISIAM. MecherguiInstitut National Agronomique de Tunisie,43, Avenue Charles Nicolle 1002, Tunis
VIETNAMBui Thi Hong ThanhRadiobiology Department,Centre of Nuclear Techniques,217 Nguyen Trai, Q. 1.,Ho Chi Minh City
RESEARCH AGREEMENTS
FRANCE G. VachaudDirector de Recherche C.N.R.S.,Institut de Mechanique de Grenoble,Domaine Universitaire,B. P. 53 X - 38041 Grenoble Cedex
GERMANY W.J. HorstInstitute for Plant Nutrition,University of Hannover,Heffenhiiuser Strasse 2 D-W 3000 Hannover 21
NEW ZEALAND A. HaysteadAuckland Institute of Technology,Private Bag 92006, Auckland 1020
210

NIGERIAN. SangingaInternational Institute of Tropical Agriculture,Oyo Road, PMB 5320, Ibadan
SWEDEN P. HogbergDepartment of Forest Site Research,The Swedish University of Agricultural Sciences,S-901 83 Umea
K. JohansenDepartment of Radioecology,The Swedish University of Agricultural Sciences,P.O. Box 7031,S-750 07 Uppsala
E. HaakDepartment of Radioecology,The Swedish University of Agricultural Sciences,P.O. Box 7031,S-750 07 Uppsala
FAO/IAEA AGRICULTURE AND BIOTECHNOLOGY LABORATORY
E. HolmgrenSoil Science Unit,FAO/IAEA Agriculture and Biotechnology Laboratory,A-2444 Seibersdorf, Austria
A. HerndlSoil Science Unit,FAO/IAEA Agriculture and Biotechnology Laboratory,A-2444 Seibersdorf, Austria
A. MontanezSoil Science Unit,FAO/IAEA Agriculture and Biotechnology Laboratory,A-2444 Seibersdorf, Austria
F. ZapataSoil Science Unit,FAO/IAEA Agriculture and Biotechnology Laboratory,A-2444 Seibersdorf, Austria
JOINT FAO/IAEA DIVISION OF NUCLEAR TECHNIQUES IN FOOD AND AGRICULTURE
K.S. Kumarasinghe (Project Officer)Soil Fertility, Irrigation and Crop Production Section,Joint FAO/IAEA Division of Nuclear Techniques in Food and Agriculture, P.O. Box 100, Wagramerstrasse 5, A-1400 Vienna, Austria
211

RECENT IAEA PUBLICATIONS IN SOIL FERTILITY, IRRIGATION AND CROP PRODUCTION
1990 Use of Nuclear Techniques in Studies of Soil-Plant Relationships (Training Course Series No. 2)
1991 Stable Isotopes in Plant Nutrition, Soil Fertility and Environmental Studies (Proceedings Series)
1992 Manual on Measurement of Methane and Nitrous Oxide Emissions from Agriculture (IAEA-TECDOC-674)
1995 Nuclear Methods in Soil-Plant Aspects of Sustainable Agriculture (IAEA-TECDOC-785)
1995 Management Strategies to Utilize Salt Affected Soils (IAEA-TECDOC-814)
1995 Nuclear Techniques in Soil-Plant Studies for Sustainable Agriculture and Environmental Preservation (Proceedings Series)
213