Automatic Resting Tremor Assessment in Parkinson's Disease ...
Upload
independentCategory
view
5download
0
Clinical Neurophysiology xxx (2013) xxx–xxx
Contents lists available at SciVerse ScienceDirect
Clinical Neurophysiology
journal homepage: www.elsevier .com/locate /c l inph
Intracranial EEG evaluation of relationship within a resting state network
Dominique Duncan a,⇑, Robert B. Duckrow b,c, Steven M. Pincus d, Irina Goncharova b, Lawrence J. Hirsch b,Dennis D. Spencer c, Ronald R. Coifman e, Hitten P. Zaveri b
a Department of Electrical Engineering, Yale University, New Haven, CT 06511, USAb Department of Neurology, Yale University School of Medicine, New Haven, CT 06520, USAc Department of Neurosurgery, Yale University School of Medicine, New Haven, CT 06520, USAd Guilford, CT, USAe Department of Mathematics, Yale University, New Haven, CT 06511, USA
a r t i c l e i n f o h i g h l i g h t s
Article history:Accepted 30 March 2013Available online xxxx
Keywords:EpilepsyResting state networksCoherenceMutual informationCross-approximate entropyGamma power
1388-2457/$36.00 � 2013 International Federation ohttp://dx.doi.org/10.1016/j.clinph.2013.03.028
⇑ Corresponding author. Address: Department oProspect St., AKW 101, Yale University, New Haven,737 5407; fax: +1 203 785 5694.
E-mail address: [email protected] (D. D
Please cite this article in press as: Duncan D ethttp://dx.doi.org/10.1016/j.clinph.2013.03.028
� We tested if a relationship between distant parts of the default mode network (DMN), a resting statenetwork defined by fMRI studies, could be observed in the intracranial EEG.
� Relationship was measured with linear and non-linear relationship measures of the intracranial EEGand an evaluation of the gamma power envelope.
� The relationship within the DMN was not greater than the relationship from DMN locations to a con-trol location outside it, suggesting a lack of intracranial EEG support for the fMRI defined DMN.
a b s t r a c t
Objective: We tested if a relationship between distant parts of the default mode network (DMN), a restingstate network defined by fMRI studies, can be observed with intracranial EEG recorded from patients withlocalization-related epilepsy.Methods: Magnitude squared coherence, mutual information, cross-approximate entropy, and the coher-ence of the gamma power time-series were estimated, for one hour intracranial EEG recordings of back-ground activity from 9 patients, to evaluate the relationship between two test areas which were withinthe DMN (anterior cingulate and orbital frontal, denoted as T1 and posterior cingulate and mesial pari-etal, denoted as T2), and one control area (denoted as C), which was outside the DMN. We tested ifthe relationship between T1 and T2 was stronger than the relationship between each of these areasand C.Results: A low level of relationship was observed among the 3 areas tested. The relationships among T1,T2 and C did not demonstrate support for the DMN.Conclusions: This study suggests a lack of intracranial EEG support for the fMRI defined default mode net-work.Significance: The results obtained underscore the considerable difference between electrophysiologicaland hemodynamic measurements of brain activity and possibly suggest a lack of neuronal involvementin the DMN.� 2013 International Federation of Clinical Neurophysiology. Published by Elsevier Ireland Ltd. All rights
reserved.
1. Introduction
FMRI studies have described a number of resting state networks(RSNs), which are comprised of distant brain areas with relatively
f Clinical Neurophysiology. Publish
f Electrical Engineering, 51CT 06511, USA. Tel.: +1 203
uncan).
al. Intracranial EEG evaluation
high correlation in the BOLD signal while the subject is in a restingstate (Biswal et al., 1995). A particular RSN which has received con-siderable attention is the default mode network (DMN) comprisedof the medial prefrontal cortex (MPFC), posterior cingulate cortex(PCC), and retrosplenial cortex (RCC) (Raichle et al., 2001). Thecorrelated hemodynamic activity within the DMN has beenconsidered to underlie cognitive processes which are importantduring rest (Raichle et al., 2001). In spite of considerable researchactivity in this area, skepticism still persists regarding the fMRI
ed by Elsevier Ireland Ltd. All rights reserved.
of relationship within a resting state network. Clin Neurophysiol (2013),

2 D. Duncan et al. / Clinical Neurophysiology xxx (2013) xxx–xxx
measurements upon which RSNs are based (Greicius et al., 2009),and the electrophysiological underpinnings of RSNs remain to befully understood.
A few recent intracranial EEG (icEEG) studies, conducted on pa-tients undergoing presurgical evaluation for epilepsy, have soughtto understand the electrophysiological underpinnings of RSNs (Heet al., 2008; Jerbi et al., 2010; Dastjerdi et al., 2011; Ko et al., 2011).Given the locations of the areas involved in the DMN, the argumenthas been made that the icEEG can allow direct observation of neu-ronal activity in these areas while scalp EEG may not be able to,and thus icEEG may be superior to scalp EEG for the study of theDMN (Dastjerdi et al., 2011). Jerbi et al. observed gamma-bandpower suppression in regions within the DMN in 2 patients (Jerbiet al., 2010), which was similar to BOLD deactivation observed withfMRI (Raichle et al., 2001). Dastjerdi et al. performed multi-electrode intracranial recordings from the human posteromedialcortex (PMC) in 4 epilepsy patients and compared the activity ofPMC and non-PMC regions during rest, self-referential processing,and arithmetic processing. They demonstrate that the human PMChas significantly higher neural activity during rest, whereas it wasdeactivated by the attention demanding task of arithmetic process-ing (Dastjerdi et al., 2011). In a study of 4 children and 4 adults, Koet al. argued that the DMN is characterized by high gamma band(65–110 Hz) activity which is coherently modulated at a verylow frequency (Ko et al., 2011). This coherence of the gamma bandpower time-series occurs over a narrow frequency range, centeredat 0.015 Hz, which is consistent with the frequency of BOLD signalfluctuations seen by fMRI. He et al. used several analysis methodsto compare correlation structures of BOLD and electrocorticogra-phy (ECoG) signals recorded from the sensorimotor area. Theyshowed in 5 patients that slow cortical potentials (f < 4 Hz)recorded by ECoG demonstrated a correlation structure similar tothat of spontaneous BOLD fluctuations across wakefulness,slow-wave sleep, and rapid-eye-movement sleep, while gammafrequency power also showed a similar correlation during wakeful-ness and rapid-eye-movement sleep but not during slow-wavesleep (He et al., 2008).
These studies underscore the promise of icEEG in understand-ing RSNs and the DMN. However, they do not directly evaluatethe relationship between the areas involved in the DMN, lookingrather to test for task-related deactivation across areas in theDMN with respect to control areas outside the DMN or use an indi-rect measure of relationship, the coherence of the gamma powertime-series, to evaluate the relationship within the DMN. The rel-atively few patients in the different studies underscore the diffi-culty of obtaining icEEG data from locations of interest withinthe DMN and where necessary from a control area outside of it.The current study was focused on the relationship of icEEG activitybetween areas of the DMN. We tested the DMN with icEEG mea-surements in 9 patients undergoing evaluation for epilepsy sur-gery. Electrode contacts placed in areas which correspond to two
Table 1Patients studied.
Patient Gender Age Seizure onset area
1 F 19 Right occipital pole2 M 20 Left anterior and medial frontal3 F 40 Left medial temporal4 F 24 Right posterior fronto-parietal5 F 18 Right anterior lateral and inferior temporal6 F 39 Left medial temporal7 M 12 Right Medial fronto-parietal8 F 27 Right medial temporal9 M 35 Left fronto-parieto-occipital
Nine patients with localization related epilepsy were studied. The age, gender, seizure oncontacts in the three areas studied in individual patients. The duration of data studied r
Please cite this article in press as: Duncan D et al. Intracranial EEG evaluationhttp://dx.doi.org/10.1016/j.clinph.2013.03.028
parts of the DMN and those in a control area were studied. Therelationship between the three defined areas was evaluated withthree different time-series measures to test if there was a strongerrelationship in the resting icEEG between the areas within theDMN relative to the control area outside the DMN.
2. Methods
2.1. Subjects
Intracranial EEG data were collected from 9 patients with local-ization related epilepsy who were undergoing presurgical evalua-tion. The age, gender, seizure onset area, number of contacts, andthe duration of studied data in minutes are listed in Table 1. Thestudy was performed at the Yale-New Haven Hospital. All patientswho underwent icEEG monitoring between 2003 and 2006, hadicEEG electrodes placed in areas of interest for this study, andwho had provided written informed consent were selected for thisstudy.
2.2. Intracranial EEG
Intracranial depth, subdural strip, and subdural grid electrodeswere placed as required for the individual study. Subdural stripand grid electrode contacts were recessed platinum disk contactswith 2.3 mm exposed surface and 1 cm center-to-center separation(Ad-Tech, Racine, WI, USA). Intracranial electrode contacts were lo-cated using a computer program (BioImage Suite) developed atYale University (Papademetris et al., 2004) and a procedure whichhas been described (Goncharova et al., 2009). Intracranial electrodecontacts were located from a postimplantation CT image. Thepostimplantation CT was then coregistered first with a postimplan-tation MR image using a linear coregistration procedure and thenwith a preimplantation MR image using both a linear and a nonlin-ear coregistration procedure. This procedure allowed us to visual-ize intracranial electrode contacts on preimplantation MR images.
All electrode contacts located in three cortical areas were iden-tified: (1) T1: anterior cingulate and orbital frontal, (2) T2: poster-ior cingulate and mesial parietal, and (3) C: superior temporal and/or lateral frontal. The first two areas, T1 and T2, were part of theRSN being tested, whereas the third area, C, was a control area out-side the RSN, which was roughly equidistant from T1 and T2. Allelectrode contacts from the three areas, which were in the record-ing montage were included in the analysis with the following twoexceptions. First, seizure onset contacts were not included in theanalysis. Second, the distance between all pairs of electrode con-tacts for the different site-pairs was estimated. We observed thatthe distance of some electrode contact pairs formed between T1and T2 was lower than that for the other pairs. The relationship be-tween cortical areas is, in general, an inverse function of distance
Number of contacts studied (T1, T2, C) Duration of data studied (min)
2, 3, 5 59.927, 1, 3 56.402, 5, 8 38.459, 8, 4 50.152, 2, 3 37.534, 5, 7 56.234, 7, 2 57.888, 3, 3 59.958, 4, 2 50.90
set area, number of contacts, and duration of data studied are listed. There were 1–9anged from 37.53 to 59.95 min.
of relationship within a resting state network. Clin Neurophysiol (2013),
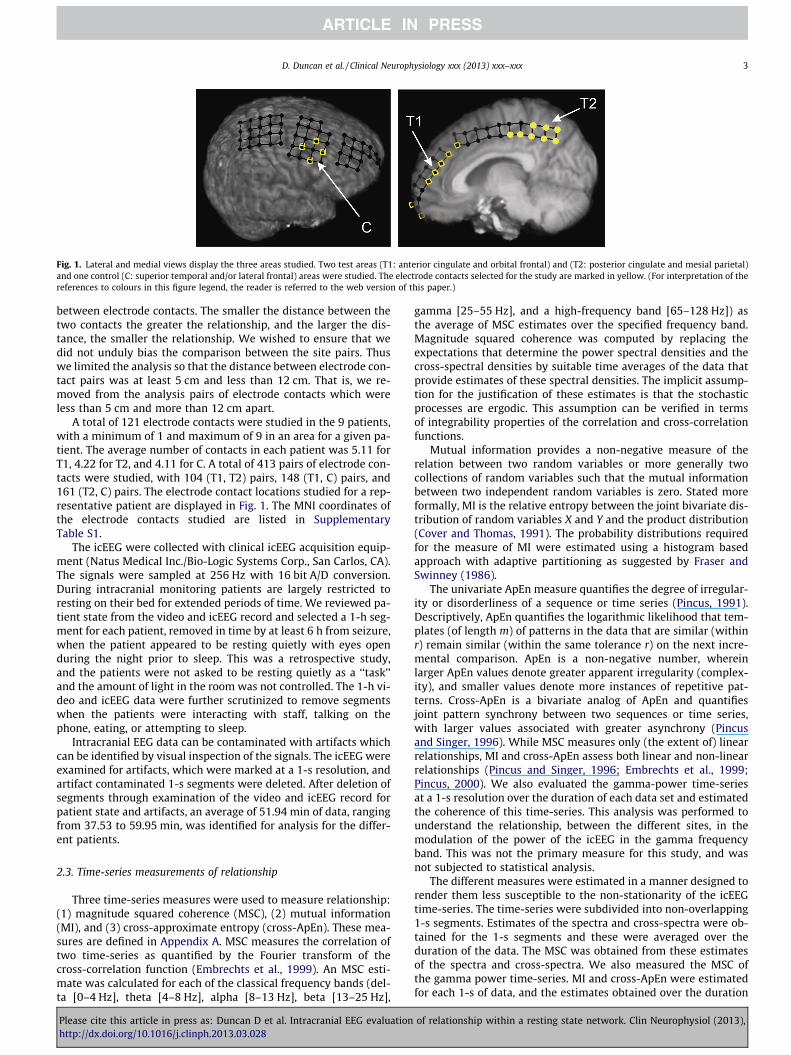
Fig. 1. Lateral and medial views display the three areas studied. Two test areas (T1: anterior cingulate and orbital frontal) and (T2: posterior cingulate and mesial parietal)and one control (C: superior temporal and/or lateral frontal) areas were studied. The electrode contacts selected for the study are marked in yellow. (For interpretation of thereferences to colours in this figure legend, the reader is referred to the web version of this paper.)
D. Duncan et al. / Clinical Neurophysiology xxx (2013) xxx–xxx 3
between electrode contacts. The smaller the distance between thetwo contacts the greater the relationship, and the larger the dis-tance, the smaller the relationship. We wished to ensure that wedid not unduly bias the comparison between the site pairs. Thuswe limited the analysis so that the distance between electrode con-tact pairs was at least 5 cm and less than 12 cm. That is, we re-moved from the analysis pairs of electrode contacts which wereless than 5 cm and more than 12 cm apart.
A total of 121 electrode contacts were studied in the 9 patients,with a minimum of 1 and maximum of 9 in an area for a given pa-tient. The average number of contacts in each patient was 5.11 forT1, 4.22 for T2, and 4.11 for C. A total of 413 pairs of electrode con-tacts were studied, with 104 (T1, T2) pairs, 148 (T1, C) pairs, and161 (T2, C) pairs. The electrode contact locations studied for a rep-resentative patient are displayed in Fig. 1. The MNI coordinates ofthe electrode contacts studied are listed in SupplementaryTable S1.
The icEEG were collected with clinical icEEG acquisition equip-ment (Natus Medical Inc./Bio-Logic Systems Corp., San Carlos, CA).The signals were sampled at 256 Hz with 16 bit A/D conversion.During intracranial monitoring patients are largely restricted toresting on their bed for extended periods of time. We reviewed pa-tient state from the video and icEEG record and selected a 1-h seg-ment for each patient, removed in time by at least 6 h from seizure,when the patient appeared to be resting quietly with eyes openduring the night prior to sleep. This was a retrospective study,and the patients were not asked to be resting quietly as a ‘‘task’’and the amount of light in the room was not controlled. The 1-h vi-deo and icEEG data were further scrutinized to remove segmentswhen the patients were interacting with staff, talking on thephone, eating, or attempting to sleep.
Intracranial EEG data can be contaminated with artifacts whichcan be identified by visual inspection of the signals. The icEEG wereexamined for artifacts, which were marked at a 1-s resolution, andartifact contaminated 1-s segments were deleted. After deletion ofsegments through examination of the video and icEEG record forpatient state and artifacts, an average of 51.94 min of data, rangingfrom 37.53 to 59.95 min, was identified for analysis for the differ-ent patients.
2.3. Time-series measurements of relationship
Three time-series measures were used to measure relationship:(1) magnitude squared coherence (MSC), (2) mutual information(MI), and (3) cross-approximate entropy (cross-ApEn). These mea-sures are defined in Appendix A. MSC measures the correlation oftwo time-series as quantified by the Fourier transform of thecross-correlation function (Embrechts et al., 1999). An MSC esti-mate was calculated for each of the classical frequency bands (del-ta [0–4 Hz], theta [4–8 Hz], alpha [8–13 Hz], beta [13–25 Hz],
Please cite this article in press as: Duncan D et al. Intracranial EEG evaluationhttp://dx.doi.org/10.1016/j.clinph.2013.03.028
gamma [25–55 Hz], and a high-frequency band [65–128 Hz]) asthe average of MSC estimates over the specified frequency band.Magnitude squared coherence was computed by replacing theexpectations that determine the power spectral densities and thecross-spectral densities by suitable time averages of the data thatprovide estimates of these spectral densities. The implicit assump-tion for the justification of these estimates is that the stochasticprocesses are ergodic. This assumption can be verified in termsof integrability properties of the correlation and cross-correlationfunctions.
Mutual information provides a non-negative measure of therelation between two random variables or more generally twocollections of random variables such that the mutual informationbetween two independent random variables is zero. Stated moreformally, MI is the relative entropy between the joint bivariate dis-tribution of random variables X and Y and the product distribution(Cover and Thomas, 1991). The probability distributions requiredfor the measure of MI were estimated using a histogram basedapproach with adaptive partitioning as suggested by Fraser andSwinney (1986).
The univariate ApEn measure quantifies the degree of irregular-ity or disorderliness of a sequence or time series (Pincus, 1991).Descriptively, ApEn quantifies the logarithmic likelihood that tem-plates (of length m) of patterns in the data that are similar (withinr) remain similar (within the same tolerance r) on the next incre-mental comparison. ApEn is a non-negative number, whereinlarger ApEn values denote greater apparent irregularity (complex-ity), and smaller values denote more instances of repetitive pat-terns. Cross-ApEn is a bivariate analog of ApEn and quantifiesjoint pattern synchrony between two sequences or time series,with larger values associated with greater asynchrony (Pincusand Singer, 1996). While MSC measures only (the extent of) linearrelationships, MI and cross-ApEn assess both linear and non-linearrelationships (Pincus and Singer, 1996; Embrechts et al., 1999;Pincus, 2000). We also evaluated the gamma-power time-seriesat a 1-s resolution over the duration of each data set and estimatedthe coherence of this time-series. This analysis was performed tounderstand the relationship, between the different sites, in themodulation of the power of the icEEG in the gamma frequencyband. This was not the primary measure for this study, and wasnot subjected to statistical analysis.
The different measures were estimated in a manner designed torender them less susceptible to the non-stationarity of the icEEGtime-series. The time-series were subdivided into non-overlapping1-s segments. Estimates of the spectra and cross-spectra were ob-tained for the 1-s segments and these were averaged over theduration of the data. The MSC was obtained from these estimatesof the spectra and cross-spectra. We also measured the MSC ofthe gamma power time-series. MI and cross-ApEn were estimatedfor each 1-s of data, and the estimates obtained over the duration
of relationship within a resting state network. Clin Neurophysiol (2013),

4 D. Duncan et al. / Clinical Neurophysiology xxx (2013) xxx–xxx
of recording were averaged. Cross-ApEn was estimated with stan-dard input parameter values (run length) m = 1 and (tolerance)r = 0.2 SD (standard deviation). Further information on the estima-tion of these measures can be found in our previous manuscripts(Pincus and Singer, 1996; Zaveri et al., 1999; Duckrow and Albano,2003; Pincus, 2000). We estimated these relationship measures foreach of the 413 pairs of contacts described above. Cross-ApEn, un-like coherence and MI, is asymmetric, which can allow contrasts be-tween ‘feedback’ and ‘feedforward’ dynamics within closednetworks. Accordingly, we measured cross-ApEn in both directions.Specifically, for cross-ApEnF, we measured the synchrony of orderedpaired dynamics between T1 and T2, T1 and C, and T2 and C, whilefor cross-ApEnR, we measured the same between T2 and T1, C andT1, and C and T2. This procedure resulted in 9 relationship estimatesfor each pair of electrode contacts; 6 estimates for the frequencybands evaluated, 1 estimate for MI, and 2 for cross-ApEn.
2.4. Statistical evaluation
The measures of a relationship between T1 and T2 were sepa-rately compared to the relationship between T1 and C and betweenT2 and C using the Student’s t-test. We define (i): T1 � T2, (ii):T1 � C, and (iii): T2 � C and tested the four hypotheses: H1:(i) > (ii), H2: (i) > (iii), H3: (ii) > (iii), and H4: (iii) > (ii). The first 2were the primary hypotheses for this study, while the latter twowere secondary hypotheses to test our selection of the control area.We used 0.0014 as the level of significance, using a Bonferroni cor-rection and dividing the significance level .05 by 36, the number oftests performed. We also estimated a threshold for significance forthe three measures by the following procedure. We first generated1000 pairs of time-series of normally distributed pseudorandomnumbers using the MATLAB randn function. Each of these time-ser-ies consisted of the equivalent of 37.5 min of data with 256 sam-ples per second (576,000 pseudorandom numbers). The threerelationship measures were evaluated for the 1,000 pairs of pseu-dorandom number time-series following the procedure describedabove for the icEEG time-series. From the estimates obtained, wecan state that all MSC estimates greater than 0.0020 and MI esti-mates greater than 0.0016 are significantly non-zero, and allcross-ApEn estimates lower than 2.3353 are significantly smallerthan maximally asynchronous (all p < 0.001).
3. Results
Continuously evaluated MI estimates, obtained over one hour ofdata for pairs of electrode contacts formed for three example elec-
0 10 200
0.2
0.4
0.6
Info
rmat
ion
(Bits
)
Tim
Fig. 2. Continuous evaluation for a one hour time-period from an example patient of M(blue). The break in the graph is for data that were removed due to patient state and artifof �0.1 to 0.45. The values for T1 � T2 are similar to those for the other pairs.
Please cite this article in press as: Duncan D et al. Intracranial EEG evaluationhttp://dx.doi.org/10.1016/j.clinph.2013.03.028
trode contacts (one each in T1, T2, and C), for a representative pa-tient are shown in Fig. 1. In this patient, a section of the icEEG wasremoved after evaluation of patient state and artifacts leaving50.15 min of resting data. MI was estimated for each 1 s of data,for each of the three pairs of electrode contacts, and these esti-mates were averaged for display purposes over a running non-overlapped 10 s window (Fig. 2). The MI estimates for T1 � T2are shown in red, T1 � C in black, and T2 � C in blue. The MI esti-mates for the three contact pairs are relatively low throughout theduration studied, with most estimates close to 0.25 and a range be-tween approximately 0.1 and 0.45. The estimates are relatively sta-ble, that is, the mean is representative, and the three evaluationsare roughly similar in value and range (T1 � T2 is not greater thanthe other evaluations).
The relationship measures were estimated for all possible pairsof electrode contacts formed between the three areas for all the pa-tients. These estimates were then averaged over all patients forillustrative purposes. The average estimates for each measure (del-ta MSC, theta MSC, alpha MSC, beta MSC, gamma MSC, high-frequency MSC, MI, cross-ApEnF, and cross-ApEnR) for T1 � T2,T1 � C, and T2 � C are displayed in Fig. 3. The relationship mea-sures were also averaged for each patient, once more for illustra-tive purposes, and these estimates are listed in Table 2 bypatient and measure (delta MSC, theta MSC, alpha MSC, betaMSC, gamma MSC, high-frequency MSC, MI, cross-ApEnF, andcross-ApEnR) for T1 � T2, T1 � C, and T2� C. Here, as describedabove, cross-ApEnF represents the relationship between T1 and T2,T1 and C, and T2 and C, whereas cross-ApEnR represents the rela-tionship between T2 and T1, C and T1, and C and T2. The averageMSC, MI, and cross-ApEn estimates, in Fig. 3 and Table 2, showedconsistency among the values for all pairs of electrode contacts ineach area and do not suggest the presence of a pronounced relation-ship between any of the areas studied, nor a greater relationship be-tween T1 � T2 in comparison to T1 � C or T2� C.
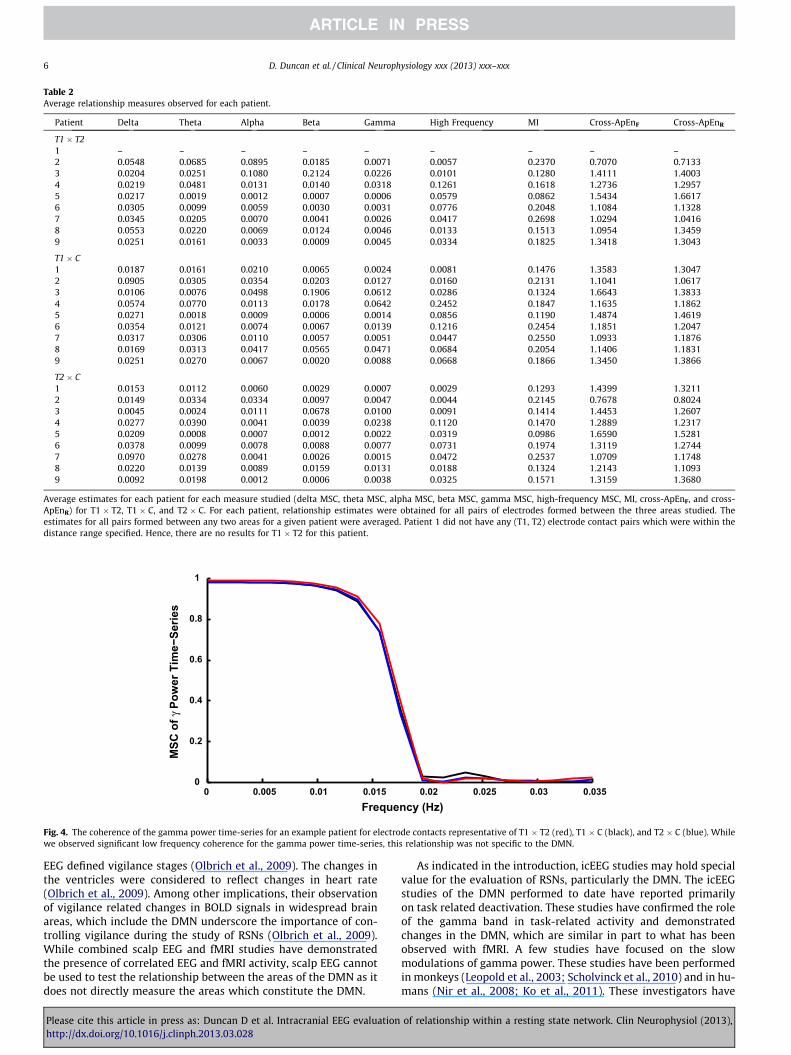
Gamma power was calculated at a 1-s resolution over the dura-tion of the data for all the electrode contacts in T1, T2 and C. Wethen measured the MSC of the gamma power time-series. A repre-sentative example from a single set of contacts from T1, T2 and C ina patient is shown in Fig. 4. In Fig. 4, the coherence of the gammapower time-series for T1xT2 is shown in red, T1 � C in black, andT2 � C in blue. A plateau can be observed at very low frequencies(f < 0.015 Hz) in the MSC of the gamma power time-series. A peakfrequency of approximately 0.015 Hz has been reported by otherswho have performed second spectrum analysis of the gammapower time series. We observed a low-frequency plateau in theT1 � T2, T1 � C, and T2 � C gamma power MSC. That is, the low-
30 40 50 60e (Min)
I for electrode contacts representative of T1 � T2 (red), T1 � C (black), and T2 � Cacts, leaving 50.15 min of data to be studied. Most values are near 0.25 with a range
of relationship within a resting state network. Clin Neurophysiol (2013),

Fig. 3. Average estimates for each measure studied (delta MSC, theta MSC, alpha MSC, beta MSC, gamma MSC, high-frequency MSC, MI, cross-ApEnF, and cross-ApEnR) forT1 � T2, T1 � C, and T2 � C are shown. Cross-ApEnF shows the relationship between T1 and T2, T1 and C, and T2 and C, whereas cross-ApEnR shows the relationship betweenT2 and T1, C and T1, and C and T2. Measures were estimated for all pairs of electrodes formed between these three areas and then averaged. The values show the presence oflow relationship between the areas studied and that the relationship between T1 � T2 is not greater than the relationship between the other areas (T1 � C and T2 � C).
D. Duncan et al. / Clinical Neurophysiology xxx (2013) xxx–xxx 5
frequency MSC of the gamma power time-series was not observedto be specific to the sites in the DMN.
We tested for the presence of significant differences in the elec-trophysiological relationships within the DMN and outside theDMN as described in the methods section. The statistical evalua-tions were performed on the relationship measures for the 413pairs of electrode contacts studied. The hypothesis H1:T1 � T2 > T1 � C, was rejected for each measure (Table 3). H2:T1 � T2 > T2 � C, was rejected for 3 of the 9 measures. The hypoth-esis was not rejected for MSC in the theta, alpha, gamma, and high-frequency bands, and MI, and cross-ApEnF (p < 0.05). H3:T1 � C > T2 � C, was rejected for 4 of the 9 measures. H3 was notrejected for theta, alpha, gamma, high-frequency, and MI(p < 0.05). H4: T2 � C > T1 � C, was rejected for each measure.
4. Discussion
Since the initial observation approximately 15 years ago, RSNshave been considerably tested and extended with the use of othermodalities and additional analysis. For example, diffusion tensorimaging (DTI) and fMRI have been used in conjunction to demon-
Please cite this article in press as: Duncan D et al. Intracranial EEG evaluationhttp://dx.doi.org/10.1016/j.clinph.2013.03.028
strate that resting state functional connectivity reflects structuralconnectivity (Skudlarski et al., 2008; Greicius et al., 2009). Therehave also been several studies that have combined fMRI and EEGto relate hemodynamic and electrophysiological activity. Laufset al. studied simultaneously acquired scalp EEG and fMRI in 15healthy subjects. They observed a negative correlation of parietaland frontal cortical BOLD activity with alpha power in all scalpEEG electrode positions studied. They argue that the relationshipsobserved suggest the presence of separable dynamic functionalnetworks, which underlie RSNs including the DMN with a particu-lar role for power in the 17–23 Hz for activity in the DMN (Laufset al., 2003). Mantini et al. employed a data driven approach to ar-rive at a description of six widely distributed RSNs. The BOLD sig-nal fluctuations associated with the six networks were correlatedwith EEG power variations in delta through gamma frequencybands (Mantini et al., 2007). They argue that the activity in theseRSNs can be considered to be a basis function from which task-related networks can be dynamically assembled and modulated.Olbrich et al. found BOLD signals increased in occipital, anteriorcingulate, frontal, parietal, and temporal cortices and decreasedin the thalamus and parts of the lateral ventricles with decreasing
of relationship within a resting state network. Clin Neurophysiol (2013),
0 0.005 0.01 0.015 0.02 0.025 0.03 0.0350
0.2
0.4
0.6
0.8
1
Frequency (Hz)
MSC
of γ
Pow
er T
ime−
Serie
s
Fig. 4. The coherence of the gamma power time-series for an example patient for electrode contacts representative of T1 � T2 (red), T1 � C (black), and T2 � C (blue). Whilewe observed significant low frequency coherence for the gamma power time-series, this relationship was not specific to the DMN.
Table 2Average relationship measures observed for each patient.
Patient Delta Theta Alpha Beta Gamma High Frequency MI Cross-ApEnF Cross-ApEnR
T1 � T21 – – – – – – – – –2 0.0548 0.0685 0.0895 0.0185 0.0071 0.0057 0.2370 0.7070 0.71333 0.0204 0.0251 0.1080 0.2124 0.0226 0.0101 0.1280 1.4111 1.40034 0.0219 0.0481 0.0131 0.0140 0.0318 0.1261 0.1618 1.2736 1.29575 0.0217 0.0019 0.0012 0.0007 0.0006 0.0579 0.0862 1.5434 1.66176 0.0305 0.0099 0.0059 0.0030 0.0031 0.0776 0.2048 1.1084 1.13287 0.0345 0.0205 0.0070 0.0041 0.0026 0.0417 0.2698 1.0294 1.04168 0.0553 0.0220 0.0069 0.0124 0.0046 0.0133 0.1513 1.0954 1.34599 0.0251 0.0161 0.0033 0.0009 0.0045 0.0334 0.1825 1.3418 1.3043
T1 � C1 0.0187 0.0161 0.0210 0.0065 0.0024 0.0081 0.1476 1.3583 1.30472 0.0905 0.0305 0.0354 0.0203 0.0127 0.0160 0.2131 1.1041 1.06173 0.0106 0.0076 0.0498 0.1906 0.0612 0.0286 0.1324 1.6643 1.38334 0.0574 0.0770 0.0113 0.0178 0.0642 0.2452 0.1847 1.1635 1.18625 0.0271 0.0018 0.0009 0.0006 0.0014 0.0856 0.1190 1.4874 1.46196 0.0354 0.0121 0.0074 0.0067 0.0139 0.1216 0.2454 1.1851 1.20477 0.0317 0.0306 0.0110 0.0057 0.0051 0.0447 0.2550 1.0933 1.18768 0.0169 0.0313 0.0417 0.0565 0.0471 0.0684 0.2054 1.1406 1.18319 0.0251 0.0270 0.0067 0.0020 0.0088 0.0668 0.1866 1.3450 1.3866
T2 � C1 0.0153 0.0112 0.0060 0.0029 0.0007 0.0029 0.1293 1.4399 1.32112 0.0149 0.0334 0.0334 0.0097 0.0047 0.0044 0.2145 0.7678 0.80243 0.0045 0.0024 0.0111 0.0678 0.0100 0.0091 0.1414 1.4453 1.26074 0.0277 0.0390 0.0041 0.0039 0.0238 0.1120 0.1470 1.2889 1.23175 0.0209 0.0008 0.0007 0.0012 0.0022 0.0319 0.0986 1.6590 1.52816 0.0378 0.0099 0.0078 0.0088 0.0077 0.0731 0.1974 1.3119 1.27447 0.0970 0.0278 0.0041 0.0026 0.0015 0.0472 0.2537 1.0709 1.17488 0.0220 0.0139 0.0089 0.0159 0.0131 0.0188 0.1324 1.2143 1.10939 0.0092 0.0198 0.0012 0.0006 0.0038 0.0325 0.1571 1.3159 1.3680
Average estimates for each patient for each measure studied (delta MSC, theta MSC, alpha MSC, beta MSC, gamma MSC, high-frequency MSC, MI, cross-ApEnF, and cross-ApEnR) for T1 � T2, T1 � C, and T2 � C. For each patient, relationship estimates were obtained for all pairs of electrodes formed between the three areas studied. Theestimates for all pairs formed between any two areas for a given patient were averaged. Patient 1 did not have any (T1, T2) electrode contact pairs which were within thedistance range specified. Hence, there are no results for T1 � T2 for this patient.
6 D. Duncan et al. / Clinical Neurophysiology xxx (2013) xxx–xxx
EEG defined vigilance stages (Olbrich et al., 2009). The changes inthe ventricles were considered to reflect changes in heart rate(Olbrich et al., 2009). Among other implications, their observationof vigilance related changes in BOLD signals in widespread brainareas, which include the DMN underscore the importance of con-trolling vigilance during the study of RSNs (Olbrich et al., 2009).While combined scalp EEG and fMRI studies have demonstratedthe presence of correlated EEG and fMRI activity, scalp EEG cannotbe used to test the relationship between the areas of the DMN as itdoes not directly measure the areas which constitute the DMN.
Please cite this article in press as: Duncan D et al. Intracranial EEG evaluationhttp://dx.doi.org/10.1016/j.clinph.2013.03.028
As indicated in the introduction, icEEG studies may hold specialvalue for the evaluation of RSNs, particularly the DMN. The icEEGstudies of the DMN performed to date have reported primarilyon task related deactivation. These studies have confirmed the roleof the gamma band in task-related activity and demonstratedchanges in the DMN, which are similar in part to what has beenobserved with fMRI. A few studies have focused on the slowmodulations of gamma power. These studies have been performedin monkeys (Leopold et al., 2003; Scholvinck et al., 2010) and in hu-mans (Nir et al., 2008; Ko et al., 2011). These investigators have
of relationship within a resting state network. Clin Neurophysiol (2013),
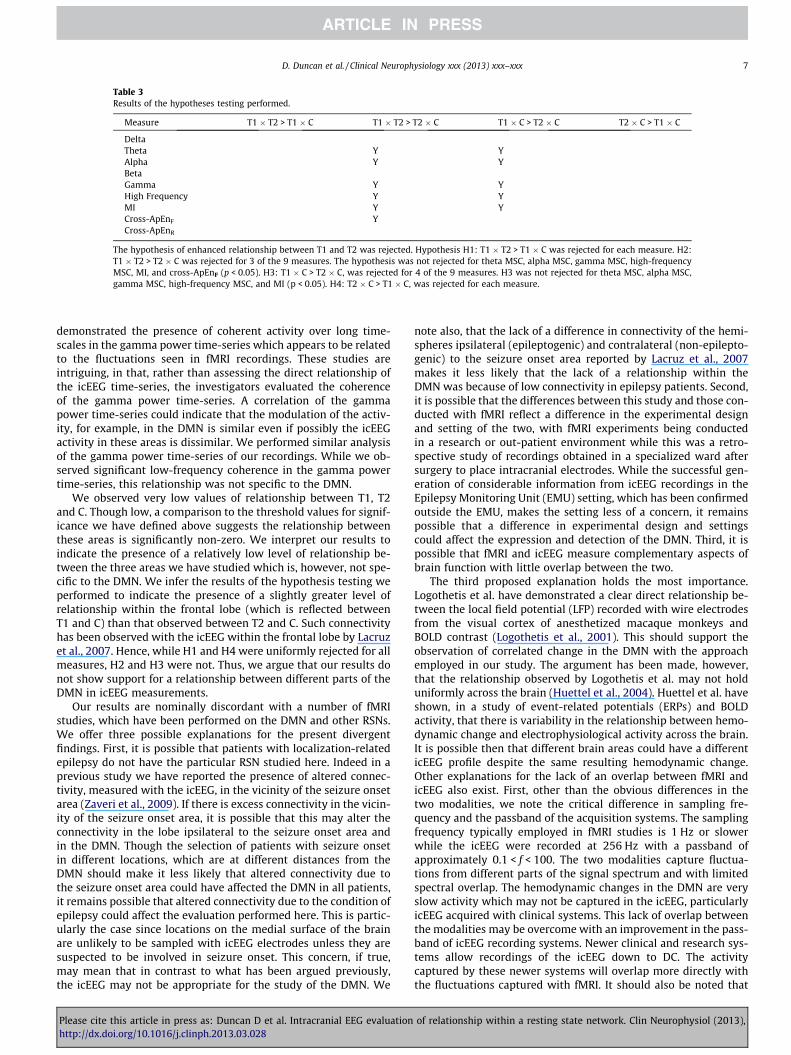
Table 3Results of the hypotheses testing performed.
Measure T1 � T2 > T1 � C T1 � T2 > T2 � C T1 � C > T2 � C T2 � C > T1 � C
DeltaTheta Y YAlpha Y YBetaGamma Y YHigh Frequency Y YMI Y YCross-ApEnF YCross-ApEnR
The hypothesis of enhanced relationship between T1 and T2 was rejected. Hypothesis H1: T1 � T2 > T1 � C was rejected for each measure. H2:T1 � T2 > T2 � C was rejected for 3 of the 9 measures. The hypothesis was not rejected for theta MSC, alpha MSC, gamma MSC, high-frequencyMSC, MI, and cross-ApEnF (p < 0.05). H3: T1 � C > T2 � C, was rejected for 4 of the 9 measures. H3 was not rejected for theta MSC, alpha MSC,gamma MSC, high-frequency MSC, and MI (p < 0.05). H4: T2 � C > T1 � C, was rejected for each measure.
D. Duncan et al. / Clinical Neurophysiology xxx (2013) xxx–xxx 7
demonstrated the presence of coherent activity over long time-scales in the gamma power time-series which appears to be relatedto the fluctuations seen in fMRI recordings. These studies areintriguing, in that, rather than assessing the direct relationship ofthe icEEG time-series, the investigators evaluated the coherenceof the gamma power time-series. A correlation of the gammapower time-series could indicate that the modulation of the activ-ity, for example, in the DMN is similar even if possibly the icEEGactivity in these areas is dissimilar. We performed similar analysisof the gamma power time-series of our recordings. While we ob-served significant low-frequency coherence in the gamma powertime-series, this relationship was not specific to the DMN.
We observed very low values of relationship between T1, T2and C. Though low, a comparison to the threshold values for signif-icance we have defined above suggests the relationship betweenthese areas is significantly non-zero. We interpret our results toindicate the presence of a relatively low level of relationship be-tween the three areas we have studied which is, however, not spe-cific to the DMN. We infer the results of the hypothesis testing weperformed to indicate the presence of a slightly greater level ofrelationship within the frontal lobe (which is reflected betweenT1 and C) than that observed between T2 and C. Such connectivityhas been observed with the icEEG within the frontal lobe by Lacruzet al., 2007. Hence, while H1 and H4 were uniformly rejected for allmeasures, H2 and H3 were not. Thus, we argue that our results donot show support for a relationship between different parts of theDMN in icEEG measurements.
Our results are nominally discordant with a number of fMRIstudies, which have been performed on the DMN and other RSNs.We offer three possible explanations for the present divergentfindings. First, it is possible that patients with localization-relatedepilepsy do not have the particular RSN studied here. Indeed in aprevious study we have reported the presence of altered connec-tivity, measured with the icEEG, in the vicinity of the seizure onsetarea (Zaveri et al., 2009). If there is excess connectivity in the vicin-ity of the seizure onset area, it is possible that this may alter theconnectivity in the lobe ipsilateral to the seizure onset area andin the DMN. Though the selection of patients with seizure onsetin different locations, which are at different distances from theDMN should make it less likely that altered connectivity due tothe seizure onset area could have affected the DMN in all patients,it remains possible that altered connectivity due to the condition ofepilepsy could affect the evaluation performed here. This is partic-ularly the case since locations on the medial surface of the brainare unlikely to be sampled with icEEG electrodes unless they aresuspected to be involved in seizure onset. This concern, if true,may mean that in contrast to what has been argued previously,the icEEG may not be appropriate for the study of the DMN. We
Please cite this article in press as: Duncan D et al. Intracranial EEG evaluationhttp://dx.doi.org/10.1016/j.clinph.2013.03.028
note also, that the lack of a difference in connectivity of the hemi-spheres ipsilateral (epileptogenic) and contralateral (non-epilepto-genic) to the seizure onset area reported by Lacruz et al., 2007makes it less likely that the lack of a relationship within theDMN was because of low connectivity in epilepsy patients. Second,it is possible that the differences between this study and those con-ducted with fMRI reflect a difference in the experimental designand setting of the two, with fMRI experiments being conductedin a research or out-patient environment while this was a retro-spective study of recordings obtained in a specialized ward aftersurgery to place intracranial electrodes. While the successful gen-eration of considerable information from icEEG recordings in theEpilepsy Monitoring Unit (EMU) setting, which has been confirmedoutside the EMU, makes the setting less of a concern, it remainspossible that a difference in experimental design and settingscould affect the expression and detection of the DMN. Third, it ispossible that fMRI and icEEG measure complementary aspects ofbrain function with little overlap between the two.
The third proposed explanation holds the most importance.Logothetis et al. have demonstrated a clear direct relationship be-tween the local field potential (LFP) recorded with wire electrodesfrom the visual cortex of anesthetized macaque monkeys andBOLD contrast (Logothetis et al., 2001). This should support theobservation of correlated change in the DMN with the approachemployed in our study. The argument has been made, however,that the relationship observed by Logothetis et al. may not holduniformly across the brain (Huettel et al., 2004). Huettel et al. haveshown, in a study of event-related potentials (ERPs) and BOLDactivity, that there is variability in the relationship between hemo-dynamic change and electrophysiological activity across the brain.It is possible then that different brain areas could have a differenticEEG profile despite the same resulting hemodynamic change.Other explanations for the lack of an overlap between fMRI andicEEG also exist. First, other than the obvious differences in thetwo modalities, we note the critical difference in sampling fre-quency and the passband of the acquisition systems. The samplingfrequency typically employed in fMRI studies is 1 Hz or slowerwhile the icEEG were recorded at 256 Hz with a passband ofapproximately 0.1 < f < 100. The two modalities capture fluctua-tions from different parts of the signal spectrum and with limitedspectral overlap. The hemodynamic changes in the DMN are veryslow activity which may not be captured in the icEEG, particularlyicEEG acquired with clinical systems. This lack of overlap betweenthe modalities may be overcome with an improvement in the pass-band of icEEG recording systems. Newer clinical and research sys-tems allow recordings of the icEEG down to DC. The activitycaptured by these newer systems will overlap more directly withthe fluctuations captured with fMRI. It should also be noted that
of relationship within a resting state network. Clin Neurophysiol (2013),

8 D. Duncan et al. / Clinical Neurophysiology xxx (2013) xxx–xxx
the susceptibility of the fMRI to artifacts including vasomotionmay affect the slow activity observed in RSNs (Razavi et al.,2008). As a further consideration of the difference between thetwo modalities, it should be noted that fMRI equipment does notcontain a temporal anti-aliasing filter while icEEG equipment does.It is possible then that fMRI time-series can contain signals, whichare temporally aliased (Razavi et al., 2008). Aliasing is non-correct-able and can diminish or even negate the value of any analysis per-formed on aliased time-series. If power in the fMRI time-series isaliased, then the findings obtained through the time-series analysisof fMRI signals should be reinterpreted in that light.
5. Conclusions
We did not observe a relationship in the icEEG between distantparts of the DMN. The lack of an electrophysiological relationshipwithin areas of the DMN may be due to the difference in subjectsstudied, experimental setting, or how the underlying phenomenonis reflected in the icEEG. The lack of icEEG support of an fMRIobservation of a relationship may also reflect the considerable dif-ference between the two modalities, including the possibility ofthe presence of aliased power (and the concomitant statisticalcompromise) in the fMRI time-series.
Acknowledgments
We thank Mark G. Frei (Flint Hills Scientific), Edward J. Novotny(University of Washington), Josef Parvizi (Stanford University), Jef-frey G. Ojemann (University of Washington), Hoby P. Hetherington(Yale University), and Jullie W. Pan (Yale University) for helpfuldiscussion. None of the authors has any conflict of interest or po-tential financial interests to disclose.
Appendix A.
A.1. Coherence
If GXX(f), GYY(f) are auto-power spectral densities and GXY(f) isthe cross-power spectrum of two stationary random processesX(t) and Y(t), then the coherence k(f) is defined as: k(f) = GXY(f)/(GXX(f) � GYY(f))1/2.
A.2. Mutual information
I(X;Y) =R
YR
X p(x,y)log(p(x,y)/(p1(x)p2(y)))dxdy, for continuousrandom variables, X and Y, where p(x,y) is the joint probabilitydensity function of X and Y, and p1(x) and p2(x) are the marginalprobability density functions of X and Y, respectively.
I(X;Y) =P
YP
X p(x,y)log(p(x,y)/(p1(x)p2(y))), for discrete ran-dom variables, X and Y, where p(x,y) is the joint probability massfunction of X and Y, and p1(x) and p2(x) are the marginal probabilitymass functions of X and Y, respectively.
The base of the logarithm in these definitions determines thenumerical scale used to measure information. The most commonbases are 2 and e. For base 2 logarithms, the numerical value ofI(X;Y) is measured in bits (binary digits) of information, and fornatural logarithms, the numerical value of I(X;Y) is measured innats (natural units) of information. The number of nats is the num-ber of bits times ln2 = 0.693.
A.3. Cross-approximate entropy (Cross-ApEn)
Let u = (u(1), u(2), . . .,u(N)) and v = (v(1), v(2), . . .,v(N)) be twolength-N sequences, and we fix input parameters m and r. Formvector sequences x(i) = (u(i), u(i + 1), . . .,u(i + m � 1)) and
Please cite this article in press as: Duncan D et al. Intracranial EEG evaluationhttp://dx.doi.org/10.1016/j.clinph.2013.03.028
y(j) = (v(j), v(j + 1), . . .,v(j + m � 1)) from u and v, respectively. Foreach i 6 N �m + 1, set Cm
j (r) (v||u) = (number of j 6 N �m + 1 suchthat d[x(i),y(j)] 6 r)/(N �m + 1), where d[x(i),y(j)] = maxk = 1,2, ...,m (|u(i + k � 1) � v(j + k � 1)|), i.e., the maximum differ-ence in their respective scalar components. Then define Um(r)(v||u)as the average value of ln Cm
j (r)(v||u), and finally, define cross-ApEn(m,r,N)(v||u) = Um(r)(v||u) � Um+1(r)(v||u). This value mea-sures the logarithmic frequency with which blocks of length m thatare close together remain close together for blocks augmented byone position.
Typically, we apply cross-ApEn to normalized u and v time-ser-ies data, i.e., for each subject, we apply cross-ApEn(m,r,N) to the{u⁄(i), v⁄(i)} series, where u⁄(i) = (u(i) �mean u)/SD u andv⁄(i) = (v(i) �mean v)/SD v. This normalization, in conjunction withthe present parameter choice of m = 1 and r = 0.2 SD (the standard,very widely utilized values), ensures good replicability propertiesfor cross-ApEn for the data lengths under study.
Appendix B. Supplementary data
Supplementary data associated with this article can be found, inthe online version, at http://dx.doi.org/10.1016/j.clinph.2013.03.028.
References
Biswal B, Yetkin FZ, Haughton VM, Hyde JS. Functional connectivity in the motorcortex of resting human brain using echo-planar MRI. Magn Reson Med1995;34:537–41.
Cover TM, Thomas JA. Elements of Information Theory. Wiley; 1991.Dastjerdi M, Foster BL, Nasrullah S, Rauschecker AM, Dougherty RF, Townsend JD,
et al. Differential electrophysiological response during rest, self-referential, andnon-self-referential tasks in human posteromedial cortex. Proc Natl Acad Sci U SA 2011;108:3023–8.
Duckrow RB, Albano AM. Comment on ‘‘Performance of different synchronizationmeasures in real data: a case study on electroencephalographic signals’’. PhysRev E 2003;67:063901.
Embrechts P, McNeil A, Straumann D. Correlation and dependency in riskmanagement: properties and pitfalls. ETH, Zurich: RiskLab; 1999.
Fraser AM, Swinney HL. Independent coordinates for strange attractors from mutualinformation. Phys Rev A 1986;33:1134–40.
Goncharova II, Zaveri HP, Duckrow RB, Novotny EJ, Spencer SS. Spatial distributionof intracranially recorded spikes in medial and lateral temporal epilepsies.Epilepsia 2009;50:2575–85.
Greicius MD, Supekar K, Menon V, Dougherty RF. Resting-state functionalconnectivity reflects structural connectivity in the default mode network.Cereb Cortex 2009;19:72–8.
He BJ, Snyder AZ, Zempel JM, Smyth MD, Raichle ME. Electrophysiological correlatesof the brain’s intrinsic large-scale functional architecture. Proc Natl Acad Sci U SA 2008;105:16039–44.
Huettel SA, McKeown MJ, Song AW, Hart S, Spencer DD, Allison T, et al. Linkinghemodynamic and electrophysiological measures of brain activity: evidencefrom functional MRI and intracranial field potentials. Cereb Cortex2004;14:165–73.
Jerbi K, Vidal JR, Ossandon T, Dalal SS, Jung J, Hoffmann D, et al. Exploring theelectrophysiological correlates of the default-mode network with intracerebralEEG. Front Sys Neurosci 2010;4:1–9.
Ko A, Darvas F, Poliakov A, Ojemann J, Sorensen L. Quasi-periodic fluctuations indefault mode network electrophysiology. J Neurosci 2011;31:11728–32.
Lacruz ME, García Seoane JJ, Valentin A, Selway R, Alarcón G. Frontal and temporalfunctional connections of the living human brain. Eur J Neurosci2007;26:1357–70.
Laufs H, Krakow K, Sterzer P, Eger E, Beyerle A, Salek-Haddadi A, et al.Electroencephalographic signatures of attentional and cognitive defaultmodes in spontaneous brain activity fluctuations at rest. Proc Natl Acad Sci US A 2003;100:11053–8.
Leopold DA, Murayama Y, Logothetis NK. Very slow activity fluctuations in monkeyvisual cortex: implications for functional brain imaging. Cereb Cortex2003;13:422–33.
Logothetis NK, Pauls J, Augath M, Trinath T, Oeltermann A. Neurophysiologicalinvestigation of the basis of the fMRI signal. Nature 2001;412:150–7.
Mantini D, Perrucci MG, Del Gratta C, Romani GL, Corbetta M. Electrophysiologicalsignatures of resting state networks in the human brain. Proc Natl Acad Sci U SA 2007;104:13170–5.
Nir Y, Mukamel R, Dinstein I, Privman E, Harel M, Fisch L, et al. Interhemisphericcorrelations of slow spontaneous neuronal fluctuations revealed in humansensory cortex. Nat Neurosci 2008;11:1100–8.
of relationship within a resting state network. Clin Neurophysiol (2013),
D. Duncan et al. / Clinical Neurophysiology xxx (2013) xxx–xxx 9
Olbrich S, Mulert C, Karch S, Trenner M, Leicht G, Pogarell O, et al. EEG-vigilance andBOLD effect during simultaneous EEG/fMRI measurement. Neuroimage2009;45:319–32.
Papademetris X, Jackowski AP, Schultz RT, Staib LH, Duncan JS. Integrated intensityand point-feature non-rigid registration. In: Haynor D, Hellier P, Barillot C,editors. Medical image computing and computer-assisted intervention. SaintMalo, France: Springer; 2004. p. 763–70.
Pincus SM. Approximate entropy as a measure of system complexity. PNAS1991;88:2297–301.
Pincus SM. Irregularity and asynchrony in biologic network signals. MethodEnzymol 2000;321:149–82.
Pincus SM, Singer BH. Randomness and degrees of irregularity. Proc Natl Acad Sci US A 1996;93:2083–8.
Raichle ME, MacLeod AM, Snyder AZ, Powers WJ, Gusnard DA, Shulman GL. Adefault mode of brain function. Proc Natl Acad Sci U S A 2001;98:676–82.
Please cite this article in press as: Duncan D et al. Intracranial EEG evaluationhttp://dx.doi.org/10.1016/j.clinph.2013.03.028
Razavi M, Eaton B, Paradiso S, Mina M, Hudetz AG, Bolinger L. Source of low-frequency fluctuations in functional MRI signal. J Magn Reson Imaging2008;27:891–7.
Scholvinck ML, Maier A, Ye FQ, Duyn JH, Leopold DA. Neural basis of global resting-state fMRI activity. Proc Natl Acad Sci U S A 2010;107:10238–43.
Skudlarski P, Jagannathan K, Calhoun VD, Hampson M, Skudlarska BA, Pearlson G.Measuring brain connectivity: diffusion tensor imaging validates resting statetemporal correlations. Neuroimage 2008;43:554–61.
Zaveri HP, Pincus SM, Goncharova II, Duckrow RB, Spencer DD, Spencer SS.Localization-related epilepsy exhibits significant connectivity away from theseizure-onset area. NeuroReport 2009;20:891–5.
Zaveri HP, Williams WJ, Sackellares JC, Beydoun A, Duckrow RB, Spencer SS.Measuring the coherence of intracranial electroencephalograms. ClinNeurophysiol 1999;110:1717–25.
of relationship within a resting state network. Clin Neurophysiol (2013),
Copyright © 2022 FDOKUMEN