Resting state eyes-closed cortical rhythms in patients with locked-in-syndrome: An eeg study
9
Resting state eyes-closed cortical rhythms in patients with locked-in-syndrome: An eeg study Claudio Babiloni a,b , Francesca Pistoia b,c, * , Marco Sarà b , Fabrizio Vecchio d , Paola Buffo e , Massimiliano Conson f , Paolo Onorati b,e , Giorgio Albertini g , Paolo Maria Rossini b,h a Department of Biomedical Sciences, University of Foggia, Italy b Department of Imaging, SAN RAFFAELE Cassino, Italy c Department of Internal Medicine and Public Health, University of L’Aquila, L’Aquila, Italy d A.Fa.R., Dip. Neurosci. Osp. FBF, Isola Tiberina, Rome, Italy e Department of Physiology and Pharmacology, Università Sapienza, Rome, Italy f Department of Psychology, Second University of Naples, Caserta, Italy g IRCCS San Raffaele Pisana, Rome, Italy h Clinical Neurology University ‘‘Campus Biomedico” Rome, Italy article info Article history: Accepted 27 April 2010 Available online 11 June 2010 Keywords: Locked-in syndrome (LIS) Resting state eyes-closed electroencephalography (EEG) Low-resolution brain electromagnetic source tomography (LORETA) Human cerebral cortex Motor imagery abstract Objective: Locked-in syndrome (LIS) is a state of complete paralysis, except for ocular movements, which results from ventral brainstem lesions. Patients typically are fully conscious. Here we tested the hypoth- esis that electroencephalographic (EEG) rhythms are abnormal in LIS patients, possibly due to an impaired neural synchronization between brainstem and cerebral cortex. Methods: Resting state eyes-closed EEG data were recorded in 13 LIS subjects and 15 cognitively normal control subjects. With reference to the individual alpha frequency (IAF), the bands of interest were delta (IAF-8 to IAF-6 Hz), theta (IAF-6 to IAF-4 Hz), alpha 1 (IAF-4 to IAF-2 Hz), alpha 2 (IAF-2 to IAF Hz), and alpha 3 (IAF to IAF + 2 Hz). Furthermore, beta 1 (13–20 Hz) and beta 2 (20–30 Hz) bands were also con- sidered. Cortical EEG sources were estimated by low-resolution electromagnetic tomography (LORETA). Results: The power of alpha 2 and alpha 3 sources in all regions was lower in patients with LIS compared to controls. The power of delta sources in central, parietal, occipital and temporal regions was higher in patients with LIS compared to controls. Conclusions: These results suggest that cortical sources of resting state eyes-closed alpha and delta rhythms are abnormal in LIS patients. Significance: LIS is accompanied by a functional impairment of cortical neuronal synchronization mech- anisms in the resting state condition. Ó 2010 International Federation of Clinical Neurophysiology. Published by Elsevier Ireland Ltd. All rights reserved. 1. Introduction Locked-in syndrome (LIS) denotes a dramatic condition of ex- treme disability characterized by a total immobility except for ver- tical eye movements and blinking. The syndrome can result from several pathologic conditions such as amyotrophic lateral sclerosis, Guillain–Barré syndrome and brainstem tumors or stroke. Most cases are the consequence of a vascular or post-traumatic insult to the ventral pons, resulting in a complete interruption of cortico- bulbar and pyramidal pathways. As a consequence of this interrup- tion, LIS patients show tetraplegia and the paralysis of all cranial motor functions except for vertical eye movements. Despite this severe motor impairment, consciousness is fully preserved as well as cognitive functions that seem to be impaired only in a few cases as a consequence of additional brain injuries (Reznick, 1983; Bauer et al., 1979; Schnakers et al., 2008). In this pathological framework, communications to LIS patients are typically based on a blinking code or brain computer interface that are controlled by eye move- ments or based on an on-line analysis of subjects’ intentional changes of brain electrical activity (Reznick, 1983; Bauer et al., 1979; Daly and Wolpaw, 2008). Because of the complex etiology, there are several varieties of LIS, including the classical, the incomplete, and the total forms. These forms differ for the degree of residual ability to communi- cate by means of preserved motor functions (Plum and Posner, 1980; Bauer et al., 1979). The classic or pure LIS is characterized 1388-2457/$36.00 Ó 2010 International Federation of Clinical Neurophysiology. Published by Elsevier Ireland Ltd. All rights reserved. doi:10.1016/j.clinph.2010.04.027 * Corresponding author. Address: Hospital San Raffaele Cassino, via Gaetano di Biasio 1, 03043 Cassino (FR), Italy. Tel.: +39 0776394880; fax: +39 0776394403. E-mail address: [email protected] (F. Pistoia). Clinical Neurophysiology 121 (2010) 1816–1824 Contents lists available at ScienceDirect Clinical Neurophysiology journal homepage: www.elsevier.com/locate/clinph
-
Upload
independent -
Category
Documents
-
view
0 -
download
0
Transcript of Resting state eyes-closed cortical rhythms in patients with locked-in-syndrome: An eeg study

Clinical Neurophysiology 121 (2010) 1816–1824
Contents lists available at ScienceDirect
Clinical Neurophysiology
journal homepage: www.elsevier .com/locate /c l inph
Resting state eyes-closed cortical rhythms in patients with locked-in-syndrome:An eeg study
Claudio Babiloni a,b, Francesca Pistoia b,c,*, Marco Sarà b, Fabrizio Vecchio d, Paola Buffo e,Massimiliano Conson f, Paolo Onorati b,e, Giorgio Albertini g, Paolo Maria Rossini b,h
a Department of Biomedical Sciences, University of Foggia, Italyb Department of Imaging, SAN RAFFAELE Cassino, Italyc Department of Internal Medicine and Public Health, University of L’Aquila, L’Aquila, Italyd A.Fa.R., Dip. Neurosci. Osp. FBF, Isola Tiberina, Rome, Italye Department of Physiology and Pharmacology, Università Sapienza, Rome, Italyf Department of Psychology, Second University of Naples, Caserta, Italyg IRCCS San Raffaele Pisana, Rome, Italyh Clinical Neurology University ‘‘Campus Biomedico” Rome, Italy
a r t i c l e i n f o
Article history:Accepted 27 April 2010Available online 11 June 2010
Keywords:Locked-in syndrome (LIS)Resting state eyes-closedelectroencephalography (EEG)Low-resolution brain electromagneticsource tomography (LORETA)Human cerebral cortexMotor imagery
1388-2457/$36.00 � 2010 International Federation odoi:10.1016/j.clinph.2010.04.027
* Corresponding author. Address: Hospital San RafBiasio 1, 03043 Cassino (FR), Italy. Tel.: +39 0776394
E-mail address: [email protected] (F.
a b s t r a c t
Objective: Locked-in syndrome (LIS) is a state of complete paralysis, except for ocular movements, whichresults from ventral brainstem lesions. Patients typically are fully conscious. Here we tested the hypoth-esis that electroencephalographic (EEG) rhythms are abnormal in LIS patients, possibly due to animpaired neural synchronization between brainstem and cerebral cortex.Methods: Resting state eyes-closed EEG data were recorded in 13 LIS subjects and 15 cognitively normalcontrol subjects. With reference to the individual alpha frequency (IAF), the bands of interest were delta(IAF-8 to IAF-6 Hz), theta (IAF-6 to IAF-4 Hz), alpha 1 (IAF-4 to IAF-2 Hz), alpha 2 (IAF-2 to IAF Hz), andalpha 3 (IAF to IAF + 2 Hz). Furthermore, beta 1 (13–20 Hz) and beta 2 (20–30 Hz) bands were also con-sidered. Cortical EEG sources were estimated by low-resolution electromagnetic tomography (LORETA).Results: The power of alpha 2 and alpha 3 sources in all regions was lower in patients with LIS comparedto controls. The power of delta sources in central, parietal, occipital and temporal regions was higher inpatients with LIS compared to controls.Conclusions: These results suggest that cortical sources of resting state eyes-closed alpha and deltarhythms are abnormal in LIS patients.Significance: LIS is accompanied by a functional impairment of cortical neuronal synchronization mech-anisms in the resting state condition.� 2010 International Federation of Clinical Neurophysiology. Published by Elsevier Ireland Ltd. All rights
reserved.
1. Introduction
Locked-in syndrome (LIS) denotes a dramatic condition of ex-treme disability characterized by a total immobility except for ver-tical eye movements and blinking. The syndrome can result fromseveral pathologic conditions such as amyotrophic lateral sclerosis,Guillain–Barré syndrome and brainstem tumors or stroke. Mostcases are the consequence of a vascular or post-traumatic insultto the ventral pons, resulting in a complete interruption of cortico-bulbar and pyramidal pathways. As a consequence of this interrup-tion, LIS patients show tetraplegia and the paralysis of all cranial
f Clinical Neurophysiology. Publish
faele Cassino, via Gaetano di880; fax: +39 0776394403.Pistoia).
motor functions except for vertical eye movements. Despite thissevere motor impairment, consciousness is fully preserved as wellas cognitive functions that seem to be impaired only in a few casesas a consequence of additional brain injuries (Reznick, 1983; Baueret al., 1979; Schnakers et al., 2008). In this pathological framework,communications to LIS patients are typically based on a blinkingcode or brain computer interface that are controlled by eye move-ments or based on an on-line analysis of subjects’ intentionalchanges of brain electrical activity (Reznick, 1983; Bauer et al.,1979; Daly and Wolpaw, 2008).
Because of the complex etiology, there are several varieties ofLIS, including the classical, the incomplete, and the total forms.These forms differ for the degree of residual ability to communi-cate by means of preserved motor functions (Plum and Posner,1980; Bauer et al., 1979). The classic or pure LIS is characterized
ed by Elsevier Ireland Ltd. All rights reserved.
C. Babiloni et al. / Clinical Neurophysiology 121 (2010) 1816–1824 1817
by the complete loss of any motor outputs with the exception ofvertical eye movements and blinking. The incomplete LIS form ischaracterized by the sparing of any voluntary motion rather thaneye movements. The total LIS form is characterized by the com-plete loss of any motor output (including eye movements), as aconsequence of coexisting diseases such as bilateral ptosis or opso-clonus myoclonus symptoms (Pistoia and Sarà, 2009). By defini-tion, these forms are characterized by a preserved consciousness,but only patients with the classic or the incomplete form are resid-ually able to interact with the environment, usually by means ofeye-coded communication strategies in response to closed ques-tions (yes/no).
The LIS symptoms can be transient or chronic (Hawkes, 1974;Karp and Hurtig, 1974; Rae-Grant et al., 1989), and the outcomeis controversial as well. In a review of 139 cases, it has been re-ported a mortality of 67% in the case of vascular patients and of41% in the case of nonvascular patients (Patterson and Grabois,1986). Other studies have indicated a better outcome (Baueret al., 1979; Rae-Grant et al., 1989; Patterson and Grabois, 1986;Yang et al., 1989).
The dramatic clinical picture of LIS has encouraged several stud-ies aimed at understanding the neurophysiological mechanisms atthe basis of LIS towards the development of neuromarkers for per-sonalized patients’ clinical care (Bassetti et al., 1994). Studies usingtranscranial magnetic stimulation of motor cortex have success-fully probed conduction velocity of descending tracts and fibers(Facco et al., 1989). Studies using evoked potentials have providedprocedures for the assessment of the integrity of ascendingsomatosensory and auditory systems, in order to probe theinvolvement of tegmental brainstem (Towle et al., 1989); specifi-cally, somatosensory evoked potentials showed normal findingsin some cases and unilateral or bilateral abnormalities in othercases (Gütling et al., 1997). Studies using endogenous event-re-lated potentials have provided procedures for the assessment ofcentral information processing and cognitive functions such asattention and expectancy (Ragazzoni et al., 2000; Kotchoubey,2005). Studies probing the reactivity of electroencephalographic(EEG) alpha rhythms (about 8–12 Hz) to eyes opening have showncontrasting results; namely, they reported an event-related powerreduction of the alpha rhythms in some LIS patients (Hawkes andBryan-Smyth, 1974; Bassetti et al., 1994; Yazawa et al., 2001) butnot in others (Jacome and Morilla-Pastor, 1990; Gütling et al.,1997). This variability of the neurophysiological findings hasimportant clinical implications, since a misinterpretation or over-interpretation of these data may suggest a diagnosis of vegetativestates and the abandonment of communication efforts towardsthese unfortunate individuals (Jacome and Morilla-Pastor, 1990).
To contribute for a complete neurophysiological assessment ofthe LIS patients, an evaluation of resting state eyes-closed corticalEEG rhythms seems to be promising. Indeed, this approach has beensuccessfully used to probe neurophysiology of attention andconsciousness in normal subjects and clinical neurophysiology inpatients with subjective memory complaints, mild cognitive impair-ment, and persistent vegetative state (Babiloni et al., 2007a,b,2008a,b, 2009a). This is not surprising since resting state eyes-closedEEG rhythms reflect the temporal synchronization of cortical pyra-midal neurons, as revealed by the summation of post-synapticpotentials at their apical dendrites (Kooi, 1978; Pfurtscheller andLopes da Silva, 1999). In this regard, it should be remarked that thesynchronization of these neurones depends not only on neural in-puts coming from cortical modules but also on inputs from thalamusand brainstem, especially from ascending neuromodulatory path-ways such as cholinergic, dopaminergic, and noradrenergic systems(Jerusalinsky et al., 1997; McCormick et al., 1991).
In stupor or coma patients suffering from brainstem impair-ment, slow cortical EEG rhythms spanning delta (about 1–4 Hz)
and theta (about 4–7 Hz) oscillations are increased in amplitude(Brenner, 2005). In persistent vegetative state subjects sufferingfrom brainstem lesion, resting state eyes-closed alpha rhythmsare reduced in amplitude (Babiloni et al., 2009a). In subjects withmild cognitive impairment, resting state eyes-closed delta rhythmsslightly increases in amplitude, while alpha rhythms decline inamplitude (Babiloni et al., 2008b). In these subjects, the amplitudereduction of the resting state alpha rhythms is related to theimpairment of the cholinergic tracts connecting basal forebrainto cerebral cortex (Babiloni et al., 2009b). In normal subjects, rest-ing state theta and alpha rhythms are affected by a cholinergicantagonist (i.e. scopolamine), which mimics the typical effects ofneurodegeneration on resting state cortical rhythms in elderly sub-jects (Osipova et al., 2003).
Patients with LIS suffer from major brainstem lesions. Interac-tions between different malfunctioning sub-cortical and corticalareas may lead to changes in resting state cortical EEG activity.To test this hypothesis, we compared the cortical sources of restingstate eyes-closed EEG rhythms in LIS and age-matched healthysubjects. According to the aforementioned evidence, we expectedthat at group level, there is an increase in cortical source amplitudeof delta/theta rhythms, whereas the opposite would be true for al-pha rhythms. These findings would represent a strong rationale toinvest resources for future systematic studies investigating in LISindividuals (i) the functional relationship between resting stateeyes-closed EEG rhythms and cognitive functions and (ii) the diag-nostic/prognostic value of these putative EEG markers, which canbe obtained by a cheap, easy, and popular procedure such as theEEG recording at resting state condition.
2. Materials and methods
2.1. Subjects
The present research was performed in 13 LIS subjects (7 males;mean age of 51 years ±4.1 standard error of mean, SEM), recruitedat Post-Coma Intensive and Rehabilitation Care Unit of San RaffaeleCassino Hospital. As a control group, 15 age-matched normal sub-jects (Normal; 8 males; mean age of 50.3 years ±1.6 SEM) were alsoenrolled.
The diagnosis of LIS was made through a rigorous neurologicalassessment based on the Bauer classification.
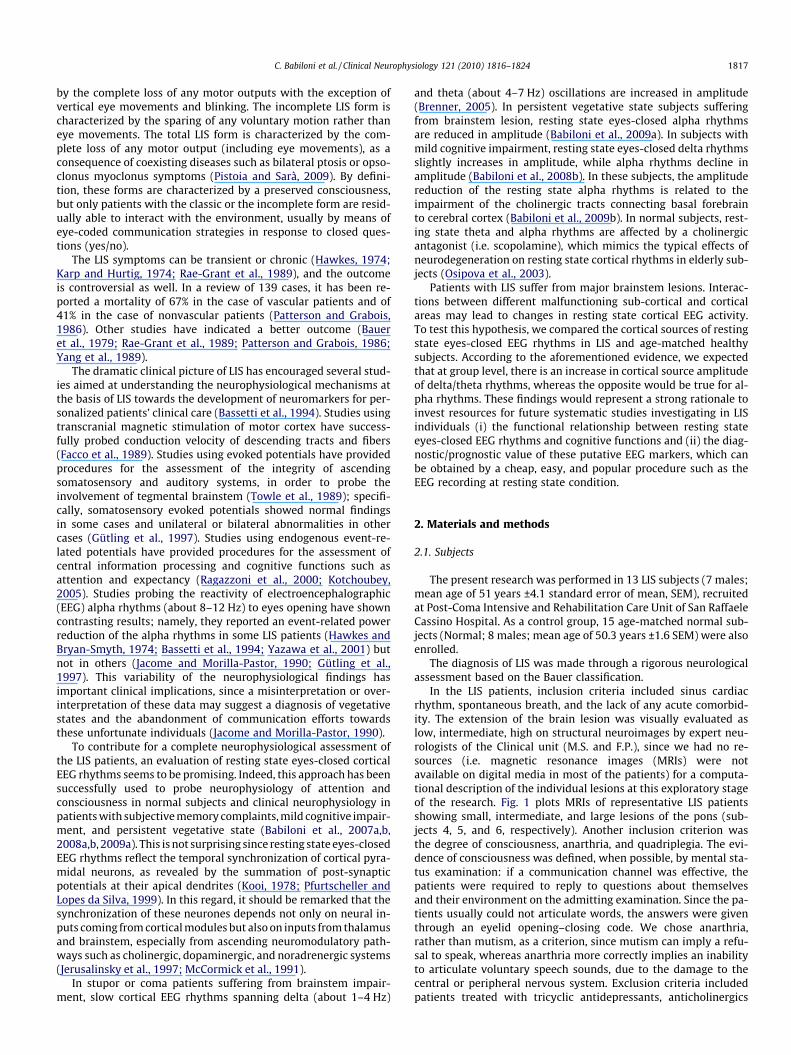
In the LIS patients, inclusion criteria included sinus cardiacrhythm, spontaneous breath, and the lack of any acute comorbid-ity. The extension of the brain lesion was visually evaluated aslow, intermediate, high on structural neuroimages by expert neu-rologists of the Clinical unit (M.S. and F.P.), since we had no re-sources (i.e. magnetic resonance images (MRIs) were notavailable on digital media in most of the patients) for a computa-tional description of the individual lesions at this exploratory stageof the research. Fig. 1 plots MRIs of representative LIS patientsshowing small, intermediate, and large lesions of the pons (sub-jects 4, 5, and 6, respectively). Another inclusion criterion wasthe degree of consciousness, anarthria, and quadriplegia. The evi-dence of consciousness was defined, when possible, by mental sta-tus examination: if a communication channel was effective, thepatients were required to reply to questions about themselvesand their environment on the admitting examination. Since the pa-tients usually could not articulate words, the answers were giventhrough an eyelid opening–closing code. We chose anarthria,rather than mutism, as a criterion, since mutism can imply a refu-sal to speak, whereas anarthria more correctly implies an inabilityto articulate voluntary speech sounds, due to the damage to thecentral or peripheral nervous system. Exclusion criteria includedpatients treated with tricyclic antidepressants, anticholinergics

Fig. 1. Magnetic resonance images (MRIs) of sagittal brain slices showing (a) small, (b) intermediate, and (c) extended pons lesions in representative LIS patients (4, 5, and 6respectively).
1818 C. Babiloni et al. / Clinical Neurophysiology 121 (2010) 1816–1824
agents, as well any drugs decreasing the arousal or responsivenesssuch as benzodiazepines, barbiturates, and neuroleptics. Therecruited patients showed no additional supratentorial lesion asrevealed by MRI. Whenever present, vascular risk factors had notbeen previously responsible for further ischemic lesions, silentcerebral infarctions or leukoaraiosis.
The LIS patients were admitted to our intensive rehabilitationunit over a 1-year period. Demographic characteristics, neurologicstatus (according to the Bauer classification), and medications arereported in Table 1. In all cases, the LIS resulted from a ventral pon-tine ischemic infarction due to basilar artery thrombosis, whichwas documented by magnetic resonance imaging showing the le-sion of interest in the absence of other neuroimaging abnormali-ties. After the stabilization of vital functions, patients weremoved to a conventional rehabilitation ward in the mentionedhospital.
The study was approved by the Local Institutional Ethics Com-mittee, and follows prescriptions of the Good Clinical Practice.We acquired informed and overt consent of the subjects’ legal rep-resentatives, in line with the Code of Ethics of the World MedicalAssociation (Declaration of Helsinki) and the standards establishedby the Author’s Institutional Review Board. The use of the data wasauthorized by means of an informed consent of the control subjects(Normal) and patients (LIS).
Table 1Basic demographic and clinical features of the locked-in-syndrome (LIS) patients. Abbrevi
Patient Gender Age(years)
Education(years)
From diagnosisto EEG recording(months)
Cause
1 F 32 8 15 Pontomesendue to basilthrombosis
2 M 32 13 23 Pontomesen3 M 59 8 3 Pontine infa
4 M 61 8 2 Bulbar infar
5 F 58 13 4 Pontine hem
6 M 56 13 2 Pontine infa
7 M 51 8 3 Pontine infa
8 F 26 13 10 Pontine infa9 F 76 13 20 Bulbar infar
10 F 56 5 2 Pontine infa
11 M 66 17 14 Pontomesen
12 F 36 8 5 Pontine infa13 M 48 13 20 Pontine infa
2.2. EEG recordings
EEG data were recorded (cephalic reference; 0.3–70 Hz band-pass) in subjects at wakening resting state (eyes-closed) from 19electrodes positioned according to the International 10–20 System(i.e. Fp1, Fp2, F7, F3, Fz, F4, F8, T3, C3, Cz, C4, T4, T5, P3, Pz, P4, T6,O1, O2). To monitor eye movements, electrooculogram (0.3–70 Hzbandpass) was also collected. All data were digitized in a continu-ous recording mode (5 min of EEG; 256 Hz sampling rate). All EEGrecordings were made in the late morning. The control subjectswere requested to be relaxed and not to be engaged in any specificmental activity during the EEG recording. In order to keep constantthe level of vigilance, an experimenter controlled on-line the sub-ject and the EEG traces to monitor signs of drowsiness and sleeponset. Specifically, he or she monitored eventual appearance of‘‘tonic” theta rhythms, K complexes, and sleep spindles (behaviorin the control subjects).
The recorded EEG data were analyzed and fragmented off-linein consecutive epochs of 2 s. The EEG epochs with ocular, muscular,and/or other types of artifact were preliminarily identified by acomputerized automatic procedure. The EEG epochs with sporadicblinking artifacts (less than 10% of the total) were corrected by anautoregressive method (Moretti et al., 2003). Two independentexperimenters blind to the diagnosis manually confirmed the
ations: M: male; F: female.
Bauer classification Medications
cephalic infarctionar post-traumatic
Total Low weight molecular heparin
cephalic infarction Total Antiaggregant treatmentrction Classic Antiaggregant treatment,
antihypertensive agentsction Classic Antiaggregant treatment,
antihypertensive agentsorrhage Classic Low weight molecular heparin,
antihypertensive agentsrction Classic Antiaggregant treatment,
oral antidiabetic drugsrction Classic Antiaggregant treatment,
antihypertensive agentsrction Classic Antiaggregant treatmentction Classic Antiaggregant treatment,
antihypertensive agentsrction Classic Antiaggregant treatment,
antihypertensive agentscephalic infarction Classic Antiaggregant treatment,
antihypertensive agents, insulinrction Classic Antiaggregant treatmentrction Classic Antiaggregant treatment,
antihypertensive agents

Table 2Brodmann areas included in the cortical regions of interest (ROIs) of the presentstudy. LORETA solutions were collapsed within frontal, central, parietal, occipital,temporal and limbic regions of interest (ROIs).
LORETA Brodmann areas within the regions of interest (ROIs)
Frontal 8, 9, 10, 11, 44, 45, 46, 47Central 1, 2, 3, 4, 6Parietal 5, 7, 30, 39, 40, 43Temporal 20, 21, 22, 37, 38, 41, 42Occipital 17, 18, 19Limbic 31, 32, 33, 34, 35, 36
C. Babiloni et al. / Clinical Neurophysiology 121 (2010) 1816–1824 1819
EEG segments accepted for further analysis. On average, we ob-tained 100 (±15.80 SEM) EEG segments for the Normal subjectsand 142 EEG segments (±12.13 SEM) for the LIS patients. Each sub-ject was associated to more than 30 EEG segments.
2.3. Spectral analysis of the EEG data
The digital FFT-based power spectrum analysis (Welch tech-nique, Hanning windowing function, no phase shift) was evaluatedin order to calculate the individual alpha frequency (IAF) peak,which was defined as the frequency associated to the strongestEEG power at the extended alpha range (Klimesch, 1999). With ref-erence to the IAF, the bands of interest were delta (IAF-8 to IAF-6 Hz), theta (IAF-6 to IAF-4 Hz), alpha 1 (IAF-4 to IAF-2 Hz), alpha2 (IAF-2 to IAF Hz), and alpha 3 (IAF to IAF + 2 Hz). For example,if power peak in the 5–15 Hz range was observed at 10 Hz (IAF),the frequency bands of interest were as follows: 2–4 Hz (delta),4–6 Hz (theta), 6–8 Hz (alpha 1), 8–10 Hz (alpha 2), 10–12 Hz (al-pha 3). Furthermore, we selected two fixed bands for the higherfrequencies such as beta 1 (13–20 Hz) and beta 2 (20–30 Hz). Note-worthy, the mean IAF peak was actually 9.8 Hz (±0.3 standard errorof mean, SEM) in the Normal subjects and 9.4 Hz (±0.4 SEM) in theLIS patients.
For a control analysis on the scalp, the EEG spectral power den-sity at each electrode was normalized to the EEG spectral powerdensity averaged across all frequencies (0.5–45 Hz) and the elec-trodes, which were representative of the following scalp zones:(i) F3, Fz and F4 electrodes for the frontal zone; (ii) C3, Cz and C4electrodes for the central zone; (iii) P3, Pz and P4 electrodes forthe parietal zone; and (iv) O1 and O2 electrodes for the occipitalzone.
2.4. Cortical sources of resting state EEG rhythms as computed byLORETA
Low-resolution electromagnetic source tomography (LORETA-KEY full software package version 2003, http://www.unizh.ch/keyinst/NewLORETA/LORETA01.htm) was used for the estimationof cortical sources of EEG rhythms (Pascual-Marqui and Michel,1994; Pascual-Marqui et al., 1999, 2002), in order to follow thesame procedures of previous EEG studies of our work group inAlzheimer’s disease and PVS patients (see for example, Babiloniet al., 2006a,b,c, 2007a,b, 2009a,b. LORETA is a functional imagingtechnique belonging to a family of linear inverse solution proce-dures (Valdès et al., 1998) modeling 3-D distributions of EEGsources (Pascual-Marqui et al., 2002). With respect to the dipolemodeling of cortical sources, no a priori decision of the dipole po-sition is required by LORETA procedure. LORETA belongs to thefamily of linear inverse algorithms like minimum norm solution,weighted minimum norm solution or weighted resolution optimi-zation (Pascual-Marqui et al., 1999; Phillips et al., 2002; Yao andHe, 2001), and has been successfully used in recent EEG studieson pathological brain aging using the same experimental set up(electrode montage, sample frequency, etc.) of the present study(Dierks et al., 2000; Babiloni et al., 2006a,b).
LORETA computes 3-D linear solutions (LORETA solutions) forthe EEG inverse problem within a 3-shell spherical head modelincluding scalp, skull, and brain compartments. The brain compart-ment is restricted to the cortical gray matter/hippocampus of ahead model co-registered to the Talairach probability brain atlasand digitized at the Brain Imaging Center of the Montreal Neuro-logical Institute (Talairach and Tournoux, 1988). This compartmentincludes 2394 voxels (7 mm resolution), each voxel containing anequivalent current dipole. Of note, EEG electrode positions werenot co-registered to individual brain source models; unlikely, theofficial LORETA package did not include software to do so and we
could not obtain the digitalization of the electrode position fromour clinical units.
LORETA solutions consisted of voxel current density values ableto predict EEG spectral power density at scalp electrodes, being areference-free method of EEG analysis, in that one obtains thesame LORETA source distribution for EEG data referenced to anyreference electrode including common average. A normalizationof the data was obtained by normalizing the LORETA current den-sity at each voxel with the power density averaged across all fre-quencies (0.5–45 Hz) and across all 2394 voxels of the brainvolume. After the normalization, the solutions lost the originalphysical dimension and were represented by an arbitrary unitscale. This procedure reduced inter-subjects variability and wassuccessfully used in previous EEG studies (Babiloni et al.,2006b,c). The general procedure fitted the LORETA solutions in aGaussian distribution and reduced inter-subject variability (Leuch-ter et al., 1993 and Nuwer, 1988). Other methods of normalizationusing the principal component analysis are effective for estimatingthe subjective global factor scale of the EEG data (Hernández et al.,1994). However, these methods are not available in the LORETApackage.
Solutions of the EEG inverse problem are under-determinedand ill conditioned when the number of spatial samples (elec-trodes) is lower than that of the unknown samples (current den-sity at each voxel). In order to properly take into account thisproblem, the cortical LORETA solutions predicting scalp EEG spec-tral power density were regularized for the estimation of distrib-uted rather than punctual EEG source patterns (Pascual-Marquiand Michel, 1994; Pascual-Marqui et al., 1999, 2002). In line withthe low spatial resolution of the adopted technique, we used ourMATLAB software to collapse the voxels of LORETA solutions atfrontal, central, parietal, occipital, temporal and limbic regionsof the brain model coded into Talairach space. The Brodmannareas listed in Table 2 formed each of these regions of interest(ROIs).
Of note, the main advantage of the regional analysis of LORETAsolutions using an explicit source model co-registered into Talai-rach space was that we could disentangle rhythms of contiguouscortical areas (namely those from the occipital source were disen-tangled with respect to those of the contiguous parietal and tem-poral sources, etc.).
2.5. Statistical analysis of the LORETA solutions
Statistical analysis was performed by ANOVA. Mauchley’s testevaluated the sphericity assumption. Correction of the degrees offreedom was made with the Greenhouse–Geisser procedure. TheANOVA of the LORETA solutions used the factors Group (Normal,LIS; independent variable), Band (delta, theta, alpha 1, alpha 2, al-pha 3, beta 1, beta 2), and ROI (frontal, central, parietal, occipital,temporal, limbic). Age, gender, medications and diagnosis servedas covariates (p < 0.05). Duncan test was used for the post hoc test-ing (p < 0.05).

Fig. 2. Grand average of low-resolution brain electromagnetic tomography (LORETA) solutions (i.e. normalized relative current density at the cortical voxels) modeling thedistributed electroencephalographic (EEG) cortical sources for delta, theta, alpha 1, alpha 2, alpha 3, beta 1, beta 2 bands in Normal subjects (Normal) and in LIS patients. Theleft side of the maps (top view) corresponds to the left hemisphere. Color scale: all power density estimates were scaled based on the averaged maximum value (i.e. alpha 3power value of occipital region in Normal subjects).
1820 C. Babiloni et al. / Clinical Neurophysiology 121 (2010) 1816–1824
3. Results
3.1. Topography of the EEG cortical sources as estimated by LORETA
Fig. 2 plots the grand average of the LORETA solutions (i.e. nor-malized relative current density at the cortical voxels) modelingthe distributed EEG cortical sources for delta, theta, alpha 1, alpha2, alpha 3, beta 1, and beta 2 bands in the Normal and LIS subjects.The Normal subjects showed alpha 2 and alpha 3 sources with themaximal values of amplitude distributed in parieto-occipital re-gions. Delta, theta, and alpha 1 sources had moderate amplitudevalues when compared to those of alpha 2 and alpha 3 sources. Fi-nally, beta 1 and beta 2 sources were characterized by the lowestamplitude values. Compared with the Normal subjects, the LIS pa-tients pointed to a decrease in amplitude of alpha 2 and alpha 3sources, and a general increase of the amplitude of delta sources.
Fig. 3. Regional normalized LORETA solutions (mean across subjects ± standard error of mamong the factors Group (Normal, LIS), Band (delta, theta, alpha 1, alpha 2, alpha 3, beta 1design used the regional normalized LORETA solutions as a dependent variable. Subjectvalues at p < 0.05, while two asterisks indicate statistical values at p < 0.0001.
3.2. Statistical comparisons of LORETA EEG sources
Fig. 3 shows mean regional normalized LORETA solutions (i.e.normalized relative current density averaged across the voxels ofa given ROI ± SEM) relative to a statistical ANOVA interaction(F(30, 780) = 3.56; p < 0.00001) among the factors Group (Normal,LIS), Band (delta, theta, alpha 1, alpha 2, alpha 3, beta 1, beta 2),and ROI (frontal, central, parietal, occipital, temporal, limbic). Inthe figure, the LORETA solutions had the shape of EEG relativepower spectra. Notably, the profile and magnitude of these spectrain the Normal subjects and in the LIS patients differed across var-ious cortical macro-regions, thus supporting the idea that scalpEEG rhythms are generated by a distributed pattern of corticalsources. When compared to the Normal subjects, LIS patients pre-sented lower LORETA solutions at alpha 2 and alpha 3 bands in allregions of interest (namely, frontal, central, parietal, occipital,
ean, SEM) relative to a statistical ANOVA interaction (F(30, 780) = 3.56; p < 0.00001), beta 2), and ROI (frontal, central, parietal, occipital, temporal, limbic). This ANOVA
s’ age and gender were used as covariates. Legend: one asterisk indicates statistical
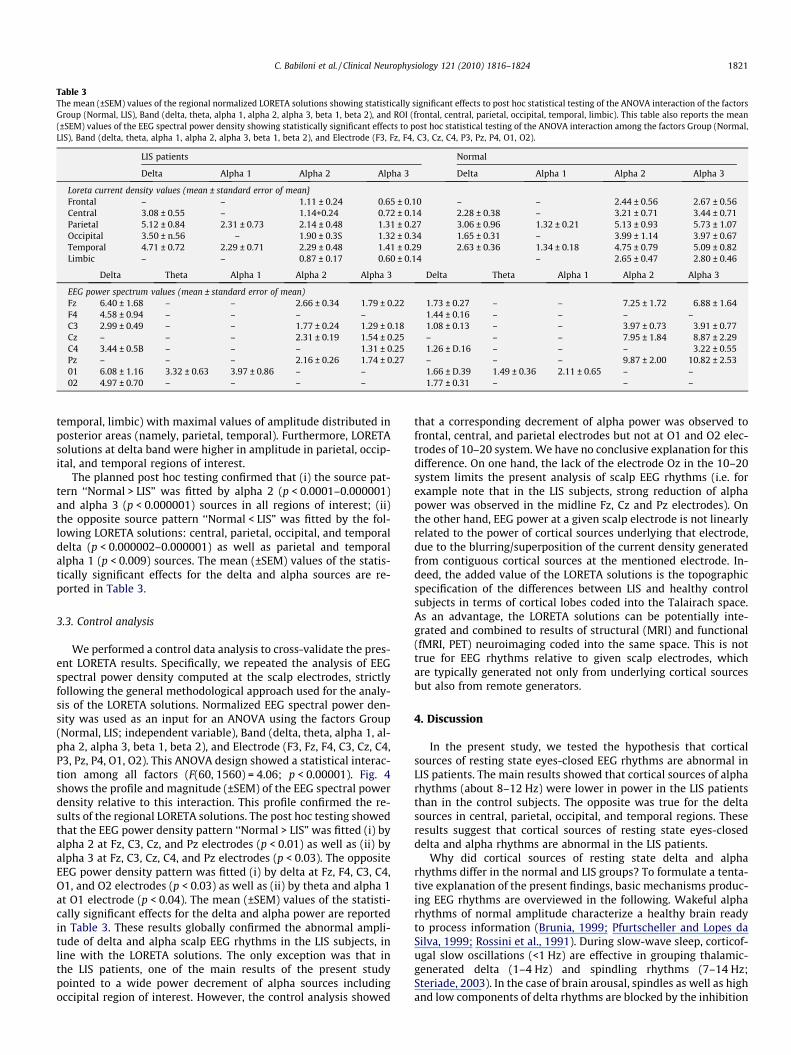
Table 3The mean (±SEM) values of the regional normalized LORETA solutions showing statistically significant effects to post hoc statistical testing of the ANOVA interaction of the factorsGroup (Normal, LIS), Band (delta, theta, alpha 1, alpha 2, alpha 3, beta 1, beta 2), and ROI (frontal, central, parietal, occipital, temporal, limbic). This table also reports the mean(±SEM) values of the EEG spectral power density showing statistically significant effects to post hoc statistical testing of the ANOVA interaction among the factors Group (Normal,LIS), Band (delta, theta, alpha 1, alpha 2, alpha 3, beta 1, beta 2), and Electrode (F3, Fz, F4, C3, Cz, C4, P3, Pz, P4, O1, O2).
LIS patients Normal
Delta Alpha 1 Alpha 2 Alpha 3 Delta Alpha 1 Alpha 2 Alpha 3
Loreta current density values (mean ± standard error of mean}Frontal – – 1.11 ± 0.24 0.65 ± 0.10 – – 2.44 ± 0.56 2.67 ± 0.56Central 3.08 ± 0.55 – 1.14+0.24 0.72 ± 0.14 2.28 ± 0.38 – 3.21 ± 0.71 3.44 ± 0.71Parietal 5.12 ± 0.84 2.31 ± 0.73 2.14 ± 0.48 1.31 ± 0.27 3.06 ± 0.96 1.32 ± 0.21 5.13 ± 0.93 5.73 ± 1.07Occipital 3.50 ± n.56 – 1.90 ± 0.3S 1.32 ± 0.34 1.65 ± 0.31 – 3.99 ± 1.14 3.97 ± 0.67Temporal 4.71 ± 0.72 2.29 ± 0.71 2.29 ± 0.48 1.41 ± 0.29 2.63 ± 0.36 1.34 ± 0.18 4.75 ± 0.79 5.09 ± 0.82Limbic – – 0.87 ± 0.17 0.60 ± 0.14 – 2.65 ± 0.47 2.80 ± 0.46
Delta Theta Alpha 1 Alpha 2 Alpha 3 Delta Theta Alpha 1 Alpha 2 Alpha 3
EEG power spectrum values (mean ± standard error of mean)Fz 6.40 ± 1.68 – – 2.66 ± 0.34 1.79 ± 0.22 1.73 ± 0.27 – – 7.25 ± 1.72 6.88 ± 1.64F4 4.58 ± 0.94 – – – – 1.44 ± 0.16 – – – –C3 2.99 ± 0.49 – – 1.77 ± 0.24 1.29 ± 0.18 1.08 ± 0.13 – – 3.97 ± 0.73 3.91 ± 0.77Cz – – – 2.31 ± 0.19 1.54 ± 0.25 – – – 7.95 ± 1.84 8.87 ± 2.29C4 3.44 ± 0.5B – – – 1.31 ± 0.25 1.26 ± D.16 – – – 3.22 ± 0.55Pz – – – 2.16 ± 0.26 1.74 ± 0.27 – – – 9.87 ± 2.00 10.82 ± 2.5301 6.08 ± 1.16 3.32 ± 0.63 3.97 ± 0.86 – – 1.66 ± D.39 1.49 ± 0.36 2.11 ± 0.65 – –02 4.97 ± 0.70 – – – – 1.77 ± 0.31 – – –
C. Babiloni et al. / Clinical Neurophysiology 121 (2010) 1816–1824 1821
temporal, limbic) with maximal values of amplitude distributed inposterior areas (namely, parietal, temporal). Furthermore, LORETAsolutions at delta band were higher in amplitude in parietal, occip-ital, and temporal regions of interest.
The planned post hoc testing confirmed that (i) the source pat-tern ‘‘Normal > LIS” was fitted by alpha 2 (p < 0.0001–0.000001)and alpha 3 (p < 0.000001) sources in all regions of interest; (ii)the opposite source pattern ‘‘Normal < LIS” was fitted by the fol-lowing LORETA solutions: central, parietal, occipital, and temporaldelta (p < 0.000002–0.000001) as well as parietal and temporalalpha 1 (p < 0.009) sources. The mean (±SEM) values of the statis-tically significant effects for the delta and alpha sources are re-ported in Table 3.
3.3. Control analysis
We performed a control data analysis to cross-validate the pres-ent LORETA results. Specifically, we repeated the analysis of EEGspectral power density computed at the scalp electrodes, strictlyfollowing the general methodological approach used for the analy-sis of the LORETA solutions. Normalized EEG spectral power den-sity was used as an input for an ANOVA using the factors Group(Normal, LIS; independent variable), Band (delta, theta, alpha 1, al-pha 2, alpha 3, beta 1, beta 2), and Electrode (F3, Fz, F4, C3, Cz, C4,P3, Pz, P4, O1, O2). This ANOVA design showed a statistical interac-tion among all factors (F(60, 1560) = 4.06; p < 0.00001). Fig. 4shows the profile and magnitude (±SEM) of the EEG spectral powerdensity relative to this interaction. This profile confirmed the re-sults of the regional LORETA solutions. The post hoc testing showedthat the EEG power density pattern ‘‘Normal > LIS” was fitted (i) byalpha 2 at Fz, C3, Cz, and Pz electrodes (p < 0.01) as well as (ii) byalpha 3 at Fz, C3, Cz, C4, and Pz electrodes (p < 0.03). The oppositeEEG power density pattern was fitted (i) by delta at Fz, F4, C3, C4,O1, and O2 electrodes (p < 0.03) as well as (ii) by theta and alpha 1at O1 electrode (p < 0.04). The mean (±SEM) values of the statisti-cally significant effects for the delta and alpha power are reportedin Table 3. These results globally confirmed the abnormal ampli-tude of delta and alpha scalp EEG rhythms in the LIS subjects, inline with the LORETA solutions. The only exception was that inthe LIS patients, one of the main results of the present studypointed to a wide power decrement of alpha sources includingoccipital region of interest. However, the control analysis showed
that a corresponding decrement of alpha power was observed tofrontal, central, and parietal electrodes but not at O1 and O2 elec-trodes of 10–20 system. We have no conclusive explanation for thisdifference. On one hand, the lack of the electrode Oz in the 10–20system limits the present analysis of scalp EEG rhythms (i.e. forexample note that in the LIS subjects, strong reduction of alphapower was observed in the midline Fz, Cz and Pz electrodes). Onthe other hand, EEG power at a given scalp electrode is not linearlyrelated to the power of cortical sources underlying that electrode,due to the blurring/superposition of the current density generatedfrom contiguous cortical sources at the mentioned electrode. In-deed, the added value of the LORETA solutions is the topographicspecification of the differences between LIS and healthy controlsubjects in terms of cortical lobes coded into the Talairach space.As an advantage, the LORETA solutions can be potentially inte-grated and combined to results of structural (MRI) and functional(fMRI, PET) neuroimaging coded into the same space. This is nottrue for EEG rhythms relative to given scalp electrodes, whichare typically generated not only from underlying cortical sourcesbut also from remote generators.
4. Discussion
In the present study, we tested the hypothesis that corticalsources of resting state eyes-closed EEG rhythms are abnormal inLIS patients. The main results showed that cortical sources of alpharhythms (about 8–12 Hz) were lower in power in the LIS patientsthan in the control subjects. The opposite was true for the deltasources in central, parietal, occipital, and temporal regions. Theseresults suggest that cortical sources of resting state eyes-closeddelta and alpha rhythms are abnormal in the LIS patients.
Why did cortical sources of resting state delta and alpharhythms differ in the normal and LIS groups? To formulate a tenta-tive explanation of the present findings, basic mechanisms produc-ing EEG rhythms are overviewed in the following. Wakeful alpharhythms of normal amplitude characterize a healthy brain readyto process information (Brunia, 1999; Pfurtscheller and Lopes daSilva, 1999; Rossini et al., 1991). During slow-wave sleep, corticof-ugal slow oscillations (<1 Hz) are effective in grouping thalamic-generated delta (1–4 Hz) and spindling rhythms (7–14 Hz;Steriade, 2003). In the case of brain arousal, spindles as well as highand low components of delta rhythms are blocked by the inhibition

Fig. 4. The profile and magnitude (±SEM) of normalized electroencephalographic (EEG) spectral power density in the Normal and LIS subjects. The values refer to allfrequency bands (delta, theta, alpha 1, alpha 2, alpha 3, beta 1, beta 2) and electrodes (F3, Fz, F4, C3, Cz, C4, P3, Pz, P4, O1, O2) of interest. Legend: one asterisk indicatesstatistical values at p < 0.05, while two asterisks indicate statistical values at p < 0.001.
1822 C. Babiloni et al. / Clinical Neurophysiology 121 (2010) 1816–1824
of oscillating neural circuits within reticulo-thalamic (7–14 Hz),thalamo-cortical (1–4 Hz), and intracortical (<1 Hz) networks.These rhythms are replaced by fast oscillations (beta and gammabands), which are mainly induced by forebrain (nucleus basalis)cholinergic inputs to hippocampus and cortex as well as by thal-amo-cortical projections (Steriade, 2003). In the awake restingstate, alpha rhythms would dominate and delta rhythms wouldbe low in amplitude, thus reminding a condition of ‘‘reciprocalinhibition” (Rossini et al., 2006). Based on this theoretical frame-work, it can be speculated that in the LIS patients, lesions of ventralpons and surrounding brainstem regions did not disrupted theputative mechanism of ‘‘reciprocal inhibition” of delta and alpharhythms in awakening eyes-closed condition. Rather, LIS pathologyaffected this mechanism enhancing delta rhythms and suppressingalpha rhythms. Future investigation should clarify if this is due tothe lack of descending motor and vegetative neural inputs or alsoto abnormal re-entrant brainstem–cortical circuits involving cere-bellum and thalamus (Conson et al., 2008).
Keeping in mind the above data, we posit that the combinationof resting state eyes-closed delta and alpha EEG rhythms is a prom-
ising approach for clinical application to differential diagnosis be-tween LIS and persistent vegetative state (PVS) in subjects withsevere difficulties in the communication. With respect to Normalsubjects, the present LIS patients showed a reduction of alphasource power but not a dramatic disruption of the shape of EEGsource spectra. In these spectra, alpha peak was clearly detectable.In contrast, alpha peak has been found practically absent in EEGsource spectra of PVS patients of a recent study (Babiloni et al.,2009a), in line with the idea that resting state alpha rhythms areone of the mechanisms at the basis of global vigilance and aware-ness (Babiloni et al., 2006d; Klimesch, 1999).
However, it should be remarked that the present results justrepresent the basis for future confirmatory studies. Indeed, neuro-physiological mechanisms underlying LIS may be quite heteroge-neous, and the relationship between brainstem dys-functioningand the clinical picture cannot be definitively explored on the basisof the present study. The analysis of resting state EEG rhythms isnot able to precise what is the respective weight of the lesions atdifferent cortical and sub-cortical structures in the determinationof the abnormality of brain oscillatory activity and of clinical

C. Babiloni et al. / Clinical Neurophysiology 121 (2010) 1816–1824 1823
picture. The main merit of the present study was to describe for thefirst time abnormal cortical sources of delta and alpha rhythms inLIS patients during a resting state eyes-closed condition, namely acheap and easy routine procedure requiring no behavioral feed-back from LIS patients. The present results suggest that thesesources represent an interesting piece of the neurophysiologicalpuzzle of LIS. However, they are not conclusive about a clinical va-lue of EEG rhythms for the assessment of LIS patients. Rather, thepresent results motivate future EEG investigations aimed at evalu-ating the diagnostic/prognostic value of EEG markers by the collec-tion and analysis of follow up data and by the comparison ofputative EEG markers between LIS with impaired eyes movementsand other pathologies (i.e. PVS patients).
Why were alpha rhythms in LIS subjects abnormal at highfrequencies? Again, we have just preliminary explanations. Severelesions in ventral pons of the LIS subjects might interfere with spe-cific sub-cortical and cortical pathways involved in the transmis-sion and retrieval of sensorimotor information as well as in thegeneral arousal of the cerebral cortex (Brunia, 1999; Pfurtschellerand Lopes da Silva, 1999 and Steriade and Llinas, 1988).
As a final methodological remark, it should be taken into ac-count that official LORETA package includes a brain source model-ing cortical gray matter in normal subjects but not brainstem.However, it is unlikely that this affects the present results, sincethe scalp resting state EEG rhythms are mainly generated at corti-cal gray matter and the present LIS patients did not show any le-sion at that anatomical level. Furthermore, we performed acontrol statistical analysis directly on scalp EEG rhythms (i.e. notimplying the use of any brain source modeling). The results con-firmed the abnormalities of resting state delta and alpha rhythmsin the present LIS subjects.
5. Conclusions
Cortical sources of alpha rhythms (about 8–12 Hz) were lower inpower in the LIS patients than in the control subjects. The oppositewas true for the delta sources in central, parietal, occipital, and tem-poral regions. The main results of this study suggest that corticalsources of resting state delta and alpha rhythms are abnormal inLIS patients. Future studies should test the hypothesis that the useof the present EEG approach contributes to clinical assessment andprognosis of LIS patients, especially those showing an impairmentof eyes movements making it problematic the communications(see ‘‘mesencephalic” locked-in syndrome; Maurri et al.,1989).
Acknowledgments
The research was granted by Tosinvest Sanità and AssociationFatebenefratelli for Research (AFaR). We thank Prof. Fabrizio Eus-ebi for his continuous support. Dr. Paola Buffo participated to thisstudy in the framework of her Ph.D. program at the Doctoral Schoolin Neurophysiology, University of Rome ‘‘Sapienza”.
References
Babiloni C, Binetti G, Cassarino A, Dal Forno G, Del Percio C, Ferreri F, et al. Sources ofcortical rhythms in adults during physiological aging: a multi-centric EEGstudy. Hum Brain Mapp 2006a;27(2):162–72.
Babiloni C, Benussi L, Binetti G, Cassetta E, Dal Forno G, Del Percio C, et al.Apolipoprotein E and alpha brain rhythms in mild cognitive impairment: amulticentric EEG study. Ann Neurol 2006b;59(2):323–34.
Babiloni C, Frisoni G, Steriade M, Bresciani L, Binetti G, Del Percio C, et al. Frontalwhite matter volume and delta EEG sources negatively correlate in awakesubjects with mild cognitive impairment and Alzheimer’s disease. ClinNeurophysiol 2006c;117(5):1113–29.
Babiloni C, Vecchio F, Bultrini A, Luca Romani G, Rossini PM. Pre- and poststimulusalpha rhythms are related to conscious visual perception: a high-resolution EEGstudy. Cereb Cortex 2006d;16(12):1690–700 [Epub 2005 Dec 28].
Babiloni C, Squitti R, Del Percio C, Cassetta E, Ventriglia MC, Ferreri F, et al. Freecopper and resting temporal EEG rhythms correlate across healthy, mildcognitive impairment, and Alzheimer’s disease subjects. Clin Neurophysiol2007a;118(6):1244–60 [Epub 2007 Apr 25].
Babiloni C, Cassetta E, Binetti G, Tombini M, Del Percio C, Ferreri F, et al. Resting EEGsources correlate with attentional span in mild cognitive impairment andAlzheimer’s disease. Eur J Neurosci 2007b;25(12):3742–57.
Babiloni C, Frisoni GB, Pievani M, Vecchio F, Infarinato F, Geroldi C, et al. White mattervascular lesions are related to parietal-to-frontal coupling of EEG rhythms inmild cognitive impairment. Hum Brain Mapp 2008a;29(12):1355–67.
Babiloni C, Visser PJ, Frisoni G, De Deyn PP, Bresciani L, Jelic V, et al. Cortical sourcesof resting EEG rhythms in mild cognitive impairment and subjective memorycomplaint. Neurobiol Aging 2008:20 [Epub ahead of print].
Babiloni C, Sarà M, Vecchio F, Pistoia F, Sebastiano F, Onorati P, et al. Cortical sourcesof resting state alpha rhythms are abnormal in persistent vegetative statepatients. Clin Neurophysiol 2009a.
Babiloni C, Pievani M, Vecchio F, Geroldi C, Eusebi F, Fracassi C, et al. White-matterlesions along the cholinergic tracts are related to cortical sources of EEGrhythms in amnesic mild cognitive impairment. Hum Brain Mapp 2009b;30(5):1431–43.
Bassetti C, Mathis J, Hess CW. Multimodal electrophysiological studies includingmotor evoked potentials in patients with locked-in syndrome: report of sixpatients. J Neurol Neurosurg Psychiatry 1994;57(11):1403.
Bauer G, Gerstenbrand F, Rumpl E. Varieties of the locked-in syndrome. J Neurol1979;221:77–9.
Brenner RP. The interpretation of the EEG in stupor and coma. Neurologist2005;11(5):271–84.
Brunia CH. Neural aspects of anticipatory behavior. Acta Psychol (Amst)1999;101(2–3):213–42 [Review].
Conson M, Sacco S, Sarà M, Pistoia F, Grossi D, Trojano L. Selective motor imagerydefect in patients with locked-in syndrome. Neuropsychologia2008;46(11):2622–8 [Epub 2008 Apr 30].
Daly JJ, Wolpaw JR. Brain–computer interfaces in neurological rehabilitation. LancetNeurol 2008;7:1032–43.
Dierks T, Jelic V, Pascual-Marqui RD, Wahlund LO, Julin P, Linden DEJ, et al. Spatialpattern of cerebral glucose metabolism (PET) correlates with localization ofintracerebral EEG-generators in Alzheimer’s disease. Clin Neurophysiol2000;111:1817–24.
Facco E, Caputo P, Fiore D, Giron GP. Sensorimotor and auditory central conductiontime in locked-in syndrome. Electroencephalogr Clin Neurophysiol 1989;73:552–6.
Gütling E, Isenmann S, Wichmann W. Electrophysiology in the locked-in-syndrome.Neurology 1997;49(1):309.
Hawkes CH. Locked-in syndrome. Report of seven cases. BMJ 1974;4:379–82.Hawkes CH, Bryan-Smyth L. The electroencephalogram in the ‘‘locked-in”
syndrome. Neurology 1974;24:1015–8.Hernández JL, Valdés P, Biscay R, Virués T, Szava S, Bosch J, et al. A global scale factor
in brain topography. Int J Neurosci 1994;76:267–78.Jacome DE, Morilla-Pastor D. Unreactive EEG: pattern in locked-in syndrome. Clin
Electroencephalogr 1990;21(1):31–6.Jerusalinsky D, Kornisiuk E, Izquierdo I. Cholinergic neurotransmission and synaptic
plasticity concerning memory processing. Neurochem Res 1997;22(4):507–15[Review].
Karp JS, Hurtig HI. ‘‘Locked-in” state with bilateral midbrain infarcts. Arch Neurol1974;30:176–8.
Klimesch W. EEG alpha and theta oscillations reflect cognitive and memoryperformance. a review and analysis. Brain Res Rev 1999;29:169–95.
Kooi KA. Significance of small sharp spike waves in EEGs. Neurology 1978;28(6):620–1.
Kotchoubey B. Event-related potential measures of consciousness: two equationswith three unknowns. Prog Brain Res 2005;150:427–44.
Leuchter AF, Cook IA, Newton TF, Dunkin J, Walter DO, Rosenberg Tompson S, et al.Regional differences in brain electrical activity in dementia: use of spectralpower and spectral ratio measures. Electroenceph Clin Neurophysiol 1993;87:385–93.
Maurri S, Lambruschini I, Barontini F. Total mesencephalic ‘‘locked-in” syndrome. Acase report and review of the literature. Rev Neurol 1989;59:211–6.
McCormick DA, Pape HC, Williamson A. Actions of norepinephrine in the cerebralcortex and thalamus: implications for function of the central noradrenergicsystem. Prog Brain Res 1991;88:293–305 [Review].
Moretti DV, Babiloni F, Carducci F, Cincotti F, Remondini E, Rossini PM, et al.Computerized processing of EEG-EOG-EMG artifacts for multicentirc studies inEEG oscillations and event-related potentials. Int J Pshycophysiol2003;47(3):199–216.
Nuwer MR. Quantitative EEG. I: techniques and problems of frequency analysis andtopographic mapping. J Clin Neurophysiol 1988;5:1–43.
Osipova D, Ahveninen J, Kaakkola S, Jääskeläinen IP, Huttunen J, Pekkonen E. Effectsof scopolamine on MEG spectral power and coherence in elderly subjects. ClinNeurophysiol 2003;114(10):1902–7.
Pascual-Marqui RD, Michel CM. LORETA (low resolution brain electromagnetictomography): new authentic 3D functional images of the brain. ISBET NewslettISSN 1994;5:4–8.
Pascual-Marqui RD, Lehmann D, Koenig T, Kochi K, Merlo MC, Hell D, et al. Lowresolution brain electromagnetic tomography (LORETA) functional imaging inacute, neuroleptic-naive, first-episode, productive schizophrenia. PsychiatryRes 1999;90(3):169–79.

1824 C. Babiloni et al. / Clinical Neurophysiology 121 (2010) 1816–1824
Pascual-Marqui RD, Esslen M, Kochi K, Lehmann D. Functional imaging with lowresolution brain electromagnetic tomography (LORETA): a review. MethodsFind Exp Clin Pharmacol 2002;24:91–5.
Patterson JR, Grabois M. Locked-in syndrome: a review of 139 cases. Stroke1986;17:758–64.
Pfurtscheller G, Lopes da Silva FH. Event-related EEG/MEG synchronization anddesynchronization: basic principles. Clin Neurophysiol 1999;110(11):1842–57[Review].
Phillips C, Rugg MD, Friston KJ. Systemic regularization of linear inverse solutions ofthe EEG source localization problem. Neuroimage 2002;17:287–301.
Pistoia F, Sarà M. Gabapentin therapy for ocular opsoclonus-myoclonus restores eyemovement communication in a patient with locked-in syndrome. NeurorehabilNeural Repair 2009;20.
Plum F, Posner JB. The diagnosis of stupor and coma. 3rd ed. Philadelphia: FA DavisCo.; 1980.
Rae-Grant AD, Lin F, Yaeger BA, Barbour P, Levitt LP, Castaldo JE, et al. Post traumaticextracranial vertebral artery dissection with locked-in syndrome: a case withMRI documentation and unusually favourable outcome. J Neurol NeurosurgPsychiatry 1989;52(10):1191–3.
Ragazzoni A, Grippo A, Tozzi F, Zaccara G. Event-related potentials in patients withtotal locked-in state due to fulminant Guillain–Barré syndrome. Int JPsychophysiol 2000;37(1):99–109.
Reznick M. Neuropathology in seven cases of locked-in syndrome. J Neurol Sci1983;60:67–78.
Rossini PM, Desiato MT, Lavaroni F, Caramia MD. Brain excitability andelectroencephalographic activation: non-invasive evaluation in healthyhumans via transcranial magnetic stimulation. Brain Res 1991;567(1):111–9.
Rossini PM, Del Percio C, Pasqualetti P, Cassetta E, Binetti G, Dal Forno G, et al.Conversion from mild cognitive impairment to Alzheimer’s disease is predictedby sources and coherence of brain electroencephalography rhythms.Neuroscience 2006;143(3):793–803 [Epub 2006 Oct 13].
Schnakers C, Majerus S, Goldman S, Boly M, Van Eeckhout P, Gay S, et al. Cognitivefunction in the locked-in syndrome. J Neurol 2008;255(3):323–30 [Epub 2008Mar 20].
Steriade M. The corticothalamic system in sleep. Front Biosci 2003;8:d878–99[Review].
Steriade M, Llinas RR. The functional states of the thalamus and the associatedneuronal interplay. Physiol Rev 1988;68(3):649–742.
Talairach J, Tournoux P. Co-Planar stereotaxic atlas of the humanbrain. Stuttgart: Thieme; 1988.
Towle VL, Maselli R, Bernstein LP, Spire JP. Electrophysiologic studies on locked-inpatients: heterogeneity of findings. Electroencephalogr Clin Neurophysiol1989;73:419–26.
Valdès P, Picton TW, Trujillo N, Bosch J, Aubert E, Riera J. Constraining EEG-MEGsource imaging with statistical neuroanatomy. Neuroimage 1998;4:635.
Yang CC, Lieberman JS, Hong CZ. Early smooth horizontal eye movements: afavourable prognostic sign in patients with locked-in syndrome. Arch Phys MedRehabil 1989;70:230–2.
Yao D, He B. A self-coherence enhancement algorithm and its application toenhancing three-dimensional source estimation from EEGs. Ann Biomed Eng2001;29:1019–27.
Yazawa S, Kawasaki S, Kanemaru A, Kuratsuwa Y, Yabuoshi R, Ohi T. Bilateralparamedian thalamo-midbrain infarction showing electroencephalographicalpha activity. Intern Med 2001;40(5):443–8.