Resting metabolic rate and diet-induced thermogenesis
258
RESTING METABOLIC RATE AND DIET-INDUCED THERMOGENESIS studies in humans on individual differences and on the impact of nutritional and non-nutritional factors 0000 0330 1849
-
Upload
khangminh22 -
Category
Documents
-
view
0 -
download
0
Transcript of Resting metabolic rate and diet-induced thermogenesis

RESTING METABOLIC RATE AND
DIET-INDUCED THERMOGENESIS
studies in humans on individual differences
and on the impact of nutritional and non-nutritional factors
0000 0330 1849

Promotor : dr. J.G.A.J. Hautvast,
hoogleraar in de leer van de voeding
en de voedselbereiding
Co-promotor: dr. P.R.M. Deurenberg,
universitair hoofddocent

pMö[?-Ol , / ^ b O
RESTING METABOLIC RATE AND
DIET-INDUCED THERMO GENESIS
studies in humans on individual differences
and on the impact of nutritional and non-nutritional factors
J.A. Weststrate
Proefschrift
ter verkrijging van de graad van
doctor in de landbouwwetenschappen,
op gezag van de rector magnificus,
dr. H.C. van der Plas,
in het openbaar te verdedigen
op dinsdag 2 mei 1989
des namiddags te vier uur in de aula
van de Landbouwuniversiteit te Wageningen
BIBLIOTHEEK LANDBOUWUNIVERSITEIT
WAGEMNGE1V
'S* V - I Uo

Aan mijn moeder
Financial support by Unilever Research Laboratory for the publication of this
thesis is gratefully acknowledged.

Stellingen
1. Het ontbreken van gegevens over de reproduceerbaarheid van metingen van het thermogeen effect van voeding betekent niet, dat de reproduceerbaarheid van deze metingen goed is. (dit proefschrift)
2. De hoogte van de ruststofwisseling wordt bij obese vrouwen mede bepaald door de lichaamsvetverdeling. (dit proefschrift)
3. De hoogte van het thermogeen effect van voeding is bij vrouwen niet gerelateerd aan het lichaamsvetgehalte en de lichaamsvetverdeling. (dit proefschrift)
4. De hoogte van het thermogeen effect van voeding hangt mede af van factoren buiten de voeding. (dit proefschrift)
5. De bevinding dat bij proefdieren onder normale omstandigheden het grootste deel van koolhydraten na vertering wordt omgezet in vet, mag niet naar de mens worden geëxtrapoleerd. (o.a. dit proefschrift) - Björntorp P, Sjöström L. Carbohydrate storage in man: speculations and some quantitative considerations. Metabolism 1978;27:1853-65. - Acheson KJ, Flatt JP, Jéquier E. Glycogen synthesis versus lipogenesis after a 500 g carbohydrate meal in man. Metabolism 1982;31:1234-40.
6. Uit het familiaal voorkomen van bepaalde kenmerken, zoals een verhoogd vetgehalte in het lichaam, mag niet geconcludeerd worden dat vooral genetische factoren hiervoor verantwoordelijk zijn. - Garn SM et al. Living together as a factor in family-line resemblances. Hum Biol 1979;51:565-87.
7. Observationeel onderzoek naar de mate waarin variatie in een kenmerk geassocieerd is met erfelijke - of omgevingsfactoren mag op logische gronden niet causaal geïnterpreteerd worden. - Kempthorne O. Logical, epistemological and statistical aspects of nature-nurture data interpretation. Biometrics 1978;34:1-23.
8. Het dogma in de voedingswetenschap dat een voedingsmiddel nooit als 'gezond' of 'ongezond' aangemerkt kan worden, staat een werkelijk effectieve voedingsvoorlichting in de weg.
9. Sommige 'light' producten bevatten nog steeds veel energie. Minder energierijke varianten van gangbare producten zouden daarom alleen de kwalificatie 'light' mogen krijgen, wanneer zij tenminste 25 procent minder energie bevatten dan hun 'normale' tegenhanger, én in absolute zin een energiedichtheid hebben in het watervrije product, die niet hoger is dan de energiedichtheid van een gedroogd voedselpakket, zoals samengesteld volgens het Advies Richtlijnen Goede Voeding van de Nederlandse Voedingsraad.

10. Een vermindering van het aandeel van vet in de energievoorziening van de gemiddelde Nederlandse voeding ten gunste van dat van koolhydraten zal, naast een daling op populatieniveau van het serumcholesterolgehalte, ook leiden tot een afname van het gemiddelde lichaamsgewicht.
11. De gewoonte in het academische curriculum de eerste jaren van de studie vooral te gebruiken voor het leren van in het verleden geproduceerde kennis en de laatste jaren voor de productie van nieuwe kennis, leidt tot een laag totaal studierendement.
12. Er valt de eerstkomende jaren een grotere bijdrage te verwachten aan de preventie van overgewicht van het op de markt brengen van een smakelijke, verzadiging-gevende, laag-energetische snack dan van congressen over overgewicht.
13. Bij de toekenning van onderzoeksgelden aan universitaire vakgroepen door derden dient de originaliteit van de vraagstelling sterker te wegen dan de afwezigheid van een onderzoeklijn.
14. De mogelijkheden om een beter voedingspatroon in Nederland ingang te doen vinden, worden belemmerd door het verbod 'gezondheidsclaims' toe te kennen aan producten, die zijn samengesteld volgens het Advies Richtlijnen Goede Voeding van de Voedingsraad.
15. Hoe meer aandacht in de media voor gezondheidsproblemen, des te zieker men zich voelt. zie ook: Barsky AJ. The paradox of health. N Engl J Med 1988;318:414-8.
16. Berichtgeving in de media over de aanwezigheid van kankerverwekkende stoffen in voedingsmiddelen dient gepaard te gaan met een evaluatie van het gezondheidsrisico in relatie tot het gezondheidsrisico van meer alledaagse activiteiten, zoals autorijden, matig alkoholgebruik of de consumptie van pindakaas. zie ook: Wilson R, Crouch EAC. Risk assessment and comparisons: an introduction. Science 1987;236:267-70.
17. De veelgehoorde opmerking van ouderen dat vroeger 'alles' beter was, moet vooral van toepassing worden geacht op het functioneren van hun geheugen.
18. De verstrekking van een OV-jaarkaart aan studenten zal de bereikbaarheid van het hoger onderwijs niet vergroten.
Proefschrift J.A. Weststrate Resting metabolic rate and diet-induced thermogenesis: studies in humans on individual differences and on the impact of nutritional and non-nutritional factors Wageningen, 2 mei 1989.

Contents
page
Voorwoord 7
Abstract 10
Chapter 1. General Introduction 11
Chapter 2. Energy exchange and energy balance in humans: a review 19
Chapter 3. The assessment of resting metabolic rate, diet-induced
thermogenesis and in vivo fuel utilization using a
ventilated hood system: methodological considerations 59
Chapter 4. Diurnal variation in postabsorptive resting metabolic
rate and diet-induced thermogenesis 105
Am J Clin Nutr 1989; in press
Chapter 5. Lack of a systematic sustained effect of prolonged
exercise bouts on resting metabolic rate in fasting
subjects 120
(submitted)
Chapter 6. Surprisingly large impact of psychological stress on
diet-induced thermogenesis but not on resting metabolic
rate 131
(submitted)
-5-

Chapter 7. Nature and magnitude of inter-individual differences in
resting metabolic rate and diet-induced thermogenesis
in lean and obese individuals 140
(submitted)
Chapter 8. Resting energy expenditure in women: impact of obesity
and body fat distribution 160
Metabolism 1989; in press
Chapter 9. Alcohol and its acute effects on resting metabolic rate
and diet-induced thermogenesis 179
(submitted)
Chapter 10. Does palatability affect the postprandial response of
energy expenditure? 197
(submitted)
Chapter 11. Unexpected interaction between the effects of
short-term carbohydrate overfeeding and prior exercise
on resting metabolic rate and diet-induced
thermogenesis 214
(submitted)
Chapter 12. General discussion 234
Summary 249
Samenvatting 252
Curriculum vitae 255

Voorwoord
Voor u ligt een proefschrift met een aantal studies over de energiewisseling
bij de mens. Een deel van de onderzoekingen betreft de energiewisseling van
mensen met overgewicht. Dergelijk onderzoek spreekt velen aan. Een groot deel
van de bevolking voert een moeizaam gevecht tegen een overvloed aan calorieën.
'Dikmakers' dienen zich op veel plaatsen verleidelijk aan ter leniging van de
'lekkere' trek. Menigeen is niet opgewassen tegen al die calorische
verlokkingen. Als gevolg hiervan worden nogal wat mensen te dik. Vaak, echter,
menen overgewichtige mensen dat zij door een 'efficiëntere' energiewisseling
dik zijn geworden. Deze mensen zouden, bij wijze van spreken, dik worden
alleen al bij het zien van een bord eten. Verrassend genoeg is er in
wetenschappelijke zin nog weinig bekend over verschillen tussen mensen in de
efficiëntie van de energiewisseling. Een antwoord op de vraag, of er personen
zijn, die een verhoogde kans hebben op overgewicht als gevolg van een
'efficiëntere' energiewisseling is van belang; niet alleen ter mogelijke
geruststelling van diegenen, die het gevecht tegen overgewicht als een
verloren zaak beschouwen, maar vooral bij de behandeling en preventie van
overgewicht. Alleen wetenschappelijk onderzoek kan over deze zaak uitsluitsel
geven. Het is de hoop van de onderzoeker dat de onderzoekingen van dit
proefschrift hieraan een bijdrage zullen leveren.
Een proefschrift dient het bewijs te leveren dat de promovendus zelfstandig
origineel onderzoek kan verrichten en hierover kan rapporteren. Met name
rapportage in daartoe geëigende vaktijdschriften is belangrijk. Dit betekent,
dat proefschriften veelal betaan uit een bundeling van artikelen met een
inleiding en een algemene discussie die de bevindingen in een passend kader
plaatsen. Dit proefschrift vormt hierop geen uitzondering. Het beschrijft
verschillende onderzoekingen met uiteenlopende vraagstellingen.
Het onderzoek in dit proefschrift is tot stand gekomen dankzij de hulp van
velen. Traditiegetrouw wil ik dit voorwoord gebruiken om de mensen te danken,
die mij bij het onderzoek hebben geholpen.
Allereerst wil ik mijn promotor Professor Dr. J.G.A.J. Hautvast hartelijk
- 7 -

danken voor zijn nooit aflatende vertrouwen in mijn werk, voor zijn
enthousiasme voor mijn onderzoek en voor zijn vermogen de rode draad in het
onderzoek steeds naar voren te laten komen.
Ook wil ik mijn co-promotor Dr. P. Deurenberg bedanken voor de uitstekende
collegiale verhouding en de vele discussies die wij, met name op het gebied
van de lichaamssamenstelling, samen voerden.
Jaap Seidell wil ik danken voor de vele gezellige uren die wij doorbrachten
met het bedenken van nieuwe baanbrekende onderzoeken, waarvoor helaas het geld
ontbrak.
I am indebted to Professor Dr. E. Jéquier and Dr. Y. Schutz from the
"Institute de Physiologie" of the University of Lausanne in Switserland for
introducing me to the 'ins and outs' of the measurements of diet-induced
thermogenesis.
De Directie van Unilever Research Laboratorium in Vlaardingen ben ik
erkentelijk voor de tijd die zij mij verleenden om dit proefschrift af te
ronden. Mijn collega's van de sectie Fysiologie van Unilever Research wil ik
danken voor het begrip dat zij de afgelopen maanden toonden voor mijn nogal
onregelmatige werktijden.
Aan het onderzoek is door 14 doktoraal studenten meegewerkt, die ik graag
persoonlijk wil bedanken voor de plezierige samenwerking en hun onmisbare
hulp: Greet Vansant, Cathaline den Besten, Zandrie Hofman, Alida Wapsta, Jos
Steenbergen, Peter Weys, Eric Poortvliet, Jacqueline Dekker, Miriam Stoel,
Liliane Begheyn, Karin van der Kooy, Ingrid Wunnink, Leoniek Robroch en Theo
Dopheide.
Veel dank gaat uit naar de medewerkers van de service-afdeling van de Centrale
Dienst van het Biotechnion. Zonder jullie hulp was dit proefschrift nooit
verschenen. Uit een eindeloze reeks van voddige papiertjes met even zovele
klodderige tekeningetjes van onderdelen van de 'ventilated hood', wisten
jullie een systeem voor energiewisselingsmetingen te bouwen, dat, in statu
nascendi, reeds landelijke bekendheid kreeg in een televisieprogramma. Guus
van Munster, Arthur van Munster, Jan Theunissen, Richard van der Vlies, Bert
Willemsen, Sjaak Viegen en Hans Ermers hartelijk dank voor jullie hulp. Ook
een woord van dank ben ik verschuldigd aan Leo Herben van de afdeling
electronica voor de constructie van de electrische componenten van de
'ventilated hood'. Zonder de hulp van Henk Stomphorst en Ton Erens was ik nu
nog bezig met het uitrekenen van de energiewisselingsgegevens van mijn tweede
experiment. Jullie waren verantwoordelijk voor de automatisering van het
'ventilated hood' systeem.
-8-

De medewerkers van het laboratorium van de Vakgroep Humane Voeding ben ik
erkentelijk voor de hulp bij de analyses van maaltijden, urines en
bloedmonsters. Een paar personen wil ik met name bedanken: Ans Soffers, Cock
Germing-Nouwen, Joke Barendse-v.Leeuwen en Peter van de Bovenkamp.
Hannie van Oosten-van der Goes zorgde op kritieke momenten voor voldoende
budget op mijn computer-rekeningnummer.
De hulp van de medewerkers van de tekenkamer van het Biotechnion was
onontbeerlijk. Zonder jullie professionele hulp hadden de verschillende
figuren in mijn proefschrift hoogstwaarschijnlijk een grote gelijkenis
vertoond met mijn ontwerpen van de verschillende onderdelen van het
'ventilated hood' systeem.
Christiaan de Vries maakte de schematische tekening van het 'ventilated hood'
systeem. Frans Schouten ben ik erkentelijk voor de uitvoering van enkele
testen ter controle van het 'ventilated hood' systeem. De medewerkers van de
Bibliotheek van het Biotechnion mogen ook niet onvermeld blijven; dank voor
het feit dat jullie mij, na zovele keren op de zwarte lijst geplaatst te zijn,
nog steeds toelaten te midden van de werken der wetenschap. Een eervolle
vermelding verdient het secretariaat van de Vakgroep Humane Voeding en Marcel
van Leuteren. Conny, Bianca, Riekie en Marcel hartelijk dank voor de onmisbare
hulp bij het vele type- en lay-out werk.
Harry Harsema ben ik erkentelijk voor het ontwerp van de omslag. Meta, Baukje
en Pauline, bedankt voor jullie steun in die drukke laatste maanden.
Mijn zussen Janet en Nelleke wil ik graag bedanken voor hun voortdurende
belangstelling voor mijn werk. Mijn moeder heeft mij steeds gestimuleerd om te
studeren en daarbij mijn eigen interesses voorop te laten staan; aan haar
draag ik dit proefschrift op.

Abstract
RESTING METABOLIC RATE AND DIET-INDUCED THERMOGENESIS: Studies in humans on individual differences and on the impact of nutritional and non-nutritional factors
THESIS, DEPARTMENT OF HUMAN NUTRITION, WAGENINGEN AGRICULTURAL UNIVERSITY, WAGENINGEN, THE NETHERLANDS, 2 MAY 1989
Jan A. Weststrate
This thesis contains studies on resting metabolic rate (RMR) and diet-induced thermogenesis (DIT) of humans using indirect calorimetry (ventilated hood system) to assess energy expenditure. A literature survey of aspects of human energy exchange and of problems of energy balance is included. At first, methodological studies on the measurement of RMR, DIT and fuel utilization are presented. Measurements of RMR and respiratory quotient showed good reproducibility, in contrast to those of DIT and fuel utilization rates. Secondly, the nature and magnitude of inter-individual differences in RMR and DIT were assessed. No significant difference in DIT was found between non-obese women and obese women with a wide range in body fat distribution. Men had a significantly higher DIT compared to women. Obese women with a non-abdominal type of body fat distribution had reduced RMR's in comparison with non-obese men, non-obese women and obese women with an abdominal type of body fat distribution. Thirdly, the impact of nutritional and non-nutritional factors on RMR and DIT was studied. No significant diurnal variation in RMR and DIT was found. Psychological stress did not affect RMR, but potentiated DIT. Unduly heavy exercise was found to have a significant after-effect on RMR and DIT, whereas moderate to heavy exercise did not have a systematic after-effect on RMR. Ethanol (20 g) induced a significant thermic effect, but did not affect DIT. Differences in palatability among otherwise identical mixed meals or sucrose solutions did not produce differences in DIT. Short-term carbohydrate overfeeding increased DIT, but not RMR. Carbohydrate overfeeding attenuated the after-effect on RMR of unduly heavy exercise. This thesis shows that inter-individual differences in RMR and DIT exist, even after statistically accounting for differences among individuals in age, body weight and body composition. This thesis shows also that, in addition to nutritional factors, non-nutritional factors affect the postprandial rise in energy expenditure.
-10-

Chapter 1. General Introduction
1.1. INTRODUCTION
This thesis deals with the study of human energy exchange. Energy exchange
involves the relationships between energy intake and energy expenditure and
includes the processes for storage and utilization of energy containing
compounds. In this thesis the energy expenditure component of human energy
exchange is studied, in particular, the rate of energy expenditure at rest in
fasting conditions and at rest after feeding. These components of energy
expenditure are referred to as resting metabolic rate and diet-induced
thermogenesis, respectively. Together they account for 70-85 percent of total
energy expenditure in the average adult individual. Because of their
quantitative importance for total energy expenditure, the study of resting
metabolic rate and diet-induced thermogenesis is essential for gaining insight
in the determinants of inter-individual variations in overall energy
requirements. The questions how much food humans need and the factors that
determine their needs are basic to the science of nutrition. This thesis
investigates methodological aspects of studies on resting metabolic rate and
diet-induced thermogenesis; it describes the size and nature of
inter-individual differences in the rate of resting energy expenditure, and
assesses the impact of various nutritional and non-nutritional factors on
resting metabolic rate and diet-induced thermogenesis.
1.2. BACKGROUND OF THESIS
In the last two decades interest in the study of human energy exchange gained
momentum. This was» in particular, the result of an increased prevalence of
problems of energy balance, both in the developed countries as in developing
countries (1-4). In developed countries the prevalence of overweight and
-11-

obesity attained levels that caused concern among physicians and
nutritionists. The widespread occurrence in developing countries of energy
undernutrition with its clinical sequelae received worldwide attention.
Obesity and energy undernutrition are two sides of the same coin. Both are the
clinical manifestations of a prolonged disturbance of energy balance. In the
former, energy intake has exceeded energy expenditure and in the latter the
opposite process has occurred. In itself it is not clear why these problems
would cause a revival of the study of human energy exchange. The first Law of
Thermodynamics offers a simple solution to both problems. The obese should
decrease their energy intake and the undernourished should increase food
intake. Obviously the problem is far more complicated.
Interest for studying energy exchange in relation to obesity arose at the
suggestion that the obese would have lower rates of energy expenditure and,
consequently, lower energy requirements in comparison with the non-obese
(5-7). Such lower rates of energy expenditure would be of pathogenetic
significance. In addition, they could offer an explanation for the frequently
observed weight relapse in the obese after weight loss (8). The hypothesis of
lowered energy requirements in the obese was in agreement with observations on
the relevance of energy expenditure for genetic-based differences in body
composition among various animal species (9,10).
Interest for studying energy exchange in relation to undernutrition stemmed
from observations in developing countries that individuals with surprisingly
low energy intakes were reported to be in remarkably good health (11). It was
suggested that these individuals had adapted their rate of energy expenditure
to the relatively low energy intakes (11). Assessing the determinants and
magnitude of this type of adaptation is considered to be highly relevant for a
critical appraisal of the food availability situation in a developing country
(11,12).
Thus, the study of energy exchange has two sides also. In developed countries
it may offer clues to the etiology of problems of energy overnutrition and in
developing countries it may elucidate the nature and quantify the magnitude of
a supposed biological adaptation phenomenon with significant food policy
implications.
Energy exchange involves two components, the first is energy intake and the
second is the use of food energy by metabolism for a variety of bodily
functions and for physical activity, ie, energy expenditure. The current
theory on energy requirements states that it is the rate of energy expenditure
-12-

that fixes the level of energy intake at which energy requirements are met
(13). This implies that differences in energy requirements among individuals
with similar degrees of physical activity should be reflected primarily in
differences in resting metabolic rate or diet-induced thermogenesis. The
question rises whether inter-individual differences exist in these components
of energy expenditure. The answer to this question is affirmative with respect
to resting metabolic rate (14-18). It is well known that differences occur
among individuals in resting metabolic rate and that these differences are
depended on inter-individual variation in body weight and body composition
(14-18). Persons with greater amounts of metabolically active cells will have
higher resting metabolic rates compared to persons with smaller amounts of
metabolically active cells (14-18). Whether inter-individual differences in
diet-induced thermogenesis exist and the factors that influence such
differences are questions that currently can not be answered with sufficient
certainty.
In the study of human energy exchange the following pivotal questions continue
to receive much investigative attention:
1. Do individuals with similar body weight, body composition and degrees of
physical activity differ in energy expenditure?
2. In which components of energy expenditure do these differences, when they
occur, become manifest?
3. To what extent do personal characteristics relate to individual differences
in energy expenditure?
4. Does the genetic make-up of an individual affect the efficiency of energy
utilization.
5. Does energy expenditure adapt in response to environmental stimuli, in
particular, to chronic alterations in the plane of nutrition?
6. Did individuals become obese because they had lowered rates of energy
expenditure? Alternatively, do relatively lowered rates of energy
expenditure occur among the obese, and, if so, are these of pathogenetic
significance?
-13-

The present thesis does not address all these questions. It investigates the
following questions that are relevant for answers to some of the
aforementioned topics of human energy exchange:
1. How large is the intra-individual variation in resting metabolic rate and
diet-induced thermogenesis? Do sex, degree of body fatness and control of
the antecedent diet affect the size of the intra-individual variation in
resting energy expenditure?
2. What is the nature and magnitude of inter-individual differences in resting
metabolic rate and diet-induced thermogenesis in lean and obese
individuals? Does the type of body fat distribution in obesity affect these
differences?
3. To what extent is resting metabolic rate affected by non-nutritional
factors, ie, previous exercise, psychological stress and time of the day,
and to what degree by nutritional factors, ie, ethanol ingestion and
short-term carbohydrate overfeeding?
4. To what extent is diet-induced thermogenesis affected by non-nutritional
factors, ie, previous exercise, psychological stress, time of the day and
palatability of food, and to what degree by nutritional factors, ie,
ethanol ingestion and short-term carbohydrate overfeeding?
In this thesis intra-individual variation is defined as the variation of an
individual about his or her true mean. Inter-individual variation is the
variation among the true means of individuals within a population. To assess
the relative importance of inter-individual variation in resting energy-
expenditure, knowledge of the magnitude of the intra-individual variation is
important. If intra-individual variation in resting energy expenditure is
large, it may prove difficult to characterize individuals from another, ie, to
correctly assess the nature and magnitude of inter-individual variation.
A review of the literature (19,20) shows that it has been difficult to
distinguish the lean from the obese with respect to diet-induced
thermogenesis. There is no satisfactory explanation for the divergence in
opinions concerning the importance of diet-induced thermogenesis for the
pathogenesis of human obesity. The possibility that a relatively large
-14-

intra-individual variation in diet-induced thermogenesis has contributed to
this controversy, has not been investigated. The problem of distinguishing
lean subjects from obese subjects with respect to diet-induced thermogenesis
could also be related to the occurrence among the lean and the obese of
subgroups of individuals with relatively low and high rates of energy
expenditure. This thesis addresses these topics in some depth. In addition, to
the estimation of the size of intra- and inter-individual variation in resting
energy expenditure, this thesis contains various studies on the impact of
specific stimuli on resting metabolic rate and diet-induced thermogenesis.
These stimuli are subdivided into nutritional factors and non-nutritional
factors. The factors were chosen to study their impact on resting energy
expenditure because of two reasons. Firstly, because it is generally assumed
for some of these factors, ie, for psychological stress, previous exercise,
time of the day, that they affect energy expenditure. In fact, however, their
effect on energy expenditure is controversial or hardly documented. The second
reason is that some of these stimuli were expected to affect the biochemistry
of postprandial energy expenditure in a specific way as to cause a
hypothetized change in the rate of resting energy expenditure. Studies were
carried out to test these hypotheses in order to gain insight in the nature of
diet-induced thermogenesis.
1.3. OUTLINE OF THESIS
The major part of this thesis contains articles which are in press or
submitted for publication.
Chapter 1 contains a general introduction.
Chapter 2 gives a short review of the components, regulation, measurement and
problems of energy exchange in humans. It provides a theoretical framework for
the study of resting energy expenditure in humans and includes a formulation
of the major hypotheses tested in this thesis.
Chapter 3 considers methodological aspects of the assessment of resting
metabolic rate, diet-induced thermogenesis and in vivo fuel utilization by
indirect calorimetry using a ventilated hood system. This chapter provides
data on the nature and magnitude of intra-individual variation in resting
-15-

metabolic rate and diet-induced thermogenesis.
Chapter 4 describes a study on the impact of diurnal variation in resting
metabolic rate and diet-induced thermogenesis. It is frequently assumed that
resting metabolic rate shows considerable diurnal variation. This variation
would seriously affect the assessment of diet-induced thermogenesis, if not
properly corrected for.
In Chapter 5 the impact of previous exercise on resting metabolic rate is
discussed. The duration and magnitude of the impact of previous exercise on
resting metabolic rate is a controversial issue. A prolonged and significant
after-effect of exercise on resting energy expenditure may represent a
significant loss of energy for the individual, which could be useful in weight
control or weight reduction therapies.
Chapter 6 contains a study on the effect of motion-picture induced
psychological stress on resting metabolic rate and diet-induced thermogenesis.
It is generally assumed that "stress" affects energy expenditure. However,
little hard data is available to support this assumption.
The nature and magnitude of inter-individual differences in resting metabolic
rate and diet-induced thermogenesis in lean and obese subjects are discussed
in Chapter 7.
Chapter 8 describes the impact of obesity in women and of the type of body fat
distribution in obesity on resting metabolic rate and diet-induced
thermogenesis. The type of body fat distribution in obesity is an important
predictor of metabolic complications of obesity. In recent years obesity
research has investigated the relationships between body fat distribution in
obesity and hormonal status, insulin and glucose metabolism, lipid metabolism,
but not in assocation with energy metabolism.
The thermic effect of ethanol and the impact of ethanol on diet-induced
thermogenesis are reported in Chapter 9. Ethanol provides on average up to 5
percent of daily energy intake in adults in Western countries. Alcohol is
reported to be added on top of the diet. Surprisingly, however, its use is not
associated with increased levels of adiposity. This has raised the suggestion
that ethanol is less efficiently used as an energy source compared to fat or
-16-

carbohydrates. We studied the efficiency of ethanol energy utilization by
assessing its thermic effect in fasting and fed subjects.
Chapter 10 addresses the question whether palatability affects diet-induced
thermogenesis. Man eats to satisfy physiological and non-physiological needs.
Ingestion of food, but possibly also the mere sight or smell of food, elicits
a prompt response in the secretion of various hormones. These early
(pre-absorptive) responses may modulate diet-induced thermogenesis. Food
varying in sensory characteristics is known to differentially influence these
early hormonal responses. In Chapter 10 it was tested whether food with
different palatability would differentially affect diet-induced thermogenesis.
In Chapter 11 we discuss the interaction between exercise and short-term
carbohydrate overfeeding on resting metabolic rate and diet-induced
thermogenesis. Prolonged heavy exercise is known to deplete the body's
glycogen stores. Carbohydrate overfeeding may have the opposite effect.
Diet-induced thermogenesis would be increased when the body's glycogen levels
are high and decreased with low levels of liver and skeletal-muscle glycogen.
In this Chapter the effects of exercise and carbohydrate overfeeding on
resting metabolic rate and diet-induced thermogenesis are discussed.
Chapter 12 contains a general discussion of the experiments reported in this
thesis and includes the formulation of general conclusions.
REFERENCES
1. Bray GA. Obesity: definition, diagnoses and disadvantages. Med J Aust 1985;142:S2-7.
2. Van Itallie TB. Health implications of overweight and obesity in the United States. Ann Int Med 1985;103:983-8.
3. Seidell JC, de Groot CPGM, van Sonsbeek JLA, Deurenberg P, Hautvast JGAJ. Associations of moderate and severe overweight with self-reported illness and medical care in Dutch adults. Am J Publ Health 1986;76:264-9.
4. Reutlinger S, Alderman H. The prevalence of calorie deficient diets in developing countries. World Dev 1980;8:239-411.
5. Miller DS, Mumford P, Stock MJ. Gluttony 2. Thermogenesis in overeating man. Am J Clin Nutr 1967;20:1223-9.
6. James WPT, Trayhurn P. An integrated view of the metabolic and genetic basis for obesity. Lancet 1976;2:770-2.
7. Jéquier E. Does a thermogenic defect play a role in the pathogenesis of human obesity? Clin Physiol 1983;3:1-7.
8. Wing RR, Jeffery RW. Outpatients treatment of obesity: a comparison of methodology and clinical results. Int J Obes 1979;3:261-79.
-17-

9. Thurlby PL, Trayhurn P. The role of thermoregulatory thermogenesis in the development of obesity in genetically obese (ob/ob) mice pair fed with lean siblings. Br J Nutr 1979;42:377-85.
10. Contaldo F. The development of obesity in genetically obese rodents. In: Cioffie LA, James WPT, Van Itallie TB, eds. The body weight regulatory system: normal and disturbed mechanisms. New York: Raven Press, 1981;237-42.
11. Sukhatme PV, Margen S. Autoregulatory homestatic nature of energy balance. Am J Clin Nutr 1982;35:355-65.
12. James WPT. Research relating to energy adaptation in man. In: Schüren B, Scrimshaw NS, eds. Chronic energy deficiency: consequences and related issues. International dietary energy consultancy group: Lausanne, 1987.
13. Energy and protein requirements. Report of a joint FAO/WHO/UNU Expert Consultation, Technical report series 724. Geneva: World Health Organization, 1985.
14. Halliday D, Hesp R, Stalley SF, Warwick P, Altman DG, Garrow JS. Resting metabolic rate, weight, surface area and body composition in obese women. Int J Obes 1979;3:1-6.
15. Ravussin E, Burnand B, Schutz Y, Jéquier E. Twenty-four hour energy expenditure and resting metabolic rate in obese, moderately obese, and control subjects. Am J Clin Nutr 1982;35:566-73.
16. Owen OE, Kavle E, Owen RS, Polansky M, Caprio S, Mozzoli MA, Kendrick ZV, Bushman MC, Boden G. A reappraisal of caloric requirements in healthy women. Am J Clin Nutr 1986;4:1-19.
17. Owen DE, Holup JC, D'Alessio DA, Craig ES, Polansky M, Smalley KJ, Kavle EC, Bushman MC, Owen LR, Mozzoli MA, Kendrick ZV, Boden GH. A reappraisal of the caloric requirements of men. Am J Clin Nutr 1987;46:875-85.
18. Bogardus C, Lillioja S, Ravussin E, Abbott W, Zawadzki JK, Young A, Knowler WC, Jacobowitz R, Moll PP. Familial dependence of the resting metabolic rate. N Engl J Med 1986;315:96-100.
19. Woo R, Daniels-Kush R, Horton ES. Regulation of energy balance. Ann Rev Nutr 1985;5:411-13.
20. Jéquier E, Schutz Y. Does a defect in energy metabolism contribute to human obesity. In : Hirsch J, Van Itallie TB, eds. Recent advances in obesity research: IV. London: John Libbey, 1985;76-81.
-18-

Chapter 2. Energy exchange and energy balance in humans: a review
CONTENTS Page
2.1. INTRODUCTION 20
2.2. HISTORICAL PERSPECTIVE 20
2.3. THE COMPONENTS OF ENERGY EXCHANGE 21
2.3.1. ENERGY EXPENDITURE 21
2.3.1.1. RESTING ("BASAL") METABOLIC RATE 21
2.3.1.2. DIET-INDUCED THERMOGENESIS 25
2.3.1.3. WORK-INDUCED THERMOGENESIS 31
2.3.1.4. MEASUREMENT OF ENERGY EXPENDITURE 32
2.3.2. ENERGY INTAKE 36
2.3.2.1. THEORIES ON THE PHYSIOLOGICAL CONTROL OF FOOD 36
INTAKE
2.3.2.2. CONTROL OF FOOD INTAKE IN HUMANS 40
2.3.3. ENERGY BALANCE 42
2.3.3.1. ENERGY BALANCE EQUATION 42
2.3.3.2. CONTROL OF ENERGY BALANCE 43
2.3.3.3. ENERGY BALANCE AND OBESITY 47
2.4. CONCLUSIONS 49
REFERENCES 50
-19-

2.1. INTRODUCTION
In this review I will briefly discuss the components of energy exchange and
their relation to energy balance.
2.2. HISTORICAL PERSPECTIVE
The study of energy exchange in biological systems started more than two
hundred years ago with the inference of Lavoisier that respiration in animals
was based on consumption of 'oxygène', a hitherto unknown element. It took
more than seventy years before another fundamental scientific advance was made
in the study of energy exchange in biological systems. In 1842 the German
Robert Meyer formulated the Principle of Energy Conservation. This Principle
is now known as the first Law of Thermodynamics. It states that energy can not
be destroyed or created, but only changed in form. More than half a century
later Rubner showed that an animal's heat or energy balance was consistent
with the first Law (1). At the turn of the century similar findings were
reported by Atwater and Benedict for humans (2). In the decades following,
biochemists unravelled the metabolic pathways involved in cellular heat
production and energy transduction (3,4). During this period interest among
physiologists and nutritionists for the study of human energy exchange was
negligible. It was assumed that the fundamental problems of energy exchange
were solved. Energy balance would be regulated by energy intake, which was
under tight hypothalamic control (5).
Interest in the study of the 'fire of life' revived in the 1960s and the 1970s
(6-8). Impetus for the revived interest in the study of human energy
metabolism came from two directions. Firstly, animal experiments showed that
genetic-based differences in body composition were related to differences in
energy expenditure (9,10). Related experiments showed that rats induced to eat
a highly palatable diet, increased their food intake substantially without
gaining excess weight due to a marked stimulation of brown adipose tissue
thermogenesis (11). Secondly, studies in humans indicated that the efficiency
of energy utilization and, consequently, the level of energy requirements,
varied in relation to degree of adiposity (12,13).
Thus, almost a century after it was shown that human energy exchange proceeds
according to the first Law of Thermodynamics, the study of human energy
exchange is at a point where it needs the second Law of Thermodynamics to
-20-

provide the key to understanding two remaining problems of human energy
metabolism. These are the partitioning of energy transformations in the body
into those leading directly to heat and those leading to internal work and
subsequent heat ('efficiency of uncoupled metabolism'), and, secondly, the
efficiency of the transformation of chemical energy in food stuffs to internal
work ('efficiency of coupled metabolism'). Related to these problems are some
important questions of human energy exchange, ie, whether individuals may show
systematic differences in the efficiency of energy utilization, whether
certain personal characteristics covary with such differences, in what way
such differences relate to environmental stimuli, and, finally, whether the
genetic make-up of an individual affects the efficiency of energy utilization.
2.3. THE COMPONENTS OF ENERGY EXCHANGE
The human body is in constant energy exchange with its surroundings. Chemical
energy is provided to the body by food ingestion. The energy contained in
macronutrients is liberated by oxidation involving a continuous uptake of
oxygen and disposal of carbondioxide. During oxidation of nutrients heat is
generated to maintain body temperature and for the provision of chemical work
(biosynthesis), osmotic work (ion gradients) and mechanical work (muscular
contractions). The transfer of energy from the body to its surroundings is
designated energy expenditure. The uptake of energy from its surroundings by
the body is known as energy intake.
2.3.1. ENERGY EXPENDITURE
The transfer of energy from to body to its surroundings comprises energy
expenditure. Total energy expenditure can be subdivided into three components:
resting metabolic rate, diet-induced thermogenesis and work-induced
thermogenesis. These elements of energy expenditure are discussed in the
following three paragraphs.
2.3.1.1. RESTING ('BASAL') METABOLIC RATE
Resting ('basal') metabolic rate (RMR or BMR) is the rate of energy
-21-

expenditure of an individual, awake and at complete physical rest some hours
after the last meal and physical activity (14). Generally, it is similar to
what is known as 'basal' metabolic rate. Basal metabolic rate is measured
under highly standardized conditions and is defined as the rate of energy
expenditure of an individual at complete physical rest, lying down, shortly
after being awake, measured in a thermoneutral state, 12-14 hours after the
last meal, with the individual at sexual repose and emotionally undisturbed,
without disease or fever (14). The term 'basal' suggests that energy
expenditure measured under these conditions would correspond to minimal energy
expenditure. However, during sleep, drowsiness or meditation the rate of
energy expenditure can be lower compared to 'basal' metabolic rate (14,15).
Most recent authorative reviews on energy expenditure use the term resting
metabolic rate (16,17). Throughout this thesis this term will be used.
Resting metabolic rate represents the sum of the energy liberated by the
metabolic activities of all the cells of the body under the specific
conditions of the measurement. It includes the costs of maintaining the
integrated systems of the body and the homeothermic temperature at rest. Under
thermoneutral conditions sufficient heat is generated to maintain body
temperature during oxidation of nutrients to provide ATP for biosynthesis,
active transport and muscular contraction. In the average adult individual
resting metabolic rate comprises 60-75 percent of total daily energy output
(16,17).
Figure 1 gives a schematic representation of various factors affecting resting
metabolic rate in humans under thermoneutral conditions and the mechanisms
involved.
Resting metabolic rate is depended on constitutional factors, ie, sex, age and
genes, and environmental factors, ie, diet, temperature, stress and drugs. The
constitution of a subject determines his or her mass of metabolically 'active'
cells and the composition of the mass of active cells. In this respect
composition refers to the proportion of tissues with different metabolic rates
(18). Obviously, in the long term environmental factors, in particular diet,
also affect a subject's mass of metabolically 'active' cells and, perhaps
also, the proportion of tissues with different metabolic rates. Both factors
determine primarily the ATP needs for biosynthesis, active transport and
muscular contraction, and, consequently, resting metabolic rate.
Thus, resting metabolic rate differs among people of different sex, body
weight and age (19-28). However, when differences in body weight and body
composition are considered most of these differences tend to disappear
-22-

(23-28).
In metabolic studies the size of the ' ac t ive ' mass i s usually estimated by a
measure of the amount of fat-free or lean mass in the body (23-28). Fat-free
mass comprises a l l 'non-fat ' t issues and organs in the body, including bone,
skin and extracellular water. The importance of the size of the ' ac t ive ' mass
CONSTITUTION
SEX/ AGE /GENES
SIZE OF
FAT-FREE BODY
COMPOSITION
FAT-FREE BODY
ATP NEEDS -BIOSYNTHESIS -ACTIVE TRANSPORT. - MUSCULAR CONTRACTION
ENVIRONMENT
DIET /TEMPERATURE "stress"/drugs
ENDOCRINE
REGULATORS
EFFICIENCY OXYDATIVE FOSFORYLATION
EFFICIENCY COUPLED METABOLISM
02 INPUT
C02 OUTPUT RMR
Figure 1. 'Model' of the impact of various factors on resting metabolic rate (RMR). Composition of the fat-free mass represents the proportion of tissues with different metabolic activities in the total fat-free mass. Thick lines indicate established contributions. Interrupted lines indicate contributions still in doubt.
for determining resting metabolic rate was shown in numerous studies reporting
high correlations between resting metabolic rate and the size of the fat-free
mass (23-28). Average resting metabolic rates per unit weight of fat-free mass
are reported to vary between 110 and 130 kJ/d/kg fat-free mass (24-28). Since
cells of different tissues and organs have widely different levels of
metabolic activity (18), it follows that the average metabolic rate per unit
weight of cell mass will change when the proportion of tissues with different
metabolic rates changes. Currently it is very difficult, perhaps impossible,
to quantify exactly in vivo the proportion of different tissues (composition)
in the fat-free mass of the body (29). This means that differences in resting
metabolic rate per weight unit of fat-free mass do not necessarily indicate a
-23-

difference in basic, energy-demanding biochemical processes at the cellular or
molecular level. It is at this basic level that environmental factors, through
endocrine regulators, may more directly affect the rate of energy expenditure
and cause inter-individual differences in the rate of resting metabolic rate.
Among these environmental factors diet and the environmental temperature are
probably the most important, but stress and certain drugs may also affect
resting metabolic rate (16,17).
Hormones could either affect the degree of coupling of oxidation to
phosphorylation, ie, affect the efficiency of oxidative phosphorylation, or
influence the use of ATP in metabolism, ie, affect the net efficiency of
coupled metabolism (17). Thyroid hormones appear to be the major hormonal
determinant of mammalian cellular thermogenesis (30). Thyroid hormones affect
directly the rate of ionic pumping (31,32). A considerable part, perhaps a
very large part, of our metabolic energy is, to cite Sims and Danforth (17),
"...devoted to keeping the primordial brine out of our cells". However,
whether the effect of thyroid hormones on sodium pumping contributes
significantly to thyroid thermogenesis remains to be established (32). In
addition to thyroid hormones, insulin (33) and norepinephrine (34) may also
affect ionic pumping. Finally, norepinephrine and thyroid hormones are
reported to increase the use of ATP in substrate ('futile') cycling (35,36).
Whether hormones may affect in man the efficiency of mitochondrial coupling of
oxidation to ATP production is not known. In small rodents it has been shown
that norepinephrine reduces the efficiency of oxydative phosphorylation in
brown adipose tissue (35).
The extent to which subtle differences in the hormonal control of cellular
thermogenesis are associated with differences in the rate of energy
expenditure per unit weight of fat-free mass remains to be investigated.
Related to this question, is the impact of nutrition on endocrine regulators
of thermogenesis. In this respect nutritionally-induced changes in sympathetic
nervous system activity and the peripheral metabolism of thyroid hormones are
interesting. It was shown that overfeeding increases, on the one hand, the
activity of the sympathetic nervous system and thereby catecholamines
secretion rates, and, on the other hand, the production of free
triiodothyronine, whereas energy restriction induced opposite effects (37-41).
The observed reduction in resting metabolic rate during energy restriction
(42-59) has frequently been ascribed to hormonally-induced changes in the
efficiency of energy utilization. Recently, Ravussin et al. (54) showed that
the decrease in resting metabolic rate in subjects during weight loss could be
-24-

completely accounted for by the loss of fat-free mass. Bessard et al. (52) and
Barrows and Snook (51), however, report a decrease after weight loss in
resting metabolic rate per unit weight of the fat-free mass. Rozen et al. (55)
showed in a short-term study that the decrease in metabolic rate in obese
euthyroid women during weight loss could be prevented by a 'physiological'
dosis of triiodothyronine. The latter study supports a role for
hormonally-induced changes in the efficiency of energy utilization during
weight loss. However, more research seems needed to settle this issue.
Two intrigueing observations on individual differences in resting metabolic
rate should be mentioned. Recently, Bogardus et al. (27) showed a familial
dependency of resting metabolic rate in American Pima Indians. The results of
the study of Bogardus et al. do not offer an answer to the question whether
this familial dependency was related to a genetic resembling of family members
or to similarity among family members in nutritional habits or, to generalize,
in lifestyle factors. It has, however, been reported that resting metabolic
rate was more alike between monozygotic twins in comparison to dizygotic twins
(56).
2.3.1.2. DIET(AKY)-INDUCED THERMOGENESIS
Diet(ary)-induced thermogenesis (DIT) is the increase in the rate of resting
energy expenditure in response to feeding (14). In this thesis diet-induced
thermogenesis is defined as the acute effect of food ingestion on resting
metabolic rate, also referred to as the thermic (thermogenic) effect of food
or the heat increment of feeding. In the average individual diet-induced
thermogenesis would account for about 10 percent of total daily energy
expenditure (16,17).
There are many synonyms in use to describe diet-induced thermogenesis, these
terms are listed in Figure 2. In addition to the plethora of terms used to
describe diet-induced thermogenesis, some investigators (57) consider
diet-induced thermogenesis not as the acute impact of food ingestion on energy
expenditure, but as the chronic effect of diet on the rate of energy
expenditure. In that case diet is synonym to the plane of nutrition, which may
affect energy expenditure. The impact of diet on energy expenditure would
manifest itself in adaptive changes of resting metabolic rate, diet-induced
thermogenesis or work-induced thermogenesis. To prevent semantical problems, I
propose to refer to such adaptive responses as diet-induced facultative
-25-

changes in resting metabolic rate, diet-induced thermogenesis or work-induced
thermogenesis, respectively.
The history of diet-induced thermogenesis starts with the work of Rubner (58).
Rubner observed an increase in oxygen consumption of fasting dogs after
ingestion of protein, fat or sugar. This increase in oxygen consumption was,
in particular, manifest after protein ingestion. Rubner called the increase in
oxygen consumption after food ingestion by fasting animals the specific
dynamic effect (action) of food.
- Specific dynamic action - Specific dynamic effect - 'Luxus consumption' - Heat increment of food, of feeding - Thermic effect
Thermogenic effect Caloric
- of food, of a meal, of glucose etc.
- Calorigenic - Thermogenic-I - Postprandial thermogenesis - Food - Diet - Dietary - Glucose
(fat, protein)
response - to food, to a meal effect
induced thermogenesis
Figure 2. Terms encountered in the literature describing the increase in energy expenditure following the ingestion of food or a meal (14).
In the first 50-60 years of the 20th century diet-induced thermogenesis was
not a matter of great concern to most nutritionists (59-61). In the last two
decades, however, the number of publications on DIT has rapidly risen
(12,13,52,53,62-85). The reason for the revived interest in diet-induced
thermogenesis was the suggestion that the obese would have a lower
diet-induced thermogenesis when compared to the non-obese (12,13). This
difference would be of pathogenetic significance. It was suggested that
diet-induced thermogenesis was an effector of differences in energy
requirements between lean and obese subjects.
More recently, diet-induced thermogenesis has been proposed as an effector of
an adaptation of energy expenditure to lower energy intakes or to sustained
increased metabolic energy needs, ie, in pregnancy and lactation (86-88).
Whether diet-induced thermogenesis may act as an effector of inter-individual
-26-

differences in energy requirements is unclear. Controversy in this area of the
study of human energy exchange is disappointingly high. Seventeen recent
studies (12,13,52,53,62-74) report a blunted diet-induced thermogenesis in the
obese, whereas eleven studies (75-85) did not observe a systematic difference
in diet-induced thermogenesis between the lean and the obese. According to
D'Alessio et al. (85) the difference, in results is not simply related to a
systematic difference in methodology between the studies supporting a role for
diet-induced thermogenesis in the etiology of obesity and studies denying such
a role.
Recently, it was reported that diet-induced thermogenesis would be reduced, in
particular, among older diabetic obese subjects (64). Such subjects are
insulin resistant and would have an impaired cellular transport of glucose,
causing lower rates of glucose oxidation and storage. Restoring the insulin
resistance by means of clamp studies showed that the thermogenic defect was
not related to a defect in energy metabolism at the cellular level, but to
impaired cellular glucose transport (89).
Controversy on the role of diet-induced thermogenesis is not only present with
respect to the impact of the degree of body fat content on diet-induced
thermogenesis, but for almost any other factor that has been studied for its
effect on diet-induced thermogenesis (90). A recent example is the impact of
the degree of physical activity on diet-induced thermogenesis (91-94). Whether
adaptive changes occur in diet-induced thermogenesis during overfeeding is
also unclear (5,41).
There is no disagreement on the primary determinants of diet-induced
thermogenesis. These are the level of energy intake and the nutrient
composition of food (80,83,85,93,95). With increasing energy intake,
proportion of protein or carbohydrates, diet-induced thermogenesis increases.
According to a recent study of D'Alessio et al. (85) energy intake is linearly
related to diet-induced thermogenesis. The results of the study of D'Alessio
et al. are confirmed by findings of Hill et al. (93).
Flatt (96) has provided a valuable account of the biochemistry of energy
expenditure associated with protein, fat or glucose ingestion. Diet-induced
thermogenesis would be highest for proteins, followed by carbohydrates and,
finally, by fats. The balance between storage of nutrients and oxidation of
nutrients would determine nutrient- or diet-induced thermogenesis. According
to Flatt, the energy expended in digesting, absorbing and transporting
nutrients is negligable in comparison with the metabolic processing of the
ingested nutrients. Evidence for this notion comes from a study that observed
-27-

no significant difference in diet-induced thermogenesis between enteral and
parenteral feeding (97).
Using Flatt's model of the biochemistry of energy expenditure associated with
nutrient ingestion, it can be predicted that metabolic states favoring storage
of nutrients prior to oxidation will enhance diet-induced thermogenesis.
Flatt's model offers a possibility to calculate from substrate balances the
amount of energy expended in postprandial metabolism of nutrients.
Various authors have shown that the amount of energy expended in the
postprandial metabolism of the ingested nutrients can not completely account
for the observed thermic response (98,99). Current theory on diet-induced
thermogenesis states that dieh-indnred thermogenesis is composed of iwo
distinct components, one, the 'obligatory' component, is involved in the
postprandial metabolism of the nutrients (16,17,95). Using Flatt's model the
size of the obligatory component can be calculated. In adddition to the
obligatory component, there would be a 'facultative' component. This component
is assumed to contribute about 30-40^percent to the total thermic response
(17,95). The biochemical basis of this facultative component is not yet
elucidated. Food ingestion, in particular carbohydrates, can stimulate the
activity of the sympathetic nervous system (83,100). It is assumed that this
activation leads to an increase in the turnover of catecholamines affecting,
in its turn, the rate of energy expenditure and consequently diet-induced
thermogenesis.
Empirical evidence for the two-component model of diet-induced thermogenesis
is given by the observed reduction in diet-induced thermogenesis (41) and
glucose-induced thermogenesis (99,101,102) in subjects infused by the
beta-blocker propanolol. It has, however, been difficult to correlate
diet-induced thermogenesis with plasma levels of norepinephrine (65,82,83).
Recently, it was observed, however, that the increment after meal ingestion in
plasma appearance rates of norepinephrine correlated significantly with
diet-induced thermogenesis (103).
It is not clear which factors determine the facultative component of
diet-induced thermogenesis. It has been suggested that personal
characteristics, ie, the degree of adiposity may be important (104), in
particular, the degree of insulin resistance that frequently accompanies the
obese state. In addition, the plane of nutrition may affect facultative
diet-induced thermogenesis. Overfeeding, in particular with carbohydrates,
would enhance this component (17). A third factor that might be involved in
the thermic response to food are the sensory characteristics of food (105).
-28-

The existence of a facultative component in diet-induced thermogenesis is
inferred from a difference in the observed thermic response to food ingestion
and the thermic response that should have been observed using Flatt's model to
calculate the energy expended in postprandial nutrient oxidation and storage
pathways. There are some problems here. The relevance of facultative
thermogenesis for energy expenditure under normal circumstances after normal
mixed meal ingestion has been questioned, since its presence has been inferred
predominantly from unphysiological clamp studies (106). Secondly, nutrient
utilization patterns as estimated from indirect calorimetry do not reflect
dynamic states in nutrient oxidation and storage, but only net storage and
oxidation (107). This means that turnover of a nutrient between its storage
and mobilisation forms can not be assessed with indirect calorimetry. If such
turnover would be high, this could increase thermogenesis. In this respect the
quantitation of lipogenesis from glucose is interesting. The energy expended
in transforming glucose to fat represents about 25 percent of the energy
content of the glucose (96). This indicates that transformation of a large
part of the ingested glucose to fat prior to oxidation will increase
diet-induced thermogenesis when compared to a situation where most of the
ingested glucose will be immediately oxydized. The indirect calorimetric
method for assessing nutrient utilization gives estimates of net lipogenesis
only. This means that concomitant fat synthesis and fat oxidation will not be
perceived from measurements of gaseous exchange and urinary nitrogen
excretion. Only the effects of fat synthesis in excess of fat oxidation, or of
fat oxidation exceeding fat synthesis on gaseous exchange will be measured.
This implies that estimating the amount of energy expended in the net
transformation of glucose into fat may underestimate the total amount of
energy expended in lipogenesis. Thus, estimation of the amount of energy
expended in the so called obligatory component of diet-induced thermogenesis
may be in error too. Consequently, the inference of the existence of a
facultative component representing 30-40 percent of total diet-induced
thermogenesis could also be wrong.
Figure 3 presents a 'model' for the current theory on the nature of
diet-induced thermogenesis.
Ingestion and digestion of food or nutrients cause the obligatory expenditure
of. energy. After absorption nutrients are transported to storage and oxidation
sites. Storage and oxidation of nutrients require the obligatory expenditure
of energy. Absorbed food may directly stimulate the sympathetic nervous system
(SNS) activity, or indirectly through insulin. Increased sympathetic nervous
-29-

system activity may lead to facultative thermogenesis. Insuline acts as
gatekeeper of the amount of glucose directed to immediate oxidation or
storage. Increased storage prior to oxidation will lead to increased
obligatory thermogenesis. Insulin may also directly act to stimulate
facultative thermogenesis.
Using this model we formulated hypotheses on the impact of various nutritional
and non-nutritional factors on diet-induced thermogenesis. In this thesis we
investigated the impact of ethanol, previous exercise, psychological stress,
palatability of food and carbohydrate overfeeding on diet-induced
FOOD/NUTRIENTS
INGESTION - DIGESTION
OBLIGATORY THERMOGENESIS
I
ABSORPTION
INSULIN
L SNS
ACTIVITY
FACULTATIVE THERMOGENESIS
_L
TRANSPORT
OXIDATION
STORAGE
OBLIGATORY THERMOGENESIS
DIET-INDUCED THERMOGENESIS
Figure 3. 'Model' of current theory on the nature of diet-induced thermogenesis (DIT). Thick lines indicate established contributions, interrupted lines indicate contributions still in doubt (SNS = sympathetic nervous system).
thermogenesis. Ethanol was assumed to increase nutrient storage and, hence,
diet-induced thermogenesis. In resting conditions, ethanol elimination by
-30-

oxidation would cause ingested nutrients to be directed not to oxidation
pathways, but to storage pathways. Prolonged exercise is known to deplete
carbohydrate storage in the body (108) and may also affect the activity of the
sympathetic nervous system (109). We expected that storage of carbohydrates
from food after previous exercise would be increased in order to restore the
tissues levels of glycogen, hence diet-induced thermogenesis would be
increased. Psychological stress was expected to increase diet-induced
thermogenesis by effects on the secretion of stress hormones, or by a
stimulation of the activity of the sympathetic nervous system. Palatability
was hypothetized to affect the early insulin rise, also known as the cephalic
insulin response. Meals with high palatability would evoke a relatively high
cephalic insulin response (110). The level of the cephalic insulin response is
positively associated with the total insulin réponse, at least in rats (111).
Loss of the early phase of insulin release has been shown in humans to impair
glucose tolerance and to reduce the thermic effect of infused glucose (112).
We expected that, due to increased insulin secretion, carbohydrate storage on
palatable meals would be increased and, hence, diet-induced themogenesis. In
addition, palatability could increase the activity of the sympathetic nervous
system with stimulatory effects on thermogenesis. Carbohydrate overfeeding was
expected to increase diet-induced thermogenesis in two ways. Firstly, by
affecting the state of the body's glycogen stores. Secondly, through
activation of the sympathetic nervous system. It was expected that the results
of our studies would enable us to refine the model on the nature of
diet-induced thermogenesis.
2.3.1.3. WORK-INDUCED THERMOGENESIS
Work-induced thermogenesis (WIT) is the energy expended above resting
conditions due to the performance of physical work. It is determined by the
type, duration and intensity of physical work. Physical activity is a much
more potent stimulus of energy expenditure compared to diet. Due to physical
activity the rate of resting energy expenditure can rise with a factor 10-20.
For the average individual, work-induced thermogenesis would contribute 15-30
percent to total daily energy expenditure (16,17). It is, however, difficult
to estimate accurately the energy expended in physical activity. This applies
not only to persons leading their normal lives, but also to persons whose
energy expenditure is studied in whole body calorimeters. In particular the
-31-

degree of spontaneous, relatively small, movements ('fidgeting') may be
quantitatively important as an effector of inter-individual differences in
energy requirements (28).
Dynamic muscular work, for example cycling, is generally performed with an
efficiency of 20-25 percent (113). Theoretically, differences in energy
requirements among individuals could be related to individual differences in
the amount and intensity of physical activity and in the efficiency of the
performance of physical work. An evaluation of differences in the amount and
intensity of physical activity of free-living persons is currently very
difficult. However, variation in work efficiency among individuals can be
assessed with standard laboratory tests. There is little evidence for
differences in work efficiency between the lean and the obese (114). The delta
efficiency of muscular work seems similar between the lean and the obese
(115). Delta efficiency is proposed as the best indicator of the efficiency of
the performance of physical work (116). The delta work efficiency is the
efficiency of work accomplished calculated by difference between two steady
state levels of work, whereas the net work efficiency is the work done by an
individual on an external system per unit of energy expended in the
performance of that work (14). Weight loss was reported to affect the net
efficiency of physical work, but not the delta efficiency (116).
It has been suggested that exercise would potentiate diet-induced
thermogenesis and that the obese would be defective in this respect (5). This
is another area of controversy on the impact of the degree of body fat content
on diet-induced thermogenesis. More research under strictly standardized
conditions seems necessary to settle this issue (114,115).
Recently, an interesting finding was reported. It was reported that African
women expended less energy in carrying loads than did their Caucasian
counterparts (117). The study of Maloiy et al. (117) does not give an answer
to the question whether this difference was the result of a higher work
efficiency of physical work among the African women compared to the Caucasian
women, or of behavioral differences between the groups in the way the loads
were carried.
2.3.1.4. MEASUREMENT OF ENERGY EXPENDITURE
Energy expenditure can be assessed by direct calorimetry, indirect calorimetry
and by noncalorimetric methods. I will not discuss these methods in depth in
-32-

this thesis. Recently, a few excellent reviews (107,118,119) have been
published on the measurement of human energy expenditure and of in vivo fuel
utilization. A few comments will suffice in this respect.
Direct calorimetry
Direct calorimetry involves the measurement of heat losses. This is the oldest
of the three techniques. It has been used since the time of Lavoisier at the
end of the 18th century. Direct calorimetry measures the sum of radiant heat
exchange and of convective -, conductive - and evaporative heat transfer. In a
resting subject the sum of these heat losses equals, in the long-run, the heat
released by metabolism in the body. Direct calorimetry has the disadvantage
that it can not be used to assess short-term effects of thermogenic stimuli on
heat exchange due to the relatively large heat storage capacity of the body.
For example, during feeding or short-term exercise a large part of the heat
that is generated is stored within the body. Only over a period of 24 hours or
longer the body will be in heat balance with its surroundings. Over prolonged
periods of time direct calorimetry provides the most accurate estimate of the
rate of energy expenditure. However, it is a less suitable technique for
assessing diet- or work-induced thermogenesis and it does not provide
information on in vivo fuel utilization.
Indirect calorimetry
Indirect calorimetry is the method by which metabolic rate is estimated from
measurements of oxygen consumption and carbondioxide production. When it is
assumed that all the oxygen consumed is used to oxydize degradable fuels and
all the carbondioxide thus produced is recovered, it is possible to calculate
the total amount of energy 'produced'. If, in addition the rate of nitrogen
excretion is known, indirect calorimetry can be used to quantitate nutrient,
ie, fuel or substrate, utilization patterns. Energy 'production' means in this
respect conversion of chemical energy of nutrients into chemical energy of
'energy-rich' substances, ie, ATP, plus loss of some energy as heat during the
oxidation process. Eventually, however, in a resting adult subject all energy
derived from the metabolism of food stuffs will be converted into heat. It is
essential to realise that in the long run direct and indirect calorimety will
give similar estimates of heat losses from the body. In the long run changes
in body temperature will cancel out and the rate of formation and degradation
-33-

of energy-rich bonds will be equal.
Indirect calorimetry can be used to assess acute effects of thermogenic
stimuli on metabolic heat production in the body. Since the body does not
posses an oxygen storage capacity of quantitative importance, oxygen
consumption will immediately rise in response to exposure of the organism to
thermogenic stimuli.
There is a variety of equations used to calculate metabolic rate from oxygen
consumption, carbondioxide production and urinary nitrogen excretion (118).
Differences between these formulas are quantitatively unimportant (118). They
are generally due to the use of slightly different constants for the amount of
oxygen used and carbondioxide produced during combustion in the body of
protein, fats and carbohydrates.
Two techniques based on indirect calorimetric principles are worthwhile to
mention. These are measurements of energy expenditure with indirect whole body
calorimeters, also known as respiration chambers, and with ventilated hood
systems. Respiration chambers are, in particular, suitable for studying total
daily energy expenditure of subjects or animals for one up to several days.
The ventilated hood system is useful for measuring the individual components
of total daily energy expenditure, ie, resting metabolic rate, diet- or
work-induced thermogenesis. The ventilated hood technique can be traced back,
at least, to Benedict in 1930 (120). However, the development of modern
physical gas analyzers, eliminating the time-consuming volumetric analysis of
gaseous exchange, and of modern physical flowmeters, ie, mass flowmeters, has
stimulated the construction and use of ventilated hood systems in metabolic
studies. Additional impetus for the use of ventilated hood systems came by the
recognition that indirect calorimetry can provide information on the type and
rate of substrate utilization in vivo. This type of information may be
important for gaining insight in patterns of nutrient assimilation in various
pathological states, for example, in diabetes and obesity (107).
Noncalorimetric methods
There is a variety of noncalorimetric methods (119) that can be used to
estimate energy expenditure in man. These methods are based on, for example,
the use of activity diaries, pulmonary ventilation or heart rate and
mechanical activity meters. A more recent development is the use of isotopic
dilution of doubly labelled water (121). This method was introduced in 1955 by
Lifson et al. (122) for the study of energy expenditure in small animals.
-34-

Until recently the cost of the isotope was too high to permit its use in
humans (123). However, in the 1980s the first publications appeared in which
energy expenditure was assessed in humans by means of the doubly labelled
water method (121,124,125). The principle of the method is to dilute the body 18
water component of a person with a known amount of D90 . Deuterium will label 18
the water pool of the body, whereas the 0 , in addition, will also label the
body's bicarbonate pool, due to the action of carbonic anhydrase. Deuterium 18
will leave the body by water output only and 0 will leave the body by water 18
plus carbondioxide output. As a consequence, the turnover in the body of 0
exceeds that of deuterium. The difference between the rates of deuterium and 18
0 turnover in the body water is used to calculate the carbondioxide
production rate (126). To convert the carbondioxide production rate to an
estimate of energy expenditure, the energy equivalent of carbondioxide has to
be used. Depending on the respiratory quotient of the metabolic mixture
oxydized in the body, the energy equivalent of carbondioxide may vary between
21.0 kJ and 27.7 kJ. If the dietary intake of the subject is estimated, and,
if the subject is in energy equilibrium during the period of measurement, the
respiratory quotient of the daily diet, also known as the food quotient, can
be used to derive an estimate of the energy equivalent of carbondioxide (118).
The major advantage of the doubly labelled water method for the assessment of
energy expenditure is its applicability for use in persons living their normal
lives (127). The use of the doubly labelled water method in free-living
subjects requires the use of various assumptions, for example, with respect to
steady state in water and energy balance of the subjects during the
experimental period, the respiratory quotient of the diet and the proportion
of water that is fractionated by evaporation at epithelial surfaces (118).
Opinions on the applicability on the doubly labelled water method vary.
Various authors regard the method as an exceptional technological advance that
permits accurate estimates of the rate of energy expenditure of free-living
adults (127,128). Other investigators are more cautious and argue that more
research is needed to establish the validity of various assumptions of the
method when applied to free-living individuals under various conditions of
climate, food intake, and physical activity (118). It should also be realised
that the doubly labelled water method gives an estimate of the average energy
expenditure during the period of measurement, usually 2-3 weeks. It is not
possible to measure 24-hours energy expenditure, day-to-day variability in
energy expenditure or to obtain information on the quantitative importance of
the various components of energy expenditure for total average energy
-35-

expenditure. In this respect a combination of the classical calorimetric
methods and the doubly labelled water method may be promising.
2.3.2. ENERGY INTAKE
In contrast to energy expenditure, which is a constant process, energy is
ingested only periodically at meal times and between meals during snacking. It
is generally assumed that the body controls its food intake, ie, its energy
intake, to meet current energy needs and to maintain an energy reserve for
times when food is unavailable. The literature on factors affecting the
regulation of food intake is enormous and will not be reviewed here in depth,
see for reviews Kissileff and Vanltallie (129), Nicholl et al. (130) or
Forbes (131). In this review I will dircuss briefly some theories on the
physiological control of food intake and the control of food intake in humans.
2.3.2.1. THEORIES ON THE PHYSIOLOGICAL CONTROL OF FOOD INTAKE
That food intake is under some physiological control is inferred from
observations on the relative consistency in daily or weekly food intake of
animals maintained on a diet of homogenous composition under constant ambient
temperature (132,133). These observations suggested the existence of a
physiological control system for food intake (134). It was hypothetized that
such a control system would correct deviations in daily energy balance in
order to maintain long-term energy balance. Additional support for the
existence of control of food intake came from the observations that food
intake in animals varied reciprocally with caloric dilution of food (135,136).
Evidence, that it was, in particular, the energy content of the food that was
controlled, was provided by experiments that showed compensation in food
intake when energy expenditure was varied (134,137). The existence of a
physiological control of food, ie, energy, intake in humans was inferred from
the observation that, although man may eat tons of food over the years, body
weight stays relatively constant (138).
Is the evidence for a physiological control of food intake sufficient? Two
comments can be made in this respect. Animals, ie, rats, can be easily overfed
by offering them a highly palatable 'cafetaria' diet (139). Secondly, relative
weight in man is not as constant as frequently is assumed. Gordon and Kannel
-36-

showed in a longitudinal study (the 'Framingham' study) that in adulthood,
body weight increases on average 10 kg over a period of 18 years (140). These
observations indicate that control of food intake in animals can be overruled
by environmental stimuli, ie, palatability of food. In humans some form of
physiological control of food intake is probably manifest, otherwise the
increase in weight during adulthood might have been even larger than the 10 kg
observed by Gordon and Kannel. The findings of Gordon and Kannel, however,
clearly show that the control of food intake in humans is probably not as
precise as previously thought (5).
When it is accepted that both humans and animals have some form of
physiological control of food intake, various theories may be used to explain
this control (134,141-144).
The homeostatic theories of the physiological control of food intake have
received most attention. In homeostatic theories it is proposed that a
variable is regulated and that certain effectors accomplish such regulations.
Homeostatic theories have been subdivided into two types. There are those
theories that propose that specific chemicals in the body are regulated
('chemostatted'), ie, fat ('lipostatted') (134), carbohydrates
('glucostatted') (141), or proteins ('aminostatted') (142), and those that
propose regulation of energy, or some function of it such as body temperature
('thermostatted') (143), or energy expenditure by metabolizing cells
('energostatted') (144). Nutrient specific homeostatic theories are now known
as the lipostatic, glucostatic and the aminostatic theories. The current
opinion is that these theories present a too limited account of the control of
such a complex phenomenon as food intake (145-148). However, a few decades ago
much research was carried out to validate the various theories. Therefore, I
will briefly mention the quintessence of each theory. The lipostatic theory
stated that depot fat was the regulated variable and that rates of food intake
and energy expenditure were its effectors (141). The glucostatic theory
proposed that utilization of glucose by privileged cells was regulated by
initiating feeding when utilization was low and inhibiting eating when
utilization was high (134). The aminostatic theory proposed that excesses and
deficiencies of plasma amino acids were responsible for the control of food
intake (142). An integration of the lipostatic, glucostatic and aminostatic
theories was the thermostatic theory which considered metabolic heat
production as the control of food intake (143). The thermostatic theory has
been further refined in the energostatic theory (144). The latter theory
states that the energy 'produced' by the metabolism of absorbed nutrients is
-37-

monitored to regulate food intake. Specific temperature receptors in the brain
would activate and terminate ingestive behavior.
The central problem in the validation of these theories has been to discover
the location of detectors and effectors for the homeostatic response. In the
past decades four anatomical sites have been suggested. About 30 years ago
Stellar stated the hypothalamocentric theory of the control of food intake
(149). It states that hunger is directly proportional to the output of a
lateral hypothalamic center, the 'hunger' centre. This center would elicit
feeding. Feeding would be inhibited by a ventromedial hypothalamic center, the
'satiety' center, as a result of specific postfeeding signals. Experimental
evidence for the dual center theory of hypothalamic control of food intake
came from observations that lesions of the lateral hypothalamus induced
hypophagia (150) and stimulation induced eating (151), whereas lesions of the
ventromedial hypothalamus induced hyperphagia (152) and stimulation inhibited
eating (153). In addition, evidence was obtained that glucose and free fatty
acids affected the neuronal activity in these areas, thus relating the dual
center theory to the chemostatic, ie, glucostatic and lipostatic theories
(134,141).
It is now generally accepted that the concept of the hypothalamus as having
two distinct control centres is a gross oversimplification (145). The concept
of discrete hunger and satiety centres has been replaced by one of diffuse
excitatory and inhibitory systems (145). The 'satiety' centre has been
associated with two major tracts, ie, the serotoninergic pathway, which
originates in the raphe nuclei of the pontine-midbrain area and passes through
the ventromedial hypothalamus, and the ventral adrenergic bundle which passes
through the periformical area in the vicinity of the ventromedial
hypothalamus. The hunger centre is associated with the dopaminergic
nigrostriatal tract.
Another suggested major site for homeostatic control of food intake is the
liver (154). According to this theory, hunger is the result of a decrease in
the liver glycogen reserves, which is signaled to the brain by discharge from
glucoreceptive hepatocytes. A role for the liver in the control of food intake
is supported by the fact that intraportal injection of glucose inhibits
feeding while equivalent doses elsewhere are less effective (155).
The gastro-intestinal system has also been proposed as a major site for
regulation of food intake (156-158). According to this theory, neural and
humoral signals arise in the gastro-intestinal tract that inhibit food intake.
Experimental evidence for this model came from observations that sham-feeding
-38-

was inhibited by the infusion of food in the small intestine (156). In
addition, evidence for a role of the gastro-intestinal tract in the control of
food intake came from observations on the satiating effect of the gut hormone
cholecystokinin (159), which is probably neuronally mediated by gastric vagal
efferents (146). Other possible mediators of the satiating effect of food in
the small intestine are somatostatin and pancreatic glucagon (146).
It seems that various factors are involved in the physiological control of
food intake. The modern theory of the control of food intake consists of a
feedback system in which various signals derived from the gastro-intestinal
tract, liver, the circulating energy, ie, nutrient, pool, depot fat or metabo
lizing cells, transmit information to a central system, ie, the brain, which
is responding to and integrating information from the various peripheral com
ponents (148). The brain also responds to and integrates external information.
The control of food intake has been diagrammatically presented in figure 4.
In this system peripheral signals act as satiety signals, some time after food
intake these signals become attenuated and food intake is terminated. Food
intake is initiated by putative hunger signals initiating in the brain. There
has been an intensive search to identify the physiological correlates of
putative satiety and hunger signals. Currently, a variety of signals is known
that act satiating, ie, act to terminate feeding or act to suppress appetite
(145,146). These are cholecystokinin, bombesin, calcitonin,
corticotropin-releasing factor, thyrotropin-releasing hormone, neurotensin and
serotonin. The recent search for signals that would initiate hunger has shown
that, in particular, opioid peptides would act as hunger signals (145). An
interesting hypothesis is that obesity, as effected by overeating, would be
the result of auto-addiction to endogenous opioid peptides (145).
Concluding I can state that the physiological control of food intake is
complex and that no factor in isolation seems to offer sufficient explanation
for the complex behavior of food intake.
-39-

COGNITIVE AND EXTEROCEPTIVE INFLUENCES
DEPOT
FAT
RATE OF TOTAL ENERGY INPUT
SMALL INTESTINE
NCONTROlH L
CIRCULATWG ENERGY
POOL
METABOLIZING CELLS "£-
RATE OF TOTAL
ENERGY OUTPUT
Figure 4. 'Model' of current homeostatic theory on the control of food intake in humans (148). The components of the overall system are shown as blocks, which correspond to quantities of 'fuel' within anatomical or physiological entities: the stomach, the small intestine, the liver, the circulating energy pool, the adipose tissue depot, and the total mass of metabolically active cells. The blocks are connected to one another by solid lines, which represent the flow of substrate between components. Control of flow rates are represented by valve symbols. In this diagram, the rate of flow of energy into the body is shown as being under the control of the brain, which is responding to and integrating information (represented by the dashed lines) transmitted from various components of the system. The asterisk at the first valve symbol indicates that the rate of energy intake is not constant but occurs instead in discrete packets (meals) whose onset and termination are controlled by the brain in response to a variety of inputs (adapted from Van Itallie and Kissileff (18)).
2.3.2.2. CONTROL OF FOOD INTAKE IN HUMANS
In humans food intake is affected not only by physiological factors, in
particular, energy needs, but also by non-physiological factors. A variety of
-40-

non-physiological signals may act on the brain to terminate or to initiate
feeding (147). These non-physiological factors may differ in origin, ie,
hedonic (palatability, taste, texture, odor), social (culture, religion),
psychological (learned preferences and aversions), environmental
(temperature), economic (cost, availability) or pharmacological (anorectants).
Garrow concluded that 'In man control of food intake is complex, and the
primitive hypothalamic reflexes are so buried under so many layers of
conditioning, cognitive and social factors that they are barely discernible'
(160). The question may rise whether food intake in humans is still under
physiological control or whether it is largely determined by exogenous
factors.
The importance of physiological control of food intake in newborns was
demonstrated by Fomon et al. (161,162). In newborns the effect of
non-physiological factors on the control of food intake may be assumed to be
of negligble importance when compared to in adults. Fomon et al. (161,162)
showed in studies on the food intake in newborns that babies fed less
energy-dense milk adjusted their intake and ate more. The compensation was
remarkably well, ie, between 80 percent and 100 percent. In an elegant study
using normal foods, Porikos et al. (163) showed that three days after energy
content of the diet had been covertly reduced by substituting the synthetic
sweetener aspartame in some food items for sucrose, lean adults subjects,
studied in a metabolic ward, started to compensate for the induced energy
deficit. Compensation was not complete, but stabilized after some days at 85
percent of the energy intake observed in the control period. In a subsequent
study of the same group with adult obese and lean subjects, no difference in '
caloric compensation between lean and obese subjects was observed (164). These
results indicate some form of control of energy intake in adults. Similar
results were obtained by Durrant et al. (166). Since in the studies of Porikos
et al. the subjects were unaware of the caloric dilution, the response of food
intake to the caloric dilution may be considered to be physiologically in
origin. It can not be discerned from Porikos et al.'s studies whether the
subjects were kept on a weight maintenance diet at the start of the study.
When it is assumed that subjects were fed their energy requirements during the
control period, the results suggest that a covert reduction in the energy
density of the diet could be beneficial for weight reduction. However, in
Porikos et al's studies no control group was investigated to estimate a
spontaneous gradual decline in food intake due to adaptation to the
experimental conditions.
-41-

Little is known about the relative contribution to the control of food intake
of physiological and non-physiological factors in free-living subjects. This
is a subject that should be studied more intensively.
2.3.3. ENERGY BALANCE
Two major components are involved in the regulation of energy balance: energy
intake and energy output. According to the Law of Conservation of Energy a
complete balance between these two components must exist. The components of
energy balance, its control and its relation to obesity will be discussed.
2.3.3.1. ENERGY BALANCE EQUATION
The energy balance equation can be expressed in the following form (166):
gross energy of food = energy of faeces
+ energy of urine
+ energy of methane
+ metabolic heat produced
+ retrievable work
+ energy retained
Not all food ingested is entirely digested, resulting in a loss of energy in
the faeces. Faeces also contains endogenous material from the alimentary
tract. The difference between the energy content of the food and the energy
content of the faeces is therefore referred to as the apparently digested
energy of food. Some food constituents are metabolized by the bacterial flora
in the colon. This may lead to the production of small amounts of combustible
gasses, ie, methane, representing a loss of energy for the individual. The
remaining part of digestible energy are nutrients that are absorbed into the
blood stream to be metabolized. The metabolism of protein results in some
waste products that are lost as energy in urine. The remaining energy is known
as the metabolisable energy of food. This metabolisable energy (ME) is used
after oxidation for, respectively, basal energy requirements, indicated by
resting ('basal') metabolic rate, diet-induced thermogenesis, work-induced
thermogenesis and, sometimes, for cold-induced thermogenesis. Under
thermoneutral conditions, or in subjects well insulated by clothing against
-42-

the cold, the latter process is probably of negligable importance for daily
energy expenditure. In very limited circumstances part of the energy expended
during physical work is retrieved for use later (retrievable work), ie, in
winding up a spring. Heat loss is then delayed until the spring is released.
Finally, part of the metabolisable energy may be retained in the body for
growth, production of milk, foetus, and also for an increase in the body's
energy reserves, ie, fat stores.
The energy balance equation is usually presented in a slightly different form:
metabolisable energy intake (ME) - energy expenditure (EE) = gain/loss in
body's energy reserves (/\ER), ie,
ME - EE = /\ER, which equals
ME - (RMR + DIT + WIT) = ^ E R
In weight stable persons the metabolisable energy intake matches energy
expenditure and no net change in the body's energy stores is observed. The
question how the body preserves its energy balance without significant net
storage or loss of energy from the body continues to be of interest to
investigators.
2.3.3.2. CONTROL OF ENERGY BALANCE
It follows from the energy balance equation that an increase in energy intake
relative to energy expenditure produces energy surfeits, increased fat storage
and eventual gain in body weight. If, on the other hand energy expenditure
exceeds energy intake, energy reserves are lost from the body, fat stores are
mobilized and body weight decreases.
Which factors contribute to the development of a new balance between energy
intake and energy output without any net change in fat stores?
Figure 5 and figure 6 show the changes by which the body will gain a new
balance between energy intake and energy output in a situation of energy
imbalance, either caused by a reduced food intake, ie, a negative energy
balance (Figure 5) or by an increase in food intake, ie, a positive energy
balance (Figure 6 ) ,
In negative energy balance, energy requirements are lowered. A decrease in
body weight reduces the cost of weight bearing activities. The loss of
fat-free mass which accompanies weight loss causes a lowering of resting
-43-

NEGATIVE BALANCE E0UT> EIN
light \
energy cost i of activity i
r -l'metabolic" T efficiency
level of I activity1)1
DIT J work i
efficiency'
RMR {
> t
WIT |
ENERGY BALANCE E0ur =E,N
Figure 5. 'Model' of impact of a negative energy balance on energy expenditure. Thick lines indicate established contributions. Interrupted lines indicate contributions still in doubt (RMR = resting metabolic rate; DIT » diet-induced thermogenesis; WIT = work-induced thermogenesis).
In negative energy balance, energy requirements are lowered. A decrease in
body weight reduces the cost of weight bearing activities. The loss of
fat-free mass which accompanies weight loss causes a lowering of resting
metabolic rate. The reduction in food intake decreases diet-induced
thermogenesis. Individuals may show (facultative) behavioral changes that
reduce the amount of energy expended in physical activities.
A further reduction in energy expenditure could be caused by an increase in
the efficiency of energy utilization, ie, in 'metabolic' efficiency. The
latter effect would become manifest in 'unexpected' (not accounted for by the
processes, headed under 1, 2 and 3) decreases in resting metabolic rate,
diet-induced thermogenesis and work-induced thermogenesis.
-44-

Recently, it was shown, however, that the reduction in energy expenditure
during weight loss could be completely accounted for by the reduction in body
weight and body composition, decreasing the cost of physical activity and of
resting metabolic rate, and by the reduced energy intake, decreasing the
amount of energy expended after food ingestion (54). There was no need to
postulate the existence of an increase in 'metabolic' efficiency. However,
Leibel and Hirsch presented evidence for an increase in 'metabolic' efficiency
when they found that post-obese had significantly lower energy requirements in
comparison to lean controls (167). However, in their study no measurements
were performed of resting metabolic rate, diet-induced thermogenesis or work
efficiency. Recently, Geissler et al. (168) showed that post-obese women had
15 percent lower daily energy expenditure rates when compared to lean
controls, matched in body composition and degree of physical activity to the
post-obese. These findings do suggest the existence of some change in the
efficiency of energy utilization in the post-obese. Such a change would
involve environmentally-induced alterations in the partitioning of energy
transformations in the body into those leading directly to heat and those
leading to work and subsequent heat and, secondly, in the efficiency of the
transformation of chemical energy in food stuffs to internal work. It is clear
that more research is needed, not only in post-obese, to investigate whether
humans show 'unexpected' metabolic responses to a negative energy balance.
In developed countries with its calorie pollution a situation where energy
intake exceeds energy expenditure is more frequently encountered. Figure 6
shows the way the body reacts to a positive energy balance. There is an
increase in body weight, usually accompanied by an increase in the size of the
metabolically 'active' mass, ie, in fat-free mass. The effects of energy
overnutrition on body weight and body composition increase the amount of
energy expended in weight bearing activities and at rest. Since more energy is
ingested, diet-induced thermogenesis is increased. In addition, behavioral
adaptation favoring expenditure of energy in physical activity may occur.
Similar to the situation of an energy deficit, the question remains whether
there are additional mechanisms favoring expenditure of energy. The existence
of such mechanisms has been postulated for the first time by Neumann (169)
when he introduced the 'Luxus consumption' phenomenon. Many years later the
results of the Vermont overfeeding studies of the group of Sims and Horton
supported the existence of such mechanisms (170). In these studies it was
observed that weight gain was less than the weight loss expected to occur on
the basis of the energy surplus in the diet (179). Evidence for the existence
-45-

POSITIVE BALANCE EIN > E0UT
weight f
energy costi of activity I
j I metabolic" 1 " f efficiency
level of act
ivel of i ctivity*
<! i
± i worK I
D'T j efficiency!
RMR f
t t
WIT t
ENERGY BALANCE E0UT = E m
Figure 6. 'Model' of impact of a positive energy balance on energy expenditure. Thick lines indicate established contributions. Interrupted lines indicate contributions still in doubt. (RMR = resting metabolic rate; DIT = diet-induced thermogenesis; WIT = work-induced thermogenesis).
in humans of metabolic responses to energy overnutrition favoring energy
expenditure is, however, far from conclusive (17,160).
Overfeeding-induced changes in thyroid status and the activity of the
sympathetic nervous system could decrease the efficiency of uncoupled
metabolism or of coupled metablism, ie, increase the use of ATP in so-called
substrate or round-about cycles, or ion pumping. In small rodents it has been
found that overfeeding decreases the efficiency of oxydative fosforylation in
brown adipose tissue (171), although this has been disputed as well (172).
When thermogenesis increases disproportionately during overfeeding, this could
-46-

act as a protective response to overeating.
The question whether the obese are defective in the capacity to show a
protective response to energy overnutrition continues to be a topic of
interest both to clinicians and to investigators (17). Another interesting
question is whether the change in the composition of the diet over the last
century has affected the capacity to show a protective response to energy
overnutrition. The major change in composition of the diets of people living
in developed countries has been the increase in the proportion of total energy
intake delivered by fat (173). The proportion of energy delivered by fat in
the diet has increased relative to calories derived from carbohydrates. This
change in the composition of the diet may be important for overall energy
balance for a variety of reasons. Firstly, carbohydrates generally evoke a
higher thermic effect in comparison to fats (95). Converting ingested lipids
to depot fat will incur a loss of energy from the body of about 4 percent of
the ingested fats. In transforming carbohydrates to depot fat about 25 percent
of the energy ingested, will be lost from the body as heat (96). It may be
hypothetized that energy surfeits with a relatively high fat content will lead
to higher fat storage in the body compared to similar energy surfeits with a
higher carbohydrate content. In addition, carbohydrate intake may increase the
activity of the sympathethic nervous system relative to fat intake (17,100).
Empirical evidence for the importance of the fat/carbohydrate ratio in the
diet in determining overall energy balance and body weight was given by
Lissner et al. (174). Lissner et al. showed that subjects on an ad libitum
diet with a fat content of 15-20 percent reduced calorie intake in comparison
to a diet with 30-35 percent or a diet with 40-45 percent fat. Body weight was
also reduced. It is not possible to partition the body weight loss observed in
the study of Lissner et al. in a component due to decreased energy intake and
a component due to increased energy expenditure. However, the results suggest
that habitual unrestricted consumption of low-fat, ie, of calorically diluted,
diets may be an effective approach to weight control.
2.3.3.3. ENERGY BALANCE AND OBESITY
Obesity is a situation with an increased storage of fats in the body. Obesity
develops when energy intake exceeds energy expenditure for a prolonged period
of time. A simple conclusion from this observation is, that the obese are
-47-

overindulgers who do not physiologically control food intake as precisely as
the lean. Experimental evidence for this conclusion is, however, lacking
(164,165). In absence of a clear defect in the obese of the (short-term)
physiological control of food intake (164,165), it seems justified to conclude
that the obese eat more than their lean counterparts, for example, due to some
particular susceptibility to food intake inducing non-physiological factors.
Surprisingly, however, evidence for increased food intakes among the obese
compared to the lean is far from conclusive (175-179). This seemingly
paradoxical finding could be related to methodological problems of accurately
quantifying food intake in humans. It is well known that food intake may show
considerable intra-individual variation, implying that repeated assessments of
food intake may be important in comparisons of food intake between relatively
small groups of lean and obese subjects (180,181). Another problem in
assessing food consumption in free-living persons is that the simple act of
monitoring food intake may affect food intake, possibly with a differential
effect on the lean and the obese. It has been suggested that the obese, when
monitored for their food intake, tend to underestimate their food intake to a
greater extent when compared to lean subjects (127).
In the absence of clear indications that the obese would overeat, research has
shifted its attention to the study of energy expenditure in obesity. If the
obese would have an increased 'metabolic' efficiency, this could explain their
obesity while ingesting similar amounts of energy as the lean.
The hypothesis of an increased efficiency of food energy use in the obese has,
however, been difficult to prove. In addition, there are no indications for
gross differences in the degree of physical activity between obese and lean
subjects (104).
Since, according to the First Law of Thermodynamics, energy can not be
created, there must be some explanation for these paradoxical results. If
obesity is the result of an increased efficiency of food energy use, the
absence of finding an increased efficiency in the obese state, indicates that
obesity is an adaptation to a metabolic state favoring energy retention. Only
prospective studies can provide a definite answer to this question.
Alternatively, studying obese after weight loss could be used to solve this
problem, but, only under the assumption that a change in metabolic state from
obese to post-obese has similar effects on the body's energy economy compared
to a change from a pre-obese to an obese state. Secondly, if among lean and
among obese there are individuals with differences in 'metabolic' efficiency,
comparing heterogenous groups of lean and obese individuals may not reveal any
-48-

significant differences in energy expenditure between both groups. A third
explanation would be that the obese and the lean are equally efficient in use
of food energy, but methodological problems in obtaining a representative and
accurate estimate of habitual food intake, or of energy expenditure, in
particular, due to physical activity, among the obese or the lean lead to
unexpected results. Finally, a systematic difference in digestibility of food
between the lean and the obese could be important for the etiology of obesity.
If digestibility would be relatively low in the lean and relatively high in
the obese this could favor energy retention in the obese. However, studies
pertaining to this subject have shown that there are no differences in
digestibility between the lean and the obese (182,183).
Whatever the cause of obesity is, it can be predicted that any investigator
looking for the 'holy grail' of the etiology of obesity will encounter
numerous problems in proving his or her hypothesis. Obesity is probably
multifactorial in origin. It may develop due to energy retention caused by
some form of energy overnutrition, aggravated in certain groups of the obese
by an increased susceptibility to store fat as a result of relatively lowered
rates of energy expenditure. Evidence for this hypothesis on the etiology of
obesity comes from an elegant study by Ravussin and colleagues (184). Ravussin
et al. recently showed in a prospective study that a reduced rate of energy
expenditure is a risk factor for body weight gain. A reduced rate of energy
exenditure could, however, in their study, account only for about 35 percent
of the energy retained in body weight gain. The extent to which physiological
and environmental factors contribute to the supposed hyperphagia or lowered
rates of energy expenditure as well as how these factors interrelate with the
genetic make-up of a pre-obese individual remain to be investigated. That the
genetic make-up of a person may be important in the response to energy
overnutrition of energy expenditure was shown by Poehlman et al. (185).
2.4. CONCLUSIONS
The study of human energy exchange has experienced a revival the last 2-3
decades. During this period substantial insight was gained in factors
affecting energy output. Salient findings have been that individuals can
differ in their efficiency of energy utilization and that a reduced rate of
energy expenditure can contribute to body weight gain in free-living
-49-

individuals. However, the nature and magnitude of inter-individual differences
in the efficiency of energy utilization as well as their relation to 'nature'
and 'nurture' are largely unknown.
REFERENCES
1. Rubner M. Die Quelle der Thierschen Warme. Zeitschrift für Biologie 1894;30:73-142.
2. Atwater WO, Benedict FG. Experiments on the metabolism of energy and matter in the human body. United States Department of Agriculture. Office of Experimental Stations, Bulletin 136, 1903.
3. Krebs HA, Johnson WA. The role of citric acid in intermediate metabolism in animal tissues. Enzymologia 1937;48:148-56.
4. Mitchell P. Coupling of phosphorylation to electron and hydrogen transfer by a chemi-osmotic type of mechanism. Nature 1961;191:144-8.
5. Brobeck JR. Neural regulation of food intake. Ann NY Acad Sei 1955;63:44-55.
6. Miller DS, Mumford P, Stock MJ. Gluttony 2. Thermogenesis in overeating man. Am J Clin Nutr 1967;20:1223-9.
7. James WPT, Trayhurn P. An integrated view of the metabolic and genetic basis for obesity. Lancet 1976;2:770-2.
8. Garrow JS. The regulation of energy expenditure in man. In: Bray GA, ed. Recent advances in obesity research: II. London: Newman Publishing LTD, 1978:200-10.
9. Thurlby PL, Trayhurn P. The role of thermoregulatory thermogenesis in the development of obesity in genetically obese (ob/ob) mice pair fed with lean siblings. Br J Nutr 1979;42:377-85
10. Contaldo F. The development of obesity in genetically obese rodents. In: Cioffie LA, James WPT, Van Itallie TB, eds. The body weight regulatory system: normal and disturbed mechanisms. New York: Raven Press, 1981:237-42.
11. Rothwell NJ, Stock MJ. A role for brown adipose tissue in diet-induced thermogenesis. Nature 1979;281:31-5.
12. Kaplan ML, Leveille GA. Calorigenic response in obese and nonobese women. Am J Clin Nutr 1976;29:1108-13.
13. Pittet P, Chappuis P. Acheson K, de Techtermann F, Jéquier E. Thermic effect of glucose in obese subjects studied by direct or indirect calorimetry. Br J Nutr 1976;35:281-92.
14. Schutz Y. Glossary of energy terms and factors used for calculations of energy metabolism in human studies. In: Van Es AJH, ed. Human energy metabolism: physical activity and energy expenditure measurements in epidemiological research based upon direct and indirect calorimetry. Euronut report no. 8. Wageningen: Stichting Nederlands Instituut voor de Voeding, 1985:169-81.
15. Schutz Y, Bessard T, Jéquier E. Diet-induced thermogenesis measured over e whole day in obese and nonobese women. Am J Clin Nutr 1984;40:542-552.
16. Woo R, Daniels-Kush R, Horton ES. Regulation of energy balance. Ann Rev Nutr 1985;5:411-33.
17. Sims EAH, Danforth E. Expenditure and storage of energy in man. J Clin Invest 1987;79:1019-25.
-50-

18. Grande F. Energy expenditure of organs and tissues. In: Kinney JM, ed. Assessment of energy metabolism in health and disease. Columbus Ohio: Ross laboratories, 1980:88-92.
19. Benedict FG. Factors affecting basal metabolism. J Biol Chem 1915; 20:263-99.
20. Boothby WM, Berkson J, Dunn HL. Studies of the energy of metabolism of normal individuals: a standard for basal metabolism with a nomogram for clinical application. Am J Physiol 1936;116:468-84.
21. Miller AT, Blythe CS. Lean body mass as a metabolic reference standard. J Appl Physiol 1953;5:311-9.
22. Keys A, Taylor HL, Grande F. Basal metabolism and age of adult man. Metabolism 1973;22:579-87.
23. Halliday D, Hesp R, Stalley SF, Warwick P, Altman DG, Garrow JS. Resting metabolic rate, weight, surface area and body composition in obese women. Int J Obes 1979;3:1-6.
24. Ravussin E, Burnand B, Schutz Y, Jéquier E. Twenty-four hour energy expenditure and resting metabolic rate in obese, moderately obese, and control subjects. Am J Clin Nutr 1982;35:466-73.
25. Owen OE, Kavle E, Owen RS, Polansky M, Caprio S, Mozzoli MA, Kendrick ZV, Bushman MC, Boden G. A reappraisal of caloric requirements in healthy women. Am J Clin Nutr 1986;44:1-19.
26. Owen OE, Holup JL, D'Alessio DA, Craig ES, Polansky M, Smalley KJ, Karle EC, Bushman MC, Owen LR, Mozzoli MA, Kendrick ZV, Boden GH. A reappraisal of the caloric requirements of men. Am J Clin Nutr 1987;46:875-85.
27. Bogardus C, Lillioja S, Ravussin E, Abbott W, Zawadzki JK, Young A, Knowler WL, Jacobowitz R, Moll PP. Familial dependence of the resting metabolic rate. N Engl J Med 1986;315:96-100.
28. Ravussin E, Lillioja S, Anderson TE, Christin L, Bogardus C. Determinants of 24-hour energy expenditure in man: methods and results using a respiration chamber. J Clin Invest 1986;78:1568-78.
29. Lukaski HC. Methods for the assessment of human body composition: traditional and new. Am J Clin Nutr 1987;46:537-56.
30. Danforth E. The role of thyroid hormones and insulin in the regulation of energy metabolism. Am J Clin Nutr 1983;38:1006-17.
31. Smith TJ, Edelman IS. The role of sodium transport in thyroid thermogenesis. Fed Proc 1979;38:2150-63.
32. Biron R, Burger A, Clinet A, Clausen T, Dubois-Ferrière R. Thyroid hormones and the energetics of active sodium-potassium transport in mammalian skeletal muscles. J Physiol (London) 1979;279:47-60.
33. Moore J. Stimulation of Na:H exchange by insulin. Biophys J 1981;33:203-10.
34. Horwitz BA. Cellular events underlying catecholamine-induced thermogenesis: cation transport in brown adipocytes. Fed Proc 1979;38:2170-6.
35. Landsberg C, Saville ME, Young JB. Sympathoadrenal system and regulation of thermogenesis. Am J Physiol 1984-247:El81-9.
36. Shulman Gl, Ladenson FW, Wolfe MH, Ridgway EC, Wolfe RR. Substrate cycling between gluconeogenesis and glycolysis in euthyroid, hypothyroid and hyperthyroid man. J Clin Invest 1985;76:757-64.
37. Danforth E Jr, Horton ES, Sims EAH. Dietary-induced alterations in thyroid hormone metabolism during overnutrition. J Clin Invest 1979;64:1336-47.
38. Vagenakis AG, Portnay GI, O'Brian JT. Effect of starvation on the production and metabolism of thyroxine and triiodothyronine in euthyroid obese patients '. J Clin Endocrinol Metab 1977;45:1305-8.
39. De Haven J, Sherwin R, Hendler R, Felig P. Nitrogen and sodium balance and sympathetic-nervous system activity in obese subjects treated with a low calorie protein or mixed diet. N Engl J Med 1980;302:477-82.
-51-

40. O'Dea K, Esler M, Leonard P, Stockigt JR, Nestel P. Noradrenaline turnover during under- and overeating in normal weight subjects. Metabolism 1982;31:896-9.
41. Welle S, Campbell RG. Stimulation of thermogenesis by carbohydrate overfeeding: Evidence against sympathetic nervous system mediation. J Clin Invest 1983;71:916-25.
42. Apfelbaum M, Bostsarron J, Lacatis D. Effect of caloric restriction and excessive caloric intake on energy expenditure. Am J Clin Nutr 1971;24:1405-9.
45. Garrow JS, Durrant ML, Mann S, Stalley SF, Warwick PM. Factors determining weight loss in obese patients in a metabolic ward. Int J Obes 1978;2:441-7.
46. Bray GA. Effect of caloric restriction on energy expenditure in obese patients. Lancet 1969;2:397-9.
47. Keys A, Brozek J, Henschel A, Michelsen 0, Taylor HL. The biology of human starvation. Minneapolis: University of Minnesota Press, 1950.
48. Grande F, Anderson J, Keys A. Changes of basal metabolic rate in man in semistarvation and refeeding. J appl Physiol 1958;1:230-8.
49. Doré C, Hesp R, Wilkins D, Garrow JS. Prediction of energy requirements of obese patients after massive weight loss. Hum Nutr:Clin Nutr 1982;36C:41-8.
50. Welle L, Amatrada JM, Forbes GB, Lockwood DH. Resting metabolic rates of obese women after rapid weight loss. J Clin Endocrinol Metab 1984;59:41-4.
51. Barrows K, Snook JT. Effect of a high-protein, very-low-calorie diet on resting metabolism, thyroid hormones, and energy expenditure of obese middle-aged women. Am J Clin Nutr 1987;45:391-8.
52. Bessard T, Schutz Y, Jéquier E. Energy expenditure and postprandial thermogenesis in obese women before and after weight loss. Am J Clin Nutr 1983;38:680-93.
53. Den Besten C, Vansant G, Weststrate JA, Deurenberg P. Resting metabolic rate, and diet-induced thermogenesis in abdominal and gluteal-femoral obese women before and after weight reduction. Am J Clin Nutr 1988;47:840-7.
54. Ravussin E, Burnand B, Schutz Y, Jéquier E. Energy expenditure before and during energy restriction in obese patients. Am J Clin Nutr 1985;41:753-9.
55. Rozen R, Abraham G, Falcon R, Apfelbaum M. Effects of a 'physiological' dose of triiodothronine on obese subjects during a protein sparing diet. Int J Obes 1986;10:303-12.
56. Fontaine E, Savard R, Tremblay A, Després JP, Poehlman E, Bouchard C. Resting metabolic rate in monozygotic and dizygotic twins. Acta Genet Med 1985;34:41-7.
57. Sjöström L. A review of weight maintenance and weight changes in relation to energy metabolism and body composition. In: Hirsch J, Vanltallie TB, eds. Recent advances in obesity research: IV. London: John Libbey, 1985:82-94.
58. Rubner M. Die Gesetze des Energie-verbrauchs bei der Ernährung. Leipzig and Vienna: Deuticke, 1902.
59. Wang CC, Strouse S, Saunders AD. Studies on the metabolism of obesity. Ill The specific dynamic action of food. Arch Int Med 1924;34:573-83.
60. Mason EH. Obesity and thinness: studies on the specific dynamic action of protein in them. Northwest Med 1927;26:143.
61. Strang JM, McClugage MB. The specific dynamic action of food in abnormal states of nutrition. Am J Med Sei,-1982:49-81.
62. Shetty PS, Jung RT, James WPT, Barrand MH, Callingham BA. Postprandial thermogenesis in obesity. Clin Sei 1981,60:519-25.
63. Zed CA, James WPT. Thermic response to fat feeding in lean and obese subjects. Proc Nutr Soc 1982;41:32A (abstract).
-52-

64. Golay A, Schutz Y, Meyer HU, Thiebaud D, Curchod B, Meader E, Felber JP, Jéquier E. Glucose-induced thermogenesis in nondiabetic and diabetic obese subjects. Diabetes 1982;31:1023-28.
65. Schwartz RS, Halter JB, Bierman EL. Reduced thermic effect of feeding in obesity: role of norepinephrine. Metabolism 1983;32:114-7.
66. Ravussin E, Bogardus C, Schwartz RS, Robbins DC, Wolfe RR, Horton ES, Danforth E, Sims EAH. Thermic effect of infused glucose and insulin in man. J Clin Invest 1983;72:893-902.
67. Segal KR, Presta E, Gutin B. Thermic effect of food during graded exercise in normal weight and obese men. Am J Clin Nutr 1984;40:995-1000.
68. Schutz Y, Golay A, Felber JP, Jéquier E. Decreased glucose-induced thermogenesis after weight loss in obese subjects: a predisposing factor for relapse of obesity? Am J Clin Nutr 1984;39:380-7.
69. Bogardus C, Lillioja S, Mott D, Zawadzki J, Young A, Abbott W. Evidence for reduced thermic effect of insulin and glucose infusions in Pima Indians. J Clin Invest 1985;75:1264-9.
70. Segal KR, Gutin B, Nyman AM, Pi-Sunyer FX. Thermic effect of food at rest, during exercise, and after exercise in lean and obese men of similar body weight. J Clin Invest 1985;76:1107-12.
71. Segal KR, Gutin B, Albu J, Pi-Sunyer FX. Thermic effects of food and exercise in lean and obese men of similar lean body mass. Am J Physiol 1987 252:Ell0-7.
72. Swaminathan R, King RFGJ, Holmfield J, Siwek RA, Baker M, Wales JK. Thermic effect of feeding carbohydrate, fat, protein and mixed meal in lean and obese subjects. Am J Clin Nutr 1985;42:177-81.
73. Molnar D, Varga P, Rubecz I, Hamar A, Mestyan J. Food-induced thermogenesis in obese children. Eur J Pediatr 1985;144:27-31.
74. Shetty PS, Jung RT, James WPT. Reduced dietary-induced thermogenesis in obese subjects before and after weight loss. Proc Nutr Soc 1979;38:87A (abstract).
75. Bradfield RB, Jordan MH. Relative importance of specific dynamic action in weight-reduction diets. Lancet 1973;2:640-3.
76. Zahorska-Markiewicz B. Thermic effect of food and exercise in obesity. Eur J Appl Physiol 1980;44:231-5.
77. Felber JP, Meyer HU, Curchod B, Iselin HU, Rouselle J, Maeder E, Pahud P, Jéquier E. Glucose storage and oxidation in different degrees of human obesity measured by continuous indirect calorimetry. Diabetologia 1981;20:39-44.
78. Sharief NN, Macdonald I. Differences in dietary-induced thermogenesis with various carbohydrates in normal and overweight men. Am J Clin Nutr 1982;35:267-72.
79. Welle SL, Campbell RG. Normal thermic effect of glucose in obese women. Am J Clin Nutr 1983;37:87-92.
80. Nair KS, Halliday D, Garrow JS. Thermic response to isoenergetic protein, carbohydrate or fat meals in lean and obese subjects. Clin Sei 1983;65:307-12.
81. Blaza S, Garrow JS. Thermogenic response to temperature, exercise and food stimuli in lean and obese women, studied by 24h direct calorimetry. Br J Nutr 1983;49:171-80.
82. Felig P, Cunningham J, Levitt M, Hendler R, Nadel E. Energy expenditure in obesity in fasting and postprandial state. Am J Physiol 1983;244:E45-51.
83. Schwartz RS, Ravussin E, Massari M, O'Connell M, Robbins DC. The thermic effect of carbohydrate versus fat feeding in men. Metabolism 1985;34:285-93.
84. Anton-Kuchly B, Laval M, Choukroun ML, Manciet G, Roger P, Varene P. Postprandial thermogenesis and hormonal release in lean and obese subjects. J Physiol (Paris) 1985;80:321-9.
-53-

85. D'Alessio DA, Kavle EC, Mozzoli MA, Smalley KJ, Polansky M, Kendrick ZV, Owen LR, Bushman MC, Boden G, Owen OE. Thermic effect of food in lean and obese men. J Clin Invest 1988;81:1781-91.
86. Trayhurn P, Douglas JB, McGuchin MM. Brown-adipose tissue thermogenesis is suppressed during lactation in mice. Nature 1982;298:59-60.
87. Illingworth PJ, Jung RT, Howie PW, Leslie P, Isles TE. Diminution in energy expenditure during lactation. Br Med J 1986;292:437-41.
88. Van Raay JMA, Vermaat-Miedema SH, Schonk CM, Peek MEM, Hautvast JGAJ. Energy requirements of pregnancy in the Netherlands. Lancet 1987;2:953-5.
89. Ravussin E, Acheson KJ, Vernet O, Danforth E, Jéquier E. Evidence that insulin resistance is responsible for the decreased thermic effect of glucose in human obesity. J Clin Invest 1985;76:1268-73.
90. Blondheim SH, Mendelson B, Hashkes P, Aranne R. Dietary thermogenesis: why the conflicting results? In: Berry EM, Blondheim SH, Eliahou HE, Shafrir E, eds. Recent advances in obesity research: V. London: John Libbey, 1987;151-4.
91. Davis JR, Tagliaferro AR, Kertzer R, Gerardo T, Nichols J, Wheeler J. Variations in dietary-induced thermogenesis and body fatness with aerobic capacity. Eur J Appl Physiol 1983;50:319-29.
92. Tremblay A, Côté J, LeBlanc J. Diminished dietary thermogenesis in exercise-trained human subjects. Eur J Apll Physiol 1983;52:1-4.
93. LeBlanc J, Mercier P, Samson P. Diet-induced thermogenesis with relation to training state in female subjects. Can J Physiol Pharmacol 1984;62:334-7.
94. Hill OJ, Heymsfield SB, McMannus III C, DiGirolamo M. Meal size and thermic response to food in male subjects as a function of maximum aerobic capacity. Metabolism 1984;33:743-9.
95. Jéquier E. Thermogenesis induced by nutrient administration in man. Infusionstherapie 1984;11:184-8.
96. Flatt JP. Biochemistry of energy expenditure. In: Bray G, ed. Recent advances in obesity research: II. London: John Libbey, 1978:211-28.
97. Vernet 0, Christin L, Schutz Y, Danforth E, Jéquier E. Enteral versus parenteral nutrition: comparison of energy metabolism in healthy subjects. Am J Physiol 1986;250:E47-54.
98. Ravussin E, Bogardus C. Thermogenic response to insulin and glucose infusions in man: a model to evaluate the different components of the thermic effect of carbohydrate. Life Sei 1982;31:2011-8.
99. Acheson KJ, Ravussin E, Wahren J, Jéquier E. Thermic effect of glucose in man; obligatory and facultative thermogenesis. J Clin Invest 1984;74:1572-80.
100.Landsberg L, Young JB. The role of the sympathetic nervous system and catecholamines in the regulation of energy metabolism. Am J Clin Nutr 1983;38:1018-24.
lOl.DeFronzo RA, Thorin D, Felber JP, Simonson DC, Thiebaud D, Jéquier E, Golay A. Effect of beta and alpha-adrenergic blockade on glucose-induced thermogenesis in man. J Clin Invest 1984;73:633-9.
102.Acheson KJ, Jéquier E, Wahren J. Influence of beta-adrenergic blockade on glucose-induced thermogenesis in man. J Clin Invest 1983;72:981-6.
103.Schwartz RS, Jaeger LF, Silberstein S, Veith RC. Sympathetic nervous system activity and the thermic effect of feeding in man. Int J Obes 1987;11:141-9.
104.Jéquier E. Energy expenditure in obesity. Clin Endocrinol Metab 1984;13:563-80.
105.LeBlanc J, Brondel L. Role of palatability on meal-induced thermogenesis in human subjects. Am J Physiol 1985;248:E333-6.
106.Jéquier E. Schutz Y. Energy expenditure in obesity and diabetes. Diabetes Metab Rev 1988;4:583-93.
-54-

107.Ferrannini E. The theoretical bases of indirect calorimetry: a review. Metabolism 1988;37:287-301.
108.Bergström J, Hermansen L, Hultman E, Saltin B. Diet, muscle glycogen and physical performance. Acta Physiol Scand 1967;71:140-50.
109.Gaesser GA, Brooks G. Metabolic bases of excess post-exercise oxygen consumption: a review. Med Sei Sports Exer 1984;16:29-43.
HO.Powley TL, Berthoud HR. Diet and cephalic insulin responses. Am J Clin Nutr 1985;42:991-1002.
lll.Louis-Sylvestre J. Relationships between two stages of prandial insulin release in rats. Am J Physiol 1978;235:E103-11.
112.Calles-Escandon J, Robbins DC. Loss of early phase of insulin release in humans impairs glucose tolerance and blunts thermic effect of glucose. Diabetes 1987;36:1167-72.
113.Astrand PO, Rodahl K. Textbook of work physiology; physiological bases of exercise. 3rd ed. New York: McGraw-Hill Book Company, 1986.
114.Horton ES. Metabolic aspects of exercise and weight reduction. Med Sei Sports Exer 1986;18:10-8.
115.Schutz Y, Bessard T, Jéquier E. Exercise and postprandial thermogenesis in obese women before and after weight loss. Am J Clin Nutr 1987;45:1424-32.
llö.Gaesser GA, Brooks GA. Muscular efficiency during steady-state exercise: effects of speed and work rate. J Appl Physiol 1975;38:1132-9.
117.Maloiy GMO, Heglund NC, Prager LM, Cavagna GA, Taylor CR. Energetic cost of carrying loads: have African women discovered an economic way? Nature 1986;319:668-9.
118.Jéquier E, Acheson K, Schutz Y. Assessment of energy expenditure and fuel utilization in man. Ann Rev Nutr 1987;7:187-208.
119.Schutz Y. Use of non-calorimetric techniques to assess energy expenditure in man. In: Björntörp P, Cairella M, Howard An, eds. Recent advances in obesity research: III. London: John Libbey, 1981;153-8.
120.Benedict FG. Helmet for use in clinical studies of gaseous metabolism, N Engl J Med 1930;203:150-8.
121.Schoeller DA, Santen van E. Measurement of energy expenditure in humans by doubly labelled water method. J Appl Physiol 1982;53:955-9.
122.Lifson N, Gordon GB, McClintock R. Measurement of total carbondioxide production by means of D20 . J Appl Physiol 1955;&:704-10.
123.Lifson N, Little WS, Levitt DG, Henderson RM. D_0 method for CO, output in small animals and economic feasibility in man. J Appl Physiol 1975;39:657-64.
124.Klein PD, James WPT, Wong WW, Irving CS, Murgatroyd PR, Cabrera M, Dallosso HM, Klein ER, Nichols BL. Calorimetric validation of the doubly-labelled water method for determination of energy expenditure in man. Hum Nutr:Clin Nutr 1984;38:95-106.
125.Westerterp KR, de Boer JO, Saris WHM, Schoffelen PFM, Ten Hoor F. Measurement of energy expenditure using doubly labelled water. Int J Sports Med 1984;5:74-5.
126.Lifson N. Theory of use of turnover of body water for measuring energy and material balance. J Theor Biol 1966;12:46-74.
127.Prentice AM, Black AE, Coward WA, Davies HL, Goldberg GR, Murgatroyd PR, Ashford J, Sawyer M, Whitehead RG. High levels of energy expenditure in obese women. Brit Med J 1986;292:983-7.
128.Schoeller DA, Webb P. Five-day comparison of the doubly labelled water method with respiratory gas exchange. Am J Clin Nutr 1984;40:153-8.
129.Kissileff HR, Vanltallie TB. Physiology of the control of food intake. Ann Rev Nutr 1982;2:371-418.
130.Nicholl CG, Polak JM, Bloom SR. The hormonal regulation of food intake, digestion, and absorption. Ann Rev Nutr 1985;5:213-39.
131.Forbes JM. Metabolic aspects of the regulation of voluntary intake and appetite. Nutr Res Rev 1988;1:145-68.
-55-

132.Adolph EF. Urges to eat and drink in rats. Am J Physiol 1947;151:110-25. 133.Hamilton CL. Long term control of food intake in the monkey. Physiol Behav
1972;9:1-6. 134.Mayer J. Regulation of energy intake and the body weight. The glucostatic
and the lipostatic hypothesis. Ann NY Acad Sei 1955;63:15-43. 135.Levitsky DA, Collier G. Effects of diet and deprivation on meal eating
behavior in rats. Physiol Behav 1968;3:137-40. 136.Strominger JL, Brobeck JR, Cort RL. Regulation of food intake in normal
rats and rats with hypothalamic hyperphagia. Yale J Biol Med 1953;26:55-74.
137.Brobeck JR. Neural regulation of food intake. Ann NY Acad Sei 1955;63:44-55.
138.Sclafani A, Springer D. Dietary obesity in adult rats: similarities to hypothalamic and human obesity studies. Physiol Behav 1976;17:461-71.
139.Davidson S, Passmore R, Brock JF, Truswell AS. Human nutrition and dietetics. 6th ed. London: Churchill Livingstone, 1975;35.
140.Gordon T, Kannel WB. The effect of overweight on cardiovascular diseases. Geriat 1973;8:80-8.
141.Kennedy GC. The role of depot fat in the hypothalamic control of food intake in the rat. Proc R Soc Lond Ser B 1953;140:578-92.
142.Mellinkoff SM, Frankland M, Boyle D, Greipel M. Relationship between serum amino acid concentration and fluctuation in appetite. J Appl Physiol 1956;8:535-8.
143.Brobeck JR. Food and temperature. Ree Adv Horm Res 1960;16:439-59. 144.Booth DA. Postabsorptively induced suppresion of appetite and the
energostatic control of feeding. Physiol Behav 1972;9:199-202. 145.Morley JE, Levine AS. The central control of appetite. Lancet
1983;2:398-401. 146.Smith GP. The peripheral control of appetite. Lancet 1983;2:88-90. 147.Castonguay TW, Applegate EA, Upton DE, Stern JS. Hunger and appetite: old
concepts/new distinctions. Nutr Rev 1983;41:101-10. 148.VanItallie TB, Kissileff HR. The physiological control of energy intake:
an econometric perspective. Am J Clin Nutr 1983;38:978-88. 149.Stellar E. Drive and motivation. In: Magoun HW, ed. Handbook of
physiology, sect 5, neurophysiology. Washington DC: Am Physiol Soc, 1960;3:1501-27.
150.Anand BK, Brobeck JR. Hypothalamic control of food intake in rats and cats. Yale J Biol Med 1951;24:123-40.
151.Miller NE. Motivational effects of brain stimulation and drugs. Fed Proc 1960;19:846-53.
152.Brobeck Jr. Tepperman J, Long CNH. Experimental hypothalamic hyperphagia in the albino rat. Yale J Biol Med 1943;15:831-53.
153.Krasne FB. General disruption resulting from electrical stimulus of the ventromedial hypothalamus. Science 1962;138:822-3.
154.Russek M. A hypothesis on the participation of hepatic glucoreceptors in the control of food intake. Nature 1963;197:79-80.
155.Novin D, Sanderson JD, Vanderweele DA. The effect of isotonic glucose on eating as a function of feeding conditions and infusion site. Physiol Behav 1974;13:3-7.
156.McHugh PR, Moran TH. Calories and gastric emptying: a regulatory capacity with implications for feeding. Am J Physiol 1979;236:T254-60.
157.McHugh PR, Moran TH, Barton GN. Satiety: a graded behavioral phenomenon regulating caloric intake. Science 1975;190:167-9.
158.Deutsch JA. The stomach in food satiation and the regulation of appetite. Prog Neurobiol 1978;10:135-53.
159.Gibbs J, Young RC, Smith GP. Cholecystokinin decreased food intake in rats. J Comp Physiol Psychol 1973;84:488-95.
-56-

160.Garrow JS. Energy balance and obesity in man. 2nd ed. Amsterdam: Elsevier, 1978.
161.Fomon SJ, Filer LJ, Thomas LN, Roger RR, Proksch AM. Relationships between formula concentration and rate of growth of normal children. J Nutr 1969;98:241-54.
162.Fomon SJ, Thomas LN, Filer LJ, Ziegler EE, Leonard MT. Food consumption and growth of normal infants fed milk-based formulas. Acta Paediatr 1971,-Suppl 223.
163.Porikos KP, Hesser MF, Vanltallie TB. Caloric regulation in normal-weight men maintained on a palatable diet of conventional foods. Physiol Behav 1982;29:293-300.
164.Porikos KP, Pi-Sunyer FX. Regulation of food intake in human obesity: studies with caloric dilution and exercise. Clin Endocrinol Metab 1984;13:547-61.
165.Durrant ML, Royston JP, Wloch RF, Garrow JS. The effect of covert changes in energy density of preloads on subsequent ad libitum energy intake in lean and obese human subjects. Hum Nutr:Clin Nutr 1982;36C:297-306.
166.McLean JA, Tobin G. Animal and human calorimetry. Cambridge: Cambridge University Press, 1987.
167.Leibel RJ, Hirsch J. Diminished energy requirements in reduced-obese patients. Metabolism 1984;33:164-70.
168.Geissler CA, Miller DS, Shah M. The daily metabolic rate of the post-obese and the lean. Am J Clin Nutr 1987;45:914-20.
169.Neumann RO. Experimentelle Beiträge zur Lehre von dem täglichen Nahrungsbedarf des Menschen unter Berücksichtigung der notwendigen Eiweissmenge. Arch Hyg 1902;45:1-87.
170.Sims EAH, Goldman RF, Gluck CM, Horton ES, Kelleher PC, Rowe DW. Experimental obesity in man. Trans Am Ass Physns 1968;81:153-70.
171.Rothwell NJ, Stock MJ. Luxus consumption, diet-induced thermogenesis and brown fat: the case in favour. Clin Sei 1983;64:19-23.
172.Hervey GR, Tobin G. Luxus consumption, diet-induced thermogenesis and brown fat: a critical review. Clin Sei 1983;64:7-18.
173.Danforth E. Diet and obesity. Am J Clin Nutr 1985;41:1132-45. 174.Lissner L, Levitsky DA, Strupp BJ, Kalkwarf HJ, Roe DA. Dietary fat and
the regulation of energy intake in human subjects. Am J Clin Nutr 1987;46:886-92.
175.Johnson ML, Burke BS, Mayer J. Relative importance of inactivity and overeating in the energy balance of obese high school girls. Am J Clin Nutr 1956;4:37-44.
176.Stefanik PA, Heald FP, Mayer J. Calorie intake in relation to energy output of obese and non-obese adolescent boys. Am J Clin Nutr 1959;7:55-62.
177.McCarthy MG. Dietary and activity patterns of obese women in Trinidad. J Am Diet Ass 1966;48:33-7.
178.Maxfield E, Konishi F. Patterns of food intake and physical activity in obesity. J Am Diet Ass 1966;49:406-8.
179.Kromhout D. Energy and macronutrient intake in lean and obese middle-aged men (the Zutphen study). Am J Clin Nutr 1983;37:295-9.
180.Marr JW, Heady JA. Within and between-person variation in dietary surveys: number of days needed to classify individuals. Hum Nutr:Clin Nutr 1986;40A: 347-64.
181.Cameron ME, Van Staveren WA, eds. Manual on methodology for food consumption studies. Oxford, Oxford University Press 1988.
182.De Boer JO, van Es AJH, van Raay JMA, Hautvast JGAJ. Energy requirements and energy expenditure of lean and obese women, measured by indirect calorimetry. Am J Clin Nutr 1987;46:13-21.
-57-

183.Webb P, Annis JF. Adaptation to overeating in lean and overweight men and women. Hum Nutr:Clin Nutr 1983;37C:117-31.
184.Ravussin E, Lillioja S, Knowler WC, Christin C. Freymond D, Abbott WGH, Boyce V, Howard BV, Bogardus C. Reduced rate of energy expenditure as a risk factor for body-weight gain. N Engl J Med 1988;318:467-72.
185.Poehlman ET, Tremblay A, Fontaine E, Després JP, Nadeau A, Dussault J, Bouchard C. Genotype dependency of the thermic effect of a meal and associated hormonal changes following short-term overfeeding. Metabolism 1986;35:30-6.
-58-

Chapter 3. The assessment of resting metabolic rate, diet-induced thermogenesis and in vivo fuel utilization using a ventilated hood system: methodological considerations
JAN A WESTSTRATE MSC, PAUL DEURENBERG PHD, JOSEPH GAJ HAUTVAST HD
ABSTRACT
Different aspects of the methodology of assessing postabsorptive resting
metabolic rate (RMR), diet-induced thermogenesis (DIT) and in vivo fuel
utilization rates (FUR's) were investigated in humans using an indirect
calorimetric ventilated hood system. The reproducibility and between-person
variability in RMR, DIT, postabsorptive and postprandial respiratory quotients
(RQ's) and FUR's were assessed in a group of 37 non-obese men and in 22
non-obese women and 32 obese women. RMR reproducibility was assessed in a
group of 49 men. The impact of strict control of the antecedent diet on the
reproducibility of RMR, DIT, RQ's and FUR's was measured in a separate study.
Diurnal variation in RMR, the effect of the phase of the menstrual cycle on
RMR and DIT, the effect of the energy content of the test meal and of the
duration of the postprandial period on the calculation of DIT were also
investigated. The average method-free within-person coefficients of variation
of RMR and RQ's were 5-6 percent. The within-person variation in DIT and FUR's
were, respectively, on average 28 percent for DIT and 20 to 50 percent for
FUR's, depending on the type of nutrient and the prandial state. RMR did not
show a significant change from early morning to early afternoon. No systematic
effect of the phase of the menstrual cycle on RMR and DIT was observed. In
both sexes DIT was positively associated with the energy content of the test
meal. With energy'intakes below 2600 kJ in men and below 2100 kJ in women
around 90 percent of the total DIT response, observed in four hours, could be
assessed within three hours. DIT was not significantly associated with body
weight, the size of the fat mass or the fat-free mass.
-59-

It is concluded that the low reproducibility of DIT measurements has important
considerations for the design and evaluation of studies on DIT.
Keywords: indirect calorimetry, resting metabolic rate, diet-induced
thermogenesis, respiratory quotient, fuel utilization, methodology,
reproducibility, obese, non-obese, antecedent diet, diurnal variation,
menstrual cycle, human
INTRODUCTION
At the turn of the century Rubner observed that the increase in heat
production, ie, in energy expenditure, was greater with protein than with fat
or sugar ingestion (1). Rubner called the increase in heat production after
food ingestion the 'specific dynamic effect of food'. At the same time that
Rubner developed his concept on the specific dynamic effect of food, Neumann
described the 'Luxus consumption' phenomenon (2). Luxus consumption refers to
a process of metabolic wastage of ingested excess energy. During Luxus
consumption excess energy is not used for proportional increases in growth or
in body energy reserves, but for increased thermogenesis.
Both Rubner and Neumann could not possibly have foreseen that more than 60
years later interest in the specific dynamic effect of food and in Luxus
consumption would increase dramatically.
Until the 1960s the specific dynamic effect of food and Luxus consumption were
matters of little concern to most nutritionists or physiologists (3,4). In the
last three decades interest in both topics has, however, been reawakened
(5,6). During this time a plethora of terms have been used to describe the
specific dynamic effect of food and the Luxus consumption phenomenon. The
terms most used nowadays are the thermic effect of food and diet-induced
thermogenesis (DIT) (5,6). Both terms are considered here to refer to the
immediate response of energy intake to food ingestion, irrespective of the
nutritional status of the subject.
The reasons for the revived interest in DIT was the emerging view that
thermogenesis would play an important role in the regulation of body weight
and body energy stores (7,8). Previously, the central problem of weight or
energy balance regulation was considered to be the regulation of energy intake
(9,10). Animal experiments, however, showed that, in addition to this factor,
the regulation of energy output was important for the control of body weight
-60-

(7,11,12). These findings suggested that in humans a defective regulation of
energy output could also be responsible for the development or maintenance of
obesity. This hypothesis led to a proliferation of studies comparing the obese
with the non-obese or post-obese on total daily energy expenditure or on some
component of daily energy output, usually the resting ('basal') metabolic rate
(RMR) and DIT. With respect to DIT the most significant outcome of all these
studies was, that DIT would be blunted in the obese, and in the post-obese,
and therefore of significance in the pathogenesis or maintenance of obesity
(13-29). The evidence for this view is, however, far from conclusive (30-42).
Since 1924 at least 17 reports (13-29) have been published in which it was
shown that the obese had a defect in DIT; in at least 13 articles (30-42) no
such defect was reported. Conflicting results are reported for almost any
other factor affecting DIT that has been investigated (43-58).
The reasons for these conflicting results are obscure (42). It is clear that,
progress in gaining insight in the etiology of problems of energy balance is
hampered considerably by these controversies.
The discrepancy in results in this field of study of postprandial metabolism
may, in part, be related to some specific methodological problems of the
measurement of DIT. For example, none of the studies reporting on DIT, present
data on the within-person variability, ie, the reproducibility, of DIT
measurements.
In the report presented here, the methodology for assessing DIT in humans is
systematically reappraised. A description is given of a computerized
open-circuit ventilated hood system, constructed for assessing RMR and DIT.
Results are presented of repeated DIT and RMR measurements obtained in 91
subjects, males and females, the latter group with a wide range in body fat
content. Special attention is given to the reproducibility of RMR and DIT
measurements, the quantitation of the thermic response, the relation between
DIT and the energy intake of the ingested meal and the duration of DIT
measurements. In addition, the impact of the phase of the menstrual cycle on
RMR and DIT is investigated. The results of this study provide important
information on methodological aspects of DIT measurements.
-61-

SUBJECTS AND METHODS
The ventilated hood system
An open-circuit indirect calorimetric ventilated hood system was built to
measure continuously the rate of energy expenditure for a prolonged period of
time (up to 6 hours) with minimal discomfort for the subject. The principle of
a ventilated flow-through system is, that a stream of air is forced to pass
across the face of a subject and mixes with and collects any expired air as it
does. The expired air is collected by a transparent perspex hood placed over
the subject's head, which is made airtight around the neck with a cord. The
rate of energy expenditure can be calculated by determining the amount of air
flowing through the hood and by measuring the oxygen (0,) and the
carbondioxide (CO,) concentrations in the incoming and outflowing air.
Figure 1 gives a schematic representation of the system used in Wageningen.
Figure 1. Schematic outline of the Wageningen Ventilated Hood System. VH indicates ventilated hood, FT is flowmeter (flowtransmitter) and FC is flowcontroller. Not shown in this outline are the multi-pen chart recorder and the load cells.
-62-
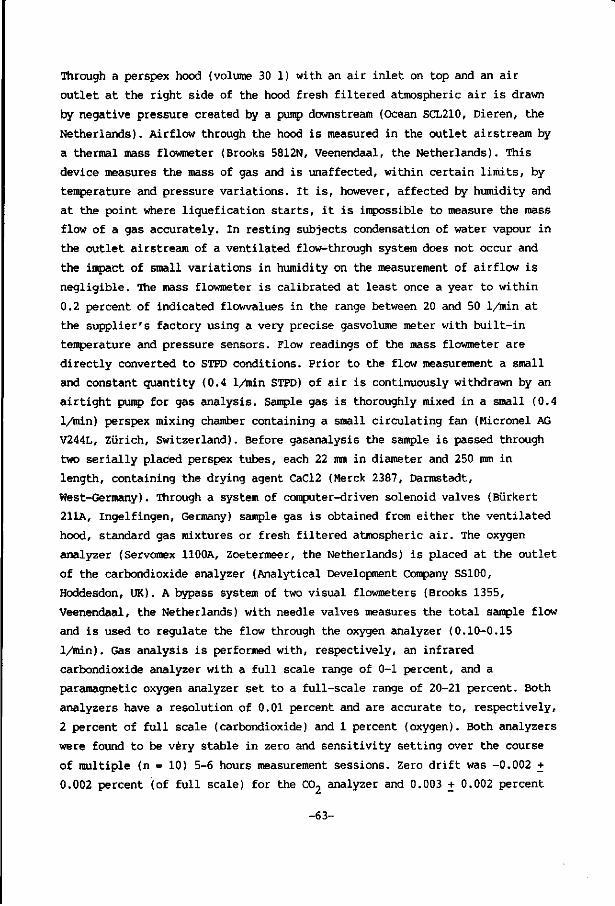
Through a perspex hood (volume 30 1) with an air inlet on top and an air
outlet at the right side of the hood fresh filtered atmospheric air is drawn
by negative pressure created by a pump downstream (Ocean SCL210, Dieren, the
Netherlands). Airflow through the hood is measured in the outlet airstream by
a thermal mass flowmeter (Brooks 5812N, Veenendaal, the Netherlands). This
device measures the mass of gas and is unaffected, within certain limits, by
temperature and pressure variations. It is, however, affected by humidity and
at the point where liquefication starts, it is impossible to measure the mass
flow of a gas accurately. In resting subjects condensation of water vapour in
the outlet airstream of a ventilated flow-through system does not occur and
the impact of small variations in humidity on the measurement of airflow is
negligible. The mass flowmeter is calibrated at least once a year to within
0.2 percent of indicated flowvalues in the range between 20 and 50 1/min at
the supplier's factory using a very precise gasvolume meter with built-in
temperature and pressure sensors. Flow readings of the mass flowmeter are
directly converted to STPD conditions. Prior to the flow measurement a small
and constant quantity (0.4 1/min STPD) of air is continuously withdrawn by an
airtight pump for gas analysis. Sample gas is thoroughly mixed in a small (0.4
1/min) perspex mixing chamber containing a small circulating fan (Micronel AG
V244L, Zürich, Switzerland). Before gasanalysis the sample is passed through
two serially placed perspex tubes, each 22 mm in diameter and 250 mm in
length, containing the drying agent CaCl2 (Merck 2387, Darmstadt,
West-Germany). Through a system of computer-driven solenoid valves (Bürkert
211A, Ingelfingen, Germany) sample gas is obtained from either the ventilated
hood, standard gas mixtures or fresh filtered atmospheric air. The oxygen
analyzer (Servomex 1100A, Zoetermeer, the Netherlands) is placed at the outlet
of the carbondioxide analyzer (Analytical Development Company SS100,
Hoddesdon, UK). A bypass system of two visual flowmeters (Brooks 1355,
Veenendaal, the Netherlands) with needle valves measures the total sample flow
and is used to regulate the flow through the oxygen analyzer (0.10-0.15
1/min). Gas analysis is performed with, respectively, an infrared
carbondioxide analyzer with a full scale range of 0-1 percent, and a
paramagnetic oxygen analyzer set to a full-scale range of 20-21 percent. Both
analyzers have a resolution of 0.01 percent and are accurate to, respectively,
2 percent of full scale (carbondioxide) and 1 percent (oxygen). Both analyzers
were found to be very stable in zero and sensitivity setting over the course
of multiple (n = 10) 5-6 hours measurement sessions. Zero drift was -0.002 +
0.002 percent (of full scale) for the CO, analyzer and 0.003 + 0.002 percent
-63-

(of full scale) for the 0, analyzer. Span, ie, sensitivity, drifts were,
respectively -0.003 + 0.003 percent (of full scale) for the CO~ analyzer and
0.003 + 0.005 percent (of full scale) for the 0, analyzer. Part of the span
drift in the 0, analyzer is not caused by random drift of the analyzer, but by
shifts in barometric pressure of the air used to calibrate the analyzer.
Analyzers are calibrated using dried standard gas mixtures and dried filtered
fresh atmospheric air. Zero settings are performed by passing 100 percent
nitrogen through the analyzers (0.4 1/min, at a pressure of 0.4 bar). The span
of the carbondioxide analyzer is set by passing a special gas mixture (0.60
percent carbondioxide, 20.50 percent oxygen, 78.90 percent nitrogen) through
the analyzer (0.4 1/min, at a pressure of 0.4 bar). The span of the oxygen
analyzer is set at 20.95 percent using fresh dried filtered atmospheric air.
During the course of measurements of energy expenditure the span of the oxygen
analyzer is controlled once every 30-60 minutes. The flow through the hood is
adjusted to keep carbondioxide readings in the range of 0.50 to 0.80 percent
and oxygen in the range of 20.10 to 20.40 percent. Flow adjustments are made
by a flow measure and a flow control-unit (Brooks 5871, Veenendaal, the
Netherlands) whose output is connected to a motor-driven valve (Brooks 5837,
Veenendaal, the Netherlands) placed downstream the thermal mass flow meter. In
adults, flow rates between 25 and 50 1/min, depending on body size and body
composition, are used. Subject's movements are recorded by a load cell (Tokyo
Sokki Kenkuyjo TKA-200A, Tokyo, Japan) placed under a leg of the hospital bed,
that is used by the subject during the gas exchange measurement. The principle
of a load cell is the registration of changes in a vertical load, ie,
pressure. Pressure is exerted on strain gauges in the centre of the load cell.
A change in pressure causes an electrical signal which is amplified and
digitized by an analogue-digital converter for computer processing.
Output voltage signals of the carbondioxide and oxygen analyzer, the mass flow
meter and load cell are measured and digitized by a data-acquisition system
(Hewlett Packard 3497A, Palo Alto, USA) interfaced to a desktop computer
(Hewlett Packard 86B or 85, Palo Alto, USA), which is connected to,
respectively, a diskdrive (Hewlett Packard 9121, Palo Alto, USA), containing
the program for the calculation of energy expenditure, and a printer. Flow and
gas concentration measurements were taken every 10 seconds, the output of the
load cell was measured with a frequency of 5 times/sec. The computer
calculated and printed the values of oxygen consumed (VO, at STPD),
carbondioxide produced (VCO, at STPD), the respiratory quotient (VCOj/vO,) and
the rate of energy expenditure (in kJ/min) integrated over periods of either
-64-

1, 2 or 5 minute(s). Output signals of the gas analyzers, mass flowmeter and
load cell are also visualized on a multi-pen chart recorder (Kipp&Zonen BD101,
Delft, the Netherlands). Energy expenditure measurements are performed in a
noise- and temperature controlled room (23-26 °C). Room temperature is
measured by a ceramic-platina electrode (Heraeus PTlOO, Wijk bij Duurstede,
the Netherlands), calibrated to 0.02 °C) and also printed at 1, 2 or 5
minute(s) intervals.
A first ventilated hood system was built in 1985, a second system was
constructed in 1986 and in 1988 two more systems were built.
Calculation of energy expenditure and fuel utilization
The rate of oxygen consumption and carbondioxide production (at STPD) are
calculated using equations published by Jéquier et al. (59) .
<!> *>2 = l *[ vOTtMAro2-AF«>2*Fino2)].
1 - Fin°2
<2> * » 2 - *out * F 0 0 2-
where:
F. 0, = fraction of oxygen at the inlet.
V . = rate of air flow at outlet (1/min at STPD).
A F 0 2 = Fin02 - Fout02.
AFC0 2 = FoutC02 - F.nCo2.
F .C02 = fraction of C02 at the outlet.
F. Co2 = fraction of CCX, at the inlet, in 2
When the respiratory quotient is different from 1.0, the inspired volume is
not equal to the expired volume and therefore the inflow of air (V. ) is
different from the measured outflow ( V . ) . Measurements of gas concentrations
at the inlet are thus made in a different volume of gas when compared to
measurements of 02 and C02 at the outlet. The Haldane correction (59) is used
to adjust measurements of inlet gas concentrations for a difference between
the inlet and outlet gas volumes. The Haldane correction of inlet gas
concentrations is particularly important for 0,, since 02 has a relatively
large concentration in the inspired air.
-65-

The rate of energy expenditure or metabolic rate is calculated using the
formula (59):
(3) MR = 4.184*[((4.686+1.096*(RO -0.707))*VO2+4.60*VO2p)].
where:
MR = metabolic rate, ie, rate of energy expenditure, in kJ/min.
RQ = the nonprotein respiratory quotient, ie, VC02 /V02 .
VCO, = the volume of carbondioxide produced in nonprotein, ie, carbohydrate
and fat, oxidation = VCO,- VC02 , in 1/min (STPD).
VO? = the volume of oxygen used for nonprotein oxidation =
vt>2 - V02 , in 1/min (STPD).
VCO, = the volume of carbondioxide produced in protein oxidation = N * 6.25 *
0.7739, in 1/min (STPD).
VD2 = the volume of oxygen used in protein oxidation = N * 6.25 * 0.9936, in
1/min (STPD).
N = total urinary nitrogen excretion, in g/min.
P = protein = 6.25 * N, in g/min.
At an RQ of 0.707, in addition to protein, fat is oxydized in the body and
the energetic equivalent of 1 1 of oxygen used for oxidation is equal to that
of fat, ie, 19.61 kJ. At an RQ__ of 1.00, in addition to protein,
carbohydrates are oxydized and the energetic equivalent of 1 1 of oxygen used
for oxidation is equal to that obtained at glucose oxidation, ie, 20.95 kJ.
During relatively short energy expenditure measurements, for example, for
assessing resting metabolic rate, total urinary nitrogen excretion can not be
assessed. Under these circumstances metabolic rate is calculated with the
following formula:
(4) MR = 4.184*t(4.686+1.096*(RQ-0.707))*VO2]
where:
RQ = "on line" measured respiratory quotient, ie, respiratory exchange ratio,
V02 = "on line" measured oxygen consumption, in 1/min (STPD).
v"C02 = "on line" measured carbondioxide production, in 1/min (STPD).
-66-

We have established that with this formula energy expenditure is determined
with a very small error (<1 %) compared to metabolic rate determined with
formula no 3.
In vivo net fuel utilization rates are calculated using the Lusk's constants
for fat, carbohydrate and protein oxidation (60):
6.25 g of protein are oxidized in the body to produce 1 g of urea nitrogen,
requiring 966.3 ml of 0, and producing 773.9 g of CO,. The RQ for lipid
oxidation is 0.707 and for carbohydrates 1.00. Oxygen consumed is 2019.3 ml/g
of fat, 828.8 ml/g of glycogen and 745.8 g/ml of glucose. The constants for
glycogen were used to calculate carbohydrate utilization rate in the fasting
state.
Thus, the following metabolic mixture equations are derived:
in the fasting state:
(5) vD2 = 0.8288*Gly + 2.019*F + 6.25*N*0.9663,
(6) VC02 = 0.8288*Gly + 1.4276*F + 6.25*N*0.7739,
in the postprandial state:
(7) V02 = 0.7456*Glu + 2.019*F + 6.25*N*0.9663,
(8) VC02 = 0.7456*Glu + 1.4276*F + 6.25*N*0.7739,
where VCu and VCO, are expressed in 1/min and Gly,Glu, F and N in g/min.
Gly = amount of glycogen oxidized
Glu = amount of glucose oxidized
F = amount of fat oxidized
N = amount of total- or urea-nitrogen excreted.
Since N and VO, and VCO, are measured, this system with metabolic mixtures
equations can be solved and the amounts of fat, glucose, glycogen or protein
that are oxydized, can be calculated using the following formula's:
-67-

carbohydrates:
in the fasting state:
(9) Gly = 4.118*vC02 - 2.911*V02 - 2.325*N.
in the postprandial state:
(10) Glu = 4.5768*VD02 - 4.5768*v02 - 2.595*N.
fat:
(11) F = 1.69*V02 - 1.69*VC02 - 2.032*N.
protein:
(12) P = 6.25*N.
A negative fat oxidation rate occurs when the RQ exceeds 1.00. This is ^ np
indicative of net lipogenesis from glucose, ie, lipogenesis in excess of
concomitant fat oxidation. The rate of net newly synthesized fat is equal to
the negative fat oxidation rate. It is taken that 2.825 g of glucose are used
to synthesize 1 g of a representative fat, ie, of
palmitoyl-stearoyl-oleoyl-glycerol (61). The amount of glucose stored
(non-oxidative storage) as lipid is measured in indirect calorimetry as
glucose oxidation. If net lipogenesis occurs, observed glucose oxidation rates
are corrected for the amount of glucose converted into lipid.
SUBJECTS
In total 103 subjects, 49 non-obese men, 22 non-obese women and 32 obese
women, participated in the studies presented here. All studies were conducted
between January 1986 and august 1988. In 91 of these subjects, 37 men and 54
women, repeated measurements of RMR and DIT were obtained. For 12 men repeated
measurements of RMR only were available. Fifty-four of the subjects
participated in studies carried out specifically for investigating
methodological aspects of RMR and DIT measurements; in the other 49 persons,
investigating aspects of RMR and DIT methodology was not the major objective
-68-

of study. Subject characteristics are shown in Table 1 for the men and in
Table 2 for women. In addition to studies in these groups, a group of 6 men
and 5 women participated in a study to assess diurnal variation in RMR.
Subjects were recruited for participation by advertisement in regional
newspapers, the University weekly periodical, by poster or through informal
contacts. After applying for participation, subjects received a brochure with
detailed information on the nature and purpose of the experiment(s). In
addition, subjects received a questionnaire for obtaining information on past
and present health status, nutritional habits, smoking and (alcoholic
beverages) drinking behaviour, habitual activity pattern and sporting
activities. Subjects eligible for participation were invited for a first visit
to the laboratory to familiarize them with the ventilated hood system. After
receiving their informed consent subjects were allowed to participate in the
studies. The protocol of each study was submitted to and approved of by the
Medical-Ethical Committee of the Wageningen Agricultural University.
Table 1. Characteristics of men participating in reproducibility studies of BMR, DIT and fuel utilization rates.
Sample s ize
FMI replicates
nrr replicates
Age Weight
Body fat
Fat-free mass
Fat mass
(n)
(k)
<k)
(yr)
(kg)
<%) (kg)
(kg)
Stud/ 1
12
4
2
27.3+1.5
78.3+3.0
15.9+1.2
65.9+2.9
12.4+1.0
Study 2
5
4
2
22.8+0.9
71.6+3.9
10.4+1.4
64.1±3.3
7.5+1.1
Study 3
4
4
4
24.5+1.7
69.2+4.0
15.4+2.2
58.4+3.7
10.7+1.7
Study 4
10
6
4
22.2±0.5
75.5+2.2
15.1+1.2
64.0+1.7
11.5+1.0
Study 5
6
6
6
22.3+0.6
71.2+1.2
15.0+1.2
60.6+1.9
10.7+1.1
StucV 6
12
4
-24.8+0.6
70.2±1.2
15.0+1.4
59.5+0.7
10.7+0.5
Total
8.2±1.5
4.7+0.4
3.6+0.7
24.3+0.5
73.5+1.1
14.8+0.6
62.5+1.0
10.9+0.5
< Range >
4-12
4-6
2-6
20-41
58.4-101.8
5.5-22.3
3.4-19.2
48.8-91.4
Values are given as •ram + sen * Study 6 not included in calculatim
Entry criteria could vary among the different studies, for example, with
respect to body fat content. In general, however, a subject was eligible for
participation when he or she was apparently healthy (no evidence of past or
present thyroid disorders and diabetes mellitus), did not use drugs known to
affect energy metabolism, had no proteinuria or glycosuria, was eating a
normal balanced diet, smoked less than 10 cigarettes, consumed no more than 5
alcoholic drinks/d, did not exercise more than 7 hours/week and had had a
-69-

stable body weight (within 2.5 kg of body weight at entry) for a period of at
least 6 months prior to the beginning of the study. Women had to be in the
premenopausal state. Obesity was defined as a body fat content, assessed with
the underwater weighing technique, exceeding 25 percent in men, or exceeding
35 percent in women. In the obese women fasting blood glucose levels were all
within the normal range.
Table 2. Characteristics of women participating in reproducibility studies of RMR, DIT and substrate utilization rates.
Sample s ize
(n) 6
RMR repl icates
DIT repl icates
Age
Weight
BocV fat
Fat-free mass
Fat mass
5
(k)
<k)
(yr)
(kg)
<*> (kg)
(kg)
stucfy 1
5
4
2
21.2+0.8
61.0+2.0
28.8+1.2
43.3+1.1
17.6+1.2
Stuty 2
6
4
4
22.8+0.5
61.8+2.9
27.7±2.3
44.4+1.2
17.4+2.1
Stucty 3
17
12
6
22.8+0.9
65.9+2.7
28.4+1.1
47.2+2.0
18.8+1.1
Stuty 4
15
6
3
21.8+0.5
61.3+4.3
28.1+2.0
43.8+2.2
17.5+2.3
StlKfy 5
9.0+2
4
4
39.1+1.5
92.6±4.3
47.8+1.3
47.6+1.4
45.0±3.2
StucV 6
2
2
2
37.9+1.1
89.3±2.9
44.8+0.9
49.0±1.2
40.3±2.0
Total
5-17
5.3+1.4
3.5+0.6
31.8+1.2
79.4±2.6
39.0+1.4
46.8+0.7
32.6±2.1
< Bange >
2-12
2-6
20-45
50.3-125.9
19.9-55.9
36.6-60.6
10.0-70.4
Values are given as i
METHODS
Variability and accuracy of the method
The precision of the gas analyzers and the calibration procedure was measured
over a period of 2.5 years by 60 ethanol (Merck 983, Darmstadt, West-Germany)
combustion tests of on average 2 hours duration (range 1-4 hours). Twenty of
these tests were used to check the precision and validity of the entire
ventilated hood system. To oxydize 1 g of ethanol 1.460 1 of oxygen is needed
and 0.972 1 of carbondioxide is produced (RQ = 0.666). When a known quantity
of ethanol is combusted, the volumes of oxygen consumed and carbondioxide
produced, involved in the oxidation process can be calculated. These
calculated values can be compared to the observed values. To calculate the
variability of the method in a comprehensible form, we extrapolated the
ethanol combustions to an ethanol combustion rate needed for the average male
sedentary individual with a resting metabolic rate of 7000 kJ/d. This would
-70-

correspond to an ethanol combustion of 236 g assuming an energetic equivalent
of ethanol oxidation of 29.7 kJ. For the oxidation of 236 g of ethanol 345 1
0* are needed and 230 1 of C0~ are produced.
Within-person variability in RMR, DIT, FQ and fuel util ization rates
RMR variability was measured in 49 men participating in 6 different studies,
DIT, RQ and fuel u t i l i za t ion rate var iabi l i ty was evaluated in 5 different
studies in 37 men. In 54 women, 6 studies were used to estimate the
within-person var iab i l i ty in variables of energy metabolism. All studies were
conducted within a period of 6 weeks, except for study no 3 and 4 in women,
which were carried out over a period of 3 months. A brief description of the
different studies is given below:
- Men:
Study 1; n=12
these subjects participated in a study to measure the thermic effect of ethanol and the impact of ethanol on EŒT. FMR vas
measured four times under the same conditions and DIT (4 hours) vas measured two times under the same conditions. Between
repeated measurements vas a time interval of at least two days.
Study 2: r*=5
These subjects participated in a study to assess the impact of palatability on DIT. The number of replicates and
time-interval between replicates of RMR and DIT measurements were similar to those in study 1.
Study 3: n=4
These subjects participated in a study to measure the effect of a two-weeks controlled dietary trial on the within-person
variability in RMR, EXIT, RQ and fuel utilization rates. RMR and DIT were measured four times under the same conditions
with a time-interval of 3-4 days between replicate measurements.
Study 4: n=10
This study vas performed t o measure the impact of diurnal variation (nwming versus afternoon) on PMR and DIT (62). The
t ime-interval between replicate RMR and DIT measurements was a t least two days.
Study 5: n=6
This study was specifically desired to estimate the within-person variability in RMR, DIT, RQ and fuel utilization
rates. RMR and DIT were measured on three consecutive mornings in two periods, separated by a five weeks period. This
study was the first study we performed. The results of this study showed a significant time of measurement effect on RMR,
but not on DIT. RMR measured on the morning of the first day of each period was slightly higher than on the mornings of
the second and third day, respectively, 3 and 7 percent. This was probably due to a small carry-over effect of the first
measurement day on the second day, and of the second day on the third day. Cn a day that energy exchange is measured food
intake and activity pattern are generally quite different from food intake and activity as observed on a 'normal' day. As
a result of this study a time-interval between replicates of RMR and EUT of at least two days was chosen.
Study 6: n*12
In this study the impact on RMR and DIT of type of motion picture was assessed. The type of motion picture did not
significantly affect the RMR. Of each subject four replicates of RMR were available.
-71-

- Women:
Study Ir n=6
This study was designed to test the impact of palatability on DIT. In each women four replicates of the BfB and two of DIT
were measured. In four women the effect on FMR and DIT of phase, ie, pre-ovular versus post-ovular, of the menstrual cycle
could be assessed. Ovulation was estimated to occur two weeks before the onset of manses. Replicate measurements of FMR
and DIT were performed with a time-interval of at least two days between replicates. The women were measured at least
three days after the start of the menstruation.
Study 2: n=5
In this study the effect of a two-weeks controlled dietary trial on the within-person variability on FMR, DIT, EQ and fuel
utilization rates was assessed. Four replicate measurements of FMR and DTT were available of each woman. The time interval
between replicate measurements was 3-4 days. Woman were measured at least three days after the onset of menstruation. In
two women the impact of the phase of the menstrual cycle on FMR and DIT could be determined. The other women used oral
contraceptives.
Study 3: n=5
This study was specifically performed to measure the effect of the stage of the menstrual cycle on FMR and DTT. The women
were measured over a period of three cycli. FMR was measured 6 times in the pre-ovular and 6 times in the postovular phase
of the cycle. DTT was measured, respectively, 3 times pre-ovularly and 3 times post-ovularly. Gas exchange measurements in
the pre-ovular phase were always performed at least three days after the onset of menstruation. The time-interval between
replicates in each stage of the cycle was in general three days. Ovulation was assessed with an IH ovulation test
(Nourypharma IH Color, Oss, the Netherlands).
Study 4: n=6
This study was carried out to determine the within-person variability in women using oral contraceptives. FMR and DTT were
measured for 6 and 3 times, respectively, over a period of three months. FMR measurements were performed in general with a
two-weeks interval between the replicate measurements, DTT was assessed once every month with on average a four weeks
time-interval between the successive measurements.
Gas exchange measurements were always performed at least three days after the onset of menstrual bleeding.
Study 5: n=17
In this study only obese women participated. The purpose of the study was to measure the within-person variability of FMR,
DTT, RQ and fuel utilization rates in obese women. Of each women four replicate FMR and DIT measurements were available.
The time-interval between the replicate measurements was at least two days. Gas exchange measurements were performed at
least three days after the start of the menstruation, m 12 women 2 FMR and DTT measurements were obtained in the
pre-ovular and in the post-ovular phase of the cycle.
Study 6: n=15
Similar to study 5, in study 6 only obese woman participated. The purpose of this study was to assess the impact of body
fat distribution and weight loss on FMR and EXIT. In 15 of these women two initial FMR and DTT measurements were obtained.
Measurements were performed at least three days after the start of the menstruation, but no attempt was made to measure
the women in a specific phase of the cycle. Part of this study has been published (63).
Impact of control of the antecedent diet on the within-person variability in RMR, DIT, RQ's and fuel uti l ization rates
Nine subjects, 4 men and 5 women, i e , study 3 in men (Table 1) and study 2 in
women (Table 2) , participated in a two-weeks controlled dietary t r i a l .
Subjects received their to ta l daily food intake, adjusted to individual energy
needs, from the laboratory. They were instructed to eat a l l the food we
provided to them and not to eat other food items during the course of the
study and to keep to the same ac t iv i ty pattern. Energy needs were assessed
using the mean of two RMR measurements, performed on the same day, i e , in the
morning and in the afternoon. This value was extrapolated to 24 hours. Energy
needs were calculated assuming that the RMR contributed, respectively, 70 -72-

percent to total daily energy output in sedentary subjects with on average 1-2
hours/week sporting activities and 67 percent in subjects having an average of
3-5 hours/week sporting activities. Each day one supplementary consumption of
an alcoholic beverage or of orange juice was permitted. Food items were
provided in a 4-days rotating menu with minor differences in energy content
(coefficient of variation (CV) < 5 percent)) and nutrient composition
(CV-protein,fat < 10 percent, CV-carbohydrates < 15 percent) between the four
menus. Energy intake and nutrient intake were determined from chemical
analysis of three duplicate portions of a total 4-days menu for a hypothetical
individual with an estimated energy intake of 8-8.5 MJ/d, 8.5-9 MJ/d or 9-9.5
MJ/d. Protein (64), fat (65) and carbohydrates (66) were determined after
assessing moisture and ash content (67). Mean energy intake was 9.3 + 0.5 MJ/d
(range: 7.3 - 12.4 MJ/d), with on average 15 percent of the energy derived
from protein, 35 percent from fat and 50 percent from carbohydrates.
Constancy of the RMR
It is sometimes advocated to use a non-caloric sham feeding treatment in
studies on DIT as a control on the constancy of the baseline, ie, the RMR
(68). The constancy of the baseline is disputed, since the RMR would show
pre-and postprandial metabolic rote (kj/min)
70-
_ _ _ R M R | 1 0 V .
constant RMR
RMR | » V .
1 2 3 4 postprandial time (tp in h )
Figure 2. Postprandial energy expenditure (PEE) with an extrapolated changing or constant resting metabolic rate (RMR).
considerable diurnal variation (68). Various investigators report the use of
-73-

such non-caloric sham feeding tests (34-36,38). Others, however, do not report
the use of such a control treatment, assuming no significant diurnal variation
in RMR (15,17,20). When the RMR shows an increasing or decreasing trend during
the day, this may seriously affect the calculation of the DIT response. This
is illustrated in Figure 2.
With a constant RMR the total thermic effect would be:
240 (duration of postprandial time (Tp))* [ PEE - RMR ], eg, 240*[4.65 - 4.10]
= 156 kJ, assuming an average postprandial energy expenditure (PEE) of 4.65
kJ/min and an RMR of 4.10 kJ/min.
When the RMR would increase 10 percent, DIT would be reduced by 38 percent to
96 KJ. On the other hand when the RMR would decrease 10 percent, DIT would
increase 38 percent to 216 kJ. These are substantial effects and it is
important to check the constancy of the baseline, ie, the suitability of
extrapolating the RMR over the postprandial period for calculating the thermic
response.
We assessed the constancy of the RMR in three different ways. In a first study
in men (Table 1, study 4), the difference was determined between morning and
afternoon RMR and DIT measurements, assessed on different days. We have
reported previously on the results of this study (62). In a second study, we
measured in 20 subjects, 11 men and 9 women, the difference between two 1-hour
RMR measurements, performed on the same day. The first RMR was measured in the
morning between 7.30 and 9.00 hours after an overnight fast and the second one
was performed in the afternoon between 13.30 and 15.00 hours with the subjects
in a 4.5 hours postabsorptive state. For this study, subjects received a small
(2 MJ) standardized breakfast. Until the second RMR measurement subjects were
not allowed to engage in heavy prolonged exercise, sleeping or to drink coffee
or tea. Mineral water and sugar-free non-alcoholic drinks were allowed ad
libitum. In a third study, we measured RMR in 12 subjects, all men, for a
period of 2.5 hours during a morning.
Impact of energy content of a test meal on DIT and duration of measurement on
calculation of DIT.
In 34 women DIT was measured for on average 3.9 hours ( 3 - 4 hours) to a meal
of on average 1884 kJ (varying on average between 1810 and 2000 kJ). In 20
women, we measured DIT for on average 3.1 hours (3 - 3.5 hours) to a meal of
on average 1321 kJ (varying on average between 1315 and 1340 kJ). In 12 men
DIT was measured repeatedly for a period of 4 hours to a meal with an energy
-74-

content of on average 2550 kJ. In 21 men DIT was assessed for on average 3.9
hours ( 3 - 4 hours) to a meal of on average 1952 kJ (varying on average
between 1900 and 2000 kJ) and in 4 men the thermic effect of food was assessed
for 3.5 hours exactly, to a meal of on average 1340 kJ. The average hourly
increase in metabolic rate after ingestion of these different test meals was
compared among the various groups, subdivided according to sex. In addition,
the distribution (in percent of total response) of the entire DIT response
over the first, second, third, and, if possible, over the fourth hour of the
postprandial period was calculated and compared among the various groups. The
completeness of the DIT response was evaluated by calculating the difference
(expressed in a percentage of the RMR) between the average rate of energy
expenditure over the last hour of the postprandial period and the RMR.
Gas exchange measurements
All gas exchange measurements were performed with a ventilated hood system, as
described in detail before.
Resting metabolic rate
Resting metabolic rate (RMR) was generally measured in the morning between
7.30 and 9.00 hours after an overnight fast. In some studies, ie, in studies
1, 3 and 4 in men and in study 2 in women, RMR was assessed in the afternoon
between 12.30 and 14.00 hours or between 13.30 and 15.00 hours, at least 4.5
hours after a small (< 2 MJ) standardized breakfast. Subjects were always
instructed not to perform heavy physical activity the evening before RMR
measurements. For each gas exchange measurement subjects were brought by car
to the laboratory. After voiding they lay in a supine (semi-recumbent)
position, but awake and motionless under the ventilated hood on a hospital bed
for 30 minutes before the actual start of the RMR measurement. RMR was then
continuously measured for one hour. Metabolic rate, oxygen consumption,
carbondioxide production and respiratory quotient readings were integrated by
the computer over periods of two or five minutes. These readings were averaged
over a period of 1 hour to obtain the RMR. Occasionally subjects hyper- or
hypoventilated for some period during the RMR measurements. These readings
were not included in the calculation of the RMR. Metabolic rate was also
corrected for the impact of spontaneous physical activity, as assessed by load
cells, on oxygen consumption and carbondioxide production rates. In addition,
-75-

values were adjusted for any drift in the span reading of the oxygen analyzer,
for example, due to changes in barometric pressure during the course of a one
hour measurement session. Measurements were performed in a noise and
temperature controlled room. During the RMR measurements subjects were kept
awake by showing them motion pictures.
Diet-induced thermogenesis
Diet-induced thermogenesis (DIT) was assessed after an initial RMR
measurement, which was used as a baseline in the calculation of the DIT
response. The meals used to evoke a thermic response were, in general, liquid
mixed meals, containing yoghurt, sucrose, orange juice, a protein supplement
and vegetable oil. Meals varied in energy content among the various studies
from 1300 to 2600 kJ. Nutrient composition was very similar among the various
meals. Table 3 shows average energy content and nutrient composition of the
various test meals. In one study, ie, study 6 in women, a testmeal composed of
normal solid foods, ie, bread, margarine, apple syrup, cheese and orange
juice, was used. No significant difference in thermic effect between this meal
and a liquid test meal of similar energy content was observed.
Table 3. Energy content and nutrient composition of meals in reproducibility studies of DIT.
Stuty 1
2
3
4
5
6
Mean +
son
Energy
kJ
2550
2000
1340
1900
2000
-1960
194
Protein
9
19.8
14.4
10.4
11.6
14.4
14.1
1.6
%
13.0
12.0
13.0
10.2
12.0
12.0
0.5
M E N
Fat
9
18.6
17.6
12.0
16.7
18.6
16.7
1.2
%
27.0
33.1
33.6
33.1
35.0
32.4
1.4
CBD
9
90.8
67.5
43.9
66.1
65.0
66.7
7.4
%
60.0
54.9
53.4
56.7
53.0
55.6
1.3
Energy
kJ
2000
1340
1950
1920
1810
1315
1723
1218
Protein
9
14.4
10.4
13.0
12.8
12.2
9.8
12.1
0.7
%
12.0
13.0
11.1
11.0
11.3
12.4
11.8
0.3
W O M E N
Fat
9
17.6
12.0
18.5
18.1
16.4
11.6
15.7
1.3
%
33.1
33.6
35.7
35.4
34.1
33.2
34.2
0.5
an g
67.5
43.9
63.6
62.7
60.7
43.9
57.1
4.3
%
54.9
53.4
53.2
53.4
54.6
54.4
54.0
0.3
Liquid test meals have various advantages over solid meals. Liquid test meals
can be prepared in bulk, which will minimize differences in. composition among
test meals. Secondly, liquid meals can be ingested with minimal disturbance of
-76-

the energy exchange measurements, for example, by passing a straw through an
opening in the ventilated hood and asking the subjects to drink the meal. To
ingest a solid meal, it is necessary to remove the ventilated hood from the
subjects head, which will cause a relatively greater disturbance of the energy
exchange measurements. Thirdly, the composition of liquid meals can be
manipulated more easily than the composition of a solid meal.
Subjects ingested the liquid meals always within 5 minutes, the solid meal was
eaten in a period of 10-15 minutes. After ingestion of the test meal the rate
of energy expenditure was continuously assessed for either 180, 210 or 240
minutes.
Once every hour the span of the oxygen analyzer was checked against fresh
dried filtered atmospheric air during five minutes. During this period
subjects were allowed to move briefly. Subjects were asked to remain awake and
motionless during the remaining time of the measurements. During the
measurements subjects watched motion pictures. Occasionally, subjects moved a
leg, arm or another part of their body. When necessary, metabolic rate
readings were adjusted for this type of disturbance.
Oxygen consumption, carbondioxide production, respiratory quotient and
metabolic rate were integrated over periods of five minutes. These periods
were averaged to obtain average hourly postprandial energy expenditure rates
(PEE). The total DIT was defined as the integrated (over the total
postprandial period (Tp)) difference between the preprandial (RMR) baseline
energy expenditure rate and the average postprandial energy expenditure rate,
ie, DIT= Tp * (PEE-RMR). Occasionally energy expenditure at the end of the
postprandial period was lower when compared to the RMR. For these subjects RMR
was redefined as the mean of the actual RMR measurement and the lower
postprandial rate of energy expenditure. After the assessment of the thermic
effect of food, subjects voided and urine was collected for determining the
total amount of total urinary nitrogen. Total nitrogen excretion was assessed
by the Kjeldahl method.
The energy content and macronutrient composition of the test meals were
chemically measured in a random 5 percent sample of each batch of test meals.
Protein (64), fat (65) and carbohydrates and lactic acid (66) were determined
after assessing moisture and ash content (66).
Generally, subjects were familiarized with the equipment for assessing gas
exchange by measuring resting energy expenditure on a seperate day for between
30 and 45 minutes before the start of the actual experiment.
-77-

Body composition
Body weight was measured to the nearest 0.05 kg (Berkel ED-60T, Rotterdam, the
Netherlands) in subjects wearing underwear or swimming clothes only, after an
overnight fast, or at least 4.5 hours after the last meal, and after voiding.
The weight of the fat and the fat-free body mass was determined by
hydrodensitometry. Subjects were weighed underwater with simultanuous
assessment of the residual lung volume by a helium dilution technique. Total
body density was calculated and body fat percentage, fat-free body mass and
body fat mass were estimated using Siri's formula. Fat-free body mass was used
as an estimate of the metabolically active mass of the body (69).
Statistics
Variability of the method and within-person variability
Reproducibility trials were analyzed using the repeated measures model as
described by Winer (70). Time of measurement was treated as the within-subject
factor. The within-subject factor was treated in the analysis of variance as a
fixed effect factor, a factor for cases (subjects) was used as the only random
effect factor. The subject factor was crossed with the within factor, ie, each
case was observed at all combinations of the within factor. The mean square of
the error term of the within-subject factor was taken as the best unbiased
estimator of the within-subject variance of the variable under study. In study
5 in men a significant time of measurement, ie, sequence, effect on RMR was
observed. The estimator of the within-subject variance in RMR was corrected,
according to Winer (70) for this effect. Assumptions required for the validity
of F tests in the fixed-effects analysis of variance model are that the
observations are mutually independent, normally distributed, and have equal
variances. In the repeated-measures model observations obtained in the same
subjects are generally correlated. As a consequence F test were made in a way
that allows some relaxation of the assumptions of complete independency, as
described by Winer (70) and in Dixon (71).
For each subject we also calculated the coefficient of variation (CV) of
repeated RMR and DIT measurements.
Reproducibility of body composition measurements has been reported before
(72).
-78-

Between-person variability
For each person RMR, DIT, RQ and fuel utilization rates were averaged over the
repeated measures. Analyses of the between-person variance of RMR, DIT, RQ and
fuel utilization rates were based on these average values. Since part of the
total between-person variance in RMR, DIT, RQ and fuel utilization rates could
be related to differences among individuals in body weight, body composition,
age (RMR) or macronutrient and energy intake (RQ, DIT, fuel utilization
rates), multiple regression analyses were used to estimate the variance among
individuals in these variables accounted for differences in body weight, body
composition, age or macronutrient and energy intake. The variance not
accounted for by the linear effects of the various predictor variables
(covariates) equals the residual mean square of the error term of the analysis
of variance of the regression models. This residual variance is referred to as
the 'adjusted' (for the linear effects of covariates) between-person variance.
RMR, fasting RQ and fuel utiliation rates were adjusted for fat-free mass, fat
mass and age. DIT and postprandial RQ and fuel utilization rates were adjusted
for the same variables including the energy or macronutrient intake with the
test meal. Normal probability plots of the residuals were used to evaluate
differences from the normality assumptions of the various regression models.
If no deviation from normality occurred the adjusted between-person variance
was assumed to be distributed as a Chi-square distribution.
- Between-group differences in variables of energy metabolism were tested
using normal analysis of variance procedures. In addition, analysis of
variance statistics not assuming equality of group variances in each group,
ie, the Welch and Brown-Forsythe statistic (70,71), were used to evaluate the
significance of group differences.
- Differences in variables between two treatments, ie, pre-ovular versus
post-ovular and morning versus afternoon energy expenditure rates, were
evaluated using the paired (within-person) comparison t-test with a two-sided
rejection region and a confidence level of 95 percent.
- Correlation coefficients were computed as Pearson's product-moment
correlation coefficients. Adjusting for linear effects of a variable on a
correlation was performed by the partial correlation procedure.
-79-

- All descriptive statistics are computed as mean + sem.
RESULTS
Accuracy of the method
The respiratory quotient of 60 ethanol combustions test was found to be 0.666
+ 0.001 (range: 0.635 - 0.695) with a coefficient of variation of 1.5 percent.
In 20 whole system checks the observed VD? and VCO, were 340 + 10 1/d and 227
+ 8 1/d, respectively, with a RQ of 0.668. This would result in a calculated
energy expenditure of 6929 + 192 kJ/d, with a coefficient of variation of the
method of 2.8 percent. Oxygen was underestimated with 1.5 percent and
carbondioxide with 1.3 percent.
Variability of FHR, DIT, RQ and fuel utilization rates in persons
Table 4 shows the within-person variability of RMR and DIT in men. The 2
within-person variances were, respectively, in RMR 0.095 + 0.012 (kj/min) , in
DIT 2172 + 526 (kJ)2 or 5.78 ± 1.28 (percent)2 of the energy intake. The
Table 4. Results of reproducibility studies of RMR and DIT in men.
StuaV 1 Stucty 2 Stuay 3 Stuay 4 Stuay 5 Stuay 6 Total < Range >
(n = 12) (n = 5) • (n = 4) (n = 10) (n = 6 ) (n = 12) (n = 49)
FMR (kj/hrin)
Dn (kJ)
Drr-% ME (%)
5.34+0.27
185±20
7.17±0.76
Within-person variance:
RMR (kj/iirin)
n r r ( k j |
nrr-% ME (%)
Within-person CV's:
RMR
DTT
nrr-% ME
0.112
3146
4.90
6.0+1.5
27.7+6.7
27.9+6.7
5.46+0.25
188+11
9.32+0.53
0.117
1311
3.28
5.4+2.1
14.1+4.5
14.2+4.7
5.24+0.29
123+11
9.08+0.83
0.108
1166
6.58
5.9+1.2
22.6+3.2
22.8+3.1
4.76+0.14
134+13
7.13+0.71
0.115
3722
10.38
6.9+0.9
39.4+5.4
39.4+5.4
4.92+0.16
178±15
8.91+0.76
0.044
1513
3.77
5.2+0.2
22.0+5.4
21.7+3.3
4.69+0.10
--
0.072
--
5.4+0.5
--
5.02+0.09
164+9
7.94+0.37
0.095+0.012
2172+526
5.78±1.28
6.O1O.6
27.5±3.0
27.6±3.0
4.16-7.29
76-329
4.02-12.76
0.044-O.115
1166-3722
3.28-10.38
0.1-16.5
0.9-68.7
1.0-69.1
Vtelues are given as WBOD ± sea * SbicV 6 not included in calcul^ticn
M l = resting •etabolic rate; EOT = diet-indiced
coefficient of variation
therBogeneeis; %-*K = percentage of energy contait of t e s t Maal; CV =
-80-

calculated coefficients of within-person variation were, respectively, on
average 6.0 + 0.6 percent for the RMR and 27.5 + 3.0 percent for the DIT. The
within-subject variability in RMR was, expressed as the root mean square of 2
the pooled within subject variances (SD ), 0.308 kJ/min. If it is assumed
that the intra-individual variability in RMR of a subject is normally 2
distributed and uncorrelated with the random measurement error (SD ), then 2 2
the contribution of the subject's variance (SD ) to the total observed SD
is given by:
SDs =V(SDw2-SDm
2).
This results for men in an SD of 0.277 kJ/min corresponding to a method-free
coefficient of within-subject variation of 5.5 percent.
The correlation between the calculated coefficients of variation for the RMR
and for the DIT was not significant (r = 0.01). The average intercorrelatj.ons
in men among the repeated RMR and DIT measurements were 0.72 and 0.22,
respectively.
Table 5 shows the within-person variability of RMR and DIT in women. The 2
within-person variances were, respectively, in RMR 0.070 ± 0.009 (kj/min) , ? 2
and in DIT 1247 + 143 (kJ) or 4.66 + 0.70 (percent) of energy intake. The
calculated coefficients for the within-person variation were 6.0 + 0.4 for the
RMR and 28.5 + 2.6 percent for the DIT. The SD of the RMR in women was 0.265
kJ/min, the method-free SD was 0.242 kJ/min corresponding to a method-free
coefficient of within-subject variation of 6.1 percent.
Similar to men, in women the calculated coefficients of variation for the RMR
showed a non-significant correlation with those of the DIT (r«0.06). The
average intercorrelations in women among the replicate measurements of the RMR
and DIT were, respectively, 0.80 and 0.41.
Except for study 5 in men, none of the studies showed a significant time of
measurement effect on RMR and DIT.
Table 6 and 7 show within-person variances in fasting and postprandial RQ's
and fuel utilization rates in men and in women, respectively. Both fasting and
postprandial RQ's and nonprotein RQ's showed relatively low within-person
variance. Average CV's for the intra-individual variation in these variables
were between 4 and 6 percent. Intra-individual variation in fuel utilization
rates was generally higher when compared to variation in RQ's. The lowest CV's
were observed for protein oxidation rates, ie, on average 20 percent in men
-81-

Table 5. Results of reproducibility studies of RMR and DIT in women.
EMR (kj/tnin)
DIT (kJ)
DIT-% ME (%)
Study 1
(n=6)
3.88+0.io
127+17
6.30+0.84
WLthin-person variance:
FJ1R (kJ/tnin)
DIT (kj>2
Drr-% H E (%)2
0.088
868
2.72
Study 2
(n= 5)
3.98+0.14
66+10
4.89+0.77
0.081
1008
5.80
Stuoy 3
(n= 5)
3.91+0.21
114+17
5.78+0.86
0.058
1627
4.24
Study 4
In» 6)
3.59+0.18
128+14
6.60±0.7
0.051
1089
2.68
Stuoy 5
(n = 17)
4.18+0.16
128+7
7.03+0.3
0.096
1736
5.82
Stuoy 6
(n = 15)
3.97+0.13
89+8
6.69+0.57
0.043
1155
6.69
Total
(n= 54)
3.98+0.07
110±5
6.48+0.26
< Range >
3.10-5.70
25-205
1.84-11.23
0.070+0.009 0.043-0.096
1247+143
4.66+0.70
868-1736
2.72-6.69
Within-person CV's:
SMR 6.8+1.5
DIT 24.0+13.8
DTT-% ME 24.1+13.8
6.2+1.6 6.2+0.8
41.2+9.1 32.5+6.5
41.4+9.1 32.7+6.5
5.7+0.8 7.0+0.4
22.7+3.1 28.9+2.6
21.5±3.1 29.3+2.7
4.8+0.6
35.2+6.4
35.6+6.4
6.0+0.4 0.5-13.2
28.5+2.6 0.1-72.0
28.6+2.6 0.1-72.2
Values are given as aeon ± seal
RR = resting metabolic rate; EOT
coefficient of variation
= (net-induced themogenasis; %-M3 = percentage of energy content of t e s t Meal; OT =
Table 6. Results of reproducibility studies of fuel u t i l i za t ion rates in men.
Variables studied
- Pastabsorptive:
1.
2.
3. Fat oxidation
4. CHO oxidation
BQ
npBQ
(nq/nàn)
(nq/Wn)
5. Protein oxidation{nq/todn)
- Postprandial :
6.
7.
8. Fat oxidation
9. CHD oxidation
FQ
npBQ
(mg/hon)
(mj/hrin)
Stuoy 1
(n = 12)
0.81+0.01
0.81+0.01
62+6
85+11
78+5
0.88+0.01
0.90+0.02
39+6
198+13
Study 2
(n = 5)
0.83+0.01
0.84+0.02
61+9
111±9
57±4
0.88+0.01
0.90+0.02
44+9
215±9
Stuoy 3
(n = 4)
0.80+0.01
0.80+0.01
68+5
82+6
58±12
0.83+0.01
0.83+0.01
64±5
134+10
Study 4
(n = 10)
0.84+0.01
0.85+0.01
48±5
115±8
56±3
0.88+0.01
0.90+0.02
37±8
178+11
Study 5
(n = 6)
0.85+0.01
0.86+0.01
44+5
120+4
57±3
0.89+0.01
0.92+0.01
30+3
215±11
Total
(n = 37)
0.83+0.01
0.84+0.01
56+3
102+5
64±3
0.88+0.01
0.90+0.01
41+3
190+7
< Range >
0.75-0.87
0.73-0.90
26-92
17-139
40-112
0.79-0.94
0.79-0.99
4-96
112-268
Within-person variance:
1.
2.
3.
4.
5.
6.
7.
8.
9.
Fat oxidation
CBD oxidation
Protein oxid
Fat oxidation
O D oxioation
RQ.10
npRQ.lo"
(mj/inin)
(nq/iivin)
(mg/inin)
RQ.10" 3
npEQ.10-
(nig/tain)
(ing/tairi)
1.63
2.84
235
2068
137
3.70
6.06
1127
7028
2.16
3.81
403
2592
195
1.33
1.86
174
2961
1.07
1.78
263
989
322
0.70
1.66
214
1095
1.37
1.51
360
1370
52
1.00
1.82
241
1252
0.89
1.61
200
791
83
0.94
1.37
204
1406
1.42+0.22
2.31+0.44
292+131
1562+337
158+48
1.53+0.55
2.55+0.88
392+184
2749+1121
0.89-1.63
1.51-3.81
200-403
791-2592
52-322
0.70-3.70
1.37-6.06
174-1127
1095-7028
Values are given as n a n ± sa t
BQ = respiratory guotioit; np =ncn protein; CH> = carixhydrate (glycogen or gluoose); oxid = oxidation
-82 -

and 19 percent in women. Fasting fat oxidation rates showed CV's of,
respectively, 31 percent in men and 30 percent in women. Fasting
carbohydrate, ie, glycogen, oxidation rates showed higher CV's, ie,
of 40 percent in men and 30 percent in women. Within-person CV's for
postprandial fat oxidation were 49 percent in men and 50 percent in
women, whereas the CV's for postprandial glucose oxidation were 27
and 20 percent, respectively. Average fasting RQ's were 0.83 + 0.01
with a range of 0.75 to 0.90. Postprandial RQ's were on average 0.88
+0.01 with a range of 0.79 - 0.94. In none of the subjects we
observed average nonprotein postprandial RQ's exceeding 1.00.
Table 7. Results of reproducibility studies of fuel utilization rates in women.
Variables studied
- Postabsorptive:
1. »0
2. npHC
3. Fat oxid (nvj/hdn)
4. O O oxid (mg/hin)
5. Protein oxid (mg/hrin)
Study 1
(n= 6)
0.83+0.01
0.84+0.01
43±3
83+7
38+4
Study 2
(n = 5)
0.82+0.01
0.82+0.01
49+3
73+3
42+2
Study 3
(n= 5|
0.86+0.01
0.88+0.02
30+6
103+5
47+2
Study 4
(n = 6)
0.87+0.01
0.89+0.01
25+3
103+4
42+4
Study 5
(n = 17)
0.83+0.01
0.83+0.0
44+3
81+4
54±2
Study 6
(n = 15)
0.82+0.01
0.83+0.01
40+4
69+7
62+4
Total
(n= 54)
0.83+0.00
0.84+0.01
40+2
81+3
51+2
< Range >
0.75-0.90
0.73-0.93
13-76
13-123
21-88
- Postprandial:
6 . HB 0.89+0.01 0.87+0.01 0.88+0.01 0.90+0.01 0.88+0.01 0.88+0.01 0.88+0.00 0.80-0.93
7. npBQ 0.90+0.01 0.89+0.01 0.91+0.02 0.92+0.01 0.90+0.01 0.90+0.01 0.90+0.01 0.80-0.99
8. r a t oxid (nq/tain) 30±2 32±2 27+7 21+2 30+2 27+4 28+2 2-52
9. OD oxid (ng/tam) 162+6 140+10 153+7 159±8 160+9 141+9 152+4 71-220
Wi thin-person variance:
1.
2.
3.
4.
5.
6.
7.
8.
9.
Fat oxid
CK> oxid
RQ.10
npRQ.10"3
(nq.min)
(mo/tain)
Protein oxid(mg/hin)
Fat oxid
O O oxid
BQ.10
npPQ.10"3
(irç/hdn)
(mcfftdn)
0.97
1.50
137
640
15
0.99
1.52
174
585
0.48
0.76
82
420
102
1.10
1.56
181
1296
1.33
1.33
193
808
85
1.10
1.07
180
998
1.11
2.21
150
329
58
1.71
3.08
255
406
1.35
2.51
235
959
118
1.53
2.68
260
1184
0.38
0.71
57
381
174
1.23
2.56
155
1126
0.94+0.17
1.50+0.30
142+27
590+104
92+22
1.28+0.12
2.08+0.33
201+18
933+145
0.38-1.33
0.71-2.51
57-235
329-808
15-174
0.99-1.71
1.07-3.08
155-260
406-1296
Values a i e given as Been + sea
BQ = respiratory quotient; np = nonprotein; OD = carbohydrate (glycDgen/glucose); oxid = oxitfetion
-83-

Impact of control of the antecedent diet on within-person variability of PMR,
DIT, RQ, and fuel utilization rates
The results, presented for men in Tables 4 and 6 (study 3) and for women in
Tables 4 and 7 (study 2 ) , indicate no clear impact of control of the
antecedent diet on the within-person variability of RMR, DIT, RQ and fuel
utilization rates, when comparing the various estimators of within-person
variances in variables of energy metabolism among the different studies.
Variability of RMR, DIT, RQ and fuel utilization rates between persons
Figure 3 and Table 8 show variability of the method, within-person variability
and between-person variability in RMR and DIT.
resting metabolic rate (kJ/min)
0.20-i
n i l I feg WOMEN
f=JMEN
-E7HG0 WITHIN A3J.3ETW. BETWEEN
cierXi-.S'jcsd fr.armoasnesis loglkJ] fy/A WOMEN
2.C0-
'£\ i
1 • i
S
dier-induced fhermogenesis (%)'
MO-MEN
MÎ7H00 WITHIN A0J.9ETW. 5ETWEEN
U)0-
2J00
0 1
f \ WOMEN
METHOO WITHIN ADJ.BETW BETWEEN
Figure 3. Within- and between-person variances in men and women of resting metabolic rate and diet-induced thennogenesis.
The between-person variability in RMR was significantly higher, even after
adjusting for covariates, compared to the within-person variability. The ratio
of (adjusted) between-person to within-person variance was 2.2 in men and 2.0
-84-

in women. In contrast, no significant difference between (adjusted)
inter-individual and intra-individual variation in DIT was found in men, with
ratios of between and within-person variability around 1. In women the
adjusted beteen-person variance in DIT was even slightly lower than the
within-person variation in DIT. The ratio's of (adjusted) between-person and
within-person variation in RQ's and fuel utilization rates were all within the
range of 0.5 to 1.7. Except for postprandial RQ's and fat oxidation rates, no
significant differences between the (adjusted) inter-individual and
intra-individual variations were found.
Table 8. Between-person variance of RMR, DIT, RQ and fuel utilization rates in men and women.
ra« DTP
nrr-% >E
Postabsorptive
Fat oxidation
CHD oxidation
Protein oxidation
Postprandial :
Fat oxidation
OD oxidation
* = variance
{KJ/ndn)2
(kJ)2
(%)2
na . icf3
nBQ. l<f3
(m^/hän)
{mq/trdn)
(mg/toiin)
BQ . l<f3
nBQ. 10~3
(inj/hün)
inq/aàn)
adjusted for fat-free i
Between
0.415
4643
5.16
1.02
1.76
361
872
243
1.23
2.21
444
1716
ns s , fat nass.
Men
age
M j . between*
0.212
2626
5.31
1.80
1.00
379
1164
160
1.20
2.20
424
1541
(pœtabsoiptive ) n i
Between
0.278
1385
3.65
0.961
0.73
208
474
183
0.73
1.37
134
868
Women
A3j. Between*
0.142
892
3.27
0.80
1.50
161
405
86
0.70
1.30
119
817
energy or aacranutrient intake
BMR = resting Metabolic zate; DIT = diet-induced theEaogenesis; % fE = percentage of energy content of test aBal; BQ =
respiratory quotient; np = nonprotein; (3D = carbohydrate (glycogen or glucose)
Constancy of the RMR
The results of the three studies on the constancy of the RMR are presented in
Table 9. None of the three studies showed a significant diurnal variation in
the RMR. In the first study the average difference between morning RMR and
afternoon RMR was 0.14 + 0.09 kJ/min, ie, 2.9 + 1.9 percent of morning RMR.
-85-

In the second study the difference between morning and afternoon RMR was -0.03
+ 0.06 kJ/min, ie, -0.7 + 1.4 percent of morning RMR. In the third study no
significant change in RMR over a 2.5 hours measurement period was found. The
difference between the RMR assessed over the first 30 minutes of this period
and the RMR measured over the last 30 minutes was 0.09 + 0.17, ie, 1.9 + 3.6
percent of the initial RMR value.
Table 9. Results of studies on the constancy of the RMR.
Variables
Age
Body weight
Body fat
Morning WR
Afternoon WIR
Morning W©
0 - 3 0 min
30 - 60
60 - 90
90 -120
120 -150
yrs
kg
% kJ/lnin
kJ/inin
kJ/min
kJ/min
kJ/min
kJ/min
kJ/min
Stuty 1 (n = 10)
22.2±0.5
75.5+2.2
15.1+1.2
4.81+0.18
4.67+0.11
----
Study 2 (n = 20)
23.1+0.5
65.0+2.1
19.4+1.5
4.58+0.14
4.61±0.14
----
Study 3 (n = 12)
24.8+0.6
70.2+1.2
15.0+1.4
--
4.67+0.11
4.78+0.11
4.71+p.ll
4.68+0.10
4.76+0.10
indues axe given as aean ± seal * W/r ratio UJ9, age in van: 32.5 + 0.9 yrs . weight: 71.4 ± 2.3 kg, body fat content: 14.9 + 1.2 percent; age in i
22.6 + 0.4 yrs , w ight : 65.0 + 2.0 kg, body fat content: 23.8 + 1.4 percent
EKl = resting Metabolic rate
Impact of phase of the menstrual cycle on RMR and DIT
Table 10 shows the results of the impact of the phase (pre-ovular versus
post-ovular) of the menstrual cycle on RMR and DIT. No significant difference
in RMR and DIT between the two phases of the cycle was found. The average
number of replicates in each phase of the cycle was 2.9 for the RMR and 2.0
for the DIT. The within-person coefficients of variation in RMR and DIT of
these women were compared with those of the women using oral contraceptives.
CV's of RMR were, respectively, 5.7 + 0.7 percent for the women with a normal
menstrual cycle and 7.5 + 0.7 for the women using oral contraceptives. CV's
for DIT were, respectively, 31.5 + 3.4 for women with normal menstrual cycles
and 26.1 + 4.0 for women using oral contraceptives. A significant difference
(p<0.05) in CV's for RMR between both groups was found; CV's for DIT did not
differ significantly between both groups.
-86-

Table 10. RMR and DIT of women in the pre-ovular and post-ovular phase of the menstrual cycle.
Subject no
1.
2.
3.
4.
5.
6.
7.
8.
9.
10.
11.
12.
13.
14.
15.
16.
17.
IS.
19.
20.
21.
22.
23.
ffean ± sem
Age
(yrs)
20
23
22
25
24
21
21
20
25
22
22
42
32
43
41
44
39
44
40
45
40
36
40
31.7±2.0
Weight
(kg)
74.6
59.3
62.1
68.7
65.0
64.3
61.1
65.5
51.8
67.1
50.0
81.2
101.7
74.2
74.2
65.5
72.2
92.7
103.4
91.2
101.3
95.9
83.6
75.1±3.3
FFM
(kg)
54.5
43.0
43.9
46.5
47.9
45.8
43.5
45.2
39.1
44.3
40.3
43.9
50.4
50.1
42.6
40.3
43.1
48.4
47.5
50.7
46.6
50.7
41.5
45.6+0.8
PMÏ pre
(kJ/tnin)
3.78
3.32
3.87
3.76
4.70
4.08
3.90
3.86
3.62
4.13
3.93
3.72
3.72
3.69
3.54
3.84
3.75
5.54
5.62
4.00
3.94
3.86
3.90
4.00+0.12
FMI post
(kj/hûiï)
4.00
3.41
3.76
3.84
4.65
4.30
4.21
3.82
3.83
3.67
3.97
4.30
3.67
3.47
3.25
3.43
3.81
5.87
5.54
4.13
4.03
4.04
4.15
4.05+0.13
DIT pre
(kJ)
100
127
104
114
164
147
169
151
157
72
49
116
79
94
98
152
158
147
123
72
138
122
93
119+7
DIT post
(U)
62
123
111
81
126
155
152
127
171
95
45
100
158
112
112
198
94
65
148
76
112
196
111
119+8
DTT pre
(%)*
5.09
6.44
5.29
5.82
8.39
7.35
8.45
7.55
7.85
5.44
3.71
6.41
4.47
5.20
5.43
8.41
8.75
8.12
6.99
3.97
7.63
6.81
5.32
6.47+0.32
DIT post
(%)
3.18
6.22
5.62
4.12
6.41
7.75
7.60
6.35
8.55
7.12
3.35
5.52
8.73
6.27
6.29
10.95
5.26
3.60
8.18
4.36
6.21
10.91
6.37
6.47+0.44
Bqvessed in percentage of energy UUMJMHL of t e s t Beal
Pbx cases 1 - 5 nailer of replicate aeasureaents for each these of cycle are 6 for HH and 3 for DIT; for cases 6 - 9 2
replicates for M t and none for DTT and for cases 10-23 2 replicates for RH and 2 for DIT
FM = fat-free BBSS; RK = resting aBtabolic rate; DTT = diet-induced theraogEnesis; Pre = pre-ovular; ftjst^ post-ovular
Impact of energy intake and duration of postprandial measurement on the
calculation of DIT
Figure 4 shows postprandial energy expenditure rates in three groups of men,
who ingested different amounts of energy in the meals used to evoke the
thermic response. No significant difference among the three groups in the
postprandial rise of energy expenditure during the first two hours of the
postprandial period was found. In the third hour of the postprandial period,
the postprandial rate of energy expenditure was significantly lower in the
group with the low energy intake compared to the groups with energy intakes of
-87-

diet
1.20-
induced thermogenesis (kJ/min . n = 21 Eir
T T à n = 12 Ein = ? Tv • n= 4 Ein =
• n = 21 E in ~ 1950 kJ 2550 kJ 1340 kJ
0 1 2 3 4 time after meal ingestion (h)
Figure 4. Diet-induced thermogenesis (mean + sent) in men after ingestion of meals with different energy content.
on average 1952 kJ and 2550 kJ. In subjects with the low energy intake 86
percent of the total observed thermic effect (over 3.5 hours) was observed in
the first two hours of the postprandial period, compared to 75 percent in
subjects with higher energy intakes. At the end of the postprandial
measurement period energy expenditure was elevated 4 percent above the RHR in
subjects of the groups with higher energy intakes and 0 percent in subjects
with low energy intake. In seven subjects energy expenditure at the end of the
postprandial period was lower compared to RMR, with a minimum of 98 percent of
the RMR. Total DIT values increased significantly on the meals with higher
energy content. The correlation coefficient (r) between total DIT and energy
intake in the testmeal was 0.39 (p=0.05).
No significant correlation was found in men between DIT and, respectively,
body weight (r = 0.11), the fat-free mass (r = 0.07), fat mass (r = 0.16) or
age (r = -0.02), adjusted for linear effects on the correlations of
differences in energy intake in the test meal. No difference in DIT among the
three groups was observed in DIT expressed as a percentage of the energy
content of the test meal, ie, 8.16 ± 0.46 percent (1952 kJ), 7.17 ± 0.76
-88-

percent (2550 kJ) and 9.08 + 0.83 percent (1340 kJ).
Figure 5 shows increases in postprandial energy expenditure for female
subjects receiving either meals of on average 1884 kJ, or of on average 1321
kJ.
induced thermogenesis (kJ/min
. n = 20 Ein» 1320 kJ i n = 34 Ein=1880 kJ
0 1 2 3 4 time after meal ingestion (h)
Figure 5. Diet-induced thermogenesis (mean + sem) in women after ingestion of meals with different energy content.
There was a significant difference in the rise of postprandial energy
expenditure during the second and third hour of the postprandial period
between both groups. In subjects receiving the low energy meals, on average 83
percent of the total thermic response was measured in the first two hours of
the postprandial period. In subjects receiving the higher energy meals, on
average 66 percent of the total response was observed in the first 120
minutes. At the end of the postprandial measurement period, energy expenditure
was still elevated by 7.2 + 0.8 percent in the group receiving the higher
energy meals and by 6.5 + 1.3 percent in the group receiving the lower energy
meals. In four women lower rates of energy expenditure were observed at the
end of the postprandial measurement period when compared to the RMR, with a
minimum of 98 percent of the RMR. Total DIT values were significantly higher
(p<0.05) in women with higher energy intakes in the test meals. The
correlation coefficient between DIT and the energy content of the test meal
-89-

was 0.53 (p<0.001) in women.
No significant correlations were found in these women between DIT and the size
of the fat-free mass (r = 0.02). DIT was significantly correlated with body
weight (r = 0.28, p<0.05)), body fat mass
(r = 0.33, p<0.05) and age (r = 0.35, p<0.05), adjusted for linear effects on
the correlations of differences in energy content of the test meal. No
significant differences were found between both groups in DIT expressed in a
percentage of the energy content of the test meal, respectively, 6.64 + 0.29
percent in the group with high energy intake and 6.24 + 0.50 in group with low
energy intake.
DISCUSSION
This study was performed to evaluate various methodological aspects of the
assessment of resting metabolic rate (RMR), diet-induced thermogenesis (DIT)
and in vivo fuel utilization rates. It is the first study that reports data on
the reproducibility of measurements of DIT in men and women using a ventilated
hood system. At the start of the study a ventilated hood system was built in
order to be able to measure the rate of energy expenditure continuously for
prolonged periods of time with minimal discomfort for the subject. The
accuracy of this method in assessing energy expenditure was tested and studies
were performed to assess the within-subject variability in RMR and DIT. The
impact of the energy intake of the ingested meal, of the duration of the
postprandial measurement on DIT, of the phase of the menstrual cycle on RMR
and DIT, of control of the antecedent diet on the within-person variability of
RMR and DIT and of diurnal variation on RMR were also investigated. All
studies, with the exception of two studies in women (Table 2, study no 3 and
4), were carried out in a period of at most 6 weeks duration to prevent
seasonal effects on energy expenditure.
The results of this study have important consequences for the study of
postprandial human energy metabolism. A finding of great importance is the
relatively large within-subject variation in DIT, which could not be
contributed to variation in the method and which seemed not subject to
reduction when the antecedent diet was controlled.
-90-

Accuracy of the method and within-subject variation in RMR, DIT, RQ and fuel
utilization
The random and systematic error of assessing energy expenditure with indirect
calorimetry using a ventilated hood system was in accordance with the data on
the accuracy of the indirect calorimetry method used in respiration chambers
(73,74). The random error was 2.7 percent and the systematic error was 1.5
percent. The variability of the method was much smaller when compared to the
within-subject variability in the RMR and in DIT. The variability in the
method contributed less than 10 percent to the total observed within-person
variability in RMR. The total CV for repeated within-person measurements of
RMR were also calculated as the average of the individual CV's. Our results
agree well with other reports on the within-person variability in RMR, which
report average within-subject CV's for the RMR ranging between 2 and 7 percent
(75-78). It is not possible to partition the method-free within-subject
variation into specific sources. RMR measurements were performed under
strictly standardized conditions, but there was some variation in conditions
under which the RMR was assessed. At each RMR measurement subjects watched
different motion pictures, which may have caused variation in RMR
measurements. In addition, there may have been variation among the repeated
measurements within a subject in subject's behavior, ie, one day a subject
lies calmly, awake, motionless in the same semi-recumbent posture under the
hood, breathing regularly, on another day a subject dozes off frequently, is
restless, has many spontaneous small movements and changes of posture and is
breathing irregularly with alternating periods of hyper-and hypoventilation.
Finally, there may be biological within-person variation in RMR from day to
day. This variation could be related to variations in feeding, drinking or
activity pattern in the days before the RMR measurements. In most of the
studies here reported, subjects were measured after an overnight fast.
Subjects were eating normal balanced diets, but their diets were not under
strict control.
There is considerable within-person variation in energy and nutrient intake
from day to day (78). This variation may be a source of additional variation
in the RMR, irrespective of the fact that the acute effects of food intake on
RMR were minimized by measuring in the postabsorptive state. We tested this
hypothesis by measuring the within-subject variation in RMR in subjects who
were put on a controlled dietary intake regime for two weeks and whose
activity pattern remained as constant as possible throughout the experimental
-91-

period. Control of the antecedent diet did not seem to have marked effects on
the within-person variability, suggesting that variation in subject's behavior
and in measurement circumstances may be greater sources of within-subject
variation than the absence of strict control of the antecedent diet.
In contrast to the relatively small within-person variation in RMR, the
intra-individual variation in DIT was much larger. In this study DIT
reproducibility was found to be of similar magnitude in obese when compared to
non-obese women. The within-subject variation seemed not subject to systematic
reduction when the antecedent diet was controlled, but it should be noted that
for these subjects no estimates were available of the within-person
variability of DIT under normal measurement conditions.
Comparison of the within-person variability of DIT measurements as observed in
this study with data of other studies is difficult. To the best of our
knowledge no other groups have published data on the reproducibility of DIT
measurements obtained by a ventilated hood system, have been published.
Ravussin et al. (74) report a high within-person variability in DIT calculated
from the difference between 24-hours energy expenditure, corrected for
work-induced thermogenesis, and the basal metabolic rate extrapolated to a 24
hours basis. The lack of data on the reproducibility of DIT measurements is
surprising. Differences in DIT have become a subject of paramount interest for
many groups involved in research on, for example, the etiology of obesity
(13-40).
The sources of the within-person variation in DIT may be similar to those of
the RMR, ie, variation among trials in measurement circumstances (motion
pictures), and in subject's behavior. Since DIT is a response of relatively
small magnitude, assessed over a prolonged period, these factors may have a
relatively greater impact on the reproducibility of DIT measurements compared
to their impact on the reproducibility of the RMR measurements. Subjects with
a relatively low reproducibility of RMR measurements had not necessarily the
highest within-person variation in DIT. This was illustrated by the
non-significant correlation between within-person variation in the RMR and in
DIT. An additional source of intra-individual variation in DIT may be
biological day-to-day variation in the postprandial processing of nutrients.
Acheson et al. (79) showed that the state of the body's glycogen stores
influenced DIT. The amount of glycogen stored in the body is affected by diet
and physical activity (80). Therefore in this study only subjects eating
normal mixed meals were allowed to participate. Subjects were also instructed
not to perform heavy exercise on the day preceding the DIT assessment to
-92-

prevent serious depletion of the body's glycogen stores.
We found that most subjects considered the DIT measurements as tedious
measurements, because of their long duration and the requirement to perform
the measurement under RMR conditions. Diverting their attention by showing
motion pictures was essential to prevent the subjects from falling asleep or
becoming restless and bored.
Within-subject variation in RQ and fuel utilization rates
Postabsorptive and postprandial respiratory quotients showed good
reproducibility. Within-person CV's for repeated measurements were, in
general, below 6 percent. Fuel utilization rates, both postabsorptively as
postprandially, showed greater within-subject variances. This indicates that
the type of metabolic mixture utilised in the postabsorptive or postprandial
phase is relatively constant in an individual. The amount of nutrients
oxydized to obtain a given type of metabolic mixture may show much larger
within-subject variation. Control of the antecedent diet did not seem to
reduce the within-subject variation in RQ's and fuel utilization rates.
Between-subject variation in RMR, DIT, RQ and fuel utilization rates
In this study it was found that the between-person variation in RMR, with or
without adjusting for the covariates age, fat-free mass and fat mass was
significantly greater when compared to the within-subject variation. This
finding confirms results obtained in a previous study (74). The reasons why
individuals of a given age, fat mass and fat-free mass may differ in RMR are
now subject of much research (6). Part of the (adjusted) inter-individual
differences in RMR may be related to differences in hormonal, ie, thyroid,
status or activity of the sympathetic nervous system (6).
The inter-individual variations in DIT, RQ and fuel utilization rates were,
after adjusting for covariates, generally of the same magnitude or smaller in
comparison to the intra-individual variation.
-93-

Importance of within- and between-person-variation in RMR, DIT, for study
design and evaluation
Knowledge of the within-person and between-person variation in variables of
energy metabolism is of paramount importance for the design and evaluation of
studies assessing changes in RMR or DIT within the same individual during a
treatment, or in the comparison of RMR or DIT between independent samples of
individuals classified as high or low with respect to, for example, body fat
content. In the latter case, average RMR and DIT for individuals classified
into these two levels are generally compared to see if they are significantly
different. If intra-individual variability is large and the number of
measurements for each subject is small, the power of the within-subject or
between-group comparisons may be low. This means that the probability of
rejecting the null hypothesis of no effect of treatment (paired comparison) or
of no difference in variables of energy metabolism (between group comparison)
may be small, even if the null hypotheses are false and the true treatment
effects or true between-group differences are quite large. A well-designed
study aiming at the assessment of treatment-induced within-person changes in a
variable under study or at the comparison between interesting variables of
independent sample means should, on the one hand, have a great chance, ie,
power, of detecting a true effect of treatment or difference and, on the other
hand, a small chance, ie, confidence, on falsely detecting an effect or
difference. In other words the type 1 error (false positive) and the type 2
error (false negative) should be sufficiently small. The probability of the
type 1 error, generally called (X, is specified by the investigator. However,
the probability that a significant result will be obtained if a real effect or
difference exists, depends largely on the sample size. As the total sample
size increases, the type 2 error, generally called ß, decreases. This means
that if a statistical test fails to reach significance, the power of the test
becomes a critical factor in reaching an inference. The failure to achieve
statistical significance may be related more to the low power of an experiment
than to the actual lack of effect of a treatment or difference between groups.
This means that an experiment with inadequate sample size is doomed to failure
before it begins. This may serve only to confuse the issue of determining the
effect of a treatment or of assessing differences between groups. Therefore
each investigator should take steps to ensure that the power of an experiement
is sufficient to justify the effort involved. If an experiment has great
power, say 0.95, the failure to achieve significance may be properly
interpreted as probably indicating a negligible treatment effect or negligible
-94-

relevant between-group differences. Many statisticians, but not all, argue
that the proper interpretation of a negative result should be based upon a
consideration of the power of an experiment (81-83). In appendices 1 and 2
sample size calculations are given at specified oc- and ß-levels and specified
true treatment effects or between-group differences in DIT.
From these calculations it appears that studies with sample sizes smaller than
10 persons and performing one measurement per subject may have power levels
below 80 percent of assessing true, relatively large, ie, 25-50 percent,
treatment effects or between-group differences in DIT.
The question rises whether these findings have consequences for the
interpretation of studies on differences in DIT between the obese- and
non-obese. A literature survey shows that eight (30,31,34,36,37,39,40,42) of
the thirteen studies reporting no difference in DIT between obese and
non-obese, probably had a power lower than 80 percent of finding a true
between-group difference in DIT of 25 percent.
Constancy of the RMR
The results of Table 9 show that RMR did not show systematic diurnal variation
from morning untill early afternoon. This indicates that the RMR remains
constant during the assessment of postprandial energy expenditure, at least
during measurements of energy expenditure over a morning. This implicates that
in the assessment of the thermic effect of food no sham feeding control
experiment is needed to correct for changes in the basal energy expenditure.
Our findings are in accordance with most other studies assessing changes
during the day in RMR (34-36), with the exception of some older studies
(84,85). It is well known that RMR shows diurnal variation due to the thermic
after-effects of exercise and food ingestion or due to sleep (20). This study
shows that in the absence of thermogenic stimuli the postabsorptive RMR shows
very little change in the morning over the course of a 2.5 hours measurement
period or between morning and afternoon assessments, comparing single RMR
measurements performed on the same day, or comparing RMR's assessed repeatedly
on mornings or afternoons.
-95-

Impact of the phase of the menstrual cycle on RMR and DIT
Table 10 shows that the phase of the menstrual cycle did not significantly
influence RMR or DIT. RMR was slightly, ie, 1.2 percent, higher during the
post-ovular phase of the cycle compared to the pre-ovular phase. On average
pre-ovular and post-ovular RMR and DIT were, respectively, assessed for about
three and two times in 23 subjects, although the variation in number of
replicates was quite large. This means that with this sample size, true
differences between the two phases of the cycle of at least 2 percent in the
RMR or at least 20 percent in DIT could have been detected with a power of 90
percent and a confidence level of 95 percent (two-sided), assuming a
correlation between the two phases of the cycle of 0.80 in RMR and of 0.40 in
DIT. Smaller differences in RMR or DIT between the pre- and post-ovular stage
of the cycle may be physiologically irrelevant. With respect to the RMR the
results of this study support the findings of several authors (86-90), but are
in contrast with results of other studies (91-94). The reasons for these
differences are not quite clear, but may be related to differences in
experimental protocol, techniques used for measuring energy expenditure, the
number of subjects studied, the frequence of measurements during the menstrual
cycle and the method used to assess ovulation.
In the present study measurements were always performed at least three days
after the onset of menses. The rationale behind this protocol demand is the
fact that many women have health complaints shortly before or during
menstruation. This may affect a subject's behavior during energy expenditure
measurements, which may cause unwanted effects on measurements. For example,
already in the 1920s it has been reported that basal metabolic rate is lowered
during menstruation in comparison with other phases of the menstrual cycle
(95).
In this study most of the pre-ovular energy expenditure measurements were made
in a period between 4 and 10 days after the onset of menstruation. For most
subjects ovulation was assumed to occur 14 days before the start of menstrual
flow. In subjects 1 to 5 ovulation was conclusively identified using an
ovulation test. Also, in these subjects no significant effect of the stage of
the ovular cycle on RMR or DIT was observed.
No studies have reported on the impact of the stage of the menstrual cycle on
DIT. Frequently it is assumed that the phase of the menstrual cycle affects
the RMR (96). In fact, the number of studies not showing any effect of the
stage of the cycle on the RMR are in balance with the number of studies that
-96-

do report an effect. In general, the post-ovular rise in RMR is attributed to
the increased progesterone secretion in that phase of the cycle (91-94). The
thermogenic effects of progesterone are, however, not clear (97). In a recent
study, progesterone administration was found to decrease RMR in women instead
of increasing RMR (97).
Variability in RMR and DIT was also compared between women using oral
contraceptives and women having normal menstrual cycles. Variation in RMR was
significantly higher in women using oral contraceptives in comparison to women
having normal cycles. This was due to the fact that 5 women using oral
contraceptives had particularly high CV's for their RMR, exceeding 10 percent.
We expected that the within-person variability of RMR in women using oral
contraceptives would be smaller when compared to the variability observed in
women having normal menstrual cycles. In women using oral contraceptives
hormonal profiles will be relatively more constant over the course of a cycle.
As a consequence the biological within-person variation in RMR was expected to
be smaller in women using oral contraceptives when compared to women with
normal ovular cycles. This hypothesis was not supported by our findings. No
systematic difference between both groups in variation in DIT was observed.
Impact of energy intake and duration of postprandial measurement on the
calculation of DIT
There is a great variety among the various studies on DIT in the energy
content of the meal given and in duration of the postprandial measurement
period (13-42). Thus, meals or nutrient solutions are being given varying in
energy content between 800 kJ (14) and 8000 (42) kJ, whereas the postprandial
measurement period varies between 1.5 (27) and 8 hours (42). It has been
pointed out by various authors (20,42) that the duration of the postprandial
measurement period should be of sufficient length in order to measure the
largest part of the thermic response to food. However, it has not been
reported which proportion of the thermic effect of food, using different
energy loads, is measured within fixed time intervals of the postingestive
period.
In this study, it was found that DIT increases with greater energy intakes,
confirming previous findings (42). In men, DIT was positively associated with
energy intake, but no significant correlation between DIT and body weight, the
size of the fat mass or fat-free mass was found. In women, DIT was also
significantly positively correlated to the energy content of the test meals,
-97-

but not to the size of the fat-free mass. Low, but significant correlations
were found between DIT and body weight, fat mass and age. This indicates that
some of the older obese subjects had relatively higher DIT's when compared to
the younger lean subjects. The postprandial response patterns indicate that in
men and women a DIT response to ingestion of a mixed liquid meal with an
energy content below 1500 kJ can be nearly completely assessed within three
hours. The DIT response to meals with larger energy content, ie, between 1500
kJ and 2600 kJ in men and between 1500 and 2000 kJ in women, can also be
assessed with sufficient accuracy within three hours. The data show that
adding a fourth hour to the postprandial period increased the observed thermic
effect by 10-15 percent only. We have experienced that after three hours many
subjects become restless and bored by the measurement. Reducing the
postprandial measurement period to three hours does not have substantial
effects on the calculation of the DIT response to meals of an energy content
of 2000 kJ, but will prevent some of the behavioural problems occurring when
subjects are measured for a more prolonged period of time.
Sometimes the energy content of the meal or nutrient solution is given as a
dosis per kg (ideal) weight (13,34,41) or fat-free body mass (20,42). When
such a procedure is used, it is implicitly assumed that the thermic response
is correlated to (ideal) body weight or to the size of the fat-free mass, and
that by adjusting for inter-individual differences in these variables
inter-individual comparison of DIT responses will be more valid. However, data
to support this view have not been reported. The present study showed a low,
and for the most, except in women, part non-significant correlation between
DIT and body weight and the size of the fat-free mass. This is in accordance
with the findings of a recent report (42) and supports a notion put forward by
Garrow, quoted in (96), ie, that " a log of a given size gives of the same
amount of heat in a small or large oven". Our findings suggest that comparing
DIT responses among individuals to equal caloric loads should be advocated.
This supports the view of Sjöström (98).
In conclusion, this study shows that RMR and postabsorptive and postprandial
RQ's can be measured with sufficiently high reproducibility in humans with a
ventilated hood system. DIT and fuel utilization rates show considerably
larger within-person variation, comparable in magnitude to the between-person
variation. The within-person variation in DIT seemed not subject to reduction
when the antecedent diet was controlled. Postabsorptive RMR did not show
substantial variation over a morning, eliminating the need for sham-feeding
-98-

control experiments in the assesssment of DIT. The phase of the menstrual
cycle did not markedly affect RMR or DIT, suggesting that in measurements of
RMR and DIT in women the stage of the cycle is a factor of negligible
relevance in the study design. The thermic effect to meals with an energy
content between about 1.5-2.5 MJ can be nearly completely assessed within
three hours. There is no need to standardize the energy content of the test
meal to body weight or to the size of the fat-free mass.
ACKNOWLEDGEMENTS
The authors are indebted to Zandrie Hofman, Jos Steenbergen, Peter Weys, Eric
Poortvliet, Theo Dopheide, Greet Vansant, Cathaline den Besten, Alida Wapstra,
Jacqueline Dekker, Miriam Stoel, Liliane Begheyn, Karin van der Kooy, Leoniek
Robroch and Ingrid Wunnink for help in conducting the experiments. We are also
indebted to the staff of the laboratory of the Department of Human Nutrition
for their help in blood, urine and food analyses, in particular to Miss Ans
Soffers. We would also like to thank Miss Saskia Meyboom for her help in
preparing the food items for the subjects receiving controlled diets. Finally,
we would like to thank all subjects for their enthousiastic participation in
the various studies.
REFERENCES
1. Rubner M. Die Gesetze des Energieverbrauchs bei der Ernährung Leipzig and Vienna: Deuticke, 1902.
2. Neumann RO. Expirementelle Beiträge zur Lehre von dem täglichen Nahrungsbedarf des Menschen unter besonderer Berücksichtigung der notwendigen Eiweissmenge. Arch Hyg 1902;45:1-87.
3. Wang CC, Strouse S, Saunders AD. Studies on the metabolism of obesity. Ill The specific dynamic action of food. Arch Int Med 1924;34:573-83.
4. Mason EH. Obesity and thinness: studies on the specific dynamic action of protein in them. Northwest Med 1927;26:143.
5. Jéquier E. Thermogenesis induced by nutrient administration in man. Infusionstherapie 1984;11:184-8.
6. Sims EAH, Danforth E. Expenditure and storage of energy in man. J Clin Invest 1987;79:1019-25.
7. Miller DS, Payne PR. Weight-maintenance and food intake. J Nutr 1962;78:255-62.
8. Miller DS, Mumford P. Gluttony, I. An experimental study of overeating on high or low protein diets. Am J Clin Nutr 1967;20:1212-22.
9. Adolph EF. Urges to eat and drink in rats. Am J Physiol 1947;151:110-25. 10. Carlisle HJ, Stellar E. Caloric regulation and food preference in normal
hyperphagic and aphagic rats. J Comp Physiol Psychol 1969;69:107-14.
-99-

11. Rothwell NJ, Stock MJ. A role for brown adipose tissue in diet-induced thermogenesis. Nature 1979;281:31-5.
12. Thurlby PL, Trayhurn P. The role of thermoregulatory thermogenesis in the development of obesity in genetically obese (ob/ob) mice pair fed with lean siblings. Br J Nutr 1979;42:377-85.
13. Kaplan ML, Leveille GA. Calorigenic response in obese and nonobese women. Am J Clin Nutr 1976;29:1108-13.
14. Pittet P, Chappuis P, Acheson K, de Techtermann F, Jéquier E. Thermic effect of glucose in obese subjects studied by direct and indirect calorimetry. Br J Nutr 1976;35:281-92.
15. Shetty PS, Jung RT, James WPT, Barrand MA, Callingham BA. Postprandial thermogenesis in obesity. Clin Sei 1981;60:519-25.
16. Zed CA, James WPT. Thermic response to fat feeding in lean and obese subjects. Proc Nutr Soc 1982;41:32 A (abstract).
17. Golay A, Schutz Y, Meger HU, Thieband D, Curchod B, Maeder E, Felber JP, Jéquier E. Glucose-induced thermogenesis in nondiabetic and diabetic obese subjects. Diabetes 1982;31:1023-28.
18. Schwartz RS, Halter JB, Bierman EL. Reduced thermic effect of feeding in obesity: role of norepinephrine. Metabolism 1983;32:114-7.
19. Bessard T, Schutz Y, Jéquier E. Energy expenditure and postprandial thermogenesis before and after weight loss. Am J Clin Nutr 1983;38:680-93.
20. Schutz Y, Bessard T, Jéquier E. Diet-induced thermogenesis measured over a whole day in obese and non obese women. Am J Clin Nutr 1984;40:542-52.
21. Ravussin E, Bogardus C, Schwartz RS, Robbins DC, Wolfe RR, Horton ES, Danforth E, Sims EAH. Thermic effect of infused glucose and insulin in man. J Clin Invest 1983;72:893-902.
22. Segal KR, Presta E, Gutin B. Thermic effect of food during graded exercise in normal weight and obese men. Am J Clin Nutr 1984;40:995-1000.
23. Schutz Y, Golay A, Felber JP, Jéquier E. Decreased glucose-induced thermogenesis after weight loss in obese subjects: a predisposing factor for relapse of obesity? Am J Clin Nutr 1984;39:380-7.
24. Bogardus C, Lillioja S, Mott D, Zawadzki J, Young A, Abbott W. Evidence for reduced thermic effect of insulin and glucose infusions in Pima Indians. J Clin Invest 1985;75:1264-9.
25. Segal KR, Gutin B, Nyman AM, Pi-Sunyer FX. Thermic effect of food at rest, during excercise, and after exercise in lean and obese men of similar body weight. J Clin Invest 1985;76:1107-12.
26. Segal KR, Gutin B, Albu J, Pi-Sunyer FX. Thermic effects of food and exercise in lean body mass. Am J Physiol 1987;252:Ell0-7.
27. Swaminathan R, King RFGJ, Holmfield J, Siwek RA, Baker M, Wales JK. Thermic effect of feeding carbohydrate, fat, protein and mixed meal in lean and obese subjects. Am J Clin Nutr 1985;42:177-81.
28. Molnar D, Varga P, Rubecz I, Hamar A, Mestyan J. Food-induced thermogenesis in obese children. Eur J Pediatr 1985;144:27-31.
29. Shetty PS, Jung RT, James WPT. Reduced dietary-induced thermogenesis in obese subjects before and after weight loss. Proc Nutr Soc 1979;38:87A (abstracts).
30. Strang JM, McClugage HB. The specific dynamic action of food in abnormal states of nutrition. Am J Med Sei 1931;182:49-81.
31. Bradfield RB, Jordan MH. Relative importance of specific dynamic action in weight-reduction diets. Lancet 1973;2:640-3.
32. Zahorska-Markiewicz B. Thermic effect of food and exercise in obesity. Eur J Appl Physiol 1980;44:231-5.
33. Felber JP, Meyer HU, Curchod B, Iselin HU, Rouselle J, Maeder E, Pahud P, Jéquier E. Glucose storage and oxidation in different degrees of human obesity measured by continuous indirect calorimetry. Diabetologia 1981;20:39-44.
-100-

34. Sharief NN, Macdonald I. Differences in dietary-induced thermogenesis with various carbohydrates in normal and overweight men. Am J Clin Nutr 1982;35:267-72.
35. Welle SL, Campbell RG. Normal thermic effect of glucose in obese women. Am J Clin Nutr 1983;37:87-92.
36. Nair KS, Halliday D, Garrow JS. Thermic response to isoenergetic protein, carbohydrate of fat meals in lean and obese subjects. Clin Sei 1983;65:307-12.
37. Blaza S, Garrow JS. Thermogenic response to temperature, exercise and food stimuli in lean and obese women, studied by 24h direct calorimetry. Br J Nutr 1983;49:171-80.
38. Felig P, Cunningham J, Levitt M, Hendler R, Nadel E. Energy expenditure in obesity in fasting and postprandial state. Am J Physiol 1983;244:E45-51.
39. Schwartz RS, Ravussin E, Massari M, O'Connell M, Robbins DC. The thermic effect of carbohydrate versus fat feeding in man. Metabolism 1985;34:285-93.
40. Anton-Kuchly B, Laval M, Choukroun ML, Manciet G, Roger P, Varene P. Postprandial thermogenesis and hormonal release in lean and obese subjects. J Physiol (Paris) 1985;80:321-9.
41. Owen DE, Kavle E, Owen RS, Polansky M, Caprio S, Mozzoli MA, Kendrick ZV, Bushman MC, Boden G. A reappraisal of caloric requirements in healthy women. Am J Clin Nutr 1986;44:1-19.
42. D'Alessio DA, Kavle EC, Mozzoli MA, Smalley KJ, Polansky M, Kendrick ZV, Owen LR, Bushman MC, Boden G, Owen OE. Thermie effect of food in lean and obese men. J Clin Invest 1988;81:1781-9.
43. Pittet P, Gygax P, Jéquier E. Thermic effect of glucose and amino acid in man studied by direct and indirect calorimetry. Br J Nutr 1974;31:343-9.
44. Garrow JS, Hawes SF. The role of amino acid oxidation in causing specific dynamic action in man. Br J Nutr 1972;27:211-9.
45. Lusk G. The specific dynamic action. J Nutr 1931;36:519-30. 46. Glickman N, Mitchell HH, Lambert EH, Keeton RW. The total specific dynamic
action of high-protein and high-carbohydrate diets on human subjects. J Nutr 1948;36:41-57.
47. Karst H, Steiniger J. Diet-induced thermogenesis in man: thermic effects of single proteins, carbohydrates and fats depending on their energy amount. Ann Nutr Metab 1984;28:245-52.
48. Rosenberg K, Durnin JVGA. The effect of alcohol on resting metabolic rate. Br J Nutr 1978;40:293-8.
49. Stock MJ, Stuart JA. Thermic effects of ethanol in the rat and man. Nutr Metab 1974;17:297-305.
50. Le Blanc J, Cabanac M, Samson P. Reduced postprandial heat production with gavage as compared with meal feeding in human subjects. Am J Physiol 1984;246:E95-101.
51. Hill JO, DiGirolamo M, Heymsfield SB. Thermic effect of food after ingested versus tube-delivered meals. Am J Physiol 1985;248:E370-374.
52. Tremblay A, Cote J, LeBlanc J. Diminished dietary thermogenesis in exercise trained human subjects. Eur J Appl Physiol 1983;52:1-4.
53. LeBlanc J, Mercier P, Samson P. Diet induced thermogenesis with relation to training state in female subjects. Can J Physiol Pharmacol 1984 ,-62-334-7.
54. Davis JR, Tagliaferro AR, Kertzer R, Gerardo T, Nichols J, Wheeler J. Variations in dietary induced thermogenesis and body fatness with aerobic capacity. Eur J Apl Physiol 1983;50:319-29.
55. Hill JC, Heymsfield SB, McMannus C. Meal size and thermic response to food in male subjects as a function of maximum aerobic capacity. Metabolism Clin Exp 1984;33:743-9.
-101-

56. Poehlman ET, Melby CL, Badylak SF. Resting metabolic rate and postprandial thermogenesis in highly trained and untrained males. Am J Clin Nutr 1988;47:793-8.
57. Acheson K, Jéquier E, Wahren J. Influence of beta-adrenergic blockade on glucose-induced thermogenesis in man. J Clin Invest 1983;72:981-6.
58. Welle SL, Campbell RG, Stimulation of thermogenesis by carbohydrate overfeeding. Evidence against sympathetic nervous system mediation. J Clin Invest 1983;71:916-25.
59. Jéquier E, Acheson K, Schutz Y. Assessment of energy expenditure and fat utilization in man. Ann Rev Nutr 1987;7:187-208.
60. Lusk G. Animal calorimetry: Analysis of the oxidation of mixtures of carbohydrate and fat. J Biol Chem 1924;59:41-2.
61. Frayn KN. Calculation of substrate oxidation in vitro from gaseous exchange. J Appl Physiol 1983;55:628-34.
62. Weststrate JA, Weys PJM, Poortvliet EJ, Deurenberg P, Hautvast JGAJ. Diurnal variation in postabsorptive resting metabolic rate and diet-induced thermogenesis. Am J Clin Nutr 1989: in press.
63. Den Besten C, Vansant G, Weststrate JA, Deurenberg P. Resting metabolic rate and diet-induced thermogenesis in abdominal and gluteal-femoral obese women before and after weight reduction. Am J Clin Nutr 1988;47:840-7.
64. Williams S, ed. Official methods of analysis of the association of official analytical chemists, 14th ed. Arlington, VA: AOAC Inc, 1984.
65. Folch J, Lees M, Sloane Stanley GH. A simple method for the isolation and purification of total lipids from animal tissues. J Biol Chem 1957;226:497-509.
66. Boehringer. Methods of enzymatic food analysis using test-combinations. Food analysis. Boehringer Mannheim, 1983.
67. Osborne DR, Voogt P. The analysis of nutrients in foods. London: Academic Press, 1978.
68. Garrow JS. Energy balance and obesity in man. 2nd ed. Amsterdam: Elsevier/North Holland Biomedical Press, 1978:96-7.
69. Siri WE. The gross composition of the body. Adv Biol Med Phys 1956;4:239-80.
70. Winer BJ. statistical principles in experimental design. 2nd ed. New York: McGraw-Hill Book Company, 1972.
71. Dixon WJ ed. BMDP statistical software. Berkeley: University of California Press, 1981.
72. Weststrate JA, Deurenberg P. Methoden ter bepaling van de lichaamssamenstelling van de mens. Deel II. Indirecte methoden. Voeding 1988;49:186-193.
73. Dalosso HM, Murgatroyd PR, James WPT. Feeding frequency and energy balance in adult males. Human Nutr:Clin Nutr 1982;36C:25-39.
74. Ravussin E, Lillioja S, Anderson T, Christin L, Bogardus C. Determinants of 24-hour energy expenditure in man. Methods and results using a respiratory chamber. J Clin Invest 1986;78:1568-78.
75. Mahadeva K, Passmore R, Woolf B. Individual variations in metabolic cost of standardised exercises: effects of food, age, sex and race. J Physiol (London) 1953;121:225-31.
76. Bogardus C, Lillioja S, Ravussin E, Abbott W, Zawadzki JK, Young A, Knowler WC, Jacobowitz R, Moll P. Familial dependence of the resting metabolic rate. N Engl J Med 1986;315:96-100.
77. Murgatroyd PR, Davies HL, Prentice AM. Intra-individual variability and measurement noise in estimates of energy expenditure by whole body indirect calorimetry. Br J Nutr 1987;58:347-56.
78. Marr JW, Heady JA. Within - and between-person variation in dietary surveys: number of days needed to classify individuals. Hum Nutr: Appl Nutr 1986;40A: 347-64.
-102-

79. Acheson KJ, Schutz Y, Ravussin E, Jéquier E, Flatt JP. Nutritional influences on lipogenesis and thermogenesis after a carbohydrate meal. Am J Physiol 1984;246:E62-70.
80. Hultman E, Nilsson LH. Liver glycogen in man. "Effect of different diets and muscular exercise. Adv Exp Med Biol 1971;11:143-51.
81. Altman DG, Gore SM, Gardner MJ, Pocock SJ. Statistical guidelines for contributors to medical journals. Br Med J 1983;286:1489-93.
82. Brown BW. Statistical controversies in the design of clinical trials-some personal views. Contr Clin Trials 1980;1:13-27.
83. Lachin JM. Introduction to sample size determination and power analysis for clinical trials. Contr Clin Trials 1981;1:93-113.
84. Buskirk ER, Iampietro PF, Welch BE. Variations in resting metabolism with changes in food, exercise and climate. Metabolism 1957;6:144-53.
85. Bailey D, Harry D, Johnson RE, Kupprat I. Oscillations in oxygen consumption of man at rest. J Appl Physiol 1973;34:467-70.
86. Blunt K, Dye M. Basal metabolism of normal women. J Biol Chem 1921;47:69-87.
87. Gephart FC, Dubois EF. Clinical calorimetry XIII: the basal metabolism of normal adults with special reference to surface area. Arch Int Med 1916;17:902-14.
88. Williams WW. The basal metabolic rate, basal body temperatures, and the ovarian cycle. Am J Obstet Gynecol 1943; 46:662-7.
89. Wiltshire MOP. Some observations on basal metabolism in menstruation. Lancet 1921;2:388-9.
90. Griffith FR, Pucher GW, Brownell GK, Klein JD, Carmer ME. Studies in human physiology I: the metabolism and body temperature (oral) under basal conditions. Am J Physiol 1929;87:602-32.
91. Rubenstein BB. The relation of cyclic changes in human vaginal smears to body temperatures and basal metabolic rates. Am J Physiol 1937;119:635-41.
92. Snell AM, Ford F, Rowntree LG. Studies in basal metabolism. JAMA 1920;75:515-23.
93. Wakeham G. Basal metabolism and the menstrual cycle. J Biol Chem 1923; 56:555-67.
94. Hessemer V, Brüch K. Influence of menstrual cycle on thermoregulatory, metabolic, and heart responses to exercise at night. J Appl Physiol 1985;59:1911-7.
95. Hitchcock FA, Wardwell FR. Cyclic variations in the basal metabolic rate of women. J Nutr 1929;2:203-15.
96. Cited in. Sims EAH. Energy balance in human beings: the problems of plenitude. Vit Horm 1986;43:1-101.
97. McNeil G, Bruce AC, Ross E, James WPT. Energy balance in women using oral contraceptives. Proc Nutr Soc 1988;47:58A (abstract)
98. Sjöstrom L. A review of weight maintenance and weight changes in relation to energy metabolism and body composition. In: Hirsch J, Van Itallie TB, eds. Recent advances in obesity research: IV. London: John Libbey, 1985:82-94.
-103-

Appendix 1. Number of subjects, according to sex, required to test a change within subjects of 10, 25 or 50 percent in diet-induced thermogenesis with a significance level of <K= 0.05 (two-sided) and ß-levels of 0.20 and 0.10, when one or two measurements are performed per subject with and without pre-post test correlation.
Ejected change (%)* in BIT
10 25 50
ß - level ß - level ß - level
0.2 0.1 0.2 0.1 0.2 0.1
No of measurements Sex
1 M
Correlation
0
0.2
0
0.4
0
0.2
0
0.4
129
103
164
99
66
48
83
38
172
138
219
132
87
63
111
49
22
18
28
18
13
10
15
8
29
24
37
23
16
12
20
10
8
4
9
6
5
4
6
4
9
6
11
8
6
5
7
4
<X= 0.05, two-sided
nuaber of subjects calculated according to ladbin (83), using the average within-subject variation, according to sex,
found in th is study
* Expected change expressed as percentage of » a n DET values (in kJ) observed in this study, in nan and ucaan
Correlation coefficient as deteradned fron rcpeatedHneasures nodel analysis of variance according to Winer (70)
DIT = diet—induced theuugunesis.
Appendix 2. Total number of subjects, according to sex, required to test a difference of 10, 25 and 50 percent in diet-induced thermogenesis between two groups of equal size with a significance level cx = 0.05 (two-sided) and ß-levels of 0.20 and 0.10, when one or two measurements are performed per subject.
rto of measurements
1
2
Sex
M
F
M
F
ß -
0.2
308
233
154
117
10
level
0.1
412
311
206
156
* Expected difference (%)
ß -
0.2
50
38
25
19
25
level
0.1
67
51
34
26
in DIT
ß -
0.2
14
11
7
6
50
level
0.1
18
14
9
7
& = 0.05, two-sided
Rater of subjects calculated according t o lachin (83), using the adjusted between-person variation, according t o !
found in th i s study
* Expected change expressed as percentage of •aon OTT values (in kJ) observed, in wen and vanen
EBT = diet—induced thenaogenesis
-104-

Chapter 4. Diurnal variation in postabsorptive resting metabolic rate and diet-induced thermogenesis
JAN A WESTSTRATE MSC, PETER JM WEYS BSC, ERIC J POORTVLIET BSC, PAUL
DEURENBERG PHD, JOSEPH GAJ HAUTVAST MD
ABSTRACT
Postabsorptive resting metabolic rate (RMR) and diet-induced thermogenesis
(DIT) were repeatedly assessed on different days in ten young normal weight
men on mornings and afternoons. No significant diurnal variation was found in
RMR, DIT, total postprandial substrate oxidation and overall postprandial
nutrient balances. The pattern of postprandial substrate oxidation indicated
an increased glucose oxidation in the first hour after ingestion of a meal on
morning tests compared to afternoon tests. This was probably related to
differences in the degree of the postabsorptive state, ie, 12-14 hours on
morning tests and 6-7 hours on afternoon tests.
Keywords: indirect calorimetry, resting metabolic rate, diet-induced
thermogenesis, diurnal variation, substrate oxidation, human
INTRODUCTION
Rhythmic variations in energy metabolism are well documented for animals (1).
Cyclical changes in energy metabolism have also been postulated for humans
(1). Among them, changes in energy expenditure during the menstrual cycle have
been studied relatively frequent (2-5). Less information is available for
humans on variation in energy metabolism during the day, ie, on diurnal
variation in energy expenditure (6-8). It is well known that energy
expenditure varies during the day due to the thermic effects of food and
physical activity (9). Very few investigators, however, have studied changes
-105-

during the day in energy expenditure in the absence of thermogenic stimuli
(6-8). In addition, no studies report on diurnal variation of energy
metabolism in response to thermogenic stimuli.
In previous studies on humans, evidence was obtained for a gradual increase
during the day in postabsorptive resting energy expenditure, ie, in
postabsorptive resting metabolic rate (6-8). More recent studies do not
support these findings (10-13). In the latter studies, however, diurnal
variation in postabsorptive resting metabolic rate was not the main objective
of study, and energy expenditure was usually measured during the morning only.
It is important to clarify the issue of diurnal variation in energy
expenditure, since this may affect the interpretation of studies on diet-
induced thermogenesis. Diet-induced thermogenesis can be defined as the
increase in energy expenditure due to ingestion of food. Frequently, in
studies on diet-induced thermogenesis a non-caloric control or sham feeding
test is used to adjust for possible diurnal variation in postabsorptive
resting energy expenditure (10-13). However, other investigators assume no
significant changes in postabsorptive resting metabolic rate during the day
and do not report such sham feeding tests (14-17).
Besides diurnal variation in resting energy expenditure in the absence of
food, changes during the day in the response of energy metabolism to food may
be important. Diurnal variation in the response of energy metabolism to food
may affect daily nutrient and energy balance.
The present study was designed to investigate whether repeated measurements of
resting metabolic rate and diet-induced thermogenesis varied systematically
with time of the day, ie, between mornings and afternoons. No significant
diurnal variation in resting metabolic rate and in diet-induced thermogenesis
was found, but postprandial substrate oxidation showed a different pattern in
the morning in comparison to the afternoon.
SUBJECTS AND METHODS
SUBJECTS
Ten young men, all students, participated in the study. Volunteers were
invited for participation in the study by advertisement in the University
weekly periodical. Data concerning some physical characteristics and age are
presented in Table 1. Each individual was fully informed on the nature and
-106-

purpose of the experiment, before giving his written consent to participate.
Each subject received a questionnaire to assess past and present health status
and nutritional habits. None of the subjects was on a special diet, all
subjects were eating normal balanced diets and none of the subjects was using
any medication at the time of the study or had experienced greater body weight
fluctuation than 2.5 kg in the half year preceding the study. All subjects
were non-smokers and apparently healthy as assessed by medical questionnaire.
The protocol was submitted to and approved of by the Medical-Ethical Committee
of the Wageningen Agricultural University.
METHODS
Experimental design
Resting metabolic rate (RMR) was measured six times on different days in each
subject, three times in the morning and, similarly, three times in the
afternoon. Between each session there was a time span of at least two days.
All subjects completed the experiment in four weeks. Morning RMR's were
measured with the subject in a 12-14 hours postabsorptive state. Afternoon
RMR's were measured with the subject in a 6-7 hours postabsorptive state. At
the day of the afternoon sessions the subjects were allowed to have a small
normal Dutch breakfast of about 2000 kJ (10 percent protein, 35 percent fat,
55 percent carbohydrates) between 7.45 and 8.00 hours. The subjects were
instructed to refrain from sleeping, coffee drinking and moderate to heavy
physical activity on the mornings before the afternoon tests. They were also
instructed not to perform heavy physical exercise on the evening before the
morning tests. The order of RMR measurements was randomized between the
morning and afternoon tests.
On two mornings and on two afternoons after the RMR measurement, energy
expenditure in response to a meal was measured in each subject to assess
diet-induced thermogenesis. The increase in resting metabolic rate due to the
ingestion of the meal was defined as diet-induced thermogenesis (DIT). The
meal was a yoghurt-based liquid formula containing on average 1900 kJ (10
percent protein, 33 percent fat, 57 percent carbohydrates). The order of the
DIT measurements was randomized between the morning and afternoon tests.
To familiarize the subjects with the equipment for measuring RMR and DIT,
-107-

resting energy expenditure was measured in each subject on a separate day
before the start of the experiment for about 30-45 minutes.
Gas exchange measurements
Resting metabolic rate
On the day of each RMR measurement, the subjects were taken to the laboratory
by car. After voiding they lay supine but awake on a hospital bed. After a 30
minutes rest period, RMR was continuously measured between 08.00 and 09.00
hours in the morning or 14.00 and 15.00 hours in the afternoon at an
environmental temperature of 23-25°C. During the RMR measurements the subjects
watched video films.
Postprandial energy expenditure
After the RMR measurement the subjects were given the test meal, five minutes
after they had finished eating the test meal, energy expenditure was measured
continuously for four hours. During the postprandial energy expenditure
measurements the subjects watched video films. Room temperature was always
kept at 23-25°C.
The subjects were instructed to be as relaxed as possible and to minimize
movements. After the gas exchange measurements, urine was collected for
determining urea-nitrogen and total urinary nitrogen.
All gas exchange measurements were performed using a ventilated hood system. A
transparent perspex ventilated hood was placed over the subjects head and made
airtight around the neck. A pump (Ocean SCL210, Dieren, The Netherlands)
drawed fresh outside air through the hood. The flow rate through the hood was
measured by a thermal mass flowmeter (Brooks, 5812N, Veenendaal, The
Netherlands). The flow rate was kept between 30 and 40 1/min by an electri
cally operated control valve (Brooks, model 5837, Veenendaal, The Nether
lands). A small sample of about 0.4 1/min of the air leaving the hood was
analysed for oxygen (0,) and carbon dioxide (CO,) content by, respectively, a
paramagnetic 0,-analyzer, adjusted to a full scale range of 20-21 percent
(Servomex, 1100A, Zoetermeer, The Netherlands) and an infrared CXU-analyzer,
full scale range 0-1 percent (Analytical Development Company, SS100,
Hoddesdon, UK). The analyzers were calibrated each morning or afternoon
session using dried gas mixtures with known 0 2 and CO, content. O, and CO,
-108-

concentrations in dried fresh outside air were measured for five minutes
every 30 minutes during the RMR measurement and every hour during the
postprandial energy expenditure measurements. Air flow rate, 0, and C0?
concentration of the inflowing and outflowing air were computed on line by an
automatic data acquisition unit (Hewlett Packard 3497A, Palo Alto, USA)
interfaced to a microcomputer (Hewlett Packard 85, Palo Alto, USA). The
outputs of the gasanalyzers and the flowmeter were also continuously recorded
by a multi-pen recorder (Kipp & Zonen BDlOl, Delft, The Netherlands). 0 ? and
CO, concentration of the outflowing air and air flow rate through the hood
were measured every 30 seconds and integrated over five minutes interval
periods to obtain 0, consumption, CO, production, respiratory quotient (RQ)
and metabolic rate according to equations described by Jéquier (18).
Calculation of diet-induced thermogenesis and substrate oxidation
The 0, consumption and CO, production were corrected for movements of the
subjects when necessary. To obtain the mean resting energy expenditure for
each hour after ingestion of the test meal, the 0, consumption and CO,
production were averaged over each hour using the five minutes interval data.
These values were used to calculate the average DIT for the individual hours
after the test meal and for the total mean DIT over four hours. DIT was
calculated by subtracting the RMR value from the respective average hourly or
total mean postprandial energy expenditure. The DIT is expressed as a
percentage of the energy content of the test meal.
Protein oxidation was estimated by determination of urinary urea-nitrogen
excretion, with a testkit (Boehringer Mannheim BV kit 396346, Almere, the
Netherlands) according to Gutman and Bergmeyer (19). Carbohydrate and fat
utilization during RMR and during the four hours after ingestion of the test
meal were calculated using the non-protein respiratory quotient (18). Oxygen
and carbon dioxide equivalents for substrate oxidation before and after the
ingestion of the test meal were obtained from Lillioja et al. (20).
Carbohydrate oxidation was corrected for net de novo lipogenesis from glucose
as previously described (17). A non-protein respiratory quotient exceeding
1.00 indicated net de novo lipogenesis, ie, lipogenesis exceeding concomitant
fat oxidation.
-109-

Body composition
Fat-free mass was estimated by densitometry. Total body density of each
subject was measured once during the experiment in duplicate by the under
water weighing method with simultaneous measurement of the residual lung
volume by a helium dilution technique. Fat-free mass was calculated from total
body density using Siri's equation (21).
Statistics
The results are expressed as mean values with standard errors of the mean
(sem). Analysis of variance using the model for a single factor experiment
with repeated measurements was used to test whether RMR and DIT varied
systematically between mornings and afternoons. Paired two-tailed Student's
t-tests were performed to evaluate differences in mean RMR, DIT and substrate
oxidation rates between morning and afternoon sessions. Confidence intervals
are used to express mean differences in RMR, DIT and substrate oxidation rates
between morning and afternoon sessions. Pearson's product-moment correlation
coefficients were used in correlation analyses.
RESULTS
Table 1 shows that all subjects had body weights and body fat percentages
within the normal range.
Table 2 gives resting metabolic rates in subjects, separately for the morning
and afternoon sessions. Analysis of variance showed no significant day and
time of day effect on RMR. The 95 percent confidence interval for the average
difference between the mean morning and afternoon values in RMR is -0.07 to
+0.35 kJ/min. Therefore, for each person mean morning and afternoon RMR values
were used in subsequent analyses. Morning RMR's were significantly correlated
with afternoon RMR's, (r = 0.95, p < 0.01).
-110-

Table 1. Age and some physical characteristics of the subjects.
subjects
1 2 3 4 5 6 7 8 9
10
mean + sem
age
yrs
22 20 23 20 21 24 25 22 23 22
22 ± 0.5
weight
kg
65.5 86.1 74.3 78.9 75.2 74.9 79.4 65.2 71.9 83.5
75.4 + 2.2
body mass index kg/m
21.7 25.9 21.8 21.3 21.4 22.8 22.0 19.5 22.2 24.4
22.3 + 0.6
fat-free mass kg
53.9 71.3 59.9 68.0 61.7 61.9 69.5 59.9 64.5 69.1
64.0 ± 1.7
body fat percentage
%
17.6 17.1 19.3 13.7 17.9 17.3 12.5 7.8
10.3 17.2
15.1 ± 1.2
Table 2. Resting metabolic rate in subjects on different times of the day.
subjects Resting metabolic rate (kJ/min)
1 2 3 4 5 6 7 8 9
10
morning mean + sem*
4.45 5.87 4.61 5.43 4.56 4.52 5.24 4.37 4.09 5.02
+ 0.11 + 0.24 + 0.27 + 0.35 + 0.06 + 0.24 + 0.11 + 0.28 + 0.21 + 0.04
afternoon mean +
4.54 + 5.45 + 4.74 + 4.82 + 4.31 + 4.66 + 4.69 + 4.47 + 4.19 + 4.87 +
4.67 +
sem*
0.07 0.07 0.35 0.33 0.20 0.26 0.11 0.04 0.05 0.04
0.11
total mean
4.50 5.66 4.68 5.12 4.43 4.58 4.96 4.42 4.14 4.94
4.74
+ semT
+ 0.06 + 0.15 + 0.20 + 0.62 + 0.11 + 0.16 + 0.14 + 0.13 + 0.10 ± 0.04
+ 0.15 mean + sem 4.81 + 0.18
* mean of three measurements f mean of six measurements
Data on diet-induced thermogenesis in subjects over a four hours period after
ingestion of a meal on different times of the day are presented in Table 3,
separately for mornings and afternoons. Analysis of variance showed no
significant day and time of day effect on total DIT. Therefore, for each
person the mean morning and afternoon DIT values were used in subsequent
-111-

analyses. The 95 percent confidence interval for the mean difference between
the morning and afternoon DIT values was -1.8 to + 2.6 percent of the energy
content of the test meal (-34 to + 50 kj). Average morning DIT values were
significantly correlated with average afternoon DIT values (r = 0.89, p <
0.01).
Table 3. Diet-induced thermogenesis in subjects after ingestion of a meal on different times of the day.
subjects
morning mean + sem
Diet-induced thermogenesis (% of energy content of test meal)*
afternoon total , mean + sem' mean + sem'
1 2 3 4 5 6 7 8 9
10
mean + sem
7.5 6.9 7.8 9.3 6.1 6.3 5.2 6.3 7.0
10.2
0.6 1.3 0.7 4.5 0.5 1.4 0.9 0.3 0.8 0.0
7.4 + 0.5
5 13 4 9 6 4 7 5 4 6
6
2 6 8 8 4 7 6 4 6 8
9
+ + + + + + + + + +
+
1 6 1 1 2 1 3 0 1 1
0
5 3 3 2 8 0 4 5 2 6
9
6 10 6 9 6 5 6 5 5 8
7
3 2 3 5 2 5 4 8 8 5
1
+ + + + + + + + + +
+
1 1 1 1 1 0 1 0 0 1
0
0 6 0 9 2 9 6 4
.9
.2
.5
* test meal contained on average 1906 kj. The coefficient of variation for energy intake was 0.5 percent.
f mean of two measurements 4: mean of four measurements
Figure 1 shows diet-induced thermogenesis separately for each hour after
ingestion of the meal in subjects on morning or afternoon tests. No
significant time of day effect on the mean hourly DIT values was observed. On
average DIT was slightly higher on morning sessions in the first hour after
ingestion of the meal in comparison with afternoon sessions, whereas for the
third and fourth hour the opposite case was true. The average DIT in the
fourth hour after the ingestion of the test meal was about 0.1 kJ/min (2-3 per
cent) above the corresponding postabsorptive resting metabolic rate on morning
sessions and about 0.2 kJ/min (4-5 per cent) above the corresponding
postabsorptive resting metabolic rate on afternoon sessions.
Figure 2 represents respiratory quotients in subjects before and after
ingestion of a test meal on different times of the day. RQ's were
-112-

diet-induced thérmogenesis [kJ/min] D morning
afternoon
2 3 4 1-4 time after meal ingestion (h)
Figure 1: Diet-induced thermogenesis (mean + sem) in subjects after ingestion of a meal on different times of the day.
respiratory quotient
1.94-
0.921
0.90
• morning • afternoon
I
RMRMEAL 1 2 3 4 1-4 before/after meal ingestion (h)
Figure 2: Respiratory quotients (mean + sem) in subjects before and after ingestion of a meal on different times of the day.
-113-

significantly higher on mornings in the first hour after ingestion of the
meal in comparison with afternoon RQ's. The reverse was true for the third
and fourth hour after ingestion of the test meal.
Table 4 gives carbohydrate and fat oxidation in subjects before and after
ingestion of a meal, separately for the morning and afternoon sessions. The
results are expressed in absolute amounts and as a percentage of total energy
expenditure. Before ingestion of the test meal, during the RMR measurement,
no significant differences were obeserved in relative or absolute amount of
oxidation of these nutrients between morning and afternoon sessions.
Table 4. Mean carbohydrate and fat oxidation in absolute amounts and as a percentage of total energy expenditure in subjects before and after ingestion of a meal on different times of the day.
oxidation during
RMRt
PEElt
PEE2
PEE3
PEE4
PEEt
:
%kJ/min mg/min
%kJ/min mg/min
%kJ/min mg/min
%kJ/min mg/min
%kj/min mg/min
%kJ/min mg/min
carbohydrates* morning
mean
39 117
64 234
66 241
46 152
27 84 52
178
afternoon mean
39 115
57 § 196§
66 226
54§ 177
37§ 133§
54 178
morning mean
40 50 16 24 14 21 33 46 51 65 28 39
fats afternoon
mean
40 47S 24§ 33 14 20 25§ 34§ 42§ 53 26 35
* expressed on a glucose basis -f- RMR: postabsorptive resting metabolic rate •£ PEE: postprandial energy expenditure; PEEl, during first hour; PEE2, during
second hour; PEE3, during third hour; PEE4, during fourth hour; PEEt, during total postprandial period
S significant difference between morning and afternoon values at p < 0.05
Carbohydrate oxidation was significantly higher and fat oxidation
significantly lower on mornings in the first hour after ingestion of the test
meal than on afternoons. During the third and fourth hour of the postprandial
period, carbohydrate oxidation was lower in the morning in comparison with the
afternoon, in contrast to fat oxidation. Protein oxidation was estimated for
each session by the average (5.5 hours) urinary urea-nitrogen excretion.
Protein oxidation was not significantly different between morning tests and
-114-

afternoon tests, 5 7 + 3 mg/min versus 5 3 + 3 mg/min.
Table 5 shows energy and nutrient balances in subjects after ingestion of
meals on different times of the day. No significant differences between
morning and afternoon tests in total oxidation and storage or balance of the
various nutrients were observed. On average, energy balance, ie, energy
retention, was slightly higher on afternoon than on morning sessions. The 95
percent confidence interval for the mean difference in energy retention
between morning and afternoon tests is -1 to +133 kJ. Net "de novo
lipogenesis" from carbohydrates did not differ between mornings and
afternoons. On average less than 3 percent of the ingested carbohydrates was
converted to fat.
Table 5. Nutrient and energy balance in subjects after ingestion of a meal on different times of the day.
energy carbohydrates fat protein
iroming afternoon noming afternoon morning afternoon iroming afternoon
kj kj g g g g g g
intake 1902 ± 3 1911 + 4* 69.2 + 0.1 69.5 + 0.2 16.6 + 0.0 16.7 + 0.0 11.7 + 0.0 11.7 + 0.0
oxidation 41.7 ± 3.1 41.8 ± 2.2 9.0 ± 1.9 8.0 + 1.6 13.8 + 0.8 12.8 ± 0.7
expenditure 1306 ±53 1248 ±43
net l ipogenesis 0.7 ± 0.3 0.4 ± 0.2
balance 597+54 664+421" 27.5 ± 2.3 27.7 ± 2.3 8.4 ± 2.1 9.2 ± 1.7 -2 .1 ± 0.8 -1 .1 ± 0.7
* insults expressed as aeen ± Bern
+ significant difference Letwuen aDming and afternoon values « t p ^ 0.05 (borderline significance)
DISCUSSION
This study was designed to determine the effect of time of the day, morning
versus afternoon, on resting metabolic rate and diet-induced thermogenesis.
The results show no significant diurnal variation in resting metabolic rate
and diet-induced thermogenesis. Postprandial substrate oxidation was affected
by time of the day, but this effect was transient and overall postprandial
nutrient balances did not show significant diurnal variation. Morning and
afternoon measurements of energy expenditure were performed on different days.
In this way, it was excluded that morning«measurements would have a residual
effect on afternoon assessments of energy expenditure. The design of the
-115-

study, however, allowed for normal intra-individual between-day variation in
morning and afternoon RMR and DIT. This may have obscured the finding of
diurnal variation in RMR and DIT of a relatively small magnitude. To minimize
this possibility RMR and DIT were assessed repeatedly both on mornings and on
afternoons.
Diurnal variation in RMR
Several investigators have studied in man temporal order in a number of
physiological variables. For many variables, ie, hormone blood levels and
urinary hormone excretions, diurnal rhythms have been well established (22).
Information on cyclical changes during the day in human energy metabolism is
scarce. The first part of this study is about diurnal variation in post-
absorptive resting metabolic rate. Early reports (6-8) show that in man
postabsorptive resting metabolic rate increases during the day. However, the
results of these studies may have been influenced by effects of variation
during the measurement period in the duration of the postabsorptive state.
Thus, metabolic rate measurements later on the day were usually performed in
subjects under greater postabsorptive stress. This may in itself have caused
the reported rise during the day in postabsorptive resting metabolic rate. In
spite of the absence of clear data on diurnal variation in postabsorptive
resting metabolic rate in man, it is generally believed that such variation
exists (10-13,23). Obviously, resting energy expenditure varies during the day
due to the thermic effects of feeding and physical activity (9). In addition,
nocturnal resting metabolic rate may be slightly different from diurnal
resting metabolic rate (24). The question is, whether there is a diurnal
rhythm in man in resting metabolic rate at a given fasting state. When such a
rhythm exists, its physiological and biochemical basis could be related to
hormonally-mediated changes during the day in energy-demanding processes, ie,
in sodium pumping or protein synthesis. At present, however, no diurnal
variation in turnover rates of thermogenic hormones has been reported (25) and
a mechanism for possible diurnal variation in resting energy expenditure is
unclear.
To study diurnal variation in energy expenditure, one should ideally measure
resting metabolic rate in subjects under the same conditions at different
times of the day. Usually in previous studies on this subject, variation was
introduced in the duration of the fasting state between different times of the
day (6-13). In the present study morning and afternoon tests also varied in
-116-

duration of the postabsorptive state. But in contrast to previous studies, the
subjects had a shorter duration of the fast on the afternoon tests than on the
morning tests. This may have confounded the afternoon measurements of resting
metabolic rate with residual diet(breakfast)-induced thermogenesis. However,
the results show that residual diet-induced thermogenesis did not
significantly increase afternoon RMR's in comparison with morning
postabsorptive RMR's. In contrast, average resting metabolic rate was
slightly, but not significantly lower on afternoon than on morning tests. The
absence of significant diurnal variation in postabsorptive resting metabolic
rate was not due to large inter-individual differences in response to time of
the day of energy metabolism, since morning RMR values were highly correlated
with afternoon RMR values. In addition, the result of this study agrees with
other reports in which, for several hours during the morning, no significant
effect of sham feeding was observed on resting metabolic rate (10-13).
Diurnal variation in DIT
The second part of the study deals with the question of systematic variation
with time of the day in the response of energy metabolism to food. This
question has not been addressed before. The results show that time of the day
did not significantly influence diet-induced thermogenesis (DIT). Similar to
the findings for the RMR, this was not due to great inter-individual varia
bility in difference in DIT between morning and afternoon tests. In addition,
it is unlikely that the absence of diurnal variation in DIT was caused by a
too short measurement period, since mean DIT had reduced almost to zero in the
fourth hour after ingestion of the meal both in the morning as in the after
noon. DIT was assessed without using a noncaloric control test. It has been
argued (23) that such a test should be used to assess diurnal variation in
postabsorptive resting metabolic rate. However, several investigators
calculate DIT in the way as has been done in this study (14-17). Furthermore,
when metabolic rate measurements on such tests are confounded by variation in
the duration of the fasting state during the test, measured changes in resting
metabolic rate may be induced by an adaptation to an increasingly prolonged
fasting state and may not reflect diurnal variation in postabsorptive resting
energy expenditure. In addition, it is a matter of conjecture to infer that
changes in resting energy expenditure in the absence of food will also occur
after ingestion of food.
Total postprandial substrate oxidation and nutrient balances were not sig-
-117-

nificantly different between morning and afternoon tests. There was, however a
transient effect of time of the day on substrate oxidation in the first, third
and fourth hour after ingestion of the meal. The effect of time of the day on
postprandial substrate oxidation is most likely related to differences between
morning and afternoon sessions in the duration of the postabsorptive state. It
can be expected that after a 12-14 hours fast total body glycogen stores are
more depleted than after a 6-7 hours fast. Previous studies in man have shown
that glucose given orally or intravenously is taken up predominantly by muscle
for glycogen synthesis (26,27). In a more glycogen depleted state, the
activity of glycogen synthetase seems increased (28), which may be associated
with an enhanced insulin response or insulin action at the cellular level
(29). This may, in turn, be related to an increased glucose oxidation, since
in the resting state, glucose oxidation up to levels of about 4 mg/min.kg is
associated with increased glucose storage, ie, glycogen synthesis (30). Such
high rates of glucose oxidation did not occur in this study. Due to the
relatively increased glucose oxidation in the first hour after ingestion of
the meal, less glucose may be available in the circulation for oxidation in
the third and fourth hour of the postprandial period. This may enhance fat
oxidation to meet the tissue demands for energy. This mechanism is supported
by the findings of this study.
In conclusion we can state that time of the day had no significant effect on
resting metabolic rate and diet-induced thermogenesis. In addition, no
systematic diurnal variation was observed in total pre and postprandial
substrate oxidation. However, hourly postprandial substrate oxidation
indicated an increased glucose oxidation in subjects in a more prolonged
fasting state.
ACKNOWLEDGEMENTS
The authors would like to thank Mr Marcel van Leuteren for typing the manu
script and Ms Ans Soffers for helping with the urinary urea-nitrogen analyses.
We also would like to thank the volunteers for their kind and enthousiastic
participation in the experiment.
-118-

REFERENCES
1. Aschoff J, Pohl H. Rhythmic variations in energy metabolism. Fed Proc 1970;29:1541-52.
2. Wakeham G. Basal metabolism and the menstrual cycle. J Biol Chem 1923; 23:555-67.
3. Williams WW. The basal metabolic rate, basal body temperatures, and the ovarian cycle. Am J Obstet Gynecol 1943;46:662-7.
4. Solomon SJ, Kurzer MS, Calloway DH. Menstrual cycle and basal metabolic rate in women. Am J Clin Nutr 1982;36:611-6.
5. Webb P. 24-hour energy expenditure and the menstrual cycle. Am J Clin Nutr 1986;44:614-9.
6. Benedict FG. Factors affecting basal metabolism. J Biol Chem 1915;20: 263-99.
7. Buskirk ER, Iampietro PF, Welch BE. Varations in resting metabolism with changes in food, excercise and climate. Metabolism 1957;6:144-53.
8. Bailey D, Harry D, Johnson RE, Kupprat I. Oscillations in oxygen consumption of man at rest. J Appl Physiol 1973;34:467-70.
9. Woo R, Daniels-Kush R, Horton ES. Regulation of energy balance. Ann Rev Nutr 1985;5:411-33.
10. Sharief NN, Macdonald I. Differences in dietary-induced thermogensis with various carbohydrates in normal and overweight man. Am J Clin Nutr 1982; 35:267-72.
11. Welle S, Campbell RG. Normal thermic effect of glucose in obese women. Am J Clin Nutr 1983;37:87-92.
12. Nair KS, Halliday D, Garrow JS. Thermic response to isoenergetic protein, carbohydrate or fat meals in lean and obese subjects. Clin Sei 1983;65: 307-12.
13. Felig P, Cunningham J, Levitt M, Hendler R, Nadel E. Energy expenditure in obesity in fasting and postprandial state. Am J Physiol 1983;244: E45-51.
14. Schutz Y, Golay A, Felber JP, Jéquier E. Decreased glucose-induced thermogenesis after weight loss in obese subjects: a predisposing factor for relapse of obesity? Am J Clin Nutr 1984;39:380-7.
15. Tappy L, Randin JP, Felber JP, Chiolero R, Simonson DC, Jéquier E, DeFronzo RA. Comparison of thermic effect of fructose and glucose in normal humans. Am J Physiol 1986;250:E718-24.
16. Illingwoth PJ, Jung RT, Howie PW, Isles TE. Reduction in postprandial energy expenditure during pregnancy. Br Med J 1987;294:1573-6.
17. Den Besten C, Vansant C, Weststrate JA, Deurenberg P. Resting metabolic rate and diet-induced thermogenesis in abdominal and gluteal-femoral obese women before and after weight reduction. Am J Clin Nutr 1988:in press.
18. Jéquier E. Direct and indirect calorimetry. In: Garrow JS, Halliday D, eds. Substrate and energy metabolism. London: John Libbey, 1985:82-92.
19 Gutman I, Bergmeyer HU. Urea. In: Bergmeyer HU, ed. Methods of enzymatic analysis, 2nd ed. New York: Verlag Chemie Weinheim and Academic Press Inc, 1974:1791-8.
20. Lillioja S, Bogardus C, Mott DM, Kennedy AL, Knowler WC, Howard BV. Relationship between insulin-mediated glucose disposal and lipid metabolism in man. J Clin Invest 1985;75:1106-15.
21. Siri WE. The gross composition of the body. Adv Biol Med Phys 1956;4:239-280.
22. Halberg F. Chronobiolgy. Ann Rev Physiol 1969;31:675-725. 23. Garrow JS. Energy balance and obesity in man. 2nd ed. Amsterdam:
Elsevier/North holland Biomedical Press, 1978:96-7. 24. Schutz Y, Bessard T, Jéquier E. Diet-induced thermogensis measured over a
whole day in obese and nonobese women. Am J Clin Nutr 1984;40:542-52.
-119-

25. Greenspan FS, Forsham PH. Basic & Clinical Endocrinolgy. 2nd ed. Norwalk: Appleton-Century-Crofts, 1986.
26 DeFronzo RA, Jacot E, Jéquier E, Maeder J, Wahren J, Felber JP. The effect of insulin on the disposal of intravenous glucose. Results from indirect calorimetry and hepatic and femoral venous catherization. Diabetes 1981;30:1000-7.
27. Katz LD, Glickman MG, Rapoport S, Ferrannini E, DeFronzo RA. Splanchnic and peripheral disposal of oral glucose in man. Diabetes 1983;32:675-9.
28. Bogardus C, Thuillez P, Ravussin E, Vasquez B, Narimiga M, Azhar S. Effect of muscle glycogen depletion on in vivo insulin action in man. J Clin Invest 1983;72:1605-10.
29. Bogardus C, Lillioja S, Stone K, Mott D. Correlation between muscle glycogen synthase activity and in vivo insulin action in man. J Clin Invest 1984;73:1185-90.
30 Thiebaud D, Jacot E, DeFronzo RA, Maeder E, Jéquier E, Felber JP. The effect of graded doses of insulin on total glucose uptake, glucose oxidation, and glucose storage in man. Diabetes 1982;31:957-63.

Chapter 5. Lack of a systematic sustained effect of prolonged exercise bouts on resting metabolic rate in fasting subjects
JAN A WESTSTRATE MSC, PETER WEYS BSC, ERIC POORTVLIET BSC, PAUL DEURENBERG
PHD, JOSEPH GAJ HAUTVAST MD
ABSTRACT
Resting metabolic rate (RMR) and respiratory quotient (RQ) were measured in
nine young normal weight men after an overnight fast on three occasions, twice
with and once without exercise on the previous evening. Exercise was cycling
for 90 min at 100 W or 175 W. A Latin square experimental design was used to
balance the order of treatment with the type of treatment. Energy expenditure
was measured by indirect calorimetry using a ventilated hood system.
No significant 10-hours after-effect of exercise on RMR was found. The
differences in RMR between the control and the 100 W or 175 W treatments were,
respectively, 0.1 + 1.3 (mean + sem) percent and 2.4 + 1.6 percent of the
control value (4.68 + 0.13 kJ/min). On the 175 W exercise treatment RQ's
decreased significantly from 0.85 + 0.01 (control) to 0.82 + 0.01 (p<0.05).
This indicates that single bouts of prolonged exercise can have a persisting
effect on the type of substrate oxydized in the fasting state.
Key words: indirect calorimetry, exercise, fasting, resting metabolic rate,
respiratory quotients, human
INTRODUCTION
The question whether exercise has a sustained effect on resting metabolic rate
remains controversial (1-10). There is no disagreement on the immediate effect
of exercise on energy expenditure or oxygen consumption. It is also generally
accepted that during the postexercise recovery period, oxygen consumption
-120-

declines gradually to its pre-exercise level (11). This increased oxygen
consumption after exercise has been known as the lactic oxygen debt,
indicating that it would correspond to the amount of oxygen needed to
eliminate the lactate produced during exercise (11). More recently, this
concept has been heavily criticized and it was proposed to rename the lactic
oxygen debt to excess postexercise oxygen consumption (EPOC) (12). The major
part of EPOC would be due to an elevation in tissue temperature and increased
levels of circulating catecholamines (12). However, the biochemical and phy
siological basis of EPOC are not yet completely elucidated.
Controversy arises particularly in estimating the magnitude and duration of
EPOC. Estimates of the duration of EPOC vary from forty minutes to more than
twenty-four hours (1-10). It is important to clarify this issue, since a
persisting EPOC may represent a significant loss of energy for the individual.
This may be important for weight-conscious individuals. The reported
differences in estimates of the duration of EPOC may in part be due to
variation among the studies in methodology used to assess EPOC. Studies
reporting on EPOC differ considerably in, for example, sample size, technique
for measuring oxygen consumption, intensity, duration and type of exercise
used, and, in control of food intake during the postexercise period (1-10). In
most studies the number of subjects was less than six persons (1-3,6,9). Such
studies may not have had enough power to detect a small persisting EPOC.
However, studies that had relatively larger sample sizes (5,7,8,10) also vary
considerably in methodology of the assessment of EPOC. Consequently, estimates
in these studies of the duration and magnitude of EPOC are very dissimilar.
The present study was undertaken to determine whether prolonged exercise bouts
have a sustained effect on oxygen consumption, ie, on resting metabolic rate,
measured 10 hours after the exercise. Two levels of exercise intensity were
used to determine whether there is a threshold level of exercise intensity
before EPOC would be significantly increased. Since exercise may potentiate
the thermic effect of food (13), subjects were fasted during and after
exercise. The results of this study show that moderate degrees of exercise,
performed the evening before assessment of resting metabolic rate, do not
systematically affect resting metabolic rate.
-121-

SUBJECTS AND METHODS
SUBJECTS
Nine young men participated in the study. Volunteers were invited to
participate in the study by advertisement in the University weekly periodical.
Each individual was fully informed on the nature and purpose of the
experiment, before giving his consent to participate. None of the subjects was
on a special diet and none was using any medication. All subjects were
non-smokers and were practicing sports for between 1 and 4 hours weekly. A
questionnaire was used to obtain information on the past and present health
status and on the nutritional habits of the participants. All subjects were
considered by a physician (JGAJH) to be in good health. In addition, only
subjects were selected who had not experienced greater weight changes than 2.5
kg in the half year preceding the start of the study. All subjects were eating
normal balanced diets and were instructed to keep to the same eating and
drinking pattern during the course of the study. The protocol of the study was
submitted to and approved of by the Medical-Ethical Committee of the
Wageningen Agricultural University.
METHODS
Experimental design
Resting metabolic rate (RMR) was measured three times in each subject. RMR
measurements were always performed between 08.00 and 09.00 hours with the
subject in a 12-14 hours postabsorptive state. Between each session there was
a time interval of at least 3 days. Each subject completed the experiment
within 2 weeks. RMR was measured on two mornings, after the subjects had
exercised on a cycle ergometer the evening before the test. A RMR measurement
without exercise on the previous evening served as a control measure. Cycling
was always performed between 20.00 and 22.00 hours, after the subjects had had
their evening meal. The evening meal was composed of ordinary foods and
provided an estimated energy intake of 3-5 MJ. During and after the exercise
period, the subjects were allowed to drink water only. The exercise period
consisted of cycling for 90 minutes at respectively 100 W, ie, at about 25-35
percent of maximal aerobic power (6,8,10,11), and at 175 W, ie, at about 60-70
percent of maximal aerobic capacity (6,8,10,11). The exercise was performed in
-122-
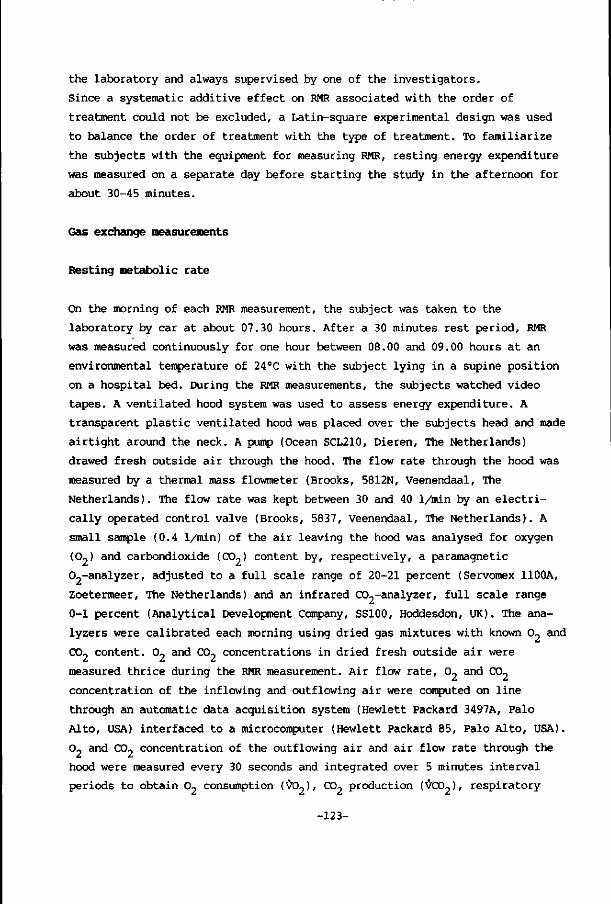
the laboratory and always supervised by one of the investigators.
Since a systematic additive effect on RMR associated with the order of
treatment could not be excluded, a Latin-square experimental design was used
to balance the order of treatment with the type of treatment. To familiarize
the subjects with the equipment for measuring RMR, resting energy expenditure
was measured on a separate day before starting the study in the afternoon for
about 30-45 minutes.
Gas exchange measurements
Resting metabolic rate
On the morning of each RMR measurement, the subject was taken to the
laboratory by car at about 07.30 hours. After a 30 minutes rest period, RMR
was measured continuously for one hour between 08.00 and 09.00 hours at an
environmental temperature of 24°C with the subject lying in a supine position
on a hospital bed. During the RMR measurements, the subjects watched video
tapes. A ventilated hood system was used to assess energy expenditure. A
transparent plastic ventilated hood was placed over the subjects head and made
airtight around the neck. A pump (Ocean SCL210, Dieren, The Netherlands)
drawed fresh outside air through the hood. The flow rate through the hood was
measured by a thermal mass flowmeter (Brooks, 5812N, Veenendaal, The
Netherlands). The flow rate was kept between 30 and 40 1/min by an electri
cally operated control valve (Brooks, 5837, Veenendaal, The Netherlands). A
small sample (0.4 1/min) of the air leaving the hood was analysed for oxygen
(0?) and carbondioxide (CO.,) content by, respectively, a paramagnetic
Oj-analyzer, adjusted to a full scale range of 20-21 percent (Servomex 1100A,
Zoetermeer, The Netherlands) and an infrared COp-analyzer, full scale range
0-1 percent (Analytical Development Company, SS100, Hoddesdon, UK). The ana
lyzers were calibrated each morning using dried gas mixtures with known 0, and
CO, content. 0~ and CO, concentrations in dried fresh outside air were
measured thrice during the RMR measurement. Air flow rate, 0, and CO,
concentration of the inflowing and outflowing air were computed on line
through an automatic data acquisition system (Hewlett Packard 3497A, Palo
Alto, USA) interfaced to a microcomputer (Hewlett Packard 85, Palo Alto, USA).
0 ? and CO, concentration of the outflowing air and air flow rate through the
hood were measured every 30 seconds and integrated over 5 minutes interval
periods to obtain O, consumption (VO_), CO? production (VCO?), respiratory
-123-

quotient (RQ) and RMR according to a modification of an equation described by
Jéquier (14), ie:
VCO, RMR (kJ/tain) = 4.184 . [(4.686 + 1.096 . (—;—2 0.707)) . VO,] and
V02 2
RQ = - — 2 .
Body composition
Fat-free mass and fat mass were estimated by densitometry. Total body density
of each subject was measured once during the experiment in duplicate by the
under water weighing method with simultaneous measurement of residual lung
volume by a helium dilution technique. Fat-free mass and fat mass were
calculated from total body density using Siri's equation (15).
Statistical analysis
The results are expressed as mean values with standard errors of the mean
(sem). Analysis of variance was used to evaluate the data from the Latin
square design (16). Differences in oxygen consumption, resting metabolic rate
and respiratory quotients between pairs of different treatments were evaluated
by paired t-tests using a two-sided significance level of 5 percent.
RESULTS
Table 1 shows age and some physical characteristics of the subjects par
ticipating in this study. The subjects formed a homogeneous group with respect
to age, weight, body mass index, fat-free mass and body fat percentage. None
of the subjects had a body fat content lower than 12 or higher than 20 percent
body weight.
Table 2 gives data on postabsorptive VO,, VCO,, RQ and RMR, separately for the
control and exercise treatments. No significant differences in VO-, VCO, and
RMR were found among the different treatments. RMR's on the 100 W exercise
treatment differed on average 0.04 + 0.06 kJ/min from control RMR's. The mean
difference between RMR's on the 175 W exercise treatment and the control RMR's
was -0.11 + 0.08 kJ/min. Generally, the RQ's were lower on the exercise
treatment when compared to the control RQ's. However, only the difference, ie,
-124-

0.034 + 0.013, in RQ's between the 175 W exercise treatment and the control
treatment reached statistical significance (p = 0.03).
Table 1. Age and same physical characteristics of the subjects.
subjects age
yr
igh t
kg
body mass
index
kg/m
f a t - f r e e
mass*
kg
body f a t
percentage
%
18 81.2 24.4 68.5
* assessed from total body density.
15.6
2 3 4 5 6 7 8 9 mean + sem
24 22 20 21 24 23 28 23
22.6 + 0.9 74
68.3 66.6 83.1 76.4 74.4 74.0 77.8 71.3
.8 + 1.8 22
21.6 22.2 25.4 21.6 22.6 21.7 21.4 22.0
.5 + 0.5 62
58.4 54.8 68.9 66.4 61.5 59.7 68.2 57.6
.7 + 1.8 16
14.5 17.6 17.1 13.0 17.3 19.3 12.4 19.2
.2 + 0.8
Table 2: Postabsorptive oxygen consumption, carbondioxide production, respiratory quotient and energy expenditure in subjects with or without previous exercise.
s u b j e c t s
1
2
3
4
5
6
7
8
9
mean +
sem
VD?
ml/min
231
216
202
262
251
229
233
234
218
231
6 . 0
c o n t r o l
voo2
ml/inin
208
173
170
240
212
189
197
195
185
197
7 . 2
fc> = ootygen c cnsuapt ion ;
* R R c a l c u l a t e d a s H V
pub l i sh ed by J igjuier
PQ
0 .90
0 . 80
0 .84
0 .92
0 . 85
0 . 83
0 . 85
0 . 83
0 . 8 5
0 . 8 5
0 . 0 1
BPE*
k j /m in
4 . 73
4 . 33
4 .09
5 .39
5 .08
4 . 6 1
4 .72
4 .72
4 . 41
4 . 6 8
0 . 13
™2 ml/min
240
214
209
274
239
218
225
227
225
230
6 . 5
fa>2 - c adxndioat ide product ion
= 4 . 1 8 4 .
(14)
< ( 4 . 686 +
e x e r c i s e
m ml/min
204
181
179
226
195
175
176
190
190
191
5 .4
loo w BQ
0 .85
0 . 85
0 .86
0 . 83
0 .82
0 .80
0 .78
0 .84
0 .84
0 . 83
0 . 00
RMR
k j /min
4 .86
4 . 33
4 .24
5 .52
4 . 8 1
4 . 37
4 .49
4 . 59
4 . 5 5
4 . 64
0 . 13
HQ = r e s p i r a t o ry q u o t i e n t ;
1 . 096 . (RB-0.707) ) . * > , )
VD2
ml/min
244
224
222
255
265
221
254
231
227
238
5 .6
e x e r c i s e
*3>
ml /min
206
178
180
205
211
186
208
195
181
194
4 . 5
175 W
BQ
0 .84
0 . 80
0 . 81
0 . 80
0 . 80
0 .84
0 . 82
0 . 84
0 . 80
0 . 82
0 . 01
H f l = r e s t i n g me tabo l i c r a t e
according t o a a c c U f i c a t i o n o f an equa t ion
E m
k j /m in
4 .94
4 . 48
4 .46
5 .11
5 .30
4 . 47
5 . 11
4 . 6 7
4 . 5 5
4 . 7 9
0 . 1 1
-125-

to their control value. In two subjects, no 3 and 7, the difference between
control RMR and RMR on the 175 W exercise treatment was relatively large, ie,
between 5 and 10 percent.
resting metabolic rate (kJ/min)
5.80-
5.20
4.60
4.00
control 100 W exercise 175 W exercise
U • -
5
I
Figure 1: Postabsorptive resting metabolic rate in subjects with or without previous exercise.
DISCUSSION
The present study was designed to determine whether exercise causes an excess
postexercise oxygen consumption (EPOC) under fasting conditions after 10
hours. The results show that postabsorptive resting metabolic rates were not
significantly increased 10 hours after exercise in comparison with control
values. However, the postabsorptive respiratory quotients on the morning after
the 175 W exercise were lower when compared to the control morning. Thus,
exercise, depending on its intensity, can have an after-effect on substrate
oxidation.
Most recent reports on the duration and magnitude of EPOC agree with our
findings (4-6,9), with the exception of two studies (7,8). One of these stu-
-126-

dies showed a variable effect of previous exercise on resting metabolic rate
after 18 hours. In addition, no significant effect of exercise on sleeping
metabolic rate was found (7). Maehlum et al. (8) found that oxygen consumption
was elevated with about 15 per cent for about 12 hours after exercise in
comparison with control values. However, a close inspection of the data of
this study reveals that oxygen consumption was significantly elevated for
about 5 hours after exercise and not for about 12 hours after exercise. This
means that the results of our study do not contrast with the data of the
latter study. Recently, Bahr et al. (10) reported that 12 hours EPOC was
proportional to exercise duration at a work intensity of 70 percent of maximal
oxygen consumption. Besides differences in the intensity of the applied
exercise between Bahr et al.'s study and the present study, there are
differences between both studies in the control of food intake. In Bahr et
al.'s study subjects received meals during the assessment of EPOC, whereas in
this study subjects were fasted during and after the exercise. Part of the
EPOC observed by Bahr et al. may be related to a synergistic effect of
previous exercise on diet-induced thermogenesis (13).
This study did not show a significant persisting 10 hours EPOC under fasting
conditions. Using data from table 2 we calculated that the probability to
detect an increase in RMR in response to previous exercise of about 0.2 kJ/min
(4-5 percent) was 95 percent for the 100 W and 90 percent for the 175 W
exercise treatments ( (* = 0.05, one-sided). This means that with the present
design, increases in postabsorptive RMR's less than 4 percent could not have
been detected with sufficient power. Whether smaller increases in RMR are
physiologically important is a matter of conjecture.
Only two persons showed consistently higher RMR's after exercise compared to
control values, and only two persons showed relatively large increases in RMR
after exercise, ie, between 5 and 10 percent of control values. In these
persons the increase in RMR after exercise could be related to a persistent
EPOC. On the other hand, even in these individuals differences in RMR's among
the three treatments may be simply a reflection of ordinary intra-individual
variation in RMR.
Using data from the literature (6,8,10,11) we estimated that in our subjects
the 100 W exercise treatment represented an average exercise intensity of
25-35 percent of the maximal aerobic power, whereas the 175 W exercise
treatment was conducted at 60-70 percent of the aerobic capacity. The latter
treatment seems comparable in intensity with the treatments used by Bielinski
et al. (7), Maehlum et al. (8) and Bahr et al (10). The 100 W exercise
-127-

treatment is comparable or slightly lower in intensity compared to the
exercise level used by Pacy et al. (6). It has been suggested that variation
in estimate of the magnitude and duration of EPOC is related to differences
among the various studies in exercise intensity (17). Brehm and Gutin (17)
suggested the existence of a threshold value of about 50 percent of the
maximal oxygen consumption before EPOC would be significantly increased. The
175 W exercise treatment employed in this study is certainly above this
threshold value, since our subjects were all normal males not engaged in
athletics.
We calculated that the exercise treatments used in this study corresponded to
an average energy expenditure of about 2.5 MJ (100 W, 90 min) and of about 4
MJ (175 W, 90 min). It cannot be excluded that more prolonged heavier exercise
can cause a sustained increase in energy expenditure. Extreme prolonged
intense exercise may cause long-lasting metabolic disturbances and may also
result in damage of the tissues. Restoring the metabolic disturbances and
tissue damage may, in this case, elevate energy expenditure during recovery
for longer periods of time than after less extreme types of exercise. On the
other hand, if EPOC is only significantly increased after extreme prolonged
heavy exercise, this finding may be of no practical importance for the average
individual engaged in recreational physical activity.
The effect of exercise on substrate oxidation has also been reported by other
investigators (7-10). Sustained moderate to heavy exercise decreases the body
glycogen stores (18) and may reduce postabsorptive hepatic glucose production.
As a corollary, glucose oxidation by peripheral tissues will be reduced.
Instead of glucose, free fatty acids are used as substrates for energy
metabolism.
In generalizing the results of this study to other situations in which
exercise-training is employed, for example, as an adjuvant in weight reduction
programmes, a caveat is warranted. The results of this study can not be used
to evaluate the possible use of exercise-training programmes on long-term
energy expenditure (19-21). Exercise-training programmes may induce an
increase in the fat-free body mass, which in itself can elevate energy expen
diture (22). Furthermore, exercise programmes may have different biochemical
and physiological consequences compared to single sustained bouts of exercise.
In conclusion we can state that single sustained bouts of moderate to heavy
exercise did not have a systematic prolonged effect on postabsorptive resting
metabolic rate. They may, however, increase the amount of fat oxydized in the
postabsorptive state.
-128-

ACKNOWLEDGEMENTS
The authors would like to thank Mr M. van Leuteren for his help in the
conductance of the study. We are also indebted to the volunteers for their
participation in this study.
REFERENCES
1. Edwards HT, Thorndike A, Dill DB. The energy requirement in strenuous muscular exercise. New Engl J Med 1935;213:532-5.
2. Passmore R, Johnson RE. Some metabolic changes following prolonged moderate exercise. Metabolism 1960;9:452-5.
3. Vries HA de, Gray DE. Aftereffects of exercise upon resting metabolic rate. Res Quarterly 1963;34:314-21.
4. Dallosso H, James WPT. Dietary thermogenesis and exercise. Proc Nutr Soc 1981;41:35A (abstract).
5. Freedman-Akabas S, Colt E, Kissileff H, Pi-Sunyer FX. Lack of sustained increase in VO- following exercise in fit and unfit subjects. Am J Clin Nutr 1985;41:535-9.
6. Pacy PJ, Barton N, Webster JD, Garrow JS. The energy cost of aerobic exercise in fed and fasted normal subjects. Am J Clin Nutr 1985;42: 764-8.
7. Bielinski R, Schutz Y, Jéquier E. Energy metabolism during the postexercise recovery in man. Am J Clin Nutr 1985;42:69-82.
8. Maehlum S, Grandmontagne M, Newsholme EA, Sejersted OM. Magnitude and duration of excess postexercise oxygen consumption in healthy young males. Metabolism 1986;35:425-9.
9. Devlin JT, Horton ES. Potentiation of the thermic effect of insulin by exercise: differences between lean, obese and non-insulin-dependent diabetic men. Am J Clin Nutr 1986;43:884-90.
10. Bahr R, Ingnes I, Vaage 0, Sejersted OM, Newsholme EA. Effect of duration of exercise on excess postexercise 07 consumption. J Appl Physiol 1987;62: 485-90.
11. Âstrand PO, Rodahl K. Textbook of work physiology. 3rd ed. New York: McGraw-Hill Book Company, 1986;300.
12. Gaesser GA, Brooks G. Metabolic bases of excess post-exercise oxygen consumption: a review. Med Sei Sports Excer 1984;16:29-43.
13. Young JC, Treadway JL, Balon TW, Garras HP, Ruderman NB. Prior exercise potentiates the thermic effect of a carbohydrate load. Metabolism 1986;35:1048-53.
14. Jéquier E. Direct and indirect calorimetry. In: Garrow JS, Halliday D, eds. Substrate and energy metabolism. London: John Libbey, 1985:82-92.
15. Siri WE. The gross composition of the body. Adv Biol Med Phys 1956;4:239-80.
16. Winer BJ. Statistical principles in experimental design. 2nd ed. New York: McGraw-Hill Book Company, 1971.
17. Brehm B, Gutin B. Recovery energy expenditure for steady state exercise in runners and nonexercisers. Med Sei Sports Exercise 1986;18:205-10.
18. Ahlborg G, Felig P, Hagenfeldt L, Hendler R, Wahren J. Substrate turnover during prolonged exercise in man. Splanchnic and leg metabolism of glucose, free fatty acids and amino acids. J CLin Invest 1974;53:1080-90.
19. Lennon D, Nagle F, Stratman F, Shrago E, Dennis S. Diet and exercise trainina effects on resting metabolic rate. Int J Obes 1985;9:39-47.
-129-

20. Tremblay A, Fontaine E, Poehlman ET, Mitchell D, Perron L, Bouchard C. The effect of exercise-training on resting metabolic rate in lean and moderate obese individuals. Int J Obes 1986;10:511-7.
21. Dale D van, Saris WHM, Schoffelen PFM, ten Hoor F. Does exercise give an additional effect in weight reduction regimes? Int J Obes 1987;11:367-75.
22. Webb P. Energy expenditure and fat-free mass in men and women. Am J Clin Nutr 1981;34:1816-26.
-130-

Chapter 6. Surprisingly large impact of psychological stress on diet-induced thermogenesis but not on resting metabolic rate
JAN A WESTSTRATE MSC, KARIN VAN DER KOOY MSC, PAUL DEURENBERG PHD,
JOSEPH GAJ HAUTVAST MD
ABSTRACT
The effect of psychological stress on resting metabolic rate and diet-induced
thermogenesis was assessed in 12 healthy young non-obese men, body weight 70.2
+ 1.2 kg (mean + sem), age 25 ± 0.6 years. Two types of motion pictures (video
films) were shown to the subjects during the measurements, ie, stress-inducing
horror films and romantic family films (control).
Resting metabolic rate and respiratory quotients were not significantly
influenced by the type of film shown to the subjects. Diet-induced
thermogenesis was signicantly increased on the stress-inducing treatment, 0.95
+ 0.05 kJ/min (mean + sem) versus 0.76 + 0.06 kJ/min (control).
No significant effect of psychological stress on postprandial substrate
oxidation rates, nutrient balances and urinary catecholamines excretion was
observed.
Keywords: indirect calorimetry, resting metabolic rate, diet-induced
thermogenesis, stress, anxiety, human.
INTRODUCTION
Daily human energy expenditure consists of three major components (1,2). The
largest among these is the basal (BMR) or resting metabolic rate (RMR). The
second component is the energy expenditure due to the performance of external
work. The third major component is the increase in resting metabolic rate due
-131-

to the thermic effect of food, also known as diet-induced thermogenesis (DIT).
RMR and DIT contribute about 70-85 percent to daily energy expenditure in the
average individual.
In recent years there has been considerable interest in inter-individual
differences in RMR and DIT (3-9). Inter-individual variation in RMR primarily
reflects differences between individuals in body weight and body composition
(5,9). Controversy exists on the nature and determinants of inter-individual
variation in DIT (3,6,8).
Conflicting results in this area of research might be related to the
methodology used for measuring the thermogenic response to meal ingestion
(10). Various investigators (5,7,11) report that subjects were entertained by
music or motion pictures during the assessment of energy expenditure. This may
have had an impact on the mental state of the subject and likewise on energy
expenditure. Unfortunately there are very little data on the impact of
disturbance of the mental state on RMR and DIT.
The purpose of this study was to determine whether emotionally upsetting and
frightening motion pictures affected RMR and DIT in comparison to romantic
family films. We hypothetized that an emotionally upsetting film would lead to
an increase in energy expenditure mediated by a stimulation of the sympathetic
nervous system. Urinary catecholamines excretion was used as an index of
sympathetic activity (12).
SUBJECTS AND METHODS
SUBJECTS
Twelve young healthy normal weight men participated in this study. Subjects
were either graduates or undergraduates of the University. All subjects were
aged between 22 and 29 years (25 years +0.6 mean + sem), had a body mass 2 2
(Quetelet) index between 18.9 and 22.9 kg/m (21.0 ± 0.3 kg/m ) and a body fat
percentage between 7 and 22 percent (15.0 + 1.4 percent). Body fat percentage
was assessed by densitometry as previously described (11). All subjects were
apparently healthy as evaluated by a medical questionnaire. None of the
subjects was on a diet at the time of the study, used any medication or had
experienced a body weight reduction of more than 2.5 kg in the half year
preceding the study or had glycosuria. All subjects were eating normal
balanced meals. The protocol was fully explained to the subjects, but none of
-132-

the subjects knew the purpose of the study. Subjects were informed that the
study was intended to investigate the effect of meal ingestion and body
temperature on total body impedance, a measure of body composition (13). The
protocol of the study was submitted to and approved of by the Medical-Ethical
Committee of the Wageningen Agricultural University.
METHODS
Experimental design
In each subject energy expenditure was measured on four mornings between 08.00
and 13.00 hours within a period of six weeks. Between each test was a time-
interval of at least two days.
In the first experiment (A), the effect of psychological stress on resting
metabolic rate (RMR) was measured in duplicate in each subject after a 12-14
hours overnight fast. Half of the subjects, randomly selected, started the
first RMR measurement with the stress-inducing treatment (horror films) and
switched to the control treatment (romantic-family type films) after 1.5
hours. The other half of the subjects received the treatments in the reverse
order. At the second RMR measurement the same procedure was followed, but
subjects who had started the first RMR measurement with the stress-inducing
treatment now started with the control treatment and vice versa.
In the second experiment (B), diet-induced thermogenesis (DIT) was measured
twice in each subject after ingestion of a standardized mixed liquid test meal
with an energy content of on average 1900 kJ (10.8 percent protein, 32.9
percent fat, 56.3 percent carbohydrates). Subjects were randomly allocated to
the stress-inducing or control treatment after ingestion of the meal.
Energy expenditure was assessed with a ventilated hood system as previously
described (11). For a DIT assessment, RMR, ie, premeal "baseline" resting
energy expenditure, was based on an one hour continuous registration of oxygen
consumption and carbondioxide production, while the subjects watched 'normal',
ie, control, motion pictures. After meal ingestion postprandial energy
expenditure (PEE) was measured continuously for four hours. The difference
between the mean PEE and the RMR was used to calculate DIT in kJ/min and,
integrated over the total measurement period, in kJ.
After the DIT assessment, urine was collected for determination of
catecholamines excretion rates. Catecholamines excretion rates were also
-133-

assessed in urine collected over the night preceding the DIT measurements.
These values were used as baseline excretion rates. Catecholamines were
analyzed according to Smedes et al. (14) and Westerink et al. (15).
Substrate oxidation rates and nutrient balances were calculated using the
nonprotein respiratory quotients and urinary urea-nitrogen excretion rates for
estimating'protein oxidation as described by den Besten et al. (11).
Statistical analysis
Significance of differences in several variables between the experimental
conditions was evaluated with two-sided paired t-tests. All values are given
as mean + sem.
RESULTS
resting metabolic rate (kJ/min)
5.00
4.90
4.80
4.701
4 60
4.50 a stress
• control
30 60 90 1ST 150 mm
Figure 1. Resting metabolic rate (mean + sem) measured for 2.5 hours in the same subjects on two separate mornings with different types of motion pictures (• = control, D = stress-inducing) shown to the subjects during each measurement.
-134-

Figure 1 shows RMR's measured in experiment A. There was no significant
difference in RMR between the two treatments. On average RMR increased 0.04
kJ/min, less than 1 percent, when films were changed from stress-inducing to
control type.
Figure 2 shows pre- and postprandial energy expenditure measured in experiment
B. RMR's were not significantly different between the two treatments, ie, 4.69
+ 0.10 kJ/min (control) versus 4.67 + 0.08 kJ/min (stress). Diet-induced
thermogenesis, was significantly higher on the stress-inducing treatment, ie,
0.95 + 0.05 kJ/min compared to 0.76 + 0.06 kJ/min for the control treatment
(p=0.021). The difference in total integrated DIT between the treatments was
about 45 + 17 kj or 2.5 + 0.9 percent of the energy content of the test meal.
Average postprandial respiratory quotients did not differ significantly
between both treatments. They werer respectively, 0.91 + 0.006 and 0.91 ±
0.009.
pre-and postprandial metabolic rate (kJ/min)
6.00
5.50
5.00
<K50
Figure 2. Postprandial energy expenditure (mean + sem) measured for 4 hours in the same subjects with (a) or without (•) stress-inducing motion pictures.
Table 1 gives urinary catecholamines excretion for the two treatments.
Baseline levels for the excretion of catecholamines were not significantly
-135-

different between the treatments, neither were the excretion rates measured
over the treatment period or ratios of baseline and treatment period
excretions. Total or individual catecholamines excretion rates or baseline
treatment period ratios were not significantly correlated with DIT.
Table 1. Urinary catecholamines excretion in men before and during energy expenditure measurements under different attention diverting conditions.
Catecholamines Control (n=12) Stress (n=12) before* during"!" during/before before during during/before /yg/h fjg/h /jg/h //g/h
adrenaline 0.43+0.09 0.81+0.10 2.72+0.46 0.34+0.08 0.81+0.09 3.18±0.50 noradrenaline 1.53±0.14 2.31±0.15 1.66+0.19 1.35±0.08 2.09+0.18 1.61±0.20 dopamine 17.3+1.7 22.9±2.5 1.41+0.14 16.9+0.9 21.0±1.7 1.23±0.06
All values are given as mean + sem * measured over an 11 hours period immediately before the start of the energy
expenditure measurements + measured over a 5.5 hours period during energy expenditure measurements
Postprandial substrate oxidation rates and nutrient balances did not differ
either between both treatments (data not shown).
DISCUSSION
This study shows a surprisingly large impact of psychological stress on
diet-induced thermogenesis, but not on resting metabolic rate.
Most reviews on factors affecting energy output in humans mention that anxiety
or stress may influence energy expenditure (16,17,18). Relatively few studies,
however, give quantitative data on the impact of some sort of emotional upset
on human energy expenditure (19-22). The results of the latter studies do not
permit an accurate estimation of the impact of stress on energy expenditure.
Only one recent study reports on the impact of a more usual type of stress,
ie, of arduous clerical work, on daily energy expenditure (23).
In the study here reported, stress was induced by motion pictures. The use of
a motion picture' to induce stress under laboratory conditions is common
practice in the field of experimental psychology (24). It was expected that an
emotionally upsetting and frightening film would lead to activation of the
sympathetic nervous system, causing a rise in energy expenditure. To our
surprise no significant effect of stress on RMR was found, whereas DIT was
-136-

significantly increased by about 0.20 kJ/min. On average only 0.04 kJ/min of
this increase may have been due to the impact of stress on RMR. The absence of
an effect of stress on RMR indicates that under fasting conditions an
emotionally upsetting film is not a sufficient stimulus of the sympathetic
nervous system. The combination of exposure to psychological stress and
ingestion of food resulted in increased rates of energy expenditure,
suggesting a synergistic action of stress and food ingestion on the activity
of the sympathetic nervous system.
Ingestion of food, especially of carbohydrates, affects the activity of the
sympathetic nervous system (25). A relatively large part, 30-40 percent, of
the total DIT response is thought to be mediated by an increase in the
activity of the sympathetic nervous system (2). An increased activity of the
sympathetic nervous system is usually reflected in increased urinary
catecholamines excretion rates (12). In this study, however, no significant
correlation was found between total DIT and urinary catecholamines excretion
rates, suggesting that urinary catecholamines excretion rates are not a
sensitive indicator of stimulation of the sympathetic nervous system.
Postprandial substrate oxidation rates and nutrient balances indicated no
significant differences between the treatments in the metabolism of the
ingested nutrients. This indicates that the effect of stress on DIT was due to
other factors increasing thermogenesis, for example by a stimulation of ionic
pumping (26) or substrate cycling in skeletal muscles (27). In addition, it is
possible that skeletal muscle tone was higher in subjects exposed to the
stress treatment in comparison with the control treatment. The energy expended
by such isometric muscle contraction may have elevated total energy
expenditure. Finally, total postprandial energy expenditure may have been
elevated by minor movements. However, an increase in muscle tone and in minor
movements due to stress would also have elevated RMR, which was not found.
Whatever the cause of the increased DIT, this study clearly shows that
stress-inducing motion pictures can significantly influence diet-induced
thermogenesis. The findings of this study implicate that investigators of RMR
and DIT should explicitly state under what conditions energy expenditure was
assessed.
-137-

ACKNOWLEDGEMENTS
The authors would like tho thank Mr Roel Bruntink of the Institute of Animal
Physiology of the University of Groningen (the Netherlands) for the analyses
of the urinary catecholamines, Mr Marcel van Leuteren for preparing the
manuscript and last, but not least, the subjects for their enthousiastic
participation in a sometimes stressful experiment.
REFERENCES
1. Danforth E. Diet and obesity. Am J Clin Nutr 1985;41:1132-45. 2. Sims EAH, Danforth E. Expenditure and storage of energy in man. J Clin
Invest 1987;79:1019-25. 3. Pittet P, Chappuis P, Acheson K, de Techtermann F, Jéquier E. Thermic
effect of glucose in obese subjects studied by direct and indirect calorimetry. Br J Nutr 1976;35:281-92.
4. James WPT, Davies HL, Bailes J, Dauncey HJ. Elevated metabolic rates in obesity. Lancet 1978;1:1122-5.
5. Ravussin E, Burnand B, Schutz Y, Jéquier E. Twenty-four-hour energy expenditure and resting metabolic rate in obese, moderate obese, and control subjects. Am J Clin Nutr 1982;35:566-73.
6. Felig P, Cunningham J, Levitt M, Hendler R, Nadel E. Energy expenditure in obesity in fasting and postprandial state. Am J Physiol 1983;244:E45-51.
7. Schutz Y, Bessard T, Jéquier E. Diet-induced thermogenesis measured over a whole day in obese and nonobese women. Am J Clin Nutr 1984;40:542-52.
8. Segal KR, Gutin B, Nyman AM, Pi-Sunyer FX. Thermic effect of food at rest, during exercise, and after exercise in lean and obese men of similar body weight. J Clin Invest 1985;76:1107-12.
9. Bogardus C, Lillioja S, Ravussin E, Abbott W, Zawadzki JK, Young A, Knowler WC, Jacobowitz R, Moll PP. Familial dependence of the resting metabolic rate. N Engl J Med 1986;315:96-100.
10. Jéquier E. Energy expenditure in obesity. Clin Endocrinol Metab 1984;13:563-80.
11. Den Besten C, Vansant G, Weststrate JA, Deurenberg P. Resting metabolic rate and diet-induced thermogenesis in abdominal and gluteal-femoral obese women before and after weight reduction. Am J Clin Nutr 1988;47:840-7.
12. Fitzgerald GA, Dollery CT. Biochemical indices of sympathie function in man. TIPS 1979:84-7.
13. Deurenberg P, Weststrate JA, Hautvast JGAJ. During weight loss changes in fat free mass measured by bioelectrical impedance differ from changes in fat free mass measured by densitometry. Am J Clin Nutr 1989: in press.
14. Smedes F, Kraak JC, Poppe H. Simple and fast solvent extraction system for selective and quantitative isolation of adrenaline, noradrenaline and dopamine from plasma and urine. J Chrom 1982;231:25-9.
15. Westerink HC, Bosker FJ, O'Hanlon JF. Use of alumina, Sephadex G—10 and ion-exchange columns to purify samples for determination of epinephrine, norepinephrine, dopamine, homovanillic acid and 5-hydroxyindoleacetic acid in urine. Clin Chem 1982;28:1745-8.
16. Garrow JS. Energy balance and obesity in man. 2nd ed. Amsterdam: Elsevier /North Holland Biomedical Press, 1978.
-138-

17. Woo R, Daniels-Kush R, Horton ES. Regulation of energy balance. Ann Rev Nutr 1985;5:411-33.
18. Sims EAH. Energy balance in human beings: the problems of plenitude. Vit Horm 1986;43:1-101.
19. Landis C. Studies of emotional reactions. IV. Metabolic rate. Am J Physiol 1925;74:188-203.
20. Blaza SE, Garrow JS. The effect of anxiety on metabolic rate. Proc Nutr Soc 1980;39:13A (abstract).
21. Damask, MC, Askanazi J, Weissman C, Elwyn DH, Kinney JM. Artifacts in measurements of resting energy expenditure. Crit Care Med 1983;11:750-2.
22. Udalov Ju, Sibuneev AG. Effect of nervous strain on some aspects of metabolism. Nutr Abstr Rev 1964;34:524-5.
23. Webster JS, Welsh G, Pacy P, Garrow JS. Description of a human direct calorimeter, with a note on the energy cost of clerical work. Br J Nutr 1986;55:1-6.
24. Lazarus RS, Speisman JC, Mordkoff AM, Davison LA. A laboratory study of phychological stress produced by a motion picture film. Psychol Monograph 1962;76:43-51.
25. Welle S, Lilavivat U, Campbell RG. Thermic effect of feeding in man: increased plasma norepinephrine levels following glucose but not protein or fat consumption. Metabolism 1981;30:953-8.
26. Himms-Hagen J. Brown adipose tissue metabolism and thermogenesis. Ann Rev Nutr 1985;5:69-94.
27. Fagher B, Liebhold H, Montri M, Morritz U. Thermogenesis in human skeletal muscle as measured by direct microcalorimetry and muscle contractile performance during ß-adrenoceptor blockade. Clin Sei 1986;70:435-41.
-139-

Chapter 7. Nature and magnitude of inter-individuel differences in resting metabolic rate and diet-induced thermogenesis in lean and obese individuals
JAN A WESTSTRATE MSC, PAUL DEURENBERG PHD, JOSEPH GAJ HAUTVAST MD
ABSTRACT
Resting metabolic rate (RMR) was measured in 154 subjects, 76 non-obese men,
44 non-obese women and 34 obese women. Diet-induced thermogenesis (DIT) and in
vivo fuel utilization rates were measured in a subgroup of 126 individuals, 55
men, 37 non-obese and 34 obese women. RMR was positively associated (r = 0.80)
with the size of the fat-free mass (FFM), ie, RMR (kj/d) = 1813 + 86*FFM (kg).
The 5th and the 95th percentile values for the distribution of the RMR per kg
fat-free mass (FFM) were 100 and 150 kJ/d, respectively. RMR per kg FFM was
significantly lower in men compared to women, 115 + 1 (mean + sem) kJ/d versus
126 + 2 kJ/d (p<0.001). RMR adjusted for FFM, age and fat mass was
significantly (p<0.05) lower among obese women with a non-abdominal type of
body fat distribution compared to non-obese men, non-obese women and obese
women with an abdominal type of body fat distribution. Inter-individual
variation in RMR, adjusted for FFM, age and fat mass, was similar among the
various groups and averaged 10 percent.
DIT to a mixed test meal of 1775 + 34 kJ was 7.5 + 0.2 percent of the ingested
energy. DIT was positively (r = 0.52) related to the energy content of the
test meal. The 5th and 95th percentile points for the distribution of DIT were
4.0 and 12.0 percent (of energy content of test meal), respectively. DIT was
significantly higher in men compared to women, 8.4 + 0.3 versus 6.8 + 0.3
percent (p<0.001). In men, on average 77 percent of DIT was calculated to be
related to energy costs for processing the ingested nutrients, in women this
was on average 99 percent. In each sex, DIT was not significantly associated
with FFM, body weight or body fat content. Inter-individual variation in DIT
among the various groups averaged 36 percent and was, respectively, 30 percent
-140-

in men, 43 percent in non-obese women and 26 percent among obese women.
Postabsorptive and postprandial in vivo fuel utilization patterns were similar
in men and women. After meal ingestion carbohydrate oxidation increased from
on average 37 to 51 percent of total energy expenditure and fat oxidation
decreased from on average 40 to 26 percent. On average less than 5 percent of
the ingested glucose was converted to fat.
It is concluded that a relatively low RMR or DIT is not an exclusive
characteristic of the obese.
keywords: indirect calorimetry, resting metabolic rate, diet-induced
thermogenesis, fuel utilization, men, women, obesity, inter-individual
variation
INTRODUCTION
Energy requirements for adults are assumed to be primarily dependent on age,
sex, body weight and physical activity (1). The current theory on human energy
requirements attributes variation in energy needs among individuals of given
age, sex and body weight to differences in the degree of physical activity. It
is assumed that age, sex and body weight determine maintenance requirements to
which increments are added, depending on physical activity, to derive total
energy needs. Maintenance requirements would be indicated by the level of the
resting ("basal") metabolic rate (RMR). The RMR can be directly assessed using
(in)direct calorimetry or it can be estimated from a variety of simple
prediction equations (2-7). In addition to the energy expended for maintenance
and physical activity, energy is dissipated by the body in the processing of
ingested nutrients, ie, in diet-induced thermogenesis (DIT) (8).
The validity of the current theory on human energy requirements may, however,
be questioned. At first, Sukhatme and Margen (9) have pointed out, that
individuals can adapt to varying energy intakes not by alterations in the
level of physical activity, but as a result of changes in the efficiency of
energy utilization. These changes would manifest themselves in adaptive
fluctuations of the level of energy expenditure in one or more components of
daily energy output. Whether individuals may show the relatively large changes
in efficiency of energy utilization as proposed by Sukhatme and Margen, is at
present a matter of conjecture. Secondly, evidence is accumulating from
metabolic studies for inter-individual differences in resting energy
-141-

expenditure among individuals of given sex, age, body weight and body
composition (10,11). However, the nature and magnitude of these differences
remain to be definitely assessed. Resolving this issue may be important for
various reasons, ie, for the diagnosis of metabolic disorders as hypo- and
hyperthyroidism, for the refinement of estimates of human energy requirements,
and, for the identification, among the lean, of individuals, that would be at
increased risk for body weight gain, and, among the obese, of individuals that
would be particularly resistant to body weight reduction.
In the present study resting metabolic rate and diet-induced thermogenesis
were measured in a group of 154 men and women, and in a subgroup of 126
persons, respectively. The aims of the study were to assess the magnitude and
determinants of inter-individual differences in RMR and DIT. Information was
also obtained in a subsample of 91 subjects on the intra-individual variation
in RMR and DIT.
SUBJECTS AND METHODS
SUBJECTS
Between January 1986 and august 1988 resting metabolic rate (RMR) was measured
in a group of 154 subjects; in 126 of these individuals diet-induced
thermogenesis (DIT) was also assessed.
The subjects participated in ongoing studies on methodological aspects of the
measurement of postprandial energy expenditure, or in studies on
(non)-nutritional influences on RMR and DIT. During this period a total of 570
RMR measurements and a total of 360 DIT measurements were obtained in these
subjects. Volunteers were invited to participate in the studies by
advertisements in regional newspapers, the University weekly periodical, by
poster or through informal contacts. After applying for participation,
subjects received a letter informing them on the nature and purpose of the
experiment. Subjects also received one or two questionnaire(s) for obtaining
information on past and present health status, nutritional habits, smoking and
(alcoholic beverages) drinking behaviour, habitual activity pattern and
sporting activities. Subjects eligible for participation were invited for a
first visit to the laboratory to familiarize them with the apparatus for
measuring energy expenditure. After giving their informed consent subjects
were allowed to participate. The protocol of each study was submitted to and
-142-

approved of by the Medical-Ethical Committee of the Wageningen Agricultural
University. Subjects participating in the studies were all in apparent good
health had no evidence of past or present thyroid disorders or diabetes
mellitus, no glycosuria or proteinuria, were not using drugs known to affect
energy metabolism, were all eating normal balanced diets, smoked less than 10
cigarettes/d, drunk no more than 5 alcoholic drinks/d, did not exercise more
than 7 hours/Week, and had had stable (within 2.5 kg of body weight at entry)
body weights at least 6 months prior to the beginning of the study. Women were
in the premenopausal state. In the obese fasting blood glucose values were all
within the normal range, ie, between 3.9 and 5.6 mmol/1 (12).
METHODS
Gas exchange measurements
Gas exchange measurements were performed with a ventilated hood system, which
has been described in detail before (13,14). Briefly, a subject's head is
covered with a transparent perspex hood with an air inlet on top and an air
outlet on the side. The hood is made airtight around the neck with a cord.
Fresh air is drawn through the hood by negative pressure created by a pump
placed downstream. The fresh air mixes with the subjects expired air, which
causes a decrease in oxygen content and an increase in carbondioxide content
of the air leaving the hood, relative to the gas concentrations of the air
entering the hood. Accurate measurement of the oxygen (Servomex 1100A,
Zoetermeer, the Netherlands) and carbondioxide (Analytical Development Company
SS100, Hoddesdon, UK) content of the inflowing and outflowing air combined
with measurement of the volume of air (Brooks massflowmeter 5812N, Veenendaal,
the Netherlands) flowing through the hood permits a calculation of the amount
of oxygen used by the subject and the amount of carbondioxide produced. The
analyzers and flowmeter voltage outputs were digitized (Hewlett Packard 3497A,
Palo Alto, US) and connected to a desktop computer (Hewlett Packard 86B or 85,
Palo Alto, US). Continuous integrated calorimetric measurements were recorded
by the computer and printed over 2 or 5 minutes intervals. The rate of oxygen
consumption and carbondioxide production serve as a basis for the calculation
of metabolic rate. Metabolic rate was calculated by a computer using an
equation published by Jéquier et al. (15). From repeated ethanol combustions
-143-

we calculated a random error of 2.8 percent of energy expenditure measurements
with the ventilated hood system.
Resting metabolic rate
Resting metabolic rate (RMR) was generally measured in the morning between
7.30 hours and 9.00 hours, after an overnight fast, for a period of one hour
continuously after a 30 minutes acclimatization period. Subjects were
instructed to refrain from heavy physical exercise the evening before the RMR
measurements. During the acclimatization period the hood was already placed,
but subjects were still allowed to move in order to find a most comfortable
position for the RMR measurement. Subjects were measured in a supine
(semi-recumbent) position in a noise and temperature controlled (23-26°C) room
during the RMR measurement. Subjects were asked to remain motionless, but
awake. Subjects watched motion pictures during the measurement. In some
subjects RMR was measured in the afternoon between 13.30 and 15.00 hours with
the subjects in a 4.5 hours postabsorptive state after a standardized
breakfast of about 2 MJ. We have previously shown that RMR's measured under
these conditions in the morning do not differ systematically from RMR's
measured in the afternoon (13). RMR was calculated omitting metabolic rate
readings disturbed by spontaneous movements or hypo- or hyperventilation. For
103 subjects repeated RMR measurements were available to assess
intra-individual variability in energy expenditure.
Diet-induced thermogenesis
In 126 individuals diet-induced thermogenesis (DIT) was measured. After an
initial RMR measurement subjects received a mixed liquid meal composed of
yoghurt, sucrose, orange juice, vegetable fat and a protein supplement with an
average nutrient composition of 12 percent protein, 55 percent carbohydrates
and 33 percent fat. The energy content of the test meal varied, depending on
the type of study, between about 1300 kJ and 2600 kJ. Mean energy content was
1775 + 34 kJ. The liquid meal was eaten within 5 minutes. The meal was sipped
through a plastic tube which was passed through an opening in the hood.
Fifteen subjects received a normal solid mixed meal which was eaten within 15
minutes. No systematic difference in DIT between a liquid or solid meal was
observed (14). After the subjects had eaten their meal, energy expenditure was
measured continuously for a period of 3-4 hours, depending on the type of
-144-

study. The duration of the postprandial measurements period was on average 224
+ 2 minutes. DIT was defined as the cumulative increase in energy expenditure
after meal ingestion above the premeal energy expenditure, ie, the RMR. In
some subjects energy expenditure at the end of the postprandial period had
decreased to a level below the corresponding RMR. For these subjects a new
baseline for the calculation of DIT was defined, ie, the mean of the RMR and
the energy expenditure at the end of the postprandial period. The energy
expended for the processing of the ingested nutrients (in kJ) was divided by
the energy content of the test meal to express DIT (16). This allows a
comparison of thermic responses to meals with differing energy contents (17).
In 91 of the subjects repeated DIT measurements were obtained to assess
intra-individual variability.
The energy content of the test meals was determined by chemical analyses of
duplicate portions of the meals.
Substrate utilization rates
Pre- and postprandial substrate oxidation rates and nutrient balances were
calculated as previously described (13,14), using the nonprotein respiratory
quotient. The nonprotein respiratory quotient was calculated from oxygen
consumption, carbondioxide production and total urinary nitrogen excretion.
After the gas exchange measurements subjects voided for determination of total
nitrogen excretion. Total nitrogen excretion was determined with the Kjeldahl
method. The energy costs for processing the ingested nutrients were calculated
using factors given by Flatt for the energy costs of processing the ingested
nutrients through oxidation or storage pathways (18).
Body composition
Body weight was measured to the nearest 0.05 kg (Berkel ED-60T, Rotterdam, the
Netherlands) with the subjects in an overnight fasting, or 4.5 hours
postabsorptive state, after voiding and wearing underwear or swimming clothes
only. Body composition was determined using densitometry. Subjects were
measured underwater with a simultaneous assessment of residual lung volume
according to a helium dilution method. Total body density was calculated and
the size of the fat-free mass and the fat mass were estimated as previously
described (13).
-145-

Statistics
Differences in continuous variables among groups were evaluated using analysis
of variance or unpaired Student's t-tests. Adjusting group means for
covariates was performed by analysis of covariance (19). Linear relationships
between resting metabolic rate and body composition variables were assessed
using univariate or multiple regression analyses (20). Correlation
coefficients are Pearson's product-moment or partial correlation coefficients.
Inter-individual variation in RMR and DIT was calculated after assessing
linear effects on RMR or DIT of body composition (RMR) variables and energy
intake of test meals (DIT) in multiple regression models. The residual mean
square of these models was used as an estimator of the 'adjusted'
between-person variation.
RESULTS
Table 1 shows physical characteristics, resting metabolic rate and respiratory
quotients of subjects participating in the two studies. Besides systematic
Table 1. Physical characteristics and characteristics of postabsorptive resting energy expenditure of subjects in two studies.
Study 1 Study 2
Inter-individual variation in resting
metabolic ra te
Inter-individual variation in diet-induced
thernogenesis and in vivo fuel u t i l i za t ion
Women (n=78) Man (n=55) Honen (n=71|
variables studied
age (yrs) 29.3 ± 0.4 (18-J1)
w igh t (kg) 73.9 ± 0.9 (58.4-102.0)
fa t-free
mass
fat mass
body fat
content (%) 15.0 ± 0.5 (5.5-24.7)
WR (kj/min) 4.99 ± 0.07 (3.93-7.29)
WR (kJ/kgFTM.d) 114.9 ± 1.3 (92.8-149.6)
(kg) 62.7 ± 0.8 (48.8-91.4)
(kg) 11.2 ± 0.4 (3.4-25.2)
31.7 + 1.1 (18-49)
74.1 ± 2.0 (50.3-125.9)
46.1 ± 0.5 (36.6-60.6)
28.0 ± 1.7 (9.1-70.4)
35.5 + 1.2 (14.6-55.9)
4.01 + 0.06 (3.10-5.70)
125.8 + 1.6(100.8-155.6)*
24.3 ± 0.5 (20-41)
73.4 + 1.0 (58.4-101.8)
62.4 ± 0.9 (48.8-91.4)
11.0 + 0.5 (3.4-19.1)
14.9 + 0.5 (5.5-22.3)
5.00 + 0.09 (3.93-7.29)
115.7 + 1.6 (92.8-148.8)
32.3 ± 1.1 (20-49)
75.3 + 2.2(50.3-125.9)
46.3 ± 0.6 (36.6-60.6)
29.0 ± 1.8 (9.1-70.4)
36.3 ± 1.2 (14.6-55.9)
4.01 ± 0.06 (3.10-5.70)
125.1 + 1.7(100.8-155.6)*
BQ - IWR 0.838 ± 0.005(0.746-0.940) 0.831 + 0.004 (0.754-0.929) 0.836 ± 0.005(0.746-0.940) 0.833 ± 0.004(0.754-0.929)
AH values are given as aean ± sea (range)
HR = postabBorptive resting •etabolijc rate; kg FHf = fat-free i
* significant difference betuBen sen and wmea a t p < 0.001
s; BQ = respiratory quotient
-146-

differences between men and women in body composition variables, ie, in
fat-free mass, fat mass and body fat content, RMR expressed on a fat-free mass
basis was significantly higher in women compared to men. Women had on average
9 percent higher RMR's per kg fat-free mass than men did. Five percent of the
total population had RMR's per kg fat-free mass below 100 kJ/d and five
percent above 150 kJ/d. Inter-individual coefficients of variation in resting
metabolic rate after adjusting for fat-free mass, age and fat mass were,
respectively, 9.6 percent in men, 11.3 percent in non-obese women and 10.7
percent in obese women, intra-individual variation in RMR was 5 percent in men
and 6 percent in the non-obese and the obese women.
resting metabolic rate (kJ/d)
10400
8800
7200-
5600
N =154 r =0.80 RMR=1813*86t FFM
• • ••• • • • • • • • • • • • • • • • • • • • • • • •
• • • • ••• • • • • •#• • • • • • • • • • • • • • • • • • « • •• • • • M • • • • * •••••• • •
• • M • •• • • • • M * • •
w r - 1 1 1 1 1 -r 35 49 65 77 91
fat-free mass (kg)
Figure 1: Relation between fat-free mass (FFM) and resting metabolic rate (RMR) in 154 subjects.
Figure 1 show the relationship between fat-free mass and RMR. No significant
differences among men, non-obese women and obese women in slopes or intercepts
of the regression equations were found. In the obese women, in addition to the
size of the fat-free mass, the size of the fat mass was significantly
positively related to RMR (r=0.68, p<0.001), even after adjusting for the
-147-

linear effects of the fat-free mass on fatmass (r=0.44, p<0.01). Comparing
RMR's, adjusted for age, fat-free mass and fat mass, among men, lean women and
obese women revealed significantly lower RMR's among the obese when compared
to the non-obese women and men. Adjusted RMR's were, respectively, 4.59 + 0.11
kJ/min (men), 4.59 + 0.10 kJ/min (lean women) and 4.18 + 0.18 kJ/min (obese
women). A further analysis showed that the lower adjusted RMR's were, in
particular, characteristic for the non-abdominal obese women, ie, for the
women with a waist-to-hips girth ratio below 0.85. In these women adjusted
RMR's were 4.13 + 0.18 kJ/min, whereas in women with an abdominal type of body
fat distribution adjusted RMR's were 4.52 + 0.23 kJ/min.
Table 2. Resting metabolic rate, diet-induced thermogenesis and in vivo fuel utilization in men and women.
Rtt
DIT
DIT - % energy content meal
DTT - % increase WR
basal fat oxidation
basal CH3 oxidation
postprandial fat oxidation
postprandial d£) oxidation
protein oxidation
basal fat oxidation
basal OÜ oxidation
basal protein oxidation
postprandial fat oxidation
postprandial CK> oxidation
postprandial protein oxidation
(kJ/min)
(kJ)
(%) (%)
(10 .mg/fciin.kgFFM)
(10 .ng/fain.kgFTM)
(10 .mjAiin.kgFFM)
(10 .mg/hdn.kgFTM)
(10 .ncytoin.kgFTM)
(% JWR)
(% Em)
(% tm.) (% PEEI
(% PEE)
(% PEE)
Men (n=55)
5.00 + 0.09
164 + 7
8.37 ± 0.33
13.9 ± 0.7
799 ± 40
1748 + 78
594 + 44
3106 + 89
963 + 24
39.6 ± 1.8
37.6 ± 1.6
22.5 ± 0.5
26.3 ± 1.7
54.0 ± 1.5
19.8 ± 0.5
(3.93-7.29)
(68-329)
(4.02-14.39)
(6.9-32.4)
(50-1623)
(262-3288)
(-47-1466)
(1569-4388)
(649-1364)
(2.5-«9.6)
(5.4-67.9)
(14.3-34.5)
(-0.4-59.2)
(26.9-73.8)
(13.3-26.7)
Women (n=71)
4.01 ± 0.06
109 ± 5
6.78 ± 0.31
12.3 ± 0.5
876 ± 37
1825 + 67
639 + 35
3273 + 87
1069 ± 29
39.9 ± 1.5
36.3 + 1.2
23.3 ± 0.7
26.3 ± 1.3
53.3 ± 1.2
20.8 + 0.6
(3.10-5.70)*
(-5-209)*
(-0.35-15.49)*
(-1.0-22.5)
(61-1623)
(247-3300)
(-254-1346)
(1326-4975)
(538-1758)*
(2.9-71.2)
(4.8-60.4)
(10.9-40.6)
(-10.7-57.2)
(23.3-70.8)
(9.1-35.7)
Values axe given as n a n ± seal (range)
IHt = postabsorptiue resting •Btabolic rate; DTT = diet-induced therMigenesis; kgFTH = kg fat free »ass; OD =
carbohydrate (glycogen or glucose); FEE = postprandial energy expenditure
* significant difference betjuean BBn and women at p < 0.001
Table 2 shows RMR, DIT and in vivo fuel utilization rates in men and women.
DIT was significantly (p<0.001) associated with the energy intake of the test
meal (r = 0.52). The 5th and 95th percentile values of the DIT distribution in
the total sample were 4 and 12 percent (of energy content of the test meal),
respectively. A significant difference of 24 percent was observed in DIT
between men and women. No significant difference was observed between lean
-148-

women and obese women in DIT. DIT was, respectively, 6.65 + 0.56 percent in
the lean and 5.71 + 0.99 percent in the obese. DIT was not significantly
affected in the obese women by type of body fat distribution. The differences
in DIT between the sexes occurred during the entire first three hours of the
postprandial period and parallelled differences in carbohydrate oxidation, but
not in fat oxidation. Oxidation rates during the first three hours of the
postprandial period were, respectively, for carbohydrates 217 + 8 mg/min in
men versus 163 + 5 mg/min in women (p<0.01), and for fat 3 1 + 3 mg/min in men
versus 2 6 + 2 mg/min in women. Protein oxidation differed also significantly
between the sexes, ie, 6 0 + 2 mg/min in men and 5 0 + 2 mg/min in women. No
differences in basal or postprandial fuel utilization rates expressed on a
fat-free mass basis between the sexes was observed, except for protein
oxidation, which was on average 11 percent higher in women compared to men.
In both sexes, fat oxidation contributed in the basal state on average 40
percent to total basal energy expenditure. Carbohydrate oxidation contributed
37 percent to total basal energy expenditure. In the postprandial state, fat
oxidation was reduced to 26 percent of total energy expenditure. A reciprocal
change was observed in postprandial carbohydrate oxidation. In 23 persons
there occurred during the postprandial period occasionally net transformation
of glucose into fat. In the other 103 subjects no net lipogenesis occurred. On
average, in men, 4 percent of the ingested glucose was converted to fat, 33
percent was stored as glycogen and 63 percent was oxidized. In women these
figures were, respectively, 5, 39 and 56 percent. On average, 50 percent of
the amount of ingested fat was oxydized in the postprandial period in both
sexes.
The coefficients of inter-individual variation in DIT were 29 percent in men,
43 percent in non-obese women and 26 percent in obese women. Inter-individual
variation in DIT was similar to intra-individual variation in DIT. The
coefficients of inter-individual variation, adjusted for fat-free mass, of in
vivo fuel utilization rates in the postabsorptive state were, respectively, 36
percent for fat, 30 percent for carbohydrates and 21 percent for protein.
Inter-individual variation of fuel utilization rates in the postprandial
state, adjusted for fat-free mass and nutrient intake with the test meal, was
respectively, 50 percent for fat, 21 percent for carbohydrates and 20 percent
for protein. Inter-individual variation in fuel utilization rates was similar
among men, non-obese women and obese women.
Table 3 shows differences in body composition and energy metabolism between
subjects characterized by relatively low (< 10th percentile of sex-specific
-149-

frequency distribution) or high (> 90th percentile) RMR per kg fat-free mass.
Significant differences between both groups, separately for men and women,
were observed in the size of the fat-free mass and in basal fat oxidation
rates. In addition, in women a significant difference between both groups in
DIT was observed. Women with relatively low RMR's were for the most part (n =
6) obese women characterized by a non-abdominal type of body fat distribution
with waist-to-hips girth ratio of 0.75 + 0.01.
Table 3. Body composition and energy expenditure in subjects characterized by relatively low or high resting metabolic rates per kg fat-free mass.
weight (kg)
body fat content (%)
fat-free mass (kg)
resting metabolic rate (kJ/d.kgFFM)
diet-inckiced thernogenesis (% Ein)
fat oxidation (10 .mj/min.kgrTM)
CH3 oxidation (10 .mg/min.kgFFM)
protein oxidation (10 -mg/min.kgFYM)
low (n=7)
78.2 + 3.9
14.9 + 1.6
66.2 ± 2.1
98.2 ± 0.9
7.65 ± 1.90
750 ± 71
1298 ± 196
839 + 54
Men
high (n=8)
68.8 + 2.9
14.5 ± 1.4
58.7 ± 2.5*
137.8 ± 2.8***
7.99 + 0.78
1087 ± 105*
1784 ± 172*
1123 ± 71*
low (n=8)
85.1 ± 4.1
40.4 + 2.4
50.3 ± 1.9
103.1 ± 0.8
5.64 ± 0.59
594 ± 83
1534 ± 150
1113 ± 88
« —
high (n=8)
61.7 ± 3.4***
28.6 + 2.7**
43.5 + 1.3**
152.4 ± 0.7***
10.15 ± 1.54*
1200 + 97***
2186 ± 271
1047 ± 112
Values axe given as B M I + see
hgpm = kg fat-free eass; Bin = energy UJILHUL of t e s t eaBl; OD = carbulaJüLale (glycogen or glucose)
* significant difference between low and high groups at p < 0.05
** irddaa at p < 0.01
i at p < 0.001
Table 4 shows some comparisons on variables between subjects characterized by
a relatively high DIT and subjects with a relatively low DIT. For men, no
significant differences between both groups in any of the variables was
observed. Women with relatively high DIT's had higher postprandial
carbohydrate oxidation rates and RMR's compared to women with relatively low
DIT'S.
In addition, we compared the measured RMR's in this study with RMR's predicted
according to formulas recently published by Owen et al. (6,7). In men, the
measured RMR's were 3.9 + 1.1 percent higher (p<0.001) compared to predicted
RMR's. Also in women, measured RMR's were systematically higher (p<0.001)
compared to predicted RMR's, on average by 2.9 + 1.3 percent.
-150-

Table 4. Body composition and energy expenditure in subjects characterized by relatively low or high thermic response to food.
weight (kg)
body fat content (%)
fat-free mass (kg)
resting metabolic ra te (kJ/d.kgFFM)
diet-induced thenrogenesis (% Ein)
fa t oxidation (10 .irg/hiin.kgïTM)
CH3 oxidation (10 .mg/lran.kglTM)
protein oxidation (10 .mg/min.kgrTTI)
low (n=6)
67.8 ± 2.2
12.0 + 1.6
59.8 + 2.6
107.9 ± 5.9
4.51 + 0.20
568 + 92
2690 ± 131
886 ± 74
Man
high (n=6)
73.0 ± 2.2
15.0 + 1.6
61.7 ± 1.9
110.7 ± 3.1
12.21 ± 0.46
608 ± 186
3080 ± 358
942 ± 80
low (n=7)
72.2 + 7.6
33.1 ± 4.0
46.6 + 2.2
125.3 ± 5.5
2.54 ± 0.55
762 ± 111
1433 ± 237
1000 ± 127
Women
high (n=8)
75.0 ± 9.4
33.3 ± 5.0
46.8 ± 2.0
142.6 ± 4.7*
12.06 + 0.76
877 + 81
1974 ± 222*
1105 ± 90
Values aie given as aeon + sen
kgFFM = kg fat-free BOSS; Ein = energy ca i tmt of t e s t real; Of) = carbohydrate (glycogen or glucose)
* significant difference between low and high groups at p < 0.05
DISCUSSION
In this study we assessed the nature and magnitude of inter-individual
differences in resting energy expenditure and in vivo fuel utilization rates.
It was found that sex, the degree of body fatness and type of body fat
distribution are important determinants of the amount of energy expended in
the postabsorptive resting state, ie, in RMR. Body fatness or body fat
distribution did not systematically affect DIT, in contrast to sex.
Inter-individual variation in RMR was similar among non-obese men, non-obese
women and obese women. Between-person variation in DIT was similar to the
intra-individual variation, with slight differences among men, non-obese women
and obese women.
The total amount of energy expended in RMR and DIT comprises in the average
individual 70-85 percent of total daily energy output (8). The major
determinants of resting metabolic rate are body weight and body composition
(10), and for diet-induced thermogenesis, energy intake and nutrient
composition (17,21).
Important questions to be answered in studies on problems of energy balance in
humans are, whether obese individuals would have relatively lower rates of
energy expenditure and, secondly, whether subjects susceptible to body weight
-151-

gain are also characterized by relatively low rates of energy expenditure.
Such a characteristic would be indicative of an increased efficiency of energy
utilization, sometimes referred to as an increased "metabolic" efficiency
(22). An increased metabolic efficiency has been reported in various animal
strains produced by selective genetic breeding (23-25). An increased
efficiency of energy utilization among the obese could explain the seemingly
anomalous finding of similar energy intakes among the obese and the lean
(26-28). However, evidence supporting the hypothesis of increased metabolic
efficiency among the obese is far from conclusive (8). This may be caused by a
variety of reasons. First of all, it is possible that among lean subjects
differences in the efficiency of energy utilization exist. Comparing obese
with lean control subjects may then not reveal any differences in the rate of
energy expenditure. Secondly, among the obese there may be variation in
metabolic efficiency, and only specific groups of obese subjects may be
characterized by an enhanced metabolic efficiency. Thirdly, the obese state
may be an adaptation to a pre-obese state characterized by a relatively low
rate of energy expenditure. Once obesity is established, the relatively low
rate of energy expenditure is not longer manifest. The validity of the latter
proposition can only be tested in prospective studies of lean individuals with
relatively low rates of energy expenditure. Cross-sectional studies among lean
and obese subjects, as the study here reported, may be used to assess the
nature and magnitude of inter-individual variations in rates of energy
expenditure. Such studies may answer the question whether there is variation
among the lean and the obese in metabolic efficiency. Such studies may also be
of great value for formulating hypotheses about longitudinal outcomes in
individuals with differences in metabolic efficiency in terms of body weight
gain.
This study shows that variation in indicators (RMR, DIT) of metabolic
efficiency is as large among non-obese as among the obese. This means that
relatively low rates of energy expenditure are not an exclusive characteristic
of obese individuals. This finding confirms recent reports (6,7,10,11). The
variation in RMR's per kg fat-free mass was 12 percent with 5 percent of the
population having RMR's below 100 kJ/d.kg fat-free mass and five percent of
the population with RMR's above 150 kJ/d.kg fat-free mass. These subjects may
tentatively be characterized, respectively, as hypo- and hypemetabolic with
respect to the RMR. It seems unlikely that differences in the composition of
the fat-free mass, intra-individual variation in RMR or measurement error of
the assessment of body composition could account for the differences in RMR
-152-

per kg fat-free mass between these subjects.
It was found that RMR per kg fat-free mass is significantly lower in men when
compared to women. To the best of our knowledge this finding has not been
reported before. This result could be caused by a higher proportion of
metabolically less 'active' tissues in the total amount of fat-free mass in
men when compared to women. RMR is determined for on average 65 percent (29)
by organ activity, whereas the metabolic activity of skeletal muscles
contributes on average 23 percent to RMR (29). A greater proportion of
skeletal muscles in the total fat-free mass in men compared to women may
explain the relatively lower RMR's among men. However, no accurate data are
available on the proportion of skeletal muscle in the total fat-free mass in
men and women to test this hypothesis. It would be interesting to relate RMR
to fat-free mass in men or women with a relative hypertrophy of skeletal
muscles, ie, in body builders. In addition, to differences in the composition
of the fat-free mass between the sexes, it is possible that, at similar
composition of the fat-free mass, men have lower rates of energy expenditure
than women do. The present study gives no data to test this hypothesis.
In accordance with other findings (5-7,10,11), this study also shows a
significant positive relation of the RMR to fat-free mass. On average 64
percent of the total variation in RMR was related to variation in the fat-free
mass. The prediction equation of RMR from fat-free mass is very similar to
equations published by other investigators (5-7,10,11). RMR's observed in this
study were on average 3 percent higher in comparison to RMR's, predicted
according to recently published equations of Owen et al. (6,7). Owen et al.
show that most prediction equations overestimate RMR by 7-14 percent. Our
study supports Owen et al.'s conclusions, although the overestimation of RMR
appears to be slightly lower in our study in comparison with Owen et al's.
study.
It was observed that in the obese women, in addition to fat-free mass, the
size of the fat mass was positively related to RMR. This is in accordance with
findings of Hofmans et al. (30). A positive association between the size of
the fat mass and the RMR at a given fat-free mass, indicates that, at
increased body fat masses, the proportion of metabolically 'active' tisues in
the total fat-free mass is relatively enlarged, or that the rate of energy
expenditure in tissues comprising the fat-free mass is relatively enhanced. It
is possible that in obese individuals with a given fat-free mass, increasing
amounts of total body fat cause a higher work load to various organs such as
-153-

the heart,lungs or kidneys, or that they cause a relative enlargement of these
organs.
We also compared individuals with relatively low RMR's with individuals with
relatively high RMR's. It was found, in men and women, that individuals with
reduced RMR's were characterized by a relatively enlarged size of the fat-free
mass. Again, this may indicate that in these individuals the proportion in the
total fat-free body mass of skeletal muscles and other relatively less
metabolically 'active' tissues, ie, bone or skin, is relatively increased. We
observed that higher RMR's were in particular related to higher rates of fat
oxidation per kg fat-free mass. The degree of fat oxidation is under hormonal
control (12). Catecholamines increase lipolysis and enhance fat oxidation.
Catecholamines may also increase thermogenesis through stimulatory effects on
ion pumping or substrate cycling (8). It is possible that the enhanced basal
fat oxidation rates in subjects with relatively low RMR's are a reflection of
a higher sympathetic activity in these individuals. In women, it was found
that the type of body fat distribution significantly affected the RMR. Obese
women with a non-abdominal type of body fat distribution were characterized by
reduced RMR's compared to abdominal obese women, lean men or lean women. We
have recently reported in detail on the impact of body fat distribution in
obese women on resting metabolic rate (14). In addition to this study, the
present study shows that RMR's in women with non-abdominal obesity were
reduced, not only in comparison with age-matched non-obese women, but also in
comparison with younger non-obese men and women. The present study does not
allow to infer on the mechanism behind this finding. Most likely the
differences in adjusted RMR's among the various groups are related to a
difference in the endocrinological state. Such a difference could, in its
turn, affect directly or indirectly the rate of thermogenic processes in
tissues. It is also possible that differences in the composition of the
fat-free mass cause the differences in adjusted RMR's. The finding of
relatively reduced RMR's among the obese in relation to type of body fat
distribution is unique. Relatively reduced rates of energy expenditure have
been reported for post-obese women (32). It has also been reported that in
wrestlers repeated cycles of weight loss and regain are associated with
changes in the RMR per kg fat-free mass (33). Wrestlers, who had experienced
repeated cycles qf weight gain and loss, had 14 percent lower RMR's per kg
fat-free mass in comparison to wrestlers with relatively minor weight
fluctuations. This suggests the possibility that periodic reductions in body
weight combined with subsequent weight relapse can reduce RMR's. In this study
-154-

no difference was observed between abdominal and non-abdominal obese women in
self-reported weight history. The majority of women reported to have had
several unsuccesful attempts to reduce body weight. We found (14) that
non-abdominal obesity is (pre)pubertal in onset, whereas abdominal obese
obesity is of the adult-onset type. This suggests that the finding of
relatively reduced RMR's in the non-abdominal obese may be of etiological
significance for the obesity.
The second component of resting energy expenditure that was investigated in
this study is DIT. Several investigators (34,35) have reported that in obese
individuals DIT would be blunted in comparison with the non-obese. These
findings have, however, not been corroborated by other investigators
(5,6,17,22). In the present study no significant difference in DIT was found
between non-obese women and obese women.
Variation in DIT for the total population was 36 percent, with five percent of
the population having, a DIT below 4 percent and five percent having a DIT
greater than 12 percent (energy content of test meal). These subjects may
tentatively be characterized as subjects with a hyper-efficiency or a
hypo-efficiency of postprandial energy utilization, respectively. It seems
unlikely that intra-individual variation in DIT can account for the
differences in DIT between these subjects.
A further analysis of DIT among the obese in relation to type of body fat
distribution revealed that body fat distribution was not associated with
differences in DIT. An unexpected finding was the significant difference in
DIT between the sexes. Men had a significant higher DIT than women did. This
indicates that men have a lower efficiency of postprandial energy utilization
compared to women. This finding may be explained by assuming differences in
energy intake between the sexes. It has been customary to standardize the
energy content of the test meals with respect to the size of the fat-free mass
(17,34) or with respect to resting metabolic rate (36). In this study a higher
DIT was observed among men compared to women, despite the fact, that men had
on average 10 percent lower energy intakes from test meals than women did,
either per kg fat-free mass or in percentage of resting metabolic rate. In men
the average energy costs of absorbing and processing of the ingested nutrients
were calculated at 126 kJ, which is 77 percent of the total thermic response.
This figure is in good agreement with data on the relative contribution of the
so called 'obligatory' component of the total DIT response (8,15). For women
we calculated that the costs of processing the ingested nutrients averaged 108
kJ, which is 99 percent of the total DIT response. This suggests that the
-155-

difference between the sexes in DIT is caused by the presence of an additional
thermic response in men to food, that is not directly related to the
postprandial processing of the nutrients. This component has been referred to
as the 'facultative' component of the DIT (8,15). The facultative component of
the DIT is thought to be mediated by the activity of the sympathetic nervous
system. Food ingestion would increase the activity of the sympathetic nervous
system causing an increased turnover of catecholamines. This increase in
catecholamines turnover would enhance the rate of energy expenditure of
various metabolic processes (8).
These processes may, in particular, be stimulated in skeletal muscles.
Recently, it was reported that in men about 50 percent of the increase in
thermogenesis induced by the sympathomimeticum ephedrine took place in
skeletal muscles (37).' Since in men the proportion of skeletal muscles in
total body weight is relatively higher than in women, this may offer some
explanation for the mechanism behind the observed difference in DIT between
the sexes. The difference in DIT between men and women suggests that in
comparisons of DIT in lean and obese, analyses should be performed, stratified
according to sex, or that groups should be matched in sex distribution.
We also compared individuals with relatively low DIT's with individuals with
relatively high DlT's. In men no significant differences in body composition
or variables of energy metabolism between both groups were found, suggesting
that other factors were involved that caused the difference in DIT beteen both
groups, for example, the degree of sympathetic nervous system activity. In
women the rate of postprandial glucose oxidation per kg fat-free mass was
significantly different between both groups, suggesting that part of the
difference in DIT was related to differences in the processing of ingested
carbohydrates.
The pattern of fuel utilization in the postabsorptive state and in the
postprandial state was similar in men and women. In the basal state, fat
oxidation contributed the greatest part to total energy dissipation. This is
in accordance with general text book knowledge (12). After meal ingestion,
there was a relative increase in glucose oxidation paralleled by a relative
decrease in fat oxidation. After meal ingestion, insulin secretion rises
rapidly causing a decrease in lipolysis and an increase in carbohydrate
oxidation. The postprandial rise in insulin secretion and in carbohydrate
oxidation generally lasts for a few hours. During this period the postprandial
substrate utilization pattern gradually becomes more similar to the
postabsorptive substrate utilization pattern. In accordance with recent
-156-

findings (38,39), the present study shews that postprandial net lipogenesis
from glucose, ingested in moderate amounts from a mixed meal, is of negligible
importance for the storing of ingested carbohydrates.
In conclusion, the present study shows that sex, body fat content and type of
body fat distribution are important determinants of RHR. Sex also affected
DIT. Inter-individual variation in RMR and DIT was comparable among the lean
and the obese. This suggests that among the lean and among the obese there may
be individuals with different efficiencies in the utilization of energy.
ACKNOWLEDGEMENTS
The authors would like to thank the subjects for their enthousiastic
participation in the study. We are also indebted to staff and students of the
Department of Human Nutrition for their help in conducting the study.
REFERENCES
1. Energy and protein requirements. Report of a joint FAO/WHO/UNU Expert consultation. Technical report series 724. World Health Organization: Geneva, 1985.
2. Harris JA, Benedict FG. A biométrie study of basal metabolism in man. Washington DC: The Carnegie Institute, 1919:1-266.
3. Boothby WM, Berkson J, Dunn HL. Studies of the energy of metabolism of normal individuals: a standard for basal metabolism, with a nomogram for clinical application. Am J Physiol 1936;116:468-84.
4. Robertson JD, Reid DD. Standards for the basal metabolism of normal people in Britain. Lancet 1952;1:940-3.
5. Cunningham JJ. A reanalysis of the factors influencing basal metabolic rate in normal adults. Am J Clin Nutr 1980;33:2372-4.
6. Owen OE, Holup JL, D'Alessio DA, Craig ES, Polansky M, Smalley KJ, Kavle EC, Bushmann MC, Owen LR, Mozzoli MA, Kendrick ZV, Boden GH. A reappraisal of the caloric requirements of men. Am J Clin Nutr 1987; 46:875-85.
7. Owen DE, Kavle E, Owen RS, Polansky M, Caprio S, Mozzoli MA, Kendrick ZV, Bushmann MC, Boden G. A reappraisal of calorie requirements in healthy women. Am J Clin Nutr 1986;44:1-9.
8. Sims EAH, Danforth E. Expenditure and storage of energy in men. J Clin Invest 1987;79:1019-25.
9. Sukhatme PV, Margen S. Antoregulatory homestatic nature of energy balance. Am J Clin Nutr 1982;35:355-65.
10. Bogardus C, Lillioja S, Ravussin E, Abbott W, Zawadzki JK, Young A, Knowler WC, Jacobowitz R, Moll PP. Familial dependence of the resting metabolic rate. N Engl J Med 1986;315:96-100.
11. Ravussin E, Lillioja S, Knowler WC, Christin L, Freymónd D, Abbott WGH, Boyce V, Howard BV, Bogardus C. Reduced rate of energy expenditure as a risk factor for body-weight gain. N Engl J Med 1988;318:467-72.
-157-

12. Ganong WF. Review of medical physiology. 9th ed. California: Lange medical publications, 1979.
13. Weststrate JA, Weys JPM, Poortvliet EJ, Deurenberg P, Hautvast JGAJ. Diurnal variation in postabsorptive resting metabolic rate and diet-induced thermogenesis. Am J Clin Nutr 1989; in press.
14. Weststrate JA, Dekker J, Stoel M, Begheyn L, Deurenberg P, Hautvast JGAJ. Resting energy expenditure in women: impact of obesity and body fat distribution. Metabolism 1989; in press.
15. Jéquier E, Acheson K, Schutz Y. Assessment of energy expenditure and fuel utilization in man. Ann Rev Nutr 1987;7:187-208.
16. Schutz, Terminology, factors and constants in studies on energy metabolism of humans. In: van Es AJH, ed. Human energy metabolism: physical activity and energy expenditure measurements in epidemiological research based upon direct and indirect calorimetry. Euronut report no 5. Wageningen: Stichting Nederlands Instituut voor de Voeding, 1985: 153-68.
17. D'Alessio DA, Kavle EC, Mozzoli MA, Smalley KJ, Polansky M, Kendrick ZV, Owen LR, Bushman MV, Boden G, Owen OE. Thermie effect of food in lean and obese men. J Clin Invest 1988;81:1781-9.
18. Flatt JP. Biochemistry of energy expenditure. In: Bray G, ed. Recent advances in obesity research: II. London: John Libbey, 1978:211-28.
19. Winer BJ. Statistical principles in experimental design. 2nd ed. New York: McGraw-Hill Book Company, 1971.
20. Peck EA, Montgomery DC. Introduction to linear regression analysis. New York: John Wiley & Sons, 1982.
21. Jéquier E. Thermogenesis induced by nutrient administration in men. Infusionstherapie 1984;11:184-8.
22. Felig P, Cunningham J, Levitt M, Hendler R, Nadel E. Energy expenditure in obesity in fasting and postprandial state. Am J Physiol 1983;244:E45-51.
23. Canolty NL, Koong LF. Utilization of energy for maintenance and for fat and lean gains by mice selected for rapid postweaning growth rate. J Nutr 1976;106:1202-8.
24. Ferrell CL, Jenkins TG. Energy utilization by mature, nonpregnant, nonlactating cows of different types. J Anim Sei 1984;58:234-43.
25. Koong LJ, Nienaber JA, Mersmann HJ. Effect of plane of nutrition on organ size and fasting meat production in genetically obese and lean pigs. J Nutr 1983;113:1626-31.
26. Stefanik PA, Heald FP jr, Mayer J. Caloric intake in relation to energy output of obese and non-obese adolescent boys. Am J Clin Nutr 1959;7:55-62.
27. Maxfield E, Konishi F. Patterns of food intake and physical activity in obesity. J Am Diet Assoc 1966;49:406-8.
28. Kromhout D. Energy and macronutrient intake in lean and obese middle-aged men (the Zutphen study). Am J Clin Nutr 1983;37:295-9.
29. Grande F. Energy expenditure of organs and tissues. In: Kinney JM, ed. Assessment of energy metabolism in health and disease. Columbus: Ross Laboratories, 1980:88-92.
30. Hoffmans M, Pfeiffer WA, Gundlach BL, Nijkrake HGM, Oude Ophuis AJM, Hautvast JGAJ. Resting metabolic rate in obese and normal weight women, int J Obes 1979;3:111-8.
31. Horwitz BA. Metabolic aspects of thermogenesis: neuronal and hormonal control. Fed Proc 1979;38:2147-9.
32. Geissler CA,' Miller DS, Shah M. The daily metabolic rate of the post-obese and lean. Am J Clin Nutr 1987;45:914-20.
33. Steen SN, Oppliger RA, Brownell KD. Metabolic effects of repeated weight loss and regain in adolescent wrestlers. JAMA 1988;260:47-50.
34. Schutz Y, Bessard T, Jéquier E. Diet-induced thermogenesis measured over a whole day in obese and non-obese women. Am J Clin Nutr 1984:542-52.
-158-

35. Swaminathan R, King RFGJ, Holmfield J, Siwek RA, Baker M, Wales JK. Thermic effect of feeding carbohydrate, fat, protein and mixed meal in lean and obese subjects. Am J Clin Nutr 1985;43:177-81.
36. Bessard T, Schutz Y, Jéquier E. Energy expenditure and postprandial thermogenesis in obese women before and after weight loss. Am J Clin Nutr 1983;63:680-93.
37. Astrup A, Biilow J, Madsen J, Christensen NJ. Contribution of BAT and skeletal muscle to thermogenesis induced by ephedrine in men. Am J Physiol 1985;248:E507-15.
38. Acheson KJ, Flatt JP, Jéquier E. Glycogen synthesis versus lipogenesis after a 500 gram carbohydrate meal in men. Metabolism 1982;31:1234-40.
39. Acheson KJ, Schutz Y, Ravussin E, Jéquier E, Flatt JP. Nutritional influences on lipogenesis and thermogenesis after a carbohydrate meal. Am J Physiol 1984;246:E62-70.
-159-

Chapter 8. Resting energy expenditure in women: impact of obesity and body fat distribution
JAN A WESTSTRATE MSC, JACQUELINE DEKKER BSC, MIRIAM STOEL BSC, LILIANE
BEGHEIJN BSC, PAUL DEURENBERG PHD, JOSEPH GAJ HAUTVAST MD
ABSTRACT
Resting metabolic rate (RMR) and diet-induced thermogenesis (DIT) were
repeatedly assessed with an indirect calorimetric ventilated hood system in a
group of 32 healthy premenopausal obese women, body fat percentage 46.4 + 0.9
(mean + sem), age 38.5 + 0.9 years. RMR and DIT were also measured in a group
of 10 healthy premenopausal non-obese women, body fat percentage 31.3 + 1.7,
age 37.7 + 2.4 years.
The obese women were subdivided according to the waist-to-hips girth ratio
(WHR) into three groups with a different type of body fat distribution. A
gluteal-femoral obese group (n=10), WHR < 0.79, an intermediate obese group
(n=10), 0,79 < WHR < 0.85, and an abdominal obese group (n=12), WHR >0.85. No
significant differences were observed among the obese groups in age, body
weight, body fat mass and fat-free body mass. Body fat distribution was not
associated with differences in DIT, pre- and postprandial respiratory
quotients and substrate oxidation rates. The abdominal obese women had
significantly higher RMR's adjusted for age, fat mass and fat-free body mass
(6075 + 200 kJ/d) in comparison to the gluteal-femoral obese women (5502 +
205 kJ/d), and in comparison to obese women with an intermediate body fat
distribution (5517 + 193 kJ/d), but not in comparison to a non-obese control
group, 6790 + 261 kJ/d. It is concluded that within the total group of obese
women, the non-abdominal obese can be characterized by relatively reduced
resting metabolic rates in comparison with either abdominal obese women or
with non-obese women.
-160-

Keywords: indirect calorimetry, resting metabolic rate, diet-induced
thermogenesis, obesity, women, body fat distribution.
INTRODUCTION
Obesity is the consequence of a prolonged imbalance between energy intake and
energy expenditure, caused by either persistent hyperphagia or a reduced rate
of energy expenditure. In spite of much research it has not been possible to
define for a given obese individual the relative etiological importance of
these factors (1-3). To determine the contribution of hyperphagia or a
reduced rate of energy expenditure to the etiology of obesity, prospective
studies are needed in which daily food intake and energy expenditure are
accurately measured for prolonged periods of time in persons leading their
normal lives. Such studies may answer the question whether individuals with
similar body weights, body composition and degrees of physical activity have
similar or different energy requirements, ie, rates of energy expenditure.
There are, however, very few prospective data on energy expenditure (4). The
majority of studies are of a cross-sectional nature (5-11), usually involving
a comparison of obese individuals with non-obese subjects on one or more
components of daily energy expenditure. Generally these studies show that the
obese have an enlarged body fat-free mass and, consequently, elevated resting
metabolic rates. Resting metabolic rate adjusted for fat-free body mass
would, however, be similar among the obese in comparison with the non-obese.
Controversy exists on the question whether the obese are characterized by a
defective diet-induced thermogenesis. Some investigators (5,6,8,11) report a
diminution in diet-induced thermogenesis in obese individuals in comparison
with lean controls, whereas other investigators could not confirm these
findings (7,9,10). The reason for the discrepancy in results is not clear. It
could be that the obese can be subdivided into subgroups with and without
reduced diet-induced thermogenesis or decreased resting metabolic rate. In
this respect subdividing obesity according to type of body fat distribution
may be important (12-14). It was shown that in obese individuals with a
relative predominance of fat in the gluteal-femoral region the obesity was of
earlier, ie, childhood, onset, whereas in individuals with a relatively
greater storage of fat in the abdominal region, the obesity was of
adult-onset (12-14). It might be hypothetized that childhood obesity, ie,
gluteal-femoral obesity, is more closely associated with decreased energy
-161-

expenditure than adult-onset obesity, which might be more environmentally
induced. This study was designed to test this hypothesis by assessing the
impact of body fat distribution on resting metabolic rate and diet-induced
thermogenesis. In addition, resting metabolic rate and diet-induced
thermogenesis were measured in age-matched non-obese subjects. Resting
metabolic rate and diet-induced thermogenesis were repeatedly assessed in
each obese individual to allow for day-to-day within-person variation in
diet-induced thermogenesis (13,15).
The results show a significant impact of body fat distribution on resting
metabolic rate, but not on diet-induced thermogenesis.
SUBJECTS AND METHODS
SUBJECTS
The obese subjects for this study were invited for participation in the study
by advertisements in regional newspapers. Thirty-two of the forty-five obese
women, who responded were selected for participation in the study on the
basis of their body fat percentage (>35 percent as assessed by densitometry),
age (between 20-45 years), premenopausal state, smoking behavior (smoking
less than 10 cigarettes/d), health status (no evidence of past or present
hypothyroidism, hyperthyroidism, diabetes mellitus) and drug use. Subjects
taking medicines known to affect energy metabolism were excluded from the
study. Health status was evaluated using a medical questionnaire by a
physician (JGAJH). Only those subjects were selected who had not experienced
greater weight changes than 2,5 kg in the half year preceding the start of
the study. By questionnaire information was obtained in the obese women on
nutritional habits, weight history, onset of obesity and family history of
obesity. The ten non-obese subjects were members of the University staff, who
met the same entry criteria as the obese subjects except for body fat
percentage, which had to be under 35 procent. Each individual was fully
informed on the nature and purpose of the study and all women gave their
written informed consent.
The protocol of the study was submitted to and accepted by the Medical
Ethical Committee of the Department of Human Nutrition, of the Wageningen
Agricultural University.
-162-

METHODS
Experimental design
Resting metabolic rate (RMR) was measured in the morning after an overnight
fast, on average three times in the obese individuals (in fifteen obese
subjects RMR was measured in duplicate, in seventeen obese subjects RMR four
times) and once in the non-obese subjects. It should be noted that the
control group was added to the study after the study on the obese subjects
was finished. Gas exchange measurements were performed in the obese during
spring and in the non-obese during summer. The methodology and procedures of
the gas exchange measurements were, however, similar for the obese and the
non-obese group. Between each measurement were at least two days, all obese
subjects completed the study in three weeks. No attempt was made to measure
RMR and DIT in a specific phase of the menstrual cycle. All gas exchange
measurements were, however, made at least 3 days after the onset of
menstruation. For twelve obese subjects a balanced number (n=2) of gas
exchange measurements was available for each period of the menstrual cycle
(pre- and post-ovulary). Ovulation was estimated to occur 14 days before the
onset of menstruation. No significant differences in RMR and DIT between the
two phases of the menstrual cycle were found. Therefore, all RMR and DIT
measurements were pooled for each individual and the mean values were used in
the analysis. The women were instructed to keep to their normal eating and
drinking pattern three to four days preceding the study and to abstain from
strenuous physical activity the day immediately before the tests. A dietary
history was obtained from each obese woman to assess habitual food
consumption. Subjects who ate less than 200 g/d of carbohydrates were
instructed to increase the consumption of carbohydrate-rich products, since a
relatively low carbohydrate consumption may decrease diet-induced
thermogenesis (16). In seventeen (4 gluteal-femoral, 5 intermediate, 8
abdominal) obese subjects diet-induced thermogenesis (DIT) was measured four
times for four hours after ingestion of a mixed liquid meal (meal A) on the
morning after a corresponding preprandial resting metabolic rate measurement.
In fifteen (6 gluteal-femoral, 5 intermediate, 4 abdominal) obese subjects
DIT was measured in duplicate for three hours after ingestion of a solid
mixed meal (meal B ) . In the non-obese subjects DIT was measured for three
hours after ingestion of a liquid mixed meal (meal C ) . The cumulative
postprandial increase of the premeal RMR was defined as diet-induced
-163-

thermogenesis. During the experiment fifteen testmeals of type A, 6 of type B
and 5 of type C were chemically analyzed for energy and nutrient content.
Meal A was composed of a yoghurt-based liquid meal containing on average 1810
kJ of metabolisable energy (11.3 percent protein, 34.1 percent fat, 54.6
percent carbohydrates). Meal B was composed of a normal Dutch breakfast
(bread, margarine, orange juice, cheese, apple syrup) containing on average
1315 kJ (12.4 percent protein, 33.2 percent fat, 54.4 percent carbohydrates).
Meal C contained on average 1310 kJ (12.2 percent protein, 30 percent fat,
57.8 percent carbohydrates). Besides differences in the metabolisable energy
content, meal A, B and C were almost identical in composition. Meal A, meal B
and meal C represented similar caloric loads for the postprandial period, ie,
about 450 kJ/h for meal A and about 440 kJ/h for meal B and meal C. The
results showed no difference in DIT, expressed as a percentage of the energy
content of the test meal between the test meals A and B, ie, 7.03+0.30
(mean + sem) percent for meal A and 6.69 + 0.57 percent for meal B. Therefore
in the analyses the DIT results of the obese subjects were pooled.
In the obese subjects receiving meal A, every morning before the start of the
gas exchange measurements an overnight-fasting venous blood sample of 10 ml
was taken for determing serumlipids and blood glucose levels. In the obese
subjects receiving meal B every first test morning of the DIT measurement an
overnight-fasting venous blood sample of 10 ml was taken. No bloodsamples
were taken in the non-obese subjects.
Gas exchange measurements
Resting metabolic rate
On the day of each RMR measurement the subject was taken to the laboratory by
car. After voiding they lay supine but awake and motionless on a hospital
bed. The subjects wore light indoor clothing. After a 30 minutes rest period
with the hood placed over the subjects head RMR was continuously measured
between 08.00 and 09.00 hours at an environmental temperature of 23-25°C.
During the RMR measurement subjects watched romantic family type motion
picture films on video.
Postprandial energy expenditure
After the RMR measurement the subjects were given the test meal. Meal A and
-164-

meal C were given through a straw over 3-5 minutes after which postprandial
energy expenditure was measured continuously for, respectively, 3 or 4 hours.
Meal B was eaten within 10-15 minutes after removement of the hood. Five or
three minutes after the meal had been eaten and the hood had been replaced
postprandial energy expenditure was measured continuously for three hours.
During the postprandial energy expenditure measurement the subjects were
awake, remained motionless and watched video tapes. After the gas exchange
measurements, urine was collected for determining total urinary nitrogen.
All gas exchange measurements were performed with a ventilated hood system. A
transparent perspex ventilated hood was placed over the head of the subject
and made airtight around the neck. A pump (Ocean SCL210, Dieren, The
Netherlands) drawed fresh outside air through the hood. The flow rate through
the hood was measured by a thermal mass flowmeter (Brooks,model 5812 N,
Veenendaal, The Netherlands). The flow rate was kept between 30 and 40 1/min
by an electrically operated control valve (Brooks, model 5837, Veenendaal,
The Netherlands). A small sample of 0.4 1/min of the air leaving the hood was
analyzed for oxygen (0,) and carbondioxide (CO~) content by, respectively, a
paramagnetic 0,-analyzer, adjusted to a full scale range of 20-21 percent
(Servomex 1100A, Zoetermeer, The Netherlands) and an infrared CCU-analyzer,
full scale range 0-1 percent (Analytical Development Company SS100,
Hoddesdon, UK). The analyzers were calibrated each morning using dried gas
mixtures with known 0 ? and CO, content. Cu and CO? concentrations in dried
fresh outside air were measured for five minutes every 30 minutes during the
RMR measurements and every hour during the postprandial energy expenditure
measurements. Air flow rate, O, and CO, concentration of the inflowing and
outflowing air were computed on line by an automatic data acquisition unit
(Hewlett Packard 3497A, Palo Alto, USA) interfaced to a microcomputer
(Hewlett Packard 86B or 85, Palo Alto, USA). The outputs of the gas analyzers
and the flowmeter were also continuously recorded by a multi-pen recorder
(Kipp&Zonen BD101, Delft, The Netherlands). 0, and CO, concentration of the
outflowing air and air flow rate through the hood were measured every 30
secondsO and integrated over five minutes interval periods to obtain 0~
consumption, CO? production,
respiratory quotients and metabolic rate according to equations described by
jéquier et al. (17).
-165-

Calculation of DIT and substrate oxidation rates
To obtain the mean energy expenditure for each hour after ingestion of the
meal, the CU consumption and C0? production were averaged over each hour
using the five minutes interval data. These values were used to calculate the
average DIT for the individual hours after the test meal and for the total
mean DIT over four or three hours. DIT was calculated by subtracting the RMR
value from the respective average hourly or total mean postprandial energy
expenditure (PEE), ie, DIT=PEE-RMR. The DIT is expressed in kJ, in a
percentage of the increase in the premeal RMR and in a percentage of the
energy content of the test meal.
Protein oxidation was calculated from total urinary nitrogen excretion.
Carbohydrate and fat oxidation during RMR and the postprandial energy
expenditure were calculated using the nonprotein respiratory quotients.
Oxygen and carbon dioxide equivalents for substrate oxidation before and
after the ingestion of the test meal were obtained from Lillioja et al. (18).
A nonprotein respiratory quotient exceeding 1.00 indicated net de novo
lipogenesis, ie, lipogenesis exceeding concomitant fat oxidation.
Carbohydrate oxidation was corrected for net de novo lipogenesis from glucose
as previously described (13).
Body composition and body fat distribution
Fat-free mass was estimated by densitometry. Total body density of each
subject was measured by the under water weighing method with simultaneous
measurement of residual lung volume by a helium dilution technique. Fat-free
body mass was calculated from total body density as previously described
(13).
Body fat distribution was assessed in the obese women using the waist-to-hips
girth ratio (19). Three categories of body fat distribution were defined, ie,
a gluteal-femoral type of body fat distribution when the WHR < 0.79, an
intermediate type of body fat distribution with the WHR between 0.79 and 0.85
and an abdominal type of body fat distribution with the WHR > 0.85.
Blood analysis
Blood variables were measured in postabsorptive venous blood samples. Blood
glucose was determined by the glucose 4-amino-antipyrene (GOD-PAP) method
-166-

with a kit supplied by Boehringer Mannheim QmBH (Almere, the Netherlands).
Total serum cholesterol was obtained by the cholesterol-oxidase
4-aminoantipyrene (CHOD-PAP) high performance method with a kit also supplied
by Boehringer Mannheim. Serum high density lipoprotein (HDL) cholesterol was
determined by a precipitation technique (20). Serum triglycerides were
assayed as described by Sullivan et al. (21).
Statistics
The groups of obese individuals subdivided according to type of body fat
distribution and the control group of the non-obese subjects were compared on
continuous variables using analysis of variance. Analysis of covariance was
used to compare among groups RMR and DIT adjusted for fat-free body mass, age
and fat mass. Two-sided Student's t-tests were used to evaluate differences
in several variables between obese subjects from the highest and lowest
quintile of the distribution of DIT (percentage of energy content of test
meal) and RMR (kJ/d.kg fat-free mass). All results are expressed as mean +
sem values.
RESULTS
Table 1 shows some characteristics of the obese women according to type of
body fat distribution and for the non-obese women. No significant
differences, except in the WHR, were observed among the obese subgroups. On
average the abdominal obese had higher body fat and fat-free body masses in
comparison to subjects from the other groups, but the differences were not
significant. The non-obese subjects had lower values for all variables,
except for age, in comparison with the obese.
Table 2 shows serum lipids and blood glucose levels in the obese women
according to type of body fat distribution. With increasing WHR total serum
cholesterol, serum triglycerides and blood glucose levels increased, whereas
the reverse was found for the level of serum HDL-cholesterol. The difference
in blood glucose levels among the groups was the most marked.
-167-

Table 1. Some characteristics of participating obese and non-obese women.
Cfoese
Body fat distribution
Gluteal-femoral Intermediate Ptxkmrnal
V«R < 0.79 0.79<VMR < 0.85 WR > 0.85
n=10 n=10 n=12
IMralue
F-ratio
Age
Body ueight
Body mass indexT
Fat-free mass
Fat-mass
Fat percentage
TOR
(yr)
(kg)
(kg/tn2)
(kg)
(kg)
(%)
35.3 ± 2.2
89.6 ± 4.6
32.2 ± 1.4
41.6 + 1.2
42.0 ± 3.7
46.2 ± 1.6
0.744 + 0.011
40.7 + 0.7
84.6 + 4.6
31.6 + 1.1
46.6 ± 1.9
38.0 ± 2.9
44.5 ± 1.3
0.821 ± 0.005
39.4 ± 1.4
97.7 ± 4.0
35.4 ± 1.4
50.2 ± 1.5
47.5 ± 3.1
48.1 + 1.4
0.902 + 0.012
37.7 ± 2.4
64.4 ± 2.5
21.9 ± 0.7
44.1 + 1.4
20.4 ± 1.6
31.3 ± 1.7
not assessed
0.19
< 0.0001
< 0.0001
0.05
< 0.0001
< 0.0001
< 0.0001
Values are given as m m + sea * waist-to-hips girth ratio
t tody weiojit (kg)/body height2(H)
Table 2. Serumlipids and blood glucose in obese women subdivided
according to body fat distribution.
body fat distribution
Gluteal-femoral
n = 9
Intermediate
n = 10
5.34 ± 0.23
1.16 ± 0.07
0.22 + 0.01
1.59 ± 0.18
4.82 + 0.12
Abdominal
n = 12
5.45 ± 0.23
1.07 + 0.06
0.20 ± 0.01
1.71 + 0.26
5.22 + 0.16
P-value
F ratio
0.47
0.13
0.03
0.03
0.009
Cholesterol (imol/1) 5.04 ± 0.24
HDL-cholesterol (rnnol/l) 1.31 + 0.11
HCD-c/total-c 0.26 + 0.02
Triglycerides (mrol/l) 0.91 + 0.08
Blood glucose (mrol/l) 4.46 + 0.19
Values are given as Bean + SCB * HXi-cholesteroL-total ctalesterol ratio
No differences in self-reported weight history or family history of obesity
were found among the various groups of the obese. However, 80 percent of the
gluteal-femoral obese reported an onset of obesity before the age of 20 years
in comparison with 50 percent of the subjects with an intermediate type of
body fat distribution and 25 percent of the abdominal obese women.
Table 3 shows resting metabolic rate (RMR) diet-induced thermogenesis (DIT)
and respiratory quotients (RQ) for the different obese groups and the
non-obese group. RMR and postprandial energy expenditure (PEE) (data not
shown) differed significantly among the groups, the abdominal obese and the
-168-
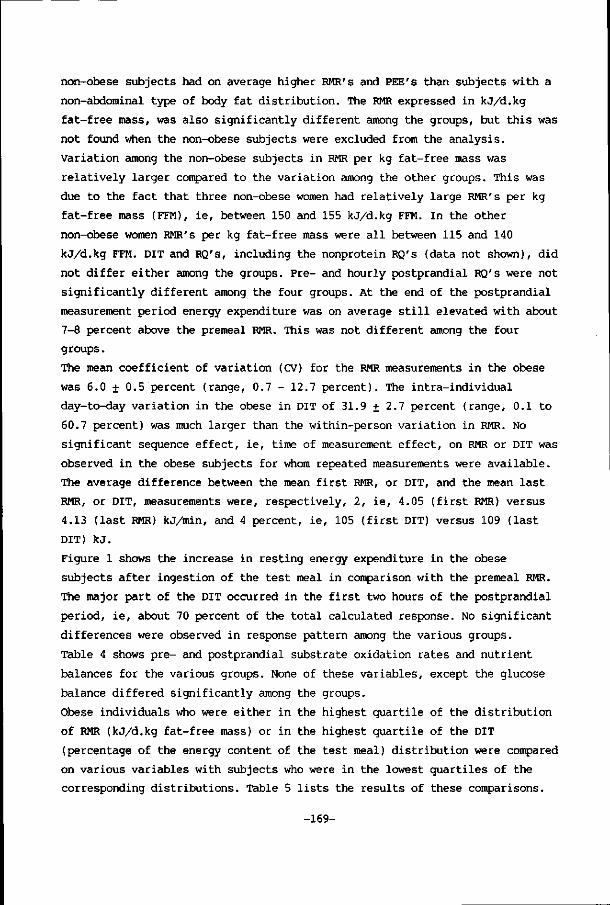
non-obese subjects had on average higher RMR's and PEE's than subjects with a
non-abdominal type of body fat distribution. The RMR expressed in kj/d.kg
fat-free mass, was also significantly different among the groups, but this was
not found when the non-obese subjects were excluded from the analysis.
Variation among the non-obese subjects in RMR per kg fat-free mass was
relatively larger compared to the variation among the other groups. This was
due to the fact that three non-obese women had relatively large RMR's per kg
fat-free mass (FFM), ie, between 150 and 155 kj/d.kg FFM. In the other
non-obese women RMR's per kg fat-free mass were all between 115 and 140
kj/d.kg FFM. DIT and RQ's, including the nonprotein RQ's (data not shown), did
not differ either among the groups. Pre- and hourly postprandial RQ's were not
significantly different among the four groups. At the end of the postprandial
measurement period energy expenditure was on average still elevated with about
7-8 percent above the premeal RMR. This was not different among the four
groups.
The mean coefficient of variation (CV) for the RMR measurements in the obese
was 6.0 + 0.5 percent (range, 0.7 - 12.7 percent). The intra-individual
day-to-day variation in the obese in DIT of 31.9 + 2.7 percent (range, 0.1 to
60.7 percent) was much larger than the within-person variation in RMR. No
significant sequence effect, ie, time of measurement effect, on RMR or DIT was
observed in the obese subjects for whom repeated measurements were available.
The average difference between the mean first RMR, or DIT, and the mean last
RMR, or DIT, measurements were, respectively, 2, ie, 4.05 (first RMR) versus
4.13 (last RMR) kJ/min, and 4 percent, ie, 105 (first DIT) versus 109 (last
DIT) kJ.
Figure 1 shows the increase in resting energy expenditure in the obese
subjects after ingestion of the test meal in comparison with the premeal RMR.
The major part of the DIT occurred in the first two hours of the postprandial
period, ie, about 70 percent of the total calculated response. No significant
differences were observed in response pattern among the various groups.
Table 4 shows pre- and postprandial substrate oxidation rates and nutrient
balances for the various groups. None of these variables, except the glucose
balance differed significantly among the groups.
Obese individuals who were either in the highest quartile of the distribution
of RMR (kJ/d.kg fat-free mass) or in the highest quartile of the DIT
(percentage of the energy content of the test meal) distribution were compared
on various variables with subjects who were in the lowest quartiles of the
corresponding distributions. Table 5 lists the results of these comparisons.
-169-

Individuals with a relatively high RMR were characterized by a more abdominal
type of body fat distribution (p=0.05).
Table 3. Resting metabolic rate, diet-induced thermogenesis and pre-and postprandial respiratory quotients in obese and non-obese women.
EM! {kJ/hiin)
KMR (kJ/d.kgfFM)
RQ - preprandia l
EQ - po s tprand ia l
Drr
DIT ( « « - i n t a k e )
DIT (%KMR)
<kJ)
(%)
Obese
Body fat distribution
Glu t ea l - f enora l
n=10
3 .95 + 0 .14
119.5 ± 3.7
0.83 + 0.01
0.86 ± 0.01
109 ± 15
7.0 + 0.
13.2 ± 1.3
Intermediate
n=10
3.78 + 0.13
117.8 ± 3.7
0.82 + 0.01
0.87 + 0.01
108 ± 6
7.2 ± 0.5
13.9 ± 0.9
Abdominal
n=12
4.46 ± 0.19
128.4 + 3.8
0.82 + 0.01
0.88 ± 0.01
110 + 11
6.6 ± 0.6
11.3 ± 1.0
Iton-obese
n=10
4.35 ± 0.14
140.2 + 5.5
0.84 ± 0.01
0.87 + 0.02
112 + 27
8.3 + 2.0
12.1 + 2.6
IMralue
F ratio
0.01
0.0005
0.62
0.86
0.99
0.70
0.62
Values are given as aBan ± sea
BMt = resting <preprandial) netabolic rate; BQ = respiratory quotient;
DTT = diet-inauoBd thercganesis; IB-intaku i laboltsahlje energy intake;
kgFFM = kg fat-^ree aass
diet-induced thermogenesis ( kJ/min)
0.80T
0.60
0A0-
0.20
| | glu teal-femoral
l l l 'J intermediate
H I abdominal
time after meal ingestion (h)
Figure 1. Diet-induced thermogenesis (mean + sem) in obese women subdivided according to body fat distribution.
-170-

Table 4. Pre- and postprandial substrate oxidation rates and postprandial nutrient balances in obese and non-obese women.
- Preprandial oxidation:
Protein (ïiq/ïnin.kgFFM )
Fat (mj/inin.kgFFM)
Glucose (jrei/hiin.kgFFM)
- Postprandial, oxidation:
Fat (nq/hiin.kgFFM)
Glucose (nq/ïiün.kgFFM)
- Nutrient balance ' :
Protein (g)
Fat (g)
Glucose (g)
Obese
Body fat d istr ibution
Gluteal-femoral
n = 9
1.17 ± 0.09
0.74 + 0.10
1.76 ± 0.19
0.49 ± 0.09
3.26 ± 0.20
- 1.0 + 0.8
8.1 ± 0.7
22.4 ± 2.5
Intenrediate
n = 10
1.19 ± 0.03
0.84 ± 0.08
1.46 + 0.15
0.60 + 0.07
2.95 ± 0.21
- 1.2 ± 0.6
7.3 + 1.0
25.1 ± 2.2
abdominal
n = 11
1.26 ± 0.06
0.97 + 0.09
1.57 ± 0.15
0.58 + 0.09
3.33 + 0.26
- 2.9 + 0.9
8.0 + 1.2
23.8 ± 2.4
Non-obese
n =
1.18
0.97
2.09
0.80
3.46
- 0.6
5.4
13.9
10
± 0.13
+ 0.17
± 0.26
± 0.16
± 0.40
+ 1.3
± 1.3
± 3-5
P value
F ra t io
0.85
0.44
0.11
0.24
0.61
0.27
0.31
0.03
Values are g ù m as aeon ± sea
T inbakB (g) - cuwtative oxidation (g)
In addition, RMR's and DIT's adjusted for fat-free body mass, age and fatmass,
were compared among groups differing in body fat distribution. The RMR,
extrapolated to 24-hour and adjusted for these covariates was significantly
higher in the abdominal obese when compared to the gluteal-femoral obese,
respectively 6075 + 200 versus 5502 + 205 kj/d (p=0.04). Also in comparison
with subjects with an intermediate type of body fat distribution, the
abdominal obese had higher adjusted RMR's, ie, 6075 + 200 versus 5517 + 193
kJ/d (p=0.05). The adjusted RMR in the non-obese group was 6790 + 261 kJ/d,
which was significantly (p<0.01) higher than the adjusted RMR's in the obese
with either a gluteal-femoral or intermediate type of body fat distribution.
No significant difference in adjusted RMR was found between the non-obese and
the abdominal obese. Excluding the three control subjects with relatively high
RMR's per kg fat-free mass from the analysis did not produce a significant
change in results. After the exclusion of these subjects from the analysis,
adjusted RMR's were respectively, 5399 + 201 kJ/d in the gluteal-femoral
obese, 5455 + 190 kJ/d in the obese with an intermediate type of body fat
distribution, 5995 + 180 kJ/d in the abdominal obese and 6329 ± 311 kJ/d in
-171-

the control women (n=7). The differences between, on the one hand, the
abdominal obese and non-obese women, and, on the other hand, the other two
obese groups, remained significant at the p < 0.05 level. No differences were
found among the groups in DIT, adjusted for these covariates.
Table 5. Resting metabolic rate, diet-induced thermogenesis and various other variables in obese women categorized in the highest and lowest quartiles of the distribution of parameters indicative of efficiency of energy metabolism.
EMR (kJ/d/kgFfM)
DTT (% ME intake) (%)
Fat-free mass (kg)
Fat mass (kg)
*HR 5
- Preprandial oxidation:
Fat (mg/min.kgFFM)
- Pastprandial oxidation:
Glucose (ng/lnin.kgFFM)
FM! -
Lowest
n=8
106.6
6.57
50.0
41.3
0.81
0.63
2.81
1.4
0.S9
1.5
2.9
0.01
0.09
0.20
kgFFM
Highest
n=9
138.4
1 .58
47 .0
43 .5
0 .86
1.04
3 .79
2 . 1 *
0.57
2.1
4.4
0 . 0 $
0.0?f
0.1?t
DET-% ME-mr&KE t
bauest
113.2
4.50
51.5
44.1
0.84
0.76
2.62
n=8
2.8
0.38
1.5
3.1
O.03
0.11
0.30
II
II
Highest
n=8
125.2
9.49
47.6
46.5
0.81
0.87
3.34
5.5
0.34 t
1.7
4.6
0.03
0.14
0.24
Values are given as n a n + sea * resting Metabolic rate expressed per kg fat-free Mess
I diet—juli ml themogenesis expressed dn percentage of «atjihni î ««Ma energy content of test •eal
î significant (p<0.05) difference aacng groups
S wrist-to-hips girth ratio
II fat and glucose oxidation rates assessed in 7 subjects free the lowest guartiXe.
DISCUSSION
Obesity is a complex disorder, whose etiology is incompletely understood in
the absence of clear hormonal or genetic disorders. It is difficult to
characterize the obese as individuals with reduced energy requirements or
energy expenditure. Some investigators report a defective diet-induced
thermogenesis in obese individuals, whereas others could not observe a reduced
diet-induced thermogenesis in obese individuals in comparison with lean
controls (5-11). The controversy on defective thermogenesis in the obese might
be due to variation among the obese in energy expenditure. The study here
reported has investigated this issue. It is unique in two respects. In the
first place, it studies the impact of body fat distribution on variation in
energy expenditure in a relatively large group of obese women, and, secondly,
-172-

in each obese individual, energy expenditure was repeatedly assessed to obtain
a more precise estimate of the individuals 'true' DIT and RMR. In addition,
energy expenditure was measured in age-matched non-obese women.
The results show no clear differences among the obese and non-obese women in
diet-induced thermogenesis. Resting metabolic rate, adjusted for fat-free body
mass, age and fatmass was, however, significantly lower in obese women with a
gluteal-femoral or intermediate type of body fat distribution in comparison
with obese women with an abdominal type of body fat distribution and the
non-obese women. The results of this study support the hypothesis that body
fat distribution affects energy expenditure in obesity.
Currently, only one study has investigated the relation between body fat
distribution and energy expenditure in obesity (13). The study of Den Besten
et al. (13) showed in a limited number of subjects that body fat distribution
did not significantly influence diet-induced thermogenesis and postabsorptive
resting metabolic rate. However, a trend was observed toward higher RMR's
(kJ/d.kg fat-free mass) in the abdominal obese in comparison with the
non-abdominal obese. The present study uses a considerable larger group of
subjects and more measurements of energy expenditure in each subject than did
the study of Den Besten et al (13). In addition, values for RMR and DIT were
obtained in a non-obese control group.
The average within-person day-to-day variation in RMR in the obese was
relatively small in comparison to the variation in DIT. The within-person
variation in RMR observed in this study was comparable to values found by
investigators who studied RMR in respiration chambers in individuals on
controlled diets (14). Suprisingly few studies report on reproducibility of
DIT measurements (13,15). Both studies report high within-person day-to-day
variation in DIT, ie, of about 30-60 percent. A high within-person variation
in DIT means that studies comparing relatively small groups of randomly
selected obese individuals with randomly selected lean controls might have had
insufficient statistical power to detect meaningful physiological differences
in DIT between obese and lean subjects.
Pre-, and total postprandial energy expenditure were on average significantly
lower in the non-abdominal obese in comparison with the abdominal obese or the
non-obese subjects. Also when the RMR (kJ/d.kg fat-free mass) was compared
among the groups it was found that the abdominal obese and the non-obese had
still higher pre- and postprandial rates of energy expenditure.
Respiratory quotients showed a characteristic pattern. Fasting RQ's were
between 0.80 and 0.85, which is in good agreement with findings from other
-173-

studies (5,6,13). In the fasting state about 40 percent of the energy
dissipated was derived from fat oxidation, and about 25 percent from protein
oxidation. In the postprandial state about 60 percent of the energy expended
was derived from glucose oxidation. This is in agreement with findings of
Flatt et al. (22) who showed that carbohydrate intake elicits a prompt
increase in the rate of glucose oxidation.
Nutrient balances were on average also similar among the different obese
groups, indicating no differences among the groups in oxidative and
non-oxidative storage of ingested carbohydrates and fat.
A comparison of obese subjects characterized by clear differences in DIT and
RMR's revealed that it was difficult to characterize subjects with a
relatively high DIT from subjects with a relatively low DIT. Age, body
composition and body fat distribution did not differ significantly among these
subjects. Obese individuals with a higher DIT had on average slightly, but not
significantly, greater postprandial glucose oxidation rates than obese
subjects with a lower DIT. Increased cellular oxidation of glucose might be
associated with increased transport of glucose into the cells for nonoxidative
storage, ie, formation of glycogen or fat. These latter two processes require
more energy than oxidation of glucose and could, thereby, contribute to an
increased DIT (23). In addition, it has been reported that DIT is only partly
determined by the metabolism of the ingested macronutrients. Activation of the
sympathetic nervous system by ingestion of nutrients might also be important
in determining the level of a subject's DIT (2). No information was obtained
in the present study on activation of the sympathetic nervous system by food
ingestion.
Obese individuals with relatively high RMR's were characterized, in
particular, by relatively high preprandial fat oxidation rates, high
postprandial glucose oxidation rates and a more abdominal type of body fat
distribution. When RMR's adjusted for age, fat mass and fat-free mass (4) were
compared among the different groups of body fat distribution, it was found
that with an increasing waist-to-hips girth ratio these adjusted RMR's also
increased. Thus, RMR's adjusted for age, fat mass and fat-free mass were on
average 11 percent (about 0.6 MJ/d) lower in the gluteal-femoral obese and the
obese with an intermediate type of body fat distribution when compared to the
abdominal obese. The DIT adjusted for these covariates did not differ
significantly among the three groups of obese individuals. No differences in
adjusted DIT's were found between the obese and the non-obese subjects,
whereas adjusted RMR's were highest in the non-obese subjects. The relatively
-174-

high adjusted RMR's among the non-obese can be partly attributed to the fact
that three of the non-obese had relatively high RMR's per kg fat-free mass. It
is possible that RMR in these women was elevated, for example, due to anxiety
caused by the RMR measurement or due to some undetected minor spontaneous
movements during the RMR measurement. However, excluding these women from the
analysis, did not produce a significantly different result.
The reasons for the difference in RMR adjusted for age, fat mass and fat-free
mass among the various groups are not directly clear. Fasting energy
expenditure at rest is determined largely by the metabolic activity of the
organs and to a smaller extent by the metabolic activity of skeletal muscles
(22). It could be that the proportion of organs in the total fat-free mass is
higher in the non-obese in comparison with the obese, and that among the obese
this proportion is higher in the abdominal obese than in the obese with a
non-abdominal type of body fat distribution. It is also possible that the
metabolic activity of the organs differs among the various groups, for
example, by differences in rates of ion pumping, protein turnover or various
substrate cycles, which could be related to differences in hormonal status or
activity of the sympathetic nervous system. However, information on the
metabolic activity of these processes in relation to body fat percentage and
body fat distribution is lacking or scarce.
It is well known from in vitro studies (25) that the metabolic activity of
abdominal fat is higher than the activity of gluteal-femoral fat, but whether
this difference is associated in vivo with higher rates of energy expenditure
in abdominal fat than in gluteal-femoral fat is unknown. Even when the
activity of the triglyceride-free fatty acid substrate cycle is relatively
elevated in abdominal fat, it seems unlikely that this could explain the total
difference of more than 10 percent in adjusted RMR's among the obese
subgroups. It has also been found that skeletal muscles in abdominal obese
contain relatively more glycolytic fast twitch fibers (26). This might, even
in resting conditions, lead to an increased output of lactate from skeletal
muscles in the abdominal obese than in the non-abdominal obese. Lactate may
then be converted by the liver into glucose at the expense of 4 moles of ATP
for 1 mole of glucose recirculated in this way (23). This recycling of lactate
could also elevate resting metabolic rate. Finally, it has been reported that
the abdominal obese have higher levels of plasma free testosterone in
comparison with non-abdominal obese (27). This difference in hormonal profile
may cause the difference in RMR's adjusted for age, fat-free mass and fat-mass
among the various subgroups of the obese.
-175-

This study joins others (25,26) in demonstrating a relationship between body
fat distribution and serum lipids and blood glucose. With increasing
waist-to-hips girth ratio serum triglycerides, serum cholesterol and blood
glucose levels increased, whereas HDL-cholesterol levels decreased. Fasting
blood glucose levels indicated no major perturbations in glucose tolerance or
insulin resistance in the different obese groups. However, to evaluate insulin
resistance and glucose tolerance it would have been better to measure insulin
and glucose levels in response to the test meals.
In conclusion, the present study shows that DIT may show considerable
intra-individual day-to-day variation suggesting that in studies of small
groups of obese individuals it may be necessary to assess DIT repeatedly in
each individual. Body fat distribution did not have an impact on DIT. However,
RMR's adjusted for age, fat-free body mass and fat mass were significantly
higher in the abdominal obese in comparison with the non-abdominal obese. This
study also showed that adjusted RMR's in the abdominal obese were not
abnormally high in comparison with the adjusted RMR's in a non-obese control
group. Our findings suggest that the non-abdominal obese are the obese with
reduced resting metabolic rates and, as a corollary, energy requirements.
These individuals, in particular the gluteal-femoral obese, also reported a
significant earlier onset of obesity than the abdominal obese. It is not clear
from this study whether the reduced resting metabolic rates in the
non-abdominal obese women are related to their earlier onset of obesity in
comparison with the abdominal obese.
ACKNOWLEDGEMENTS
The authors would like to thank Mr Marcel van Leuteren for preparing the
manuscript and the subjects for their kind and enthousiastic participation in
the study.
REFERENCES
1. James WPT. Energy requirements and obesity. Lancet 1983:386-9. 2. Danforth E. Diet and obesity. Am J Clin Nutr 1985;41:1132-45. 3. Garrow JS. Treat obesity seriously: a clinical manual. London: Churchill
Livingstone, 1981. 4. Ravussin E, Lillioja S, Knowler W, Christin L, Freymond D, Abbott D,
Boyce V, Howard, BV, Bogardus C. Reduced rate of energy expenditure as a
-176-

risk factor for body-weight gain. N Engl J Med 1988;318:467-72.
5. Ravussin E, Burnand B, Schutz Y, Jéquier E. Twenty-four-hour energy expenditure and resting metabolic rate in obese, moderately obese, and control subjects. Am J Clin Nutr 1982;35:566-73.
6. Bessard T, Schutz Y, Jéquier E. Energy expenditure and postprandial thermogenesis in obese women before and after weight loss. Am J Clin Nutr 1983;38:680-93.
7. Welle SL, Campbell RG. Normal thermic effect of glucose in obese women. Am J Clin Nutr 1983;37:87-92.
8. Pittet P, Chappuis P, Acheson K, de Techtermann F, Jéquier E. Thermic effect of glucose in obese subjects studied by direct and indirect calorimetry. Br J Nutr 1976;35:281-92.
9. Felig P, Cunningham J, Levitt M, Hendler R, Nadel E. Energy expenditure in obesity in fasting and postprandial state. Am J Physiol 1983;244:E45-51.
10. Nair KS, Halliday D, Garrow JS. Thermic response to isoenergetic protein, carbohydrate or fat meals in lean and obese subjects. Clin Sei 1983;65:307-12.
11. Schutz Y, Bessard T, Jéquier E. Diet-induced thermogenesis measured over a whole day in obese and non-obese women. Am J Clin Nutr 1984;40:542-52.
12. Vansant G, Den Besten C, Weststrate J, Deurenberg P. Body fat distribution and the prognosis for weight reduction: preliminary results. Int J Obesity; 1988;12:133-40.
13. Den Besten C, Vansant G, Weststrate JA, Deurenberg P. Resting metabolic rate and diet-induced thermogenesis in abdominal and gluteal-femoral obese women before and after weight reduction. Am J Clin Nutr 1988;47:840-7.
14. Seidell JC, Bakx JC, de Boer E, Deurenberg P, Hautvast JGAJ. Fat distribution of overweight persons in relation to morbidity and subjective health. Int J Obesity 1985;9:363-74.
15. Ravussin E, Lillioja S, Anderson TE, Christin L, Bogardus C. Determinants of 24-hour energy expenditure in man. J Clin Invest 1986;78:1568-78.
16. Acheson K, Schutz Y, Bessard T, Ravussin E, Jéquier E, Flatt JP. Nutritional influences on lipogenesis and thermogenesis after a carbohydrate meal. Am J Physiol 1984;:246:E62-E70.
17. Jéquier E, Acheson K, Schutz Y. Assessment of energy expenditure and fuel utilization in man. Ann Rev Nutr 1987;7:187-208.
18. Lillioja S, Bogardus C, Mott DM, Kennedy AL, Knowler WC, Howard BV. Relationship between insulin-mediated glucose disposal and lipid metabolism. J Clin Invest 1985;75:1106-15.
19. Hartz AJ, Rupley DC, Rimm AA. The association of girth measurements with disease in 21065 women. Am J Epidemiol 1984;119:71-80.-
20. Warnick GR, Benderson J, Albers JJ. Dextran sulfate-Mg precipitation procedure for quantitation of high-density-lipoprotein cholesterol. Clin Chem 1982;28:1379-88.
21. Sullivan DR, Kruijswijk Z, West CE, Kohlmeier M, Katan MB. Determination of serum triglycerides by an accurate enzymatic method not affected by free glycerol. Clin Chem 1985;31:1227-8.
22. Flatt JP, Ravussin E. Acheson KJ, Jéquier E. Effects of dietary fat on postprandial substrate oxidation and on carbohydrate and fat balances. J Clin Invest 1985;76:1019-24.
23. Flatt JP. Biochemistry of energy expenditure. In: Bray G, ed. Recent advances in obesity research: II London: John Libbey, 1978:211-8.
24. Grande F. Energy expenditure of organs and tissues. In: Kinney JM, ed. Assessment of energy metabolism in health and disease. Columbus: Ross Laboratories, 1980:88-92.
-177-

25. Björntorp P. Adipose tissue distribution and morbidity. In: Berry EM Blondheim SH, Eliahou HE, Shafrir E, eds. Recent advances in obesity research: V. London: John Libbey, 1986:60-5.
26. Krotkiewski M, Björntorp P. Muscle tissue in obesity with different distribution of adipose tissue. Effects of physical training. Int J Obesity 1986;10:331-41.
27. Kissebah AH, Peiris A, Evans DJ. Mechanisms associating body fat distribution with the abnormal metabolic profile in obesity. In: Berry EM, Blondheim SH, Eliahou HE, Shafrir E, eds. Recent advances in obesity research: V. London: John Libbey, 1986:54-9.
-178-

Chapter 9. Alcohol and its acute effects on resting metabolic rate and diet-induced thermogenesis
JAN A WESTSTRATE MSC, INGRID WUNNINK BSC, PAUL DEURENBERG PHD, JOSEPH
GAJ HAUTVAST MD
ABSTRACT
In two studies the impact of alcohol (ethanol) on resting energy
expenditure was determined. In a first study the thermic effect of
ethanol on resting metabolic rate (RMR) was assessed in ten non-obese
men, age 26.5 + 1.7 (mean + sem) years. Energy expenditure was measured
with a ventilated hood system. After an initial RMR measurement,
subjects received in random order 20 g of ethanol in three
concentrations, respectively, of 7.5, 18 and 30 ml/100 ml water. The
thermic effect of ethanol was then continuously measured for 90 minutes.
Ethanol had a significant thermic effect, which varied, depending on its
concentration, between 0.22 kJ/min (7.5%) to 0.30 kJ/min (30%). However,
no significant differences in thermic effect among the three
concentration were observed. In a second study the impact of ethanol on
diet-induced thermogenesis (DIT) was assessed in twelve non-obese men,
age 27.3 + 1.5 years. After an initial RMR measurement, subjects
received in random order, in duplicate, either a meal of food (2.00 MJ,
13 percent protein, 30 percent fat, 57 percent carbohydrates) plus an
alcoholic aperitif (20 g in 18 ml/100 ml) or an iso-energetic meal of
food alone (2.55 MJ, 13 percent protein, 30 percent fat, 57 percent
carbohydrates) plus a placebo aperitif, similar in taste and appearance
to the alcohol aperitif. DIT was then continuously measured for a period
of 4 hours. No significant differences in DIT between the treatments
were observed. After the. meal plus alcohol, substrate oxidation rates of
glucose and fat were significantly reduced in comparison with the meal
-179-

alone. At the postprandial period during which ethanol oxidation was at
its maximum, there was a slight potentiation of DIT by ethanol.
Keywords: indirect calorimetry, alcohol, ethanol, thermic effect,
resting metabolic rate, diet-induced thermogenesis, substrate oxidation,
human
INTRODUCTION
In most Western countries total per capita alcohol consumption has
increased dramatically over the last few decades (1,2). A recent
nation-wide food consumption study in the Netherlands showed that
alcohol contributes on average 3 percent to total daily energy intake in
women and 5.4 percent in men aged 22-49 years (3). Similar figures have
been reported for men and women in other Western countries (4,5).
The health effects of excessive alcohol intake are well documented
(6-8), but the metabolic consequences and relation to the incidence of
disease of moderate alcohol use remain to be definitely assessed. In
this respect there is a general interest in the utilization of alcohol
as an energy source. The issues that receive most attention are whether
alcohol calories are added to or substituted for non-alcoholic calories
in the diet and whether energy intake from alcohol is related to
increased levels of adiposity in the same way as energy intake from
non-alcoholic sources.
The majority of observational studies show a striking phenomenon.
Alcohol usually provides additional energy to the diet, but its use is
not associated with higher levels of adiposity (9-13). In concordance
with these findings are the results of various experimental studies
(14-16). In these studies it was found that iso-energetic substitution
of non-alcoholic calories by alcohol resulted in weight loss in
volunteers and that alcohol added to the diet did not result in weight
gain. These findings suggest that alcohol is used less efficient as an
energy source than, for example, fats and carbohydrates, or that alcohol
interferes with the efficient utilization of these substrates.
However, results from metabolic studies assessing the impact of alcohol
ingestion on energy expenditure give equivocal support for the latter
proposition. In the classical report of Atwater and Benedict it was
-180-

shown that alcohol use did not increase energy expenditure in man
relative to fats or carbohydrates (17). More recent studies did observe
either an increase in, or no effect on oxygen consumption after alcohol
use (18-21). The reasons for these discrepant findings are unclear, but
in general the experimental design, ie, number and sex of subjects
studied, duration of study, amount of alcohol given and way in which
alcohol was provided and the technique used to measure energy
expenditure differ considerably among the various studies. Thus, in
spite of its importance as an energy source in the average adult
individual, little is known with certainty on the impact of alcohol on
overall energy metabolism. In particular, there is little data on the
effect of alcohol on diet-induced thermogenesis (19,21).
In this report we used the ventilated hood technique to assess the
thermic effect of ethanol in varying concentrations. In addition, we
investigated the impact of ethanol on diet-induced thermogenesis. The
results show a significant thermic effect of ethanol on fasting energy
expenditure, but no systematic potentiation of diet-induced
thermogenesis by ethanol.
SUBJECTS AND METHODS
The present study consisted of two parts. In the first study the impact
of ingestion of ethanol on postabsorptive resting metabolic rate (RMR)
was studied. In a second study we assessed the effect of ethanol on
diet-induced thermogenesis (DIT).
SUBJECTS
Eighteen male subjects were invited for participation in the studies by
an advertisement in the weekly periodical of the University and through
friends and relatives. Four subjects participated in both experiments.
Subjects were all, except one, students or members of staff of the
University. After applying for participation subjects received a letter
in which the purpose and nature of the experiment(s) were explained.
They also received two questionnaires, one for assessing past and
present health status and one for obtaining information on habitual
eating, drinking, smoking and exercise habits. The medical questionnaire
-181-

was evaluated by a physician (JGAJH). After the subjects gave their
written consent to participate and when they fulfilled the entry
criteria, subjects could participate in the experiments. Subjects had to
be apparently healthy (no past or present evidence of hypo- or
hyperthyroidism or diabetes mellitus), non-obese (body fat percentage
below 25 percent) and had to have moderate smoking (less than 10
cigarettes/d) or drinking habits (no more than 5 alcoholic
consumptions/d). None of the subjects used drugs known to affect energy
metabolism, none was on a diet, all subjects were consuming normal
balanced meals and all subjects had had weight fluctuations within 2.5
kg for at least six months prior to the start of the study. The protocol
of the studies was submitted to and approved of by the Medical-Ethical
Committee of the Wageningen Agricultural University.
METHODS
Experimental design
Thermic effect of ethanol
In this study ten subjects received on three occasions at different days
an oral dose of 20 g ethanol dissolved in either 335 ml water (7.5
percent solution), 140 ml water (18 percent solution) or 85 ml water (30
percent solution) after an initial RMR measurement. To these solutions
were, respectively, added 1.2 g of a nonnutritive sweetener (Natrena,
Bayer GmbH, Germany) and 0.012 mg of aniseed oil (to the 7.5 percent
solution) or 0.8 g of the sweetener and 0.006 mg of aniseed oil (to the
18 and 30 percent solutions) to improve sensory characteristics
(mimicking Anisette). The ethanol solutions were drunk at a temperature
between 10-15°C within 10 minutes and with the ventilated hood removed
from the subjects heads. After the alcohol ingestion the hood was
replaced and energy expenditure was measured continuously for another 90
minutes. Energy expenditure was measured with a ventilated hood system
as previously described (22). Subjects received the three ethanol
solutions either early in the morning after an overnight fast or, early
in the morning after a fasting period of at least 4.5 hours after a
standardized breakfast of about 2 MJ. In a separate study in 5 subjects
-182-

(data not shown) the thermic effect of drinking 350 ml water plus 1.2 g
of the sweetener was assessed. Water plus sweetener did not induce a
thermic effect. Between each session was a time-interval of at least two
days. Subjects received the three ethanol solutions in randomized order.
Impact of ethanol on diet-induced thermogenesis
In this study twelve subjects received on four different days in the
afternoon two treatments in duplicate, ie, either a test treatment
consisting of the ingestion of an alcoholic aperitif (containing 20 g of
ethanol in an 18 percent solution (v/v)) and a yoghurt-based mixed
liquid test meal (containing 1.96 MJ, 13 percent protein, 27 percent
fat, 60 percent carbohydrates) or a placebo aperitif (containing zero
calories) and an iso-energetic yoghurt-based mixed liquid test meal
(containing 2.55 MJ, 13 percent protein, 27 percent fat, 60 percent
carbohydrates). To both aperitifs flavorings were added to mimiek
Anisette. To the alcoholic aperitif was added 0.8 g of a nonnutritive
sweetener (Natrena, Bayer GmbH, Germany) and 0.06 mg of aniseed oil. To
the placebo aperitif were added 0.8 g of the sweetener, 0.06 mg of
aniseed oil, 0.03 mg of kinin and 0.007 mg of maltol. In a separate
control experiment in 8 subjects (data not shown) the thermic effect of
kinin in a much larger dose (220 mg in 350 ml water) was tested. Kinin
did not induce a significant thermic effect. The impact of maltoi on
energy expenditure was not studied. The quantity used was extremely low
and no effects on energy expenditure were expected. The aperitifs were
given at a temperature between 10-15°C after RMR had been measured for
at least 1 hour, and with the hood removed from the subjects. After
ingestion of the aperitif (within 10 minutes), the hood was replaced
over the subject's head. Fifteen minutes later subjects received the
liquid test meal through a straw which was passed through the hood. The
meals were given at room temperature and were eaten within 5 minutes.
Energy expenditure was then continuously measured for 4 hours. Control
and test treatments were assigned to the subjects according to a Latin
square design.
Between treatments was a time-interval of at least two days.
-183-

Energy exchange measurements
Energy expenditure of subjects resting in a hospital bed in a supine
position was measured with a ventilated hood system. Details of the
measurement procedure and conditions have been previously published
(22,23). Spontaneous movements of the subjects were unobtrusively
registered by means of a load cell (Tokyo Sokki Kenkyujo, TKA-200A,
Tokyo, Japan) placed under one of the legs of the hospital bed. Once
every hour, during calibration of the gas analyzers with fresh outside
air, subjects were allowed to move briefly for 2-3 minutes.
Subjects whose energy expenditure was measured in the afternoon were
instructed to have a small breakfast (< 2 MJ) before 8.00 hours and to
avoid coffee drinking, sleeping and moderate or heavy exercise on the
morning before the gas exchange measurements. Under these conditions,
RMR and DIT measured in the afternoon do not differ systematically from
RMR and DIT measured in the morning (22). After the gas exchange
measurements urine was collected for determining urea-nitrogen
excretion.
Energy expenditure was calculated according to Jéquier et al. (24). The
thermic effect of ethanol was calculated as the difference between the
average energy expenditure over a period of 90 minutes and the
corresponding baseline RMR. DIT with or without ethanol was calculated
as the difference between the average hourly and total (4 hours)
postprandial energy expenditure and the corresponding baseline RMR.
Substrate oxidation rates and nutrient balances
Substrate oxidation rates and nutrient balances were calculated as
previously described (22-24). In addition, the contribution of ethanol
oxidation to total oxidation was estimated. Alcohol oxidation was
assumed to be equal to the average elimination rate of alcohol from the
blood, ie, 100 mg/kg body weight/hour (25).
Generally about 93-98 percent of an ingested dose of alcohol is
eliminated from the body by oxidation and negligable amounts leave the
body by respiration and in the urine (25). We calculated the amount of
oxygen needed to oxydize 1 g of ethanol (1.4594 1) and the amount of
carbondioxide thus produced (0.973 1). Total oxygen consumption and
carbondioxide production were subsequently corrected for the volumina of
-184-

oxygen and carbondioxide associated with ethanol oxidation. These
corrected gasvolumina were used in the calculation of the oxidation
rates of fats and carbohydrates. It should be noted that there may be
considerable inter-individual difference in the elimination rate of
alcohol from the blood (25). However, since in this study each person is
measured repeatedly under different conditions such variation will
probably not bias conclusions on within-person comparisons of
treatments.
Body composition
Body fat mass and body fat-free mass were estimated from total body
density using Siri's formula (26). Total body density was measured in
each subject by hydrostatic weighing with simultaneous determination of
residual lung volume by a helium dilution technique.
Statistics
The thermic effect of ethanol was evaluated using two-sided paired
t-tests.
Analysis of variance was used to test differences among the three
treatments (7.5, 18 and 30 percent solutions) in thermic effect. In the
second study, results of the duplicate measurements were pooled and
averaged for both treatments. Analysis of differences between both
treatments were performed using two-sided paired t-tests. Correlation
coefficients were calculated as Pearson's product-moment correlation
coefficients.
Results are expressed as mean + sem.
RESULTS
Table 1 gives some characteristics of the subjects participating in the
two experiments.
-185-

Table 1: Age, body weight, body fat percentage and habitual alcohol use of the subjects.
Age (yrs)
Body weight (kg)
Body fat content (%)
Habitual alcohol use
Study 1
Thermic effect of alcohol
Mean
26.5
76.8
17.0
1.2
n =
sem
1.7
3.2
1.1
0.2
10
Bange
22 - 41
66.2 - 102.0
1 3 . 0 - 24.7
0.0 - 3
Effect of alcohol
Mean
27.3
78.3
16.0
1.4
StuoV
on diet
n =
-.
1.5
3.0
1.2
0.4
2
-induced therncgenesis
L2
Bange
21 - 41
58.8 - 101.8
7.9 - 22.5
0.0 - 5
n d « of alcoholic beverages habitually used/ti
The average was 27 + 1.5 years (range: 21-41 years), body fat percentage was
on average 16.5 + 1,2 percent (range: 7.6-24.7 percent). Three subjects had a
body fat percentage between 20 and 25 percent, but none was obese. Habitual
use of alcoholic beverages was on average 1-2 units/d (range: 0-5).
Table 2 shows metabolic rate, oxygen consumption, carbondioxide production and
respiratory quotients in subjects before and after ethanol ingestion in three
different concentrations. None of the variables was significantly different
among the three treatments. Alcohol ingestion induced a significant increase
in metabolic rate and in oxygen consumption, but not in carbondioxide
production. As a consequence respiratory quotients decreased significantly
after alcohol use. On average, metabolic rate increased 4.4 percent after
intake of 7.5 percent ethanol solution, 4.8 percent after ingestion of the 18
percent ethanol solution and 6.2 percent after use of alcohol in a 30 percent
solution. These values did not differ significantly.
Since we did not observe significant differences in thermic effect among
iso-energetic ethanol solutions of varying concentration, the effect of
ethanol on DIT was studied in the second study using the moderately
concentrated solution of 18 percent.
Table 3 gives pre- and postprandial metabolic rate, oxygen consumption and
carbondioxide production in subjects who received in duplicate either a meal
with or without ethanol as an aperitif.
Metabolic rate, oxygen consumption and carbondioxide production increased
significantly after ingestion of the meal either with or without alcohol. No
significant difference was found between both treatments in the increase in
metabolic rate or in oxygen consumption. The postprandial rise in
carbondioxide was, however, significantly smaller on the test treatment in
-186-

Table 2: Metabolic rate, oxygen consumption, carbondioxide production and respiratory quotients in subjects before and after ingestion of a 20 g ethanol dosis in three different concentrations.
E T H A N O L
Volune percent 7.5 18 30
Before After Before After Before After
Metabolic rate (kj/tnin) 4.98 + 0.13 5.20 ± 0.16 4.95 + 0.21 5.19 + 0.24Î 4.85 ± 0.22 5.15 ± 0.24 t
O Consunption (ml/tnin) 247 + 7.0 261 ± 8.3 245 ± 11.3 260 + 12.st 241 + 11.0 258 ± 12.1 Î
CO production (ml/tnin) 206 + 5.7 204 + 6.1 206 + 6.5 203 + 7.4 201 + 9.3 200 + 10.3
Respiratory quotient 0.84 + 0.02 0.78 ± O.Olt 0.85 + 0.02 0.78 ± O.Olr 0.84 ± 0.02 0.77 ± O.orf
Values are given as wan + sea * Difference between 'before' and 'after' signifirTeltly different fro» zero at p < 0.05
T Bùdae at p < 0.01
$ Ibide» a t p < 0.001
Meal
Before
5.34 + 0.23
267 ± 11
216 + 9
0.81+ 0.01
--
+ ethanol
After
6.25 + 0.25
312 ± 12
251 ± 11
0.80 ± 0.01
219 ± 14
8.6 ± 0.6
Control - irea]
Before
5.34 + 0.26
267 ± 13
216 ± 11
0.88 ± 0.01
--
t After
6.12
300
263
0.88
185
7.2
+ 0.27
± 1 3
± H ± O.Olt
± 20
+ 0.8
Table 3: Metabolic rate, oxygen consumption, carbondioxide production, respiratory quotient and diet-induced thermogenesis in subjects before and after ingestion of a test meal with or without a dose of 20 g ethanol given as an aperitif.
f f e tabo l i c r a t e (kj/tain)
0 . Consunption (ml/hiin)
0 0 . Product ion (ml/hiin)
Resp ira tory quo t i en t
DIT (kJ)
DIT-% ME (%)
Va lues axe g i v a n a s a ean ± s e e
EOT — d iet—induoed t her sDganes i s ; % IC = peccentage o f a e t a b o l i s a b l e energy i n t ake * Bwrgy intake: 2.545 ± 0.005 KT (22.7 pttlUBUL derivad froB etiianol)
t Biergy intake: 2.551 ± 0.004 HI
f Postprandial respiratory quotients significantly different between treatBBnts (p = 0.002)
comparison to the control treatment. Respiratory quotients remained at their
preprandial level after ingestion of a meal with ethanol, whereas after
ingestion of a meal without ethanol respiratory quotients showed a significant
increase. On average, DIT was about 16 percent higher on the test treatment in
comparison with the control treatment. The difference in DIT between the
treatments was, however, not significant.
Figure 1 shows average hourly DIT values separately for both treatments.
-187-

diet-induced thermogenesis ( kJ /m in )
1.40-
g MEAL
MEAL»ETHANOL
2 3 4
postprandial time (h)
Figure 1. Diet-induced thermogenesis (mean + sem) in subjects after ingestion of iso-energetic meals with or without ethanol.
During the second, third and fourth hour, DIT was higher on the test treatment
compared to the control treatment, but only for the second hour the difference
reached statistical significance (p=0.03).
Figure 2 gives respiratory quotients for RMR and for the course of the DIT
measurement separately for both treatments.
Significant differences were found between both treatments in respiratory
quotients during the first, second and third hour of the postprandial period.
Table 4 gives energy and nutrient intake, and postprandial metabolism of the
ingested nutrients for both treatments. Glucose and fat oxidation rates were
significantly lower (p <0.001) on the test treatment in comparison with the
control treatment. Postprandial protein oxidation was not systematically
affected by ethanol ingestion. On the control treatment subjects oxydized on
average about 50 percent of the carbohydrate and fat intake. During a 4 hours
postprandial period, when food was eaten with ethanol, about 40 percent of the
-188-

respiratory quotient
0.89-
0.87-
0.85-
0.83-
0.81-
0.79-
0.77-
I i
RMR ~~r~ MEAL
I
i
Z
1 Ü
I
g M E A L
^ 1 MEAL »ETHANOL
before/after meal ingestion ( h )
Figure 2. Respiratory quotients (mean + sem) in subjects before and after ingestion of iso-energetic meals with or without ethanol.
glucose intake and about 20 percent of the fat intake were subsequently
oxydized. Total energy retention was not significantly different between both
treatments.
On the test treatment, net lipogenesis occurred in nine subjects during the
first postprandial hour (1.9 + 0.7 g) and in eight subjects during the second
hour (1.9 + 0.7 g ) . Net lipogenesis was of negligable importance in the
subjects on the control treatment.
-189-

Table 4: Nutrient and energy intake, utilization and storage in the body over a period of 4 hours in subjects after ingestion of a test meal with or without a dose of 20 ethanol given as an aperitif.
Energy
MfE MfE
kJ kJ
Carbohydrate
M+E M-E
g g
Fats
MŒ
g
M-E
g
Protein
» E
g
M-E
g
Ethanol
MfE
g
Intake 2543+ 5 2550+ 4 68.7 + 0.1 90.8 + 0.1 14.1 ± 0.0 18.6 + 0.0 15.0 + 0.0 19.8 + 0.0 19.9 + 0.1
Oxidation 29.8 + 3.5 47.5 ± 3.3* 3.1 ± 1.5 9.2 ± 1.6t 17.5 + 1.5 18.8 + 1.4 19.8 ± 0.3
Expenditure 1500 + 60 1469 + 65
Storage 1093 ± 61 1081 + 66 38.9 ± 3.5 43.3 + 3.3 11.0 1.5 9.4 ± 1.6 -2.6 + 1.5 1.0 + 1.4 0.1 + 0.0
Values are g i \en as aean ± sea
HIE = Maal with ethanol; M-E = Baal without ethanol * Sionificant difference betwaan MtE and M-E at p < 0.01
+ Sionificant difference Letweon MfE and M-E at p < 0.05
DISCUSSION
Thermic effect of ethanol
The results of this study show that ethanol in a moderate amount of 20 g
induces in fasting individuals a significant increase in oxygen consumption
and metabolic rate, but not in carbondioxide production. The increase in
metabolic rate was not significantly related to the concentration of the
ethanol solution.
Ethanol induced an increase in metabolic rate of about 4-6 percent of the
ingested caloric load (about 0.6 MJ). This is similar or slightly lower to the
thermic effect of fats or carbohydrates (27). The results of this study
support the findings of Perman (18) and Rosenberg and Durnin (19), but are in
contrast with the observations of Stock and Stuart (21) and Barnes et al.
(22). It is, however, difficult to compare these studies, because of
differences in experimental design and in the technique used for assessing
alcohol-induced thermogenesis. In contrast to the present study, none of the
aforementioned studies employed the ventilated hood technique to assess energy
expenditure. This technique is particularly suitable for measuring energy
expenditure accurately over prolonged periods of time, ie, over several hours,
and has been recommended for use in metabolic studies assessing thermogenesis
(28).
In the present study we gave 20 g of ethanol dissolved in varying amounts of
water with added flavorings. This enabled us to study the impact of ethanol in
-190-

different concentrations on energy expenditure. Perman (18) and Rosenberg and
Durnin (19) gave ethanol, respectively, in a dosis of 0.29 gAg dissolved in
150 ml of chilled fruit juice or in a dosis of 23 g as 230 ml of red wine.
Barnes et al. (22) and Stock and Stuart (21) used whisky in a dosis of 1.5
ml/kg and in a quantity of about 80 ml, respectively. Besides differences
among these studies in the amount of ethanol given, the concentration of the
ethanol solutions and the amount of non-alcoholic calories varied. For
example, red wine and fruit juice may contain carbohydrates, which can provoke
an increase in energy expenditure (27).
For the present study we first tested a quantity of 30 g ethanol (18 percent)
and found that this amount, drunk within 10 minutes, induced drowsiness and
symptoms of mild intoxication in fasting individuals. Since drowsiness may
interfere with a correct assessment of metabolic rate, we opted for the
smaller dosis of 20 g. In fasting subjects such an amount of ethanol should
quickly raise the blood ethanol concentrations to values between 5 and 15
mmol/1 (29). It was expected that the more concentrated solutions would lead
to higher maximal blood alcohol curves (29). At higher blood alcohol levels an
increased metabolism of ethanol by the microsomal ethanol oxydizing system
(MEOS) occurs (14). Oxidation of ethanol by MEOS will result in a less
efficient coupling (about 20 percent reduction in net ATP production) of
oxidation to ATP synthesis and an increased demand for NADPH compared to
oxidation by the alcohol-dehydrogenase (ADH) pathway. The latter pathway
operates fully at lower blood alcohol concentrations (14). This may affect
thermogenesis in two ways. A relative increase in ethanol oxidation by MEOS
may increase the rate of ethanol oxidation to meet the tissues demand for ATP,
secondly, the eventual NADPH repletion may increase energy, ie, ATP demand,
from other metabolic pathways. Both processes could lead to higher oxygen
consumption and hence increased thermogenesis. However, we did not find a
significant relation between the thermic effect of ethanol and its
concentration. Nonetheless, at lower ethanol concentrations (7.5 and 18
percent) the thermic effect of ethanol was on average 4.6 percent versus 6.2
percent at the highest ethanol concentration. This is a relative difference of
about 30 percent and could be partly attributed to an increase in rate' of
ethanol oxidation at the highest ethanol concentration to compensate for the
less efficient metabolism of ethanol, ie, a relatively greater part by MEOS
than by the ADH pathway. However, the increase in the thermic effect of
ethanol at the highest ethanol concentration was not a systematical phenomenon
and did not reach statistical significance. It is also possible that the
-191-

different solutions did not result in clear differences in blood ethanol
concentrations and hence in ethanol metabolism. Since blood alcohol curves
were not measured we can not put this explanation to empirical test.
In this study it was also found that ethanol ingestion and its subsequent
oxidation significantly reduced basal respiratory quotients. It is well known
that ethanol oxydizes with a respiratory quotient of 0.666, which is much
lower than respiratory quotients usually found in overnight fasting
individuals (30).
Impact of ethanol on diet-induced thermogenesis
Very few studies have assessed the effect of ethanol on diet-induced
thermogenesis (19,21). Rosenberg and Durnin (19) found no significant
difference between the average increase in metabolic rate over 3 hours after
an iso-energetic meal of food or of food plus alcohol. However, in the latter
study, during the last 30 minutes of the 3 hours postprandial period the
increased oxygen consumption was significantly greater after the meal
including the alcohol. Stock and Stuart (21) found that whisky (837 kj) taken
with a meal produced a 22 percent increase in oxygen consumption which was
significantly greater than the 13 percent increase caused by consuming an
iso-caloric non-alcoholic meal. This effect was observed during the entire
postprandial period. In both studies, however, at the end of the postprandial
period energy expenditure was still elevated with more than 20 percent above
the premeal baseline energy expenditure, indicating that the total thermogenic
response was not completely measured.
In this study we compared thermogenesis induced by a iso-energetic meal of
food alone and of food plus alcohol. Alcohol was given as an aperitif to
minimize effects of food on the absorption of ethanol from the
gastro-intestinal tract. Control and test treatments were carried out in
duplicate to obtain a more precise estimate of an individuals response of
energy metabolism to food. In previous studies it was shown that diet-induced
thermogenesis is prone to considerable within-person variation (22,31).
Postprandial measurements were carried out over a period of 4 hours, which was
sufficiently prolonged in duration to allow an almost complete assessment of
the thermogenic response. Thus, energy expenditure averaged over the fourth
hour of the postprandial period was on average 4.5 percent elevated above the
corresponding premeal baseline energy expenditure on the control treatment and
6.5 percent on the test treatment.
-192-

In the present study overall diet-induced thermogenesis was not potentiated by
ethanol ingestion. On average, in particular during the last three hours of
the postprandial period, DIT values were, however, slightly higher on the test
treatment than on the control treatment. The maximum potentiation of DIT was
observed during the second and third hour of the postprandial period. After
ethanol consumption it takes about 30-45 minutes in fasting subjects to reach
the maximal blood ethanol concentrations (29). Depending on the total amount
of ethanol ingested ethanol, elimination will take several hours. It can be
calculated that in this study most of the ethanol will have been eliminated
between a period of 30-150 minutes after ingestion of the meal, which was
given 15 minutes after the aperitif. During this period ethanol oxidation
contributed on average 3.8 kJ/min to total energy expenditure. On average
between 55 and 65 percent of total energy expended was derived from ethanol
oxidation.
Analysis of the substrate oxidation rates revealed that ethanol was
preferentially oxydized in comparison with fats and carbohydrates, but not in
comparison with proteins. In the first 180 minutes of the postprandial period,
glucose and fat oxidation were markedly reduced, respectively, on average by
about 22 g and 7 g after ingestion of a meal of food plus alcohol in
comparison with a meal of food alone. This means that during this period more
fats and carbohydrates were stored on the test treatment when compared to the
control treatment. Increased storage of nutrients prior to oxidation after a
meal will increase postprandial energy expenditure (30). When fats and
carbohydrates are oxydized without prior storage, about 2 percent of the
energy content of these substrates has to be expended to provide ATP for
handling costs. In contrast, if fats are stored prior to oxidation total
energy dissipated for handling this process is about 4 percent of the energy
content of fat. For glucose stored as glycogen or as fat the costs for
processing are, respectively, about 7 and 24 percent of the energy content of
glucose (30). The average difference in handling costs of the postprandial
processing of the nutrients was calculated at about 0.2-0.3 kJ/min for the
first, second and third hour of the postprandial period. Figure 1 shows that
for this period differences were found between both treatments in energy
expenditure on average of -0.03, 0.23 and 0.21 kJ/min, respectively. In
particular, the values for the second and third hour are close to what was
expected. Probably, over the first hour of the postprandial period differences
in storage of nutrients between both treatments are small. This could be due
to a relatively low ethanol oxidation especially in the first half of this
-193-

period. It has also been found (27) that nutrient-induced thermogenesis cannot
solely be explained in terms of the biochemistry of energy expenditure
associated with the processing of ingested nutrients (30). Part of nutrient-
or diet-induced thermogenesis, ie, about 30-40 percent, is thought to be
mediated by an increased activity of the sympathetic nervous system after food
or nutrient ingestion (32). The latter part of the total thermogenic response
is usually designated with the term facultative thermogenesis, indicating that
this part of thermogenesis might not be operating at the same level in each
individual, or that it might be susceptible to environmental stimuli. It is
possible that nutrient-induced facultative thermogenesis is effectively
operative in the period immediately after food ingestion (0-60 minutes) and
that ethanol reduces the amount of energy expended by the facultative
mechanism.
The results of this study on the thermic effect of ethanol and the impact of
ethanol on DIT do not indicate that moderate amounts of ethanol are less
efficiently used as an energy source in comparison to fats or carbohydrates.
We therefore tentatively conclude that the observation that alcohol provides
additional energy to the diet, but that its use is not associated with
increased levels of adiposity, is due to methodological problems of accurately
quantifying energy and alcohol intake in free-living humans, or of the
accurate quantition of other factors than diet and alcohol that affect energy
balance or body weight in man, for example, of the degree of physical
activity.
In conclusion we can state that ethanol consumed in a moderate amount has a
significant thermic effect, probably, similar to fats or carbohydrates. No
potentiation by ethanol ingestion of diet-induced thermogenesis was found.
Ethanol fed in combination with a mixed liquid meal had a substantial impact
on substrate oxidation and storage rates, in particular during the period at
which ethanol oxidation was at its maximum. During this period ethanol
ingestion slightly increased diet-induced thermogenesis. Overall postprandial
energy retention was, however, similar between a iso-energetic meal of food
plus alcohol and of food alone. Substituting moderate amounts of calories from
fats and carbohydrates by alcohol in non-alcoholics is not expected to
decrease energy retention significantly or to be useful as an adjuvant in
weight reducing regimes.
-194-

ACKNOWLEDGEMENTS
The authors want to thank the subjects for their enthousiastic participation.
We are also indebted to Quest International (Naarden, the Netherlands) for
advice on flavoring the ethanol solutions and for providing the necessary
flavoring agents.
REFERENCES
1. Problems related to alcohol consumption. Report of WHO Expert Committee. Technical Report Series 650. World Health Organization: Geneva, 1980.
2. Sulkunen P. Production, consumption and recent changes on consumption of alcoholic beverages. Br J Addict 1976;71:115-22.
3. Wat eet Nederland. Resultaten van de voedselconsumptiepeiling 1987-1988. Rijswijk: Ministerie van Welzijn, Volksgezondheid en Cultuur, Ministerie van Landbouw en Visserij, 1988.
4. Gruchow HW, Sobocinski KA, Barboriak JJ, Scheller JG. Alcohol consumption, nutrient intake and relative body weight among US adults. Am J Clin Nutr 1985;42:289-95.
5. Spring JA, Buss DH. Three centuries of alcohol in the Britisch diet. Nature 1977;270:567-72.
6. Mercy E. Alcolic liver disease: roles of alcohol and malnutrition. Am J Clin Nutr 1980;33:2709-18.
7. Klatsky AL. Effects of alcohol on the cardiovascular system. In: Castineau GF, Darby WL, Turner TB. Fermented food beverages in nutrition. New York: Academic Press, 1979:317-36.
8. Lieber CS. Medical disorders of alcoholism: pathogenesis and treatment Philadelphia: Saunders, 1982.
9. Fisher M, Gordon T. The relation of drinking and smoking habits to diet: The lipid Research Clinics Prevalence Study. Am J Clin Nutr 1985;41:623-30.
10. Hillers VN, Massey LK. Interrelationships of moderate and high alcohol consumption with diet and health status. Am J Clin Nutr 1985;41:356-62.
11. Camargo CA, Vranizan KM, Dreon DM, Frey-Hewitt B, Wood PD. Alcohol calorie intake, and adiposity in overweight men. J Am Coll Nutr 1987;6:271-8.
12. Bebb HT, Houser HB, Witschi JC, Littell AS, Fuller RK. Calorie and nutrient contribution of alcoholic beverages to the usual diets of 155 adults. Am J Clin Nutr 1971;24:1042-52.
13. Jones BR, Barett-Connor E, Criqui MH, Holdbrook MJ. A community study of calorie and nutrient intake in drinkers and nondrinkers of alcohol. Am J Clin Nutr 1982;035:135-9.
14. Pirola RD, Lieber CS. The energy cost of the metabolism of drugs, including ethanol. Pharmacology 1972;7:185-96.
15. McDonald JT, Margen S. Wine versus ethanol in human nutrition. I. Nitrogen and calorie balance. Am J Clin Nutr 1976;29:1093-1103.
16. Crouse JR, Grundy SM. Effects of alcohol on plasma lipoproteins and cholesterol and triglyceride metabolism in man. J Lipid Res 1984;25:486-96.
17. Atwater WD, Benedict FG. An experimental inquiry regarding the nutritive value of alcohol. Mem Natl Acad Sei 1902;8:235-397.
-195-

18. Perman ES. Increase in oxygen uptake after small ethanol doses in man. Acta Physiol Scand 1962;55:207-9.
19. Rosenberg K, Durnin JVGA. The effect of alcohol on resting metabolic rate. Br J Nutr 1978;40:293-8.
20. Barnes EW, Cooke NJ, King AJ, Passmore R. Observations on the metabolism of alcohol in man. Br J Nutr 1965;19:485-9.
21. Stock MJ, Stuart JA. Thermic effects of ethanol in the rat and man. Nutr Metab 1974;17:297-305.
22. Weststrate JA, Weys PJM, Poortvliet EJ, Deurenberg P, Hautvast JGAJ. Diurnal variation in postabsorptive resting metabolic rate and diet-induced thermogenesis. Am J Clin Nutr 1989:in press.
23. Den Besten C, Vansant G, Weststrate JA, Deurenberg P. Resting metabolic rate and diet-induced thermogenesis in abdominal and gluteal-femoral obese women before and after weight reduction. Am J Clin Nutr 1988;47:840-7.
24. Jéquier E. Direct and indirect calorimetry. In: Garrow JS, Halliday D, eds. Substrate and energy metabolism. London: John Libbey, 1985:82-92.
25. Bouman WC, Rand MJ. Textbook of pharmacology. 2nd ed. Oxford: Blackwell Scientific Publications, 1980:42.7.
26. Siri WE. The gross composition of the body. Adv Biol Med Phys 1956;4:239-80.
27. Jéquier E. Thermogenesis induced by nutrient administration in man. Infusionstherapie 1984;4:184-8.
28. Kinney JM. The application of indirect calorimetry to clinical studies. In: Kinney JM ed. Assessment of energy metabolism in health and disease. Report on the first Ross conference on medical research. Columbus: Ross Laboratories, 1980:42-48.
29. DiPadova C, Worner TM, Julkunen RJK, Lieber CS. Effects of fasting and chronic alcohol consumption on the first-pass metabolism of ethanol. Gastroenterology 1987;92:1169-73.
30. Flatt JP. Biochemistry of energy expenditure. In: Bray G ed. Recent advances in obesity research:II. London: John Libbey, 1978:211-28.
31. Ravussin E, Lillioja S, Anderson TE, Christin L, Bogardus C. Determinants of 24-hour energy expenditure in man. J Clin Invest 1986;78:1568-78.
32. Sims EAH, Danforth E. Expenditure and storage of energy in man. J Clin Invest 1987;79:1019-25.
-196-

Chapter 10. Does palatability effect the postprandial response of energy expenditure?
JAN A WESTSTFATE MSC, THEO DOPHEIDE BSC, LEONIEK ROBROCH BSC, PAUL DEURENBERG
PHD, JOSEPH GAJ HAUTVAST MD
ABSTRACT
The impact of palatability on diet (DIT)- and sucrose (SIT)-induced
thermogenesis was studied in two experiments with 24 healthy young
normal-weight subjects, 12 men and 12 women. In the first study, subjects
received at random, in duplicate, either a normal liquid test meal (2000 kJ,
12 percent protein, 33 percent fat, 55 percent carbohydrates) or an
iso-energetic unpalatable test meal with kinin. Palatability did not have a
significant impact on postprandial metabolism. Integrated DIT values were,
respectively 165 + 15 (mean + sem) kJ for the control treatment and 185 + 14
kJ for the test treatment. In the second study, subjects received at random
either a palatable sucrose solution (900 kJ), an iso-energetic standard
sucrose solution or an iso-energetic unpalatable sucrose solution. Kinin and a
citrusflavor were used to vary palatability. Postprandial energy expenditure
over a period of 150 minutes was not significantly affected by differences in
palatability. In both studies, men had a higher rise in postprandial energy
expenditure than women did, in particular, after the control meal and after
the unpalatable sucrose solution. A separate control experiment to assess the
effect of kinin on energy expenditure was carried out in 8 subjects. Kinin had
no significant effect on energy expenditure over a period of 120 minutes after
ingestion.
Keywords: indirect calorimetry, energy expenditure, palatability, diet-induced
thermogenesis, postprandial, sucrose, human.
-197-

INTRODUCTION
Food intake evokes a prompt increase in energy expenditure, known as
diet-induced thermogenesis, the thermic effect of food or postprandial
thermogenesis. The postprandial rise in energy expenditure depends largely on
the amount of energy and type of nutrient ingested (1,2). Generally, the
thermic effect of food increases linearly with energy intake (2) and is larger
for proteins and carbohydrates than for fats (1). In the average individual
about 10 percent of the total daily energy output would be associated with
food ingestion (3). This represents a considerable loss of energy for the
individual. Therefore it is not surprising that interest arose in diet-induced
thermogenesis, in particular, at the suggestion that obese individuals would
expend less energy after meal ingestion when compared to lean subjects (4).
Postprandial energy expenditure can be largely attributed to the energy needed
for processing the ingested nutrients (1). However, the total observed thermic
response to food or nutrients can not completely be understood in terms of the
biochemistry of energy expenditure of the postprandial processing of nutrients
(1,5). Part of the response, about 30-40 percent, is thought to be mediated by
a diet-induced increase in the activity of the sympathethic nervous system
(5). This latter part of the thermogenic response involves facultative
thermogenic mechanisms, which may vary between individuals or in response to
environmental stimuli. The determinants of diet-induced facultative
thermogenesis in man are largely unknown. Degree of adiposity (6), aerobic
capacity (7), type of nutrient (8) and sensory characteristics (9) of food may
be important.
Information on the impact of sensory characteristics of food on diet-induced
thermogenesis is scarce. Meal ingestion is usually associated with olfactive,
gustative and cognitive stimulation (10), which may affect the activity of the
sympathetic nervous system. It is possible that meals differing in
palatability result in different sensory stimulation and, hence, induction of
metabolic processes involved in facultative thermogenesis.
Recently, LeBlanc et al. (9) reported that diet-induced thermogenesis was
significantly elevated on an iso-energetic palatable meal in comparison with
an unpalatable meal. In this study, however, the palatable and unpalatable
meal varied extremely in water content, which could have caused the observed
difference in dietary thermogenesis (11). Differences in diet-induced
thermogenesis between palatable and unpalatable meals have been associated
with differences in insulin responses (9). After ingestion of an unpalatable
-198-

meal the insulin response was significantly reduced in comparison with a
palatable meal (9). This phenomenon may be related to differences in the
early, ie, pre-absorptive or cephalic insulin response (10,12-14). After
ingestion of an unpalatable meal the cephalic insulin response would be
reduced or absent. Blocking of the early insulin response was found to reduce
the thermic effect of infused glucose (15).
In this report we describe two studies assessing the impact of palatability on
diet-induced thermogenesis. In the first study, iso-energetic meals identical
in energy content, nutrient composition and water content, but differing in
palatability were compared. In the second study, iso-energetic sucrose
solutions of varying palatability were tested. This study was performed to
investigate differences in postprandial thermogenesis between a palatable and
unpalatable nutrient solution with a particular strong impact on postprandial
insulin and glucose homeostasis.
The results of these studies show that palatability did not significantly
affect postprandial energy expenditure.
SUBJECTS AND METHODS
The total experiment consisted of several studies, two metabolic studies for
determining the impact of palatability on postprandial energy expenditure and
a sensoric study to assess the palatability of the meals and sucrose solutions
to be used in the energy expenditure studies. In addition, a control study was
performed to measure the impact of kinin on energy expenditure. Kinin was used
for decreasing palatability.
SUBJECTS
Subjects were recruited for participation in the studies by an advertisement
in the weekly periodical of the University. In addition, some subjects were
contacted for participation through student organisations. In total 36
subjects applied for participation. Subjects received a letter informing them
on the nature and purpose of the experiments. In addition, they received two
questionnaires, one for obtaining information on past and present health
status and one for getting information on eating, drinking, smoking and
exercise habits. The medical questionnaire was evaluated by a physician
-199-

(JGAJH). For both studies 24 subjects were needed, 12 women and 12 men.
Subjects were selected for participation when they had a body fat percentage
less than 25 percent for men or less than 35 percent for women, did not smoke
or smoked less than 10 cigarettes/d, were apparently healthy, were consuming
normal balanced diets and had had no major weight fluctuations (more than 2.5
kg) within a period of six months prior to the study. In addition, the
selected subjects had to show consistent preference ratings in the sensory
evaluation of the test meals and solutions. This means that they had to be
able to discriminate consistently between the various meals and solutions. All
subjects were students at the University, none of the subjects was on a diet
or used drugs known to affect energy expenditure. All subjects participated in
only one energy expenditure study. Before the start of the studies subjects
gave their written informed consent to participate. The protocol of the study
was submitted to and approved of by the Medical-Ethical Committee of the
Wageningen Agricultural University.
METHODS
Experimental design
Sensory evaluation
Before the start of the energy expenditure studies, the taste preference of
each subjects for the various test meals and sucrose solutions was evaluated
in a sensoric study.
Three different test meals were prepared, identical in energy content,
nutrient composition, texture and water content. Liquid yoghurt-based test
meals were used with an energy content of 4.12 MJ/kg (12 percent protein, 33
percent fats, 55 percent carbohydrates). Meals were varied in palatability
either by adding 0.10 gAg of a coloring agent (E-151, brillant black) or by
adding the coloring agent plus 0.79 gAg of a 10 percent solution of kinin in
ethanol. A meal without these added substances served as a reference meal.
Sucrose solutions (143 g/1) were varied in palatablity either by adding 0.63
gAg of a 10 percent kinin solution in ethanol or by adding 0.63 gAg of a
commercially available citrusflavor on ethanol basis (Baukje, Rijssen, the
Netherlands). A standard sucrose solution was used for reference purposes.
After being instructed in the standard sip-and-spit procedure, subjects
-200-

received the various stimuli for pairwise comparison in small plastic cups
(approximately 15 ml) at room temperature. Tests were carried out in the
afternoon with the subjects in a 5-6 hours postabsorptive state. Thorough
rinsing between the samples was emphasized. For each study all 6 permutations
of the 3 items were used and the order of presentation of stimulus pairs was
randomized across subjects. In addition, to the pairwise comparisons of the
various stimuli subjects had to rank their preference for each item on a
standard nine-point hedonic preference scale that ranged from 'dislike
extremely' (1) to 'like extremely' (9). Results of the sensory evaluation
showed that the meal with added coloring agent was not sufficiently disliked
in comparison with the standard meal. Therefore, the impact of palatability on
meal-induced thermogenesis was investigated with two meal types only, ie, the
standard meal and the meal with coloring plus kinin. Differences in
palatability among the three sucrose solutions were statistically significant.
Impact of palatability on meal-induced thermogenesis
In this study 12 subjects, 6 males and 6 females, received in the morning,
after an overnight fast, on four different days two times an iso-energetic
meals in duplicate, either the palatable standard test meal with an energy
content of 2.00 MJ (12 percent protein, 33.1 percent fat, 54.9 percent
carbohydrates) or the unpalatable test meal. Meals were given at room
temperature after an initial measurement of resting metabolic rate of at least
one hour. Energy expenditure was assessed with a ventilated hood system as
previously described (16). Meals were given through a straw which was passed
through the ventilated hood. Meals were ingested within five minutes. Energy
expenditure was then continuously measured for 3.5 hours. Meals were given to
the subjects according to a Latin square design to balance the order of
treatment with the type of treatment. No attempt was made to measure the women
in a specific phase of the menstrual cycle. In a previous study (17) we had
not found a significant impact of the stage of the menstrual cycle on
postprandial energy expenditure. Measurements were, however, always carried
out at least three days after the onset of menstruation. Between the
measurements was an interval of at least two days.
-201-

Impact of palatability on sucrose-induced thermogenesis
In this study 12 subjects, 6 men and 6 women, received on three days in the
afternoon three iso-energetic solutions consisting of a standard sucrose
solution (0.90 MJ), a highly unplalatable sucrose solution or a highly
palatable sucrose solution. Subjects were measured in the afternoon for
practical reasons. Subjects were instructed to have a small breakfast (< 2 MJ)
before 8.00 hours and to avoid coffee drinking, smoking, sleeping and moderate
or heavy exercise on the morning before the energy expenditure measurements.
Under these conditions resting metabolic rate and diet-induced thermogenesis
do not show significant diurnal variation (16). Sucrose solutions were given
at room temperature after an initial measurement of baseline postabsorptive
energy expenditure of at least one hour. Sucrose solutions were given through
a straw, which was passed through the ventilated hood and were drunk within 5
minutes. Energy expenditure was then continuously measured for 2-2.5 hours.
Because of the relatively low energy content of the sucrose solutions (< 1MJ)
a shorter duration of the postprandial measurements was chosen. Similar to the
other study, subjects recieved sucrose solutions in a random order according
to a Latin square design. Also no attempt was made to measure the women in a
particular phase of the menstrual cycle. Between the tests was a time interval
of at least two days.
Control study using kinin
In 8 subjects, 3 men and 5 women, recruited from students and staff working in
the laboratory, the impact was assessed on energy expenditure of 0.22 g of a
10 percent (v/v) kinin solution in ethanol, given either in 350 ml of water or
in a gelatin capsule ingested with 350 ml of water. Resting metabolic rate was
measured after an overnight fast for at least one hour. After the RMR
measurement subjects received the kinin solution or capsule with water in a
random order. Energy expenditure was then assessed continuously for 120
minutes. All subjects considered the kinin solution as extremely unpleasant.
No sensory stimulation was induced by the ingestion of the kinin capsule. Thus
the impact of kinin on energy expenditure could be assessed controlling for
its sensory-mediated effects. Between the tests was an interval of at least
two days.
-202-

Gas exchange measurements
Energy expenditure was measured with a ventilated hood system in subjects
reclining in a supine position in a hospital bed. Details of the measurement
procedure and conditions have been published previously (16). In addition,
movements were objectively registered using a load cell (TKA-200A, Tokyo Sokki
Kenkyujo Co Ltd, Tokyo, Japan) connected to one of the legs of the bed. Once
every hour during calibration of the oxygen analyzer with fresh outside air,
subjects were allowed to move briefly for 2-3 minutes. After the gas exchange
measurements for assessing the meal- or sucrose-induced thermogenesis in
relation to palatability, urine was collected for determining urea-nitrogen
excretion.
Calculations of energy expenditure and substrate oxidation
Energy expenditure was calculated according to Jéquier et al. (18). The
thermic effect of the various test meals and solutions was defined as the
integrated increase in postprandial energy expenditure above the corresponding
preprandial baseline energy expenditure after ingestion of the test food.
Substrate oxidation rates and postprandial nutrient balances were calculated
as previously described (16).
Body composition
Body fat content was estimated from total body density using Siri's formula
(19). Total body density was measured in each subject participating in the two
major studies by hydrostatic weighing with simultaneous assessment of residual
lung volume with a helium dilution technique.
Statistics
Pairwise comparisons of test stimuli were statistically evaluated using the
chi-square statistic. Preference ratings for each stimuli were compared using
paired t-tests with a two-tailed region of rejection and a confidence level of
95 percent. Treatments were compared in the meal study using paired t-tests on
the pooled average results of the duplicate measurements. In the sucrose
study, treatments were compared using analysis of variance.
-203-

RESULTS
Table 1 gives age and some characteristics of the subjects participating in
the various experiments. Subjects participating in the palatability studies
Table 1. Age, body weight and body fat percentage in subjects participating in studies.
Study 1 palatability - DIT
men women n = 6 n = 6
Study 2 palatability - SIT men women
n = 6 n = 6
Study 3 Control - kinin men women
n = 3 n = 5
Age (yrs) 22.7+0.8 21.2+0.8 22.2+0.3 21.8+1.1 Body weight (kg) 71.8+2.9 60.6+2.0 74.2±1.6 61.4+2.1
Body fat content (%) 12.0+1.0 29.0+1.1 12.4+1.5 28.0±2.5
35.3+6.8 23.4+0.8
71.8+3.1 60.0±0.8
16.5+2.8 29.1+2.1
Results are given as mean + sem DIT = diet-induced thermogenesis; SIT = sucrose-induced thermogenesis
had ages between 18 and 25 years, normal body weights and body fat
percentages. The men who participated in the kinin study were on average
slightly older compared to the other men, ages were, respectively, 28, 29 and
49 years, but none of these men was obese.
Table 2. Preference rating of the various test meals and sucrose solutions.
Meal type
Study 1
palatability - DIT
n = 12 Solution type
Study 2
palatability - SIT
n = 12
1. standard meal
2. standard + color
3. standard + color + kinin 1.8 + 0.3
p<0.001
1. standard sucrose 5.5 + 0.3-
p<0.001 2. standard + flavor 6.6 + 0.3
3. standard + kinin 1.8 + 0.2-
p<005
p<0.001
p<0.001
t are given as maan + sen
EOT = diet—induced theraogenesis; STT = sucrose-induced theraogenasis
Preferences were rated on a standard nine-polat bédane scale ranging fron 'dislike extremely (1) t o ' l ike extreaely' (9)
-204-

Table 2 gives the results of the sensory evaluation of the various test meals
and sucrose solutions. For the meals a significant difference in preference
rating was found between the standard meal and the meal with added coloring
plus kinin only. Therefore, it was decided to study the impact of palatability
on diet-induced thermogenesis with these meal types only. Preference ratings
differed significantly among the three sucrose solutions. The largest
differences occurred between the standard solution and the solution with
citrusflavoring on the one hand, and the solution plus kinin on the other
hand.
Table 3. Diet-induced thermogenesis, postprandial respiratory quotients and substrate oxidation rates in subjects receiving meals of differing palatability.
DIT DIT - %/ME RQ 0 - 60 min
60 - 120 min 120 - 180 min 180 - 210 min
Glucose oxidation Fat oxidation Protein oxidation
(mg/min (mg/min (mg/min
(kJ) (%)
.kgFFM)
.kgFFM)
.kgFFM)
palatable meal n =
166 + 15 8.3 + 0.7
0.90 + 0.01 0.93 + 0.01 0.86 + 0.01 0.83 + 0.01 3.4 + 0.17 0.7 + 0.06 1.4 + 0.09
unpalatable meal 12
185 + 14 9.0 + 0.7
0.89 + 0.01 0.93 + 0.01 0.84 + 0.01 0.81 + 0.01
3.7 + 0.23 0.8 + 0.09 1.5 + 0.09
Results expressed as mean + sem DIT = diet-induced thermogenesis; %ME = percent of energy intake; RQ = respiratory quotients; kgFFM = kg fat-free mass
Table 3 gives diet-induced thermogenesis, postprandial respiratory quotients
and substrate oxidation rates in subjects after the palatable and unpalatable
test meal. None of the variables differed significantly between the
treatments. Baseline energy expenditure rates (resting metablic rate) and
respiratory quotients did not differ significantly between the treatments.
Resting metabolic rates and respiratory quotients were, respectively, 4.58 +
0.25 kJ/min and 0.83 + 0.01 before ingestion of the palatable meal and 4.68 +
0.25 kJ/min and 0.82+0.01 before the unpalatable meal.
Figure 1 gives the time course in DIT after ingestion of a palatable or an
unpalatable meal. No significant differences were observed in integrated
hourly DIT values between both treatments.
-205-

There was a surprising sex difference in DIT. On both treatments DIT was
higher in men than in women, respectively, 203 + 11 kJ compared to 128 + 16 kJ
(p=0.005) for the palatable meal and 210 + 16 kJ versus 159 + 18 kJ (p=0.06)
for the unpalatable meal. The difference between men and women occurred
entirely in the first two hours of the postprandial period.
diet
1.50-
0.90
0.30
induced thermogenesis (kJ/min)
f | PALATABLE MEAL
I- UNPALATABLE MEAL
M i^- M
1 2 3 4 time after meal ingestion (h)
Figure 1. Diet-induced thermogenesis (mean + sem) over 4 hours in subjects after ingestion of a palatable or unpalatable meal.
Table 4 gives sucrose-induced thermogenesis, postprandial respiratory
quotients and substrate oxidation rates in the subjects after ingestion of the
three sucrose solutions. None of the variables differed significantly among
the treatments. Baseline energy expenditure rates and respiratory quotients
were similar for the three treatments, respectively, 4.81 + 0.26, 4.95 + 0.33
and 5.03 + 0.30 kJ/min, and 0.81 + 0.01, 0.80 + 0.01 and 0.80 + 0.01.
Figure 2 gives the time course of the sucrose-induced thermogenesis for the
various treatments. No differences in time course among treatments were
observed. SIT was reduced to zero for most subjects after two hours.
A significant sex difference in SIT was observed only for the unpalatable
sucrose solution, 43 + 5 kJ in men versus 26 + 4 kJ in women (p=0.03).
-206-

Table 4. Sucrose-induced thermogenesis, postprandial respiratory quotients and Substrate oxidation rates in subjects receiving sucrose solutions of differing palatability.
SIT SIT-%ME RQ 0 - 6 0 min
60 - 120 min 120 - 150 min
Glucose oxid (mg/kgFFM Fat oxid (mgAgFFM Protein oxid {mq/WgFFVi
(kJ) (%)
min) min) min)
Most palatable
44 + 9 4.9 + 1.0
0.88 + 0.02 0.85 + 0.01 0.84 + 0.02 3.0 + 0.26 0.9 + 0.12 1.6 + 0.14
Standard solution n = 12
42 + 12 4.6 + 1.3
0.93 + 0.01 0.87 + 0.01 0.86 + 0.01 3.6 + 0.26 0.6 + 0.12 1.5 + 0.14
Unpalatable solution
34 + 4 3.8 + 0.5
0.91 + 0.02 0.88 + 0.01 0.86 + 0.01
3.2 + 0.23 0.6 + 0.06 1.5 + 0.09
Results are expressed as mean ± sem SIT - sucrose-induced thermogenesis; %ME = percent of energy intake; RQ = respiratory quotients; kgFFM = kg fat-free mass
sucrose-induced thermogenesis (kJ/min)
f f j j j l MOST PALATABLE SOLUTION
f = = j STANDARD SOLUTION
UNPALATABLE SOLUTION
4-
0.64-
1 2 time after meal ingestion (h)
Figure 2. Sucrose-induced thermogenesis (mean + sem) in subjects after ingestion of sucrose solutions of different palatability.
-207-

Table 5. Resting metabolic rate and respiratory quotients in subjects before and after kinin ingestion.
Kinin solution Kinin capsule T n = 8 n = 8
before after before after
Resting metabolic rate (kJ/min) 4.23 ± 0.36 4.32 ± 0.36 4.05 ± 0.35 4.17 + 0.32 Respiratory quotient 0.81 + 0.01 0.79 ± 0.02 0.85 + 0.03 0.81 ± 0.02t
Results are expressed as mean + sem * Kinin was given in a dosis of 0.22 g (10% ethanol solution v/v)
in 350 ml water T Kinin was given in gelatin capsule in a dosis of 0.22 g (10% ethanol
solution v/v) + Significant difference at p < 0.01 between 'before' and 'after'
Table 5 gives the results of the impact of kinin, either in solution or in
capsule on resting metabolic rate and respiratory quotient. On average,
resting metabolic was not significantly affected by kinin ingestion. There
was, however, a small increase in resting metabolic rate of on average 2.3
percent. Respiratory quotients declined significantly after kinin ingestion,
in particular after ingestion of the kinin capsule with water.
DISCUSSION
This study did not show a significant impact of palatability on diet-induced
thermogenesis. The thermic effect of sucrose was, albeit not significantly,
slightly increased following ingestion of a palatable sucrose solution when
compared to an unpalatable sucrose drink. Postprandial respiratory quotients
and substrate oxidation rates were very similar following ingestion of either
a palatable or unpalatable meal or sucrose solution. A surprising difference
was found between men and women in diet-induced thermogenesis. Men had a
significantly higher rise in postprandial energy expenditure than women did,
in particular following ingestion of the palatable meal and the unpalatable
sucrose solution.
Our findings with respect to the effect of palatablity on dietary
thermogenesis are in contrast with observations of LeBlanc et al. (9). The
experimental design used in this study differs considerably from the one
employed by LeBlanc et al. (9). LeBlanc et al. (9) prepared the unpalatable
-208-

meal by mixing together in a blender all the ingredients served in the
palatable meal and presenting it to the subjects in the form of a desiccated
biscuit. The palatable meal was composed of a parmesan fondue, spaghetti with
meat balls, a chocolate eclair and a bottle of soft drink. Although no
quantitative data on the mass of both meals are given in LeBlanc et al.'s
report, it seems likely that the unpalatable meal had a much lower weight than
the palatable meal. This may seriously affect the interpretation of their
results. Recently, Blondheim and Hirt (11) reported that diet-induced
thermogenesis was considerably smaller after an isocaloric meal of small mass
than after a meal of a larger size. Over a period of 75 minutes the difference
between these meals in rise in oxygen consumption after ingestion of the meal
was on average about 8.4 percent. This figure is very similar to the
difference between the palatable and unpalatable meal in postprandial oxygen
consumption, ie, 8 percent, LeBlanc et al. report. It is not clear, therefore,
whether the difference in diet-induced thermogenesis between meals of varying
palatablity LeBlanc et al. found, has to be ascribed to the impact of
palatability per se, or to the difference in mass between these meals.
In this study meals identical in caloric content, nutrient composition, water
content and mass, but different in palatability were investigated on their
differential effect on diet-induced thermogenesis. Palatability of the test
meals was varied with kinin and a coloring agent. Sensory ratings, obtained in
5-6 hours postabsorptive subjects, showed that these meals were significantly
different in pleasantness. For each meal type, postprandial measurements were
carried out in duplicate for a period of 2.5 hours. Total and hourly
integrated values for diet-induced thermogenesis were not significantly
different between the two meal types. Since an effect of kinin on energy
expenditure could not be excluded, a control experiment was performed for
assessing the impact of kinin on energy expenditure. Kinin ingestion was
associated with a slight but non-significant increase in resting metabolic
rate. This increase was not mediated by sensory stimulation since kinin
encapsulated caused a similar increase in energy expenditure as kinin in
solution. When the observed integrated diet-induced thermogenesis is corrected
for the slight effect of kinin on baseline energy expenditure, the resulting
average value of 163 kJ is very similar to the thermic effect observed after
ingestion of the palatable test meal, ie, 166 kJ. The results clearly refute
-209-

the hypothesis that palatability significantly affects diet-induced
thermogenesis.
It was expected that after ingestion of a palatable meal the sympathetic
nervous system activity would be more stimulated than after ingestion of a
revolting meal. A palatable meal was also expected to induce a significantly
higher cephalic insulin response, and, hence, a total insulin response in
comparison to an unpalatable meal (10,12-14). Both effects could increase
postprandial thermogenesis. Firstly, through stimulation of facultative
thermogenic mechanisms, and, secondly, by stimulation of postprandial glucose
metabolism, ie, oxidation and storage. Our results suggest that these
processes were not sufficiently stimulated by ingestion of the palatable meal,
or, alternatively, suppressed by the unpalatable meal, to have a major impact
on the overall rate of energy expenditure. In addition, it is possible that
ingestion of a revolting meal may provoke a stress reaction, which, in its
turn, could increase the turnover of catecholamines and the rate of energy
expenditure. Consequently, a masking of a difference in diet-induced
thermogenesis between meals of differing palatability would occur. More
research is necessary to investigate these possibilities.
In agreement with the findings on diet-induced thermogenesis, sucrose-induced
thermogenesis was not significantly affected by palatability either. There was
a trend toward a lower thermic effect of sucrose following ingestion of the
unpalatable sucrose solution compared to the more palatable solutions. The
total thermic effect of sucose was low, ie, about 4 percent of the ingested
caloric load. This is probably related to the relatively low energy content of
the test drinks, ie, of less than 1 MJ (about 55 g of sucrose). In most
subjects the thermogenic response was completed after 2 hours. The response we
found of about 40 kJ is in accordance with data given by Welle et al. (20).
The observed thermic effect is in good agreement with the energy expended in
the postprandial oxidation and storage of the sucrose (21 ). At the end of the
experiment about half of the ingested dose was oxydized at the expense of
about 10 kJ and the other half was stored, predominantly as glycogen, at an
energy cost of about 30 kJ. When the integrated sucrose-induced thermogenesis
is corrected for the impact of kinin on energy expenditure the thermic effect
is reduced to about 20 kJ. This value is lower than the thermic effect
calculated on the basis of the energy costs of the postprandial processing of
sucrose. This may be indicative of a diminution of the thermogenic response to
sucrose when sucrose is given as an unpalatable solution. A replication of the
-210-

experiment with sucrose solutions of higher energy content is necessary to
test this hypothesis.
There was a clear effect of gender on the rise in postprandial energy
expenditure. To our knowledge this effect has not been described before. Owen
et al (22) report differences between men and women in postprandial
metabolism, but give no data on energy expenditure. The difference between the
sexes in rise in postprandial energy expenditure following meal ingestion was
present only during the first two hours of the postprandial period. During
this period, in particular during the first hour of the postprandial period,
men had significantly higher respiratory quotients than women did. The
mechanism underlying the difference in diet-induced thermogenesis between men
and women is not clear. Various factors may be involved. A higher rate of
digestion and absorption of the ingested nutrients may result in a greater
flux of nutrients from the gastrointestinal tract into the bloodstream per
unit of time in men when compared to women. The relatively large availability
of nutrients may exceed the capacity for immediate oxidation causing nutrients
to be directed into 'energetically wasteful' (21) storage processes. In this
respect, the postprandial processing of glucose is interesting. The
respiratory quotient indicates that the rate of glucose digestion and
absorption was higher in men than in women, in particular in the first hour of
the postprandial period. Most of the absorbed glucose will be oxydized or
stored in the body as muscle- or hepatic-glycogen. It is well known that men,
at similar body weights, have a larger muscle mass than women. Hence, men have
a larger storage capacity for glucose than women. The relatively larger
storage capacity for glucose combined with a relatively greater influx of
nutrients from the gastrointestinal tract into the circulation may cause the
rise in postprandial energy expenditure to be relatively enhanced in men in
comparison to women. In addition, it is possible that in men stimulation by
food ingestion of facultative thermogenic mechanisms is relatively larger than
in women.
In conclusion we can state that in this study no significant impact of
palatabllty on meal-or sucrose-induced thermogenesis was found. However, the
thermic effect of sucrose was slightly reduced following ingestion of an
unpalatable sucrose solution. Men had on average a greater rise in
postprandial energy expenditure compared to women as well as after ingestion
of mixed meal as after ingestion of an unpalatable sucrose solution.
-211-

ACKNOWLEDGEMENTS
The authors want to thank the subjects for their willing cooperation and for
their courage to consume rather large quantitities of revolting test meals or
sucrose solutions.
REFERENCES
1. Jéquier E. Thermogenesis induced by nutrient administration in man. Infusionstherapie 1984;11:184-8
2. D'Alessio DA, Kavle EC, Mozzoli MA, Smalley KJ, Polansky M, Kendrick ZV, Owen LR, Bushman MG, Boden G, Owen OE. Thermic effect of food in lean and obese men. J Clin Invest 1988;81:1781-9.
3. Danforth E. Diet and obesity. Am J Clin Nutr 1985;41:1132-45. 4. Kaplan ML, Leveille GA. Calorigenic responses in obese and non-obese
women. Am J Clin Nutr 1976;29:1108-13. 5. Sims EAH, Danforth E. Expenditure and storage of energy in man. J Clin
Invest 1987;79:1019-25. 6. Segal KR, Gutin B, Nyman AM, Pi-Sunyer FX. Thermic effect of food at rest,
during exercise, and after exercise in lean and obese men of similar body weight. J Clin Invest 1985;76:1107-12.
7. Hill JC, Heymsfield SB, McMannus C. Meal size and thermic response to food in male subjects as a function of maximum aerobic capacity Metabolism 1984;33:743-9.
8. Welle S, Lilavivat U, Campbell RG. Thermic effect of feeding in man: increased plasma norepinephrine levels following glucose but not protein or fat consumption. Metabolism 1981;30:953-8.
9. LeBlanc J, Brondel L. Role of palatability on meal-induced thermogenesis in human subjects. Am J Physiol 1985;248:E333-6.
10. Powley TL, Berthoud HR. Diet and cephalic phase insulin responses. Am J Clin Nutr 1985;42:991-1002.
11. Blondheim SH, Hirt R. Relationship between dietary thermogenesis and bulk of meal. Isr J Med Sei 1982;18:969-71.
12. Louis-Sylvestre J. Relationship between two stages of prandial insulin release in rats. Am J Physiol 1978;235:E103-11.
13. Bellisle F, Louis-Sylvestre J, Demozay F, Blazy D, Le Magnen J. Cephalic phase of insulin secretion and food stimulation in humans: a new perspective. Am J Physiol 1985;249:E639-45.
14. Bruce DG, Storlien LH, Furier SM, Chisholm DJ. Cephalic phase metabolic responses in normal weight adults. Metabolism 1987;36:721-5.
15. Calles-Escandon J, Robbins DC. Loss of early phase of insulin release in humans impairs glucose tolerance and blunts thermic effect of glucose. Diabetes 1987;36:1167-72.
16. Weststrate JA, Weys PJM, Poortvliet EJ, Deurenberg P, Hautvast JGAJ. Diurnal variation in postabsorptive resting metabolic rate and diet-induced thermogenesis. Am J Clin Nutr 1989:in press.
17. Weststrate JA, Dekker J, Stoel M, Begheijn L, Deurenberg P, Hautvast JGAJ. Resting energy expenditure in women: impact of obesity and body fat distribution. Metabolism 1989:in press.
18. Jéquier E, Acheson K, Schutz Y. Assessment of energy expenditure and fuel utilization in man. Ann Rev Nutr 1987;7:187-208.
-212-

19. Siri WE. The gross composition of the body. Adv Biol Med Phys 1956;4:239-80.
20. Welle SL, Campbell RG. Normal thermic effect of glucose in obese women. Am J Clin Nutr 1983;37:87-92.
21. Flatt JP. Biochemistry of energy expenditure in: Bray G. ed. Recent advances in obesity research: II. London: John Libbey, 1978:211-28.
22. Owen OE, Mozzoli MA, Patel MS, Boden G, Reichard GA, Trapp V, Shuman CR, Feiig P. Substrate, hormone, and temperature responses in males and females to a common breakfast. Metabolism 1980;29:511-23.
-213-

Chapter 11. Unexpected interaction between the effects of short-term carbohydrate overfeeding and prior exercise on resting metabolic rate and diet-induced thermogenesis
JAN A WESTSTRATE MSC, JOSEPH GAJ HAUTVAST MD
ABSTRACT
In 10 young normal weight subjects, 5 men and 5 women, the effects were
investigated of carbohydrate overfeeding and prior exercise on resting
metabolic rate (RMR) and diet-induced thermogenesis (DIT). Subjects were kept
on controlled diets in a cross-over design for two periods of 8 days, with a
one-week interval in between. During the last 4 days of each period subjects
received additional carbohydrates on top of their diet. The carbohydrate
overfeeding started at 15 percent in excess of the estimated energy
requirements on day 1 increasing to 60 percent on day 4. At the beginning and
at the end of the 4-days carbohydrate overfeeding periods RMR and DIT were
measured, respectively, for 1 and 3.5 hours using a ventilated hood system. In
one of the 8-days periods, on evenings before the energy expenditure
measurements, subjects performed a maximum work capacity test on a cycle
ergometer. Subsequently, they cycled for a total of about 80 minutes at fixed
percentages (between 30-80%) of their maximum work capacity. RMR and DIT on
control treatment were 4.56 + 0.22 kJ/min and 7.6 + 0.9 percent (of energy
content of test meal (Ein)), respectively. After exercise, RMR and DIT were
5.10 + 0.25 kJ/min and 10.1 + 0.8 percent (Ein), respectively. Prior exercise
on days before the measurements increased RMR and DIT significantly,
respectively, by 11.9 + 2.6 percent and 32.2 + 13.7 percent. RMR after
carbohydrate overfeeding was 4.50 + 0.28 kJ/min; in combination with prior
exercise, RMR was 4.82 + 0.17 kJ/min. DIT was 11.5 + 1.2 percent (Ein) after
carbohydrate overfeeding and 13.2 + 1.4 percent (Ein) after carbohydrate
overfeeding with prior exercise. Carbohydrate overfeeding systematically
reduced the impact of prior exercise on RMR and DIT. Carbohydrate overfeeding
-214-

did not significantly influence RMR, but increased DIT systematically by,
respectively, 50 + 18.6 percent without prior exercise and by 31.1 + 8.7
percent with prior exercise.
It is concluded that prior exercise and an antecedent diet high in
carbohydrates affects RMR and DIT, and that these effects are interactive.
Keywords: indirect calorimetry, carbohydrates, overfeeding, exercise, resting
metabolic rate, diet-induced thermogenesis, dietary trial, human
INTRODUCTION
An important area in research on human energy metabolism pertains to the
quantitation of the response of energy expenditure to thermogenic stimuli, in
particular, to food. It is now generally assumed, that in the average
sedentary individual, food intake contributes about 10 percent to total energy
expenditure (1,2). However, the nature and determinants of inter-individual
differences in the proportion of daily energy output depending on food intake
remain to be definitely assessed (1,2).
The thermic effect of food, also referred to as diet-induced thermogenesis
(DIT), is primarily a function of the amount of energy and type of nutrients
ingested (3,4). In addition, the antecedent diet may affect DIT as well (5).
Recently, it was shown that a diet high in carbohydrates increased DIT (5). It
was suggested that in this respect the state of the body's glycogen stores
would be of pivotal importance. On a high carbohydrate diet the amount of
glycogen stored in liver and skeletal muscles increases (6-8). In this state a
relatively larger part of ingested carbohydrates would be converted into fat,
resulting in a less efficient energy utilization compared to storage of the
ingested carbohydrates as glycogen. Thus, the energy expended when a given
amount of glucose is transformed to lipid and is subsequently oxydized is
substantially greater than if the glucose is converted into glycogen before
being oxidized (9).
In addition to diet, physical activity can have a particular strong impact on
the state of the body's glycogen stores (6,7). Prolonged high intensity
exercise is well known to deplete liver and muscle- glycogen (6,7).
Whether prior glycogen-depleting exercise affects DIT is unclear. Since
prolonged exercise reduces the body's glycogen stores, it might be
hypothesized that DIT would be reduced. Alternatively, DIT might be increased,
-215-

since sustained heavy exercise may induce an excess postexercise oxygen
consumption of relatively high magnitude and duration (10-12).
In the present study the state of the body's glycogen stores was modulated by
short-term (4-days) carbohydrate overfeeding or by prolonged prior heavy
exercise bouts. The purpose of the study was to assess the effects of these
two treatments, and their interaction, on postabsorptive - and postprandial
resting energy expenditure and substrate oxidation rates.
SUBJECTS AND METHODS
SUBJECTS
Subjects were recruited for participation in the experiment by posters placed
in University buildings and student dormitories.
After applying for participation, subjects received a letter with detailed
information on the nature, purpose and possible inconveniences of the
experiment. They also received a questionnaire for obtaining information on
past and present health status, sporting activities, smoking habits, habitual
use of alcoholic beverages, food aversions and allergies, and, for women only,
use of oral contraceptives. The medical part of the questionnaire was
evaluated by a physician (JGAJH). Subjects were selected for participation
when they were non-obese (body fat percentage below 25 percent in men and
below 35 percent in women), apparently healthy (no past or present evidence of
diabetes mellitus and thyroid disorders), non-smokers, consumed less than 20
alcoholic beverages/Week and when they had moderate sporting activities
(between 1 and 7 hours/week). A total of 10 subjects, 5 men and 5 women, were
selected for participation. These subjects were not on a diet, had had no
major, ie, greater than 2.5 kg, body weight fluctuations within a period of 6
months prior to the beginning of the study and were not using any drugs. Two
women used oral contraceptives. Before the start of the study subjects gave
their written informed consent to participate. The protocol of the study was
submitted to and approved of by the Medical-Ethical Committee of the
Wageningen Agricultural University.
-216-

METHODS
Experimental design
The study used a crossover design and consisted of two periods of 8 days with
a one week interval between both periods to prevent carry-over effects (13).
The total study lasted 24 days. During both periods of 8 days subjects were on
controlled experimental diets. In the week between the experimental periods
subjects consumed their habitual diets. At fixed time intervals during the
study, ie, on the morning of day 5, day 9, day 20 and day 24, energy
expenditure was measured in subjects in the fasting and postprandial state.
Between day 1 and day 5, and between day 16 and 20 subjects were kept on a
normal mixed weight maintenance diet. Between day 5 and day 9, and between day
20 and day 24 subjects received additional carbohydrates in their diet.
Carbohydrate overfeeding was started at 15 percent of the energy intake during
the weight maintenance period. Carbohydrates were added cumulatively to the
diet, starting with 15 percent on the first day and increasing to 60 percent
on the fourth day. Half of the subjects, randomly chosen, had exercise bouts
on two evenings before the energy expenditure measurements in the first period
of the experiment. The other half of the subjects performed the exercise bouts
in the second period. On the evening (between 19.30 and 22.30 hours) of day 4
and day 8, in the first or second period subjects performed a maximum work
capacity test on a cycle ergometer. After the determination of the maximum
work capacity test subjects cycled at fixed percentages of their maximum work
capacity for a maximum of two periods of 45 minutes with a fifteen minutes
resting period in between.
Experimental diets and carbohydrate overfeeding
Before the subjects started in the study their energy requirements were
estimated. Energy requirements were estimated on the basis of a duplicate
resting metabolic rate (RMR) measurement. Overnight fasting subjects were
taken in the morning by car to the laboratory for a measurement of their RMR.
RMR was assessed with a ventilated hood system as previously described (14).
After the RMR measurement, subjects received a small breakfast tailored to
their individual energy needs but not exceeding 2.0 MJ. Subjects either stayed
at the laboratory or were brought home by car. On the same day in the
afternoon the RMR was measured again, now with the subjects in a 4.5 hours
-217-

postabsorptive state. No systematic diurnal variation in RMR occurred.
Therefore, the mean of the two RMR measurements was taken as the most precise
estimator of a subject's RMR. It was then assumed, that in subjects with 1-3
hours/week sporting activities the RMR represented 70 percent of the total
daily energy expenditure, ie, requirements. In subjects with 3-5 hours/week
sporting activities, the RMR was taken to represent 67 percent of the total
daily energy output and for subjects with 5-7 hours/week the RMR was taken as
64 percent of the daily energy output.
It is generally assumed that the RMR represents on average between 60 and 75
percent of total daily energy output (1,2). This assumption has been
corroborated by several respiration chamber studies and studies using the
doubly labelled water method in free-living individuals (15,16). Subsequently,
energy requirements were calculated for each individual. Energy was provided
in the diet in 0.5 MJ/d modules, starting with a basal diet of 7.0 MJ/d. For
each indivual the experimental diets were weighed out according to the
estimated energy requirements. The experimental diets consisted of normal food
stuffs and provided breakfast, lunch and dinner as well as snacks and drinks.
Subjects were instructed to consume each day only the food items that they
were provided with. Subjects were also allowed to have one free alcoholic
consumption each day or one glass of orange juice. Coffee, tea (both without
sugar and milk) and mineral water or water could be consumed ad libitum. Sugar
use in tea or coffee was compensated for by reducing the amount of sugar used
in other foodstuffs. Subjects kept a daily record of all food items and drinks
consumed in excess of the food and drinks they received. Sporting activities,
intercurrent illnesses and menstruation dates were also recorded in this
notebook.
A 4-days rotating menu was given to the subjects to have a balanced number of
consumptions of each daily menu over the entire experimental period. For
practical reasons it was not possible to provide the subjects with an 8-days
rotating menu, a 2-days rotating menu was considered to be too monotonous for
the subjects and to cause problems with dietary compliance. The diets were
prepared by a trained dietitian and nutritionist and consisted of on average
14 percent protein, 35 percent fat (11 percent saturated fats, 12 percent
mono-unsaturated fat, 12 percent poly-unsaturated fat), 51 percent
carbohydrates (28'percent mono - and disaccharides, 23 percent
polysaccharides), 5 mg/MJ cholesterol and 5 g/MJ dietary fiber. Energy and
nutrient intake were calculated using the 1985 edition of the Dutch
computerized food table (17). Subjects consumed their food at home, hot meals
-218-

were provided as take-away deepfrozen meals.
Energy intake was adjusted according to the subject's wishes in the beginning
of the study when subjects had problems eating all the food, when they
experienced chronic hunger feelings or when weight changed with more than 0.5
kg during the first four days of the experiment. Seventy percent of the
carbohydrate overfeeding was performed with normal food stuffs (fruit juice,
raisins, apple-sauce, marsh-mallows, English licorice), predominantly
containing mono- and disaccharides. Thirthy percent of the carbohydrate load
was given as a commercially available maltodextrins supplement (Fantomalt,
Nutricia, Zoetermeer, The Netherlands).
Duplicate portions were taken of three complete 4-days menus, respectively,
for a hypothetical subject with an energy intake of 8-8.5 MJ/d, 8.5-9 MJ/d or
of 9-9.5 MJ/d. The duplicate portions were stored at -20 C before analysis of
energy and nutrient content. The duplicate portions of each 4-days menu were
mixed thoroughly and then freezedried. The ash content and moisture level were
determined (18) and then the material was stored at -20 C. Aliquots were
analyzed for protein (19), total fat (20), the proportion of individual fatty
acids after saponification and methylation (21), dietary fiber (22) and
cholesterol (23). Mono-, di- and polysaccharides were enzymatically determined
(24). The mean composition of the diets was calculated from the duplicate
portion analysis. No chemical analysis was performed of the foodstuffs used
for the carbohydrate overfeeding treatment. The mean composition of the diets
during the carbohydrate overfeeding periods was calculated from the duplicate
portion analyses plus the calculated contribution of the extra carbohydrates
from foodtables.
Maximum work capacity and exercise tests
On two occasions during the experiment subjects were requested to perform a
maximum work capacity test on a cycle ergometer and, subsequently, to cycle
for a maximum of 90 minutes at three fixed percentages of the maximum work
capacity. Half of the subjects, randomly chosen, had their exercise and work
capacity test on the evening of day 4 and day 8, ie, on the evening before the
energy exchange measurements. The other half on the evening of day 19 and day
23. Subjects came to the laboratory at least 2 hours after their last meal.
Subjects then performed a maximum work capacity test on a cycle ergometer. The
first fifteen minutes period of each test was used for a warming-up. During
this period women cycled equal periods of time at 100, 125 and 150 W. Men
-219-

followed the same procedure but at work loads of 150, 175 or 200 and 200 or
250 W, depending on estimated physical fitness. After this period the work
load was gradually increased every three minutes with either 10 or 25 W steps
until exhaustion occurred. The complete test was always finished within 25
minutes. After the assessment of the maximum work capacity subjects had a
fifteen minutes rest period during which they could drink water or tea, or on
the second occasion only, could eat some of their extra carbohydrates. After
this rest period, subjects had to cycle for 45 minutes, for equal periods of
time at a more or less fixed percentage of their maximum work capacity,
starting with 70-80 percent, followed by 50-60 percent and finally by 30-40
percent. Some subjects could not sustain cycling at 80 percent for the entire
period of 15 minutes. For these individuals the highest work load was slighlty
decreased, but never below 70 percent. After the first cycling period of 45
minutes subjects could rest for 15 minutes during which water or tea were
drunk. Subjects then started a second period of 45 minutes (or less if
exhaustion occurred prematurely) cycling according to the same protocol used
in the first period. The protocol followed on the first cycling evening was
repeated on the second evening. After the exercise tests (between 22.00 and
22.30 hours) the exhausted subjects received 4 (women) or 8 (men) g of glucose
before they went home (by bike mostly). They were instructed to fast until the
next morning, not to smoke and to drink water only.
Energy exchange measurements and calculations
Energy expenditure was measured with a ventilated hood system on mornings.
Subjects reclined in a supine position in a hospital bed. Details of the
measurement procedure and conditions have been published before (14).
Movements of the subjects were registered by means of a load cell (TKA-200A,
Tokyo Sokki Kenkyujo, Tokyo, Japan) placed under one of the legs of the
hospital bed. Once every hour during calibration of the oxygen analyzer with
fresh dried outside air, the subjects were allowed to move briefly for 2-3
minutes.
Resting metabolic rate (RMR) or premeal baseline energy expenditure, was
continuously measured in overnight fasting individuals for at least 60
minutes. After the RMR measurements subjects received a liquid yogurt-based
test meal, containing on average 1.34 MJ (13 percent protein, 34 percent fat,
53 percent carbohydrates). The liquid test meal was given through a straw
which was passed into the ventilated hood. The meal was eaten within 5
-220-

minutes. After ingestion of the test meal postprandial energy expenditure was
measured continuously for 210 minutes. After the gas exchange measurements
urine was collected for determining urea-nitrogen excretion. Energy
expenditure was calculated according to Jéquier et al. (25). Diet-induced
thermogenesis was calculated as the increase in postprandial energy
expenditure above the premeal baseline energy expenditure (RMR) after
ingestion of the test food. Substrate oxidation rates and postprandial
nutrient balances were calculated using the nonprotein respiratory quotient
and Lusk's equations (26). Net lipogenesis was quantitated as previously
described (14).
Body composition
Body fat content was estimated from total body density as previously described
(14).
Statistics
Analysis of variance was used to evaluate the effects of the exercise
treatment and the carbohydrate overloading on the RMR and the thermic effect
of food (27). In addition, pairwise comparisons were performed between
different treatments. Pairwise comparisons were statistically evaluated using
the within-person t-test with a two-tailed region of rejection at a confidence
level of 95 percent. Data are given as mean values + sem.
RESULTS
Table 1 shows some characteristics of the subjects at entry of the study. All
subjects had a body fat content within a normal range.
Morning RMR's did not differ significantly from afternoon RMR's. Energy
requirements estimated on the basis of the RMR measurements were on average
close to energy requirements, observed during the control period. Two
subjects, no 2 and 6, experienced problems eating all their food. For these
subjects energy intake was slightly reduced on the fourth day of the study
with 0.5 MJ/d. In one subject, no 5, energy requirements were underestimated
with about 20 percent. This subject's energy intake was increased on the third
day of the experiment with 1.0 MJ/d and on the fifth day with another 1.0
-221-

MJ/d. In this subject the first energy expenditure measurements were made on
the morning of day 8.
Table 1: Some characteristics of subjects at the beginning of the study.
Subject
Ho
1
2
3
4
5
6
7
8
9
10
Msan +
Sex
ryr
M
M
M
F
M
M
F
F
F
F
sem
Age
Years
29
22
22
24
23
22
20
22
24
22
23 + 0.8
Height
Kg
66.1
65.5
83.6
62.1
69.0
81.4
51.8
53.1
55.0
54.1
64.2+3.6
Fat
%
14.5
20.1
17.5
14.6
8.8
13.8
18.6
20.0
20.8
25.1
17.4+1.5
Stort
Hrs/W
1 -
1 -
3 -
4 -
6 -
5 -
1 -
1 -
3 -
1 -
2
2
4
5
7
6
2
2
4
2
H «
noming
kj/min
4.33
4.68
5.14
4.43
4.93
6.22
3.97
3.39
4.21
4.02
4.53+0.25
FNR
Afternoon
kJ/inin
4.48
4.68
5.31
4.40
4.35
6.05
4.25
3.43
4.17
4.06
4.52+0.23
BMR
Msan
kj/min
4.41
4.68
5.22
4.42
4.64
6.14
4.11
3.41
4.19
4.05
4.53+0.23
Estimated
9.0
9.5
11.0
9.0
10.0
13.5
8.0
7.0
9.0
8.0
Energy requirement
H/J/d
- 9.5
- 10.0
- 11.5
- 9.5
- 10.5
- 14.0
- 8.5
- 7.5
- 9.5
- 8.5
HR = resting •etatxriic rate
Table 2: Mean daily energy and macronutrient intake in subjects before and during periods of carbohydrate overfeeding.
Energy Protein Fat Carbohydrates MJ/d g/d g/d g/d
Before CHO overfeeding: day 1 - 4 / 1 - 19 During CHO overfeeding: day 5/20
6/21 7/22 8/23
9.9 + 0.6
11.4 + 0.7 12.9 + 0.8 14.4 + 0.8 15.9 + 1.0
85 + 5
85 + 5 85 + 5 85 + 5 8 5 + 5
93 + 6
93 + 6 93 + 6 93 + 6 93 + 6
293 + 17
382 + 23 470 + 28 559 + 33 652 + 38
Values are given as mean + sem CHO: carbohydrate
Body weight did not show marked changes during the course of the experiment.
Body weights were, respectively, 64.2 + 3.6 kg (control), 64.5 + 3.6 kg
(carbohydrate), 63.8 + 3.5 kg (exercise) and 64.2 + 3.6 kg
-222-

(carbohydrate/exercise).
Table 2 gives energy and macronutrient intake before and during the
carbohydrate overloading periods.
Mean energy intake was 9.9 + 0.6 MJ/d (14.6 percent protein, 34.9 percent fat
and 50.5 percent carbohydrates) during the four days before the carbohydrate
suppletion. Energy intake increased during the carbohydrate overfeeding from a
mean of 11.4 MJ/d (day 1) to 15.9 MJ/d (day 4). Carbohydrate intake increased
during this period from an average of 293 g/d to 652 g/d. On the first day of
the carbohydrate suppletion periods subjects consumed on average 90 g/d (1.5
MJ/d) in excess of their intake of carbohydrates on the first four days of the
treatment period requirements. On the last day of the suppletion periods the
excess carbohydrate intake amounted on average to 359 g/d (6.1 MJ/d). Most
subjects experienced some problems in ingesting such large amounts of
carbohydrates on top of their daily diet.
Table 3: Maximum work capacity, average work load and exercise duration during a cycle ergometer test in subjects before and at the end of a carbohydrate overloading period.
Subject
No
1
2
3
4
5
e 7
8
9
10
Sex
M/F
M
M
M
F
M
M
F
F
r F
Maan ± sem
Maxinun work
Start d e
W
270
225
290
220
240
315
200
205
200
185
235 + 13.7
capacity
End O C
W
270
225
280
220
245
330
200
205
210
190
238 + 13.9
Average
Start CHD
W
140
130
170
130
149
170
120
135
125
110
137.9 ± 6.3
work load
End a c
W
140
135
190
130
150
240
120
138
130
120
149.3 ± 11.9
Average exercise
Start a n
Min
65
65
90
90
68
90
90
80
90
75
80.3 ± 3.5
duration
End cm
Min
70
65
90
90
90
90
90
80
90
75
83 ± 3.1
both subjects had additional exercise before cycle t e s t (running). Ulis HBS conpensated for en the second exercise t e s t by
increasing the duration (no 5) or the work load (no 6) of the cycle t e s t
QD = f irwwywut*
Table 3 shows maximum work capacity, average work load and exercise duration
obtained on two cycle ergometer tests, one at the start of the carbohydrates
-223-

suppletion period and one at the end of this period. At the start of the
suppletion period subjects cycled on average for 80 minutes at 59 percent of
their maximum work capacity. At the end of the carbohydrate suppletion period
subjects exercised on average for 83 minutes at 63 percent of their maximum
work capacity. On both occasions a maximum work capacity test was performed
prior to the exercise test. During the assessment of the maximum work capacity
the men cycled on average 22 min at 200-205 W and the women cycled 20 min at
140 W. In total, subjects cycled on both exercise tests on average for more
than 100 minutes.
Table 4: Besting metabolic rate and respiratory quotients in postabsorptive
subjects at different periods in the study.
Subject
Ito
1
2
3
4
5
6
7
8
9
10
Sex
M/F
M
M
M
F
M
M
F
F
F
F
HBan ± son
Control
FMR
kJ/hrin
3.97
5.33
5.39
4.35
5.01
5.46
4.58
3.75
3.61
4.16
4.56 + 0.2
R3
0.85
0.83
0.85
0.84
0.80
0.81
0.83
0.83
0.86
0.83
0.83 + 0.01
FMR
kj/hiiii
3.75
4.94
5.04
4.89
5.90
5.37
4.18
3.05
3.46
4.42
4.50 + 0.28
Ou
0
SQ
0.90
0.92
0.81
0.91
0.90
0.89
0.99
0.93
0.95
0.94
91 ± 0.01
Exercise
RMR
kj/tnin
4.17
5.60
5.85
5.16
5.06
6.40
5.65
4.01
4.65
4.45
5.10 ± 0.25
R3
0.83
0.79
0.77
0.79
0.74
0.77
0.77
0.79
0.75
0.82
0.78 + 0.01
Exercise + a ©
RMR
kj/inin
4.70
4.98
5.40
4.69
4.71
5.86
4.73
3.75
4.80
4.60
4.82 ± 0.17
BQ
0.85
0.97
0.84
0.86
0.87
0.83
0.89
0.88
0.85
0.87
0.87 + 0.01
IHt = resting •etabolic rate; BQ = respiratory opotients; CHD carbohydrate overloading
Table 4 shows RMR's and RQ's in fasting subjects at different periods in the
study. Prior exercise on the day before the measurements significantly
increased RMR (p=0.02). No systematic effect of the carbohydrate suppletion on
the RMR was observed. Both treatments had a significant impact on fasting
RQ's. Postabsorptive RQ's were on average 10 percent higher at the end of the
carbohydrate suppletion period compared to the RQ's observed at the start of
the suppletion period. In contrast, RQ's were on average 12 percent lower
after prior exercise compared to the RQ's measured in the non-exercise state.
Not all subjects showed the same relative magnitude in response of RMR to
exercise. Subject no 5 did not respond at all, whereas subject no 6 increased
her RMR 29 percent in response to prior exercise.
-224-

Table 5 gives DIT's and postprandial RQ's in subjects at different periods in
the study. There was a significant effect of carbohydrate overfeeding on DIT.
Carbohydrate suppletion without prior exercise was associated with a mean
increase in DIT of 50 percent. Prior exercise did not systematically affect
DIT. DIT values were only significantly increased by 33 + 14 kJ , ie, 0.16 +
0.07 kJ/min (p=0.035) in response to exercise, when subjects did not receive
extra carbohydrates. DIT values expressed as a percentage of the ingested
energy content were, respectively, 7.6 + 0.9 percent (control), 11.5 + 1.2
percent (carbohydrate), 10.1 + 0.8 percent (exercise) and 13.2 + 1.4 percent
(carbohydrate/exercise). The inter-individual difference in response of the
postprandial rise in energy expenditure to prior exercise or carbohydrate
overloading was considerable. Differences in response were not systematically
associated with the sex of the subject or with the maximum work capacity.
Table 5: Diet-induced thermogenesis and postprandial respiratory quotients in subjects at different periods in the study.
Subject
No
1
2
3
4
5
6
7
8
9
10
M/T
M
M
M
F
M
M
F
F
F
F
Mean + sem
Control
DIT
kJ
63
131
80
94
146
97
139
44
71
156
102 ± 12
BQ
0.90
0.83
0.88
0.90
0.89
0.85
0.85
0.85
0.87
0.92
0.87 ± 0.01
DIT
kJ
174
145
148
151
280
170
119
118
133
94
153 ± 16
ac BQ
0.89
0.96
0.93
0.91
0.93
0.89
0.99
0.97
0.99
0.97
0.94 + 0.01
DIT
kJ
142
188
113
186
130
95
143
127
96
128
Exercise
BQ
0.82
0.77
0.61
0.79
0.76
0.79
0.79
0.80
0.80
0.82
135 ± 10 0.79 ± 0.01
Exercise + O C
DIT
KJ
268
176
103
226
178
219
155
164
77
200
177 ± 18
BQ
0.93
0.96
0.89
0.89
0.86
0.88
0.93
0.85
0.91
0.92
0.90 + 0.01
DÛT = diet-dniioed thenDgaiesis; HQ = re^irstory ^lotient; OD - cmlxiyltate overloar&iig
Prior exercise and carbohydrate suppletion affected postprandial RQ's in a
similar way as they influenced the postabsorptive RQ's. Figure 1 shows the
time course of the postprandial rise in energy expenditure for each of the
four treatments. The highest response was observed in the period between 30
-225-

and 120 minutes of the postprandial period. After 210 minutes the thermic
effect of food was negligible for all treatments, except for the carbohydrate/
exercise treatment.
diet U
induced thermogenesis (kJ/min)
1 2 3 time after meal ingestion (h)
Figure 1. Diet-induced thermogenesis in subjects during control treatment (•), after prior excerise (/S.), after short-term carbohydrate overfeeding (0), after short-term carbohydrate overfeeding plus prior exercise (.A.) •
Table 6 give pre-and postprandial substrate utilization rates at different
periods in the study. Protein oxidation rates were significantly reduced by
carbohydrate overfeeding. Also fat oxidation rates, both pre- and
postprandially, were systematically decreased by carbohydrate suppletion.
Glucose oxidation rates were significantly increased after carbohydrate
overloading. Exercise impacted significantly on pre-and postprandial glucose
and fat oxidation rates. Postprandial glucose and fat balances were
significantly affected by both exercise and carbohydrate overfeeding.
Postprandial fat balances were, respectively, 5.2 + 1.0 g (control), 9.9 + 1.1
g (carbohydrate), -4.5 + 1.2 g (exercise) and 6.4 + 0.9 g
(carbohydrate/exercise). Postprandial glucose balances were, respectively, for
the different treatments, 8.2 ± 2.1 g, -8.0 + 3.1 g, 22.9 + 1.6 g and -4.8 ±
3.6 g.
-226-

Table 6. Pre- and postprandial substrate utilization rates in subjects at different periods in study.
Protein
Fat
Glucose
Lipogenesis
(mg/inin)
(mg/hon)
(mg/hiin)
(mg/tnin)
1
46 + 4
49 + 4
100 + 6
0
Preprandial
Period
2
37 + 3
22 ± 6
165 ± 12
0
in study
3
51 ± 4
79 ± 6
58 + 7
0
4
45 + 4
37 + 4
14 3 ± 11
0
1
46 + 4
37 + 4
169 + 11
1.1 ± 0.9
Postprandial
Period
2
37 + 3
13 ± 5
237 ± 15
6.2 ± 18
in study
3
51 + 4
84 + 6
93 + 8
0
4
45 + 4
30 ± 4
223 + 16
2.8 + 0.8
Results a ie given as seen + sea
Patiod 1 = control
2 = caifachythate overloading
3 = exercise
4 = caxbohydrste overloading + exercise
DISCUSSION
In recent years there has been considerable interest in defining the
determinants of an individual's resting metabolic rate (RMR) and thermic
response to food, ie, diet-induced thermogenesis (DIT) (3,4,28-31). The RMR of
a subject is primarily depended on the size of his or her fat-free body mass
(28-31). The thermic effect of food is largely depended on the amount of
energy and type of macronutrients ingested (3,4). In addition, to assessing
the size and nature of inter-individual variation in RMR and DIT, it is
important to investigate within-person responses of RMR and DIT to various
stimuli. Such studies may give information on the biological capacity in
humans of modifying energy use through metabolic processes in response to
changing environmental factors.
In this study we investigated the impact on RMR and DIT of an antecedent
hyper-energetic diet high in carbohydrates and of prolonged intense prior
exercise bouts. The present study also confirmes a previous study of this
laboratory on the absence of significant diurnal variation in RMR (14).
Exercise and carbohydrate overfeeding were chosen for studying their impact on
RMR and DIT, since they are known to have large effects on the state of the
body's glycogen stores (6-8). The state of the body's glycogen stores seems of
pivotal importance in determining the metabolic routing of ingested
carbohydrates (5,32,33). Thus, with boosted glycogen stores ingested glucose
will, in addition to immediate oxidation, be stored as lipid rather than as
-227-

glycogen (5,32,33). In contrast, in a glycogen-deprived state ingested glucose
will be stored rather as glycogen than as fat (5,32,33). Storage of ingested
glucose as glycogen or as fat involves a higher ATP use than direct oxidation
of the absorbed glucose (9). This implicates that a metabolic state favoring
storage of dietary carbohydrates either as glycogen or as fat prior to
oxidation will increase the thermic effect of food, compared to a metabolic
state where most of the ingested carbohydrates are oxydized without prior
storage.
The results of the present study show an increased DIT in response to
carbohydrate overloading either with or without prior exercise. We also found
that prior exercise increased DIT. The systematic effect of prior exercise on
DIT was, however, lacking during the carbohydrate overloading. Furthermore,
prior exercise did increase the RMR, but, again, the effect of exercise on RMR
was modulated by carbohydrate overloading. Both carbohydrate overloading and
prior exercise had significant effects on postabsorptive and postprandial
substrate utilization rates. Exercise increased fat oxidation rates and
reduced glucose oxidation, whereas the opposite effect was observed for the
carbohydrates overloading, confirming the findings of previous studies
(5,10-12,32,33).
The effect of prior exercise on RMR has been observed in other studies
(10-12,33-35) as well. Generally this phenomenon is designated excess
postexercise oxygen consumption (EPOC) (36). Several studies have, however,
not observed a significant after-effect on RMR of prior exercise (37-39). The
reasons for these discrepant findings are not clear. Generally, there is
considerable variation among the studies in the type, the intensity and
duration of the applied exercise tests. In addition, in some studies no strict
control over the antecedent diet was performed (33-35,38). It is likely that
only prolonged intense glycogen-depleting exercise affects the body's energy
economy sufficiently well to cause an enhanced thermogenesis in the
postexercise period. Furthermore, as this study shows, the effect of exercise
on RMR can be affected by the antecedent diet.
The biochemical basis of the excess postexercise oxygen consumption is not yet
elucidated (36). Probably excess energy is expended in the postexercise period
for replenishing the body's glycogen stores, for example, in converting
glyconeogenic precursors into glycogen. Exercise may also increase various
other energy-demanding processes in the postexercise period such as increased
substrate cycling and sodium pumping (36). The finding that excess
carbohydrates reduced the after-effect of exercise on RMR suggests that a
-228-

relatively large part, ie, about 0.30 kJ/min (5.10 - 4.80 kJ/min) of EPOC
might be related to energy expended for refilling the body's glycogen stores.
The latter process is likely to be diminished after prolonged exercise with
previous carbohydrate overloading compared to prolonged exercise without
previous carbohydrate suppletion.
The effect of prior exercise on DIT has not been studied before. Only one
study assessed the impact of prior exercise on the thermic effect of glucose
(40). In the study of Young et al. (40) it was found that prior exercise
potentiated the thermic effect of glucose by about 65 percent. The effect of
exercise was found to be independent of the state of training of the subjects.
In this study exercise potentiated DIT on average by 33 percent. No
significant relation was found between the response to exercise of DIT and the
maximum work capacity. Part of the potentiation of DIT by prior exercise can
be attributed to the increased energy costs for storing the ingested glucose
as glycogen. Postprandial nutrient balances showed that on the morning after
exercise without previous carbohydrate overloading on average 22.9 g of
glucose were retained in the body, presumably as glycogen. The cost of this
nonoxidative storage of glucose adds up to 20 kJ. This is almost 60 percent of
the total increase in DIT after prior exercise. The remaining part of the
increase should be attributed to stimulation by prior exercise of thermogenic
processes, such as increased sodium pumping and substrate cycling (36).
Similar to the effect of prior exercise on RMR the effect of exercise on DIT
was modulated by carbohydrate overloading. Carbohydrate overfeeding caused an
increase in DIT of on average 50 percent (without prior exercise) and of 31
percent (with prior exercise). These results are in contrast with findings of
Welle et al. (41). However, as pointed out by Welle et al. (41), the
relatively short duration of DIT measurements in their study precludes any
major conclusions on the impact of short-term Carbohydrate overfeeding on DIT.
The result of the present study are concordant with the findings of Acheson et
al. (5). Acheson et al. observed a significant increase in DIT in subjects on
a high carbohydrate compared to the DIT on iso-energetic diets high in fat or
of normal composition. The relative differences among the various diets in DIT
were, respectively, 60 percent (high carbohydrate versus high fat) and 32
percent (high carbohydrate versus mixed diet) in the study of Acheson et al.
These differences agree well with the relative differences in DIT observed
among the various treatments in this study.
The reason for the potentiation of the DIT by the carbohydrate overloading is
not directly clear. Postprandial nutrient balances showed that all the
-229-

ingested carbohydrates were oxydized and that no major net storage occurred.
There was some net lipogenesis, ie, 6 mg/min on the morning without prior
exercise and 3 mg/min on the morning with prior exercise. We calculated that
at the most 5-10 percent of the total thermic response was due to the net
conversion of ingested carbohydrates into lipid. It should be realized,
however, that indirect calorimetry is not a suitable technique for measuring
total lipogenesis (25). Indirect calorimetry gives an estimate of the amount
of lipid synthetized from glucose in excess of the amount of fat concomitantly
oxydized (25). This means that if substantial fat synthesis occurs with
concomitant fat oxidation, the simultaneous occurrence of these two processes
would cause an increase in energy expenditure of about 20-25 percent of the
energy contained in the glucose channeled into lipogenesis. Calculating the
amount of energy expended for the conversion of glucose into net lipogenesis
would, in that case, underestimate the energy costs made for total
lipogenesis. It is not known whether the body would simultaneously synthetize
and oxydize large quantities of fat. When it is assumed that postprandial
glucose oxidation rates in excess of the rate observed at the control
treatment, represent glucose oxydized as lipid, then, the energy costs made
for lipogenesis could easily explain the observed differences in DIT among the
treatments. The amount of glucose oxydized as lipid corresponds to 14.3 g
(control versus carbohydrate) and 11.3 g (exercise versus
carbohydrate/exercise). The energy expended for converting these amounts of
glucose into fat are, respectively, 54 kJ and 42 kJ. This is equal to the
difference in DIT between the control and carbohydrate treatment and to the
difference in DIT between the exercise and carbohydrate/exercise treatment. It
represents, however, only 56 percent of the difference in DIT between the
control and carbohydrate/exercise treatment. This suggests that the
combination of exercise and carbohydrate overloading resulted in a stimulation
of additional thermogenic mechanisms in the postprandial period. Ivy et al.
(42) suggest that a diet high in carbohydrates following exercise causes an
increased insulin response. Insulin has been shown to increase circulating
norepinephrine concentrations, ie, to activate the sympathethic nervous system
activity, independent of changes in blood glucose (43). Both insulin and SNS
activity could affect the rate of influx of sodium into cells and thereby
stimulate the use of ATP to extrude the sodium from cells (44,45).
Catecholamines may also increase the rate of substrate cycling (46) and the
recycling of glucose through 3-carbon compounds (47). That prior exercise can
-230-

potentiate the thermic effect of insulin was recently reported by Devlin and
Horton (39).
In conclusion, the results of the present study show that intense prolonged
prior exercise increases energy expenditure both in the postabsorptive and thé
postprandial phase. Short-term carbohydrate overfeeding enhances the thermic
response to food considerably, but does not increase resting metabolic rate.
Carbohydrate suppletion seems to reduce the excess loss of energy from the
body after exercise. The results indicate that in assessing the thermic
response to food control over prior exercise may be warranted. The results
also underscore the role of the antecedent diet in determining an individual's
thermic response to food.
ACKNOWLEDGMENTS
The authors want to thank the subjects for their enthousiastic participation
in this study. We are also indebted to Mrs Saskia Meyboom for excellent
dietary advice and help in preparing the experimental diets for the subjects.
REFERENCES
1. Danforth E. Diet and obesity. Am J Clin Nutr 1985;41:1132-45. 2. Sims EAH, Danforth E. Expenditure and storage of energy in man. J Clin
Invest 1987;79:1019-25. 3. Jéquier E. Thermogenesis induced by nutrient administration in man.
Infusionstherapie 1984 ;11:184-8. 4. D'Alessio DA, Kavle EC, Mozzoli MA, Smalley KJ, Polansky M, Kendrick ZV,
Owen LR, Bushman MC, Boden G, Owen OE. Thermie effect of food in lean and obese men. J Clin Invest 1988;81:1781-9.
5. Acheson KJ, Schutz Y, Ravussin E, Jéquier E, Flatt JP. Nutritional influences on lipogenesis and thermogenesis after a carbohydrate meal. Am J Physiol 1984;246:E62-70.
6. Bergström J, Hermansen L, Hultman E, Saltin B. Diet, muscle glycogen and physical performance. Acta Physiol Scand 1967;71:140-50.
7. Hultman E, Nilsson LH. Liver glycogen in man. Effect of different diets and muscular exercise. Adv Exp Med Biol 1971;11:143-51.
8. Hultman E, Bergström J. Muscle glycogen synthesis in relation to diet studied in normal subjects. Acta Med Scand 1967;182:109.
9. Flatt JP. Biochemistry of energy expenditure. In: Bray G ed. Recent advances in obesity research: II. London: John Libbey, 1978:211-28.
10. Bielinski R, Schutz Y, Jéquier E. Energy metabolism during the postexercise recovery in man. Am J Clin Nutr 1985;42:69-82.
11. Maehlum S, Grandmontagne M, Newsholme EA, Sejersted OM. Magnitude and duration of excess postexercise oxygen consumption in healthy young males. Metabolism 1986;35:425-9.
-231-

12. Bahr R, Ingues I, Vaage 0, Sejersted 0M, Newsholme EA. Effect of duration of exercise on excess postexcercise 0, consumption. J Appl Physiol 1987;62:485-90.
13. Wilan AR, Pater JL. Carryover and the two-period crossover clinical trial. Biometrics 1986;42:593-9.
14. Weststrate JA, Weys PJM, Poortvliet EJ, Deurenberg P, Hautvast JGAJ. Diurnal variation in postabsorptive resting metabolic rate and diet-induced thermogenesis. Am J Clin Nutr 1989: in press.
15. Ravussin E, Burnand B, Schutz Y, Jéquier E. Twenty-four-hour energy expenditure and resting metabolic rate in obese, moderately obese, and control subjects. Am J Clin Nutr 1982;35:566-73.
16. Prentice AM, Black AE, Coward WA, Davies HL, Goldberg GR, Murgatroyd PR, Ashford J, Sawyer M, Whitehead RG. High levels of.energy expenditure in obese women. Brit Med J 1986;292:983-7.
17. Commissie UCV. UCV tabel, 's Gravenhage: Voorlichtingsbureau voor de Voeding, 1985.
18. Osborne DR, Voogt P. The analysis of nutrients in foods. London: Academic Press, 1978.
19. Williams S. ed. Official methods of analysis of the association of official analytical chemists. 14th ed. Arlington: VA: ADAC Ine, 1984.
20. Folch J, Lees M, Sloane Stanley GH. A simple method for the isolation and purification of total lipids from animal tissues. J Biol Chem 1957;226:497-509.
21. Metcalfe LD, Schmitz AA, Pelka JR. Rapid preparation of fatty acid esters from lipids for gas chromatographic analysis. Anal Chem 1966;38:514-5.
22. Prosky C, Asp NG, Furda J, de Vries JW, Schweizer TF, Harland BF. Determination of total dietary fiber in foods, food products and total diets: interlaboratory study. J Assoc Anal Chem 1984;67:1044-53.
23. Van de Bovenkamp P, Katan MB. Cholesterol content of chicken skin. J Food Sei 1981;46:291.
24. Boehringer. Methods of enzymatic food analysis using test-combinations. Food analysis, Boehringer Mannheim 1983.
25. Jéquier E, Acheson K, Schutz Y. Assessment of energy expenditure and fuel utilization. Ann Rev Nutr 1987;7:187-208.
26. Lusk G. Animal calorimetry. Analysis of the oxidation of mixtures of carbohydrate and fat. J Biol Chem 1924;59:41-2.
27. Winer BJ. Statistical principles in experimental design 2nd ed. New York: McGraw-Hill Book Company, 1971.
28. Ravussin E, Lillioja S, Anderson TE, Christin L, Bogardus C. Determinants of 24-hour energy expenditure in man. Methods and results using a respiratory chamber. J Clin Invest 1986;78:1568-78.
29. Bogardus C, Lillioja S, Ravussin E, Abbott W, Zawadzki JK, Young A, Knowler WC, Jacobowitz R, Moll PP. Familial dependance of the resting metabolic rate. N Engl J Med 1986;315:96-100.
30. Owen OE, Holup JL, D'Alessio DA, Craig ES, Polansky M, Smalley KJ, Kavle EC, Bushmann MC, Owen LR, Mozzoli MA, Kendrick ZV, Boden GH. A reappraisal of the caloric requirements of men. Am J Clin Nutr 1987;46:875-85.
31. Owen OE, Kavle E, Owen RS, Polansky M, Caprio S, Mozzoli MA, Kendrick ZV, Bushmann MC, Boden G. A reappraisal of calorie requirements in healthy women. Am J Clin Nutr 1986;44:1-9.
32. Acheson KJ, Flatt JP, Jéquier E. Glycogen synthesis versus lipogenesis after a 500 gram carbohydrate meal in man. Metabolism 1982;31:1234-40.
33. Acheson KJ, Schutz Y, Bessard T, Anantharaman K, Flatt JP, Jéquier E. Glycogen storage capacity and de novo lipogenesis during massive carbohydrate overfeeding in man. Am J Clin Nutr 1988;48:240-7.
34. Edwards HT, Thorndike A, Dill DB. The energy requirements in strenous muscular exercise. N Engl J Med 1935;213:532-5.
-232-

35. De Vries HA, Gray DA. After effects of exercise upon resting metabolic rate. Res Quart 1962;34:314-21.
36. Passmore R, Johnson RE. Some metabolic changes following prolonged moderate exercise. Metabolism 1960;9:452-5.
37. Gaesser GA, Brooks GA. Metabolic bases of excess post-exercise oxygen consumption: a review. Med Sei Sports Int 1984;16:29-43.
38. Dalloso H, James WPT. Dietary thermogenesis and exercise. Proc Nutr Soc 1981;35A (abstract).
39. Freedman-Akabas S, Colt E, Kissileff HR, Pi-Sunyer FX. Lack of sustained increase in VO- following exercise in fit and unfit subjects. Am J Clin Nutr 1985;41:535-9.
40. Devlin JT, Horton ES. Potentiation of the thermic effect of insulin by exercise: differences between lean, obese and non-insulin dependent diabetic men. Am J Clin Nutr 1986;43:884-90.
41. Young JC, Treadway JC, Balon TO, Garras HP. Ruderman NB. Prior exercise potentiates the thermic effect of a carbohydrate load. Metabolism 1986;35:1048-53.
42. Welle S, Campbell RG. Stimulation of thermogenesis by carbohydrate overfeeding. Evidence against sympathetic nervous system mediation. J Clin Invest 1983;71:916-25.
43. Ivy JC, Sherman WM, Miller W, Farrell S, Frishberg B. Glycogen synthesis: effect of diet and training. In: Knuttgen HG, Vogel JA, Poortsman J. eds, Biochemistry of exercise. Human Kinetics Research 1983;13:291.
44. Felig P. Insulin is the mediator of feeding-related thermogenesis: insulin resistance and/or deficiency results in a thermogenic defect which contributes to the pathogenesis of obesity. Clin Physiol 1984;4:267-77.
45. Moore RD. Stimulation of Na: H exchange by insulin. Bioph J 1981;33: 203-10.
46. Horwitz BA. Metabolic aspects of thermogenesis: neuronal and hormonal control. Fed Proc 1979;38:2147-9.
47. Newsholme EA. substrate cycles: their metabolic, energetic and thermic consequences in man. Biochem Soc Symp 1978;43:183-205.
48. DeFronzo RA, Thorin D, Felber J, Simonson DC, Thiebaud D, Jéquier E, Golay A. Effect of beta and alpha adrenergic blockade on glucose-induced thermogenesis in man. J Clin Invest 1984;73:633-9.
-233-

Chapter 12. General discussion
The studies described in this thesis were conducted to answer the following
questions:
1. How large is the intra-individual variation in resting metabolic rate and
diet-induced thermogenesis? Do sex, degree of body fatness and control of the
antecedent diet affect the size of the intra-individual variation in resting
energy expenditure?
2. What is the nature and magnitude of inter-individual differences in resting
metabolic rate and diet-induced thermogenesis in lean and obese individuals?
Does the type of body fat distribution in obesity affect these differences?
3. To what extent is resting metabolic rate affected by non-nutritional
factors, ie, previous exercise, psychological stress and time of the day, and
to what degree by nutritional factors, ie, ethanol ingestion and short-term
carbohydrate overfeeding?
4. To what extent is diet-induced thermogenesis affected by non-nutritional
factors, ie, previous exercise, psychological stress, time of the day and
palatability of food, and to what degree by nutritional factors, ie, ethanol
ingestion and short-term carbohydrate overfeeding?
AD 1
Two components of daily energy expenditure were investigated, resting
metabolic rate (RMR) and diet-induced thermogenesis (DIT). These components
comprise 70-85 percent of total energy expenditure in the average individual
(1). It is not surprising that research on human energy expenditure has
focused on studying these components in relation to the pathogenesis of
-234-

obesity. They are quantitatively important for overall energy expenditure and
can be assessed relatively easy with the use of indirect calorimetry.
In the studies described in this thesis the ventilated hood technique was used
to measure RMR and DIT in humans. Before the start of the experiments much
effort was spent in the development and construction of a ventilated hood
system. There was no experience in our Department with the assessment of
energy expenditure using the ventilated hood technique. Therefore, extensive
studies were carried out to test the accuracy and the reproducibility of
measurements of energy expenditure. These studies are described in chapter 3.
A salient finding of these studies is the relatively low reproducibility of
measurements of DIT. Intra-individual coefficients of variation were around 30
percent. When a characteristic shows a relatively large intra-individual
variation, this may pose serious problems for studies that aime to determine
within-person responses to treatments (2). Also, distinguishing groups of
individuals from another may become difficult (2).
Reproducibility data, obtained from the studies described in chapter 3, were
used to determine the experimental designs of the studies reported in
subsequent chapters of this thesis. In assessing the effect on DIT of
non-nutritional and nutritional factors, a minimum sample size of 10 subjects
was used. In most studies repeated measurements per subject were obtained for
each treatment condition. Experimental designs were devised to have a power of
80 to 90 percent in detecting treatments effects on DIT of about 30 percent.
Chapter 7 reports on between-group comparisons of DIT. Data on between-person
variation in DIT, as described in chapter 3, indicate that sample sizes per
group were sufficiently large to detect, with a power between 80 to 90
percent, real between-group differences in DIT of about 25 percent. This means
that the failure to reach statistical significance in treatment effects or
between-group differences, as reported in some of our studies, is probably
related to the actual lack of effect of treatment or between-group
differences.
In the study of human energy expenditure one of the more controversial issues
is, whether obese persons have a defective thermogenic response to food in
comparison to their lean counterparts (3). A defective thermogenic response to
food could be of significance for the pathogenesis of human obesity (3).
Whether a relatively high intra-individual variation in diet-induced
thermogenesis has contributed to the genesis of this controversy, can not be
-235-

ascertained from our studies. After scrutinizing the literature for data of
other groups on the reproducibility of DIT, only one reference was found
containing this information (4). Ravussin et al. (4) conclude that DIT shows
low reproducibility. Our results confirm their conclusions. A survey of the
various studies on DIT shows, that most of the studies reporting no systematic
difference in DIT between the lean and the obese had sample sizes probably too
small to detect even relatively large differences of about 50 percent (5-17).
The absence of data on reproducibility of DIT measurements is puzzling.
Reproducibility of RMR or 24-hour energy expenditure measurements is
frequently reported (4,18-21). Whatever the reason is for the lack of data on
reproducibility of DIT measurements, this thesis shows that, before concluding
on the existence or absence of systematic treatment effects on DIT or
between-group differences in DIT, investigators should obtain information on
[_ within-person and between-person variation in DIT.
The specific cause for the relatively high within-person variability in
diet-induced thermogenesis was difficult to determine. Coefficients of
variation were not affected by sex, degree of body fat content or oral
contraceptive use. Control of the antecedent diet did not seem to affect the
size of the intra-individual variation. It was concluded that, in particular,
variation. in_ siibjectLs_bfihaviar and in measurement circumstances, ie, in
motion-pictures, attributed to the high within-person variability. To assess
the effect of variation in motion-pictures on RMR and DIT, two extreme types
of motion-pictures were compared, the romantic-family type versus the horror
type. DIT increased significantly on horror films compared to romantic-family
type of films. This effect was due to a synergistic effect of meal ingestion
and exposure to horror motion-pictures. The results suggest that part of the
within-person variation in diet-induced thermogenesis could have been related
to variation among the repeated measurements in the type of motion-picture
that was shown to the subjects. Under normal measurement circumstances,
however, variation in motion-pictures was not as extreme as applied in the
study described in chapter 6. The synergistic interaction between the exposure
to a stressor and food ingestion on DIT is difficult to explain. The results
of chapter 5 suggest the existence of facultative diet-induced thermogenesis
after food ingestion under exposure to a relatively mild stressor. From the
absence of an effect of psychological stress on fasting energy expenditure, it
may be concluded that food triggers sympathetic nervous system activity (22),
and that additional exposure to a stressor may enhance this process and
thereby facultative thermogenesis.
-236-

AD 2
The extent and nature of inter-individual variation in RMR and DIT were
determined in a group of 154 obese and nonobese persons.
An important outcome of this study was the lack of a systematic difference
between non-obese and obese females in the efficiency of energy utilization,
either in fed or fasted conditions. This confirms recent reports (4,17), but
is in contradiction with reports of various other groups (3,23-25). We have no
explanation for this discrepancy. As stated before, the present study had
sufficient power to detect even relatively minor differences in DIT between
the non-obese and the obese females. Since no obese men were studied in this
thesis, inferences on differences in DIT between obese men and non-obese men
should be done cautiously.
A surprising finding was the lower DIT of men compared tQ_women. Around 25
percent of the thermogenic response to food in men was unaccounted for by the
energy expended for nutrient oxidation and retention. This indicates that men
have a facultative thermogenic response of significant magnitude after mixed
meal ingestion.
Do these observations fit in with the 'model' on the nature of DIT? Men had in
particular higher postprandial glucose oxidation rates when compared to women.
Postprandial glucose oxidation is likely to be a function of the amount of
carbohydrates ingested and subsequently digested, the insulin response to
ingested carbohydrates and the mass of glucose-metabolizing cells. Under
normal resting conditions after carbohydrates ingestion, insulin determines
largely the intensity of cellular glucose metabolism. I hypothetize that the
difference in DIT between the sexes is related to a difference in insulin
response. Men may have a relatively larger insulin response, ie, characterized
by relatively large peak heights or postprandial surface areas. A higher
insulin response could increase the cellular metabolism of glucose and, in
addition, activate the sympathetic nervous system (22). This thesis offers no
hard data to test this hypothesis. A difference in insulin response between
men and women could partly be a function of differences in the rate of
digestion and absorption of carbohydrates. A_higher rate of stomach emptying
is expected to result in an increased flux of carbohydrates into the small
.intestine, resulting in a higher absorption rate of carbohydrates, and,
consequently, in a higher insulin response. This hypothesis could be tested by
monitoring and varying the rate of stomach emptying in response to different
meals in men and women. It predicts that, at given oral doses of
-237-

carbohydrates, increased rates of stomach emptying and carbohydrate absorption
will result in a higher DIT. When this hypothesis can not be refuted, it would
indicate that the model of the current theory on DIT should be expanded by
incorporating in the model of DIT the rate of nutrient digestion and
absorption as a determinant of DIT.
A second surprising finding was the significantly lower RMR per unit weight of
fat-free mass in men when compared to women. This does not necessarily
indicate a difference in basic energy-demanding processes at the cellular
level between the sexes as explained in chapter 2. Men may have a relative
hypertrophy of fat-free tissues with low metabolic activity compared to women.
A combination of accurate in vivo imaging techniques for assessing body
composition, direct or indirect macrocalorimetry and microcalorimetry may
elucidate the precise nature of our finding.
Whereas the data on RMR indicate that men are more efficient users of energy
compared to women, the results of _the_ppstprandial energy expenditure
measurements suggest the opposite. A similar anomaly between trained and
untrained males has recently been published by Poehlman et al. (26).
The clinically most relevant finding of the studies described in chapters 7
and 8 was the observation that non-abdominal obese women had relatively lower
RMR's when compared to abdominal obese women, young lean men, young women and
non-obese women matched in age. The impact of the type of body fat
distribution on metabolic complications of overweight and obesity is currently
the object of intense investigations (27). A relative predominance of fat in
the abdominal region has conclusively been shown to be associated with an
increased risk on metabolic complications. Whether the type of body fat
distribution affects energy expenditure was unknown when we started our
studies. The results of our studies suggest that the type of body fat
distribution might be a predictor of long-term body weight gain.
The question how to interprète the relatively lowered RMR's among the
non-abdominal obese is intrigueing. Did these lowered rates of energy
expenditure contribute to the obesity in these women or are they secondary to
the obese state? Only prospective studies with pre-obese persons subdivided
according to type of body fat distribution and according to rate of energy
expenditure can give a definite answer to this question. I think, however,
that the reduced rates of energy expenditure among the non-abdominal obese
contributed to their obesity rather than being caused by it. The arguments for
this opinion are based on three observations. Firstly, the non-abdominal obese
women, in particular the gluteal-femoral obese, reported a childhood
-238-

(prepubertal) history of obesity, whereas the abdominal obese reported an
adult-onset obesity. The association of an early onset of obesity in the
non-abdominal obese and the occurrence, later in adulthood, of reduced rates
of energy expenditure suggests a causal relationship between the reduced rates
of energy expenditure and the obesity. Secondly, in an earlier report of our
group (28) it was observed that during weight loss RMR's reduced significantly
in abdominal obese women but not in non-abdominal obese women. RMR's in the
non-abdominal obese did not adapt to the chronically reduced energy intake.
This indicates that the reduced RMR's in the non-abdominal obese did
contribute to the obese state. Thirdly, the abdominal obese, in contrast to
the non-abdominal obese, are frequently characterized by hyperinsulinemia and
hypertension (27). Insulin may increase the sympathetic nervous system
activity (22). An increased sympathetic nervous system activity may increase
thermogenesis, for example, in processes contributing to RMR. In that case,
the relatively increased RMR's in the abdominal obese could be viewed as an
adaptation in the abdominal obese to excessive energy intake. The increased
thermogenesis would antagonize further weight gain. This means that the
relatively increased RMR's in the abdominal obese would be a consequence of
the obese state, implying that the relatively reduced RMR's in the
non-abdominal obese have not adapted to the obese state, ie, are
constitutional.
When the reduced RMR in the non-abdominal obese are constitutional, could it
affect overall energy balance? Using the results of chapter 8, we calculated
that a surfeit of about 5 percent of daily energy intake could occur in the
non-abdominal obese compared to the abdominal obese, assuming equal energy
intakes, degrees and intensities of physical activity in both groups. An
energy retention of 5 percent of total daily energy intake could certainly
contribute to weight gain. It should be realized, however, that a positive
energy balance induces changes in energy expenditure that affect body weight
gain. This implicates that a simple summation in time of the calculated daily
energy surfeits divided by the energy equivalent of weight gain (29) is only
useful for estimating the maximally possible weight gain. If the lowered RMR
in the non-abdominal women is constitutional, then, it might be predicted that
in particular these women will be most resistent to weight reduction.
The type of body fat distribution did not affect DIT, suggesting that a
(pre)pubertal history of obesity, associated with the type of body fat
distribution, is not an important determinant of dietary thermogenesis.
-239-

AD 3
In addition to investigations on the intra- and inter-individual variation in
RMR and DIT, studies were carried out to assess the impact of various
non-nutritional and nutritional factors on these components of energy
expenditure.
In chapter 5 it was shown that prior exercise did not have a significant 10
hours after-effect on RMR. In this study energy expenditure was not
continuously measured after exercise. It is possible that the exercise induced
a significant after-effect on RMR that lasted only a relatively short time.
The results of this study suggest that exercise would not induce a greater
energy loss than the loss that could be inferred from calculation of the
crossproduct of the applied workload and workefficiency. From this study we
may conclude that exercise would probably not be useful as an adjuvant for
weight control in subjects occasionally engaged in recreational physical
activity. Surprisingly, however, the study described in chapter 11 showed a
significant 10-hours after-effect of exercise on RMR. The difference in
results between these two studies is probably related to the difference in
exercise duration and intensity. The exercise performed in the study described
in chapter 11 was of the unduly heavy type. After a maximum work capacity
test, subjects had to cycle for another 80 minutes at varying percentages of
their maximum workload. The combination of prolonged, alternating intense and
less intense exercise proved to be a particular effective stimulus of resting
metabolic rate. Such heavy rates of exercise are obviously not frequently
encountered under normal conditions. Thus, the results of chapter 11 do not
invalidate the conclusion on the efficacy of occasional recreational acitivity
for weight control purposes.
Another aspect which was studied related to diurnal variation in RMR. Garrow,
an authority on studies of energy balance and obesity in humans, points out
that diurnal variation in RMR exists and that it could seriously affect the
calculation of DIT (29). At close inspection it seems that Garrow bases his
opinion on a single reference, the classical paper by Aschoff and Pohl, on
rhytmic variations in energy metabolism (30). This paper gives a figure on
oxygen uptake of a female subject measured in resting conditions over a whole
day in thermoneutral conditions. It can not be concluded from this paper
whether this subject was measured under strict fasting conditions or
periodically fed. It is premature to conclude from this observation that
diurnal variation in RMR exists. The results of studies presented in chapter 3
-240-

and in chapter 4 clearly show that time of the day does not significantly
impact on RMR and DIT. The results of these studies are not at all
spectacular, but they have important methodological consequences for the
measurement of RMR and DIT, as explained in chapter 3.
AD 4
The effects on DIT of palatability, ethanol ingestion and short-term
carbohydrate overfeeding were investigated to test various hypotheses on the
mechanisms of postprandial energy expenditure.
Meals with relatively high palatability were expected to induce a relatively
large pre-absorptive, ie, cephalic, insulin réponse, and, consequently, a
higher post-absorptive insulin response. This was expected to cause enhanced
storage of carbohydrates and, possibly, activation of the sympathetic nervous
system. Both processes could lead to increased DIT. This hypothesis was not
supported by the findings of the study presented in chapter 10. No difference
in DIT occurred between meals of different palatability. Power calculations
revealed that the design used in the study was sufficiently sensitive to
detect a within-person change in DIT in response to treatment of around 25
percent. It seems, therefore, that humans, in short-term, do not protect
themselves against the undesirable effects on energy balance of an occasional
overindulgence at dinner. The absence of a significant effect of palatability
on DIT was explained by assuming that highly unpalatable meals evoke a stress
reaction, that increases facultative thermogenesis. Evidence for this notion
comes from the study on the impact of psychological stress on DIT. In the
palatability study two meal types were compared, a palatable versus a highly
unpalatable meal. The results of this study do not preclude the possibility
that the thermic response to food differs between palatable meals and ordinary
meals.
The impact of ethanol on DIT was assessed in a study described in chapter 9.
Ethanol ingested in a moderate dosis induced a significant thermic effect.
According to the literature (32) the impact of ethanol on energy expenditure
observed in this thesis is similar to glucose- or fat-induced thermogenesis.
We did not compare the impact of iso-energetic loads of the three individual
macronutrients on RMR to that of ethanol. Ethanol ingestion immediately prior
to meal ingestion (aperitif) did not potentiate DIT in comparison with an
equal amount of calories given in a mixed meal form. Again, the ethanol was
not compared for its effects on DIT with each individual macronutrient. It was
-241-

expected that ethanol ingestion would increase nutrient storage and thereby
DIT, not by an effect on insulin response, but, simply, because ethanol would
act as an energy source in cellular metabolism, substituting for fat, glucose
or proteins. Evidence for this mechanism came from the observed increase in
DIT after ethanol ingestion in the second and third hour of the postprandial
period. Overall, however, ethanol ingestion did not potentiate DIT.
This thesis does not offer an explanation for the paradoxical finding in
observational studies that ethanol is usually added on top of the diet, but
that its use is not associated with increased levels of adiposity (33-37).
Three comments should be made. First, equality of body mass index (weight 2
(kg)/height (m)) between drinkers and abstainers of ethanol does not mean
equality of metabolically 'active' mass or, as a corollary, equality of body
fat stores (38). Secondly, ethanol use might covary with other lifestyle
factors affecting energy expenditure, ie, smoking, coffee consumption,
sleeping behavior (39) or physical activity. Ideally, observational studies
should adjust the relationship between ethanol intake and body weight for
these potential confounders. Thirdly, chronic ethanol use could induce
thermogenic processes, for example, by effects on the autonomic nervous system
(40). Finally, inferring about the chronic effects of a stimulus using results
of acute effects of that stimulus should always be done cautiously.
In a last study described in chapter 11, the impact was assessed on RMR and
DIT of unduly heavy previous exercise and short-term carbohydrate overfeeding.
It was expected that carbohydrate overfeeding would result in an increase of
DIT. This was indeed found; carbohydrate overfeeding increased DIT
significantly. The effect of carbohydrate overfeeding on DIT was increased by
prior exercise. No effect of carbohydrate overfeeding on RMR was observed.
Unduly prior heavy exercise significantly affected RMR and DIT. Surprisingly,
the carbohydrate overfeeding reduced the impact of prior exercise on RMR.
These findings suggest that part of the after-effect of exercise on energy
expenditure is related to replenishing the body's glycogen stores. Such a
process would be relatively diminished after previous carbohydrate loading.
The study described in Chapter 11 provides evidence for the existence of
facultative, ie, adaptive thermogenesis. The increased DIT reduced the energy
surfeit caused by the carbohydrate overfeeding. The response after exercise
does not seem to indicate an adaptive response with respect to restoring
energy balance. Both stimulus and response tend to decrease the body's energy
stores. This indicates that after heavy exercise, restoring the original
steady state in the body's glycogen stores is of greater importance in
-242-

comparison to balancing short-term fluctuations in the body's energy stores.
Although this study gives evidence for the existence of the facultative
component of DIT, it is difficult to assess from this study the contribution
to overall DIT of neuronally-mediated stimulation of facultative thermogenic
processes and, for example, of an increased turnover between the mobilisation
and storage forms of a nutrient.
General textbook knowledge states that ingested carbohydrates are oxydized or
converted to fat (41). In the carbohydrate overfeeding study it was shown
that, even after carbohydrate overfeeding, net transformation of glucose into
fat was of negligible importance for the non-oxidative storage of
carbohydrates. This confirms previous findings (42,43) and supports
Björntörp's and Sjöström's speculations and quantitative considerations with
regard to carbohydrate storage in men (44). Only after massive overfeeding
with carbohydrates de novo lipogenesis becomes a quantitatively important
pathway for storing ingested carbohydrates (45). In such conditions daily
energy expenditure increases markedly, largely, due to the energy expended in
converting carbohydrates to fat (45).
Finally, does the work described in this thesis contribute to the solving of
some of the major problems of the study of human energy exchange?
This thesis shows that individual differences in resting energy expenditure
exist, even after accounting statistically for differences in age, body weight
and body composition. Whether these inter-individual differences are
associated with differences in the degree or intensity of habitual physical
activity among our subjects can not be inferred from the studies described in
this thesis. Secondly, after accounting for differences age, in body weight
and body compositipn, this thesis shows that simple personal characteristics,
ie, sex and type of body fat distribution in obesity, are still related to
inter-individual differences in resting energy expenditure.
Short-term manipulation of the plane of nutrition, such as carbohydrate
overfeeding, was shown to induce some form of a protective response in DIT
against energy overnutrition. Whether this response would be of significance
in total daily energy expenditure, and, whether a chronic dietary manipulation
would induce such a response, can not be concluded from the results of this
thesis. These questions remain unanswered.
The work described in this thesis shows that obese women with a relative
predominance of body fat on buttocks and hips (non-abdominal type of fat
-243-

distribution) are characterized by a relatively reduced RMR. Our studies do
not allow to draw a definite conclusion on the importance of this finding for
the pathogenesis of non-abdominal obesity. They do suggest that studying
energy expenditure in human obesity in relation to body fat distribution may
prove,to be valuable for understanding the nature of human obesity.
This thesis also shows that the origin of DIT is not exclusively determined by
the postprandial processing of ingested nutients. Some simple non-nutritional
factors, in particular psychological stress, sex of a subject and prior
exercise, can significantly affect the postprandial rise in energy
expenditure. To account for the impact of these factors, a revised 'model' of
the origin of DIT is presented in Figure 1.
FOOD/NUTRIENTS PRE-ABSORPTIVE
RESPONSES
INGESTION - DIGESTION
OBLIGATORY THERMOGENESIS
NON-NUTRITIONAL STIMULI
ABSORPTION
INSULIN
SNS ACTIVITY
i
FACULTATIVE THERMOGENESIS
TRANSPORT
< Ç—-
44 — i
. ,^— i i
i
OXIDATION
STORAGE
OBLIGATORY THERMOGENESIS
DIET-INDUCED THERMOGENESIS
Figure 1. Revised 'model' of origin of diet-induced thermogenesis, incorporating the impact of non-nutritional factors. Thick lines indicate established contributions, interrupted lines indicate contributions still in doubt (SNS = sympathetic nervous system).
-244-

Non-nutritional factors were shown to affect dietary thermogenesis. The
precise mechanism of these effects could not be elucidated from the work
described in this thesis. Tentatively, I state that the effects of these
factors on DIT could have been mediated through pre-absorptive influences on
the post-absorptive insulin response, the rate of digestion and absorption of
nutrients, in particular of carbohydrates, the routing of ingested nutrients
over storage and immediate oxidation, the turnover between storage and
mobilisation forms of nutrients and, finally, through a direct or indirect,
ie, through stimulation of the activity of the sympathetic nervous system,
stimulatory effect on the rate of ion pumping or substrate cycli. More
research is needed to assess the contribution of these various processes to
overall DIT.
CONCLUSIONS
This thesis shows that intra-individual variation in diet-induced
thermogenesis is relatively large. This finding is important in the design of
studies that aime to compare diet-induced thermogenesis between different
groups or to quantify within-person responses of diet-induced thermogenesis to
a thermogenic stimulus. Diet-induced thermogenesis showed a large inter-
individual variation, but no evidence was obtained that, in particular, the
obese would have a blunted thermogenic response to food. Men had a
significantly higher diet-induced thermogenesis than women did. It is
hypothetized that this is related to a difference between the sexes in the
postabsorptive insulin response, probably mediated by a difference in
carbohydrate digestion and absorption rate. Men were found to have lower
resting metabolic rates per unit weight of fat-free mass when compared to
women. This could indicate a higher effiency of fasting energy utilization in
men. Alternatively, this finding could be related to a relative hypertrophy in
men of components of the fat-free mass with relatively low metabolic activity.
Obese women with a non-abdominal type of body fat distribution were found to
have reduced resting metabolic rates compared to young non-obese men, young
non-obese women, age-matched non-obese women and in comparison with obese
women with an abdominal type of body fat distribution. It is hypothetized that
the reduced resting metabolic rates in the non-abdominal obese women are
causally related to their obesity. To test this hypothesis it is necessary to
measure energy expenditure in groups of obese women, subdivided according to
-245-
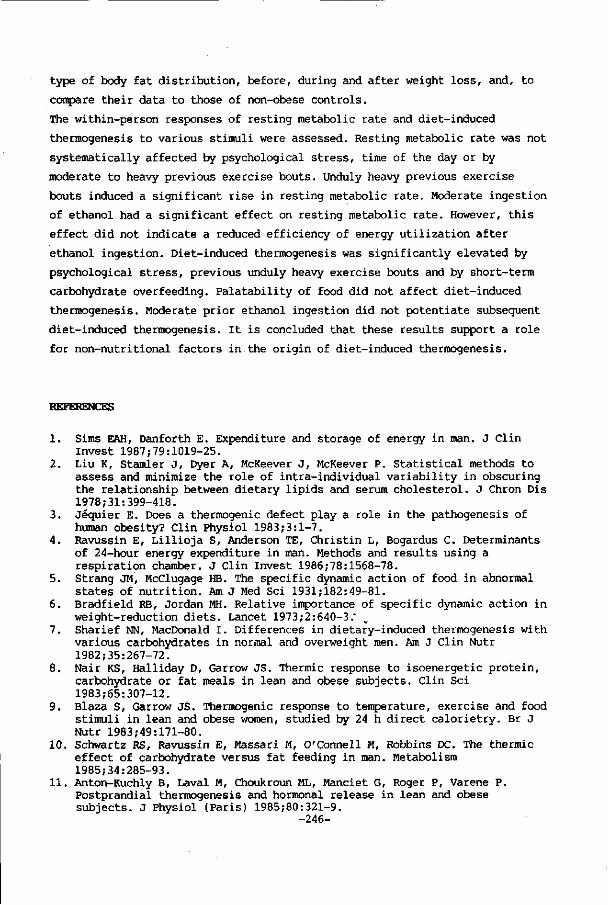
type of body fat distribution, before, during and after weight loss, and, to
compare their data to those of non-obese controls.
The within-person responses of resting metabolic rate and diet-induced
thermogenesis to various stimuli were assessed. Resting metabolic rate was not
systematically affected by psychological stress, time of the day or by
moderate to heavy previous exercise bouts. Unduly heavy previous exercise
bouts induced a significant rise in resting metabolic rate. Moderate ingestion
of ethanol had a significant effect on resting metabolic rate. However, this
effect did not indicate a reduced efficiency of energy utilization after
ethanol ingestion. Diet-induced thermogenesis was significantly elevated by
psychological stress, previous unduly heavy exercise bouts and by short-term
carbohydrate overfeeding. Palatability of food did not affect diet-induced
thermogenesis. Moderate prior ethanol ingestion did not potentiate subsequent
diet-induced thermogenesis. It is concluded that these results support a role
for non-nutritional factors in the origin of diet-induced thermogenesis.
REFERENCES
1. Sims EAH, Danforth E. Expenditure and storage of energy in man. J Clin Invest 1987;79:1019-25.
2. Liu K, Stander J, Dyer A, McKeever J, McKeever P. Statistical methods to assess and minimize the role of intra-individual variability in obscuring the relationship between dietary lipids and serum cholesterol. J Chron Dis 1978;31:399-418.
3. Jéquier E. Does a thermogenic defect play a role in the pathogenesis of human obesity? Clin Physiol 1983;3:1-7.
4. Ravussin E, Lillioja S, Anderson TE, Christin L, Bogardus C. Determinants of 24-hour energy expenditure in man. Methods and results using a respiration chamber. J Clin Invest 1986;78:1568-78.
5. Strang JM, McClugage HB. The specific dynamic action of food in abnormal states of nutrition. Am J Med Sei 1931;182:49-81.
6. Bradfield RB, Jordan MH. Relative importance of specific dynamic action in weight-reduction diets. Lancet 1973;2:640-3."
7. Sharief NN, MacDonald I. Differences in dietary-induced thermogenesis with various carbohydrates in normal and overweight men. Am J Clin Nutr 1982;35:267-72.
8. Nair KS, Halliday D, Garrow JS. Thermic response to isoenergetic protein, carbohydrate or fat meals in lean and obese subjects. Clin Sei 1983;65:307-12.
9. Blaza S, Garrow JS. Thermogenic response to temperature, exercise and food stimuli in lean and obese women, studied by 24 h direct calorietry. Br J Nutr 1983;49:171-80.
10. Schwartz RS, Ravussin E, Massari M, O'Connell M, Robbins DC. The thermic effect of carbohydrate versus fat feeding in man. Metabolism 1985;34:285-93.
11. Anton-Kuchly B, Laval M, Choukroun ML, Manciet G, Roger P, Varene P. Postprandial thermogenesis and hormonal release in lean and obese subjects. J Physiol (Paris) 1985;80:321-9.
-246-

12. D'Alessio DA, Kavle EC, Mozzoli MA, Smalley KJ, Polansky M, Kendrick ZV, Owen LR, Bushman MC, Boden G, Owen OE. Thermic effect of food in lean and obese men. J Clin Invest 1988;81:1781-9.
13. Zahorska-Markiewicz B. Thermic effect of food and exercise in obesity. Eur J Appl Physiol 1980;44:231-5.
14. Felber JP, Meyer HU, Curchod B, Iselin HU, Rouselle J, Maeder E, Pahud P, Jéquier E. Glucose storage and oxidation in different degrees of human obesity measured by continuous indirect calorimetry. Diabetologia 1981;20:39-44.
15. Welle SL, Campbell RG. Normal thermic effect of glucose in obese women. Am J Clin Nutr 1983;37:87-92.
16. Felig P, Cunningham J, Levitt M, Hendler R, Nadel E. Energy expenditure in obesity in fasting and postprandial state. Am J Physiol 1983;244:E45-51.
17. Owen OE, Kavle E, Owen RS, Polansky M, Caprio S, Mozzoli MA, Kendrick ZV, Bushman MC, Boden G. A reappraisal of caloric requirements in healthy women. Am J Clin Nutr 1986;44:1-19.
18. Bogardus C, Lillioja S, Ravussin E, Abbott W, Zawadzki JK, Young A, Knowler WC, Jacobowitz R, Moll PP. Familial dependence of the resting metabolic rate. N Engl J Med 1986;315:96-100.
19. Murgatroyd PR, Davies HL, Prentice AM. Intra-individual variability and measurement noise in estimates of energy expenditure by whole body indirect calorimetry. Br J Nutr 1987;58:347-56.
20. Soares MJ, Shetty PS. Intra-individual variations in resting metabolic rates of human subjects. Hum Nutr:Clin Nutr 1986;40C:365-9.
21. Mahadeva K, Passmore R, Woolf B. Individual variations in metabolic cost of standardized exercises: effects of food, age, sex and race. J Physiol (London)1953 ,-121:225-31.
22. Landsberg L, Young JB. The role of the sympathetic nervous system and catecholamines in the regulation of energy metabolism. Am J Clin Nutr 1983;38:1018-24.
23. Segal KR, Gutin B, Albu J, Pi-Sunyer FX. Thermic effects of food and exercise in lean and obese men of similar lean body mass. Am J Physiol 1987;252:EllO-7.
24. Shetty PS, Jung RT, James WPT. Reduced dietary-induced thermogenesis in obese subject-before and after weight loss. Proc Nutr Soc 1979;38:87A (abstract).
25. Schwartz RS, Halter JB, Bierman EC. Reduced thermic effect of feeding in obesity: role of norepinephrine. Metabolism 1983;32:114-7.
26. Poehlman ET, Melby CL, Badylak SF. Resting metabolic rate and postprandial thermogenesis in highly trained and untrained males. Am J Clin Nutr 1988;47:793-8.
27. Björntörp P. Adipose tissue distribution and morbidity. In: Berry EM, Blondheim SH, Eliahou HE, Shafrir E, eds. Recent advances in obesity research: V. London: John Libbey, 1986:60-85.
28. Den Besten C, Vansant G, Weststrate JA, Deurenberg P. Resting metabolic rate and diet-induced thermogenesis in abdominal and gluteal-femoral obese women before and after weight reduction. Am J Clin Nutr 1988;47:840-7.
29. Garrow JS. Energy balance and obesity in man. 2nd ed. Amsterdam: Elsevier/North Holland Biomedical Press, 1978;96-7.
30. Aschoff J, Pohl H. Rhythmic variations in energy metabolism. Fed Proc 1970;29:1541-52.
31. LeBlanc J, Brondel L. Role of palatability on meal-induced thermogenesis in human subjects. Am J Physiol 1985;248:E333-6.
32. Jéquier E. Thermogenesis induced by nutrient administration in man. Infusionstherapie 1984 ;11:184-8.
33. Fisher MA, Gordon T. The relation of drinking and smoking habits to diet: the lipid Research Clinics Prevalence study. Am J Clin Nutr 1985;41:623-30.
-247-

34. Hillers VN, Massey LK. Interrelationships of moderate and high alcohol consumption with diet and health status. Am J Clin Nutr 1985;41:356-62.
35. Bebb HT, Houser HB, Witschi JC, Littell AS, Fuller RK. Calorie and nutrient contribution of alcoholic beverages to the usual diets of 155 adults. Am J Clin Nutr 1971;24:1042-52.
36. Jones BR, Barrett-Connor E, Criqui MH, Holdbrook MJ. A community study of calorie and nutrient intake in drinkers and nondrinkers of alcohol. Am J Clin Nutr 1982;35:135-9.
37. Gruchow HW, Sobocinski KA, Barboriak JJ, Scheller JG. Alcohol consumption, nutrient intake and relative body weight among US adults. Am J Clin Nutr 1985;42:289-95.
38. Weststrate JA, Deurenberg P. Methoden ter bepaling van de lichaamssamenstelling van de mens. Deel III. Indirecte methoden. Voeding 1988;49:206-14.
39. Baecke JAH, Burema J, Frijters JER, Hautvast JGAJ, van der Wiel-Wetzels WAM. Obesity in young Dutch adults: II, daily life-style and body mass index. Int J Obes 1983;7:13-24.
40. Johnson RH, Eisenhofer G, Lambie DG. The effects of acute and chronic ingestion of ethanol on the autonomic nervous system. Drug Ale Dep 1986;18:319-28.
41. Davidson S, Passmore R, Brock JF, Truswell AS. Human nutrition and dietetics. 7th ed. Edinburgh: Churchill Livingstone, 1979:30-31.
42. Acheson KJ, Schutz Y, Ravussin E, Jéquier E, Flatt JP. Nutritional influences on lipogenesis and thermogenesis after a carbohydrate meal. Am J Physiol 1984;246:E62-70.
43. Acheson KJ, Flatt JP, Jéquier E. Glycogen synthesis versus lipogenesis after a 500 gram carbohydrate meal in man. Metabolism 1982;31:1234-40.
44. Björntörp P, Sjöström L. Carbohydrate storage in man: speculations and some quantitative considerations. Metabolism 1978;27:1853-65.
45. Acheson KJ, Schutz Y, Bessard T, Anatharaman K, Flatt JP, Jéquier E. Glycogen storage capacity and de novo lipogenesis during massive carbohydrate overfeeding. Am J Clin Nutr 1988;48:240-7.
-248-

Summary
This thesis contains studies in humans on individual differences in resting
metabolic rate (RMR) and diet-induced thermogenesis (DIT), and on the impact
of various nutritional and non-nutritional factors on RMR and DIT.
RMR and DIT account for between 70-85 percent of total daily energy
expenditure in the average individual. RMR is the energy expenditure of a
postabsorptive subject in resting conditions. DIT is the increase in energy
expenditure, relative to RMR, in a resting individual after food ingestion.
Interest for studying RMR and, in particular, DIT arose at the suggestion that
obese persons would have a relatively lowered DIT when compared to lean
persons. A lowered DIT was considered to be caused by an increased
'efficiency' of energy metabolism, contributing to the pathogenesis of
obesity. Opinions on this issue are, however, divergent.
From a different point of view interest in RMR and DIT has also been
expressed. It has been suggested that individuals could reduce energy use
through RMR or DIT, for example, during energy undernutrition or during
increased energy requirements. Such a reduction would result in a more
'efficient' energy metabolism, resulting in decreased energy requirements.
Little is known about the nature and magnitude of individual differences in
healthy adult subjects of RMR and DIT and on the impact of nutritional and
non-nutritional factors on RMR and DIT. The objective of the studies described
in this thesis is to provide new knowledge on these matters.
Chapter 1 gives an introduction to the field of study and states the questions
that were investigated in this thesis.
In Chapter 2 a review is given of aspects of the study of human energy
exchange and their relation to problems of energy balance. The components and
determinants of energy expenditure are discussed. The control of food (energy)
intake is reviewed as well as the control of energy balance in relation to
energy under- and overnutrition. 'Models' of RMR, DIT, the control of food
intake and energy balance are presented.
Chapter 3 contains methodological studies on the measurement in humans of RMR,
DIT and fuel utilization with a ventilated hood system. It was found that RMR
measurements showed good reproducibility. DIT measurements were less
reproducible. Strict control over the antecedent diet seemed not to reduce the
within-person variability of DIT. The importance of the relatively low
reproducibility for the study of DIT is discussed. No systematic effect of the
phase of the menstrual cycle on RMR and DIT was observed. DIT was positively
-249-

associated with the energy content of the testmeal. For mixed meals with an
energy content between about 1.5-2.5 MJ DIT can be assessed with sufficient
accuracy within three hours.
Chapter 4 reports on the impact of time of the day on the measurement of RMR
and DIT. No significant diurnal variation in RMR and DIT was observed.
Chapter 5 contains a study to assess whether prior moderate to heavy exercise
bouts affect RMR in fasting subjects. No significant 10-hours after-effect of
exercise on RMR was found.
Chapter 6 describes a study to measure the impact of psychological stress on
RMR and DIT. Psychological stress did not systematically affect RMR.
Surprisingly, psychological stress increased DIT.
Chapter 7 reports on the nature and magnitude of inter-individual variation in
RMR and DIT in lean and obese subjects. No significant difference in DIT was
found between lean and obese female subjects. DIT was on average 24 percent
higher in men compared to women. Men had a relatively reduced RMR compared to
women per unit weight of fat-free mass. Obese women with a non-abdominal type
of body fat distribution had significantly lower RMR's, adjusted for body
weight, body composition and age, compared to non-obese men and women, but
also, in comparison to obese women with an abdominal type of body fat
distribution.
Chapter 8 reports in detail on the impact of body fat distribution on resting
energy expenditure in obese women. Three groups of obese women were studied. A
group with a gluteal-femoral type of body fat distribution, a group with an
intermediate type of body fat distribution and a group with a typical
abdominal type of body fat distribution. A control group of age-matched
non-obese women was also studied. RMR's adjusted for body weight and body
composition were similar in the non-abdominal (gluteal-femoral/intermediate
type of body fat distribution) obese women. Adjusted RMR's in the non-obese
and the abdominal obese women were not statistically different. Adjusted RMR's
of the latter groups were on average 15 percent higher compared to the RMR's
of the non-abdominal obese women. The non-abdominal obese reported a
relatively earlier onset obesity. It is concluded that the relatively reduced
RMR's in the non-abdominal obese are probably of pathogenetic significance.
The thermic effect of ethanol (alcohol) and the impact of ethanol on DIT are
described in Chapter 9. Ethanol induced a significant thermic effect. No
effect of concentration on the thermic effect of ethanol was found. Ingestion
of ethanol did not potentiate DIT when compared to an iso-energetic mixed
meal.
-250-

The impact of the palatability of food on DIT was evaluated in a study
described in Chapter 10. Differences in palatability among otherwise identical
mixed meals or sucrose solutions did not produce systematic differences in
DIT.
Chapter 11 describes a study on the influences of prior unduly heavy exercise
bouts and short-term carbohydrate overfeeding on RMR and DIT. Prior exercise
increased RMR and DIT significantly. Carbohydrate overfeeding did not affect
RMR, but raised DIT significantly. The impact of exercise on RMR was
attenuated by carbohydrate overfeeding.
Chapter 12 contains a general discussion. The results of the various studies
are discussed, among other things in relation to the problems of energy
balance and to a 'model' of DIT.
-251-

Samenvatting
Dit proefschrift bevat studies bij de mens naar individuele verschillen in
ruststofwisseling en thermogeen effect van voeding (Engels, diet-induced
thermogenesis (DIT)) alsmede naar de invloed van verschillende voedings- en
andersoortige factoren op ruststofwisseling en DIT.
Ruststofwisseling en DIT dragen bij de gemiddelde mens voor 70-85 procent bij
aan de totale dagelijkse energie-afgifte. De ruststofwisseling is de
energie-afgifte van nuchtere personen in rust. DIT is de stijging van de
energie-afgifte bij een persoon na voedselinneming ten opzichte van het
nuchtere rustniveau.
De interesse voor onderzoek naar de ruststofwisseling en, met name, DIT nam
toe na de suggestie, dat vetzuchtige personen een verlaagde DIT zouden hebben
in vergelijking met mensen met een normaal vetpercentage in het lichaam. Een
verlaagde DIT zou een gevolg zijn van een 'efficiëntere' energiewisseling. Een
efficiëntere energiewisseling zou bijdragen aan het ontstaan van vetzucht. De
meningen over deze zaak lopen echter bepaald uiteen.
Van een andere invalshoek is er ook interesse voor ruststofwisseling en DIT.
Zo is gesuggereerd dat mensen hun energie-afgifte in ruststofwisseling of DIT
zouden kunnen verlagen, bijvoorbeeld, bij ondervoeding of een langdurig
verhoogde energiebehoefte. Een dergelijke verlaging zou resulteren in een
verlaagde energiebehoefte.
Over de aard en grootte van individuele verschillen in ruststofwisseling en
DIT bij gezonde volwassenen alsmede over de invloed van voedings- en
andersoortige factoren op ruststofwisseling en DIT is nog weinig bekend. Het
doel van de studies in dit proefschrift is over deze zaken nieuwe kennis te
verkrijgen.
Hoofdstuk 1 schets het algemene kader waarbinnen het onderzoek valt en bevat
een opsomming van de onderzoeksvragen.
In hoofdstuk 2 wordt een overzicht gegeven van aspecten van de studie van de
energiewisseling bij de mens en hun relatie met problemen van de
energiebalans. De componenten en determinanten van de energie-afgifte worden
besproken. De regulatie van de voedsel(energie)inneming passeert de revue
alsmede de controle van de energiebalans in relatie tot onder- en overvoeding.
'Modellen'" van de ruststofwisseling, DIT, de controle van de
voedsel(energie-)inneming en de energiebalans worden gepresenteerd.
Hoofdstuk 3 bevat studies, die ingaan op methodologische aspecten van metingen
bij de mens van de ruststofwisseling, DIT en substraatgebruik met een
-252-

'ventilated hood' systeem. Metingen van de ruststofwisseling waren goed
reproduceerbaar. Metingen van DIT vertoonden een slechtere
reproduceerbaarheid. Strikte controle op de voedselopname leek geen
noemenswaardig effect te hebben op de binnen-persoonsvariatie van DIT. Het
belang van de relatief slechte reproduceerbaarheid van DIT metingen voor
onderzoek naar DIT wordt uitgediept. De fase van de menstruele cyclus had geen
significant effect op ruststofwisseling en DIT. DIT vertoonde~een positieve
samenhang met de energie-inhoud van de testvoeding. Bij gebruik van een
gemengde testvoeding met een energie-inhoud van ongeveer 1.5-2.5 MJ kan DIT
bij een meetduur van drie uur voldoende nauwkeurig gemeten worden.
Hoofdstuk 4 rapporteert over de invloed van het tijdstip van de dag op de
ruststofwisseling en DIT. Tussen ochtendmetingen en middagmetingen van
ruststofwisseling en DIT werd geen systematisch verschil gevonden.
Hoofdstuk 5 bevat een studie naar het effect van voorafgaande inspannende
lichamelijke aktiviteit op ruststofwisseling. Inspannende lichamelijke
aktiviteit had na 10 uur geen aantoonbaar effect op de ruststofwisseling.
In hoofdstuk 6 wordt een studie beschreven naar de invloed van psychologische
stress op ruststofwisseling en DIT. Psychologische stress had geen invloed op
de ruststofwisseling. Verassend genoeg verhoogde psychologische stress de DIT.
Hoofdstuk 7 bevat een studie naar de aard en grootte van individuele
verschillen in ruststofwisseling en DIT in vetzuchtige en niet-vetzuchtige
personen. DIT verschilde niet significant tussen vetzuchtige en
niet-vetzuchtige personen. DIT was gemiddeld 24 procent hoger in mannen in
vergelijking met vrouwen. Mannen hadden in vergelijking met vrouwen gemiddeld
een lagere ruststofwisseling per kilo vetvrije massa. Vetzuchtige vrouwen met
een niet-abdominale lichaamsvetverdeling hadden gemiddeld een lagere
ruststofwisseling, ook na correctie voor verschillen in lichaamsgewicht,
lichaamssamenstelling en leeftijd, in vergelijking met niet-vetzuchtige
personen, maar ook in vergelijking met vetzuchtige vrouwen met een abdominale
lichaamsvetverdeling.
Hoofdstuk 8 rapporteert in detail over de invloed van de lichaamsvetverdeling
bij vrouwen met vetzucht op ruststofwisseling en DIT. Drie groepen vrouwen
werden bestudeerd. Een groep met een gluteaal-femoraal type vetverdeling, een
groep met een intermediair type vetverdeling en een groep met een typisch
abdominale vetverdeling. Een controle groep van niet-obese vrouwen,
overeenkomend in leeftijd met de vetzuchtige groep, werd ook onderzocht. De
ruststofwisseling, gecorrigeerd voor verschillen in lichaamsgewicht en
lichaamssamenstelling, was overeenkomstig bij de vrouwen met een
-253-

niet-abdominale vetverdeling (gluteaal-femoraal/intermediair type
vetverdeling). De ruststofwisseling verschilde niet significant tussen
niet-vetzuchtige vrouwen en vrouwen met abdominale vetzucht. Gemiddeld lag de
ruststofwisseling bij de niet-abdominale vetzuchtige groep 15 procent lager in
vergelijking met de andere groepen. De vetzucht bij de niet-abdominale vrouwen
was relatief op jongere leeftijd ontstaan. De conclusie wordt getrokken dat de
lagere ruststofwisseling van de vrouwen met een niet-abdominale
lichaamsvetverdeling van waarschijnlijk pathogenetisch belang is.
Het thermogeen effect van ethanol (alcohol) en de invloed van ethanol op de
DIT worden beschreven in hoofdstuk 9. Ethanol had een significant thermogeen
effect. Het thermogeen effect werd niet beïnvloed door verschillen in
concentratie. Ethanol verhoogde de DIT niet in vergelijking met een
iso-energetische gemengde testvoeding.
De invloed van aangenaamheid van voedsel op de DIT werd nagegaan in een
studie, die in hoofdstuk 10 staat beschreven. Verschillen in aangenaamheid
tussen verder identieke testmaaltijden of identieke suikeroplossingen leidden
niet tot significante verschillen in DIT.
Hoofdstuk 11 beschrijft een studie naar de invloed op de ruststofwisseling en
DIT van voorafgaande zeer zware lichamelijke inspannende aktiviteit en van
kortdurende overvoeding met koolhydraten. Zeer inspannende lichamelijke
aktiviteit had in deze studie nog na 10 uur een systematisch verhogend effect
op ruststofwisseling en DIT. Overvoeding met koolhydraten verhoogde de DIT,
maar had geen duidelijk invloed op de ruststofwisseling. Het effect van de
aktiviteit op de ruststofwisseling was geringer wanneer overvoeding met
koolhydraten plaatsvond.
Hoofdstuk 12 bevat een algemene discussie. De resultaten van de verschillende
studies worden besproken, onder andere in relatie met problemen van de
energiebalans en in relatie tot een 'model' voor DIT.
-254-

Curriculum vitae
Jan Adriaan Weststrate werd geboren op 23 januari 1959 in Krabbendijke. In
1977 behaalde hij het gymnasium-B diploma aan de Chistelijke
Scholengemeenschap Walcheren te Middelburg. In datzelfde jaar begon hij zijn
studie aan de toenmalige Landbouwhogeschool te Wageningen. In het studiejaar
1982/1983 werd een stageperiode doorgebracht bij het Dunn Clinical Nutrition
Centre te Cambridge in Engeland. In september 1984 behaalde hij aan de
Landbouwuniversiteit Wageningen het diploma van landbouwkundig ingenieur in de
afstudeerrichting "Humane Voeding" met als hoofdvakken, Humane Voeding en
Toxicologie, en als bijvakken, Wiskundige Statistiek en Methoden en Technieken
van Sociaal-Wetenschappelijk Onderzoek. Vanaf januari 1985 tot september 1988
was hij verbonden als wetenschappelijk assistent aan de Vakgroep Humane
Voeding van de Landbouwuniversiteit. Vanaf medio 1985 verrichtte hij onderzoek
naar de energiewisseling en lichaamssamenstelling bij de mens. Het onderzoek
naar de energiewisseling bij de mens resulteerde in een proefschrift. Het
onderzoek naar de lichaamssamenstelling leidde tot 9 publicaties, waarvan 6 in
internationale vaktijdschriften. Vanaf september 1988 is hij werkzaam als
voedingskundige bij Unilever Research Laboratorium in Vlaardingen.
-255-