Digital Signal Cross-Connect and Digital Signal Interconnect ...

NeuroImage 59 (2012) 1420–1428
Contents lists available at SciVerse ScienceDirect
NeuroImage
j ourna l homepage: www.e lsev ie r .com/ locate /yn img
Anticorrelations in resting state networks without global signal regression
Xiaoqian J. Chai a,⁎, Alfonso Nieto Castañón a, Dost Öngür b,c, Susan Whitfield-Gabrieli a
a Department of Brain and Cognitive Sciences, McGovern Institute for Brain Research and Poitras Center for Affective Disorders Research, Massachusetts Institute of Technology, Cambridge,MA 02139, USAb McLean Hospital, Belmont, MA, 02478, USAc Harvard University Medical School, Boston, MA 02115, USA
⁎ Corresponding author at: 43 Vassar St, 46-5081, BuilUSA. Fax: +1 617 324 5311.
E-mail address: [email protected] (X.J. Chai).
1053-8119/$ – see front matter © 2011 Elsevier Inc. Alldoi:10.1016/j.neuroimage.2011.08.048
a b s t r a c t
a r t i c l e i n f oArticle history:Received 10 May 2011Revised 19 July 2011Accepted 16 August 2011Available online 26 August 2011
Keywords:fMRIFunctional connectivityPhysiological noiseDefault mode networkTask-positive networkNegative correlations
Anticorrelated relationships in spontaneous signal fluctuation have been previously observed in resting-statefunctional magnetic resonance imaging (fMRI). In particular, it was proposed that there exists two systems inthe brain that are intrinsically organized into anticorrelated networks, the default mode network, which usu-ally exhibits task-related deactivations, and the task-positive network, which usually exhibits task-related ac-tivations during tasks that demands external attention. However, it is currently under debate whether theanticorrelations observed in resting state fMRI were valid or were instead artificially introduced by global sig-nal regression, a common preprocessing technique to remove physiological and other noise in resting-statefMRI signal. We examined positive and negative correlations in resting-state connectivity using two differentpreprocessing methods: a component base noise reduction method (CompCor, Behzadi et al., 2007), in whichprincipal components from noise regions-of-interest were removed, and the global signal regression method.Robust anticorrelations between a default mode network seed region in the medial prefrontal cortex and re-gions of the task-positive network were observed under both methods. Specificity of the anticorrelations wassimilar between the two methods. Specificity and sensitivity for positive correlations were higher underCompCor compared to the global regression method. Our results suggest that anticorrelations observed inresting-state connectivity are not an artifact introduced by global signal regression and might have biologicalorigins, and that the CompCor method can be used to examine valid anticorrelations during rest.
ding 46, Cambridge, MA 02139,
rights reserved.
© 2011 Elsevier Inc. All rights reserved.
Introduction
Coherent low frequency fluctuations in the resting state of the bloodoxygenation level-dependent (BOLD) signal in functionalmagnetic reso-nance imaging (fMRI) are thought to reflect the intrinsic organization ofthe brain [see (Buckner et al., 2008; Fox and Raichle, 2007) for review].Resting-state fMRI has revealed that signals in functionally relatedbrain regions correlate with each other even in the absence of externalstimuli (Beckmann et al., 2005; Biswal et al., 1995; De Luca et al., 2006;Fox et al., 2005; Fransson, 2005; Greicius et al., 2003). Functional net-works identified by resting-state fMRI have been shown to be robustand reliable (Damoiseaux et al., 2006; Shehzad et al., 2009; Van Dijket al., 2010; Zuo et al., 2010), and can thus provide useful informationabout brain organization differences across different clinical populations(Dosenbach et al., 2010; Seeley et al., 2009) and during development(Dosenbach et al., 2010).
It has been proposed that some systems in the brain are intrinsicallyorganized into anticorrelated networks in resting-state fMRI. Specifically,the default mode network, which consists of a set of brain regions that
are commonly deactivated during tasks that demand external attention,has been found to be anticorrelatedwith regions of the task-positive net-work, which consists of a set of regions that are commonly activatedin tasks that demand attention and mental control (Fox et al., 2005;Fransson, 2005; Greicius et al., 2003; Kelly et al., 2008; Uddin et al.,2009). The strength of the negative correlation between the defaultmode network regions and task-positive network regions has beenlinked to variability in task performance (Hampson et al., 2010; Kelly etal., 2008) and individual differences in task-induced BOLD activity(Mennes et al., 2010). Abnormalities in these two anticorrelated net-works have been found in patients with schizophrenia (Whitfield-Gabrieli et al., 2009), ADHD (Castellanos et al., 2008), bipolar disorder(Chai et al., 2011), and Alzheimer's disease (Wang et al., 2007).
However, it remains unclear whether the anticorrelations observedin resting-state fMRI are neurobiologically valid or are instead artificial-ly introduced by global signal regression, a preprocessing technique forremoving physiological and other noise in fMRI BOLD time series(Aguirre et al., 1997, 1998; Desjardins et al., 2001; Macey et al., 2004;Zarahn et al., 1997). Global signal, the average signal across all voxelsin the brain, is removed in some fMRI studies to correct for physiologicalnoise, such as respiratory and cardiac noise, under the assumption thatglobal signal is not correlated with task-induced signal. However, whenglobal signal is influence by experimental manipulations, removing

1421X.J. Chai et al. / NeuroImage 59 (2012) 1420–1428
global signal can decrease task-related activation in fMRI studies(Aguirre et al., 1998; Junghofer et al., 2005). In seed-based resting-state fMRI analysis, physiological noise and signal fluctuation causedby residual motion and other artifacts can introduce spurious correla-tion among brain regions and result in overestimation of connectivity.Global signal is commonly removed using a general linear model(GLM) technique to improve the specificity of functional connectivityanalysis (Fox et al., 2005; Van Dijk et al., 2010; Weissenbacher et al.,2009). However, global signal regression shifts the distribution of thecorrelation values of a seed region toward the negative direction suchthat they must sum to less than zero (Murphy et al., 2009). It hasbeen suggested that anticorrelations in resting-state connectivity aremost likely artificially introduced by global signal regression, callinginto question of the functional significance of anticorrelations observedin resting-state connectivity (Murphy et al., 2009). Previous studieshave not reached a consistent conclusion on this issue (Chang andGlover,2009; Fox et al., 2009; Hampson et al., 2010; Van Dijk et al., 2010;Weissenbacher et al., 2009).
In the present study, we examined positive and negative correla-tions in resting-state connectivity using a component base noise re-duction method (CompCor) (Behzadi et al., 2007). The CompCormethod corrects for physiological noise by regressing out principalcomponents from noise regions-of-interest (ROI), such as the whitematter and cerebral spinal fluid (CSF) regions, in which signal is un-likely to be related to neural activity. Compared to the average signalfrom white matter and CSF regions, principal components derivedfrom these noise ROIs can better account for voxel-specific phase dif-ferences in physiological noise. Applying CompCor to BOLD time se-ries significantly reduced noise from physiological and other sources(Behzadi et al., 2007). Here we compared functional connectivityfrom a default mode network seed region in the medial prefrontalcortex (MPFC) under two separate preprocessing streams: the Comp-Cor approach that does not remove global signal, and the whole brainregression method in which the global signal was removed. We hy-pothesized that anticorrelations from the MPFC seed should emergewithout global signal regression, when physiological and other spuri-ous noise are effectively removed using the CompCor approach.
Materials and methods
Participants
Fifteen healthy participants (mean age: 37.3±2.4, 9 males) wereincluded in the study. All participants were right-handed, had no his-tory of psychiatric or neurological illness as confirmed by a psychiat-ric clinical assessment. The study was approved by the institutionalreview boards of McLean Hospital. Signed informed consent wasobtained prior to participation.
Imaging procedure
Data were acquired on a 3T Siemens scanner using a standard headcoil. T1-weighted whole brain anatomy images (MPRAGE sequence,256×256 voxels, 1×1.3-mm inplane resolution, 1.3-mm slice thick-ness) were acquired. In addition, all participants underwent a restingfunctional MRI scan of 10 min with the instructions “keep your eyesopen and think of nothing in particular”. Resting scan images wereobtained in 42 3.5-mm thick transverse slices, covering the entirebrain (interleaved EPI sequence, T2*-weighted images; 3.5-mm inplaneresolution, repetition time=2.5 s, echo time=24ms, flip angle=82,64×64 voxels).
Data analysis
Resting-state fMRI data were first preprocessed in SPM5 (WellcomeDepartment of Imaging Neuroscience, London, UK; http://www.fil.ion.
ucl.ac.uk/spm), using standard spatial preprocessing steps. Images wereslice-time corrected, realigned and resliced into 2 mm isotropic voxels,normalized, smoothed with a 4-mm kernel.
Connectivity analysisFunctional connectivity analysis was performed using a seed-
driven approach with in-house, custom software “Conn toolbox”(Whitfield-Gabrieli and Nieto-Castanon, submitted for publication)(http://web.mit.edu/swg/software/). We defined the MPFC seed fol-lowing the literature (Fox et al., 2005; Whitfield-Gabrieli et al.,2009) as a 10-mm sphere around the coordinates (−1, 49, −2) inMontreal Neurological Institute (MNI) space. Physiological andother spurious sources of noise were removed using two separatepreprocessing approaches described below (Fig. 1). A temporalband-pass filter of 0.009 Hz to 0.08 Hz was applied. Residual headmotion parameters (3 rotation and 3 translation parameters, plus an-other 6 parameters representing their first-order temporal deriva-tives) were regressed out.
Whole brain signal regression (WB-reg). The average signal over allvoxels (global mean) was computed for each time point and used asa temporal covariate and removed using linear regression. In addi-tion, signal from a 10-mm sphere ROI located in the center of thewhite matter and signal from the lateral ventricle were also removed(Fox et al., 2005; Vincent et al., 2006).
Anatomical CompCor (without global signal regression). Instead of re-moving the global signal, non-neuronal sources of noise were esti-mated and removed using the anatomical CompCor method(aCompCor) (Behzadi et al., 2007). The anatomical image for eachparticipant was segmented into white matter (WM), gray matter,and CSF masks using SPM5. To minimize partial voluming with graymatter, the WM and CSF masks were eroded by one voxel and usedas noise regions of interest (ROI) (Fig. S1a). The average volume ofthe white matter ROI before and after the one-voxel erosion was622 cm3 and 198 cm3, respectively (68% of white matter voxelswere removed by the erosion process). The average CSF ROI volumebefore and after the one-voxel erosion was 436 cm3 and 20 cm3, re-spectively (96% of CSF voxels were removed by erosion). The averagevolume of the whole-brain mask that was used to estimate global sig-nal was 1831 cm3. Principal components of the signals from WM andCSF noise ROIs were removed with regression. Signals from the WMand CSF ROIs were always extracted from the unsmoothed functionalvolumes.
We examined the connectivity maps after removing 1, 3, 5, or 10principal components (PCA1–PCA10) from the WM and CSF noiseROIs in order to determine the optimal configuration of the aCompCorapproach for resting-state connectivity analysis.
Correlation maps were produced by extracting the residual bloodoxygen level-dependent (BOLD) time course from the MPFC seedand computing Pearson's correlation coefficients between that timecourse and the time course of all other voxels. Correlation coefficientswere converted to normally distributed z-scores using the Fishertransformation to allow for second-level General Linear Model ana-lyses. For each preprocessing stream, the group connectivity mapwas created by performing a random effects one-sample t-test acrossall participants.
Creation of ROIsTo compare across different preprocessing methods, we created
ROIs for representative regions that were positively correlated oranticorrelated with the MPFC seed, following Fox et al. (2005). Thepositively correlated ROIs included major nodes of the default modenetwork, the medial prefrontal cortex (MPFC), posterior cingulatecortex (PCC), left lateral parietal cortex (LLP), and right later parietalcortex (RLP). Anticorrelated ROIs included the left and right

Fig. 1. Illustration of the data analysis methods. The two preprocessing methods are shown in the boxes.
1422 X.J. Chai et al. / NeuroImage 59 (2012) 1420–1428
dorsolateral prefrontal cortex (DLPFC), left and right inferior parietallobule (IPL), supplementary motor area (SMA), and frontal eye field(FEF). The ROIs were created using the following steps: 1) Group-level connectivity maps from each method (whole brain regression,and 4 aCompCor preprocessing streams with 1, 3, 5, and 10 PCA
6000
5000
4000
3000
2000
1000
06000
5000
4000
3000
2000
1000
0900080007000600050004000300020001000
0900080007000600050004000300020001000
0-0
Bandpassfilter
Movementregression
Whole brainregression
aCompCor(PCA5)
1.0 -0.4
0.2 -0.1
Num
ber
of v
oxel
s
Fig. 2. Connectivity maps (left panel) and correlations values
components from the noise ROIs) were created. 2) A mask forpositively-correlated regions and a mask for anticorrelated regionswere created for each method from the connectivity map with thethreshold of pb0.001, uncorrected. 3) A union operation was per-formed in SPM Imcalc on masks from all methods to create a combined
.4 -0.2 0.2 0.4 0.6 0.8 10
Correlation values
distribution (right panel) after each preprocessing step.

1423X.J. Chai et al. / NeuroImage 59 (2012) 1420–1428
mask for correlated regions and a combinedmask for anticorrelated re-gions across differentmethods. 4) Each ROIwas restricted with the cor-responding Brodmann area(s) from Fox et al. (2005). These ROIs forpositively correlated and anticorrelated regions with MPFC (Fig. 4)were later used to further examine the connectivity magnitude andspecificity of different preprocessing approaches via pair-wise t-tests. The rationale for using the union masks was to make sure we in-cluded regions that were only present for a subset of themethods. Sincethe CompCor approach which regressed out only one principal noisesignal component did not result in significant negative correlations inseveral task-positive regions, a unionmaskwas used to examine the dif-ferences among the different analyses. To examine the positive connec-tivity strengths in more restricted ROIs, we re-created the MPFC andPCC ROIs as intersections of the correlation maps from differentmethods, using a more strict threshold (pb0.05 FWE-corrected)(Fig. S4).
Specificity comparison of the different preprocessing streamsTo examine the specificity of each preprocessing approach, we
compared connectivity values from regions showing significant cor-relation or anticorrelation with the MPFC seed, with connectivityvalues between the MPFC seed and two reference regions in the visu-al cortex (Van Dijk et al., 2010) in which no correlation is expectedwith the MPFC. The reference regions were 10-mm spheres thatwere centered around MNI coordinates (−30, −88, 0) and (30, 88,0). Following Weissenbacher et al. (2009), we define specificity as
Starget ¼Ztarget���
���−jZreferencej
Ztarget���
���þ jZreferencej
Ztarget is the group-level Fisher's Z score from the MPFC to theanticorrelated or positive correlated ROIs described above. Zreferencerepresents the average Fisher's Z scores from MPFC to the left andright visual reference regions. Specificity of the target ROI Stargetranges from −1 to 1.
Fig. 3. Functional connectivity maps from the MPFC seed across all participants. a) whole brain
To compare the specificity for different methods, we use a boot-strapping procedure (resampling with replacement). The resamplingtechnique consisted of creating a high number (10^6) of new datasetsfrom the original dataset by resampling with replacement across sub-jects. Each new dataset consisted of 15 data points, obtained from theoriginal data by choosing 15 subjects at random. Then for each ofthese new datasets, specificity from the group-level averages wascomputed. The resulting distribution of values represents theexpected distribution of specificity values in the population. Hypoth-esis test p-values were obtained by computing the correspondingpercentages in the obtained distributions (e.g. the p-value for com-paring the specificity for the PCA1 method vs. the specificity for thewhole brain regression method was obtained by computing the per-centage of times, from the multiple datasets, where the specificityresulting from the PCA1 method was higher than the specificityresulting from the whole brain regression method). p-values oftwo-sided tests are reported.
Results
The distribution of the correlation values before and after wholebrain signal regression or aCompCor preprocessing is shown inFig. 2. Correlation values were predominantly in the positive rangebefore whole brain regression or aCompCor. Whole brain regressionshifted the distribution toward the negative range.
Regions positively correlated with the MPFC seed, including theposterior cingulate cortex, left and right lateral parietal cortices, bilat-eral parahippocampal gyri, bilateral inferior temporal cortices, wereconsistent across both the whole brain regression and aCompCor ap-proaches. Regions anticorrelated with the MPFC, including bilateralDLPFC, bilateral IPL, SMA, and FEF, were present under both thewhole brain regression approach and the aCompCor processingstreams when more than one PCA components were removed(Table 1, Fig. 3). These positively and negatively correlated regionscorresponded closely to previously reported default mode and task-positive networks (Fox et al., 2005; Fransson, 2005).
regression b) aCompCor, regressing out 5 principal components of the noise ROIs signal.

Table 1Group-level peak t-values of the regions negatively (top) and positively (bottom) cor-related with the MPFC seed for the whole brain regression (WB-reg) and aCompCormethods. The aCompCor results are shown separately after regressing out 1, 3, 5, or10 principal components (PCA1, PCA3, PCA5, and PCA10) from noise ROIs. Regionslisted survived a height threshold of pb0.001, and an extent threshold of FWE-corrected pb0.05 at the cluster-level, unless noted otherwise by * voxel-level FDR cor-rected at pb0.05 but did not survive the cluster-level correction.
WB-reg
aCompCor
PCA1 PCA3 PCA5 PCA10
Anticorrelated regions L DLPFC 10.84 n.s. 7.02 9.67 7.92R DLPFC 9.73 n.s. 8.17 7.23 6.44L IPL 10.53 8.76 8.67 10.21 12.25R IPL 8.18 6.07 7.55 7.90 6.96SMA 8.02 n.s. 5.40⁎ 6.48 5.87R FEF 7.44 n.s 5.79⁎ 5.93⁎ 6.06
Positive-correlated regions MPFC 22.06 24.19 22.78 24.65 20.72PCC 14.58 18.03 16.24 15.91 13.83L LP 8.47 9.76 10.66 8.53 6.79R LP 7.18 12.88 10.16 8.81 7.80L PHG 9.96 11.13 10.41 9.63 8.75R PHG 8.08 10.02 11.19 11.34 9.15L IT 10.50 10.07 9.51 7.35 8.22R IT 9.40 11.48 8.92 8.36 10.32
1424 X.J. Chai et al. / NeuroImage 59 (2012) 1420–1428
We further investigated the magnitude and specificity of the con-nectivity values of each processing stream in subsequent ROI analysis,using masks for correlated and anticorrelated regions describedabove (Fig. 4).
Magnitude of connectivity (Fig. 5)
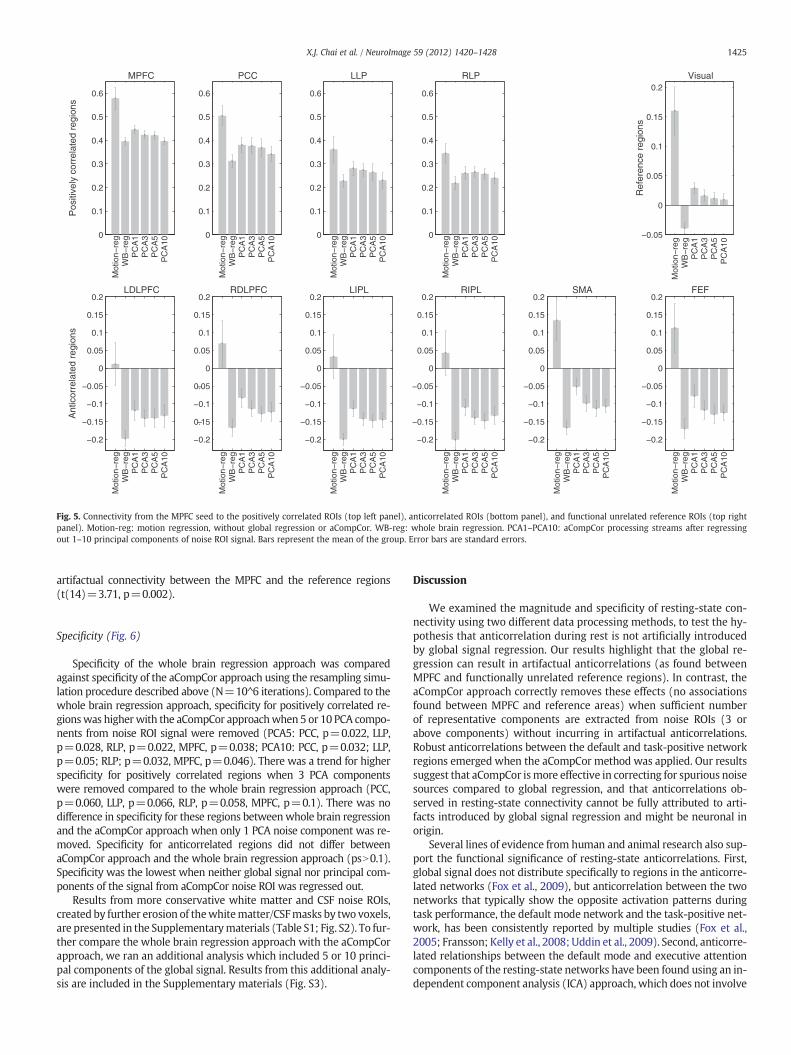
Positively correlated regionsCompared to the whole brain regression method, positive correla-
tions were significantly higher or trended toward significance withthe aCompCor approach when 1 (PCA1: MPFC, p=0.0002, PCC,p=0.0004, LLP, p=0.003, RLP p=0.008), 3 (PCA3: MPFC, p=0.018,
Fig. 4. Regions of interest used in the comparison of different analysis m
PCC, p=0.003, LLP, p=0.009, RLP p=0.004), or 5 (PCA5: MPFC,p=0.06, PCC, p=0.02, LLP: p=0.1, RLP, p=0.07) principal compo-nents from the noise ROIs were removed. When neither global signalnor principal components of the signal from aCompCor noise ROI wasregressed out, positive correlations were much higher, which reflectedthe overestimation of correlations due to noise (Fig. 2).
Anticorrelated regionsCompared to the whole brain regression approach, anticorrelation
strengths were less strong under the aCompCor processing streams(psb0.05). Nevertheless, anticorrelations between the MPFC seedand all 6 anticorrelation ROIs were significant with the aCompCor ap-proach when 3, 5, or 10 PCA components were removed (PCA3–5)(psb0.001). When only the first noise PCA component was removed(PCA1), inferior parietal lobule ROIs (left and right IPL) were anticor-related with the MPFC seed at pb0.001 level, while the anticorrelationbetweenMPFC and DLPFC regions (psb0.005) and FEF (p=0.03) wereless strong. The SMA anticorrelationwithMPFC seedwas not significantwhen only the first principal component was removed (p=0.11). Nonegative correlations emerged when neither global signal nor principalcomponents of the signal from aCompCor noise ROIwere regressed out.
Reference regionsConnectivity from MPFC to functionally unrelated regions (in which
neither positive nor negative correlations were expected) was assessedusing the average connectivity between theMPFC and the two visual ref-erence regions (10-mm spheres around (−30,−88, 0) and (30, 88, 0))(Van Dijk et al., 2010). There was artifactual anticorrelation betweenMPFC and the reference regions when the whole brain regression ap-proach was applied (t(14)=3.99, p=0.001). With the aCompCor ap-proach, connectivity values between MPFC and the reference regionswere not significant when 3, 5, or 10 noise principal components wereremoved (PCA3–10) (psN0.14). When a single principal componentfrom noise ROIs was removed (PCA1), there was artifactual connectivitybetween MPFC and the reference regions (t(14)=3.21, p=0.006).When neither global signal nor principal components of the signalfrom aCompCor noise ROI was regressed out, we also observed
ethods. Yellow: positively-correlated ROIs. Blue: anticorrelated ROI.
0
0.1
0.2
0.3
0.4
0.5
0.6
Mot
ion−
reg
WB
−re
gP
CA
1P
CA
3P
CA
5P
CA
10
Pos
itive
ly c
orre
late
d re
gion
sMPFC
0
0.1
0.2
0.3
0.4
0.5
0.6
Mot
ion−
reg
WB
−re
gP
CA
1P
CA
3P
CA
5P
CA
10
PCC
0
0.1
0.2
0.3
0.4
0.5
0.6
Mot
ion−
reg
WB
−re
gP
CA
1P
CA
3P
CA
5P
CA
10
LLP
0
0.1
0.2
0.3
0.4
0.5
0.6
Mot
ion−
reg
WB
−re
gP
CA
1P
CA
3P
CA
5P
CA
10
RLP
−0.2
−0.15
−0.1
−0.05
0
0.05
0.1
0.15
0.2
Mot
ion−
reg
WB
−re
gP
CA
1P
CA
3P
CA
5P
CA
10
Ant
icor
rela
ted
regi
ons
LDLPFC
−0.2
−0.15
−0.1
−0.05
0
0.05
0.1
0.15
0.2
Mot
ion−
reg
WB
−re
gP
CA
1P
CA
3P
CA
5P
CA
10
RDLPFC
−0.2
−0.15
−0.1
−0.05
0
0.05
0.1
0.15
0.2
Mot
ion−
reg
WB
−re
gP
CA
1P
CA
3P
CA
5P
CA
10
LIPL
−0.2
−0.15
−0.1
−0.05
0
0.05
0.1
0.15
0.2
Mot
ion−
reg
WB
−re
gP
CA
1P
CA
3P
CA
5P
CA
10
RIPL
−0.2
−0.15
−0.1
−0.05
0
0.05
0.1
0.15
0.2
Mot
ion−
reg
WB
−re
gP
CA
1P
CA
3P
CA
5P
CA
10
SMA
−0.2
−0.15
−0.1
−0.05
0
0.05
0.1
0.15
0.2
Mot
ion−
reg
WB
−re
gP
CA
1P
CA
3P
CA
5P
CA
10
FEF
−0.05
0
0.05
0.1
0.15
0.2
Mot
ion−
reg
WB
−re
gP
CA
1P
CA
3P
CA
5P
CA
10
Ref
eren
ce r
egio
ns
Visual
Fig. 5. Connectivity from the MPFC seed to the positively correlated ROIs (top left panel), anticorrelated ROIs (bottom panel), and functional unrelated reference ROIs (top rightpanel). Motion-reg: motion regression, without global regression or aCompCor. WB-reg: whole brain regression. PCA1–PCA10: aCompCor processing streams after regressingout 1–10 principal components of noise ROI signal. Bars represent the mean of the group. Error bars are standard errors.
1425X.J. Chai et al. / NeuroImage 59 (2012) 1420–1428
artifactual connectivity between the MPFC and the reference regions(t(14)=3.71, p=0.002).
Specificity (Fig. 6)
Specificity of the whole brain regression approach was comparedagainst specificity of the aCompCor approach using the resampling simu-lation procedure described above (N=10^6 iterations). Compared to thewhole brain regression approach, specificity for positively correlated re-gionswas higherwith the aCompCor approachwhen 5 or 10 PCA compo-nents from noise ROI signal were removed (PCA5: PCC, p=0.022, LLP,p=0.028, RLP, p=0.022, MPFC, p=0.038; PCA10: PCC, p=0.032; LLP,p=0.05; RLP; p=0.032, MPFC, p=0.046). There was a trend for higherspecificity for positively correlated regions when 3 PCA componentswere removed compared to the whole brain regression approach (PCC,p=0.060, LLP, p=0.066, RLP, p=0.058, MPFC, p=0.1). There was nodifference in specificity for these regions betweenwhole brain regressionand the aCompCor approach when only 1 PCA noise component was re-moved. Specificity for anticorrelated regions did not differ betweenaCompCor approach and the whole brain regression approach (psN0.1).Specificity was the lowest when neither global signal nor principal com-ponents of the signal from aCompCor noise ROI was regressed out.
Results from more conservative white matter and CSF noise ROIs,created by further erosion of thewhitematter/CSFmasks by two voxels,are presented in the Supplementarymaterials (Table S1; Fig. S2). To fur-ther compare the whole brain regression approach with the aCompCorapproach, we ran an additional analysis which included 5 or 10 princi-pal components of the global signal. Results from this additional analy-sis are included in the Supplementary materials (Fig. S3).
Discussion
We examined the magnitude and specificity of resting-state con-nectivity using two different data processing methods, to test the hy-pothesis that anticorrelation during rest is not artificially introducedby global signal regression. Our results highlight that the global re-gression can result in artifactual anticorrelations (as found betweenMPFC and functionally unrelated reference regions). In contrast, theaCompCor approach correctly removes these effects (no associationsfound between MPFC and reference areas) when sufficient numberof representative components are extracted from noise ROIs (3 orabove components) without incurring in artifactual anticorrelations.Robust anticorrelations between the default and task-positive networkregions emerged when the aCompCor method was applied. Our resultssuggest that aCompCor ismore effective in correcting for spurious noisesources compared to global regression, and that anticorrelations ob-served in resting-state connectivity cannot be fully attributed to arti-facts introduced by global signal regression and might be neuronal inorigin.
Several lines of evidence from human and animal research also sup-port the functional significance of resting-state anticorrelations. First,global signal does not distribute specifically to regions in the anticorre-lated networks (Fox et al., 2009), but anticorrelation between the twonetworks that typically show the opposite activation patterns duringtask performance, the default mode network and the task-positive net-work, has been consistently reported by multiple studies (Fox et al.,2005; Fransson; Kelly et al., 2008; Uddin et al., 2009). Second, anticorre-lated relationships between the default mode and executive attentioncomponents of the resting-state networks have been found using an in-dependent component analysis (ICA) approach, which does not involve

0
0.2
0.4
0.6
0.8
1
Mot
ion−
reg
WB
−re
gP
CA
1P
CA
3P
CA
5P
CA
10
Pos
itive
ly c
orre
late
d re
gion
s
MPFC PCC
Mot
ion−
reg
WB
−re
gP
CA
1P
CA
3P
CA
5P
CA
10
LLP
Mot
ion−
reg
WB
−re
gP
CA
1P
CA
3P
CA
5P
CA
10
RLP
−1
−0.5
0
0.5
1
−1
−0.5
0
0.5
1
−1
−0.5
0
0.5
1
Ant
icor
rela
ted
regi
ons
LDLPFC RDLPFC LIPL RIPL SMA FEF
Mot
ion−
reg
WB
−re
gP
CA
1P
CA
3P
CA
5P
CA
10
Mot
ion−
reg
WB
−re
gP
CA
1P
CA
3P
CA
5P
CA
10
Mot
ion−
reg
WB
−re
gP
CA
1P
CA
3P
CA
5P
CA
10
Mot
ion−
reg
WB
−re
gP
CA
1P
CA
3P
CA
5P
CA
10
Mot
ion−
reg
WB
−re
gP
CA
1P
CA
3P
CA
5P
CA
10
Mot
ion−
reg
WB
−re
gP
CA
1P
CA
3P
CA
5P
CA
10
Mot
ion−
reg
WB
−re
gP
CA
1P
CA
3P
CA
5P
CA
10
−1
−0.5
0
0.5
1
−1
−0.5
0
0.5
1
−1
−0.5
0
0.5
1
0
0.2
0.4
0.6
0.8
1
0
0.2
0.4
0.6
0.8
1
0
0.2
0.4
0.6
0.8
1
Fig. 6. Specificity for positively correlated (top) and anticorrelated (bottom) ROIs. Motion-reg: motion regression, without global regression or aCompCor. WB-reg: whole brainregression. PCA1–PCA10: aCompCor processing streams after regressing out 1–10 principal components of noise ROI signal. Error bars are standard errors.
1426 X.J. Chai et al. / NeuroImage 59 (2012) 1420–1428
global signal regression (Cole et al., 2010; Zuo et al., 2010). Third, com-putational simulations of monkey and human brains suggest existenceof spontaneous anticorrelated networks (Deco et al., 2009; Honeyet al., 2007; Izhikevich and Edelman, 2008). Finally, neuronal originsof the anticorrelated fluctuations in the BOLD signals have been ex-plored by electrophysiological work in cats, in which anticorrelatedfluctuations of local field potential have been shown between homologsof the task-positive and defaultmode systems in cats (Popa et al., 2009).
Compared to the whole brain regression preprocessing method, ourresults suggest that a preprocessing stream using aCompCor, combinedwith the bandpass filtering and modeling of movement parameters,may provide better sensitivity and specificity to detect positive correla-tions in resting-state networks, while anticorrelations under theaCompCor approach are similar to those with global signal regression.Physiological and subject-movement noise sources are known to intro-duce artifactual positive associations between potentially unconnectedareas. When attempting to correct for these spurious effects our ana-lyses show, in agreement with Murphy et al.'s (2009) rationale, thatthe global signal regressionmethod can effectively overshoot and intro-duce artifactual negative associations (as found between MPFC andfunctionally unrelated reference regions), while the aCompCor methodprovides a more valid control (showing no associations between MPFCand reference regions). Also in agreement with Murphy et al.'s ratio-nale, the connectivity between positively associated regions (e.g.,MPFC and PCC) seems to be undersestimated when using global signalregression, compared to the aCompCor method. One possible explana-tion for the higher positive correlations under aCompCor is that theglobal signal may contain neural signal (Scholvinck et al., 2010), andtherefore removing the global signal will reduce the estimated effectsas well as the power to detect positive correlations. Moreover, thenon-homogeneous distribution of noise in the brain is not captured bythe global signal, but is potentially represented by the higher orderprincipal components from the noise ROIs, which is consistent withour results showing that a single principal component from the noiseROIs only partially but not fully removes artifactual associations be-tween MPFC and the reference regions. Since global signal regression
shifts the correlation coefficients distribution to the more negativerange, it is also not surprising to see anticorrelation strengths to bethe strongest under global signal regression.
Alternative physiological noise correction methods have beenused to examine anticorrelations in resting-state fMRI data (Changand Glover, 2009). Chang and Glover (2009) tested the effects of re-moving time-locked cardiac and respiratory artifacts (RETROICOR)(Glover et al., 2000) and low-frequency respiratory and heart rate ef-fects (Birn et al., 2008; Chang et al., 2009). Physiological noise correctionenhanced the extent of negative correlations. Here we showed thataCompCor was effective in characterizing noise of non-neural origin,yielding robust group-level anticorrelations. It is possible that otherphysiological noise not modeled by Chang and Glover (2009), such asnonlinear interactions between respiratory and cardiac effects, may becaptured in aCompCor. The two approaches combined together mightprovide even better noise correction in resting-state fMRI data analysis.
Negative correlations are in general weaker in magnitude thanpositive correlations. This could be due to the more varied temporaldynamics of anticorrelations compared to positive correlations inresting-state BOLD connectivity. Chang and Glover (2010) showedthat the degree of anticorrelation between the default mode networkand the task-positive network exhibited considerable fluctuationwithin the course of a single session. Furthermore, the dynamic inter-actions between the default mode and executive control networkhave been shown to be modulated by nicotine administration in ab-stinent smokers (Cole et al., 2010). Variability in the strength of theanticorrelation between the default mode and executive control net-works was linked with individual differences in symptom improve-ment after nicotine replacement therapy, suggesting the functionalsignificance of state-dependent dynamics in anticorrelations betweenthe two networks (Cole et al., 2010). The majority of the studies so farhave only tested stationary relationships in resting state connectivity.Future studies are needed to better understand the temporal dynam-ics between brain regions in the resting state.
When higher numbers of principal components from the noiseROIs were regressed out, artifactual connectivity between the MPFC

1427X.J. Chai et al. / NeuroImage 59 (2012) 1420–1428
and functionally unrelated (reference) regions was reduced, suggest-ing that removing higher number of PCA components resulted inmore effective noise correction. Residual confounding effects intro-duced by physiological and subject motion are not spatially homoge-neous enough to be captured by a single temporal component. Highernumber of PCA components allows these noise effects to be character-ized by a more complex set of temporal series and effectively removed,which eliminated the artifactual correlations in the reference regions.However regressing out too many PCA components (10 components)seemed to reduce correlation strengths, especially positive correlations,at a similar rate as the reduction observed in the reference region. This isreflected in the approximate saturation of the specificity results (Fig. 6)when extracting 5 or above components from each noise ROI. This sat-uration effect is consistent with the findings from Behzadi et al. (2007)which estimated the number significant components for to be around 6.It is possible that higher PCA components from the noise ROI may sharespectral characteristicswith the neural signalwhich, pairedwith the as-sociated reduction in degrees of freedom, may limit the benefits of re-moving additional components from the noise ROIs. It is possible thatthe noise signal estimated from the WM/CSF masks still overlapped ina small portion with signal from gray matter. However the extent ofthe contamination from gray matter signal should be minimal com-pared to the global regression method. If the WM/CSF regressorsshare a significant portion of its variance with the global signal regres-sor, one would expect similar patterns of correlations when comparingthe aCompCormethod to amethod that removes principal componentsobtained fromwhole-brain voxels. In contrast we observe faster reduc-tion in spurious correlationswith reference regions and slower decay ofcorrelationswith positively and negatively correlated areaswhen usingthe aCompCor method compared to regressing out principal compo-nents of the global signal (Fig. S3). This suggests that there are impor-tant qualitative differences between those signals represented by theaCompCor components and the global signal. Using more restrictivenoise ROIs masks created by eroding theWM/CSF masks by two voxels,we showed that significant anticorrelations to task-positive regions stillemergedwhen higher number of principal components were regressedout (Fig. S2). Thereforewe believe the CompCormethod is a reasonablealternative to the global regression method, whichmathematically cre-ates artifactual negative correlations, as shown byMurphy et al. (2009).Based on the present analysis, we propose that removing 5 principalcomponents from noise ROIs, modeling residual motion, and perform-ing temporal pass-filtering are recommended in a resting-state connec-tivity preprocessing stream.
In conclusion, we demonstrated that when physiological and othernoise sources were effectively removed, anticorrelations between thedefault network and task-positive networkwere presentwithout globalsignal regression and therefore may be of biological importance. Futurework in resting state connectivity should consider noise correctionmethods without global signal regression, such as the one presentedin the present study, possibly in combination other physiological noisecorrection methods such as the ones described in Chang and Glover(2009).
Acknowledgments
This research was supported by 5K23MH079982-03 (Dr. Öngür)from the National Institute of Mental Health and by the Poitras Centerfor Affective Disorders Research at the McGovern Institute for BrainResearch at MIT. The authors declare no financial interests or poten-tial conflicts of interest with this work.
Appendix A. Supplementary data
Supplementary data to this article can be found online at doi:10.1016/j.neuroimage.2011.08.048.
References
Aguirre, G.K., Zarahn, E., D'Esposito, M., 1997. Empirical analyses of BOLD fMRI statis-tics. II. Spatially smoothed data collected under null-hypothesis and experimentalconditions. Neuroimage 5, 199–212.
Aguirre, G.K., Zarahn, E., D'Esposito, M., 1998. The inferential impact of global signalcovariates in functional neuroimaging analyses. Neuroimage 8, 302–306.
Beckmann, C.F., DeLuca, M., Devlin, J.T., Smith, S.M., 2005. Investigations into resting-state connectivity using independent component analysis. Philos. Trans. R. Soc.Lond. B Biol. Sci. 360, 1001–1013.
Behzadi, Y., Restom, K., Liau, J., Liu, T.T., 2007. A component based noise correctionmethod (CompCor) for BOLD and perfusion based fMRI. Neuroimage 37, 90–101.
Birn, R.M., Smith, M.A., Jones, T.B., Bandettini, P.A., 2008. The respiration response func-tion: the temporal dynamics of fMRI signal fluctuations related to changes in res-piration. Neuroimage 40, 644–654.
Biswal, B., Yetkin, F.Z., Haughton, V.M., Hyde, J.S., 1995. Functional connectivity in themotor cortex of resting human brain using echo-planar MRI. Magn. Reson. Med.34, 537–541.
Buckner, R.L., Andrews-Hanna, J.R., Schacter, D.L., 2008. The brain's default net-work: anatomy, function, and relevance to disease. Ann. N. Y. Acad. Sci. 1124,1–38.
Castellanos, F.X., Margulies, D.S., Kelly, C., Uddin, L.Q., Ghaffari, M., Kirsch, A., Shaw, D.,Shehzad, Z., Di Martino, A., Biswal, B., Sonuga-Barke, E.J., Rotrosen, J., Adler, L.A.,Milham, M.P., 2008. Cingulate-precuneus interactions: a new locus of dysfunc-tion in adult attention-deficit/hyperactivity disorder. Biol. Psychiatry 63,332–337.
Chai, X.J., Whitfield-Gabrieli, S., Shinn, A.K., Gabrieli, J.D.E., Nieto Castanon, A., McCar-thy, J.M., Cohen, B.M., Öngür, D., 2011. Abnormal medial prefrontal cortexresting-state connectivity in bipolar disorder and schizophrenia. Neuropsycho-pharmacology 36, 2009–2017.
Chang, C., Cunningham, J.P., Glover, G.H., 2009. Influence of heart rate on the BOLD sig-nal: the cardiac response function. Neuroimage 44, 857–869.
Chang, C., Glover, G.H., 2009. Effects of model-based physiological noise correctionon default mode network anti-correlations and correlations. Neuroimage 47,1448–1459.
Chang, C., Glover, G.H., 2010. Time-frequency dynamics of resting-state brain connec-tivity measured with fMRI. Neuroimage 50, 81–98.
Cole, D.M., Beckmann, C.F., Long, C.J., Matthews, P.M., Durcan, M.J., Beaver, J.D., 2010.Nicotine replacement in abstinent smokers improves cognitive withdrawal symp-toms with modulation of resting brain network dynamics. Neuroimage 52,590–599.
Damoiseaux, J.S., Rombouts, S.A., Barkhof, F., Scheltens, P., Stam, C.J., Smith, S.M., Beck-mann, C.F., 2006. Consistent resting-state networks across healthy subjects. Proc.Natl. Acad. Sci. U. S. A. 103, 13848–13853.
De Luca, M., Beckmann, C.F., De Stefano, N., Matthews, P.M., Smith, S.M., 2006. fMRIresting state networks define distinct modes of long-distance interactions in thehuman brain. Neuroimage 29, 1359–1367.
Deco, G., Jirsa, V., McIntosh, A.R., Sporns, O., Kotter, R., 2009. Key role of coupling,delay, and noise in resting brain fluctuations. Proc. Natl. Acad. Sci. U. S. A. 106,10302–10307.
Desjardins, A.E., Kiehl, K.A., Liddle, P.F., 2001. Removal of confounding effects of globalsignal in functional MRI analyses. Neuroimage 13, 751–758.
Dosenbach, N.U., Nardos, B., Cohen, A.L., Fair, D.A., Power, J.D., Church, J.A., Nelson, S.M.,Wig, G.S., Vogel, A.C., Lessov-Schlaggar, C.N., Barnes, K.A., Dubis, J.W., Feczko, E.,Coalson, R.S., Pruett Jr., J.R., Barch, D.M., Petersen, S.E., Schlaggar, B.L., 2010.Prediction of individual brain maturity using fMRI. Science 329, 1358–1361.
Fox, M.D., Raichle, M.E., 2007. Spontaneous fluctuations in brain activity observed withfunctional magnetic resonance imaging. Nat. Rev. Neurosci. 8, 700–711.
Fox, M.D., Snyder, A.Z., Vincent, J.L., Corbetta, M., Van Essen, D.C., Raichle, M.E., 2005.The human brain is intrinsically organized into dynamic, anticorrelated functionalnetworks. Proc. Natl. Acad. Sci. U. S. A. 102, 9673–9678.
Fox, M.D., Zhang, D., Snyder, A.Z., Raichle, M.E., 2009. The global signal and observedanticorrelated resting state brain networks. J. Neurophysiol. 101, 3270–3283.
Fransson, P., 2005. Spontaneous low-frequency BOLD signal fluctuations: an fMRI in-vestigation of the resting-state default mode of brain function hypothesis. Hum.Brain Mapp. 26, 15–29.
Glover, G.H., Li, T.Q., Ress, D., 2000. Image-based method for retrospective correc-tion of physiological motion effects in fMRI: RETROICOR. Magn. Reson. Med.44, 162–167.
Greicius, M.D., Krasnow, B., Reiss, A.L., Menon, V., 2003. Functional connectivity in theresting brain: a network analysis of the default mode hypothesis. Proc. Natl. Acad.Sci. U. S. A. 100, 253–258.
Hampson, M., Driesen, N., Roth, J.K., Gore, J.C., Constable, R.T., 2010. Functional connec-tivity between task-positive and task-negative brain areas and its relation to work-ing memory performance. Magn. Reson. Imaging 28, 1051–1057.
Honey, C.J., Kotter, R., Breakspear, M., Sporns, O., 2007. Network structure of cerebralcortex shapes functional connectivity on multiple time scales. Proc. Natl. Acad.Sci. U. S. A. 104, 10240–10245.
Izhikevich, E.M., Edelman, G.M., 2008. Large-scale model of mammalian thalamocorti-cal systems. Proc. Natl. Acad. Sci. U. S. A. 105, 3593–3598.
Junghofer, M., Schupp, H.T., Stark, R., Vaitl, D., 2005. Neuroimaging of emotion: empir-ical effects of proportional global signal scaling in fMRI data analysis. Neuroimage25, 520–526.
Kelly, A.M., Uddin, L.Q., Biswal, B.B., Castellanos, F.X., Milham, M.P., 2008. Competitionbetween functional brain networks mediates behavioral variability. Neuroimage39, 527–537.

1428 X.J. Chai et al. / NeuroImage 59 (2012) 1420–1428
Macey, P.M., Macey, K.E., Kumar, R., Harper, R.M., 2004. A method for removal of globaleffects from fMRI time series. Neuroimage 22, 360–366.
Mennes, M., Kelly, C., Zuo, X.N., Di Martino, A., Biswal, B.B., Castellanos, F.X., Milham,M.P., 2010. Inter-individual differences in resting-state functional connectivitypredict task-induced BOLD activity. Neuroimage 50, 1690–1701.
Murphy, K., Birn, R.M., Handwerker, D.A., Jones, T.B., Bandettini, P.A., 2009. The impactof global signal regression on resting state correlations: are anti-correlated net-works introduced? Neuroimage 44, 893–905.
Popa, D., Popescu, A.T., Pare, D., 2009. Contrasting activity profile of two distributedcortical networks as a function of attentional demands. J. Neurosci. 29, 1191–1201.
Scholvinck, M.L., Maier, A., Ye, F.Q., Duyn, J.H., Leopold, D.A., 2010. Neural basis of glob-al resting-state fMRI activity. Proc. Natl. Acad. Sci. U. S. A. 107, 10238–10243.
Seeley, W.W., Crawford, R.K., Zhou, J., Miller, B.L., Greicius, M.D., 2009. Neurodegener-ative diseases target large-scale human brain networks. Neuron 62, 42–52.
Shehzad, Z., Kelly, A.M., Reiss, P.T., Gee, D.G., Gotimer, K., Uddin, L.Q., Lee, S.H., Margu-lies, D.S., Roy, A.K., Biswal, B.B., Petkova, E., Castellanos, F.X., Milham, M.P., 2009.The resting brain: unconstrained yet reliable. Cereb. Cortex 19, 2209–2229.
Uddin, L.Q., Kelly, A.M., Biswal, B.B., Xavier Castellanos, F., Milham, M.P., 2009. Func-tional connectivity of default mode network components: correlation, anticorrela-tion, and causality. Hum. Brain Mapp. 30, 625–637.
Van Dijk, K.R., Hedden, T., Venkataraman, A., Evans, K.C., Lazar, S.W., Buckner, R.L.,2010. Intrinsic functional connectivity as a tool for human connectomics: theory,properties, and optimization. J. Neurophysiol. 103, 297–321.
Vincent, J.L., Snyder, A.Z., Fox, M.D., Shannon, B.J., Andrews, J.R., Raichle, M.E., Buckner,R.L., 2006. Coherent spontaneous activity identifies a hippocampal-parietal memo-ry network. J. Neurophysiol. 96, 3517–3531.
Wang, K., Liang, M., Wang, L., Tian, L., Zhang, X., Li, K., Jiang, T., 2007. Altered functionalconnectivity in early Alzheimer's disease: a resting-state fMRI study. Hum. BrainMapp. 28, 967–978.
Weissenbacher, A., Kasess, C., Gerstl, F., Lanzenberger, R., Moser, E., Windischberger, C.,2009. Correlations and anticorrelations in resting-state functional connectivityMRI: a quantitative comparison of preprocessing strategies. Neuroimage 47,1408–1416.
Whitfield-Gabrieli, S., Nieto-Castanon, A., submitted for publication. A functional con-nectivity toolbox for correlated and anticorrelated networks.
Whitfield-Gabrieli, S., Thermenos, H.W., Milanovic, S., Tsuang, M.T., Faraone, S.V.,McCarley, R.W., Shenton, M.E., Green, A.I., Nieto-Castanon, A., LaViolette, P., Woj-cik, J., Gabrieli, J.D., Seidman, L.J., 2009. Hyperactivity and hyperconnectivity ofthe default network in schizophrenia and in first-degree relatives of personswith schizophrenia. Proc. Natl. Acad. Sci. U. S. A. 106, 1279–1284.
Zarahn, E., Aguirre, G.K., D'Esposito, M., 1997. Empirical analyses of BOLD fMRI statis-tics. I. Spatially unsmoothed data collected under null-hypothesis conditions. Neu-roimage 5, 179–197.
Zuo, X.N., Kelly, C., Adelstein, J.S., Klein, D.F., Castellanos, F.X., Milham, M.P., 2010. Reli-able intrinsic connectivity networks: test-retest evaluation using ICA and dual re-gression approach. Neuroimage 49, 2163–2177.
Copyright © 2022 FDOKUMEN