Automatic Resting Tremor Assessment in Parkinson's Disease ...
29
sensors Article Automatic Resting Tremor Assessment in Parkinson’s Disease Using Smartwatches and Multitask Convolutional Neural Networks Luis Sigcha 1,2 , Ignacio Pavón 1, * ,Nélson Costa 2 , Susana Costa 2 , Miguel Gago 3 , Pedro Arezes 2 , Juan Manuel López 1 and Guillermo De Arcas 1 Citation: Sigcha, L.; Pavón, I.; Costa, N.; Costa, S.; Gago, M.; Arezes, P.; López, J.M.; De Arcas, G. Automatic Resting Tremor Assessment in Parkinson’s Disease Using Smartwatches and Multitask Convolutional Neural Networks. Sensors 2021, 21, 291. https:// doi.org/10.3390/s21010291 Received: 26 November 2020 Accepted: 29 December 2020 Published: 4 January 2021 Publisher’s Note: MDPI stays neu- tral with regard to jurisdictional clai- ms in published maps and institutio- nal affiliations. Copyright: © 2021 by the authors. Li- censee MDPI, Basel, Switzerland. This article is an open access article distributed under the terms and con- ditions of the Creative Commons At- tribution (CC BY) license (https:// creativecommons.org/licenses/by/ 4.0/). 1 Instrumentation and Applied Acoustics Research Group (I2A2), ETSI Industriales, Universidad Politécnica de Madrid, Campus Sur UPM, Ctra. Valencia, Km 7, 28031 Madrid, Spain; [email protected] (L.S.); [email protected] (J.M.L.); [email protected] (G.D.A.) 2 ALGORITMI Research Center, School of Engineering, University of Minho, 4800-058 Guimarães, Portugal; [email protected] (N.C.); [email protected] (S.C.); [email protected] (P.A.) 3 Life and Health Sciences Research Institute (ICVS), School of Medicine, University of Minho, 4710-057 Braga, Portugal; [email protected] * Correspondence: [email protected]; Tel.: +34-91-067-7222 Abstract: Resting tremor in Parkinson’s disease (PD) is one of the most distinctive motor symptoms. Appropriate symptom monitoring can help to improve management and medical treatments and improve the patients’ quality of life. Currently, tremor is evaluated by physical examinations during clinical appointments; however, this method could be subjective and does not represent the full spectrum of the symptom in the patients’ daily lives. In recent years, sensor-based systems have been used to obtain objective information about the disease. However, most of these systems require the use of multiple devices, which makes it difficult to use them in an ambulatory setting. This paper presents a novel approach to evaluate the amplitude and constancy of resting tremor using triaxial accelerometers from consumer smartwatches and multitask classification models. These approaches are used to develop a system for an automated and accurate symptom assessment without interfering with the patients’ daily lives. Results show a high agreement between the amplitude and constancy measurements obtained from the smartwatch in comparison with those obtained in a clinical assessment. This indicates that consumer smartwatches in combination with multitask convolutional neural networks are suitable for providing accurate and relevant information about tremor in patients in the early stages of the disease, which can contribute to the improvement of PD clinical evaluation, early detection of the disease, and continuous monitoring. Keywords: machine learning; wearable sensors; resting tremor; deep learning; convolutional neural networks; Parkinson’s disease; multitask 1. Introduction Parkinson’s disease (PD) is a neurodegenerative disease associated with progressive dopaminergic nigro-striatal dysfunction, one of the main neural networks responsible by coordinating human movements [1,2]. Worldwide, an estimated 7–10 million people are living with this disease, and its prevalence increases with age, being rare before age 50 and more common in men than in women [3–6]. The prevalence of PD increases with age and PD affects 1% of the population above 60 years of age [7]. Several symptoms are present in PD. The most common symptoms are stiffness of the trunk and the extremities (increased muscle tone), slowness of movement (bradykinesia), rigidity, tremor (resting tremor and re-emerging postural tremor), postural instability, and gait impairment [8,9]. Among these symptoms, resting tremor is usually the most evident and clinically distinctive [10]. Sensors 2021, 21, 291. https://doi.org/10.3390/s21010291 https://www.mdpi.com/journal/sensors
-
Upload
khangminh22 -
Category
Documents
-
view
0 -
download
0
Transcript of Automatic Resting Tremor Assessment in Parkinson's Disease ...

sensors
Article
Automatic Resting Tremor Assessment in Parkinson’s DiseaseUsing Smartwatches and Multitask ConvolutionalNeural Networks
Luis Sigcha 1,2 , Ignacio Pavón 1,* , Nélson Costa 2 , Susana Costa 2 , Miguel Gago 3, Pedro Arezes 2 ,Juan Manuel López 1 and Guillermo De Arcas 1
�����������������
Citation: Sigcha, L.; Pavón, I.; Costa,
N.; Costa, S.; Gago, M.; Arezes, P.;
López, J.M.; De Arcas, G. Automatic
Resting Tremor Assessment in
Parkinson’s Disease Using
Smartwatches and Multitask
Convolutional Neural Networks.
Sensors 2021, 21, 291. https://
doi.org/10.3390/s21010291
Received: 26 November 2020
Accepted: 29 December 2020
Published: 4 January 2021
Publisher’s Note: MDPI stays neu-
tral with regard to jurisdictional clai-
ms in published maps and institutio-
nal affiliations.
Copyright: © 2021 by the authors. Li-
censee MDPI, Basel, Switzerland.
This article is an open access article
distributed under the terms and con-
ditions of the Creative Commons At-
tribution (CC BY) license (https://
creativecommons.org/licenses/by/
4.0/).
1 Instrumentation and Applied Acoustics Research Group (I2A2), ETSI Industriales, Universidad Politécnica deMadrid, Campus Sur UPM, Ctra. Valencia, Km 7, 28031 Madrid, Spain; [email protected] (L.S.);[email protected] (J.M.L.); [email protected] (G.D.A.)
2 ALGORITMI Research Center, School of Engineering, University of Minho, 4800-058 Guimarães, Portugal;[email protected] (N.C.); [email protected] (S.C.); [email protected] (P.A.)
3 Life and Health Sciences Research Institute (ICVS), School of Medicine, University of Minho,4710-057 Braga, Portugal; [email protected]
* Correspondence: [email protected]; Tel.: +34-91-067-7222
Abstract: Resting tremor in Parkinson’s disease (PD) is one of the most distinctive motor symptoms.Appropriate symptom monitoring can help to improve management and medical treatments andimprove the patients’ quality of life. Currently, tremor is evaluated by physical examinations duringclinical appointments; however, this method could be subjective and does not represent the fullspectrum of the symptom in the patients’ daily lives. In recent years, sensor-based systems havebeen used to obtain objective information about the disease. However, most of these systems requirethe use of multiple devices, which makes it difficult to use them in an ambulatory setting. Thispaper presents a novel approach to evaluate the amplitude and constancy of resting tremor usingtriaxial accelerometers from consumer smartwatches and multitask classification models. Theseapproaches are used to develop a system for an automated and accurate symptom assessment withoutinterfering with the patients’ daily lives. Results show a high agreement between the amplitudeand constancy measurements obtained from the smartwatch in comparison with those obtained ina clinical assessment. This indicates that consumer smartwatches in combination with multitaskconvolutional neural networks are suitable for providing accurate and relevant information abouttremor in patients in the early stages of the disease, which can contribute to the improvement of PDclinical evaluation, early detection of the disease, and continuous monitoring.
Keywords: machine learning; wearable sensors; resting tremor; deep learning; convolutional neuralnetworks; Parkinson’s disease; multitask
1. Introduction
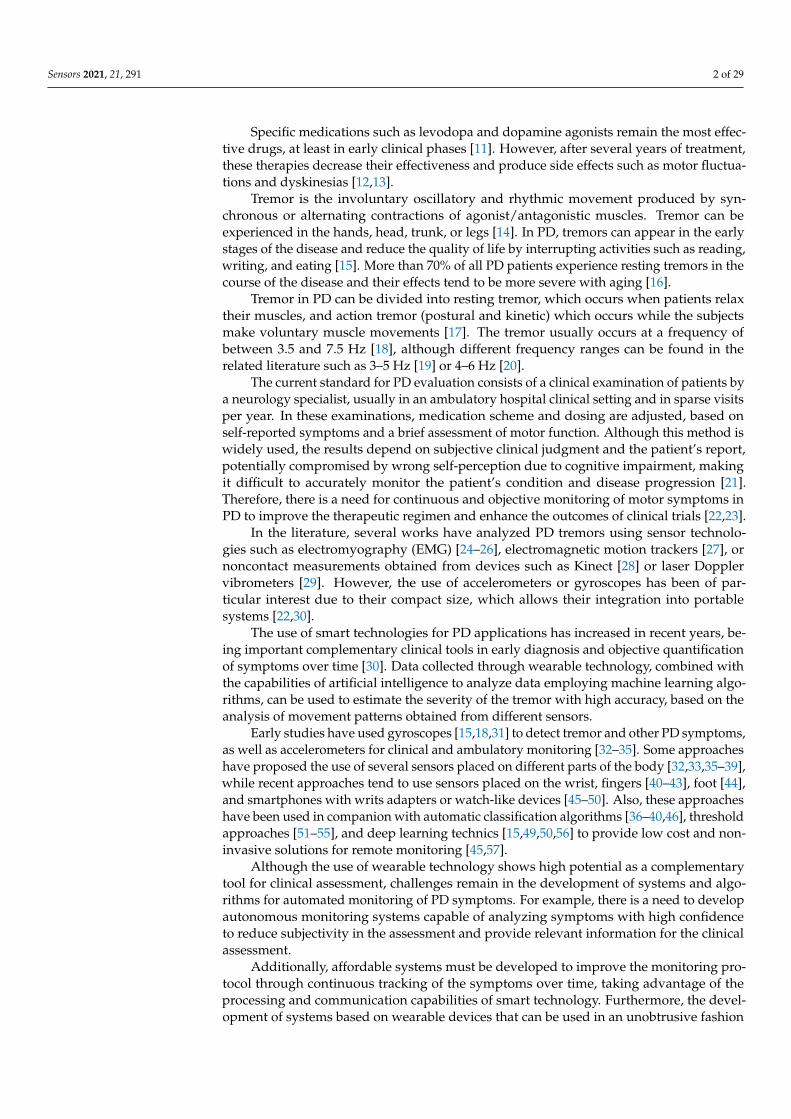
Parkinson’s disease (PD) is a neurodegenerative disease associated with progressivedopaminergic nigro-striatal dysfunction, one of the main neural networks responsible bycoordinating human movements [1,2]. Worldwide, an estimated 7–10 million people areliving with this disease, and its prevalence increases with age, being rare before age 50 andmore common in men than in women [3–6]. The prevalence of PD increases with age andPD affects 1% of the population above 60 years of age [7].
Several symptoms are present in PD. The most common symptoms are stiffness of thetrunk and the extremities (increased muscle tone), slowness of movement (bradykinesia),rigidity, tremor (resting tremor and re-emerging postural tremor), postural instability, andgait impairment [8,9]. Among these symptoms, resting tremor is usually the most evidentand clinically distinctive [10].
Sensors 2021, 21, 291. https://doi.org/10.3390/s21010291 https://www.mdpi.com/journal/sensors
Sensors 2021, 21, 291 2 of 29
Specific medications such as levodopa and dopamine agonists remain the most effec-tive drugs, at least in early clinical phases [11]. However, after several years of treatment,these therapies decrease their effectiveness and produce side effects such as motor fluctua-tions and dyskinesias [12,13].
Tremor is the involuntary oscillatory and rhythmic movement produced by syn-chronous or alternating contractions of agonist/antagonistic muscles. Tremor can beexperienced in the hands, head, trunk, or legs [14]. In PD, tremors can appear in the earlystages of the disease and reduce the quality of life by interrupting activities such as reading,writing, and eating [15]. More than 70% of all PD patients experience resting tremors in thecourse of the disease and their effects tend to be more severe with aging [16].
Tremor in PD can be divided into resting tremor, which occurs when patients relaxtheir muscles, and action tremor (postural and kinetic) which occurs while the subjectsmake voluntary muscle movements [17]. The tremor usually occurs at a frequency ofbetween 3.5 and 7.5 Hz [18], although different frequency ranges can be found in therelated literature such as 3–5 Hz [19] or 4–6 Hz [20].
The current standard for PD evaluation consists of a clinical examination of patients bya neurology specialist, usually in an ambulatory hospital clinical setting and in sparse visitsper year. In these examinations, medication scheme and dosing are adjusted, based onself-reported symptoms and a brief assessment of motor function. Although this method iswidely used, the results depend on subjective clinical judgment and the patient’s report,potentially compromised by wrong self-perception due to cognitive impairment, makingit difficult to accurately monitor the patient’s condition and disease progression [21].Therefore, there is a need for continuous and objective monitoring of motor symptoms inPD to improve the therapeutic regimen and enhance the outcomes of clinical trials [22,23].
In the literature, several works have analyzed PD tremors using sensor technolo-gies such as electromyography (EMG) [24–26], electromagnetic motion trackers [27], ornoncontact measurements obtained from devices such as Kinect [28] or laser Dopplervibrometers [29]. However, the use of accelerometers or gyroscopes has been of par-ticular interest due to their compact size, which allows their integration into portablesystems [22,30].
The use of smart technologies for PD applications has increased in recent years, be-ing important complementary clinical tools in early diagnosis and objective quantificationof symptoms over time [30]. Data collected through wearable technology, combined withthe capabilities of artificial intelligence to analyze data employing machine learning algo-rithms, can be used to estimate the severity of the tremor with high accuracy, based on theanalysis of movement patterns obtained from different sensors.
Early studies have used gyroscopes [15,18,31] to detect tremor and other PD symptoms,as well as accelerometers for clinical and ambulatory monitoring [32–35]. Some approacheshave proposed the use of several sensors placed on different parts of the body [32,33,35–39],while recent approaches tend to use sensors placed on the wrist, fingers [40–43], foot [44],and smartphones with writs adapters or watch-like devices [45–50]. Also, these approacheshave been used in companion with automatic classification algorithms [36–40,46], thresholdapproaches [51–55], and deep learning technics [15,49,50,56] to provide low cost and non-invasive solutions for remote monitoring [45,57].
Although the use of wearable technology shows high potential as a complementarytool for clinical assessment, challenges remain in the development of systems and algo-rithms for automated monitoring of PD symptoms. For example, there is a need to developautonomous monitoring systems capable of analyzing symptoms with high confidenceto reduce subjectivity in the assessment and provide relevant information for the clinicalassessment.
Additionally, affordable systems must be developed to improve the monitoring pro-tocol through continuous tracking of the symptoms over time, taking advantage of theprocessing and communication capabilities of smart technology. Furthermore, the devel-opment of systems based on wearable devices that can be used in an unobtrusive fashion

Sensors 2021, 21, 291 3 of 29
(such as watches or wristbands) [22] without increasing the burden to the patients due tothe use of specific sensorization or the use of several sensors placed on the body is required.
Hence, this paper investigates the feasibility of using nonmodified consumer smart-watches and deep learning techniques to provide a self-contained and low-cost alternativefor automatic detection and assessment of the constancy and amplitude of the restingtremor in patients with PD. This may allow improvements in the results of clinical trialsthrough continuous and unobtrusive monitoring.
In this work, the use of a hierarchical approach developed to operate with deeplearning models that analyze multiple tasks simultaneously (context and symptom) isproposed. The use of multitask models can help to improve the model’s generalizationby leveraging the domain-specific information contained in the training data of relatedtasks [58]. To the best of our knowledge, this is the first study that proposes the use of apipeline for simultaneous task analysis that takes advantage of multitask convolutionalmodels for the evaluation of resting tremors.
For the development of this system, the frequency response of the embedded ac-celerometer has been analyzed using an adapted version of the calibration method forvibration transducers by comparison with a reference accelerometer. This analysis wasmade to identify the accuracy of a consumer smartwatch to measure the amplitude of thetremor, to be used as a robust indicator of clinical severity.
A data collection protocol has been developed for the evaluation of resting tremors.With the data collected for the smartwatches, different machine learning classifiers and datarepresentations proposed in the related literature have been evaluated for the detection ofresting times (context classifier) and the detection of the occurrence of tremors in the upperlimbs (tremor detector). Additionally, novel approaches based on multitask convolutionalneural networks (multitask CNNs) capable of simultaneously analyzing the context andthe occurrence of tremors have been developed and tested.
The vast majority of experiments to evaluate the classifiers have been made using theleave-one-subject-out (LOSO) cross-validation methodology to identify the ability of theevaluated models to generalize data from unseen patients.
This study was carried out using data from PD patients who participated in the TECA-PARK project [59]. These data include weekly records of 18 PD patients who manifestedmotor symptoms while performing a variety of scripted activities, including standardizedexercises and upper limb resting periods. The present approach has been compared to theclinical assessment performed according to the ordinal Unified Parkinson’s Disease RatingScale (UPDRS) [60] parts 3.17 (rest tremor amplitude) and 3.18 (constancy of rest tremor),to validate the results and identify reliable biomarkers for resting tremor monitoring thatcan support clinical evaluation, disease monitoring, and decision making.
The remainder of this paper is organized as follows: Section 2 presents the back-ground, including the related work regarding the tremor assessment. Section 3 presents thematerials and methods proposed in this work, including the data collection and evaluationmethodologies proposed for tremor assessment based on multitasking analysis. Section 4presents the experiments and results obtained from the evaluation of the proposed systemand the methodology for tremor assessment. Finally, Section 5 presents the discussion andthe conclusions of the results obtained in this work.
2. Background
Currently, the severity of resting and action tremor is analyzed during routine clinicalvisits using Part III of the UPDRS scale. During the assessment, patients were asked toperform three tasks: armrest, arm extension, and nose tip contact with the index finger(finger to nose test) [60].
While the patient performs these tasks, the maximum amplitude produced by thetremors was analyzed and rated on a scale ranging from 0 to 4 (where 0 implies that thereis no presence of tremors and 4 indicates tremors with an amplitude of up to 10 cm).
Sensors 2021, 21, 291 4 of 29
Furthermore, as part of the UPDRS at the end of the evaluation, the constancy of thetremor was evaluated considering the percentage of time that a patient presented tremorsduring his/her entire examination. In a similar way to the other sections of the UPDRS, theconstancy is qualified on a discrete scale from 0 to 4. Although this type of evaluation is awidespread method, visits to the specialist are spaced several months apart and often failto capture the full spectrum of symptoms that the patients with PD may experience in theirdaily lives [61]. Therefore, tools for remote monitoring could help to improve treatments bycollecting data in-home settings, reducing the number of clinic visits in situations similarto those produced by the COVID-19 pandemic emergency, where medical appointmentshave experienced a significant reduction.
In the literature, several works have analyzed the use of wearable devices in healthcare applications [62–64]. Many studies are focused on the development and validation ofsystems for the analysis and quantification of motor symptoms remotely using a variety ofinertial sensors. The most commonly used sensors include accelerometers and gyroscopesdue to their compact size and affordability [65–70].
The sensors named micro-electromechanical (MEMS), due to their low cost, have con-tributed to the development of compact monitoring systems, which can be used for mon-itoring PD and other movement disorders continuously [71]. Additionally, systems em-ploying machine learning techniques have allowed the improvement and automation ofPD motor symptom detection with higher speed and reliability than standard analysismethods [65,67,68]. As a result, these technologies have led to the development of solutionsfor automated and continuous monitoring, allowing a reduction in overall cost [72].
An important aspect considered in the related literature has been the quality of thedata obtained from this type of device and sensors because it has a significant impact onthe performance of these systems. Thus, an appropriate selection of sensors and algorithmshave supported the improvement in the performance of these systems, also considering thecomputational costs for real-time applications, such as those related to health care, where atrade-off between performance and efficiency is required [73].
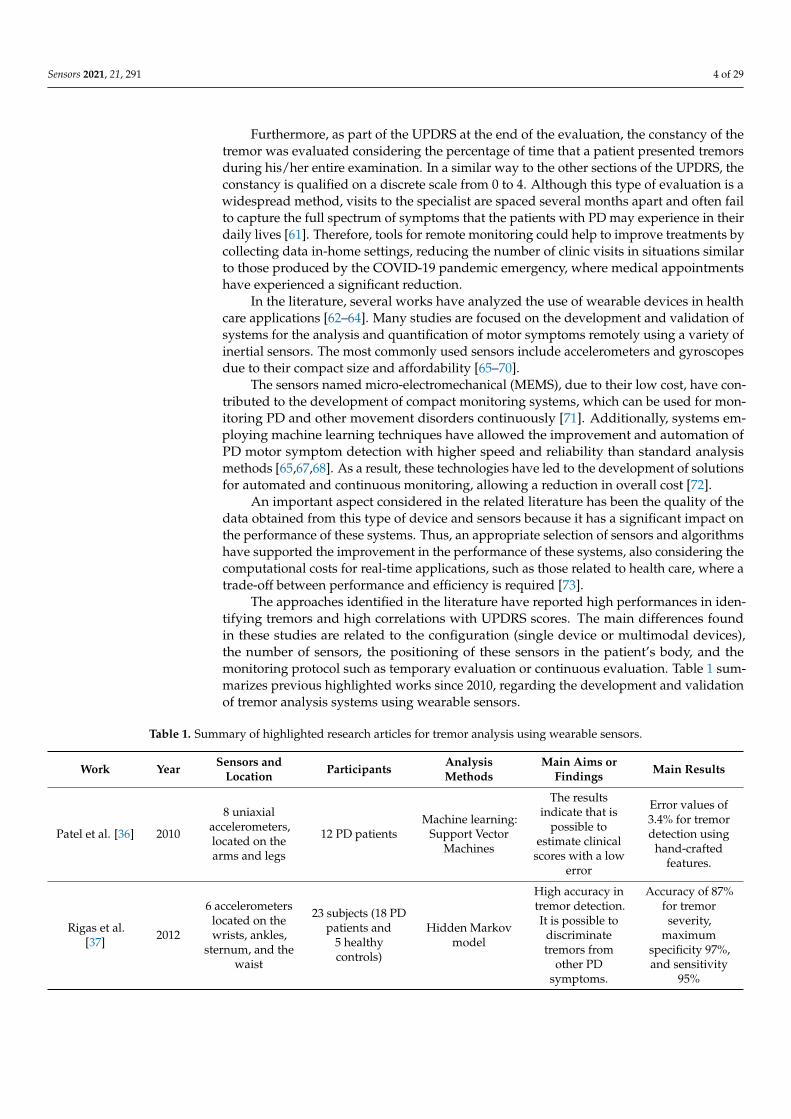
The approaches identified in the literature have reported high performances in iden-tifying tremors and high correlations with UPDRS scores. The main differences foundin these studies are related to the configuration (single device or multimodal devices),the number of sensors, the positioning of these sensors in the patient’s body, and themonitoring protocol such as temporary evaluation or continuous evaluation. Table 1 sum-marizes previous highlighted works since 2010, regarding the development and validationof tremor analysis systems using wearable sensors.
Table 1. Summary of highlighted research articles for tremor analysis using wearable sensors.
Work Year Sensors andLocation Participants Analysis
MethodsMain Aims or
Findings Main Results
Patel et al. [36] 2010
8 uniaxialaccelerometers,located on thearms and legs
12 PD patientsMachine learning:
Support VectorMachines
The resultsindicate that is
possible toestimate clinical
scores with a lowerror
Error values of3.4% for tremordetection using
hand-craftedfeatures.
Rigas et al.[37] 2012
6 accelerometerslocated on thewrists, ankles,
sternum, and thewaist
23 subjects (18 PDpatients and
5 healthycontrols)
Hidden Markovmodel
High accuracy intremor detection.It is possible to
discriminatetremors from
other PDsymptoms.
Accuracy of 87%for tremorseverity,
maximumspecificity 97%,and sensitivity
95%

Sensors 2021, 21, 291 5 of 29
Table 1. Cont.
Work Year Sensors andLocation Participants Analysis
MethodsMain Aims or
Findings Main Results
Roy et al. [38] 2013
EMG and4 accelerometerslocated on bothforearms and
shanks
11 PD for training,and 12 for testing(8 PD + 4 healthy
controls)
Machine learning:Dynamic neural
network
The use of ahybrid sensor anda neural networkto detect tremor
duringunconstrained
activities
Overall meanspecificity of
90.2% andsensitivity of
92.9% for tremordetection
Tzallas et al.[39] 2014
4 triaxialaccelerometers
and 1 gyroscopeon both wrists,ankles, and the
waist
20 PD patients forshort-term
analysis and 24for long-term
analysis
Machine learning
The authorspropose a system
for continuousevaluation of
tremor and motorsymptoms
Accuracy of 87%for tremor
classification
Ahlrichs et al.[40] 2014
Triaxialaccelerometerlocated on the
wrist
76 subjects (64 PDfor testing and
12 PD fortraining)
Machine learning:Support vector
machines
The resultsindicate that
frequencydomain features
may be enough todetect tremor
Specificity of88.4% and
sensitivity of89.4%
Kostikis et al.[57] 2015
Smartphoneaccelerometerand gyroscope,located on thewrists with a
glove
25 PD patientsand
20 age-matchedhealthy controls
Machine learning
The authorspropose the use
of consumersmartphones toassess tremor
Accuracy of 82%for PD patients
and 90% forhealthy controls
Braybrooket al. [43] 2016
A triaxialaccelerometerlocated on the
wrist of the mostaffected side
85 PD patientsThreshold
method using aspectral analysis
The authorspropose a system
for ambulatoryassessment of PD
tremor
Specificity of92.5% and
selectivity of92.9% for tremor
detection
García-Magariño et al.
[45]2016
Smartphone withtriaxial
accelerometerused in
unconstrainedenvironments
11 PD withtremors
10 subjectswithout tremor
Algorithmicapproach
The authorspropose a
smartphone-based application
for detectinghand tremor
Specificity of95.8% and
Sensitivity of99.5% for tremor
detection
Jeon et al. [46] 2017
A watch-likedevice with anaccelerometerand gyroscopelocated on the
wrist and fingerof both hands
85 PD patientsMachine learning:
Severalalgorithms
The authors showan accurate
scoring systemfor estimating the
tremor severity
Accuracy of85.5%, and anRMSE of 0.410(on five classes
according toUPDRS)
Pulliam et al.[47] 2018
Triaxialaccelerometerand gyroscopelocated on both
wrists and ankles
13 PD patients Regressionmodels
The use ofwearable sensors
to quantify thedose–response forseveral symptoms
AUC 0.89 fortremor detection.
Kim et al. [50] 2018
Triaxialaccelerometerand gyroscopelocated on the
wrist and fingerof both hands
92 PD patients
Deep learning:Convolutional
neural networks(CNNs)
The use of CNNoutperforms
machine learningapproaches
Accuracy of 0.85,and RMSE of 0.35

Sensors 2021, 21, 291 6 of 29
Table 1. Cont.
Work Year Sensors andLocation Participants Analysis
MethodsMain Aims or
Findings Main Results
López-Blancoet al. [51] 2019
Consumersmartwatch
(accelerometerand gyroscope)
22 PD patients
The tremorintensity
calculatedthrough RMS ofthe gyroscope
signal
The use ofconsumer
smartwatches fortremor
quantification isreliable and
well-correlatedwith clinical
scores.
Spearmancoefficient
between UPDRSscores and
smartwatchmeasurements for
the intensity of0.81 (p < 0.001)
Hssayeni et al.[15] 2019
Triaxialgyroscope locatedon the wrist and
ankle of themost-affected side
24 PD patients
Machine anddeep learning:
Recurrent neuralnetworks
The authorspropose the useof gradient tree
boosting andLong short-term
memorynetworks
A correlationr = 0.93 withLOSO usinggradient tree
boostingalgorithm
Pierleoni et al.[52] 2019
Watch like devicewith a triaxialaccelerometer,
gyroscope, andmagnetometer
40 PD patients Thresholdmethod
A method forcontinuous and
real-timemonitoring of PDusing wearables
and Cloudservices
Accuracy of 97.7%for tremordetection
Battista et al.[53] 2020
Watch-like devicewith a triaxialaccelerometer
20 PD patients Thresholdmethod
A device forcontinuous
monitoring of PDtremor, increasing
thediscrimination
with normal dailyactivities
Linear correlationwith the UPDRS
constancyr = 0.744
(p = 0.0004)
VanBrummelen
et al. [54]2020
Consumerdevices with
triaxialaccelerometers
10 patients withPD and 10 withessential tremor
Spectral analysis
The authorsevaluate the
performance ofthe
accelerometers ofconsumerdevices.
Consumerdevices could be
suitable toanalyze the peakfrequency in PD
tremor
Mahadevanet al. [55] 2020
Watch-like IMU(results reportedwith the use of
theaccelerometer)
31 PD and50 healthy
controls forevaluating the
tremor detector
Thresholdmethod and
machine learning
Sensor measuresof resting tremor
present highagreement withclinical scoring
Tremor classifieraccuracy of 83%.
Pearsoncorrelation of 0.97
for tremorconstancy
San Segundoet al. [56] 2020
Wrist-worntriaxial
accelerometers
12 patients withPD
Deep learning:Convolutional
neural networks
Evaluation ofnovel
preprocessingmethods andalgorithms in
free-living andlaboratory
settings
Error lower than5% when
estimating thepercentage of
tremor in alaboratory setting

Sensors 2021, 21, 291 7 of 29
Early studies by Salarian [18,31] have used spectral analysis from signals obtainedfrom gyroscopes placed on the wrists to detect tremors, showing symptom detection with aspecificity of 99.5% and sensitivities of up to 94.2%. Keijsers et al. [33] obtained specificitiesand sensitivities of 0.97 using six accelerometers placed on different parts of the body.Giuffrida et al. [34] have shown high correlations (r2 = 0.89) when comparing the root-mean-square (RMS) magnitude of accelerometers and gyroscopes with the clinical scores.
In recent years, most of the works concerning the analysis of tremors have usedsupervised machine learning techniques to identify the presence of tremors using differenttypes of “hand-crafted” features extracted from inertial signals in both time and frequencydomains [15,36–40,46,55–57]. Other authors have used threshold-based algorithms, takingadvantage of the heuristic knowledge of the symptom to determine objective indicators formonitoring the symptom [43,45,47,51–55].
Some other approaches [15,49,50,56] have started to use deep learning techniquesfor tremor detection, mainly Convolutional neural networks (CNNs) [74] and recurrentneural networks such as Long short-term memory (LSTM) [75], showing, in several exper-iments, a higher performance than the methods based on shallow algorithms. The deeplearning techniques have enabled the development of end-to-end classifiers used in manyapplications such as human activity recognition (HAR), using data acquired from multiplesensors [76] or data from sensors of smart devices such as smartphones or smartwatches todetect the user context or the activity performed at any given time [77].
Among the solutions based on wearable technology, the use of consumer devices suchas smartphones [45,57] and smartwatches [51,54] has been identified. These studies showthat the use of smart devices is feasible, reliable, and well-related to clinical scores, whereasin the case of smartwatches they show good acceptance from the patients, which may allowtheir use as continuous monitoring devices.
Although a great advance can be identified in the area of PD tremor monitoring,several challenges have been identified that need to be addressed. For example, few studieshave focused on characterizing, from a metrological point of view, the amplitude orthe frequency response of the accelerometers of consumer devices to provide accurateindicators for clinical monitoring and assessment. Additionally, the results of the detectionsystems are not always associated with clinical ratings and in some cases lack the expectedclinical outcomes for enhanced monitoring. Additionally, it is desirable to reduce thenumber of devices or sensors placed on different parts of the body to improve usability infree-living environments.
Finally, differences between our work and the reviewed studies can be categorizedas follows:
• Several studies have evaluated systems for tremor detection without distinguishingthe type of PD tremor (rest or action tremor); usually, these approaches are focused onfree-living monitoring [15,37–39,43,45,47,52,53,56]. Instead of only measuring featuresrelated to PD, data analysis techniques should be used to identify reliable biomarkersto support the clinical assessment that can be obtained automatically with wearabletechnology and artificial intelligence techniques [68];
• Early studies have used configurations of several sensors placed on different partsof the body [15,36–39], but these systems could present usability limitations in am-bulatory settings. In this work, the use of a nonmodified consumer smartwatch isproposed in contrast to the use of multimodal systems or ad-hoc devices for dataacquisition;
• Several studies have used threshold or shallow machine learning approaches to detectthe presence or the amplitude of tremor, while few studies have used deep learningtechniques [15,49,50,56]. However, the use of multitask convolutional models has notbeen identified for resting tremor assessment.
In contrast to the reviewed works, our study examines the capability of a systembased on a deep learning multitask approach combined with the data acquired from asingle (triaxial) accelerometer sensor of a nonmodified consumer smartwatch for tremor

Sensors 2021, 21, 291 8 of 29
assessment (amplitude and constancy). Additionally, the use of standardized metrics formeasuring vibration amplitude such as the acceleration level is compared with the clinicalrating to validate the results of the proposed system.
3. Materials and Methods
This section describes the materials and methods used in the data collection andevaluation of the proposed systems. This section has been divided into five subsections.Section 3.1 shows the data collection methodology and the characteristics of the group ofpatients involved in the experiments. Section 3.2 shows the analysis methodology andthe frequency response obtained from the evaluation of the acquisition device. Section 3.3shows the experimental protocol for data acquisition based on a smartwatch and a customsoftware application. Section 3.4 shows the methodology for data labeling. Section 3.5describes the algorithmic approaches used to the development of different classifiers(context and tremor), as well as the proposed approach for the assessment of the amplitudeand constancy of the resting tremor using models with multiple outputs.
3.1. Data Collection
Data were collected during the TECAPARK project using a custom-built mHealthmobile and wearable application for tracking motor symptoms of PD patients using smart-phones and smartwatches [59]. The study was approved by the Ethics Committee of theUniversidad Politécnica de Madrid. The PD patients were previously diagnosed accordingto the UK Parkinson’s Disease Society Brain Bank [78]. All subjects gave their writtenconsent before participating in the experiment.
A total of 18 subjects with PD were recruited from different Parkinson associationslocated in Spain and Portugal who were in early stages (≤2) of the disease according tothe Hoehn and Yahr (H&Y) scale [79] (age: 64.9 ± 7.6 [47–76] years; gender: 8 M/10 F;stage H&Y I/II/: 4/14). Patients had a good clinical response to levodopa and/or dopamineagonists and did not present dementia according to the diagnostic and statistical manualof mental disorders IV (DSM IV) criteria [78].
From this group of 18 patients, 4 patients did not present tremors, while the remaining14 presented tremors with different severities. Amplitude tremor ranged from 0 (no tremor)to 2 (mild tremor) according to the UPDRS guide section 3.17. Tremor constancy rangedfrom 0 (no tremor) to 4 (tremor is present more than 75% of the entire examination period),evaluated according to the UPDRS guide section 3.18. Patients were assessed in theirbest ON state (the ON state is the one in which motor symptoms are controlled by themedication) as assessed by clinical and patient’s assessment history. During the study,all patients continued taking their medication as usual.
Figure 1a shows the number of hours that resting tremor signals were analyzed for inthis study; they are distributed according to the amplitude severity evaluated with UPDRSguide section 3.17, while Figure 1b shows the number of tests performed for the tremorconstancy according to the UPDRS guide section 3.18.
The data generated in the experiments were stored in the internal memory of thesmartwatch and downloaded later for labeling and off-line evaluation. The experimentsfor data processing and evaluation were conducted on a computer with an Intel Xeon with2.30 GHz processor, 12 GB of random-access memory (RAM), and a 12 GB NVIDIA TeslaK80 graphics accelerator card. The signal labeling, preprocessing, and feature extractionwere performed using the MATLAB software (version R2017a), while the evaluation andtraining of the classification models were performed in Python (version 3.6), using thelibraries Keras (version 2.4) [80], TensorFlow (version 2.3) [81], and Scikit-learn (version0.22) [82].

Sensors 2021, 21, 291 9 of 29
Sensors 2021, 20, x FOR PEER REVIEW 8 of 30
scribes the algorithmic approaches used to the development of different classifiers (con-text and tremor), as well as the proposed approach for the assessment of the amplitude and constancy of the resting tremor using models with multiple outputs.
3.1. Data Collection Data were collected during the TECAPARK project using a custom-built mHealth
mobile and wearable application for tracking motor symptoms of PD patients using smartphones and smartwatches [59]. The study was approved by the Ethics Committee of the Universidad Politécnica de Madrid. The PD patients were previously diagnosed according to the UK Parkinson’s Disease Society Brain Bank [78]. All subjects gave their written consent before participating in the experiment.
A total of 18 subjects with PD were recruited from different Parkinson associations located in Spain and Portugal who were in early stages (≤2) of the disease according to the Hoehn and Yahr (H&Y) scale [79] (age: 64.9 ± 7.6 [47–76] years; gender: 8 M/10 F; stage H&Y I/II/: 4/14). Patients had a good clinical response to levodopa and/or dopamine ago-nists and did not present dementia according to the diagnostic and statistical manual of mental disorders IV (DSM IV) criteria [78].
From this group of 18 patients, 4 patients did not present tremors, while the remain-ing 14 presented tremors with different severities. Amplitude tremor ranged from 0 (no tremor) to 2 (mild tremor) according to the UPDRS guide section 3.17. Tremor constancy ranged from 0 (no tremor) to 4 (tremor is present more than 75% of the entire examination period), evaluated according to the UPDRS guide section 3.18. Patients were assessed in their best ON state (the ON state is the one in which motor symptoms are controlled by the medication) as assessed by clinical and patient’s assessment history. During the study, all patients continued taking their medication as usual.
Figure 1a shows the number of hours that resting tremor signals were analyzed for in this study; they are distributed according to the amplitude severity evaluated with UP-DRS guide section 3.17, while Figure 1b shows the number of tests performed for the tremor constancy according to the UPDRS guide section 3.18.
(a) (b)
Figure 1. (a) Number of hours data were analyzed, distributed according to the tremor amplitude severities evaluated through the UPDRS guide section 3.17; (b) number of constancy tests distributed according to the UPDRS guide section 3.18.
The data generated in the experiments were stored in the internal memory of the smartwatch and downloaded later for labeling and off-line evaluation. The experiments for data processing and evaluation were conducted on a computer with an Intel Xeon with 2.30 GHz processor, 12 GB of random-access memory (RAM), and a 12 GB NVIDIA Tesla K80 graphics accelerator card. The signal labeling, preprocessing, and feature extraction were performed using the MATLAB software (version R2017a), while the evaluation and training of the classification models were performed in Python (version 3.6), using the
Figure 1. (a) Number of hours data were analyzed, distributed according to the tremor amplitude severities evaluatedthrough the UPDRS guide section 3.17; (b) number of constancy tests distributed according to the UPDRS guide section 3.18.
3.2. Acquisition Device (Smartwatch)
A consumer smartwatch was used for data acquisition; the device was placed on thewrist of the most affected side of each patient. The smartwatch was available on the marketin 2019 and uses the Android Wear operating system. The device has an internal memoryof 4 GB (2 GB of free space), the dimensions are 46.6 mm × 51.8 mm × 12.9 mm, and it hasa weight of 32.5 g. The device has a calibrated accelerometer, with a maximum amplitudeset to ±2 g. The sensor can be adjusted to a maximum sampling rate of 100 Hz factory-setby the operating system.
In this study, the sampling rate was adjusted to 50 Hz, which is considered a suitablevalue for human activity recognition (HAR) using sensors placed on the wrist (standardhuman activities do not typically exceed 10 Hz) [83,84] and is suitable for evaluatingtremors in the 3.5–7.5 Hz range, as usually occurs in PD [18].
The smartwatch used for the data collection was previously analyzed to identifyits frequency response by using a methodology described in a previous work [85]. Theanalysis employs an adapted version of the calibration method by comparison with areference accelerometer. For this method, the smartwatch and a reference accelerometer,the Dytran 3023M3 (Dytran Instruments, Chatsworth, CA, USA), were simultaneouslycoupled to an electrodynamic vibration shaker, LDS V406 CE M4 (Bruel and Kjaer). Thevibration signals were generated from a PULSE 7537 vibration analysis system (Bruel andKjaer, Copenhagen, Denmark) and a power amplifier, LDS PA 100E (Bruel and Kjaer).
To evaluate the frequency response of the device, six root-mean-square (RMS) de-terminations were performed for different acceleration values at known frequencies andamplitudes using discrete sinusoidal signals.
Three different amplitudes (1, 3, and 5 m/s2) were tested in this experiment for asingle axis at standardized third-octave intervals, with central frequencies in the rangeof 3.15–20 Hz. Values for 3.15 and 4 Hz at 5 m/s2 could not be determined due to thelimitations of the equipment to reach those magnitudes. The results of the frequencyanalysis at different amplitudes are shown in Figure 2, and the deviation percentage (ε) tothe reference accelerometer is shown in Table 2.
Table 2. Percentage of deviation of the smartwatch compared to the reference accelerometer.
Frequency (Hz)
Amplitude 3.15 4 5 6.3 8 10 12.5 16 20
5 m/s2 - - 1.33% 1.47% 1.44% 0.67% 0.03% −2.38% −4.79%3 m/s2 −0.82% −0.51% 1.63% 1.80% 1.85% 0.79% −0.27% −1.94% −4.29%1 m/s2 −4.65% −0.3% 0.27% −0.31% 0.47% 0.0% 0.69% −2.01% −4.89%

Sensors 2021, 21, 291 10 of 29
Sensors 2021, 20, x FOR PEER REVIEW 9 of 30
libraries Keras (version 2.4) [80], TensorFlow (version 2.3) [81], and Scikit-learn (version 0.22) [82].
3.2. Acquisition Device (Smartwatch) A consumer smartwatch was used for data acquisition; the device was placed on the
wrist of the most affected side of each patient. The smartwatch was available on the mar-ket in 2019 and uses the Android Wear operating system. The device has an internal memory of 4 GB (2 GB of free space), the dimensions are 46.6 mm × 51.8 mm × 12.9 mm, and it has a weight of 32.5 g. The device has a calibrated accelerometer, with a maximum amplitude set to ±2 g. The sensor can be adjusted to a maximum sampling rate of 100 Hz factory-set by the operating system.
In this study, the sampling rate was adjusted to 50 Hz, which is considered a suitable value for human activity recognition (HAR) using sensors placed on the wrist (standard human activities do not typically exceed 10 Hz) [83,84] and is suitable for evaluating trem-ors in the 3.5–7.5 Hz range, as usually occurs in PD [18].
The smartwatch used for the data collection was previously analyzed to identify its frequency response by using a methodology described in a previous work [85]. The anal-ysis employs an adapted version of the calibration method by comparison with a reference accelerometer. For this method, the smartwatch and a reference accelerometer, the Dytran 3023M3 (Dytran Instruments, Chatsworth, CA, USA), were simultaneously coupled to an electrodynamic vibration shaker, LDS V406 CE M4 (Bruel and Kjaer). The vibration sig-nals were generated from a PULSE 7537 vibration analysis system (Bruel and Kjaer, Co-penhagen, Denmark) and a power amplifier, LDS PA 100E (Bruel and Kjaer).
To evaluate the frequency response of the device, six root-mean-square (RMS) deter-minations were performed for different acceleration values at known frequencies and am-plitudes using discrete sinusoidal signals.
Three different amplitudes (1, 3, and 5 m/s2) were tested in this experiment for a sin-gle axis at standardized third-octave intervals, with central frequencies in the range of 3.15–20 Hz. Values for 3.15 and 4 Hz at 5 m/s2 could not be determined due to the limita-tions of the equipment to reach those magnitudes. The results of the frequency analysis at different amplitudes are shown in Figure 2, and the deviation percentage (ε) to the refer-ence accelerometer is shown in Table 2.
Figure 2. Frequency response of the smartwatch built-in accelerometer.
Table 2. Percentage of deviation of the smartwatch compared to the reference accelerometer.
Frequency (Hz) Amplitude 3.15 4 5 6.3 8 10 12.5 16 20
5 m/s2 - - 1.33% 1.47% 1.44% 0.67% 0.03% −2.38% −4.79% 3 m/s2 −0.82% −0.51% 1.63% 1.80% 1.85% 0.79% −0.27% −1.94% −4.29% 1 m/s2 −4.65% −0.3% 0.27% −0.31% 0.47% 0.0% 0.69% −2.01% −4.89%
Figure 2. Frequency response of the smartwatch built-in accelerometer.
According to the methodology established in [85], an error band has been consideredfor amplitude and frequency linearity according to the specifications of the InternationalOrganization for Standardization (ISO) 8041:2005 [86], in which values with a deviationgreater than ±6% are considered linearity errors.
For the smartwatch, the results show a linear behavior in frequency and amplitude thatcan be useful for the analysis of standard human activities and parkinsonian tremors, withamplitudes evaluated up to 5 m/s2. For frequencies higher than 16 Hz, a gradual decreasein amplitude was noted; however, the relative error did not exceed ±6% at any analyzedpoint, with a maximum error of −4.89% at 20 Hz. Expanded uncertainties equal to or lessthan ±3% were achieved in all experiments, following the ISO 8041:2005 recommendationsfor mechanical tests of amplitude linearity.
3.3. Experimental Protocol
The experimental protocol used for data acquisition was based on the combinationof six scripted activities extracted from UPDRS, including some exercises to assess motorsymptoms in PD, plus a resting time interval of at least 30 s between each exercise. We usedUPDRS exercises because they are a well-known protocol for PD patients, therapists, andneurologists, and they simplify labeling the signals for comparison with clinical assessment.
To facilitate data collection, a custom mobile application was used to guide the patientsto perform exercises using voice instructions as shown in Figure 3.
Sensors 2021, 20, x FOR PEER REVIEW 10 of 30
According to the methodology established in [85], an error band has been considered for amplitude and frequency linearity according to the specifications of the International Organization for Standardization (ISO) 8041:2005 [86], in which values with a deviation greater than ±6% are considered linearity errors.
For the smartwatch, the results show a linear behavior in frequency and amplitude that can be useful for the analysis of standard human activities and parkinsonian tremors, with amplitudes evaluated up to 5 m/s2. For frequencies higher than 16 Hz, a gradual decrease in amplitude was noted; however, the relative error did not exceed ±6% at any analyzed point, with a maximum error of −4.89% at 20 Hz. Expanded uncertainties equal to or less than ±3% were achieved in all experiments, following the ISO 8041:2005 recom-mendations for mechanical tests of amplitude linearity.
3.3. Experimental Protocol The experimental protocol used for data acquisition was based on the combination
of six scripted activities extracted from UPDRS, including some exercises to assess motor symptoms in PD, plus a resting time interval of at least 30 s between each exercise. We used UPDRS exercises because they are a well-known protocol for PD patients, therapists, and neurologists, and they simplify labeling the signals for comparison with clinical as-sessment.
To facilitate data collection, a custom mobile application was used to guide the pa-tients to perform exercises using voice instructions as shown in Figure 3.
(a) (b)
Figure 3. (a) Evaluation tests and data acquisition based on a smartwatch. (b) Mobile application.
Patients were evaluated weekly in their care center with the supervision of the cen-ter’s staff during an interval of between 2 and 8 weeks (average 5.8 weeks). Complete evaluation, including exercises and resting times, took an average duration of 6 min per patient.
3.4. Data Labeling Since the data labeling is a costly and time-consuming process, the data used were
initially labeled using a method based on the analysis of the magnitude in the tremor band (3.5–7.5 Hz), and thresholds were empirically established to identify the presence of trem-ors. These labels were then reviewed and corrected by comparison with a video recording reference for each of the tests. The clinical evaluation of the tremor amplitude and con-stancy were performed by an expert according to the UPDRS guide sections 3.17 and 3.18.
For the context classifier, the resting periods were labeled by manually annotating the intervals from the video recordings.
Figure 3. (a) Evaluation tests and data acquisition based on a smartwatch. (b) Mobile application.
Patients were evaluated weekly in their care center with the supervision of the center’sstaff during an interval of between 2 and 8 weeks (average 5.8 weeks). Complete evaluation,including exercises and resting times, took an average duration of 6 min per patient.
Sensors 2021, 21, 291 11 of 29
3.4. Data Labeling
Since the data labeling is a costly and time-consuming process, the data used wereinitially labeled using a method based on the analysis of the magnitude in the tremorband (3.5–7.5 Hz), and thresholds were empirically established to identify the presenceof tremors. These labels were then reviewed and corrected by comparison with a videorecording reference for each of the tests. The clinical evaluation of the tremor amplitudeand constancy were performed by an expert according to the UPDRS guide sections 3.17and 3.18.
For the context classifier, the resting periods were labeled by manually annotating theintervals from the video recordings.
3.5. Algorithmic Approach
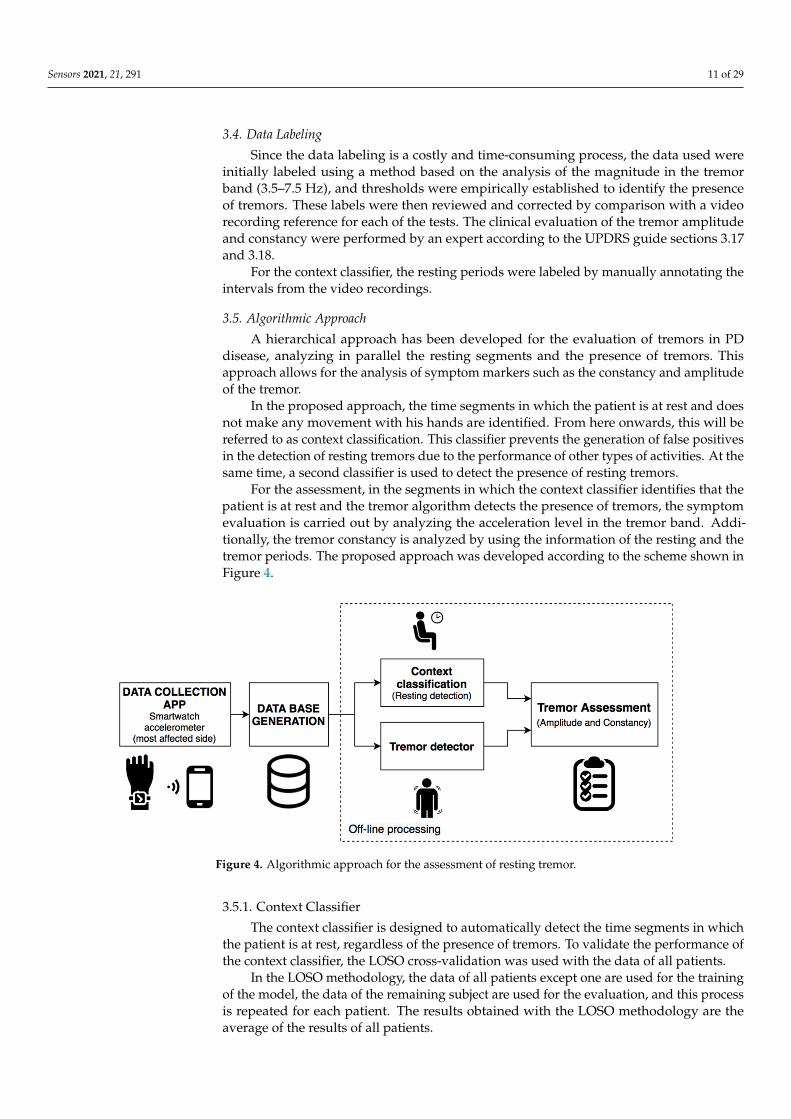
A hierarchical approach has been developed for the evaluation of tremors in PDdisease, analyzing in parallel the resting segments and the presence of tremors. Thisapproach allows for the analysis of symptom markers such as the constancy and amplitudeof the tremor.
In the proposed approach, the time segments in which the patient is at rest and doesnot make any movement with his hands are identified. From here onwards, this will bereferred to as context classification. This classifier prevents the generation of false positivesin the detection of resting tremors due to the performance of other types of activities. At thesame time, a second classifier is used to detect the presence of resting tremors.
For the assessment, in the segments in which the context classifier identifies that thepatient is at rest and the tremor algorithm detects the presence of tremors, the symptomevaluation is carried out by analyzing the acceleration level in the tremor band. Addi-tionally, the tremor constancy is analyzed by using the information of the resting and thetremor periods. The proposed approach was developed according to the scheme shown inFigure 4.
Sensors 2021, 20, x FOR PEER REVIEW 11 of 30
3.5. Algorithmic Approach A hierarchical approach has been developed for the evaluation of tremors in PD dis-
ease, analyzing in parallel the resting segments and the presence of tremors. This ap-proach allows for the analysis of symptom markers such as the constancy and amplitude of the tremor.
In the proposed approach, the time segments in which the patient is at rest and does not make any movement with his hands are identified. From here onwards, this will be referred to as context classification. This classifier prevents the generation of false posi-tives in the detection of resting tremors due to the performance of other types of activities. At the same time, a second classifier is used to detect the presence of resting tremors.
For the assessment, in the segments in which the context classifier identifies that the patient is at rest and the tremor algorithm detects the presence of tremors, the symptom evaluation is carried out by analyzing the acceleration level in the tremor band. Addition-ally, the tremor constancy is analyzed by using the information of the resting and the tremor periods. The proposed approach was developed according to the scheme shown in Figure 4.
Figure 4. Algorithmic approach for the assessment of resting tremor.
3.5.1. Context Classifier The context classifier is designed to automatically detect the time segments in which
the patient is at rest, regardless of the presence of tremors. To validate the performance of the context classifier, the LOSO cross-validation was used with the data of all patients.
In the LOSO methodology, the data of all patients except one are used for the training of the model, the data of the remaining subject are used for the evaluation, and this process is repeated for each patient. The results obtained with the LOSO methodology are the average of the results of all patients.
To train and evaluate the algorithms, the signals of the triaxial accelerometer were divided into fixed intervals (windows) of 2.56 s (128 samples) with a 50% overlap which, according to [36], is a suitable time interval to analyze tremors with inertial sensors, while the increase in this time does not present significant improvements. A window was la-beled as resting or nonresting only if more than 50% of its samples were labeled as resting or nonresting. Windows with samples containing unknown labels or windows with labels containing less than 50% of their samples labeled as a resting or nonresting were discarded during training.
The signals were filtered by a Butterworth band-pass filters with cut-off frequencies of 0.5 to 10 Hz and third-order slope, which is a suitable range for human activity recog-nition using sensors [84].
Figure 4. Algorithmic approach for the assessment of resting tremor.
3.5.1. Context Classifier
The context classifier is designed to automatically detect the time segments in whichthe patient is at rest, regardless of the presence of tremors. To validate the performance ofthe context classifier, the LOSO cross-validation was used with the data of all patients.
In the LOSO methodology, the data of all patients except one are used for the trainingof the model, the data of the remaining subject are used for the evaluation, and this processis repeated for each patient. The results obtained with the LOSO methodology are theaverage of the results of all patients.

Sensors 2021, 21, 291 12 of 29
To train and evaluate the algorithms, the signals of the triaxial accelerometer weredivided into fixed intervals (windows) of 2.56 s (128 samples) with a 50% overlap which,according to [36], is a suitable time interval to analyze tremors with inertial sensors,while the increase in this time does not present significant improvements. A window waslabeled as resting or nonresting only if more than 50% of its samples were labeled as restingor nonresting. Windows with samples containing unknown labels or windows with labelscontaining less than 50% of their samples labeled as a resting or nonresting were discardedduring training.
The signals were filtered by a Butterworth band-pass filters with cut-off frequencies of0.5 to 10 Hz and third-order slope, which is a suitable range for human activity recognitionusing sensors [84].
For the evaluation of the context classifier, several algorithms and three different typesof data representations were tested. The context classifier was developed following thescheme shown in Figure 5, by using machine and deep learning techniques.
Sensors 2021, 20, x FOR PEER REVIEW 12 of 30
For the evaluation of the context classifier, several algorithms and three different types of data representations were tested. The context classifier was developed following the scheme shown in Figure 5, by using machine and deep learning techniques.
Figure 5. Algorithm for the context classifier using machine and deep learning techniques.
To create a baseline for context classifier, 290 hand-crafted features commonly used in context detection and automatic human activity recognition with smartphones and smartwatches were extracted from the acceleration signals [77]. These types of features are normally used to identify human physical activity (sitting, standing, walking, etc.); however, in this study they were used to detect the context of the patient corresponding to resting or nonresting periods.
The features extracted include time and frequency characteristics. [77] This data rep-resentation has been evaluated using an AdaBoost [87] classifier with 100 estimators. This algorithm was used as a baseline due to its good performance and because it does not require complex adjustment of hyperparameters for training.
To compare the results obtained with the baseline, a second data representation based on the frequency spectrum was implemented using the Fast Fourier Transform (FFT) [88] obtained after calculating the Euclidean Norm of the signals (Equation (1)). This spectral representation is used because in [40] the authors state that using characteristics extracted from the frequency domain can provide results with similar performance to those obtained by combining both time and frequency characteristics. ( ) = ( ) ( ) ( ) (1)
where , , are the acceleration values related to x, y, and z axes. The FFT-based data representation was evaluated using AdaBoost and Gradient
Boost classifiers [89]. As a second approach for the context classifier, a CNN was evaluated for classifica-
tion with the raw signals as data representation, taking advantage of CNN’s capability to automatically extract discriminating characteristics from the signals [74]. For evaluating the CNN, the signals of the triaxial accelerometer were filtered in the interval from 0.5 to 10 Hz and normalized in a range from 0 to 1.
The CNN used for the context classifier is composed of an input layer (128 samples and 3 channels) and two one-dimensional convolutional layers (1-D CNN) with Rectified Linear Unit (ReLU) activations. The first CNN layer has 128 filters (kernel = 8), and it is connected to a max polling layer (pool size = 2). The second CNN layer uses 96 filters (kernel = 8), followed by a global average pooling (GAP) layer [90] which calculates the average values of each of the feature-maps by reducing them to a dimension of 1 × 1. For the classification, a dense layer with 190 units (ReLU activation) was connected to an out-put layer with a sigmoid activation function to obtain the probabilities that the input sam-ples correspond to a resting segment. The architecture used for the implementation of this classifier is shown in Figure 6.
Figure 5. Algorithm for the context classifier using machine and deep learning techniques.
To create a baseline for context classifier, 290 hand-crafted features commonly usedin context detection and automatic human activity recognition with smartphones andsmartwatches were extracted from the acceleration signals [77]. These types of featuresare normally used to identify human physical activity (sitting, standing, walking, etc.);however, in this study they were used to detect the context of the patient corresponding toresting or nonresting periods.
The features extracted include time and frequency characteristics [77]. This datarepresentation has been evaluated using an AdaBoost [87] classifier with 100 estimators.This algorithm was used as a baseline due to its good performance and because it does notrequire complex adjustment of hyperparameters for training.
To compare the results obtained with the baseline, a second data representation basedon the frequency spectrum was implemented using the Fast Fourier Transform (FFT) [88]obtained after calculating the Euclidean Norm of the signals (Equation (1)). This spectralrepresentation is used because in [40] the authors state that using characteristics extractedfrom the frequency domain can provide results with similar performance to those obtainedby combining both time and frequency characteristics.
a(i) =√
a2x(i) + a2
y(i) + a2z(i) (1)
where ax, ay, az are the acceleration values related to x, y, and z axes.The FFT-based data representation was evaluated using AdaBoost and Gradient Boost
classifiers [89].As a second approach for the context classifier, a CNN was evaluated for classification
with the raw signals as data representation, taking advantage of CNN’s capability toautomatically extract discriminating characteristics from the signals [74]. For evaluatingthe CNN, the signals of the triaxial accelerometer were filtered in the interval from 0.5 to10 Hz and normalized in a range from 0 to 1.
The CNN used for the context classifier is composed of an input layer (128 samplesand 3 channels) and two one-dimensional convolutional layers (1-D CNN) with RectifiedLinear Unit (ReLU) activations. The first CNN layer has 128 filters (kernel = 8), and it isconnected to a max polling layer (pool size = 2). The second CNN layer uses 96 filters

Sensors 2021, 21, 291 13 of 29
(kernel = 8), followed by a global average pooling (GAP) layer [90] which calculates theaverage values of each of the feature-maps by reducing them to a dimension of 1 × 1.For the classification, a dense layer with 190 units (ReLU activation) was connected to anoutput layer with a sigmoid activation function to obtain the probabilities that the inputsamples correspond to a resting segment. The architecture used for the implementation ofthis classifier is shown in Figure 6.
Sensors 2021, 20, x FOR PEER REVIEW 13 of 30
Figure 6. Convolutional neural network used for the context classifier using the raw signals.
Deep neural networks are difficult to train due to the large number of parameters that must be adjusted in each layer [91]. An accurate selection of these hyperparameters controls the training process and has a great influence on the performance of the model. The hyperparameter optimization was made by using the hyperband method [92]. During this process, the following hyperparameters were adjusted: learning rate, the number of CNNs and fully connected layers, the number of filters and kernel sizes in the CNN layers, the number of neurons in the fully connected layers, and the batch-size.
The training is an iterative process that repeats until finding an acceptable solution for a problem; in this process, the weights of the layers are updated iteratively. These it-erations are named epochs. The correct adjustment of the number of epochs is important to prevent overfitting and unnecessary computing. The training of the CNN model was performed by the retro-propagation method using the Adaptive moment estimation (ADAM) [93] optimizer with a learning rate of 0.0046, the binary cross-entropy as loss function, a batch-size of 64, and 200 as the max number of epochs. To avoid overfitting, an early-stopping strategy was employed, which requires subdividing the training data into a proportion of 80% for training (train–train) and 20% for validation (train–valida-tion). A reduced batch-size of 64 samples was chosen, allowing the model to achieve a better generalization capability [94].
3.5.2. Tremor Detector This detector was created to automatically detect the presence of tremors and was
used in conjunction with the context classifier to assess the symptom. For the evaluation of this classifier, several feature extraction techniques and algorithms proposed in the lit-erature were reproduced and evaluated using the signals of the triaxial accelerometer with windows of 2.56 s. A window was labeled as a tremor or nontremor only if more than 50% of its samples had these labels. Windows containing unknown labels or windows with labels containing less than 50% of its samples labeled as a tremor or nontremor were dis-carded during training.
For the development of the tremor detector, the scheme proposed in Figure 5 (context classifier) was used for machine and deep learning approaches.
The sets of features used to evaluate the tremor detector include: the spectral repre-sentation (FFT) obtained from the Euclidean Norm of triaxial signals (used as a baseline), features composed of the Mel frequency cepstral coefficients (MFCCs) adapted to inertial signals as used in [49,56], a set of features proposed by Hssayeni et al. [15], a set of features proposed by Mahadevan et al. [55], and the raw triaxial accelerometer signals used to evaluate the deep learning approaches.
As in the context classifier experiments, the signals were filtered in the range of 0.5–10 Hz, except for the Hssayeni et al. [15] data representation filtered in the range of 0.5–
Figure 6. Convolutional neural network used for the context classifier using the raw signals.
Deep neural networks are difficult to train due to the large number of parametersthat must be adjusted in each layer [91]. An accurate selection of these hyperparameterscontrols the training process and has a great influence on the performance of the model.The hyperparameter optimization was made by using the hyperband method [92]. Duringthis process, the following hyperparameters were adjusted: learning rate, the number ofCNNs and fully connected layers, the number of filters and kernel sizes in the CNN layers,the number of neurons in the fully connected layers, and the batch-size.
The training is an iterative process that repeats until finding an acceptable solution fora problem; in this process, the weights of the layers are updated iteratively. These iterationsare named epochs. The correct adjustment of the number of epochs is important to preventoverfitting and unnecessary computing. The training of the CNN model was performedby the retro-propagation method using the Adaptive moment estimation (ADAM) [93]optimizer with a learning rate of 0.0046, the binary cross-entropy as loss function, a batch-size of 64, and 200 as the max number of epochs. To avoid overfitting, an early-stoppingstrategy was employed, which requires subdividing the training data into a proportionof 80% for training (train–train) and 20% for validation (train–validation). A reducedbatch-size of 64 samples was chosen, allowing the model to achieve a better generalizationcapability [94].
3.5.2. Tremor Detector
This detector was created to automatically detect the presence of tremors and wasused in conjunction with the context classifier to assess the symptom. For the evaluationof this classifier, several feature extraction techniques and algorithms proposed in theliterature were reproduced and evaluated using the signals of the triaxial accelerometerwith windows of 2.56 s. A window was labeled as a tremor or nontremor only if morethan 50% of its samples had these labels. Windows containing unknown labels or windowswith labels containing less than 50% of its samples labeled as a tremor or nontremor werediscarded during training.
For the development of the tremor detector, the scheme proposed in Figure 5 (contextclassifier) was used for machine and deep learning approaches.
The sets of features used to evaluate the tremor detector include: the spectral repre-sentation (FFT) obtained from the Euclidean Norm of triaxial signals (used as a baseline),

Sensors 2021, 21, 291 14 of 29
features composed of the Mel frequency cepstral coefficients (MFCCs) adapted to inertialsignals as used in [49,56], a set of features proposed by Hssayeni et al. [15], a set of featuresproposed by Mahadevan et al. [55], and the raw triaxial accelerometer signals used toevaluate the deep learning approaches.
As in the context classifier experiments, the signals were filtered in the range of0.5–10 Hz, except for the Hssayeni et al. [15] data representation filtered in the range of0.5–15 Hz. A summary of the data representations used to evaluate the tremor classifiers isshown in Table 3.
Table 3. Summary of the data representations used in the tremor detector.
Data Representation Number of Features Description of the Features
FFT 64 Symmetric part of FFT obtained from the Euclidean Norm.
MFCCs [49,56] 36 (12 × 3 channels) Mel frequency cepstral coefficients adapted toinertial signals.
Hssayeni et al. [15] 39Power in bands (4–6 Hz and 0.5–15 Hz), autocorrelation features,
spectral entropy, first and second dominant frequencies andmagnitudes, cross-correlations between pairs of the axis.
Mahadevan et al. [55] 64 (8 × 8 preprocessed signals)RMS, signal range, signal entropy, dominant frequency and
magnitude, the ratio of the dominant frequency band to total energy,spectral flatness, spectral entropy.
Raw signal 384 (128 × 3 channels) The raw triaxial signal obtained for the accelerometer.
As in the context detector, a CNN model similar to that shown in Figure 6 wasevaluated for tremor detection using the raw signals of the triaxial accelerometer as aninput. The CNN was trained using the same hyperparameters of the context CNN andusing the early-stopping strategy to avoid overfitting.
3.5.3. Convolutional Multitask Models (Multitask CNN)
As a novel approach for the context classifier and tremor detector, a deep neuralnetwork with two independent outputs was implemented and evaluated. The proposedmultitask CNN is capable of analyzing the context and the occurrence of tremors simulta-neously. The model can reduce the number of trainable parameters that would be requiredwhen using two independent CNN models for context classification and tremor detection.
The scheme proposed for the tremor assessment using the multitask CNN models isshown in Figure 7.
Sensors 2021, 20, x FOR PEER REVIEW 14 of 30
15 Hz. A summary of the data representations used to evaluate the tremor classifiers is shown in Table 3.
Table 3. Summary of the data representations used in the tremor detector.
Data Representa-tion Number of Features Description of the Features
FFT 64 Symmetric part of FFT obtained from the Euclidean Norm.
MFCCs [49,56] 36 (12 × 3 channels) Mel frequency cepstral coefficients adapted to
inertial signals.
Hssayeni et al. [15] 39 Power in bands (4–6 Hz and 0.5–15 Hz), autocorrelation features, spectral
entropy, first and second dominant frequencies and magnitudes, cross-cor-relations between pairs of the axis.
Mahadevan et al. [55]
64 (8 × 8 preprocessed signals)
RMS, signal range, signal entropy, dominant frequency and magnitude, the ratio of the dominant frequency band to total energy, spectral flatness, spec-
tral entropy. Raw signal 384 (128 × 3 channels) The raw triaxial signal obtained for the accelerometer.
As in the context detector, a CNN model similar to that shown in Figure 6 was eval-uated for tremor detection using the raw signals of the triaxial accelerometer as an input. The CNN was trained using the same hyperparameters of the context CNN and using the early-stopping strategy to avoid overfitting.
3.5.3. Convolutional Multitask Models (Multitask CNN) As a novel approach for the context classifier and tremor detector, a deep neural net-
work with two independent outputs was implemented and evaluated. The proposed mul-titask CNN is capable of analyzing the context and the occurrence of tremors simultane-ously. The model can reduce the number of trainable parameters that would be required when using two independent CNN models for context classification and tremor detection.
The scheme proposed for the tremor assessment using the multitask CNN models is shown in Figure 7.
Figure 7. Algorithm for the tremor assessment using a multitask Convolutional neural network (CNN).
The proposed model has convolutional and polling layers that are shared with two separated branches with independent fully connected layers used for classification.
The multitask CNN is composed of two 1-D CNNs (128 filters, kernel = 8, and ReLU activation). The first CNN is connected to a max polling layer (pool size = 2) and the sec-ond is connected to a GAP layer. The convolutional and the polling layers were used for feature learning. For classification, two individual branches composed of dense layers (each one with 190 units and ReLU activation and dropout of 0.2) were connected to sin-gle-output layers for context and tremor detection, each one with sigmoid activations.
The architecture used for the implementation of the multitask CNN classifiers is shown in Figure 8.
Figure 7. Algorithm for the tremor assessment using a multitask Convolutional neural network (CNN).
The proposed model has convolutional and polling layers that are shared with twoseparated branches with independent fully connected layers used for classification.
The multitask CNN is composed of two 1-D CNNs (128 filters, kernel = 8, and ReLUactivation). The first CNN is connected to a max polling layer (pool size = 2) and the secondis connected to a GAP layer. The convolutional and the polling layers were used for featurelearning. For classification, two individual branches composed of dense layers (each onewith 190 units and ReLU activation and dropout of 0.2) were connected to single-outputlayers for context and tremor detection, each one with sigmoid activations.
The architecture used for the implementation of the multitask CNN classifiers isshown in Figure 8.

Sensors 2021, 21, 291 15 of 29Sensors 2021, 20, x FOR PEER REVIEW 15 of 30
Figure 8. Multitask CNN used for the context classifier and the tremor classifier using raw signals.
The multitask CNN was tested on the raw signals of the triaxial accelerometer and the FFT data representation. As in the context classifier and tremor detector, the triaxial signals was filtered in the range of 0.5 to 10 Hz and normalized in the range of 0–1. For the multitask CNN with FFT, the input layer was adapted to receive data of 64 features with a single channel (Input 64 × 1).
As in the CNN for context detection, the hyperparameter optimization was made by using the hyperband method to identify a suitable learning rate and the number of units in the fully connected layers of each branch.
The training of the model was performed by the retro-propagation method using an ADAM optimizer [93], with a learning rate of 0.0039 for the model with raw signals and 0.0046 for the model with FFT. The loss function selected to train the model was the binary cross-entropy. This loss function was used in the two branches with no weightings ap-plied to the outputs. Additionally, a batch-size of 64 and 200 as the max number of epochs was selected. An early-stopping strategy was set in both models to avoid overfitting.
3.5.4. Resting Tremor Assessment For the assessment, both the amplitude and tremor constancy were evaluated using
data of each experimental visit. These indicators were obtained to offer a long-term mon-itoring mechanism to improve the outcomes for the clinical evaluation of the disease.
The evaluation of the amplitude of the tremors was made through the spectral anal-ysis of the inertial signals. In agreement with the literature, the spectral analysis on the accelerometer signals shows an increase in the level in the frequency band from 3.5 to 7.5 Hz [18] when the patient presents resting tremors (Figure 9).
(a) (b) (c)
Figure 9. Spectrum of accelerometer signals for different tremor severities: (a) no tremor (UPDRS = 0); (b) slight tremor (UPDRS = 1); (c) mild tremor (UPDRS = 2).
Figure 8. Multitask CNN used for the context classifier and the tremor classifier using raw signals.
The multitask CNN was tested on the raw signals of the triaxial accelerometer andthe FFT data representation. As in the context classifier and tremor detector, the triaxialsignals was filtered in the range of 0.5 to 10 Hz and normalized in the range of 0–1. For themultitask CNN with FFT, the input layer was adapted to receive data of 64 features with asingle channel (Input 64 × 1).
As in the CNN for context detection, the hyperparameter optimization was made byusing the hyperband method to identify a suitable learning rate and the number of units inthe fully connected layers of each branch.
The training of the model was performed by the retro-propagation method using anADAM optimizer [93], with a learning rate of 0.0039 for the model with raw signals and0.0046 for the model with FFT. The loss function selected to train the model was the binarycross-entropy. This loss function was used in the two branches with no weightings appliedto the outputs. Additionally, a batch-size of 64 and 200 as the max number of epochs wasselected. An early-stopping strategy was set in both models to avoid overfitting.
3.5.4. Resting Tremor Assessment
For the assessment, both the amplitude and tremor constancy were evaluated usingdata of each experimental visit. These indicators were obtained to offer a long-termmonitoring mechanism to improve the outcomes for the clinical evaluation of the disease.
The evaluation of the amplitude of the tremors was made through the spectral anal-ysis of the inertial signals. In agreement with the literature, the spectral analysis on theaccelerometer signals shows an increase in the level in the frequency band from 3.5 to7.5 Hz [18] when the patient presents resting tremors (Figure 9).
Sensors 2021, 20, x FOR PEER REVIEW 15 of 30
Figure 8. Multitask CNN used for the context classifier and the tremor classifier using raw signals.
The multitask CNN was tested on the raw signals of the triaxial accelerometer and the FFT data representation. As in the context classifier and tremor detector, the triaxial signals was filtered in the range of 0.5 to 10 Hz and normalized in the range of 0–1. For the multitask CNN with FFT, the input layer was adapted to receive data of 64 features with a single channel (Input 64 × 1).
As in the CNN for context detection, the hyperparameter optimization was made by using the hyperband method to identify a suitable learning rate and the number of units in the fully connected layers of each branch.
The training of the model was performed by the retro-propagation method using an ADAM optimizer [93], with a learning rate of 0.0039 for the model with raw signals and 0.0046 for the model with FFT. The loss function selected to train the model was the binary cross-entropy. This loss function was used in the two branches with no weightings ap-plied to the outputs. Additionally, a batch-size of 64 and 200 as the max number of epochs was selected. An early-stopping strategy was set in both models to avoid overfitting.
3.5.4. Resting Tremor Assessment For the assessment, both the amplitude and tremor constancy were evaluated using
data of each experimental visit. These indicators were obtained to offer a long-term mon-itoring mechanism to improve the outcomes for the clinical evaluation of the disease.
The evaluation of the amplitude of the tremors was made through the spectral anal-ysis of the inertial signals. In agreement with the literature, the spectral analysis on the accelerometer signals shows an increase in the level in the frequency band from 3.5 to 7.5 Hz [18] when the patient presents resting tremors (Figure 9).
(a) (b) (c)
Figure 9. Spectrum of accelerometer signals for different tremor severities: (a) no tremor (UPDRS = 0); (b) slight tremor (UPDRS = 1); (c) mild tremor (UPDRS = 2).
Figure 9. Spectrum of accelerometer signals for different tremor severities: (a) no tremor (UPDRS = 0); (b) slight tremor(UPDRS = 1); (c) mild tremor (UPDRS = 2).
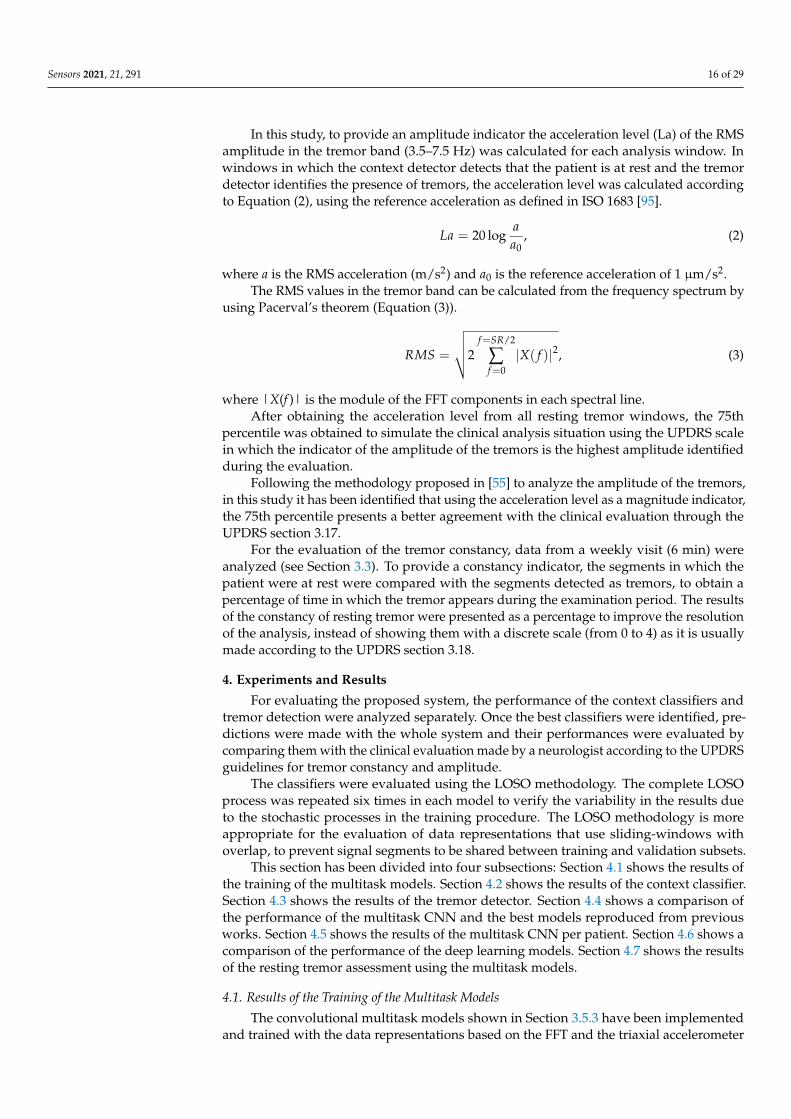
Sensors 2021, 21, 291 16 of 29
In this study, to provide an amplitude indicator the acceleration level (La) of the RMSamplitude in the tremor band (3.5–7.5 Hz) was calculated for each analysis window. Inwindows in which the context detector detects that the patient is at rest and the tremordetector identifies the presence of tremors, the acceleration level was calculated accordingto Equation (2), using the reference acceleration as defined in ISO 1683 [95].
La = 20 logaa0
, (2)
where a is the RMS acceleration (m/s2) and a0 is the reference acceleration of 1 µm/s2.The RMS values in the tremor band can be calculated from the frequency spectrum by
using Pacerval’s theorem (Equation (3)).
RMS =
√√√√2f=SR/2
∑f=0|X( f )|2, (3)
where |X(f )| is the module of the FFT components in each spectral line.After obtaining the acceleration level from all resting tremor windows, the 75th
percentile was obtained to simulate the clinical analysis situation using the UPDRS scalein which the indicator of the amplitude of the tremors is the highest amplitude identifiedduring the evaluation.
Following the methodology proposed in [55] to analyze the amplitude of the tremors,in this study it has been identified that using the acceleration level as a magnitude indicator,the 75th percentile presents a better agreement with the clinical evaluation through theUPDRS section 3.17.
For the evaluation of the tremor constancy, data from a weekly visit (6 min) wereanalyzed (see Section 3.3). To provide a constancy indicator, the segments in which thepatient were at rest were compared with the segments detected as tremors, to obtain apercentage of time in which the tremor appears during the examination period. The resultsof the constancy of resting tremor were presented as a percentage to improve the resolutionof the analysis, instead of showing them with a discrete scale (from 0 to 4) as it is usuallymade according to the UPDRS section 3.18.
4. Experiments and Results
For evaluating the proposed system, the performance of the context classifiers andtremor detection were analyzed separately. Once the best classifiers were identified, pre-dictions were made with the whole system and their performances were evaluated bycomparing them with the clinical evaluation made by a neurologist according to the UPDRSguidelines for tremor constancy and amplitude.
The classifiers were evaluated using the LOSO methodology. The complete LOSOprocess was repeated six times in each model to verify the variability in the results dueto the stochastic processes in the training procedure. The LOSO methodology is moreappropriate for the evaluation of data representations that use sliding-windows withoverlap, to prevent signal segments to be shared between training and validation subsets.
This section has been divided into four subsections: Section 4.1 shows the results ofthe training of the multitask models. Section 4.2 shows the results of the context classifier.Section 4.3 shows the results of the tremor detector. Section 4.4 shows a comparison ofthe performance of the multitask CNN and the best models reproduced from previousworks. Section 4.5 shows the results of the multitask CNN per patient. Section 4.6 shows acomparison of the performance of the deep learning models. Section 4.7 shows the resultsof the resting tremor assessment using the multitask models.
4.1. Results of the Training of the Multitask Models
The convolutional multitask models shown in Section 3.5.3 have been implementedand trained with the data representations based on the FFT and the triaxial accelerometer

Sensors 2021, 21, 291 17 of 29
signals. The resulting loss curves for the training and test subsets of two models trainedduring LOSO evaluation are shown in Figure 10.
Sensors 2021, 20, x FOR PEER REVIEW 17 of 30
4.1. Results of the Training of the Multitask Models The convolutional multitask models shown in Section 3.5.3 have been implemented
and trained with the data representations based on the FFT and the triaxial accelerometer signals. The resulting loss curves for the training and test subsets of two models trained during LOSO evaluation are shown in Figure 10.
(a) (b)
Figure 10. (a) Loss curves obtained from the training of multitask CNN with Fast Fourier Transform (FFT). (b) Loss curves obtained from the training of the multitask CNN with triaxial signals.
Figure 10 shows that increasing the number of training-iterations (epochs), the value of the losses decreases for the training and test subsets. The early-stopping strategy was implemented with the test-loss as monitor and the patience parameter set to 10.
Figure 10a, corresponding to the multitasking CNN with FFT, indicates that there is no significant improvement in the test-loss after epoch 62. Thus, overall, 72 epochs were performed. The mean processing time for this model was 4.6 ms per batch (batch size of 64 samples) and 1.9 s per epoch.
Figure 10b, corresponding to the multitask CNN with triaxial signals, indicates that there is no significant improvement in the test-loss after epoch 55. Thus, overall, 65 epochs were performed. The mean processing time was 6 milliseconds per batch and 2.4 s per epoch.
These results indicate that the multitask models were properly trained with the con-figuration indicated in Section 3.5.3.
The mean processing time in the multitask CNN with a raw signal was slightly higher than the model with FFT. This increase is because the model needs to handle a larger amount of data corresponding to the three channels from the accelerometer and the model needs to adjust a greater number of parameters in the training.
Additionally, the presence of overfitting was not identified because of the loss curves for validation and testing decrease until the training was stopped by the early-stopping strategy. The early-stopping was configured to restore the weights from the epoch with the lower test-loss.
4.2. Results of the Context Classifier For a binary classification problem (resting and nonresting) such as this, the results
obtained from the context classifier are expressed by sensitivity, specificity [96], and the area under the curve (AUC) of the receiver operating characteristic curve [97]. The sensi-tivity is the ratio of positives that are correctly identified, while specificity is the ratio of
Figure 10. (a) Loss curves obtained from the training of multitask CNN with Fast Fourier Transform (FFT). (b) Loss curvesobtained from the training of the multitask CNN with triaxial signals.
Figure 10 shows that increasing the number of training-iterations (epochs), the valueof the losses decreases for the training and test subsets. The early-stopping strategy wasimplemented with the test-loss as monitor and the patience parameter set to 10.
Figure 10a, corresponding to the multitasking CNN with FFT, indicates that there isno significant improvement in the test-loss after epoch 62. Thus, overall, 72 epochs wereperformed. The mean processing time for this model was 4.6 ms per batch (batch size of64 samples) and 1.9 s per epoch.
Figure 10b, corresponding to the multitask CNN with triaxial signals, indicatesthat there is no significant improvement in the test-loss after epoch 55. Thus, overall,65 epochs were performed. The mean processing time was 6 milliseconds per batch and2.4 s per epoch.
These results indicate that the multitask models were properly trained with theconfiguration indicated in Section 3.5.3.
The mean processing time in the multitask CNN with a raw signal was slightly higherthan the model with FFT. This increase is because the model needs to handle a largeramount of data corresponding to the three channels from the accelerometer and the modelneeds to adjust a greater number of parameters in the training.
Additionally, the presence of overfitting was not identified because of the loss curvesfor validation and testing decrease until the training was stopped by the early-stoppingstrategy. The early-stopping was configured to restore the weights from the epoch with thelower test-loss.
4.2. Results of the Context Classifier
For a binary classification problem (resting and nonresting) such as this, the resultsobtained from the context classifier are expressed by sensitivity, specificity [96], and the areaunder the curve (AUC) of the receiver operating characteristic curve [97]. The sensitivity isthe ratio of positives that are correctly identified, while specificity is the ratio of negativesthat are correctly identified. The values of sensitivity and specificity have been obtainedusing a threshold of equal sensitivity and specificity.
Three data representations have been used for the evaluation of this classifier andseveral classification algorithms have been evaluated such as AdaBoost (100 estimators),
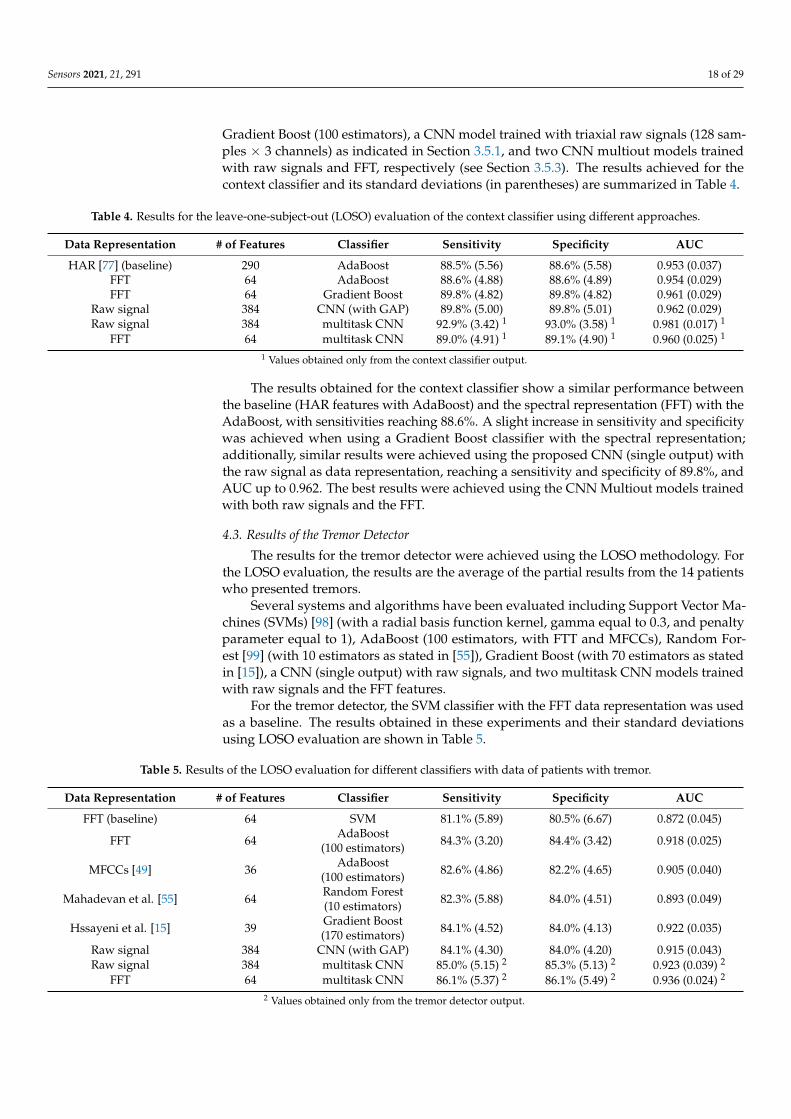
Sensors 2021, 21, 291 18 of 29
Gradient Boost (100 estimators), a CNN model trained with triaxial raw signals (128 sam-ples × 3 channels) as indicated in Section 3.5.1, and two CNN multiout models trainedwith raw signals and FFT, respectively (see Section 3.5.3). The results achieved for thecontext classifier and its standard deviations (in parentheses) are summarized in Table 4.
Table 4. Results for the leave-one-subject-out (LOSO) evaluation of the context classifier using different approaches.
Data Representation # of Features Classifier Sensitivity Specificity AUC
HAR [77] (baseline) 290 AdaBoost 88.5% (5.56) 88.6% (5.58) 0.953 (0.037)FFT 64 AdaBoost 88.6% (4.88) 88.6% (4.89) 0.954 (0.029)FFT 64 Gradient Boost 89.8% (4.82) 89.8% (4.82) 0.961 (0.029)
Raw signal 384 CNN (with GAP) 89.8% (5.00) 89.8% (5.01) 0.962 (0.029)Raw signal 384 multitask CNN 92.9% (3.42) 1 93.0% (3.58) 1 0.981 (0.017) 1
FFT 64 multitask CNN 89.0% (4.91) 1 89.1% (4.90) 1 0.960 (0.025) 1
1 Values obtained only from the context classifier output.
The results obtained for the context classifier show a similar performance betweenthe baseline (HAR features with AdaBoost) and the spectral representation (FFT) with theAdaBoost, with sensitivities reaching 88.6%. A slight increase in sensitivity and specificitywas achieved when using a Gradient Boost classifier with the spectral representation;additionally, similar results were achieved using the proposed CNN (single output) withthe raw signal as data representation, reaching a sensitivity and specificity of 89.8%, andAUC up to 0.962. The best results were achieved using the CNN Multiout models trainedwith both raw signals and the FFT.
4.3. Results of the Tremor Detector
The results for the tremor detector were achieved using the LOSO methodology. Forthe LOSO evaluation, the results are the average of the partial results from the 14 patientswho presented tremors.
Several systems and algorithms have been evaluated including Support Vector Ma-chines (SVMs) [98] (with a radial basis function kernel, gamma equal to 0.3, and penaltyparameter equal to 1), AdaBoost (100 estimators, with FTT and MFCCs), Random For-est [99] (with 10 estimators as stated in [55]), Gradient Boost (with 70 estimators as statedin [15]), a CNN (single output) with raw signals, and two multitask CNN models trainedwith raw signals and the FFT features.
For the tremor detector, the SVM classifier with the FFT data representation was usedas a baseline. The results obtained in these experiments and their standard deviationsusing LOSO evaluation are shown in Table 5.
Table 5. Results of the LOSO evaluation for different classifiers with data of patients with tremor.
Data Representation # of Features Classifier Sensitivity Specificity AUC
FFT (baseline) 64 SVM 81.1% (5.89) 80.5% (6.67) 0.872 (0.045)
FFT 64 AdaBoost(100 estimators) 84.3% (3.20) 84.4% (3.42) 0.918 (0.025)
MFCCs [49] 36 AdaBoost(100 estimators) 82.6% (4.86) 82.2% (4.65) 0.905 (0.040)
Mahadevan et al. [55] 64 Random Forest(10 estimators) 82.3% (5.88) 84.0% (4.51) 0.893 (0.049)
Hssayeni et al. [15] 39 Gradient Boost(170 estimators) 84.1% (4.52) 84.0% (4.13) 0.922 (0.035)
Raw signal 384 CNN (with GAP) 84.1% (4.30) 84.0% (4.20) 0.915 (0.043)Raw signal 384 multitask CNN 85.0% (5.15) 2 85.3% (5.13) 2 0.923 (0.039) 2
FFT 64 multitask CNN 86.1% (5.37) 2 86.1% (5.49) 2 0.936 (0.024) 2
2 Values obtained only from the tremor detector output.

Sensors 2021, 21, 291 19 of 29
According to the results shown in Table 5, the two multitask CNN models presenthigher performances in sensitivity and specificity; however, the system proposed byHssayeni [15] is the best shallow machine learning approach and presents a higher AUCvalue than the multitask CNN with raw signals but presents similar results in terms ofsensibility and sensitivity (84.1% and 84.0%, respectively). According to these results, theperformance of this system could be considered for the implementation of a system basedon independent classifiers with shallow machine learning algorithms.
The AdaBoost algorithm with FFT also presents a good performance over the CNN(single output), but less than the multioutput models. The remaining approaches haveshown AUC results up to 0.9, with sensitivities and specificities below 84%.
The best result in tremor detection has been achieved using the multitask CNN withthe FFT.
4.4. Comparison of the Multitask CNN Models with Previous Works
In this section, the best results obtained in the context classifier and the tremor de-tector are analyzed. Additionally, for comparison purposes, the results obtained for bothclassifiers are reported with the LOSO evaluation and the stratified 10-fold cross-validation.
For the stratified 10-fold evaluation the dataset was divided into 10 folds that werecreated by preserving the percentage of samples for each class. From these folds, nine wereused for training and one for testing, and the process was repeated for each fold. Theresults of the evaluation are the mean of the ten iterations. The use of the stratified 10-foldcross-validation could lead to achieving over-optimistic results since the training and testdata are usually very similar.
Table 6 shows a summary of the best results obtained from the systems reproducedfrom previous works and the results achieved with the multitask CNN models for bothcontext and tremor classification. The results are presented in terms of AUC for the LOSOand the stratified 10-fold cross-validation.
Table 6. Comparison of the performance of the best systems reproduced from previous works and the best CNN multitasksystems.
System Classification Task LOSO AUC Stratified 10-Fold AUC
HAR features [77] + Adaboost (with 100 estimators) Context 0.962 (0.029) 0.970 (0.003)multitask CNN with raw signal (ours) Context 0.981 (0.017) 3 0.990 (0.002) 3
Hssayeni et al. [15] (Specific tremor features) Tremor 0.922 (0.035) 0.956 (0.003)multitask CNN with FFT (ours) Tremor 0.936 (0.024) 4 0.965 (0.003) 4
3 Value obtained only from the context classifier output. 4 Value obtained only from the tremor detector output.
According to Table 6, the proposed models based on multitask CNN models show aslight improvement in terms of AUC over the best results obtained from the reproduction ofprevious works in both classification tasks and evaluation methodologies. As expected, theresults obtained from the stratified 10-fold cross-validation presents higher performancesover the LOSO evaluation.
The use of spectral representations seems to be suitable for accurate tremor detection,while the use of complex data representations (including time and frequency features orraw signals) seems to be suitable for context identification.
The results obtained in the LOSO evaluation present a higher standard deviation thanthe stratified 10-fold validation. These variations are produced because some patientspresent different movement and tremor patterns, thus producing a higher variation in theglobal results.
In contrast, the stratified 10-fold evaluation presents a low standard deviation regard-less of the system or the classification task, because of the similarity between the trainingand test subsets.
A further comparison for each classifier (context and tremor) is provided inSections 4.4.1 and 4.4.2.

Sensors 2021, 21, 291 20 of 29
4.4.1. Comparison with Previous Works for the Context Classifier
For the context classifier (resting periods), our best results were obtained with themultitask CNN with the raw triaxial signals from the accelerometer. The best contextclassifier shows a sensitivity of 92.0%, a specificity of 93%, and an AUC of 0.981, evaluatedthrough LOSO cross-validation. This classifier shows an increase in the performance overthe baseline (time and frequency features used in HAR [77] with AdaBoost) up to 4.4% inthe sensitivity and specificity.
In terms of AUC, an increase of 0.02 was achieved over the baseline in both evalua-tion methodologies. For the context data, a difference of 0.01 in AUC is significant withp-value < 0.001, according to Hanley’s method [97].
Additionally, a slight improvement in the performance over the baseline has beenshown in Table 4 using different data representations such as FFT and a Gradient Boostclassifier. While the CNN (single output) with raw signals present similar results to thebest shallow machine learning approach (FFT with Gradient Boost).
In addition to the improvement in the performance of the context classifier whenusing models with multiple outputs, it can be observed according to Tables 4 and 5 thatthe performance of the tremor detector is also increased. This improvement could be pro-duced because the outputs of the CNN multioutput models share convolutional layers thatare used to automatically learn discriminating characteristics by the two branches of theclassifier, thus increasing the generalization capacity of the network and allowing the con-volutional layers to learn discriminant characteristics useful for both context classificationand tremor detection.
4.4.2. Comparison with Previous Works for the Tremor Detector
The best result obtained in the present study for detecting resting tremors shows asensitivity of 86.1%, a specificity of 86.1%, and an AUC of 0.936 using a multitask CNNwith FFT, evaluated through LOSO evaluation. These results show an increase in theperformance—5% increase in sensitivity and 5.6% for the specificity when compared withthe baseline (SVM with FFT), and 2% (sensitivity and specificity) higher than the bestsystem [15] reproduced from previous works.
In terms of AUC, an increase of 0.014 and 0.009 was achieved in the LOSO and thestratified 10-fold evaluation over the best method reproduced from previous works. Forthe tremor data, a difference of 0.01 in AUC is significant with p-value < 0.001, according toHanley’s method [97]. Even with the increase in the AUC, the CNN multioutput (with FFT)evaluated through the stratified 10-fold evaluation does not seem to show a significantdifference compared to the best reproduced method.
In the experiments performed in this study, the system proposed by Hssayeni et al. [15](handcrafted features with Gradient Boost) presents a higher performance in terms of AUCamong the shallow machine learning classifiers. This system shows a performance evenhigher (0.922) than the CNN single-output trained with raw signals. Additionally, theAdaBoost algorithm with FFT presents a good performance over the CNN single-output(but less than the multitask models). For this reason, these shallow approaches could besuitable for the development of systems dedicated only to the analysis of tremors or forsystems based on multiple classifiers.
The remaining approaches for tremor detection based on shallow classification algo-rithms present lower performances, with sensitivities and specificities ranging from 80% to84.0%. According to the results obtained in Table 5, the data representation based in MFCCs(AUC 0.905) could be considered a good trade between performance and computationalburden due to the low number of features to be extracted.
In the related literature for tremor detection, sensitivities and specificities above 94%have been reported using configurations of four or six accelerometers, such as in theworks of Rigas et al. [37], Keijsers et al. [33], Roy et al. [38] (with an additional EMG), andSalarian et al. [31] (with two gyroscopes). Although these methods show a great perfor-mance, the results obtained from the stratified 10-fold cross-validation using the multitask

Sensors 2021, 21, 291 21 of 29
CNN presents similar performances, with AUC values up to 0.965, even considering theuse of a single sensor.
These results suggest that it is feasible to develop optimized systems that can reducethe usability barriers such as the burden for the wearer when using multiple devices or theneed for assistance for the correct placement of the sensors on the body.
4.5. Results of the Multitask CNN Per Patient
For further analysis, Table 7 shows the results per patient obtained from the multitaskCNN models (FFT and triaxial raw data). The results presented are the mean values ofsix evaluations obtained per patient using LOSO validation, in a similar manner to theprevious experiments.
Patients 4, 15, 17, and 18 did not preset tremors, therefore AUC values for tremor havenot been obtained.
Table 7. Area under the curve (AUC) results per patient of the multitask CNN models using LOSOevaluation.
Patient IDMultitask CNN with FFT Multitask CNN with Raw Signals
AUC Context AUC Tremor AUC Context AUC Tremor
1 0.961 (0.003) 0.962 (0.004) 0.969 (0.005) 0.948 (0.010)2 0.980 (0.002) 0.960 (0.002) 0.994 (0.0002) 0.926 (0.002)3 0.960 (0.001) 0.981 (0.001) 0.975 (0.006) 0.978 (0.002)4 0.956 (0.006) - 0.972 (0.001) -5 0.950 (0.001) 0.928 (0.003) 0.971 (0.001) 0.902 (0.004)6 0.935 (0.002) 0.913 (0.002) 0.952 (0.001) 0.848 (0.002)7 0.936 (0.001) 0.933 (0.002) 0.981 (0.0002) 0.952 (0.002)8 0.940 (0.003) 0.933 (0.004) 0.982 (0.003) 0.959 (0.005)9 0.949 (0.003) 0.959 (0.005) 0.976 (0.002) 0.954 (0.005)10 0.962 (0.003) 0.900 (0.003) 0.995 (0.0004) 0.904 (0.003)11 0.975 (0.003) 0.915 (0.005) 0.990 (0.001) 0.826 (0.010)12 0.890 (0.003) 0.924 (0.004) 0.951 (0.005) 0.887 (0.003)13 0.985 (0.003) 0.909 (0.003) 0.995 (0.0003) 0.927 (0.003)14 0.982 (0.0003) 0.932 (0.001) 0.996 (0.0005) 0.930 (0.007)15 0.984 (0.001) - 0.997 (0.0003) -16 0.957 (0.003) 0.959 (0.002) 0.969 (0.005) 0.935 (0.002)17 0.981 (0.0001) - 0.991 (0.0004) -18 0.993 (0.001) - 0.998 (0.0004) -
According to Table 7, the multitask CNN model with FFT presents values over the0.935 for the AUC Context with a maximum value of 0.993, except for patient 12 with anAUC of 0.890. The AUC tremor present values over 0.900 in all cases, reaching a maximumof 0.981.
For the multitask CNN model trained with raw triaxial signals, the AUC contextpresents higher performances than the model trained with FFT. AUC Context values over0.951 have been achieved with a maximum value of 0.998. In contrast, the AUC tremorpresents a lower performance than the FFT, although this model presents AUC values over0.902, patients 6, 11, and 12 present lower performances (between 0.826 and 0.887) reducingthe overall performance of the model in tremor detection.
These results show an accurate performance in multiple task classification (contextand tremor) in the majority of the patients in both models. The standard deviation of thesix evaluations (trainings) present low variation for each patient and regardless of theclassification task, which indicates that the model generalizes well with data it has not seenbefore using the configuration indicated in Section 3.5.3.

Sensors 2021, 21, 291 22 of 29
4.6. Comparison of the Performance and Number Trainable Parameters of the Deep LearningModels
Since the CNN models have presented higher performances for context and tremordetection, this section analyses the number of parameters that must be trained for each ofthe models. Table 8 shows a comparison of the number of trainable parameters and theperformance of the CNN approaches for context and tremor detection.
Table 8. Comparison of the number of trainable parameters and the performance of the convolutional models.
Model Data Representation Number of Trainable Parameters AUC Context AUC Tremor
CNN context (single output) Raw signal 120,221 0.962 (0.029) -CNN tremor (single output) Raw signal 120,221 - 0.915 (0.043)
multitask CNN Raw signal 183,802 0.981 (0.017) 0.920 (0.044)multitask CNN FFT 136,794 0.960 (0.025) 0.936 (0.024)
According to Table 8, the best result for context detection was achieved using themultitask CNN with raw signal whereas the best result for tremor has been achieved bythe multitask CNN with FFT, over the CNN single-output models.
On the one hand, the multitask CNN with FFT has 16,573 additional parameterscompared with the single-output models. A reduced number of parameters could be usedto implement an efficient system that avoids the execution of two models which requires atotal of 240,442 parameters to perform the tremor assessment with a pipe such as the oneshown in Figure 4.
On the other hand, the use of the multitask CNN with raw signals present a highernumber of parameters (183,802 parameters). The use of this model could be justified bythe fact that it presents the best performance for context detection and it does not requirepreprocessing, reducing the number of tasks that the system must perform to be used forlong-term monitoring.
According to results achieved in the context and tremor classification, the subse-quent experiments were performed with the CCN multioutput models to evaluate themethodology for tremor assessment.
4.7. Results of the Resting Tremor Assessment
Since the assessment of the symptom using amplitude and constancy is one of themain objectives of the proposed system, the results obtained from the complete system werecompared with the clinical evaluations assessed by a neurologist from video recordingsaccording to the UPDRS sections 3.17 and 3.18. The results for the amplitude and constancywere obtained using the best models (multitask CNN) trained during the LOSO evaluationof context and tremor classifiers.
4.7.1. Results of the Amplitude Assessment
To evaluate the agreement between the acceleration level from the tremor band andthe amplitude obtained through the clinical evaluation performed by the neurologist, aKruskal–Wallis test was used, obtaining a chi-square = 20.84, p = 2.98 × 10⁻⁵ for themultitask CNN with FFT and a chi-square = 22.61, p = 1.23 × 10⁻⁵ for the multitask CNNwith raw signals. Previously, a Shapiro–Wilk test was used to verify that the variablesgrouped according to the clinical score do not follow normal distributions.
Post-hoc Dunn’s test was used for pairwise comparisons. Both multitask CNN ap-proaches were able to significantly differentiate (p ≤ 0.05) among all pairs of clinical scores(pairs adjacent and nonadjacent). Figure 11 shows the agreement between the accelerationlevel obtained from the multitask CNN models and the clinical evaluation (UPDRS 3.17).

Sensors 2021, 21, 291 23 of 29
Sensors 2021, 20, x FOR PEER REVIEW 23 of 30
According to results achieved in the context and tremor classification, the subsequent experiments were performed with the CCN multioutput models to evaluate the method-ology for tremor assessment.
4.7. Results of the Resting Tremor Assessment Since the assessment of the symptom using amplitude and constancy is one of the
main objectives of the proposed system, the results obtained from the complete system were compared with the clinical evaluations assessed by a neurologist from video record-ings according to the UPDRS sections 3.17 and 3.18. The results for the amplitude and constancy were obtained using the best models (multitask CNN) trained during the LOSO evaluation of context and tremor classifiers.
4.7.1. Results of the Amplitude Assessment To evaluate the agreement between the acceleration level from the tremor band and
the amplitude obtained through the clinical evaluation performed by the neurologist, a Kruskal–Wallis test was used, obtaining a chi-square = 20.84, p = 2.98 × 10⁻⁵ for the multi-task CNN with FFT and a chi-square = 22.61, p = 1.23 × 10⁻⁵ for the multitask CNN with raw signals. Previously, a Shapiro–Wilk test was used to verify that the variables grouped according to the clinical score do not follow normal distributions.
Post-hoc Dunn’s test was used for pairwise comparisons. Both multitask CNN ap-proaches were able to significantly differentiate (p ≤ 0.05) among all pairs of clinical scores (pairs adjacent and nonadjacent). Figure 11 shows the agreement between the acceleration level obtained from the multitask CNN models and the clinical evaluation (UPDRS 3.17).
(a) (b)
Figure 11. Agreement between the measurements of acceleration level derived from the resting tremor assessment and the UPDRS clinical score. (a) Agreement obtained with the multitask CNN with FFT. (b) Agreement obtained with the multitask CNN with raw signals.
4.7.2. Results of the Constancy Assessment For the tremor constancy evaluation, the correlation between the clinical evaluation
and the constancy obtained by the proposed system for each of the weekly experimental tests was analyzed.
As shown in Figure 12, a strong correlation was found between the constancy ob-tained by video evaluation and the multitask CNN approaches.
Figure 11. Agreement between the measurements of acceleration level derived from the resting tremor assessment andthe UPDRS clinical score. (a) Agreement obtained with the multitask CNN with FFT. (b) Agreement obtained with themultitask CNN with raw signals.
4.7.2. Results of the Constancy Assessment
For the tremor constancy evaluation, the correlation between the clinical evaluationand the constancy obtained by the proposed system for each of the weekly experimentaltests was analyzed.
As shown in Figure 12, a strong correlation was found between the constancy obtainedby video evaluation and the multitask CNN approaches.
Sensors 2021, 20, x FOR PEER REVIEW 24 of 30
(a) (b)
Figure 12. Correlation between the clinical evaluation and the constancy obtained by the system. (a) Correlation obtained with the multitask CNN with FFT. (b) Correlation obtained with the multitask CNN with raw signals.
For the multitask CNN with FFT, a Person r = 0.969, p = 3.99 × 10−64 was found, while for the multitask CNN with raw signals, a Person r = 0.959, p = 1.56 × 10−57 was achieved. The results are shown in percentages to offer a better resolution for monitoring.
5. Discussion and Conclusions This study analyzes the use of consumer smartwatches and their embedded accel-
erometers for monitoring and evaluating resting tremor in PD patients. The proposed method is composed of a context classifier that detects resting times, a tremor detector, and a module that assesses the amplitude and constancy of resting tremors. According to the results achieved, the proposed approaches based on CNN with multiple outputs are capable of deriving significant measures of the amplitude and constancy of resting trem-ors from the data collected during the performance of a set of programmed activities and rest periods.
The frequency response of the embedded accelerometer from the smartwatch has been verified to analyze the accuracy of the device for measuring the amplitude of the tremor. The results of the comparison with a reference accelerometer show a linear fre-quency response in the range of 3.15–20 Hz for amplitudes of 1 and 3 m/s2, and a linear frequency in the range of 5–20 Hz for an amplitude of 5 m/s2, which is a suitable frequency range for tremor analysis and activity detection. Additionally, the maximum amplitude range of the sensor (±2 g factory-set) has not been exceeded in the tests performed in this study for slight and mild tremor severities according to section 3.17 of the UPDRS guide.
It should be noted that an accurate selection of the data acquisition devices and sen-sors is relevant to develop systems with high performances. Optimized systems should be able to maintain high performance despite the variability of movement patterns or mo-tor symptoms among patients, even by resorting to the use of a single sensor. In this study, the technical characteristics of a consumer smartwatch and its built-in accelerometer seem to be suitable for the acquisition of data to assess resting tremor in patients with PD.
The experimental protocol for data collection was carried out with 18 PD patients who performed a series of scripted activities alternated with rest periods. From the data collected in these experiments, several implementations of context classifiers (resting pe-riods) and tremor classifiers have been evaluated.
For the implementation of the system, a hierarchical system was developed to simul-taneously identify the resting times and the presence of tremors of the upper limbs. This approach opens opportunities for continuous monitoring in free-living environments
Figure 12. Correlation between the clinical evaluation and the constancy obtained by the system. (a) Correlation obtainedwith the multitask CNN with FFT. (b) Correlation obtained with the multitask CNN with raw signals.
For the multitask CNN with FFT, a Person r = 0.969, p = 3.99 × 10−64 was found,while for the multitask CNN with raw signals, a Person r = 0.959, p = 1.56 × 10−57 wasachieved. The results are shown in percentages to offer a better resolution for monitoring.
5. Discussion and Conclusions
This study analyzes the use of consumer smartwatches and their embedded accelerom-eters for monitoring and evaluating resting tremor in PD patients. The proposed method is

Sensors 2021, 21, 291 24 of 29
composed of a context classifier that detects resting times, a tremor detector, and a modulethat assesses the amplitude and constancy of resting tremors. According to the resultsachieved, the proposed approaches based on CNN with multiple outputs are capable ofderiving significant measures of the amplitude and constancy of resting tremors from thedata collected during the performance of a set of programmed activities and rest periods.
The frequency response of the embedded accelerometer from the smartwatch has beenverified to analyze the accuracy of the device for measuring the amplitude of the tremor.The results of the comparison with a reference accelerometer show a linear frequencyresponse in the range of 3.15–20 Hz for amplitudes of 1 and 3 m/s2, and a linear frequencyin the range of 5–20 Hz for an amplitude of 5 m/s2, which is a suitable frequency rangefor tremor analysis and activity detection. Additionally, the maximum amplitude range ofthe sensor (±2 g factory-set) has not been exceeded in the tests performed in this study forslight and mild tremor severities according to section 3.17 of the UPDRS guide.
It should be noted that an accurate selection of the data acquisition devices and sensorsis relevant to develop systems with high performances. Optimized systems should beable to maintain high performance despite the variability of movement patterns or motorsymptoms among patients, even by resorting to the use of a single sensor. In this study, thetechnical characteristics of a consumer smartwatch and its built-in accelerometer seem tobe suitable for the acquisition of data to assess resting tremor in patients with PD.
The experimental protocol for data collection was carried out with 18 PD patients whoperformed a series of scripted activities alternated with rest periods. From the data collectedin these experiments, several implementations of context classifiers (resting periods) andtremor classifiers have been evaluated.
For the implementation of the system, a hierarchical system was developed to si-multaneously identify the resting times and the presence of tremors of the upper limbs.This approach opens opportunities for continuous monitoring in free-living environmentswithout interrupting the patients’ daily lives. Additionally, with this approach, the sec-tions identified as movements can be used to evaluate other PD motor symptoms such asbradykinesia.
When evaluating the complete system, the errors made by the context classifiers andthe tremor detector did not appear to have a significant impact on the symptom assessmentresults; however, there was a risk of error propagation (if any of the classifiers presenta high error). For this reason, novel algorithms, such as the proposed CNN classifiers(single and multioutput) shown in Sections 3.5.1 and 3.5.3, could be used to improve theperformance and reduce the risk of error propagation, even considering an increase in thenumber of parameters to be used for the classification models.
The evaluation of the context classifier using the LOSO methodology shows that thebest results were obtained through the use of a multitask CNN, using the raw signals asinput. Although this approach presents the best performance, the model has a highernumber of trainable parameters (183,802) among the models presented in this work. Theuse of this model could be supported by the fact that the system implemented did notrequire preprocessing techniques besides the extraction of the acceleration level. Thedevelopment of models similar to this could support the implementation of end-to-endsystems where a complex feature extraction creation and evaluation process is not required.
For the tremor classifier, it was identified that the approach based on the multitaskCNN with spectral representation presents a higher performance. As in [40], it was foundthat features extracted only from the frequency domain may allow tremor detection withsufficient accuracy to be used for the assessment of amplitude and constancy of tremor.This situation presents opportunities for the improvement and development of optimizedsystems for continuous operation, considering novel deep learning architectures and spec-tral data representations. For evaluating the performance of the resting tremor assessment,the present approach was compared with the clinical assessment made by the UPDRSsections 3.17 and 3.18. The results show a high agreement between the clinical assessmentof the tremor amplitude and the acceleration level obtained from the data acquired by
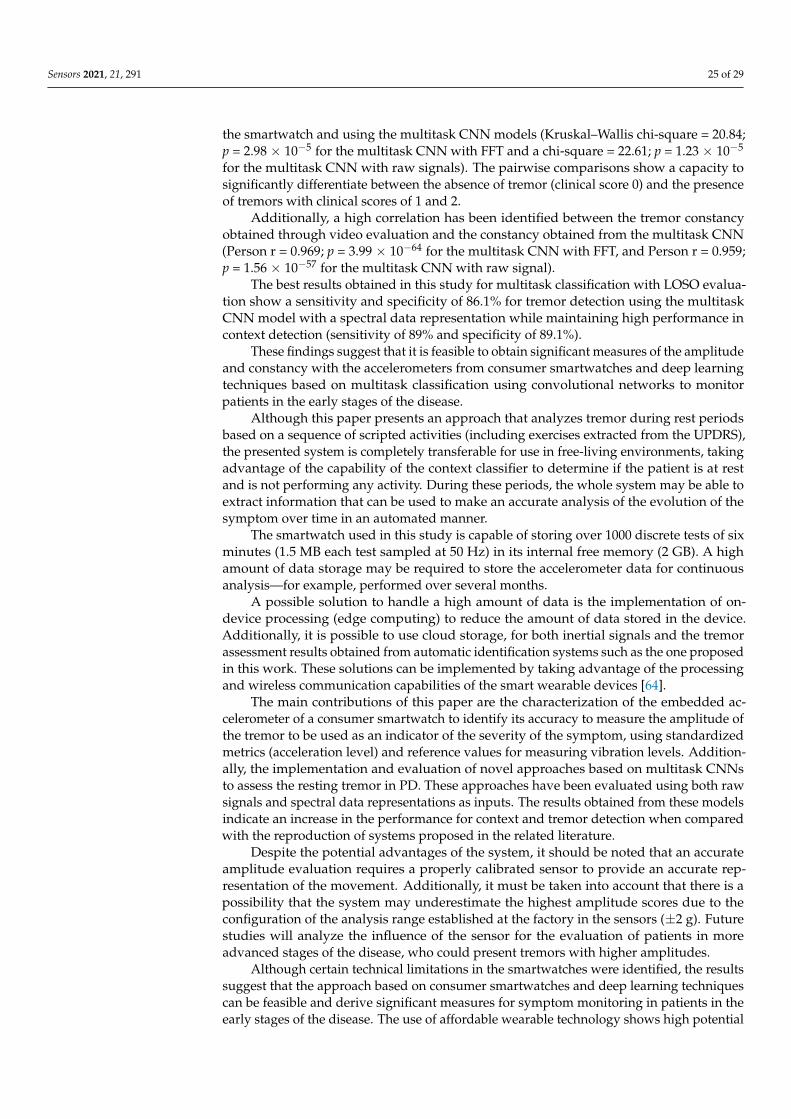
Sensors 2021, 21, 291 25 of 29
the smartwatch and using the multitask CNN models (Kruskal–Wallis chi-square = 20.84;p = 2.98 × 10⁻⁵ for the multitask CNN with FFT and a chi-square = 22.61; p = 1.23 × 10⁻⁵
for the multitask CNN with raw signals). The pairwise comparisons show a capacity tosignificantly differentiate between the absence of tremor (clinical score 0) and the presenceof tremors with clinical scores of 1 and 2.
Additionally, a high correlation has been identified between the tremor constancyobtained through video evaluation and the constancy obtained from the multitask CNN(Person r = 0.969; p = 3.99 × 10−64 for the multitask CNN with FFT, and Person r = 0.959;p = 1.56 × 10−57 for the multitask CNN with raw signal).
The best results obtained in this study for multitask classification with LOSO evalua-tion show a sensitivity and specificity of 86.1% for tremor detection using the multitaskCNN model with a spectral data representation while maintaining high performance incontext detection (sensitivity of 89% and specificity of 89.1%).
These findings suggest that it is feasible to obtain significant measures of the amplitudeand constancy with the accelerometers from consumer smartwatches and deep learningtechniques based on multitask classification using convolutional networks to monitorpatients in the early stages of the disease.
Although this paper presents an approach that analyzes tremor during rest periodsbased on a sequence of scripted activities (including exercises extracted from the UPDRS),the presented system is completely transferable for use in free-living environments, takingadvantage of the capability of the context classifier to determine if the patient is at restand is not performing any activity. During these periods, the whole system may be able toextract information that can be used to make an accurate analysis of the evolution of thesymptom over time in an automated manner.
The smartwatch used in this study is capable of storing over 1000 discrete tests of sixminutes (1.5 MB each test sampled at 50 Hz) in its internal free memory (2 GB). A highamount of data storage may be required to store the accelerometer data for continuousanalysis—for example, performed over several months.
A possible solution to handle a high amount of data is the implementation of on-device processing (edge computing) to reduce the amount of data stored in the device.Additionally, it is possible to use cloud storage, for both inertial signals and the tremorassessment results obtained from automatic identification systems such as the one proposedin this work. These solutions can be implemented by taking advantage of the processingand wireless communication capabilities of the smart wearable devices [64].
The main contributions of this paper are the characterization of the embedded ac-celerometer of a consumer smartwatch to identify its accuracy to measure the amplitude ofthe tremor to be used as an indicator of the severity of the symptom, using standardizedmetrics (acceleration level) and reference values for measuring vibration levels. Addition-ally, the implementation and evaluation of novel approaches based on multitask CNNsto assess the resting tremor in PD. These approaches have been evaluated using both rawsignals and spectral data representations as inputs. The results obtained from these modelsindicate an increase in the performance for context and tremor detection when comparedwith the reproduction of systems proposed in the related literature.
Despite the potential advantages of the system, it should be noted that an accurateamplitude evaluation requires a properly calibrated sensor to provide an accurate rep-resentation of the movement. Additionally, it must be taken into account that there is apossibility that the system may underestimate the highest amplitude scores due to theconfiguration of the analysis range established at the factory in the sensors (±2 g). Futurestudies will analyze the influence of the sensor for the evaluation of patients in moreadvanced stages of the disease, who could present tremors with higher amplitudes.
Although certain technical limitations in the smartwatches were identified, the resultssuggest that the approach based on consumer smartwatches and deep learning techniquescan be feasible and derive significant measures for symptom monitoring in patients in theearly stages of the disease. The use of affordable wearable technology shows high potential

Sensors 2021, 21, 291 26 of 29
and opportunities for the development of tools that can be integrated into the routine careand assessment of PD patients. In this way, affordable tools can be developed to improvethe management and monitoring protocol through objective evaluations, which can bemade automatically and in a continuous manner, enabling the development of effectivetreatments in clinical and ambulatory settings.
Author Contributions: L.S., I.P., N.C., S.C. and M.G. conceived, designed, supervised the experi-ments, and wrote the manuscript. P.A., G.D.A. and J.M.L. contributed to the early versions andreviewed the manuscript. G.D.A. was the principal investigator of the TECAPARK project underwhich this study was developed. All authors have contributed to the development, analysis, interpre-tation, and discussion of the results, and have read and approved the final version of the manuscript.All authors have read and agreed to the published version of the manuscript.
Funding: This research was funded by the following projects: (1) “Tecnologías Capacitadoras parala Asistencia, Seguimiento y Rehabilitación de Pacientes con Enfermedad de Parkinson”. CentroInternacional sobre el envejecimiento, CENIE (código 0348_CIE_6_E) Interreg V-A España-Portugal(POCTEP). (2) Ecuadorian Government Granth “Becas internacionales de posgrado 2019” of theSecretaría de Educación Superior, Ciencia, Tecnología e Innovación (SENESCYT), received by theauthor Luis Sigcha.
Institutional Review Board Statement: The study was conducted according to the guidelines of theDeclaration of Helsinki, and approved by the Ethics Committee of the Universidad Politécnica deMadrid (date of approval 18 June 2018).
Informed Consent Statement: Informed consent was obtained from all subjects involved in the study.
Data Availability Statement: The data presented in this study are available on request from thecorresponding author. The data are not publicly available because they contain protected patienthealth information.
Acknowledgments: This work has been supported by: (1) FCT—Fundação para a Ciência e Tec-nologia within the R&D Units Project Scope: UIDB/00319/2020. (2) Grupo de Investigación enInstrumentación y Acústica Aplicada (I2A2). ETSI Industriales. Universidad Politécnica de Madrid.
Conflicts of Interest: The authors declare no conflict of interest.
References1. Goetz, C.G. The history of Parkinson’s disease: Early clinical descriptions and neurological therapies. Cold Spring Harb. Perspect.
Med. 2011, 1, a008862. [CrossRef]2. Michel, P.P.; Hirsch, E.C.; Hunot, S. Understanding Dopaminergic Cell Death Pathways in Parkinson Disease. Neuron 2016, 90,
675–691. [CrossRef] [PubMed]3. Understanding Parkinson’s. Available online: https://www.parkinson.org/Understanding-Parkinsons/Statistics (accessed on
10 August 2020).4. Prasad, R.; Babu, S.; Siddaiah, N.; Rao, K. A review on techniques for diagnosing and monitoring patients with parkinson’s
disease. J. Biosens. Bioelectron. 2016, 7, 2.5. Reeve, A.; Simcox, E.; Turnbull, D. Ageing and Parkinson’s disease: Why is advancing age the biggest risk factor? Ageing Res. Rev.
2014, 14, 19–30. [CrossRef] [PubMed]6. Wirdefeldt, K.; Adami, H.-O.; Cole, P.; Trichopoulos, D.; Mandel, J. Epidemiology and etiology of Parkinson’s disease: A review
of the evidence. Eur. J. Epidemiol. 2011, 26, 1–58. [CrossRef] [PubMed]7. Tysnes, O.B.; Storstein, A. Epidemiology of Parkinson’s disease. J. Neural Transm. 2017, 124, 901–905. [CrossRef]8. Chen, S.; Tsai, S. The Epidemiology of Parkinson’s Disease. Tzu Chi Med. J. 2010, 22, 73–81. [CrossRef]9. Sveinbjornsdottir, S. The clinical symptoms of Parkinson’s disease. J. Neurochem. 2016, 139, 318–324. [CrossRef]10. Bötzel, K.; Tronnier, V.; Gasser, T. The Differential Diagnosis and Treatment of Tremor. Dtsch. Aerztebl. Int. 2014, 111, 225–236.
[CrossRef]11. Albanese, A.; Bonuccelli, U.; Brefel, C.; Chaudhuri, K.R.; Colosimo, C.; Eichhorn, T.; Melamed, E.; Pollak, P.; Van Laar, T.; Zappia,
M. Consensus statement on the role of acute dopaminergic challenge in Parkinson’s disease. Mov. Disord. 2001, 16, 197–201.[CrossRef]
12. Dhall, R.; Kreitzman, D.L. Advances in levodopa therapy for Parkinson disease: Review of RYTARY (carbidopa and levodopa)clinical efficacy and safety. Neurology 2016, 86, S13–S24. [CrossRef] [PubMed]
13. Senek, M.; Aquilonius, S.-M.; Askmark, H.; Bergquist, F.; Constantinescu, R.; Ericsson, A.; Lycke, S.; Medvedev, A.; Memedi, M.;Ohlsson, F.; et al. Levodopa/carbidopa microtablets in Parkinson’s disease: A study of pharmacokinetics and blinded motorassessment. Eur. J. Clin. Pharmacol. 2017, 73, 563–571. [CrossRef] [PubMed]

Sensors 2021, 21, 291 27 of 29
14. Puschmann, A.; Wszolek, Z.K. Diagnosis and Treatment of Common Forms of Tremor. Semin. Neurol. 2011, 31, 65–77. [CrossRef][PubMed]
15. Hssayeni, M.D.; Jimenez-Shahed, J.; Burack, M.A.; Ghoraani, B. Wearable Sensors for Estimation of Parkinsonian Tremor Severityduring Free Body Movements. Sensors 2019, 19, 4215. [CrossRef] [PubMed]
16. Baumann, C.R. Epidemiology, diagnosis and differential diagnosis in Parkinson’s disease tremor. Parkinsonism Relat. Disord. 2012,18, S90–S92. [CrossRef]
17. Bhidayasiri, R. Differential diagnosis of common tremor syndromes. Postgrad. Med. J. 2005, 81, 756–762. [CrossRef] [PubMed]18. Salarian, A.; Russmann, H.; Vingerhoets, F.J.G.; Burkhard, P.R.; Blanc, Y.; Dehollain, C.; Aminian, K. An ambulatory system
to quantify bradykinesia and tremor in Parkinson’s disease. In Proceedings of the 4th International IEEE EMBS Special TopicConference on Information Technology Applications in Biomedicine, Birmingham, UK, 24–26 April 2003; pp. 35–38.
19. Samii, A.; Nutt, J.G.; Ransom, B.R. Parkinson’s disease. Lancet 2004, 363, 1783–1793. [CrossRef]20. Jankovic, J. Parkinson’s disease: Clinical features and diagnosis. J. Neurol. Neurosurg. Psychiatry 2008, 79, 368–376. [CrossRef]21. Mcghee, D.; Davidson, M.B.; Counsell, C.E. Comparison of patient rated treatment response with measured improvement in
Parkinson’s disease. J. Neurol. Neurosurg. Psychiatry 2012, 83, 1001–1005.22. Ossig, A.A.C.; Antonini, A.; Buhmann, C.; Classen, J.; Csoti, J.A.; Falkenburger, B.H.; Schwarz, M.; Winkler, J.; Storch, A. Wearable
sensor-based objective assessment of motor symptoms in Parkinson’s disease. J. Neural Transm. 2016, 123, 57–64. [CrossRef]23. Maetzler, W.; Domingos, J.; Srulijes, K.; Ferreira, J.J.; Bloem, B.R. Quantitative wearable sensors for objective assessment of
Parkinson’s disease. Mov. Disord. 2013, 28, 1628–1637. [CrossRef] [PubMed]24. Mailankody, P.; Thennarasu, K.; Nagaraju, B.C.; Yadav, R.; Pal, P.K. Re-emergent tremor in Parkinson’s disease: A clinical and
electromyographic study. J. Neurol. Sci. 2016, 366, 33–36. [CrossRef] [PubMed]25. Palmes, P.; Ang, W.T.; Widjaja, F.; Tan, L.C.; Au, W.-L. Pattern Mining of Multichannel sEMG for Tremor Classification. IEEE
Trans. Biomed. Eng. 2010, 57, 2795–2805. [CrossRef] [PubMed]26. Kwon, K.; Lee, H.M.; Lee, S.; Kang, S.H.; Koh, S. Comparison of motor and non-motor features between essential tremor and
tremor dominant Parkinson’s disease. J. Neurol. Sci. 2016, 361, 34–38. [CrossRef] [PubMed]27. Perera, T.; Yohanandan, S.A.C.; Thevathasan, W.; Jones, M.; Peppard, R.; Evans, A.H.; Tan, J.L.; McKay, C.M.; McDermott, H.J.
Clinical validation of a precision electromagnetic tremor measurement system in participants receiving deep brain stimulationfor essential tremor. Physiol. Meas. 2016, 37, 1516–1527. [CrossRef]
28. Sooklal, S.; Mohan, P.; Teelucksingh, S. Using the Kinect for detecting tremors: Challenges and opportunities. In Proceedings ofthe IEEE-EMBS International Conference on Biomedical and Health Informatics (BHI), Valencia, Spain, 1–4 June 2014; pp. 768–771.
29. Casacanditella, L.; Cosoli, G.; Ceravolo, M.G.; Tomasini, E.P. Non-contact measurement of tremor for the characterization ofParkinsonian individuals: Comparison between Kinect and Laser Doppler vibrometer. J. Phys. Conf. Ser. 2017, 882, 012002.[CrossRef]
30. Rovini, E.; Maremmani, C.; Cavallo, F. How Wearable Sensors Can Support Parkinson’s Disease Diagnosis and Treatment:A Systematic Review. Front. Neurosci. 2017, 11, 555. [CrossRef]
31. Salarian, A.; Russmann, H.; Wider, C.; Burkhard, P.R.; Vingerhoets, F.J.G.; Aminian, K. Quantification of Tremor and Bradykinesiain Parkinson’s Disease Using a Novel Ambulatory Monitoring System. IEEE Trans. Biomed. Eng. 2007, 54, 313–322. [CrossRef]
32. Hoff, J.I.; Van Der Meer, V.; Van Hilten, J.J. Accuracy of Objective Ambulatory Accelerometry in Detecting Motor Complicationsin Patients with Parkinson Disease. Clin. Neuropharmacol. 2004, 27, 53–57. [CrossRef]
33. Keijsers, N.L.; Horstink, M.W.; Gielen, S.C. Ambulatory motor assessment in Parkinson’s disease. Mov. Disord. 2006, 21, 34–44.[CrossRef]
34. Giuffrida, J.P.; Riley, D.E.; Maddux, B.N.; Heldman, D.A. Clinically deployable Kinesia™ technology for automated tremorassessment. Mov. Disord. 2009, 24, 723–730. [CrossRef] [PubMed]
35. Zwartjes, D.G.M.; Heida, T.; van Vugt, J.P.P.; Geelen, J.A.G.; Veltink, P.H. Ambulatory Monitoring of Activities and MotorSymptoms in Parkinson’s Disease. IEEE Trans. Biomed. Eng. 2010, 57, 2778–2786. [CrossRef] [PubMed]
36. Patel, S.; Lorincz, K.; Hughes, R.; Huggins, N.; Growdon, J.H.; Standaert, D.G.; Akay, M.; Dy, J.G.; Welsh, M.; Bonato, P. MonitoringMotor Fluctuations in Patients with Parkinson’s Disease Using Wearable Sensors. IEEE Trans. Inf. Technol. Biomed. 2009, 13,864–873. [CrossRef] [PubMed]
37. Rigas, G.; Tzallas, A.T.; Tsipouras, M.G.; Bougia, P.; Tripoliti, E.E.; Baga, D.; Fotiadis, D.I.; Tsouli, S.; Konitsiotis, S. Assessment ofTremor Activity in the Parkinson’s Disease Using a Set of Wearable Sensors. IEEE Trans. Inf. Technol. Biomed. 2012, 16, 478–487.[CrossRef]
38. Roy, S.H.; Cole, B.T.; Gilmore, L.D.; De Luca, C.J.; Thomas, C.A.; Saint-Hilaire, M.M.; Nawab, S.H. High-resolution tracking ofmotor disorders in Parkinson’s disease during unconstrained activity. Mov. Disord. 2013, 28, 1080–1087. [CrossRef]
39. Tzallas, A.T.; Tsipouras, M.G.; Rigas, G.; Tsalikakis, D.; Karvounis, E.C.; Chondrogiorgi, M.; Psomadellis, F.; Cancela, J.; Pastorino,M.; Waldmeyer, M.T.A.; et al. PERFORM: A System for Monitoring, Assessment and Management of Patients with Parkinson’sDisease. Sensors 2014, 14, 21329–21357. [CrossRef]
40. Ahlrichs, C.; Samà Monsonís, A. Is “frequency distribution” enough to detect tremor in PD patients using a wrist wornaccelerometer? In Proceedings of the 8th International Conference on Pervasive Computing Technologies for Healthcare,Oldenburg, Germany, 20–23 May 2014; pp. 65–71.

Sensors 2021, 21, 291 28 of 29
41. Cole, B.T.; Roy, S.H.; De Luca, C.J.; Nawab, S.H. Dynamical Learning and Tracking of Tremor and Dyskinesia from WearableSensors. IEEE Trans. Neural Syst. Rehabil. Eng. 2014, 22, 982–991. [CrossRef]
42. Dai, H.; Zhang, P.; Lueth, T.C. Quantitative Assessment of Parkinsonian Tremor Based on an Inertial Measurement Unit. Sensors2015, 15, 25055–25071. [CrossRef]
43. Braybrook, M.; O’Connor, S.; Churchward, P.; Perera, T.; Farzanehfar, P.; Horne, M. An Ambulatory Tremor Score for Parkinson’sDisease. J. Parkinson’s Dis. 2016, 6, 723–731. [CrossRef]
44. Perumal, S.V.; Sankar, R. Gait and tremor assessment for patients with Parkinson’s disease using wearable sensors. ICT Express2016, 2, 168–174. [CrossRef]
45. García-Magariño, I.; Medrano, C.; Plaza, I.; Oliván, B. A smartphone-based system for detecting hand tremors in unconstrainedenvironments. Pers. Ubiquitous Comput. 2016, 20, 959–971. [CrossRef]
46. Jeon, H.; Lee, W.; Park, H.; Lee, H.J.; Kim, S.K.; Kim, H.B.; Jeon, B.; Park, K.S. Automatic classification of tremor severity inParkinson’s disease using awearable device. Sensors 2017, 17, 2067. [CrossRef] [PubMed]
47. Pulliam, C.L.; Heldman, D.A.; Brokaw, E.B.; Mera, T.O.; Mari, Z.K.; Burack, M.A. Continuous Assessment of Levodopa Responsein Parkinson’s Disease Using Wearable Motion Sensors. IEEE Trans. Biomed. Eng. 2018, 65, 159–164. [CrossRef] [PubMed]
48. Sánchez-Pérez, L.A.; Sánchez-Fernández, L.P.; Shaout, A.; Martinez-Hernandez, J.M.; Alvarez-Noriega, M.J. Rest tremor quantifi-cation based on fuzzy inference systems and wearable sensors. Int. J. Med. Inf. 2018, 114, 6–17. [CrossRef] [PubMed]
49. Zhang, A.; San-Segundo, R.; Panev, S.; Tabor, G.; Stebbins, K.; Whitford, A.; De La Torre, F.; Hodgins, J. Automated TremorDetection in Parkinson’s Disease Using Accelerometer Signals. In Proceedings of the 2018 IEEE/ACM International Conferenceon Connected Health: Applications, Systems and Engineering Technologies (CHASE), Washington, DC, USA, 26–28 September2018; pp. 13–14.
50. Kim, H.B.; Lee, W.W.; Kim, A.; Lee, H.J.; Park, H.Y.; Jeon, H.S.; Kim, S.K.; Jeon, B.; Park, K.S. Wrist sensor-based tremor severityquantification in Parkinson’s disease using convolutional neural network. Comput. Biol. Med. 2018, 95, 140–146. [CrossRef][PubMed]
51. López-Blanco, R.; Velasco, M.A.; Méndez-Guerrero, A.; Romero, J.P.; Del Castillo, M.D.; Serrano, J.I.; Rocon, E.; Benito-León, J.Smartwatch for the analysis of rest tremor in patients with Parkinson’s disease. J. Neurol. Sci. 2019, 401, 37–42. [CrossRef]
52. Pierleoni, P.; Belli, A.; Bazgir, O.; Maurizi, L.; Paniccia, M.; Palma, L. A Smart Inertial System for 24h Monitoring and Classificationof Tremor and Freezing of Gait in Parkinson’s Disease. IEEE Sens. J. 2019, 19, 11612–11623. [CrossRef]
53. Battista, L.; Romaniello, A. A wearable tool for selective and continuous monitoring of tremor and dyskinesia in Parkinsonianpatients. Parkinsonism Relat. Disord. 2020, 77, 43–47. [CrossRef]
54. Van Brummelen, E.M.J.; Ziagkos, D.; De Boon, W.M.I.; Hart, E.P.; Doll, R.J.; Huttunen, T.; Kolehmainen, P.; Groeneveld, G.J.Quantification of tremor using consumer product accelerometry is feasible in patients with essential tremor and Parkinson’sdisease: A comparative study. J. Clin. Mov. Disord. 2020, 7, 4. [CrossRef]
55. Mahadevan, N.; Demanuele, C.; Zhang, H.; Volfson, D.; Ho, B.; Erb, M.K.; Patel, S. Development of digital biomarkers for restingtremor and bradykinesia using a wrist-worn wearable device. NPJ Digit. Med. 2020, 3, 5. [CrossRef]
56. San-Segundo, R.; Zhang, A.; Cebulla, A.; Panev, S.; Tabor, G.; Stebbins, K.; Massa, R.E.; Whitford, A.; De La Torre, F.; Hodgins, J.Parkinson’s Disease Tremor Detection in the Wild Using Wearable Accelerometers. Sensors 2020, 20, 5817. [CrossRef] [PubMed]
57. Kostikis, N.; Hristu-Varsakelis, D.; Arnaoutoglou, M.; Kotsavasiloglou, C. A Smartphone-Based Tool for Assessing ParkinsonianHand Tremor. IEEE J. Biomed. Health Inform. 2015, 19, 1835–1842. [CrossRef] [PubMed]
58. Caruana, R.A. Multitask Learning: A Knowledge-Based Source of Inductive Bias. In Tenth International Conference on MachineLearning; Morgan Kaufmann: Burlington, MA, USA, 1993; pp. 41–48.
59. TECAPARK. Available online: https://www.i2a2.upm.es/tecapark/ (accessed on 6 October 2020).60. Goetz, C.G.; Tilley, B.C.; Shaftman, S.R.; Stebbins, G.T.; Fahn, S.; Martinez-Martin, P.; Poewe, W.; Sampaio, C.; Stern, M.B.; Dodel, R.
Movement Disorder Society-sponsored revision of the Unified Parkinson’s Disease Rating Scale (MDS-UPDRS): Scale presentationand clinimetric testing results. Mov. Disord. 2008, 23, 2129–2170. [CrossRef] [PubMed]
61. Dorsey, E.R.; Venuto, C.; Venkataraman, V.; Harris, D.A.; Kieburtz, K. Novel methods and technologies for 21st-century clinicaltrials: A review. JAMA Neurol. 2015, 72, 582–588. [CrossRef]
62. Yetisen, A.K.; Martinez-Hurtado, J.L.; Ünal, B.; Khademhosseini, A.; Butt, H. Wearables in Medicine. Adv. Mater. 2018, 30, e1706910.[CrossRef]
63. Piwek, L.; Ellis, D.A.; Andrews, S.; Joinson, A. The Rise of Consumer Health Wearables: Promises and Barriers. PLoS Med. 2016,13, e1001953. [CrossRef]
64. Dunn, J.; Runge, R.; Snyder, M.P. Wearables and the medical revolution. Pers. Med. 2018, 15, 429–448. [CrossRef]65. Kubota, K.J.; Chen, J.A.; Little, M.A. Machine learning for large-scale wearable sensor data in Parkinson’s disease: Concepts,
promises, pitfalls, and futures. Mov. Disord. 2016, 31, 1314–1326. [CrossRef]66. Maetzler, W. A clinical view on the development of technology-based tools in managing Parkinson’s disease. Mov. Disord. 2016,
31, 1263–1271. [CrossRef]67. Sánchez-Ferro, Á.; Elshehabi, M.; Godinho, C.; Salkovic, D.; Hobert, M.A.; Domingos, J.; van Uem, J.M.; Ferreira, J.J.; Maetzler, W.
New methods for the assessment of Parkinson’s disease (2005 to 2015): A systematic review. Mov. Disord. 2016, 31, 1283–1292.68. Matias, R.; Paixão, V.; Bouça, R.; Ferreira, J.J. A Perspective on Wearable Sensor Measurements and Data Science for Parkinson’s
Disease. Front. Neurol. 2017, 8, 8. [CrossRef] [PubMed]

Sensors 2021, 21, 291 29 of 29
69. Linares-Del Rey, M.; Vela-Desojo, L.; Cano-de, L.C. Aplicaciones móviles en la enfermedad de Parkinson: Una revisión sistemática.Neurología 2019, 34, 38–54. [CrossRef]
70. Channa, A.; Popescu, N.; Ciobanu, V. Wearable Solutions for Patients with Parkinson’s Disease and Neurocognitive Disorder:A Systematic Review. Sensors 2020, 20, 2713. [CrossRef] [PubMed]
71. López, C.P.; Samà, A.; Martín, D.M.R.; Català, A.; Cabestany, J.; Moreno-Arostegui, J.M.; Fernández, E.D.M.; Rodríguez-Molinero,A. Assessing Motor Fluctuations in Parkinson’s Disease Patients Based on a Single Inertial Sensor. Sensors 2016, 16, 2132.[CrossRef] [PubMed]
72. Borzì, L.; Varrecchia, M.; Olmo, G.; Artusi, C.A.; Fabbri, M.; Rizzone, M.G.; Romagnolo, A.; Zibetti, M.; Lopiano, L. Home moni-toring of motor fluctuations in Parkinson’s disease patients. J. Reliab. Intell. Environ. 2019, 5, 145–162. [CrossRef]
73. Poli, A.; Cosoli, G.; Scalise, L.; Spinsante, S. Impact of Wearable Measurement Properties and Data Quality on ADLs ClassificationAccuracy. IEEE Sens. J. 2020, 1. [CrossRef]
74. LeCun, Y.; Bengio, Y. Convolutional Networks for Images, Speech, and Time Series. In The Handbook of Brain Theory and NeuralNetworks; MIT Press: Cambridge, MA, USA, 1998; pp. 255–258.
75. Hochreiter, S.; Schmidhuber, J. Long Short-Term Memory. Neural Comput. 1997, 9, 1735–1780. [CrossRef] [PubMed]76. Wang, J.; Chen, Y.; Hao, S.; Peng, X.; Hu, L. Deep learning for sensor-based activity recognition: A survey. Pattern Recognit. Lett.
2019, 119, 3–11. [CrossRef]77. San-Segundo, R.; Blunck, H.; Moreno-Pimentel, J.; Stisen, A.; Gil-Martín, M. Robust Human Activity Recognition using
smartwatches and smartphones. Eng. Appl. Artif. Intell. 2018, 72, 190–202. [CrossRef]78. Hughes, A.J.; Daniel, S.E.; Kilford, L.; Lees, A.J. Accuracy of clinical diagnosis of idiopathic Parkinson’s disease: A clinico-
pathological study of 100 cases. J. Neurol. Neurosurg. Psychiatry 1992, 55, 181. [CrossRef]79. Hoehn, M.M.; Yahr, M.D. Parkinsonism: Onset, progression, and mortality. Neurology 1998, 50, 318. [CrossRef] [PubMed]80. Keras: The Python Deep Learning library. Available online: https://keras.io (accessed on 15 November 2020).81. Abadi, M.; Agarwal, A.; Barham, P.; Brevdo, E.; Chen, Z.; Citro, C.; Corrado, G.; Davis, A.; Dean, J.; Ghemawat, S.; et al.
TensorFlow: Large-Scale Machine Learning on Heterogeneous Distributed Systems. arXiv 2016, arXiv:1603.04467.82. Pedregosa, F.; Varoquaux, G.; Gramfort, A.; Michel, V.; Thirion, B.; Grisel, O.; Blondel, M.; Prettenhofer, P.; Weiss, R.; Dubourg, V.;
et al. Scikit-learn: Machine Learning in Python. J. Mach. Learn. Res. 2011, 12, 2825–2830.83. Mannini, A.; Intille, S.S.; Rosenberger, M.; Sabatini, A.M.; Haskell, W. Activity Recognition Using a Single Accelerometer Placed
at the Wrist or Ankle. Med. Sci. Sports Exerc. 2013, 45, 2193–2203. [CrossRef]84. Khan, A.; Hammerla, N.Y.; Mellor, S.; Plötz, T. Optimising sampling rates for accelerometer-based human activity recognition.
Pattern Recognit. Lett. 2016, 73, 33–40. [CrossRef]85. Sigcha, L.; Pavón, I.; Arezes, P.; Costa, N.; De Arcas-Castro, G.; Lopez-Navarro, J.M. Occupational Risk Prevention through
Smartwatches: Precision and Uncertainty Effects of the Built-In Accelerometer. Sensors 2018, 18, 3805. [CrossRef]86. ISO 8041:2005 Human Response to Vibration—Measuring Instrumentation; ISO: Geneva, Switzerland, 2005.87. Freund, Y.; E Schapire, R. A Decision-Theoretic Generalization of On-Line Learning and an Application to Boosting. J. Comput.
Syst. Sci. 1997, 55, 119–139. [CrossRef]88. Smith, S.W. Digital Signal Processing: A Practical Guide for Engineers and Scientists; Newnes: Amsterdam, The Netherlands, 2003;
pp. 225–234.89. Ke, G.; Meng, Q.; Finley, T.; Wang, T.; Chen, W.; Ma, W.; Ye, Q.; Liu, T. LightGBM: A highly efficient gradient boosting decision
tree. In Proceedings of the 31st Conference on Neural Information Processing Systems, Long Beach, CA, USA, 4–9 December2017; pp. 3146–3154.
90. He, K.; Zhang, X.; Ren, S.; Sun, J. Deep residual learning for image recognition. arXiv 2015, arXiv:1512.03385.91. Glorot, X.; Bengio, Y. Understanding the difficulty of training deep feedforward neural networks. J. Mach. Learn. Res. 2010, 9,
249–256.92. Li, L.; Jamieson, K.; Desalvo, G.; Rostamizadeh, A.; Talwalkar, A. Hyperband: A Novel Bandit-Based Approach to Hyperparameter
Optimization. arXiv 2018, arXiv:1603.06560.93. Kingma, D.P.; Ba, J. Adam: A method for stochastic optimization. arXiv 2014, arXiv:1412.6980.94. Keskar, N.S.; Mudigere, D.; Nocedal, J.; Smelyanskiy, M.; Tang, P.T.P. On Large-Batch Training for Deep Learning: Generalization
Gap and Sharp Minima. arXiv 2016, arXiv:1609.04836.95. ISO 1683:2015 Acoustics—Preferred Reference Values for Acoustical and Vibratory Levels; ISO: Geneva, Switzerland, 2015.96. Vidakovic, B. Sensitivity, Specificity, and Relatives. In Statistics for Bioengineering Sciences: With MATLAB and WinBUGS Support;
Vidakovic, B., Ed.; Springer: New York, NY, USA, 2011; pp. 109–130.97. Hanley, J.A.; McNeil, B.J. The meaning and use of the area under a receiver operating characteristic (ROC) curve. Radiology 1982,
143, 29–36. [CrossRef] [PubMed]98. Cortes, C.; Vapnik, V. Support-vector networks. Mach. Learn. 1995, 20, 273–297. [CrossRef]99. Breiman, L. Random Forests. Mach. Learn. 2001, 45, 5–32. [CrossRef]