Increased Gamma Oscillatory Activity in the Subthalamic Nucleus During Tremor in Parkinson's Disease...
17
doi: 10.1152/jn.00829.2004 93:1569-1584, 2005. First published 20 October 2004; J Neurophysiol Conrad T. E. Pappas José M. Hurtado, Leonid L. Rubchinsky, Karen A. Sigvardt, Vicki L. Wheelock and GPi/Muscle Pairs in Parkinson's Disease Temporal Evolution of Oscillations and Synchrony in You might find this additional info useful... 46 articles, 18 of which you can access for free at: This article cites http://jn.physiology.org/content/93/3/1569.full#ref-list-1 13 other HighWire-hosted articles: This article has been cited by http://jn.physiology.org/content/93/3/1569#cited-by including high resolution figures, can be found at: Updated information and services http://jn.physiology.org/content/93/3/1569.full can be found at: Journal of Neurophysiology about Additional material and information http://www.the-aps.org/publications/jn This information is current as of June 4, 2013. http://www.the-aps.org/. Copyright © 2005 by the American Physiological Society. ISSN: 0022-3077, ESSN: 1522-1598. Visit our website at times a year (monthly) by the American Physiological Society, 9650 Rockville Pike, Bethesda MD 20814-3991. publishes original articles on the function of the nervous system. It is published 12 Journal of Neurophysiology by guest on June 4, 2013 http://jn.physiology.org/ Downloaded from
Transcript of Increased Gamma Oscillatory Activity in the Subthalamic Nucleus During Tremor in Parkinson's Disease...

doi: 10.1152/jn.00829.200493:1569-1584, 2005. First published 20 October 2004;J Neurophysiol
Conrad T. E. PappasJosé M. Hurtado, Leonid L. Rubchinsky, Karen A. Sigvardt, Vicki L. Wheelock andGPi/Muscle Pairs in Parkinson's DiseaseTemporal Evolution of Oscillations and Synchrony in
You might find this additional info useful...
46 articles, 18 of which you can access for free at: This article citeshttp://jn.physiology.org/content/93/3/1569.full#ref-list-1
13 other HighWire-hosted articles: This article has been cited by http://jn.physiology.org/content/93/3/1569#cited-by
including high resolution figures, can be found at: Updated information and serviceshttp://jn.physiology.org/content/93/3/1569.full
can be found at: Journal of Neurophysiology about Additional material and informationhttp://www.the-aps.org/publications/jn
This information is current as of June 4, 2013.
http://www.the-aps.org/. Copyright © 2005 by the American Physiological Society. ISSN: 0022-3077, ESSN: 1522-1598. Visit our website attimes a year (monthly) by the American Physiological Society, 9650 Rockville Pike, Bethesda MD 20814-3991.
publishes original articles on the function of the nervous system. It is published 12Journal of Neurophysiology
by guest on June 4, 2013http://jn.physiology.org/
Dow
nloaded from

Temporal Evolution of Oscillations and Synchrony in GPi/Muscle Pairs inParkinson’s Disease
Jose M. Hurtado,1 Leonid L. Rubchinsky,1 Karen A. Sigvardt,1,2 Vicki L. Wheelock,2,4
and Conrad T. E. Pappas3,4
1Center for Neuroscience, University of California, Davis; 2Department of Neurology and 3Department of Neurosurgery, University ofCalifornia Davis Medical Center, Sacramento; and 4Clinical Neuroscience, Kaiser Permanente, Sacramento, California
Submitted 13 August 2004; accepted in final form 2 October 2004
Hurtado, Jose M., Leonid L. Rubchinsky, Karen A. Sigvardt,Vicki L. Wheelock, and Conrad T. E. Pappas. Temporal evolutionof oscillations and synchrony in GPi/muscle pairs in Parkinson’sdisease. J Neurophysiol 93: 1569–1584, 2005. First published Octo-ber 20, 2004; doi:10.1152/jn.00829.2004. Both standard spectral anal-ysis and time-dependent phase correlation techniques were applied to27 pairs of tremor-related single units in the globus pallidus internus(GPi) and EMG of patients with Parkinson’s disease (PD) undergoingstereotactic neurosurgery. Over long time-scales (�60 s), GPi tremor-related units were statistically coherent with restricted regions of theperipheral musculature displaying tremor. The distribution of pooledcoherence across all pairs supports a classification of GPi cell/EMGoscillatory pairs into coherent or noncoherent. Analysis using �2-ssliding windows shows that oscillatory activity in both GPi tremorunits and muscles occurs intermittently over time. For brain/musclepairs that are coherent, there is partial overlap in the times ofoscillatory activity but, in most cases, no significant correlationbetween the times of oscillatory subepisodes in the two signals. Phaselocking between coherent pairs occurs transiently; however, the phasedelay is similar for different phase-locking subepisodes. Noncoherentpairs also show episodes of transient phase locking, but they occurredless frequently, and no preferred phase delay was seen across subepi-sodes. Tremor oscillations in pallidum and EMGs are punctuated byphase slips, which were classified as synchronizing or desynchroniz-ing depending on their effect on phase locking. In coherent pairs, theincidence of synchronizing slips is higher than desynchronizing slips,whereas no significant difference was seen for noncoherent pairs. Theresults of this quantitative characterization of parkinsonian tremorprovide a foundation for hypotheses about the structure and dynamicalfunctioning of basal ganglia motor control networks involved intremor generation.
I N T R O D U C T I O N
Oscillatory activity and phase synchronization are prominentfeatures of vertebrate motor systems. Some forms of coordi-nated oscillatory activity play an undisputed role in motorfunction, but it is well known that oscillatory activity can alsohave disruptive consequences for neural function. Its presenceis a recurrent feature in a variety of neurological diseases(Llinas et al. 1999), including several movement disorders(Farmer 2002). Oscillations in the motor cortex and relatedsubcortical structures can propagate to the limb musculaturevia descending pathways (Baker et al. 2003; Gross et al. 2000;Salenius and Hari 2003) and give rise to tremors (Elble 1996;Elble and Koller 1990; Halliday et al. 2000; McAuley and
Marsden 2000). One of the best known is the resting tremor ofParkinson’s disease (PD) that affects roughly 70% of PDpatients. Parkinsonian tremor occurs in the 2- to 6-Hz fre-quency band, is predominantly present at rest, and is moreprevalent in the distal than proximal segments of the upper orlower limbs (Deuschl et al. 2000).
The pathological origin of PD, the loss of midbrain dopa-minergic cells, has been well known for nearly 40 yr (Hornyk-iewicz 1966), but despite significant advances in our under-standing of the anatomy and cellular physiology of the basalganglia (BG) structures affected by the dopamine (DA) loss,the causal link between the pathology and the symptomsremains obscure. Most recently, hypotheses regarding thepathophysiology of PD have emphasized the dynamicalchanges that the BG network undergoes as a result of thepathology; in this view, changes in firing patterns, not just ofmean firing rates, are considered the hallmark of PD (reviewedin Bevan et al. 2002; Brown 2003; Obeso et al. 2000). Thisidea has been supported by physiological evidence from PDpatients and animal studies, including the 1-methyl-4-phenyl-1,2,3,6-tetrahydropyridine (MPTP) model of parkinsonism(Nini et al. 1995). It has been shown that following DA loss,cells in globus pallidus internus (GPi) and subthalamic nucleus(STN) enter a regime of rhythmic firing concomitant withexcess synchrony (Bergman et al. 1998; Brown et al. 2001;Levy et al. 2002; Obeso et al. 2000). Given the tight interre-lationship between the BG and other structures in the motorsystem, it is not surprising that the pathological regime of PDcan affect the entire limb motor network, including cortico-thalamic, cerebellar, and spinal networks (reviewed in Doya2000; Houk and Wise 1995; Middleton and Strick 2000).Several studies indicate that PD tremor-related activity is notrestricted to the core BG/ motor cortex network, but it involvescerebellar and spinal circuitry as well (Parker et al. 1992;Timmermann et al. 2003; Volkmann et al. 1996; Williams et al.2002).
A prominent feature of PD dynamics is that tremor-relatedoscillations occurring in different locations of the network canin many cases be uncorrelated, even while their frequencies arenearly uniform. This phenomenon was first studied by Albertset al. (1969), who compared tremor-frequency intracorticalpotentials to the EMGs of muscles in different limbs. Severalstudies of multilimb EMG recordings in PD patients alsoindicate that tremor in different limbs is largely uncorrelated
Address for reprint requests and other correspondence: K. A. Sigvardt,Center for Neuroscience, Univ. of California Davis, 1544 Newton Ct., Davis,CA 95616 (E-mail: [email protected]).
The costs of publication of this article were defrayed in part by the paymentof page charges. The article must therefore be hereby marked “advertisement”in accordance with 18 U.S.C. Section 1734 solely to indicate this fact.
J Neurophysiol 93: 1569–1584, 2005.First published October 20, 2004; doi:10.1152/jn.00829.2004.
15690022-3077/05 $8.00 Copyright © 2005 The American Physiological Societywww.jn.org
by guest on June 4, 2013http://jn.physiology.org/
Dow
nloaded from

(Ben-Pazi et al. 2001; Hurtado et al. 2000; O’Suilleabhain andMatsumoto 1998; Raethjen et al. 2000). In addition, dualrecordings in GPi tremor-related cells during stereotactic sur-gery have shown that, although cells might be correlated torestricted portions of the musculature or to each other, uncor-related oscillations are commonplace as well (Hurtado et al.1999; Lemstra et al. 1999). These findings are consistent witha topographic organization of the individual structures thatcomprise the tremor generating network.
However, the results of these studies also raise a number ofquestions. Clinical observations indicate that tremor in any onemuscle can come and go over time; in spectral analysis terms,tremor is largely a nonstationary phenomenon. If nonstationarysignals are analyzed over long periods of time, even if theycontain short segments of phase locking, the correlation couldbe below statistical significance. A better assessment of theinteractions would be obtained by analyzing these signals overtime. Another common observation made during intraoperativemapping of the basal ganglia in functional neurosurgery is thatthe tremor-related neural activity might wax and wane whilethe limb tremor persists, and vice versa, persistent tremor-related activity can exist in the apparent absence of limbtremor. This raises a similar and related question regarding thetemporal evolution of the correlations between tremor-relatedneurons within the basal ganglia and between these neuronsand the peripheral musculature. Finally, the topographic orga-nization of the different limb representations within the basalganglia (DeLong et al. 1985) raises the question of how theneurons within and between these representations interact dur-ing tremor episodes.
The purpose of this study is to address these questions indetail. We applied time-dependent spectral techniques totremor-related single unit and EMG recordings in PD patients.Using statistical methods that detect the onset and offset ofoscillations and phase locking at high temporal resolution(Hurtado et al. 2004), we characterized the temporal propertiesof tremor-related oscillatory activity in the basal ganglia-muscle network. The results of this quantitative characteriza-tion of tremor dynamics provide a foundation for hypothesesabout the structure and dynamical functioning of basal gangliamotor control networks involved in parkinsonian tremor.
M E T H O D S
Patients
We studied data collected from five cases of surgical treatment ofpatients with idiopathic Parkinson’s disease. This included all patientsin our program from 1998 to 2003 who had a microelectrode-guided
pallidal procedure (pallidotomy or pallidal deep brain stimulating(DBS) electrode implantation and who fulfilled our inclusion criteriaof having recordings of tremor-related activity from the internalsegment of the GPi and simultaneously recorded tremulous EMGs(see Table 1). Criteria for identification of neurons as being withinGPi included 1) area with noted increased level of tonic activity; 2)area with tremor-related activity; 3) area with passive responses tolimb movement; 4) quiet zone below GPi with optic tract below that(as indicated by light responses); 5) lesions placed in area identified inthis way result immediately in improvement of one or more motorsymptoms (e.g., reduction in tremor and rigidity); 6) identification ofcorrect placement or lesion or DBS in postoperative MRI; and 7)improvement in UPDRS scores 6 mo postoperatively.
Hoehn and Yahr scores and Unified Parkinson’s Disease RatingScale scores (UPDRS) were determined in preoperative and postop-erative visits off and on anti-parkinsonian medication by a neurologist(V.L.W.). The total UPDRS score in Table 1 was composed of items1–4 on medication, items 5–31 (activities of daily living and motorscores) off medication, and items 32–42 (complications of therapy) onmedication. Motor scores included only a single score for each item(i.e., did not include scores for each extremity). We obtained datafrom a total of 17 recording sessions from the posteroventral GPi,each lasting �1 min.
Recordings
Data were collected during microelectrode-guided mapping of theposteroventral pallidum prior to lesion or the placement of a DBSelectrode. Details of the procedure have been previously described(Hurtado et al. 2004). Briefly, the coordinates of the target site for thefirst electrode pass, the optic tract just ventral to the ventral border ofGPi, were determined from MRIs of the brain in relation to fiducialmarkings on the stereotactic frame (Radionics, Burlington, MA).EMGs were recorded from one to four of the following arm and legmuscles: abductor pollicis brevis (APB), wrist extensor (WE), wristflexor (WF), biceps (BI), quadriceps (QUAD), gastrocnemius(GAST), and tibialis anterior (TA). At the time of surgery, patientshad been off antiparkinsonian medication for �8–10 h. Informedconsent was obtained from all patients. The protocol for collection ofintraoperative data was approved by the Institutional Review Boardsof The University of California Davis and Kaiser Permanente Re-search Foundation.
Microelectrode recordings were obtained with 50-�m, beveled,stainless steel electrode (Frederick Haer and Company, Bowdoinham,ME), with an impedance of �0.5–1.0 M� at 1 KHz. Signals wereamplified (10,000 times) and band-pass filtered between 500 Hz and10 KHz (Bak Electronics, Germantown, MD). EMGs were recordedwith Grass disk electrodes (Astro-Med, West Warwick, RI), amplified(2,000 times), band-pass filtered in the range of 30 Hz to 1 KHz, andfull wave rectified prior to spectral analysis. This last step was torecover the low-frequency myoelectric signal from the amplitude-modulated activity in the EMG signals. Neuronal and EMG signalswere digitized at 10 kHZ using an A/D board (RC Electronics Santa
TABLE 1. Patient demographics
Patient Gender Age
Durationof
DiseaseType ofSurgery
Side ofSurgery
PreoperativeHoehn and
Yahr
Preoperative UPDRSScores
PostoperativeHoehn and
Yahr
Postoperative UPDRSScores
TremorScore
MotorScore
TotalScore
TremorScore
MotorScore
TotalScore
A M 63 14 Palli-X Right 3 5 31 63.5 2.5 5 16 47B M 65 16 Palli-DBS Left 2.5 9 20 63 2 5 18 51C F 74 13 Palli-X Right 3 12 34 75 3 3 18 54D M 63 6 Palli-X Right 3 5 22 43 2 1 6 12E M 61 10 Palli-X Right 2.5 4 20 42 2.5 3 16 45
1570 HURTADO ET AL.
J Neurophysiol • VOL 93 • MARCH 2005 • www.jn.org
by guest on June 4, 2013http://jn.physiology.org/
Dow
nloaded from

Barbara, CA) with software provided by that company. Neuronalspikes were threshold extracted (�2 SD above baseline) and downsampled at a 1-ms resolution. Single units were further assessed byconfirming the presence of a clear refractory period (�1–2 ms) in theautocorrelogram and stability in spike shape and amplitude over therecording period. Multiunit data were discarded from the analysis.
Standard spectral analysis
Standard statistical spectral methods were used to compute overall(i.e., over �60 s) spectral properties of the signals, as describedpreviously (Brillinger 1981; Hurtado et al. 1999; Percival and Walden1993; Rosenberg et al. 1989). The terms “overall spectra” and “overallcoherence” are used to distinguish these computations from thetime-dependent coherence measure we apply later. All analysis wasperformed in MATLAB (MathWorks, Natick, MA). For overall spec-tral estimation, we used a multiple window method (Carter 1987;Percival and Walden 1993) as follows: epochs of paired neural-EMGrecordings were subdivided into Nwin 1-s segments with no overlapand multiplied with a Hanning tapering window to reduce spectralleakage. The discrete Fourier transform (DFT) of each segment di,k
(channel i, segment k) was computed using the FFT algorithm fromthe MATLAB library. The frequency bin for the DFT and all overallspectral estimates are 1 Hz. To obtain the power spectrum, a directspectral estimate (i.e., periodogram) from each 1-s segmentwas computed by taking the magnitude square of its DFT ateach frequency, Pk(�) � �dk(�)�2, where � is the frequency, andthe spectrum is estimated as the average of all direct estimates,
P��� � �1/Nwin� �k�1
N
Pk���. To extract significant peaks, we consider asa null hypothesis a flat spectrum with the same total power as theobserved spectrum as follows. For a stationary process, the spectrumfollows a �2 distribution (Brillinger 1981; Percival and Walden 1993)
Pnull � E�Pnull��v
2
v(1)
where v is the degrees of freedom, Pnull is the empirical (i.e., sample)spectrum in the null condition, and E[Pnull] is the expected value. ForNwin-independent windows, the degrees of freedom are v � 2N. Under thenull hypothesis of a flat spectrum, E[Pnull] should be constant across frequen-cies. For evaluation purposes, the constant value was taken as the average ofthe empirical spectra in E�Pnull� � P���. This assures that the nulldistribution has equal power as the empirical spectrum. In our case,the average was taken in the frequency range between 1 and 35 Hz.Departures from the null condition (i.e., peaks) are obtained at � �0.002 significance level, and significant peaks in the range of tremor(2–6 Hz) were considered as evidence of tremor-related activity.
Overall coherence is computed from the formula
�ij2 �
� fij����2
fii���fjj���(2)
where fij(�) is the estimated cross spectrum between channels i,j fij(�)
� �1/Nwin� �k�1
N
di,k���dj,k(�), where the bar denotes complex conjugate,and Nwin is the number of nonoverlapping analysis windows.
To distinguish between noncoherent and coherent pairs, we test thenull hypothesis of independent activity. We define as a cut-off level�� as the value of coherence such that the probability P(� � ���� �0) � �. This is the maximum value consistent with the zero coherencehypothesis at the significance level �. A cut-off value �� as a functionof � and N is given by
�� � 1 � �1 � ��1
N�1 (3)
(Rosenberg et al. 1989). The validity of this binary classification(coherent/noncoherent) was tested by building a histogram of coher-
ence values across all recorded pairs and checking the modes. Themethod is described below.
An example of a digitized EMG and threshold-extracted spiketrain is shown in Fig. 1A. The overall power spectrum of each ofthese signals and their coherence spectrum is shown in Fig. 1B.Recording pairs having a significant peak in their coherencespectrum are expected to maintain a relatively constant phase lagat that frequency throughout the recording period. We display thedistribution of phase differences over the sample windows as anangular histogram (Fig. 1B). Clustering around an angular bin isexpected when coherence is high.
Pooled coherence histogram
Building a histogram of combined or “pooled” coherence valuesacross patients, neural/EMG pairs, and recording episodes is com-plicated by two problems. First, coherence estimators obtainedwith different numbers of independent windows (N) are not com-parable since the bias and variance of the estimator dependscrucially on N (Amjad et al. 1997; Carter 1987). Second, ournumber of recorded pairs was too limited to generate a meaningfulhistogram. We adopted a bootstrapping strategy to address theseproblems. In this scheme, the following sequence was repeated n �105 times: first, a recording session was selected at random fromthe database, with replacement; the probability of choosing anyparticular session was made proportional to that session duration.From the chosen session a neural/EMG pair is obtained; if morethan one EMG channel was available, one was selected randomly.Second, the paired neural/EMG data were subdivided into non-overlapping 1-s segments, as described in the previous section.Third, from these (paired) segments, a group of 20 is randomlydrawn, and their coherence is computed. The total of 105 coherencevalues obtained was pooled to form a histogram; pooling waslegitimate since each coherence estimate was computed from thesame number of segments (n � 20).
The bias and variance of the coherence estimator depends also onthe “underlying” coherence (Carter 1987). To equalize variancesacross coherence values, we used the Fisher transform of coherence,
tanh�1����, which returns values close to a normal distribution withvariance that is not dependent on the underlying coherence (Amjad etal. 1997).
Time-frequency analysis, SNR, and tremor-on-off index
We implemented a method to extract the intervals of significantoscillatory activity in the EMG and neuronal data. This step isimportant for the phase reconstruction procedure that follows,since a phase can be meaningfully defined only for signals that areoscillatory. First, a time-frequency spectrum, P(�,t) (�, frequency;t, time) was computed for each data series. For each point in time,we applied the same calculation scheme as for the overall spectralanalysis, with the sole difference being that here we used overlap-ping windows (90%) to obtain a higher temporal resolution. Datawere windowed into 1-s sliding windows (100-ms offset betweensubsequent windows), a Hanning taper was applied to each win-dow, and the direct spectra was computed from its FFT, asdescribed before. The spectra of 10 adjacent windows were aver-aged to yield a spectral estimate. One such estimate was obtainedevery 100 ms, spanning 1.9 s of data (i.e., 10 1-s windows 100-msoffset) and with a frequency resolution of 1 Hz.
Episodes of tremor activity are defined as intervals where thespectral peak in the tremor range (2– 6 Hz) is substantially higherthan the baseline (noise) level. A cut-off level was obtained by
1571TEMPORAL EVOLUTION OF OSCILLATIONS AND SYNCHRONY IN PD TREMOR
J Neurophysiol • VOL 93 • MARCH 2005 • www.jn.org
by guest on June 4, 2013http://jn.physiology.org/
Dow
nloaded from

taking a flat power spectrum as a null hypothesis and consideringdepartures at a significance level � � 0.002 as significant peaks.The null distribution of the averaged spectrum, Pnull, is �2, and weapproximate E[Pnull] by the average of the power in the frequencyrange 1–35 Hz, E�Pnull� � P���. For the degrees of freedom, wemust consider that, in this case, there is substantial overlap betweenadjacent windows, and the assumption of independence is thus vio-lated. We therefore estimated the equivalent degrees of freedom fornonindependent windows from a procedure described in detail inThomson and Chave (1991). For an overlap level of 90%, usingNwin �[r] 10 and considering Hanning tapers, the degrees of freedomparameter is v � 4.87. At a significance level � � 0.002, the
corresponding cut-off value is 3.78 � i.e., p��v2
v� 3.78� � ��.
Peaks that surpass the spectral average baseline 3.78 times were thusconsidered significant (P � 0.002). Since we are extracting phases inthe tremor range, we consider peaks in the 2- to 6-Hz range.
To implement this criterion over time, we defined a signal to noiseratio (SNR) as a function of time, SNR(t), as the ratio of maximum
power in the tremor frequency band over the average signal power inthe broader band 1–35 Hz
SNR�t� �
max�a��b
�P��,t��
avg�0��max
�P��,t��(4)
where �a, �b are the limits of the tremor band (2–6 Hz), �max �35 Hz, and �0 � 1 Hz. From the previous considerations, weused a threshold value of SNR(t) � 3.78 to extract the segmentswhere tremor oscillations are significant. We confirmed the valid-ity of the threshold by visually inspecting tremor-related neuralactivity and tremor EMG series and checking that this thresholdindex discriminates well between oscillatory and nonoscillatoryintervals (Fig. 1C). Intervals above and below this threshold arereferred to as “tremor-on” and “tremor-off” intervals, respectively.It is important to note that this separation between nonoscillatoryand oscillatory episodes is necessary for a valid phase reconstruc-tion, since phase variables defined over nonoscillatory data aremisleading.
0
min
max
30
A
Im
i
-i
-11 Re
φ
1 sec
fre
qu
en
cy [
Hz]
GPi
APB
1
φ2
φ1
Φ
Φ
1sec
0
2
4
6
8
10
SN
R
0
2
4
6
8
10
B
APB
0 10 20 30
0
0
2
20
0
.5
14HzGPi
frequency [Hz]
C
E
tremor-on tremor-off
tremor-on tremor-off
D
-2000 0
time [msec]
ma
gn
itu
de
[a
.u.]
2000
0
.01
FIG. 1. A and B: summary of standard spectral analysis. A:tremor-related activity in simultaneously recorded threshold-extracted single unit spike train in globus pallidus internus(Gpi) and EMG from the abductor pollicis (APB; scale bar �250 �V). Ten seconds of data are subdivided into 10 nonover-lapping 1-s segments (dashed lines) B: power spectra of GPi(arbitrary units) and EMG (�V2/s/Hz) activity (graphs withgray background) and coherence spectrum (graph with whitebackground); for a 10-s period (dashed lines, 1% significancelevel). Bottom left: histogram of the phase differences betweenthe 2 signals for the 10 analysis windows. Both spike train andEMG have a significant peak at 4 Hz. Peak at 4 Hz in thecoherence spectrum indicates that the unit and muscle arecorrelated within the tremor band, and the histogram showsthat the phase between the 2 remains relatively constant. C:time-frequency methods. Panels show the time-frequencypower spectra from GPi (top) and APB EMGs (bottom).Time-dependent signal-to-noise ratio (SNR; green trace, scaleon left) is overlaid on the time-frequency spectra; dashed greenline marks SNR threshold level. Note that there is power in thetremor band when SNR � threshold. Band-pass filtered data(gray traces) and raw data corresponding to each time-fre-quency spectra are shown below each panel (scale � 50 �V).Note that tremor range oscillations visible in the raw andfiltered signals coincide with times where SNR � threshold. D:impulse response of the filter. E: phase reconstruction andphase coherence methods. Top: complex Gabor representationof an oscillatory brain signal; only 2 cycles are displayed forclarity. Angle is represented as a point in the unit circle (thincircle) by projecting into it (arrow). Middle: phase evolution of2 oscillators (GPi and EMG) overlaid in the unit circle. 1, 2
are phase angles at a particular point in time. Their difference, , is a point in the unit circle that represents the phase lag.Bottom: thin vectors represent values at different timesduring the interval of analysis. Their average is shown as athick vector. Modulus (length) of this vector is always �1. Itsvalue is high (near 1) if varies little over time and low (near0) if is highly variable. The phase coherence index is thesquare of the modulus.
1572 HURTADO ET AL.
J Neurophysiol • VOL 93 • MARCH 2005 • www.jn.org
by guest on June 4, 2013http://jn.physiology.org/
Dow
nloaded from

Tremor-on and tremor-off intervals were represented by a binaryvariable as a function of time �(t), as
��t� � � 0, SNR�t� � SNRthres
1, SNR�t� � SNRthres(5)
(that is, � � 0 for tremor-off intervals and � � 1 for tremor-onintervals). This index was computed for neuronal activity and EMGrecordings. Since one SNR point, spanning 1.9 s of data, was obtainedevery 100 ms, gaps in tremor (i.e., periods of � � 0) that lasted � 1 sand were in the midst of tremor-on periods (� � 1), were considerednonsignificant and set to the value � � 1. We did this correctionbecause a drop in the SNR value for such short times does not reflecta lasting interruption in tremor (the total time extent for computing aSNR point was 1.9 s, i.e., 10 1-s windows with 90% overlap). Theseshort interruptions were caused by the appearance of a series of phaseslips in quick succession and are treated separately in phase slips andestimation of associated phase advance.
This transformation from continuous SNR to binary indexes pro-vides a way to extract episodes of significant tremor, where a phasecan be defined with relative certainty, and it simplifies the analysis oftemporal incidence of tremor.
Tremor-on-off correlation for paired recordings
To determine whether there are temporal correlations between thetremor-on-off intervals for different neural and EMG channel pairs,we computed a (0 lag) correlation coefficient Ri, j
� between the � ofchannel pairs (i,j), over each recording episode
Ri,j� �
cov��i,�j�
�var��i�var��j�(6)
A value of Ri,j� close to 1 means that channels i,j tend to be in the
tremor-on or -off states concurrently, whereas a value close to 0indicates that the tremor-on and -off states in both channels areindependent; a value near �1 means that one channel is likely to betremor-off when the other is tremor-on. The statistical significance ofRi,j
� was assessed by estimating the distribution of correlation coeffi-cients under the null hypothesis of Ri,j
� � 0 and obtaining cut-offvalues from this distribution. To estimate the distribution, independentpairs of �i(t) and �j(t) series were generated using surrogate data. A setof surrogate series �i
s�t� can be constructed by time-shifting either ofthe original series by a random step, while keeping circular boundaryconditions. The Ri,j
�,s (superscript s for surrogate) was computed for 500surrogate data pairs, and the 95th and 5th percentiles of the distribu-tion were used as the cut-off to determine significant correlation (oranticorrelation). In cases where either of the �i,j(t) was 1 or 0 for allt, the variance is zero and Ri,j
� has no meaning.A caveat of this analysis is that there may be a loss of information
when transforming the SNR measure to a binary index, and thereforesignificant correlations in SNR could be masked. We therefore com-puted the correlation coefficients of the original SNR, and the answerswere identical to those obtained by using the tremor index.
Phase reconstruction procedure
The goal of the phase reconstruction procedure is to obtain anangular phase variable as a function of time from the oscillatory timeseries. The phase variable indicates the amount of completion of anoscillation cycle at any given point in time and is used to quantifyphase locking between oscillatory signals. Importantly, a phase re-construction method yields meaningful results only if the signal isoscillatory (Hurtado et al. 2004; Pikovsky et al. 2001; Rosenblum etal. 2001). We therefore restrict the analysis of phase to tremor-onintervals.
The steps in the phase reconstruction methods have been describedin detail elsewhere (Hurtado et al. 2004). In summary, after spikeextraction in the neuronal signal and rectification in EMGs, signalswere band-pass filtered in the range of tremor activity. We used adigital FIR filter, 2- to 6-Hz passband, stop 0–1 (�60 dB) and 7 HzNyquist, (�80 dB), sampled at 1 kHz. The parameters yielded analmost flat response in the passband, and rejection of out of bandactivity with a sharp rolloff. A filter of relatively high order (2,530)was necessary to obtain good out of band rejection together with a flatresponse in the tremor range and little distortion in the time locationof peaks. We compared the original series to the filtered ones to checkthat filtering did not alter peak locations and that it was sensitiveenough to follow the shifts in phase in the original data. The processof filtering entails a loss of temporal resolution, since it is equivalentto convolving the data with a moving window. High filter orders suchthose used here imply longer windows. We measured the time aslocalization of our filter by taking the square of its impulse responseas a distribution (Percival and Walden 1993) and computing its SD. Inour case, this was 188 ms, meaning that the lost of temporal precisiondue to filtering happened within a very narrow window of time, eventhough the total filter length was about 5 s (Fig. 1D).
Phase is obtained from the filtered series by using the Gaborrepresentation, (t), that projects the oscillatory series on to thecomplex plane and results in a rotational trajectory around the com-plex origin (Gabor 1946; Rosenblum et al. 2001). Its real part is thesignal itself Re[ (t)] � x(t), and the imaginary part is obtained fromthe Hilbert transform of the signal Im[ (t)] � x�(t) � H[x(t)]. Thecomplex trajectory (t) is projected onto the unit circle (Fig. 1E):
z�t� � �t�
�t�, and the phase of the signal is obtained as the angular
variable �t� � arg� �t�� � arg�z�t�� �z�t� � ei�t��. As a result, weobtained a discrete series of (tk), k � 1, 2. . .N, where �t � tk�1 �tk is the sampling period (1 ms), and N is the number of samples. The“raw” instantaneous frequency �(t) is defined here as the first-order
differential of �t�, ��tk� �k �k�1 � k
�t. Ideally, � varies slowly
over time (Boashash 1992); the problem of discontinuities is treated inPhase slips and estimation of associated phase advance.
Phase slips and estimation of associated phase advance
Phase slips are discontinuities in the phase evolution of an oscilla-tor, leading to abrupt phase advances. To detect slips, we tookadvantage of the fact that they would appear as “spikes” in thederivative of phase, which is the instantaneous frequency, �(t) (Fig.2A, arrows). We therefore referred to these events as �-spikes.�-spikes were extracted from �(t) by setting as threshold the fre-quency limits of the band-pass filter that was used in the phaseconstruction procedure (Fig. 2A, dashed lines). The rationale for thischoice is that the instantaneous frequency is expected to remain withinthe frequency band of the signal (Boashash 1992); large departurescan be considered singularities. A flat band-pass response and goodout of band rejection of the filter were important in the procedure ofphase slip extraction because they guaranteed that the only out of bandactivity visible corresponded to singularities (i.e., phase slips) andminimized false positives in slip detection due to poor filtering.Importantly, only slips occurring in the midst of an oscillation epi-sode, (i.e., with high SNR) were considered as such.
In addition to obtaining the time location of slips, we estimated theamount of phase advance associated with each event. For this purpose,we compared the phase value shortly after the slip to the “forecasted”phase value had the slip not taken place. The forecasted phase wasobtained by time integrating a smoothed estimate of the instantaneousfrequency, � (Fig. 2B). The smoothed slips were first “erased” fromthe raw instantaneous frequency approximation, and the gaps (thresh-old crossing � 100 ms) were filled by cubic interpolation from the
1573TEMPORAL EVOLUTION OF OSCILLATIONS AND SYNCHRONY IN PD TREMOR
J Neurophysiol • VOL 93 • MARCH 2005 • www.jn.org
by guest on June 4, 2013http://jn.physiology.org/
Dow
nloaded from

neighboring endpoints. � was obtained by filtering the resulting series(moving average filter, 750 ms width). The forecasted phase series,(t) was computed as the time integral of �. The additional phaseadvance due to the slip is the difference between the forecasted phase(with no slip) and the observed phases, � � �tM� � �tM�.
Importantly, this estimate has a margin of error due to the smooth-ing procedure used to obtain the forecasted phase advance, . Theerror arises because is the integral of the smoothed instantaneousfrequency �, whereas equals the integral of the raw instantaneousfrequency � (see Fig. 2B). Even if no phase slip takes place, thesmoothed and raw series would differ, and � would drift away fromthe zero expected value. The error should be accounted for in theestimate of � for phase slips. We studied the distribution of that errorby computing � for randomly selected data segments where no slipsoccurred. From this distribution (data not shown), we found that theangular departure was ��� � 45° in 95% of the cases. Consequently,
slips less than �45° in magnitude were considered nonsignificant, anda conservative error bound of �45° was added to all slip angleestimates.
To determine whether there is a preferred angle of phase slippingfor a given channel, we studied the distribution of slip advance anglesfor each recording session and tested the null hypothesis of a uniformcircular distribution. An eight-bin circular histogram (45° bin size) ofphase advance values was built, and an entropy index was calculatedfrom this histogram. To obtain the null distribution of the entropyindex, we numerically computed the index for uniformly distributedangles in the circle. An identical number of events was generated, andthe index was computed a 100 different times. From this null distri-bution, a cut-off value was obtained at the 5th lowest percentile.Entropy values less than the cut-off were indicative of significantclustering.
Phase correlation statistics
To quantify time-locking between pairs over time, we used atime-dependent phase coherence index � (details in Hurtado et al.2004). The phase coherence is always 1, taking a value of 1 onlywhen the relative phase remained constant throughout the obser-vation period. A similar measure has been used by others (Lachaux etal. 1999; Rosenblum et al. 2001). For each data pair, the relative phaseseries is obtained by taking the difference of angles between theindividual phase series j 1�tj� � 2�tj�, j � � � N, . . .k, wherethe tj is the sampling point (see Fig. 1E).
The time-dependent phase coherence is defined as
�N�tk� � � 1
N�
j�k�N
k
ei j� 2
, where N indicates the number of consec-
utive data samples to be considered in the coherence computation. Asmall value of N provides an index with a higher temporal resolution,but lower statistical power. In this study we used n � 1,500, which atthe sampling rate of 1 kHz corresponds roughly to six cycles of tremoroscillation. Values of phase coherence were only considered whenboth channels had significant oscillations (i.e., SNR above threshold).
We used a statistical method to test for phase locking against thenull hypothesis of independent processes by studying the distributionof � for independent processes with similar temporal characteristics�ind (see Hurtado et al. 2004). Briefly, surrogate versions of theinstantaneous frequency, �, are created from �. To do this, we createdsurrogates having the same power spectrum as the � series, random-izing the phase spectrum while preserving the amplitude spectrum.We erased the �-spikes caused by phase slips prior to the computation
FIG. 2. Phase slip methods. A: detection of phase slips. Time evolution ofraw instantaneous frequency � of a GPi unit. Smooth instantaneous frequencyestimate � is overlaid (thick dashed line). Thin dashed lines mark upper andlower frequency thresholds for �-spike extraction. Arrows point to extractedevents. B: phase advance estimation, details of � (thick line), and � (thickdashed line) at the time around the �-spike occurrence. Bottom traces: phaseevolution of the oscillation at the time around �-spike occurrence; sinusoidaltraces are the real part of the complex Gabor representation. Arrow points tothe phase slip location. The “predicted” phase evolution if no slip occurred(overlaid dashed line) is the time integral of �. This particular slip wasquantified as a 140° advance (�30% of a cycle). C: top traces: GPi oscillatorfrom B (black trace) with the EMG oscillator overlaid (phase evolution ofEMG, white trace); note that throughout the time, the phase lag between GPiand muscle is preserved. Bottom traces: predicted phase evolution (dashed)overlaid on the same EMG oscillation as above; note the large variation inphase lag between both cases over time. Circular histograms on the right showthe distribution of phase lag values during the time observed for the actualoscillator (top) and predicted (bottom). D: histogram of phase coherence valuesbetween the 2 oscillators obtained by inserting random phase advances at thetime of slipping into the “predicted” GPi oscillation. Dashed lines mark the 25upper and lower percentiles; arrow points to observed coherence value. Thisphase slip is therefore classified as synchronizing with respect to that particularmuscle EMG.
1574 HURTADO ET AL.
J Neurophysiol • VOL 93 • MARCH 2005 • www.jn.org
by guest on June 4, 2013http://jn.physiology.org/
Dow
nloaded from

of surrogates because �-spikes contribute to power at all frequencies.From the surrogate �, we obtained a series of surrogate that areentered into the computation of the null distribution �ind. From �ind,we obtained a 95% cut-off level �ind
(.95), to detect times of significantsynchronization. In addition, we used the 50% cut-off level, �ind
(.5), asa reference to obtain the duration of intervals as described below.From the previous analysis step, we could obtain periods of phaselocking at a 0.05 significance level. However, even for independentprocesses, some periods with � � �ind
(.95) above the 95% cut-off (� ��ind
(.95)) will randomly occur (on average, 5% of the time). To determinewhether events above cut-off actually reflect a significant transientsynchronization, we examined their duration. For a set of 200 surro-gate independent pairs (generated as specified above), we determinedthe distribution of duration for intervals above the 50% cut-off level�ind � �ind
(.5). A recorded pair was considered to show transientcoherence if 1) it contained at least one interval � � �ind
(.5) with durationin the upper 95% and 2) if the � within the interval � � �ind
(.5) inquestion crossed the �ind
(.95) line at least once.
Synchronizing and desynchronizing phase slips
We describe here a statistical method to determine whether a phaseslip in a channel promotes or destroys the synchrony between it anda second (reference) oscillatory signal (Fig. 2C). For this analysis,only phase slips that occur during an interval of synchronizationbetween the two channels are selected. A time segment around the�-spike associated with the slip is selected (tsl � 850 ms, where tsl isthe time of threshold crossing) and the phase coherence around theslip occurrence, �sl, is computed over that interval. For the computa-tion of �sl, the interval tsl � 100 ms is eliminated from the calculationbecause the particular shape of an �-spike is not a robust feature of thedynamics but depends on the details of numerical methods (filtersettings, etc.). A random phase advance chosen from an uniformdistribution in the circle is introduced into the channel with the phaseslip at t � tsl and the value of � with the random slip, �R sl, iscomputed. This procedure is repeated 100 times, and the histogram of�R sl is computed. A slip is considered “synchronizing” if its �sl is inthe highest 25th percentile of the �R sl distribution, “desynchroniz-ing” if it is below the lowest 25th percentile, and “neutral” if it fallswithin the median 50th percentile (Fig. 2D). This procedure wascarried out for all single unit recordings, taking each muscle as areference (neuronal slips), and also for each muscle, taking theneuronal signal as a reference (EMG slips).
A bootstrapping test was performed to determine whether synchro-nizing slips are significantly more probable in pairs that are coherentoverall versus pairs that are noncoherent. Slips from all recordings inour database with overall coherence were listed, and groups of 30were successively drawn randomly and with replacement. For eachgroup, the number of synchronizing, desynchronizing, and neutralslips was counted. This procedure was repeated 5,000 times, drawinga new set of 30 slips each time. The frequencies of each event type(synchronizing, desynchronizing, and neutral) were averaged over allrepetitions to yield an estimated probability distribution for each case.The same procedure was done for slips occurring in noncoherentpairs, and also for slips in EMGs.
R E S U L T S
Our data base included 9 single GPi units and 27 singleunit/EMG pairs (see Table 2). Each of these nine units wasidentified as a GPi single unit by the following criteria: 1) theunit was a well-isolated neuron with a stable spike shapeand stable amplitude significantly above the noise level overthe recording period; 2) the spike autocorrelogram had a clearrefractory period (�1–2 ms); 3) the area from which theunit was recorded had a noted increased level of tonic activity;
4) the area from which the unit was recorded had tremor-related activity; 5) the area had passive responses to limbmovement; 6) there was a quiet zone below GPi with optic tractbelow the quiet zone (as indicated by light responses); 7)lesions placed in the area identified as GPi during mappingresulted immediately in improvement of one or more motorsymptoms (e.g., reduction in tremor and rigidity); 8) the lesionor DBS was correctly placed in GPi as confirmed by postop-erative MRI; and 9) the patient showed improvement inUPDRS scores 6 mo postoperatively (see Table 1).
The analysis of the GPi/EMG tremor data was done in twosteps. First, we computed statistical power and coherencespectra for pairs of GPi single units and EMGs from severalmuscles using a multiple window method. These computationsprovide statistical estimators over a time scale of tens ofseconds (usually 1 min), corresponding to a few hundredtremor cycles. Although these estimators lack temporal reso-lution, they provide insights into the spatial (i.e., anatomical)characteristics of the networks that give rise to tremor activity.We refer to them as “overall” spectral properties.
TABLE 2. Oscillatory activity and coherence of tremor-relatedGPi units and EMGs
PatientKey Channel
TremorRange
ActivityBoth
Tremors CoherentTransientCoherence
SNRCorrelation
A GPi YesWE Yes Yes No No No
B1 GPi YesAPB Yes Yes Yes Yes YesWE Yes Yes Yes Yes YesWF Yes Yes Yes Yes NoBI Yes Yes No Yes Yes
B2 GPi YesAPB Yes Yes Yes Yes NoWE Yes Yes Yes Yes YesWF Yes Yes Yes Yes NoBI Yes Yes Yes Yes No
C GPi YesWE Yes Yes No Yes NAAPB Yes Yes No Yes NAQUAD Yes Yes Yes Yes NAGAST Yes Yes Yes Yes NA
D1 GPi YesWE Yes Yes Yes Yes NAWF Yes Yes Yes Yes NATA Yes Yes No No NA
D2 GPi YesWE No No No No NAWF No No No No NATA No No No No NA
D3 GPi YesWE Yes Yes Yes Yes Yes
D4 GPi YesWE Yes Yes Yes Yes NAWF Yes Yes Yes Yes NATA Yes Yes Yes Yes No
E GPi YesGAST Yes Yes Yes Yes NoTA Yes Yes Yes Yes NoAPB No No No No NAWE No No No No NA
Total 31 22 17 20
GPi, globus pallidus internus; WE, wrist extensor; APB, abductor pollicisbrevis; WF, wrist flexor; BI, biceps; QUAD, quadriceps; GAST, gastroenominus; TA, tibialis anterior; NA, not applicable.
1575TEMPORAL EVOLUTION OF OSCILLATIONS AND SYNCHRONY IN PD TREMOR
J Neurophysiol • VOL 93 • MARCH 2005 • www.jn.org
by guest on June 4, 2013http://jn.physiology.org/
Dow
nloaded from

The second set of measures characterizes the temporal evo-lution of oscillatory activity and the synchrony between oscil-lations over time, with a resolution of about six tremor cycles(i.e., 1.5 s). From them, we obtain 1) a time profile of theintervals during which tremor-range oscillatory activity ispresent (tremor-on) and absent (tremor-off) in each of thechannels, 2) the time location of phase slips in each of theoscillatory channels during the tremor-on states, and 3) apicture of the time evolution of phase locking between pairs ofoscillatory channels. These high resolution measures resolvethe problems of nonstationarity faced in the standard spectralmeasures used to compute overall coherence, that span longeranalysis periods.
Distribution of overall tremor coherence reveals two classesof GPi/EMG interactions
Power spectra were computed for GPi single units (n � 9)and EMG recordings (n � 27). The duration of data epochsvaried from 30 to 90 s. All single units studied exhibited astatistically significant peak in the tremor range (2–6 Hz), and22 of the EMG episodes recorded had significant tremor. Theresulting 22 neural/EMG pairs with prominent tremor-rangeactivity in both channels amount to a total of nearly 20 min ofpaired tremor data from all patients, pairs, and recordingepochs.
Figure 3 shows the pooled coherence histogram from these22 pairs, constructed with the bootstrapping method describedpreviously. A total of 105 coherence values was computedfrom data segments drawn randomly from the database, asdescribed in METHODS. The histogram exhibits a prominentmode at low coherence (arrow) and a wider peak at highercoherence values that contains two closely spaced secondary
peaks. The Fisher transform (inset), normalizes the coherencemeasure and reveals the modes more clearly.
The low coherence peak is consistent with the presence ofindependent GPi/EMG oscillations. The modal coherence inthis population is shifted from zero because coherence is anupward biased estimator. For comparison, we overlaid thesample distribution of coherence values from a numericalmodel of independent white noise processes (white line). Thedistributions dropped to near zero because we selected thehighest coherence value in a range of frequencies (2–6 Hz);this procedure reduced the incidence of lower values.
The presence of a distinct population of independent oscil-lators (i.e., 0 coherence) led us to sort our data into coherentand noncoherent pairs; the main motivation for this was tocompare the temporal dynamics of one class versus the other.To this end, we used the following classification scheme: arecording was classified as noncoherent if the null hypothesisof independent oscillators could not be rejected at the 0.01significance level. Pairs that did not conform to the nullhypothesis were classified as coherent. We used the full lengthof the each data epoch to compute coherence for this classifi-cation. In addition, the same bootstrapping method was ap-plied, separately, to both coherent and noncoherent subclassesto obtain their individual distributions of coherence values. Theblack full and dashed lines in the histogram plot show thecoherence distributions obtained for these two subsets. Thecoincidence between the peaks on the latter and those of thefull distribution indicates that our classification scheme sensi-bly splits the population into natural modal components. Thefull distribution is, of course, the sum of both groups. Note thatthe distribution of coherence for cell/muscle pairs classified asnoncoherent (full line) is largely coincident with the theoreticaldistribution for independent (i.e., 0 coherence) white noiseprocesses (white line), as expected.
The incidence of coherent and noncoherent pairs is shown atthe bottom of Table 2. Of the 22 GPi/EMG pairs that hadconcurrent oscillations in the tremor range, 17 pairs (77%)showed significant coherence; the remaining 5 (23%) pairswere noncoherent. That many of the pairs were coherentoverall is expected, given that both the unit and the muscle ineach pair had tremor-related activity. The finding of concur-rent, yet noncoherent, oscillatory activity at the same frequencyis, however, not intuitive. One possibility is that a given tremorGPi cell is functionally linked in a preferential way to a subsetof muscles, but is independent from the rest. This interpretationwas supported by recordings where GPi/ tremor correlationswere clearly specific to some tremulous muscles but not others.In four of the nine single units studied, we observed overallcoherence between an oscillatory GPi unit and some of therecorded muscles but not others, even as these others hadsignificant tremor. In one of our patients (patient B), werecorded two GPi units and four arm muscles. One of the unitswas coherent with all four muscles, but the other unit wascoherent only with the three more distal muscles (APB, WE,WF), but not with the proximal muscle (BI).
The idea that tremor/GPi correlations follow a topographicorder was further supported by the results of the analysis ofrecordings from patients with both upper and lower limbtremor. One of the patients studied here (Table 2, C) exhibitedprominent tremor in both upper and lower extremities con-tralateral to GPi. Overall coherence between a GPi single unit
FIG. 3. Coherence values are consistent with 2 classes of interactions.Distribution of pooled GPi-EMG coherence values across all subjects and pairsobtained with a bootstrapping method (gray area, number of bootstrappingsamples, n � 105). Histogram shows a low coherence component (arrow) anda high coherence population. Inset: histogram obtained after applying theFisher transform, tanh�1��coh�, to normalize the data. Black lines are thebootstrapped coherence obtained from pairs classified as coherent overall(dashed) and noncoherent (solid). White line is the coherence distributionobtained by applying an identical procedure to a numerical model of 2independent white noise processes; number of bootstrapping samples in themodel is chosen to be equal to the number of noncoherent draws (black line).
1576 HURTADO ET AL.
J Neurophysiol • VOL 93 • MARCH 2005 • www.jn.org
by guest on June 4, 2013http://jn.physiology.org/
Dow
nloaded from
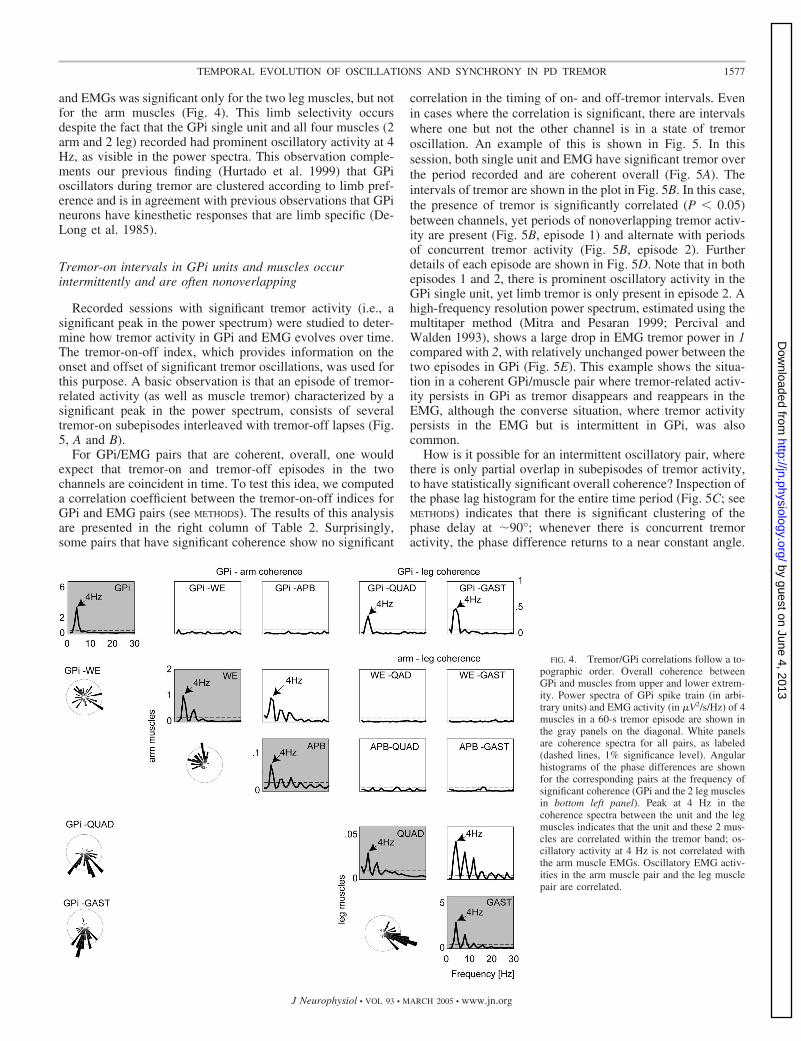
and EMGs was significant only for the two leg muscles, but notfor the arm muscles (Fig. 4). This limb selectivity occursdespite the fact that the GPi single unit and all four muscles (2arm and 2 leg) recorded had prominent oscillatory activity at 4Hz, as visible in the power spectra. This observation comple-ments our previous finding (Hurtado et al. 1999) that GPioscillators during tremor are clustered according to limb pref-erence and is in agreement with previous observations that GPineurons have kinesthetic responses that are limb specific (De-Long et al. 1985).
Tremor-on intervals in GPi units and muscles occurintermittently and are often nonoverlapping
Recorded sessions with significant tremor activity (i.e., asignificant peak in the power spectrum) were studied to deter-mine how tremor activity in GPi and EMG evolves over time.The tremor-on-off index, which provides information on theonset and offset of significant tremor oscillations, was used forthis purpose. A basic observation is that an episode of tremor-related activity (as well as muscle tremor) characterized by asignificant peak in the power spectrum, consists of severaltremor-on subepisodes interleaved with tremor-off lapses (Fig.5, A and B).
For GPi/EMG pairs that are coherent, overall, one wouldexpect that tremor-on and tremor-off episodes in the twochannels are coincident in time. To test this idea, we computeda correlation coefficient between the tremor-on-off indices forGPi and EMG pairs (see METHODS). The results of this analysisare presented in the right column of Table 2. Surprisingly,some pairs that have significant coherence show no significant
correlation in the timing of on- and off-tremor intervals. Evenin cases where the correlation is significant, there are intervalswhere one but not the other channel is in a state of tremoroscillation. An example of this is shown in Fig. 5. In thissession, both single unit and EMG have significant tremor overthe period recorded and are coherent overall (Fig. 5A). Theintervals of tremor are shown in the plot in Fig. 5B. In this case,the presence of tremor is significantly correlated (P � 0.05)between channels, yet periods of nonoverlapping tremor activ-ity are present (Fig. 5B, episode 1) and alternate with periodsof concurrent tremor activity (Fig. 5B, episode 2). Furtherdetails of each episode are shown in Fig. 5D. Note that in bothepisodes 1 and 2, there is prominent oscillatory activity in theGPi single unit, yet limb tremor is only present in episode 2. Ahigh-frequency resolution power spectrum, estimated using themultitaper method (Mitra and Pesaran 1999; Percival andWalden 1993), shows a large drop in EMG tremor power in 1compared with 2, with relatively unchanged power between thetwo episodes in GPi (Fig. 5E). This example shows the situa-tion in a coherent GPi/muscle pair where tremor-related activ-ity persists in GPi as tremor disappears and reappears in theEMG, although the converse situation, where tremor activitypersists in the EMG but is intermittent in GPi, was alsocommon.
How is it possible for an intermittent oscillatory pair, wherethere is only partial overlap in subepisodes of tremor activity,to have statistically significant overall coherence? Inspection ofthe phase lag histogram for the entire time period (Fig. 5C; seeMETHODS) indicates that there is significant clustering of thephase delay at �90°; whenever there is concurrent tremoractivity, the phase difference returns to a near constant angle.
FIG. 4. Tremor/GPi correlations follow a to-pographic order. Overall coherence betweenGPi and muscles from upper and lower extrem-ity. Power spectra of GPi spike train (in arbi-trary units) and EMG activity (in �V2/s/Hz) of 4muscles in a 60-s tremor episode are shown inthe gray panels on the diagonal. White panelsare coherence spectra for all pairs, as labeled(dashed lines, 1% significance level). Angularhistograms of the phase differences are shownfor the corresponding pairs at the frequency ofsignificant coherence (GPi and the 2 leg musclesin bottom left panel). Peak at 4 Hz in thecoherence spectra between the unit and the legmuscles indicates that the unit and these 2 mus-cles are correlated within the tremor band; os-cillatory activity at 4 Hz is not correlated withthe arm muscle EMGs. Oscillatory EMG activ-ities in the arm muscle pair and the leg musclepair are correlated.
1577TEMPORAL EVOLUTION OF OSCILLATIONS AND SYNCHRONY IN PD TREMOR
J Neurophysiol • VOL 93 • MARCH 2005 • www.jn.org
by guest on June 4, 2013http://jn.physiology.org/
Dow
nloaded from

When analyzed over the entire period, this behavior gives riseto high coherence.
We also performed the SNR correlation analysis for muscle/muscle pairs. Of 17 muscle pairs that were coherent at thetremor frequency, the occurrence of tremor was significantlycorrelated in 7 (41%) and was not in 10 (59%). This analysisof muscle/muscle pairs reveals similar independent tremor-onbehavior that was found for the GPi/muscle pairs, even formuscle pairs within the same limb or limb segment.
Phase-locking can be transient in both coherent andnoncoherent GPi-muscle pairs
The phase reconstruction outlined in METHODS allows us totrack the evolution of phase locking between oscillatory neu-ronal and muscle activity over time. Since phase reconstructionis meaningful only when oscillatory activity is present, thisanalysis was restricted to intervals where both channels were inthe tremor-on state. In Fig. 6, we show the time dependence ofphase coherence for two channels of the same recordingsession as presented in Fig. 4. Several features are revealed inthese plots. First, although GPi and EMG signals are clearlyoscillatory for most of the recording time, statistically signif-icant phase locking is episodic and occupies only a fraction ofthe time that the two signals are concurrently oscillatory.Figure 6A shows the time evolution of phase coherence for aGPi/gastrocnemius pair with overall coherence. There are twoperiods of concurrent oscillatory activity (a, b); in both of
them, significant phase locking is achieved for only a fractionof the time. In period a, significant phase locking begins about4 s after the onset of concurrent oscillatory activity and endswhen tremor stops in the leg muscle. In period b, phase lockingalso begins after the onset of concurrent tremor. Figure 6Bshows the time evolution of phase coherence for a noncoherentpair of the same recording of GPi as Fig. 6A but with respectto an arm muscle (wrist extensor). This pair is statisticallynoncoherent overall even though tremor activity in the unit andthe muscle is concurrent throughout the epoch. Despite beingnoncoherent, we do, in fact, find episodes of significant tran-sient phase locking, but these episodes are of shorter durationthan in the coherent pair. In summary, transient coherence iscommon in both pairs that are coherent overall and noncoher-ent pairs. In the analysis of all pairs (see Table 2, transientcoherence column), we found that 20 of 22 pairs that hadtremor in both channels showed at least one transient coherentepisode of significant duration (see METHODS for significancecriterion) and 3 of the 5 noncoherent pairs showed significanttransient episodes.
Tremor oscillations in GPi and EMG are punctuated byshifts in phase
Close examination of the time course of oscillatory activityreveals the presence of phase slips; these events are character-ized by a sudden shift in phase, usually coincident with adecrease in oscillation amplitude lasting less than one tremor
FIG. 5. Oscillatory activity throughout a tremor episode isnot constant, although overall coherence is high. A: left andmiddle: power spectra of GPi (arbitrary units) and EMG activity(�V2/s/Hz) and coherence spectrum (right) for a 100-s period(dashed lines, 1% significance level). GPi unit and EMG havea significant peak at 4 Hz and are correlated in the tremorfrequency band. B: plot of the presence of oscillatory activity inthe GPi unit (black bar) and EMG (white bar), as determined bythe SNR. There are periods when oscillatory activity exists inone but not the other of the pair (e.g., episode 1), as well asperiods of co-occurrence (e.g., episode 2). C: histogram ofphase lag between GPi during the period of observation. D:oscillatory activity in spike train and EMG during episodes 1and 2. Top: spike train in GPi. Bottom: EMG (scale � 50 �V).E: power spectra for GPi and EMG during episodes 1 and 2.During episode 1, there are oscillations at the tremor frequencyin the GPi spike train, but not in the EMG, whereas in episode2, oscillatory activity occurs in both GPi and EMG.
1578 HURTADO ET AL.
J Neurophysiol • VOL 93 • MARCH 2005 • www.jn.org
by guest on June 4, 2013http://jn.physiology.org/
Dow
nloaded from

cycle (see Fig. 7). Phase slips occur relatively frequently inbrain (Fig. 7, A–C) and in muscle (Fig. 7D). We determined therate of occurrence of these events in GPi and in muscle duringeach tremor episode (Table 3) and estimated the amount ofphase advance associated with each event (see METHODS).Figure 7B shows an example of a phase slip of �190°. If thiscell is synchronized to others in the basal ganglia-thalamocor-tical network, this phase slip would cause a dramatic change inits phase delay with respect to the rest of the network. How-ever, as we see in Fig. 7C, a series of closely spaced phase slipscan sum so that the combined phase advance is zero.
Synchronizing slips are more common in pairs withoverall coherence
Figure 6, A and B, shows examples of synchronizing anddesynchronizing phase slips (1 of each is presented at higher
temporal resolution in Fig. 8). Examination of the temporalevolution of coherence in Fig. 6A shows that there is a highincidence of synchronizing phase slips in this coherent pair. Incontrast, most of the phase slips in GPi in the noncoherent pairin Fig. 6B occur at points in time where there is no phaselocking and therefore have no effect in the already randomphase delay. During the periods of transient phase locking, wesee one synchronizing and one desynchronizing phase slip.
Figure 9A summarizes the effects of phase slips in GPi forcoherent and noncoherent GPi/muscle pairs. The fraction ofsynchronizing phase slips occurring during intervals of phaselocking is significantly higher in coherent pairs than in nonco-herent pairs. Phase slips in the muscle EMG can also beclassified as synchronizing and desynchronizing with respect tothe GPi oscillation. As is the case with GPi phase slips, EMGslips are more frequently synchronizing in coherent pairs (Fig.9B). Note that synchronizing GPi slips are more frequent thannonsynchronizing slips only in the case of coherent pairs,whereas for noncoherent pairs, there is a nonsignificant differ-ence between the three types. Since the slips in the upper 25thpercentile of the distribution of the coherence values forrandom phase advances are classified as synchronizing, it isexpected that, on average, one of four slips would be classifiedas such. Thus the overlap in the distribution in the noncoherentcase would be expected if slips occur at random. However, inthe case of coherent pairs, the higher incidence of synchroniz-ing slips indicates that these slips are part of a mechanism forsynchronization.
D I S C U S S I O N
GPi/EMG tremor coherence is consistent with parallelcircuits that are limb specific
In this study, we combined classical spectral analysis with astatistical time-dependent method to scrutinize the dynamics ofparkinsonian tremor, one of the landmark symptoms of basalganglia pathophysiology in PD. Our data base included only 9single units and 27 single unit/EMG pairs. This data base,however, enabled us to examine �20 min of paired GPi/EMGdata with oscillatory activity in both channels, the equivalent ofabout 5,000 tremor cycles. Nonetheless, this data base islimited in size, due to the constraints inherent in humanneurosurgery, and our conclusions are therefore preliminary.Multiunit data were not included in this study because it wouldpreclude an unambiguous interpretation of phase correlations;for example, the mix of two or more same-frequency oscilla-tory single units that are out of phase could appear as a higherfrequency phenomenon.
Standard coherence analysis here confirms the idea thattremor-related activity in a GPi site is correlated to a restrictedportion of the limb musculature undergoing tremor (Hurtado etal. 1999). In that study, the hypothesis of independent oscilla-tors was supported by recordings with dual electrodes in theGPi and simultaneous EMGs in PD patients with tremor. It wasreported that spatially separated cells (�3 mm) undergoingtremor-related oscillations at identical modal frequencies couldbe independent (i.e., show no significant coherence). An addi-tional piece of evidence comes from studies of muscle tremorshowing that during parkinsonian tremor the limb musculatureis assembled in distinct groups of phase-locked muscles, each
FIG. 6. Phase-locking is transient and occurs in both coherent and nonco-herent GPi-muscle pairs Time evolution of phase coherence index between aGPi unit and EMGs during a tremor episode. Dashed lines indicate the 50thand 95th percentiles of phase coherence for the null hypothesis of independentoscillators. Diamonds indicate time-points of phase slips in the neuronal signal.Upward arrows indicate synchronizing phase slips, and downward arrowsindicate desynchronizing phase slips. Bars below plot the presence of oscilla-tory activity in GPi and EMG; phase coherence is a valid measure only whenboth channels are oscillatory. A: GPi unit and gastrocnemius EMG pair withoverall coherence. B: noncoherent GPi unit and wrist extensor EMG. Blackphase histograms to the right show the distribution of the phase angles for 1.5 saround periods of high coherence in the phase evolution (1 and 2). These aresuperimposed on the white analysis phase histograms from the overall analysistaken from Fig. 3. For the coherent pair in A, phase difference remains withinthe modal distribution despite numerous phase slips. This is not the case for thenoncoherent pair in B.
1579TEMPORAL EVOLUTION OF OSCILLATIONS AND SYNCHRONY IN PD TREMOR
J Neurophysiol • VOL 93 • MARCH 2005 • www.jn.org
by guest on June 4, 2013http://jn.physiology.org/
Dow
nloaded from

spanning an individual limb or limb segment, and that differentlimbs oscillate independently of each other (Hurtado et al.2000; O’Suilleabhain and Matsumoto 1998; Raethjen et al.2000). This supports the idea first advanced by Alberts et al.(1969) that parkinsonian tremor is generated by segregatedparallel networks, each involving a different limb.
Here we have complemented this picture by establishing thatGPi cells synchronize in a preferential manner (i.e., are coher-ent overall) to tremor in a restricted portion of the peripheralmusculature. The idea of independent circuits has beenstrengthened in this study by a simultaneous recording of upperand lower limb tremor EMG and GPi tremor-related activity,with the latter showing coherence to one limb but no significantcoherence to the other. The standard analysis used here isbased on a classification of pairs into coherent and noncoherentgroups by taking a statistical cut-off level. It could be arguedthat the interpretation given here is a result of artificiallysplitting the data based on this arbitrary cut-off value. How-ever, the pooled coherence histogram across all patients (seeFig. 3) confirms that the subdivision between coherent andnoncoherent pairs is not a statistical artifact, since the nonco-herent group appears as a distinct mode in the histogram.
FIG. 7. Phase slips in GPi and EMG during on-going oscillatory activity. A:band-pass (2–6 Hz) filtered spike train during a 20-s tremor episode in GPi.There are 4 phase slips, indicated by arrows. B–D: top: white trace, observedband-pass (2–6 Hz) filtered oscillatory activity; black trace, oscillatory activitywith phase slip removed. Middle: spike density function calculated from spiketrain below. Bottom: threshold extracted neuronal spike train (B and C) orEMG (D). Phase slips indicated by arrows. B: single phase slip in GPi spiketrain results in a phase advance that remains over time. C: 3 phase slips in GPispike train return the oscillatory activity to original phase evolution. D: 2 phaseslips in an EMG recording also return the oscillation to its original trajectory.Note that the value of the phase advance associated with each phase slip onlyapproximately matches the overall value of the phase advance (see METHODS).
TABLE 3. Rates of phase slips in oscillations in pallidal units andEMGs
Phase Slips (GPi)
PatientKey Muscle
Slips perMinute
SignificantModal Angle
A 24.9 �134.7B1 19.0B2 12.2C 10.0D1 0.0D2 0.0D3 11.3 113.4D4 2.0E 4.3
Phase Slips (Muscles)
PatientKey
A WE 3.0B1 APB 9.5
WE 11.6WF 2.1
B2 APB 15.1 123.9WE 3.6WF 3.6BIC 25.9 �104.2
C WE 1.0APB 2.0QUAD 4.0GAST 1.0
D1 WE 8.0D3 WE 5.3D4 WE 0.0
WF 12.0TA 2.0
E GAST 4.3TA 5.7APB 4.3WE 0.0
See Table 2 for abbreviations.
1580 HURTADO ET AL.
J Neurophysiol • VOL 93 • MARCH 2005 • www.jn.org
by guest on June 4, 2013http://jn.physiology.org/
Dow
nloaded from

Although close inspection of the histogram obtained suggeststhat the coherent population contains secondary peaks (Fig. 3),we did not attempt to segment them further, because therelatively small amount of data in our study precluded furthersubdivision.
These findings are consistent with anatomical and functionalstudies showing a rough topographic representation in themotor portion of different structures of the BG thalamocorticalpathways (Crutcher and DeLong 1984; DeLong et al. 1985;Kaneda et al. 2002; Lenz et al. 1988). A consequence of thistopographic organization is that a GPi cell is phase-correlatedto a restricted region of the limb musculature, whereas tremorin other regions is generated independently by pathways thatinclude other GPi sensorimotor fields.
When examined in temporal detail, we found that tremoractivity in single units and in individual EMGs occurs inter-mittently. Furthermore, when analyzing the coincidence oftremor between GPi/EMG pairs, we found only partial overlapin tremor-on periods, even in cases where the GPi/EMG pair is
coherent overall. Phase locking can obviously only occurduring periods of overlapping tremor activity, yet we foundphase locking may not be continuous for the full duration ofoverlap; episodes of tremor synchronization are themselvesintermittent. This transient phase locking occurs in both coher-ent and noncoherent pairs. There are, however, importantdifferences between phase locking in each case. Statisticallynoncoherent pairs phase lock only occasionally, even whenthere is substantial tremor-on overlap and the phase differenceis highly variable from one phase locking episode to the next.In contrast, coherent pairs show longer, more frequent phaselocking episodes, and the phase difference returns to a pre-ferred value across episodes.
Apart from their differences in temporal resolution, the twomethods of analysis differ in that the standard coherencemeasure takes into account interactions both in phase and inamplitude, whereas for the time-dependent analysis, we con-sidered the correlations in phase only. The analysis of phasecorrelations is more appropriate for detecting synchronizationin oscillatory pairs because it is sensitive to co-variations in therelative timing of the oscillations while neglecting amplitudefluctuations (Schafer et al. 1999); uncorrelated amplitude fluc-tuations can mask the presence of phase correlations. Thepre-eminence of phase correlations in oscillatory systems issupported by a number of recent modeling studies in the fieldof nonlinear dynamics showing that, as the strength of couplingbetween different oscillators is increased, phase entrainmentprecedes the appearance of amplitude covariations (reviewedin Boccaletti et al. 2002; Pikovsky et al. 2001). These obser-vations suggest that, in weakly coupled neural oscillators,
FIG. 9. Box plot showing the distribution of 3 types of phase slips in brainfor coherent and noncoherent single units and EMG pairs (see METHODS). Foreach box, top and bottom borders represent the 25th and 75th percentiles, anddashed horizontal lines show median values. Top and bottom whiskers showextent of the entire sample.
FIG. 8. Example of a GPi phase slip that is synchronizing with respect totremor in the leg (gastrocnemius) but not to tremor in the arm (wrist) muscle.Top: phase evolution in GPi around the time of the phase slip indicated by thestar in Fig. 6, A and B. Black solid line represents phase evolution of the signalin GPi unit. Dashed line is phase evolution of the same GPi signal, butdiscounting the phase advance of the phase slip, as described in METHODS.Associated phase advance is 140°. White traces: phase evolution of the EMGs(gastrocnemius and wrist extensor). To compare the effect of the slip in bothmuscles, we have duplicated the white traces to superimpose them with the GPiphase with the phase slip intact (solid black trace) and discounting the phaseslip (dashed black trace). Bottom: phase diagrams at times a and b: solid arrowsrepresent the phase difference between GPi and EMG, and dashed arrowsbetween GPi with the phase slip discounted and the EMG.
1581TEMPORAL EVOLUTION OF OSCILLATIONS AND SYNCHRONY IN PD TREMOR
J Neurophysiol • VOL 93 • MARCH 2005 • www.jn.org
by guest on June 4, 2013http://jn.physiology.org/
Dow
nloaded from

phase entrainment might be present even as the amplitudes areuncorrelated. A correlation index sensitive to both phase andamplitude such as the coherence spectrum can therefore missthe type of events where correlations exist in the timing alone,with amplitudes varying independently.
The time-dependent analysis showing that noncoherent pairscan undergo phase locking for short periods does not contradictthe idea of segregated circuits, but it suggests that interactionbetween circuits is possible. The reason these short periods ofphase locking do not contribute significantly to increase thecoherence value over longer times is that the phase-lag anglevaries widely from one period to the next; this results in mutualcancellation of phase angles over long periods, giving rise tolow overall coherence. Importantly, pairs that appear as coher-ent overall in the standard measure also show episodic phaselocking interleaved with periods of independent oscillatoryactivity.
We conjecture that interactions giving rise to transientphase locking in noncoherent pairs are of a different naturethan in coherent ones. The fact that, in the latter case, thepallido-muscular phase delay returns to a similar valueacross locking subepisodes suggests that their locking arisefrom more robust interactions than in the former case. Onepossibility is that the fixed phase delay results from con-duction delays within a limb-specific BG-thalamocorticalnetwork. In contrast, the variable delays seen in noncoherentpairs may result from weaker collateral interactions betweenparallel circuits.
Interactions within a parallel network
The analysis of coherence discussed above suggests thepresence of parallel pathways in the BG-thalamocortical net-work. On the other hand, the analysis of tremor-on and -offstates over time (Fig. 5) provides insights into the networkwithin one of these parallel pathways. We observed that duringan episode of tremor, a GPi tremor cell and an EMG coherentwith it could be recruited into and out of tremor activityindependently of each other; it was often the case that one andnot the other was in a tremor on state, even though the standardcoherence measure indicated that they were functionally linkedoverall. The same type of nonoverlap was seen when analyzingdifferent muscles of a limb, where coherent behavior was alsocommonplace.
A possible interpretation of these observations is that aparticular region in GPi (belonging to one of the parallel andinterconnected limb BG subcircuits) is always associated witha particular territory of the limb musculature, but neither all themuscles of the affected limb nor all GPi units in the corre-sponding functional region are concurrently in a tremor state.Specific units or muscles in this functional subcircuit may berecruited into and out of the tremor-on state, and this recruit-ment process occurs more or less independently between oneelement of the network and its neighbors. In this picture, thetremor-on state would always be present somewhere in a set offunctionally related muscles and somewhere in the pallidallimb representation. Tremor, in this case, would be a propertyof the population of cells at each stage of the parallel pathway,but not of the individual cells, which can be either in thetremor-on or -off state at any one time. However, since werecorded from a limited number of sites in the network, it could
be argued that other cells in the vicinity of the recorded GPicell could be closely correlated (in their tremor-on timing) to aparticular EMG. The apparent lack of correlation would thenbe a consequence of our sampling. The problem with thisinterpretation is that it invokes a rather precise topographywithin GPi, with particular cells functionally linked to partic-ular muscles. This is at odds with mapping studies of GPi,where individual cells respond to active or passive movementsof one or more joints, suggesting a rough topography (DeLonget al. 1985). In PD, the topography is even less precise, becauseit has been shown in MPTP studies that a larger number of cellsrespond to multijoint movements (Filion et al. 1988). It isunlikely that firing in individual GPi cells map to activity ofindividual muscles in a precise manner.
This picture poses an apparent contradiction: a pair (GPi/muscle, GPi/GPi, muscle/muscle) can be coherent overall, yetthere is little relationship between the times where each indi-vidual muscle or GPi cell enters and leaves the oscillatorystate. This incongruity between the two results is resolvedwhen one considers the properties of the phase locking processover time. Overall coherence is possible because the phaseslock to a particular value during the periods of overlap and thephase value varies little across locking episodes. This findingprovides a new view of the properties of the tremor network,one where tremor appears as a dynamical regime at a networklevel and individual components of the network participateintermittently even though the network as a whole may beoscillatory over long periods of time.
Synchronization through phase slips
When inspecting the dynamics of tremor-on periods, wefound that tremor oscillations, both in pallidum and EMGs, arepunctuated by phase slips (or “jumps” in phase). Similarphenomena have been described in several neural systems, inparticular, in the hippocampus, where place cells advance theirphase relative to the ongoing theta rhythm as animals movethrough the cell’s place field (O’Keefe and Recce 1993; but seeHarris et al. 2002). These events can be important for theformation and the breakdown of neuronal ensembles. Consider,for example, a population of phase-locked oscillatory cells,sharing a preferred frequency. Every cell in the ensemble hasa particular phase delay relative to any other and synchrony ispreserved as long as the relative phase delays between thecomponent cells is preserved. A random slip in phase in a cellwould create a different pattern of phase locking, and a seriesof random jumps would destroy the synchrony between thatcell and the rest of the population. On the other hand, phaseslips could contribute to synchronization if they preserve thephase lag between two cells with slightly different oscillatoryfrequencies.
We computed changes in phase coherence caused by theoccurrence of phase slips and classified them as synchronizingslips, desynchronizing slips, or those without significant effect.We found that synchronizing slips are substantially morecommon than nonsynchronizing slips in pairs that are coherentoverall; phase slips are part of a mechanism of synchroniza-tion. In contrast, desynchronizing phase slips are as likely tooccur in coherent as in noncoherent pairs. We can speculatefrom this that desynchronizing slips arise from either intrinsicnoise of the cells or from an input pathway that is external to
1582 HURTADO ET AL.
J Neurophysiol • VOL 93 • MARCH 2005 • www.jn.org
by guest on June 4, 2013http://jn.physiology.org/
Dow
nloaded from
the tremor generating network. The precise cellular and net-work mechanisms that give rise to slips is an area for furtherresearch in in vitro preparations as well as for multiple record-ing studies in intact preparations.
Conclusions
The results of this study provide a richer description ofthe parkinsonian tremor-generating network, beyond that ofprevious anatomical and physiological studies. While pre-vious evidence provide support for a shift to an oscillatorystate in PD, at least in cases with tremor, and a concomitantincrease in synchrony across the basal ganglia thalamocor-tical network, the view has been that tremor-related activitywithin limb-specific areas are tightly correlated and thatbetween limb-specific areas there is no correlation. Thetime-dependent measure used in this study provides a dif-ferent picture, one in which, during tremor episodes, limbspecific regions of GPi are oscillatory overall, but theoscillation in the individual tremor-related units within thatregion is more sporadic. The same is true for musculartremor. Furthermore, the synchrony between an oscillatoryunit in a particular field and a particular tremulous musclewithin that field is transitory. What then gives rise to thehigh level of synchrony, as measured by overall coherence,is that whenever there is an oscillation in both the unit andthe muscle of the same limb, the phase difference betweenthe two locks to some constant value. Furthermore, thecorrelation between individual units (as described by Hur-tado et al. 1999) or between individual units and specificmuscles are constantly being formed and broken. When onelooks across limb-specific regions, the oscillatory behaviorhas the same intermittent nature; phase locking does formsporadically. The lack of correlation between fields (i.e.,limbs) occurs because the phase difference between the unitand the muscle is not constant from one subepisode oflocking to the next and therefore is only revealed by time-dependent measures of coherence. One interesting questionthat arises from this new picture is whether this type ofbehavior arises in other structures within the tremor-gener-ating network (e.g., STN, primary motor cortex).
A C K N O W L E D G M E N T S
Present address of L. Rubchinsky: Dept. of Mathematical Sciences, IUPUIand Stark Neurosciences Research Inst., Indiana University School of Medi-cine. 402 N. Blackford St., Indianapolis, IN 46202–3216.
G R A N T S
This work was supported by National Institute of Neurological Disordersand Stroke Grant NS-39121.
R E F E R E N C E S
Alberts WW, Wright EW Jr, and Feinstein B. Cortical potentials andParkinsonian tremor. Nature 221: 670–672, 1969.
Amjad AM, Halliday DM, Rosenberg JR, and Conway BA. An extendeddifference of coherence test for comparing and combining several indepen-dent coherence estimates: theory and application to the study of motor unitsand physiological tremor. J Neurosci Methods 73: 69–79, 1997.
Baker SN, Pinches EM, and Lemon RN. Synchronization in monkey motorcortex during a precision grip task. II. effect of oscillatory activity oncorticospinal output. J Neurophysiol 89: 1941–1953, 2003.
Ben-Pazi H, Bergman H, Goldberg JA, Giladi N, Hansel D, Reches A, andSimon ES. Synchrony of rest tremor in multiple limbs in parkinson’s
disease: evidence for multiple oscillators. J Neural Transm 108: 287–296,2001.
Bergman H, Feingold A, Nini A, Raz A, Slovin H, Abeles M, and VaadiaE. Physiological aspects of information processing in the basal ganglia ofnormal and parkinsonian primates. Trends Neurosci 21: 32–38, 1998.
Bevan MD, Magill PJ, Terman D, Bolam JP, and Wilson CJ. Move to therhythm: oscillations in the subthalamic nucleus-external globus pallidusnetwork. Trends Neurosci 25: 525–531, 2002.
Boashash B. Estimating and interpreting the instantaneous frequency of asignal. Proc IEEE 80: 520–568, 1992.
Boccaletti S, Kurths J, Osipov G, Valladares DL, and Zhou CS. Thesynchronization of chaotic systems. Physics Rep 366: 1–101, 2002.
Brillinger DR. Time Series: Data Analysis and Theory. San Francisco, CA:Holden-Day, 1981.
Brown P. Oscillatory nature of human basal ganglia activity: relationship tothe pathophysiology of Parkinson’s disease. Mov Disord 18: 357–363, 2003.
Brown P, Oliviero A, Mazzone P, Insola A, Tonali P, and Di Lazzaro V.Dopamine dependency of oscillations between subthalamic nucleus andpallidum in Parkinson’s disease. J Neurosci 21: 1033–1038, 2001.
Carter GC. Coherence and time delay estimation. Proc IEEE 75: 236–255,1987.
Crutcher MD and DeLong MR. Single cell studies of the primate putamen.I. Functional organization. Exp Brain Res 53: 233–243, 1984.
DeLong M, Crutcher M, and Georgopoulos A. Primate globus pallidus andsubthalamic nucleus: functional organization. J Neurophysiol 53: 530–543,1985.
Deuschl G, Raethjen J, Baron R, Lindemann M, Wilms H, and Krack P.The pathophysiology of parkinsonian tremor: a review. J Neurol 247(Suppl5): V33–V48, 2000.
Doya K. Complementary roles of basal ganglia and cerebellum in learning andmotor control. Curr Opin Neurobiol 10: 732–739, 2000.
Elble RJ. Central mechanisms of tremor. J Clin Neurophysiol 13: 133–144,1996.
Elble RJ and Koller WC. Tremor. Baltimore, MD: Johns Hopkins UniversityPress, 1990.
Farmer S. Neural rhythms in Parkinson’s disease. Brain 125: 1175–1176,2002.
Filion M, Tremblay L, and Bedard P. Abnormal influences of passive limbmovement on the activity of globus pallidus neurons in parkinsonianmonkeys. Brain Res 444: 165–176, 1988.
Gabor D. Theory of communication. J Inst Elect Eng 93: 429–457, 1946.Gross J, Tass PA, Salenius S, Hari R, Freund HJ, and Schnitzler A.
Cortico-muscular synchronization during isometric muscle contraction inhumans as revealed by magnetoencephalography. J Physiol 527: 623–631,2000.
Halliday DM, Conway BA, Farmer SF, Shahani U, Russell AJ, andRosenberg JR. Coherence between low-frequency activation of the motorcortex and tremor in patients with essential tremor. Lancet 355: 1149–1153,2000.
Harris KD, Henze DA, Hirase H, Leinekugel X, Dragoi G, Czurko A, andBuzsaki G. Spike train dynamics predicts theta-related phase precession inhippocampal pyramidal cells. Nature 417: 738–741, 2002.
Hornykiewicz O. Dopamine (3-hydroxytyramine) and brain function. Phar-macol Rev 18: 925–964, 1966.
Houk JC and Wise SP. Distributed modular architectures linking basalganglia, cerebellum, and cerebral cortex: their role in planning and control-ling action. Cereb Cortex 5: 95–110, 1995.
Hurtado JM, Gray CM, Tamas LB, and Sigvardt KA. Dynamics oftremor-related oscillations in the human globus pallidus: a single case study.Proc Natl Acad Sci USA 96: 1674–1679, 1999.
Hurtado JM, Lachaux JP, Beckley DJ, Gray CM, and Sigvardt KA. Inter-and intralimb oscillator coupling in parkinsonian tremor. Mov Disord 15:683–691, 2000.
Hurtado JM, Rubchinsky LL, and Sigvardt KA. Statistical method fordetection of phase-locking episodes in neural oscillations. J Neurophysiol91: 1883–1898, 2004.
Kaneda K, Nambu A, Tokuno H, and Takada M. Differential processingpatterns of motor information via striatopallidal and striatonigral projec-tions. J Neurophysiol 88: 1420–1432, 2002.
Lachaux JP, Rodriguez E, Martinerie J, and Varela FJ. Measuring phasesynchrony in brain signals. Hum Brain Mapp 8: 194–208, 1999.
Lemstra AW, Verhagen Metman L, Lee JI, Dougherty PM, and Lenz FA.Tremor-frequency (3–6 Hz) activity in the sensorimotor arm representation
1583TEMPORAL EVOLUTION OF OSCILLATIONS AND SYNCHRONY IN PD TREMOR
J Neurophysiol • VOL 93 • MARCH 2005 • www.jn.org
by guest on June 4, 2013http://jn.physiology.org/
Dow
nloaded from

of the internal segment of the globus pallidus in patients with Parkinson’sdisease. Neurosci Lett 267: 129–132, 1999.
Lenz F, Dostrovsky J, Tasker R, Yamashiro K, Kwan H, and Murphy J.Single-unit analysis of the human ventral thalamic nuclear group: somato-sensory responses. J Neurophysiol 59: 299–316, 1988.
Levy R, Ashby P, Hutchison WD, Lang AE, Lozano AM, and DostrovskyJO. Dependence of subthalamic nucleus oscillations on movement anddopamine in Parkinson’s disease. Brain 125: 1196–1209, 2002.
Llinas RR, Ribary U, Jeanmonod D, Kronberg E, and Mitra PP. Thalamo-cortical dysrhythmia: A neurological and neuropsychiatric syndrome char-acterized by magnetoencephalography. Proc Natl Acad Sci USA 96: 15222–15227, 1999.
McAuley JH, and Marsden CD. Physiological and pathological tremors andrhythmic central motor control. Brain 123: 1545–1567, 2000.
Middleton FA and Strick PL. Basal ganglia and cerebellar loops: motor andcognitive circuits. Brain Res Brain Res Rev 31: 236–250, 2000.
Mitra PP and Pesaran B. Analysis of dynamic brain imaging data. BiophysJ 76: 691–708, 1999.
Nini A, Feingold A, Slovin H, and Bergman H. Neurons in the globuspallidus do not show correlated activity in the normal monkey, but phase-locked oscillations appear in the MPTP model of parkinsonism. J Neuro-physiol 74: 1800–1805, 1995.
Obeso JA, Rodriguez-Oroz MC, Rodriguez M, Lanciego JL, Artieda J,Gonzalo N, and Olanow CW. Pathophysiology of the basal ganglia inParkinson’s disease. Trends Neurosci 23: S8–19, 2000.
O’Keefe J, and Recce ML. Phase relationship between hippocampal placeunits and the EEG theta rhythm. Hippocampus 3: 317–330, 1993.
O’Suilleabhain PE, and Matsumoto JY. Time-frequency analysis of tremors.Brain 121: 2127–2134, 1998.
Parker F, Tzourio N, Blond S, Petit H, and Mazoyer B. Evidence for acommon network of brain structures involved in parkinsonian tremor andvoluntary repetitive movement. Brain Res 584: 11–17, 1992.
Percival DB and Walden AT. Spectral Analysis for Physical Applications:Multitaper and Conventional Univariate Techniques. Cambridge, UK: Cam-bridge University Press, 1993.
Pikovsky A, Rosenblum M, and Kurths J. Synchronization: A UniversalConcept in Nonlinear Sciences. Cambridge, UK: Cambridge UniversityPress, 2001.
Raethjen J, Lindemann M, Schmaljohann H, Wenzelburger R, Pfister G,and Deuschl G. Multiple oscillators are causing parkinsonian and essentialtremor. Mov Disord 15: 84–94, 2000.
Rosenberg JR, Amjad AM, Breeze P, Brillinger DR, and Halliday DM.The Fourier approach to the identification of functional coupling betweenneuronal spike trains. Prog Biophys Mol Biol 53: 1–31, 1989.
Rosenblum MG, Pikovsky AS, Kurths J, Schafer C, and Tass PA. Phasesynchronization: from theory to data analysis. In: Neuro-Informatics andNeural Modeling, edited by Moss F and Gielen S. New York: Elsevier,2001, p. 279–321.
Salenius S and Hari R. Synchronous cortical oscillatory activity during motoraction. Curr Opin Neurobiol 13: 678–684, 2003.
Schafer C, Rosenblum MG, Abel HH, and Kurths J. Synchronization in thehuman cardiorespiratory system. Phys Rev E Stat Phys Plasmas Fluids RelatInterdiscip Topics 60: 857–870, 1999.
Thomson DJ and Chave AD. Jackknifed error estimates for spectra, coher-ence and transfer functions. In: Advances in Spetrum Analysis and ArrayProcessing, edited by Haykin S. Englewood Cliffs, NJ: Prentice Hall, 1991,p. 58–113.
Timmermann L, Gross J, Dirks M, Volkmann J, Freund HJ, and Schnit-zler A. The cerebral oscillatory network of parkinsonian resting tremor.Brain 126: 199–212, 2003.
Volkmann J, Joliot M, Mogilner A, Ioannides A, Lado F, Fazzini E,Ribary U, and Llinas R. Central motor loop oscillations in parkinsonianresting tremor revealed by magnetoencephalography. Neurology 46: 1359–1370, 1996.
Williams D, Tijssen M, Van Bruggen G, Bosch A, Insola A, Di LazzaroV, Mazzone P, Oliviero A, Quartarone, Speelman H, and Brown P.Dopamine-dependent changes in the functional connectivity betweenbasal ganglia and cerebral cortex in humans. Brain 125: 1558 –1569,2002.
1584 HURTADO ET AL.
J Neurophysiol • VOL 93 • MARCH 2005 • www.jn.org
by guest on June 4, 2013http://jn.physiology.org/
Dow
nloaded from