Oscillatory changes related to the forced termination of a movement
11
Oscillatory changes related to the forced termination of a movement M. Alegre a,b , I. Alvarez-Gerriko b , M. Valencia a , J. Iriarte a,b , J. Artieda a,b, * a Neurophysiology Laboratory, Neuroscience Area, CIMA, Universidad de Navarra, Pamplona, Spain b Clinical Neurophysiology Section, Department of Neurology, Clı ´nica Universitaria de Navarra, Avda. Pı ´o XII, 36, 31008 Pamplona (Navarra), Spain Accepted 18 October 2007 Abstract Objective: Stimulus-induced movements are accompanied by a definite pattern of oscillatory changes, that include a frontal 15 Hz syn- chronization, a central peri-movement desynchronization, and a contralateral beta rebound after the movement. Our aim was to study the oscillatory changes related to the forced termination of a single complex motor program (signature) and compare them with those observed after the normal termination of the movement. Methods: Fifty-eight reference-free EEG channels were analyzed in 10 healthy subjects. A 2000 Hz tone (S1, go signal) indicated the sub- ject to begin to write his/her complete signature. A second 2000 Hz tone 0.8 s afterwards (50% probability: S2, stop signal) indicated the subject to stop immediately. Movement-related energy changes were evaluated by means of time-frequency (Gabor) transforms. Results: A frontal 15 Hz synchronization was observed after S1, but not after S2. The amplitude of the post-movement beta increase was significantly lower when the movement was abnormally terminated (p = 0.005), while the peri-movement decrease was similar. Conclusions: The forced termination of a motor program reduces significantly the amplitude of the post-movement beta increment, con- serving its temporal pattern. Also, the presence of the 15 Hz frontal synchronization only after S1, together with the results of previous studies, suggests that the frontal mechanisms involved in go/no go and stop signals are very different. Significance: Our results indicate that the beta rebound is an active process, independent of the peri-movement beta decrease, which is influenced by how the movement is terminated. Ó 2007 International Federation of Clinical Neurophysiology. Published by Elsevier Ireland Ltd. All rights reserved. Keywords: Frontal lobe; Motor control; Oscillations; Motor inhibition; Event-related synchronization; Event-related desynchronization 1. Introduction Brain oscillations might be a common substrate of the binding mechanisms involved in sensory, motor and cogni- tive processing (Singer, 1993). Voluntary movements are accompanied by changes in oscillatory activity at the corti- cal (Crone et al., 1998) and subcortical levels (Cassidy et al., 2002; Paradiso et al., 2004; Alegre et al., 2005). Some of these changes, like the disappearance of the central mu rhythm during movement, can be observed in the EEG from normal subjects without the use of any further anal- ysis (Gastaut et al., 1954). With the help of different math- ematical tools, a well-defined pattern of alpha (8–12 Hz) and beta (15–30 Hz) cortical oscillatory changes during self-initiated movements has been characterized. In the alpha band, a decrease in energy begins up to 2 s before the movement, and lasts up to 2–3 s after its end (Pfurtsch- eller and Aranibar, 1979; Derambure et al., 1993). In the beta range, a fall in activity which begins more than one second before movement and lasts up to the end of muscle contraction (beta event-related desynchronization, ERD), and a post-movement rebound over baseline level (beta event-related synchronization, ERS), have been thoroughly described (Pfurtscheller, 1981; Derambure et al., 1999). Both the pre-movement beta ERD and the post-movement beta ERS reach maximal values in the contralateral rolan- dic area, although their distribution is quite widespread (Crone et al., 1998). In particular, the post-movement 1388-2457/$32.00 Ó 2007 International Federation of Clinical Neurophysiology. Published by Elsevier Ireland Ltd. All rights reserved. doi:10.1016/j.clinph.2007.10.017 * Corresponding author. Address: Clinical Neurophysiology Section, Department of Neurology, Clı ´nica Universitaria de Navarra, Avda. Pı ´o XII, 36, 31008 Pamplona (Navarra), Spain. Tel.: +34 948 255400; fax: +34 948 296500. E-mail address: [email protected] (J. Artieda). www.elsevier.com/locate/clinph Clinical Neurophysiology 119 (2008) 290–300
-
Upload
independent -
Category
Documents
-
view
3 -
download
0
Transcript of Oscillatory changes related to the forced termination of a movement

www.elsevier.com/locate/clinph
Clinical Neurophysiology 119 (2008) 290–300
Oscillatory changes related to the forced termination of a movement
M. Alegre a,b, I. Alvarez-Gerriko b, M. Valencia a, J. Iriarte a,b, J. Artieda a,b,*
a Neurophysiology Laboratory, Neuroscience Area, CIMA, Universidad de Navarra, Pamplona, Spainb Clinical Neurophysiology Section, Department of Neurology, Clınica Universitaria de Navarra, Avda. Pıo XII, 36, 31008 Pamplona (Navarra), Spain
Accepted 18 October 2007
Abstract
Objective: Stimulus-induced movements are accompanied by a definite pattern of oscillatory changes, that include a frontal 15 Hz syn-chronization, a central peri-movement desynchronization, and a contralateral beta rebound after the movement. Our aim was to studythe oscillatory changes related to the forced termination of a single complex motor program (signature) and compare them with thoseobserved after the normal termination of the movement.Methods: Fifty-eight reference-free EEG channels were analyzed in 10 healthy subjects. A 2000 Hz tone (S1, go signal) indicated the sub-ject to begin to write his/her complete signature. A second 2000 Hz tone 0.8 s afterwards (50% probability: S2, stop signal) indicated thesubject to stop immediately. Movement-related energy changes were evaluated by means of time-frequency (Gabor) transforms.Results: A frontal 15 Hz synchronization was observed after S1, but not after S2. The amplitude of the post-movement beta increase wassignificantly lower when the movement was abnormally terminated (p = 0.005), while the peri-movement decrease was similar.Conclusions: The forced termination of a motor program reduces significantly the amplitude of the post-movement beta increment, con-serving its temporal pattern. Also, the presence of the 15 Hz frontal synchronization only after S1, together with the results of previousstudies, suggests that the frontal mechanisms involved in go/no go and stop signals are very different.Significance: Our results indicate that the beta rebound is an active process, independent of the peri-movement beta decrease, which isinfluenced by how the movement is terminated.� 2007 International Federation of Clinical Neurophysiology. Published by Elsevier Ireland Ltd. All rights reserved.
Keywords: Frontal lobe; Motor control; Oscillations; Motor inhibition; Event-related synchronization; Event-related desynchronization
1. Introduction
Brain oscillations might be a common substrate of thebinding mechanisms involved in sensory, motor and cogni-tive processing (Singer, 1993). Voluntary movements areaccompanied by changes in oscillatory activity at the corti-cal (Crone et al., 1998) and subcortical levels (Cassidyet al., 2002; Paradiso et al., 2004; Alegre et al., 2005). Someof these changes, like the disappearance of the central murhythm during movement, can be observed in the EEGfrom normal subjects without the use of any further anal-
1388-2457/$32.00 � 2007 International Federation of Clinical Neurophysiolo
doi:10.1016/j.clinph.2007.10.017
* Corresponding author. Address: Clinical Neurophysiology Section,Department of Neurology, Clınica Universitaria de Navarra, Avda. PıoXII, 36, 31008 Pamplona (Navarra), Spain. Tel.: +34 948 255400; fax: +34948 296500.
E-mail address: [email protected] (J. Artieda).
ysis (Gastaut et al., 1954). With the help of different math-ematical tools, a well-defined pattern of alpha (8–12 Hz)and beta (15–30 Hz) cortical oscillatory changes duringself-initiated movements has been characterized. In thealpha band, a decrease in energy begins up to 2 s beforethe movement, and lasts up to 2–3 s after its end (Pfurtsch-eller and Aranibar, 1979; Derambure et al., 1993). In thebeta range, a fall in activity which begins more than onesecond before movement and lasts up to the end of musclecontraction (beta event-related desynchronization, ERD),and a post-movement rebound over baseline level (betaevent-related synchronization, ERS), have been thoroughlydescribed (Pfurtscheller, 1981; Derambure et al., 1999).Both the pre-movement beta ERD and the post-movementbeta ERS reach maximal values in the contralateral rolan-dic area, although their distribution is quite widespread(Crone et al., 1998). In particular, the post-movement
gy. Published by Elsevier Ireland Ltd. All rights reserved.

M. Alegre et al. / Clinical Neurophysiology 119 (2008) 290–300 291
ERS is present not only in precentral and postcentral areas,but even prefrontal, frontal midline and temporal regions(Ohara et al., 2000; Szurhaj et al., 2003; Rektor et al.,2006).
Stimulus-induced movements have a similar pattern ofoscillatory changes, but the beta ERD in these paradigmsbegins after the stimulus, unless it is rhythmic and thereforepredictable (Alegre et al., 2003). In this case (rhythmicstimuli), the ERD begins before the stimulus, and is similarto that observed in self-initiated movements.
Go/no go paradigms and stop signal paradigms are usu-ally employed to study motor inhibition. Go/no go para-digms are series of stimulus-induced movements, in whichthe subject decides to move or not depending on the char-acteristics of the stimulus. (Lai et al., 1997). In stop signalparadigms, a go signal is followed in a percentage of thecases by a stop signal that indicates the subject to abortthe response.
ERD/ERS changes in different go/no go paradigmshave been addressed in several studies (Leocani et al.,2001; Filipovic et al., 2001). In a series of recent papers,our group described the appearance of a frontal 15 Hzenergy increase after the stimulus that makes the subjectdecide whether to move or not (Alegre et al., 2004b) orwhich movement to perform (Alegre et al., 2006).
Oscillatory changes during stop signal paradigms havenot been addressed, to our knowledge. Our aim was tostudy the oscillatory changes related to the forced termina-tion of a movement and compare them with those observedafter a normal termination, focusing on two oscillatoryphenomena: the 15 Hz frontal peak and the post-move-ment beta rebound. The presence or absence of the 15 Hzfrontal peak after the stop signal may help to clarify itsmeaning and its potential relationship with the frontal pro-cesses involved in go/no go and stop signal paradigms.Regarding the beta ERS, there is still some debate onwhether it is mainly motor or sensitive in nature, and aboutits physiological meaning. The study of the influence of theforced termination of a movement on its amplitude mayhelp to clarify this discussion. We chose the signature asmovement, as signing is a well-learned automatic complexsequence of movements (Merton, 1972).
2. Subjects and methods
2.1. Signal recording
A total of 10 right-handed healthy volunteers (3 men, 7women) with an age range between 26 and 34 years partic-ipated in the study. All of them gave their written consentafter a detailed explanation of the procedure. The protocolwas approved by the Institutional Ethics Committee.
The subjects were comfortably sat in a dimly-lit sound-attenuated room with eyes opened. A standard electrodecap with 58 surface electrodes placed according to the10–10 system was used for the recordings (ElectroCapIntl.). All impedances were systematically kept below
8 kX. Both linked earlobes were used as initial reference.Current source density (reference-free) values wereobtained for each electrode afterwards using the sphericalLaplacian algorithm implemented in the BrainVision Ana-lyser software. Three bipolar EMG channels in the rightlimb (extensor digitorum, opponens pollicis, flexor digito-rum) were simultaneously recorded. These channelsshowed activity throughout the duration of the signature,and the surface electrodes did not interfere with pen grasp-ing. EEG channels were amplified ·20,000 and digitised at500 Hz using BrainVision Recorder software, with low-pass and high pass filters set at 100 and 0.3 Hz, respec-tively. After downsampling data to 200 Hz to reduce com-puting time, all channels were stored for offline analysis.
2.2. Description of the stimulation paradigm
Sequences of 70 ms, 90 dB tone bursts were generated bymeans of the Neuroscan Stim module synchronized withthe recording equipment, and delivered by means of bilat-eral intracanalicular earphones.
The subjects were instructed to begin to sign their nameson a sheet of paper immediately after hearing a 2000 Hztone (S1). A second 2000 Hz tone (S2) could appear800 ms after S1 with a 50% probability, indicating the sub-ject to stop the signature. The 800 ms interval was chosenbasing on a series of preliminary tests measuring reactiontimes (RT), movement (signature) times (MT) and stop sig-nal reaction times (SSRT) in a series of subjects, in order tominimize the number of incorrect trials (see below). Theinterval between S1 stimuli was randomized between 11.5and 13.5 s.
2.3. Signal processing
An initial offline segmentation was performed on thecontinuously recorded data, using S1 stimuli as triggerand the presence or absence of S2 as classifier. Ten-secondsweeps were obtained, from 4 s before to 6 s after S1. Allsweeps were visually reviewed, and those with visible arte-facts or incorrect executions were manually rejected. Thecriteria for rejection due to incorrect execution were: noinitiation of the signature 800 ms after S1 (S1 unattended)or full completion of the signature despite the presence ofS2 (S2 unattended). Reaction times were measured bothfor the beginning of the movement (RT) and for theforced termination (in the stop condition; named stop sig-nal reaction time or SSRT). The minimal number of arte-fact-free trials per subject and condition was 70 (maximal:114).
An additional manual offline segmentation was per-formed, using the end of the movement (measured by theEMG signal) as trigger. Eleven-second sweeps wereobtained, from 5.5 s before to 5.5 s after the trigger (endof the movement). As in the initial segmentation, S2 wasused to classify the sweeps, and those with visible artefactsor incorrect executions were manually rejected.
292 M. Alegre et al. / Clinical Neurophysiology 119 (2008) 290–300
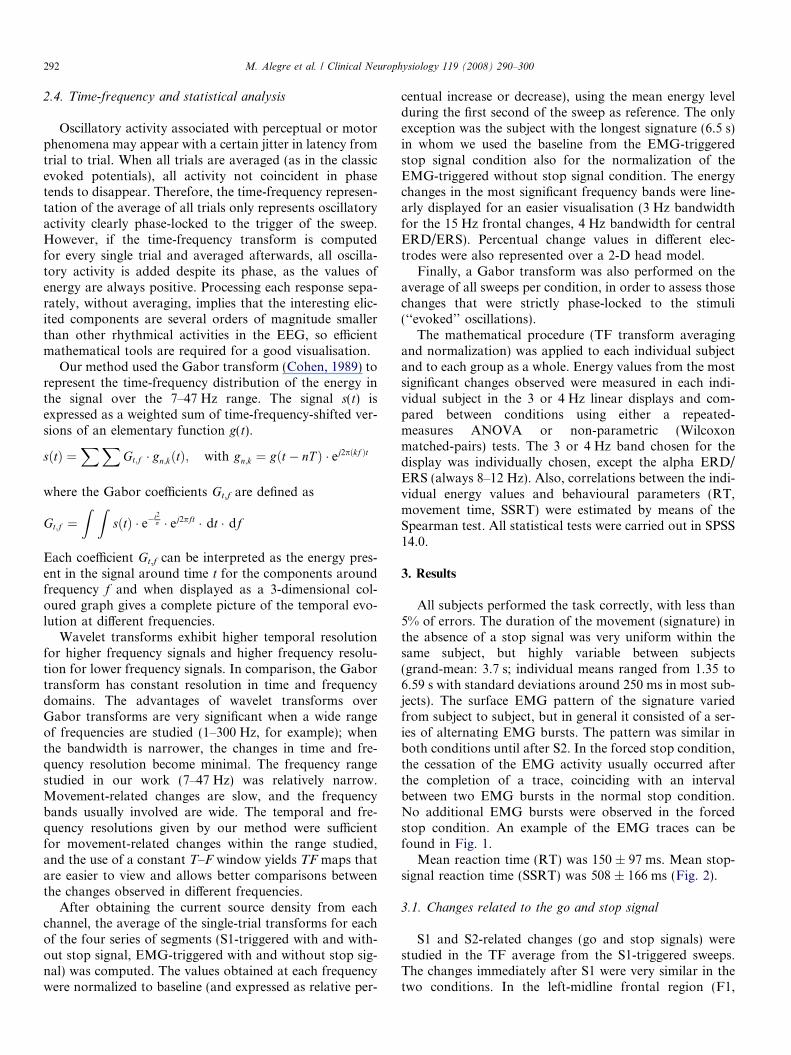
2.4. Time-frequency and statistical analysis
Oscillatory activity associated with perceptual or motorphenomena may appear with a certain jitter in latency fromtrial to trial. When all trials are averaged (as in the classicevoked potentials), all activity not coincident in phasetends to disappear. Therefore, the time-frequency represen-tation of the average of all trials only represents oscillatoryactivity clearly phase-locked to the trigger of the sweep.However, if the time-frequency transform is computedfor every single trial and averaged afterwards, all oscilla-tory activity is added despite its phase, as the values ofenergy are always positive. Processing each response sepa-rately, without averaging, implies that the interesting elic-ited components are several orders of magnitude smallerthan other rhythmical activities in the EEG, so efficientmathematical tools are required for a good visualisation.
Our method used the Gabor transform (Cohen, 1989) torepresent the time-frequency distribution of the energy inthe signal over the 7–47 Hz range. The signal s(t) isexpressed as a weighted sum of time-frequency-shifted ver-sions of an elementary function g(t).
sðtÞ ¼XX
Gt;f � gn;kðtÞ; with gn;k ¼ gðt � nT Þ � ej2pðkf Þt
where the Gabor coefficients Gt,f are defined as
Gt;f ¼Z Z
sðtÞ � e�t2r � ej2pft � dt � df
Each coefficient Gt,f can be interpreted as the energy pres-ent in the signal around time t for the components aroundfrequency f and when displayed as a 3-dimensional col-oured graph gives a complete picture of the temporal evo-lution at different frequencies.
Wavelet transforms exhibit higher temporal resolutionfor higher frequency signals and higher frequency resolu-tion for lower frequency signals. In comparison, the Gabortransform has constant resolution in time and frequencydomains. The advantages of wavelet transforms overGabor transforms are very significant when a wide rangeof frequencies are studied (1–300 Hz, for example); whenthe bandwidth is narrower, the changes in time and fre-quency resolution become minimal. The frequency rangestudied in our work (7–47 Hz) was relatively narrow.Movement-related changes are slow, and the frequencybands usually involved are wide. The temporal and fre-quency resolutions given by our method were sufficientfor movement-related changes within the range studied,and the use of a constant T–F window yields TF maps thatare easier to view and allows better comparisons betweenthe changes observed in different frequencies.
After obtaining the current source density from eachchannel, the average of the single-trial transforms for eachof the four series of segments (S1-triggered with and with-out stop signal, EMG-triggered with and without stop sig-nal) was computed. The values obtained at each frequencywere normalized to baseline (and expressed as relative per-
centual increase or decrease), using the mean energy levelduring the first second of the sweep as reference. The onlyexception was the subject with the longest signature (6.5 s)in whom we used the baseline from the EMG-triggeredstop signal condition also for the normalization of theEMG-triggered without stop signal condition. The energychanges in the most significant frequency bands were line-arly displayed for an easier visualisation (3 Hz bandwidthfor the 15 Hz frontal changes, 4 Hz bandwidth for centralERD/ERS). Percentual change values in different elec-trodes were also represented over a 2-D head model.
Finally, a Gabor transform was also performed on theaverage of all sweeps per condition, in order to assess thosechanges that were strictly phase-locked to the stimuli(‘‘evoked’’ oscillations).
The mathematical procedure (TF transform averagingand normalization) was applied to each individual subjectand to each group as a whole. Energy values from the mostsignificant changes observed were measured in each indi-vidual subject in the 3 or 4 Hz linear displays and com-pared between conditions using either a repeated-measures ANOVA or non-parametric (Wilcoxonmatched-pairs) tests. The 3 or 4 Hz band chosen for thedisplay was individually chosen, except the alpha ERD/ERS (always 8–12 Hz). Also, correlations between the indi-vidual energy values and behavioural parameters (RT,movement time, SSRT) were estimated by means of theSpearman test. All statistical tests were carried out in SPSS14.0.
3. Results
All subjects performed the task correctly, with less than5% of errors. The duration of the movement (signature) inthe absence of a stop signal was very uniform within thesame subject, but highly variable between subjects(grand-mean: 3.7 s; individual means ranged from 1.35 to6.59 s with standard deviations around 250 ms in most sub-jects). The surface EMG pattern of the signature variedfrom subject to subject, but in general it consisted of a ser-ies of alternating EMG bursts. The pattern was similar inboth conditions until after S2. In the forced stop condition,the cessation of the EMG activity usually occurred afterthe completion of a trace, coinciding with an intervalbetween two EMG bursts in the normal stop condition.No additional EMG bursts were observed in the forcedstop condition. An example of the EMG traces can befound in Fig. 1.
Mean reaction time (RT) was 150 ± 97 ms. Mean stop-signal reaction time (SSRT) was 508 ± 166 ms (Fig. 2).
3.1. Changes related to the go and stop signal
S1 and S2-related changes (go and stop signals) werestudied in the TF average from the S1-triggered sweeps.The changes immediately after S1 were very similar in thetwo conditions. In the left-midline frontal region (F1,

Fig. 1. Averaged rectified EMG traces from a representative subject in both conditions (normal termination (bottom) and forced termination (top)). Eachof the three muscles recorded (opponens pollicis, wrist flexors and wrist extensors) is in the same scale in both conditions. The sweeps are triggered with S1.Both stimuli (S1 and S2) are indicated with vertical arrows.
M. Alegre et al. / Clinical Neurophysiology 119 (2008) 290–300 293
Fz), a marked ERS was observed after S1, partially over-lapping with the central ERD/ERS, around 15 Hz. Thisfrontal ERS peaked around 600 ms after S1 (individualrange between 500 and 870 ms), and lasted until more than1 s after S1 (Fig. 3). The ERS was clearly present in six outof the ten subjects individually considered, as well as in thegrand average. The remaining four subjects showed little orno changes around 15 Hz. There were no differences in theamplitude of the ERS or in the peak latency values betweenthe two conditions (Fig. 4). The interindividual variability
Fig. 2. (Left) Reaction times from the whole group of 10 subjects, including bo10 subjects (only forced termination paradigm).
in the frequency of this ERS was very narrow, between12 and 16 Hz.
A desynchronization of alpha and beta activity couldalso be observed after S1 in the left central region. In theabsence of a stop signal, this desynchronization lasted untilthe end of the movement; then it was followed by an earlyhigh-energy post-movement beta ERS and a later andsmaller alpha ERS. In the stop condition, the ERD finishedshortly after the stop signal, being followed in most casesby an ERS, but with lower energy. This difference was bet-
th conditions. (Right) Stop-signal reaction times from the whole group of

Fig. 3. Stimulus-related frontal energy changes (electrode F1) in both conditions. The colour graph is the normalized grand-average of all the single-sweeptime-frequency transforms. The colour scale represents the percentage of increase or decrease of the energy values in the 7–47 Hz range. The sweeps weretriggered by S1 (first sound, indicating the subject to begin to sign, time = 0). In the first condition (normal termination, top graph) there was no S2. In thesecond condition (forced termination, bottom graph) a second sound (S2, time = 0.8 s) indicated the subject to terminate the signature. A frontal energyincrease around 15 Hz can be observed in both plots 600 ms after S1. No additional changes after S2 were found in that frequency range. Thetopographical distribution of the 15 Hz frontal peak, coincident with a central ERD (right), was similar in both conditions. The white square indicates thetime-frequency window selected for the topographic representation.
294 M. Alegre et al. / Clinical Neurophysiology 119 (2008) 290–300
ter appreciated in the TF plots obtained from the sweepstriggered by the end of the movement (see below).
There were no definite changes in the frontal region afterS2; only an extension of the central changes (but with lowerenergy changes) could be observed. Specifically, no 15 HzERS was present after S2 (Figs. 3 and 4).
In the lower limit of the graphs (7–8 Hz), a small energyincrease could be observed immediately after S1 and S2 in
Fig. 4. Linear representation of the energy changes in the 13–18 Hz rangein F1 electrode, in both conditions. The vertical dotted lines indicate thetiming of S1 (in both conditions) and S2 (only in the forced terminationcondition). The horizontal dotted line indicates baseline energy levels(100%). A similar pattern of S1-related changes can be observed in bothplots.
all conditions. This increase was coincident with the mid-latency auditory evoked potential, and was also presentwith the same frequency and timing when the time-fre-quency plot of the averaged signal (measuring phase-locked energy changes) was computed.
3.2. Changes related to the termination of the movement
The oscillatory changes related to the spontaneous andforced termination of the movement were compared inthe TF averages from the sweeps triggered by the end ofthe movement (EMG signal).
After the normally-terminated movements (Fig. 5, top),a marked energy increase (ERS) in the beta band wasobserved in all subjects with maximum values in the con-tralateral central region (mean: 246 ± 77%, see Table 1),as typically described. In the alpha band, the ERS wassmaller (mean: 181 ± 90%) and later.
After the stimulus-induced forced termination of the sig-nature (Fig. 5, bottom), the beta-ERS was minimally pres-ent or absent in half of the subjects, and in the remainingones it was smaller than after the normal termination ofthe movement.
The energy difference between both conditions followedthe topographical distribution of the beta ERS; it was high-est in the contralateral central area, while in the ipsilateralcentral region it was nearly absent (Fig. 6 and Table 1). Asa consequence, the temporal evolution and the topograph-

Fig. 5. Central energy changes related to the end of the movement in both conditions. The colour graph is the normalized grand-average of all the single-sweep time-frequency transforms. The colour scale represents the percentage of increase or decrease of the energy values in the 7–47 Hz range. The sweepswere triggered by the end of the movement, determined by the EMG signal. The post-movement ERS was much higher when the movement was normallyterminated than when the termination was forced by S2. The topographical distribution (right) was similar despite the differences in energy levels. Thewhite square indicates the time-frequency window selected for the topographic representation.
M. Alegre et al. / Clinical Neurophysiology 119 (2008) 290–300 295
ical distribution (electrodes in which it was observed) of thepost-movement beta ERS were similar in both conditions(when present) despite the differences in maximalenergy (Fig. 5, right). Minimum beta-ERD values, on theother hand, were similar in both conditions (Fig. 6 andTable 1).
In the alpha band, the results were similar, although thedifferences in the energy of the post-movement ERS weresmaller.
A three factor (condition, side, band) repeated-measuresANOVA confirmed the statistical significance of theseresults. In the analysis of maximal post-movement ERSvalues, significant condition (normal versus forced;F = 16.92, p = 0.003) and side effects (F = 14.878,p = 0.002) were found. Contralateral ERS was significantly
Table 1Means and standard deviations (in brackets) of the maximal peri-movement aside, midline, and ipsilateral side
Normal termination
Contra Midline
Minimal alpha ERD 0.47 0.57(0.21) (0.19)
Maximal alpha ERS 1.82 1.29(0.9) (0.33)
Minimal beta ERD 0.41 0.44(0.15) (0.13)
Maximal beta ERS 2.46 1.49(0.77) (0.46)
The values are in relative values with respect to baseline (1). The statistical si
higher than midline or ipsilateral ERS (p = 0.003 in bothcases; midline vs ipsilateral p = 0.074). No significant band
(alpha versus beta) effect was found (just a trend, p = 0.1),suggesting that the differences between conditions and sideshad similar characteristics in both bands. A significant con-
dition · side effect was also found (F = 6.14, p = 0.009),confirming that the differences between conditions weremostly observed in the contralateral region. The minimalERD ANOVA showed no condition or band effects. A sig-nificant side effect was found (F = 6.65; p = 0.007), withsignificantly lower ERD values in both ipsilateral and con-tralateral sides than in the midline.
Table 1 shows the mean and standard deviation of thealpha and beta ERD and ERS in each condition. Fig. 5shows the normalized grand average of the TF transforms
lpha and beta oscillatory changes in both conditions, in the contralateral
Forced termination
Ipsi Contra Midline Ipsi
0.46 0.45 0.61 0.51(0.18) (0.22) (0.17) (0.19)
1.24 1.32 1.11 1.01(0.11) (0.33) (0.25) (0.19)
0.41 0.37 0.48 0.44(0.16) (0.16) (0.12) (0.1)
1.31 1.7 1.36 1.21(0.43) (0.65) (0.34) (0.31)
gnificance of the results is discussed in the main text.

Fig. 6. Linear representation of the energy changes in the 22–26 Hz range in C3, Cz and C4 electrodes, in both conditions (grand-average of all subjects).The vertical dotted line indicates the end of the movement (trigger of the sweeps). The horizontal dotted line indicates baseline energy levels (100%). Amuch higher post-movement energy increase is observed in C3 when the movement is normally terminated, although the temporal pattern of the changes issimilar in both conditions.
296 M. Alegre et al. / Clinical Neurophysiology 119 (2008) 290–300
from the sweeps triggered by the end of the movement, inboth conditions in C3: Fig. 6 shows a linear display ofthe beta changes in C3, Cz and C4 electrodes.
Fig. 7. Central energy changes in a single subject with a short signature (right) ithe single-sweep time-frequency transforms. The colour scale represents the peThe linear plots below the colour graphs are averages of the rectified EMG. Thdifference in movement times between both conditions was below 200 ms), theterminated than when the termination was forced by S2.
Fig. 7 shows the normalized average of the TF trans-forms triggered by S1 from subject 2, who had one of theshortest signatures. The difference in duration between
n both conditions. The colour graph is the normalized grand-average of allrcentage of increase or decrease of the energy values in the 7–47 Hz range.e sweeps were triggered by S1 (time 0). Despite the similar time course (thepost-movement ERS was much higher when the movement was normally

Fig. 8. Linear representation of the energy changes in the 22–26 Hz rangein C3 electrode, in both conditions in the same subject from the previousfigure. Time 0 indicates S1. The horizontal dotted line indicates baselineenergy levels (100%). A much higher post-movement energy increase isobserved when the movement is normally terminated, although thetemporal pattern of the changes is very similar in both conditions.
M. Alegre et al. / Clinical Neurophysiology 119 (2008) 290–300 297
the normally and the forcedly terminated movements,although significant, was minimal (just the last trace; move-ment times were 1.35 ± 0.16 s and 1.11 ± 0.12 s, respec-tively; p < 0.001), allowing the direct comparison of thepost-movement changes despite the triggering with S1.The beta ERD pattern was nearly identical in both condi-tions. However, the energy of the post-movement beta ERSwas markedly lower after the forced termination (Fig. 8shows a linear display).
The difference in the beta ERS between both conditionsdid not correlate with the RT, SSRT, or duration of themovement.
4. Discussion
The main findings in our study can be summarized intwo aspects: The frontal ERS at 15 Hz in F1 and Fz, pres-ent after S1 but was not present after S2, and the loweramplitude of the post-movement beta ERS after the forcedtermination of the signature. No other specific changesrelated to the stop signal were found. These aspects willbe discussed separately later.
4.1. Why signing?
We chose the signature as movement paradigm becauseit is a very well-automated movement, despite the complexsequence of muscle activity involved. The high automationavoids learning effects that could confound the results andminimizes the need for visual feedback.
Signing has been used as movement paradigm in at leastone fMRI (Hamzei et al., 2002) and several neurophysio-logical studies (Schreiber et al., 1983; Nashmi et al.,1994), usually in comparison to other less automatedmovements. The study by Nashmi et al. found no relevant30–50 Hz peri-movement activity increases during signing,as opposed to other movement paradigms requiring more
attention. To our knowledge, there are no studies on thealpha and beta changes specifically related to signing; Rek-tor et al. (2006) studied alpha and beta changes and fMRIactivations during different letter writing tasks, observingan extension of the alpha and beta ERD to frontal andtemporal areas mostly when the task posed an increaseddemand on executory functions.
4.2. Changes after S1 but not after S2
After S1, a frontal ERS with maximum at 15 Hz couldbe observed in the two conditions (Figs. 2 and 3). ThisERS was clearly present in six subjects in Fz and F1, andwas not preceded by any ERD. No similar activity was seenafter S2.
Although the maximum of this ERS was around 600 msafter S1, it began immediately after the stimulus. The fron-tal ERS overlapped partially with the central ERD, so asimultaneous central ERD and frontal ERS could beobserved around 500 ms after S1.
A similar 15 Hz frontal activity had been described inprevious works by our group in choice and go/no go para-digms (Alegre et al., 2004a, 2006).
In a recent fMRI study in a go/no go paradigm, anincrease of activity in the anterior cingulate cortex wasfound in both conditions (Liddle et al., 2001). This areahas been proposed as an interface between cognition andmotor action, given its connectivity (Paus, 2001). Activityin this area in both conditions of go/no go paradigms hasalso been detected in electrocorticographic recordings (Ike-da et al., 1996). The topography of the 15 Hz activity foundin our study is compatible with an origin in this area. Itmust be noted though that midline surface recordings havea poor localization capability. The activity observed mightalso have originated in other areas, as the SMA or prefron-tal mesial cortex, or even in the convexity. Deep recordingsfrom midline structures would be necessary to clarify theorigin of this activity.
Despite a careful analysis, we did not find any S2 (stopsignal)-related oscillatory change within the frequencyrange studied. The probable association of the right infe-rior frontal cortex with response inhibition (Aron andPoldrack, 2006) is not therefore reflected as changes inoscillatory activity within the range included in our study.On the other hand, as commented above, a 15 Hz ERS hasbeen described both after go and no go signals in go/no goparadigms. The combination of these two findings suggeststhat the processes involved in no-go tasks are different fromthose involved in stopping already initiated responses.
4.3. Differences in the post-movement beta ERS
The post-movement beta ERS, an energy increase in thebeta band observed after the end of a movement, is one ofthe most significant movement-related changes in corticaloscillatory activity. The ‘‘motor’’ or ‘‘sensory’’ nature ofthe post-movement ERS is still under discussion. Alpha

298 M. Alegre et al. / Clinical Neurophysiology 119 (2008) 290–300
and beta ERS have classically been considered as an indi-cation of an ‘‘idling’’ or inactive area (Pfurtscheller, 1992;Pfurtscheller et al., 1996; Chen et al., 1999; Leocaniet al., 2001). The post-movement ERS has therefore beenrelated to the closure of the motor process, or the returnto an ‘‘idling’’ state of the motor cortex. These hypothesesare supported by topographical studies that locate the max-imal values of the beta ERS over motor areas, and by thefinding of a reduced motor cortex excitability during theERS time course (Chen et al., 1998; Hummel and Gerloff,2006). In a sequence of movements, the ERS only appearsafter the last one of them even if more than one motor pro-gram is involved, suggesting a relationship with processesrelated to the end of the whole motor sequence (Alegreet al., 2004a).
Nevertheless, other evidences have raised doubts onthese ideas. Passive movements are also followed by a betaERS, similar to the ERS observed after voluntary move-ments (Cassim et al., 2001; Alegre et al., 2002). A betaERS can also be obtained over the contralateral somato-sensory cortex when a mechanical or electrical stimulus ispresented to the upper limb, even in the absence of move-ment (Houdayer et al., 2006). Also, some studies usingdeep electrodes have described that the topographical dis-tribution of the post-movement ERS is quite widespread(Crone et al., 1998), including not only precentral and post-central areas but even prefrontal, frontal midline and tem-poral regions (Ohara et al., 2000; Szurhaj et al., 2003;Rektor et al., 2006).
A recent study combining fMRI and EEG found a cor-relation between the amplitude of the post-movement betaERS and the somatosensory cortex bold signal (maximal inthe postcentral cortex), suggesting that motor activity, orsomatosensory inputs related to that motor activity, doindeed influence the post-movement beta ERS (Parkeset al., 2006). Other parameters, such as the inter-movementinterval, also may influence the amplitude of the beta ERS(Wu et al., 2006).
Our results indicate, on one hand, that the movement-related beta ERD and the post-movement beta reboundare independent phenomena, as a similar ERD amplitudewas found in both conditions despite the big differencesin post-movement ERS. Classically, both phenomena hadbeen related to each other, as the baseline level may influ-ence the amplitude of the ERD and the ERS (Pfurtscheller,1992). Baseline levels (which can be measured in the aver-age of the TF plots before normalization) were equal inboth conditions; moreover, the differences in the energyof the post-movement ERS were clearly visible before nor-malizing the plots. The independence of the peri-movementERD and the post-movement ERS is also supported by thedifferent peak frequencies described for both phenomena.Muller-Putz et al. (2007) found lower peak frequencies(around 4 Hz) for the beta ERS when compared with theERD induced by foot movements. A similar differencewas observed in some of our subjects (Fig. 6 shows anexample: the frequency band in which the beta ERD is
maximal (24–28 Hz) is 2 Hz higher than the band withthe maximal ERS (22–26 Hz)).
Our results also show that the post-movement ERS isconditioned by how the movement is finished, as the valueswere significantly higher when the movement was ‘‘nor-mally’’ terminated. There are several possible explanationsfor this finding that should be explored in future studies.After the stop signal, despite the cessation of the muscularactivity, an enhanced cortical excitability may remain dueto the fact that the motor program has not been fully com-pleted. The result would be similar to the suppression ofthe post-movement beta ERS described during sensorimo-tor activation (Pfurtscheller et al., 2002; Jarvelainen et al.,2004). A second hypothesis, related to the first one, wouldbe to consider that stopping the movement may be a realmotor task associated with cortical activation. Therefore,in the forced termination condition there would be a sum-mation of the usual post-movement ERS and a stop-relatedbeta ERD. However, this stop-related beta ERD should befollowed by a later ERS, which was not observed withinthe timeframe studied. A third alternative, more specula-tive, could also be considered. When a movement is per-formed, a comparison between the ‘‘planned’’ movement(‘‘efferent’’ copy or ‘‘corollary discharge’’) and the actually‘‘executed’’ movement (‘‘afferent’’ copy) is constantly exe-cuted. If the movement is not fully performed, there is amismatch between both copies of the motor information.It could be hypothesised that the beta ERS is enhancedby the coincidence of the afferent and the efferent copiesof the motor program (due to a coincident afferent volley),and therefore it is significantly reduced when they are mis-matched. This hypothesis, that includes both ‘‘motor’’ and‘‘sensory’’ influence in the beta ERS, may explain some ofthe apparently discrepant studies performed. However, abeta ERS is observed both after a passive movement, ascommented above, with no ‘‘efferent’’ copy (Cassimet al., 2001; Alegre et al., 2002) and after motor imagery(in which there is no ‘‘afferent’’ copy) (Pfurtscheller et al.,2005).
Several other factors might influence the amplitude ofthe post-movement ERS (and therefore confound theresults of the study). As commented above, a recent worksuggested that the amplitude of the beta ERS might dependon the inter-movement interval (Wu et al., 2006). In ourstudy, the intervals between the beginning of each move-ment were not different in both conditions. It is evident thatthe interval between the end of a completed signature andthe beginning of the next one was shorter than the intervalbetween an interrupted signature and the next one, but therandomization of the series ensured that this effect affectedboth conditions equally.
Signature duration (movement time) was different ineach subject, while the S1–S2 interval was constant(0.8 s). Also, movement times were logically longer in nor-mally-terminated movements. However, two findings sug-gest that these differences did not affect the results of thestudy. On one hand, the lack of correlation between move-

M. Alegre et al. / Clinical Neurophysiology 119 (2008) 290–300 299
ment times and ERS values suggests that the ERS was notinfluenced by the movement time ‘‘per se’’. On the otherhand, although the subjects were in different stages of theirsignature at S2, all of them showed a higher beta ERS inthe ‘‘normal termination’’ condition. Although eye move-ments were not specifically controlled, any potential influ-ence of visual tracking on the results can also beexcluded because the beta ERS analysis was limited tothe time period after the end of the movement, in whichthere is no more tracking in any condition, and any poten-tial relationship between tracking time (equal to movementtime) and ERS amplitude is discarded by the reasonsexplained above.
The recording of a continuous signal allowed us the useof two different triggers for the offline segmentation of thesweeps (S1, and the end of the movement determined bythe EMG traces). The use of the end of the movement asa trigger ensured that the maximal amplitude of the ERSwas obtained in both conditions despite the different move-ment times. The forced termination of the movement wasmore abrupt, so the triggering of the sweeps with theEMG signal was easier in all subjects in that condition, dis-carding any influence of the triggering on the higher ampli-tude found after the normal termination. Also, thedifferences in the amplitude of the ERS could be comparedin the S1-triggered sweeps in the subjects with shorter sig-natures, and they were very similar to those observed inthe sweeps triggered with the end of the EMG burst (seeFig. 8 for an example).
Another possible concern might be the different kine-matics of the forcedly terminated movement and the natu-rally terminated one. The findings in the subject with theshorter signature (Fig. 7) also discard any relevant influ-ence of movement kinematics on the amplitude of theERS. The sweeps in this figure were triggered by S1. Asshown in the EMG traces, the pattern of the EMG burstswas equal in both conditions, but for the last trace in thesignature, which was omitted when the termination wasforced. Despite the high similarity in the EMG (also pres-ent in the two other EMG channels), the difference in theenergy ERS was very marked.
Although amplitude values were very different, the tem-poral pattern and the topographical distribution of thealpha and beta ERS were similar in both conditions. Thisstrongly suggests that the differences observed really repre-sent a lower synchronization in these frequency bands inthe contralateral central region after the movement, andare not due to artefactual or methodological issues.
4.4. Final remarks
In summary, our results show that the peri-movementbeta decrease and the post-movement beta ERS are inde-pendent phenomena, despite their occurrence in a similarfrequency band. The forced termination (before its ‘‘natu-ral’’ closure) of a motor program reduces significantly theamplitude of this beta increment, conserving its temporal
pattern. This finding indicates that it is an active process,related to the termination of the movement, and not justa correlate of inhibition or ‘‘idling’’. Also, the presence ofthe 15 Hz frontal synchronization after the ‘‘go’’ stimulus,but not after the ‘‘stop the ongoing movement’’ one,together with the results from previous studies, suggeststhat the frontal mechanisms involved in go/no go and stopsignals are very different.
Acknowledgement
This study was partially funded by a grant from the‘‘Departamento de Salud, Gobierno de Navarra’’ and bythe ‘‘UTE project CIMA’’.
References
Alegre M, Alonso-Frech F, Rodriguez-Oroz MC, Guridi J, Zamarbide I,Valencia M, et al. Movement-related changes in oscillatory activity inthe human subthalamic nucleus: ipsilateral vs. contralateral move-ments. Eur J Neurosci 2005;22:2315–24.
Alegre M, Gurtubay IG, Labarga A, Iriarte J, Malanda A, Artieda J.Alpha and beta oscillatory changes during stimulus-induced movementparadigms: effect of stimulus predictability. Neuroreport2003;14:381–5.
Alegre M, Gurtubay IG, Labarga A, Iriarte J, Malanda A, Artieda J.Alpha and beta oscillatory activity during a sequence of twomovements. Clin Neurophysiol 2004a;115:124–30.
Alegre M, Gurtubay IG, Labarga A, Iriarte J, Valencia M, Artieda J.Frontal and central oscillatory changes related to different aspects ofthe motor process: a study in go/no-go paradigms. Exp Brain Res2004b;159:14–22.
Alegre M, Labarga A, Gurtubay IG, Iriarte J, Malanda A, Artieda J. BetaEEG changes during passive movements: sensory afferences contributeto the beta event-related desynchronization in humans. Neurosci Lett2002;331:29–32.
Alegre M, Lazaro D, Valencia M, Iriarte J, Artieda J. Imitating versusnon-imitating movements: Differences in frontal electroencephalo-graphic oscillatory activity. Neurosci Lett 2006;398:201–5.
Aron AR, Poldrack RA. Cortical and subcortical contributions to stopsignal response inhibition: role of the subthalamic nucleus. J Neurosci2006;26:2424–33.
Cassidy M, Mazzone P, Oliviero A, Insola A, Tonali P, Di Lazzaro V,et al. Movement-related changes in synchronization in the humanbasal ganglia. Brain 2002;125:1235–46.
Cassim F, Monaca C, Szurhaj W, Bourriez JL, Defebvre L, Derambure P,et al. Does post-movement beta synchronization reflect an idlingmotor cortex? Neuroreport 2001;12:3859–63.
Chen R, Corwell B, Hallett M. Modulation of motor cortex excitabilityby median nerve and digit stimulation. Exp Brain Res1999;129:77–86.
Chen R, Yaseen Z, Cohen LG, Hallett M. Time course of corticospinalexcitability in reaction time and self-paced movements. Ann Neurol1998;44:317–25.
Cohen L. Time-frequency distributions. A review. Proc IEEE1989;77:941–81.
Crone NE, Miglioretti DL, Gordon B, Sieracki JM, Wilson MT, UematsuS, et al. Functional mapping of human sensorimotor cortex withelectrocorticographic spectral analysis. I. Alpha and beta event-relateddesynchronization. Brain 1998;121:2271–99.
Derambure P, Defebvre L, Bourriez JL, Cassim F, Guieu JD. Desyn-chronisation et synchronisation liees a l’evenement. Etude de lareactivite des rythmes electrocorticaux en relation avec la planificationet l’execution du mouvement volontaire. Neurophysiol Clin1999;29:53–70.

300 M. Alegre et al. / Clinical Neurophysiology 119 (2008) 290–300
Derambure P, Dujardin K, Defebvre L, Bourriez JL, Jacquesson JM,Guieu JD. Etude spatiotemporelle des desynchronisations liees al’evenement au cours d’une activite motrice autocommandee. Neuro-physiol Clin 1993;23:337–51.
Filipovic SR, Jahanshahi M, Rothwell JC. Uncoupling of contingentnegative variation and alpha band event-related desynchronization in ago/no-go task. Clin Neurophysiol 2001;112:1307–15.
Gastaut H, Dongier M, Courtois G. On the significance of ‘‘wicketrythms’’ (‘‘rythmes en arceau) in psychosomatic medicine. Electroen-cephalogr Clin Neurophysiol 1954;6:687.
Hamzei F, Dettmers C, Rijntjes M, Glauche V, Kiebel S, Weber B, et al.Visuomotor control within a distributed parieto-frontal network. ExpBrain Res 2002;146:273–81.
Houdayer E, Labyt E, Cassim F, Bourriez JL, Derambure P. Relationshipbetween event-related beta synchronization and afferent inputs:analysis of finger movement and peripheral nerve stimulations. ClinNeurophysiol 2006;117:628–36.
Hummel FC, Gerloff C. Interregional long-range and short-rangesynchrony: a basis for complex sensorimotor processing. Prog BrainRes 2006;159:223–36.
Ikeda A, Luders HO, Collura TF, Burgess RC, Morris HH, Hamano T,et al. Subdural potentials at orbitofrontal and mesial prefrontal areasaccompanying anticipation and decision making in humans: a com-parison with Bereitschaftspotential. Electroencephalogr Clin Neuro-physiol 1996;98:206–12.
Jarvelainen J, Schurmann M, Hari R. Activation of the human primarymotor cortex during observation of tool use. Neuroimage2004;23:187–92.
Lai C, Ikeda A, Terada K, Nagamine T, Honda M, Xu X, et al. Event-related potentials associated with judgment: comparison of S1- and S2-choice conditions in a contingent negative variation (CNV) paradigm.J Clin Neurophysiol 1997;14:394–405.
Leocani L, Toro C, Zhuang P, Gerloff C, Hallett M. Event-relateddesynchronization in reaction time paradigms: a comparison withevent-related potentials and corticospinal excitability. Clin Neuro-physiol 2001;112:923–30.
Liddle PF, Kiehl KA, Smith AM. Event-related fMRI study of responseinhibition. Hum Brain Mapp 2001;12:100–9.
Merton PA. How we control the contraction of our muscles. Sci Am1972;226:30–7.
Muller-Putz GR, Zimmermann D, Graimann B, Nestinger K, Korisek G,Pfurtscheller G. Event-related beta EEG-changes during passive andattempted foot movements in paraplegic patients. Brain Res2007;1137:84–91.
Nashmi R, Mendonca AJ, MacKay WA. EEG rhythms of the sensori-motor region during hand movements. Electroencephalogr ClinNeurophysiol 1994;91:456–67.
Ohara S, Ikeda A, Kunieda T, Yazawa S, Baba K, Nagamine T,et al. Movement-related change of electrocorticographic activityin human supplementary motor area proper. Brain 2000;123:1203–15.
Paradiso G, Cunic D, Saint-Cyr JA, Hoque T, Lozano AM, Lang AE,et al. Involvement of human thalamus in the preparation of self-pacedmovement. Brain 2004;127:2717–31.
Parkes LM, Bastiaansen MC, Norris DG. Combining EEG and fMRI toinvestigate the post-movement beta rebound. Neuroimage2006;29:685–96.
Paus T. Primate anterior cingulate cortex: where motor control, drive andcognition interface. Nat Rev Neurosci 2001;2:417–24.
Pfurtscheller G. Central beta rhythm during sensorimotor activities inman. Electroencephalogr Clin Neurophysiol 1981;51:253–64.
Pfurtscheller G. Event-related synchronization (ERS): an electrophysio-logical correlate of cortical areas at rest. Electroencephalogr ClinNeurophysiol 1992;83:62–9.
Pfurtscheller G, Aranibar A. Evaluation of event-related desynchroniza-tion (ERD) preceding and following voluntary self-paced movement.Electroencephalogr Clin Neurophysiol 1979;46:138–46.
Pfurtscheller G, Neuper C, Brunner C, Lopes da Silva F. Beta reboundafter different types of motor imagery in man. Neurosci Lett2005;378:156–9.
Pfurtscheller G, Stancak A, Neuper C. Post-movement beta synchroni-zation. A correlate of an idling motor area? Electroencephalogr ClinNeurophysiol 1996;98:281–93.
Pfurtscheller G, Woertz M, Muller G, Wriessnegger S, Pfurtscheller K.Contrasting behavior of beta event-related synchronization andsomatosensory evoked potential after median nerve stimulation duringfinger manipulation in man. Neurosci Lett 2002;323:113–6.
Rektor I, Sochurkova D, Bockova M. Intracerebral ERD/ERS involuntary movement and in cognitive visuomotor task. Prog BrainRes 2006;159:311–30.
Schreiber H, Lang M, Lang W, Kornhuber A, Heise B, Keidel M,et al. Frontal hemispheric differences in the Bereitschaftspotentialassociated with writing and drawing. Hum Neurobiol 1983;2:197–202.
Singer W. Synchronization of cortical activity and its putative role ininformation processing and learning. Annu Rev Physiol1993;55:349–74.
Szurhaj W, Derambure P, Labyt E, Cassim F, Bourriez JL, Isnard J, et al.Basic mechanisms of central rhythms reactivity to preparation andexecution of a voluntary movement: a stereoelectroencephalographicstudy. Clin Neurophysiol 2003;114:107–19.
Wu YZ, Niddam DM, Chen CC, Liao KK, Cheng CM, Chen LF, et al.Effects of cognitive demands on postmovement motor cortical deac-tivation. Neuroreport 2006;17:371–5.