premature termination codon readthrough
294
PREMATURE TERMINATION CODON READTHROUGH RESTORES PROGRANULIN EXPRESSION IN PRECLINICAL MODELS OF FRONTOTEMPORAL DEMENTIA AND NEURONAL CEROID LIPOFUSCINOSIS by Jonathan Frew B.Sc., The University of British Columbia, 2016 A THESIS SUBMITTED IN PARTIAL FULFILLMENT OF THE REQUIREMENTS FOR THE DEGREE OF DOCTOR OF PHILOSOPHY in THE FACULTY OF GRADUATE AND POSTDOCTORAL STUDIES (Experimental Medicine) UNIVERSITY OF BRITISH COLUMBIA (Vancouver) April 2021 © Jonathan Frew, 2021
-
Upload
khangminh22 -
Category
Documents
-
view
1 -
download
0
Transcript of premature termination codon readthrough

PREMATURE TERMINATION CODON READTHROUGH
RESTORES PROGRANULIN EXPRESSION IN PRECLINICAL
MODELS OF FRONTOTEMPORAL DEMENTIA AND
NEURONAL CEROID LIPOFUSCINOSIS
by
Jonathan Frew
B.Sc., The University of British Columbia, 2016
A THESIS SUBMITTED IN PARTIAL FULFILLMENT OF THE
REQUIREMENTS FOR THE DEGREE OF
DOCTOR OF PHILOSOPHY
in
THE FACULTY OF GRADUATE AND POSTDOCTORAL STUDIES
(Experimental Medicine)
UNIVERSITY OF BRITISH COLUMBIA
(Vancouver)
April 2021
© Jonathan Frew, 2021

ii
The following individuals certify that they have read, and recommend to the Faculty of
Graduate and Postdoctoral Studies for acceptance, the dissertation entitled:
Premature termination codon readthrough restores progranulin expression in preclinical models of frontotemporal dementia and neuronal ceroid lipofuscinosis
submitted by Jonathan Frew
in partial fulfillment of the requirements for
the degree of Doctor of Philosophy
in Experimental Medicine
Examining Committee:
Haakon B. Nygaard, Neurology
Supervisor
Robin G-Y. Hsiung, Neurology
Supervisory Committee Member
Stephanie Willerth, Biomedical Engineering
Supervisory Committee Member
Eric Jan, Biochemistry & Molecular Biology
University Examiner
Neil Cashman, Neurology
University Examiner
Additional Supervisory Committee Members:
Michel Roberge, Biochemistry & Molecular Biology

iii
Abstract
Frontotemporal dementia (FTD) is a devastating and progressive disorder and a
common form of early-onset dementia. There are currently no disease-modifying
therapies available, signifying the need for new therapeutic approaches. Progranulin
(PGRN) haploinsufficiency due to autosomal dominant mutations in the progranulin
gene (GRN) is a major cause of familial FTD (FTD-GRN), with nearly a quarter of these
genetic cases resulting from a nonsense mutation. Nonsense mutations introduce
premature termination codons (PTCs) that can be therapeutically targeted by
compounds allowing readthrough, and aminoglycoside antibiotics are known to be
potent PTC readthrough drugs. When this research project was initiated, restoring
PGRN through PTC readthrough had not been explored as a therapeutic intervention in
FTD-GRN.
We used human induced pluripotent cell (hiPSC) lines bearing clinical nonsense
mutations spanning the GRN coding region (S116X+/-, R418X+/-, R493X-/- KI) to evaluate
G418 and novel PTC readthrough enhancer (CDX-series) combination treatments. Our
aim was to demonstrate proof-of-concept GRN PTC readthrough and lower the required
dose of G418 to address the known toxicity of traditional aminoglycoside PTC
readthrough agents.
Screening in HEK293 cells expressing nonsense mutant (S116X, R418X, R493X) GRN
expression constructs found PTC readthrough combination treatment with G418 and
CDX5-288 enhancer most potently induced GRN readthrough. We demonstrated in vivo

iv
proof-of-concept GRN PTC readthrough by performing single intracerebroventricular
(ICV) injections of G418 with or without CDX5-288 enhancer in our GRN R493X adeno-
associated virus-based mouse model. Combination treatment in hiPSC-derived isogenic
R493X-/- KI cortical neurons significantly restored PGRN levels and normalized
overexpression of the mature form of the lysosomal enzyme cathepsin D.
We attempted to achieve in vivo PTC readthrough of GrnR493X through repeated ICV
administrations of G418 in GrnR493X/R493X mice. However, G418 doses capable of
eliciting PTC readthrough in these mice were associated with significant neurotoxicity.
We next conducted further neuropathological characterization of lysosomal dysfunction,
neuroinflammation, and neurodegeneration in GrnR493X/R493X mice, identifying several
phenotypes recently reported in Grn-/- mice, including decreased thalamic excitatory
neuronal density. Taken together, our findings suggest that PTC readthrough may be a
potential therapeutic strategy for FTD caused by GRN nonsense mutations and support
further investigations into novel readthrough drugs with improved tolerability.

v
Lay Summary
Neurodegenerative diseases represent a growing burden to Canadian society.
Frontotemporal dementia (FTD) is a neurodegenerative syndrome that is the second
most common cause of early-onset dementia after Alzheimer’s disease. Approximately
25% of FTD cases are caused by mutations in the progranulin gene (GRN), meaning
that patients only have 50% of the normal levels of the progranulin protein (PGRN). A
nonsense mutation is a type of loss-of-function mutation that causes a protein to be cut
short in length by a process known as premature termination. Nonsense mutations in
GRN cause approximately 7.5-10% of FTD cases (FTD-GRN). We have discovered
drugs that silence the effect of nonsense mutations by preventing premature
termination. The goal of this work was to test whether these drugs promote full-length
PGRN production in cells derived from FTD-GRN patients and in FTD-GRN mouse
models. This work is important because there are currently no effective treatments for
FTD.

vi
Preface
Parts of chapters 3 and 4 were published in the following articles:
1) Frew, J., Baradaran-Heravi, A., Balgi, A.D., Wu, X., Yan, T.D., Arns, S.,
Shidmoossavee, F.S., Tan, J., Jaquith, J.B., Jansen-West, K.R., Lynn, F.C., Gao, F.B.,
Petrucelli, L., Feldman, H.H., Mackenzie, I.R., Roberge, M., Nygaard, H.B. (2020).
Premature termination codon readthrough upregulates progranulin expression and
improves lysosomal function in preclinical models of GRN deficiency. Molecular
Neurodegeneration, 15(21). https://doi.org/10.1186/s13024-020-00369-5. This article
was minimally modified to fit formatting guidelines of this thesis and was reused under
the Spring Nature Creative Commons license (CC BY 4.0).
2) Frew, J., Wu, X., Hsiung, G.Y., Feldman H.H., Mackenzie, I.R., Nygaard, H.B. (2019).
Generation of an induced pluripotent stem cell line (UBCi001-A) from a presymptomatic
individual carrying the R418X progranulin gene mutation. Stem Cell Research,
41(101582). https://doi.org/10.1016/j.scr.2019.101582. This article was minimally
modified to fit formatting guidelines of this thesis and was reused under the Elsevier
B.V. Creative Commons license (CC BY-NC-ND 4.0).
The design of all research, data analysis, and manuscript preparation were an original
intellectual product of the author, myself, with the guidance and mentorship of Dr.
Haakon B. Nygaard. I performed all experiments myself with the following exceptions:
• GRN expression vector cloning and HEK293 experiments that generated data
presented in Figures 3-1, 3-2, and 3-4 were performed by A. Baradaran-Heravi
and A.D Balgi.

vii
• AAV-GRN-R493X-V5 vector packaging was performed by K.R. Jansen-Weston.
• AAV-GRN-R493X-V5 RIPA-soluble mouse brain lysate V5 automated capillary
electrophoresis western analysis presented in Figure 3-7 was performed by A.D
Balgi.
• hiPSC CRISPR/Cas9 gene editing guidance was provided by F.C. Lynn.
• X. Wu prepared DNA samples for Sanger sequencing.
• T.D Yan assisted with some hiPSC tissue culture work.
• S. Arns, F.S. Shidmoossavee, J. Tan, and J.B Jaquith were involved in the
synthesis of CDX-series compound derivatives.
Parts of chapter 5 were published in the following article:
1) Frew, J., Nygaard, H.B. (2021). Neuropathological and behavioural characterization
of aged Grn R493X progranulin-deficient frontotemporal dementia knock-in mice. Acta
Neuropathologica Communications (in press). This article was minimally modified to fit
formatting guidelines of this thesis and was reused under the Elsevier B.V. Creative
Commons license (CC BY 4.0).
The design of all research, data analysis, and manuscript preparation were an original
intellectual product of the author, myself, with the guidance and mentorship of Dr.
Haakon B. Nygaard. I performed all experiments myself with the following exception:
• Dr. Kunho Choi isolated and treated Grn+/+ and GrnR493X/R493X MEFs and
conducted the Pgrn linker-1 antibody PTC readthrough western blot assay
presented in Figure 5-16 (unpublished data).

viii
Animal studies were performed in compliance with the Canadian Council on Animal
Care and were approved by the University of British Columbia (UBC) Animal Care
Committee under protocols A19-0623 (FTD mouse model breeding), A19-0062
(generation of mouse embryonic fibroblasts), A17-0225 (AAV injection of P0 C57BL/6J
pups) and A16-0161 (CNS delivery of PTC readthrough drugs). hiPSC studies were in
compliance with the Tri-Council Policy Statement on ‘Ethical Conduct for Research
Involving Humans’, as well as ICH Good Clinical Practice Guidelines and were
approved by the UBC under protocol HO7-03022. I have successfully completed the
following Canadian Council on Animal Care courses: Rodent Biology and Husbandry,
Introduction to Rodent Anesthesia Inhalable and Injectable, Introduction to Rodent
Aseptic Surgery – Full Sterile and Sterile Tip (Online animal care training program
certificate number: 6870-14). I have also completed the UBC Laboratory Biological
Safety Course (certificate number: 2019-swyay).

ix
Table of Contents
Abstract ......................................................................................................................... iii
Lay Summary ................................................................................................................. v
Preface .......................................................................................................................... vi
Table of Contents ......................................................................................................... ix
List of Tables .............................................................................................................. xvi
List of Figures ........................................................................................................... xvii
List of Symbols .......................................................................................................... xxi
List of Abbreviations ................................................................................................. xxii
Acknowledgements ................................................................................................. xxvii
Dedication ................................................................................................................. xxix
Chapter 1: An introduction to frontotemporal lobar degeneration, progranulin
neurobiology, and premature termination codon readthrough ................................ 1
1.1 Frontotemporal lobar degeneration ................................................................... 1
1.1.1 History of FTLD ............................................................................................. 1
1.1.2 Clinical presentations of FTD ........................................................................ 2
1.1.3 Neuropathology of FTLD ............................................................................... 3
1.1.4 Genetics of FTLD .......................................................................................... 4
1.1.5 FTLD caused by PGRN haploinsufficiency .................................................... 6
1.1.6 Genetic modifiers of FTLD-GRN ................................................................... 8
1.1.7 Clinical and neuropathological phenotypes of FTLD-GRN and CLN11 ....... 12
1.2 PGRN neurobiology ........................................................................................ 14

x
1.2.1 PGRN structure ........................................................................................... 15
1.2.2 PGRN expression in the brain ..................................................................... 15
1.2.3 PGRN regulation in the brain ....................................................................... 18
1.2.4 Mouse models of Grn-deficiency ................................................................ 24
1.2.4.1 Neuroinflammation ............................................................................... 24
1.2.4.2 Lysosomal dysfunction ......................................................................... 28
1.2.4.3 Dysregulated lipid metabolism ............................................................. 31
1.2.4.4 Neural connectivity deficits and neurodegeneration ............................. 33
1.2.5 hiPSC-derived CNS models of GRN-deficiency .......................................... 37
1.2.6 Proposed mechanisms of neurodegeneration in FTLD-GRN ...................... 41
1.2.7 Therapeutic development for the treatment of FTLD-GRN .......................... 47
1.3 Premature termination codon readthrough ..................................................... 48
1.3.1 Aminoglycoside PTC readthrough ............................................................... 52
1.3.2 Aminoglycoside toxicity ............................................................................... 54
1.3.3 Promising PTC readthrough drugs .............................................................. 56
1.3.4 PTC readthrough enhancers ....................................................................... 59
1.3.5 Nonsense mediated mRNA decay .............................................................. 60
1.3.6 PTC readthrough in cellular models of FTLD-GRN ..................................... 62
1.4 Thesis research questions .............................................................................. 63
Chapter 2: Materials and methods ............................................................................. 67
2.1 Mice ................................................................................................................ 67
2.2 Cells ................................................................................................................ 67
2.2.1 HEK293 ....................................................................................................... 67

xi
2.2.2 Mouse embryonic fibroblasts ....................................................................... 68
2.3 Expression vectors .......................................................................................... 68
2.3.1 Vector mutagenesis ..................................................................................... 68
2.3.2 Transfection ................................................................................................. 69
2.3.3 AAV vector packaging ................................................................................. 69
2.3.4 In vitro transduction ..................................................................................... 70
2.4 Antibodies ....................................................................................................... 71
2.5 Drug treatments .............................................................................................. 73
2.5.1 In vitro.......................................................................................................... 73
2.5.2 AAV mouse model ....................................................................................... 73
2.5.3 GrnR493X/R493X mouse model ......................................................................... 74
2.6 Western blot .................................................................................................... 74
2.6.1 Conventional western blot ........................................................................... 74
2.6.2 ProteinSimple Wes ...................................................................................... 75
2.7 hiPSC models ................................................................................................. 76
2.7.1 hiPSC reprogramming ................................................................................. 76
2.7.2 hiPSC culture .............................................................................................. 76
2.7.3 hiPSC trilineage differentiation .................................................................... 77
2.7.4 hiPSC CNS lineage differentiation ............................................................... 77
2.7.5 Karyotyping analysis ................................................................................... 78
2.8 CRISPR/Cas9 gene editing............................................................................. 78
2.9 Multielectrode array electrophysiology ............................................................ 79
2.10 ELISA .............................................................................................................. 80
xii
2.11 qPCR .............................................................................................................. 81
2.12 Mouse genotyping ........................................................................................... 81
2.13 Histology ......................................................................................................... 82
2.13.1 Immunocytochemical staining and quantification ........................................ 82
2.13.2 Brain immunofluorescence microscopy and quantification .......................... 83
2.13.3 Brightfield microscopy ................................................................................. 87
2.14 Surgical procedures ........................................................................................ 87
2.14.1 Intracerebroventricular injection of AAV particles ........................................ 87
2.14.2 Bolus intracerebroventricular injection of drugs ........................................... 87
2.14.2.1 AAV-GRN-R493X-V5 mice ................................................................... 87
2.14.2.2 Grn+/+ and GrnR493X/R493X mice .............................................................. 88
2.14.3 Intracerebroventricular iPRECIO® pump implantation in Grn+/+ and
GrnR493X/R493X mice ................................................................................................. 89
2.15 Open-field behavioural assay .......................................................................... 90
2.16 Brain collection of processing ......................................................................... 90
2.16.1 AAV mouse model ....................................................................................... 90
2.16.2 GrnR493X/R493X baseline characterization ...................................................... 91
2.16.3 Vehicle/G418 treated Grn+/+ and GrnR493X/R493X mice ................................... 92
2.17 Statistical analysis ........................................................................................... 92
Chapter 3: Exogenous PTC readthrough of nonsense mutant GRN expression
constructs .................................................................................................................... 94
3.1 Introduction ..................................................................................................... 94
3.2 Results ............................................................................................................ 96

xiii
3.2.1 PTC readthrough in transiently transfected HEK293 cells ........................... 96
3.2.2 PTC readthrough in stably transfected HEK293 cells ................................ 100
3.2.3 PTC readthrough in HEK293 cells transduced with AAV-GRN-R493X-V5
viral particles ........................................................................................................ 102
3.2.4 Technical demonstration of CNS P0 delivery of AAV particles and bolus ICV
injection in adult mice ........................................................................................... 104
3.2.5 PTC readthrough in AAV-GRN-R493X-V5 mice ........................................ 107
3.3 Discussion..................................................................................................... 109
Chapter 4: Generation of FTLD-GRN hiPSC lines and endogenous PTC
readthrough of GRN nonsense mutant hiPSC-derived CNS cell types ................ 111
4.1 Introduction ................................................................................................... 111
4.2 Results .......................................................................................................... 114
4.2.1 Generation of WT and FTLD-GRN patient-derived hiPSC lines ................ 114
4.2.2 Generation of an isogenic GRN R493X homozygous knock-in hiPSC line
using CRISPR/Cas9 gene editing ........................................................................ 114
4.2.3 Characterization of hiPSC line pluripotency .............................................. 115
4.2.4 Differentiation of WT and GRN-deficient hiPSC lines into cortical neurons
and astrocytes ...................................................................................................... 121
4.2.5 PTC readthrough in GRN-deficient hiPSC-derived cortical neurons ......... 128
4.2.6 PTC readthrough rescues lysosomal dysfunction in R493X-/- KI hiPSC-
derived cortical neurons ....................................................................................... 137
4.2.7 PTC readthrough in R493X-/- KI hiPSC-derived astrocytes ........................ 141

xiv
4.2.8 Impact of G418 on PGRN expression in WT hiPSC-derived cortical neurons
and astrocytes ...................................................................................................... 149
4.3 Discussion..................................................................................................... 153
Chapter 5: Phenotypic characterization of the GrnR493X/R493X mouse model and
dose-limiting in vivo toxicity of G418 ...................................................................... 159
5.1 Introduction ................................................................................................... 159
5.2 Results .......................................................................................................... 160
5.2.1 Pgrn expression in the brains of aged GrnR493X/R493X mice ......................... 160
5.2.2 Lysosomal dysfunction in the brains of aged GrnR493X/R493X mice .............. 165
5.2.3 Neuroinflammation and astrogliosis in the ventral thalamus of aged
GrnR493X/R493X mice ................................................................................................ 177
5.2.4 Partial preservation of inhibitory synaptic density in the thalamus of aged
GrnR493X/R493X mice ............................................................................................... 185
5.2.5 Reduced thalamic excitatory neuron density in the brains of aged
GrnR493X/R493X mice ............................................................................................... 188
5.2.6 Aged male GrnR493X/R493X mice exhibit an increased anxiety phenotype .... 190
5.2.7 PTC readthrough in GrnR493X/R493X MEFs ................................................... 198
5.2.8 G418-induced toxicity in GrnR493X/R493X mice limits therapeutic potential ... 201
5.3 Discussion..................................................................................................... 216
Chapter 6: Conclusions ............................................................................................ 223
6.1 Contributions to the fields of FTLD-GRN and CLN11 ................................... 223
6.1.1 In vitro and in vivo PTC readthrough of exogenously expressed nonsense
mutant human GRN expression constructs .......................................................... 223

xv
6.1.2 In vitro and in vivo PTC readthrough in human and mouse models
endogenously expressing nonsense mutant GRN ............................................... 224
6.2 Final conclusions .......................................................................................... 226
6.3 Future directions ........................................................................................... 227
References ................................................................................................................. 231

xvi
List of Tables
Table 1-1 Primary antibodies ........................................................................................ 71

xvii
List of Figures
Figure 1-1 Brain regulation of extracellular PGRN proteolysis ...................................... 22
Figure 1-2 Nonsense mutation readthrough .................................................................. 51
Figure 1-3 Graphical overview of experimental models................................................. 66
Figure 3-1 Induction of PTC readthrough by G418 and CDX5 enhancers in cells stably
expressing nonsense mutant GRN-V5 .......................................................................... 97
Figure 3-2 Induction of PTC readthrough by G418 in transiently transfected cells
expressing nonsense mutant GRN-V5 .......................................................................... 99
Figure 3-3 Chemical structures of CDX5-196 and CDX5-288 ..................................... 101
Figure 3-4 Induction of PTC readthrough in cells transduced with increasing titers of
AAV-GRN-R493X-V5 .................................................................................................. 103
Figure 3-5 Technical demonstration of AAV P0 ICV injection method ........................ 105
Figure 3-6 Technical demonstration of bolus ICV injection method in adult mice ....... 106
Figure 3-7 Induction of PTC readthrough in AAV-R493X-GRN-V5 mice ..................... 108
Figure 4-1 Generation of isogenic CRISPR/Cas9 gene edited R493X-/- KI hiPSC line
from WT ...................................................................................................................... 116
Figure 4-2 PGRN immunofluorescence in WT and R493X-/- KI hiPSC-derived cortical
neurons ....................................................................................................................... 118
Figure 4-3 Characterization of WT and GRN-deficient hiPSC lines ............................ 119
Figure 4-4 Differentiation and characterization of cortical neurons and astrocytes
derived from WT and GRN-deficient hiPSCs .............................................................. 122
Figure 4-5 Characterization of hiPSC-derived cortical neuron synaptic development and
neural network formation ............................................................................................. 124

xviii
Figure 4-6 Co-culturing hiPSC-derived cortical neurons with hiPSC-derived astrocytes
accelerates electrophysiological maturation and neural network formation................. 126
Figure 4-7 Baseline expression and secretion of PGRN in WT hiPSC-derived cortical
neurons and astrocytes ............................................................................................... 130
Figure 4-8 Detecting PGRN in WT and R493X-/- KI hiPSC-derived cortical neurons by
western blot ................................................................................................................. 131
Figure 4-9 Induction of PTC readthrough by G418 and enhancers in hiPSC-derived
cortical neurons bearing FTLD-GRN nonsense mutations .......................................... 132
Figure 4-10 Quantification of G418-induced neuronal cytotoxicity .............................. 134
Figure 4-11 Selective increase of nonsense mutant GRN mRNA in R493X-/- KI hiPSC-
derived cortical neurons in response to PTC readthrough treatments ........................ 136
Figure 4-12 GRN PTC readthrough rescues FTLD-GRN/CLN11 lysosomal pathological
CTSD maturation phenotype in R493X-/- KI hiPSC-derived cortical neurons .............. 139
Figure 4-13 qPCR analysis of GRN mRNA levels in WT hiPSC-derived cortical neurons
and astrocytes ............................................................................................................. 143
Figure 4-14 Induction of PTC readthrough by G418 and enhancers in R493X-/- KI
hiPSC-derived astrocytes demonstrated by western blot ............................................ 144
Figure 4-15 Induction of PTC readthrough by G418 and enhancers in R493X-/- KI
hiPSC-derived astrocytes demonstrated by ELISA ..................................................... 147
Figure 4-16 Selective increase of nonsense mutant GRN mRNA in R493X-/- KI hiPSC-
derived astrocytes in response to PTC readthrough treatments ................................. 148
Figure 4-17 G418-mediated disruption of PGRN homeostasis in WT hiPSC-derived
astrocytes .................................................................................................................... 151

xix
Figure 5-1 GrnR493X/R493X genotyping............................................................................ 162
Figure 5-2 Pgrn expression in the brains of aged GrnR493X/R493X mice ......................... 163
Figure 5-3 Lysosomal dysfunction in the ventral thalamus and CA3 hippocampal region
of aged GrnR493X/R493X mice .......................................................................................... 167
Figure 5-4 Enlarged lysosomes in the ventral thalamus and CA3 hippocampal region of
aged GrnR493X/R493X mice .............................................................................................. 169
Figure 5-5 Global lysosomal dysfunction in the brains of aged GrnR493X/R493X mice ..... 171
Figure 5-6 Neuronal TDP-43 proteinopathy is localized to the ventral thalamus of aged
GrnR493X/R493X mice ....................................................................................................... 174
Figure 5-7 Absence of global p-TDP-43 proteinopathy in the brains of aged
GrnR493X/R493X mice ....................................................................................................... 176
Figure 5-8 Neuroinflammation in the ventral thalamus of aged GrnR493X/R493X mice ..... 180
Figure 5-9 Microglial skeletal analysis method ............................................................ 182
Figure 5-10 Severe astrogliosis in the ventral thalamus and CA3 hippocampal region of
aged GrnR493X/R493X mice .............................................................................................. 183
Figure 5-11 Inhibitory synaptic density is preserved in the thalamus of aged
GrnR493X/R493X mice ....................................................................................................... 186
Figure 5-12 Reduced thalamic Foxp2+ excitatory neuron density in the brains of aged
GrnR493X/R493X mice ....................................................................................................... 189
Figure 5-13 Aged male GrnR493X/R493X mice exhibit an increased anxiety phenotype ... 192
Figure 5-14 GrnR493X/R493X brain lysosomal dysfunction does not exhibit a sex-specific
phenotype ................................................................................................................... 194
xx
Figure 5-15 GrnR493X/R493X microgliosis and astrogliosis does not exhibit a sex-specific
phenotype ................................................................................................................... 195
Figure 5-16 GrnR493X/R493X decreased thalamic excitatory neuron density and inhibitory
synaptic pruning does not exhibit a sex-specific phenotype ........................................ 196
Figure 5-17 Induction of PTC readthrough by G418 and enhancers in GrnR493X/R493X
MEFs ........................................................................................................................... 199
Figure 5-18 A single ICV injection of G418 may induce increased Pgrn expression in the
brains of GrnR493X/R493X mice ........................................................................................ 203
Figure 5-19 Technical demonstration of bolus iPRECIO® pump-mediated ICV injections
targeting the lateral ventricles ..................................................................................... 205
Figure 5-20 G418’s PTC readthrough activity is preserved despite prolonged incubation
at physiologic temperature .......................................................................................... 206
Figure 5-21 Schematic describing iPRECIO® pump experiment infusion programs and
toxicity outcomes in mice ............................................................................................ 208
Figure 5-22 Quantification of G418 concentration in the brains of Grn+/+ and
GrnR493X/R493X mice treated ICV with G418 .................................................................. 209
Figure 5-23 Multiple iPRECIO® pump-mediated ICV infusions of 50 µg G418 may
induce increased Pgrn expression in the brains of GrnR493X/R493X mice ....................... 210
Figure 5-24 Grn+/+ tolerate iPRECIO® pump ICV infusion of saline ............................. 213
Figure 5-25 Increased Pgrn expression induced by 2X repeated ICV G418 injections in
the brains of GrnR493X/R493X mice .................................................................................. 214

xxi
List of Symbols
µ micron
α alpha
β beta
δ delta
γ gamma
κ kappa

xxii
List of Abbreviations
2-DOS 2-deoxystreptamine AAV Adeno-associated virus AAVS1 Adeno-associated virus integration site 1 AD Alzheimer’s disease ADAMTS7 A disintegrin and metalloproteinase with thrombospondin motifs 7 ADP Adenosine diphosphate ALP Autophagy-lysosomal pathway ALS Amyotrophic lateral sclerosis ANOVA Analysis of variance ATP Adenosine triphosphate ATRA Vitamin A1 metabolite all-trans retinoic acid BBB Blood-brain-barrier BDNF Brain-derived neurotrophic factor bvFTD Behavioural variant frontotemporal dementia C/EBPβ CCAAT-enhancer binding protein β C1qa Complement C1q subcomponent subunit A C3b Complement component C3b C9orf72 Chromosome 9 open reading frame 72 Cas9 CRISPR associated protein 9 CE Cholesterol ester CF Cystic fibrosis CLEAR Coordinated lysosomal expression and regulation CLN11 Ceroid lipofuscinosis neuronal 11 CNS Central nervous system CreER Cre-estrogen receptor CRISPR Clustered regularly interspaced short palindromic repeats crRNA trans-activating CRISPR RNA CSF Cerebrospinal fluid CSF1R Colony stimulating factor 1 receptor CTF C-terminal fragment CTIP2 COUP-TF-interacting protein 2 CTSB/D/L/S Cathepsin B/D/L/S CX3CR1 CX3 chemokine receptor 1 DAG Diacylglycerides DAM Disease-associated microglia DAPI 4′,6-diamidino-2-phenylindole DIV Day in vitro DLDH Dementia lacking distinctive histopathology DMD Duchenne muscular dystrophy DMEM Dulbecco's Modified Eagle Medium DMSO Dimethyl sulfoxide DN Dystrophic neurites

xxiii
DNMT DNA methyltransferase DPPII/7 Dipeptidyl peptidase II/7 DTT Dithiothreitol EDTA Ethylenediaminetetraacetic acid eGFP Enhanced green fluorescent protein EJC Exon junction complex ELISA Enzyme-linked immunosorbent assay EP Erythroid progenitor ER Endoplasmic reticulum eRF1/3 Eukaryotic release factor 1/3 EWS Ewing sarcoma FAM171A2 Family with sequence similarity 171 member A2 FBS Fetal bovine serum FOXG/O/P1 Forkhead box protein G/O/P1 FTD Frontotemporal dementia FTD-MND Frontotemporal dementia with motor neuron disease FTLD Frontotemporal lobar degeneration FUS Fused in Sarcoma GAD65 Glutamic acid decarboxylase 65-kilodalton isoform GAPDH Glyceraldehyde 3-phosphate dehydrogenase GCase Glucocerebrosidase GDNF Glia cell-derived neurotrophic factor GFAP Glial fibrillary acidic protein GNS N-acetylglucosamine-6-sulfatase GOF Gain-of-function GPNMB Glycoprotein NMB gRNA Guide RNA GRNs Granulin peptides GWAS Genome-wide association studies HEK293 Human embryonic kidney 293 cells HEXB Hexosaminidase subunit beta hiPSC Human induced pluripotent stem cells HPRT1 Hypoxanthine phosphoribosyltransferase 1 Hsp70 Heat shock protein 70 IBA1 Allograft inflammatory factor 1 ICV Intracerebroventricular IF Immunofluorescence IFNγ Interferon gamma IKBKB Inhibitor of NF-κB subunit beta IL-10 Interleukin 10 IL-1β Interleukin 1 beta kDa Kilodaltons KO Knockout LAMP1 Lysosomal-associated membrane LC Locus ceruleus

xxiv
LC3-I/II Microtubule-associated proteins I/II light chain 3B LD Lipid-droplet LOF Loss-of-function LPS Lipopolysaccharide LRP1 Low density lipoprotein receptor-related protein 1 M6PR Mannose 6-phosphate receptor MAC Membrane attack complex MAP2 Microtubule-associated protein 2 MAPK Mitogen-activated protein kinase MAPT Microtubule-associated protein tau MCM Microglia conditioned media MEA Multielectrode array MEF Mouse embryonic fibroblast miRNA Micro-RNA Mitoribosome Mitochondrial ribosome mPFC Medial prefrontal cortex MSN Medium spiny neurons mTOR C1 Mammalian target of rapamycin complex 1 N2a Neuro2a NA Nucleus accumbens NCI Neuronal cytoplasmic inclusions NCL Neuronal ceroid lipofuscinosis NF-κB Nuclear factor kappa beta nfvPPA Non-fluent variant primary progressive aphasia NII Neuronal intranuclear inclusions NMD Nonsense-mediated mRNA decay NPC Neuronal progenitor cells OCD Obsessive-compulsive disorder ORF Open reading frame PBS Phosphate-buffered saline PCR Polymerase chain reaction PFA Paraformaldehyde PFU Plaque-forming unit PGRN Progranulin PGRN/GRNs Full-length PGRN, truncated PGRN, and GRN peptides PI3K Phosphoinositide 3-kinase PKB Protein kinase B PKCδ Protein kinase C delta PLO/L Poly-L-ornithine / laminin Poly I:C Polyinosinic:polycytidylic acid PP2A Protein phosphatase 2 PSAP Prosaposin PTC Premature termination codon p-TDP-43 Phosphorylated TAR DNA-binding protein 43

xxv
qPCR Quantitative polymerase chain reaction rec. PGRN Recombinant PGRN RF Release factor RIPA Radioimmunoprecipitation assay RNAi RNA interference ROS Reactive oxygen species RT Room temperature S1BF Barrel field region of the rodent primary somatosensory cortex S6K2 S6 kinase beta SAP Saposin SCARB2 Scavenger receptor class B member 2 SDS-PAGE Sodium dodecyl sulfate polyacrylamide gel electrophoresis SEM Standard error of mean siRNA Small interfering RNA SLPI Secretory leukocyte protease inhibitor SMAD Small mothers against decapentaplegic SNP Single nucleotide polymorphism snRNA-seq Single-nuclei RNA-sequencing SORT1 Sortilin SOX1/17 SRY-related HMG-box 1/17 ssODN Single-stranded oligonucleotide svPPA Semantic-variant primary progressive aphasia TAF15 TBP associated factor 15 TAG Triacylglycerides TARDBP TAR DNA-binding protein 43 gene TBR1 T-box brain transcription factor 1 TBS Tris-buffered saline TCA Tricarboxylic acid TDP-43 TAR DNA-binding protein 43 TFEB Transcription factor EB TGF-β Transforming growth factor beta TGFβR-1 Transforming growth factor beta receptor 1 TLR4 Toll-like receptor 4 TMEM106B Transmembrane protein 106B TNFR1/2 Tumor necrosis factor receptor 1/2 TNFα Tumor necrosis factor alpha TP53/p53 Tumor protein p53 TPP1 Tripeptidyl-peptidase 1 TUJ1 Neuron specific class III beta-tubulin UBC University of British Columbia UPF1/2/3 Up-frameshift suppressor 1/2/3 UTR Untranslated region V-ATPase Vacuolar-type ATPase VGAT Vesicular gamma-aminobutyric amino acid transporter VGLUT1 Vesicular glutamate transporter 1

xxvi
VPL Ventral posterolateral VPM Ventral posteromedial VT Vehicle-treated WB Western blot WHP Woodchuck hepatitis virus Wnt Wingless-related integration site WPRE WHP post-transcriptional regulatory element WT Healthy control hiPSC line

xxvii
Acknowledgements
I conducted this research and wrote this dissertation on the unceded traditional
ancestral territories of the Coast Salish peoples, including the Qayqayt (the only First
Nation without a land base), the xʷməθkʷəy̓əm (Musqueam), the skwxwú7mesh
(Squamish) and the səl̓ilwətaɁɬ (Tsleil-Waututh). As a Canadian decedent of white
colonial settlers, I acknowledge the historical and ongoing injustices against indigenous
people and am committed to the lifelong practices of decolonization and reconciliation.
I offer my tremendous gratitude to my supervisor Dr. Haakon Nygaard for his incredible
support, guidance, and generosity throughout my graduate studies. I am grateful for the
trust he had in me to establish his new lab's scientific foundation. His encouragement,
thoughtful feedback, and belief in my abilities helped me develop the resilience required
to face major challenges I encountered throughout my graduate studies. I thank my
committee member Dr. Michel Roberge, whose frequent collaborative and insightful
discussions greatly improved the work presented in this thesis. I would also like to thank
my current and former committee members, Dr. Stephanie Willerth, Dr. Robin Hsiung,
and Dr. Christian Naus, for their invaluable guidance.
I also thank the Nygaard lab members, past and present, who created a lab
environment that nurtured my scientific curiosity and contributed to my ultimate success
in accomplishing my research goals. In no particular order, thank you: Tyler Yan, Dr.
Brianne Kent, Dr. Xiajuan Wu, Julia Boyle, Katina Mak, Hannah Pae, Chris Lee, Ariel
Frame, Clara Dutton-Kneaves, Meghan Chen, Kiana Yau, and Adrienne Kinman. Many

xxviii
thanks also to past and present Roberge lab members, especially to Dr. Aruna Balgi,
Dr. Alireza Baradaran-Heravi, and Dr. Kunho Choi.
Thank you to the Weston Brain Institute, who provided funds for the research presented
in this thesis. I would also like to thank the Canadian Institute for Health Research for
providing salary support through the Canada Graduate Scholarships – Master’s
program.
Special thanks are owed to my family, especially to my parents Mark and Debbie Frew,
who have always believed in me. I was so lucky to have you both so close by for
emotional support and encouragement throughout all the successes and failures that
defined this journey. Last but certainly not least, I would like to also thank my wife,
Madison Galts, for her unconditional love and support, cheering me on every step of the
way.

xxix
Dedication
I dedicate this thesis to my wife Madison for the endless sacrifices she happily made to
support me throughout this challenging endeavor, and to my late grandpa Roy whose
battle with Alzheimer’s disease inspired me to pursue graduate studies in the field of
neurodegeneration.

1
Chapter 1: An introduction to frontotemporal lobar degeneration,
progranulin neurobiology, and premature termination codon
readthrough
1.1 Frontotemporal lobar degeneration
Frontotemporal lobar degeneration (FTLD) is the underlying pathology uniting a
clinically, genetically, and pathologically heterogeneous group of disorders that primarily
affect the frontal, temporal, and parietal lobes. FTLD causes a spectrum of clinical
presentations of frontotemporal dementia (FTD), including progressive changes in
behaviour, personality, executive function, and language. 75-80% of FTD patient
symptomatic onset occurs before age 65, and FTLD has an incidence of 10-30 per
100,000 individuals aged 45-65 years old (1). FTLD is the 2nd most common cause of
early-onset dementia (2). There are currently no approved therapies that can stop or
alter the progression of this disease. Symptomatic management with selective serotonin
reuptake inhibitors and other antipsychotics represents the only available form of
pharmacological intervention for FTD patients (3).
1.1.1 History of FTLD
Pathology resembling FTLD has been clinically described for over a century; however, it
was often misdiagnosed as Alzheimer’s disease (AD) or other psychiatric disorders (4).
Arnold Pick was first to characterize a now rare form of FTLD, Pick’s disease,
diagnosed post-mortem pathologically by the observation of neuronal ballooning (Pick

2
cells) and intraneuronal argentophilic inclusion bodies (Pick bodies) in the absence of
AD plaques/tangles (5-7). In the early 1980s, American neurologists believed it was
essentially impossible to distinguish between Pick’s disease and AD using either clinical
or radiological measures (8). Meanwhile, neurologists in Europe had observed a
behavioural phenotype not classically associated with AD and developed a clinical
rating scale to differentiate between AD and Pick’s disease / ‘frontal degeneration of
non-Alzheimer’s type’ (9,10). It was later discovered that many FTLD cases in America
had been misdiagnosed as AD, likely due to a lack of awareness of its distinct clinical
presentation (11). In 1994, European clinicians published a consensus report on the
clinical and neuropathological criteria for FTLD; thus, solidifying its recognition as a
separate condition from AD dementia (2). More recently, advances in DNA sequencing,
neuropathological indicators, and radiographic technologies have further revealed the
complex clinical heterogeneity underlying FTLD.
1.1.2 Clinical presentations of FTD
There are three main clinical subtypes of FTD: behavioural variant (bvFTD), semantic
variant primary progressive aphasia (svPPA), and non-fluent variant progressive non-
fluent aphasia (nfvPPA). Few cases present in a relatively pure form, with most patients
developing overlapping syndromes throughout disease progression. bvFTD is
characterized by atrophy of the frontal, anterior temporal, and lateral parietal lobes
resulting in various degrees of social disinhibition, loss of sympathy/empathy, and
increased apathy (12). svPPA is characterized by a consistent asymmetric atrophy
pattern in the anterior temporal lobe leading to an inability to access conceptual

3
knowledge (12). nfvPPA is characterized primarily by atrophy of the left hemisphere,
disrupting smooth speech articulation, and grammatical proficiency (12).
Fluorodeoxyglucose positron emission tomography imaging measuring glucose uptake
in FTLD patients’ brains has identified deficits in cerebral glucose metabolism as an
early marker of disease progression (13). Further, 15% of patients with FTLD express
comorbidity in the form of motor neuron disease (14,15), resembling amyotrophic lateral
sclerosis (ALS), highlighting the significant overlap of genetic, clinical, and pathological
characteristics shared by these two disorders (16). In general, the prognosis for FTLD
patients is poor, leading to death within 3-10 years following diagnosis (17).
1.1.3 Neuropathology of FTLD
Post mortem analysis of clinically diagnosed FTLD patients’ brains has led to the
identification of four major types of abnormal aggregated protein accumulation in
neurons and glia. Approximately 45% of clinically diagnosed FTLD cases develop
neuronal intracytoplasmic inclusions (NCI) that are composed of the microtubule-
associated protein tau (FTLD-tau) (18). FTLD-tau can be further divided into two
subtypes, with the hallmark either being round tau-positive Pick bodies observed in
Pick’s disease or neurofibrillary tangle-like structures observed in corticobasal
syndrome and progressive supranuclear palsy (19). Tau-negative FTLD cases were
initially classified as dementia lacking distinctive histopathology (DLDH) (20), though it
was later discovered that the majority of these DLDH cases possessed ubiquitin-
positive inclusions (21,22).

4
A few years later, the elusive ubiquitinated protein that constitutes the aggregates in
about 50% of FTLD cases was discovered to be the RNA/DNA binding protein TAR
DNA-binding protein 43 (TDP-43) (23,24). TDP-43 aggregates can appear as neuronal
cytoplasmic inclusions (NCI), neuronal intranuclear inclusions (NII), and dystrophic
neurites (DN) in the cortices of FTLD patients (FTLD-TDP). The ratio and prevalence of
these different TDP-43 aggregates distinguish FTLD-TDP type A-D sub-classifications
(25). Subtype A cases have a near-equal ratio of NCI and DN; in type B, NCI
predominates over DN; type C is applied when DN predominates over NCI, and type D
when NII is the most common form of TDP-43 pathology. The discovery that
chromosome 9 open reading frame 72 (C9orf72) hexanucleotide expansion mutations
cause the majority of familial FTLD cases has led to the identification of distinct
histopathological hallmarks. In addition to TDP-43 pathology, these patients develop
sense and antisense C9orf72 expanded repeat RNA foci (26), and translation of the
hexanucleotide expansion derived mRNA results in the cytoplasmic accumulation of
dipeptide repeat proteins (27). The remaining 5% of FTLD patient brains accumulate
protein inclusions (NCI and sometimes NII) consisting of Fused in Sarcoma (FUS)
protein and sometimes other members of the FET (FUS, EWS, and TAF15) family of
proteins (FTLD-FUS) (28).
1.1.4 Genetics of FTLD
An estimated 40% of FTLD cases are familial, with patients often presenting with a
history of similar diseases within their family (29). Furthermore, a clear autosomal
dominant inheritance pattern has been observed in ~10% of cases, thus indicating

5
genetics play a key role in disease pathogenesis (29). Certain FTD clinical phenotypes
exhibit differential inheritance patterns; for example, svPPA is rarely familial, while
bvFTD can be either familial or sporadic in nature (29). The three most prevalent genes
confirmed to cause familial FTLD are MAPT, GRN, and C9orf72. There are 44 known
pathogenic MAPT mutations, causing between 5-20% of familial FTLD cases (30,31).
There are two main types of MAPT mutations: 1) mutations that disrupt splicing of exon
10 that result in an increased ratio of 4R:3R tau isoforms (32) that lead to accumulation
of 4R insoluble tau aggregates forming neurofibrillary tangles; 2) missense mutations
throughout the gene that reduce the ability of all tau isoforms to bind to microtubules,
increasing the pool of unbound tau accelerating 3R/4R tau aggregation into Pick bodies
(33). After identifying MAPT mutations on chromosome 17q21, there were still
numerous FTLD cases that had been linked to 17q21 but were null for mutations in
MAPT (34). Subsequently, loss-of-function (LOF) mutations in GRN were discovered in
these patients within a 6.2 Mb segment of 17q21 that also contained the MAPT locus
(35,36). Approximately 5-20% of familial FTLD cases are caused by GRN
haploinsufficiency (FTLD-GRN) (37). Most heterozygous pathogenic GRN mutations
lead to a > 50% loss in progranulin protein (PGRN) levels/function leading to disease
through haploinsufficiency (38).
In the years following the identification of causal FTLD-GRN mutations, there was still a
significant proportion of FTLD patients that exhibited clear autosomal dominant pattern
of inheritance with unknown genetic origin. In 2011, researchers identified the
GGGGCC hexanucleotide repeat expansion in the non-coding region of the C9orf72
6
gene as a key driver of familial FTLD and ALS (39,40). The majority (~25%) of familial
FTLD cases are caused by C9orf72 hexanucleotide expansions (41), with patients
carrying 100-1000 repeats compared to 2-20 repeats in healthy control populations (38).
It has been demonstrated that transcripts bearing the GGGGCC repeat sequences can
be translated through an unconventional repeat-associated non-ATG initiated form of
translation, which results in the accumulation of dipeptide repeats (27). The mechanism
driving neurodegeneration in C9orf72 repeat expansion carriers is still up for debate,
with findings from numerous disease models supporting both LOF and gain-of-function
(GOF) pathogenic processes (42,43). Interestingly, mutations in TARDBP (TDP43) are
rarely associated with FTLD-TDP pathology (19). Meanwhile, several rare mutations in
genes associated with autophagolysosomal pathways (CHMP2B, VCP, SQSTM1,
TBK1) have been shown to cause a small minority of FTLD-TDP cases (44-47). This
suggests that disrupted proteolytic mechanisms play a major role in the establishment
of FTLD-TDP pathology. Lastly, most FTLD-FUS cases appear to lack clear genetic
origin and are believed to be sporadic in nature (19).
1.1.5 FTLD caused by PGRN haploinsufficiency
As discussed in section 1.1.4, heterozygous mutations in GRN on chromosome 17q21
cause a familial form of FTLD. Going forward, we will refer to symptomatic GRN
haploinsufficient mutation carriers as having FTLD-GRN and will refer to models of GRN
deficiency as FTLD-GRN models. All pathogenic GRN mutations have either been
confirmed or are predicted to produce a LOF allele (48). Of the known 79 known
pathogenic GRN mutations, ~84% are either nonsense or frameshift mutations that
7
introduce premature termination codons (PTCs) (49-51). However, less common
missense and deletion mutations have also been identified that can: disrupt mRNA
maturation leading to nuclear mRNA degradation (52); prevent initiation of protein
translation at the start codon (53); destroy the signal peptide sequence critical for
protein secretion (54); and, eliminate key cysteine residues that do not decrease total
protein/mRNA levels but cause impaired protein function and processing into granulin
peptides (GRNs) (55).
FTLD-GRN has a variable age of onset, ranging from 35-89 years of age. This presents
a significant challenge for designing clinical trials since even family members bearing
the same GRN mutation can develop symptoms at significantly different ages (56).
Extrapolating the incidence of FTLD (see section 1.1) using the proportion of FTLD
patients bearing GRN mutations (~4%) implies a global incidence of 0.5-1.5 FTLD-GRN
cases per 100,000 people (36,57). This finding, along with the lack of clinical correlation
between age of onset and PGRN plasma/cerebrospinal fluid (CSF) concentration (58),
implies that other factors such as disease modulating genetic variants or environmental
conditions may play a role in determining age of onset. The vast majority of FTLD-GRN
patients express 70-80% less serum PGRN than control subjects (59). These patient
PGRN levels are lower than expected, given the heterozygous LOF nature of FTLD-
GRN mutations. Reprogramming FTLD-GRN patient fibroblasts that express < 50%
GRN mRNA levels compared to healthy control cells into human induced pluripotent
stem cells (hiPSCs) increased GRN mRNA back to the expected 50% level (60).
Pluripotent reprogramming resets a differentiated cell’s epigenetic signature; therefore,

8
suggesting that epigenetic mechanisms may be responsible for the additional basal
suppression of PGRN expression in FTLD-GRN mutation carriers.
1.1.6 Genetic modifiers of FTLD-GRN
A host of genetic elements have been associated with the age of onset and disease
progression in FTLD-GRN. The majority of these factors are either known to influence
lysosomal function, are involved in the regulation of GRN expression, or participate in
direct protein-protein interactions with PGRN (61). Most of these genetic markers have
been identified through genome-wide association studies (GWAS); thus, it is important
to recognize the limitations of interpreting these disease-associated risk loci. The
original variant or single nucleotide polymorphism (SNP) identified by a GWAS is rarely
confirmed to be the true causal variant resulting in the molecular modification that
confers greater disease risk (62); this is because there are usually 10s-100s of variants
in strong linkage disequilibrium with the sentinel SNP at the specified genetic locus,
representing a set of co-inherited variants or haplotypes. There is the potential for any
of these co-inherited variants to be the true underlying cause of altered disease risk. It is
also important to consider that the risk-haplotype can often span multiple genes, further
complicating the identification of the gene to which a certain GWAS signal belongs.
TMEM106B is a single-pass integral membrane glycoprotein localized to late
endosomes and lysosomes and is important for regulating lysosomal size, motility, and
responsiveness to stress (63). TMEM106B and PGRN have both been shown to co-
localize in the endolysosomal compartment in various cell types (64).
9
SNPs in TMEM106B have been shown to have protective effects on FTLD-GRN
disease progression (65,66). The minor allele of the non-coding TMEM106B SNP
rs1990662 has been detected at a low frequency in FTLD-GRN patients compared to
healthy controls, suggesting GRN mutation carriers expressing the minor allele may
exhibit delayed symptomatic onset (65,66). Further, the frontal cortices of FTLD-TDP
patients and unaffected individuals carrying the major allele exhibit significantly elevated
TMEM106B mRNA levels compared to those with the minor allele (65). Remarkably, the
age of onset was delayed by an average of 13 years in FTLD-GRN patients
homozygous for the rs1990662 “protective” TMEM106B allele (67). These patients were
also found to possess significantly higher plasma PGRN levels than those homozygous
for the “risk” allele, possibly explaining their slower disease progression (67).
More recently, TMEM106B SNP rs1990620, an additional non-coding “risk” allele, has
been identified in complete linkage disequilibrium with the sentinel SNP (rs1990622)
that functionally increases recruitment of the chromatin-organizing protein CTCF to
downstream regulatory sequences of the TMEM106B locus, positively regulating
transcription levels (68). The “protective” allele of the lone TMEM106B coding region
SNP rs3173615 or p.T185S (also in linkage disequilibrium with rs1990662) has been
shown to impart faster protein turnover, resulting in an overall decrease in TMEM106B
expression (64). Together these findings suggest that these “risk” alleles confer genetic
susceptibility through increased TMEM106B gene expression or GOF mechanism.
Finally, independent of TMEM106B SNPs, FTLD-GRN patients exhibit reduced levels (<
50%) of the TMEM106B targeting miRNA-312 cluster members (miRNA-132, miRNA-

10
132*, miRNA-212) compared to controls, resulting in the derepression of TMEM106B
expression (69), further strengthening the hypothesis that reducing TMEM106B
expression may be beneficial in FTLD-GRN patients (70).
The first GWAS study to search for genetic modulators of CSF PGRN levels identified a
SNP (rs708384) in another gene encoding a transmembrane protein, FAM171A2, for
which the minor allele (A allele) was significantly linked to lower CSF PGRN levels in a
dose-dependent manner (71). FAM171A2 is highly expressed in cerebral vascular
endothelium and microglia in the mouse brain (71). HEK293 cells transfected with the
minor allele exhibited higher FAM171A2 expression levels compared to the major allele
(71). Overexpression of FAM171A2 in human umbilical vein endothelial cells decreased
PGRN expression and secretion, and siRNA knock-down of FAM171A2 significantly
increased PGRN expression (71). Little is known about the function of the single-pass
type I membrane protein FAM171A2; therefore, the precise mechanisms underlying its
regulation of PGRN expression are currently unclear (71).
The discovery of genetic variability within the GRN allele itself has led to the
identification of novel mechanisms that modify GRN expression levels. In particular, the
minor T-allele rs5848, a SNP in the 3’ untranslated region (UTR) of GRN, has been
shown to affect the predicted binding site of miRNA-659 (72). The presence of the minor
T-allele enhances the binding affinity of miRNA-659, thus expediting the rate of GRN
mRNA turnover (72). Homozygous carriers of rs5848 exhibit decreased serum and CSF
PGRN levels (58,72,73), though there is mixed evidence correlating this genotype with
an increased risk of developing non-GRN linked FTLD-TDP (74). Moreover, FTLD-GRN
11
patients with the common R493X GRN mutation carrying the A-allele of SNP rs9897526
found 21 bp downstream of the GRN intron 2 splice donor site of their intact allele
exhibit delayed disease progression (75). Though the precise mechanism for this delay
is currently unclear, its proximity to the splice site suggests it may alter the maturation
and stability of GRN mRNA. Additional non-coding regions of the GRN allele have also
been implicated in regulating GRN expression, including the methylation state of the
GRN promoter which is inversely correlated with GRN expression in lymphoblasts and
post-mortem brain tissue derived from FTLD patients (76,77). Expression of DNA
methyltransferase 3a (DNMT3a) mRNA is upregulated in the brain tissue of FTLD-TDP
patients compared to controls and thus may be responsible for hypermethylation of the
GRN locus (76). Also, overexpressing DNMT3a in lymphoblasts resulted in decreased
GRN expression, which could be reversed through treatment with a DNMT inhibitor
(76). Improving the understanding of the epigenetic regulation of GRN expression may
lead to the identification of novel therapeutic targets.
Several proteins are known to interact directly with PGRN, which mainly function to
regulate its trafficking and cellular localization. Sortilin (SORT1) is a type I membrane
glycoprotein and high-affinity neuronal receptor for PGRN, mediating PGRN
endocytosis and delivery to the lysosome, therefore regulating extracellular PGRN
concentrations (78). Sort1-/- knockout (KO) mice exhibit elevated (2.5-5X) brain and
serum levels of PGRN (78). The minor C-allele SORT1 SNP (rs646776) is associated
with decreased serum PGRN levels, with each allele copy generating a subsequent
~15% decrease, though it is unlikely that this SNP influences CNS PGRN levels since it

12
primarily alters hepatic SORT1 expression levels (79). Prosaposin (PSAP), another
protein that interacts with PGRN, is a precursor protein that is localized to the lysosome,
where it is processed into saposin (SAP) activators that are critical for glycosphingolipid
degradation (80). Further, PSAP facilitates the SORT1-independent delivery of
extracellular PGRN to lysosomes, made evident by the 5X increase in serum PGRN
levels in Psap-/- mice (81). At a genetic level, more copies of the PSAP minor T-allele
SNP (rs1867977) were correlated with decreased plasma PGRN levels in healthy
controls (82). Additional PGRN binding partners have been identified with roles
regulating extracellular PGRN levels, including members of the endoplasmic reticulum
(ER) chaperone network, such as calreticulin and disulfide isomerases ERp57 and
ERp5 (83). These factors likely play a key role in orchestrating the PGRN folding
process by forming several disulfide bonds throughout the cysteine-rich polypeptide.
1.1.7 Clinical and neuropathological phenotypes of FTLD-GRN and CLN11
FTLD-GRN includes a wide range of clinical presentations, including bvFTD, nfvPPA,
svPPA, Parkinson’s disease-like syndromes such as corticobasal syndrome, and an
amnestic disorder resembling AD (84). The most common clinical presentation in FTLD-
GRN patients is bvFTD, though there is also a high prevalence of nfvPPA (35,85).
Clinical symptoms of bvFTD in FTLD-GRN cases commonly include behavioural
disinhibition and increased apathy (35), while nfvPPA symptoms include effortful
inconsistent speech and agrammatism (86). Extrapyramidal motor dysfunction is rare in
FTLD-GRN but occurs with high prevalence in particular families beginning with
muscular rigidity and akinesia, eventually progressing to an inability to walk (35,87).

13
Generally, disease duration ranges from 3 to 12 years (84). The common
neuropathological hallmarks in FTLD-GRN include global atrophy of the frontal,
temporal, and, in some cases, the parietal lobes (85), hypometabolism of frontotemporal
cortices (88), significant white matter degeneration (89), FTLD-TDP type A pathology in
neocortical layer II (90,91), microgliosis (92), and pathological features associated
neuronal ceroid lipofuscinosis (NCL) including elevated expression of lysosomal
enzymes (93). Interestingly, only the unaffected FTLD-GRN post-mortem brain regions
show a clear reduction in PGRN protein levels compared to healthy control samples,
whereas atrophied regions show similar PGRN levels to controls (94). The elevated
PGRN in diseased brain regions may be derived from infiltrating microglial populations,
known to secrete high levels of PGRN.
The growing interest in understanding the contribution of lysosomal dysfunction to
FTLD-GRN disease progression stems from the recent discovery of a rare form of NCL
caused by homozygous GRN LOF mutations, CLN11 (95). Two GRN-null siblings were
the first identified cases of CLN11, presenting with early adulthood-onset NCL,
developing progressive retinal dystrophy, cognitive decline, cerebellar ataxia, and
recurrent myoclonic seizures. Eleven CLN11 cases have now been identified, exhibiting
a range of early- to late-onset phenotypes (96). The first neuropathological
characterization of an early-onset case (died age 27) found severe cerebellar atrophy,
numerous lipofuscin deposits in hippocampal and temporal cortical neurons, and early
signs of cytoplasmic translocation of TDP-43 with a lack of classic FTLD-GRN
inclusions (96). Therefore, these findings demonstrate that GRN-mutation dosage

14
strongly impacts the severity and age of disease onset and suggest that FTLD-GRN
may neuropathologically resemble a mild form of NCL (95).
1.2 PGRN neurobiology
In a quest to characterize novel granulocyte peptides with unknown immunoregulatory
functions, Bateman et al. discovered several GRNs in a minor subfraction of cysteine-
rich peptides purified from human leukocyte extracts (97). Key sequences of these
approximately 6 kDa cysteine-rich peptides are highly conserved between species
suggesting a long evolutionary history. Phylogenetic analysis of the GRN motif suggests
it evolved only once ~1.5 billion years ago in a primordial unicellular eukaryote predating
the divergence of the plant and animal kingdoms (98). These GRNs are believed to
have played a role in early cell signaling mechanisms, predating the evolution of
classical growth factor pathways such as Wnt, Hedgehog, and TGF-β (99,100). Given
PGRNs ancient evolutionary origin, it is not surprising that it is a key player in a diverse
array of biological phenomena, including proliferation (101), wound healing (102),
immunoregulation (103), embryogenesis (104,105), neurodegeneration (35,92), and
autophagy-lysosomal function (106,107). The identification of GRNs in such a variety of
biological contexts resulted in an equally divergent nomenclature; therefore, PGRN
(108) is known synonymously as granulin-epithelin precursor (109), proepithelin (110),
PC cell-derived growth factor (111), acrogranin (112), and epithelial transforming growth
factor (113).

15
1.2.1 PGRN structure
The human progranulin gene is located on chromosome 17q21 and consists of 12
coding exons (114). Full-length PGRN is an 88 kDa multifunctional secreted
glycoprotein made up of 7.5 cysteine-rich repeat units known as GRN modules (para-
GRN & GRN1-7) separated by short intervening spacer/linker sequences and an N-
terminal 17 amino acid signal peptide for secretion (111). Post-translational
glycosylation of PGRN contributes 20 kDa to the 68 kDa 593 amino acid polypeptide. It
is a member of the cysteine-rich mini protein family, which are generally known to
function as hormones, growth factors, ion channel modulators, or enzyme inhibitors. As
its name suggests, PGRN is a pro-protein, which cleavage gives rise to individual 6 kDa
GRNs. The highly conserved GRN modules consist of 4 pairs of cysteines plus 2
additional cysteine residues at each amino/carboxyl-terminal (CX5-6 CX5CCX8CCX6CC
XDXXHCCPX4CX5-6C) for a total of 12 cysteines, except for GRN-1 and para-GRN,
which possess 10 and 6 cysteine residues, respectively. Though no tertiary structures
have been established for full-length PGRN, some of the GRNs (GRN-2, -4, and -5)
have been crystallographically solved, identifying that these cysteine residues
significantly contribute to PGRNs rigid peptide backbone. The globular structure of
individual GRNs is composed of a core of 6 disulfide bridges forming a parallel stack of
4 beta-hairpins that twists through a left-handed super-helix (115,116).
1.2.2 PGRN expression in the brain
During early murine embryonic neurodevelopment (E15.5), Grn expression is limited to
small cell populations throughout the developing brain, often associated with

16
neurovasculature and epithelial populations (117). Neuronal Grn expression gradually
increases from E15.5 to P7, though it does not appear to be critical for neocortical
development since immature neurons migrating to the cortical plate (E15.5) lack Pgrn
immunoreactivity (117). Post-mitotic mature cortical neurons begin to show progranulin
positivity at P0, which increases into adulthood (117). Brightly Pgrn immunoreactive
Iba1+ amoeboid microglia are also scattered throughout the embryonic and postnatal
mouse brain from E15.5 to P14, often localized along developing white matter tracts
(117). In adult mice, Pgrn is expressed widely throughout the neocortex and
hippocampus, with immunoreactivity observed most prominently in large pyramidal cells
in cortical layers V/VI and the CA3 hippocampal region (117). Moderate Pgrn
expression is also observed in the thalamus, hypothalamus, amygdala, and midbrain,
with little to no expression in the striatum and brain stem (117). Additionally, only the
large Purkinje neurons of the cerebellum are positive for Pgrn staining. Interestingly, this
Pgrn expression is achieved despite a lack of a neuronal Grn expression observed
throughout the adult cerebellum, possibly indicating that Purkinje cell Pgrn may be
derived from distal brain regions (117).
Intracellularly, PGRN is primarily localized to lysosomal-associated membrane protein 1
(LAMP1) positive early lysosomes, the Golgi apparatus, and in vesicles immediately
adjacent to and partially overlapping with Ras-related protein Rab7+ late endosomes
(78,92). Recent findings suggest that once transported to the lysosome, full-length
PGRN undergoes rapid proteolysis into stable GRNs (118). Given that most anti-PGRN
antibodies also detect a subset of GRNs, it is likely that a significant proportion of

17
intracellular PGRN immunoreactivity likely represents cleaved GRNs.
Histological characterization of CNS cell type-specific Pgrn expression patterns has
shown that both neurons and microglia express Pgrn, though relative staining intensity
is much greater in microglia (117). GFAP-positive astrocytes, on the other hand, have
been shown to exhibit no Pgrn immunoreactivity in the adult mouse brain (117).
Nevertheless, subsequent western blot analysis of astrocyte- and neuron-enriched
whole mouse brain lysate fractions and single-nuclei RNA-sequencing (snRNA-seq) of
Grn+/+ mouse thalami have both observed similar baseline Pgrn/Grn expression levels in
both astrocyte and neuronal populations (119,120). Moreover, cultured primary human
astrocytes (121) and our own hiPSC-derived astrocytes (122) have both been shown to
express and secrete PGRN; thus, suggesting that astrocyte Pgrn expression in the adult
mouse brain may have been below the threshold of histological detection in the
previous study (117).
Conditional neuronal- and microglia-specific Grn KO mouse models have further
delineated individual cell types' contributions to total brain Pgrn expression levels. A
conditional neuronal floxed Grn KO mouse achieved through Nestin promoter-driven
Cre recombinase expression resulted in a 50% reduction in CNS Pgrn and no
detectable Pgrn in primary neuronal cultures, implying that approximately half of mouse
CNS Pgrn originates in neurons (123,124). The initial attempts to generate conditional-
microglia Grn KO mice, on the other hand, proved more difficult with primary microglia
cultures and isolated adult microglia only exhibiting a 50% decrease in Grn mRNA/Pgrn
18
expression (125-128). However, a subsequent study using the tamoxifen-inducible Cre-
estrogen receptor (CreER) fusion protein KO system driven by the microglial promoter
Cx3Cr1 achieved a 95% reduction in isolated adult microglial Grn mRNA expression
and a 26% decrease in overall brain Pgrn levels (129). Thus, suggesting that microglia
produce approximately a quarter of total CNS Pgrn, despite representing only 10% of
mouse brain cells (130); therefore, the remaining unaccounted for ~25% of CNS Pgrn
expression is likely collectively produced by astrocytes, endothelial cells, and
oligodendrocytes (120).
1.2.3 PGRN regulation in the brain
Mature neurons are post-mitotic and dependent on a high basal rate of autophagy
compared to non-neuronal cells since toxic metabolites and misfolded proteins cannot
be diluted through serial cell division. Transcription factor EB (TFEB) is a master
regulator of autophagy mediating the activation of the coordinated lysosomal expression
and regulation (CLEAR) gene network resulting in increased lysosomal biogenesis and
expression of lysosomal enzymes (131). The GRN gene possesses two TFEB binding
sites upstream of its coding sequence (131,132); therefore, GRN expression can be
upregulated by activation of TFEB (132,133). Inhibiting the key negative regulator of
autophagy, mTORC1, which functions to maintain TFEBs cytosolic localization (134),
increases PGRN expression in several cell lines, though importantly not in neuronal cell
types (135). Activating autophagy with the disaccharide trehalose through a mTORC1-
independent mechanism has been shown to increase GRN expression in hiPSC-
derived neurons in a partially TFEB-dependent manner (135).
19
Additionally, a genome-wide RNAi screen performed in the Neuro2A (N2a) mouse
neuroblastoma cell line identified that several genes regulating GRN expression were
enriched for autophagy-lysosomal pathways (ALPs) involved in both transcriptional and
post-transcriptional mechanisms (136). For example, when expression of the autophagy
regulator Foxo1 transcription factor was suppressed, Pgrn levels were increased by 1.7-
fold in N2a cells (136). Moreover, siRNA knockdown of Foxo1 in primary mouse cortical
neurons increased both Grn expression and Pgrn secretion, and simultaneous siRNA
knockdown of both Foxo1 and Grn prevented the accumulation of enlarged lysosomal
vesicles observed following siRNA-mediated Grn knockdown alone (136). The opposing
effects of TFEB and FOXO1 ALP transcription factor activation on the regulation of Grn
expression highlights the complex role PGRN plays in regulating lysosomal biology,
which will be explored further in the following sections.
Microglia constantly survey the brain parenchyma for damaged or unnecessary neurons
and synapses, infectious agents, and abnormal chemical stimuli. The GRN gene is
highly expressed in the myeloid lineage and is strongly upregulated in response to brain
and spinal cord injury (117,137). The GRN promoter region also contains several
CCAAT-enhancer-binding protein β (C/EBPβ) response elements (138). The C/EBPβ
transcription factor is commonly activated by the action of upstream pro-inflammatory
cytokines such as IL-6, known to induce GRN expression (139,140). The vitamin A1
metabolite all-trans retinoic acid (ATRA) has also been shown to induce upregulation of
GRN mRNA expression, specifically in cells of myeloid origin (141). Though the GRN

20
allele lacks a canonical retinoic acid response element in its promoter, ATRA may
activate downstream transcription factors capable of upregulating GRN transcription
(141). Interestingly, treating primary human fetal microglia cultures with pro-
inflammatory cytokines (IL-1β + IFNγ) and endotoxins (LPS, Poly I:C) was shown to
significantly suppress GRN/PGRN expression at the transcript and protein level (121).
Additionally, this study also demonstrated an opposing phenomenon in primary human
fetal astrocyte cultures, which despite lower baseline PGRN levels, significantly
upregulated GRN/PGRN expression in response to stimulation with either IL-1β + IFNγ
or Poly I:C (121). LPS treatment was omitted because human astrocytes lack TLR4 co-
receptor CD14 expression necessary for LPS-induced TLR4 activation (142).
Differential expression of alternative splice variants has also been implicated in the
regulation of GRN expression. Alternatively spliced GRN transcripts harboring a long
5’UTR sequence (219 nucleotides) containing two upstream open reading frames
(ORFs) exhibit translational repression and lower mRNA stability compared to
transcripts bearing short 5’UTRs (38-93 nucleotides) that lack upstream ORFs (143).
Upon GRN mRNA translation and translocation into the ER, PGRN is post-
translationally processed. Here, PGRN interacts with ER chaperones to ensure correct
protein folding through disulfide bond formation and undergoes regulated glycosylation
(144,145), which is essential for its sorting through the secretory pathway (146). After
transit through the trans-Golgi network, PGRN is either secreted into the extracellular
environment (147) or localized to the endolysosomal network via SORT1-dependent or
SORT1-independent transport mechanisms (78,81,148). Once secreted, full-length

21
PGRN can also undergo reuptake or be taken up by neighboring cells resulting in
lysosomal delivery; therefore, the relative abundance of endocytic PGRN receptors
(SORT1, LRP1, M6PR) in the plasma membrane plays a key role in regulating the
levels of intracellular PGRN/GRNs (78,81,148). Lysosomal PGRN can be cleaved into
individual GRNs by the lysosomal protease cathepsin L (CTSL) and at least one
additional unknown lysosomal enzyme that may be activated by cathepsin B (CTSB)
(149,150). As previously discussed in section 1.1.6, extracellular PGRN has been
shown to interact with another pro-protein, PSAP, which promotes PGRN homodimer
and oligomer formation and regulates the extracellular levels of PGRN (82). The ratio of
secreted full-length PGRN to individual GRNs is regulated by the secretory leukocyte
protease inhibitor (SLPI) (103). SLPI forms a complex with full-length PGRN preventing
its conversion into GRNs by extracellular proteases (e.g., elastase, metalloprotease
ADAMTS-7, proteinase 3), which functions to promote an anti-inflammatory and wound
healing response (103). SLPI is upregulated by neurons and astrocytes in response to
either neurological damage or stimulation with pro-inflammatory cytokines (121,151)
and, therefore, may function to regulate PGRN biology in the brains of FTLD-GRN
patients.

22
Figure 1-1 Brain regulation of extracellular PGRN proteolysis. Upon detecting
cellular damage/pathogen associated molecular patterns, microglia secrete
proinflammatory cytokines into the extracellular space. This induces upregulation and
secretion of SLPI by neurons and astrocytes. Microglia secrete the majority of
extracellular PGRN, which can be degraded into GRNs by extracellular proteases
(elastase, ADAMST-7, proteinase 3), however, neuron/astrocyte-derived SLPI can bind
to PGRN and protect it from proteolysis into GRNs, enhancing PGRNs anti-
inflammatory function.

23
As highlighted in section 1.1.6, genetic variance in TMEM106B has been identified as a
major modifier of FTLD-GRN disease progression (66). The TMEM106B type-II
transmembrane protein is highly expressed in neurons and is localized to the
endolysosomal compartment, where it controls the size, number, motility, and trafficking
of lysosomes in both neuronal and non-neuronal cell types (63,152,153).
Overexpression of TMEM106B in neurons has been shown to induce lysosomal
dysfunction resulting in enlarged vacuolar lysosomes with impaired acidification and a
reduced endocytic degradative capacity (63,152,154). Contrary to the GOF risk
hypothesis proposed based on SNP data, excess Tmem106b in N2a cells has been
shown to cause intra- and extracellular accumulation of PGRN (152). Further,
exogenously delivered TMEM106B expression in primary cortical mouse neurons
significantly increased TFEB nuclear localization activating expression of the CLEAR
gene network, providing a potential mechanism for TMEM106B-dependent positive
regulation of CNS PGRN expression (63).
Nevertheless, recent in vivo evidence from Tmem106b KO and overexpression studies
in the context of Grn-deficiency suggest that both resulted in detrimental consequences
to disease progression (155-158), therefore complicating exploration into the potential
therapeutic benefits of disrupting TMEM106B function. Another transmembrane protein,
FAM171A2, expressed in murine cerebral vascular endothelial cells and microglia, has
recently been demonstrated to regulate CSF PGRN levels (71). FAM171A2
overexpression and knockdown induced suppression and increased levels of PGRN,
respectively, indicating an inverse proportional relationship between FAM171A2 and

24
PGRN expression levels (71). Therefore, the mechanisms driving FAM171A2-mediated
regulation of CSF PGRN levels are currently under active investigation.
1.2.4 Mouse models of Grn-deficiency
Over the past 15 years, significant progress has been made characterizing the role of
PGRN in the CNS through the use of Grn KO mouse models. Although FTLD-GRN is
caused by GRN haploinsufficiency, Grn+/- mouse models have not replicated the
majority of the pathological hallmarks observed in this variant of FTLD-TDP (159).
Therefore, most studies have focused on models bearing homozygous deletion of Grn
expression (Grn-/-), which better recapitulate FTLD-GRN pathological progression
(92,93,106,107,159-164) but would be more accurately described as a model of the rare
form of NCL (CLN11) caused by homozygous LOF GRN mutations. The
characterization of Grn-/- mice has uncovered that PGRN is an essential regulator of
neuroinflammation, autophagy, and synaptic pruning in the CNS.
1.2.4.1 Neuroinflammation
Microgliosis is a hallmark of FTLD-GRN, in which the affected brain regions are
populated with increased numbers of hyperactivated microglia with thick processes and
an enlarged soma. Therefore, major research efforts have sought to better understand
the role of PGRN in regulating inflammatory processes. Cultured Grn-/- and
GrnR493X/R493X macrophages and microglia express and secrete elevated pro-
inflammatory cytokines in response to treatment with inflammatory mediators, likely due
to their suppressed levels of Il-10 expression and exaggerated NF-κB activation

25
(125,129,161). These excessive pro-inflammatory phenotypes can be acutely rescued
through exogenous delivery of murine Grn (125,165). Extraordinarily, Grn-/- microglia
stimulated with LPS + IFNγ were found to secrete elevated levels of Il-10 into the culture
medium, despite lower levels of Il-10 mRNA, reflecting differential regulation at the
transcriptional and secretory levels (125). Nevertheless, increased Il-10 secretion was
insufficient to reduce the increased pro-inflammatory state observed in Grn-/- microglia,
possibly indicating that Grn-/- microglia are less responsive to the anti-inflammatory
action of Il-10 signaling (125). Treatment of Grn+/+ rat primary cortical neurons with
human PGRN increased expression and secretion of cytokines/chemokines associated
with chemoattraction, including Il-10 (166). Grn-/- hippocampal slices are significantly
more sensitive to microglia-mediated neurotoxicity than Grn+/+; however, this phenotype
can be replicated in Grn+/+ slices by inhibiting Il-10 function (161). These findings
highlight PGRNs essential role in suppressing hyperinflammatory immune responses.
Pgrn-deficient microglia and macrophages overexpress and secrete excessive
quantities of TNFα (125,161). Several reports have suggested that Pgrn mediates its
anti-inflammatory effects by extracellularly disrupting TNFα signaling through direct
inhibition of its plasma membrane receptors (TNFR1/2) (167,168); however, the veracity
of this direct binding hypothesis has been challenged (169-171). Whether PGRN
directly modulates TNFα signaling through TNFR1/2 binding competition or an unknown
indirect mechanism, several studies have clearly established that PGRN and the multi-
GRN derivative Atsttrin negatively regulate TNFα expression and function (167,172-
174). Conditioned media obtained from activated (LPS + IFNγ) primary Grn-/- microglia
26
induced a greater increase in cell death in Grn+/+ primary cortical neurons than media
derived from Grn+/+ microglia, suggesting that activated Grn-deficient microglia may
secrete neurotoxic factors (125). A recent publication by the Huang lab further
elucidated this process, establishing that elevated levels of complement proteins (C1qa
and C3b) in primary Grn-/- microglia conditioned media (MCM) are at least partially
responsible for increased primary cortical neuronal death compared to Grn+/+ MCM
(120). Since inhibition of membrane attack complex (MAC) formation completely
blocked Grn-/- MCM-induced neurotoxicity, it is likely that the additional toxicity
promoting factors in Grn-/- MCM may be downstream complement pathway components
involved in MAC assembly (120).
Modelling complete loss of Pgrn in vivo consistently results in significant astro- and
microgliosis established as early as 7 months of age, which then rapidly accelerates
throughout the aging process (159,161,162,164,165). The most neuroinflammation-
prone regions in Grn-/- mouse brain include the cerebral cortex, CA3 hippocampal
region, and ventral posteromedial (VPM)/ventral posterolateral (VPL) thalamic nuclei.
Furthermore, a region of cortical layer IV in Grn-/- mice (S1BF) innervated by the highly
pathologically vulnerable VPM/VPL thalamic nuclei has also been shown to exhibit
increased microgliosis (164). Interestingly, a recent study examining differentially
expressed genes in primary Grn-/- microglia identified significant enrichment for the
overexpression of cell cycle-related genes, suggestive of an increased proliferative
capacity in line with the observed microgliosis phenotype (175). The VPM/VPL regions
of the thalamus in aged Grn-/- mice have also been shown to accumulate deposits of the

27
complement proteins C1qa and C3b, which when disrupted (Grn-/-;C1qa-/- and Grn-/-
;C1qa-/-;C3-/- mice) partially reduces the severity of thalamic microgliosis (92,120). Grn-/-
microglia also exhibit impaired motility as evidenced by their decreased chemotaxis
towards ADP/ATP gradients and limited process extensions/retractions observed at
baseline and post-laser-induced injury (129). The loss of Pgrn has also been shown to
increase the sensitivity of Grn-/- mice to both chemically- and physically-induced CNS
damage resulting in exaggerated neuroinflammation and increased neurotoxicity
compared to Grn+/+ (125,176). Grn-/- mice acutely infected with Listeria monocytogenes
(L. monocytogenes) mount a dysfunctional innate immune response that fails to
efficiently clear the bacterial burden in various organs (106,161).
The previously held notion that microglia only exist in the binary categorization of either
resting or activated (M1 vs. M2) has been disputed by transcriptomic analyses, which
have identified greater biological complexity in the form of several unique homeostatic
and disease-associated microglia (DAM) gene expression signatures (177). Several
studies have transcriptomically characterized aged Grn-/- brains identifying upregulated
genes related to innate immunity, including several cytotoxic factors (92,107,164).
Additionally, the aforementioned snRNA-seq study of microdissected Grn+/+ and Grn-/-
thalami identified drastic and dynamic microglia-specific transcriptional changes
throughout disease progression, characterized by downregulation of homeostatic genes
and overexpression of genes associated with inflammation, lysosomal function, and
neurodegeneration (120). Moreover, a similar 11 gene DAM signature emerged
following quantification of differentially expressed genes in Grn+/+ and Grn-/- primary

28
microglia cultures, including the downregulation of the homeostatic genes Tgfbr1 and
Csf1r (175). Intriguingly, conditionally depleting either neuronal or microglia Grn
expression fails to replicate any of the major neuropathological hallmarks observed in
Grn-/- mice. This may be because only partial microglial Grn KO (LysM promoter-driven)
was achieved compared to nearly complete penetrance in conditional neuronal KO
models (123,124,127,128). However, a recent effort achieved a more robust depletion
of Grn expression using the tamoxifen-inducible CreER system driven by the microglial-
specific Cx3Cr1 promoter and observed behavioural deficits in aged mice resembling
Grn-/- phenotypes (129). Cumulatively, these findings suggest that PGRN plays a major
role in suppressing aberrant microglial activation throughout the aging process.
1.2.4.2 Lysosomal dysfunction
Since the identification and characterization of CLN11, a rare form of NCL caused by
homozygous GRN mutations, there has been growing research interest in uncovering
the role of PGRN in lysosomal function. Lysosomal abnormalities are among the first
observable phenotypes in Grn-/-, developing months before chronic hyperinflammation
and microgliosis (107,119,120,178). 3 month old Grn-/- hippocampal neurons exhibit
increased lysosomal size and abundance, often presenting with lamellar
pseudomembranous inclusions characteristic of NCL (107). Transcriptomic and
proteomic analysis of 2 month old Grn-/- mice cerebral cortex identified significant
upregulation of several key lysosomal enzymes (Hexb, Tpp1, Ctsb, Ctsl, Dpp7) (179).
Lipofuscin accumulation, a hallmark of NCL, commonly observed in neuropathological
hot spots of aged Grn-/- brains (159,163-165), has been observed in the thalamus of 2

29
month old Grn-/- mice (179). Moreover, 2-3 month old Grn-/- mice exhibit major
deficiency in xenophagy (ability to clear intracellular pathogens) following intravenous
infection with L. monocytogenes, with increased bacterial burdens detected in the brain,
liver, and spleen in Grn-/- mice 1 week post-infection (106,161). Lipidomic analysis of 2-3
month old Grn-/- brains has detected decreased levels of both di-18:1 and di-22:6
bis(monoacylglycerol)phosphates, lipid species known to stimulate lysosomal hydrolase
activity important for lysosomal sphingolipid degradation (Denali Therapeutics,
Alzheimer’s Association International Conference 2020). However, these studies failed
to identify which specific cell populations are most responsible for driving lysosomal
dysfunction.
Following the discovery that aged Grn-/- mice brains exhibit elevated levels of NCL
related proteins, such as SapD (PSAP peptide product), cathepsin D (Ctsd), Lamp1,
Tmem106b, and subunit C of mitochondrial ATP synthase (93), the Capell lab sought to
determine whether a particular CNS cell type plays an outsized role in the establishment
of these lysosomal pathologies. Western blot analysis of whole-brain lysates derived
from aged 20 month old Grn-/- mice found an increase in the maturation rate of
cathepsin enzymes (Ctsd, Ctsb, and Ctsl), resulting in increased enzyme activity that is
absent in 3 month old Grn-/- mice (119). However, characterizing microglial enriched
lysate fractions from young Grn-/- brains revealed decreased cathepsin maturation
levels, indicated by the accumulation of the pro-forms of Ctsd, Ctsb, Ctsl, and Ctss, not
observed in Grn+/+ microglial lysates (119). Furthermore, these young Grn-/- derived
microglial enriched fractions also possessed increased lysosomal proteins Lamp1 and

30
SapD. On the other hand, the microglial depleted fractions produced from young Grn-/-
and Grn+/+ express similar levels of the pro- and mature-forms of cathepsins and exhibit
no increase in Lamp1 or SapD (119). Strikingly, throughout the aging process (3 months
to 12 months), dysregulation of Ctsd and Ctsb maturation patterns appeared to be
partially normalized in Grn-/- microglia, while non-microglial cells compensated for the
early decreased degradative capacity of microglia by increasing their respective Ctsd
enzyme activity (119). Therefore, providing evidence supporting microglia as the
primary drivers of the early lysosomal pathology in Grn-/- mice. These results are
supported by several CNS cell type-specific transcriptomic analyses suggesting that
microglia-specific transcriptomic signatures in Pgrn-deficient brains exhibit the highest
degree of differential gene expression, transitioning from a homeostatic to disease state
characterized by significant endolysosomal dysfunction (92,106,120).
The development of FTLD-TDP type A pathology in FTLD-GRN patients is thought to be
caused by an inability to proteolytically process nuclear and cytoplasmic aggregated
TDP-43 granules. Significant research efforts have been conducted to explore PGRNs
role in regulating the autophagolysosomal pathway to better understand this
pathological hallmark. Grn-deficient mice have been shown to accumulate neuronal
cytoplasmic inclusions of both TDP-43 and the ubiquitin-binding autophagosome cargo
protein p62, most notably in the thalamus and hippocampus (93,120,161,164,165). This
selective vulnerability was elegantly demonstrated by infecting both Grn+/+ and Grn-/-
primary cortical neurons with an adeno-associated virus (AAV) vector expressing the
aggregation-prone C-terminal fragment (CTF) of TDP-43. This resulted in an increase in

31
TDP-43 CTF levels in Grn-/- neurons that could be rescued by recombinant (rec.) Pgrn
treatment and phenotypically replicated in Grn+/+ neurons by inhibiting autophagosome
degradation (106). Activation of autophagy by serum/amino acid starvation in primary
Grn-/- microglia and cortical neuron cultures has been used to further highlight their
propensity for overexpression of lysosomal genes/proteins (180) and impaired
autophagosome clearance (106), both of which could also be reversed through
exogenous delivery of rec. Pgrn. Grn-/- primary cortical neurons and Grn-/- cortical tissue
have been found to express reduced levels of phosphorylated 5’ AMP-activated protein
kinase alpha, a key positive regulator of autophagy; therefore, PGRN may positively
regulate upstream autophagolysosomal signaling pathways (106). Together these
findings suggest that impaired autophagy caused by PGRN deficiency plays a central
role in TDP-43 pathology.
1.2.4.3 Dysregulated lipid metabolism
Lipidomic analysis of the frontal cortices of aged (12 month old) Grn-/- mice identified the
accumulation of polyunsaturated triacylglycerides (TAGs) and cholesterol esters (CEs),
accompanied by a corresponding reduction in diacylglycerides (DAGs) and
phosphatidylserines of increasing chain length and number of unsaturated bonds (107).
Thus, suggesting that PGRN/GRNs are involved in the regulation of long-chained
polyunsaturated fatty acid metabolism. This hypothesis is further supported by the
observed Grn-/- specific transcriptomic differential downregulation of DAG-specific lipid
hydrolases, providing a potential mechanism for PGRN-dependent positive regulation of
the enzymatic conversion of phosphatidic acid into DAGs (107). Long polyunsaturated

32
TAG-rich lipid-droplets (LDs) are produced in cells of myeloid origin in response to
inflammation and stress; intriguingly, a recent study identified GRN as a primary
negative regulator of LD formation (181). Additionally, they found that 9-10 month old
Grn-/- mice hippocampi contain increased levels of LD-accumulating microglia, a
process previously identified in a Drosophila model of neurodegeneration (182). Grn-/-
LD-rich microglia exhibited decreased phagocytic activity and secreted elevated levels
of pro-inflammatory cytokines following LPS stimulation compared to LD-low Grn-/-
microglia. Since lysosomal dysfunction precedes the establishment of pro-inflammatory
phenotypes in Grn-/- brains and LDs are known sites of cytokine production and storage
(183), altered lipid metabolism caused by GRN deficiency may prime microglia for
hyperinflammation throughout the aging process.
Huang et al. recently conducted whole-brain proteomic network analysis in 3 and 19
month old Grn+/+ and Grn-/- mice. This unbiased quantitative proteomic analysis
replicated previously described early lysosomal dysfunction phenotypes (179), detecting
overexpression of lysosomal proteins (Gns, Scarb2, Hexb, Ctss); however, they also
observed a substantial subset of lysosomal proteins that exhibited decreased
expression (178). A significant proportion of the most downregulated proteins identified
in 3 month old Grn-/- pooled brain lysates were enriched for proteins involved in
lysosomal lipid catabolism, with functions ranging from regulation of lipogenesis and
lipid homeostasis to enzymatic roles in lipid degradation pathways (178). The most
significantly elevated protein in the aged Grn-/- cohort was the transmembrane type I
glycoprotein Gpnmb (178), which exhibits diverse cellular functions and has been found

33
to exhibit increased expression in several neurodegenerative diseases (184). CNS
Gpnmb expression was primarily observed in Iba1+ microglia and was most prominent
in the thalamus of 19 month old Grn-/- mice (178). Though it is unclear whether Gpnmb
plays a direct role in Grn-/- pathophysiology, results demonstrating that Gpnmb is
upregulated in the murine CNS in response to direct inhibition of the lysosomal
hydrolase glucocerebrosidase (GCase) suggest that it may be elevated in Grn-/- brains
in response to lysosomal dysfunction (185). Moreover, this hypothesis is further
strengthened by findings that Pgrn directly regulates GCase lysosomal localization and
enzymatic activity levels (186,187). Interestingly, microglia expressing elevated levels of
Gpnmb have been implicated in the demyelination process in multiple sclerosis (188),
potentially explaining the significant decrease in myelin basic protein levels found in the
aged Grn-/- brain (178), providing another plausible link between lysosomal dysfunction
and the onset of chronic inflammation. Once again, the early establishment of lysosomal
dysfunction was shown to precede the onset of neuroinflammatory processes,
suggesting that disruptions to lysosomal lipid metabolism may represent a key
instigating factor driving neurodegenerative processes in FTLD-GRN.
1.2.4.4 Neural connectivity deficits and neurodegeneration
Microglia play a pivotal role in modulating neural networks during neurodevelopment
and aging through a process known as synaptic pruning, by which microglia trogocytose
(selective partial phagocytosis) the membranes of presynaptic boutons and axons
(189). The disruption of microglial immunoregulation in the CNS of mouse models of
Grn deficiency has profound downstream consequences on the neural activity of the

34
thalamocortical circuit, which may drive behavioural abnormalities (92).
Electrophysiological recordings of hippocampal slice cultures have demonstrated
reduced synaptic connectivity in Grn-/- mice, likely due to impaired synaptic plasticity
resulting in an overall depression of activity (163). Additionally, the Leavitt laboratory
also showed that the apical dendritic arbors of hippocampal CA1 region pyramidal
neurons showed significantly lower spine density in Grn-/- compared to Grn+/+ (163).
Grn-deficient primary microglia co-cultured with Grn+/+ primary cortical neurons engulfed
higher levels of C1qa-tagged synapses resulting in lower synaptic density surrounding
Grn-/- microglia (92). Grn-/- mice also exhibited decreased synaptic density in the ventral
thalamus, which was first detected at 7 months of age and continues to decrease
throughout the aging process (92). The rescue of synaptic loss in double Grn-/-;C1qa-/-
and triple Grn-/-;C1qa-/-;C3-/- KO mice demonstrated that complement-mediated
microglial synaptic pruning is responsible for this observed Grn-/--specific decrease in
synaptic density (92,120).
These neurological aberrancies drive behavioural defects in both Grn+/- and Grn-/- mice
(160,162,163,190). Two of the most well-characterized Grn-/- behavioural abnormalities
include a chronic grooming phenotype resembling a form of obsessive-compulsive
disorder (OCD) that results in an increased incidence of skin lesions and a male-specific
increase in anxiety (92,160,163,165). Remarkably, the C1qa-dependent synaptic
pruning in Grn-/- VPM/VPL thalamic nuclei has been shown to selectively target
inhibitory synapses for elimination (92). The loss of inhibitory synapses in the
thalamocortical circuit in Grn-/- mice results in electrophysiological hyperexcitability in

35
thalamic slice cultures, which may in part be responsible for their excessive grooming
phenotype (92). Incredibly, both the hyperexcitability and chronic grooming Grn-/-
phenotypes can be rescued by C1qa deletion (92).
Given the association of increased plasma TNFα levels in OCD patients (191) and the
growing consensus that PGRN negatively regulates TNFα signaling, researchers sought
to demonstrate the impact of Tnfα deficiency on the Grn-/- OCD phenotype (129). Since
the cortico-basal ganglia circuit in the nucleus accumbens (NA) of ventral striatum has
also been implicated in OCD patients (192), electrophysiological brain slice recordings
were performed on the medium spiny neurons (MSNs) in the core of the NA, identifying
a similar hyperexcitability phenotype (129). Extraordinarily, both hetero- and
homozygous deletion of Tnfα rescued both the chronic grooming and NA MSNs
hyperexcitability Grn-/- phenotypes (129). However, both Grn-/-;Tnfα+/- and Grn-/-;Tnfα-/-
mice still possess defects in social behavioural observed in Grn-/- mice, suggesting
TNFα may only play an important role in the regulation of the neural circuits associated
with compulsive behaviours (129). As mentioned in section 1.2.4.1, Krabbe et al. also
observed this OCD-like chronic grooming phenotype in 8-10 month old tamoxifen-
induced microglia-specific Grn KO mice, suggesting loss of microglial Pgrn may be
sufficient to disrupt neural circuitry (129). Ikbkb encodes the inhibitor of NF-κB subunit
beta required for NF-κB activation and therefore regulates the transcription factor
responsible for upregulating inflammatory cytokines, including TNFα. To further
evaluate the contribution of microglial-induced neuroinflammation to Grn-/-
pathophysiology, they also generated the less penetrant (LysM promoter-driven) Cre/lox
36
microglial-specific KO mouse model targeting both Grnfl/fl and Ikbkbfl/fl (129). Despite
only achieving an ~50% reduction in adult Cd11b+ microglia Grn mRNA levels, this
LysM-Grnfl/fl mouse model exhibited both OCD and social behavioural abnormalities,
that were rescued by simultaneous microglia-specific KO of Ikbkb (LysM-Grnfl/fl;Ikbkbfl/fl)
(129). Thus, suggesting that the increased propensity for NF-κB activation in Grn-/-
microglia (193) is at least partially responsible for their hyperinflammatory phenotype,
which results in the overexpression of pro-inflammatory cytokines, including TNFα that
drives the OCD phenotype.
Neurodegeneration in Grn-/- has been shown to occur primarily in the VPM/VPL thalamic
nuclei, and therefore may also contribute to the development of behavioural phenotypes
(120,164). Interestingly, 19 month old Grn-/- thalamic snRNA-seq transcriptomes
exhibited a strikingly lower quantity of nuclei expressing cell type-specific markers
associated with excitatory neurons and a modest increase in the number of inhibitory
neurons (120). Immunohistochemical verification of these findings confirmed that the
loss of excitatory neurons could be detected by Pkcδ and Foxp2 staining in Grn-/-
thalamus in both 12 and 19 month old Grn-/- mice (120). 19 month old Grn-/- thalamic
Foxp2+ neurons were found surrounded by microglia containing intracellular Foxp2+
debris suggestive of microglial-mediated neurotoxicity and phagocytic clearance of
dying excitatory neurons (120). The selective vulnerability of Grn-/- excitatory primary
cortical neurons to Grn-/- MCM compared to Grn-/- GABAergic primary cortical neurons
supports these findings (120). Extraordinarily, Grn-/-;C1qa-/-;C3-/- mice have near-
complete protection of thalamic Pkcδ+ excitatory neurons, further signifying the

37
importance of complement-mediated neurodegenerative mechanisms in FTLD-GRN.
Though the loss of VPM/VPL inhibitory synapses is apparent in 8,12, and 19 month old
Grn-/- mice, the electrophysiological hyperexcitability phenotype was only assessed at
12 months old (92); therefore, it is possible that the hyperexcitability phenotype may be
less prominent in 19 month old Grn-/- mice due to the continued neurodegeneration of
thalamic Pkcδ+ and Foxp2+ excitatory neurons between 12 and 19 months of age
(120). Furthermore, the increase in the number of thalamic nuclei expressing inhibitory
neuron markers in Grn-/- mice from 12 to 19 months of age may represent a
compensatory mechanism due to complement-mediated inhibitory synaptic pruning
(92,120).
1.2.5 hiPSC-derived CNS models of GRN-deficiency
Though rodent models have been essential for uncovering the CNS functions of Pgrn,
one must be careful when directly applying these findings to the clinical manifestation of
FTLD-GRN. The inability to translate vast amounts of data obtained in preclinical
therapeutic interventions in AD mouse models into viable disease-modifying agents
provides reason to be cautious projecting murine pathogenic mechanisms onto human
disease (194). Until recently, post-mortem analysis was the primary option for studying
human neurobiology; however, in 2007, the Yamanaka group developed a technology
that could achieve human adult somatic cell reprogramming into hiPSCs (195),
unlocking the potential to generate human cell types from any genetic background.
Subsequently, researchers around the world worked to establish hiPSC differentiation
protocols for a variety of cell types, including those present in CNS tissue such as
38
neurons, astrocytes, and microglia (196-198). To date, our group and several others
have generated hiPSC lines from symptomatic and presymptomatic carriers of
haploinsufficient GRN mutations and differentiated them into CNS cell types for FTLD-
GRN disease modelling and preclinical drug development (60,122,135,199,200).
The first FTLD-GRN hiPSC line was generated from fibroblasts obtained from a patient
carrying the heterozygous p.S116X mutation (designated S116X+/-) and was
successfully differentiated into neurons and microglia (60). S116X+/- hiPSC-derived
neurons expressed and secreted reduced levels of PGRN, exhibited increased
sensitivity to the broad-spectrum kinase inhibitor staurosporine, and expressed
decreased levels of the ribosomal Ser/Thr kinase S6K2 involved in PI3K/PKB and
MAPK signaling pathways. Importantly, these latter two phenotypes could be rescued
by lentiviral delivery of GRN expression (60). Another study generated hiPSC lines from
three different FTLD-GRN patients carrying the same GRN IVS1+5G>C splice donor
site mutation (199). Differentiation of healthy control and FTLD-GRN splice donor
mutant hiPSC lines into cortical neurons uncovered that these GRN-deficient lines
expressed significantly lower levels of cortical neuron markers (CTIP2, TBR1, FOXG1)
at days in vitro (DIV) 40 compared to healthy control neurons. This inefficient cortical
neuron maturation phenotype was corrected by genetically inserting GRN cDNA into the
AAVS1 safe harbor locus of one of the FTLD-GRN lines (199). However, more recent
studies, including those published by our lab using other cortical neuron differentiation
methods, have failed to observe this defect in several FTLD-GRN hiPSC lines, including
a homozygous knock-in GRN p.R493X mutant line (122,200,201). These findings

39
suggest that GRN haploinsufficiency does not disrupt all pathways required for inducing
robust cortical neuron differentiation and that a more efficient differentiation technique
may have been required to obtain similar differentiation efficiency across their healthy
control and FTLD-GRN lines.
Valdez et al. generated an FTLD-GRN patient hiPSC line bearing the p.A9D signal
peptide disrupting mutation that blocks PGRN post-translational glycosylation and
secretion in order to assess lysosomal defects in patient-derived cortical neurons
(54,200). Subsequently, they corrected this heterozygous GRN mutation using
CRISPR/Cas9 gene editing to produce an isogenic control hiPSC line in order to
eliminate any potential phenotypic contributions from disparate genetic backgrounds
between the isogenic control and FTLD-GRN line. Aged GRN+/- hiPSC-derived cortical
neurons exhibited decreased lysosomal proteolysis, resulting in the accumulation of
intracellular electron-dense lipofuscin deposits and increased TDP-43 expression (200).
This study also assessed CTSD enzyme maturation levels in both isogenic control and
mutant hiPSC-derived cortical neurons. Both 35 and 100 DIV GRN+/- neurons exhibited
increased levels of mature CTSD; notably, the ratio of mature to immature CTSD was
significantly increased in the aged GRN+/- neurons (200). However, CTSD enzyme
activity normalized to mature CTSD expression levels were significantly lower in both 35
and 100 DIV GRN+/- hiPSC-derived cortical neurons (200). Though not demonstrated in
hiPSC-derived neurons, this study also added to the growing consensus suggesting that
PGRN and CTSD are binding partners and that PGRN’s C-terminus and/or GRN-7 may
promote CTSD maturation/activity (202,203). This finding is counterintuitive given the

40
increased levels of CTSD maturation frequently observed in the context of GRN-
deficiency, although it is possible that the impact of general lysosomal dysfunction on
CTSD maturation outweighs the effects of limited PGRN chaperone activity.
FTLD-GRN patient hiPSC-derived CNS tissue provides an invaluable resource for the
preclinical development of new therapeutics aimed at elevating GRN/PGRN expression
levels. For example, neurons derived from the S116X+/- hiPSC line have been used for
the in vitro validation of the SORT1 antagonist 2-methyl-6-(phenylethynyl)-pyridine,
which induced accumulation of extracellular PGRN in cell culture medium (204). As we
will discuss in section 1.2.7, a SORT1 targeting approach using the AL001 anti-SORT1
antibody has recently begun phase 3 clinical trials for FTLD-GRN, highlighting the
importance of preclinical validation in hiPSC models. Additionally, treatment of S116X+/-
hiPSC-derived cortical neurons with suberoylanilide hydroxamic acid, a histone
deacetylase inhibitor previously shown to upregulate GRN expression through
epigenetic modification (205), has been shown to significantly increase intra- and
extracellular PGRN expression from the intact allele (201). Another group, studying the
therapeutic potential of the disaccharide trehalose, generated hiPSC lines from a
healthy control and FTLD-GRN patient carrying the GRN p.R198GfsX19 mutation (135).
They demonstrated that p.R198GfsX19 mutant hiPSC-derived neurons express slightly
elevated levels of the LC3-II autophagosome marker compared to control neurons.
Treatment of p.R198GfsX19 mutant hiPSC-derived neurons with the autophagy
activator trehalose increased intracellular PGRN expression but further increased the
levels of LC3-II (135). In chapter 4, we will describe studies we conducted in our lab

41
using novel GRN nonsense mutant hiPSC lines demonstrating the therapeutic potential
of nonsense mutation readthrough drugs for the treatment of FTLD-GRN (122).
1.2.6 Proposed mechanisms of neurodegeneration in FTLD-GRN
The multifunctional nature of PGRN has complicated the elucidation of the key
biological mechanisms driving FTLD-GRN pathophysiology. The pathological cascade
resulting in FTLD-GRN symptomatic onset is multi-decade in nature, involving both
biochemical and cellular phases that precede the clinical manifestation of FTLD-GRN
(206,207). Drawing heavily upon the discoveries made in Grn-/- mice, it is likely that
microglial lysosomal dysfunction is a key initial step in the disease process, preceding
the establishment of neuroinflammation and gliosis (179). Götzl et al. elegantly
demonstrated that disrupted microglial lysosomal function in Grn-/- mice is one of the
earliest pathological events. Interestingly, the lysosomal dysfunction phenotype was not
observed in non-microglial populations until the latter stages of disease progression.
This may reflect both the heavy proteolytic strain associated with constantly sampling
their extracellular microenvironment and the fact that microglia express the most PGRN
in the brain on a per-cell basis (see section 1.2.2). The role of PGRN/GRNs in the
regulation of lysosomal biology is multifaceted, with functions including activation of
lysosomal proteases (119,202,208) and glycolipid hydrolases (186,187), promotion of
lysosomal acidification (180), and the homeostatic maintenance of lysosomal
morphology and biogenesis (93,107,178).

42
As discussed in section 1.2.4.3, GRN-deficiency has been increasingly linked to
dysfunctional microglial lipid metabolism, as evidenced by abnormal accumulation of
TAG and CE lipid species and LDs (107,181). These findings, combined with the
mounting evidence that PGRN is a key regulator of autophagy (106,131,209), provide a
potential mechanistic link to the eventual establishment of the pro-inflammatory DAM
phenotype through immunometabolic disruption. Immunometabolism is a cellular
process that regulates the way immune cells respond to environmental stimuli through
the flexible reprogramming of metabolic pathways (210). Microglial metabolic plasticity
is increasingly understood as a central node that controls the distinct states of microglial
homeostasis and activation. For example, homeostatic microglia preferentially
metabolize glucose through oxidative phosphorylation, while DAM are primarily
dependent on glycolysis to fuel their pro-inflammatory activities (reviewed here
(210,211)). Remarkably, transcriptomic analysis of LD-accumulating microglia isolated
from 9 month old Grn-/- mice hippocampi were found to be hyperglycolytic, exhibiting
significant disruption of metabolic pathways, including the TCA cycle and lipid
metabolism (181). The loss of microglial PGRN/GRNs may disrupt metabolic flexibility,
limiting the ability of microglia to revert back to a homeostatic state following initial pro-
inflammatory activation (212). However, it is still unclear whether disturbances to Grn-/-
microglial energetic pathways are a result of early lysosomal dysfunction or are an
additional independent phenotype caused by the loss of multifunctional PGRN/GRNs.
Regardless, the mechanisms driving dysfunctional microglial immunometabolism in
FTLD-GRN warrant further investigation.

43
Neuroinflammation is a prominent feature of FTLD-GRN, with severe microgliosis
observed in pathologically affected brain regions. Highly reactive pro-inflammatory
microglia with enlarged somas and thick processes are the central drivers of FTLD-GRN
pathogenesis. GRN-deficient DAM exhibit a transcriptomic signature unique to FTLD-
GRN neurodegeneration, characterized by suppression of homeostatic microglial genes
(Tgfbr1, Mef2c, P2ry12, etc.) and upregulation of microglial neurodegeneration-
associated genes (Apoe, Csf1, Clec7a, etc.) (120,212). These activated DAM secrete
elevated levels of pro-inflammatory mediators into the surrounding brain parenchyma,
including complement cascade proteins C1QA and C3. Complement proteins have
been shown to accumulate in the frontal cortices of FTLD-GRN patients and have also
been detected at heightened levels in their CSF. Interestingly, the levels of complement
proteins C1QA and C3B in FTLD-GRN patient CSF are negatively correlated with mini-
mental status exam score, in which lower scores indicate greater cognitive decline (92).
The Huang group’s research has strongly implicated these complement proteins in
FTLD-GRN pathogenesis, identifying several mechanisms linking neuroinflammation to
neurodegeneration (92,120). These include both selective targeting of inhibitory
synapses for complement-mediated microglial synaptic pruning (92) and the formation
of complement MAC on the excitatory neuronal cell surface that induces TDP-43
cytoplasmic translocation and neuronal cell death (120). Clinical validation of these
disease processes discovered in mouse models has been obtained through an fMRI
study on asymptomatic/prodromal GRN mutation carriers compared to healthy controls.
This study identified enhanced connectivity across four major neural networks (salience,
non-fluent variant primary progressive aphasia, perirolandic, and default mode), with the

44
unifying feature being thalamocortical hyperconnectivity (213), mirroring complement-
mediated phenotypic observations in aged Grn-/- mice.
Examining the relationship between PGRN and the FTLD-GRN risk factor TMEM106B
is essential for developing a comprehensive understanding of the basis of neuronal
lysosomal dysfunction in FTLD-GRN. Neuronal TMEM106B lysosomal functions include
maintaining lysosomal acidity through positive regulation of V-ATPase activity and
regulating axonal transport of lysosomes (179,214). Current evidence suggests that
TMEM106B risk alleles accelerate FTLD-GRN pathology through a GOF mechanism
(see section 1.1.6). Overexpression of TMEM106B driven by a neuron-specific promoter
in aged Grn+/+ mice identified tight regulation of TMEM106B protein levels, which
exhibited no increase despite a several-fold increase in TMEM106B mRNA (155).
However, TMEM106B overexpression in aged Grn-/- mice resulted in a 50% increase in
TMEM106B levels compared to normal aged Grn-/- mice, providing further evidence that
PGRN is involved in homeostatic negative regulation of TMEM106B levels (155).
Overexpression of TMEM106B in aged Grn-/- mice accelerated lysosomal dysfunction in
these mice (155), thus providing additional support for the GOF TMEM106B risk allele
hypothesis. On the contrary, several recent publications have demonstrated that
deletion of Tmem106b in a Grn KO background also exacerbates Grn-/- pathology
(156,157,215). A more clinically relevant double heterozygous KO model (Grn+/-
;Tmem106b+/-) was generated to assess whether a partial reduction in Tmem106b
levels may rescue Grn+/- phenotypes, but this only normalized the activity of a single
lysosomal enzyme (β-glucuronidase) (216). The current consensus suggests that

45
cortical neurons are particularly susceptible to excess or limited TMEM106B in the
context of GRN-deficiency, and that tight spatiotemporal regulation of TMEM106B in
neurons is required for neuronal lysosomal function.
As mentioned above, neuronal lysosomal dysfunction has been shown to develop in
aged Grn-/- mice further along the pathological progression (119). It has been
speculated that neurons may compensate for early decreased microglial autophagic
capacity; although, it is also possible that microglia-derived secreted neuroinflammatory
factors exacerbate this neuronal phenotype (120) or that neuronal autophagy is more
resilient to the effects of GRN haploinsufficiency. Ultimately, disrupted neuronal
proteolysis contributes to the major neuropathological hallmark of ubiquitin- and TDP-
43-positive NCI and DN subtype A pathology in neocortical layer II of the frontal and
temporal lobes of FTLD-GRN patients (90,91). As previously discussed in section 1.1.7,
the neuropathological hot spots in FTLD-GRN patient brains exhibit greater GRN
mRNA/PGRN levels than would be expected for a haploinsufficient condition (94). This
is likely a consequence of severe microgliosis in the affected regions, given that
activated microglia are known to upregulate GRN expression in response to
pathological insults (137,217). However, it appears that the levels of upregulated
microglial-derived GRN expression are insufficient to result in any meaningful impact on
FTLD-GRN neurodegeneration.
In aged Grn-/- mice, delivery of AAV-Grn expression vectors to the medial prefrontal
cortex (mPFC) increased neuronal Pgrn levels to 10X more than Grn+/+ baseline mPFC

46
expression levels (218). Despite only inducing a minor increase in neuronal Grn/Pgrn
expression in the epicenter of Grn-/- pathology (thalamic VPM/VPL), exogenous delivery
of Pgrn was capable of reducing thalamic microgliosis and lysosomal dysfunction 8-10
weeks post-viral injection (218). Importantly, this finding demonstrates that increasing
neuronal Pgrn expression, even in the latter stages of disease progression, can disrupt
neuropathology associated with Grn-deficiency. Given the multi-decade progression of
FTLD-GRN neuropathology, it is possible that increased microglial GRN expression
derived from the normal allele occurs too late in the disease process to provide
therapeutic benefit or that the microglia-derived PGRN fails to reach the threshold
concentration required for clinical improvement. It is currently unknown why particular
brain regions are sparred, and others are vulnerable to the neurodegenerative effects of
GRN haploinsufficiency, although neuroimaging studies have shed light on the earliest
functional and metabolic brain changes observed in the presymptomatic stages of
FTLD-GRN, which generally precedes grey/white matter atrophy (219). The pattern of
disrupted glucose metabolism and altered network activity expands topographically from
anterior to posterior as the disease progresses. The most consistent abnormalities are
initially observed in medial/dorsal prefrontal and fronto-insular regions mapping onto the
salience network, which plays key roles in social-emotional processing (219). Further
exploration of the complex immunometabolic regulatory interactions between microglia
and neurons/astrocytes may provide insights into the neuropathological basis for the
selective vulnerability observed in these brain regions (210).

47
1.2.7 Therapeutic development for the treatment of FTLD-GRN
There are currently no disease-modifying therapies that can slow down or reverse the
progression of FTLD-GRN. The therapeutic efforts explored to date have aimed to
increase GRN expression from the intact allele (135,201,205,220), increase PGRN’s
extracellular half-life (204), and restore PGRN through exogenous delivery (218,221).
Thus far, the proposed therapies have attempted to upregulate GRN/PGRN expression
levels by alkalizing lysosomes to decrease lysosomal turnover of PGRN (222), calcium
channel blockade (223), promoting the acetylation state of the GRN allele by modulating
epigenetic regulation through deacetylase inhibition (201,205,220), disrupting the
SORT1-PGRN axis to prevent the endocytosis and extend extracellular bioavailability of
PGRN (204), activating autophagy in an mTOR- and TFEB independent manner (135),
or directly delivering GRN to the CNS (218,221). Though several of these mechanisms
have been tested clinically, only the anti-SORT1 antibody AL001 (Alector, INFRONT-3)
and AAV GRN gene therapies PR006 (Prevail Therapeutics, PROCLAIM) and PBFT02
(Passage Bio Inc., upliFT-D) have currently demonstrated clinical potential (224-226).
Recent phase I/IIb clinical trial results presented at the 2020 Alzheimer’s Association
International Conference showed that short- (single dose 60 mg/kb, 12 days,
asymptomatic) and extended-treatment (3X 30 mg/kg, 4 weeks, symptomatic) of FTLD-
GRN patients with the Alector’s AL001 human monoclonal anti-SORT1 antibody was
well tolerated and significantly restored plasma and CSF PGRN levels to normal levels.
PGRN CSF levels in 8 symptomatic FTLD-GRN patients remained in the normal range
8 weeks after receiving the final of the three doses, and extended treatment rescued

48
several pathological CSF biomarkers of lysosomal dysfunction (CTSB),
neuroinflammation (osteopontin), and gliosis (chitotriosidase). These findings have
initiated the development of a phase III clinical study (INFRONT-3) to assess the impact
of AL001 on FTLD-GRN pathological progression. Symptom management is currently
the only clinical option available to FTLD-GRN patients. Some patients expressing the
behavioural variant of FTLD-GRN have been shown to respond positively to serotonin
reuptake inhibitors and antipsychotic medications. For example, bvFTD symptoms such
as irritability, agitation, and depression are improved by treatment with the serotonergic
compound trazodone in a double-blind placebo-controlled crossover trial (227). There is
a clear need for more research and preclinical development into novel therapies
capable of treating or preventing FTLD-GRN.
1.3 Premature termination codon readthrough
Nonsense mutations change an amino acid codon to a termination codon (UAG, UAA
(228), or UGA (229)), resulting in the production of a truncated protein and mRNA
destabilization (230). PTC readthrough is a process that suppresses nonsense
mutations through the pairing of a near-cognate aminoacyl-tRNA at a PTC, allowing for
the incorporation of an amino acid instead of termination, leading to translation of the
full-length protein and increased nonsense mutant mRNA stability (Figure 1-2) (230-
233). Under normal conditions, PTC readthrough occurs at a rate of ~1% of translation
events (234,235), while suppression of natural stop codons occurs at a frequency of ≤
0.1% (236,237). The rationale for the observed discrepancy between these rates is two-
fold; the surrounding mRNA sequence context has been under evolutionary pressure to

49
select for efficient termination at natural stop codons (238-240), and the stabilization
effect imparted by the proximity of stop codons to the poly(A) binding protein bound to
the 3’ poly(A) tail which enables interaction with release factor (RF) eRF3 to enhance
termination of translation (241,242).
Over the past several decades, significant efforts have been made to identify
compounds that are capable of increasing the rate of PTC readthrough as a means to
restore expression from nonsense mutant alleles back to normal levels for therapeutic
gain. To date, many PTC readthrough-inducing drugs has been identified, developed,
and tested clinically; the most common include aminoglycosides (natural (243,244) and
synthetic derivatives (245-247)), negamycin analogs (248,249), and non-
aminoglycoside compounds such as ataluren (formally known as PTC124) (250,251).
Still, common concerns often raised against research into PTC readthrough as a
disease-modifying therapy include the potential for negative impact on global translation
efficiency and whether these efforts would increase suppression of normal stop codons
at the end of ORFs. Failing to terminate translation at stop codons would significantly
increase misfolded proteins due to C-terminal extensions, inevitably inducing the
unfolded protein response. Such a response would be expected to cause upregulation
of the inducible form of heat shock protein 70 (Hsp70) (252), however, treating
fibroblasts with a high concentration of readthrough drugs only slightly increased Hsp70
expression (253) and had no impact on overall translation rates (254,255). On the
contrary, results from a recent global ribosomal profiling study treating HEK293 cells
with high concentrations (0.5 mg/mL) of aminoglycosides, observed increased ribosome
50
density within 3’UTRs in samples treated with G418 and paromomycin. This finding is
indicative of readthrough of natural stop codons, highlighting the need to identify
aminoglycoside readthrough enhancer compounds that may lower the concentration of
aminoglycosides required to induce PTC readthrough (256).
According to a recent analysis of the Orphanet database (257), 3.5-5.9% of the human
population is affected by rare genetic diseases, and of that, ~11% of all genetic
disorders are caused by single base substitutions leading to the introduction of an in-
frame PTC (258); thus, the potentially addressable patient population for PTC
readthrough treatment is substantial. In the past 20 years, there have been numerous
clinical trials conducted testing candidate PTC readthrough drugs in nonsense mutation
bearing Duchenne muscular dystrophy (DMD) (244,251,259) and cystic fibrosis (CF)
(260-263) patients. Though these trials have resulted in the approval of ataluren (known
commercially as Translarna™) to treat children with DMD by the European Medicines
Agency (264), the drug only provides marginal clinical benefit to a subset of nonsense
mutation carriers. The success of previous clinical studies testing PTC readthrough
drugs has been limited by low readthrough efficiencies (0.5-20% increase) failing to
reach the therapeutic threshold required for meaningful disease-modification (265) and
significant toxicity associated with the long-term treatment required to delay and/or
prevent further disease progression (266-268). There is growing interest in applying a
readthrough-based approach to neurodegenerative diseases that possess a significant
proportion of nonsense mutation bearing patients, and in some cases exhibit a lower
therapeutic threshold.

51
Figure 1-2 Nonsense mutation readthrough. A, Translation termination at a natural
mRNA stop codon. B, Premature translation termination at a nonsense codon. C, Drug-
induced PTC readthrough resulting in full-length translation of nonsense mutant mRNA.

52
1.3.1 Aminoglycoside PTC readthrough
Aminoglycosides are bactericidal antibiotics consisting of two to three amino sugar
groups joined to either a streptidine or 2-deoxystreptamine (2-DOS) ring by glycosidic
linkages and are potent inhibitors of protein synthesis at high doses and reduce
translational fidelity at low doses in Gram-negative bacteria (269,270). Aminoglycoside-
mediated PTC readthrough has been thoroughly demonstrated in several mammalian
cell lines and in vivo models expressing disease-associated nonsense mutations
(reviewed here (271-273)). In 2-DOS aminoglycosides, this is achieved through binding
to the 30S ribosomal subunit’s 16S rRNA decoding center, which is responsible for
proof-reading codon-anticodon base-pairing complementarity (274). The eukaryotic 18S
rRNA decoding center sequence differs from prokaryotic 16S rRNA at two key
nucleotides, weakening the binding affinity of 2-DOS aminoglycosides by 25-50X
(275,276). Therefore, eukaryotic ribosomes are less susceptible to translational
inhibition by aminoglycosides at low doses, supporting their clinical use as therapeutic
antibiotics targeting bacterial infections. The weaker affinity of aminoglycosides to the
eukaryotic ribosomal decoding center is fundamental to their propensity to suppress
nonsense mutations while minimizing the misincorporation of amino acids at sense
codons (277).
The differential biochemical interactions between the eukaryotic ribosomal A-site and
aminoacyl tRNAs / translational RFs in the presence and absence of aminoglycosides
have been thoroughly investigated (reviewed here (278,279)). Translational fidelity is
monitored by three universally conserved ribosomal rRNA nucleotides in helix 18

53
(G530) and 44 (A1492, A1493). For simplicity, rRNA residues will be numbered
according to the numbering used in E. coli 16S rRNA. As mentioned above, the
eukaryotic rRNA decoding center also contains non-conserved nucleotides; A1408G
and G1491A base substitutions in helix 44 are responsible for the diminished
aminoglycoside binding affinity (274,276). Upon forming a cognate codon-anticodon
pair, A1492 and A1493 are flipped out into the minor groove of the codon-anticodon
mini-helix core, and G530 transitions from a syn to anti conformation (280,281). This
conformational change, often referred to as the ON-state, brings these proof-reading
rRNA nucleotides in proximity to the codon-anticodon base-pairing event, allowing
hydrogen bonding via 2’ OH groups to assess complementarity.
In contrast, natural stop codons and PTCs are instead recognized through a nucleotide-
protein interaction with RFs, which trigger translational termination. The eukaryotic RF
(eRF1) is capable of recognizing all three stop codons (282), while prokaryotes possess
RF1 and RF2, which recognize UAG/UAA and UGA/UAA, respectively (283). These
RFs share 3D structural homology with aminoacyl tRNAs and can directly recognize the
three stop codons; however, there are subtle differences in how they interact with the
ribosomal A-site. Unlike sense codons, only one of the A1492 or A1493 position
nucleotides is flipped out of helix 44 (A1492 in prokaryotes vs. A1493 position in
eukaryotes) in response to RF stop codon/PTC recognition, leaving the remaining
adenine free to form a stacking interaction with A1913 of helix 69 on 23S rRNA which
signals the RF to activate peptidyl transferase activity (284,285). The ribosomal A-site
configuration where either one or both of the conserved adenines are directed towards

54
the helical core is known as the non-decoding or OFF-state, which has also been
associated with the absence of a cognate tRNA (286,287).
Aminoglycoside binding to the 16S rRNA decoding center is stabilized by hydrogen
bonds with G1408 and displaces both A1492 and A1493 from the helical core, similar to
the ON-state induced by cognate tRNAs, which may introduce steric clash and disrupt
potential base stacking interactions between A1493 and A1913, thus limiting the access
of RFs to stop codons/PTCs (288,289). Furthermore, aminoglycoside-mediated
displacement of A1493 has been shown to strongly shift its phosphate group, which
relaxes the decoding pocket on the codon side (290). These conformation changes
simultaneously increase the likelihood of near-cognate tRNA sampling in the ribosomal
A-site and the accommodation of a single-nucleotide anticodon mismatch at PTCs,
stimulating readthrough.
1.3.2 Aminoglycoside toxicity
To prevent or delay the progression of any nonsense mutation-linked diseases, patients
will likely require lifelong treatment with PTC readthrough-inducing drugs to maintain
adequate expression from their nonsense alleles. Therefore, long-term tolerability with
minimal toxicity and low rates of drug-associated adverse events are essential for the
success of nonsense suppression therapy as a treatment for genetic disorders.
Therefore, a major impediment to the clinical application of aminoglycosides as
translational readthrough-inducing drugs has been the association of their prolonged
use with significant nephro- and ototoxicity (reviewed here (267,291,292)).

55
Aminoglycoside-induced nephrotoxicity is a reversible process that results in both the
necrosis and apoptosis of renal proximal tubular epithelial cells (293,294). In contrast,
ototoxicity induced by aminoglycosides results in permanent bilateral sensorineural
hearing loss by triggering apoptosis of vestibular and cochlear hair cells (295,296).
Three main mechanisms contribute to aminoglycoside-induced toxicity: lysosomal
phospholipidosis, accumulation of intracellular reactive oxygen species (ROS), and
inhibition of mitochondrial protein synthesis.
Aminoglycoside antibiotics gain entry into cells through the endocytic membrane
receptor, megalin, which is highly expressed on the apical membrane of epithelial cells
in the renal proximal tubule (297) and stria vascularis marginal cells of the cochlear duct
(298,299). Following endocytosis, most aminoglycosides enter the endolysosomal
network, those destined for the lysosome become positively charged (300), allowing
them to bind to negatively charged lysosomal membrane phospholipids. This affinity for
the lysosomal membrane disrupts phospholipid turnover and inhibits phospholipase
function, resulting in lysosomal phospholipidosis (266,301). Eventually, membrane
damage becomes so severe that lysosomal membranes rupture (302), releasing
aminoglycosides into the cytosol, causing the formation of ROS and subsequent
oxidative damage (303,304) via iron-aminoglycoside complexes (305), and
aminoglycoside-mediated mitochondrial dysfunction (306,307). Mitochondrial ribosomal
(mitoribosomal) rRNA shares significant homology with prokaryotic rRNA; given that the
mitoribosome is a remnant from a previously symbiotic bacteria, the mitoribosomal
decoding site is more susceptible to aminoglycoside-mediated inhibition of protein

56
synthesis than the eukaryotic ribosome. Genetic analysis has revealed that individuals
carrying specific SNPs in their mitochondrial DNA encoding the helix 44 decoding
center that further enhance aminoglycoside-mitoribosomal affinity are at greater risk of
aminoglycoside-induced ototoxicity (268,308,309). Molecularly characterizing the
mechanisms of both PTC readthrough and aminoglycoside-induced toxicity have
provided researchers with a rational basis for designing novel synthetic
aminoglycosides with improved readthrough activity while minimizing toxicity.
1.3.3 Promising PTC readthrough drugs
As discussed in section 1.3.2, there are several known clinical limitations to using
aminoglycosides as potential PTC readthrough drugs (266-268). While natural
aminoglycosides are currently not suitable for long-term human administration, efforts
are underway to develop novel aminoglycoside derivatives with improved tolerability
and PTC readthrough potency. Medicinal chemistry approaches for designing synthetic
aminoglycosides have been largely focused on limiting their affinity for the prokaryotic
and mitochondrial ribosomal decoding center while maintaining a weak affinity for
eukaryotic ribosomes as a means to reduce toxicity. The aminoglycoside G418
(geneticin) is simultaneously the strongest readthrough inducer and most toxic of all
natural aminoglycosides tested to date (234,310,311). Over the past 15 years, Baasov
and co-workers have systematically and elegantly demonstrated which aminoglycoside
chemical moieties of G418 are essential for its PTC readthrough activity and those
responsible for its toxicity that may be expendable (312-316). In summary, these
exceptional molecular remodeling studies confirmed that ring I is essential for G418-

57
induced PTC readthrough activity, and its garosamine ring III is largely responsible for
its significant toxicity.
Their 4th generation aminoglycoside derivative NB124 only differed from G418 by
modifications to ring III, swapping the garosamine ring to a 5 amino ribose with an (S)-
5’’-methly group and its ring II attachment position (C6 instead of C5). Compared to
G418, these ring III alterations in NB124 dramatically reduced its affinity for both the
mitochondrial and prokaryotic ribosomes (> 100X) while maintaining similar PTC
readthrough efficiency (316). Following its initial synthesis, NB124 was acquired by
Eloxx Pharmaceuticals and became one of their lead investigational therapeutic
candidates (ELX-02). ELX-02 is a novel eukaryotic ribosomal selective glycoside that
exhibits potent PTC suppression activity in several nonsense mutant disease models,
comparable to G418 (317,318). Recent results of a phase I clinical trial have
established that ELX-02 is safe and tolerated in healthy human subjects (246), thus
prompting ongoing phase II clinical trials in CF and cystinosis patients harboring
nonsense mutations (319-321). Despite the early success of ELX-02, Baasov et al.
have continued their efforts to further structurally optimize aminoglycoside derivatives,
applying a rational design strategy to maximize readthrough efficacy while minimizing
nephro- and ototoxicity (317,322).
In parallel, significant research efforts have been made to identify PTC readthrough-
inducing drugs of non-aminoglycoside antibiotic origin. The poor long-term tolerability of
the aminoglycoside gentamicin highlighted the need for novel nonsense suppressors;

58
this search culminated in a high-throughput PTC readthrough screen of over 800,000
compounds identifying the small molecule oxadiazole, ataluren, as the most potent
stimulator of a firefly luciferase-based PTC readthrough reporter assay (250). However,
shortly following its discovery, evidence emerged demonstrating that ataluren binds to
and stabilizes the firefly luciferase enzyme, which suggested that the ataluren ‘hit’ may
have been the result of a PTC readthrough-independent mechanism (323,324). Several
subsequent PTC readthrough studies failed to observe ataluren-induced PTC
readthrough activity in various genetic contexts (325-327). On the other hand, multiple
preclinical studies have confirmed ataluren-mediated PTC readthrough activity and
observed lower toxicity levels compared to aminoglycosides (250,328-330). An
additional mechanistic study unambiguously demonstrated that ataluren promotes the
insertion of near cognate tRNAs at PTCs, similar to aminoglycosides (331). In further
support of this interaction, co-treatment of both nonsense mutant cell cultures and CF
patients with tobramycin, an aminoglycoside with a strong affinity for the eukaryotic
ribosomal A site (332), has been discovered to competitively inhibit ataluren-induced
readthrough (263,331). Confidence in ataluren’s therapeutic potential as a PTC
readthrough drug ultimately resulted in multiple phase III clinical trials treating nonsense
mutation carrying DMD and CF patients with ataluren but failed to significantly alter
disease progression compared to placebo groups (251,263,333). Nevertheless, these
varied results have led to the development of promising novel oxadiazole containing
ataluren analogs with improved readthrough performance, currently under preclinical
development (334-336).

59
1.3.4 PTC readthrough enhancers
Our collaborators in the Roberge lab previously identified several readthrough enhancer
compounds capable of synergistically increasing the potency of aminoglycoside-
mediated suppression of nonsense mutations. In 2016, they discovered a novel class of
aminoglycoside PTC readthrough enhancer compounds (CDX-series) using a high-
throughput screen for nonsense suppression in yeast (337). The CDX-series
compounds are N-substituted phthalimide derivatives that they further systematically
functionalized to increase their potency. They demonstrated that co-treatment with
CDX5-1 and G418 enhanced PTC readthrough in TP53 nonsense mutant HDQ-P1
cancer cells. At present, the mechanism underpinning the readthrough enhancement
achieved by CDX compounds is unclear. However, qualitative observations suggest that
combination treatment with G418 and CDX compounds inhibit proliferation in cell
cultures; therefore, toxicity may limit clinical potential. In a subsequent study, the
Roberge group also identified that the antimalaria drug mefloquine could potentiate
aminoglycoside-induced PTC readthrough in several TP53 nonsense mutant cancer cell
lines (338). Importantly, readthrough-derived full-length p53 retained biological function
as observed through increased Ser15 phosphorylation in response to ionizing radiation.
They demonstrated that mefloquine-induced readthrough enhancement is not achieved
through increased extracellular uptake of G418 or increased lysosomal permeability to
G418, suggesting that mefloquine may directly target translation machinery.

60
1.3.5 Nonsense mediated mRNA decay
The abundance of nonsense mutant mRNA transcripts is a determining factor of PTC
readthrough efficiency. mRNA stability is regulated by several biological processes,
including microRNA silencing, mRNA maturation, and nonsense-mediated mRNA decay
(NMD). mRNAs bearing nonsense mutations are targeted for degradation by NMD, and
PTC readthrough enables escape of nonsense mutant mRNA from degradation by
NMD. NMD efficiency can vary up to 4-fold in the general population, likely resulting in a
wide variance in basal PTC readthrough levels in individual nonsense mutation carriers
(339). For this discussion, only the exon-junction complex (EJC)-dependent model of
mammalian NMD will be presented, as EJC-independent NMD is not triggered by the
presence of a PTC (reviewed here (233,340,341)). For a PTC containing mRNA to
elude destruction by NMD, it must be translated through to at least 50-55 nucleotides
upstream of the final exon-exon junction during its ‘pioneer’ round of translation. This
degree of translation is sufficient because it removes al EJCs that are deposited 20-24
nucleotides upstream of every exon-exon junction during pre-mRNA splicing. During the
translation of a nonsense mutant mRNA transcript, the NMD factors UPF1 and SMG1
kinase interact with eRF1 and eRF3 upon PTC recognition forming a pretermination
complex. When a ribosome encounters a PTC with an intact downstream EJC (contains
NMD factors UPF2 and UPF3), UPF1 can interact with UPF2/UPF3, which induces
UPF1 phosphorylation by SMG1, thus marking the mRNA for degradation. This
phosphorylation recruits additional NMD factors (SMG5, SMG6, SMG7, PP2A), forming
an mRNA surveillance complex that facilitates the breakdown of the PTC-containing

61
mRNA. Concurrently, the PP2A phosphatase dephosphorylates UPF1, thus enabling
the detection of additional nonsense mutant mRNAs.
The elucidation of the NMD pathway and understanding its role in suppressing the
levels of nonsense mutant mRNAs has identified potential drug targets to inhibit NMD
as an adjunct to PTC readthrough agents. Because the phosphorylation and
subsequent dephosphorylation of UPF1 are the main rate-limiting steps driving NMD,
interfering with these processes leads to efficient NMD inhibition. Thus far, several
compounds have been identified that inhibit NMD by targeting the phosphorylation
status of UPF1. For example, the natural substances caffeine and wortmannin both
inhibit the SMG1 kinase, preventing the phosphorylation of UPF1, which rescues
nonsense mutant mRNA from being tagged for degradation (342). Another group
performed a virtual screen, capitalizing on the crystallographic resolution of the UPF1-
SMG7 complex to identify commercially available compounds capable of binding to the
SMG7 pocket critical for association with UPF1. This screen led to the identification of
NMDI-14, which prevents phosphorylated UPF1 from recruiting the SMG5-SMG7
heterodimer, which together serves as an adapter for phosphatase PP2A-mediated
UPF1 dephosphorylation (343).
Another compound, NMDI-1, inhibits NMD through a similar mechanism by disrupting
the association between SMG5 and UPF1, which leads to the sequestration of
hyperphosphorylated UPF1 (344); notably, NMDI-1 is a 1500X more potent NMD
inhibitor than caffeine. In vivo co-administration of the NMD attenuator, NMDI-1, and

62
gentamicin in the IduaW392X/W392X mucopolysaccharidosis type I mouse model
synergistically enhanced Idua enzyme activity and rescued glycosaminoglycan
accumulation and lysosomal dysfunction (345). Despite the synergistic benefits of
combining NMD inhibition and PTC readthrough treatment, it is important to consider
the potential negative consequences of inhibiting NMD factors. For example, NMD
factors have also been implicated in the transcriptomic regulation of ~10% of all
mammalian mRNA (non-PTC bearing) transcripts (265), playing important roles in B
and T cell maturation (346), as well as telomere maintenance (347). Therefore, efforts
exploring the clinical application of NMD inhibition should proceed with caution,
although, considering that a 4-fold variation in NMD efficiency has been observed in the
general population, it is likely that some degree of NMD disruption may be tolerated.
1.3.6 PTC readthrough in cellular models of FTLD-GRN
Of the 79 known GRN mutations, 18 (23%) are single-base substitutions introducing
nonsense mutations, and notably, the most common familial GRN mutation is the
p.R493X nonsense mutation. These disease characteristics make FTLD-GRN an ideal
candidate for PTC readthrough drug development. Following our abstract presented at
the 11th International Conference in Frontotemporal Dementias in 2018, Kuang et al.
corroborated parts of our findings, showing that aminoglycosides induced GRN
nonsense mutation readthrough in cells transfected with nonsense mutant expression
GRN constructs (348). They transfected N2a cells with C-terminally FLAG-tagged GRN
nonsense mutant expression constructs (p.Q125X, p.Y229X, p.R493X) and confirmed
gentamicin- and G418-mediated PTC readthrough of UGA nonsense codon (p.R493X),

63
while UAG/UAA codons (p.Q125X/p.Y229X) were unresponsive (348). Analysis of the
subcellular localization of G418-induced PTC readthrough-derived full-length PGRN
found co-localization with the lysosomal and Golgi apparatus similar to wild-type PGRN;
thus, suggesting the readthrough product may function similarly to wild-type PGRN
(348). Moreover, they reported evidence demonstrating escape of FLAG-tagged GRN
R493X mRNA from NMD, resulting in a 2X increase in mRNA levels following a 24 h
treatment with G418 (348). Two months later, we published our manuscript
demonstrating G418-mediated PTC readthrough in HEK293 cells transfected with
similar C-terminally tagged nonsense mutant GRN expression constructs, further
improving upon these efforts by co-treating with novel readthrough enhancer drugs. The
results from our studies demonstrating GRN PTC readthrough will be presented in detail
in the subsequent chapters.
1.4 Thesis research questions
The primary objectives of this thesis were to answer the following questions: 1) can we
demonstrate in vitro and proof-of-concept in vivo GRN PTC readthrough of exogeneous
nonsense mutant GRN expression constructs? 2) do FTLD-GRN and CLN11 hiPSC
models of GRN-deficiency caused by nonsense mutations exhibit mutant lysosomal
phenotypes? 3) can we demonstrate proof-of-concept PTC readthrough of endogenous
pathogenic GRN mutations in both in vitro and in vivo models, and reverse disease-
related phenotypes? 4) What behavioural and neuropathological phenotypes develop in
the recently developed GrnR494X/R493X knock-in mouse model? A graphical overview and

64
summary of our experimental approach is described below (Figure 1-3).

65

66
Figure 1-3 Graphical overview of experimental models. Exogenous PTC
readthrough was demonstrated in HEK293 cells transfected with several C-terminally
V5-tagged GRN expression constructs, each bearing a causal FTLD-GRN pathological
mutation. Stably transfected HEK293 lines provided an ideal model for screening PTC
readthrough CDX-series enhancer compounds treated in combination with G418. The
coding sequence of the R493X GRN-V5 expression construct was cloned into an AAV
expression vector, which was used to generate AAV-GRN-R493X-V5 mice. Top
readthrough enhancer compound CDX5-288 identified in HEK293 screening was used
in combination with G418 to induce in vivo CNS PTC readthrough of the V5-tagged
GRN R493X construct. To demonstrate PTC readthrough of endogenously expressed
GRN, we established novel FTLD-GRN patient- and isogenic CRISPR/Cas9 gene
editing-derived hiPSC models of GRN LOF caused by nonsense mutations. GRN
nonsense mutant hiPSC-derived neurons and astrocytes were treated with top
candidate PTC readthrough drug combinations and assessed for rescued PGRN
expression. We also obtained and similarly treated aged GrnR493X/R493X mice with G418
to further establish proof-of-concept in vivo readthrough; however, high levels of toxicity
prevented us from achieving long-term delivery of therapeutic dosages. Therefore, we
limited the scope to a novel phenotypic characterization of this mouse model, assessing
several neuropathological phenotypes previously reported in Grn-/- mice.

67
Chapter 2: Materials and methods
2.1 Mice
C57BL/6J mice for AAV studies were acquired from Dr. Ann Marie Craig (Department of
Psychiatry, Centre for Brain Health, UBC). GrnR493X/R493X mice on a C57BL/6J
background, and C57BL/6J Grn+/+ mice were obtained from Jackson Laboratories
(Stock# 029919 and #000664, respectively). Animal procedures were approved by the
UBC Animal Care and Biosafety Committees. Mice were housed at the UBC Centre for
Disease Modelling and Animal Research Unit facilities, where work outlined in
institutionally approved breeding and experimental protocols (A19-0623, A19-0062,
A16-0161, and A17-0225) was conducted. Mice were provided with a 12 h light/12 h
dark cycle and allowed food and water ad libitum. All efforts were made to minimize
suffering with minimally invasive procedures, and where necessary, isoflurane
anesthesia was used.
2.2 Cells
2.2.1 HEK293
HEK293 cell studies were conducted in Dr. Roberge’s lab (Life Science Center, UBC)
and cultured in DMEM medium supplemented with 10% fetal bovine serum (FBS,
Thermo Fisher Scientific) + 1% Pen/Strep (Thermo Fisher Scientific).

68
2.2.2 Mouse embryonic fibroblasts
Grn+/+ and GrnR493X/R493X mouse embryonic fibroblasts (MEFs) were isolated from E14.5
embryos. Briefly, dissected embryos were finely minced and digested in 0.25% Trypsin-
EDTA (Thermo Fisher Scientific) at 37 °C for 10 min. This solution was centrifuged at
100 x g for 3.5 min, and the pellet was resuspended in 0.125% Trypsin-EDTA for further
digestion at 37 °C for 25 min. Following the addition of FBS to neutralize the trypsin, the
solution was vigorously pipetted with FBS and passed through a cell strainer for
collection of a single cell suspension. This resulting suspension was centrifuged at 300
x g for 5 min, and the supernatant was discarded and replaced with DMEM-high
glucose medium (Thermo Fisher Scientific) supplemented with 15% FBS + 1%
Pen/Strep. The cells were counted and plated at a density of 1.5E7 cells per 150 mm
plate and passaged once confluent. Early passage frozen stocks were prepared and
thawed as needed for experiments.
2.3 Expression vectors
2.3.1 Vector mutagenesis
Using GeneArt mutagenesis service (Thermo Fisher Scientific), the coding sequence of
GRN was synthesized and cloned into pDONR221 Entry vector. Three base
substitutions c.347C>A, c.1252C>T, and c.1477C>T were engineered into GRN using a
targeted PCR-based strategy to generate p.S116X (UAA), p.R418X (UGA) and
p.R493X (UGA) nonsense mutations. Finally, to generate expression clones, LR
recombination reaction was used to recombine the wild-type and mutated samples from
the Entry vectors into the pcDNA-6.2/V5-DEST vector (Thermo Fisher Scientific). These

69
C-terminal V5 tagged GRN expression constructs were used for HEK293 cell
transfections.
2.3.2 Transfection
HEK293 cells were transiently transfected with pcDNA6.2/V5-DEST vector expressing
C-terminally V5-tagged mutated GRN with nonsense mutations (p.S116X, p.R418X,
p.R493X) using Lipofectamine 2000 (Thermo Fisher Scientific). 24 h after transfection,
each sample was split into two wells and either left untreated or treated with G418 (100
µg/mL). After 72 h, cells were lysed and subjected to automated capillary
electrophoresis western analysis (Wes, ProteinSimple). To generate stable cell lines,
HEK293 cells were transfected with pcDNA-6.2/V5-DEST vectors expressing mutant
GRN as described above and subjected to blasticidin (Thermo Fisher Scientific)
selection. Individual clones that were resistant to 15 μg/mL blasticidin were selected.
2.3.3 AAV vector packaging
The packaging of AAV-GRN-R493X-V5 was performed by the Petrucelli group at the
Mayo Clinic in Jacksonville, Florida. The coding sequence for V5-tagged p.R493X
mutant GRN was cloned into the AAV expression vector pAM/CBA-EGFP-WPRE-BGH,
AAV particles were packaged into serotype 9 capsid (AAV9), and purified using
standard methods (349). Briefly, AAV was generated by co-transfection with the cis
plasmids pF Delta6 and pRepCap9 into HEK293T cells. Cells were harvested 72 h after
transfection, treated with 50 Units/ml Benzonase (Sigma-Aldrich), and lysed by freeze-
thaw. The virus (AAV-GRN-R493X-V5) was then purified using a discontinuous

70
iodixanol gradient and buffer exchanged to PBS using an Amicon Ultra 100
Centrifugation device (EMD Millipore). The genomic titer of each virus was determined
by quantitative PCR using the ABI 7700 (Applied Biosystems) and primers specific to
the WPRE. The viral DNA samples were prepared for quantification by treating the
virus with DNaseI (Invitrogen) and Proteinase K (Invitrogen), and samples were
compared against a standard curve of supercoiled plasmid. AAV9-eGFP-Cre viral
particles (AddGene, 105540-AAV9) were used to demonstrate technical proficiency of
P0 intracerebroventricular (ICV) AAV injection by assessing brain-wide human synapsin
promoter-driven eGFP expression in 10 week old AAV9-eGFP-Cre mice.
2.3.4 In vitro transduction
HEK293 cells were transduced for 5 days with 2 mL volumes of media containing
increasing concentrations of AAV-GRN-R493X-V5 expression vector (8.8E8, 8.8E9, and
8.8E10 PFU/mL) and 8 µg/mL polybrene for increased transduction efficiency. 48 h after
transduction, each transduced well was treated with G418 (100 µg/mL). Following 72 h
G418 treatment, supernatant was collected and cells were lysed. Cell lysates and
supernatant were both subjected to automated capillary electrophoresis western
analysis.

71
2.4 Antibodies
Table 1-1 Primary antibodies
Antibody Dilution Source Identifier
Polyclonal Rabbit Anti-Human ACTIN Antibody
1:10000 (WB / Wes)
Novus Biologicals NB600-532, RRID: AB_10002039
Monoclonal Rabbit Anti-Mouse C1q Antibody
1:500 (IF) Abcam ab182451, RRID: AB_2732849
Polyclonal Goat Anti-Human CTSD Antibody
1:1000 (WB) R&D Systems AF1014, RRID: AB_2087218
Polyclonal Goat Anti-Mouse Ctsd Antibody
1:500 (WB) R&D Systems AF1029, RRID: AB_2087094
Polyclonal Rabbit Anti-Human DESMIN Antibody
1:500 (IF) Invitrogen PA5-16705, RRID: AB_10977258
Polyclonal Goat Anti-Mouse DppII Antibody
1:500 (IF) R&D Systems AF3436, RRID: AB_2093882
Polyclonal Rabbit Anti-Human FOXG1 Antibody
1:500 (IF) Abcam ab18259, RRID: AB_732415
Polyclonal Rabbit Anti-Mouse Foxp2 Antibody
1:500 (IF) Abcam ab16046, RRID: AB_2107107
Polyclonal Rabbit Anti-Human GAD65/67 Antibody
1:500 (IF) Sigma-Aldrich G5163, RRID: AB_477019
Polyclonal Rabbit Anti-Human GFAP Antibody
1:500 (IF) STEMCELL Technologies
60128, RRID: AB_215513
Monoclonal Rat Anti-Mouse Lamp1 Antibody
1:500 (IF/WB)
BD Biosciences 553792, RRID: AB_2134499
Polyclonal Rabbit Anti-Mouse LC3-I/II Antibody
1:1000 (WB) Cell Signaling Technology
2775, RRID: AB_915950
Polycloncal Rabbit Anti-Human MAP2 Antibody
1:500 (IF) Proteintech 17490-1-AP, RRID: AB_2137880

72
Antibody Dilution Source Identifier
Polycloncal Goat Anti-Human NANOG Antibody
1:1000 (IF) R&D Systems AF1997, RRID: AB_355097
Monoclonal Mouse Anti-Human OCT3/4 Antibody
1:1000 (IF) STEMCELL Technologies
60093, RRID: AB_2801346
Polyclonal Goat Anti-Human PGRN Antibody
1:1000 (IF) R&D Systems AF2420, RRID: AB_2845434
Polyclonal Rabbit Anti-Human PGRN Antibody
1:1000 (WB) Sigma-Aldrich HPA008763, RRID: AB_1850339
Polyclonal Rabbit Anti-Mouse Pgrn Antibody
1:1000 (WB) Yu/Herz lab (82) Mouse Linker 1 Peptide (C)TLLKKF PAQKTNRAVSI
Polyclonal Sheep Anti-Mouse Pgrn Antibody
1:100 (WB) R&D Systems AF2557, RRID: AB_2114504
Monoclonal Rabbit Anti-Human SOX1 Antibody
1:1000 (IF) STEMCELL Technologies
60095, RRID: AB_2801347
Polyclonal Goat Anti-Human SOX17 Antibody
1:500 (IF) R&D Systems AF1924, RRID: AB_355060
Polyclonal Rabbit Anti-Human SYNAPSIN Antibody
1:500 (IF) EMD Millipore 5747777, RRID: AB_212517
Polyclonal Rabbit Anti-Human TBR1 Antibody
1:500 (IF) Abcam ab31940, RRID: AB_2200219
Polyclonal Rabbit Anti-Mouse N-terminal TDP-43 Antibody
1:1000 (WB), 1:500 (IF)
Proteintech 10782-2-AP, RRID: AB_615042
Polyclonal Rabbit Anti-Human phospho-Ser409 TDP-43 Antibody
1:500 (WB) Cosmo Bio USA CAC-TIP-PTD-P03, RRID: AB_1961901
Polyclonal Chicken Anti-Human TUJ1 Antibody
1:500 (IF) Neuromics CH23005, RRID: AB_2210684

73
Antibody Dilution Source Identifier
Monoclonal Mouse Anti-V5 Antibody
1:500 (Wes) Abcam ab27671, RRID: AB_471093
Monoclonal Mouse Anti-Mouse Vgat Antibody
1:300 (IF) Synaptic Systems 131011, RRID: AB_887872
Monoclonal Mouse Anti-Human VGLUT1 Antibody
1:200 (IF) Synaptic Systems 135311, RRID: AB_887880
2.5 Drug treatments
2.5.1 In vitro
G418 sulfate powder was reconstituted in sterile PBS to 50 mg/mL and CDX-series
compounds in dimethyl sulfoxide (DMSO) to 50 mM. These stock solutions were stored
at -20C. Upon addition of CDX compounds to cell culture media, gentle vortexing was
applied for 2 min to ensure complete solubilization. Vehicle solutions were prepared by
adding an equivalent volume of PBS and/or DMSO. Rec. PGRN (Adipogen, AG-40A-
0068Y-C010) was reconstituted to 0.1 mg/mL in sterile water. CTSL inhibitor (Z-Phe-
Phe-FMK, Abcam, ab141386) 10 mM stock in DMSO was first diluted to 100 and 300
µM, prior to 1:10 dilution in cell culture medium.
2.5.2 AAV mouse model
In vivo treatment solutions of vehicle (1.6% solutol), 16.6 mg/mL G418 (1.6% solutol),
0.5 mM CDX5-288 (1.6% solutol), and 16.6 mg/mL G418 + 0.5 mM CDX5-288 (1.6%
solutol) were prepared in sterile saline. A 50 mM solution of CDX5-288 in DMSO was
first diluted to 3 mM in 10% solutol (diluted in sterile saline) and further diluted 1:6 in

74
treatment solutions.
2.5.3 GrnR493X/R493X mouse model
In vivo treatment solutions of either vehicle (saline) and G418 reconstituted in saline (25
and 100 mg/mL) were used to treat Grn+/+ and GrnR493X/R493X mice. A range of G418
concentrations and injection volumes were used to achieve different doses of G418 in
the brain.
2.6 Western blot
2.6.1 Conventional western blot
Cortical neuron, astrocyte, and MEF supernatant were collected, and cell monolayers
were rinsed with 1 mL ice-cold PBS. Cells were lysed in 50 µL lysis buffer (20 mM Tris–
HCl pH 7.5, 150 mM NaCl, 1mM EDTA, 1 mM EGTA, 1% (v/v) Triton X-100, 2.5 mM
sodium pyrophosphate, 1 mM β-glycerophosphate) supplemented with fresh 1 mM
Na3VO4, and 1X complete protease inhibitor cocktail (Roche Molecular Biochemicals).
Lysates and supernatants were pre-cleared by centrifugation at 19,500 x g for 10 min at
4 °C. Neuronal, astrocyte, and MEF lysate protein concentrations were quantitated
using the Bradford assay and diluted in 4X SDS-PAGE loading buffer + 100 mM DTT.
Hemi-brain RIPA-soluble and -insoluble lysates were prepared and quantified according
to section 2.16.2 and were diluted in 4X SDS-PAGE loading buffer + 100 mM DTT. In
brief, 10-30 µg protein from each boiled (5 min at 95 °C) SDS lysate was separated on
4-15% gradient precast polyacrylamide gel (Bio-Rad), electroblotted onto a 0.45 µm
nitrocellulose membrane (Thermo Fisher Scientific) and blocked for 1 hour in 5% (w/v)

75
non-fat milk in TBS + 0.1% (v/v) Tween-20 (TBST). Samples from GrnR493X/R493X and
wildtype control mice (Grn+/+) were run on the same precast gel to allow for direct
comparison. Membranes were incubated with primary antibodies diluted in 5% non-fat
milk TBST blocking buffer overnight at 4 °C, washed 3X 5 min with TBST, incubated
with 1:10,000 HRP-conjugated secondary antibody diluted in 5% non-fat milk TBST
blocking buffer, washed again 3X 5 min with TBST, and incubated with enhanced
chemiluminescence substrate (EMD Millipore). Films were developed, scanned, and
analyzed using the Fiji processing package for ImageJ (National Institute of Health) for
densitometry analysis. To reprobe blots with the same species of primary antibody,
membranes were stripped with 0.1 N NaOH for 5 min, washed twice with deionized
H2O, and incubated for 30 min in 5% non-fat milk TBST blocking buffer before
incubation with an additional primary antibody.
2.6.2 ProteinSimple Wes
Automated capillary electrophoresis western analysis was carried out with
manufacturer’s reagents according to the user manual (Wes, ProteinSimple). HEK293
cell lysates were prepared and quantified following the methods used for
neurons/astrocytes/MEFs (see section 2.6.1), and AAV-GRN-R493X-V5 whole-brain
RIPA-soluble lysates were prepared and quantified as in section 2.16.1. Briefly, 5.6 µL
of 1 mg/mL HEK293 cell or whole-brain lysate was mixed with 1.4 µL fluorescent master
mix and heated at 95 °C for 5 min. The samples, blocking reagent, wash buffer, primary
antibody, secondary antibody, and chemiluminescent substrate were dispensed into the

76
microplate provided by the manufacturer, and the microplate was centrifuged at 1000 x
g for 5 min. The electrophoretic separation and immunodetection were performed
automatically using default settings. The data were analyzed with inbuilt Compass
software (ProteinSimple). The truncated and full-length V5 (PGRN) peak intensities
(area under the curve) were normalized to that of the actin peak, used as a loading
control. In Figure 3-1, Figure 3-2, Figure 3-4, and Figure 3-7, electropherograms are
represented as pseudo-blots, generated from the quantification of chemiluminescence
by the Compass software.
2.7 hiPSC models
2.7.1 hiPSC reprogramming
Erythroid progenitor (EP) cells were isolated from peripheral blood obtained from a
healthy control subject (WT) and a GRN p.R418X mutation carrier (R418X+/-) (350)
using the erythroid progenitor reprogramming kit (STEMCELL Technologies). Expanded
EPs were reprogrammed into hiPSCs with Epi5TM episomal reprogramming kit plasmids
(Invitrogen, Thermo Fisher Scientific) delivered in AmaxaTM Human CD34+ Cell
nucleofection buffer (Lonza) using the AmaxaTM Nucleofector II (Lonza) electroporation
device according to the erythroid progenitor reprogramming kit manufacturer’s
instructions.
2.7.2 hiPSC culture
hiPSCs were cultured in a feeder-independent manner on Matrigel (BD Biosciences)
coated plates and fed daily with mTeSR1 medium (STEMCELL Technologies). Every 4-

77
5 days, 70-80% confluence cultures were passaged as aggregates using ReLeSR
(STEMCELL Technologies) at ~1:5 split ratio. During the first 24 h post-plating,
mTeSR1 medium was supplemented with 10 µM rho-associated protein kinase inhibitor
(Y-27632, EMD Millipore). S116X+/- hiPSCs were obtained from existing stock and
previously described (60).
2.7.3 hiPSC trilineage differentiation
hiPSCs were differentiated into the three germ layers using the StemDiff™ trilineage
differentiation kit (STEMCELL Technologies) according to manufacturer's instructions.
After differentiation, cells were fixed in 4% PFA for 15 min for immunofluorescence
analysis with anti-SOX1 (ectoderm), anti-SOX17 (endoderm), and anti-DESMIN
(mesoderm) antibodies (see section 2.13.1).
2.7.4 hiPSC CNS lineage differentiation
WT and FTLD-GRN mutant hiPSCs were differentiated into neuronal progenitor cells
(NPCs) using the dual SMAD inhibition protocol (351). These NPCs were frozen and
thawed as needed onto Matrigel-coated plates in neural stem cell medium for week-long
expansion. Expanded NPCs were then plated onto poly-L-ornithine / laminin (PLO/L)
coated plates and further differentiated into cortical neurons using complete
BrainPhysTM media system (352) supplemented with 1X CultureOneTM (Gibco, Thermo
Fisher Scientific) for the first two weeks of neuron maturation. cAMP and ascorbic acid
were withdrawn from BrainPhysTM media after 3 weeks (from hiPSC stage, DIV 50) for
continued neuronal maturation until DIV 80 to allow lysosomal phenotypes to develop.

78
Astrocytes were differentiated from expanded cryopreserved NPCs according to the
STEMDiffTM astrocyte differentiation and maturation kit (STEMCELL Technologies)
protocol to produce DIV 60+ frozen stocks to be thawed and passaged as needed onto
Matrigel-coated plates in STEMDiffTM astrocyte maturation medium.
2.7.5 Karyotyping analysis
Karyotyping was performed on WT, R418X+/-, & R493X-/- KI by WiCell Cytogenetics, Inc.
(Madison, WI). The S116X+/- line was previously karyotyped by Cell Line Genetics
(Madison, WI) following the initial production of this line (60).
2.8 CRISPR/Cas9 gene editing
An isogenic hiPSC line homozygous for GRN R493X knock-in (R493X-/- KI) was
generated from WT using aspects of a previously established CRISPR/Cas9 gene
editing protocol (353). Briefly, guide RNA (gRNA) sequences were designed according
to the online Optimized CRISPR Design tool (http://crispr.mit.edu) to target a region for
double-strand breakage slightly upstream of the GRN R493 codon. A mutagenizing
single-stranded oligonucleotide (ssODN, Integrated DNA Technologies) was designed
to knock-in the R493X mutation and silently introduce a HindIII restriction enzyme site.
hiPSCs were co-transfected (Lipofectamine Stem Transfection Reagent, Invitrogen)
with knock-in ssODN and gRNA/Cas9 ribonucleoprotein (Integrated DNA Technologies)
complexes for 72 h. CRISPR/Cas9 edited hiPSCs were seeded at clonal density (25
cells/cm2). Individual colonies of adequate size and morphology, were picked and plated
for expansion. Genomic DNA was isolated using QuickExtractTM DNA Extraction

79
Solution (Lucigen) and PCR products containing the R493X target site were digested
with HindIII (New England Biolabs). Clones with positive digestion signal were selected
for Sanger sequencing to confirm the clean homozygous introduction of the R493X KI
mutation. Sanger sequencing was performed by the UBC Sequencing + Bioinformatics
Consortium.
2.9 Multielectrode array electrophysiology
WT and mutant hiPSC-derived NPCs (DIV 30) were co-cultured with hiPSC-derived WT
astrocytes (DIV 60+) at a 1:1 ratio and plated onto 48-well multielectrode array (MEA)
plates (Axion Biosystems) coated with PLO/L. For the 2 month time course MEA
experiment WT NPCs, WT astrocytes, and co-cultures of WT NPCs and WT astrocytes
were compared to evaluate the electrophysiological benefits of astrocyte inclusion. Cells
were plated using the drop seed method, where 15 µL of mixed cell suspension (60,000
cells in total) in a 10% dilution of Matrigel in BrainPhysTM media was pipetted onto the
electrode array in the center of each well. Cultures were fed by partial media
replacement every 3 days according to our cortical neuron differentiation protocol
described in section 2.7.4. Spontaneous electrophysiological activity of neuron-
astrocyte co-cultures was recorded for either 10 min at cortical neuron DIV 50
(WT/mutant NPC + WT astrocyte co-cultures) or 5 min weekly for 2 month time course
experiment using the Axion Biosystems Maestro MEA at 37 °C and 5% CO2. Data
analysis was performed using AxIs software (Axion BioSystems) to extract the number
of spikes and bursts from the recording file. Quality criteria for the assays were defined
as follows: an electrode having an average of more than 5 spikes/min and wells with

80
less than 30% of the total electrodes active were considered inactive and excluded from
the analysis. To assess synchronous network activity, at least 25% of the total 16
electrodes in each well were required to participate in a network event to be designated
as a network burst.
2.10 ELISA
PGRN levels in hiPSC-derived cortical neuronal and astrocyte whole cell lysates
(prepared according to section 2.5.1) and concentrated supernatants (Amicon Ultra 0.5
mL, 50 kDa, 25X concentrated) were determined by ELISA (Adipogen, human) using
the manufacturer’s protocol. Cultures were treated with an equal volume of media, and
an equal volume of supernatant was concentrated for each sample. Cortical neuron and
astrocyte lysates (1 mg/mL) and concentrated supernatant were diluted in ELISA buffer
at optimized dilutions. Pgrn levels in MEF whole cell lysates (prepared according to
section 2.5.1) and RIPA-soluble Grn+/+ and GrnR493X/R493X hemi-brain lysates (prepared
according to 2.16.2) were determined by ELISA (Adipogen, mouse) using the
manufacturer’s protocol. MEF lysates (1 mg/mL, Grn+/+ 1:20 and GrnR493X/R493X 1:5) and
RIPA-soluble hemi-brain lysates (10 mg/mL, Grn+/+ 1.5:10 and GrnR493X/R493X 1:5) were
diluted in ELISA buffer. G418 concentration levels in whole-brain lysates (prepared
according to 2.16.3) were determined by Gentamicin ELISA (Creative Diagnostics)
according to the manufacturer’s protocol using a G418 standard curve of 0.1, 0.3, 1, 3,
10, 30, and 100 ng/mL.

81
2.11 qPCR
Total RNA was extracted from hiPSCs using RNeasy Plus Mini Kit (Qiagen). cDNA was
produced by reverse transcription using the High-Capacity RNA-to-cDNA Kit (Applied
Biosystems, Thermo Fisher Scientific). To measure the endogenous gene expression of
pluripotency factors, qPCR analysis was performed using the 7900HT Fast Real-Time
PCR System (Applied Biosystems, Thermo Fisher Scientific). mRNA was detected with
TaqmanTM probes (Thermo Fisher Scientific, OCT4 Hs01895061_u1, LIN28
Hs00702808_s1, NANOG Hs02387400_g1, SOX2 Hs00602736_s1, GRN
Hs00963707_g1, GAPDH Hs03929097_g1, and HPRT1 Hs02800695_m1) in
combination with the TaqmanTM Universal PCR Master Mix (Applied Biosystems,
Thermo Fisher Scientific). Gene expression of hiPSC markers was normalized to
GAPDH housekeeping gene and compared to human fibroblast expression using the
ΔΔCt-method. GRN gene expression in cortical neurons and astrocytes was normalized
to the mean of GAPDH and HPRT1 housekeeping genes and compared to vehicle-
treated WT expression using the ΔΔCt-method.
2.12 Mouse genotyping
Mouse ear notch DNA was isolated in Chelex® 100. Briefly, 100 µL Chelex® 100 was
added to ear notch, vortexed for 10 sec, and pulse spun to ensure tissue was
submerged in the solution. Samples were then incubated at 95 C for 20 min. After 10
min, sample tubes were opened to release pressure and agitated to enhance tissue
digestion before completing the remaining 10 min of incubation. Samples were then
further agitated by running the bottom of the tubes across a metal tube storage rack and

82
centrifuged at 21,000 x g for 1.5 min. The PCR was run according to specifications
outlined on the Jackson Laboratories B6.129S4(SJL)-Grntm2.1Far/J strain data sheet with
2 µL of the resulting DNA-containing supernatant from each sample loaded into a 23 µL
PCR master mix solution. The resulting PCR products were resolved on a 2% agarose
gel and detected using SafeView Classic (Applied Biological Materials).
2.13 Histology
2.13.1 Immunocytochemical staining and quantification
Cells were fixed with 4% paraformaldehyde (PFA) for 15 min and washed three times
with Dulbecco PBS (D-PBS, Gibco, Thermo Fisher Scientific). Cells were blocked and
permeabilized with 10% donkey or goat serum (Sigma-Aldrich) in D-PBS containing
0.1% Triton X-100 (Abcam) for 1 h at room temperature (RT). Primary antibodies were
then diluted (Table 1-1) in 10% donkey or goat serum in D-PBS and applied to cells
overnight at 4 °C. All Alexa Fluor®-tagged secondary antibodies (Molecular Probes,
Thermo Fisher Scientific) were applied at a dilution of 1:500 at RT for 2 h. The
coverslips were then mounted in DAPI mounting medium (Vector Laboratories). Images
were captured with ZEN 2 software using a Zeiss 880 scanning laser confocal
microscope. Image quantification was performed using Fiji. The % of neurons
expressing FOXG1/TBR1 was determined by applying uniform thresholds and
converting images to binary using the watershed segmentation tool and quantifying the
number of individual DAPI+/neuronal marker+ cells with the analyze particles function.
The % neurons+ for MAP2 and % astrocytes+ for GFAP was determined by manually
counting nuclei of MAP2- and GFAP+ cells. Subtracting the number of MAP2- cells from

83
the total number of DAPI+ nuclei and dividing it by the total number of DAPI+ nuclei
yielded % MAP2+ and dividing the number of GFAP+ cells by the number of DAPI+
nuclei yielded % GFAP+. Cytotoxicity was assayed by staining fixed 96-well plate
neuronal cultures with Hoechst dye (1.5 µg/mL, Invitrogen). These plates were imaged
using a Cellomics ArrayScanTM plate scanner, and the number of cells/field were
automatically counted with acQuisitionTM software.
2.13.2 Brain immunofluorescence microscopy and quantification
Free-floating sagittal brain sections were blocked and permeabilized with 10% donkey
or goat serum (Sigma-Aldrich) in D-PBS containing 0.1% Triton X-100 (Abcam) for 2 h
at RT. Primary antibodies were then diluted (Table 1-1) in 10% donkey or goat serum in
D-PBS and applied to sections overnight at 4 °C with gentle agitation. All Alexa Fluor®-
tagged secondary antibodies were used at a dilution of 1:500 at RT for 2 h. The
sections were then mounted in DAPI mounting medium (Vector Laboratories). AAV9-
eGFP-Cre mouse brain sections were simply mounted in DAPI mounting medium to
assess eGFP expression. Z-stacks and tilescans were captured with ZEN 2 software
using a Zeiss 880 scanning laser confocal microscope using 20X and 40X objective
lenses. AAV9-eGFP-Cre whole mouse brain tilescans were captured with a 20X
objective lens, while all other brain section imaging was done with a 40X objective lens.
High magnification (100X, 2.5X digital zoom with 40X objective) Tuj1-TDP-43-DAPI co-
stained images were captured as single Z-plane images. All other images were
obtained through single field 30 µm thick (1 image / 5 µm step) z-stack and z-stack
tilescan acquisitions and were processed into maximum intensity projections using ZEN

84
2 software prior to image quantification performed using the Fiji processing package for
ImageJ (National Institutes of Health).
The total area (µm2) of lysosomal marker (Lamp1 and DppII) staining per CA3 or
VPM/VPL field was quantified using Fiji by applying a uniform threshold to all images
and watershed segmentation to distinguish individual lysosomal vesicles. The analyze
particle function was used to quantify areas ranging from 0.05-infinity µm2, providing
both total Lamp1+/DppII+ area and average lysosomal vesicle size. Total Pgrn staining
area was quantified by applying a uniform threshold across all images and analyzing
particle areas 0-infinity µm2. Microgliosis was quantified by assessing both total Iba1+
area and the number of Iba1+ cells; this was determined by applying a uniform
threshold and analyzing particles with an area of 0.25-infinity µm2 and 20-infinity µm2,
respectively. Astrogliosis was similarly quantified by measuring total Gfap+ area in
uniformly thresholded images using the analyze particles tool (0.25-infinity µm2).
Thalamic VPM/VPL total C1qa complement staining area was quantified by applying a
uniform threshold across all images and analyzing particle areas 0-infinity µm2. Ventral
thalamic density of Vgat+ synapses was determined by quantifying both the total Vgat+
area and the number of Vgat+ puncta. Vgat images were uniformly thresholded and
segmented using the watershed function, and particles limited to a 0.3-5 µm2 area were
analyzed. The % of Vgat+ synaptic area co-stained for C1qa was determined by
generating regions of interest (ROIs) of Vgat+ synapses using the above image
processing and analyze particle specifications. These Vgat ROIs were then applied to
corresponding co-stained C1qa images, and any C1qa+ staining outside of ROIs was

85
cleared using the clear outside function. The remaining intra-ROI C1qa staining was
uniformly thresholded and quantified by analyzing particle areas 0-infinity µm2. The total
C1qa area within Vgat ROIs was divided by total Vgat area and multiplied by 100 to
obtain % of Vgat+ synaptic area co-stained for C1qa. For data normalized on a per cell
basis, the number of DAPI+ nuclei were quantified per field by applying a uniform
threshold to all images and watershed segmentation to distinguish individual nuclei. The
analyze particle function was used to quantify areas ranging from 25-infinity µm2 to
determine the total number of cells per field.
Foxp2+ excitatory neuron and Vgat+ synaptic total thalamic density were obtained from
MIPs generated from z-stack tilescans containing both the hippocampal and thalamic
brain structures (40X magnification, 0.6 zoom, 8 x 12 tilescan). The polygon selection
tool was used to draw a boundary surrounding the thalamus to measure the total
thalamic area (mm2). Any Foxp2+ or Vgat+ staining outside of the thalamic boundary
was eliminated using the clear outside function, and a uniform threshold was applied to
each tilescan image. Following watershed segmentation to allow for clear detection of
individual Foxp2+ nuclei and Vgat+ synaptic puncta, the number of particles 50-200 µm2
(Foxp2) or 7.75-25 µm2 (Vgat) in size were analyzed and normalized to total thalamic
area.
Microglial skeletal analysis was conducted using the Fiji Analyze Skeleton (2D/3D)
plugin using a modified version of a previously described protocol (354). Pre-analysis
Iba1 image processing required adjusting image brightness maximum (-40 to 215),

86
applying unsharp mask (radius 3 and mask weight 0.6), and reducing background noise
using the despeckle tool. These processed images were then uniformly thresholded,
further despeckled, processed using the binary Close- tool, and background noise was
reduced further using the remove outliers function. The analyze particles function was
then used to generate ROIs masking Iba1+ staining of a 10-infinity µm2 area and add
them to the ROI manager. The original image was then reopened, and the initial Iba1
image processing steps were reapplied (brightness, unsharp mask, and despeckled). All
ROIs were then selected in the ROI manager and applied to this image using the OR
(combine) function. Any Iba1+ staining outside of the applied ROIs was eliminated using
the clear outside function, and a threshold of 1-255 was applied to completely fill in the
ROIs generating a clean binary image of microglial cell shapes. This image was then
skeletonized using the binary processing tool and analyzed with the Analyze Skeleton
(2D/3D) plugin (prune cycle: none, checked boxes = ‘show detailed info’ and ‘display
labelled skeletons’) to determine the total number of microglial branches per field. To
quantify microglial Pgrn fluorescent intensity (integrated density) from Iba1-Pgrn co-
staining microglial ROIs were generated from Iba1 images according to the above
skeletal analysis method. These ROIs were applied to their corresponding Pgrn co-
stained image, and any Pgrn+ staining outside of the applied microglial ROIs was
removed using the clear outside function. Pgrn integrated density in each microglial ROI
was then measured from the ROI manager. The calculated integrated densities for all
microglial ROIs per image were averaged, providing the Pgrn microglial fluorescent
intensity per field.

87
2.13.3 Brightfield microscopy
Live cultures were photographed with a digital camera mounted to a tissue culture
microscope (40X obj. lens) throughout the differentiation process from hiPSCs to
cortical neurons.
2.14 Surgical procedures
2.14.1 Intracerebroventricular injection of AAV particles
P0 C57BL/6J neonates were anesthetized using isoflurane and bilaterally injected ICV
with 0.5 µL of viral vector (AAV-GRN-R493X-V5, 8E13 PFU/mL and AAV9-eGFP-Cre,
1E13 PFU/mL) through a finely drawn glass micropipette as described previously (355).
PTC readthrough treatments were performed when AAV-GRN-R493X-V5 mice were 6
weeks old.
2.14.2 Bolus intracerebroventricular injection of drugs
2.14.2.1 AAV-GRN-R493X-V5 mice
A single bolus ICV injection of vehicle, CDX5-288, or G418 ± CDX5-288 was performed
in 6 week old AAV-GRN-R493X-V5 mice according to previously published works with
some modifications (356). First, to establish ICV targeting technical proficiency, a
healthy C57BL/6J control mouse right lateral ventricle was injected stereotactically
through a borehole (coordinates: -1.0 mm lateral/-0.3 mm posterior/-3.0 mm depth to
bregma) by loading a glass micropipette needle attached via tubing to a 5 µL glass
syringe (Hamilton, 600 series, model 65) with 5 µL 0.1% Fast Green FCF dye (Sigmal-
Aldrich) driven by microinjection syringe-pump (UMP3T-1, World Precision Instruments)

88
to deliver the dosage at a flow rate of 1 µL/min. The dye-injected mouse was
immediately euthanized, and its brain was collected to evaluate the pattern of CNS
delivery. Following similarly conducted 3 µL drug injections in AAV-GRN-R493X-V5
mice, the needle was left in place for 3 minutes and then removed at a rate of 1
mm/second while holding a cotton swab against the skull at the base of the needle. The
incision was then sutured with monocryl sutures (Ethicon, J303H) to close the skin, and
the mice were placed on the heating pad warmed half of a cage to ensure the mice
were kept at 36-38 °C for the first 1.5 h while they recovered from the anesthesia, with
the option for them to move away from the heat source. After treated AAV-GRN-R493X-
V5 mice had recovered fully from surgery, they were singly housed for 72 h. 5 mg/kg of
meloxicam was injected subcutaneously once per day for the first 2 days post-
operation.
2.14.2.2 Grn+/+ and GrnR493X/R493X mice
Bolus ICV injections of both vehicle and G418 were performed in Grn+/+ and
Grn493X/R493X mice to validate in vivo PTC readthrough in this model and optimize G418
dosing for a proposed recurrent injection model according to previously published works
with some modifications (122). Briefly, both 1X (100 µg, 72 h treatment) and 2X (50 µg
repeated 48 h treatments) ICV injections of G418 were tested. Mice lateral ventricles
were injected stereotactically (1-3 µL volume, coordinates: -1.0 mm lateral/-0.3 mm
posterior/-3.0 mm depth to bregma) with microinjection syringe-pump driven 10 µL glass
syringe (Hamilton, 701 LT) connected to a 51 mm Luer-locking needle (Hamilton, 31G,

89
K-Fel) loaded with either saline or G418 solutions delivered at a flow rate of 0.5 µL/min.
The incision was sutured, and post-surgical care was provided as in 2.14.2.1.
2.14.3 Intracerebroventricular iPRECIO® pump implantation in Grn+/+ and
GrnR493X/R493X mice
To establish iPRECIO® pump ICV targeting technical proficiency, a SMP-310R
iPRECIO® Programmable Infusion Pump (AZLET) was loaded with 0.1% Fast Green
FCF dye, programmed to immediately deliver dye the max rate of 8 µL/hour for 1 hour,
and implanted subcutaneously in a Grn+/+ mouse under isoflurane anesthesia. Pumps
were connected to a 30G 3 mm long Brain Infusion Kit 3 (AZLET) cannula. The base of
the cannula was coated in Loctite 454 (AZLET) glue and was stereotactically driven
through a borehole in mice right lateral ventricles (coordinates: -1.0 mm lateral/-0.3 mm
posterior/-3.0 mm depth to bregma). The physical pump and excess tubing were then
sterilely inserted into a subcutaneous pocket created caudally from the incision using a
blunt dissection tool. Following completion of iPRECIO® pump dye ICV perfusion, the
mouse was immediately euthanized, and its brain was collected to evaluate the pattern
of CNS delivery. iPRECIO® pumps loaded with saline or 25 mg/mL G418 were similarly
implanted, and the brain infusion cannula was inserted into the right lateral ventricles of
Grn+/+ and Grn493X/R493X mice. Saline/G418 loaded pumps were programmed to allow
mice to recover for 48-72 h and then dispense recurring bolus ICV doses of 1-2 µL
volumes (saline or 25/50 µg G418) at the max flow rate (8 µL/hr) every 48-72 h for the
experimental duration (see Figure 5-20 for more details). The incision was sutured, and

90
post-surgical care was provided as in 2.14.2.1.
2.15 Open-field behavioural assay
The open-field test was performed to evaluate anxiety in the GrnR493X/R493X mouse
model of frontotemporal dementia. The test consisted of a single 10 min trial in a white
opaque 40 cm x 40 cm x 30 cm arena (Maze Engineers). The center zone was defined
as a square covering 16% of the total area (16 cm x 16 cm central square). The mice
were moved to the experimental room at least 1 hour before starting the tests. To begin
each test, a mouse was introduced to the center of the square, and its behaviour was
captured on video for 10 min. On recording days, males were tested before any
females, and the area was cleaned with 50% ethanol and allowed to dry completely
between each test. The duration that each mouse stayed in either the peripheral or
central regions was quantified using JWatcher software (UCLA).
2.16 Brain collection and processing
2.16.1 AAV mouse model
72 h following ICV vehicle/drug injection, mice were anesthetized using isoflurane and
transcardially perfused with PBS before brain collection. Brains were immediately flash
frozen on dry ice and stored at -80 °C until lysate preparation. Whole-brains were later
thawed, homogenized in 500 µL TBS lysis buffer (150 mM NaCl, 1 mM EDTA, 1 mM
sodium orthovanadate, 1 mM NaF, 1 mM β-glycerophosphate, 2.5 mM sodium
pyrophosphate, 1 mM PMSF, PhosSTOP, cOmplete mini protease inhibitor), sonicated
for 10 sec at 20% amplitude and ultracentrifuged at 100,000 x g for 20 min at 4 °C. The

91
supernatants were collected as TBS-soluble extract, and the pellets were homogenized
in RIPA buffer (TBS lysis buffer + 1% NP-40), sonicated, and again ultracentrifuged at
100,000 x g for 20 min at 4 °C. The supernatants were collected as RIPA-soluble
extract. The protein concentration of RIPA-soluble fractions was measured by Bradford,
diluted to 1 mg/mL for automated capillary electrophoresis western analysis. 10-week
old AAV9-eGFP-Cre mice were perfused with PBS prior to brain collection. Brains were
immediately incubated in 4% PFA overnight and transferred to PBS + 0.05% azide at 4
°C for long term storage. 40 µm thick sagittal brain sections were prepared using a
vibratome (Leica, VT1000 S) and stored in PBS + 0.05% azide at 4 °C.
2.16.2 GrnR493X/R493X baseline characterization
80 week old Grn+/+ and GrnR493X/R493X mice were anesthetized using isoflurane and
transcardially perfused with PBS before brain collection. Brains were hemisected down
the midsagittal plane, one half was immediately flash frozen on dry ice, and the other
fixed overnight in 4% PFA. Frozen halves were stored at -80 °C until lysate preparation,
and fixed halves were transferred to PBS + 0.05% azide for long term storage. Floating
sections were prepared and stored according to section 2.16.1. Frozen brain halves
were thawed, homogenized in 250 µL RIPA buffer sonicated for 10 sec at 20%
amplitude and ultracentrifuged at 100,000 x g for 20 min at 4 °C. The supernatants were
collected as RIPA-soluble extract, and the insoluble protein pellet was further extracted
with urea buffer (30 mM Tris-HCl pH 8, 7 M urea, 2 M thiourea, 4% CHAPS,
PhosSTOP, cOmplete mini protease inhibitor) and centrifuged at 150,000 x g for 45 min
at 4 °C. The protein concentration of RIPA-soluble fractions was measured by Bradford,

92
diluted to 1 mg/mL for ELISA and western blots. The insoluble urea fractions were
diluted according to the protein concentration of corresponding RIPA-soluble fractions.
2.16.3 Vehicle/G418 treated Grn+/+ and GrnR493X/R493X mice
ICV injected (bolus/iPRECIO® pump) vehicle/G418 treated Grn+/+ and GrnR493X/R493X -
mice were anesthetized using isoflurane and transcardially perfused with PBS prior to
brain collection. The majority of brains were hemisected down the midsagittal plane,
one half was immediately flash frozen on dry ice, and the other fixed overnight in 4%
PFA, though a subset of experiments were conducted on whole flash frozen brains.
Frozen brain tissue was stored at -80 °C until lysate preparation, and fixed halves were
transferred to PBS + 0.05% azide for long term storage. Floating sections were
prepared and stored according to section 2.16.1. In a minority of cases, whole-brains
were dissected, flash frozen, and stored at -80 °C until lysate preparation. Frozen hemi-
brains were thawed, homogenized in 250 µL (500 µL for whole-brains) RIPA buffer
sonicated for 10 sec at 20% amplitude and ultracentrifuged at 100,000 x g for 20 min at
4 °C. The protein concentration of RIPA-soluble fractions was measured by Bradford,
diluted to 1 mg/mL for Pgrn and G418 quantification by ELISA/western blot.
2.17 Statistical analysis
All values are expressed as the mean ± standard error of mean (SEM). In experiments
where two groups were compared a standard unpaired two-tailed Student’s t-test was
performed. For comparisons of more than two groups, one-way analysis of variance
(ANOVA) was used followed by Tukey’s post hoc test. For comparisons of two or more

93
groups with multiple time points, two-way ANOVA was used followed by Bonferroni post
hoc test comparing each column to all other columns. For comparing the frequency of
lesion development and whisker barbering in our cohorts of Grn+/+ and GrnR493X/R493X
mice, Chi Square test was used. p-values less than 0.05 were considered significant.
Statistical analysis was performed using GraphPad Prism Software, Version 5.0.

94
Chapter 3: Exogenous PTC readthrough of nonsense mutant GRN
expression constructs
3.1 Introduction
Despite 23% of known causal FTLD-GRN variants introducing nonsense mutations,
PTC readthrough of GRN nonsense mutations had not yet been experimentally
demonstrated when this research project was initiated. Exogenous nonsense mutant
gene expression is a common approach used to validate whether a particular mutation
and surrounding sequence context are susceptible to PTC readthrough. Transfection is
a process that enables exogenous delivery of extracellular material (DNA expression
plasmids, mRNA, protein) into animal cells through a variety of methods. Typically,
transfection methods gain entry into the cell by creating transient pores in the plasma to
enable uptake of exogenous materials. Two of the most common transfection methods,
lipofection, and electroporation were employed in this chapter. Lipofection gains entry
into the cell through liposomal-membrane fusion, which releases encapsulated target
material into the cytoplasm. Electroporation involves a brief application of an electric
field to the cells, which temporarily increases the permeability of cell membranes
allowing for the introduction of foreign material. The highly transfectable HEK293 cell
line is believed to have originated from an embryonic adrenal precursor cell transformed
by incorporation of an ~4.5 kb segment of adenovirus 5 DNA into chromosome 19
(357,358). HEK293 cells are used widely for transfection experiments due to their short
doubling time, propensity to highly express exogenously delivered genes, and routine
culture methods.

95
AAVs are single-stranded DNA viruses commonly used as expression vectors in
mammalian systems. These viruses are particularly well-suited for transduction due to
their apparent lack of pathogenicity and ability to stably integrate into the host cell
genome at a specific AAVS1 locus in chromosome 19. These properties have
generated significant interest in utilizing AAVs for gene therapy applications. As
previously mentioned in section 1.2.7, an AAV GRN gene therapy-based approach has
been shown to restore GRN expression in preclinical models (218,221), leading to the
development of the AAV9 GRN expression vector, PR006, which is currently
undergoing phase I/II clinical validation in FTLD-GRN patients.
Generating complex genetic knock-in mouse models generally requires time-consuming
and expensive germ-line manipulations. ICV AAV injection into the murine neonatal
brain represents an alternative, more cost-effective way to manipulate mouse CNS
gene expression (359). When AAV are injected ICV on P0, mice develop stable long-
term brain-wide neuronal transgene expression (355). In this chapter, we sought to
determine whether we could induce PTC readthrough in HEK293 cells exogenously
expressing nonsense mutant GRN with the aminoglycoside G418. We also set out to
determine whether any of the recently generated CDX-series readthrough enhancer
compounds could synergistically increase GRN nonsense mutation readthrough.
Finally, we assessed whether we could induce in vivo brain PTC readthrough of
exogenously expressed nonsense mutant GRN in our AAV-GRN-R493X-V5 mice.

96
3.2 Results
3.2.1 PTC readthrough in transiently transfected HEK293 cells
PTC readthrough efficiency is affected by the specific nonsense codon sequence and
the flanking nucleotide sequences (234,240). Therefore, to survey the responsiveness
of GRN nonsense mutations to PTC readthrough, we designed several clinical GRN
nonsense mutation expression constructs. We first transiently transfected HEK293 cells
with S116X (UAA), R418X (UGA), and R493X (UGA) C-terminally V5-tagged human
PGRN expression constructs (Figure 3-1, A) and treated them for 72 h with the
aminoglycoside G418. Mock transfected HEK293 cells showed no detectable V5 signal
(Figure 3-2). Since the V5 tag was inserted at the C-terminus, any V5 detected
represented full-length PGRN generated by PTC readthrough. G418 induced GRN PTC
readthrough in cells with the R418X and R493X mutations, with V5 (full-length PGRN)
detected in both the cell lysate (intracellular) and supernatant (extracellular) fractions
(Figure 3-2). The accumulation of full-length PGRN in both the intra- and extracellular
fractions of transiently transfected HEK293 cells suggests that the PGRN readthrough
product retains its ability to be post-translationally processed via the secretory pathway.
The S116X mutant did not respond to G418 treatment (Figure 3-2), and this may be
because aminoglycoside-induced PTC readthrough is most efficient at UGA nonsense
codons and least efficient at UAA nonsense codons (UGA > UAG > UAA) (234).
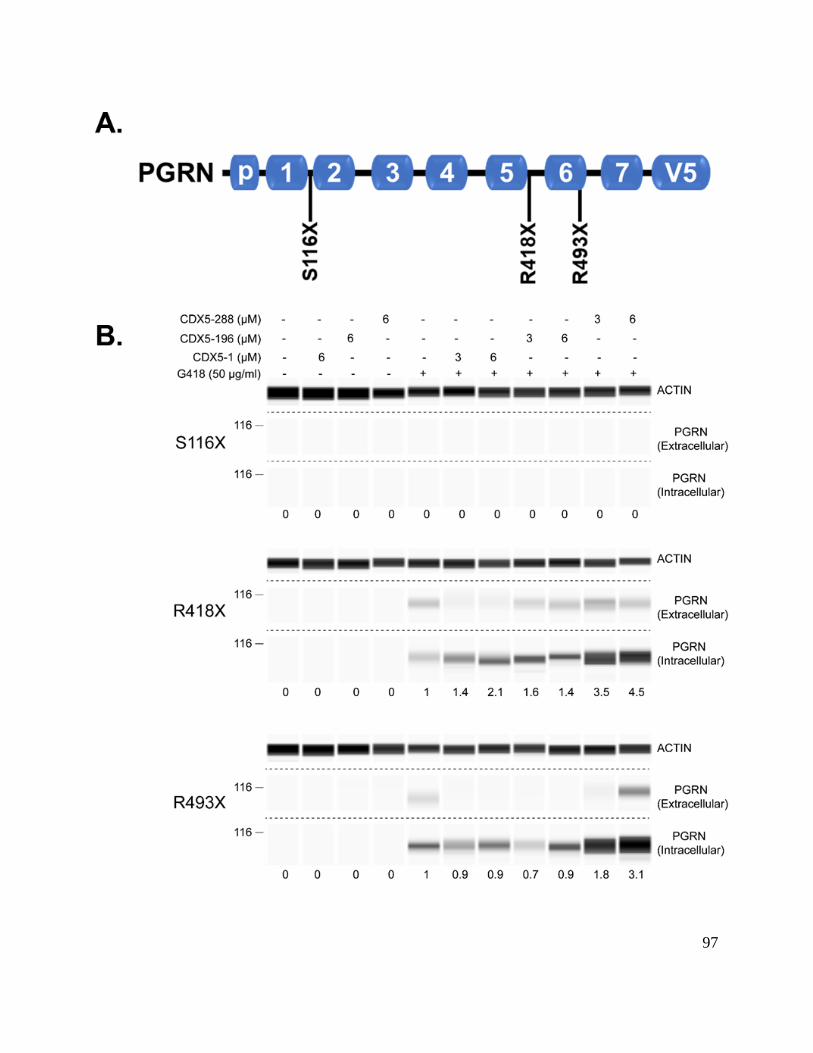
97

98
Figure 3-1 Induction of PTC readthrough by G418 and CDX5 enhancers in cells
stably expressing nonsense mutant GRN-V5. (A) Schematic of full-length PGRN
highlighting the position of the S116X (UAA), R418X (UGA), and R493X (UGA)
nonsense mutations in relation to the position of individual GRNs and the C-terminal V5
tag. (B) HEK293 cells transiently transfected with GRN-V5 expression constructs
bearing the indicated nonsense mutations were treated with G418 for 72 h. (C) HEK293
cell lines stably expressing GRN-V5 with the indicated nonsense mutations were treated
with G418 and the indicated concentrations of CDX5-1, CDX5-196, and CDX5-288 for
72 h. Cell culture supernatants (extracellular) and cell lysates (intracellular) were
subjected to automated capillary electrophoresis western analysis. Full-length PGRN
was detected with a V5 antibody. Actin was measured in cell lysates as a loading
control. The readthrough enhancement ratios (normalized to G418 alone) are indicated
under the lanes. The proportion loaded was 15-20X lower for the extracellular samples
than for the intracellular samples.

99
Figure 3-2 Induction of PTC readthrough by G418 in transiently transfected cells
expressing nonsense mutant GRN-V5. HEK293 cells transiently transfected with
GRN-V5 expression constructs bearing the indicated nonsense mutations were treated
with G418 for 72 h. Cell culture supernatants (extracellular) and cell lysates
(intracellular) were subjected to automated capillary electrophoresis western analysis.
Full-length PGRN was detected with a V5 antibody. Actin was measured in cell lysates
as a loading control. The proportion loaded was 15-20X lower for the extracellular
samples than for the intracellular samples.

100
3.2.2 PTC readthrough in stably transfected HEK293 cells
To further screen and validate the GRN PTC readthrough observed in transiently
transfected cells, we generated HEK293 lines stably expressing GRN-V5 nonsense
mutant constructs. When treated with G418, these cell lines exhibited a similar GRN
PTC readthrough response to that observed in transiently transfected cells (Figure 3-1,
B). Stable GRN-V5 expressing HEK293 lines provided an ideal screening platform to
test which CDX-series compounds could most effectively enhance G418-induced GRN
PTC readthrough. We treated HEK293 cell lines expressing nonsense mutant GRN-V5
with G418 alone or in combination with readthrough enhancers CDX5-1 (337), CDX5-
196 (Figure 3-3, A), or CDX5-288 (Figure 3-3, B) for 72 h, and measured intra- and
extracellular V5 levels. CDX5 compounds may enhance G418-induced PTC
readthrough activity in both the R418X and R493X mutant lines, and full-length PGRN
was detected in both the intra- and extracellular fractions (Figure 3-1, B). Given that the
data presented in Figure 3-1 is n=1, we did not conduct statistical analysis and therefore
viewed this data as a preliminary low confidence observation. Since CDX5-288 may
possess the highest enhancement of readthrough activity (Figure 3-1, B), we selected
co-treatment with G418 and CDX5-288 for further validation in patient hiPSC-derived
cortical neurons and astrocytes and AAV-GRN-R493X-V5 mouse model.

101
Figure 3-3 Chemical structures of CDX5-196 and CDX5-288. N-substituted
phthalimide derivatives CDX5-196 (A) and CDX5-288 (B).

102
3.2.3 PTC readthrough in HEK293 cells transduced with AAV-GRN-R493X-V5
viral particles
Upon generating AAV-GRN-R493X-V5 viral particles, we wanted to assess whether
transduced cells expressing the GRN-R493X-V5 construct were responsive G418-
induced PTC readthrough before proceeding with in vivo studies. To this end, we
transduced HEK293 cells for a total of 5 days with increasing concentrations of AAV-
GRN-R493X-V5 and co-treated them with G418 for 72 h. G418-induced GRN-R493X-
V5 PTC readthrough was only observed in HEK293 cells transduced with the highest
viral titer of 8.8E10 PFU/mL, as indicated by both intra- and extracellular V5 detection
(Figure 3-4).

103
Figure 3-4 Induction of PTC readthrough in cells transduced with increasing titers
of AAV-GRN-R493X-V5. HEK293 cells transduced for 5 days with increasing titers of
AAV-GRN-R493X-V5 viral vector were treated with G418 48 h post-transduction for an
additional 72 h. Cell culture supernatants (extracellular) and cell lysates (intracellular)
were subjected to automated capillary electrophoresis western analysis. Full-length
PGRN was detected with a V5 antibody. The proportion loaded was 15-20X lower for
the extracellular samples than for the intracellular samples.
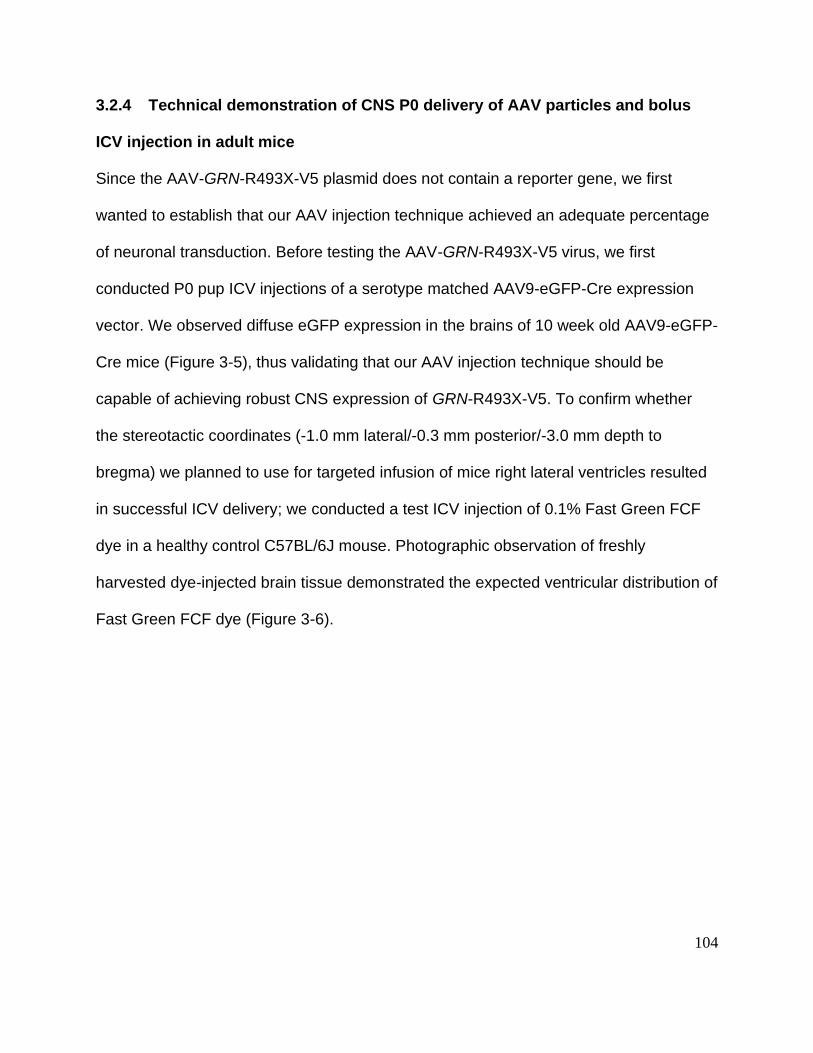
104
3.2.4 Technical demonstration of CNS P0 delivery of AAV particles and bolus
ICV injection in adult mice
Since the AAV-GRN-R493X-V5 plasmid does not contain a reporter gene, we first
wanted to establish that our AAV injection technique achieved an adequate percentage
of neuronal transduction. Before testing the AAV-GRN-R493X-V5 virus, we first
conducted P0 pup ICV injections of a serotype matched AAV9-eGFP-Cre expression
vector. We observed diffuse eGFP expression in the brains of 10 week old AAV9-eGFP-
Cre mice (Figure 3-5), thus validating that our AAV injection technique should be
capable of achieving robust CNS expression of GRN-R493X-V5. To confirm whether
the stereotactic coordinates (-1.0 mm lateral/-0.3 mm posterior/-3.0 mm depth to
bregma) we planned to use for targeted infusion of mice right lateral ventricles resulted
in successful ICV delivery; we conducted a test ICV injection of 0.1% Fast Green FCF
dye in a healthy control C57BL/6J mouse. Photographic observation of freshly
harvested dye-injected brain tissue demonstrated the expected ventricular distribution of
Fast Green FCF dye (Figure 3-6).

105
Figure 3-5 Technical demonstration of AAV P0 ICV injection method. P0 ICV
injection using an AAV9-eGFP-Cre viral vector with expression driven by the human
SYN1 promoter. Diffuse brain-wide eGFP (green) expression apparent 10 weeks after
bilateral P0 ICV injection. Cell nuclei were counterstained with DAPI (blue). Scale bar, 1
mm.
106
Figure 3-6 Technical demonstration of bolus ICV injection method in adult mice. A
C57BL/6J mouse was stereotactically injected with 5 µL 0.1% Fast Green FCF dye at
coordinates: -1.0 mm lateral/-0.3 mm posterior/-3.0 mm depth to bregma. Immediately
following dye injection, the brain was collected and photographed, demonstrating
ventricular delivery.
107
3.2.5 PTC readthrough in AAV-GRN-R493X-V5 mice
Having demonstrated PTC readthrough in exogenous GRN nonsense mutant
expression models in vitro, we sought to demonstrate initial proof-of-concept for this
approach in vivo. Brain PTC readthrough induced by ICV G418 has been previously
demonstrated in mice harboring an inducible gene-targeting system driven by the full-
length expression of a nonsense mutant Cre recombinase and in R294X Mecp2 knock-
in mice (360,361). Newborn pups (P0) were bilaterally injected ICV with virus solution
and aged to at least 6 weeks to allow for sufficient blood-brain-barrier (BBB) maturation
before treatment (362). RIPA-soluble brain lysates from each ICV treated AAV-GRN-
R493X-V5 mouse were probed for V5 expression to assess the extent of GRN R493X
PTC readthrough in vivo. No V5 signal was detected in either the vehicle (n=6) or
CDX5-288 (n=4) AAV-GRN-R493X-V5 brains 72 h after ICV injection (Figure 3-7, A-B).
By contrast, ICV injections with G418 alone (n=5) or G418 and CDX5-288 (n=4)
induced clear GRN-R493X-V5 PTC readthrough, as shown by the detection of V5 signal
at the expected molecular weight of PGRN, using automated capillary electrophoresis
western analysis (Figure 3-7, A-B). G418 significantly induced readthrough in AAV-
GRN-R493X-V5 mice compared to treatment with vehicle solution (Figure 3-7, A-B).
Though robust V5 levels were detected, co-treatment of AAV-GRN-R493X-V5 mice with
CDX5-288 did not increase full-length PGRN levels compared to G418 alone (Figure 3-
7, A-B). Our data indicate that short term administration of the aminoglycoside G418
can induce GRN PTC readthrough in vivo when delivered intraventricularly in an
exogenous AAV transgene expression model.

108
Figure 3-7 Induction of PTC readthrough in AAV-R493X-GRN-V5 mice. (A) 6-week-
old AAV-GRN-R493X-V5 mice were stereotactically injected ICV with either vehicle
solution, G418, CDX5-288, or a combination of G418 + CDX5-288 ICV and sacrificed
after 72 h. Whole-brain RIPA-soluble protein extracts were subjected to automated
capillary electrophoresis western analysis. Full-length PGRN was detected with a V5
antibody, and actin was measured in brain lysates as a loading control. (B)
Chemiluminescence quantification of automated capillary electrophoresis western
analysis V5 detection normalized to actin. Values are shown as mean ± SEM; * p <
0.05, one-way ANOVA with Tukey’s multiple comparison test.

109
3.3 Discussion
We generated several human expression constructs with known clinical GRN nonsense
mutations and observed a more robust PTC readthrough response to G418 and CDX5-
288 enhancer treatment in R418X and R493X mutant HEK293 cells compared to G418
alone or co-treatment with other enhancer compounds. To avoid confounding measures
of endogenous PGRN in HEK293 cells and ensure the measured PGRN was reflective
of full-length protein produced by readthrough, the GRN expression constructs bore a
C-terminal V5 tag. The readthrough enhancer compounds are N-substituted phthalimide
derivatives identified in a high-throughput screen in combination with sub-active
concentrations of the aminoglycoside paromomycin and further systematically
functionalized to increase their potency (337). These results provide a clear
demonstration that GRN UGA PTCs are most susceptible to readthrough, in alignment
with previously published reports evaluating the impact of nonsense codon sequence on
readthrough efficiency (234).
The production of AAV-GRN-R493X-V5 viral particles enabled us to validate whether
PTC readthrough could be achieved from exogenously delivered CNS nonsense mutant
GRN. Bilaterally injecting this virus into the developing P0 murine lateral ventricles
induced widespread CNS neuronal expression of V5-tagged R493X GRN. Since G418
and other aminoglycosides do not readily cross the BBB, we sought to determine
whether ICV administration of compounds could be a viable strategy for widespread
brain exposure and readthrough. Indeed, our results provide proof-of-concept that a
single ICV injection of G418 can induce PTC readthrough in an AAV-GRN-R493X-V5

110
mouse model in only 72 h. However, given the likely massive overexpression of the
GRN-R493X-V5 construct driven by the strong hybrid chicken β-actin promoter, it is
difficult to make meaningful conclusions regarding the optimal dosage of either G418 or
CDX5-288 enhancer compound. The recently generated GrnR493X/R493X nonsense
mutant knock-in mouse (165) is a superior model for further exploration of the optimal in
vivo doses of both G418 and enhancer compounds (see chapter 5).

111
Chapter 4: Generation of FTLD-GRN hiPSC lines and endogenous
PTC readthrough of GRN nonsense mutant hiPSC-derived CNS cell
types
4.1 Introduction
For decades ethical controversy and limited availability of human embryonic stem cells
limited their basic science research applications. As discussed in section 1.2.5, over a
decade ago, Dr. Shinya Yamanaka published an elegant study demonstrating the first
instance of adult somatic cell reprogramming into hiPSCs (195). This masterful work
has since sparked a revolution in our understanding of human developmental biology
and our ability to model human genetic disorders that originate in previously
unattainable tissues. The reprogramming of human somatic cells into hiPSCs is now
routine in labs worldwide, enabling rapid developments in personalized medicine and
improved investigation of pathological mechanisms driving complex disease processes.
Several methodologies have been established enabling somatic cell to hiPSC
reprogramming through the exogenous delivery of Yamanaka factors (OCT3/4, SOX2,
KLF4, MYC, and LIN28); the most common being Sendai viral transduction, non-
integrating episomal transfection, mRNA transfection, and protein transduction
(reviewed here (363,364)).
These technological advances have been particularly relevant to the fields of neurology
and neurodegeneration, as a multitude of hiPSC differentiation methods have been

112
developed that enable the derivation of distinct neuronal subtypes and glial cell types
(196-198). Decades of embryonic neurodevelopmental biology research provided the
foundational knowledge of growth factor patterning gradients required to guide the
establishment of hiPSC to neuroectoderm differentiation protocols. Chemical inhibition
of the anaplastic lymphoma kinase family has been shown to disrupt BMP4/TGF-β
signaling through the TGFβR-1 receptor and downstream activation of SMAD signal
transducers, promoting expression of the neuroectoderm lineage SOX1 transcription
factor while suppressing endoderm/mesoderm pathways (196). This approach, known
as dual-SMAD-inhibition, is widely used to derive pure populations NPCs for further
downstream differentiation/maturation into various CNS cell types.
hiPSC-derived NPCs neurodevelopmentally mirror the neuroepithelial cells that line the
apical surface of the ventricular zone and asymmetrically divide to produce radial glial
stem cells, which give rise to the majority of neuronal and glial cell types (365). Extrinsic
patterning cues in the form of recombinant protein growth factors (e.g., BDNF/GDNF)
are often provided to mature NPCs into the desired neuronal cell type. In 2015, Bardy et
al. generated a novel neuronal culture medium (BrainPhysTM) that more accurately
reflected neurophysiological ion concentrations and enhanced hiPSC-derived neuronal
electrophysiological maturation (352). Since obtaining human CNS neurologic tissue
primary cell cultures is severely limited by the risks and potential complications
associated with brain biopsies, the use of hiPSC-derived CNS tissue modelling has
accelerated research into human neurobiology.

113
The field of molecular biology was radically transformed following the landmark 2012
publication by Dr. Doudna and Dr. Charpentier, demonstrating that the bacterial
adaptive immune system (CRISPR/Cas9) could be co-opted for targeted genetic
engineering (366). Briefly, gRNA (dual complex of crRNA and tracrRNA) forms a
ribonucleoprotein complex with the Cas9 endonuclease, and the crRNA-guide
sequence localizes the complex to a complementary sequence of the genome triggering
double-strand break formation. Utilization of CRISPR/Cas9 gene editing is ubiquitous
throughout molecular biology research, with hiPSC modelling efforts being a major
benefactor. Dissecting precise phenotypic contributions of disease-associated SNPs
has been hampered by inadequate control hiPSC lines often derived from healthy
and/or genetically related individuals, which introduces background genetic variation
that may either silence or amplify observed phenotypes. CRISPR/Cas9 gene editing
solves this dilemma, enabling the generation of isogenic control/mutant hiPSC lines with
identical genetic backgrounds.
To expand on the results presented in chapter 3, we sought to determine whether PTC
readthrough treatments could restore endogenous nonsense mutant GRN expression in
hiPSC-derived cortical neurons and astrocytes. To evaluate readthrough efficiency in
GRN nonsense mutant hiPSC-derived brain cells, we measured both GRN mRNA and
intracellular/extracellular PGRN protein levels using qPCR and immunoassays. We also
assessed whether restoring PGRN expression in mutant neurons could rescue mutant
lysosomal dysfunction.

114
4.2 Results
4.2.1 Generation of WT and FTLD-GRN patient-derived hiPSC lines
We generated hiPSC lines from erythroid progenitors isolated from peripheral blood
obtained from a healthy control (WT) and an FTLD-GRN patient carrying the g.2923 C >
T (p.R418X) GRN nonsense mutation (R418X+/-) (350). Additionally, our collaborators
provided a stock of a previously published hiPSC line produced from an FTLD-GRN
patient bearing the g.585 C > A (p.S116X) GRN nonsense mutation (S116X+/-) (60).
These pluripotent cell lines enabled us to produce disease-relevant CNS cell types to
assess whether the compounds identified in chapter 3 could also restore endogenous
nonsense mutant GRN expression.
4.2.2 Generation of an isogenic GRN R493X homozygous knock-in hiPSC line
using CRISPR/Cas9 gene editing
The development of isogenic hiPSC lines limits non-specific phenotypic differences from
background genetic variability when comparing two distinct hiPSC lines derived from
healthy control and mutation carriers. We utilized the CRISPR/Cas9 gene editing tool to
homozygously introduce the most common FTLD-GRN mutation, p.R493X, into our WT
hiPSC line (Figure 4-1, A-C). Clones positive for the successful introduction of the
HindIII restriction enzyme digest site (Figure, 4-1, B) were Sanger sequenced to confirm
seamless homologous recombination of the knock-in ssODN (Figure 4-1, C). The
resulting isogenic mutant clone, R493X-/- KI, is the first hiPSC model of the rare form of
NCL, CLN11. As expected, R493X-/- KI hiPSC-derived cortical neuronal cultures
115
immunofluorescently stained for PGRN exhibit limited expression levels compared to
the parental isogenic WT neurons (Figure 4-2).
4.2.3 Characterization of hiPSC line pluripotency
To characterize the hiPSC lines, we assessed their expression of pluripotent markers at
the protein and mRNA level, and their ability to differentiate into all three germ layers
(Figure 4-3, A-B). Colonies from the WT, S116X+/-, R418X+/-, and R493X-/- KI hiPSC
lines exhibited strong nuclear staining for the pluripotent transcription factors NANOG
and OCT4 (Figure 4-3, A). Moreover, these hiPSC lines possessed elevated expression
of pluripotent markers, LIN28, OCT3/4, SOX2, and NANOG mRNA transcripts (Figure
4-3, B). To functionally validate these hiPSC lines’ pluripotential, we conducted in vitro
differentiation into the primary germ layers. All four hiPSC lines could differentiate into
ectodermal, mesodermal, and endodermal tissue as indicated by SOX1, DESMIN, and
SOX17 expression, respectively (Figure 4-3, A). Since chromosome abnormalities are
known to occur during hiPSC reprogramming, we had the hiPSC lines that we
generated (WT, R418X+/-, and R493X-/- KI) karyotyped, confirming that they were
karyotypically normal (Figure 4-3, A). Karyotyping analysis of the S116X+/- hiPSC line
was normal as previously described (60).

116

117
Figure 4-1 Generation of isogenic CRISPR/Cas9 gene edited R493X-/- KI hiPSC line
from WT. (A) Schematic representation of the gene editing strategy using the
CRISPR/Cas9 system. (B) Clonal screening for the silent introduction of the AAGCTT
HindIII restriction enzyme site to identify potential R493X knock-in clones. (C)
Simultaneous Sanger sequencing of the R493 codon region in both GRN alleles in WT
and isogenic R493X-/- KI clone confirming homozygous introduction of the UGA
nonsense codon at codon 493 (red highlight) and silent deletion of the PAM site.
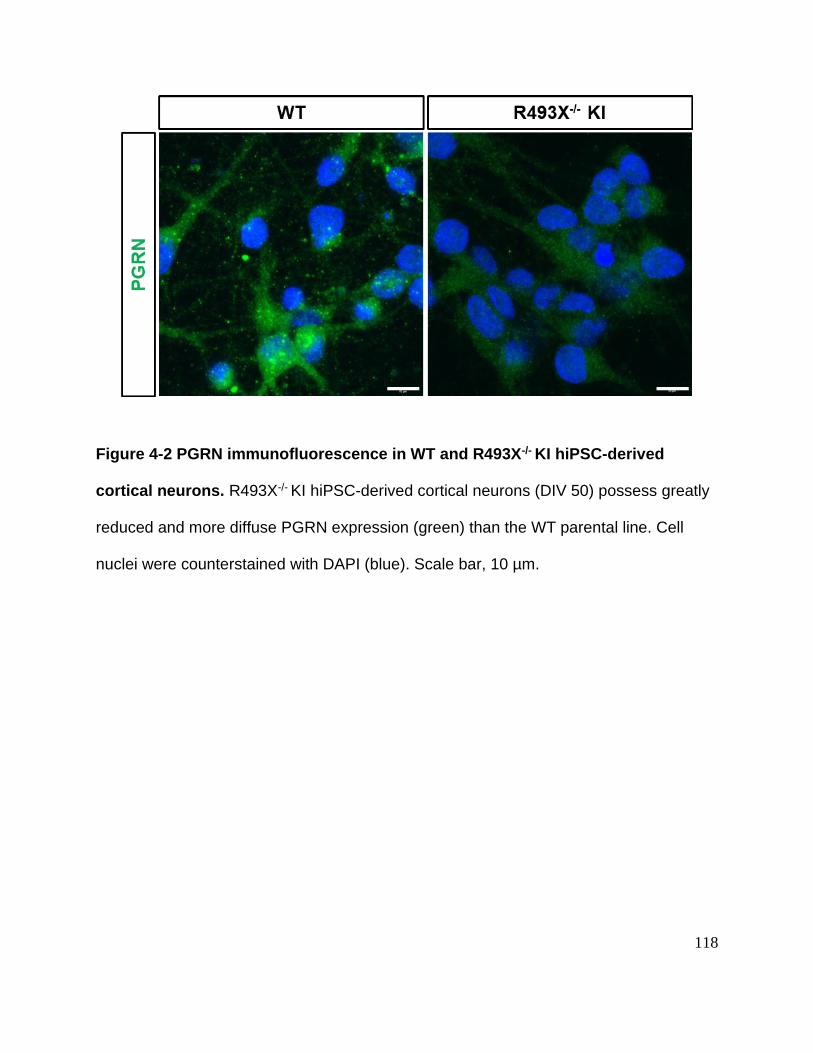
118
Figure 4-2 PGRN immunofluorescence in WT and R493X-/- KI hiPSC-derived
cortical neurons. R493X-/- KI hiPSC-derived cortical neurons (DIV 50) possess greatly
reduced and more diffuse PGRN expression (green) than the WT parental line. Cell
nuclei were counterstained with DAPI (blue). Scale bar, 10 µm.

119
Figure 4-3 Characterization of WT and GRN-deficient hiPSC lines. (A)
Immunofluorescence analysis of pluripotent markers in WT, S116X+/-, R418X+/-, and
R493X-/- KI hiPSC lines, and their respective normal karyotypes. In vitro trilineage
differentiation of WT, S116X+/-, R418X+/-, and R493X-/- KI hiPSC lines, cells were
immunostained for SOX1 (ectoderm), DESMIN (mesoderm), SOX17 (endoderm). Cell
nuclei were counterstained with DAPI (blue) except for SOX17. Scale bar, 50 µm. (B)

120
mRNA expression of pluripotent reprogramming factors in WT, S116X+/-, R418X+/-, and
R493X-/- KI hiPSC lines relative to the values in WT fibroblasts, as assessed by qPCR.
Values are shown as mean ± SEM.

121
4.2.4 Differentiation of WT and GRN-deficient hiPSC lines into cortical neurons
and astrocytes
We then differentiated the hiPSC lines into cortical neurons using a recently reported
version of the dual SMAD inhibition neuroectoderm induction protocol (351) in
combination with BrainPhysTM medium NPC neuronal maturation (352) (Figure 4-4, A).
The resulting neuronal cultures possessed high levels of purity, as indicated by the high
percentage of MAP2 positive (> 95%) and low percentage of GFAP positive cells (< 4%)
(Figure 4-4, B-D). This high degree of purity is likely attributable to the early addition of
the proprietary CultureOneTM supplement known to limit NPC proliferation during
neuronal maturation. Additionally, greater than 75% of cells expressed both FOXG1 and
TBR1, confirming these neurons express cortical layer VI markers (Figure 4-4, B, E,
and F). Synaptogenesis was demonstrated in these cultures by staining to analyze the
expression of synapsin and excitatory/inhibitory synaptic markers (Figure 4-5, A-B).
Interestingly, GRN mutant hiPSC-derived cortical neurons all exhibited significantly
lower VGLUT1+ excitatory synapse levels than WT (Figure 4-5, A-B). Astrocytes were
also differentiated from NPCs using an astrocyte differentiation/maturation kit protocol.
Mature astrocyte cultures (DIV 60+) derived from both WT and R493X-/- KI hiPSC lines
both expressed high levels (80%) of GFAP (Figure 4-4, G-H). Co-culturing cortical
neurons with WT astrocytes on MEA plates induced accelerated their
electrophysiological maturation and the formation of neural networks with frequent and
robust spontaneous action potentials measured by MEA (Figure 4-5, C and Figure 4-6,
A-B).

122

123
Figure 4-4 Differentiation and characterization of cortical neurons and astrocytes
derived from WT and GRN-deficient hiPSCs. (A) Brightfield images of the cells at
different stages of cortical neuronal differentiation. SB = SB 431542, LDN = LDN
193189, RI = Y-27632, BP = BrainPhysTM, N2 = N-2 supplement, B27 = B-27
supplement. (B) Representative immunofluorescence images of DIV 50 WT, S116X+/-,
R418X+/-, and R493X-/- KI hiPSC-derived cortical neurons stained for MAP2, GFAP,
TUJ1, FOXG1 (forebrain), and TBR1 (cortical layer VI). Cell nuclei were counterstained
with DAPI (blue). Scale bar, 50 µm. (C-F) Cells positive for MAP2, GFAP, FOXG1, and
TBR1 (neuronal, astrocytes, forebrain, and cortical layer VI markers, respectively) as a
percentage of DAPI+ cells. On average, ~900 cells were analyzed per replicate, in (C-F)
n = 3 independent cultures, 3 images per biological replicate; values are shown as
mean ± SEM. (G) Representative immunofluorescence images of DIV 60+ WT and
R493X-/- KI hiPSC-derived astrocytes stained for GFAP. Cell nuclei were counterstained
with DAPI (blue). Scale bar, 50 µm. (H) Cells positive for GFAP as a percentage of
DAPI+ cells. On average, ~400 cells were analyzed per replicate, n = 3 independent
cultures, 3 images per biological replicate; values are shown as mean ± SEM.

124

125
Figure 4-5 Characterization of hiPSC-derived cortical neuron synaptic
development and neural network formation. (A) Representative immunofluorescence
images of DIV 50 WT, S116X+/-, R418X+/-, and R493X-/- KI hiPSC-derived cortical
neurons stained for synapsin, VGLUT1 (excitatory), and GAD65 (inhibitory). Cell nuclei
were counterstained with DAPI (blue). Scale bar, 20 µm. (B) Quantification of the
synaptic density (excitatory/inhibitory) per 100 µm2 area of TUJ1+ staining in DIV 50
WT, S116X+/-, R418X+/-, and R493X-/- KI hiPSC-derived cortical neuron cultures. n = 3
independent cultures, 3 images per biological replicate; values are shown as mean ±
SEM; *** p < 0.0001, one-way ANOVA with Tukey’s multiple comparison test. (C)
Electrophysiological properties of DIV 50 WT, S116X+/-, R418X+/-, and R493X-/- KI
hiPSC-derived cortical neurons co-cultured with WT human astrocytes were recorded
via MEA to quantify the number of spikes and bursts detected over a 10 min interval. n
= 4 independent cultures; values are shown as mean ± SEM.

126
Figure 4-6 Co-culturing hiPSC-derived cortical neurons with hiPSC-derived
astrocytes accelerates electrophysiological maturation and neural network
formation. Weekly electrophysiological recordings were performed on WT astrocytes,
WT cortical neurons, and WT cortical neurons + WT astrocytes MEA plate cultures.
Recordings were obtained via MEA to quantify the number of spikes (A) and network
bursts (B) detected over a 5 min interval. WT astrocytes alone were excluded from
network burst analysis due to lack of electrical activity detected in (A). n = 4

127
independent cultures; values are shown as mean ± SEM, *** p < 0.001, ** p < 0.01, p *
< 0.05, two-way ANOVA with Bonferroni post-tests.

128
4.2.5 PTC readthrough in GRN-deficient hiPSC-derived cortical neurons
hiPSC-derived cortical neurons were matured to DIV 50 and exposed to PTC
readthrough compounds for 72 h. The levels of WT neuronal full-length PGRN
expression were not sufficiently high for detection by western blotting with available anti-
PGRN antibodies (Figure 4-7, A-B and Figure 4-8). As an alternative, intracellular and
concentrated extracellular fractions were assayed by ELISA using a PGRN polyclonal
antibody to multiple epitopes (GRN 1/3/5/7 peptides) that detects not only full-length
PGRN but also truncated PGRN as well as granulin (GRN) peptides, collectively
referred to here as PGRN/GRNs. Vehicle-treated S116X+/-, R418X+/-, and R493X-/- KI
neurons expressed 33.1% ± 1.5%, 49.9% ± 1.3%, and 74.5% ± 1.2% less intracellular
PGRN/GRNs than vehicle-treated WT neurons, as expected (Figure 4-9, A-D). In
general, treatment of FTLD-GRN mutant neurons with G418 without or with CDX5-288
produced a similar pattern of PGRN/GRNs expression to that observed in the stably
transfected HEK293 cell lines bearing the same mutations. Again, the S116X+/- neurons
exhibited little to no intra- or extracellular increase in the levels of PGRN/GRNs in
response to PTC readthrough treatment (Figure 4-9, A, E). R418X+/- neurons exposed
to G418 alone or to G418 and CDX5-288 showed significantly increased intracellular
PGRN/GRNs levels to 67.5% ± 1.2% and 75.8% ± 5.8% of vehicle-treated WT levels,
respectively (Figure 4-9, B). Treatment of R493X-/- KI neurons with G418 alone
significantly increased intracellular PGRN/GRNs levels, to 54.0% ± 5.5% of vehicle-
treated WT levels, and exposure to G418 and CDX5-288 further significantly increased
intracellular PGRN/GRNs levels compared G418 alone, to 83.9% ± 1.3% of vehicle-
treated WT (Figure 4-9, C). For both R418X+/- neurons and R493X-/- KI neurons,

129
extracellular PGRN/GRNs levels were not significantly increased in response to
treatment, although a trend toward a minor increase was observed (Figure 4-9, F-G).
Since R493X-/- KI neurons have no intact GRN allele, the observed increase in
intracellular PGRN/GRNs is derived from the mutant alleles. G418 did not show
significant cellular toxicity in iPSC-derived neurons (Figure 4-10).

130
Figure 4-7 Baseline expression and secretion of PGRN in WT hiPSC-derived
cortical neurons and astrocytes. PGRN expression is significantly greater in the intra-
(A) and extracellular (B) fractions of WT hiPSC-derived astrocytes compared to cortical
neurons. WT and R493X-/- KI hiPSC-derived cortical neurons and astrocytes were
cultured in fresh medium for 72 h. Intracellular (1 mg/mL lysate) and extracellular (25X
concentrated supernatant) samples were subjected to PGRN ELISA. Values are shown
as mean ± SEM; *** p < 0.0001, Student’s t-test.
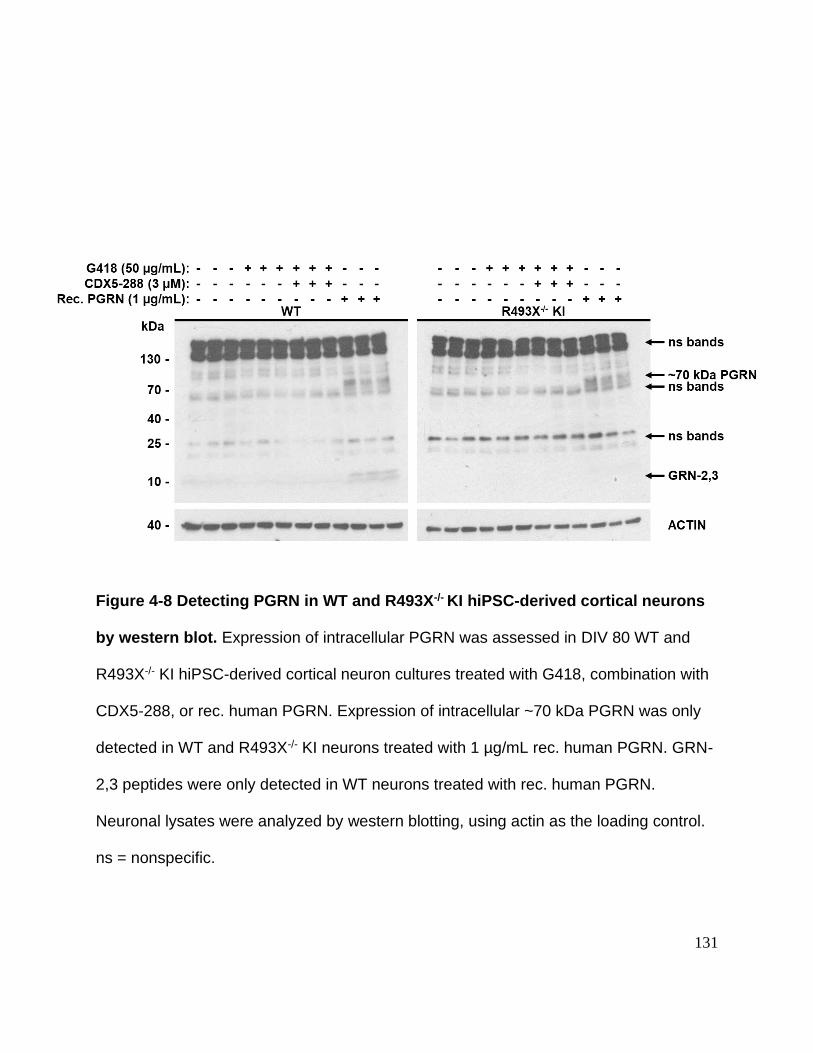
131
Figure 4-8 Detecting PGRN in WT and R493X-/- KI hiPSC-derived cortical neurons
by western blot. Expression of intracellular PGRN was assessed in DIV 80 WT and
R493X-/- KI hiPSC-derived cortical neuron cultures treated with G418, combination with
CDX5-288, or rec. human PGRN. Expression of intracellular ~70 kDa PGRN was only
detected in WT and R493X-/- KI neurons treated with 1 µg/mL rec. human PGRN. GRN-
2,3 peptides were only detected in WT neurons treated with rec. human PGRN.
Neuronal lysates were analyzed by western blotting, using actin as the loading control.
ns = nonspecific.

132

133
Figure 4-9 Induction of PTC readthrough by G418 and enhancers in hiPSC-
derived cortical neurons bearing FTLD-GRN nonsense mutations. DIV 50 S116X+/-,
R418X+/-, R493X-/- KI, and WT hiPSC-derived cortical neurons were treated with G418
and CDX5-288 at the indicated concentrations for 72 h. Intracellular (A-D, 1 mg/mL
lysate) and extracellular (E-H, 25X concentrated supernatants) samples were subjected
to PGRN ELISA using a polyclonal anti-PGRN antibody that targets multiple epitopes
(GRN 1/3/5/7 peptides) and cannot differentiate between PGRN/GRNs. n = 3
independent cultures; values are shown as mean ± SEM; * p < 0.05, ** p < 0.01, *** p <
0.0001, one-way ANOVA with Tukey’s multiple comparison test.

134
Figure 4-10 Quantification of G418-induced neuronal cytotoxicity. R418X+/- hiPSC-
derived neurons treated with escalating doses of G418 for 120 h with fresh media/drug
solutions replaced after 72 h. Cultures were stained with Hoechst dye and counted
using a Cellomics ArrayScanTM device. n = 3 independent cultures, 12 images per
biological replicate; values are shown as mean ± SEM.
0
2000
4000
6000A
vg
. # o
f cells /
fie
ld
G418 (g/mL) - 10 30 100

135
qPCR analysis revealed that readthrough compounds significantly increased GRN
mRNA levels in R493X-/- KI neurons. This observation was anticipated as mRNAs
bearing nonsense mutations are targeted for degradation by nonsense-mediated mRNA
decay (NMD) (233), and PTC readthrough enables escape of nonsense mutant mRNA
from degradation by NMD. Vehicle-treated R493X-/- KI neurons expressed 5.1-fold less
GRN mRNA relative to vehicle-treated WT neurons (Figure 4-11), indicating
downregulation of mutant mRNA by NMD. When treated with G418 or combination,
R493X-/- KI neurons express increased GRN mRNA levels (Figure 4-11). The selective
stabilization of PTC-bearing GRN mRNA over WT GRN mRNA strongly supports
inhibition of NMD consequent to readthrough in R493X-/- KI neurons. Taken together,
these results show that the G418 - CDX5-288 combination induces PTC readthrough
and effectively restores intracellular levels of PGRN in both heterozygous and
homozygous GRN nonsense mutant neurons to levels approaching that of healthy
control cells.

136
Figure 4-11 Selective increase of nonsense mutant GRN mRNA in R493X-/- KI
hiPSC-derived cortical neurons in response to PTC readthrough treatments.
qPCR analysis of human GRN mRNA levels in DIV 50 WT and R493X-/- KI hiPSC-
derived cortical neurons treated with G418 and CDX5-288 at the indicated
concentrations for 72 h. Relative mRNA levels were normalized to the mean of GAPDH
and HPRT1 housekeeping genes and compared to vehicle-treated (VT) WT. n = 3
independent cultures; values are shown as mean ± SEM; * p < 0.05, ** p < 0.01, *** p <
0.0001, one-way ANOVA with Tukey’s multiple comparison test.
137
4.2.6 PTC readthrough rescues lysosomal dysfunction in R493X-/- KI hiPSC-
derived cortical neurons
The specific nonsense mutant codon (e.g., R493X-/- KI, Arg-CGA to X-UGA) restricts
which near-cognate aminoacyl-tRNA molecules (Trp UGG, Cys UGC, Arg CGA, etc.)
pair with the PTC in the ribosome A site and contribute their amino acid to the growing
polypeptide during a readthrough event. Previous studies have demonstrated that the
amino acids most commonly incorporated at UGA nonsense mutations during
readthrough were Trp, followed by Cys and Arg (367). Thus, it is likely that a proportion
of full-length PGRN derived from GRN R493X-/- KI PTC readthrough would possess a
missense mutation at codon 493. Therefore, it was important to assess the functionality
of PGRN produced by PTC readthrough through its ability to rescue known cellular
FTLD-GRN and NCL phenotypes.
As discussed in sections 1.2.4 and 1.2.6, lysosomal defects are among the earliest
disease phenotypes in Grn-/- mice. Grn-/- brains upregulate the expression, maturation
rate, and catalytic activity of cathepsin lysosomal proteases (cathepsin D, B, and L) in
an age-dependent manner (119), and this aberrant lysosomal phenotype has been
previously rescued in vivo by treating aged Grn-/- mice with AAV-mediated Grn gene
therapy (218). Moreover, hiPSC-derived neurons with heterozygous GRN mutations
have been shown to exhibit an increased CTSD maturation phenotype (200). We
quantified the CTSD levels in aged (DIV 80) WT and R493X-/- KI hiPSC-derived cortical
neurons and observed significantly increased expression of the mature form of CTSD in
vehicle-treated R493X-/- KI neurons compared with WT neurons (Figure 4-12, A-B).

138
Treating WT neurons with G418, G418 + CDX5-288, or rec. PGRN did not affect mature
CTSD expression levels (Figure 4-12, A-B). However, treating R493X-/- KI neurons with
G418 and CDX5-288 significantly reduced mature CTSD levels, thus rescuing their
dysregulated lysosomal enzyme phenotype. Importantly, this effect was also observed
in R493X-/- KI neurons treated with extracellular rec. PGRN with a trend towards
reduced mature CTSD levels (Figure 4-12, A-B). These findings provide evidence that
PGRN expression restored by PTC-readthrough in R493X-/- KI cortical neurons (Figure
4-8, C) is biologically active and functional in vitro.

139
Figure 4-12 GRN PTC readthrough rescues FTLD-GRN/CLN11 lysosomal
pathological CTSD maturation phenotype in R493X-/- KI hiPSC-derived cortical
neurons. (A) DIV 80 WT and R493X-/- KI hiPSC-derived cortical neurons were treated
with vehicle solution, G418 alone, G418 in combination with CDX5-288, and rec. human
PGRN at the indicated concentrations for 72 h. Expression of mature CTSD in treated
WT and R493X-/- KI cortical neuron lysates analyzed by western blotting, using actin as

140
the loading control. (B) Densitometric quantification of CTSD expression in the
aforementioned cortical neuron lysates normalized to vehicle-treated WT levels. n = 3-6
independent cultures; values are shown as mean ± SEM; * p < 0.05, ** p < 0.01, one-
way ANOVA with Tukey’s multiple comparison test.

141
4.2.7 PTC readthrough in R493X-/- KI hiPSC-derived astrocytes
Next, WT and R493X-/- KI hiPSC-derived astrocytes were matured to DIV 60+ to extend
testing of readthrough compounds to another relevant CNS cell type with endogenous
nonsense mutant GRN expression. WT hiPSC-derived astrocytes produced 17.9-fold
more intracellular PGRN/GRNs, secreted 25.0-fold more PGRN/GRNs, and expressed
3.7-fold higher GRN mRNA than WT hiPSC-derived neurons as measured by ELISA
and qPCR (Figure 4-6 and 4-13). This considerably higher expression level enabled
analysis of intracellular PGRN levels by western blotting in hiPSC-derived astrocyte
cultures (Figure 4-14). The PGRN antibody used in this western blot analysis has
previously been shown to detect full-length PGRN and GRNs (GRN-2,3) (118). Both
PGRN and GRN-2,3 peptides were detected in WT astrocytes, though the GRN-2,3
peptides were more abundant than full-length PGRN (Figure 4-14, A). R493X-/- KI
astrocytes expressed small amounts of a band at ~70 kDa that may be PGRN truncated
at R493, and no detectable GRN-2,3 peptides (Figure 4-14, A).
Treating R493X-/- KI astrocytes with either G418 alone or G418 and CDX5-288
significantly increased intracellular ~70 kDa PGRN by 3.3- and 4.6-fold, respectively
(Figure 4-14, A, B.i). This increase in intracellular ~70 kDa PGRN was accompanied by
a small increase in GRN-2,3 peptide signal, which indicates that at least some of the
protein entered lysosomes and was cleaved into individual GRNs (Figure 4-14, A, B.ii).
Exposing R493X-/- KI astrocytes to extracellular rec. PGRN showed that these cells
could take up and process PGRN, as the vast majority of endocytosed full-length PGRN
was converted into GRNs (Figure 4-14, A-B). Since the conversion rate of full-length
142
PGRN to GRN-2,3 peptides is so efficient in astrocytes, we hypothesized that full-length
PGRN generated by readthrough would be rapidly processed into GRNs, perhaps
explaining why we observe limited full-length PGRN in G418 and CDX5-288
combination-treated R493X-/- KI astrocytes. The lysosomal cysteine protease CTSL
cleaves PGRN into GRNs (150). Therefore, we tested whether inhibiting CTSL during
G418 and CDX5-288 induced PTC readthrough in R493X-/- KI astrocytes could enable
clear visualization of full-length PGRN by western blot. Co-treating R493X-/- KI
astrocytes with 30 µM Z-Phe-Phe-FMK (CTSL inhibitor), G418, and CDX5-288 led to
accumulation of PTC readthrough derived full-length PGRN (Figure 4-14, C-D),
consistent with our hypothesis.

143
Figure 4-13 qPCR analysis of GRN mRNA levels in WT hiPSC-derived cortical
neurons and astrocytes. Relative GRN mRNA levels were measured in vehicle-
treated (VT) DIV 50 WT hiPSC-derived cortical neurons and DIV 60+ WT hiPSC-derived
astrocytes and were normalized to the mean of GAPDH and HPRT1 housekeeping
genes and compared to VT cortical neurons. n = 3 independent cultures; values are
shown as mean ± SEM; *** p < 0.0001, Student’s t-test.

144
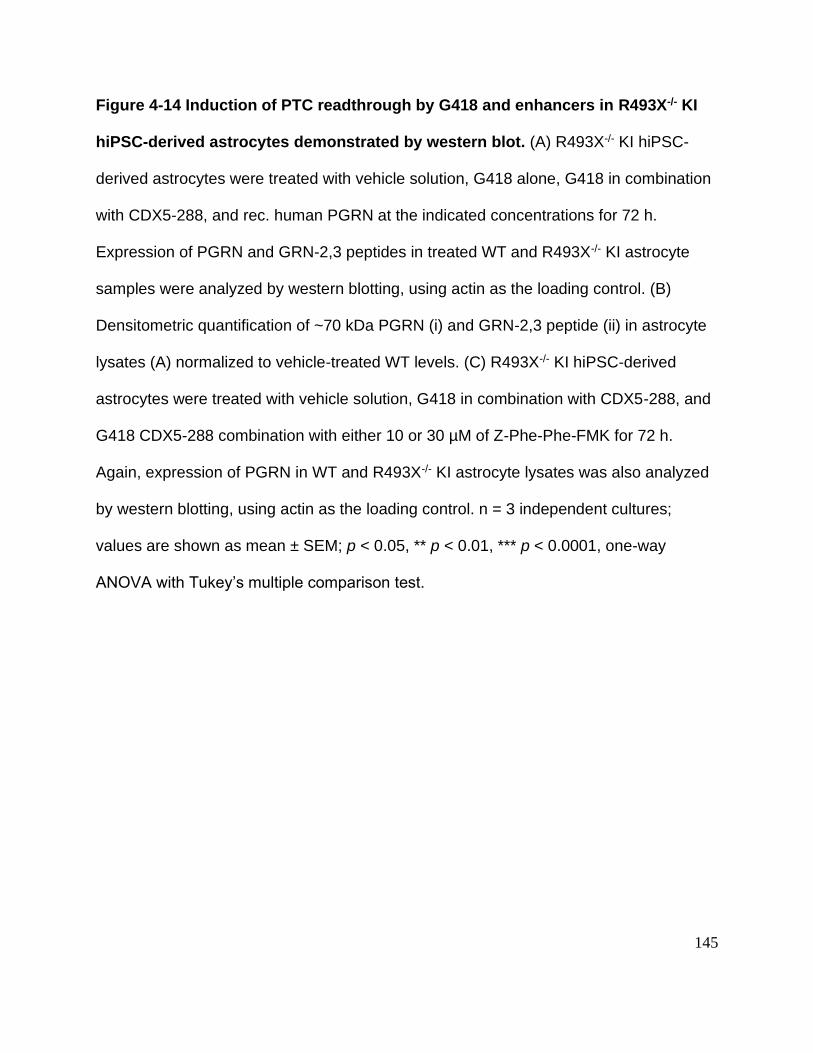
145
Figure 4-14 Induction of PTC readthrough by G418 and enhancers in R493X-/- KI
hiPSC-derived astrocytes demonstrated by western blot. (A) R493X-/- KI hiPSC-
derived astrocytes were treated with vehicle solution, G418 alone, G418 in combination
with CDX5-288, and rec. human PGRN at the indicated concentrations for 72 h.
Expression of PGRN and GRN-2,3 peptides in treated WT and R493X-/- KI astrocyte
samples were analyzed by western blotting, using actin as the loading control. (B)
Densitometric quantification of ~70 kDa PGRN (i) and GRN-2,3 peptide (ii) in astrocyte
lysates (A) normalized to vehicle-treated WT levels. (C) R493X-/- KI hiPSC-derived
astrocytes were treated with vehicle solution, G418 in combination with CDX5-288, and
G418 CDX5-288 combination with either 10 or 30 µM of Z-Phe-Phe-FMK for 72 h.
Again, expression of PGRN in WT and R493X-/- KI astrocyte lysates was also analyzed
by western blotting, using actin as the loading control. n = 3 independent cultures;
values are shown as mean ± SEM; p < 0.05, ** p < 0.01, *** p < 0.0001, one-way
ANOVA with Tukey’s multiple comparison test.

146
We next used ELISA to measure intra- and extracellular PGRN/GRNs levels in
astrocytes. Vehicle-treated R493X-/- KI astrocytes expressed 81.8% ± 1.6% less
intracellular PGRN/GRNs than vehicle-treated WT astrocytes (Figure 4-15, A-B).
R493X-/- KI astrocytes exposed to G418 alone or G418 and CDX5-288 showed
significantly increased intracellular PGRN/GRNs levels, to 75.7% ± 6.5% and 75.8% ±
3.2%, respectively, of vehicle-treated WT levels, only slightly less than PGRN/GRNs
restoration achieved through the application of exogenous rec. PGRN (Figure 4-15, B).
Vehicle-treated R493X-/- KI astrocytes secreted 94.9% ± 0.3% less PGRN/GRNs than
vehicle-treated WT astrocytes (Figure 4-15, C-D). Exposure to G418 alone or G418 and
CDX5-288 caused a considerable increase in secreted PGRN/GRNs, to 30.4% ± 1.7%
and 32.5% ± 1.2%, respectively, of vehicle-treated WT levels (Figure 4-15, C-D), unlike
R493X-/- KI cortical neurons, where treatment increased intracellular PGRN/GRNs but
only subtly increased PGRN/GRNs secretion.
As observed in cortical neurons, qPCR analysis found that PTC readthrough
compounds also significantly increased in GRN mRNA levels in R493X-/- KI astrocytes.
Vehicle-treated R493X-/- KI astrocytes expressed 3.3-fold less GRN mRNA than vehicle-
treated WT astrocytes (Figure 4-16). When treated with G418 or combination with
CDX5-288, R493X-/- KI astrocytes showed significantly increased GRN mRNA levels
compared to vehicle-treated control (Figure 4-16). These findings support of inhibition of
NMD consequent to PTC readthrough in R493X-/- KI astrocytes.

147
Figure 4-15 Induction of PTC readthrough by G418 and enhancers in R493X-/- KI
hiPSC-derived astrocytes demonstrated by ELISA. DIV 60+ WT and R493X-/- KI
hiPSC-derived astrocytes were treated with G418, CDX5-288, and rec. human PGRN at
the indicated concentrations for 72 h. Intracellular (A-B, 1 mg/mL lysate) and
extracellular (C-D, 25X concentrated supernatant) samples were subjected to PGRN
ELISA using a polyclonal anti-PGRN antibody that targets multiple epitopes (GRN
1/3/5/7 peptides). Therefore, the antibody cannot differentiate between PGRN/GRNs. n
= 3 independent cultures; values are shown as mean ± SEM; * p < 0.05, ** p < 0.01, ***
p < 0.0001, one-way ANOVA with Tukey’s multiple comparison test.

148
Figure 4-16 Selective increase of nonsense mutant GRN mRNA in R493X-/- KI
hiPSC-derived astrocytes in response to PTC readthrough treatments. qPCR
analysis of human GRN mRNA levels in DIV60+ WT and R493X-/- KI hiPSC-derived
astrocytes treated with G418 and CDX5-288 at the indicated concentrations for 72 h.
Relative GRN mRNA levels were normalized to the mean of GAPDH and HPRT1
housekeeping genes and compared to vehicle-treated (VT) WT. n = 3 independent
cultures; values are shown as mean ± SEM; * p < 0.05, ** p < 0.01, *** p < 0.0001, one-
way ANOVA with Tukey’s multiple comparison test.

149
4.2.8 Impact of G418 on PGRN expression in WT hiPSC-derived cortical neurons
and astrocytes
Contrary to expectation, we observed that WT cortical neurons treated with G418 alone
and in combination with CDX5-288 showed significantly increased intracellular
PGRN/GRNs levels relative to vehicle-treated cells, by 37.9% ± 3.2% and 42.9% ± 3.7,
respectively (Figure 4-8, D). This intracellular increase in WT neuronal PGRN/GRNs
levels was not due to PTC readthrough as both GRN alleles are WT. CDX5-288 alone
did not increase intracellular WT neuronal PGRN/GRNs, and its combination with G418
did not increase PGRN/GRNs over G418 treatment alone, indicating the observed
increase is mediated by G418 (Figure 4-8, D). The G418-mediated increase in
intracellular WT neuronal PGRN/GRNs expression was not accompanied by a
corresponding increase in PGRN/GRNs secretion (Figure 4-8, H). These findings in WT
neurons suggest that G418 may disrupt PGRN exocytosis. The potential mechanisms
driving this phenomenon are addressed in more detail in the context of WT astrocytes
(Figure 4-15 and Figure 4-16).
G418 increased intracellular PGRN/GRNs in WT astrocytes by 31.7% ± 5.6%, without a
corresponding increase in secreted PGRN/GRNs (Figure 4-15, A, C), as was observed
with WT cortical neurons. Western blotting revealed that G418 significantly increased
the intracellular levels of PGRN while decreasing the levels of GRN-2,3 peptides in WT
astrocytes (Figure 4-17). Therefore, G418 may disrupt the normally highly efficient
lysosomal processing of full-length PGRN to GRNs in astrocytes. To further probe the
mechanism of this unanticipated readthrough-independent increase in WT intracellular
150
PGRN, we conducted GRN qPCR analysis in WT hiPSC-derived neurons and
astrocytes. Treating WT neurons or astrocytes with G418 alone or in combination with
CDX5-288 did not significantly increase GRN mRNA levels (Figure 4-10 and Figure 4-
16). We speculate that G418 affects PGRN homeostasis at the protein level resulting in
reduced lysosomal processing of full-length PGRN into individual GRNs.

151
Figure 4-17 G418-mediated disruption of PGRN homeostasis in WT hiPSC-derived
astrocytes. G418 disrupts PGRN homeostasis in WT hiPSC-derived DIV 60+ astrocyte
cultures. (A) Expression of intracellular full-length PGRN and GRN-2,3 peptides in
G418, combination, and rec. human PGRN treated WT astrocyte lysates analyzed by
western blotting, using actin as the loading control. Densitometric quantification of
PGRN (B) and the ratio of PGRN:GRN-2,3 peptide (C) expression in the

152
aforementioned astrocyte lysates normalized to vehicle-treated WT levels. n = 3
independent cultures; values are shown as mean ± SEM; * p < 0.05, ** p < 0.01, one-
way ANOVA with Tukey’s multiple comparison test.

153
4.3 Discussion
As the founding graduate student researcher in the Nygaard laboratory, it was my
responsibility to establish novel cellular models for the study of FTLD-GRN. A critical
aim of my thesis was to assess the potential of PTC readthrough drugs to restore
endogenous nonsense mutant GRN expression in disease-relevant CNS cell types;
therefore, it was essential to generate and characterize healthy control- and FTLD-GRN
patient-derived hiPSC lines. WT and R418X+/- hiPSC lines were produced from healthy
control and a presymptomatic member of a Canadian family of GRN haploinsufficient
mutation carriers (UBC15), respectively. Our lab resource publication of the R418X+/-
hiPSC line in the journal of Stem Cell Research represents the contribution of a novel
research tool to the field of FTLD (350). Since the phenotypes reported in past studies
of GRN+/- hiPSC-derived neurons are not particularly robust (see section 1.2.5), we
used CRISPR/Cas9 to generate a WT hiPSC-derived isogenic homozygous GRN
R493X hiPSC line (R493X-/- KI). Additionally, the isogenicity of the WT and R493X-/- KI
hiPSCs provides greater confidence in attributing phenotypic differences to a lack of
GRN expression. Moreover, the homozygous nature of this knock-in hiPSC line ensured
that any increase in full-length PGRN expression detected in response to PTC
readthrough treatment was derived from a nonsense allele and not the intact allele
present in heterozygous hiPSC lines (S116X+/- or R418X+/-).
Considerable efforts were undertaken to optimize and identify an hiPSC neuroectoderm
induction method that reproducibly generated high-quality homogenous NPC cultures
from various hiPSC lines derived from either fibroblasts or erythroid progenitor cells.

154
This specific variant of dual-SMAD inhibition was adapted from a 2018 Rose et al. study
(351) and has been validated on at least eight different hiPSC lines in our lab. This
protocol’s key benefit was its ability to rapidly (3.5 weeks) produce 1E8+ NPCs starting
from a single 6-well plate well of confluent hiPSCs that could be frozen down for long-
term storage and thawed for future experiments requiring neuronal/astrocyte
differentiation. Thawed NPCs plated in BrainPhysTM supplemented with CultureOneTM
immediately initiated neurite sprouting and neural network formation, and within just 3
weeks, cultures were positive for forebrain and cortical neuron markers FOXG1 and
TBR1. Furthermore, the inclusion of CultureOneTM likely contributed to the minimal
accumulation of GFAP+ cells. This may be achieved through a mechanism similar to
previous differentiation efforts utilizing DAPT (γ-secretase and Notch pathway inhibitor)
to inhibit NPC proliferation and increase neuronal culture purity (368). A secondary
benefit of generating large quantities of frozen NPC stocks from each hiPSC line was
the ability to differentiate astrocytes from the same cells used to produce cortical
neurons. Astrocytes differentiated using the commercial STEMCELL Technologies
differentiation/maturation kit expressed high levels of GFAP. Importantly, we also
observed that the inclusion of WT astrocytes with WT cortical neurons in MEA co-
cultures significantly accelerated their electrophysiological development (Figure 4-5, A-
B); these hiPSC-derived astrocytes functionally support neuronal maturation as
expected. The generation of these hiPSC lines and optimization of the neural lineage
differentiation method was integral, enabling further assessment of their responsiveness
to nonsense suppression therapy.

155
Here, we showed that PGRN insufficiency caused by GRN nonsense mutations can be
ameliorated through PTC readthrough in disease-relevant cell types and that the
resultant increase in PGRN reverses FTLD-GRN related lysosomal dysfunction. We
used a commercially available ELISA kit that detects PGRN at multiple epitopes (GRN-
1, 3, 5, & 7) to measure intra- and extracellular of cortical neuron PGRN expression
levels, precluding discrimination between truncated and full-length forms of PGRN or
GRNs. This is because we could not detect full-length PGRN in hiPSC-derived cortical
neurons by western blot, likely due to their low levels of basal PGRN expression or
rapid processing into smaller GRNs. In contrast, we showed that full-length and
truncated PGRN is measurable by western blot in human astrocytes, allowing more
precise measurements of PGRN protein of various sizes, including full-length, truncated
forms, and GRNs. In response to G418 and CDX5-288, there was a significant increase
in truncated and likely full-length PGRN in R493X-/- KI astrocytes, as well as an increase
in GRN-2,3. This increase reflects a greater than 6-fold increase in GRN mRNA in
response to G418 and CDX5-288 combination treatment. PTC readthrough treatment
only restored R493X-/- KI neuronal GRN mRNA to WT levels, while astrocytes exhibited
> 2-fold increase in R493X GRN mRNA over WT levels, perhaps reflecting their overall
elevated basal GRN expression level. This increase in mRNA is characteristic of escape
from NMD, in which nonsense mutant mRNA undergoes its pioneering round of full-
length translation without stalling at its PTC.
This process is thought to be regulated by the degree of PTC readthrough, and only a
minor increase in translation beyond a proposed 0.5% threshold would be sufficient for
156
substantial NMD inhibition and increased translation, as shown in yeast (369). G418
has been previously demonstrated to inhibit NMD through this readthrough-dependent
mechanism (370). Stabilization of R493X mutant GRN mRNA leads to accumulation of
truncated protein, which was evident in R493X-/- KI astrocytes treated with both G418
alone and CDX5-288 combination. Moreover, the increase in ~70 kDa PGRN signal
detected in the R493X-/- KI astrocytes was accompanied by a faint, slightly higher MW
band (Figure 4-14, A), which likely represents full-length PGRN. Given that both WT
and R493X-/- KI astrocytes rapidly and efficiently process PGRN into individual GRNs,
likely, the majority of PTC readthrough-derived full-length PGRN would also be cleaved
into GRNs, thus making full-length PGRN particularly difficult to detect. This hypothesis
is supported by the observed increase in full-length PGRN in R493X-/- KI astrocytes in
response to readthrough treatment when the major lysosomal PGRN processing
enzyme CTSL is inhibited. Thus, suggesting that the increase in intracellular
PGRN/GRNs in R493X-/- KI cortical neurons likely reflects a mixture of truncated and
full-length PGRN. These findings highlight the value of conducting drug screening in
multiple cell types to evaluate differential drug responses, informing cell type-specific
therapeutic targeting methods.
Interestingly, treating R493X-/- KI cortical neurons with G418 and CDX5-288
combination rescued aberrant lysosomal function in these cells, reducing mature CTSD
levels back to WT levels. Recent studies have discovered a physical interaction
between PGRNs C-terminus and CTSD (200,202,203). Despite some conflicting reports
(119), the growing consensus is that PGRN binds to the pro-form of CTSD, promoting
157
its maturation, thus increasing its enzymatic activity (200,208). However, this hypothesis
is contradicted by the observation that mature CTSD is upregulated in Grn-/- mice
brains/microglia and can be rescued with exogenous mouse rec. Pgrn (180,218).
Nevertheless, our results suggest that PGRN generated by PTC RT can perform
biological functions and provides supplementary validation for at least a portion of the
readthrough derived neuronal PGRN being full-length. It has also been recently
demonstrated that the truncated PGRN R493X protein retains some of its biological
properties, such as lysosomal localization and an ability to suppress a proinflammatory
immune response in Grn-/- mice bone marrow-derived macrophage cultures (165).
Therefore, we cannot rule out a contribution of truncated PGRN in the correction of this
excess mature CTSD phenotype.
Unexpectedly, G418 induced accumulation of WT endogenous intracellular PGRN in all
of our in vitro models. Given that G418 increases WT PGRN levels, it was difficult to
prove that PTC readthrough was responsible for the elevated PGRN expression
detected in heterozygous R418X+/- cortical neurons, as any increase in PGRN could be
attributable to either increased expression from the WT allele or PTC-readthrough of the
nonsense mutant allele. This provided the rationale for developing a homozygous
R493X-/- KI line to address this issue and establish that at least a portion of the
increased PGRN expression we observed in R418X+/- neurons were likely reflective of
PTC readthrough. GRN expression analysis in WT cortical neurons and astrocytes
treated with G418 confirmed that the increase in intracellular PGRN is not due to an
accumulation of GRN mRNA, suggesting the mechanism is post-translational in nature.
158
The G418-mediated intracellular PGRN increase in WT neurons and astrocytes does
not result in corresponding accumulation of PGRN in culture media, implying that G418
may interfere with the PGRN secretory pathway. Further studies are needed to better
understand the possible post-translational role of G418 in PGRN processing.

159
Chapter 5: Phenotypic characterization of the GrnR493X/R493X mouse
model and dose-limiting in vivo toxicity of G418
5.1 Introduction
The neuropathology observed in patients bearing GRN LOF mutations is dictated by a
gene dosage-dependent effect, with haploinsufficient individuals developing FTLD-GRN
(35,36) and those lacking intact GRN alleles suffering from a rare form of NCL, CLN11
(95,96). The discovery that GRN-null individuals develop a lysosomal storage disease
has encouraged investigation into the role of PGRN and GRNs in regulating lysosomal
function (see section 1.2.4.2). The majority of the known neurobiological functions of
PGRN have been uncovered using Grn-/- mouse models, partially because models of
Grn haploinsufficiency do not replicate many of the neuropathological hallmarks
observed in either FTLD-GRN or CLN11. Microglial lysosomal dysfunction and neuronal
lipofuscin accumulation are the earliest pathological phenotypes observed in the Grn-/-
mouse brain (119,179), preceding well-established neuroinflammatory and
neurodegenerative phenotypes (see sections 1.2.4.1 and 1.2.4.4).
Previous in vivo FTLD-GRN therapeutic intervention studies have aimed to identify
drugs capable of upregulating the intact allele and thus had to be performed in Grn+/-
mice (135). The GrnR493X mouse model was recently generated to more accurately
model FTLD-GRN by introducing one of the most frequent GRN mutation (R493X) at
the analogous mouse Grn codon (R504X), providing an ideal model for preclinical

160
validation of novel PTC readthrough therapies. Characterization of this nonsense
mutant Grn model identified several previously observed Grn-/- disease phenotypes,
including microgliosis, lipofuscin accumulation, synaptic loss, and TDP-43 pathology
(165). We sought to comprehensively characterize behavioural and neuropathological
phenotypes in aged GrnR493X/R493X mice and attempt to restore CNS Pgrn expression
through PTC readthrough treatment. These findings provide additional phenotypic
markers of pathogenesis in aged GrnR493X/R493X mice that will contribute to better
defining mechanisms underlying FTLD-GRN, and offer relevant outcome measures for
preclinical efficacy testing of novel therapeutics that target nonsense mutations leading
to this devastating disease.
5.2 Results
5.2.1 Pgrn expression in the brains of aged GrnR493X/R493X mice
We obtained the previously generated FTLD-GRN/CLN11 mouse model bearing
homozygous Grn R504X mutations analogous to the human GRN R493X mutation for
further neuropathological and behavioural characterization (165). Homozygous
introduction of the GrnR493X PTC in these mice was confirmed by PCR (Figure 5-1).
Brain Pgrn expression in 18 month old Grn+/+ and GrnR493X/R493X mice was assayed using
multiple immunological detection methods, including western blot (Figure 5-2, A), ELISA
(Figure 5-2, B), and immunofluorescence microscopy (Figure 5-2, C-D). These results
demonstrate that nonsense mutant Pgrn expression is significantly reduced, detecting
GrnR493X/R493X global Pgrn brain expression levels of 14.7% ± 1.7% (ELISA) and 21.7% ±

161
2.5% (western blot) relative to Grn+/+ expression levels. Immunofluorescent
quantification of Pgrn expression in hippocampal CA3 and thalamic VPM/VPL
GrnR493X/R493X pathological hotspots identified even lower levels of Pgrn, with total Pgrn
area per cell of 4.3% ± 0.7% (CA3) and 4.6% ± 0.7% (VPM/VPL) of Grn+/+ tissue levels.

162
Figure 5-1 GrnR493X/R493X genotyping. PCR genotyping results confirm the presence of
the homozygous GrnR493X knock-in alleles in GrnR493X/R493X mice. nt = no template, bp =
base pair.

163
Figure 5-2 Pgrn expression in the brains of aged GrnR493X/R493X mice. 18 month old
Grn+/+ and GrnR493X/R493X hemibrain RIPA-soluble lysate samples were subjected to both
Pgrn western blot (A) and Pgrn ELISA (B). Densitometric quantification of Pgrn western
blot signal was normalized to actin loading control. (C) Pgrn expression was also
detected in the hippocampal CA3 and thalamic VPM/VPL regions by

164
immunofluorescence staining of 18 month old Grn+/+ and GrnR493X/R493X brain sections
(scale bar, 20 µm). (D) Total Pgrn+ area in CA3 (i) and VPM/VPL (ii) was quantified and
normalized to the total number of cells (DAPI, blue). For western blot/ELISA n = 6 mice
were used per sex/genotype; for immunofluorescence staining n=10 mice were used
per sex/genotype (except male GrnR493X/R493X n=8); values are shown as mean ± SEM;
*** p < 0.0001, Student’s t-test.
165
5.2.2 Lysosomal dysfunction in the brains of aged GrnR493X/R493X mice
NCL pathophysiology is generally driven by disrupted lysosomal catabolic functions
resulting from lysosomal enzyme deficiencies. As discussed in section 1.2.4, a growing
consensus in the literature suggests that loss of PGRN directly and indirectly disrupts
both protein and lipid recycling pathways. Studies of Grn-deficient mouse models have
helped identify PGRN’s roles in maintaining autophagic homeostasis in the CNS
(107,119,120,178). To assess the potential efficacy of therapeutic interventions in our
GrnR493X/R493X mice, it was critical to first characterize the various disease phenotypes
that develop in this model. Additionally, since GrnR493X/R493X mice express low levels of a
semi-functional truncated form of Pgrn (Pgrn-R493X) (165), it was also important to
assess whether these mice pathologically mirror Grn-/- mice disease progression.
Previous studies in Grn-/- mice have found CNS lipofuscin accumulation occurs as early
as 2-3 months of age (179). We replicated the thalamic/hippocampal autofluorescent
lipofuscin phenotype reported in the seminal GrnR493X/R493X model characterization paper
(165), observing extensive lipofuscin in 18 month old mice in both the CA3 hippocampal
region and thalamus (Figure 5-3, A). Further, aged R493X knock-in mice exhibit
increased expression of lysosomal proteins Lamp1 and DppII, which were also shown
to accumulate in these brain regions (Figure 5-3, B-C). We quantified Lamp1+ and
DppII+ areas in the thalamus and hippocampus of aged GrnR493X/R493X mice and
observed a significant increase in the expression of these lysosomal markers in the CA3
and VPM/VPL brain regions (Figure 5-3, D-G). Increased lysosomal vesicle size has
been previously reported in several models of Grn-deficiency, including both Grn-/-
mouse hippocampal neurons (107) and in GrnR493X/+ primary cortical neurons (136). We

166
also found that GrnR493X/R493X CA3 and VPM/VPL regions accumulate significantly larger
Lamp1+ lysosomal vesicles than Grn+/+ control mice (Figure 5-4, A-B).
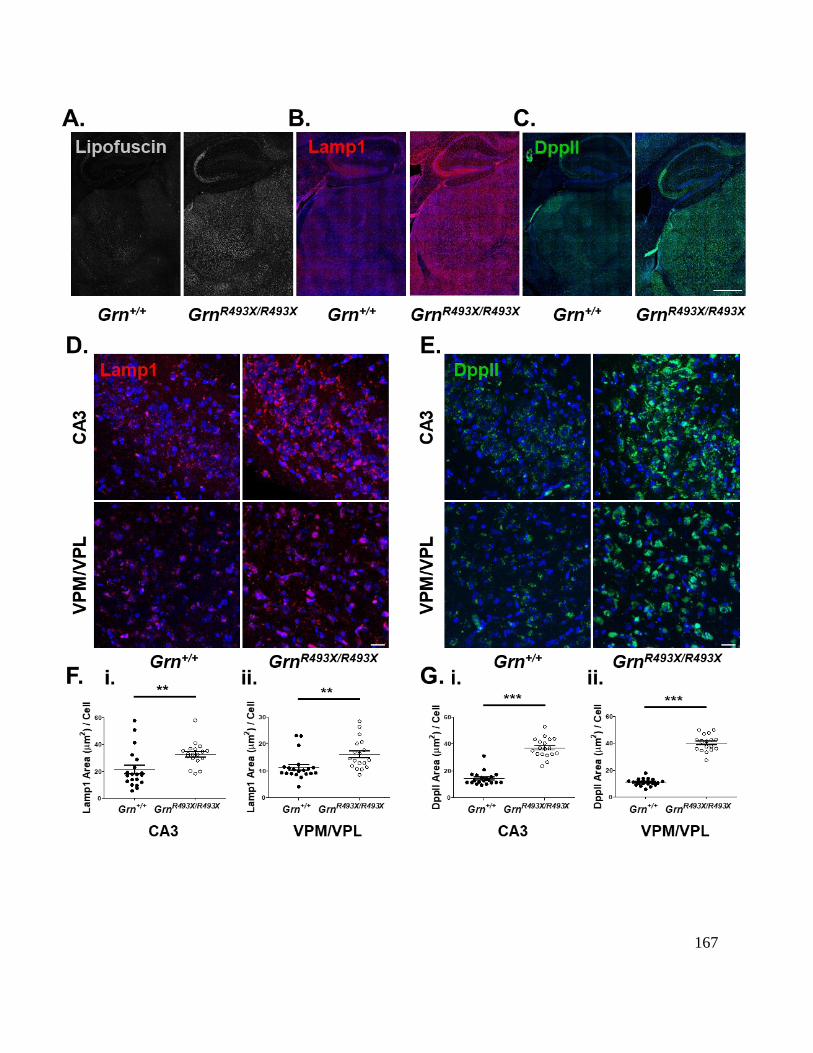
167

168
Figure 5-3 Lysosomal dysfunction in the ventral thalamus and CA3 hippocampal
region of aged GrnR493X/R493X mice. Representative hippocampal/thalamic tilescans
highlighting autofluorescent lipofuscin (A, green channel), Lamp1 (B), and DppII (C)
accumulation in the CNS of 18 month old GrnR493X/R493X mice (scale bar, 500 µm). (D-E)
Representative Lamp1 and DppII immunofluorescence images of hippocampal CA3 and
thalamic VPM/VPL regions in 18 month old Grn+/+ and GrnR493X/R493X brain sections
(scale bar, 20 µm). (F-G), Total Lamp1+ and DppII+ area/cell in CA3 (i) and VPM/VPL
(ii) images were quantified and normalized to the total number of cells (DAPI, blue). For
immunofluorescence staining n=10 mice were used per sex/genotype (except male
GrnR493X/R493X n=8); values are shown as mean ± SEM; ** p < 0.01, *** p < 0.0001 was
determined by Student’s t-test.

169
Figure 5-4 Enlarged lysosomes in the ventral thalamus and CA3 hippocampal
region of aged GrnR493X/R493X mice. Average Lamp1+ vesicle size was quantified in
images of Grn+/+ and GrnR493X/R493X CA3 (A) and VPM/VPL (B). For immunofluorescence
staining n=10 mice were used per sex/genotype (except male GrnR493X/R493X n=8);
values are shown as mean ± SEM; *** p < 0.0001 was determined by Student’s t-test.

170
Aged Grn-/- mice develop global CNS lysosomal dysfunction, including disrupted
autophagosome clearance (106), overexpression of lysosomal enzymes (119), and
cytoplasmic accumulation of insoluble TDP-43 (93). To evaluate CNS-wide lysosomal
dysfunction in this model, we conducted a series of western blot assays on RIPA-
soluble and -insoluble hemi-brain lysates. Unlike previous findings in Grn-/- mice (218),
Lamp1 protein levels were not found to be significantly increased in the GrnR493X/R493X
brain, although the data trended toward elevated Lamp1 expression (Figure 5-5, A-B).
Increased expression and enzymatic maturation of the lysosomal protease Ctsd has
been reproducibly observed in whole Grn-/- brain tissue (119). Expression of both the
pro- and mature forms of Ctsd were significantly increased in GrnR493X/R493X brain
compared to Grn+/+ (Figure 5-5, A, C). Lysosomal dysfunction can lead to functional
impairments in autophagy, an essential process in maintaining cellular health. Chang et
al. identified impaired ALP signaling in whole cortical tissue obtained from 18 month old
Grn-/- mice, including an approximate 35% increase in the LC3-II:LC3-I ratio, which
indicates autophagosome accumulation (106). Our similarly aged GrnR493X/R493X mice
exhibited a nearly 2-fold increase in LC3-II:LC3-I over Grn+/+ (Figure 5-5, A, D),
suggesting a dysregulated autophagy phenotype persists despite the low levels of
lysosomal accumulation of partially functional Pgrn-R493X that may occur in these mice
(165).

171
Figure 5-5 Global lysosomal dysfunction in the brains of aged GrnR493X/R493X mice.
Representative western blots of hemibrain RIPA-soluble lysates from 18 month old
Grn+/+ and GrnR493X/R493X mice probed with the indicated antibodies (A). Expression of
Lamp1, total/pro/mat-Ctsd, and LC3-I/II in Grn+/+ and GrnR493X/R493X hemibrains lysates
was analyzed by western blotting, using actin as the loading control. Densitometric
quantification of brain-wide Lamp1 (B) and Ctsd (C) expression was normalized to actin
and Grn+/+ levels. The LC3-II:LC3-I densitometric expression ratio (D) was normalized to
Grn+/+ levels. n=6 mice were used per sex/genotype; values are shown as mean ± SEM;
ns = not significant, ** p < 0.01, *** p < 0.0001, Student’s t-test.

172
Impaired autophagy has been linked to increases in pathological forms of TDP-43, a
pathologic hallmark of FTLD-GRN. Although Grn-/- mice develop a limited form
cytoplasmic/nuclear TDP-43 aggregation slightly resembling histopathology observed in
FTLD-GRN patients (371), biochemical analyses have identified increased full-length
and phosphorylated TDP-43 (p-TDP-43) expression in whole-brain RIPA-insoluble
fractions (93,371). Full-length TDP-43 can be cleaved into aggregation-prone CTFs that
form the major protein component of TDP-43+ inclusions (23,24). 12 month old
GrnR493X/R493X brains were found to contain diffuse cytoplasmic TDP-43/p-TDP-43
positivity similar to Grn-/- mice, that was absent in Grn+/+ mice (165). We reasoned that
older mice might display a more robust TDP-43 phenotype. Using a polyclonal N-
terminal TDP-43 antibody known to detect multiple forms of TDP-43, including full-
length and several truncated CTFs (372), we probed RIPA-soluble and -insoluble hemi-
brain lysates for TDP-43 expression. Full-length TDP-43 expression in the soluble
fraction was significantly decreased in GrnR493X/R493X mice (Figure 5-6, A-B), with a
similar trend observed for CTFs (Figure 5-6, A, arrows). Surprisingly, decreased soluble
TDP-43 expression did not correspond with an increase in insoluble TDP-43 levels
(Figure 5-6, A, C). We further probed these lysate fractions for Ser409 p-TDP-43
expression and observed a similar phenotype to that observed with TDP-43 total (Figure
5-7, A-C). As previously observed in Grn+/+ and Grn-/- brains (371), the insoluble
fractions of both Grn+/+ and GrnR493X/R493X exhibited higher levels of full-length p-TDP-43
compared to the soluble fraction (Figure 5-6, A and Figure 5-7, A). Since TDP-43
pathology in this model has previously been demonstrated using TDP-43
immunofluorescent staining (165,373), we co-stained Grn+/+ and GrnR493X/R493X brain

173
sections for Tuj1 and TDP-43 to assess neuronal TDP-43 cellular localization (Figure 5-
6, D-E). Tuj1-TDP-43 GrnR493X/R493X hippocampal/thalamic tilescans showed a major
increase in neuronal TDP-43 expression localized to the thalamic VPM/VPL regions
compared to Grn+/+. Similar to previous reports, high magnification micrographs of the
GrnR493X/R493X VPM/VPL revealed considerable cytoplasmic TDP-43 accumulation in
ventral thalamic neurons (Figure 5-6, E).

174

175
Figure 5-6 Neuronal TDP-43 proteinopathy is localized to the ventral thalamus of
aged GrnR493X/R493X mice. Representative western blots of hemibrain RIPA-soluble and
-insoluble lysates from 18 month old Grn+/+ and GrnR493X/R493X mice probed for TDP-43
expression. (A) Expression of full-length TDP-43 in Grn+/+ and GrnR493X/R493X hemibrains
in soluble and insoluble lysates was analyzed by western blotting, using RIPA-soluble
actin as the loading control (no actin detected in insoluble urea fraction). Arrows indicate
TDP-43 CTFs, and the * demarks a remnant TDP-43 signal observed upon reprobing
stripped RIPA-soluble TDP-43 blot with actin antibody. Densitometric quantification of
brain-wide full-length TDP-43 expression in soluble (B) and insoluble (C) lysate fractions
were normalized to RIPA-soluble actin and Grn+/+ levels. (D) Representative
hippocampal/thalamic tilescans highlighting the neuronal (TUJ1, green) TDP-43 (red)
proteinopathy phenotype in the ventral thalamus of 18 month old GrnR493X/R493X mice
(scale bar, 500 µm). (E) High magnification images from the thalamic VPM/VPL regions
demonstrating neuronal cytoplasmic accumulation of TDP-43 in 18 month old
GrnR493X/R493X mice (DAPI, blue; scale bar, 10 µm). For western analysis n=6 mice were
used per sex/genotype; values are shown as mean ± SEM; ns = not significant, ** p <
0.01, Student’s t-test.

176
Figure 5-7 Absence of global p-TDP-43 proteinopathy in the brains of aged
GrnR493X/R493X mice. Representative western blots of hemibrain RIPA-soluble and -
insoluble lysates from 18 month old Grn+/+ and GrnR493X/R493X mice probed for TDP-43
expression. (A) Expression of full-length p-TDP-43 in Grn+/+ and GrnR493X/R493X
hemibrains in soluble and insoluble lysates was analyzed by western blotting, using
RIPA-soluble actin as the loading control (no actin detected in insoluble urea fraction).
Arrows indicate TDP-43 CTFs, and the * demarks a remnant TDP-43 signal observed
upon reprobing stripped RIPA-soluble TDP-43 blot with actin antibody. Densitometric
quantification of brain-wide full-length p-TDP-43 expression in soluble (B) and insoluble
(C) lysate fractions were normalized to RIPA-soluble actin and Grn+/+ levels. n=6 mice
were used per sex/genotype; values are shown as mean ± SEM; ns = not significant, **
p < 0.01, Student’s t-test.

177
5.2.3 Neuroinflammation and astrogliosis in the ventral thalamus of aged
GrnR493X/R493X mice
Pathologic increases of both microglia and astrocytes in the CA3 hippocampal region
and ventral thalamus are well established phenotypes in Grn-deficient mice (see section
1.2.4.1). We sought to characterize neuroinflammation and astrogliosis in aged
GrnR493X/R493X mice. Nguyen et al. previously described a temporal increase in thalamic
microglial density in GrnR493X/R493X mice (165), and this was also observed in our aged
GrnR493X/R493X mice (Figure 5-8, A). The number of microglia per thalamic VPM/VPL field
was significantly greater in mutant mice (Figure 5-8, B, C.ii); however, no microgliosis
was observed in the hippocampal CA3 region (Figure 5-8, B, C.i). A common feature of
pro-inflammatory activated microglia is a morphological transition from a highly ramified
state to an amoeboid shape with enlarged soma (374). To quantify microglia
morphology, we conducted skeletal analysis to measure the number of Iba1+ branches
and normalized that to the number of microglia present in a given field to obtain the
average branches/microglia (Figure 5-9, A-B) (354). Decreased microglial branching
was observed in both the CA3 and VPM/VPL regions of the GrnR493X/R493X brain,
although the phenotype was more pronounced in the VPM/VPL, which exhibited 56.3%
± 6.6% of the branching levels observed in wildtype mice (Figure 5-8, B, C.iii-iv).
Counterintuitively, increased GRN expression has been detected in the frontal and
temporal cortices of FTLD-GRN patients (94). This observation is believed to result from
upregulation of the intact GRN allele in hyperactivated, proliferating microglia in

178
degenerating brain regions. In GrnR493X/R493X mice, upregulation of the mutated alleles
could also result in increased basal PTC readthrough which would result in increased
full length Pgrn expression. To test this hypothesis, we conducted Pgrn-Iba1 co-staining
in Grn+/+ and GrnR493X/R493X mice to assess whether diseased brain regions in the knock-
in mice display upregulated microglial Pgrn-R493X expression. We found that microglial
Pgrn fluorescent intensity was significantly lower in the CA3 and VPM/VPL of
GrnR493X/R493X mice, suggesting that microglial activation in these regions does not result
in substantial basal PTC readthrough or accumulation of truncated Pgrn-R493X (Figure
5-8, B, D).
As discussed in section 1.2.4.4, the innate immune defense system has been previously
implicated in the pathology of FTLD-GRN (92,120). Complement-driven synaptic
pruning is a critical microglial-mediated neurodevelopmental mechanism (189) that is
hyperactivated in the context of Grn-deficiency, resulting in selective depletion of
thalamic inhibitory synapses in Grn-/- mice (92). Complement protein C1qa was
significantly increased in the thalamic VPM/VPL of GrnR493X/R493X mice, similar to that
observed in Grn-/- mice (Figure 5-8, E-F). Astrogliosis is another hallmark of FTLD-GRN
pathogenesis demonstrated to develop in the same brain regions as microgliosis, as
observed by Gfap staining in Grn-/- mice (163,371). We present the first characterization
of GrnR493X/R493X astroglial pathology (Figure 5-10), observing that Gfap+ staining was
significantly increased in the CA3 and VPM/VPL regions in GrnR493X/R493X mice (Figure
5-10, B-C). The astrogliosis phenotype was more striking than microgliosis, spanning

179
both the CA3 and VPM/VPL compared to microgliosis primarily observed in the
thalamus.

180
181
Figure 5-8 Neuroinflammation in the ventral thalamus of aged GrnR493X/R493X mice.
(A) Representative hippocampal/thalamic tilescans co-stained for Iba1/Pgrn show
severe microgliosis in the brains of 18 month old GrnR493X/R493X mice (scale bar, 500
µm). (B) Representative Iba1/Pgrn co-stained immunofluorescence images of
hippocampal CA3 and thalamic VPM/VPL regions in 18 month old Grn+/+ and
GrnR493X/R493X brain sections (scale bar, 20 µm). (C) Quantification of microglial density
(i-ii) and branching morphology (iii-iv) in the CA3 and thalamic VPM/VPL regions. (D)
Microglial Pgrn fluorescence intensity in the CA3 (i) and VPM/VPL (ii). (E-F)
Representative images and quantification of C1qa staining in the VPM/VPL. n=10 mice
were used per sex/genotype (except male GrnR493X/R493X n=8 and male Grn+/+ Iba1-Pgrn
staining of VPM/VPL n=9); values are shown as mean ± SEM; ns not significant, * p <
0.05, *** p < 0.0001, Student’s t-test.

182
Figure 5-9 Microglial skeletal analysis method. Iba1 immunofluorescent images were
processed using Fiji as described in section 2.12.2 (A) and skeletonized using the Fiji
Analyze Skeleton (2D/3D) plugin (B).

183
Figure 5-10 Severe astrogliosis in the ventral thalamus and CA3 hippocampal
region of aged GrnR493X/R493X mice. (A) Representative hippocampal/thalamic tilescans
stained for Gfap show severe astrogliosis in 18 month old Grn+/+ and GrnR493X/R493X brain
(scale bar, 500 µm). (B) Representative Gfap immunofluorescence images of
hippocampal CA3 and thalamic VPM/VPL regions in 18 month old Grn+/+ and
GrnR493X/R493X brain sections (scale bar, 20 µm). (C) Total Gfap+ area in CA3 (i) and
VPM/VPL (ii) images were quantified and normalized to the total number of cells (DAPI,
Gfap
GrnR493X/R493XGrn+/+
A.
Grn+/+
GrnR493X/R493X
0
20
40
60
80
100
Gfa
p A
rea
(
m2)
/ C
ellGrn
+/+Grn
R493X/R493X
0
20
40
60
Gfa
p A
rea
(
m2)
/ C
ell
CA
3V
PM
/VP
L
GrnR493X/R493XGrn+/+
B.Gfap
C.
VP
M/V
PL
CA
3
i.
ii.***
***

184
blue). n=10 mice were used per sex/genotype (except male GrnR493X/R493X n=8); values
are shown as mean ± SEM; ns not significant, * p < 0.05, *** p < 0.0001, Student’s t-
test.

185
5.2.4 Partial preservation of inhibitory synaptic density in the thalamus of aged
GrnR493X/R493X mice
As discussed in sections 1.2.4.4, 1.2.6, and 5.2.3, there is growing support in the
literature for a critical role of the complement innate immune signaling cascade in
driving aberrant microglial synaptic pruning in FTLD-GRN and CLN11 (92,120). Given
the robust increase in complement C1qa protein deposition observed in the
GrnR493X/R493X ventral thalamus (Figure 5-8, E-F), we assessed whether this produced a
corresponding decrease in inhibitory synaptic density as previously observed in Grn-/-
mice (92). First, we characterized the whole thalamus Vgat synaptic density from
hippocampal/thalamic tilescans, and observed a non-significant trend towards lower
inhibitory synaptic density in GrnR493X/R493X mice (Figure 5-11, A-C). Since the Grn-/-
synaptic phenotype was localized to the ventral thalamus, we further analyzed C1qa-
Vgat images of Grn+/+ and GrnR493X/R493X VPM/VPL regions and found a similar non-
significant trend towards lower Vgat synaptic area and number of puncta in
GrnR493X/R493X mice (Figure 5-11, A’-B’, D-E). Interestingly, this weak trend towards a
reduction of thalamic Vgat synaptic density was observed despite 26.9% ± 6.0% of total
Vgat+ synaptic area being co-localized with C1qa in the GrnR493X/R493X VPM/VPL
thalamic regions (Figure 5-11, F).

186

187
Figure 5-11 Inhibitory synaptic density is preserved in the thalamus of aged
GrnR493X/R493X mice. (A-B) Representative hippocampal/thalamic tilescans co-stained for
C1qa and Vgat in 18 month old Grn+/+ and GrnR493X/R493X mice, the dashed outline
depicts area quantified in (C) (scale bar, 500 µm). (A’-B’) C1qa-Vgat tilescan inset
immunofluorescence images (from A-B) of thalamic VPM/VPL region in 18 month old
Grn+/+ and GrnR493X/R493X brain sections (scale bar, 20 µm). (C) Quantification of thalamic
Vgat+ synaptic area within hippocampal/thalamic tilescans normalized to thalamic area
(white dashed outline). Vgat+ area (D), the number of Vgat+ synaptic puncta (E), and
the proportion of Vgat+ synaptic area that is positive for C1qa (F) was quantified in high-
resolution C1qa-Vgat VPM/VPL images (A’-B’). n=10 mice were used per sex/genotype
(except male GrnR493X/R493X n=8); values are shown as mean ± SEM; ns not significant,
*** p < 0.0001, Student’s t-test.

188
5.2.5 Reduced thalamic excitatory neuron density in the brains of aged
GrnR493X/R493X mice
As outlined in section 1.2.4.4, a recent snRNA-seq study by Zhang et al. characterized
disease progression in Grn-/- mice from 2-19 months of age discovered a selective
decrease in the abundance of excitatory neuron markers from 12-19 months of age
(120). They validated these findings immunohistochemically by staining for excitatory
neuron markers Pkcδ and Foxp2 and identifying Grn-/- microglia surrounding Foxp2+
neurons contain Foxp2+ debris in their cytoplasm, suggestive of phagocytosis of dying
excitatory neurons (120). We attempted to replicate these findings in GrnR493X/R493X mice
by performing Foxp2 immunofluorescence staining and quantifying the number of
Foxp2+ thalamic neurons. 18 month old GrnR493X/R493X thalami exhibited a significant
reduction in the number of Foxp2+ excitatory neurons compared to Grn+/+ (21.0% ±
4.3%) mice, consistent with a possible neurodegenerative phenotype in this model
(Figure 5-12, A-B).

189
Figure 5-12 Reduced thalamic Foxp2+ excitatory neuron density in the brains of
aged GrnR493X/R493X mice. (A) Representative hippocampal/thalamic tilescans from 18
month old Grn+/+ and GrnR493X/R493X mice brain sections stained for Foxp2, the dashed
outline depicts area quantified in (B) (scale bar, 500 µm). (B) Quantification of total
number of thalamic Foxp2+ nuclei. n=9 male Grn+/+ mice, n=7 female Grn+/+ mice, n=7
male GrnR493X/R493X, and n=10 female GrnR493X/R493X mice were used; values are shown
as mean ± SEM; *** p < 0.0001, Student’s t-test.
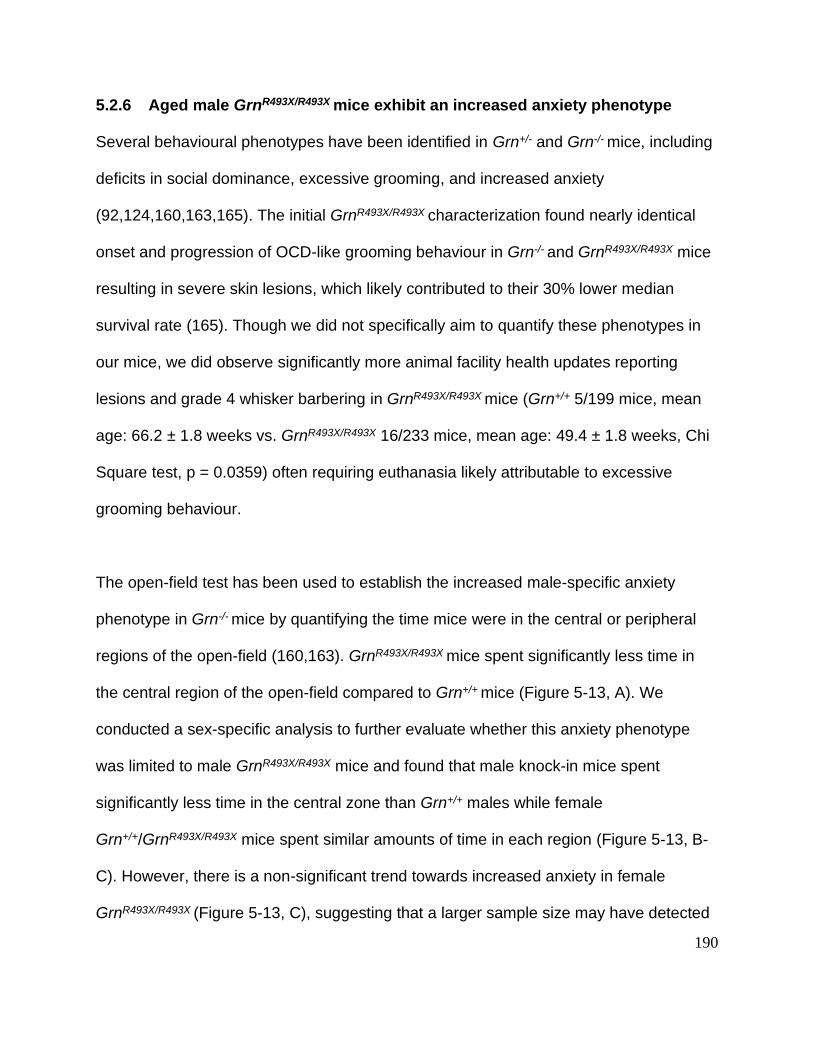
190
5.2.6 Aged male GrnR493X/R493X mice exhibit an increased anxiety phenotype
Several behavioural phenotypes have been identified in Grn+/- and Grn-/- mice, including
deficits in social dominance, excessive grooming, and increased anxiety
(92,124,160,163,165). The initial GrnR493X/R493X characterization found nearly identical
onset and progression of OCD-like grooming behaviour in Grn-/- and GrnR493X/R493X mice
resulting in severe skin lesions, which likely contributed to their 30% lower median
survival rate (165). Though we did not specifically aim to quantify these phenotypes in
our mice, we did observe significantly more animal facility health updates reporting
lesions and grade 4 whisker barbering in GrnR493X/R493X mice (Grn+/+ 5/199 mice, mean
age: 66.2 ± 1.8 weeks vs. GrnR493X/R493X 16/233 mice, mean age: 49.4 ± 1.8 weeks, Chi
Square test, p = 0.0359) often requiring euthanasia likely attributable to excessive
grooming behaviour.
The open-field test has been used to establish the increased male-specific anxiety
phenotype in Grn-/- mice by quantifying the time mice were in the central or peripheral
regions of the open-field (160,163). GrnR493X/R493X mice spent significantly less time in
the central region of the open-field compared to Grn+/+ mice (Figure 5-13, A). We
conducted a sex-specific analysis to further evaluate whether this anxiety phenotype
was limited to male GrnR493X/R493X mice and found that male knock-in mice spent
significantly less time in the central zone than Grn+/+ males while female
Grn+/+/GrnR493X/R493X mice spent similar amounts of time in each region (Figure 5-13, B-
C). However, there is a non-significant trend towards increased anxiety in female
GrnR493X/R493X (Figure 5-13, C), suggesting that a larger sample size may have detected

191
a female-specific anxiety phenotype. The lack of significant difference observed
between the amount of time male and female GrnR493X/R493X mice spent in the central
zone (Figure 5-13, E), suggests that the stronger male-specific anxiety phenotype is
likely reflective of the trend towards lower baseline anxiety levels in male vs. female
Grn+/+ mice (Figure 5-13, D). To probe whether any of the previously presented
neuropathological phenotypes show any sex-dependent effects, we conducted further
sex-specific analyses of these data and failed to observe any statistically significant
differences between sexes (Figure 5-14, Figure 5-15, and Figure 5-16).

192
Figure
Figure 5-13 Aged male GrnR493X/R493X mice exhibit an increased anxiety phenotype.
Proportion of time male/female (A), male (B), and female (C) Grn+/+ and GrnR493X/R493X
mice spent inside the center region of an open-field arena over a 10 min trial. (D-E)

193
Comparison of intra-genotypic sex-differences in the % of time spent inside the center
region of an open-field arena. Male Grn+/+ n=12, female Grn+/+ n=15, male GrnR493X/R493X
n=10, and female GrnR493X/R493X n=10; values are shown as mean ± SEM; ns = not
significant, * p < 0.05, Student’s t-test.

194
Figure 5-14 GrnR493X/R493X brain lysosomal dysfunction does not exhibit a sex-
specific phenotype. DppII+ (A-B) and Lamp1+ (C-D) area/cell in both male and female
Grn+/+ and GrnR493X/R493X CA3 and VPM/VPL images were quantified and normalized to
the total number of cells (DAPI). For immunofluorescence staining n=10 mice were used
per sex/genotype (except male GrnR493X/R493X n=8); values are shown as mean ± SEM,
ns = not significant, one-way ANOVA with Tukey’s multiple comparison test.
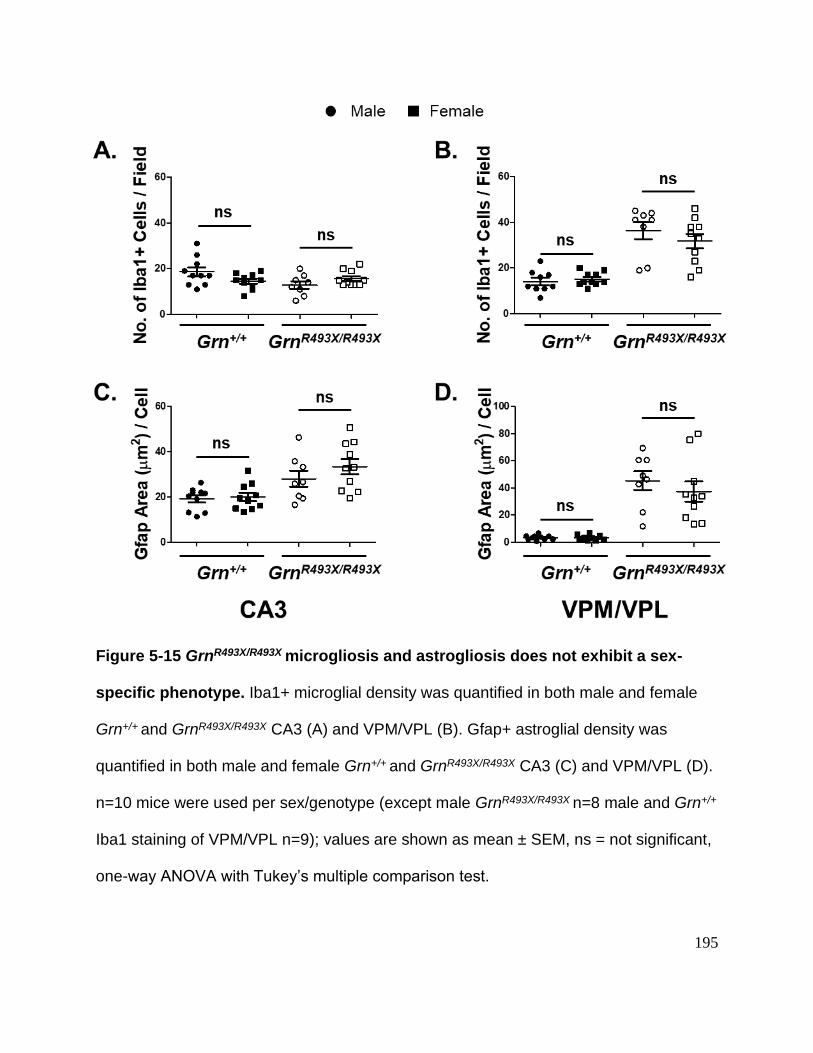
195
Figure 5-15 GrnR493X/R493X microgliosis and astrogliosis does not exhibit a sex-
specific phenotype. Iba1+ microglial density was quantified in both male and female
Grn+/+ and GrnR493X/R493X CA3 (A) and VPM/VPL (B). Gfap+ astroglial density was
quantified in both male and female Grn+/+ and GrnR493X/R493X CA3 (C) and VPM/VPL (D).
n=10 mice were used per sex/genotype (except male GrnR493X/R493X n=8 male and Grn+/+
Iba1 staining of VPM/VPL n=9); values are shown as mean ± SEM, ns = not significant,
one-way ANOVA with Tukey’s multiple comparison test.

196
Figure 5-16 GrnR493X/R493X decreased thalamic excitatory neuron density and
inhibitory synaptic pruning does not exhibit a sex-specific phenotype. (A)
Quantification of total number of thalamic Foxp2+ nuclei in male and female Grn+/+ and
GrnR493X/R493X. Quantification of total thalamic (B) and VPM/VPL (C) Vgat+ inhibitory
synaptic area in male and female Grn+/+ and GrnR493X/R493X. Total thalamic Foxp2 (A)
n=9 male Grn+/+ mice, n=7 female Grn+/+ mice, n=7 male GrnR493X/R493X, and n=10
female GrnR493X/R493X mice, total thalamic Vgat (B) n=9 male Grn+/+ mice, n=9 female
Grn+/+ mice, n=7 male GrnR493X/R493X, and n=10 female GrnR493X/R493X mice, and
VPM/VPL Vgat (C) n=10 mice were used per sex/genotype (except male GrnR493X/R493X

197
n=8 male); values are shown as mean ± SEM, ns = not significant, one-way ANOVA
with Tukey’s multiple comparison test.
198
5.2.7 PTC readthrough in GrnR493X/R493X MEFs
Since the ultimate goal of obtaining the GrnR493X/R493X mouse model was to demonstrate
in vivo PTC readthrough of endogenous nonsense mutant Grn expression, we
established Grn+/+ and GrnR493X/R493X MEF lines for initial in vitro validation of treatment
efficacy. GrnR493X/R493X MEFs were treated with either escalating doses of G418 alone or
in combination with 5 µM CDX5-288 PTC readthrough enhancer. Western blot analysis
of G418-treated GrnR493X/R493X MEF lysates using the anti-mouse Pgrn Linker-1 antibody
(82) detected a dose-dependent increase in both full-length and R493X truncated Pgrn
(Figure 5-17, A). Furthermore, combination treatment of GrnR493X/R493X MEF treatment
with 25 µg/mL G418 and 5 µM CDX5-288 appeared to increase full-length Pgrn levels
compared to 25 µg/mL G418, which may be indicative of PTC readthrough
enhancement (Figure 5-17, A). 5-fold less protein was loaded in the Grn+/+ sample lane
to reduce overexposure (Figure 5-17, A). A subset of these MEF samples was
assessed for Pgrn levels by mouse Pgrn ELISA (Figure 5-17, B). Pgrn levels in
GrnR493X/R493X MEFs treated with 200 µg/mL G418 and combination treatment of 25
µg/mL G418 and 5 µM CDX5-288 were increased by 8.3-fold and 6.8-fold, respectively
(Figure 5-17, B). Given the low n-values presented in Figure 5-17, we did not conduct
statistical analysis and therefore viewed this data as a preliminary low confidence
observation. These results suggested that the GrnR493X loci is susceptible to PTC
readthrough and prompted further in vivo preclinical investigations.

199
Figure 5-17 Induction of PTC readthrough by G418 and enhancers in GrnR493X/R493X
MEFs. Expression of intracellular Pgrn was assessed in Grn+/+ and GrnR493X/R493X MEF
cultures treated with escalating concentrations of G418 alone or in combination with 5
µM CDX5-288 enhancer compound. (A) Expression of full-length Pgrn and Pgrn R493X
in treated Grn+/+ (5-fold less protein loaded) and GrnR493X/R493X MEF lysates were
analyzed by western blotting. (B) Quantification of Pgrn expression in a subset of these

200
Grn+/+ and GrnR493X/R493X MEF lysates by mouse Pgrn ELISA (n=1 per treatment group);
values are shown as mean of 2 technical replicates.

201
5.2.8 G418-induced toxicity in GrnR493X/R493X mice limits therapeutic potential
In chapter 3, we presented data demonstrating in vivo G418-induced PTC readthrough
of a human GRN R493X mutant expression construct delivered to the CNS by P0 ICV
AAV-GRN-R493X-V5 injection. At the time of treatment, AAV-GRN-R493X-V5 mice
were beginning to exhibit minor signs of declining health commonly associated with P0
AAV injection; therefore, G418-induced toxicity was more difficult to assess. Single ICV
injections with 50 µg G418 in these mice were tolerated, though, by the end of the 72 h
treatment period, mice were beginning to show signs of toxicity, including increased fur
piloerection, slow movement, and 10% body weight loss. Here, we aimed to translate
this knowledge into CNS targeted PTC readthrough treatments of GrnR493X/R493X mice
intending to delay or reverse disease progression by at least partially restoring Pgrn
expression.
In vivo G418-induced neurotoxicity was expected given the established CNS ototoxicity
associated with aminoglycoside treatment discussed in section 1.3.2. Although previous
studies have found 2X repeated 80 µg ICV injections (at T=0 h and T=48 h) of G418
over a 96 h time point were capable of inducing CNS PTC readthrough with minimal
toxicity (360,361). We first aimed to replicate the R493X GRN PTC readthrough findings
we observed following short term treatment of AAV-GRN-R493X-V5 mice with 100 µg
G418 in young GrnR493X/R493X mice. We conducted single ICV treatments of either saline
or 100 µg G418 in Grn+/+ and GrnR493X/R493X mice for 72 h. At the time of euthanasia, two
out of the three G418 treated GrnR493X/R493X mice exhibited signs of significant toxicity,
including limited mobility and > 10-15% body weight loss. Measuring Pgrn expression in

202
whole-brain RIPA-soluble lysates indicated that a single 100 µg G418-treatment may
have induced a 2X increase in CNS Pgrn levels (Figure 5-18), though it was unclear
whether this increase was driven by PTC-readthrough or aminoglycoside-mediated
toxicity. Given the low n-values presented in Figure 5-18, we did not conduct statistical
analysis and therefore viewed this data as a preliminary low confidence observation.
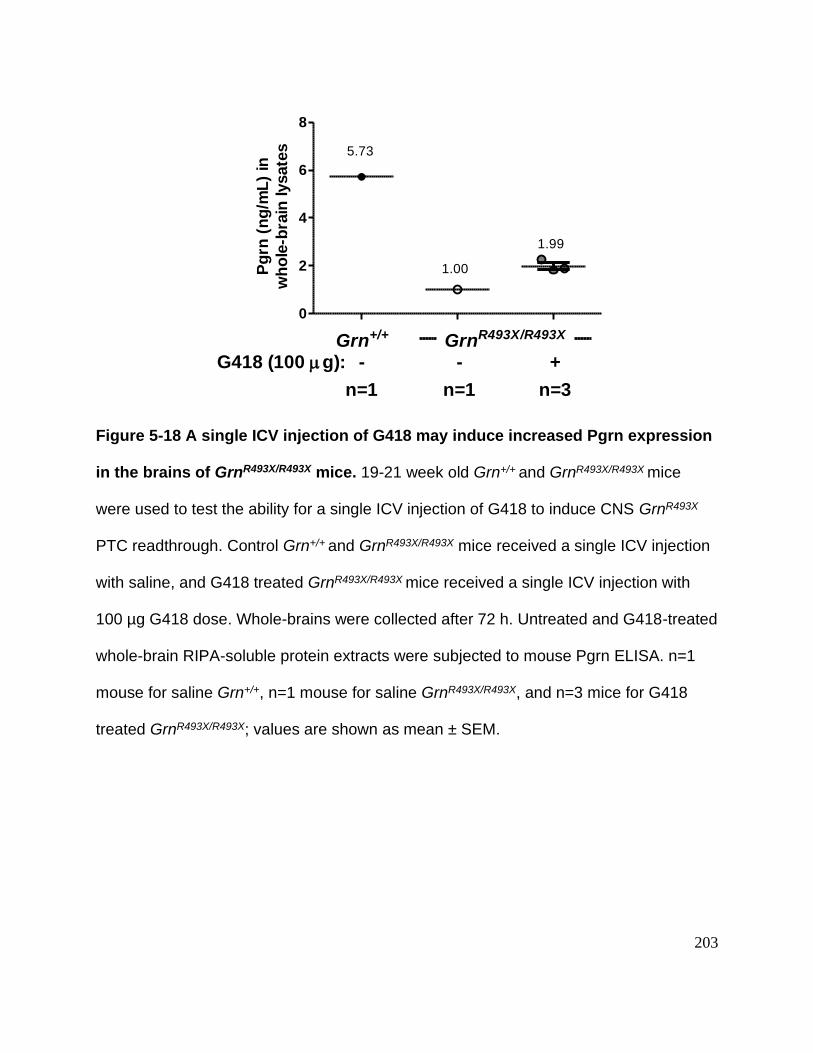
203
Figure 5-18 A single ICV injection of G418 may induce increased Pgrn expression
in the brains of GrnR493X/R493X mice. 19-21 week old Grn+/+ and GrnR493X/R493X mice
were used to test the ability for a single ICV injection of G418 to induce CNS GrnR493X
PTC readthrough. Control Grn+/+ and GrnR493X/R493X mice received a single ICV injection
with saline, and G418 treated GrnR493X/R493X mice received a single ICV injection with
100 µg G418 dose. Whole-brains were collected after 72 h. Untreated and G418-treated
whole-brain RIPA-soluble protein extracts were subjected to mouse Pgrn ELISA. n=1
mouse for saline Grn+/+, n=1 mouse for saline GrnR493X/R493X, and n=3 mice for G418
treated GrnR493X/R493X; values are shown as mean ± SEM.
0
2
4
6
8
Grn+/+ GrnR493X/R493X
n=1 n=3
1.00
1.99
5.73
n=1
G418 (100 g): - +-
Pg
rn (
ng
/mL
) in
wh
ole
-bra
in lysate
s

204
In 2018, Arrant et al. bilaterally infused the medial prefrontal cortices of 10-12 month old
Grn-/- mice with AAV-Grn and achieved striking rescue of several neuropathological
phenotypes in this model at 4-6 weeks post-transduction (218). Therefore, we
hypothesized that recurrent long-term (~1 month) induction of in vivo Grn R493X PTC
readthrough might be necessary to influence pathological progression in GrnR493X/R493X
mice. Studies comparing daily bolus injections with sustained osmotic pump-mediated
release of a related aminoglycoside, gentamicin, have identified that recurrent daily
doses are more favorable for promoting aminoglycoside-induced PTC readthrough
(243,375). To explore whether chronic CNS delivery of PTC readthrough-inducing
doses of G418 could be tolerated in knock-in mice, we obtained implantable and
programmable iPRECIO® pumps capable of automated chronic ICV dosing for up to 2
months. Before conducting PTC readthrough treatments, we first confirmed ICV
targeting by implanting an iPRECIO® pump loaded with 0.1% Fast Green FCF dye
programmed to deliver 10 µL of dye through the cranially implanted brain infusion
cannula during the first hour post-operation. Photographic observation of freshly
harvested dye-infused brain tissue demonstrated the expected ventricular distribution of
Fast Green FCF dye (Figure 5-19). Additionally, we also validated G418’s
thermostability up to 28 days at 37 °C, observing that it retains in vitro PTC readthrough
activity after incubation in an environment thermally analogous to subcutaneous
implantation (Figure 5-20).

205
Figure 5-19 Technical demonstration of bolus iPRECIO® pump-mediated ICV
injections targeting the lateral ventricles. A Grn+/+ mouse received implantation of a
0.1% Fast Green FCF dye loaded iPRECIO® pump inserted cranially at ICV
coordinates: -1.0 mm lateral/-0.3 mm posterior/-3.0 mm depth to bregma. Immediately
following 1 h infusion of 10 µL dye, the brain was collected and photographed,
demonstrating ventricular delivery.

206
Figure 5-20 G418’s PTC readthrough activity is preserved despite prolonged
incubation at physiologic temperature. R493X-/- KI hiPSC-derived astrocytes were
treated with either vehicle solution or 50 µg/mL G418 for 72 h. G418 working stock
solutions were incubated for either 0, 7, 14, 21, or 28 days at 37 °C. Expression of ~70
kDa PGRN in treated R493X-/- KI astrocyte samples were analyzed by western blotting,
using actin as the loading control. n = 2 independent cultures per treatment condition.

207
Since single 100 µg ICV doses of G418 were poorly tolerated, we chose to assess
whether recurrent doses of either 25 µg or 50 µg G418 are tolerated and capable of
inducing Grn R493X PTC readthrough. Please refer to Figure 5-21 for a schematic
description of iPRECIO® pump experiments #1-3. In experiment #1, we programmed
pumps to constantly infuse G418 solution at the lowest flow rate (0.1 µL/h) to maintain
brain infusion cannula patency and prevent clogging. This chronic low basal G418
dosing scheme resulted in rapid deterioration in the health of both 25 µg and 50 µg
treated mice, likely due to major G418 accumulation in the brain to neurotoxic levels
(Figure 5-22). In experiment #2, we programmed a similar G418 dosing schedule but
set the flow rate to 0 µL/h during the recovery phase and between bolus 25 µg and 50
µg infusions. These mice appeared to tolerate this regimen marginally better than those
in experiment #1; 4/5 mice were either found dead or required humane endpoint
euthanasia by day 6. However, one extremely obese (70 g) GrnR493X/R493X mouse (blue
star, Figure 5-21) tolerated five recurrent (every 48-72 h) 25 µg G418 bolus doses
exhibiting initial weight loss that stabilized by day 10. Unfortunately, this experimental
mouse had to be prematurely euthanized due to UBC’s COVID-19 shutdown
requirements. Regardless, experiment #2 hemi-brain lysate Pgrn quantification found
that 5X 25 µg G418 doses failed to increase Pgrn levels compared to untreated
GrnR493X/R493X (Figure 5-23). Importantly, we did observe a modest Pgrn increase in
mice treated with 2X 50 µg G418 doses. Again, given the low number of samples
assessed in Figure 5-23, we did not conduct statistical analysis and therefore viewed
this data as a preliminary low confidence observation.

208
Figure 5-21 Schematic describing iPRECIO® pump experiment infusion programs
and toxicity outcomes in mice. iPRECIO® pump experiments #1-3 were conducted on
Grn+/+ and GrnR493X/R493X mice. Red lines indicate infusion events (25/50 µg G418 or 2
µL saline) and mice were euthanized at humane endpoints except for Exp#3 saline
infused mice which were healthy at experimental endpoint and 5X 25 µg G418 treated
mouse (*) which had to be euthanized due to UBC COVID-19 shutdown.

209
Figure 5-22 Quantification of G418 concentration in the brains of Grn+/+ and
GrnR493X/R493X mice treated ICV with G418. Whole-brain lysates obtained from Grn+/+
mice treated with 100 µg G418 for 2 h (n=2), GrnR493X/R493X mice treated with 100 µg
G418 for 72 h (n=3), and an iPRECIO® Exp#1 50 µg G418 / 72 h treated mouse that
was treated for ~100 h (blue triangle in Figure 5-20, n=1) were assayed for G418
concentration levels using a commercial Gentamicin ELISA kit; values are shown as
mean ± SEM.
0
20
40
60
Grn+/+ GrnR493X/R493X
n=3 n=1n=2
Time-post 100 g G418 (h): 72 -2
iPRECIO Exp#1 (50 g / 72 h): - +-
G418 (g
/mL
) in
wh
ole
bra
in lysate

210
Figure 5-23 Multiple iPRECIO® pump-mediated ICV infusions of 50 µg G418 may
induce increased Pgrn expression in the brains of GrnR493X/R493X mice. 76 week old
Grn+/+ and GrnR493X/R493X hemi-brain lysates derived from untreated controls and
iPRECIO® pump Exp#2 treated mice were assayed for Pgrn expression to assess
whether 25 µg G418 dose can induce PTC readthrough. Untreated and G418-treated
hemi-brain RIPA-soluble protein extracts were subjected to mouse Pgrn ELISA. n=1
mouse for saline Grn+/+, n=1 mouse for saline GrnR493X/R493X, and n=1 mouse for 2X 25
µg G418, n=2 mice for 2X 50 µg G418, and n=1 for 5X 50 µg G418; values are shown
as mean ± SEM.
0
5
10
15
Grn+/+ GrnR493X/R493X
iPRECIO Exp#2 G418 (g): --
--
252
502
255No. of infusions:
n=1 n=1 n=1 n=2 n=1
Pg
rn (
ng
/mL
) in
hem
i-b
rain
lysate
s

211
Finally, for experiment #3, we implanted saline loaded pumps programmed to deliver 2
µL ICV infusions every 72 h into the brains of aged Grn+/+ mice. These mice received
and tolerated 4X 2 µL saline bolus injections and were sacrificed on day 12 to assess
brain Pgrn levels. We found that pump implanted mice did not exhibit increased Pgrn
expression (Figure 5-24), suggesting that implanted cannula-associated
neuroinflammation may not be responsible for upregulation of Pgrn expression in G418
pump implanted GrnR493X/R493X mice. This also suggests that technical surgical errors
linked to pump implantation were not responsible for the severe morbidity observed in
GrnR493X/R943X implanted with G418 ICV perfusing pumps. To further validate the
increased Pgrn expression observed in 2X 50 µg G418 filled pump implanted mice in
Exp#2 and completely rule out the possibility that pump-related non-specific
phenomenon was responsible for this increase, we conducted 2X ICV syringe-pump
driven 50 µg G418 injections in GrnR493X/R493X mice.
As expected, these repeated ICV injections (at t=0 h and t=48 h over 96 h) of 50 µg
G418 resulted in significant toxicity, which became particularly apparent ~24 h post the
2nd G418 injection. Though all mice survived until the experimental endpoint, their
weight decline and limited mobility at 96 h post-injection #1 would have soon required
humane endpoint euthanasia. To definitively demonstrate GrnR493X/R493X G418-induced
PTC readthrough, we pooled iPRECIO® 2X 50 µg G418 (n=2) and these syringe-pump
2X 50 µg G418 injected mice (n=3) into a single treatment group (2X 50 µg G418) and
evaluated Pgrn expression compared to untreated controls. 2X 50 µg G418 injections
significantly increased Pgrn expression when assayed by both western blot and Pgrn

212
ELISA (Figure 5-25). The increased levels of truncated Pgrn-R493X indicate potential in
vivo G418-induced PTC readthrough of an endogenously expressed nonsense mutant
Grn allele (Figure 5-25, A-B). Observing that repeated ICV treatments with 50 µg G418
increased brain Pgrn expression using two independent injection methods provides
additional evidence that G418 was responsible for increased Pgrn expression.

213
Figure 5-24 Grn+/+ tolerate iPRECIO® pump ICV infusion of saline. 77-88 week old
Grn+/+ hemi-brain lysates derived from untreated controls and iPRECIO® saline pump
Exp#3 treated mice were assayed for Pgrn expression levels. Untreated and saline
pump treated hemi-brain RIPA-soluble protein extracts were subjected to mouse Pgrn
ELISA. n=7 untreated Grn+/+ mice and n=2 iPRECIO® saline pump treated Grn+/+ mice;
values are shown as mean ± SEM; ns = non-significant, Student’s t-test.

214
Figure 5-25 Increased Pgrn expression induced by 2X repeated ICV G418
injections in the brains of GrnR493X/R493X mice. 52-86 week old Grn+/+ and
GrnR493X/R493X mice were used to test the ability for G418 to induce CNS GrnR493X PTC
readthrough. Control Grn+/+ and GrnR493X/R493X mice were untreated or received 2X ICV
saline injections t=0 h and t=48 h over 96 h. G418 treated GrnR493X/R493X mice received
either 2X syringe driven bolus ICV doses of 50 µg G418 at t=0 h and t=48 h over 96 h
(n=3) or ICV iPRECIO® pump injected 2X 50 µg G418 doses delivered at t=48 h and
t=120 h over 124 h (n=2). Untreated and G418-treated hemi-brain RIPA-soluble protein
215
extracts were subjected to Pgrn western blot (A-B) and mouse Pgrn ELISA (C).
Cropped Grn+/+ and GrnR493X/R493X western blot lanes presented were detected on the
same membrane, and the loading control signal was obtained by reprobing the same
membrane with actin for normalization. The first two G418-treated lanes are from ICV
iPRECIO® pump injected mice, and the last three are from syringe-pump injected mice.
Both Pgrn western blot and ELISA data are presented relative to untreated
GrnR493X/R493X. Values are shown as mean ± SEM; * p < 0.05, *** p < 0.0001, one-way
ANOVA with Tukey’s multiple comparison test.
216
5.3 Discussion
In this chapter, we provide the first detailed analysis of lysosomal dysfunction and
selective loss of thalamic excitatory neurons in the brains of aged GrnR493X/R493X mice.
First, we established that Pgrn expression is suppressed in the brains of aged
GrnR493X/R493X mice, and pathologically active brain regions do not show upregulated
Pgrn expression via basal PTC readthrough. This limited expression is driven by NMD
(165); therefore, the majority of Pgrn detected in the GrnR493X/R493X brain likely consist of
the truncated Pgrn-R493X form. Since disrupted lysosomal homeostasis is a
pathological hallmark of Grn-/- mice, we chose to evaluate several previously
established brain lysosomal phenotypes in our aged GrnR493X/R493X cohort. The CA3
hippocampal and thalamic VPM/VPL brain regions of aged GrnR493X/R493X mice
displayed striking expansions of their lysosomal compartments. We further evaluated
aged knock-in mice for global changes in brain lysosomal function and impairments in
autophagy; identifying overexpression of both the pro- and mature-forms of lysosomal
protease Ctsd and impaired clearance of autophagolysosomes as indicated by an
increased LC3-II:LC3-I ratio, both of which have been previously observed in aged Grn-/-
mice (106,119). Notably, evidence of lysosomal dysfunction has been demonstrated in
Grn-/- mice as young as 2 months of age (179). Future efforts may seek to understand
whether the presence of a semi-functional, truncated Pgrn-R493X might delay the onset
of this early lysosomal phenotype.
As discussed in sections 1.1.3 and 1.1.7, GRN deficiency is associated with nuclear to
cytoplasmic translocation of TDP-43, ultimately resulting in the formation of insoluble

217
neuronal inclusions. The redistribution of TDP-43 from the nucleus to the cytoplasm has
also been observed in Grn-/- mice, a process which may involve excessive
neuroinflammation and dysfunctional autophagolysosomal and ubiquitin-proteasome
systems (120,165,371,373). Similar to these findings, we found TDP-43 pathology
limited to ventral thalamic neurons in GrnR493X/R493X mice, which exhibited intense
nuclear to cytoplasmic TDP-43 translocation. We further observed that GrnR493X/R493X
soluble hemi-brain lysates contained decreased TDP-43, potentially indicating that a
proportion of the soluble TDP-43 pool had transitioned into an insoluble form. This
phenomenon was observed in a mutant TDP-43 mouse model where soluble TDP-43
increased while insoluble TDP-43 decreased upon overexpression of PGRN (376).
However, we failed to observe a corresponding increase in the insoluble levels of TDP-
43 and were unable to detect p-TDP-43 in either soluble or insoluble lysates, both of
which have been previously found in aged Grn-/- mice (93,371). The former most likely
relates to our finding that TDP-43 pathology is largely limited to ventral thalamic
neurons, and the phenotype may thus be lost through dilution when assessing hemi-
brain lysates. Other discrepancies are less clear and may relate to inherent differences
in mouse models as well as the particular age chosen for analysis.
GrnR493X/R493X mice exhibit age-dependent microgliosis that begins around 6 months of
age, reaching a peak at 12 months, and is maintained until 18 months of age. We
observed significant neuroinflammation in the ventral thalamus of GrnR493X/R493X mice,
including astro- and microglial expansion and morphological transition into a
proinflammatory state. This observation is important because we show that the

218
chronically inflamed ventral thalamic brain region also develops TDP-43 proteinopathy,
providing additional support to the growing evidence demonstrating that factors
secreted by Grn-deficient microglia directly induce cytoplasmic accumulation of TDP-43
(165). These inflammatory mediators include the innate immune system complement
system (C1qa, C3, etc.) which have been implicated in Grn-deficient microglial
mediated neurotoxicity. Although most of the literature has focused on examining
microglial-driven neuropathological mechanisms, a recent study by Guttikonda et al.
conducted using hiPSC-derived neuron-astrocyte-microglia tricultures suggested that
reciprocal C3 signaling between microglia and astrocytes is critical to driving excessive
microglial C1qa complement protein expression and secretion (377). Therefore, future
studies assessing the role of Grn-deficient astrocytes in driving disease pathophysiology
may be critical to identifying novel therapeutic strategies.
As discussed in sections 1.2.4 and 1.2.6, microglial-mediated innate immune system
complement pathway activation has been directly and indirectly implicated in driving
thalamic neurodegeneration in Grn-/- mice through selective targeting of both inhibitory
synapses and excitatory neurons for elimination (92,120). Despite observing robust
C1qa tagging of Vgat+ synapses as seen in Grn-/- mice, neither GrnR493X/R493X whole
thalami or the VPM/VPL region showed a significant decrease in inhibitory synaptic
density. However, there was a trend towards lower levels of Vgat+ synapses in these
regions. It is possible that low basal Pgrn-R493X expression in GrnR493X/R493X microglial
limited their voracity for inhibitory synapses, but this is not known. A recent snRNA-seq
study found that selective loss of excitatory neurons in the ventral thalamus of Grn-/-

219
mice could be rescued by simultaneous deletion of both C1qa and C3 complement
genes (120). The authors proposed that elevated C1qa and C3 in this brain region
result in increased MAC formation on neuronal surfaces, which permeabilizes their
plasma membranes, triggering apoptosis (120). Similarly, our aged GrnR493X/R493X
displayed loss of thalamic Foxp2+ excitatory neurons, perhaps suggesting that a loss of
excitatory neurons precedes the synaptic pruning phenotype in this model.
Nevertheless, it is still unclear how these complement-mediated neurodegenerative
mechanisms selectively target inhibitory synapses and excitatory neurons.
Grn-deficient mice develop behavioural abnormalities impacting social interactions,
grooming frequency, and anxiety levels (92,124,160,163,165). GrnR493X/R493X mice were
no different, exhibiting an increased anxiety phenotype similar to that previously
reported in Grn-/- mice, observing a stronger anxiety phenotype in males (160,163). In
section 1.2.4.4, we discussed neuropathological correlates of behavioural disturbances
in Grn-/-, connecting decreased inhibition of the thalamocortical circuit to their OCD-like
grooming phenotype (92). Since we observed significant thalamic pathology in aged
GrnR493X/R493X mice, we analyzed the major neuropathological phenotypes presented
here for sexual dimorphism to assess whether increased pathology might explain the
male-predominant anxiety phenotype. While we found that levels of inhibitory synaptic
density in the thalamic VPM/VPL regions exhibited a strong trend towards a sex-
dependent phenotype in both Grn+/+ and GrnR493X/R493X mice (Figure 5-16, C), with males
displaying elevated inhibitory synaptic density compared to females, we did not observe
sexually dimorphic FTLD-related pathology in GrnR493X/R493X mice. Similar efforts have

220
been made to identify the neurological basis for the increased susceptibility of male
Grn-deficient mice to the development of an increased anxiety phenotype (378,379).
These studies found that Grn expression is upregulated in the ventromedial
hypothalamic nucleus in response to androgen and estrogen sex-hormones and that
Pgrn is an essential mediator of male sexual differentiation in the developing brain.
Since Grn+/+ female mice generally exhibit elevated anxiety compared to Grn+/+ males, it
has been proposed that a lack of Grn expression during sexual differentiation results in
at least partial fulfillment of the default female neurodevelopmental program (160).
Evidence supporting this hypothesis includes the observation that Grn-/- mice lack the
sexually dimorphic trait of differential locus ceruleus (LC) volume, which is normally
larger in Grn+/+ females (380). Because the LC is an important regulator of stress-
induced anxiety responses, it is possible that a relatively enlarged LC in male Grn-/-
compared to Grn+/+ mice could predispose them to increased anxiety (381). There
studies suggest profound developmental changes in the brain as a result of Grn
deficiency. Improved preclinical methodology, including the use of hiPSCs, may allow
future studies to probe these mechanisms which could reveal process far upstream of
known FTLD pathology that may prove central to FTLD-GRN pathophysiology.
Taken together, a striking finding in both aged GrnR493X/R493X mice and other Grn-/-
models is the pronounced involvement of select thalamic regions. For the clinician this
might be curious as neurodegeneration in the frontal, temporal, and parietal lobes is
widely recognized in driving clinical symptoms across FTLD syndromes. However, a
recent study in preclinical GRN carriers found prominent hyperconnectivity between

221
cortical hub regions and the thalamus in several intrinsic connectivity networks
assessed by functional magnetic resonance imaging (213). The implications of these
findings are not fully clear, but abnormal thalamic physiology, which is robustly
demonstrated in FTLD-GRN mouse models either through histology or
electrophysiology, may have important implications for the earliest changes in human
FTLD-GRN. As such, interventions to reverse these pathologic changes in mice may
have important translational value.
Aminoglycoside-induced toxicity (reviewed in section 1.3.2) has been a major deterrent
to the clinical translation of PTC readthrough therapy. Through the discovery of our
CDX-series of PTC readthrough enhancer compounds, we aimed to lower the required
concentration of G418 to a more tolerable level while still achieving readthrough. As
shown in GrnR493X/R493X derived MEFs, we were able to accomplish this goal in vitro. In
section 5.2.8, we chronicled our efforts to identify a dose of G418 capable of inducing
PTC readthrough that would be tolerated for at least a month-long recurrent treatment
regimen. These data represent the first demonstration of CNS delivery of a PTC
readthrough drug using an implantable programmable pump capable of infusing bolus
doses. We found that short term ICV doses of 50-100 µg G418 could induce GrnR493X
PTC readthrough, though were accompanied by significant and often fatal neurotoxicity.
Though not presented here, we attempted single syringe-pump ICV injections of 200 µg
and 400 µg G418 doses, which resulted in rapid-onset muscular paralysis requiring
euthanasia and sudden death, respectively. Given that 2/3 GrnR493X/R493X mice treated
with 25 µg G418 doses for iPRECIO® Exp#2 were either found dead or required
222
humane endpoint euthanasia and that even five recurrent 25 µg G418 doses over 15
days failed to increase Pgrn expression; we conclude that there is likely no tolerated
ICV dose of G418 that is capable sufficient CNS exposure to induce PTC readthrough
in the GrnR493X/R493X mouse model. Unable to establish a baseline tolerated dose of
G418 capable of inducing PTC readthrough, we chose to abandon efforts to attempt
combination therapy with CDX5-288, as we would not have been able to assess the
degree of PTC readthrough enhancement.
In conclusion, our aged cohort of GrnR493X/R493X mice displayed several pathologic
phenotypes, including lysosomal dysfunction and select thalamic synaptic degeneration
not previously described in this model, but in line with observations in other Grn-/- model
mice. Our characterization of aged GrnR493X/R493X mice provides the field with further
insight into neuropathological phenotypes that may be used to better define the
mechanisms underlying FTLD-GRN, and evaluate the preclinical efficacy of novel
therapeutics to target relevant nonsense mutations that cause FTLD-GRN.
223
Chapter 6: Conclusion and future directions
6.1 Contributions to the fields of FTLD-GRN and CLN11
FTLD-GRN is a devastating neurodegenerative disease, yet there are currently no
disease-modifying therapies available in the clinic. The majority of drug development
efforts for the treatment of FTLD-GRN have focused on restoring normal PGRN levels
by increasing expression from the intact allele or exogenous delivery of PGRN to the
CNS. The viability of preclinical investigation exploring novel nonsense mutation
suppression therapies is dependent on the prevalence of nonsense mutations in a given
genetic condition. Approximately 25% of causal FTLD-GRN mutations introduce in-
frame PTCs, providing a substantial patient population that may benefit from PTC
readthrough therapy. Despite the known toxicity of aminoglycosides, PTC readthrough
has not been pursued as a therapy for FTLD-GRN. The work here describes proof-of-
concept demonstration of PTC readthrough in several in vitro and in vivo models
bearing clinical GRN nonsense mutations, and represents a major contribution to the
field of FTLD-GRN incentivizing further development of this therapeutic approach.
6.1.1 In vitro and in vivo PTC readthrough of exogenously expressed nonsense
mutant human GRN expression constructs
Early in 2020, we showed that aminoglycoside-mediated GRN nonsense mutation
readthrough in cells transfected with C-terminally tagged nonsense mutant expression
GRN constructs (122). In chapter 3, we generated HEK293 cell lines stably expressing
human GRN bearing several clinically relevant FTLD-GRN nonsense mutations for

224
screening our lead PTC readthrough enhancer compounds in combination with the
aminoglycoside G418. These screening efforts identified that the UGA GRN R418X and
R493X mutations were most susceptible to PTC readthrough and that combination
treatment with CDX5-288 had the most synergistic effect on readthrough efficiency.
Based on these findings, we generated and transduced neonatal C57BL/6J mice with
AAV vectors expressing tagged R493X mutant GRN. We found that a single ICV
injection of G418-induced CNS wide PTC readthrough of human tagged R493X GRN
expression constructs in AAV-GRN-R493X-V5 mice. CDX5-288 co-treatment with G418
in these mice did not induce PTC readthrough enhancement, suggesting that the CDX5-
288 dosage we selected based on in vitro efficacy may have been too low.
Complications involving poor viability of AAV-GRN-R493X-V5 mice limited our ability to
conduct additional G418 and CDX5-288 combination treatment dose optimizations.
Furthermore, the artificial nature of GRN-R493X-V5 overexpression precluded
quantification of disease-relevant PTC readthrough efficiency in this model; therefore,
we view these results as proof-of-concept demonstration of in vivo PTC readthrough.
6.1.2 In vitro and in vivo PTC readthrough in human and mouse models
endogenously expressing nonsense mutant GRN
To our knowledge, this is the first and only report demonstrating nonsense mutation
readthrough to enhance PGRN expression in FTLD-GRN patient-derived cortical
neurons and astrocytes. In chapter 4, we reviewed our efforts reprogramming healthy
control and FTLD-GRN UBC15 patient somatic cells into hiPSCs and CRISPR/Cas9
225
gene editing the first isogenic hiPSC model of CLN11. These hiPSC models provided
excellent sources of disease-relevant cell types bearing common pathogenic GRN
nonsense mutations. We also examined the potency of our PTC readthrough
combination therapy in S116X+/-, R418X+/-, and R493X-/- KI hiPSC-derived cortical
neurons and astrocytes. Full-length translation of PGRN was detected in R493X-/- KI
hiPSC-derived astrocytes treated with G418 and CDX5-288 by co-treatment with a
CTSL inhibitor to prevent the rapid processing of readthrough-derived full-length PGRN
into GRNs observed in this cell type. This is an important observation for other
researchers in the field, aiming to pursue readthrough based approaches for the
treatment of FTLD-GRN. We further demonstrated that increased PGRN expression
induced by G418 and CDX5-288 in R493X-/- KI cortical neurons rescued an elevated
mature CTSD mutant lysosomal phenotype, indicating that the combination of full-length
and truncated PTC readthrough-derived PGRN had a functional benefit. These cell lines
represent valuable research tools for the field of FTLD.
In chapter 5, we characterized the GrnR493X/R493X knock-in mouse model bearing a
murine analog to the pathogenic R493X mutation. Our aged GrnR493X/R493X knock-in mice
cohort displayed several neuropathological features previously observed in Grn-/- mice.
Notably, we provide the first evidence that these mice develop striking lysosomal
dysfunction and neurodegeneration in the form of selective loss of thalamic excitatory
neurons. Moreover, we observed a male-specific increased anxiety phenotype in aged
GrnR493X/R493X mice previously reported in Grn-/- mice. We provided preliminary results
from a pilot study demonstrating in vivo PTC readthrough of endogenously expressed

226
GrnR493X through repeated ICV administrations of G418. However, the doses of G418
required to achieve readthrough caused severe neurotoxicity and were not suitable for
long term therapeutic intervention. Future studies are needed to further explore whether
in vivo PTC readthrough induced PGRN rescue is sufficient to surpass the therapeutic
threshold required to disrupt or slow down FTLD-GRN pathogenesis.
6.2 Final conclusions
In summary, we show that G418 increases PGRN through PTC readthrough in cellular
and mouse models of FTLD due to pathogenic progranulin nonsense mutations. The
enhancer compound CDX5-288 potentiates the readthrough effects of G418 in vitro and
increases PGRN over G418 treatment alone. We further show that increased
progranulin through PTC readthrough ameliorates lysosomal dysfunction in R493X-/- KI
cortical neurons, showing a functional impact of raised PGRN. A single ICV
administration of G418 in mice expressing tagged human GRN R493X nonsense
mutation achieves proof-of-concept in vivo PTC readthrough. Our characterization of
aged GrnR493X/R493X mice provides the field with insight into neuropathological
phenotypes that may be used to evaluate the preclinical efficacy of novel therapeutics in
this model. While G418 is not suitable for long-term human consumption, our work
highlights the importance of ongoing and future efforts to find novel readthrough
compounds more suitable for human use. Taken together, our findings suggest that
PTC readthrough may be a potential therapeutic strategy for a subset of patients with
FTLD bearing a GRN nonsense mutation, but highlight the need for better drugs with
improved tolerability.

227
6.3 Future directions
Our observations of severe dose-limiting G418-mediated toxicity following ICV delivery
in GrnR493X/R493X mice suggest that aminoglycoside readthrough compounds are unlikely
to have a therapeutic window for FTLD-GRN or CLN11 patients carrying nonsense
mutant GRN alleles. As discussed in section 1.3.3, systematic examination of the
chemical moieties responsible for aminoglycoside-induced toxicity and PTC
readthrough by Dr. Timor Baasov’s group resulted in the synthesis of the novel
eukaryotic ribosomal selective glycoside, ELX-02. Developing an academia-industry
partnership with Eloxx Pharmaceuticals may enable us to conduct similar in vivo brain-
targeting PTC readthrough studies in our GrnR493X/R493X mouse cohort testing ELX-02
and other synthetic aminoglycosides under their development. Additionally, we are
currently in the process of conducting in vitro validation of novel PTC readthrough drugs
through our collaborations with the Roberge lab, which may support further exploration
of in vivo nonsense mutation readthrough therapy in GrnR493X/R493X knock-in mice.
As discussed in section 1.2.7, several ongoing clinical investigations are evaluating the
efficacy of therapies aimed at restoring PGRN expression levels in FTLD-GRN patients.
Alector is currently recruiting participants for a phase III clinical trial (INFRONT-3)
testing the anti-SORT1 antibody AL001, which aims to disrupt SORT1-mediated
extracellular uptake of PGRN to increase its extracellular bioavailability. Since brain
SORT1 expression is primary localized to neurons, inhibition of SORT1-mediated
PGRN endocytosis likely results in greater microglial endocytosis of extracellular PGRN
through SORT1-independent transport mechanisms (described in section 1.2.3).

228
Microglia are increasingly recognized as primary drivers of FTLD-GRN pathophysiology;
therefore, it is possible that recently reported improvements in CSF FTLD-GRN
biomarkers following 4-week treatment with AL001 may be due to restored microglial
PGRN levels. Exogenous delivery of GRN expression through gene therapy or direct
delivery of intact rec. PGRN represents another promising approach to delaying or
reversing pathological progression in FTLD-GRN and CLN11 patients. Prevail
Therapeutics is actively recruiting symptomatic FTLD-GRN patients for a phase I/II
clinical trial (PROCLAIM) to validate the safety, tolerability, and immunogenicity of a
single dose (low, medium, or high) of their AAV9 GRN expression vector (PR006)
delivered intraventricularly via the cisterna magna. Additionally, Passage Bio Inc. will
soon begin recruiting for its own phase I/II clinical trial (upliFT-D) to test the safety,
tolerability, and pharmacodynamic effects of a single dose (3.3E10 or 1.1E11 genome
copies / gram of estimated brain weight) of their AAV1 GRN expression vector
(PBFT02) which will also be delivered by intra-cisterna magna injection. These trials
build upon several preclinical studies demonstrating viral CNS delivery of GRN
expression (218,221) and may provide insight into whether restoring GRN expression in
the brain can disrupt the pathogenic processes associated with FTLD-GRN. Importantly,
PGRN overexpression is known to be associated with oncogenicity in multiple organ
systems (382,383), therefore it will be critical to ensure GRN expression is limited to
normal healthy control levels.
Drugs targeting the pathophysiological mechanisms responsible for FTLD-GRN disease
pathogenesis may represent an alternative therapeutic modality for the treatment of

229
GRN deficiency. Our laboratory’s expertise and unique repository of FTLD-GRN patient-
and isogenic CRISPR/Cas9-derived hiPSC models are well suited for further elucidation
of disease-associated molecular pathways. Recent advances in cerebral organoid
technology have enabled the production of 3D iPSC-derived spheroids that
neurodevelopmentally replicate elements of the human embryonic brain (384). Although
these neural constructs lack resident microglia, hiPSC-derived microglia can be co-
cultured with maturing cerebral organoids, resulting in microglia chemotactic migration
and integration into the mini-brains. Microglia tile the cerebral organoid tissue adopting
a characteristic ramified morphology that upon neural injury become activated,
undergoing classic amoeboid morphological transition (198). hiPSC-derived microglia-
cerebral organoid co-cultures represent a valuable research tool for the study of FTLD-
GRN and CLN11 pathology. A hypothetical experiment could involve co-culturing WT or
R493X-/- KI hiPSC-derived microglia with WT or R493X-/- KI hiPSC-derived cerebral
organoids to assess whether mutant microglial induce any characteristic FTLD-GRN
phenotypes, such as TDP-43 cytoplasmic translocation or excessive secretion of
complement (C1QA, C3, etc.) proteins. Assuming we were to observe R493X-/- KI
microglia-specific phenotypes, this may represent an ideal model for high-throughput
screening to identify drugs capable of reversing the hyperinflammatory phenotype in
GRN-deficient microglia. It would then be important to test the top compounds in
Grn+/R493X and GrnR493X/R493X mice to assess whether treatment can decrease microglia-
induced neuropathology in the absence of increased PGRN expression.
The current slate of clinical trials actively recruiting FTLD-GRN patients represents the

230
culmination of 15 years of extensive research uncovering the pathophysiology of this
rare genetic condition and provide a reason for individuals carrying pathogenic GRN
mutations to be optimistic that the first disease-modifying therapies may receive clinical
approval within the next decade.

231
References
(1) Ratnavalli E, Brayne C, Dawson K, Hodges JR. The prevalence of frontotemporal dementia. Neurology 2002;58(11):1615-1621.
(2) Englund B, Brun A, Gustafson L, Passant U, Mann D, Neary D, et al. Clinical and neuropathological criteria for frontotemporal dementia. J Neurol Neurosurg Psychiatr 1994;57(4):416-418.
(3) Tsai RM, Boxer AL. Therapy and clinical trials in frontotemporal dementia: past, present, and future. J Neurochem 2016;138:211-221.
(4) Pasquier F, Petit H. Frontotemporal dementia: its rediscovery. Eur Neurol 1997;38(1):1-6.
(5) Pick A. Uber die Beziehungen der senilen Hirnatrophie zur Aphasie. Prag Med Wochenschr 1892;17:165-167.
(6) Pick A, Girling DM, Marková IS. Senile Hirnatrophie als Grundlage von Herderscheinungen: (Senile cerebral atrophy as the origin of focal symptoms). History of Psychiatry 1995;6(24):533-537.
(7) Pick A. Über einen weiteren Symptomenkomplex im Rahmen der Dementia senilis, bedingt durch umschriebene stärkere Hirnatrophie (gemischte Apraxie). Eur Neurol 1906;19(2):97-108.
(8) Wechsler AF, Verity MA, Rosenschein S, Fried I, Scheibel AB. Pick's disease: a clinical, computed tomographic, and histologic study with Golgi impregnation observations. Arch Neurol 1982;39(5):287-290.
(9) Gustafson L, Nilsson L. Differential diagnosis of presenile dementia on clinical grounds. Acta Psychiatr Scand 1982;65(3):194-209.
(10) Gustafson L, Brun A, Risberg J. Frontal lobe dementia of non-Alzheimer type. Adv Neurol 1990;51:65-71.
(11) Mendez MF, Selwood A, Mastri AR, Frey W2. Pick's disease versus Alzheimer's disease: a comparison of clinical characteristics. Neurology 1993;43(2):289-292.
(12) Neary D, Snowden JS, Gustafson L, Passant U, Stuss D, Black S, et al. Frontotemporal lobar degeneration: a consensus on clinical diagnostic criteria. Neurology 1998;51(6):1546-1554.

232
(13) Diehl-Schmid J, Grimmer T, Drzezga A, Bornschein S, Riemenschneider M, Förstl H, et al. Decline of cerebral glucose metabolism in frontotemporal dementia: a longitudinal 18F-FDG-PET-study. Neurobiol Aging 2007;28(1):42-50.
(14) Neary D, Snowden JS, Mann DM, Northen B, Goulding PJ, Macdermott N. Frontal lobe dementia and motor neuron disease. Journal of Neurology, Neurosurgery & Psychiatry 1990;53(1):23-32.
(15) Burrell JR, Halliday GM, Kril JJ, Ittner LM, Götz J, Kiernan MC, et al. The frontotemporal dementia-motor neuron disease continuum. The Lancet 2016;388(10047):919-931.
(16) Riedl L, Mackenzie IR, Förstl H, Kurz A, Diehl-Schmid J. Frontotemporal lobar degeneration: current perspectives. Neuropsychiatric disease and treatment 2014;10:297-310.
(17) Hodges JR, Davies R, Xuereb J, Kril J, Halliday G. Survival in frontotemporal dementia. Neurology 2003;61(3):349-354.
(18) Shi J, Shaw CL, Du Plessis D, Richardson AM, Bailey KL, Julien C, et al. Histopathological changes underlying frontotemporal lobar degeneration with clinicopathological correlation. Acta Neuropathol 2005;110(5):501-512.
(19) Mann DM, Snowden JS. Frontotemporal lobar degeneration: Pathogenesis, pathology and pathways to phenotype. Brain Pathology 2017;27(6):723-736.
(20) Knopman DS, Mastri AR, Frey WH2, Sung JH, Rustan T. Dementia lacking distinctive histologic features: a common non‐Alzheimer degenerative dementia. Neurology 1990;40(2):251-256.
(21) Jackson M, Lennox G, Lowe J. Motor neurone disease-inclusion dementia. Neurodegeneration 1996;5(4):339-350.
(22) Josephs KA, Holton JL, Rossor MN, Godbolt AK, Ozawa T, Strand K, et al. Frontotemporal lobar degeneration and ubiquitin immunohistochemistry. Neuropathol Appl Neurobiol 2004;30(4):369-373.
(23) Arai T, Hasegawa M, Akiyama H, Ikeda K, Nonaka T, Mori H, et al. TDP-43 is a component of ubiquitin-positive tau-negative inclusions in frontotemporal lobar degeneration and amyotrophic lateral sclerosis. Biochem Biophys Res Commun 2006;351(3):602-611.
(24) Davidson Y, Kelley T, Mackenzie IR, Pickering-Brown S, Du Plessis D, Neary D, et al. Ubiquitinated pathological lesions in frontotemporal lobar degeneration contain the TAR DNA-binding protein, TDP-43. Acta Neuropathol 2007;113(5):521-533.
233
(25) Mackenzie IR, Neumann M, Baborie A, Sampathu DM, Du Plessis D, Jaros E, et al. A harmonized classification system for FTLD-TDP pathology. Acta Neuropathol 2011;122(1):111-113.
(26) Mizielinska S, Lashley T, Norona FE, Clayton EL, Ridler CE, Fratta P, et al. C9orf72 frontotemporal lobar degeneration is characterised by frequent neuronal sense and antisense RNA foci. Acta Neuropathol 2013;126(6):845-857.
(27) Davidson YS, Barker H, Robinson AC, Thompson JC, Harris J, Troakes C, et al. Brain distribution of dipeptide repeat proteins in frontotemporal lobar degeneration and motor neurone disease associated with expansions in C9ORF72. Acta neuropathologica communications 2014;2(70).
(28) Davidson YS, Robinson AC, Hu Q, Mishra M, Baborie A, Jaros E, et al. Nuclear carrier and RNA‐binding proteins in frontotemporal lobar degeneration associated with fused in sarcoma (FUS) pathological changes. Neuropathol Appl Neurobiol 2013;39(2):157-165.
(29) Rohrer JD, Guerreiro R, Vandrovcova J, Uphill J, Reiman D, Beck J, et al. The heritability and genetics of frontotemporal lobar degeneration. Neurology 2009;73(18):1451-1456.
(30) Pickering-Brown SM, Rollinson S, Du Plessis D, Morrison KE, Varma A, Richardson AM, et al. Frequency and clinical characteristics of progranulin mutation carriers in the Manchester frontotemporal lobar degeneration cohort: comparison with patients with MAPT and no known mutations. Brain 2008;131(3):721-731.
(31) Seelaar H, Kamphorst W, Rosso SM, Azmani A, Masdjedi R, de Koning I, et al. Distinct genetic forms of frontotemporal dementia. Neurology 2008;71(16):1220-1226.
(32) Grover A, Houlden H, Baker M, Adamson J, Lewis J, Prihar G, et al. 5′ splice site mutations in tau associated with the inherited dementia FTDP-17 affect a stem-loop structure that regulates alternative splicing of exon 10. J Biol Chem 1999;274(21):15134-15143.
(33) Hong M, Zhukareva V, Vogelsberg-Ragaglia V, Wszolek Z, Reed L, Miller BI, et al. Mutation-specific functional impairments in distinct tau isoforms of hereditary FTDP-17. Science 1998;282(5395):1914-1917.
(34) Cruts M, Kumar-Singh S, Van Broeckhoven C. Progranulin mutations in ubiquitin-positive frontotemporal dementia linked to chromosome 17q21. Current Alzheimer Research 2006;3(5):485-491.

234
(35) Gass J, Cannon A, Mackenzie IR, Boeve B, Baker M, Adamson J, et al. Mutations in progranulin are a major cause of ubiquitin-positive frontotemporal lobar degeneration. Hum Mol Genet 2006;15(20):2988-3001.
(36) Baker M, Mackenzie IR, Pickering-Brown SM, Gass J, Rademakers R, Lindholm C, et al. Mutations in progranulin cause tau-negative frontotemporal dementia linked to chromosome 17. Nature 2006;442(7105):916.
(37) Rademakers R, Neumann M, Mackenzie IR. Advances in understanding the molecular basis of frontotemporal dementia. Nature Reviews Neurology 2012;8(8):423-434.
(38) Pottier C, Ravenscroft TA, Sanchez‐Contreras M, Rademakers R. Genetics of FTLD: overview and what else we can expect from genetic studies. J Neurochem 2016;138:32-53.
(39) DeJesus-Hernandez M, Mackenzie IR, Boeve BF, Boxer AL, Baker M, Rutherford NJ, et al. Expanded GGGGCC hexanucleotide repeat in noncoding region of C9ORF72 causes chromosome 9p-linked FTD and ALS. Neuron 2011;72(2):245-256.
(40) Renton AE, Majounie E, Waite A, Simón-Sánchez J, Rollinson S, Gibbs JR, et al. A hexanucleotide repeat expansion in C9ORF72 is the cause of chromosome 9p21-linked ALS-FTD. Neuron 2011;72(2):257-268.
(41) Majounie E, Renton AE, Mok K, Dopper EG, Waite A, Rollinson S, et al. Frequency of the C9orf72 hexanucleotide repeat expansion in patients with amyotrophic lateral sclerosis and frontotemporal dementia: a cross-sectional study. The Lancet Neurology 2012;11(4):323-330.
(42) Mizielinska S, Isaacs AM. C9orf72 amyotrophic lateral sclerosis and frontotemporal dementia: gain or loss of function? Curr Opin Neurol 2014;27(5):515-523.
(43) Gendron TF, Belzil VV, Zhang Y, Petrucelli L. Mechanisms of toxicity in C9FTLD/ALS. Acta Neuropathol 2014;127(3):359-376.
(44) Skibinski G, Parkinson NJ, Brown JM, Chakrabarti L, Lloyd SL, Hummerich H, et al. Mutations in the endosomal ESCRTIII-complex subunit CHMP2B in frontotemporal dementia. Nat Genet 2005;37(8):806-808.
(45) Watts GD, Wymer J, Kovach MJ, Mehta SG, Mumm S, Darvish D, et al. Inclusion body myopathy associated with Paget disease of bone and frontotemporal dementia is caused by mutant valosin-containing protein. Nat Genet 2004;36(4):377.

235
(46) Rubino E, Rainero I, Chiò A, Rogaeva E, Galimberti D, Fenoglio P, et al. SQSTM1 mutations in frontotemporal lobar degeneration and amyotrophic lateral sclerosis. Neurology 2012;79(15):1556-1562.
(47) Gijselinck I, Van Mossevelde S, van der Zee J, Sieben A, Philtjens S, Heeman B, et al. Loss of TBK1 is a frequent cause of frontotemporal dementia in a Belgian cohort. Neurology 2015;85(24):2116-2125.
(48) Yu C, Bird TD, Bekris LM, Montine TJ, Leverenz JB, Steinbart E, et al. The spectrum of mutations in progranulin: a collaborative study screening 545 cases of neurodegeneration. Arch Neurol 2010;67(2):161-170.
(49) Cruts M, Theuns J, Van Broeckhoven C. Locus‐specific mutation databases for neurodegenerative brain diseases. Hum Mutat 2012;33(9):1340-1344.
(50) Mackenzie IR, Baker M, Pickering-Brown S, Hsiung GR, Lindholm C, Dwosh E, et al. The neuropathology of frontotemporal lobar degeneration caused by mutations in the progranulin gene. Brain 2006;129(11):3081-3090.
(51) Bronner IF, Rizzu P, Seelaar H, van Mil SE, Anar B, Azmani A, et al. Progranulin mutations in Dutch familial frontotemporal lobar degeneration. European Journal of Human Genetics 2007;15(3):369.
(52) Skoglund L, Matsui T, Freeman SH, Wallin A, Blom ES, Frosch MP, et al. Novel progranulin mutation detected in 2 patients with FTLD. Alzheimer Dis Assoc Disord 2011;25(2):173.
(53) Cruts M, Gijselinck I, Van Der Zee J, Engelborghs S, Wils H, Pirici D, et al. Null mutations in progranulin cause ubiquitin-positive frontotemporal dementia linked to chromosome 17q21. Nature 2006;442(7105):920-924.
(54) Mukherjee O, Wang J, Gitcho M, Chakraverty S, Taylor‐Reinwald L, Shears S, et al. Molecular characterization of novel progranulin (GRN) mutations in frontotemporal dementia. Hum Mutat 2008;29(4):512-521.
(55) Wang J, Van Damme P, Cruchaga C, Gitcho MA, Vidal JM, Seijo‐Martínez M, et al. Pathogenic cysteine mutations affect progranulin function and production of mature granulins. J Neurochem 2010;112(5):1305-1315.
(56) Seelaar H, Rohrer JD, Pijnenburg YA, Fox NC, Van Swieten JC. Clinical, genetic and pathological heterogeneity of frontotemporal dementia: a review. Journal of Neurology, Neurosurgery & Psychiatry 2011;82(5):476-486.

236
(57) Nguyen AD, Nguyen TA, Martens LH, Mitic LL, Farese Jr RV. Progranulin: at the interface of neurodegenerative and metabolic diseases. Trends in Endocrinology & Metabolism 2013;24(12):597-606.
(58) Meeter LH, Patzke H, Loewen G, Dopper EG, Pijnenburg YA, van Minkelen R, et al. Progranulin levels in plasma and cerebrospinal fluid in granulin mutation carriers. Dementia and geriatric cognitive disorders extra 2016;6(2):330-340.
(59) Finch N, Baker M, Crook R, Swanson K, Kuntz K, Surtees R, et al. Plasma progranulin levels predict progranulin mutation status in frontotemporal dementia patients and asymptomatic family members. Brain 2009;132(3):583-591.
(60) Almeida S, Zhang Z, Coppola G, Mao W, Futai K, Karydas A, et al. Induced pluripotent stem cell models of progranulin-deficient frontotemporal dementia uncover specific reversible neuronal defects. Cell reports 2012;2(4):789-798.
(61) Wauters E, Van Mossevelde S, Van der Zee J, Cruts M, Van Broeckhoven C. Modifiers of GRN-Associated Frontotemporal Lobar Degeneration. Trends Mol Med 2017;23(10):962-979.
(62) Edwards SL, Beesley J, French JD, Dunning AM. Beyond GWASs: illuminating the dark road from association to function. The American Journal of Human Genetics 2013;93(5):779-797.
(63) Stagi M, Klein ZA, Gould TJ, Bewersdorf J, Strittmatter SM. Lysosome size, motility and stress response regulated by fronto-temporal dementia modifier TMEM106B. Molecular and Cellular Neuroscience 2014;61:226-240.
(64) Nicholson AM, Finch NA, Wojtas A, Baker MC, Perkerson III RB, Castanedes-Casey M, et al. TMEM106B p. T185S regulates TMEM106B protein levels: implications for frontotemporal dementia. J Neurochem 2013;126(6):781-791.
(65) Van Deerlin VM, Sleiman PM, Martinez-Lage M, Chen-Plotkin A, Wang L, Graff-Radford NR, et al. Common variants at 7p21 are associated with frontotemporal lobar degeneration with TDP-43 inclusions. Nat Genet 2010;42(3):234.
(66) Finch N, Carrasquillo MM, Baker M, Rutherford NJ, Coppola G, Dejesus-Hernandez M, et al. TMEM106B regulates progranulin levels and the penetrance of FTLD in GRN mutation carriers. Neurology 2011;76(5):467-474.
(67) Cruchaga C, Graff C, Chiang H, Wang J, Hinrichs AL, Spiegel N, et al. Association of TMEM106B gene polymorphism with age at onset in granulin mutation carriers and plasma granulin protein levels. Arch Neurol 2011;68(5):581-586.

237
(68) Gallagher MD, Posavi M, Huang P, Unger TL, Berlyand Y, Gruenewald AL, et al. A dementia-associated risk variant near TMEM106B alters chromatin architecture and gene expression. The American Journal of Human Genetics 2017;101(5):643-663.
(69) Chen-Plotkin AS, Unger TL, Gallagher MD, Bill E, Kwong LK, Volpicelli-Daley L, et al. TMEM106B, the risk gene for frontotemporal dementia, is regulated by the microRNA-132/212 cluster and affects progranulin pathways. Journal of Neuroscience 2012;32(33):11213-11227.
(70) Nicholson AM, Rademakers R. What we know about TMEM106B in neurodegeneration. Acta Neuropathol 2016;132(5):639-651.
(71) Xu W, Han S, Zhang C, Li J, Wang Y, Tan C, et al. The FAM171A2 gene is a key regulator of progranulin expression and modifies the risk of multiple neurodegenerative diseases. Science Advances 2020;6(43):eabb3063.
(72) Rademakers R, Eriksen JL, Baker M, Robinson T, Ahmed Z, Lincoln SJ, et al. Common variation in the miR-659 binding-site of GRN is a major risk factor for TDP43-positive frontotemporal dementia. Hum Mol Genet 2008;17(23):3631-3642.
(73) Hsiung GR, Fok A, Feldman HH, Rademakers R, Mackenzie IR. rs5848 polymorphism and serum progranulin level. J Neurol Sci 2011;300(1-2):28-32.
(74) Rollinson S, Rohrer JD, van der Zee J, Sleegers K, Mead S, Engelborghs S, et al. No association of PGRN 3′ UTR rs5848 in frontotemporal lobar degeneration. Neurobiol Aging 2011;32(4):754-755.
(75) Rademakers R, Baker M, Gass J, Adamson J, Huey ED, Momeni P, et al. Phenotypic variability associated with progranulin haploinsufficiency in patients with the common 1477C→ T (Arg493X) mutation: an international initiative. The Lancet Neurology 2007;6(10):857-868.
(76) Banzhaf-Strathmann J, Claus R, Mücke O, Rentzsch K, van der Zee J, Engelborghs S, et al. Promoter DNA methylation regulates progranulin expression and is altered in FTLD. Acta neuropathologica communications 2013;1(1):16.
(77) Galimberti D, D’Addario C, Dell’Osso B, Fenoglio C, Marcone A, Cerami C, et al. Progranulin gene (GRN) promoter methylation is increased in patients with sporadic frontotemporal lobar degeneration. Neurological Sciences 2013;34(6):899-903.
(78) Hu F, Padukkavidana T, Vgter CB, Brady OA, Zheng Y, Mackenzie IR, et al. Sortilin-mediated endocytosis determines levels of the frontotemporal dementia protein, progranulin. Neuron 2010;68(4):654-667.

238
(79) Carrasquillo MM, Nicholson AM, Finch N, Gibbs JR, Baker M, Rutherford NJ, et al. Genome-wide screen identifies rs646776 near sortilin as a regulator of progranulin levels in human plasma. The American Journal of Human Genetics 2010;87(6):890-897.
(80) Hiraiwa M, Obrien JS, Kishimoto Y, Galdzicka M, Fluharty AL, Ginns EI, et al. Isolation, characterization, and proteolysis of human prosaposin, the precursor of saposins (sphingolipid activator proteins). Arch Biochem Biophys 1993;304(1):110-116.
(81) Zhou X, Sun L, de Oliveira FB, Qi X, Brown WJ, Smolka MB, et al. Prosaposin facilitates sortilin-independent lysosomal trafficking of progranulin. J Cell Biol 2015;210(6):991-1002.
(82) Nicholson AM, Finch NA, Almeida M, Perkerson RB, Van Blitterswijk M, Wojtas A, et al. Prosaposin is a regulator of progranulin levels and oligomerization. Nature communications 2016;7:11992.
(83) Almeida S, Zhou L, Gao F. Progranulin, a glycoprotein deficient in frontotemporal dementia, is a novel substrate of several protein disulfide isomerase family proteins. PloS One 2011;6(10):e26454.
(84) Hsiung GR, Feldman HH. GRN-related frontotemporal dementia. GeneReviews®[Internet]: University of Washington, Seattle; 2013.
(85) Josephs KA, Ahmed Z, Katsuse O, Parisi JF, Boeve BF, Knopman DS, et al. Neuropathologic features of frontotemporal lobar degeneration with ubiquitin-positive inclusions with progranulin gene (PGRN) mutations. Journal of Neuropathology & Experimental Neurology 2007;66(2):142-151.
(86) Mesulam M, Johnson N, Krefft TA, Gass JM, Cannon AD, Adamson JL, et al. Progranulin mutations in primary progressive aphasia: the PPA1 and PPA3 families. Arch Neurol 2007;64(1):43-47.
(87) Masellis M, Momeni P, Meschino W, Heffner Jr R, Elder J, Sato C, et al. Novel splicing mutation in the progranulin gene causing familial corticobasal syndrome. Brain 2006;129(11):3115-3123.
(88) Jacova C, Hsiung GR, Tawankanjanachot I, Dinelle K, McCormick S, Gonzalez M, et al. Anterior brain glucose hypometabolism predates dementia in progranulin mutation carriers. Neurology 2013;81(15):1322-1331.
(89) Caroppo P, Le Ber I, Camuzat A, Clot F, Naccache L, Lamari F, et al. Extensive white matter involvement in patients with frontotemporal lobar degeneration: think progranulin. JAMA neurology 2014;71(12):1562-1566.

239
(90) Mackenzie IR. The neuropathology and clinical phenotype of FTD with progranulin mutations. Acta Neuropathol 2007;114(1):49-54.
(91) Cairns NJ, Neumann M, Bigio EH, Holm IE, Troost D, Hatanpaa KJ, et al. TDP-43 in familial and sporadic frontotemporal lobar degeneration with ubiquitin inclusions. The American journal of pathology 2007;171(1):227-240.
(92) Lui H, Zhang J, Makinson SR, Cahill MK, Kelley KW, Huang H, et al. Progranulin deficiency promotes circuit-specific synaptic pruning by microglia via complement activation. Cell 2016;165(4):921-935.
(93) Götzl JK, Mori K, Damme M, Fellerer K, Tahirovic S, Kleinberger G, et al. Common pathobiochemical hallmarks of progranulin-associated frontotemporal lobar degeneration and neuronal ceroid lipofuscinosis. Acta Neuropathol 2014;127(6):845-860.
(94) Chen-Plotkin AS, Xiao J, Geser F, Martinez-Lage M, Grossman M, Unger T, et al. Brain progranulin expression in GRN-associated frontotemporal lobar degeneration. Acta Neuropathol 2010;119(1):111-122.
(95) Smith KR, Damiano J, Franceschetti S, Carpenter S, Canafoglia L, Morbin M, et al. Strikingly different clinicopathological phenotypes determined by progranulin-mutation dosage. The American Journal of Human Genetics 2012;90(6):1102-1107.
(96) Huin V, Barbier M, Bottani A, Lobrinus JA, Clot F, Lamari F, et al. Homozygous GRN mutations: new phenotypes and new insights into pathological and molecular mechanisms. Brain 2020;143(1):303-319.
(97) Bateman A, Belcourt D, Bennett H, Lazure C, Solomon S. Granulins, a novel class of peptide from leukocytes. Biochem Biophys Res Commun 1990;173(3):1161-1168.
(98) Eichinger L, Pachebat JA, Glöckner G, Rajandream M, Sucgang R, Berriman M, et al. The genome of the social amoeba Dictyostelium discoideum. Nature 2005;435(7038):43-57.
(99) Nichols SA, Dirks W, Pearse JS, King N. Early evolution of animal cell signaling and adhesion genes. Proceedings of the National Academy of Sciences 2006;103(33):12451-12456.
(100) King N, Westbrook MJ, Young SL, Kuo A, Abedin M, Chapman J, et al. The genome of the choanoflagellate Monosiga brevicollis and the origin of metazoans. Nature 2008;451(7180):783-788.

240
(101) Zanocco-Marani T, Bateman A, Romano G, Valentinis B, He Z, Baserga R. Biological activities and signaling pathways of the granulin/epithelin precursor. Cancer Res 1999;59(20):5331-5340.
(102) He Z, Ong CH, Halper J, Bateman A. Progranulin is a mediator of the wound response. Nat Med 2003;9(2):225-229.
(103) Zhu J, Nathan C, Jin W, Sim D, Ashcroft GS, Wahl SM, et al. Conversion of proepithelin to epithelins: roles of SLPI and elastase in host defense and wound repair. Cell 2002;111(6):867-878.
(104) Qin J, Díaz-Cueto L, Schwarze J, Takahashi Y, Imai M, Isuzugawa K, et al. Effects of progranulin on blastocyst hatching and subsequent adhesion and outgrowth in the mouse. Biol Reprod 2005;73(3):434-442.
(105) Desmarais JA, Cao M, Bateman A, Murphy BD. Spatiotemporal expression pattern of progranulin in embryo implantation and placenta formation suggests a role in cell proliferation, remodeling, and angiogenesis. Reproduction 2008;136(2):247-258.
(106) Chang MC, Srinivasan K, Friedman BA, Suto E, Modrusan Z, Lee WP, et al. Progranulin deficiency causes impairment of autophagy and TDP-43 accumulation. J Exp Med 2017;214(9):2611-2628.
(107) Evers BM, Rodriguez-Navas C, Tesla RJ, Prange-Kiel J, Wasser CR, Yoo KS, et al. Lipidomic and Transcriptomic Basis of Lysosomal Dysfunction in Progranulin Deficiency. Cell Reports 2017;20(11):2565-2574.
(108) He Z, Bateman A. Progranulin gene expression regulates epithelial cell growth and promotes tumor growth in vivo. Cancer Res 1999;59(13):3222-3229.
(109) Xu S, Tang D, Chamberlain S, Pronk G, Masiarz FR, Kaur S, et al. The granulin/epithelin precursor abrogates the requirement for the insulin-like growth factor 1 receptor for growth in vitro. J Biol Chem 1998;273(32):20078-20083.
(110) Plowman GD, Green JM, Neubauer MG, Buckley SD, McDonald VL, Todaro GJ, et al. The epithelin precursor encodes two proteins with opposing activities on epithelial cell growth. Journal of Biological Chemistry 1992;267(18):13073-13078.
(111) Zhou J, Gao G, Crabb JW, Serrero G. Purification of an autocrine growth factor homologous with mouse epithelin precursor from a highly tumorigenic cell line. Journal of Biological Chemistry 1993;268(15):10863-10869.
(112) Baba T, Hoff III HB, Nemoto H, Lee H, Orth J, Arai Y, et al. Acrogranin, an acrosomal cysteine‐rich glycoprotein, is the precursor of the growth‐modulating

241
peptides, granulins, and epithelins, and is expressed in somatic as well as male germ cells. Mol Reprod Dev 1993;34(3):233-243.
(113) Parnell PG, Wunderlich J, Carter B, Halper J. Transforming growth factor e: amino acid analysis and partial amino acid sequence. Growth Factors 1992;7(1):65-72.
(114) Bhandari V, Giaid A, Bateman A. The complementary deoxyribonucleic acid sequence, tissue distribution, and cellular localization of the rat granulin precursor. Endocrinology 1993;133(6):2682-2689.
(115) Hrabal R, Chen Z, James S, Bennett HP, Ni F. The hairpin stack fold, a novel protein architecture for a new family of protein growth factors. Nat Struct Biol 1996;3(9):747-752.
(116) Belcourt DR, Lazure C, Bennett HP. Isolation and primary structure of the three major forms of granulin-like peptides from hematopoietic tissues of a teleost fish (Cyprinus carpio). J Biol Chem 1993;268(13):9230-9237.
(117) Petkau TL, Neal SJ, Orban PC, MacDonald JL, Hill AM, Lu G, et al. Progranulin expression in the developing and adult murine brain. J Comp Neurol 2010;518(19):3931-3947.
(118) Holler CJ, Taylor G, Deng Q, Kukar T. Intracellular Proteolysis of Progranulin Generates Stable, Lysosomal Granulins that Are Haploinsufficient in Patients with Frontotemporal Dementia Caused by GRN Mutations. eNeuro 2017;4(4):ENEURO. 0100-17.2017.
(119) Götzl JK, Colombo A, Fellerer K, Reifschneider A, Werner G, Tahirovic S, et al. Early lysosomal maturation deficits in microglia triggers enhanced lysosomal activity in other brain cells of progranulin knockout mice. Molecular neurodegeneration 2018;13(48).
(120) Zhang J, Velmeshev D, Hashimoto K, Huang Y, Hofmann JW, Shi X, et al. Neurotoxic microglia promote TDP-43 proteinopathy in progranulin deficiency. Nature 2020;588(7838):459-465.
(121) Suh H, Choi N, Tarassishin L, Lee SC. Regulation of progranulin expression in human microglia and proteolysis of progranulin by matrix metalloproteinase-12 (MMP-12). PloS One 2012;7(4):e35115.
(122) Frew J, Baradaran-Heravi A, Balgi AD, Wu X, Yan TD, Arns S, et al. Premature termination codon readthrough upregulates progranulin expression and improves lysosomal function in preclinical models of GRN deficiency. Molecular Neurodegeneration 2020;15(21).

242
(123) Petkau TL, Blanco J, Leavitt BR. Conditional loss of progranulin in neurons is not sufficient to cause neuronal ceroid lipofuscinosis-like neuropathology in mice. Neurobiol Dis 2017;106:14-22.
(124) Arrant AE, Filiano AJ, Unger DE, Young AH, Roberson ED. Restoring neuronal progranulin reverses deficits in a mouse model of frontotemporal dementia. Brain 2017;140(5):1447-1465.
(125) Martens LH, Zhang J, Barmada SJ, Zhou P, Kamiya S, Sun B, et al. Progranulin deficiency promotes neuroinflammation and neuron loss following toxin-induced injury. J Clin Invest 2012;122(11):3955-3959.
(126) Minami SS, Min S, Krabbe G, Wang C, Zhou Y, Asgarov R, et al. Progranulin protects against amyloid β deposition and toxicity in Alzheimer's disease mouse models. Nat Med 2014;20(10):1157-1164.
(127) Petkau TL, Kosior N, de Asis K, Connolly C, Leavitt BR. Selective depletion of microglial progranulin in mice is not sufficient to cause neuronal ceroid lipofuscinosis or neuroinflammation. Journal of neuroinflammation 2017;14(255).
(128) Arrant AE, Filiano AJ, Patel AR, Hoffmann MQ, Boyle NR, Kashyap SN, et al. Reduction of microglial progranulin does not exacerbate pathology or behavioral deficits in neuronal progranulin-insufficient mice. Neurobiol Dis 2019;124:152-162.
(129) Krabbe G, Minami SS, Etchegaray JI, Taneja P, Djukic B, Davalos D, et al. Microglial NFκB-TNFα hyperactivation induces obsessive–compulsive behavior in mouse models of progranulin-deficient frontotemporal dementia. Proceedings of the National Academy of Sciences 2017;114(19):5029-5034.
(130) Erö C, Gewaltig M, Keller D, Markram H. A cell atlas for the mouse brain. Frontiers in neuroinformatics 2018;12:84.
(131) Tanaka Y, Matsuwaki T, Yamanouchi K, Nishihara M. Increased lysosomal biogenesis in activated microglia and exacerbated neuronal damage after traumatic brain injury in progranulin-deficient mice. Neuroscience 2013;250:8-19.
(132) Belcastro V, Siciliano V, Gregoretti F, Mithbaokar P, Dharmalingam G, Berlingieri S, et al. Transcriptional gene network inference from a massive dataset elucidates transcriptome organization and gene function. Nucleic Acids Res 2011;39(20):8677-8688.
(133) Sardiello M, Palmieri M, di Ronza A, Medina DL, Valenza M, Gennarino VA, et al. A gene network regulating lysosomal biogenesis and function. Science 2009;325(5939):473-477.

243
(134) Roczniak-Ferguson A, Petit CS, Froehlich F, Qian S, Ky J, Angarola B, et al. The transcription factor TFEB links mTORC1 signaling to transcriptional control of lysosome homeostasis. Science signaling 2012;5(228):ra42.
(135) Holler CJ, Taylor G, McEachin ZT, Deng Q, Watkins WJ, Hudson K, et al. Trehalose upregulates progranulin expression in human and mouse models of GRN haploinsufficiency: a novel therapeutic lead to treat frontotemporal dementia. Molecular neurodegeneration 2016;11(1):46.
(136) Elia LP, Mason AR, Alijagic A, Finkbeiner S. Genetic regulation of neuronal progranulin reveals a critical role for the autophagy-lysosome pathway. Journal of Neuroscience 2019;39(17):3332-3344.
(137) Naphade SB, Kigerl KA, Jakeman LB, Kostyk SK, Popovich PG, Kuret J. Progranulin expression is upregulated after spinal contusion in mice. Acta Neuropathol 2010;119(1):123-133.
(138) Bhandari V, Daniel R, Lim PS, Bateman A. Structural and functional analysis of a promoter of the human granulin/epithelin gene. Biochem J 1996;319(2):441-447.
(139) Frampton G, Invernizzi P, Bernuzzi F, Pae HY, Quinn M, Horvat D, et al. Interleukin-6-driven progranulin expression increases cholangiocarcinoma growth by an Akt-dependent mechanism. Gut 2012;61(2):268-277.
(140) Liu F, Zhang W, Yang F, Feng T, Zhou M, Yu Y, et al. Interleukin-6-stimulated progranulin expression contributes to the malignancy of hepatocellular carcinoma cells by activating mTOR signaling. Scientific reports 2016;6:21260.
(141) Ong CH, He Z, Kriazhev L, Shan X, Palfree RG, Bateman A. Regulation of progranulin expression in myeloid cells. American Journal of Physiology-Regulatory, Integrative and Comparative Physiology 2006;291(6):1602.
(142) Tarassishin L, Suh H, Lee SC. LPS and IL‐1 differentially activate mouse and human astrocytes: Role of CD14. Glia 2014;62(6):999-1013.
(143) Capell A, Fellerer K, Haass C. Progranulin transcripts with short and long 5′ untranslated regions (UTRs) are differentially expressed via posttranscriptional and translational repression. J Biol Chem 2014;289(37):25879-25889.
(144) Kanazawa M, Kawamura K, Takahashi T, Miura M, Tanaka Y, Koyama M, et al. Multiple therapeutic effects of progranulin on experimental acute ischaemic stroke. Brain 2015;138(7):1932-1948.

244
(145) Songsrirote K, Li Z, Ashford D, Bateman A, Thomas-Oates J. Development and application of mass spectrometric methods for the analysis of progranulin N-glycosylation. Journal of proteomics 2010;73(8):1479-1490.
(146) Jia Y. Analysis of the neuroprotective function and the N-glycosylation progranulin (PGRN) (University of British Columbia). 2009.
(147) Petoukhov E, Fernando S, Mills F, Shivji F, Hunter D, Krieger C, et al. Activity-dependent secretion of progranulin from synapses. J Cell Sci 2013;126(23):5412-5421.
(148) Zheng Y, Brady OA, Meng PS, Mao Y, Hu F. C-terminus of progranulin interacts with the beta-propeller region of sortilin to regulate progranulin trafficking. PloS One 2011;6(6):e21023.
(149) Zhou X, Paushter DH, Feng T, Sun L, Reinheckel T, Hu F. Lysosomal processing of progranulin. Molecular neurodegeneration 2017;12(62).
(150) Lee CW, Stankowski JN, Chew J, Cook CN, Lam Y, Almeida S, et al. The lysosomal protein cathepsin L is a progranulin protease. Molecular neurodegeneration 2017;12(55).
(151) Wang X, Li X, Xu L, Zhan Y, Yaish-Ohad S, Erhardt JA, et al. Up-regulation of secretory leukocyte protease inhibitor (SLPI) in the brain after ischemic stroke: adenoviral expression of SLPI protects brain from ischemic injury. Mol Pharmacol 2003;64(4):833-840.
(152) Brady OA, Zheng Y, Murphy K, Huang M, Hu F. The frontotemporal lobar degeneration risk factor, TMEM106B, regulates lysosomal morphology and function. Hum Mol Genet 2013;22(4):685-695.
(153) Schwenk BM, Lang CM, Hogl S, Tahirovic S, Orozco D, Rentzsch K, et al. The FTLD risk factor TMEM106B and MAP6 control dendritic trafficking of lysosomes. EMBO J 2014;33(5):450-467.
(154) Busch JI, Unger TL, Jain N, Tyler Skrinak R, Charan RA, Chen-Plotkin AS. Increased expression of the frontotemporal dementia risk factor TMEM106B causes C9orf72-dependent alterations in lysosomes. Hum Mol Genet 2016;25(13):2681-2697.
(155) Zhou X, Sun L, Brady OA, Murphy KA, Hu F. Elevated TMEM106B levels exaggerate lipofuscin accumulation and lysosomal dysfunction in aged mice with progranulin deficiency. Acta neuropathologica communications 2017;5(9).
(156) Feng T, Mai S, Roscoe JM, Sheng RR, Ullah M, Zhang J, et al. Loss of TMEM106B and PGRN leads to severe lysosomal abnormalities and neurodegeneration in mice. EMBO Rep 2020;21(10):e50219.

245
(157) Werner G, Damme M, Schludi M, Gnörich J, Wind K, Fellerer K, et al. Loss of TMEM106B potentiates lysosomal and FTLD‐like pathology in progranulin‐deficient mice. EMBO Rep 2020;21(10):e50241.
(158) Zhou X, Nicholson AM, Ren Y, Brooks M, Jiang P, Zuberi A, et al. Loss of TMEM106B leads to myelination deficits: implications for frontotemporal dementia treatment strategies. Brain 2020;146(6):1905-1919.
(159) Ahmed Z, Sheng H, Xu Y, Lin W, Innes AE, Gass J, et al. Accelerated lipofuscinosis and ubiquitination in granulin knockout mice suggest a role for progranulin in successful aging. The American journal of pathology 2010;177(1):311-324.
(160) Kayasuga Y, Chiba S, Suzuki M, Kikusui T, Matsuwaki T, Yamanouchi K, et al. Alteration of behavioural phenotype in mice by targeted disruption of the progranulin gene. Behav Brain Res 2007;185(2):110-118.
(161) Yin F, Banerjee R, Thomas B, Zhou P, Qian L, Jia T, et al. Exaggerated inflammation, impaired host defense, and neuropathology in progranulin-deficient mice. J Exp Med 2010;207(1):117-128.
(162) Yin F, Dumont M, Banerjee R, Ma Y, Li H, Lin MT, et al. Behavioral deficits and progressive neuropathology in progranulin-deficient mice: a mouse model of frontotemporal dementia. The FASEB Journal 2010;24(12):4639-4647.
(163) Petkau TL, Neal SJ, Milnerwood A, Mew A, Hill AM, Orban P, et al. Synaptic dysfunction in progranulin-deficient mice. Neurobiol Dis 2012;45(2):711-722.
(164) Tanaka Y, Chambers JK, Matsuwaki T, Yamanouchi K, Nishihara M. Possible involvement of lysosomal dysfunction in pathological changes of the brain in aged progranulin-deficient mice. Acta neuropathologica communications 2014;2(78).
(165) Nguyen AD, Nguyen TA, Zhang J, Devireddy S, Zhou P, Karydas AM, et al. Murine knockin model for progranulin-deficient frontotemporal dementia with nonsense-mediated mRNA decay. Proceedings of the National Academy of Sciences 2018;115(12):E2849-E2858.
(166) Pickford F, Marcus J, Camargo LM, Xiao Q, Graham D, Mo J, et al. Progranulin is a chemoattractant for microglia and stimulates their endocytic activity. The American journal of pathology 2011;178(1):284-295.
(167) Tang W, Lu Y, Tian Q, Zhang Y, Guo F, Liu G, et al. The growth factor progranulin binds to TNF receptors and is therapeutic against inflammatory arthritis in mice. Science 2011;332(6028):478-484.

246
(168) Jian J, Zhao S, Tian Q, Gonzalez-Gugel E, Mundra JJ, Uddin SM, et al. Progranulin directly binds to the CRD2 and CRD3 of TNFR extracellular domains. FEBS Lett 2013;587(21):3428-3436.
(169) Chen X, Chang J, Deng Q, Xu J, Nguyen TA, Martens LH, et al. Progranulin does not bind tumor necrosis factor (TNF) receptors and is not a direct regulator of TNF-dependent signaling or bioactivity in immune or neuronal cells. Journal of neuroscience 2013;33(21):9202-9213.
(170) Etemadi N, Webb A, Bankovacki A, Silke J, Nachbur U. Progranulin does not inhibit TNF and lymphotoxin‐α signalling through TNF receptor 1. Immunol Cell Biol 2013;91(10):661-664.
(171) Lang I, Füllsack S, Wajant H. Lack of evidence for a direct interaction of progranulin and tumor necrosis factor receptor-1 and tumor necrosis factor receptor-2 from cellular binding studies. Frontiers in immunology 2018;9:793.
(172) Wei F, Zhang Y, Jian J, Mundra JJ, Tian Q, Lin J, et al. PGRN protects against colitis progression in mice in an IL-10 and TNFR2 dependent manner. Scientific reports 2014;4(7023).
(173) Chen Q, Cai J, Li X, Song A, Guo H, Sun Q, et al. Progranulin promotes regeneration of inflammatory periodontal bone defect in rats via anti-inflammation, osteoclastogenic inhibition, and osteogenic promotion. Inflammation 2019;42(1):221-234.
(174) Liu L, Qu Y, Liu Y, Zhao H, Ma H, Noor AF, et al. Atsttrin reduces lipopolysaccharide-induced neuroinflammation by inhibiting the nuclear factor kappa B signaling pathway. Neural regeneration research 2019;14(11):1994-2002.
(175) Telpoukhovskaia MA, Liu K, Sayed FA, Etchegaray JI, Xie M, Zhan L, et al. Discovery of small molecules that normalize the transcriptome and enhance cysteine cathepsin activity in progranulin-deficient microglia. Scientific reports 2020;10(13688).
(176) Tanaka Y, Matsuwaki T, Yamanouchi K, Nishihara M. Exacerbated inflammatory responses related to activated microglia after traumatic brain injury in progranulin-deficient mice. Neuroscience 2013;231:49-60.
(177) Sarlus H, Heneka MT. Microglia in Alzheimer’s disease. J Clin Invest 2017;127(9):3240-3249.
(178) Huang M, Modeste E, Dammer E, Merino P, Taylor G, Duong DM, et al. Network analysis of the progranulin-deficient mouse brain proteome reveals pathogenic mechanisms shared in human frontotemporal dementia caused by GRN mutations. Acta Neuropathologica Communications 2020;8(163).
247
(179) Klein ZA, Takahashi H, Ma M, Stagi M, Zhou M, Lam TT, et al. Loss of TMEM106B ameliorates lysosomal and frontotemporal dementia-related phenotypes in progranulin-deficient mice. Neuron 2017;95(2):281-296.
(180) Tanaka Y, Suzuki G, Matsuwaki T, Hosokawa M, Serrano G, Beach TG, et al. Progranulin regulates lysosomal function and biogenesis through acidification of lysosomes. Hum Mol Genet 2017;26(5):969-988.
(181) Marschallinger J, Iram T, Zardeneta M, Lee SE, Lehallier B, Haney MS, et al. Lipid-droplet-accumulating microglia represent a dysfunctional and proinflammatory state in the aging brain. Nat Neurosci 2020;23:194–208.
(182) Liu L, Zhang K, Sandoval H, Yamamoto S, Jaiswal M, Sanz E, et al. Glial lipid droplets and ROS induced by mitochondrial defects promote neurodegeneration. Cell 2015;160(1-2):177-190.
(183) den Brok MH, Raaijmakers TK, Collado-Camps E, Adema GJ. Lipid droplets as immune modulators in myeloid cells. Trends Immunol 2018;39(5):380-392.
(184) Budge KM, Neal ML, Richardson JR, Safadi FF. Glycoprotein NMB: an emerging role in neurodegenerative disease. Mol Neurobiol 2018;55(6):5167-5176.
(185) Moloney EB, Moskites A, Ferrari EJ, Isacson O, Hallett PJ. The glycoprotein GPNMB is selectively elevated in the substantia nigra of Parkinson's disease patients and increases after lysosomal stress. Neurobiol Dis 2018;120:1-11.
(186) Jian J, Tian Q, Hettinghouse A, Zhao S, Liu H, Wei J, et al. Progranulin recruits HSP70 to β-glucocerebrosidase and is therapeutic against Gaucher disease. EBioMedicine 2016;13:212-224.
(187) Zhou X, Paushter DH, Pagan MD, Kim D, Santos MN, Lieberman RL, et al. Progranulin deficiency leads to reduced glucocerebrosidase activity. PloS One 2019;14(7):e0212382.
(188) Hendrickx DA, Van Scheppingen J, van der Poel M, Bossers K, Schuurman KG, van Eden CG, et al. Gene expression profiling of multiple sclerosis pathology identifies early patterns of demyelination surrounding chronic active lesions. Frontiers in immunology 2017;8:1810.
(189) Weinhard L, di Bartolomei G, Bolasco G, Machado P, Schieber NL, Neniskyte U, et al. Microglia remodel synapses by presynaptic trogocytosis and spine head filopodia induction. Nature communications 2018;9(1):1228.

248
(190) Arrant AE, Filiano AJ, Warmus BA, Hall AM, Roberson ED. Progranulin haploinsufficiency causes biphasic social dominance abnormalities in the tube test. Genes, Brain and Behavior 2016;15(6):588-603.
(191) Konuk N, Tekın IO, Ozturk U, Atik L, Atasoy N, Bektas S, et al. Plasma levels of tumor necrosis factor-alpha and interleukin-6 in obsessive compulsive disorder. Mediators Inflamm 2007;2007(65704).
(192) Figee M, Luigjes J, Smolders R, Valencia-Alfonso C, Van Wingen G, De Kwaasteniet B, et al. Deep brain stimulation restores frontostriatal network activity in obsessive-compulsive disorder. Nat Neurosci 2013;16(4):386-387.
(193) Liu L, Guo H, Song A, Huang J, Zhang Y, Jin S, et al. Progranulin inhibits LPS-induced macrophage M1 polarization via NF-кB and MAPK pathways. BMC Immunology 2020;21(1):32.
(194) Windisch M. We can treat Alzheimer's disease successfully in mice but not in men: failure in translation? A perspective. Neurodegenerative Diseases 2014;13(2-3):147-150.
(195) Takahashi K, Tanabe K, Ohnuki M, Narita M, Ichisaka T, Tomoda K, et al. Induction of pluripotent stem cells from adult human fibroblasts by defined factors. Cell 2007;131(5):861-872.
(196) Chambers SM, Fasano CA, Papapetrou EP, Tomishima M, Sadelain M, Studer L. Highly efficient neural conversion of human ES and iPS cells by dual inhibition of SMAD signaling. Nat Biotechnol 2009;27(3):275-280.
(197) Julia T, Wang M, Pimenova AA, Bowles KR, Hartley BJ, Lacin E, et al. An efficient platform for astrocyte differentiation from human induced pluripotent stem cells. Stem cell reports 2017;9(2):600-614.
(198) Abud EM, Ramirez RN, Martinez ES, Healy LM, Nguyen CH, Newman SA, et al. iPSC-derived human microglia-like cells to study neurological diseases. Neuron 2017;94(2):278-293.
(199) Raitano S, Ordovàs L, De Muynck L, Guo W, Espuny-Camacho I, Geraerts M, et al. Restoration of progranulin expression rescues cortical neuron generation in an induced pluripotent stem cell model of frontotemporal dementia. Stem cell reports 2015;4(1):16-24.
(200) Valdez C, Wong YC, Schwake M, Bu G, Wszolek ZK, Krainc D. Progranulin-mediated deficiency of cathepsin D results in FTD and NCL-like phenotypes in neurons derived from FTD patients. Hum Mol Genet 2017;26(24):4861-4872.

249
(201) Almeida S, Gao F, Coppola G, Gao F. Suberoylanilide hydroxamic acid increases progranulin production in iPSC-derived cortical neurons of frontotemporal dementia patients. Neurobiol Aging 2016;42:35-40.
(202) Beel S, Moisse M, Damme M, De Muynck L, Robberecht W, Van Den Bosch L, et al. Progranulin functions as a cathepsin D chaperone to stimulate axonal outgrowth in vivo. Hum Mol Genet 2017;26(15):2850-2863.
(203) Zhou X, Paushter DH, Feng T, Pardon CM, Mendoza CS, Hu F. Regulation of cathepsin D activity by the FTLD protein progranulin. Acta Neuropathol 2017;134(1):151-153.
(204) Lee WC, Almeida S, Prudencio M, Caulfield TR, Zhang Y, Tay WM, et al. Targeted manipulation of the sortilin–progranulin axis rescues progranulin haploinsufficiency. Hum Mol Genet 2013;23(6):1467-1478.
(205) Cenik B, Sephton CF, Dewey CM, Xian X, Wei S, Yu K, et al. Suberoylanilide hydroxamic acid (vorinostat) up-regulates progranulin transcription: rational therapeutic approach to frontotemporal dementia. J Biol Chem 2011;286(18):16101-16108.
(206) Rohrer JD, Warren JD, Barnes J, Mead S, Beck J, Pepple T, et al. Mapping the progression of progranulin-associated frontotemporal lobar degeneration. Nature Clinical Practice Neurology 2008;4(8):455-460.
(207) Borroni B, Alberici A, Cercignani M, Premi E, Serra L, Cerini C, et al. Granulin mutation drives brain damage and reorganization from preclinical to symptomatic FTLD. Neurobiol Aging 2012;33(10):2506-2520.
(208) Butler VJ, Cortopassi WA, Argouarch AR, Ivry SL, Craik CS, Jacobson MP, et al. Progranulin stimulates the in vitro maturation of pro-cathepsin D at acidic pH. J Mol Biol 2019;431(5):1038-1047.
(209) Altmann C, Vasic V, Hardt S, Heidler J, Häussler A, Wittig I, et al. Progranulin promotes peripheral nerve regeneration and reinnervation: role of notch signaling. Molecular neurodegeneration 2016;11(1):69.
(210) Bernier L, York EM, MacVicar BA. Immunometabolism in the brain: how metabolism shapes microglial function. Trends Neurosci 2020;43(11):854-869.
(211) Afridi R, Lee W, Suk K. Microglia gone awry: linking immunometabolism to neurodegeneration. Frontiers in Cellular Neuroscience 2020;14(246).
(212) Götzl JK, Brendel M, Werner G, Parhizkar S, Monasor LS, Kleinberger G, et al. Opposite microglial activation stages upon loss of PGRN or TREM2 result in reduced cerebral glucose metabolism. EMBO molecular medicine 2019;11(6):e9711.

250
(213) Lee SE, Sias AC, Kosik EL, Flagan TM, Deng J, Chu SA, et al. Thalamo-cortical network hyperconnectivity in preclinical progranulin mutation carriers. NeuroImage: Clinical 2019;22(101751).
(214) Lüningschrör P, Werner G, Stroobants S, Kakuta S, Dombert B, Sinske D, et al. The FTLD risk factor TMEM106B regulates the transport of lysosomes at the axon initial segment of motoneurons. Cell Reports 2020;30(10):3506-3519. e6.
(215) Zhou X, Brooks M, Jiang P, Koga S, Zuberi AR, Baker MC, et al. Loss of Tmem106b exacerbates FTLD pathologies and causes motor deficits in progranulin‐deficient mice. EMBO Rep 2020;21(10):e50197.
(216) Arrant AE, Nicholson AM, Zhou X, Rademakers R, Roberson ED. Partial Tmem106b reduction does not correct abnormalities due to progranulin haploinsufficiency. Molecular neurodegeneration 2018;13(32).
(217) Philips T, De Muynck L, Nguyen Thi Thu H, Weynants B, Vanacker P, Dhondt J, et al. Microglial upregulation of progranulin as a marker of motor neuron degeneration. Journal of Neuropathology & Experimental Neurology 2010;69(12):1191-1200.
(218) Arrant AE, Onyilo VC, Unger DE, Roberson ED. Progranulin gene therapy improves lysosomal dysfunction and microglial pathology associated with frontotemporal dementia and neuronal ceroid lipofuscinosis. Journal of Neuroscience 2018;38(9):2341-2358.
(219) Alexander C, Pisner D, Jacova C. Predementia brain changes in progranulin mutation: a systematic review of neuroimaging evidence. Dement Geriatr Cogn Disord 2019;47(1-2):1-18.
(220) She A, Kurtser I, Reis SA, Hennig K, Lai J, Lang A, et al. Selectivity and kinetic requirements of HDAC inhibitors as progranulin enhancers for treating frontotemporal dementia. Cell Chemical Biology 2017;24(7):892-906.
(221) Hinderer C, Miller R, Dyer C, Johansson J, Bell P, Buza E, et al. Adeno‐associated virus serotype 1‐based gene therapy for FTD caused by GRN mutations. Annals of Clinical and Translational Neurology 2020;7(10):1843-1853.
(222) Alberici A, Archetti S, Pilotto A, Premi E, Cosseddu M, Bianchetti A, et al. Results from a pilot study on amiodarone administration in monogenic frontotemporal dementia with granulin mutation. Neurological Sciences 2014;35(8):1215-1219.
(223) Sharon JS, Miller ZA, Min S, Zhou Y, Brown J, Mitic LL, et al. An 8-week, open-label, dose-finding study of nimodipine for the treatment of progranulin insufficiency from GRN gene mutations. Alzheimer's & Dementia: Translational Research & Clinical Interventions 2017;3(4):507-512.

251
(224) A Phase 3 Study to Evaluate Efficacy and Safety of AL001 in Frontotemporal Dementia (INFRONT-3). Available at: https://ClinicalTrials.gov/show/NCT04374136.
(225) Phase 1/2 Clinical Trial of PR006 in Patients with Frontotemporal Dementia with Progranulin Mutations (FTD-GRN) (PROCLAIM). Available at: https://ClinicalTrials.gov/show/NCT04408625.
(226) A Study of PBFT02 in Patients with Frontotemporal Dementia and Progranulin Mutations (FTD-GRN) (upliFT-D). Available at: https://ClinicalTrials.gov/show/NCT04747431.
(227) Lebert F, Stekke W, Hasenbroekx C, Pasquier F. Frontotemporal dementia: a randomised, controlled trial with trazodone. Dement Geriatr Cogn Disord 2004;17(4):355-359.
(228) Brenner S, Stretton A, Kaplan S. Genetic code: the ‘nonsense’ triplets for chain termination and their suppression. Nature 1965;206(4988):994-998.
(229) Brenner S, Barnett L, Katz ER, Crick F. UGA: a third nonsense triplet in the genetic code. Nature 1967;213(5075):449-450.
(230) Losson R, Lacroute F. Interference of nonsense mutations with eukaryotic messenger RNA stability. Proceedings of the National Academy of Sciences 1979;76(10):5134-5137.
(231) Wilhelm JM, Jessop JJ, Pettitt SE. Aminoglycoside antibiotics and eukaryotic protein synthesis: stimulation of errors in the translation of natural messengers in extracts of cultured human cells. Biochemistry 1978;17(7):1149-1153.
(232) Palmer E, Wilhelm JM, Sherman F. Phenotypic suppression of nonsense mutants in yeast by aminoglycoside antibiotics. Nature 1979;277(5692):148-150.
(233) Nicholson P, Yepiskoposyan H, Metze S, Orozco RZ, Kleinschmidt N, Mühlemann O. Nonsense-mediated mRNA decay in human cells: mechanistic insights, functions beyond quality control and the double-life of NMD factors. Cellular and molecular life sciences 2010;67(5):677-700.
(234) Manuvakhova M, Keeling K, Bedwell DM. Aminoglycoside antibiotics mediate context-dependent suppression of termination codons in a mammalian translation system. RNA 2000;6(7):1044-1055.
(235) Cassan M, Rousset J. UAG readthrough in mammalian cells: effect of upstream and downstream stop codon contexts reveal different signals. BMC molecular biology 2001;2(3).
252
(236) McCaughan KK, Brown CM, Dalphin ME, Berry MJ, Tate WP. Translational termination efficiency in mammals is influenced by the base following the stop codon. Proceedings of the National Academy of Sciences 1995;92(12):5431-5435.
(237) Tate WP, Poole ES, Horsfield JA, Mannering SA, Brown CM, Moffat JG, et al. Translational termination efficiency in both bacteria and mammals is regulated by the base following the stop codon. Biochemistry and cell biology 1995;73(11-12):1095-1103.
(238) Pavlov MY, Freistroffer DV, Dincbas V, MacDougall J, Buckingham RH, Ehrenberg M. A direct estimation of the context effect on the efficiency of termination. J Mol Biol 1998;284(3):579-590.
(239) Namy O, Hatin I, Rousset J. Impact of the six nucleotides downstream of the stop codon on translation termination. EMBO Rep 2001;2(9):787-793.
(240) Bonetti B, Fu L, Moon J, Bedwell DM. The efficiency of translation termination is determined by a synergistic interplay between upstream and downstream sequences in Saccharomyces cerevisiae. J Mol Biol 1995;251(3):334-345.
(241) Hoshino S, Imai M, Kobayashi T, Uchida N, Katada T. The eukaryotic polypeptide chain releasing factor (eRF3/GSPT) carrying the translation termination signal to the 3'-Poly(A) tail of mRNA. Direct association of erf3/GSPT with polyadenylate-binding protein. J Biol Chem 1999;274(24):16677-16680.
(242) Ivanov PV, Gehring NH, Kunz JB, Hentze MW, Kulozik AE. Interactions between UPF1, eRFs, PABP and the exon junction complex suggest an integrated model for mammalian NMD pathways. EMBO J 2008;27(5):736-747.
(243) Barton-Davis ER, Cordier L, Shoturma DI, Leland SE, Sweeney HL. Aminoglycoside antibiotics restore dystrophin function to skeletal muscles of mdx mice. J Clin Invest 1999;104(4):375-381.
(244) Wagner KR, Hamed S, Hadley DW, Gropman AL, Burstein AH, Escolar DM, et al. Gentamicin treatment of Duchenne and Becker muscular dystrophy due to nonsense mutations. Annals of Neurology: Official Journal of the American Neurological Association and the Child Neurology Society 2001;49(6):706-711.
(245) Shulman E, Belakhov V, Wei G, Kendall A, Meyron-Holtz EG, Ben-Shachar D, et al. Designer aminoglycosides that selectively inhibit cytoplasmic rather than mitochondrial ribosomes show decreased ototoxicity a strategy for the treatment of genetic diseases. J Biol Chem 2014;289(4):2318-2330.
(246) Leubitz A, Frydman‐Marom A, Sharpe N, van Duzer J, Campbell KC, Vanhoutte
F. Safety, tolerability, and pharmacokinetics of single ascending doses of ELX‐02, a

253
potential treatment for genetic disorders caused by nonsense mutations, in healthy volunteers. Clinical pharmacology in drug development 2019;8(8):984-994.
(247) Brasell EJ, Chu LL, Akpa MM, Eshkar-Oren I, Alroy I, Corsini R, et al. The novel aminoglycoside, ELX-02, permits CTNSW138X translational read-through and restores lysosomal cystine efflux in cystinosis. PloS One 2019;14(12):e0223954.
(248) Taguchi A, Nishiguchi S, Shiozuka M, Nomoto T, Ina M, Nojima S, et al. Negamycin analogue with readthrough-promoting activity as a potential drug candidate for duchenne muscular dystrophy. ACS medicinal chemistry letters 2012;3(2):118-122.
(249) Hamada K, Omura N, Taguchi A, Baradaran-Heravi A, Kotake M, Arai M, et al. New negamycin-based potent readthrough derivative effective against TGA-type nonsense mutations. ACS medicinal chemistry letters 2019;10(10):1450-1456.
(250) Welch EM, Barton ER, Zhuo J, Tomizawa Y, Friesen WJ, Trifillis P, et al. PTC124 targets genetic disorders caused by nonsense mutations. Nature 2007;447(7140):87-91.
(251) McDonald CM, Campbell C, Torricelli RE, Finkel RS, Flanigan KM, Goemans N, et al. Ataluren in patients with nonsense mutation Duchenne muscular dystrophy (ACT DMD): a multicentre, randomised, double-blind, placebo-controlled, phase 3 trial. The Lancet 2017;390(10101):1489-1498.
(252) Roles of molecular chaperones in cytoplasmic protein folding. Seminars in cell & developmental biology: Elsevier; 2000.
(253) Keeling KM, Brooks DA, Hopwood JJ, Li P, Thompson JN, Bedwell DM. Gentamicin-mediated suppression of Hurler syndrome stop mutations restores a low level of α-L-iduronidase activity and reduces lysosomal glycosaminoglycan accumulation. Hum Mol Genet 2001;10(3):291-300.
(254) Keeling KM, Bedwell DM. Clinically relevant aminoglycosides can suppress disease-associated premature stop mutations in the IDUA and P53 cDNAs in a mammalian translation system. Journal of molecular medicine 2002;80(6):367-376.
(255) Chernikov VG, Terekhov SM, Krokhina TB, Shishkin SS, Smirnova TD, Kalashnikova EA, et al. Comparison of cytotoxicity of aminoglycoside antibiotics using a panel cellular biotest system. Bull Exp Biol Med 2003;135(1):103-105.
(256) Wangen JR, Green R. Stop codon context influences genome-wide stimulation of termination codon readthrough by aminoglycosides. Elife 2020;9:e52611.

254
(257) Wakap SN, Lambert DM, Olry A, Rodwell C, Gueydan C, Lanneau V, et al. Estimating cumulative point prevalence of rare diseases: analysis of the Orphanet database. European Journal of Human Genetics 2020;28(2):165-173.
(258) Mort M, Ivanov D, Cooper DN, Chuzhanova NA. A meta‐analysis of nonsense mutations causing human genetic disease. Hum Mutat 2008;29(8):1037-1047.
(259) Bushby K, Finkel R, Wong B, Barohn R, Campbell C, Comi GP, et al. Ataluren treatment of patients with nonsense mutation dystrophinopathy. Muscle Nerve 2014;50(4):477-487.
(260) Wilschanski M, Famini C, Blau H, Rivlin J, Augarten A, Avital A, et al. A pilot study of the effect of gentamicin on nasal potential difference measurements in cystic fibrosis patients carrying stop mutations. American journal of respiratory and critical care medicine 2000;161(3):860-865.
(261) Clancy JP, Bebok Z, Ruiz F, King C, Jones J, Walker L, et al. Evidence that systemic gentamicin suppresses premature stop mutations in patients with cystic fibrosis. American journal of respiratory and critical care medicine 2001;163(7):1683-1692.
(262) Wilschanski M, Yahav Y, Yaacov Y, Blau H, Bentur L, Rivlin J, et al. Gentamicin-induced correction of CFTR function in patients with cystic fibrosis and CFTR stop mutations. N Engl J Med 2003;349(15):1433-1441.
(263) Kerem E, Konstan MW, De Boeck K, Accurso FJ, Sermet-Gaudelus I, Wilschanski M, et al. Ataluren for the treatment of nonsense-mutation cystic fibrosis: a randomised, double-blind, placebo-controlled phase 3 trial. The Lancet Respiratory Medicine 2014;2(7):539-547.
(264) Haas M, Vlcek V, Balabanov P, Salmonson T, Bakchine S, Markey G, et al. European Medicines Agency review of ataluren for the treatment of ambulant patients aged 5 years and older with Duchenne muscular dystrophy resulting from a nonsense mutation in the dystrophin gene. Neuromuscular disorders 2015;25(1):5-13.
(265) Keeling KM, Xue X, Gunn G, Bedwell DM. Therapeutics based on stop codon readthrough. Annual review of genomics and human genetics 2014;15:371-394.
(266) Carlier M, Rollman B, Van Hoof F, Tulkens P. Mechanism of aminoglycoside-induced lysosomal phospholipidosis: in vitro and in vivo studies with gentamicin and amikacin. Biochem Pharmacol 1982;31(23):3861-3870.
(267) O’neil WG. Aminoglycoside induced ototoxicity. Toxicology 2008;249(2-3):91-96.

255
(268) Hobbie SN, Akshay S, Kalapala SK, Bruell CM, Shcherbakov D, Böttger EC. Genetic analysis of interactions with eukaryotic rRNA identify the mitoribosome as target in aminoglycoside ototoxicity. Proceedings of the National Academy of Sciences 2008;105(52):20888-20893.
(269) Davies J, Gorini L, Davis BD. Misreading of RNA codewords induced by aminoglycoside antibiotics. Mol Pharmacol 1965;1(1):93-106.
(270) Edelmann P, Gallant J. Mistranslation in E. coli. Cell 1977;10(1):131-137.
(271) Dietz HC. New therapeutic approaches to mendelian disorders. N Engl J Med 2010;363(9):852-863.
(272) Linde L, Kerem B. Introducing sense into nonsense in treatments of human genetic diseases. Trends in genetics 2008;24(11):552-563.
(273) Keeling KM, Bedwell DM. Recoding therapies for genetic diseases. Recoding: Expansion of Decoding Rules Enriches Gene Expression: Springer; 2010. p. 123-146.
(274) Recht MI, Douthwaite S, Puglisi JD. Basis for prokaryotic specificity of action of aminoglycoside antibiotics. EMBO J 1999;18(11):3133-3138.
(275) Lynch SR, Puglisi JD. Structural origins of aminoglycoside specificity for prokaryotic ribosomes. J Mol Biol 2001;306(5):1037-1058.
(276) Fan-Minogue H, Bedwell DM. Eukaryotic ribosomal RNA determinants of aminoglycoside resistance and their role in translational fidelity. RNA 2008;14(1):148-157.
(277) Salas-Marco J, Bedwell DM. Discrimination between defects in elongation fidelity and termination efficiency provides mechanistic insights into translational readthrough. J Mol Biol 2005;348(4):801-815.
(278) Korostelev A, Ermolenko DN, Noller HF. Structural dynamics of the ribosome. Curr Opin Chem Biol 2008;12(6):674-683.
(279) Shalev M, Baasov T. When proteins start to make sense: fine-tuning of aminoglycosides for PTC suppression therapy. MedChemComm 2014;5(8):1092-1105.
(280) Carter AP, Clemons WM, Brodersen DE, Morgan-Warren RJ, Wimberly BT, Ramakrishnan V. Functional insights from the structure of the 30S ribosomal subunit and its interactions with antibiotics. Nature 2000;407(6802):340-348.

256
(281) Ogle JM, Brodersen DE, Clemons WM, Tarry MJ, Carter AP, Ramakrishnan V. Recognition of cognate transfer RNA by the 30S ribosomal subunit. Science 2001;292(5518):897-902.
(282) Frolova L, Le Goff X, Rasmussen HH, Cheperegin S, Drugeon G, Kress M, et al. A highly conserved eukaryotic protein family possessing properties of polypeptide chain release factor. Nature 1994;372(6507):701-703.
(283) Scolnick EM, Caskey CT. Peptide chain termination, V. The role of release factors in mRNA terminator codon recognition. Proceedings of the National Academy of Sciences 1969;64(4):1235-1241.
(284) Laurberg M, Asahara H, Korostelev A, Zhu J, Trakhanov S, Noller HF. Structural basis for translation termination on the 70S ribosome. Nature 2008;454(7206):852-857.
(285) Brown A, Shao S, Murray J, Hegde RS, Ramakrishnan V. Structural basis for stop codon recognition in eukaryotes. Nature 2015;524(7566):493-496.
(286) Kondo J, Urzhumtsev A, Westhof E. Two conformational states in the crystal structure of the Homo sapiens cytoplasmic ribosomal decoding A site. Nucleic Acids Res 2006;34(2):676-685.
(287) Kondo J, Westhof E. The bacterial and mitochondrial ribosomal A-site molecular switches possess different conformational substates. Nucleic Acids Res 2008;36(8):2654-2666.
(288) Youngman EM, He SL, Nikstad LJ, Green R. Stop codon recognition by release factors induces structural rearrangement of the ribosomal decoding center that is productive for peptide release. Mol Cell 2007;28(4):533-543.
(289) Shalev M, Kondo J, Kopelyanskiy D, Jaffe CL, Adir N, Baasov T. Identification of the molecular attributes required for aminoglycoside activity against Leishmania. Proceedings of the National Academy of Sciences 2013;110(33):13333-13338.
(290) Demeshkina N, Jenner L, Westhof E, Yusupov M, Yusupova G. A new understanding of the decoding principle on the ribosome. Nature 2012;484(7393):256-259.
(291) Mingeot-Leclercq M, Tulkens PM. Aminoglycosides: nephrotoxicity. Antimicrob Agents Chemother 1999;43(5):1003-1012.
(292) Selimoglu E. Aminoglycoside-induced ototoxicity. Curr Pharm Des 2007;13(1):119-126.

257
(293) Lopez-Novoa JM, Quiros Y, Vicente L, Morales AI, Lopez-Hernandez FJ. New insights into the mechanism of aminoglycoside nephrotoxicity: an integrative point of view. Kidney Int 2011;79(1):33-45.
(294) El Mouedden M, Laurent G, Mingeot-Leclercq M, Taper HS, Cumps J, Tulkens PM. Apoptosis in renal proximal tubules of rats treated with low doses of aminoglycosides. Antimicrob Agents Chemother 2000;44(3):665-675.
(295) Huth ME, Ricci AJ, Cheng AG. Mechanisms of aminoglycoside ototoxicity and targets of hair cell protection. International journal of otolaryngology 2011;2011(937861).
(296) N Abi-Hachem R, Zine A, R Van De Water, Thomas. The injured cochlea as a target for inflammatory processes, initiation of cell death pathways and application of related otoprotective strategies. Recent patents on CNS drug discovery 2010;5(2):147-163.
(297) llsø Christensen E, Birn H, Verroust P, Moestrup SK. Membrane receptors for endocytosis in the renal proximal tubule. International review of cytology: Elsevier; 1998. p. 237-284.
(298) Mizuta K, Saito A, Watanabe T, Nagura M, Arakawa M, Shimizu F, et al. Ultrastructural localization of megalin in the rat cochlear duct. Hear Res 1999;129(1-2):83-91.
(299) Konig O, Ruttiger L, Muller M, Zimmermann U, Erdmann B, Kalbacher H, et al. Estrogen and the inner ear: megalin knockout mice suffer progressive hearing loss. The FASEB Journal 2008;22(2):410-417.
(300) Lesniak W, Mc Laren J, Harris WR, Pecoraro VL, Schacht J. An isocratic separation of underivatized gentamicin components, 1H NMR assignment and protonation pattern. Carbohydr Res 2003;338(24):2853-2862.
(301) Giuliano RA, Paulus GJ, Verpooten GA, Pattyn VM, Pollet DE, Nouwen EJ, et al. Recovery of cortical phospholipidosis and necrosis after acute gentamicin loading in rats. Kidney Int 1984;26(6):838-847.
(302) Regec AL, Trump BF, Trifilis AL. Effect of gentamicin on the lysosomal system of cultured human proximal tubular cells: Endocytotic activity, lysosomal pH and membrane fragility. Biochem Pharmacol 1989;38(15):2527-2534.
(303) Schacht J. Antioxidant therapy attenuates aminoglycoside-induced hearing loss. Ann N Y Acad Sci 1999;884:125-130.

258
(304) Wu W, Sha S, Schacht J. Recent advances in understanding aminoglycoside ototoxicity and its prevention. Audiology and Neurotology 2002;7(3):171-174.
(305) Priuska EM, Clark-Baldwin K, Pecoraro VL, Schacht J. NMR studies of iron-gentamicin complexes and the implications for aminoglycoside toxicity. Inorg Chim Acta 1998;273(1-2):85-91.
(306) Simmons CF, Bogusky RT, Humes HD. Inhibitory effects of gentamicin on renal mitochondrial oxidative phosphorylation. J Pharmacol Exp Ther 1980;214(3):709-15.
(307) Walker PD, Shah SV. Gentamicin enhanced production of hydrogen peroxide by renal cortical mitochondria. American Journal of Physiology-Cell Physiology 1987;253(4):C495-C499.
(308) Estivill X, Govea N, Barceló A, Perelló E, Badenas C, Romero E, et al. Familial progressive sensorineural deafness is mainly due to the mtDNA A1555G mutation and is enhanced by treatment with aminoglycosides. The American Journal of Human Genetics 1998;62(1):27-35.
(309) Zhao H, Li R, Wang Q, Yan Q, Deng J, Han D, et al. Maternally inherited aminoglycoside-induced and nonsyndromic deafness is associated with the novel C1494T mutation in the mitochondrial 12S rRNA gene in a large Chinese family. The American Journal of Human Genetics 2004;74(1):139-152.
(310) Howard M, Frizzell RA, Bedwell DM. Aminoglycoside antibiotics restore CFTR function by overcoming premature stop mutations. Nat Med 1996;2(4):467-469.
(311) Bedwell DM, Kaenjak A, Benos DJ, Bebok Z, Bubien JK, Hong J, et al. Suppression of a CFTR premature stop mutation in a bronchial epithelial cell line. Nat Med 1997;3(11):1280-1284.
(312) Nudelman I, Rebibo-Sabbah A, Shallom-Shezifi D, Hainrichson M, Stahl I, Ben-Yosef T, et al. Redesign of aminoglycosides for treatment of human genetic diseases caused by premature stop mutations. Bioorg Med Chem Lett 2006;16(24):6310-6315.
(313) Nudelman I, Rebibo-Sabbah A, Cherniavsky M, Belakhov V, Hainrichson M, Chen F, et al. Development of novel aminoglycoside (NB54) with reduced toxicity and enhanced suppression of disease-causing premature stop mutations. J Med Chem 2009;52(9):2836-2845.
(314) Nudelman I, Glikin D, Smolkin B, Hainrichson M, Belakhov V, Baasov T. Repairing faulty genes by aminoglycosides: development of new derivatives of geneticin (G418) with enhanced suppression of diseases-causing nonsense mutations. Bioorg Med Chem 2010;18(11):3735-3746.

259
(315) Kandasamy J, Atia-Glikin D, Belakhov V, Baasov T. Repairing faulty genes by aminoglycosides: Identification of new pharmacophore with enhanced suppression of disease-causing nonsense mutations. MedChemComm 2011;2(3):165-171.
(316) Kandasamy J, Atia-Glikin D, Shulman E, Shapira K, Shavit M, Belakhov V, et al. Increased selectivity toward cytoplasmic versus mitochondrial ribosome confers improved efficiency of synthetic aminoglycosides in fixing damaged genes: a strategy for treatment of genetic diseases caused by nonsense mutations. J Med Chem 2012;55(23):10630-10643.
(317) Sabbavarapu NM, Shavit M, Degani Y, Smolkin B, Belakhov V, Baasov T. Design of novel aminoglycoside derivatives with enhanced suppression of diseases-causing nonsense mutations. ACS medicinal chemistry letters 2016;7(4):418-423.
(318) Bidou L, Bugaud O, Belakhov V, Baasov T, Namy O. Characterization of new-generation aminoglycoside promoting premature termination codon readthrough in cancer cells. RNA biology 2017;14(3):378-388.
(319) A Phase 2 Study to Evaluate the Safety, Tolerability, PK and PD of ELX-02 in Cystic Fibrosis Patients With G542X Allele. Available at: https://ClinicalTrials.gov/show/NCT04135495.
(320) A Phase 2 Study of ELX-02 in Patients With Nephropathic Cystinosis. Available at: https://ClinicalTrials.gov/show/NCT04069260.
(321) A Phase 2 Study to Evaluate the Safety, Tolerability, PK and PD in Cystic Fibrosis Patients With at Least 1 G542X Allele. Available at: https://ClinicalTrials.gov/show/NCT04126473.
(322) Sabbavarapu NM, Pieńko T, Zalman B, Trylska J, Baasov T. Exploring eukaryotic versus prokaryotic ribosomal RNA recognition with aminoglycoside derivatives. MedChemComm 2018;9(3):503-508.
(323) Auld DS, Thorne N, Maguire WF, Inglese J. Mechanism of PTC124 activity in cell-based luciferase assays of nonsense codon suppression. Proceedings of the National Academy of Sciences 2009;106(9):3585-3590.
(324) Auld DS, Lovell S, Thorne N, Lea WA, Maloney DJ, Shen M, et al. Molecular basis for the high-affinity binding and stabilization of firefly luciferase by PTC124. Proceedings of the National Academy of Sciences 2010;107(11):4878-4883.
(325) Dranchak PK, Di Pietro E, Snowden A, Oesch N, Braverman NE, Steinberg SJ, et al. Nonsense suppressor therapies rescue peroxisome lipid metabolism and assembly in cells from patients with specific PEX gene mutations. J Cell Biochem 2011;112(5):1250-1258.

260
(326) Brumm H, Mühlhaus J, Bolze F, Scherag S, Hinney A, Hebebrand J, et al. Rescue of melanocortin 4 receptor (MC4R) nonsense mutations by aminoglycoside‐mediated read‐through. Obesity 2012;20(5):1074-1081.
(327) McElroy SP, Nomura T, Torrie LS, Warbrick E, Gartner U, Wood G, et al. A lack of premature termination codon read-through efficacy of PTC124 (Ataluren) in a diverse array of reporter assays. PLoS Biol 2013;11(6):e1001593.
(328) Du M, Liu X, Welch EM, Hirawat S, Peltz SW, Bedwell DM. PTC124 is an orally bioavailable compound that promotes suppression of the human CFTR-G542X nonsense allele in a CF mouse model. Proceedings of the National Academy of Sciences 2008;105(6):2064-2069.
(329) Goldmann T, Overlack N, Möller F, Belakhov V, van Wyk M, Baasov T, et al. A comparative evaluation of NB30, NB54 and PTC124 in translational read‐through efficacy for treatment of an USH1C nonsense mutation. EMBO molecular medicine 2012;4(11):1186-1199.
(330) Sarkar C, Zhang Z, Mukherjee AB. Stop codon read-through with PTC124 induces palmitoyl-protein thioesterase-1 activity, reduces thioester load and suppresses apoptosis in cultured cells from INCL patients. Mol Genet Metab 2011;104(3):338-345.
(331) Roy B, Friesen WJ, Tomizawa Y, Leszyk JD, Zhuo J, Johnson B, et al. Ataluren stimulates ribosomal selection of near-cognate tRNAs to promote nonsense suppression. Proceedings of the National Academy of Sciences 2016;113(44):12508-12513.
(332) Salian S, Matt T, Akbergenov R, Harish S, Meyer M, Duscha S, et al. Structure-activity relationships among the kanamycin aminoglycosides: role of ring I hydroxyl and amino groups. Antimicrob Agents Chemother 2012;56(12):6104-6108.
(333) Konstan MW, VanDevanter DR, Rowe SM, Wilschanski M, Kerem E, Sermet-Gaudelus I, et al. Efficacy and safety of ataluren in patients with nonsense-mutation cystic fibrosis not receiving chronic inhaled aminoglycosides: the international, randomized, double-blind, placebo-controlled Ataluren Confirmatory Trial in Cystic Fibrosis (ACT CF). Journal of Cystic Fibrosis 2020;19(4):595-601.
(334) Pibiri I, Lentini L, Tutone M, Melfi R, Pace A, Di Leonardo A. Exploring the readthrough of nonsense mutations by non-acidic Ataluren analogues selected by ligand-based virtual screening. Eur J Med Chem 2016;122:429-435.
(335) Pibiri I, Lentini L, Melfi R, Tutone M, Baldassano S, Galluzzo PR, et al. Rescuing the CFTR protein function: Introducing 1, 3, 4-oxadiazoles as translational readthrough inducing drugs. Eur J Med Chem 2018;159:126-142.

261
(336) Campofelice A, Lentini L, Di Leonardo A, Melfi R, Tutone M, Pace A, et al. Strategies against nonsense: oxadiazoles as translational readthrough-inducing drugs (TRIDs). International journal of molecular sciences 2019;20(13):3329.
(337) Baradaran-Heravi A, Balgi AD, Zimmerman C, Choi K, Shidmoossavee FS, Tan JS, et al. Novel small molecules potentiate premature termination codon readthrough by aminoglycosides. Nucleic Acids Res 2016;44(14):6583-6598.
(338) Ferguson MW, Gerak CA, Chow CC, Rastelli EJ, Elmore KE, Stahl F, et al. The antimalarial drug mefloquine enhances TP53 premature termination codon readthrough by aminoglycoside G418. PloS One 2019;14(5):e0216423.
(339) Seoighe C, Gehring C. Heritability in the efficiency of nonsense-mediated mRNA decay in humans. PLoS One 2010;5(7):e11657.
(340) Maquat LE, Tarn W, Isken O. The pioneer round of translation: features and functions. Cell 2010;142(3):368-374.
(341) Kurosaki T, Popp MW, Maquat LE. Quality and quantity control of gene expression by nonsense-mediated mRNA decay. Nature reviews Molecular cell biology 2019;20(7):406-420.
(342) Usuki F, Yamashita A, Higuchi I, Ohnishi T, Shiraishi T, Osame M, et al. Inhibition of nonsense-mediated mRNA decay rescues the phenotype in Ullrich's disease. Annals of Neurology: Official Journal of the American Neurological Association and the Child Neurology Society 2004;55(5):740-744.
(343) Martin L, Grigoryan A, Wang D, Wang J, Breda L, Rivella S, et al. Identification and characterization of small molecules that inhibit nonsense-mediated RNA decay and suppress nonsense p53 mutations. Cancer Res 2014;74(11):3104-3113.
(344) Durand S, Cougot N, Mahuteau-Betzer F, Nguyen C, Grierson DS, Bertrand E, et al. Inhibition of nonsense-mediated mRNA decay (NMD) by a new chemical molecule reveals the dynamic of NMD factors in P-bodies. J Cell Biol 2007;178(7):1145-1160.
(345) Keeling KM, Wang D, Dai Y, Murugesan S, Chenna B, Clark J, et al. Attenuation of nonsense-mediated mRNA decay enhances in vivo nonsense suppression. PloS One 2013;8(4):e60478.
(346) Li S, Wilkinson MF. Nonsense surveillance in lymphocytes? Immunity 1998;8(2):135-141.
(347) Lew JE, Enomoto S, Berman J. Telomere length regulation and telomeric chromatin require the nonsense-mediated mRNA decay pathway. Mol Cell Biol 1998;18(10):6121-6130.
262
(348) Kuang L, Hashimoto K, Huang EJ, Gentry MS, Zhu H. Frontotemporal dementia nonsense mutation of progranulin rescued by aminoglycosides. Hum Mol Genet 2020;29(4):624-634.
(349) Zolotukhin S, Byrne BJ, Mason E, Zolotukhin I, Potter M, Chesnut K, et al. Recombinant adeno-associated virus purification using novel methods improves infectious titer and yield. Gene Ther 1999;6(6):973-985.
(350) Frew J, Wu X, Hsiung GY, Feldman HH, Mackenzie IR, Nygaard HB. Generation of an induced pluripotent stem cell line (UBCi001-A) from a presymptomatic individual carrying the R418X progranulin gene mutation. Stem Cell Research 2019;41:101582.
(351) Rose SE, Frankowski H, Knupp A, Berry BJ, Martinez R, Dinh SQ, et al. Leptomeninges-derived induced pluripotent stem cells and directly converted neurons from autopsy cases with varying neuropathologic backgrounds. Journal of Neuropathology & Experimental Neurology 2018;77(5):353-360.
(352) Bardy C, Van Den Hurk M, Eames T, Marchand C, Hernandez RV, Kellogg M, et al. Neuronal medium that supports basic synaptic functions and activity of human neurons in vitro. Proceedings of the National Academy of Sciences 2015;112(20):2725.
(353) Jacobi AM, Rettig GR, Turk R, Collingwood MA, Zeiner SA, Quadros RM, et al. Simplified CRISPR tools for efficient genome editing and streamlined protocols for their delivery into mammalian cells and mouse zygotes. Methods 2017;121-122:16-28.
(354) Young K, Morrison H. Quantifying microglia morphology from photomicrographs of immunohistochemistry prepared tissue using ImageJ. JoVE (Journal of Visualized Experiments) 2018(136):e57648.
(355) Kim J, Grunke SD, Levites Y, Golde TE, Jankowsky JL. Intracerebroventricular viral injection of the neonatal mouse brain for persistent and widespread neuronal transduction. JoVE (Journal of Visualized Experiments) 2014(91):e51863.
(356) DeVos SL, Miller TM. Direct intraventricular delivery of drugs to the rodent central nervous system. JoVE (Journal of Visualized Experiments) 2013(75):e50326.
(357) Louis N, Evelegh C, Graham FL. Cloning and sequencing of the cellular–viral junctions from the human adenovirus type 5 transformed 293 cell line. Virology 1997;233(2):423-429.
(358) Lin Y, Boone M, Meuris L, Lemmens I, Van Roy N, Soete A, et al. Genome dynamics of the human embryonic kidney 293 lineage in response to cell biology manipulations. Nature communications 2014;5(1):1-12.

263
(359) Passini MA, Wolfe JH. Widespread gene delivery and structure-specific patterns of expression in the brain after intraventricular injections of neonatal mice with an adeno-associated virus vector. J Virol 2001;75(24):12382-12392.
(360) Meng F, Han Y, Srisai D, Belakhov V, Farias M, Xu Y, et al. New inducible genetic method reveals critical roles of GABA in the control of feeding and metabolism. Proceedings of the National Academy of Sciences 2016;113(13):3645-3650.
(361) Merritt JK, Collins BE, Erickson KR, Dong H, Neul JL. Pharmacological readthrough of R294X Mecp2 in a novel mouse model of Rett Syndrome. Hum Mol Genet 2020;29(15):2461–2470.
(362) Vorbrodt AW, Lossinsky AS, Wisniewski HM. Localization of alkaline phosphatase activity in endothelia of developing and mature mouse blood-brain barrier. Dev Neurosci 1986;8(1):1-13.
(363) Hu K. All roads lead to induced pluripotent stem cells: the technologies of iPSC generation. Stem cells and development 2014;23(12):1285-1300.
(364) Borgohain MP, Haridhasapavalan KK, Dey C, Adhikari P, Thummer RP. An insight into DNA-free reprogramming approaches to generate integration-free induced pluripotent stem cells for prospective biomedical applications. Stem Cell Reviews and Reports 2019;15(2):286-313.
(365) Götz M, Huttner WB. The cell biology of neurogenesis. Nature reviews Molecular cell biology 2005;6(10):777-788.
(366) Jinek M, Chylinski K, Fonfara I, Hauer M, Doudna JA, Charpentier E. A programmable dual-RNA–guided DNA endonuclease in adaptive bacterial immunity. Science 2012;337(6096):816-821.
(367) Roy B, Leszyk JD, Mangus DA, Jacobson A. Nonsense suppression by near-cognate tRNAs employs alternative base pairing at codon positions 1 and 3. Proceedings of the National Academy of Sciences 2015;112(10):3038-3043.
(368) Theocharatos S, Wilkinson DJ, Darling S, Wilm B, Kenny SE, Edgar D. Regulation of progenitor cell proliferation and neuronal differentiation in enteric nervous system neurospheres. PloS One 2013;8(1):e54809.
(369) Floquet C, Deforges J, Rousset J, Bidou L. Rescue of non-sense mutated p53 tumor suppressor gene by aminoglycosides. Nucleic Acids Res 2010;39(8):3350-3362.
(370) Keeling KM, Lanier J, Du M, Salas-Marco J, Gao L, Kaenjak-Angeletti A, et al. Leaky termination at premature stop codons antagonizes nonsense-mediated mRNA decay in S. cerevisiae. RNA 2004;10(4):691-703.

264
(371) Wils H, Kleinberger G, Pereson S, Janssens J, Capell A, Van Dam D, et al. Cellular ageing, increased mortality and FTLD‐TDP‐associated neuropathology in progranulin knockout mice. J Pathol 2012;228(1):67-76.
(372) Tsuji H, Nonaka T, Yamashita M, Masuda-Suzukake M, Kametani F, Akiyama H, et al. Epitope mapping of antibodies against TDP-43 and detection of protease-resistant fragments of pathological TDP-43 in amyotrophic lateral sclerosis and frontotemporal lobar degeneration. Biochem Biophys Res Commun 2012;417(1):116-121.
(373) Fujita K, Chen X, Homma H, Tagawa K, Amano M, Saito A, et al. Targeting Tyro3 ameliorates a model of PGRN-mutant FTLD-TDP via tau-mediated synaptic pathology. Nature communications 2018;9(1):433.
(374) Damani MR, Zhao L, Fontainhas AM, Amaral J, Fariss RN, Wong WT. Age‐related alterations in the dynamic behavior of microglia. Aging cell 2011;10(2):263-276.
(375) Guerin K, Gregory-Evans CY, Hodges MD, Moosajee M, Mackay DS, Gregory-Evans K, et al. Systemic aminoglycoside treatment in rodent models of retinitis pigmentosa. Exp Eye Res 2008;87(3):197-207.
(376) Beel S, Herdewyn S, Fazal R, De Decker M, Moisse M, Robberecht W, et al. Progranulin reduces insoluble TDP-43 levels, slows down axonal degeneration and prolongs survival in mutant TDP-43 mice. Molecular neurodegeneration 2018;13(1):55.
(377) Guttikonda SR, Sikkema L, Tchieu J, Saurat N, Walsh RM, Harschnitz O, et al. Fully defined human pluripotent stem cell-derived microglia and tri-culture system model C3 production in Alzheimer’s disease. Nat Neurosci 2021:1-12.
(378) Chiba S, Matsuwaki T, Yamanouchi K, Nishihara M. Alteration in anxiety with relation to the volume of the locus ceruleus in progranulin-deficient mice. Journal of reproduction and development 2009;55(5):518-522.
(379) Suzuki M, Lee H, Kayasuga Y, Chiba S, Nedachi T, Matsuwaki T, et al. Roles of progranulin in sexual differentiation of the developing brain and adult neurogenesis. Journal of Reproduction and Development 2009;55(4):351-355.
(380) Guillamón A, de Blas MR, Segovia S. Effects of sex steroids on the development of the locus coeruleus in the rat. Dev Brain Res 1988;40(2):306-310.
(381) McCall JG, Al-Hasani R, Siuda ER, Hong DY, Norris AJ, Ford CP, et al. CRH engagement of the locus coeruleus noradrenergic system mediates stress-induced anxiety. Neuron 2015;87(3):605-620.
(382) Monami G, Emiliozzi V, Bitto A, Lovat F, Xu S, Goldoni S, et al. Proepithelin regulates prostate cancer cell biology by promoting cell growth, migration, and

265
anchorage-independent growth. The American journal of pathology 2009;174(3):1037-1047.
(383) Bandey I, Chiou SH, Huang AP, Tsai JC, Tu PH. Progranulin promotes Temozolomide resistance of glioblastoma by orchestrating DNA repair and tumor stemness. Oncogene 2015;34(14):1853-1864.
(384) Birey F, Andersen J, Makinson CD, Islam S, Wei W, Huber N, et al. Assembly of functionally integrated human forebrain spheroids. Nature 2017;545(7652):54-59.