300Hz subthalamic oscillations in Parkinson's disease
11
300-Hz subthalamic oscillations in Parkinson’s disease G. Foffani, 1,2,4 * A. Priori, 1 * M. Egidi, 1 P. Rampini, 1 F. Tamma, 3 E. Caputo, 3 K. A. Moxon, 4 S. Cerutti 2 and S. Barbieri 1 1 Department of Neurological Sciences, Universita ` di Milano, IRCCS Ospedale Maggiore di Milano, 2 Department of Biomedical Engineering, Politecnico di Milano, 3 Department of Clinical Neurology, Ospedale San Paolo, Milano, Italy and 4 School of Biomedical Engineering, Science and Health Systems, Drexel University, Philadelphia, PA, USA Correspondence to: Professor Alberto Priori, Dipartimento di Scienze Neurologiche, Clinica Neurologica, Padiglione Ponti, Ospedale Maggiore Policlinico, Via F. Sforza 35, Milano, 20122, Italy E-mail: [email protected] *These two authors equally contributed to this work. Summary Despite several studies and models, much remains unclear about how the human basal ganglia operate. Deep brain stimulation (DBS) of the subthalamic nucleus (STN) is an effective treatment for complicated Parkinson’s disease, but how DBS acts also remains unknown. The clinical benefit of DBS at frequencies >100 Hz suggests the possible importance of neural rhythms operating at frequencies higher than the range normally considered for basal ganglia processing (<100 Hz). The electrodes implanted for DBS also offer the opportunity to record neural activity from the human basal ganglia. This study aimed to assess whether oscil- lations at frequencies >100 Hz operate in the human STN. While recording local field potentials from the STN of nine patients with Parkinson’s disease through DBS electrodes, we found a dopamine- and movement- dependent 300-Hz rhythm. At rest, and in the absence of dopaminergic medication, in most cases (eight out of 11 nuclei) the 100–1000 Hz band showed no consistent rhythm. Levodopa administration elicited (or markedly increased) a 300-Hz rhythm at rest [(mean 6 SD) cen- tral frequency: 319 6 33 Hz; bandwidth: 72 6 21 Hz; power increase (after medication – before medication)/ before medication: 1.30 6 1.25; n = 11, P = 0.00098]. The 300-Hz rhythm was also increased by apomor- phine, but not by orphenadrine. The 300-Hz rhythm was modulated by voluntary movement. Before levo- dopa administration, movement-related power increase in the 300-Hz rhythm was variably present in different subjects, whereas after levodopa it became a robust phenomenon [before 0.014 6 0.014 arbitrary units (AU), after 0.178 6 0.339 AU; n = 8, P = 0.0078]. The dopamine-dependent 300-Hz rhythm probably reflects a bistable compound nuclear activity and supports high- resolution information processing in the basal ganglia circuit. An absent 300-Hz subthalamic rhythm could be a pathophysiological clue in Parkinson’s disease. The 300-Hz rhythm also provides the rationale for an excita- tory—and not only inhibitory—interpretation of DBS mechanism of action in humans. Keywords: deep brain stimulation; event-related synchronization; high frequency; levodopa; subthalamus Abbreviations: DBS = deep brain stimulation; ERS = event-related synchronization; LFP = local field potential; SN = substantia nigra; STN = subthalamic nucleus; UPDRS = unified Parkinson’s disease rating scale Introduction About 80 years ago Kinnear Wilson referred to the basal ganglia as ‘the dark basement of the brain’ (Wilson, 1925). Despite enormous progress achieved by experimental studies and functional models (Wichmann and DeLong, 1996), still little is known about the signals controlling information processing and integration in the basal ganglia of living humans. Neuronal rhythms, i.e. oscillatory activities, play a key role in brain information processing (Gray, 1994) at multiple scales, from subcellular regulation (Goldbeter, 2002) to network integration (Varela et al., 2001). The importance of neuronal rhythms in the basal ganglia circuit has been demonstrated in animal studies in vitro (Bevan and Wilson, 1999; Plenz and Kital, 1999) and in vivo (Bergman et al., Brain 126 ª Guarantors of Brain 2003; all rights reserved DOI: 10.1093/brain/awg229 Advanced Access publication August 21, 2003 Brain (2003), 126, 2153–2163 by guest on May 24, 2014 http://brain.oxfordjournals.org/ Downloaded from
Transcript of 300Hz subthalamic oscillations in Parkinson's disease

300-Hz subthalamic oscillations in Parkinson'sdisease
G. Foffani,1,2,4* A. Priori,1* M. Egidi,1 P. Rampini,1 F. Tamma,3 E. Caputo,3 K. A. Moxon,4
S. Cerutti2 and S. Barbieri1
1Department of Neurological Sciences, UniversitaÁ di
Milano, IRCCS Ospedale Maggiore di Milano,2Department of Biomedical Engineering, Politecnico di
Milano, 3Department of Clinical Neurology, Ospedale
San Paolo, Milano, Italy and 4School of Biomedical
Engineering, Science and Health Systems,
Drexel University, Philadelphia, PA, USA
Correspondence to: Professor Alberto Priori, Dipartimento
di Scienze Neurologiche, Clinica Neurologica, Padiglione
Ponti, Ospedale Maggiore Policlinico, Via F. Sforza 35,
Milano, 20122, Italy
E-mail: [email protected]
*These two authors equally contributed to this work.
SummaryDespite several studies and models, much remainsunclear about how the human basal ganglia operate.Deep brain stimulation (DBS) of the subthalamicnucleus (STN) is an effective treatment for complicatedParkinson's disease, but how DBS acts also remainsunknown. The clinical bene®t of DBS at frequencies>100 Hz suggests the possible importance of neuralrhythms operating at frequencies higher than the rangenormally considered for basal ganglia processing (<100Hz). The electrodes implanted for DBS also offer theopportunity to record neural activity from the humanbasal ganglia. This study aimed to assess whether oscil-lations at frequencies >100 Hz operate in the humanSTN. While recording local ®eld potentials from theSTN of nine patients with Parkinson's disease throughDBS electrodes, we found a dopamine- and movement-dependent 300-Hz rhythm. At rest, and in the absenceof dopaminergic medication, in most cases (eight out of11 nuclei) the 100±1000 Hz band showed no consistentrhythm. Levodopa administration elicited (or markedly
increased) a 300-Hz rhythm at rest [(mean 6 SD) cen-tral frequency: 319 6 33 Hz; bandwidth: 72 6 21 Hz;power increase (after medication ± before medication)/before medication: 1.30 6 1.25; n = 11, P = 0.00098].The 300-Hz rhythm was also increased by apomor-phine, but not by orphenadrine. The 300-Hz rhythmwas modulated by voluntary movement. Before levo-dopa administration, movement-related power increasein the 300-Hz rhythm was variably present in differentsubjects, whereas after levodopa it became a robustphenomenon [before 0.014 6 0.014 arbitrary units(AU), after 0.178 6 0.339 AU; n = 8, P = 0.0078]. Thedopamine-dependent 300-Hz rhythm probably re¯ects abistable compound nuclear activity and supports high-resolution information processing in the basal gangliacircuit. An absent 300-Hz subthalamic rhythm could bea pathophysiological clue in Parkinson's disease. The300-Hz rhythm also provides the rationale for an excita-toryÐand not only inhibitoryÐinterpretation of DBSmechanism of action in humans.
Keywords: deep brain stimulation; event-related synchronization; high frequency; levodopa; subthalamus
Abbreviations: DBS = deep brain stimulation; ERS = event-related synchronization; LFP = local ®eld potential; SN =
substantia nigra; STN = subthalamic nucleus; UPDRS = uni®ed Parkinson's disease rating scale
IntroductionAbout 80 years ago Kinnear Wilson referred to the basal
ganglia as `the dark basement of the brain' (Wilson, 1925).
Despite enormous progress achieved by experimental studies
and functional models (Wichmann and DeLong, 1996), still
little is known about the signals controlling information
processing and integration in the basal ganglia of living
humans.
Neuronal rhythms, i.e. oscillatory activities, play a key role
in brain information processing (Gray, 1994) at multiple
scales, from subcellular regulation (Goldbeter, 2002) to
network integration (Varela et al., 2001). The importance of
neuronal rhythms in the basal ganglia circuit has been
demonstrated in animal studies in vitro (Bevan and Wilson,
1999; Plenz and Kital, 1999) and in vivo (Bergman et al.,
Brain 126 ã Guarantors of Brain 2003; all rights reserved
DOI: 10.1093/brain/awg229 Advanced Access publication August 21, 2003 Brain (2003), 126, 2153±2163
by guest on May 24, 2014
http://brain.oxfordjournals.org/D
ownloaded from
1998). In humans, electrophysiological recordings of local
®eld potentials (LFPs) from patients implanted with elec-
trodes for deep brain stimulation (DBS) have so far revealed
the presence of various rhythms in the classic EEG frequency
range, from very low frequencies (<5 Hz) up to the gamma
range (30±80 Hz) (Brown et al., 2001; Marsden et al., 2001;
Pesenti et al., 2003). These studies showed the existence
within the basal ganglia circuit of multiple modes of
operation, observable as network activities oscillating at
different frequencies (Bevan et al., 2002; Levy et al., 2000).
The pathophysiological relevance of these network oscilla-
tions has been suggested by their dependency on dopaminer-
gic medication and on movement execution (Brown et al.,
2001; Cassidy et al., 2002; Foffani et al., 2002; Levy et al.,
2002; Priori et al., 2002). We reported that voluntary
movement modulates beta (~27 and ~17 Hz) oscillations in
the human subthalamic nucleus (STN) and globus pallidus
internus with a pattern of movement-related desynchroniza-
tion (i.e. power decrease) similar to the one observed at the
scalp over the primary motor area (Foffani et al., 2002; Priori
et al., 2002). Similar ®ndings were reported independently by
two other groups. Cassidy et al. (2002) studied the move-
ment-related changes in synchronization in the basal ganglia,
expanding the movement dependency we observed in the beta
range up to gamma frequencies (70±80 Hz); and Levy et al.
(2002) described the dependence of STN oscillations on
movement and dopamine, also showing that network oscil-
lations in LFPs are not necessarily re¯ected by the ®ring rates
of the single neurons.
DBS of the STN is an effective treatment for advanced
Parkinson's disease (Limousin et al., 1998; Dowsey-
Limousin and Pollak, 2001). Stimulation frequencies typ-
ically >100 Hz provide therapeutic ef®cacy (Moro et al.,
2002), similar to the lesion in the STN (Bergman et al.,
1990). Even though this parallel represents the rationale for
the inhibitory/suppressive interpretation of STN stimulation
(Limousin et al., 1995), the mechanism underlying the
therapeutic action of DBS remains unclear (Lozano et al.,
2002; Vitek, 2002); indeed, excitatory effects of DBS have
been proposed recently (Windels et al., 2000; Grill and
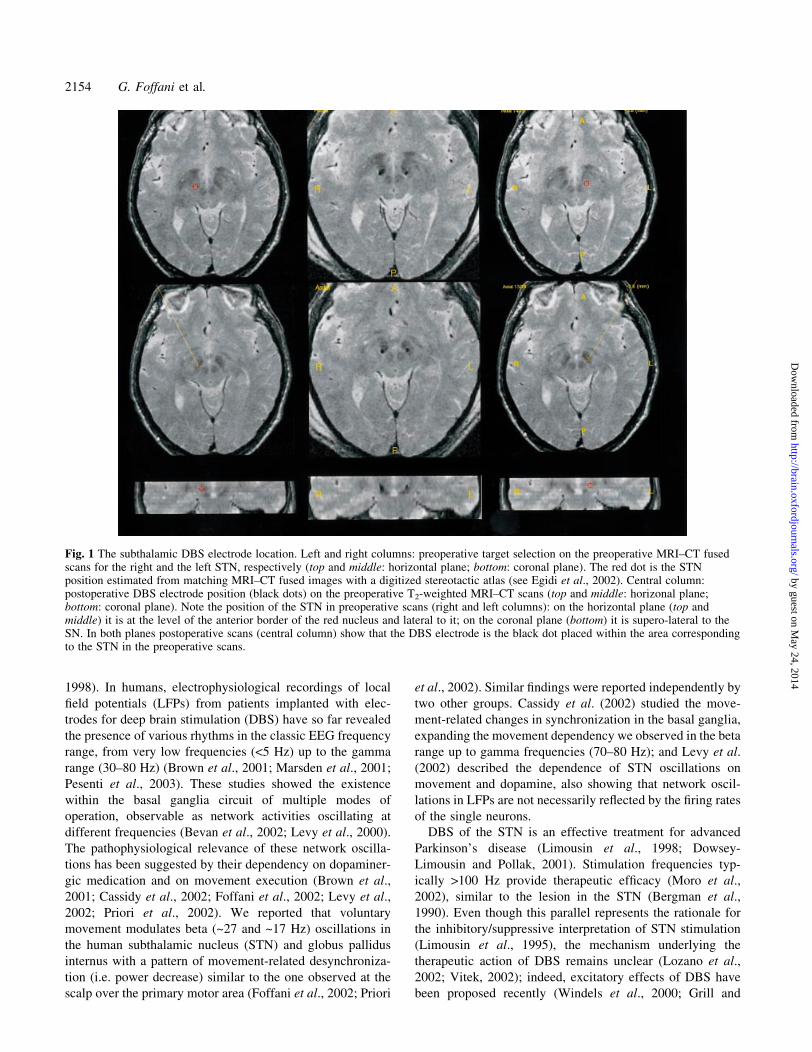
Fig. 1 The subthalamic DBS electrode location. Left and right columns: preoperative target selection on the preoperative MRI±CT fusedscans for the right and the left STN, respectively (top and middle: horizontal plane; bottom: coronal plane). The red dot is the STNposition estimated from matching MRI±CT fused images with a digitized stereotactic atlas (see Egidi et al., 2002). Central column:postoperative DBS electrode position (black dots) on the preoperative T2-weighted MRI±CT scans (top and middle: horizonal plane;bottom: coronal plane). Note the position of the STN in preoperative scans (right and left columns): on the horizontal plane (top andmiddle) it is at the level of the anterior border of the red nucleus and lateral to it; on the coronal plane (bottom) it is supero-lateral to theSN. In both planes postoperative scans (central column) show that the DBS electrode is the black dot placed within the area correspondingto the STN in the preoperative scans.
2154 G. Foffani et al.
by guest on May 24, 2014
http://brain.oxfordjournals.org/D
ownloaded from
McIntyre, 2001; Lozano et al., 2002; Vitek, 2002;
Hashimoto et al., 2003).
It is reasonable to hypothesize the existence of fast (>100
Hz) neuronal rhythms that would be driven by arti®cial
stimulation at their operating frequency. We therefore
recorded LFPs from DBS electrodes placed in the STN of
patients affected by Parkinson's disease searching for
oscillatory activities (i.e. spectral peaks using Fourier analy-
sis) in the frequency range of 100±1000 Hz. Two factors were
tested in order to assess the possible pathophysiological
relevance of these oscillations: (i) their pharmacological
modulation by levodopa (dopamine precursor), apomorphine
(dopamine agonist) or orphenadrine (anticholinergic); and (ii)
their modulation during voluntary movements.
Patients and methodsPatientsNine patients (®ve men, four women) with idiopathic
Parkinson's disease were studied after obtaining their
informed consent and local ethics committee approval. The
average age was 57 years (range 44±69), years of disease
history 16 (9±35), levodopa equivalent therapy before surgery
1455 mg (range 915±2000), Uni®ed Parkinson's Disease
Rating Scale (UPDRS) III (motor part) presurgery `OFF'
therapy 44.2 (27±63.5), `ON' therapy 6.8 (range 1±23.5),
UPDRS III 3 months after surgery OFF therapy ON
stimulation 6.6 (range 3±14; seven patients), UPDRS IV
(complications) before surgery 11.8 (range 6±17), UPDRS IV
3 months after surgery 4.3 (range 0±12; seven patients).
Neuroimaging and stereotactic targeting of theSTNThe STN was localized by direct visualization through an
MRI±CT fusion-based technique (Fig. 1) reported in detail
elsewhere (Egidi et al., 2002). The target position of the
recording electrodes was further assessed with intraoperative
microrecordings and stimulation through the probe micro-
electrodes. The 3389 electrode (Medtronic, Minneapolis, MN,
USA) was ultimately implanted for DBS. The electrode had
four cylindrical contacts (diameter 1.27 mm). Each of them
was 1.5 mm long, and was spaced 0.5 mm away from the
others (i.e. 2 mm centre to centre). Contacts were denomi-
nated 0, 1, 2 and 3 beginning from the more caudal placement.
The objective was to place contact 1 into the target position.
Double-blind assessment revealed marked clinical effects
during intra-operative monopolar macrostimulation through
contact 1. The ®nal location of the DBS electrode within the
STN was veri®ed on the postoperative T2-weighted MRI±CT
fused scan (Fig. 1). In all the patients included in this study for
STN recordings (14 sides from nine patients), contact 1 (and
consistently less contact 2) induced a remarkably greater
clinical effect (scored postoperatively by two independent
blind observers) than contacts 0 and 3. All of these procedures
taken together suggest that contact 1 was within or close to the
STN. We also included two further sides from two of the
above patients where contact 1 and 2 had little or no clinical
effectiveness and postoperative scans showed that the
electrodes were caudally shifted and their ®nal position was
in the substantia nigra (SN).
Postoperative recordingsThe postoperative recording sessions took place 2±3 days
after electrode implantation. The patients were comfortably
seated on an armchair. LFPs were recorded at rest and during
voluntary movements, 8±12 h after withdrawal of dopami-
nergic medication, before and after administration of 100±
200 mg oral fast-acting levodopa (Madopar Dispersibile;
Roche, Monza (MI), Italy) (11 STN and two SN at rest, eight
STN during movement execution) or 6 mg subcutaneous
apomorphine (Apo®n Stylo; Chiesi Farmaceutici, Parma,
Italy) [one STN at rest: AN R (AN is the patient and R
denotes right)] or 40 mg intramuscular orphenadrine (Disipal;
Yamanouchi Pharma, Carugate (MI), Italy) [two STN at rest:
PI R and PI L (PI is the patient, R denotes right and L denotes
left)]. After-medication recordings started 30±40 min after
drug administration, when the patient showed clinical
improvement. The latter was evaluated by an experienced
neurologist: levodopa and apomorphine reduced rigidity,
tremor and bradykinesia; orphenadrine improved mainly
rigidity and tremor. Most patients had some dyskinesias after
levodopa, but none before. Patients were instructed to extend
the second ®nger at the metacarpophalangeal joint from an
initial relaxed semi-¯exed position every 8±10 s as quickly as
possible [mean total movement time (6 SD) before levodopa
1.07 6 0.42 s, after levodopa 0.91 6 0.28 s]. Movements
were self-paced. One extension corresponded to one trial; the
mean (6 SD) number of artefact-free trials was 113 6 39
(range 67±165) before levodopa and 77 6 39 (range 15±133)
after. The task execution was interrupted either by the patient,
if tired, or after a block of 50 trials. Multiple blocks of trials
were usually recorded from each nucleus (range 2±3 before
levodopa, and range 1±6 after levodopa) separated by rest
periods to avoid fatigue. Dyskinesias, when present, did not
interfere with task execution. The EMG signal from the
extensor indicis muscle was recorded through a pair of
surface non-polarizable Ag/AgCl electrodes with a belly-
tendon montage. LFPs were captured from the contralateral
3389 electrode using two pairs of contact: closely spaced (1±
2) and widely spaced (0±3). Signals were pre-ampli®ed,
differentially ampli®ed and ®ltered (EMG, 20±1000 Hz;
STN, 2±1000 Hz) through a Cambridge 1902 (Cambridge
Electronic Design, Cambridge, UK), analogue/digital con-
verted (sampling rate 2500 Hz) through a Cambridge 1401
(Cambridge Electronic Design), on-line analysed on a
personal computer and stored by Signal software, version
1.80 (Cambridge Electronic Design). All further analysis was
conducted off-line with the MATLAB software, version 5.3
300-Hz STN oscillations in Parkinson's disease 2155
by guest on May 24, 2014
http://brain.oxfordjournals.org/D
ownloaded from
(The Mathworks, Natick, MA, USA) with custom-written
programs described below unless otherwise speci®ed.
Rest spectral analysisThe spectra of the STN LFPs were calculated for ~1 min at rest.
The Welch's averaged, modi®ed periodogram method was
used (Welch, 1967): the signal was divided into ~150 sections
of 1024 samples, with no overlap; each section was detrended
and windowed by a Hanning window; the magnitude squared
of the discrete Fourier transforms of the sections was averaged
to estimate the power spectral density of the signal. Only
spectral frequencies ranging from 100 to 1000 Hz were
considered. To compare data before and after medication, LFPs
were normalized by subtracting the mean and dividing by the
SD of the 600±1000 Hz band-pass ®ltered signals.
Parameter extractionIn order to evaluate the effect of drugs on the STN rest
spectrum, a relative spectrum was calculated for every STN
by dividing the spectrum after medication with the spectrum
before medication. To quantify the spectral properties of the
300-Hz rhythm (central frequency, area, height and width of
the peak), a curve was ®tted to the 100±1000 Hz relative
spectrum using the equation
y = y0 + [ A/(w ´ (p/2)1/2)] ´ exp(±2 ´ (x ± x0)2/w2),
where y0 is the baseline offset, A the total area under the curve
from the baseline, x0 the centre of the peak, and w
approximately 0.849 the width of the peak at half height.
The equation represents a Gaussian curve, like the normal
probability distribution function, where x0 would be the mean
and w/2 the SD. Non-linear least squares ®tting (Dennis,
1977) was performed with the Levenberg±Marquardt
algorithm (Levenberg, 1944; Marquardt, 1963) implemented
in Origin software, version 6.0 (Microcal Software Inc.,
Northampton, MA, USA). The goodness of ®t was evaluated
by two statistics: c2 and R2. c2 is de®ned as the sum of the
squares of the residuals, i.e. of the deviations of the theoretical
curve (the Gaussian) from the experimental points (the
relative spectrum), and it is minimized by the ®tting
procedure. R2 measures how successful the ®t is in explaining
the variation of the data, and it can be interpreted as the square
of the correlation between the experimental curve values and
the theoretical curve values. Therefore, good ®tting is
indicated by a c2 value that approaches zero and an R2
value that approaches one. The values obtained for the two
statistics (average 6 SD: R2 = 0.75 6 0.15, c2 = 0.017 60.010; n = 11; see Table 1) guaranteed that a Gaussian curve
was an accurate analytical description of the relative spectrum
(after/before medication) between 100±1000 Hz. The central
frequency (x0) and bandwidth (w) of the 300-Hz rhythm were
then calculated from the ®tted Gaussian curve. The effect of
levodopa on the 300-Hz rhythm was evaluated by testing the
null hypotheses that the median height (h = y evaluated in x0)
or area (A) of the Gaussian was equal to 0 using the Wilcoxon
signed rank test. This non-parametric test was used because of
the small sample size (n = 11). The central frequency and the
bandwidth were used to de®ne the band-pass ®lter for the
movement-related analysis (see below).
Movement onset±offset detectionThe movement onsets, which triggered the analysis, and
movement offsets, which allowed the estimate of movement
Table 1 Effect of levodopa on the 300-Hz rhythm at rest evaluated by ®tting the normalized 100±1000 Hz spectrum (afterlevodopa/before levodopa) with a Gaussian curve
Patient L or Rnucleus
c2 R2 Area Centre(Hz)
Width(Hz)
Height UPDRSIII OFF
UPDRSIII ON
DeltaUPDRS III
CO R 0.0106 0.8976 147.73 231.77 115.17 1.02 62 23.5 38.5BE R 0.0278 0.9145 186.77 335.20 64.65 2.31 49 1 48BE L 0.0118 0.6512 53.78 303.64 71.30 0.60 49 1 48PA R* 0.0437 0.9393 193.41 305.75 32.70 4.72 27 4.5 22.5PA L* 0.0103 0.8139 69.38 326.32 59.81 0.93 27 4.5 22.5MA R* 0.0128 0.6547 51.67 323.82 61.23 0.67 38.5 4 34.5MA L 0.0120 0.5087 38.06 304.04 79.42 0.38 38.5 4 34.5CR R 0.0195 0.8849 157.01 338.65 86.26 1.45 29 3.5 25.5CM L 0.0111 0.8450 77.92 340.60 56.57 1.10 45.5 4 41.5TO R 0.0145 0.5511 55.43 353.79 89.55 0.49 30.5 2.5 28TO L 0.0163 0.6518 68.42 341.93 81.29 0.67 30.5 2.5 28
Mean 0.0173 0.7557 99.96 318.68 72.54 1.30 38.77 5 33.77SD 0.0102 0.1555 58.74 33.42 21.48 1.25 11.42 6.26 9.36
The c2 and R2 coef®cients describing the goodness of ®t are reported, as well as the areas, centre, width and height of the ®tted Gaussian.Preoperative motor (III) UPDRS scores `OFF' and `ON' therapy, as well as their difference (delta = OFF ± ON) are also reported. Thereis no clear relationship between the UPDRS scores and the 300-Hz descriptors. Each row corresponds to a different STN and it isindicated with the identi®er of the patient followed by left nucleus (L) or right nucleus (R). Means and SDs are reported at the bottom ofthe table. *The nuclei in which the 300-Hz was already observable before levodopa administration.
2156 G. Foffani et al.
by guest on May 24, 2014
http://brain.oxfordjournals.org/D
ownloaded from

duration, were evaluated on the EMG signal as follows: (i) the
EMG signal was squared to obtain power; (ii) the mean of
the resulting signal was subtracted point-by-point; (iii) the
cumulative sum of the resulting signal was calculated and
then ®ltered using a moving average forward±backward (zero
phase) ®lter; (iv) the movement onsets were de®ned as the
local minima (the signal at the previous and at the next
instants is greater than the signal at the current instant) and
the offsets as the local maxima (the signal at the previous and
at the next instants is lower than the signal at the current
instant) in the ®ltered cumulative sum; and (v) signals were
visually inspected, and only epochs free from artefacts were
used for the analysis.
Movement-related analysisLFPs from the STN were ®rst normalized to their high-
frequency content (as described in `Rest spectral analysis')
and then ®ltered with a zero-phase ®nite impulse response
(forward±backward) band-pass ®lter. The band was de®ned
as the central frequency plus and minus half the bandwidth
calculated with the Gaussian ®tting of the relative spectra, as
described above. The ®ltered signals were then squared to
obtain power and averaged over trials. The average signals
were smoothed by subsampling to a ®nal 10-Hz sampling rate
after anti-aliasing zero-phase low-pass ®ltering. Changes in
the resulting signals were then detected by change-point
analysis (Taylor, 2000; Cassidy et al., 2002) using commer-
cial software (Change-Point Analyser 2.0 shareware program;
Taylor Enterprises, IL, USA). Only changes with a probability
of change >99% and 95% con®dence interval <800 ms were
considered, performing 10 000 bootstraps without replace-
ment. The average power before the onset change was
considered as `baseline power', and the average power after
the onset change less the baseline power was considered as
event-related synchronization (ERS) (Pfurtscheller and Lopes
da Silva, 1999) or `ERS power'. The signi®cance of levodopa
effect on baseline power, ERS power and on the ratio between
ERS and baseline powers was separately tested using the
Wilcoxon matched-pairs signed rank test. This non-para-
metric test was used because of the small sample size (n = 8).
Throughout the text, values are means 6 1 SD. A P-value
<0.05 was considered to indicate statistical signi®cance.
ResultsSearching for neural rhythms at frequencies >100 Hz, we
recorded LFPs from DBS electrodes in the human STN at rest
and during voluntary movement.
Rest spectral analysisAt rest, in the absence of dopaminergic medication, no
consistent rhythmic activity (i.e. spectral peak) was observed
between 100 and 1000 Hz (Fig. 2C and F). As well as
inducing a prompt clinical motor improvement comparable to
that before surgery (see UPDRS scores in the section
`Patients' and in Table 1), levodopa administration elicited
(in eight out of 11 nuclei, from seven patients), or markedly
increased (in three out of 11 nuclei) a subthalamic 300-Hz
rhythm at rest (Fig. 2C, G and H). Hence, in three out of 11
nuclei the 300-Hz rhythm was already present before
levodopa administration, and in the absence of dyskinesias.
The 300-Hz rhythm had a central frequency of 319 6 33 Hz
and a bandwidth of 72 6 21 Hz. Overall, the boosting effect
of levodopa on the 300-Hz rhythm in the human STN at rest
was highly signi®cant. Two parameters were used to support
this assertion: (i) the ®tted Gaussian height, which corres-
ponds to maximal percent increase spectral peak after
medication compared with before medication; and (ii) the
®tted Gaussian area, which corresponds to the integral of the
relative spectrum over the entire 100±1000 Hz spectrum, i.e.
a sort of total power increase of the 300-Hz rhythm in
arbitrary units. The average height was 1.30 6 1.25, where 0
represents the value before medication and 1 corresponds to
100% increase; the increase was signi®cantly different from
zero (Wilcoxon test; n = 11, P = 0.00098). The average area
was 99.96 6 58.73 arbitrary units (AU) and signi®cantly
differed from zero (Wilcoxon test; n = 11, P = 0.00098). The
area and the height in one nucleus were markedly higher than
the others (PA R; see Table 1). The average relative spectrum
[(after levodopa ± before levodopa)/before levodopa] is
shown in Fig. 2H. The results are detailed in Table 1. The
magnitude of the 300-Hz rhythm was compared with
frequencies <100 Hz, namely the 15±40 and 70±80 Hz
frequency bands. The peak power of the 300-Hz rhythm was
smaller than the 15±40 Hz peak power (average 300 Hz/15±
40 Hz power ratio = 0.23 6 0.19) and greater than the
70±80 Hz peak power (average 300 Hz/70±80 Hz power ratio
= 1.85 6 0.66).
To test the hypothesis that the 300-Hz rhythm was
dopamine dependent, and not exclusively levodopa depend-
ent, we studied the effect of subcutaneous apomorphine
administration (one nucleus). The drug reduced rigidity,
tremor and bradykinesia. Before apomorphine the 300-Hz
rhythm was barely detectable, after drug injection it markedly
increased: the ®tted Gaussian height was 0.53 (i.e. 53%
increase), the area was equal to 47 arbitrary units. The central
frequency of the peak was 298 Hz with a bandwidth of 71 Hz
(Fig. 2D).
To con®rm further the speci®c dopaminergic dependency
of the 300-Hz rhythm at rest, we studied changes in the
oscillatory activity induced by intramuscular administration
of orphenadrine, an anticholinergic drug (two nuclei).
Although orphenadrine improved rigidity and tremor, it did
not enhance the 300-Hz rhythm (Fig. 2E). Hence, despite the
possible variability of the responses to apomorphine and
orphenadrine and the small number of nuclei tested, the
®ndings with these two drugs support a dopaminergic
dependence of the 300-Hz rhythm.
Interestingly, the 300-Hz rhythm was always maximal in
the more closely spaced pair of contacts (1±2), but absent or
300-Hz STN oscillations in Parkinson's disease 2157
by guest on May 24, 2014
http://brain.oxfordjournals.org/D
ownloaded from

Fig. 2 Pharmacological modulation of the 300-Hz rhythm at rest. (A, B) One second of subthalamic LFP (A) before and (B) afterlevodopa administration. (C) Effect of levodopa on the 100±1000 Hz spectrum in one STN (BE R). (D) Effect of apomorphine (APO) onthe 100±1000 Hz spectrum in one STN (AN R). (E) Effect of orphenadrine (ORP) on the 100±1000 Hz spectrum in one STN (PI L). (C±E) Grey and black continuous lines represent data before and after medication; grey and black dotted lines are the correspondingcon®dence intervals (c.i.). (F, G) 100±1000 Hz spectrum of all 11 nuclei superimposed (F) before and (G) after levodopa administration.The y-axis is in logarithmic scale. (H) Levodopa-dependent increment of the 100±1000 Hz spectrum {[(post-levodopa) ± (pre-levodopa)]/[pre-levodopa]} expressed as a percentage and averaged over all 11 nuclei. (I) 100±1000 Hz spectrum of one STN (CM L) after levodopaadministration evaluated in the closely spaced contacts (1±2) and in the widely spaced contacts (0±3). (J) 100±1000 Hz spectrum of oneSN (CM R) before and after levodopa administration. a.u. = arbitrary units.
2158 G. Foffani et al.
by guest on May 24, 2014
http://brain.oxfordjournals.org/D
ownloaded from
reduced in the wider pair (0±3) (Fig. 2I). On average, after
levodopa administration the ratio between the 300-Hz power
in the closely spaced pair and the 300-Hz power in the wider
spaced pair (1±2/0±3) was 1.96 6 0.62 (Wilcoxon test; n = 7,
P = 0.0156). In addition, when the closely spaced pairs of
contacts (1±2) were supposedly in the SN (n = 2: CR L and
CM R), and hence outside the STN, we failed to detect the
300-Hz rhythm (Fig. 2J).
Movement-related power modulation of the 300-Hz oscillationsTo test whether voluntary movement modulated the 300-Hz
rhythm, we asked our patients to execute self-paced
contralateral second ®nger extensions during LFP recordings
from the STN (eight nuclei from six patients). When EMG
activity began, power in the 300-Hz rhythm increased; when
EMG activity ended, power returned to baseline values
(Fig. 3). The results are detailed in Table 2. The responses of
PA R are much higher than those of the other nuclei.
Before levodopa administration, the movement-related
power increase in the 300-Hz rhythm was variably present
in different subjects (signi®cant changes detected in four out
of eight nuclei); after levodopa it became a robust phenom-
enon (signi®cant changes in eight out of eight nuclei). As
shown in Table 2, levodopa administration signi®cantly
increased the baseline power of the 300-Hz rhythm (Wilcoxon
test; P = 0.0078), as well as the ERS power (Wilcoxon test;
P = 0.0078) and the ERS/baseline ratio (Wilcoxon test;
P = 0.0391). When the movement-related power increase of
the 300-Hz rhythm was already signi®cant before levodopa
administration, the phenomenon was enhanced by the
drug.
DiscussionThe spectrum of oscillatory activities in the human basal
ganglia is hence wider than known to date, spreading also to
unusually high frequencies, around 300 Hz. The 300-Hz
subthalamic oscillations in Parkinson's disease appear after
dopaminergic medication and their power increases during
voluntary movement.
300-Hz oscillations at restAt rest, the 300-Hz rhythm appears only when the patient is in
`ON' condition after levodopa or apomorphine, but not after
the anticholinergic drug. Hence dopaminergic medication in
parkinsonian patients speci®cally shifts the system to a new
dynamic equilibrium in which the human STN oscillates at a
characteristic frequency around 300 Hz. Three pieces of
evidence: (i) the fact that 15±40 Hz activity is decreased (and
not increased) by levodopa (Brown et al., 2001); (ii) the
greater peak power of the 300-Hz rhythm compared with 70±
80 Hz; and (iii) the absence of spectral peaks in harmonic
relationship around 100 or 150 Hz, argue against, though do
not exclude, the possibility of the 300-Hz rhythm being a
harmonic of lower frequencies.
Even though, for ethical and methodological reasons, we
did not systematically map the spatial distribution of the
300-Hz rhythm, the fact that 300-Hz oscillations are reduced
in the wider spaced pair of DBS contacts (0±3) compared with
the closely spaced ones (1±2) suggests that the 300-Hz
rhythm is probably located within or close to the STN. The
localization of the ®nding is also con®rmed by the fact that
300-Hz oscillations are not observable `out of target', outside
the STN (two SN). Nevertheless, the presence of 300-Hz
oscillations in other basal ganglia nuclei is possible.
Although in this paper 300 Hz is used as the reference
frequency, the range of the central frequencies of the 300-Hz
rhythm actually encompasses more than 100 Hz on the
frequency axis (from 232 to 354 Hz). This variability is not as
large as it might seem, considering that the bandwidth of the
300-Hz rhythm can be >100 Hz. The broad bandwidth of
high-frequency oscillations is in accordance with the uncer-
tainty principle expressed by the Heisenberg inequality
(Df ´ Dt > 1/4p, where Df is frequency resolution and Dt
time resolution), which states that resolution in time and
frequency can not be arbitrarily small, because their product
is lower bounded (Gabor, 1946; Heisenberg, 1949). In other
words, higher frequencies guarantee better time resolution
(i.e. faster processing), but such `speed' is paid for in term of
frequency resolution, which necessarily decreases. This
simply means that higher is the frequency of neural oscilla-
tions, wider is their bandwidth. An example of this can be
seen in the classical EEG frequency range in the STN (Levy
et al., 2002) or, more traditionally, at the scalp: the alpha or
slower rhythms are well localized in frequency, whereas the
relatively fast beta activities are more spread out on the
frequency axis.
The cellular mechanisms responsible for the 300-Hz
oscillations are unclear. Until now, no stable neural activity
oscillating as a network at such high frequencies has, to our
knowledge, been reported in any brain structure involved in
human motor control. Correlated neuronal rhythms at
frequencies >100 Hz have been observed in vivo in the
hippocampus (BuzsaÂki et al., 1992; Hirai et al., 1999). The
cellular origin of these high-frequency oscillations has been
related to electrical coupling (Draguhn et al., 1998) and
axo-axonal connections (Schmitz et al., 2001).
A synchronized, phase-shifted recruitment of STN cells,
reverberating activity of STN units due to intrinsic mem-
brane properties, subthreshold ¯uctuations determined by
coordinated pre-synaptic input and high-frequency dendro-
somatic potential uncoupling represent other possible and
not mutually exclusive mechanisms for the origin of 300-Hz
oscillations. Hence, the presence of a 300-Hz activity does
not necessarily imply either a single presynaptic 300-Hz
drive or a postsynaptic unitary activity at such high
frequencies.
300-Hz STN oscillations in Parkinson's disease 2159
by guest on May 24, 2014
http://brain.oxfordjournals.org/D
ownloaded from

Movement-related modulation of the 300-HzoscillationsThe relatively slow alpha and beta EEG rhythms are
commonly interpreted as `idling' rhythms and, accordingly,
they are lost or reduced during active processing (e.g. eye
opening, movement execution, etc.); movement-related
power decreases are often referred as event-related desyn-
chronization (Pfurtscheller and Lopes da Silva, 1999). On the
other hand, gamma oscillations (40±80 Hz) typically increase
their power in correspondence of movements or other
cognitive actions; movement-related power increases are
often referred to as ERS (Pfurtscheller and Lopes da Silva,
1999); for their characteristic ERS, gamma rhythms have
been proposed to directly re¯ect active processing
(Pfurtscheller and Lopes da Silva, 1999) and they have
been functionally related to the need for `binding' informa-
tion from different brain structures (Von der Malsburg, 1995)
to produce fast integration for higher-level processing (Singer
and Gray, 1995). Indeed, the 300-Hz rhythm we observed in
the human STN presents pharmacological and movement-
related dynamics that are very similar to those previously
reported in the same STN, coherently with the globus pallidus
internus, in the high-gamma range at 70±80 Hz (Brown et al.,
2001; Cassidy et al., 2002): they closely follow the EMG
burst, with the power rapidly increasing and decreasing back
to baseline values.
During movement execution, levodopa signi®cantly in-
creased the 300-Hz baseline power, the ERS power and the
ERS/baseline ratio. The fact that levodopa effect is signi®cant
on the 300-Hz baseline power is obvious: the baseline power
corresponds to a `dynamic rest' between two movements,
therefore the levodopa dependent increase con®rms the
results obtained at rest. On the other hand, the fact that
levodopa effect is signi®cant on the 300-Hz ERS power
means that greater the dopamine -dependent 300-Hz activity
at rest, the greater its movement-related modulation. Finally,
the fact that effect of levodopa on the ERS/baseline ratio is
signi®cant is subtler, and it indicates that the relationship
qualitatively stated at the previous sentence is non-linear.
Intuitively the concept is that the `amount' of oscillation at
rest not only allows a certain `amount' of movement-related
modulation, but also increases the `ef®ciency' of the modu-
lation itself.
Pathophysiological implicationsOne might wonder whether high-frequency oscillations in the
STN, either at 70±80 Hz (Brown et al., 2001; Cassidy et al.,
Fig. 3 Movement-related modulation of the 300-Hz rhythm. (A±H) Peri-event (0 s = EMG onset) power averages of the 300-Hz band-pass®ltered STN signals from eight single STN, before (grey line) and after (black line) levodopa administration.
2160 G. Foffani et al.
by guest on May 24, 2014
http://brain.oxfordjournals.org/D
ownloaded from
2002) or at 300 Hz, are not causally responsible for the
levodopa induced improvement but only its epiphenomenon.
Also, these oscillations might be, at least in part, related to
drug-induced involuntary movements. However, Cassidy
et al. (2002) reported that more than half of the patients
had no clinical evidences of dyskinesia or tremor during the
recordings and changes at 70±80 Hz started after a warning
stimulus, during the reaction time and before movement
onset. In addition, 300-Hz activity can be observed even
before levodopa administration (30% of the nuclei at rest and
50% movement related), in absence of any involuntary
movement. Finally, these high-frequency subthalamic oscil-
lations are modulated by both dopaminergic stimulation and
voluntary movement. Therefore, at least in Parkinson's
disease, the 300-Hz rhythm appears to be a determinant of
voluntary motor behaviour.
The ®nding of the 300-Hz rhythm in the human STN has
several possible implications. First, because signals at higher
frequencies can process larger amounts of information than
rhythms in the beta or even gamma range, faster rhythms
accord well with the operational complexity of the basal
ganglia circuit. Using an analogy with the classic communi-
cation theory, the STN processes phasic movement informa-
tion in amplitude modulation mode, on the 300-Hz carrier
frequency. The maximum theoretical bandwidth of the
transmission (i.e. the amount of information per time unit)
is directly proportional to the carrier frequency (Haykin,
1994). Although the information currency of the nervous
system is the action potential rather than the LFP, 300-Hz
oscillations may provide a coordinated `clock' that paces the
neurons excitability at a resolution of ~3 ms, acting somehow
similarly to the clock of a microprocessor in a personal
computer. Therefore, the 300-Hz subthalamic rhythm might
not be directly involved in individual movements or actions,
but it could be a non-speci®c regulator of neural synchrony in
order to guarantee speci®c modulation of individual move-
ments, that probably are more directly determined by lower
frequencies. The 300-Hz power increase during movement
execution would further enhance the clock precision when
fast and robust processing is needed. Hence, the loss of
300-Hz oscillations can contribute to movement abnormal-
ities in Parkinson's disease.
Secondly, from a pathophysiological point of view, the
appearance of the 300-Hz rhythm after dopaminergic medi-
cation in subjects at rest may re¯ect the shift of a bistable
neural subsystem from quiescence to an operational state that
allows the optimal information processing required for
normal motor control. Neural bistability has recently been
suggested as a key element for robust neural integration
(Koulakov et al., 2002). At a cellular level, bistable behaviour
has been experimentally observed in neurons from many
brain structures, including the striatum (Nicola et al., 2000),
depending on speci®c neurotransmitters, including dopamine
(Nicola et al., 2000; Lavin and Grace, 2001). At the network
level, the sudden appearance of synchronized neural rhythms
in correspondence with pathological or physiological events,
as, for example, in epilepsy (Manuca et al., 1998) or simply in
attention (Steinmetz et al., 2000; Salinas and Sejnowski,
2001), may be interpreted as a state transition of a complex
neural system. In Parkinson's disease, the loss of nigrostriatal
dopaminergic projections might determine an opposite tran-
sition to a desynchronized state, electrophysiologically
re¯ected by absence of the 300-Hz subthalamic rhythm and,
eventually, reversed by dopaminergic medication.
Finally, the 300-Hz rhythm could also help to explain how
STN DBS induces its bene®cial effects in Parkinson's
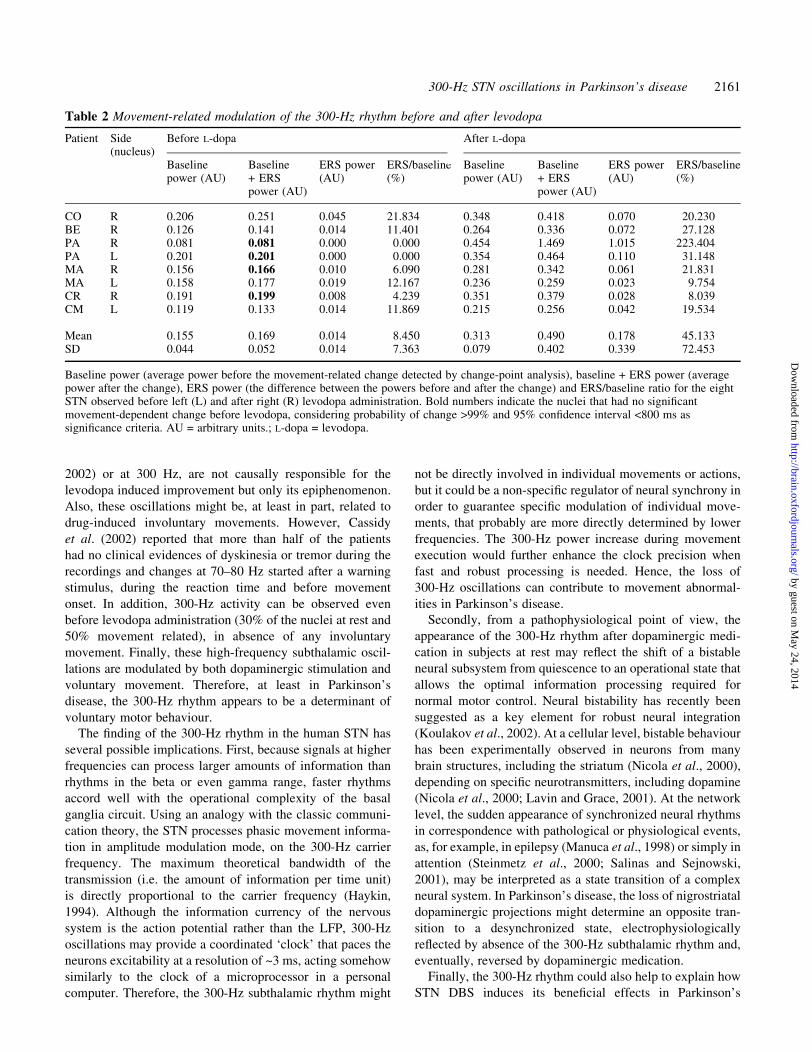
Table 2 Movement-related modulation of the 300-Hz rhythm before and after levodopa
Patient Side Before L-dopa After L-dopa(nucleus)
Baselinepower (AU)
Baseline+ ERSpower (AU)
ERS power(AU)
ERS/baseline(%)
Baselinepower (AU)
Baseline+ ERSpower (AU)
ERS power(AU)
ERS/baseline(%)
CO R 0.206 0.251 0.045 21.834 0.348 0.418 0.070 20.230BE R 0.126 0.141 0.014 11.401 0.264 0.336 0.072 27.128PA R 0.081 0.081 0.000 0.000 0.454 1.469 1.015 223.404PA L 0.201 0.201 0.000 0.000 0.354 0.464 0.110 31.148MA R 0.156 0.166 0.010 6.090 0.281 0.342 0.061 21.831MA L 0.158 0.177 0.019 12.167 0.236 0.259 0.023 9.754CR R 0.191 0.199 0.008 4.239 0.351 0.379 0.028 8.039CM L 0.119 0.133 0.014 11.869 0.215 0.256 0.042 19.534
Mean 0.155 0.169 0.014 8.450 0.313 0.490 0.178 45.133SD 0.044 0.052 0.014 7.363 0.079 0.402 0.339 72.453
Baseline power (average power before the movement-related change detected by change-point analysis), baseline + ERS power (averagepower after the change), ERS power (the difference between the powers before and after the change) and ERS/baseline ratio for the eightSTN observed before left (L) and after right (R) levodopa administration. Bold numbers indicate the nuclei that had no signi®cantmovement-dependent change before levodopa, considering probability of change >99% and 95% con®dence interval <800 ms assigni®cance criteria. AU = arbitrary units.; L-dopa = levodopa.
300-Hz STN oscillations in Parkinson's disease 2161
by guest on May 24, 2014
http://brain.oxfordjournals.org/D
ownloaded from

disease. The clinical ef®cacy of DBS at frequencies
>100 Hz could re¯ect its role as arti®cial (subharmonic)
drive for the physiological neural oscillations at 300 Hz
required for normal basal ganglia function. If we interpret the
basal ganglia as a complex dynamic system, dopamine may
be viewed as an external input that sets some internal
variables at the working oscillatory equilibrium required for a
correct output. When the dopaminergic system is defective as
it is in Parkinson's disease, DBS would directly drive those
internal variables into or closer to their physiological
oscillatory equilibrium. This excitatory interpretation of
DBS at a network level is in agreement with recent ®ndings
on the MPTP primate model of Parkinson's disease
(Hashimoto et al., 2003), and it does not contrast with
inhibitory effects at the cellular level that have been
originally suggested for the similar effect of STN stimulation
and its lesion. Indeed, DBS and lesions can elicit a similar
(but probably not the same) clinical improvement through
different mechanisms of actions. As shown by intracerebral
microdialysis studies in rats (Windels et al., 2000, 2002),
excitatory and inhibitory effects might coexist and both
contribute to the therapeutic effect of DBS. Hence, DBS
could act in a far more complex way than was once
thought.
AcknowledgementsThe authors wish to thank Dr G. Ardolino, Professor G.
Baselli, Ing. A. Bianchi, Dr V. Chiesa, Dr M. Locatelli and Dr
A. Pesenti, for their helpful cooperation, and S. Croci, S.
Garlaschi, G. Gherardi, A. Marsilio, B. Meda, M. Pastori and
M. Pellegrini for their technical assistance. The study was
partially supported by Associazione Amici del Centro Dino
Ferrari for Neurodegenerative Disorders, by a Health
Italian Ministry Collaborative grant with IRCCS Istituto
Neurologico Mediterraneo Neuromed, Pozzilli, Italy and by
MURST.
References
Bergman H, Wichmann T, DeLong MR. Reversal of experimental
parkinsonism by lesions of the subthalamic nucleus. Science 1990;
249: 1436±8.
Bergman H, Feingold A, Nini A, Raz A, Slovin H, Abeles M, et al.
Physiological aspects of information processing in the basal ganglia
of normal and parkinsonian primates. [Review]. Trends Neurosci
1998; 21: 32±8.
Bevan MD, Wilson CJ. Mechanisms underlying spontaneous
oscillation and rhythmic ®ring in rat subthalamic neurons. J
Neurosci 1999; 19: 7617±28.
Bevan MD, Magill PJ, Terman D, Bolam JP, Wilson CJ. Move to
the rhythm: oscillations in the subthalamic nucleus±external globus
pallidus network. [Review]. Trends Neurosci 2002; 25: 525±31.
Brown P, Oliviero A, Mazzone P, Insola A, Tonali P, Di Lazzaro V.
Dopamine dependency of oscillations between subthalamic nucleus
and pallidum in Parkinson's disease. J Neurosci 2001; 21: 1033±8.
BuzsaÂki G, HorvaÂth Z, Urioste R, Hetke J, Wise K. High-frequency
network oscillation in the hippocampus. Science 1992; 256:
1025±7.
Cassidy M, Mazzone P, Oliviero A, Insola A, Tonali P, Di Lazzaro
V, et al. Movement-related changes in synchronization in the
human basal ganglia. Brain 2002; 125: 1235±46.
Dennis JE Jr. Nonlinear least squares and equations. In: Jacob D,
editor. The state of the art of numerical analysis. Orlando:
Academic Press; 1977. p. 269±312.
Dowsey-Limousin P, Pollak P. Deep brain stimulation in the
treatment of Parkinson's disease: a review and update. [Review].
Clin Neurosci Res 2001; 1: 521±6.
Draguhn A, Traub RD, Schmitz D, Jefferys JGR. Electrical
coupling underlies high-frequency oscillations in the hippocampus
in vitro. Nature 1998; 394: 189±92.
Egidi M, Rampini P, Locatelli M, Farabola M, Priori A, Pesenti
A, et al. Visualisation of the subthalamic nucleus: a multiple
sequential image fusion (MuSIF) technique for direct stereotaxic
localisation and postoperative control. Neurol Sci 2002; 23
Suppl 2: S71±2.
Foffani G, Priori A, Rohr M, Pesenti A, Locatelli M, Caputo E, et al.
Event-related desynchronization (ERD) in the human subthalamus
and internal globus pallidus. J Physiol 2002; 539.P: 39P.
Gabor D. Theory of communication. J Inst Elect Engrs (London)
1946; 93: 429±57.
Goldbeter A. Computational approaches to cellular rhythms.
[Review]. Nature 2002; 420: 238±45.
Gray CM. Synchronous oscillations in neuronal systems:
mechanisms and functions. [Review]. J Comput Neurosci 1994; 1:
11±38.
Grill WM, McIntyre CC. Extracellular excitation of central
neurons: implications for the mechanisms of deep brain
stimulation. Thal Rel Sys 2001; 1: 269±77.
Haykin S. Communication systems. 3rd ed. New York: John Wiley;
1994.
Hashimoto T, Elder CM, Okun MS, Patrick SK, Vitek JL.
Stimulation of the subthalamic nucleus changes the ®ring pattern
of pallidal neurons. J Neurosci 2003; 23: 1916±23.
Heisenberg, W. The physical principles of quantum theory. New
York: Dover; 1949.
Hirai N, Uchida S, Maehara T, Okubo Y, Shimizu H. Enhanced
gamma (30±150 Hz) frequency in the human medial temporal lobe.
Neuroscience 1999; 90: 1149±55.
Koulakov AA, Raghavachari S, Kepecs A, Lisman JE. Model for a
robust neural integrator. Nat Neurosci 2002; 5: 775±82.
Lavin A, Grace AA. Stimulation of D1-type dopamine receptors
enhances excitability in prefrontal cortical pyramidal neurons in a
state-dependent manner. Neuroscience 2001; 104: 335±46.
Levenberg K. A method for the solution of certain problems in least
squares. Quart Appl Math 1944; 2: 164±8.
2162 G. Foffani et al.
by guest on May 24, 2014
http://brain.oxfordjournals.org/D
ownloaded from
Levy R, Hutchison WD, Lozano AM, Dostrovsky JO. High-
frequency synchronization of neuronal activity in the subthalamic
nucleus of parkinsonian patients with limb tremor. J Neurosci 2000;
20: 7766±75.
Levy R, Ashby P, Hutchison WD, Lang AE, Lozano AM,
Dostrovsky JO. Dependence of subthalamic nucleus oscillations
on movement and dopamine in Parkinson's disease. Brain 2002;
125: 1196±209.
Limousin P, Pollak P, Benazzouz A, Hoffmann D, Le Bas JF,
Broussolle E, et al. Effect of parkinsonian signs and symptoms
of bilateral subthalamic nucleus stimulation. Lancet 1995; 345:
91±5.
Limousin P, Krack P, Pollak P, Benazzouz A, Ardouin C, Hoffmann
D, et al. Electrical stimulation of the subthalamic nucleus in
advanced Parkinson's disease. New Engl J Med 1998; 339: 1105±11.
Lozano AM, Dostrovsky J, Chen R, Ashby P. Deep brain
stimulation for Parkinson's disease: disrupting the disruption.
[Review]. Lancet Neurol 2002; 1: 225±31.
Manuca R, Casdagli MC, Savit RS. Nonstationarity in epileptic
EEG and implications for neural dynamics. Math Biosci 1998; 147:
1±22.
Marquardt D. An algorithm for least-squares estimation of
nonlinear parameters. SIAM J Appl Math 1963; 11: 431±41.
Marsden JF, Limousin-Dowsey P, Ashby P, Pollak P, Brown P.
Subthalamic nucleus, sensorimotor cortex and muscle
interrelationships in Parkinson's disease. Brain 2001; 124:
378±88.
Moro E, Esselink RJA, Xie J, Hommel M, Benabid AL, Pollak P.
The impact on Parkinson's disease of electrical parameter settings
in STN stimulation. Neurology 2002; 59: 706±13.
Nicola SM, Surmeier DJ, Malenka RC. Dopaminergic modulation
of neuronal excitability in the striatum and nucleus accumbens.
[Review] Annu Rev Neurosci 2000; 23: 185±215.
Pesenti A, Priori A, Locatelli M, Egidi M, Rampini P, Tamma F,
et al. Subthalamic somatosensory evoked potentials in Parkinson's
disease. Mov Disord 2003; DOI: 10.1002/MDS.10519.
Pfurtscheller G, Lopes da Silva FH. Event-related EEG/EMG
synchronization and desynchronization: basic principles. [Review].
Clin Neurophysiol 1999; 110: 1842±57.
Plenz D, Kital ST. A basal ganglia pacemaker formed by the
subthalamic nucleus and external globus pallidus. Nature 1999;
400: 677±82.
Priori A, Foffani G, Pesenti A, Bianchi A, Chiesa V, Baselli G, et al.
Movement-related modulation of neural activity in human basal
ganglia and its L-DOPA dependency: recordings from deep brain
stimulation electrodes in patients with Parkinson's disease. Neurol
Sci 2002; 23 Suppl 2: S101±2.
Salinas E, Sejnowski TJ. Correlated neuronal activity and the ¯ow of
neural information. [Review]. Nat Rev Neurosci 2001; 2:
539±50.
Schmitz D, Schuchmann S, Fisahn A, Draguhn A, Buhl EH,
Petrasch-Parwez E, et al. Axo-axonal coupling: a novel
mechanism for ultrafast neuronal communication. Neuron 2001;
31: 831±40.
Singer W, Gray CM. Visual feature integration and the temporal
correlation hypothesis. [Review]. Annu Rev Neurosci 1995; 18:
555±86.
Steinmetz PN, Roy A, Fitzgerald PJ, Hsiao SS, Johnson KO, Niebur
E. Attention modulates synchronized neuronal ®ring in primate
somatosensory cortex. Nature 2000; 404: 187±90.
Taylor WA. Change-point analysis: a powerful new tool for
detecting changes. 2000. Available from: http: //www.variation.
com/cpa/tech/changepoint.html
Varela F, Lachaux JP, Rodriguez E, Martinerie J. The brainweb:
phase synchronization and large-scale integration. [Review]. Nat
Rev Neurosci 2001; 2: 229±39.
Vitek JL. Mechanisms of deep brain stimulation: excitation or
inhibition. [Review] Mov Disord 2002; 17 Suppl 3: S69±72.
VonderMalsburg C. Binding in models of perception and brain
function. [Review]. Curr Opin Neurobiol 1995; 5: 520±6.
Welch PD. The use of fast Fourier transform for the estimation of
power spectra: a method based on time averaging over short,
modi®ed periodograms. IEEE Trans. Audio Electroacoustics 1967;
AU-15: 70±3.
Wichmann T, DeLong MR. Functional and pathophysiological
models of the basal ganglia. [Review]. Curr Opin Neurobiol 1996;
6: 751±758.
Wilson K. Disorders of motility and of muscle tone, with special
reference to the corpus striatum. Lancet 1925; 2: 1±10, 53±62, 169±
78, 215±9, 268±76.
Windels F, Bruet N, Poupard A, Urbain N, Chouvet G, Feuerstein
C, et al. Effects of high frequency stimulation of subthalamic
nucleus on extracellular glutamate and GABA in substantia nigra
and globus pallidus in the normal rat. Eur J Neurosci 2000; 12:
4141±6.
Windels F, Bruet N, Poupard A, Feuerstein C, Bertrand A, Savasta
M. In¯uence of frequency on extracellular glutamate and GABA in
substantia nigra and globus pallidus during electrical stimulation of
subthalamic nucleus in rats [abstract]. Mov Disord 2002; 17 Suppl
5: S200.
Received January 8, 2003. Revised March 16, 2003.
Second revision April 16, 2003. Accepted April 21, 2003
300-Hz STN oscillations in Parkinson's disease 2163
by guest on May 24, 2014
http://brain.oxfordjournals.org/D
ownloaded from