Coenzyme Q10 for Parkinson's disease
47
Coenzyme Q10 for Parkinson’s disease (Review) Liu J, Wang L, Zhan SY, Xia Y This is a reprint of a Cochrane review, prepared and maintained by The Cochrane Collaboration and published in The Cochrane Library 2011, Issue 12 http://www.thecochranelibrary.com Coenzyme Q10 for Parkinson’s disease (Review) Copyright © 2011 The Cochrane Collaboration. Published by John Wiley & Sons, Ltd.
-
Upload
independent -
Category
Documents
-
view
0 -
download
0
Transcript of Coenzyme Q10 for Parkinson's disease

Coenzyme Q10 for Parkinson’s disease (Review)
Liu J, Wang L, Zhan SY, Xia Y
This is a reprint of a Cochrane review, prepared and maintained by The Cochrane Collaboration and published in The Cochrane Library2011, Issue 12
http://www.thecochranelibrary.com
Coenzyme Q10 for Parkinson’s disease (Review)
Copyright © 2011 The Cochrane Collaboration. Published by John Wiley & Sons, Ltd.

T A B L E O F C O N T E N T S
1HEADER . . . . . . . . . . . . . . . . . . . . . . . . . . . . . . . . . . . . . . .
1ABSTRACT . . . . . . . . . . . . . . . . . . . . . . . . . . . . . . . . . . . . . .
2PLAIN LANGUAGE SUMMARY . . . . . . . . . . . . . . . . . . . . . . . . . . . . . .
2BACKGROUND . . . . . . . . . . . . . . . . . . . . . . . . . . . . . . . . . . . .
3OBJECTIVES . . . . . . . . . . . . . . . . . . . . . . . . . . . . . . . . . . . . .
3METHODS . . . . . . . . . . . . . . . . . . . . . . . . . . . . . . . . . . . . . .
6RESULTS . . . . . . . . . . . . . . . . . . . . . . . . . . . . . . . . . . . . . . .
7DISCUSSION . . . . . . . . . . . . . . . . . . . . . . . . . . . . . . . . . . . . .
8AUTHORS’ CONCLUSIONS . . . . . . . . . . . . . . . . . . . . . . . . . . . . . . .
8ACKNOWLEDGEMENTS . . . . . . . . . . . . . . . . . . . . . . . . . . . . . . . .
8REFERENCES . . . . . . . . . . . . . . . . . . . . . . . . . . . . . . . . . . . . .
10CHARACTERISTICS OF STUDIES . . . . . . . . . . . . . . . . . . . . . . . . . . . . .
18DATA AND ANALYSES . . . . . . . . . . . . . . . . . . . . . . . . . . . . . . . . . .
Analysis 1.1. Comparison 1 Co Q10 versus placebo, Outcome 1 Total UPDRS score change. . . . . . . . . 20
Analysis 1.2. Comparison 1 Co Q10 versus placebo, Outcome 2 Motor UPDRS. . . . . . . . . . . . . . 22
Analysis 1.3. Comparison 1 Co Q10 versus placebo, Outcome 3 Mental UPDRS. . . . . . . . . . . . . 23
Analysis 1.4. Comparison 1 Co Q10 versus placebo, Outcome 4 ADL UPDRS. . . . . . . . . . . . . . 24
Analysis 1.5. Comparison 1 Co Q10 versus placebo, Outcome 5 Hoehn & Yahr. . . . . . . . . . . . . . 25
Analysis 1.6. Comparison 1 Co Q10 versus placebo, Outcome 6 Schwab & England (investigator). . . . . . . 26
Analysis 1.7. Comparison 1 Co Q10 versus placebo, Outcome 7 severe viral infection. . . . . . . . . . . . 27
Analysis 1.8. Comparison 1 Co Q10 versus placebo, Outcome 8 Pharyngitis. . . . . . . . . . . . . . . 28
Analysis 1.9. Comparison 1 Co Q10 versus placebo, Outcome 9 Sinusitis. . . . . . . . . . . . . . . . 29
Analysis 1.10. Comparison 1 Co Q10 versus placebo, Outcome 10 Flatulence. . . . . . . . . . . . . . 30
Analysis 1.11. Comparison 1 Co Q10 versus placebo, Outcome 11 Back pain. . . . . . . . . . . . . . . 31
Analysis 1.12. Comparison 1 Co Q10 versus placebo, Outcome 12 Coughing. . . . . . . . . . . . . . 32
Analysis 1.13. Comparison 1 Co Q10 versus placebo, Outcome 13 Diarrhea. . . . . . . . . . . . . . . 33
Analysis 1.14. Comparison 1 Co Q10 versus placebo, Outcome 14 Fall. . . . . . . . . . . . . . . . . 34
Analysis 1.15. Comparison 1 Co Q10 versus placebo, Outcome 15 Fatigue. . . . . . . . . . . . . . . 35
Analysis 1.16. Comparison 1 Co Q10 versus placebo, Outcome 16 Hypercholesterolemia. . . . . . . . . . 36
Analysis 1.17. Comparison 1 Co Q10 versus placebo, Outcome 17 Number of withdrawals due to adverse effects. . 37
Analysis 2.1. Comparison 2 Long-term efficacy of Co Q10 versus placebo, Outcome 1 Total UPDRS score change. . 38
Analysis 2.2. Comparison 2 Long-term efficacy of Co Q10 versus placebo, Outcome 2 Motor UPDRS. . . . . . 39
Analysis 2.3. Comparison 2 Long-term efficacy of Co Q10 versus placebo, Outcome 3 Mental UPDRS. . . . . . 40
Analysis 2.4. Comparison 2 Long-term efficacy of Co Q10 versus placebo, Outcome 4 ADL UPDRS. . . . . . 41
Analysis 2.5. Comparison 2 Long-term efficacy of Co Q10 versus placebo, Outcome 5 Hoehn & Yahr. . . . . . 42
Analysis 2.6. Comparison 2 Long-term efficacy of Co Q10 versus placebo, Outcome 6 Schwab & England (investigator). 43
43HISTORY . . . . . . . . . . . . . . . . . . . . . . . . . . . . . . . . . . . . . . .
44CONTRIBUTIONS OF AUTHORS . . . . . . . . . . . . . . . . . . . . . . . . . . . . .
44DECLARATIONS OF INTEREST . . . . . . . . . . . . . . . . . . . . . . . . . . . . . .
44SOURCES OF SUPPORT . . . . . . . . . . . . . . . . . . . . . . . . . . . . . . . . .
44DIFFERENCES BETWEEN PROTOCOL AND REVIEW . . . . . . . . . . . . . . . . . . . . .
44INDEX TERMS . . . . . . . . . . . . . . . . . . . . . . . . . . . . . . . . . . . .
iCoenzyme Q10 for Parkinson’s disease (Review)
Copyright © 2011 The Cochrane Collaboration. Published by John Wiley & Sons, Ltd.

[Intervention Review]
Coenzyme Q10 for Parkinson’s disease
Jia Liu1 , Luning Wang1 , Si-Yan Zhan2, Yinyin Xia3
1Department of Geriatric Neurology, Chinese PLA General Hospital, Beijing, China. 2Department of Epidemiology and Biostatistics,
School of Public Health, Peking University Health Science Center, Beijing, China. 3Department of Epidemiology and Biostatistics,
School of Public Health, Peking University Health Science Center, Beijing, China
Contact address: Luning Wang, Department of Geriatric Neurology, Chinese PLA General Hospital, Fuxinglu 28, Beijing, 100853,
China. [email protected].
Editorial group: Cochrane Movement Disorders Group.
Publication status and date: New, published in Issue 12, 2011.
Review content assessed as up-to-date: 16 July 2011.
Citation: Liu J, Wang L, Zhan SY, Xia Y. Coenzyme Q10 for Parkinson’s disease. Cochrane Database of Systematic Reviews 2011, Issue
12. Art. No.: CD008150. DOI: 10.1002/14651858.CD008150.pub2.
Copyright © 2011 The Cochrane Collaboration. Published by John Wiley & Sons, Ltd.
A B S T R A C T
Background
A number of preclinical studies in both in vitro and in vivo models of Parkinson’s disease have demonstrated that coenzyme Q10
can protect the nigrostriatal dopaminergic system. Some clinical trials have looked at the neuroprotective effects of coenzyme Q10 in
patients with early and midstage Parkinson’s disease.
Objectives
To assess the evidence from randomized controlled trials on the efficacy and safety of treatment with coenzyme Q10 compared to
placebo in patients with early and midstage Parkinson’s disease.
Search methods
We searched the Cochrane Movment Disorders Group Trials Register, CENTRAL (The Cochrane Library 2009, Issue 4), MEDLINE
(January 1966 to March 2011), and EMBASE (January 1985 to March 2011). We handsearched the references quoted in the identified
trials, congress reports from the most important neurological association and movement disorder societies in Europe and America
(March 2011), checked reference lists of relevant studies and contacted other researchers.
Selection criteria
We included randomized controlled trials (RCTs) that compared coenzyme Q10 to placebo for patients who suffered early and midstage
primary Parkinson’s disease. Studies in which the method of randomization or concealment were unknown were included. Cross-over
studies were excluded.
Data collection and analysis
Two review authors independently assessed trial quality and extracted data. All disagreements were resolved by consensus between
authors and were explained. We attempted to contact the authors of studies for further details if any data were missing and to establish
the characteristics of unpublished trials through correspondence with the trial coordinator or principal investigator. Adverse effects
information was collected from the trials.
1Coenzyme Q10 for Parkinson’s disease (Review)
Copyright © 2011 The Cochrane Collaboration. Published by John Wiley & Sons, Ltd.

Main results
Four randomized, double-blind, placebo-controlled trials with a total of 452 patients met the inclusion criteria and were included in
the review. In overall, there were improvements in activities of daily living (ADL) UPDRS (WMD -3.12, 95% CI -5.88 to -0.36) and
Schwab and England (WMD 4.43, 95% CI 0.05 to 8.81) for coenzyme Q10 at 1200 mg/d for 16 months versus placebo.
In safety outcomes, only the risk ratios (RR) of pharyngitis (RR 1.04, 95% CI 0.18 to 5.89) and diarrhea (RR 1.39, 95% CI 0.62 to
3.16) are mild elevated between coenzyme Q10 therapy and placebo and there were no differences in the number of withdrawals due
to adverse effects (RR 0.61, 95% CI 0.23 to 1.62).
Authors’ conclusions
Coenzyme Q10 therapy with 1200 mg/d for 16 months was well tolerated by patients with Parkinson’s disease. The improvements
in ADL UPDRS and Schwab and England were positive, but it need to be further confirmed by larger sample. For total and other
subscores of UPDRS, the effects of coenzyme Q10 seemed to be less clear.
P L A I N L A N G U A G E S U M M A R Y
[Coenzyme Q10 for Parkinson’s Disease.]
[Mitochondrial dysfunction has been well established to occur in Parkinson’s disease and appears to play a role in the pathogenesis of
the disorder. A deficit in brain coenzyme Q10 status may be involved in the pathophysiology of Parkinson’s disease. Mitochondria play
a central role in apoptotic cell death through a number of mechanisms. Coenzyme Q10 as an antioxidant, can affect certain of these
processes. Theoretically, coenzyme Q10 can interfere with Parkinson’s disease progression. There are four randomized, double-blind,
placebo-controlled trials that tested coenzyme Q10 for Parkinson’s disease. The results show coenzyme Q10 at dose of 1200mg/d for
16 months is well-tolerated and might disability as measured improve ADL UPDRS and Schwab and England. However this data is
uncertain and precludes that this treatment be recommended for clinical use without further confirmatory trials are done.]
B A C K G R O U N D
Description of the condition
Parkinson’s disease (PD) is the second most common progressive
neurodegenerative disorder and is characterized by several cardi-
nal symptoms including resting tremor, rigidity, bradykinesia, and
postural instability (Calne 1992). PD is believed to result from
a progressive loss of dopaminergic neurons in the substantia ni-
gra (Lang 1998). Once 80% or so of the dopamine producing
cells have been damaged the symptoms of PD begin to be no-
ticed (Neutel 2007). The prevalence rates range from 57 to 371
per 100,000, worldwide (Lang 1998; Strickland 2004). The in-
cidence increases with age and peaks between the ages of 70 and
79 years (Twelves 2003). Since populations are aging slowly, and
recognition of parkinsonism is improving, it is anticipated that
the incidence and prevalence will rise in the next decades (Neutel
2007).
Description of the intervention
Coenzyme Q10 (Co Q10) is composed of a quinine ring and a
10 isoprene unit tail; it is distributed in all membranes through-
out a cell (Crane 2001). Co Q10 is an essential cofactor in the
mitochondrial electron transport pathway and is also a lipid-solu-
ble antioxidant. It is endogenously synthesised via the mevalonate
pathway, and some is obtained from the diet (Molyneux 2008).
However, supplementary oral administration of Co Q10 has been
found to increase Co Q10 levels in plasma, platelets, and white
blood cells (Niklowitz 2007). Coenzyme Q10 as a vitamin-like
substance has been used in a variety of disorders primarily related
to suboptimal cellular energy metabolism and oxidative injury, e.g.
primary hypertension and heart failure (Ho 2009; Kumar 2009).
Studies also supported the efficacy of Coenzyme Q10 as a neu-
roprotectant for neurodegenerative disorders such as Parkinson’s
disease and certain encephalomyopathies (Bonakdar 2005).
2Coenzyme Q10 for Parkinson’s disease (Review)
Copyright © 2011 The Cochrane Collaboration. Published by John Wiley & Sons, Ltd.

How the intervention might work
It has been well established that mitochondrial dysfunction occurs
in PD and appears to play a role in the pathogenesis of the disorder.
Mitochondrial function has been evaluated in PD patients with
early untreated disease. A significantly reduced mitochondrial level
of Co Q10 was found from the PD subjects compared with age
and gender matched control subjects (Shults 1997). A deficit in
brain Co Q10 status may be involved in the pathophysiology of
PD (Hargreaves 2008). A key component of the mitochondrial
electron transport chain (ETC) is Co Q10, which not only serves as
the electron acceptor for complexes I and II of the ETC but is also
an antioxidant. In addition to being crucial to the bioenergetics
of the cell, mitochondria play a central role in apoptotic cell death
through a number of mechanisms and Co Q10 can affect certain
of these processes (Shults 2005). Co Q10 may possibly slow the
progression of PD.
Why it is important to do this review
A number of preclinical studies in in vitro and in vivo models
of PD have demonstrated that Co Q10 can protect the nigros-
triatal dopaminergic system. Oral supplementation with Co Q10
can reduce the loss of dopamine and dopaminergic axons in the
striatum in one-year old mice treated with 1-methyl-4-phenyl-
1,2,3,6-tetrahydropyridine (MPTP) (Beal 1998). Experiments on
monkeys also reported that 10 days of oral supplementation with
Co Q10 (15 to 22 mg/kg, a dose range similar to that used in the
phase II trial in patients with PD) prior to treatment with MPTP
significantly attenuated the loss of nigral dopaminergic neurons
(Horvath 2003). At the same time, several clinical trials looked at
the neuroprotective effects of Co Q10 in early and midstage PD
patients.
No systematic review with meta-analysis currently exists in the
peer-reviewed literature that focuses on Co Q10 for patients with
PD. This review is designed to comprehensively examine the cur-
rent literature in order to evaluate the efficacy and safety of treat-
ment with Co Q10 in patients with early and midstage PD in
order to guide and normalize its use in clinical treatment.
O B J E C T I V E S
To assess the evidence from randomized controlled trials for the
efficacy and safety of treatment with Co Q10 compared to placebo
in patients with early and midstage PD.
M E T H O D S
Criteria for considering studies for this review
Types of studies
We included randomized controlled trials (RCTs) that compared
Co Q10 to placebo. Studies in which the methods of random-
ization or concealment were unknown were included. Cross-over
studies were excluded.
Types of participants
We included studies with participants, aged 30 years or older, of
either sex and with early and midstage PD according to the Hoehn
and Yahr stage. Participants were evaluated according to the Uni-
fied Parkinson’s Disease Rating Scale (UPDRS) (Fahn 1987) from
the time of study entry to its termination. Patients were excluded
if they had fluctuations or any secondary causes of parkinsonism,
such as drug-induced parkinsonism and structural lesions. Partic-
ipants were either stable on antiparkinsonism medications for the
treatment of their symptoms or not at the time of entry to the
study.
Types of interventions
Oral Co Q10, including nanoparticular and standard formula-
tions, from 300 mg/d to 2400 mg/d versus placebo. Vitamin E
could be added to the formulation as a lipophilic carrier and the
placebo contained the same dosage of vitamin E. Use of an an-
tiparkinsonism drug remained stable throughout the whole trial if
it had been used before study enrollment. The minimum duration
of treatment was four weeks.
Types of outcome measures
Primary outcomes
Efficacy
The rate of progression of PD as measured by the change in the
total UPDRS score
Safety
The number of patients with adverse effects
3Coenzyme Q10 for Parkinson’s disease (Review)
Copyright © 2011 The Cochrane Collaboration. Published by John Wiley & Sons, Ltd.

Secondary outcomes
Efficacy
The change in the respective UPDRS subscores
The outcome of quality of life scales
Plasma level of Co Q10
Mitochondrial assays
Safety
The number of withdrawals due to adverse effects
Search methods for identification of studies
Electronic searches
(1)The Cochrane Central Register of Controlled Trials (CEN-
TRAL) (The Cochrane Library 2009, Issue 4):
#1. PARKINSONIAN DISORDERS explode tree 1 (MeSH)
#2. parkinson*
#3. (#1 or #2)
#4. ubiquinone single term (MeSH)
#5. ubiquinone
#6. coenzyme Q10
#7. (#4 or #5 or #6)
#8. (#3 and #7)
(2)Example for Medline(1966 to present) search through OVID
Gateway:
1.Parkinson$.tw.
2.exp Parkinsonian Disorders/
3.1 or 2
4.coenzyme Q10/
5.coenzyme Q10.tw
6.ubiquinone.tw
7.or/4-6
8.randomized controlled trial.pt.
9.controlled clinical trial.pt.
10.randomized controlled trials/
11.random allocation/
12.double?blind method/
13.single?blind method/
14.clinical trial.pt.
15.exp clinical trials/
16.clin$ with trial$.tw.
17.random$.tw.
18.exp research design/
19.or/8-20
20.limit 19 to animal
21.limit 19 to human
22.20 and 21
23.20 not 22
24.19not 23
25. 3 and 7 and 24
(3)Example for EMBASE(1980 to present) through OVID Gate-
way:
1. Parkinson Disease/
2. Parkinsonism/
3. Parkinson$.tw.
4. 1 or 2 or 3
4. coenzyme Q10/
5. coenzyme Q10.tw
6. ubiquinone.tw
7.or/4-6
8.clinical trial/
9.multicenter study/
10.phase 2 clinical trial/
11.phase 3 clinical trial/
12.phase 4 clinical trial/
13.randomized controlled trial/
14.controlled study/
15.meta analysis/
16.double blind procedure/
17.single blind procedure/
18.randomization/
19.major clinical study/
20.placebo/
21.drug comparison/
22.clinical study/
23.(clin$ adj25 trial$).tw.
24.((singl$ or doubl$ or tripl$ or trebl$) adj25 (blind$ or
mask$)).tw.
25.placebo$.tw.
26.random$.tw.
27.control$.tw.
28.or/8-27
29.human/
30.nonhuman/
31.8 and 30
32.30 not 31
33.28 not 32
34.4 and7 and 33
(4) Online searching of conference proceeding through the ISI
proceedings database (1990 to present):
#1 TS=( coenzyme Q10 OR ubiquinone)
#2 TS=(TRIAL OR RANDOM* OR PLACEBO* OR CON-
TROL*)
#3 #1 AND #2
Searching other resources
4Coenzyme Q10 for Parkinson’s disease (Review)
Copyright © 2011 The Cochrane Collaboration. Published by John Wiley & Sons, Ltd.

(5) Handsearching of conference proceedings including:
Movement Disorders - Maryse Lapeyre-Mestre; Completed:
1994,1996; Still searching: 1986-93, 1995, 1997-98;
European Journal of Disorders of Communication - Julie Speller;
Dysphagia - Julie Speller;
Physiotherapy - Julie Speller;
European Neuropsychopharmacology - Pascale Jolliet;
Italian Journal of neurological Sciences - Carlo Colosimo;
International Congresses of Movement Disorders;
International Congresses on Parkinson’s Disease;
World Congresses of Neurology;
Annual meetings of the American Academy of Neurology;
Meetings of the American Neurological Society;
Meetings of the European Federation of Neurological Sciences;
Meetings of the European Neurological Society;
Meetings of the Scandinavian Congress of Neurology.
(6) Checking reference lists of relevant trials to identify any addi-
tional
trials.
(7) Previous reviews.
(8) Personal communication: we will contact other researchers in
the field.
Data collection and analysis
Selection of studies
Two review authors (LJ, WL) independently assessed titles and
abstracts identified from the literature search and obtained the full
text of potentially relevant studies. Two review authors (LJ, WL)
independently evaluated the eligibility (on the basis of information
accessible in the published data) and assessed the methodological
quality of these studies. Any discordance was resolved by discussion
or by an independent party if agreement still could not be obtained.
Data extraction and management
Two review authors independently extracted eligible data from the
published reports onto standardised forms and cross-checked them
for accuracy. Disagreements regarding inclusion were resolved by
consensus between authors and were recorded. We attempted to
contact the authors of the studies for further details if any data were
missing and to establish the characteristics of unpublished trials
through correspondence with the trial coordinator or principal
investigator. We used checklists to independently record details of
the:
• methods of generating randomization schedule;
• method of concealment of allocation;
• blinding of assessors;
• use of an intention-to-treat analysis (all participants initially
randomized included in the analyses as allocated to groups);
• adverse events and drop outs for all reasons;
• important imbalance in prognostic factors;
• participants (country, number of participants, age, gender,
inclusion and exclusion criteria);
• comparison (details of the intervention in treatment and
control groups; details of co-intervention(s) in both groups;
duration of treatment);
• outcomes and time points of measures (number of
participants in each group and outcome, regardless of
compliance).
Assessment of risk of bias in included studies
Methodological quality was assessed independently by two review
authors (LJ, WL) according to method of randomization, blind-
ing of treatment and outcome assessment, completeness of fol-
low up, and whether intention-to-treat analysis was carried out or
was possible from the published data. The quality of the included
studies was evaluated according to the Cochrane Collaboration
Handbook criteria (based on the allocation concealment). We as-
sessed whether the treatment groups were comparable with regard
to demographics, clinical characteristics, and the number of pa-
tients excluded or lost to follow up within each trial; and whether
the definition of outcomes and entry and exclusion criteria were
comparable across the different trials. Sources of bias were con-
sidered on a study-by-study basis and studies were to be excluded
if the authors agreed that they were significantly biased. In such
cases, reasons for exclusion were recorded.
Measures of treatment effect
We expected the RCTs to measure both event (dichotomous)
data and continuous data. Continuous data were expressed as
weighted mean differences (WMD) or standardised mean differ-
ences (SMD), and dichotomised data were expressed as risk ra-
tios (RR). We calculated the WMD with 95% confidence interval
(CI). If studies did not use the same outcome, we used the SMD
with 95% CI. For all binary outcomes we calculated RR with 95%
CI. As it was possible that some trials (or groups within a trial) had
no adverse events or no drop outs, we calculated risk differences
(RD) instead of RRs in these specific situations, again with 95%
CI.
Unit of analysis issues
We described variability in participants, interventions, and the
outcomes studied (clinical diversity) in an additional table. This
did not influence the selection of trials.
Dealing with missing data
We attempted to contact the authors of the studies for further
details if any data were missing and to establish the characteristics
5Coenzyme Q10 for Parkinson’s disease (Review)
Copyright © 2011 The Cochrane Collaboration. Published by John Wiley & Sons, Ltd.

of unpublished trials through correspondence with the trial coor-
dinator or principal investigator.
Assessment of heterogeneity
To test for heterogeneity we used the I2 (Higgins 2003) statistic
(alpha level 50%) for all comparisons. If we found statistically
significant heterogeneity, we calculated the overall effects using a
random-effects model instead of a fixed-effect model.
Assessment of reporting biases
The effect of publication bias was to be analysed with a funnel
plot if a significant result was found (Egger 1997).
Data synthesis
Formal meta-analysis using the RevMan software was performed,
where possible, although substantial heterogeneity between the
studies can prevent this. Otherwise we will give a descriptive sum-
mary of the results.
Subgroup analysis and investigation of heterogeneity
We planned that if there is significant heterogeneity we will at-
tempt to identify possible causes by carrying out a number of sub-
group analyses. Where relevant, and where data were available,
subgroup analysis was to include age, gender, severity of disease
(such as total UPDRS score, UPDRS motor score, Hoehn and
Yahr scale score at baseline), using antiparkinsonism medication
or not, the dosage of Co Q10, and the duration of treatment. As
a formal method of comparing subgroups, we used the Chi2 test
(to test for significant differences between both subgroups of par-
ticipants). For all statistical analyses we used the latest version of
the Cochrane Collaboration’s Review Manager software (RevMan
2008).
Sensitivity analysis
If heterogeneity of the selected trial estimates was present, we
planned to investigate the source by doing a sensitivity analysis.
For positive results, we also planned to assess the effect of missing
outcomes from patients excluded after randomization by perform-
ing a best and worse case sensitivity analysis.
R E S U L T S
Description of studies
See: Characteristics of included studies; Characteristics of excluded
studies; Characteristics of ongoing studies.
Using our search methods, 648 references were considered further.
After screening of titles and abstracts, full papers of seven studies
were obtained and assessed for eligibility. Two were excluded due
to an invalid control. Agreement between the review authors on
exclusion was 100%. At the same time, two trial reports were
identified as the same trial. To sum up, a total of four trials were
included. There is also an ongoing Phase III randomized controlled
trials on this intervention.
Results of the search
Four randomized, double-blind, placebo-controlled trials, with a
total of 452 patients, met the inclusion criteria and were included
in the review. Summary details of these trials are given in the
Characteristics of included studies table.
Included studies
Five studies were selected according to the criteria (Mueller 2003;
Shults 2002; Sotirios 2009; Storch 2007; The NINDS NET-PD
2007). However, two trial reports were identified as the same trial
(Sotirios 2009; The NINDS NET-PD 2007). Therefore, a total
of four studies were included in this review (Mueller 2003; Shults
2002; Storch 2007; The NINDS NET-PD 2007).
Excluded studies
Two studies were excluded based on the reason that they were
open-label trials without matched controls (Shults 2004; Strijks
1997).
Risk of bias in included studies
Allocation
All the studies had well concealed methods of allocation. How-
ever, they made use of different kinds of randomization such as
numbered containers, computer generated, and a randomization
list generated by the investigator. All were considered reasonable.
Blinding
The four studies were all double-blind trials. In one trial (Storch
2007), the randomization list was generated by one investigator
(RK). And it should be clarified that if RK went on to participate
this trial after randomization, although the title called double-
blind trial.
6Coenzyme Q10 for Parkinson’s disease (Review)
Copyright © 2011 The Cochrane Collaboration. Published by John Wiley & Sons, Ltd.

Incomplete outcome data
Nearly all the studies have individuals who did not complete the
trials; the trial by Mueller 2003 recorded that “All participants were
reevaluated under identical conditions 4 weeks later”. However,
in every study the percentage of participants lost to follow up was
less than 5% and reasons for losses were specified. All withdrawals
after randomization were included in the data analysis.
Selective reporting
None known
Other potential sources of bias
Some data were presented in a line or column graph, which meant
we could not obtain the accurate figures for the mean value and
standard deviation. We made inquiries to the primary investigator
but unfortunately responses were rare. Therefore we had to discard
some uncertain data in our analysis, which may cause potential
bias. In future updates, once we have acquired the required infor-
mation, we can improve this process.
Effects of interventions
Total UPDRS score change (comparisons 1.1)
Three included trials (Mueller 2003; Shults 2002; The NINDS
NET-PD 2007) measured the changes in total UPDRS score, with
Co Q10 from 300 mg/d to 2400 mg/d. However, there were no
differences between coenzyme Q10 at any dose and placebo. All
the 95% CI spanned zero, which meant no statistical significance.
Number of patients with all expected adverse effects (compar-
isons 1.7 to 1.16)
There was no difference in common adverse effects, even in a dose
of 1200 or 2400 mg/d, compared with placebo. No severe adverse
effects were reported which were believed to be related to Co Q10
therapy.
• 1200 mg/d Co Q10 versus placebo: severe viral infection,
pharyngitis, sinusitis, diarrhea, back pain (RR 1.04, 95% CI
0.14 to 7.70).
• 2400 mg/d Co Q10 versus placebo: sinusitis (RR 0.63, 95%
CI 0.21 to1.82); back pain (RR 1.50, 95% CI 0.44 to 5.09).
The risk ratios of other common adverse effects were all less than
one (please see Data and analyses).
Change in the respective UPDRS subscore and quality of life
scales
For motor UPDRS (comparisons 1.2), mental UPDRS (compar-
isons 1.3) and Hoehn and Yahr (comparisons 1.5), there were also
no differences between coenzyme Q10 at any dose and placebo.
All the 95% CI spanned zero, which meant no statistical signifi-
cance.
Only the dose of 1200 mg/d for 16 months appeared to be effec-
tive (comparisons 1.4 and 1.6), in activities of daily living (ADL)
UPDRS (WMD -3.12, 95% CI -5.88 to -0.36) and Schwab and
England (WMD 4.43, 95% CI 0.05 to 8.81).
Plasma level of Co Q10
Two studies (Shults 2002; Storch 2007) mentioned this outcome.
The group receiving Co Q10 always had a significant increase in
the mean Co Q10 plasma level, comparing with the placebo group.
The mean plasma levels of Co Q10 were significantly related to
the dosage of receiving Co Q10.
Mitochondrial assays
Only one study (Shults 2002) referred to the mitochondrial assays.
Results of the assay of the activity of complex I normalized to the
activity of citrate synthetase did not indicate a significant effect of
Co Q10. In this assay, the activity of complex I did not depend
on endogenous Co Q10, as an excess of exogenous Co Q10 was
added. There was also a significant increase in the activity of the
electron transport chain with treatment with Co Q10.
Number of withdrawals due to adverse effects (comparison
1.17)
There were two studies which reported the withdrawals due to
adverse effects (Storch 2007; The NINDS NET-PD 2007). No
difference existed between Co Q10 therapy and placebo (RR 0.61,
95% CI 0.23 to 1.62).
Sensitive analysis
A sensitivity analysis was undertaken to split the short-term versus
long-term (at least 12 months) efficacy of Co Q10 for PD patients.
The results were robust to changes in the way the analysis was
done. In long-term use of Co Q10, there were improvements at
dosage of 1200mg/d in ADL UPDRS (WMD -3.12, 95% CI -
5.88 to -0.36) and Schwab and England (WMD 4.43, 95% CI
0.05 to 8.81), but not in other items or dosages (please see Data
and analyses).
D I S C U S S I O N
Summary of main results
Four randomized, double-blind, placebo-controlled trials with a
total of 452 patients met the inclusion criteria and were included
in the review. In overall, there were improvements in ADL UPDRS
(WMD -3.12, 95% CI -5.88 to -0.36) and Schwab and England
(WMD 4.43, 95% CI 0.05 to 8.81) for coenzyme Q10 at 1200
mg/d for 16 months versus placebo.
In safety outcomes, only the RR of pharyngitis (RR 1.04, 95% CI
0.18 to 5.89) and diarrhea (RR 1.39, 95% CI 0.62 to 3.16) are
mild elevated between coenzyme Q10 therapy and placebo and
there were no differences in the number of withdrawals due to
adverse effects (RR 0.61, 95% CI 0.23 to 1.62).
7Coenzyme Q10 for Parkinson’s disease (Review)
Copyright © 2011 The Cochrane Collaboration. Published by John Wiley & Sons, Ltd.

Overall completeness and applicability ofevidence
Three of the four studies had individual participants who did not
complete the study. Nevertheless, the percentage of loss to follow
up for all the 452 patients was less than 5%, which is regarded
as acceptable. In addition, nearly all the reasons for losses were
specified. At the same time, all withdrawals after randomization
were included in the data analysis (please see Characteristics of
included studies). Therefore, the evidence from this review is valid
and applicable for clinical guidance.
Quality of the evidence
We believe the quality of the evidence is credible. The search
method was rigorous and well performed. Moreover, all the in-
cluded trials were high quality through our evaluation (please see
Characteristics of included studies). The reasons for excluding
trials were also specified (please see Characteristics of excluded
studies). The eligible data were analysed with official updated soft-
ware.
Potential biases in the review process
Some data in the included trials were presented in a line or column
graph. This led to our inability to obtain the accurate figures,
for example the mean value and standard deviation. We made
inquiries to the primary investigator for the detailed information
and are awaiting responses. Therefore, we had to discard some
uncertain data in our analysis, which may cause potential bias.
Agreements and disagreements with otherstudies or reviews
This is the first systematic review on this topic, as far as we are
aware and so we have no other review to compare with.
A U T H O R S ’ C O N C L U S I O N S
Implications for practice
The Co Q10 dose of 1200 mg/d is well-tolerated by patients with
PD. The improvements of coenzyme Q10 at 1200 mg/d for 16
months in ADL UPDRS and Schwab and England were positive,
but it need to be further confirmed by larger sample. However, for
total and motor UPDRS, the effect seems to be less clear. More
well-designed studies are required to establish an effect.
Implications for research
More research is required in the future, particularly well-designed,
double-blind randomized controlled trials. The focal point should
be as follows.
(1) The efficacy and safety of high doses, such as 1200 mg/d, 2400
mg/d and 3000 mg/d.
(2) The difference in efficacy and safety between different forms,
such as nanoparticular Co Q10 and standard formulation.
(3) All the data, including the scale scores and biochemistry out-
comes, should be published in detail and as complete as possible;
at least the mean value and standard deviation should be provided
as well as a line or column graph.
Actually, there is an ongoing study in this field (please see
Characteristics of ongoing studies), which is also a randomized,
double blind treatment trial. The paticipants are the patients with
idiopathic PD, and the prospective sample size is 600. The inter-
vention is Co Q10 1200mg/d with vitamin E 1200 IU/day versus
placobo with vitamin E 1200 IU/day. The primary outcomes are
changes in UPDRS total score and subsores. Therefore, we will
consider this trial in the next update, if the data is available.
A C K N O W L E D G E M E N T S
The authors would like to acknowledge the help provided by the
Cochrane Movement Disorders Group.
R E F E R E N C E S
References to studies included in this review
Mueller 2003 {published data only}
Müller T, Büttner T, Gholipour AF, Kuhn W. Coenzyme
Q10 supplementation provides mild symptomatic benefit
in patients with Parkinson’s disease. Neuroscience Letters
2003;341(3):201–4. [MEDLINE: 12697283]
Shults 2002 {published data only}
Shults CW, Oakes D, Kieburtz K, Beal MF, Haas R, Plumb
S, et al.Parkinson Study Group. Effects of coenzyme Q10
in early Parkinson disease: evidence of slowing of the
functional decline. Archives of Neurology 2002;59(10):
1541–50. [MEDLINE: 12374491]
Sotirios 2009 {published data only}
Parashos SA, Swearingen CJ, Biglan KM, Bodis-Wollner
I, Liang GS, Ross GW, et al.NET-PD Investigators.
Determinants of the timing of symptomatic treatment
in early Parkinson disease: The National Institutes of
Health Exploratory Trials in Parkinson Disease (NET-PD)
8Coenzyme Q10 for Parkinson’s disease (Review)
Copyright © 2011 The Cochrane Collaboration. Published by John Wiley & Sons, Ltd.

Experience. Archives of Neurology 2009;66(9):1099–104.
[MEDLINE: 19597081]
Storch 2007 {published data only}
Storch A, Jost WH, Vieregge P, Spiegel J, Greulich W,
Durner J, et al.German Coenzyme Q(10) Study Group.
Randomized, double-blind, placebo-controlled trial on
symptomatic effects of coenzyme Q(10) in Parkinson
disease. Archives of Neurology 2007;64(7):938–44.
[MEDLINE: 17502459]
The NINDS NET-PD 2007 {published data only}
NINDS NET-PD Investigators. A randomized clinical trial
of coenzyme Q10 and GPI-1485 in early Parkinson disease.
Neurology 2007;68(1):20–8. [MEDLINE: 17200487]
References to studies excluded from this review
Shults 2004 {published data only}
Shults CW, Flint Beal M, Song D, Fontaine D. Pilot trial of
high dosages of coenzyme Q10 in patients with Parkinson’s
disease. Experimental Neurology 2004;188(2):491–4.
[MEDLINE: 15246848]
Strijks 1997 {published data only}
Strijks E, Kremer HP, Horstink MW. Q10 therapy in
patients with idiopathic Parkinson’s disease. Molecular
Aspects of Medicine 1997;18 Suppl:237–40. [MEDLINE:
9266528]
References to ongoing studies
Phase III {unpublished data only}
Parkinson Study Group. Effects of Coenzyme Q10 in
Parkinson Disease - Phase III.
Additional references
Beal 1998
Beal MF, Matthews RT, Tieleman A, Shults CW.
Coenzyme Q10 attenuates the 1-methyl-4-phenyl-1,2,
3,6-tetrahydropyridine (MPTP) induced loss of striatal
dopamine and dopaminergic axons in aged mice. Brain
Research 1998;783:109–14.
Bonakdar 2005
Bonakdar RA, Guarneri E. Coenzyme Q10. Review.
American Family Physician 2005;72(6):1065–70.
Calne 1992
Calne DB, Snow BJ, Lee C. Criteria for diagnosing
Parkinson’s disease. Annals of Neurology 1992;32 Suppl:
125–7.
Crane 2001
Crane FL. Biochemical functions of coenzyme Q10. Journal
of the American College of Nutrition 2001;20(6):591–8.
Egger 1997
Egger M, Davey Smith G, Schneider M, Minder C. Bias
in meta analysis detected by a simple, graphical test. BMJ
1997;315(7190):629–34.
Fahn 1987
Fahn S, Elton RL, UPDRS Development Committee.
The Unified Parkinson’s Disease Rating Scale. In: Fahn S,
Marsden CD, Calne DB, editors. Recent Developments in
Parkinson’s Disease. Vol 2. Florham Park, NJ: Macmillan
Healthcare Information; 1987:153-163,293-304.
Hargreaves 2008
Hargreaves IP, Lane A, Sleiman PM. The coenzyme Q10
status of the brain regions of Parkinson’s disease patients.
Neuroscience Letters 2008;447(1):17–9.
Higgins 2003
Higgins JPT, Thompson SG, Deeks JJ, Altman DG.
Measuring inconsistency in meta-analyses. BMJ 2003, 327
(7414):557-60.
Ho 2009
Ho MJ, Bellusci A, Wright JM. Blood pressure lowering
efficacy of coenzyme Q10 for primary hypertension.
Cochrane Database Syst Rev 2009 Oct 7, (4):CD007435.
Horvath 2003
Horvath TL, Diano S, Leranth C, Garcia-Segura LM,
Cowley MA, Shanabrough M. Coenzyme Q induces nigral
mitochondrial uncoupling and prevents dopamine cell loss
in a primate model of Parkinson’s disease. Endocrinology
2003;144(7):2757–60.
Kumar 2009
Kumar A, Kaur H, Devi P, Mohan V. Role of coenzyme
Q10 in cardiac disease, hypertension and Meniere-like
syndrome. Pharmacol Ther 2009;124:259–268.
Lang 1998
Lang AE, Lozano AM. Parkinson’s disease. First of two
parts. New England Journal of Medicine 1998;339:1044–53.
Molyneux 2008
Molyneux SL, Young JM, Florkowski CM, Lever M, George
PM. Coenzyme Q10: Is There a Clinical Role and a Case
for Measurement?. Clinical Biochemistry Reviews 2008;29
(2):71–82.
Neutel 2007
Neutel D, Ferreira J, CoelhoMM, RosaMM, Rascol O,
Sampaio C. Piribedil versus levodopa in earlyParkinson’s
disease. CochraneDatabase of Systematic Reviews
2007, Issue 3. Art.No.: CD006710. DOI:
10.1002/14651858.CD006710.
Niklowitz 2007
Niklowitz P, Sonnenschein A, Janetzky B, Andler W, Menke
T. Enrichment of coenzymeQ10 in plasma and blood cells:
defense against oxidative damage. International Journal of
Biological Sciences 2007;3(4):257–62.
RevMan 2008
TheNordic Cochrane Centre, The Cochrane Collaboration.
Review Manager (RevMan). 5.0 for Windows.
Copenhagen: The Nordic Cochrane Centre, The Cochrane
Collaboration, 2008.
Shults 1997
Shults CW, Haas RH, Passov D, Beal MF. Coenzyme Q10
levels correlate with the activities of complexes I and II/III
in mitochondria from parkinsonian and nonparkinsonian
subjects. Annals of Neurology 1997;42(2):261–4.
9Coenzyme Q10 for Parkinson’s disease (Review)
Copyright © 2011 The Cochrane Collaboration. Published by John Wiley & Sons, Ltd.

Shults 2005
Shults CW. Therapeutic role of coenzyme Q10 in
Parkinson’s disease. Pharmacology & Therapeutics 2005;107
(1):120–30.
Strickland 2004
Strickland D, Bertoni JM. Parkinson’s prevalence estimated
by a state registry. Movement Disorders 2004;19(3):318–23.
Twelves 2003
Twelves D, Perkins K, Counsell C. Systematic Review
of Incidence Studies of Parkinson’s Disease. Movement
Disorders 2003;18(1):19–31.∗ Indicates the major publication for the study
10Coenzyme Q10 for Parkinson’s disease (Review)
Copyright © 2011 The Cochrane Collaboration. Published by John Wiley & Sons, Ltd.

C H A R A C T E R I S T I C S O F S T U D I E S
Characteristics of included studies [ordered by study ID]
Mueller 2003
Methods Single center, parallel-group, placebo-controlled, double-blind trial
Participants Germany
28 randomized: 7 males and 7 females to Co Q10 group ; 7 males and 7 females to
placebo group
Incl: Those who was treated and stable PD patients with statin free, CT or MRI scans
showed no evidence of any parenchymal lesion or atrophy
Excl: dementia, electrophysiological or neuroradiological evidence of additional CNS
pathology exceeding PD, previous exposure to neuroleptics or any drugs affecting the
dopaminergic system, treatment with digitalis, retinopathy or color blindness, i.e. red/
green
In placebo group, Mean age 64.36yrs, 50% male,Mean Total UPDRS score 17.36; FMT
118.79
In Co Q10 group, Mean age 66.21yrs, 50% male, Mean Total UPDRS score 23.29;
FMT 159.29
Interventions Daily oral application of 360 mg Co Q10 lasting 4 weeks or placebo. The optimum
titrated antiparkinson’s drug regime, consisting of levodopa/benserazide, one dopamine
agonist and/or selegiline, remained stable throughout the whole trial
Outcomes Total UPDRS score
UPDRS motor score
Farnsworth-Munsell 100 Hue test total error score
Notes Mean FU: 4 weeks
Risk of bias
Bias Authors’ judgement Support for judgement
Allocation concealment (selection bias) Low risk Quote: “We randomly (numbered con-
tainers) assigned participating, statin free,
non-fluctuating out-patients to one of the
groups.”
Comment: Adequate
Blinding (performance bias and detection
bias)
All outcomes
Low risk Quote: “followed them under double-blind
conditions.” “We blinded UPDRS raters to
the results of the FMT at both timepoints.
”
Comment: Adequate
11Coenzyme Q10 for Parkinson’s disease (Review)
Copyright © 2011 The Cochrane Collaboration. Published by John Wiley & Sons, Ltd.

Mueller 2003 (Continued)
Incomplete outcome data (attrition bias)
All outcomes
Low risk Quote: “All participants were reevaluated
under identical conditions 4 weeks later.”
Comment: All randomized patients were
included.
Shults 2002
Methods Multicenter, randomized, double-blind, placebo-controlled, with 4 parallel groups
Participants The United States (10 Parkinson Study Group sites)
80 randomized: 16 to placebo, 21 to 300 mg/d, 20 to 600 mg/d, 23 to 1200 mg/d
Incl: The diagnosis of PD have been made within the previous 5 years in men or in
women 30 years or older, and did not require treatment for their disability
Excl: Any medication for PD within 60 days before the baseline visit. secondary parkin-
sonism, MMSE< 24, other nervous system disease and serious illness
In placebo group, Mean age 63.1yrs, 75% male, Mean Total UPDRS score 24.1
In Co Q10 300 mg/d group, Mean age 60.9yrs, 57% male, Mean Total UPDRS score
23.9
In Co Q10 600 mg/d group, Mean age 61.9yrs, 70% male, Mean Total UPDRS score
23.0
In Co Q10 1200 mg/d group, Mean age 59.9yrs, 61% male, Mean Total UPDRS score
22.7
Interventions Placebo, or Co Q10 300 mg/d, 600 mg/d and 1200 mg/d respectively
Outcomes Total UPDRS score
UPDRS mental score
UPDRS motor score
UPDRS ADL score
Percentage of patients who was considered to required levodopa
Plasma Co Q10 levels
NADH to cytochrome-c reductase
Adverse events
Notes Median FU: 16 months for all the outcomes
Risk of bias
Bias Authors’ judgement Support for judgement
Allocation concealment (selection bias) Low risk Quote: “allocation using a computer-gen-
erated randomization plan that included
stratification by the investigator and block-
ing (with a block size of 8) to ensure that
each investigator had approximately the
same number of subjects assigned to each
treatment group.”
Comment: Adequate
12Coenzyme Q10 for Parkinson’s disease (Review)
Copyright © 2011 The Cochrane Collaboration. Published by John Wiley & Sons, Ltd.

Shults 2002 (Continued)
Blinding (performance bias and detection
bias)
All outcomes
Low risk Quote: “ Subjects, enrolling investigators,
enrolling coordinators, and other person-
nel involved in the care of the patients and
the acquisition and analysis of data were
masked to treatment assignment until com-
pletion of the study.”
Comment: Adequate
Incomplete outcome data (attrition bias)
All outcomes
Low risk Quote: “ Three subjects prematurely ter-
minated or were lost to follow-up from the
study before the investigator determined
that they had reached the point that their
disability warranted use of levodopa. In-
creased tremor, lower-back pain, and in-
creased nocturia developed in 1 subject
who was receiving 1200 mg/d of Co Q10
and who prematurely terminated. This
subject was noncompliant, and the inves-
tigator did not believe that the symptoms
were related to the study drug. This subject
was lost to follow-up.”
Comment: Withdrawals after randomiza-
tion were included in data analysis, and the
reasons were specified
Sotirios 2009
Methods Please see The NINDS NET-PD 2007
Participants Please see The NINDS NET-PD 2007
Interventions Please see The NINDS NET-PD 2007
Outcomes Please see The NINDS NET-PD 2007
Notes Please see The NINDS NET-PD 2007
Risk of bias
Bias Authors’ judgement Support for judgement
Allocation concealment (selection bias) Low risk Please see The NINDS NET-PD 2007
Blinding (performance bias and detection
bias)
All outcomes
Low risk Please see The NINDS NET-PD 2007
13Coenzyme Q10 for Parkinson’s disease (Review)
Copyright © 2011 The Cochrane Collaboration. Published by John Wiley & Sons, Ltd.

Sotirios 2009 (Continued)
Incomplete outcome data (attrition bias)
All outcomes
Low risk Please see The NINDS NET-PD 2007
Storch 2007
Methods Multicenter, randomized, double-blind, placebo-controlled, stratified, parallel-group,
single-dose trial
Participants Germany, at 13 movement disorder clinics, from September 2003 to January 2005
131 randomized: 67 to placebo, including 46 with levodopa; 64 to Co Q10, including
43 with levodopa
Incl: Subjects were between 40 and 75 years of age, had received the diagnosis of PD
according to the UK Brain Bank criteria had a rating on the modified Hoehn-Yahr scale
between II and III and 16 points or more on the UPDRS motor score and were on stable
antiparkinsonian medication with or without levodopa for at least 4 weeks prior to study
enrollment
Excl: They had been exposed to Co Q10 during the last 3 months prior to study inclu-
sion; were taking more than 149 IU of vitamin E or calcium, magnesium, and/or other
vitamins for more than 3 months prior to study inclusion; were receiving cholesterol-
lowering drugs, thyroid hormones, antiarrhythmic compounds, warfarin, metformin, or
clozapine; had an identifiable cause of parkinsonism or signs for atypical parkinsonian
disorders; had hypothyroidism or current evidence of epilepsy or psychosis; or had lev-
odopa-induced motor fluctuations or dyskinesias
In placebo group, Mean age 62.3yrs, 70.1% male, 68.7% with levodopa therapy, Mean
Co Q10 plasma level 0.94ug/mL3 ; Mean total UPDRS score 38.6
In Co Q10 group, Mean age 60.7yrs, 68.7% male, 67.2% with levodopa therapy, Mean
Co Q10 plasma level 0.99ug/mL3 ; Mean total UPDRS score 35.5
Interventions Nanoparticular Co Q10 suspension 100 mg 3 times a day or matching placebo for a
treatment period of 3 months. After that, the subjects underwent a withdrawal from
study drug for 2 months and a final assessment of the severity of the symptoms of PD was
made. Doses of levodopa and all other antiparkinsonian medications were kept constant
throughout the study
Outcomes UPDRS ADL score
UPDRS motor score
Total UPDRS score
Hoehn and Yahr scale
Plasma Co Q10 levels
Adverse events and withdrawals due to adverse event
Notes Mean FU: 2 months after 3 months treatment period
Risk of bias
Bias Authors’ judgement Support for judgement
14Coenzyme Q10 for Parkinson’s disease (Review)
Copyright © 2011 The Cochrane Collaboration. Published by John Wiley & Sons, Ltd.

Storch 2007 (Continued)
Allocation concealment (selection bias) Low risk Quote: “Subjects were randomly assigned
to nanoparticular Co Q10 suspension (100
mg 3 times a day; Nanoquinon from MSE
Pharmazeutika) or matching placebo for a
treatment period of 3 months centrally by
the contract research organization accord-
ing to a randomization list generated by 1
of us (R.K.). Randomization was stratified
by comedication of levodopa.”
Comment: Adequate
Blinding (performance bias and detection
bias)
All outcomes
Low risk Quote: “We therefore undertook a ran-
domized, double-blind, placebo-controlled
trial on symptomatic effects of nanopartic-
ular CoQ10 in stable patients with mid-
stage PD, a randomization list generated by
1 of us (R.K.).”
Comment: The author should point out if
R.K. go on to participate the next step after
randomization
Incomplete outcome data (attrition bias)
All outcomes
Low risk Quote: “changes of antiparkinsonian med-
ication led to exclusion from the perpro-
tocol population in 4 and 3 subjects, re-
spectively. All randomized patients were in-
cluded in the primary efficacy and safety
analysis (intent-to-treat population), but
13 patients were excluded from the Co Q10
group and 12 from the placebo group for
additional per-protocol population analy-
ses of primary and all secondary efficacy
measures due to protocol violations or dis-
continuation of the study.”
Comment: Withdrawals after randomiza-
tion were included in data analysis, and the
reasons were specified
The NINDS NET-PD 2007
Methods A randomized, double-blind, calibrated futility clinical trial of Co Q10 and GPI-1485
in early untreated PD using placebo data from the DATATOP study to establish the
futility threshold
Participants 213 randomized: 71 received Co Q10, 71 received GPI-1485, and 71 received placebo
Incl: Participants were men and women aged 30 and over who had a diagnosis of PD but
did not require any medications for the treatment of their symptoms at the time of study
entry. Two of three cardinal manifestations of PD (tremor, rigidity, and bradykinesia)
were required; these findings had to be asymmetric. The diagnosis of PD must have been
15Coenzyme Q10 for Parkinson’s disease (Review)
Copyright © 2011 The Cochrane Collaboration. Published by John Wiley & Sons, Ltd.

The NINDS NET-PD 2007 (Continued)
made within 5 years of randomization. Women of childbearing potential were required
to use adequate birth control and have a negative pregnancy test at baseline
Excl: Those who had any secondary causes of parkinsonism, such as drug-induced parkin-
sonism or structural lesions; atypical parkinsonian syndromes; gait freezing or impair-
ment in postural reflexes; prior stereotaxic surgery for PD; used GPI-1485 or Co Q10
or an investigational agent within 90 days prior to randomization; known hypersensitiv-
ity to Co Q10 or GPI-1485; or any clinically significant medical condition that could
interfere with the subject’s ability to safely participate in the study or to be followed
In Co Q10 group, Mean age 60.7yrs, 61% male, Mean total UPDRS score 22.5, Hoehn
and Yahr 1.49
In GPI-1485 group, Mean age 62.2yrs, 65% male, Mean total UPDRS score 22.0,
Hoehn and Yahr 1.54
In placebo group, Mean age 60.1yrs, 70% male, Mean total UPDRS score 22.6, Hoehn
and Yahr 1.41
Interventions The participants may receive 1) 2400 mg of Co Q10 and placebo for GPI-1485; 2)
placebo for Co Q10 and 4000 mg of GPI-1485; or 3) placebo for Co Q10 and placebo
for GPI-1485
Outcomes Total UPDRS score
UPDRS motor score
UPDRS mental score
UPDRS ADL score
Hoehn and Yahr scale
Serious adverse events and withdrawals due to adverse event
Notes Mean FU: 12 months
Risk of bias
Bias Authors’ judgement Support for judgement
Allocation concealment (selection bias) Low risk Quote: “The statistical center generated the
random allocations sequence, and the sites
accessed the blinded treatment assignment
via a secured web page.”
Comment: Adequate
Blinding (performance bias and detection
bias)
All outcomes
Low risk Quote: “Subjects and investigators were
kept blinded to treatment group.”
Comment: Adequate
Incomplete outcome data (attrition bias)
All outcomes
Low risk Quote: “There were few missed visits with
only three subjects in the GPI-1485 arm,
one subject in the Co Q10 arm, and no con-
trols having missing values requiring impu-
tation.”
Comment: Withdrawals after randomiza-
tion were included in data analysis
16Coenzyme Q10 for Parkinson’s disease (Review)
Copyright © 2011 The Cochrane Collaboration. Published by John Wiley & Sons, Ltd.

Excl: excluded
FU: follow up
Incl: included
Characteristics of excluded studies [ordered by study ID]
Study Reason for exclusion
Shults 2004 Not an RCT - open-label trial without matched controls
Strijks 1997 Not an RCT - open-label trial without matched controls
Characteristics of ongoing studies [ordered by study ID]
Phase III
Trial name or title Effects of coenzyme Q10 in Parkinson’s Disease - Phase III
Methods Treatment, randomized, double blind (participant, caregiver, investigator, outcomes assessor), parallel assign-
ment, safety and efficacy study
Participants Those people who has presence of all 3 of the cardinal features of PD (resting tremor, bradykinesia and
rigidity). The clinical signs must be asymmetric. The diagnosis of PD within 5 years prior to the screening
visit. Age 30 or older. Female subjects must not be of childbearing potential or must use an approved form
of contraception for the duration of the trial
Sample size: 600
Interventions Co Q10 2400 mg/day with vitamin E 1200 IU/day versus placebo with vitamin E 1200 IU/day
Outcomes Time frame: Over 16 months (Screening, Baseline, 1, 4, 8, 12 and 16 month visits)
Primary outcomes: Change in UPDRS total score (sum of parts I, II and III)
Secondary outcomes: Change in Modified Schwab and England Scale; modified Rankin Scale; PD qualify of
life scale; Symbol Digit Modalities Test; adverse experiences and abnormal lab values
Starting date August 22, 2008
Contact information Principal Investigator: M. Flint Beal, MD
Weill Medical College of Cornell University, New York Hospital Department of Neurology
Notes This study is currently recruiting participants.
Last Updated: October 14, 2009
17Coenzyme Q10 for Parkinson’s disease (Review)
Copyright © 2011 The Cochrane Collaboration. Published by John Wiley & Sons, Ltd.

D A T A A N D A N A L Y S E S
Comparison 1. Co Q10 versus placebo
Outcome or subgroup titleNo. of
studies
No. of
participants Statistical method Effect size
1 Total UPDRS score change 3 330 Mean Difference (IV, Fixed, 95% CI) 0.49 [-0.64, 1.63]
1.1 300-400mg/d VS Placebo 2 80 Mean Difference (IV, Fixed, 95% CI) 0.83 [-0.97, 2.63]
1.2 600mg/d VS Placebo 1 50 Mean Difference (IV, Fixed, 95% CI) 0.60 [-3.10, 4.31]
1.3 1200mg/d VS Placebo 1 58 Mean Difference (IV, Fixed, 95% CI) -0.25 [-2.18, 1.67]
1.4 2400mg/d VS Placebo 1 142 Mean Difference (IV, Fixed, 95% CI) 1.21 [-1.64, 4.06]
2 Motor UPDRS 3 330 Mean Difference (IV, Fixed, 95% CI) -0.07 [-0.71, 0.58]
2.1 300-400mg/d VS Placebo 2 80 Mean Difference (IV, Fixed, 95% CI) -0.27 [-0.99, 0.45]
2.2 600mg/d VS Placebo 1 50 Mean Difference (IV, Fixed, 95% CI) 0.89 [-2.02, 3.81]
2.3 1200mg/d VS Placebo 1 58 Mean Difference (IV, Fixed, 95% CI) 0.37 [-2.31, 3.04]
2.4 2400mg/d VS Placebo 1 142 Mean Difference (IV, Fixed, 95% CI) 0.94 [-1.17, 3.05]
3 Mental UPDRS 2 302 Mean Difference (IV, Fixed, 95% CI) -0.07 [-0.30, 0.17]
3.1 300-400mg/d VS Placebo 1 52 Mean Difference (IV, Fixed, 95% CI) -0.16 [-0.65, 0.33]
3.2 600mg/d VS Placebo 1 50 Mean Difference (IV, Fixed, 95% CI) -0.13 [-0.62, 0.37]
3.3 1200mg/d VS Placebo 1 58 Mean Difference (IV, Fixed, 95% CI) -0.22 [-0.67, 0.24]
3.4 2400mg/d VS Placebo 1 142 Mean Difference (IV, Fixed, 95% CI) 0.20 [-0.24, 0.64]
4 ADL UPDRS 2 302 Mean Difference (IV, Fixed, 95% CI) -0.52 [-1.15, 0.11]
4.1 300-400mg/d VS Placebo 1 52 Mean Difference (IV, Fixed, 95% CI) -0.83 [-2.31, 0.64]
4.2 600mg/d VS Placebo 1 50 Mean Difference (IV, Fixed, 95% CI) -0.29 [-1.77, 1.19]
4.3 1200mg/d VS Placebo 1 58 Mean Difference (IV, Fixed, 95% CI) -1.65 [-3.01, -0.29]
4.4 2400mg/d VS Placebo 1 142 Mean Difference (IV, Fixed, 95% CI) 0.11 [-0.87, 1.09]
5 Hoehn & Yahr 2 302 Mean Difference (IV, Fixed, 95% CI) 0.05 [-0.05, 0.15]
5.1 300-400mg/d VS Placebo 1 52 Mean Difference (IV, Fixed, 95% CI) 0.08 [-0.11, 0.28]
5.2 600mg/d VS Placebo 1 50 Mean Difference (IV, Fixed, 95% CI) 0.05 [-0.15, 0.25]
5.3 1200mg/d VS Placebo 1 58 Mean Difference (IV, Fixed, 95% CI) 0.06 [-0.12, 0.24]
5.4 2400mg/d VS Placebo 1 142 Mean Difference (IV, Fixed, 95% CI) 0.01 [-0.20, 0.22]
6 Schwab & England (investigator) 2 302 Mean Difference (IV, Fixed, 95% CI) 0.30 [-0.79, 1.39]
6.1 300-400mg/d VS Placebo 1 52 Mean Difference (IV, Fixed, 95% CI) 0.27 [-1.87, 2.41]
6.2 600mg/d VS Placebo 1 50 Mean Difference (IV, Fixed, 95% CI) -0.13 [-2.28, 2.01]
6.3 1200mg/d VS Placebo 1 58 Mean Difference (IV, Fixed, 95% CI) 1.22 [-0.75, 3.19]
6.4 2400mg/d VS Placebo 1 142 Mean Difference (IV, Fixed, 95% CI) -0.60 [-3.20, 2.00]
7 severe viral infection 2 211 Risk Ratio (M-H, Fixed, 95% CI) 0.55 [0.18, 1.68]
7.1 300mg/d VS Placebo 2 157 Risk Ratio (M-H, Fixed, 95% CI) 0.40 [0.10, 1.61]
7.2 600mg/d VS Placebo 1 25 Risk Ratio (M-H, Fixed, 95% CI) 0.86 [0.04, 18.45]
7.3 1200mg/d VS Placebo 1 29 Risk Ratio (M-H, Fixed, 95% CI) 1.46 [0.08, 26.97]
8 Pharyngitis 1 80 Risk Ratio (M-H, Fixed, 95% CI) 1.04 [0.18, 5.89]
8.1 300mg/d VS Placebo 1 26 Risk Ratio (M-H, Fixed, 95% CI) 0.82 [0.04, 17.64]
8.2 600mg/d VS Placebo 1 25 Risk Ratio (M-H, Fixed, 95% CI) 0.86 [0.04, 18.45]
8.3 1200mg/d VS Placebo 1 29 Risk Ratio (M-H, Fixed, 95% CI) 1.46 [0.08, 26.97]
9 Sinusitis 2 222 Risk Ratio (M-H, Fixed, 95% CI) 0.75 [0.30, 1.92]
9.1 300mg/d VS Placebo 1 26 Risk Ratio (M-H, Fixed, 95% CI) 1.36 [0.08, 24.76]
9.2 600mg/d VS Placebo 1 25 Risk Ratio (M-H, Fixed, 95% CI) 0.0 [0.0, 0.0]
9.3 1200mg/d VS Placebo 1 29 Risk Ratio (M-H, Fixed, 95% CI) 1.46 [0.08, 26.97]
9.4 2400mg/d VS Placebo 1 142 Risk Ratio (M-H, Fixed, 95% CI) 0.63 [0.21, 1.82]
10 Flatulence 1 80 Risk Ratio (M-H, Fixed, 95% CI) 0.26 [0.06, 1.04]
18Coenzyme Q10 for Parkinson’s disease (Review)
Copyright © 2011 The Cochrane Collaboration. Published by John Wiley & Sons, Ltd.

10.1 300mg/d VS Placebo 1 26 Risk Ratio (M-H, Fixed, 95% CI) 0.09 [0.00, 1.96]
10.2 600mg/d VS Placebo 1 25 Risk Ratio (M-H, Fixed, 95% CI) 0.5 [0.06, 4.47]
10.3 1200mg/d VS Placebo 1 29 Risk Ratio (M-H, Fixed, 95% CI) 0.26 [0.02, 3.59]
11 Back pain 2 222 Risk Ratio (M-H, Fixed, 95% CI) 1.00 [0.43, 2.35]
11.1 300mg/d VS Placebo 1 26 Risk Ratio (M-H, Fixed, 95% CI) 0.48 [0.05, 4.27]
11.2 600mg/d VS Placebo 1 25 Risk Ratio (M-H, Fixed, 95% CI) 0.25 [0.02, 3.34]
11.3 1200mg/d VS Placebo 1 29 Risk Ratio (M-H, Fixed, 95% CI) 1.04 [0.14, 7.70]
11.4 2400mg/d VS Placebo 1 142 Risk Ratio (M-H, Fixed, 95% CI) 1.5 [0.44, 5.09]
12 Coughing 2 222 Risk Ratio (M-H, Fixed, 95% CI) 0.53 [0.21, 1.36]
12.1 300mg/d VS Placebo 1 26 Risk Ratio (M-H, Fixed, 95% CI) 0.24 [0.02, 3.19]
12.2 600mg/d VS Placebo 1 25 Risk Ratio (M-H, Fixed, 95% CI) 0.25 [0.02, 3.34]
12.3 1200mg/d VS Placebo 1 29 Risk Ratio (M-H, Fixed, 95% CI) 0.26 [0.02, 3.59]
12.4 2400mg/d VS Placebo 1 142 Risk Ratio (M-H, Fixed, 95% CI) 0.8 [0.22, 2.86]
13 Diarrhea 3 353 Risk Ratio (M-H, Fixed, 95% CI) 1.39 [0.62, 3.16]
13.1 300mg/d VS Placebo 2 157 Risk Ratio (M-H, Fixed, 95% CI) 3.51 [0.68, 18.19]
13.2 600mg/d VS Placebo 1 25 Risk Ratio (M-H, Fixed, 95% CI) 0.86 [0.04, 18.45]
13.3 1200mg/d VS Placebo 1 29 Risk Ratio (M-H, Fixed, 95% CI) 1.46 [0.08, 26.97]
13.4 2400mg/d VS Placebo 1 142 Risk Ratio (M-H, Fixed, 95% CI) 0.83 [0.27, 2.61]
14 Fall 2 222 Risk Ratio (M-H, Fixed, 95% CI) 0.55 [0.22, 1.35]
14.1 300mg/d VS Placebo 1 26 Risk Ratio (M-H, Fixed, 95% CI) 0.71 [0.09, 5.51]
14.2 600mg/d VS Placebo 1 25 Risk Ratio (M-H, Fixed, 95% CI) 0.10 [0.00, 2.05]
14.3 1200mg/d VS Placebo 1 29 Risk Ratio (M-H, Fixed, 95% CI) 0.26 [0.02, 3.59]
14.4 2400mg/d VS Placebo 1 142 Risk Ratio (M-H, Fixed, 95% CI) 0.8 [0.22, 2.86]
15 Fatigue 2 222 Risk Ratio (M-H, Fixed, 95% CI) 0.32 [0.12, 0.85]
15.1 300mg/d VS Placebo 1 26 Risk Ratio (M-H, Fixed, 95% CI) 0.48 [0.05, 4.27]
15.2 600mg/d VS Placebo 1 25 Risk Ratio (M-H, Fixed, 95% CI) 0.25 [0.02, 3.34]
15.3 1200mg/d VS Placebo 1 29 Risk Ratio (M-H, Fixed, 95% CI) 0.10 [0.00, 2.13]
15.4 2400mg/d VS Placebo 1 142 Risk Ratio (M-H, Fixed, 95% CI) 0.38 [0.10, 1.36]
16 Hypercholesterolemia 2 223 Risk Ratio (M-H, Fixed, 95% CI) 0.14 [0.04, 0.44]
16.1 300mg/d VS Placebo 1 26 Risk Ratio (M-H, Fixed, 95% CI) 0.12 [0.01, 1.07]
16.2 600mg/d VS Placebo 1 26 Risk Ratio (M-H, Fixed, 95% CI) 0.05 [0.00, 0.99]
16.3 1200mg/d VS Placebo 1 29 Risk Ratio (M-H, Fixed, 95% CI) 0.13 [0.01, 1.21]
16.4 2400mg/d VS Placebo 1 142 Risk Ratio (M-H, Fixed, 95% CI) 0.25 [0.03, 2.18]
17 Number of withdrawals due to
adverse effects
4 381 Risk Ratio (M-H, Fixed, 95% CI) 0.61 [0.23, 1.62]
Comparison 2. Long-term efficacy of Co Q10 versus placebo
Outcome or subgroup titleNo. of
studies
No. of
participants Statistical method Effect size
1 Total UPDRS score change 2 222 Mean Difference (IV, Fixed, 95% CI) -0.27 [-2.61, 2.07]
1.1 300mg/d VS Placebo 1 26 Mean Difference (IV, Fixed, 95% CI) -3.18 [-10.49, 4.13]
1.2 600mg/d VS Placebo 1 25 Mean Difference (IV, Fixed, 95% CI) -1.17 [-8.50, 6.16]
1.3 1200mg/d VS Placebo 1 29 Mean Difference (IV, Fixed, 95% CI) -5.3 [-12.03, 1.43]
1.4 2400mg/d VS Placebo 1 142 Mean Difference (IV, Fixed, 95% CI) 1.21 [-1.64, 4.06]
2 Motor UPDRS 2 222 Mean Difference (IV, Fixed, 95% CI) 0.33 [-1.41, 2.06]
2.1 300mg/d VS Placebo 1 26 Mean Difference (IV, Fixed, 95% CI) -0.66 [-6.09, 4.77]
2.2 600mg/d VS Placebo 1 25 Mean Difference (IV, Fixed, 95% CI) -0.07 [-5.51, 5.37]
2.3 1200mg/d VS Placebo 1 29 Mean Difference (IV, Fixed, 95% CI) -1.93 [-6.92, 3.06]
19Coenzyme Q10 for Parkinson’s disease (Review)
Copyright © 2011 The Cochrane Collaboration. Published by John Wiley & Sons, Ltd.

2.4 2400mg/d VS Placebo 1 142 Mean Difference (IV, Fixed, 95% CI) 0.94 [-1.17, 3.05]
3 Mental UPDRS 2 222 Mean Difference (IV, Fixed, 95% CI) -0.11 [-0.44, 0.21]
3.1 300mg/d VS Placebo 1 26 Mean Difference (IV, Fixed, 95% CI) -0.36 [-1.23, 0.51]
3.2 600mg/d VS Placebo 1 25 Mean Difference (IV, Fixed, 95% CI) -0.55 [-1.42, 0.32]
3.3 1200mg/d VS Placebo 1 29 Mean Difference (IV, Fixed, 95% CI) -0.57 [-1.37, 0.23]
3.4 2400mg/d VS Placebo 1 142 Mean Difference (IV, Fixed, 95% CI) 0.20 [-0.24, 0.64]
4 ADL UPDRS 2 222 Mean Difference (IV, Fixed, 95% CI) -0.45 [-1.30, 0.40]
4.1 300mg/d VS Placebo 1 26 Mean Difference (IV, Fixed, 95% CI) -2.2 [-5.20, 0.80]
4.2 600mg/d VS Placebo 1 25 Mean Difference (IV, Fixed, 95% CI) -0.72 [-3.73, 2.29]
4.3 1200mg/d VS Placebo 1 29 Mean Difference (IV, Fixed, 95% CI) -3.12 [-5.88, -0.36]
4.4 2400mg/d VS Placebo 1 142 Mean Difference (IV, Fixed, 95% CI) 0.11 [-0.87, 1.09]
5 Hoehn & Yahr 2 222 Mean Difference (IV, Fixed, 95% CI) 0.08 [-0.04, 0.21]
5.1 300mg/d VS Placebo 1 26 Mean Difference (IV, Fixed, 95% CI) 0.14 [-0.14, 0.42]
5.2 600mg/d VS Placebo 1 25 Mean Difference (IV, Fixed, 95% CI) 0.13 [-0.15, 0.41]
5.3 1200mg/d VS Placebo 1 29 Mean Difference (IV, Fixed, 95% CI) 0.11 [-0.15, 0.37]
5.4 2400mg/d VS Placebo 1 142 Mean Difference (IV, Fixed, 95% CI) 0.01 [-0.20, 0.22]
6 Schwab & England (investigator) 2 222 Mean Difference (IV, Fixed, 95% CI) 1.11 [-0.75, 2.97]
6.1 300mg/d VS Placebo 1 26 Mean Difference (IV, Fixed, 95% CI) 3.09 [-1.66, 7.84]
6.2 600mg/d VS Placebo 1 25 Mean Difference (IV, Fixed, 95% CI) 0.95 [-3.82, 5.72]
6.3 1200mg/d VS Placebo 1 29 Mean Difference (IV, Fixed, 95% CI) 4.43 [0.05, 8.81]
6.4 2400mg/d VS Placebo 1 142 Mean Difference (IV, Fixed, 95% CI) -0.60 [-3.20, 2.00]
Analysis 1.1. Comparison 1 Co Q10 versus placebo, Outcome 1 Total UPDRS score change.
Review: Coenzyme Q10 for Parkinson’s disease
Comparison: 1 Co Q10 versus placebo
Outcome: 1 Total UPDRS score change
Study or subgroup CoQ10 PlaceboMean
Difference WeightMean
Difference
N Mean(SD) N Mean(SD) IV,Fixed,95% CI IV,Fixed,95% CI
1 300-400mg/d VS Placebo
Mueller 2003 14 2.29 (2.92) 14 1.21 (2.64) 30.4 % 1.08 [ -0.98, 3.14 ]
Shults 2002 21 8.81 (7.45) 5 11.99 (7.51) 2.4 % -3.18 [ -10.49, 4.13 ]
Shults 2002 21 1.35 (4.36) 5 0.22 (4.4) 7.0 % 1.13 [ -3.15, 5.41 ]
Subtotal (95% CI) 56 24 39.9 % 0.83 [ -0.97, 2.63 ]
Heterogeneity: Chi2 = 1.23, df = 2 (P = 0.54); I2 =0.0%
Test for overall effect: Z = 0.90 (P = 0.37)
2 600mg/d VS Placebo
Shults 2002 20 10.82 (7.34) 5 11.99 (7.51) 2.4 % -1.17 [ -8.50, 6.16 ]
Shults 2002 20 1.43 (4.31) 5 0.22 (4.4) 7.0 % 1.21 [ -3.08, 5.50 ]
-100 -50 0 50 100
Favours CoQ10 Favours Placebo
(Continued . . . )
20Coenzyme Q10 for Parkinson’s disease (Review)
Copyright © 2011 The Cochrane Collaboration. Published by John Wiley & Sons, Ltd.

(. . . Continued)
Study or subgroup CoQ10 PlaceboMean
Difference WeightMean
Difference
N Mean(SD) N Mean(SD) IV,Fixed,95% CI IV,Fixed,95% CI
Subtotal (95% CI) 40 10 9.4 % 0.60 [ -3.10, 4.31 ]
Heterogeneity: Chi2 = 0.30, df = 1 (P = 0.58); I2 =0.0%
Test for overall effect: Z = 0.32 (P = 0.75)
3 1200mg/d VS Placebo
Shults 2002 23 6.69 (7.4) 6 11.99 (7.51) 2.9 % -5.30 [ -12.03, 1.43 ]
Shults 2002 23 0.42 (4.32) 6 0.22 (1.2) 32.0 % 0.20 [ -1.81, 2.21 ]
Subtotal (95% CI) 46 12 34.9 % -0.25 [ -2.18, 1.67 ]
Heterogeneity: Chi2 = 2.36, df = 1 (P = 0.12); I2 =58%
Test for overall effect: Z = 0.26 (P = 0.80)
4 2400mg/d VS Placebo
The NINDS NET-PD 2007 71 7.52 (8.87) 71 6.31 (8.47) 15.9 % 1.21 [ -1.64, 4.06 ]
Subtotal (95% CI) 71 71 15.9 % 1.21 [ -1.64, 4.06 ]
Heterogeneity: not applicable
Test for overall effect: Z = 0.83 (P = 0.41)
Total (95% CI) 213 117 100.0 % 0.49 [ -0.64, 1.63 ]
Heterogeneity: Chi2 = 4.84, df = 7 (P = 0.68); I2 =0.0%
Test for overall effect: Z = 0.85 (P = 0.40)
Test for subgroup differences: Chi2 = 0.95, df = 3 (P = 0.81), I2 =0.0%
-100 -50 0 50 100
Favours CoQ10 Favours Placebo
21Coenzyme Q10 for Parkinson’s disease (Review)
Copyright © 2011 The Cochrane Collaboration. Published by John Wiley & Sons, Ltd.

Analysis 1.2. Comparison 1 Co Q10 versus placebo, Outcome 2 Motor UPDRS.
Review: Coenzyme Q10 for Parkinson’s disease
Comparison: 1 Co Q10 versus placebo
Outcome: 2 Motor UPDRS
Study or subgroup CoQ10 PlaceboMean
Difference WeightMean
Difference
N Mean(SD) N Mean(SD) IV,Fixed,95% CI IV,Fixed,95% CI
1 300-400mg/d VS Placebo
Mueller 2003 14 0.29 (0.61) 14 0.64 (1.28) 75.1 % -0.35 [ -1.09, 0.39 ]
Shults 2002 21 1.54 (3.48) 5 0 (3.54) 3.5 % 1.54 [ -1.90, 4.98 ]
Shults 2002 21 5.88 (5.5) 5 6.54 (5.58) 1.4 % -0.66 [ -6.09, 4.77 ]
Subtotal (95% CI) 56 24 80.0 % -0.27 [ -0.99, 0.45 ]
Heterogeneity: Chi2 = 1.13, df = 2 (P = 0.57); I2 =0.0%
Test for overall effect: Z = 0.74 (P = 0.46)
2 600mg/d VS Placebo
Shults 2002 20 6.47 (5.43) 5 6.54 (5.58) 1.4 % -0.07 [ -5.51, 5.37 ]
Shults 2002 20 1.28 (3.44) 5 0 (3.54) 3.5 % 1.28 [ -2.17, 4.73 ]
Subtotal (95% CI) 40 10 4.9 % 0.89 [ -2.02, 3.81 ]
Heterogeneity: Chi2 = 0.17, df = 1 (P = 0.68); I2 =0.0%
Test for overall effect: Z = 0.60 (P = 0.55)
3 1200mg/d VS Placebo
Shults 2002 23 4.61 (5.47) 6 6.54 (5.58) 1.7 % -1.93 [ -6.92, 3.06 ]
Shults 2002 23 1.29 (3.47) 6 0 (3.54) 4.1 % 1.29 [ -1.88, 4.46 ]
Subtotal (95% CI) 46 12 5.8 % 0.37 [ -2.31, 3.04 ]
Heterogeneity: Chi2 = 1.14, df = 1 (P = 0.29); I2 =12%
Test for overall effect: Z = 0.27 (P = 0.79)
4 2400mg/d VS Placebo
The NINDS NET-PD 2007 71 4.73 (6.66) 71 3.79 (6.16) 9.3 % 0.94 [ -1.17, 3.05 ]
Subtotal (95% CI) 71 71 9.3 % 0.94 [ -1.17, 3.05 ]
Heterogeneity: not applicable
Test for overall effect: Z = 0.87 (P = 0.38)
Total (95% CI) 213 117 100.0 % -0.07 [ -0.71, 0.58 ]
Heterogeneity: Chi2 = 4.14, df = 7 (P = 0.76); I2 =0.0%
Test for overall effect: Z = 0.20 (P = 0.84)
Test for subgroup differences: Chi2 = 1.71, df = 3 (P = 0.64), I2 =0.0%
-100 -50 0 50 100
Favours CoQ10 Favours Placebo
22Coenzyme Q10 for Parkinson’s disease (Review)
Copyright © 2011 The Cochrane Collaboration. Published by John Wiley & Sons, Ltd.

Analysis 1.3. Comparison 1 Co Q10 versus placebo, Outcome 3 Mental UPDRS.
Review: Coenzyme Q10 for Parkinson’s disease
Comparison: 1 Co Q10 versus placebo
Outcome: 3 Mental UPDRS
Study or subgroup CoQ10 PlaceboMean
Difference WeightMean
Difference
N Mean(SD) N Mean(SD) IV,Fixed,95% CI IV,Fixed,95% CI
1 300-400mg/d VS Placebo
Shults 2002 21 0.54 (0.89) 5 0.9 (0.89) 7.3 % -0.36 [ -1.23, 0.51 ]
Shults 2002 21 -0.29 (0.62) 5 -0.22 (0.61) 15.4 % -0.07 [ -0.67, 0.53 ]
Subtotal (95% CI) 42 10 22.7 % -0.16 [ -0.65, 0.33 ]
Heterogeneity: Chi2 = 0.29, df = 1 (P = 0.59); I2 =0.0%
Test for overall effect: Z = 0.65 (P = 0.52)
2 600mg/d VS Placebo
Shults 2002 20 -0.15 (0.62) 5 -0.22 (0.61) 15.2 % 0.07 [ -0.53, 0.67 ]
Shults 2002 20 0.35 (0.89) 5 0.9 (0.89) 7.2 % -0.55 [ -1.42, 0.32 ]
Subtotal (95% CI) 40 10 22.5 % -0.13 [ -0.62, 0.37 ]
Heterogeneity: Chi2 = 1.32, df = 1 (P = 0.25); I2 =24%
Test for overall effect: Z = 0.51 (P = 0.61)
3 1200mg/d VS Placebo
Shults 2002 23 -0.27 (0.61) 6 -0.22 (0.61) 18.3 % -0.05 [ -0.60, 0.50 ]
Shults 2002 23 0.33 (0.89) 6 0.9 (0.89) 8.6 % -0.57 [ -1.37, 0.23 ]
Subtotal (95% CI) 46 12 26.8 % -0.22 [ -0.67, 0.24 ]
Heterogeneity: Chi2 = 1.11, df = 1 (P = 0.29); I2 =10%
Test for overall effect: Z = 0.94 (P = 0.35)
4 2400mg/d VS Placebo
The NINDS NET-PD 2007 71 0.68 (1.49) 71 0.48 (1.18) 28.1 % 0.20 [ -0.24, 0.64 ]
Subtotal (95% CI) 71 71 28.1 % 0.20 [ -0.24, 0.64 ]
Heterogeneity: not applicable
Test for overall effect: Z = 0.89 (P = 0.38)
Total (95% CI) 199 103 100.0 % -0.07 [ -0.30, 0.17 ]
Heterogeneity: Chi2 = 4.74, df = 6 (P = 0.58); I2 =0.0%
Test for overall effect: Z = 0.57 (P = 0.57)
Test for subgroup differences: Chi2 = 2.03, df = 3 (P = 0.57), I2 =0.0%
-100 -50 0 50 100
Favours CoQ10 Favours Placebo
23Coenzyme Q10 for Parkinson’s disease (Review)
Copyright © 2011 The Cochrane Collaboration. Published by John Wiley & Sons, Ltd.
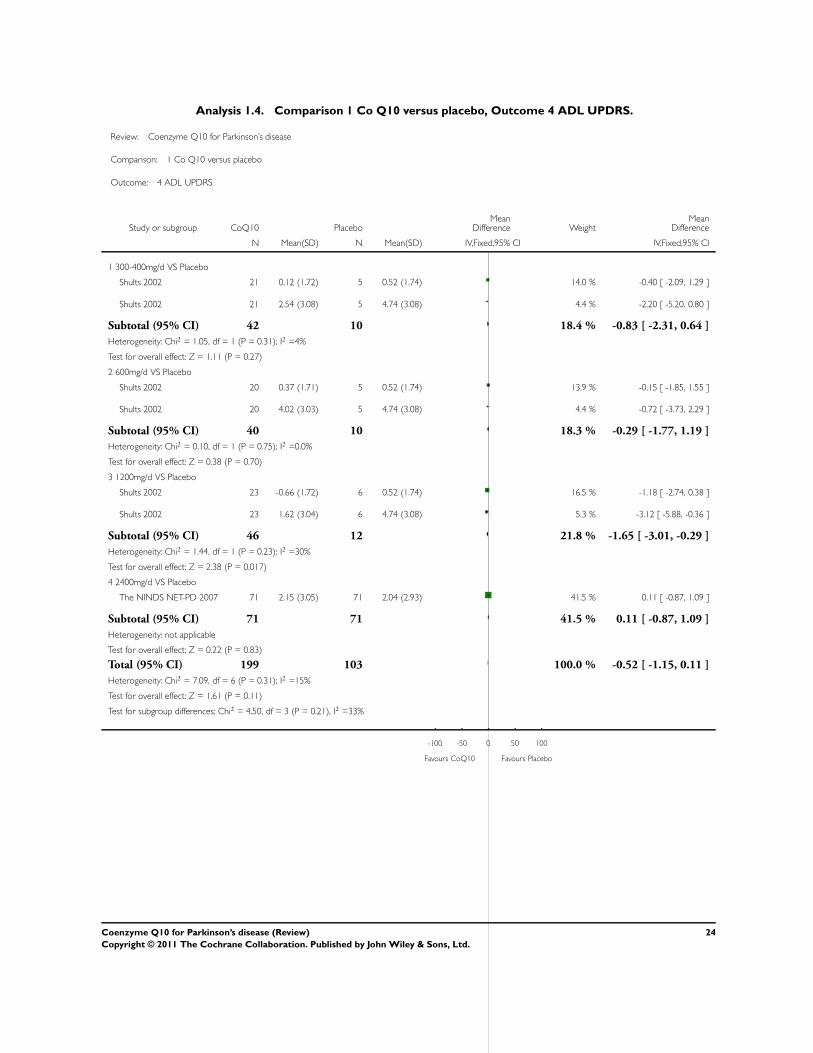
Analysis 1.4. Comparison 1 Co Q10 versus placebo, Outcome 4 ADL UPDRS.
Review: Coenzyme Q10 for Parkinson’s disease
Comparison: 1 Co Q10 versus placebo
Outcome: 4 ADL UPDRS
Study or subgroup CoQ10 PlaceboMean
Difference WeightMean
Difference
N Mean(SD) N Mean(SD) IV,Fixed,95% CI IV,Fixed,95% CI
1 300-400mg/d VS Placebo
Shults 2002 21 0.12 (1.72) 5 0.52 (1.74) 14.0 % -0.40 [ -2.09, 1.29 ]
Shults 2002 21 2.54 (3.08) 5 4.74 (3.08) 4.4 % -2.20 [ -5.20, 0.80 ]
Subtotal (95% CI) 42 10 18.4 % -0.83 [ -2.31, 0.64 ]
Heterogeneity: Chi2 = 1.05, df = 1 (P = 0.31); I2 =4%
Test for overall effect: Z = 1.11 (P = 0.27)
2 600mg/d VS Placebo
Shults 2002 20 0.37 (1.71) 5 0.52 (1.74) 13.9 % -0.15 [ -1.85, 1.55 ]
Shults 2002 20 4.02 (3.03) 5 4.74 (3.08) 4.4 % -0.72 [ -3.73, 2.29 ]
Subtotal (95% CI) 40 10 18.3 % -0.29 [ -1.77, 1.19 ]
Heterogeneity: Chi2 = 0.10, df = 1 (P = 0.75); I2 =0.0%
Test for overall effect: Z = 0.38 (P = 0.70)
3 1200mg/d VS Placebo
Shults 2002 23 -0.66 (1.72) 6 0.52 (1.74) 16.5 % -1.18 [ -2.74, 0.38 ]
Shults 2002 23 1.62 (3.04) 6 4.74 (3.08) 5.3 % -3.12 [ -5.88, -0.36 ]
Subtotal (95% CI) 46 12 21.8 % -1.65 [ -3.01, -0.29 ]
Heterogeneity: Chi2 = 1.44, df = 1 (P = 0.23); I2 =30%
Test for overall effect: Z = 2.38 (P = 0.017)
4 2400mg/d VS Placebo
The NINDS NET-PD 2007 71 2.15 (3.05) 71 2.04 (2.93) 41.5 % 0.11 [ -0.87, 1.09 ]
Subtotal (95% CI) 71 71 41.5 % 0.11 [ -0.87, 1.09 ]
Heterogeneity: not applicable
Test for overall effect: Z = 0.22 (P = 0.83)
Total (95% CI) 199 103 100.0 % -0.52 [ -1.15, 0.11 ]
Heterogeneity: Chi2 = 7.09, df = 6 (P = 0.31); I2 =15%
Test for overall effect: Z = 1.61 (P = 0.11)
Test for subgroup differences: Chi2 = 4.50, df = 3 (P = 0.21), I2 =33%
-100 -50 0 50 100
Favours CoQ10 Favours Placebo
24Coenzyme Q10 for Parkinson’s disease (Review)
Copyright © 2011 The Cochrane Collaboration. Published by John Wiley & Sons, Ltd.

Analysis 1.5. Comparison 1 Co Q10 versus placebo, Outcome 5 Hoehn & Yahr.
Review: Coenzyme Q10 for Parkinson’s disease
Comparison: 1 Co Q10 versus placebo
Outcome: 5 Hoehn % Yahr
Study or subgroup CoQ10 PlaceboMean
Difference WeightMean
Difference
N Mean(SD) N Mean(SD) IV,Fixed,95% CI IV,Fixed,95% CI
1 300-400mg/d VS Placebo
Shults 2002 21 0.16 (0.29) 5 0.02 (0.29) 12.0 % 0.14 [ -0.14, 0.42 ]
Shults 2002 21 0.04 (0.27) 5 0.01 (0.28) 13.1 % 0.03 [ -0.24, 0.30 ]
Subtotal (95% CI) 42 10 25.1 % 0.08 [ -0.11, 0.28 ]
Heterogeneity: Chi2 = 0.30, df = 1 (P = 0.58); I2 =0.0%
Test for overall effect: Z = 0.83 (P = 0.41)
2 600mg/d VS Placebo
Shults 2002 20 0.15 (0.29) 5 0.02 (0.29) 11.9 % 0.13 [ -0.15, 0.41 ]
Shults 2002 20 -0.02 (0.29) 5 0.01 (0.28) 12.6 % -0.03 [ -0.31, 0.25 ]
Subtotal (95% CI) 40 10 24.5 % 0.05 [ -0.15, 0.25 ]
Heterogeneity: Chi2 = 0.63, df = 1 (P = 0.43); I2 =0.0%
Test for overall effect: Z = 0.47 (P = 0.64)
3 1200mg/d VS Placebo
Shults 2002 23 0.13 (0.29) 6 0.02 (0.29) 14.2 % 0.11 [ -0.15, 0.37 ]
Shults 2002 23 0.02 (0.28) 6 0.01 (0.28) 15.2 % 0.01 [ -0.24, 0.26 ]
Subtotal (95% CI) 46 12 29.4 % 0.06 [ -0.12, 0.24 ]
Heterogeneity: Chi2 = 0.29, df = 1 (P = 0.59); I2 =0.0%
Test for overall effect: Z = 0.63 (P = 0.53)
4 2400mg/d VS Placebo
The NINDS NET-PD 2007 71 0.32 (0.65) 71 0.31 (0.65) 21.0 % 0.01 [ -0.20, 0.22 ]
Subtotal (95% CI) 71 71 21.0 % 0.01 [ -0.20, 0.22 ]
Heterogeneity: not applicable
Test for overall effect: Z = 0.09 (P = 0.93)
Total (95% CI) 199 103 100.0 % 0.05 [ -0.05, 0.15 ]
Heterogeneity: Chi2 = 1.47, df = 6 (P = 0.96); I2 =0.0%
Test for overall effect: Z = 1.03 (P = 0.30)
Test for subgroup differences: Chi2 = 0.25, df = 3 (P = 0.97), I2 =0.0%
-100 -50 0 50 100
Favours CoQ10 Favours Placebo
25Coenzyme Q10 for Parkinson’s disease (Review)
Copyright © 2011 The Cochrane Collaboration. Published by John Wiley & Sons, Ltd.

Analysis 1.6. Comparison 1 Co Q10 versus placebo, Outcome 6 Schwab & England (investigator).
Review: Coenzyme Q10 for Parkinson’s disease
Comparison: 1 Co Q10 versus placebo
Outcome: 6 Schwab % England (investigator)
Study or subgroup CoQ10 PlaceboMean
Difference WeightMean
Difference
N Mean(SD) N Mean(SD) IV,Fixed,95% CI IV,Fixed,95% CI
1 300-400mg/d VS Placebo
Shults 2002 21 -4.89 (4.81) 5 -7.98 (4.89) 5.3 % 3.09 [ -1.66, 7.84 ]
Shults 2002 21 -0.57 (2.43) 5 -0.12 (2.47) 20.7 % -0.45 [ -2.85, 1.95 ]
Subtotal (95% CI) 42 10 25.9 % 0.27 [ -1.87, 2.41 ]
Heterogeneity: Chi2 = 1.70, df = 1 (P = 0.19); I2 =41%
Test for overall effect: Z = 0.25 (P = 0.81)
2 600mg/d VS Placebo
Shults 2002 20 -7.03 (4.78) 5 -7.98 (4.89) 5.2 % 0.95 [ -3.82, 5.72 ]
Shults 2002 20 -0.53 (2.4) 5 -0.12 (2.47) 20.6 % -0.41 [ -2.82, 2.00 ]
Subtotal (95% CI) 40 10 25.8 % -0.13 [ -2.28, 2.01 ]
Heterogeneity: Chi2 = 0.25, df = 1 (P = 0.62); I2 =0.0%
Test for overall effect: Z = 0.12 (P = 0.90)
3 1200mg/d VS Placebo
Shults 2002 23 -3.55 (4.8) 6 -7.98 (4.89) 6.2 % 4.43 [ 0.05, 8.81 ]
Shults 2002 23 0.28 (2.42) 6 -0.12 (2.47) 24.4 % 0.40 [ -1.81, 2.61 ]
Subtotal (95% CI) 46 12 30.6 % 1.22 [ -0.75, 3.19 ]
Heterogeneity: Chi2 = 2.60, df = 1 (P = 0.11); I2 =61%
Test for overall effect: Z = 1.21 (P = 0.23)
4 2400mg/d VS Placebo
The NINDS NET-PD 2007 71 -5.5 (8.16) 71 -4.9 (7.63) 17.6 % -0.60 [ -3.20, 2.00 ]
Subtotal (95% CI) 71 71 17.6 % -0.60 [ -3.20, 2.00 ]
Heterogeneity: not applicable
Test for overall effect: Z = 0.45 (P = 0.65)
Total (95% CI) 199 103 100.0 % 0.30 [ -0.79, 1.39 ]
Heterogeneity: Chi2 = 5.99, df = 6 (P = 0.42); I2 =0.0%
Test for overall effect: Z = 0.54 (P = 0.59)
Test for subgroup differences: Chi2 = 1.45, df = 3 (P = 0.69), I2 =0.0%
-100 -50 0 50 100
Favours Placebo Favours CoQ10
26Coenzyme Q10 for Parkinson’s disease (Review)
Copyright © 2011 The Cochrane Collaboration. Published by John Wiley & Sons, Ltd.

Analysis 1.7. Comparison 1 Co Q10 versus placebo, Outcome 7 severe viral infection.
Review: Coenzyme Q10 for Parkinson’s disease
Comparison: 1 Co Q10 versus placebo
Outcome: 7 severe viral infection
Study or subgroup CoQ10 Placebo Risk Ratio Weight Risk Ratio
n/N n/N M-H,Fixed,95% CI M-H,Fixed,95% CI
1 300mg/d VS Placebo
Shults 2002 1/21 0/5 9.6 % 0.82 [ 0.04, 17.64 ]
Storch 2007 2/64 6/67 71.5 % 0.35 [ 0.07, 1.67 ]
Subtotal (95% CI) 85 72 81.1 % 0.40 [ 0.10, 1.61 ]
Total events: 3 (CoQ10), 6 (Placebo)
Heterogeneity: Chi2 = 0.24, df = 1 (P = 0.63); I2 =0.0%
Test for overall effect: Z = 1.29 (P = 0.20)
2 600mg/d VS Placebo
Shults 2002 1/20 0/5 9.5 % 0.86 [ 0.04, 18.45 ]
Subtotal (95% CI) 20 5 9.5 % 0.86 [ 0.04, 18.45 ]
Total events: 1 (CoQ10), 0 (Placebo)
Heterogeneity: not applicable
Test for overall effect: Z = 0.10 (P = 0.92)
3 1200mg/d VS Placebo
Shults 2002 2/23 0/6 9.4 % 1.46 [ 0.08, 26.97 ]
Subtotal (95% CI) 23 6 9.4 % 1.46 [ 0.08, 26.97 ]
Total events: 2 (CoQ10), 0 (Placebo)
Heterogeneity: not applicable
Test for overall effect: Z = 0.25 (P = 0.80)
Total (95% CI) 128 83 100.0 % 0.55 [ 0.18, 1.68 ]
Total events: 6 (CoQ10), 6 (Placebo)
Heterogeneity: Chi2 = 0.90, df = 3 (P = 0.83); I2 =0.0%
Test for overall effect: Z = 1.05 (P = 0.29)
Test for subgroup differences: Chi2 = 0.70, df = 2 (P = 0.70), I2 =0.0%
0.01 0.1 1 10 100
Favours CoQ10 Favours Placebo
27Coenzyme Q10 for Parkinson’s disease (Review)
Copyright © 2011 The Cochrane Collaboration. Published by John Wiley & Sons, Ltd.

Analysis 1.8. Comparison 1 Co Q10 versus placebo, Outcome 8 Pharyngitis.
Review: Coenzyme Q10 for Parkinson’s disease
Comparison: 1 Co Q10 versus placebo
Outcome: 8 Pharyngitis
Study or subgroup CoQ10 Placebo Risk Ratio Weight Risk Ratio
n/N n/N M-H,Fixed,95% CI M-H,Fixed,95% CI
1 300mg/d VS Placebo
Shults 2002 1/21 0/5 33.6 % 0.82 [ 0.04, 17.64 ]
Subtotal (95% CI) 21 5 33.6 % 0.82 [ 0.04, 17.64 ]
Total events: 1 (CoQ10), 0 (Placebo)
Heterogeneity: not applicable
Test for overall effect: Z = 0.13 (P = 0.90)
2 600mg/d VS Placebo
Shults 2002 1/20 0/5 33.3 % 0.86 [ 0.04, 18.45 ]
Subtotal (95% CI) 20 5 33.3 % 0.86 [ 0.04, 18.45 ]
Total events: 1 (CoQ10), 0 (Placebo)
Heterogeneity: not applicable
Test for overall effect: Z = 0.10 (P = 0.92)
3 1200mg/d VS Placebo
Shults 2002 2/23 0/6 33.1 % 1.46 [ 0.08, 26.97 ]
Subtotal (95% CI) 23 6 33.1 % 1.46 [ 0.08, 26.97 ]
Total events: 2 (CoQ10), 0 (Placebo)
Heterogeneity: not applicable
Test for overall effect: Z = 0.25 (P = 0.80)
Total (95% CI) 64 16 100.0 % 1.04 [ 0.18, 5.89 ]
Total events: 4 (CoQ10), 0 (Placebo)
Heterogeneity: Chi2 = 0.09, df = 2 (P = 0.96); I2 =0.0%
Test for overall effect: Z = 0.05 (P = 0.96)
Test for subgroup differences: Chi2 = 0.09, df = 2 (P = 0.96), I2 =0.0%
0.01 0.1 1 10 100
Favours CoQ10 Favours Placebo
28Coenzyme Q10 for Parkinson’s disease (Review)
Copyright © 2011 The Cochrane Collaboration. Published by John Wiley & Sons, Ltd.

Analysis 1.9. Comparison 1 Co Q10 versus placebo, Outcome 9 Sinusitis.
Review: Coenzyme Q10 for Parkinson’s disease
Comparison: 1 Co Q10 versus placebo
Outcome: 9 Sinusitis
Study or subgroup CoQ10 Placebo Risk Ratio Risk Ratio
n/N n/N M-H,Fixed,95% CI M-H,Fixed,95% CI
1 300mg/d VS Placebo
Shults 2002 2/21 0/5 1.36 [ 0.08, 24.76 ]
Subtotal (95% CI) 21 5 1.36 [ 0.08, 24.76 ]
Total events: 2 (CoQ10), 0 (Placebo)
Heterogeneity: not applicable
Test for overall effect: Z = 0.21 (P = 0.83)
2 600mg/d VS Placebo
Shults 2002 0/20 0/5 0.0 [ 0.0, 0.0 ]
Subtotal (95% CI) 20 5 0.0 [ 0.0, 0.0 ]
Total events: 0 (CoQ10), 0 (Placebo)
Heterogeneity: not applicable
Test for overall effect: Z = 0.0 (P < 0.00001)
3 1200mg/d VS Placebo
Shults 2002 2/23 0/6 1.46 [ 0.08, 26.97 ]
Subtotal (95% CI) 23 6 1.46 [ 0.08, 26.97 ]
Total events: 2 (CoQ10), 0 (Placebo)
Heterogeneity: not applicable
Test for overall effect: Z = 0.25 (P = 0.80)
4 2400mg/d VS Placebo
The NINDS NET-PD 2007 5/71 8/71 0.63 [ 0.21, 1.82 ]
Subtotal (95% CI) 71 71 0.63 [ 0.21, 1.82 ]
Total events: 5 (CoQ10), 8 (Placebo)
Heterogeneity: not applicable
Test for overall effect: Z = 0.86 (P = 0.39)
Total (95% CI) 135 87 0.75 [ 0.30, 1.92 ]
Total events: 9 (CoQ10), 8 (Placebo)
Heterogeneity: Chi2 = 0.48, df = 2 (P = 0.79); I2 =0.0%
Test for overall effect: Z = 0.59 (P = 0.55)
Test for subgroup differences: Chi2 = 0.47, df = 2 (P = 0.79), I2 =0.0%
0.01 0.1 1 10 100
Favours CoQ10 Favours Placebo
29Coenzyme Q10 for Parkinson’s disease (Review)
Copyright © 2011 The Cochrane Collaboration. Published by John Wiley & Sons, Ltd.

Analysis 1.10. Comparison 1 Co Q10 versus placebo, Outcome 10 Flatulence.
Review: Coenzyme Q10 for Parkinson’s disease
Comparison: 1 Co Q10 versus placebo
Outcome: 10 Flatulence
Study or subgroup CoQ10 Placebo Risk Ratio Weight Risk Ratio
n/N n/N M-H,Fixed,95% CI M-H,Fixed,95% CI
1 300mg/d VS Placebo
Shults 2002 0/21 1/5 42.5 % 0.09 [ 0.00, 1.96 ]
Subtotal (95% CI) 21 5 42.5 % 0.09 [ 0.00, 1.96 ]
Total events: 0 (CoQ10), 1 (Placebo)
Heterogeneity: not applicable
Test for overall effect: Z = 1.53 (P = 0.13)
2 600mg/d VS Placebo
Shults 2002 2/20 1/5 28.9 % 0.50 [ 0.06, 4.47 ]
Subtotal (95% CI) 20 5 28.9 % 0.50 [ 0.06, 4.47 ]
Total events: 2 (CoQ10), 1 (Placebo)
Heterogeneity: not applicable
Test for overall effect: Z = 0.62 (P = 0.54)
3 1200mg/d VS Placebo
Shults 2002 1/23 1/6 28.6 % 0.26 [ 0.02, 3.59 ]
Subtotal (95% CI) 23 6 28.6 % 0.26 [ 0.02, 3.59 ]
Total events: 1 (CoQ10), 1 (Placebo)
Heterogeneity: not applicable
Test for overall effect: Z = 1.00 (P = 0.32)
Total (95% CI) 64 16 100.0 % 0.26 [ 0.06, 1.04 ]
Total events: 3 (CoQ10), 3 (Placebo)
Heterogeneity: Chi2 = 0.79, df = 2 (P = 0.67); I2 =0.0%
Test for overall effect: Z = 1.90 (P = 0.057)
Test for subgroup differences: Chi2 = 0.79, df = 2 (P = 0.67), I2 =0.0%
0.01 0.1 1 10 100
Favours CoQ10 Favours Placebo
30Coenzyme Q10 for Parkinson’s disease (Review)
Copyright © 2011 The Cochrane Collaboration. Published by John Wiley & Sons, Ltd.

Analysis 1.11. Comparison 1 Co Q10 versus placebo, Outcome 11 Back pain.
Review: Coenzyme Q10 for Parkinson’s disease
Comparison: 1 Co Q10 versus placebo
Outcome: 11 Back pain
Study or subgroup CoQ10 Placebo Risk Ratio Weight Risk Ratio
n/N n/N M-H,Fixed,95% CI M-H,Fixed,95% CI
1 300mg/d VS Placebo
Shults 2002 2/21 1/5 18.4 % 0.48 [ 0.05, 4.27 ]
Subtotal (95% CI) 21 5 18.4 % 0.48 [ 0.05, 4.27 ]
Total events: 2 (CoQ10), 1 (Placebo)
Heterogeneity: not applicable
Test for overall effect: Z = 0.66 (P = 0.51)
2 600mg/d VS Placebo
Shults 2002 1/20 1/5 18.2 % 0.25 [ 0.02, 3.34 ]
Subtotal (95% CI) 20 5 18.2 % 0.25 [ 0.02, 3.34 ]
Total events: 1 (CoQ10), 1 (Placebo)
Heterogeneity: not applicable
Test for overall effect: Z = 1.05 (P = 0.29)
3 1200mg/d VS Placebo
Shults 2002 4/23 1/6 18.0 % 1.04 [ 0.14, 7.70 ]
Subtotal (95% CI) 23 6 18.0 % 1.04 [ 0.14, 7.70 ]
Total events: 4 (CoQ10), 1 (Placebo)
Heterogeneity: not applicable
Test for overall effect: Z = 0.04 (P = 0.97)
4 2400mg/d VS Placebo
The NINDS NET-PD 2007 6/71 4/71 45.4 % 1.50 [ 0.44, 5.09 ]
Subtotal (95% CI) 71 71 45.4 % 1.50 [ 0.44, 5.09 ]
Total events: 6 (CoQ10), 4 (Placebo)
Heterogeneity: not applicable
Test for overall effect: Z = 0.65 (P = 0.52)
Total (95% CI) 135 87 100.0 % 1.00 [ 0.43, 2.35 ]
Total events: 13 (CoQ10), 7 (Placebo)
Heterogeneity: Chi2 = 1.96, df = 3 (P = 0.58); I2 =0.0%
Test for overall effect: Z = 0.01 (P = 1.0)
Test for subgroup differences: Chi2 = 1.94, df = 3 (P = 0.58), I2 =0.0%
0.01 0.1 1 10 100
Favours experimental Favours control
31Coenzyme Q10 for Parkinson’s disease (Review)
Copyright © 2011 The Cochrane Collaboration. Published by John Wiley & Sons, Ltd.

Analysis 1.12. Comparison 1 Co Q10 versus placebo, Outcome 12 Coughing.
Review: Coenzyme Q10 for Parkinson’s disease
Comparison: 1 Co Q10 versus placebo
Outcome: 12 Coughing
Study or subgroup CoQ10 Placebo Risk Ratio Weight Risk Ratio
n/N n/N M-H,Fixed,95% CI M-H,Fixed,95% CI
1 300mg/d VS Placebo
Shults 2002 1/21 1/5 16.5 % 0.24 [ 0.02, 3.19 ]
Subtotal (95% CI) 21 5 16.5 % 0.24 [ 0.02, 3.19 ]
Total events: 1 (CoQ10), 1 (Placebo)
Heterogeneity: not applicable
Test for overall effect: Z = 1.08 (P = 0.28)
2 600mg/d VS Placebo
Shults 2002 1/20 1/5 16.3 % 0.25 [ 0.02, 3.34 ]
Subtotal (95% CI) 20 5 16.3 % 0.25 [ 0.02, 3.34 ]
Total events: 1 (CoQ10), 1 (Placebo)
Heterogeneity: not applicable
Test for overall effect: Z = 1.05 (P = 0.29)
3 1200mg/d VS Placebo
Shults 2002 1/23 1/6 16.2 % 0.26 [ 0.02, 3.59 ]
Subtotal (95% CI) 23 6 16.2 % 0.26 [ 0.02, 3.59 ]
Total events: 1 (CoQ10), 1 (Placebo)
Heterogeneity: not applicable
Test for overall effect: Z = 1.00 (P = 0.32)
4 2400mg/d VS Placebo
The NINDS NET-PD 2007 4/71 5/71 51.0 % 0.80 [ 0.22, 2.86 ]
Subtotal (95% CI) 71 71 51.0 % 0.80 [ 0.22, 2.86 ]
Total events: 4 (CoQ10), 5 (Placebo)
Heterogeneity: not applicable
Test for overall effect: Z = 0.34 (P = 0.73)
Total (95% CI) 135 87 100.0 % 0.53 [ 0.21, 1.36 ]
Total events: 7 (CoQ10), 8 (Placebo)
Heterogeneity: Chi2 = 1.37, df = 3 (P = 0.71); I2 =0.0%
Test for overall effect: Z = 1.32 (P = 0.19)
Test for subgroup differences: Chi2 = 1.35, df = 3 (P = 0.72), I2 =0.0%
0.01 0.1 1 10 100
Favours CoQ10 Favours Placebo
32Coenzyme Q10 for Parkinson’s disease (Review)
Copyright © 2011 The Cochrane Collaboration. Published by John Wiley & Sons, Ltd.

Analysis 1.13. Comparison 1 Co Q10 versus placebo, Outcome 13 Diarrhea.
Review: Coenzyme Q10 for Parkinson’s disease
Comparison: 1 Co Q10 versus placebo
Outcome: 13 Diarrhea
Study or subgroup CoQ10 Placebo Risk Ratio Weight Risk Ratio
n/N n/N M-H,Fixed,95% CI M-H,Fixed,95% CI
1 300mg/d VS Placebo
Shults 2002 2/21 0/5 8.4 % 1.36 [ 0.08, 24.76 ]
Storch 2007 5/64 1/67 10.5 % 5.23 [ 0.63, 43.59 ]
Subtotal (95% CI) 85 72 18.9 % 3.51 [ 0.68, 18.19 ]
Total events: 7 (CoQ10), 1 (Placebo)
Heterogeneity: Chi2 = 0.55, df = 1 (P = 0.46); I2 =0.0%
Test for overall effect: Z = 1.50 (P = 0.13)
2 600mg/d VS Placebo
Shults 2002 1/20 0/5 8.3 % 0.86 [ 0.04, 18.45 ]
Subtotal (95% CI) 20 5 8.3 % 0.86 [ 0.04, 18.45 ]
Total events: 1 (CoQ10), 0 (Placebo)
Heterogeneity: not applicable
Test for overall effect: Z = 0.10 (P = 0.92)
3 1200mg/d VS Placebo
Shults 2002 2/23 0/6 8.3 % 1.46 [ 0.08, 26.97 ]
Subtotal (95% CI) 23 6 8.3 % 1.46 [ 0.08, 26.97 ]
Total events: 2 (CoQ10), 0 (Placebo)
Heterogeneity: not applicable
Test for overall effect: Z = 0.25 (P = 0.80)
4 2400mg/d VS Placebo
The NINDS NET-PD 2007 5/71 6/71 64.4 % 0.83 [ 0.27, 2.61 ]
Subtotal (95% CI) 71 71 64.4 % 0.83 [ 0.27, 2.61 ]
Total events: 5 (CoQ10), 6 (Placebo)
Heterogeneity: not applicable
Test for overall effect: Z = 0.31 (P = 0.75)
Total (95% CI) 199 154 100.0 % 1.39 [ 0.62, 3.16 ]
Total events: 15 (CoQ10), 7 (Placebo)
Heterogeneity: Chi2 = 2.38, df = 4 (P = 0.67); I2 =0.0%
Test for overall effect: Z = 0.80 (P = 0.43)
Test for subgroup differences: Chi2 = 2.06, df = 3 (P = 0.56), I2 =0.0%
0.01 0.1 1 10 100
Favours CoQ10 Favours Placebo
33Coenzyme Q10 for Parkinson’s disease (Review)
Copyright © 2011 The Cochrane Collaboration. Published by John Wiley & Sons, Ltd.

Analysis 1.14. Comparison 1 Co Q10 versus placebo, Outcome 14 Fall.
Review: Coenzyme Q10 for Parkinson’s disease
Comparison: 1 Co Q10 versus placebo
Outcome: 14 Fall
Study or subgroup CoQ10 Placebo Risk Ratio Weight Risk Ratio
n/N n/N M-H,Fixed,95% CI M-H,Fixed,95% CI
1 300mg/d VS Placebo
Shults 2002 3/21 1/5 15.3 % 0.71 [ 0.09, 5.51 ]
Subtotal (95% CI) 21 5 15.3 % 0.71 [ 0.09, 5.51 ]
Total events: 3 (CoQ10), 1 (Placebo)
Heterogeneity: not applicable
Test for overall effect: Z = 0.32 (P = 0.75)
2 600mg/d VS Placebo
Shults 2002 0/20 1/5 22.1 % 0.10 [ 0.00, 2.05 ]
Subtotal (95% CI) 20 5 22.1 % 0.10 [ 0.00, 2.05 ]
Total events: 0 (CoQ10), 1 (Placebo)
Heterogeneity: not applicable
Test for overall effect: Z = 1.50 (P = 0.13)
3 1200mg/d VS Placebo
Shults 2002 1/23 1/6 15.1 % 0.26 [ 0.02, 3.59 ]
Subtotal (95% CI) 23 6 15.1 % 0.26 [ 0.02, 3.59 ]
Total events: 1 (CoQ10), 1 (Placebo)
Heterogeneity: not applicable
Test for overall effect: Z = 1.00 (P = 0.32)
4 2400mg/d VS Placebo
The NINDS NET-PD 2007 4/71 5/71 47.5 % 0.80 [ 0.22, 2.86 ]
Subtotal (95% CI) 71 71 47.5 % 0.80 [ 0.22, 2.86 ]
Total events: 4 (CoQ10), 5 (Placebo)
Heterogeneity: not applicable
Test for overall effect: Z = 0.34 (P = 0.73)
Total (95% CI) 135 87 100.0 % 0.55 [ 0.22, 1.35 ]
Total events: 8 (CoQ10), 8 (Placebo)
Heterogeneity: Chi2 = 1.96, df = 3 (P = 0.58); I2 =0.0%
Test for overall effect: Z = 1.30 (P = 0.19)
Test for subgroup differences: Chi2 = 1.96, df = 3 (P = 0.58), I2 =0.0%
0.01 0.1 1 10 100
Favours CoQ10 Favours Placebo
34Coenzyme Q10 for Parkinson’s disease (Review)
Copyright © 2011 The Cochrane Collaboration. Published by John Wiley & Sons, Ltd.

Analysis 1.15. Comparison 1 Co Q10 versus placebo, Outcome 15 Fatigue.
Review: Coenzyme Q10 for Parkinson’s disease
Comparison: 1 Co Q10 versus placebo
Outcome: 15 Fatigue
Study or subgroup CoQ10 Placebo Risk Ratio Weight Risk Ratio
n/N n/N M-H,Fixed,95% CI M-H,Fixed,95% CI
1 300mg/d VS Placebo
Shults 2002 2/21 1/5 11.9 % 0.48 [ 0.05, 4.27 ]
Subtotal (95% CI) 21 5 11.9 % 0.48 [ 0.05, 4.27 ]
Total events: 2 (CoQ10), 1 (Placebo)
Heterogeneity: not applicable
Test for overall effect: Z = 0.66 (P = 0.51)
2 600mg/d VS Placebo
Shults 2002 1/20 1/5 11.8 % 0.25 [ 0.02, 3.34 ]
Subtotal (95% CI) 20 5 11.8 % 0.25 [ 0.02, 3.34 ]
Total events: 1 (CoQ10), 1 (Placebo)
Heterogeneity: not applicable
Test for overall effect: Z = 1.05 (P = 0.29)
3 1200mg/d VS Placebo
Shults 2002 0/23 1/6 17.2 % 0.10 [ 0.00, 2.13 ]
Subtotal (95% CI) 23 6 17.2 % 0.10 [ 0.00, 2.13 ]
Total events: 0 (CoQ10), 1 (Placebo)
Heterogeneity: not applicable
Test for overall effect: Z = 1.48 (P = 0.14)
4 2400mg/d VS Placebo
The NINDS NET-PD 2007 3/71 8/71 59.1 % 0.38 [ 0.10, 1.36 ]
Subtotal (95% CI) 71 71 59.1 % 0.38 [ 0.10, 1.36 ]
Total events: 3 (CoQ10), 8 (Placebo)
Heterogeneity: not applicable
Test for overall effect: Z = 1.50 (P = 0.13)
Total (95% CI) 135 87 100.0 % 0.32 [ 0.12, 0.85 ]
Total events: 6 (CoQ10), 11 (Placebo)
Heterogeneity: Chi2 = 0.79, df = 3 (P = 0.85); I2 =0.0%
Test for overall effect: Z = 2.29 (P = 0.022)
Test for subgroup differences: Chi2 = 0.79, df = 3 (P = 0.85), I2 =0.0%
0.01 0.1 1 10 100
Favours CoQ10 Favours Placebo
35Coenzyme Q10 for Parkinson’s disease (Review)
Copyright © 2011 The Cochrane Collaboration. Published by John Wiley & Sons, Ltd.

Analysis 1.16. Comparison 1 Co Q10 versus placebo, Outcome 16 Hypercholesterolemia.
Review: Coenzyme Q10 for Parkinson’s disease
Comparison: 1 Co Q10 versus placebo
Outcome: 16 Hypercholesterolemia
Study or subgroup CoQ10 Placebo Risk Ratio Weight Risk Ratio
n/N n/N M-H,Fixed,95% CI M-H,Fixed,95% CI
1 300mg/d VS Placebo
Shults 2002 1/21 2/5 22.5 % 0.12 [ 0.01, 1.07 ]
Subtotal (95% CI) 21 5 22.5 % 0.12 [ 0.01, 1.07 ]
Total events: 1 (CoQ10), 2 (Placebo)
Heterogeneity: not applicable
Test for overall effect: Z = 1.90 (P = 0.057)
2 600mg/d VS Placebo
Shults 2002 0/21 2/5 27.4 % 0.05 [ 0.00, 0.99 ]
Subtotal (95% CI) 21 5 27.4 % 0.05 [ 0.00, 0.99 ]
Total events: 0 (CoQ10), 2 (Placebo)
Heterogeneity: not applicable
Test for overall effect: Z = 1.97 (P = 0.049)
3 1200mg/d VS Placebo
Shults 2002 1/23 2/6 22.1 % 0.13 [ 0.01, 1.21 ]
Subtotal (95% CI) 23 6 22.1 % 0.13 [ 0.01, 1.21 ]
Total events: 1 (CoQ10), 2 (Placebo)
Heterogeneity: not applicable
Test for overall effect: Z = 1.79 (P = 0.073)
4 2400mg/d VS Placebo
The NINDS NET-PD 2007 1/71 4/71 27.9 % 0.25 [ 0.03, 2.18 ]
Subtotal (95% CI) 71 71 27.9 % 0.25 [ 0.03, 2.18 ]
Total events: 1 (CoQ10), 4 (Placebo)
Heterogeneity: not applicable
Test for overall effect: Z = 1.25 (P = 0.21)
Total (95% CI) 136 87 100.0 % 0.14 [ 0.04, 0.44 ]
Total events: 3 (CoQ10), 10 (Placebo)
Heterogeneity: Chi2 = 0.71, df = 3 (P = 0.87); I2 =0.0%
Test for overall effect: Z = 3.34 (P = 0.00085)
Test for subgroup differences: Chi2 = 0.70, df = 3 (P = 0.87), I2 =0.0%
0.01 0.1 1 10 100
Favours CoQ10 Favours Placebo
36Coenzyme Q10 for Parkinson’s disease (Review)
Copyright © 2011 The Cochrane Collaboration. Published by John Wiley & Sons, Ltd.

Analysis 1.17. Comparison 1 Co Q10 versus placebo, Outcome 17 Number of withdrawals due to adverse
effects.
Review: Coenzyme Q10 for Parkinson’s disease
Comparison: 1 Co Q10 versus placebo
Outcome: 17 Number of withdrawals due to adverse effects
Study or subgroup CoQ10 Placebo Risk Ratio Risk Ratio
n/N n/N M-H,Fixed,95% CI M-H,Fixed,95% CI
Mueller 2003 0/14 0/14 0.0 [ 0.0, 0.0 ]
Shults 2002 0/64 0/16 0.0 [ 0.0, 0.0 ]
Storch 2007 2/64 3/67 0.70 [ 0.12, 4.04 ]
The NINDS NET-PD 2007 4/71 7/71 0.57 [ 0.17, 1.87 ]
Total (95% CI) 213 168 0.61 [ 0.23, 1.62 ]
Total events: 6 (CoQ10), 10 (Placebo)
Heterogeneity: Chi2 = 0.03, df = 1 (P = 0.85); I2 =0.0%
Test for overall effect: Z = 0.99 (P = 0.32)
Test for subgroup differences: Not applicable
0.01 0.1 1 10 100
Favours CoQ10 Favours Placebo
37Coenzyme Q10 for Parkinson’s disease (Review)
Copyright © 2011 The Cochrane Collaboration. Published by John Wiley & Sons, Ltd.

Analysis 2.1. Comparison 2 Long-term efficacy of Co Q10 versus placebo, Outcome 1 Total UPDRS score
change.
Review: Coenzyme Q10 for Parkinson’s disease
Comparison: 2 Long-term efficacy of Co Q10 versus placebo
Outcome: 1 Total UPDRS score change
Study or subgroup Experimental ControlMean
Difference WeightMean
Difference
N Mean(SD) N Mean(SD) IV,Fixed,95% CI IV,Fixed,95% CI
1 300mg/d VS Placebo
Shults 2002 21 8.81 (7.45) 5 11.99 (7.51) 10.3 % -3.18 [ -10.49, 4.13 ]
Subtotal (95% CI) 21 5 10.3 % -3.18 [ -10.49, 4.13 ]
Heterogeneity: not applicable
Test for overall effect: Z = 0.85 (P = 0.39)
2 600mg/d VS Placebo
Shults 2002 20 10.82 (7.34) 5 11.99 (7.51) 10.2 % -1.17 [ -8.50, 6.16 ]
Subtotal (95% CI) 20 5 10.2 % -1.17 [ -8.50, 6.16 ]
Heterogeneity: not applicable
Test for overall effect: Z = 0.31 (P = 0.75)
3 1200mg/d VS Placebo
Shults 2002 23 6.69 (7.4) 6 11.99 (7.51) 12.1 % -5.30 [ -12.03, 1.43 ]
Subtotal (95% CI) 23 6 12.1 % -5.30 [ -12.03, 1.43 ]
Heterogeneity: not applicable
Test for overall effect: Z = 1.54 (P = 0.12)
4 2400mg/d VS Placebo
The NINDS NET-PD 2007 71 7.52 (8.87) 71 6.31 (8.47) 67.4 % 1.21 [ -1.64, 4.06 ]
Subtotal (95% CI) 71 71 67.4 % 1.21 [ -1.64, 4.06 ]
Heterogeneity: not applicable
Test for overall effect: Z = 0.83 (P = 0.41)
Total (95% CI) 135 87 100.0 % -0.27 [ -2.61, 2.07 ]
Heterogeneity: Chi2 = 3.85, df = 3 (P = 0.28); I2 =22%
Test for overall effect: Z = 0.23 (P = 0.82)
Test for subgroup differences: Chi2 = 3.85, df = 3 (P = 0.28), I2 =22%
-100 -50 0 50 100
Favours experimental Favours control
38Coenzyme Q10 for Parkinson’s disease (Review)
Copyright © 2011 The Cochrane Collaboration. Published by John Wiley & Sons, Ltd.

Analysis 2.2. Comparison 2 Long-term efficacy of Co Q10 versus placebo, Outcome 2 Motor UPDRS.
Review: Coenzyme Q10 for Parkinson’s disease
Comparison: 2 Long-term efficacy of Co Q10 versus placebo
Outcome: 2 Motor UPDRS
Study or subgroup Experimental ControlMean
Difference WeightMean
Difference
N Mean(SD) N Mean(SD) IV,Fixed,95% CI IV,Fixed,95% CI
1 300mg/d VS Placebo
Shults 2002 21 5.88 (5.5) 5 6.54 (5.58) 10.2 % -0.66 [ -6.09, 4.77 ]
Subtotal (95% CI) 21 5 10.2 % -0.66 [ -6.09, 4.77 ]
Heterogeneity: not applicable
Test for overall effect: Z = 0.24 (P = 0.81)
2 600mg/d VS Placebo
Shults 2002 20 6.47 (5.43) 5 6.54 (5.58) 10.2 % -0.07 [ -5.51, 5.37 ]
Subtotal (95% CI) 20 5 10.2 % -0.07 [ -5.51, 5.37 ]
Heterogeneity: not applicable
Test for overall effect: Z = 0.03 (P = 0.98)
3 1200mg/d VS Placebo
Shults 2002 23 4.61 (5.47) 6 6.54 (5.58) 12.1 % -1.93 [ -6.92, 3.06 ]
Subtotal (95% CI) 23 6 12.1 % -1.93 [ -6.92, 3.06 ]
Heterogeneity: not applicable
Test for overall effect: Z = 0.76 (P = 0.45)
4 2400mg/d VS Placebo
The NINDS NET-PD 2007 71 4.73 (6.66) 71 3.79 (6.16) 67.6 % 0.94 [ -1.17, 3.05 ]
Subtotal (95% CI) 71 71 67.6 % 0.94 [ -1.17, 3.05 ]
Heterogeneity: not applicable
Test for overall effect: Z = 0.87 (P = 0.38)
Total (95% CI) 135 87 100.0 % 0.33 [ -1.41, 2.06 ]
Heterogeneity: Chi2 = 1.26, df = 3 (P = 0.74); I2 =0.0%
Test for overall effect: Z = 0.37 (P = 0.71)
Test for subgroup differences: Chi2 = 1.26, df = 3 (P = 0.74), I2 =0.0%
-100 -50 0 50 100
Favours experimental Favours control
39Coenzyme Q10 for Parkinson’s disease (Review)
Copyright © 2011 The Cochrane Collaboration. Published by John Wiley & Sons, Ltd.

Analysis 2.3. Comparison 2 Long-term efficacy of Co Q10 versus placebo, Outcome 3 Mental UPDRS.
Review: Coenzyme Q10 for Parkinson’s disease
Comparison: 2 Long-term efficacy of Co Q10 versus placebo
Outcome: 3 Mental UPDRS
Study or subgroup Experimental ControlMean
Difference WeightMean
Difference
N Mean(SD) N Mean(SD) IV,Fixed,95% CI IV,Fixed,95% CI
1 300mg/d VS Placebo
Shults 2002 21 0.54 (0.89) 5 0.9 (0.89) 14.2 % -0.36 [ -1.23, 0.51 ]
Subtotal (95% CI) 21 5 14.2 % -0.36 [ -1.23, 0.51 ]
Heterogeneity: not applicable
Test for overall effect: Z = 0.81 (P = 0.42)
2 600mg/d VS Placebo
Shults 2002 20 0.35 (0.89) 5 0.9 (0.89) 14.1 % -0.55 [ -1.42, 0.32 ]
Subtotal (95% CI) 20 5 14.1 % -0.55 [ -1.42, 0.32 ]
Heterogeneity: not applicable
Test for overall effect: Z = 1.24 (P = 0.22)
3 1200mg/d VS Placebo
Shults 2002 23 0.33 (0.89) 6 0.9 (0.89) 16.8 % -0.57 [ -1.37, 0.23 ]
Subtotal (95% CI) 23 6 16.8 % -0.57 [ -1.37, 0.23 ]
Heterogeneity: not applicable
Test for overall effect: Z = 1.40 (P = 0.16)
4 2400mg/d VS Placebo
The NINDS NET-PD 2007 71 0.68 (1.49) 71 0.48 (1.18) 54.9 % 0.20 [ -0.24, 0.64 ]
Subtotal (95% CI) 71 71 54.9 % 0.20 [ -0.24, 0.64 ]
Heterogeneity: not applicable
Test for overall effect: Z = 0.89 (P = 0.38)
Total (95% CI) 135 87 100.0 % -0.11 [ -0.44, 0.21 ]
Heterogeneity: Chi2 = 4.46, df = 3 (P = 0.22); I2 =33%
Test for overall effect: Z = 0.69 (P = 0.49)
Test for subgroup differences: Chi2 = 4.46, df = 3 (P = 0.22), I2 =33%
-100 -50 0 50 100
Favours experimental Favours control
40Coenzyme Q10 for Parkinson’s disease (Review)
Copyright © 2011 The Cochrane Collaboration. Published by John Wiley & Sons, Ltd.

Analysis 2.4. Comparison 2 Long-term efficacy of Co Q10 versus placebo, Outcome 4 ADL UPDRS.
Review: Coenzyme Q10 for Parkinson’s disease
Comparison: 2 Long-term efficacy of Co Q10 versus placebo
Outcome: 4 ADL UPDRS
Study or subgroup Experimental ControlMean
Difference WeightMean
Difference
N Mean(SD) N Mean(SD) IV,Fixed,95% CI IV,Fixed,95% CI
1 300mg/d VS Placebo
Shults 2002 21 2.54 (3.08) 5 4.74 (3.08) 8.0 % -2.20 [ -5.20, 0.80 ]
Subtotal (95% CI) 21 5 8.0 % -2.20 [ -5.20, 0.80 ]
Heterogeneity: not applicable
Test for overall effect: Z = 1.44 (P = 0.15)
2 600mg/d VS Placebo
Shults 2002 20 4.02 (3.03) 5 4.74 (3.08) 8.0 % -0.72 [ -3.73, 2.29 ]
Subtotal (95% CI) 20 5 8.0 % -0.72 [ -3.73, 2.29 ]
Heterogeneity: not applicable
Test for overall effect: Z = 0.47 (P = 0.64)
3 1200mg/d VS Placebo
Shults 2002 23 1.62 (3.04) 6 4.74 (3.08) 9.5 % -3.12 [ -5.88, -0.36 ]
Subtotal (95% CI) 23 6 9.5 % -3.12 [ -5.88, -0.36 ]
Heterogeneity: not applicable
Test for overall effect: Z = 2.22 (P = 0.027)
4 2400mg/d VS Placebo
The NINDS NET-PD 2007 71 2.15 (3.05) 71 2.04 (2.93) 74.6 % 0.11 [ -0.87, 1.09 ]
Subtotal (95% CI) 71 71 74.6 % 0.11 [ -0.87, 1.09 ]
Heterogeneity: not applicable
Test for overall effect: Z = 0.22 (P = 0.83)
Total (95% CI) 135 87 100.0 % -0.45 [ -1.30, 0.40 ]
Heterogeneity: Chi2 = 6.17, df = 3 (P = 0.10); I2 =51%
Test for overall effect: Z = 1.03 (P = 0.30)
Test for subgroup differences: Chi2 = 6.17, df = 3 (P = 0.10), I2 =51%
-100 -50 0 50 100
Favours experimental Favours control
41Coenzyme Q10 for Parkinson’s disease (Review)
Copyright © 2011 The Cochrane Collaboration. Published by John Wiley & Sons, Ltd.

Analysis 2.5. Comparison 2 Long-term efficacy of Co Q10 versus placebo, Outcome 5 Hoehn & Yahr.
Review: Coenzyme Q10 for Parkinson’s disease
Comparison: 2 Long-term efficacy of Co Q10 versus placebo
Outcome: 5 Hoehn % Yahr
Study or subgroup Experimental ControlMean
Difference WeightMean
Difference
N Mean(SD) N Mean(SD) IV,Fixed,95% CI IV,Fixed,95% CI
1 300mg/d VS Placebo
Shults 2002 21 0.16 (0.29) 5 0.02 (0.29) 20.3 % 0.14 [ -0.14, 0.42 ]
Subtotal (95% CI) 21 5 20.3 % 0.14 [ -0.14, 0.42 ]
Heterogeneity: not applicable
Test for overall effect: Z = 0.97 (P = 0.33)
2 600mg/d VS Placebo
Shults 2002 20 0.15 (0.29) 5 0.02 (0.29) 20.1 % 0.13 [ -0.15, 0.41 ]
Subtotal (95% CI) 20 5 20.1 % 0.13 [ -0.15, 0.41 ]
Heterogeneity: not applicable
Test for overall effect: Z = 0.90 (P = 0.37)
3 1200mg/d VS Placebo
Shults 2002 23 0.13 (0.29) 6 0.02 (0.29) 24.0 % 0.11 [ -0.15, 0.37 ]
Subtotal (95% CI) 23 6 24.0 % 0.11 [ -0.15, 0.37 ]
Heterogeneity: not applicable
Test for overall effect: Z = 0.83 (P = 0.41)
4 2400mg/d VS Placebo
The NINDS NET-PD 2007 71 0.32 (0.65) 71 0.31 (0.65) 35.6 % 0.01 [ -0.20, 0.22 ]
Subtotal (95% CI) 71 71 35.6 % 0.01 [ -0.20, 0.22 ]
Heterogeneity: not applicable
Test for overall effect: Z = 0.09 (P = 0.93)
Total (95% CI) 135 87 100.0 % 0.08 [ -0.04, 0.21 ]
Heterogeneity: Chi2 = 0.75, df = 3 (P = 0.86); I2 =0.0%
Test for overall effect: Z = 1.30 (P = 0.19)
Test for subgroup differences: Chi2 = 0.75, df = 3 (P = 0.86), I2 =0.0%
-100 -50 0 50 100
Favours experimental Favours control
42Coenzyme Q10 for Parkinson’s disease (Review)
Copyright © 2011 The Cochrane Collaboration. Published by John Wiley & Sons, Ltd.

Analysis 2.6. Comparison 2 Long-term efficacy of Co Q10 versus placebo, Outcome 6 Schwab & England
(investigator).
Review: Coenzyme Q10 for Parkinson’s disease
Comparison: 2 Long-term efficacy of Co Q10 versus placebo
Outcome: 6 Schwab % England (investigator)
Study or subgroup Experimental ControlMean
Difference WeightMean
Difference
N Mean(SD) N Mean(SD) IV,Fixed,95% CI IV,Fixed,95% CI
1 300mg/d VS Placebo
Shults 2002 21 -4.89 (4.81) 5 -7.98 (4.89) 15.3 % 3.09 [ -1.66, 7.84 ]
Subtotal (95% CI) 21 5 15.3 % 3.09 [ -1.66, 7.84 ]
Heterogeneity: not applicable
Test for overall effect: Z = 1.27 (P = 0.20)
2 600mg/d VS Placebo
Shults 2002 20 -7.03 (4.78) 5 -7.98 (4.89) 15.2 % 0.95 [ -3.82, 5.72 ]
Subtotal (95% CI) 20 5 15.2 % 0.95 [ -3.82, 5.72 ]
Heterogeneity: not applicable
Test for overall effect: Z = 0.39 (P = 0.70)
3 1200mg/d VS Placebo
Shults 2002 23 -3.55 (4.8) 6 -7.98 (4.89) 18.1 % 4.43 [ 0.05, 8.81 ]
Subtotal (95% CI) 23 6 18.1 % 4.43 [ 0.05, 8.81 ]
Heterogeneity: not applicable
Test for overall effect: Z = 1.98 (P = 0.047)
4 2400mg/d VS Placebo
The NINDS NET-PD 2007 71 -5.5 (8.16) 71 -4.9 (7.63) 51.3 % -0.60 [ -3.20, 2.00 ]
Subtotal (95% CI) 71 71 51.3 % -0.60 [ -3.20, 2.00 ]
Heterogeneity: not applicable
Test for overall effect: Z = 0.45 (P = 0.65)
Total (95% CI) 135 87 100.0 % 1.11 [ -0.75, 2.97 ]
Heterogeneity: Chi2 = 4.54, df = 3 (P = 0.21); I2 =34%
Test for overall effect: Z = 1.17 (P = 0.24)
Test for subgroup differences: Chi2 = 4.54, df = 3 (P = 0.21), I2 =34%
-100 -50 0 50 100
Favours experimental Favours control
43Coenzyme Q10 for Parkinson’s disease (Review)
Copyright © 2011 The Cochrane Collaboration. Published by John Wiley & Sons, Ltd.

H I S T O R Y
Protocol first published: Issue 4, 2009
Review first published: Issue 12, 2011
C O N T R I B U T I O N S O F A U T H O R S
Liu J took the lead role in searching, identifying and assessing studies, in data extraction and analyses, and in writing up the full review.
Liu J and Wang L formulated the idea and developed the basis for the review.
Wang L gave general advice for this review.
Zhan S supervised the methodology.
Wang L, Xia Y identified trials, assessed studies and extracted data.
Xia Y gave great help with the statistics.
All authors were involved in writing or revising the full review.
D E C L A R A T I O N S O F I N T E R E S T
None known
S O U R C E S O F S U P P O R T
Internal sources
• Department of Geriatric Neurology, Chinese PLA General Hospital, China.
External sources
• No sources of support supplied
D I F F E R E N C E S B E T W E E N P R O T O C O L A N D R E V I E W
None
I N D E X T E R M S
44Coenzyme Q10 for Parkinson’s disease (Review)
Copyright © 2011 The Cochrane Collaboration. Published by John Wiley & Sons, Ltd.

Medical Subject Headings (MeSH)
Activities of Daily Living; Diarrhea [chemically induced]; Neuroprotective Agents [adverse effects; ∗therapeutic use]; Parkinson Disease
[∗drug therapy]; Pharyngitis [chemically induced]; Randomized Controlled Trials as Topic; Ubiquinone [adverse effects; ∗analogs &
derivatives; therapeutic use]; Vitamins [adverse effects; ∗therapeutic use]
MeSH check words
Humans
45Coenzyme Q10 for Parkinson’s disease (Review)
Copyright © 2011 The Cochrane Collaboration. Published by John Wiley & Sons, Ltd.