Environmental toxicant exposure and Parkinson's disease
208
Environmental toxicant exposure and Parkinson’s disease: LRRK2 and inflammatory processes. A thesis submitted to the Department of Neuroscience in partial fulfillment of the requirements for the degree of: Doctor of Philosophy Neuroscience Zachary Dwyer Department of Neuroscience Carleton University (2019)
-
Upload
khangminh22 -
Category
Documents
-
view
0 -
download
0
Transcript of Environmental toxicant exposure and Parkinson's disease

Environmental toxicant exposure and Parkinson’s disease: LRRK2 and inflammatory processes.
A thesis submitted to the Department of Neuroscience in partial fulfillment of the requirements
for the degree of:
Doctor of Philosophy
Neuroscience
Zachary Dwyer
Department of Neuroscience
Carleton University (2019)

i
Abstract
Parkinson’s disease (PD) results from the progressive loss of dopamine producing neurons
in the Substantia Nigra pars comapcta (SNc). This loss is thought to occur over several years to
decades and current evidence suggests that neuroinflammation may play a central role in this loss.
Numerous epidemiological studies have implicated chronic exposure to environmental toxicants
such as heavy metals and pesticides to risk of developing PD. Indeed, many of these risk factors
have been validated as rodent models of PD, able to induce dopaminergic cell loss in the SNc as
well as motor dysfunction. While research strongly supports a role for environmental toxicants
and inflammation in PD relatively little work has examined the interactions between these
toxicants and other risk factors including senescence, genetic vulnerabilities, the gut microbiota or
immunogens. Thus, the present dissertation set out to investigate the interactions between these
factors in PD to determine which factors may be of greatest relevance in further animal models of
the disease.
We presently demonstrated that interaction of diverse environmental and genetic factors
contributed to the neuroinflammatory and PD-like neurodegeneration. We found that exposure to
paraquat led to neuroinflammatory consequences persisting over six months and provide evidence
that at this time point further inflammatory processes arise. We also found that LPS and paraquat
treatment did not significantly alter the gut microbiome or gut inflammasome; however, in
combination with dextran sodium sulphate (DSS) we found greatly increased pro-inflammatory
factors. Using mice overexpressing the LRRK2 gene, G2019S, we found no changes in sickness,
inflammation or neurodegeneration following paraquat treatment. However, the G2019S over-
expressing mice did display augmented stressor effects. Further experiments revealed that G2019S
knock-in mice showed increased signs of inflammation and that this was reversed by the CSF-1

ii
antagonistic drug, PLX-3397. Ultimately these data support the role of environmental factors in
PD including alterations to the gut microbiome, however, these findings suggest that such factors
may not be an immediate PD cause but rather may exert their influence over a longer period of
time.

iii
This thesis is based upon the following four manuscripts referred to in text by their
corresponding chapter numbers.
Chapter 2: Dwyer, Z., Rudyk, C., Farmer, K., Beauchamp, S., Shail, P., Derksen, A., Fortin, T.,
Ventura, K., Ayoub, K., Torres, C. and Hayley, S. Tracking the chronic and progressive effects
of paraquat in a murine model of Parkinson’s. In preparation for submission to Neurobiology of
aging.
Chapter 3: Dwyer, Z., Chaiquin, M., Landrigan, J., Rudyk, C., Ayoub, K., Shail, P., Rocha, J.,
Childers, C., Storey, K., Philpott, D. and Hayley, S. A murine model of Parkinson’s disease
interacts with dextran sodium sulphate and pro-biotics. In preparation for submission to FASEB.
Chapter 4: Dwyer, Z.*, Rudyk, C.* and Hayley, S. (2019). Leucine rich repeat kinase-2
(LRRK2) modulates paraquat induced inflammatory sickness and stress phenotype. Journal of
Neuroinflammation. 16(1):120.
Chapter 5: Dwyer, Z., Rudyk, C., Situt, D., Beauchamp, S., Abdali, J., Dinesh, A., Legancher,
N., Schlossmacher, M. and Hayley, S. PLX-3397 administration blunts the effects of a murine
model of Parkinson’s disease. In preparation for submission to Brain Behaviour and Immunity

iv
Other works by Zachary Dwyer
Farmer K, Derksen A, Rowe E, Thompson A, Rudyk C, Prowse NA, Dwyer Z, Fortin T, Abd-
Elrahman KS, Ferguson SSG, Hayley S. mGluR5 modulation promotes neurorecovery through
mTOR in a Parkinson's model. Journal of Neuroscience. Submitted (2019).
Landrigan, J., Dwyer, Z., Beauchamp, S., Roderiguez, R. & Hayley, S. Quantum dot conjugated
saporin activates microglia and induces selective substantia nigra degeneration. Neurotoxicology.
Submitted (2019).
Prowse, N., Dwyer, Z., Thompson, A., Fortin, T., Elson, K., Robeson, H., Fenner, B. & Hayley,
S. Early life selective knockdown of the TrkB receptor modulates adult stress phenotype.
Behavioural Brain Research. Submitted (2019).
Rudyk C., Dwyer Z., Farmer K., Prowse N., & Hayley S. (2019). Chronic unpredictable stress
differentially influenced impact of paraquat upon behavioral and neuronal outcomes.
Neurobiology of Stress. In press.
McConnell, E.*, Ventura, K.*, Dwyer, Z., Hunt, V., Koudrina, A., Holahan, M., & DeRosa, M.
(2019). In vivo use of a multi-DNA aptamer-based payload/targeting system to study dopamine
dysregulation in the central nervous system. ACS Chemical Neuroscience. 10(1): 371-383.
Boutin, R., Dwyer, Z., Farmer, K., Rudyk, C., Forbes, M. and Hayley, S. (2018). Perinatal
antibiotic exposure alters the composition of the gut microflora and may alter responses to a
peanut antigen. Allergy, Asthma and Clinical Immunology. 14: 42.
Litteljohn, D., Rudyk, C., Dwyer, Z., Farmer, K., Fortin, T., Hayley, S. & Canadian LRRK2 in
Inflammation Team (CLINT). (2018). The impact of murine LRRK2 G2019S transgene
overexpression on acute responses to inflammatory challenge. Brain Behavior and Immunity. 67:
246-256.
Landrigan, J., Shawaf, F., Dwyer, Z., Abizaid, A. and Hayley, S. (2018). The interactive effects
of ghrelin and ketamine on forced swim performance: Implications for novel anti-depressant
strategies. Neuroscience Letters. 16;669: 55-58

v
Clarke, M., Razmjou, S., Pentz, R., Litteljohn, D., Prowse, N., Dwyer, Z., Anisman, H., and
Hayley, S. (2017). Ketamine modulates hippocampal neurogenesis and pro-inflammatory
cytokines but not stressor induced neurochemical changes. Neuropharmacology. 112(A): 210-
220.
Litteljohn, D., Rudyk, C., Razmjou, S Dwyer, Z., Syed, S., and Hayley, S. (2017). Individual
and interactive sex-specific effects of acute restraint and systemic IFN-γ treatment on
neurochemistry. Neurochemistry International. 102: 95-104
Rudyk. C., McNeill, J., Prowse, N., Dwyer, Z., Farmer, K., Litteljohn, D., Caldwell, W. &
Hayley, S. (2017). Age and chronicity of administration dramatically influenced the impact of
low dose paraquat exposure on behaviour and hypothalamic-pituitary-adrenal activity. Frontiers
of Aging Neuroscience. 14;9: 222
Razmjou, S., Litteljohn, D., Rudyk, C., Syed, S., Clarke, M., Pent, R., Dwyer, Z., Hayley, S.
(2016) The interactive effects of ketamine and magnesium upon depressive-like pathology.
Neuropsychiatric Disease and Treatment. 12: 2049-2056.
Rudyk, C., Litteljohn, D., Syed, S., Dwyer, Z. and Hayley, S. (2015). Paraquat and psychological
stressor interactions as pertains to Parkinsonian co-morbidity. Neurobiology of Stress. 2: 85-93

vi
Acknowledgements
I would like to express my sincerest gratitude to the many individuals that I have worked
with over the past 4 years at Carleton, Ottawa University, and the University of Toronto,
completing these projects and others has required an enormous amount of experience, patience
and outside expertise to put together. Within the lab Teresa Fortin, Chris Rudyk and Kyle Farmer
were instrumental in helping me plan and complete these studies providing mental and material
support. My supervisor, Dr. Shawn Hayley, has been immensely supportive and provided guidance
and expertise across all areas of this thesis in addition to creating a collaborative lab environment
to facilitate teamwork and superb research. I would be remiss not to mention the many graduate
students that have helped conduct this research with me along the way including Natalie Prowse,
Pragya Shail, Melany Chaiquin, Jeff Landrigan, Kyle Malone and Sheryl Beauchamp. Finally, my
most important thanks go to my family and spouse Chaya who have driven me to finish by
constantly asking when I’ll be done.

vii
Table of contents
Abstract………………………….....................................................................................i
Other works by Zachary Dwyer……………………………………..………………….iv
Acknowledgments……………………………………………………………….……...vi
Table of Contents……………………………………………………………..…….…..vii
Table of Figures…………………………………………………………….……..……viii
Table of Tables…………………………………………………………….………..…..xi
Abbreviations……………………………………………………………………...……xii
Chapter 1: General Introduction…………………………………………………………1
Research Objective……………………………………………………………………..19
Chapter 2: Tracking the protracted effects of paraquat in a murine model of
Parkinson’s disease: A neurophysiology and imaging study…………………………..21
Introduction ……………………………………………………………………24
Methods…………………………………………………………………...……26
Results……………………………………………………………………...…..33
Discussion……………………………………………………………….……..42
Chapter 3: A murine model of Parkinson’s disease interacts with dextran sodium
sulphate and pro-biotics………………………………………………………………..47
Introduction ……………………………………………………………………49
Methods………………………………………………………………………...52
Results………………………………………………………………………….64
Discussion……………………………………………………………………...75
Chapter 4: Leucine rich repeat kinase-2 (LRRK2) modulates paraquat induced
inflammatory sickness and stress phenotype…………………………………………...81
Introduction … ……… ………… …………………………………………….85
Methods………………………………………………………………………...88
Results………………………………………………………………………….95
Discussion……………………………………………………………………..105
Chapter 5: PLX-3397 administration blunts the effects of a murine model
of Parkinson’s disease……………………....………………………………………….112
Introduction ……………………………………………………………114

viii
Methods…………………………………………………………………..…..116
Results………………………………………………………………………..124
Discussion…………………………………………………………………....135
Chapter 6: General Discussion…………………………………………………...…..141
Conclusions…………………………………………………………..………………159
References……………………………………………………………………………160

ix
Table of Figures
Chapter 2:
Figure 2.1: Experimental timeline in weeks, animals were assessed daily for weight and sickness
outcomes during the first three weeks then bi-weekly afterwards.
Figure 2.2: Paraquat treatment leads to acute failure to gain weight and lasting alterations in
peripheral organs.
Figure 2.3: Paraquat treatment induces lasting TH+ cell loss in the SNc.
Figure 2.4: Paraquat treatment results in persistent altered microglial phenotypes
Figure 2.5: Markers of inflammation, phagocytosis and cell death are increased following
paraquat administration.
Figure 2.6: Circulating corticosterone remained elevated more than one moth following paraquat
administration as did markers of actin-cytoskeleton remodeling.
Figure 2.7: No gross alterations were detected in hippocampal, ventricle or SNc volume, neither
were any hemispheric alterations found.
Chapter 3:
Figure 3.1: Timeline of experimental treatments, behaviours, and sample collections.
Figure 3.2: DSS significantly altered gut microbiota composition but LPS and paraquat
combination treatment did not.
Figure 3.3: DSS led to transient weight loss and decreased survival, whereas VSL #3 prevented
the LPS and paraquat induced reduced weight gain.
Figure 3.4: DSS had lasting effects on motor coordination as well as transiently reduced home-
cage activity after administration, LPS and paraquat combination treatment reduced locomotor
activity at sacrifice.
Figure 3.5: LPS and paraquat combination treatment reduces TH+ cell count in the SNc.
Figure 3.6: DSS treatment led to increased microglial activation in the SNc as did LPS and
paraquat combination treatment.
Figure 3.7: DSS treatment increased intestinal TNF-α and IL-1β mRNA expression

x
Figure 3.8: Circulating immune factors were increased by LPS and paraquat combination
treatment as well as by DSS administration.
Figure 3.9: LPS and paraquat administration alter proteins involved in inflammation, astrogliosis
and cell motility.
Chapter 4:
Figure 4.1: Timeline in days for experiment 3, injection days are indicated by vertical bars
above the axis while behavioural assessments are indicated below the axis.
Figure 4.2: LRRK2 KO prevented paraquat and LPS + paraquat induced sickness behavior and
mortality
Figure 4.3: LRRK2 KO prevented paraquat induced home-cage motor activity and nestlet
building deficits
Figure 4.4: LRRK2 KO blunted corticosterone elevations but not BDNF or 5-HT1A changes in
paraquat exposed mice
Figure 4.5: LRRK2 KO but not G2019S overexpression increased fraktalkine expression in the
SNc
Figure 4.6: LRRK2 KO prevented the pathological effects of paraquat within the periphery
Chapter 5
Figure 5.1: Timeline in days for experiment 4, injection days and treatments are indicated by
vertical bars above the axis while behavioural assessments are indicated below the axis.
Figure 5.2: PLX-3397 pre-treatment protected mice from LPS induced weight loss and locomotor
deficits.
Figure 5.3: LPS and paraquat combination treatment leads to TH+ cell loss in the SNc in both WT and
G2019S KI mice.
Figure 5.4: LPS and praquat treatment increases microglial activation as does LRRK2 G2019S genotype,
this genotype effect is reduced by PLX-3397 administration.
Figure 5.5: LPS and paraquat combination treatment increases circulating corticosterone and cytokines.
Figure 5.6: PLX-3397 administration decreased levels of cell death markers and the fraktalkine receptor
while increasing levels of the anti-oxidant inducer SiRT3.

xi
Figure 5.7: Markers of astrogliosis are increased following LPS and paraquat administration while
pretreatment with PLX-3397 further led to GFAP increases.
Figure 5.8: PLX-3397 administration leads to increased soluble alpha synuclein in the striatum.

xii
Abbreviations
1-methyl-4-phenyl-1,2,3,6-tetrahydropyridine MPTP
3,3′-Diaminobenzidine DAB
6-Hydroxydopamine 6-OHDA
Alpha Synuclein α-syn
bicinchoninic acid BCA
Blood Brain Barrier BBB
Bone Marrow Derived Macrophage BMDM
Bovine Serum Albumin BSA
Cycle Threshold Ct
Dentritic Cells DCs
Dextran Sodium Sulphate DSS
Fractalkine CX3CL1
Fractalkine Receptor CX3CR1
Glial Fibrulary Acidic Protein GFAP
Intraperitoneal IP
Ionized Calcium Binding Adapter 1 IBA-1
Irritable Bowel Syndrome IBS
Knock out KO
Knock-in KI
Leucine Rich Repeat Kinase 2 LRRK2
Lewy Body Dementia LBD
Lipocalin LCN2
Multiple System Atrophy MSA
Neutrophil Gelatinase-Associated Lipocalin NGAL
Nicotinamide Adenine Dinucleotide NAD+
Normal Goat Serum NGS

xiii
Parkinson's Disease PD
Phosphate Buffer PB
Phosphate Buffered Saline PBS
Regulatory T Cells Treg
Serotonin 5-HT
Sirtuin SiRT
Sodium Dodecyl Sulphate SDS
Striatum ST
Subcutaneous SQ
Subtantia Nigra Pars compacta SNc
T Helper 1 Cells Th1
Tris buffered Saline TBS
Tyrosine Hydroxylase TH
Ubiquitin/Proteasome System UPS
Wild Type WT

1
Chapter 1:
General Introduction

2
1.1 Parkinson’s Diseases
Parkinson’s disease (PD) is a neurodegenerative disorder affecting approximately 1-3% of
individuals over the age of 65, second in prevalence only to Alzheimer’s disease [1, 2]. The number
one risk factor for a PD diagnosis is age, with a prevalence rate of ~0.5% which rises rapidly
between the ages of 60 and 80 to peak at approximately 4% of the male population and 1.5% of
the female population [3, 4]. Historically, clinical diagnosis of PD was based on the concept of a
motor disease with four principle symptoms; bradykinesia, tremors, rigidity, and postural
instability [5]. More recently, diagnostic criteria have expanded based on literature describing
prodromal forms of the disease, genetic contributions and the role of the alpha-synuclein protein
in disease state to include a variety of non-motor symptoms occurring in conjunction with
bradykinesia [1, 6]. These motor symptoms arise following the loss of the dopamine producing
neurons in the substantia nigra pars compacts (SNc) [1]. Strikingly, motor symptoms are typically
diagnosed after 60-80% of the dopamine fibres in the brain have already been lost [7] and between
30 and 50% of the SNc neurons have been lost [8]. In combination with data detailing prodromal
forms of the disease, the leading etiological hypothesis is that a series of genetic vulnerabilities
interact with the environment and natural aging process over the course of years to decades to
result in PD [9, 10].
In PD, the complex neural circuitry controlling movement becomes disrupted when
dopamine producing neurons in the SNc degenerate [1]. These neurons normally innervate a
portion of the forebrain known as the basal ganglia which plays a role in both positive and negative
action selection [11, 12]. The basal ganglia projects to the pre-motor cortex which formulates a
specific movement blueprint [11] which is then acted on by the motor cortex. Currently, the exact

3
biological nature of non-motor symptoms and co-morbidities including loss of olfaction,
depression, delayed intestinal contractions and dementia are not understood [13, 14].
Each year approximately 6,600 new PD cases are diagnosed in Canada [4], with 10% being
familial but most likely related to genetic and environmental factors [15]. The majority of familial
cases can be traced to a relatively small pool of genes which include autosomal dominant (SNCA,
LRRK2 and VPS35) as well as autosomal recessive (PINK1, DJ-1 and Parkin) mutations [15]. In
addition to intrinsic factors, such as age, external factors including diet [16, 17] and environmental
interactions [18, 19] have been found to markedly alter immune profiles. Most recently changes
in the composition of the gut microbiome were found to lead to increased alpha-synuclein
pathology in a mouse model of PD [20]. This follows several human population studies that have
uncovered microbiota alterations in PD patients [21, 22] and linked gut dysfunction as a major risk
factor for diagnoses [23]. Given that the composition of the gut can be substantially altered based
on diet or purposefully manipulated with pro- and anti- biotics the role of the microbiome and
more broadly gut is highly important to consider as a potential target for novel therapeutics.
1.2 Inflammation
Inflammatory processes that occur both within the brain and in the periphery have been
linked to PD. The inflammatory immune system is one of the evolutionarily oldest systems being
present in virtually all organisms. Inflammation is a fundamental basic system that protects the
organism from environmental threats emerging from microbial or other toxic insults. Classic
inflammation in the periphery is typically experienced in a gross sense as the swollen heated tissue
around an injury such as a cut or bruise, however, this simple understanding belies the complex

4
immune response responsible for this process. Inflammation and immunity in general is mediated
through a variety of cell types in the peripheral nervous system including macrophages,
monocytes, dendritic cells, B-cells and T-cells amongst many others [24]. These cells and their
responses can be categorized as innate or adaptive immune responses. Innate immune responses
are general non-specific defense mechanisms which rapidly act to deal with infections or damaged
cells [24, 25]. The main component of this response are neutrophils, which release a host of
reactive oxygen species and antimicrobial proteins [25], and macrophages, the main phagocytic
cell in the body which engulfs foreign particles, pathogens, and help recruit further immune
responses [24]. Adaptive immunity is the specific response to a damaged cell or pathogen mediated
through cytokines and antigens [24]. B-cells and T-cells comprise this system and work together
to recognize and destroy invading or damaged cells. B-cells bind to antigens and with the aid of T
helper cells differentiate into plasma cells which secrete large volumes of cytokines and antibodies
to recruit immune responses [24, 26]. T-cells can be split into two distinct classes, T-helper cells
and cytotoxic T cells [24]. The first serve to mediate the up- and downregulation of the immune
system through the release of pro- and anti-inflammatory cytokines[27], while the latter multiply
and can induce cell death through cleavage of caspases or direct generation of reactive oxygen
species (ROS) [28].
Under normal conditions the central nervous system (CNS) is somewhat isolated from
these peripheral immune cells by the blood brain barrier (BBB) and is instead monitored by
microglia, the brain’s resident immunocompetent cell which in many respects is analogous to
peripheral macrophages [29]. Microglia are part of the innate immune system, however, direct
interactions with neurons through fracktalkine signalling as well as transcriptional differences
“tone-down” pro-inflammatory signalling compared to peripheral immune cells [30, 31]. Despite

5
this separation, immune activation can occur in the CNS following viral and bacterial infections,
stroke and traumatic brain injury [32, 33]. In the acute phase, inflammation is beneficial, as it
removes pathogens and damaged cells to prevent widespread infection and cell death. Despite
these benefits, if inflammation persists it creates a hostile environment high in pro-inflammatory
factors and ROS [34]. Some cells and regions within the brain are further vulnerable to
inflammation for a variety of reasons including axonal length and complexity [35], oxidative
neurotransmitters [36] and resting microglial distribution [37]. The dopamine producing cells
located in the SNc are one of these vulnerable populations [35, 37].
Similar to the cells of the peripheral immune system, microglia extend long processes to
detect markers of cell death and pathogens such as bacteria and viruses within their
microenvironment [38]. In this resting, or quiescent state, microglial cells have small somas and
highly ramified processes which are evenly spread around their microenvironment [38]. Upon the
detection of disruptions or injury in the microenvironment the microglia reorganize their
cytoskeleton in order to retract processes into the soma and migrate towards the source of injury
[38]. The membranes of damaged cells become permeable to molecules normally not found in the
microenvironment (heat shock proteins, nuclear DNA and RNA, potassium concentration
changes) signaling microglia and inducing translational and structural changes to promote an
appropriate inflammatory or phagocytic response [39].
Over the past several decades research has solidly demonstrated that chronic inflammation
represents an extremely important factor in both animal and human models of PD [40]. Utilizing
various models researchers have found that microglia aid in the mediation of alpha-synuclein
aggregation and contribute to dopaminergic cell death (as marked by Tyrosine hydroxylase (TH+)
staining) in the progression of PD [41]. Enhance microglial activation, increased levels of pro-

6
inflammatory cytokines and alterations in inflammatory mediators such as sirtuins are consistently
observed in the brains of post-mortem PD patients and in their cerebrospinal fluid (CSF) [41–43].
Further research has also established that infections both systemic and in the CNS contribute to
neuroinflammatory, neurodegenerative and behavioral alterations in patients and have indicated
that viral infections may mediate microglial reactivity prior to BBB permeability [44–47]. Our
own lab in addition to others have demonstrated that exposure to the bacterial endotoxin,
lipopolysaccharide (LPS), augmented TH+ neuron loss in the SNc when mice were subsequently
exposed to the pesticide paraquat, this has corresponded to work in the Greenamyre lab using the
pesticide rotenone and more of our own work with the viral mimic poly I:C [48–51].
While it is possible that microglial mediated neuroinflammation could be a secondary
reaction following neuronal damage or death [52], much current evidence supports this process as
the primary cause of neuronal death [52]. Several studies have found evidence indicating that
chronic neuroinflammation may be the result infiltrating peripheral immune cells or environmental
toxicants such as heavy metals [18, 53, 54]. This chronic inflammation then precipitates neuronal
degeneration as a result of ROS and other factors secreted by the activated microglia. In particular,
this might be especially true for the SNc which has a particularly high density of microglia,
together with very metabolically active dopamine neurons [55, 56]. Supporting this, central
infusion of moderate to high concentrations of LPS into the SNc results in augmented microglial
activity and pro-inflammatory cytokine release as well as dopaminergic cell loss [57]. Interestingly
similar research in mice found that injections in other brain regions including the hippocampus
and thalamus resulted in augmented microglial activation but not neuronal death [37]. Indeed,
repeated culture-based experiments demonstrated that LPS is not sufficient to result in neuronal
death unless neurons are co-cultured with macrophages or microglia [58, 59].

7
1.3 Leucine rich repeat kinase 2
While there are several genes identified in the development of PD, nearly 10% of familial
and 2% of sporadic cases are the result of the Gly-2019-Serine (G2019S) mutation in the LRRK2
gene [60, 61]. In addition to this mutation, four other mutations in the LRRK2 gene have been
unequivocally linked to PD pathology and a large number of other LRRK2 mutations may play a
role disease development and symptomology [62–64]. LRRK2 was first discovered in the early
2000’s and has since been linked to several immune processes [57]. The gene is exceedingly large
at 2,527 amino acids in length compared to the typical 375 amino acid length for a human protein
[65]. It is also the only known human protein to have both active kinase and active GTPase sites
and is highly conserved with homologues across species tracing all the way to amoeba [66]. Oddly,
despite this conservation, the promoter region of this gene is highly differentiated between species
such that the protein is expressed to different amounts in different tissues and cells even in closely
related animals such as rats and mice [67].
LRRK2 mutations are quite common and many often appear to be benign. Mutations in the
ROC-COR and kinase domains seem to contribute to the risk of developing PD although
paradoxically may be protective in several other diseases [63, 64, 68, 69]. Mutations in the
remaining regions of the gene are fairly common but are not strongly linked to PD or detrimental
outcomes in general [70]. The proportion of the population expressing mutant LRRK2 varies by
population with up to 30% of individuals in North African Berber and Ashkenazi Jewish
populations carrying the G2019S LRRK2 mutation to 5% of North Americans and Europeans
carrying the allele and <1% of Asians [60, 61]. Despite this variable chance, it appears this
mutation has arisen in three separate incidences and recent research has indicated it may play an

8
evolutionary important role in the protection of hosts from pathogens [71, 72]. Supporting this,
LRRK2 mutations including G2019S and R1441G/C have low penetrance rates in young
individuals which climb sharply with age. At 60 years of age the penetrance is approximately 30%
and 15% rising to 75% by the age of 80 for these respective mutations [3, 73].
LRRK2 is found throughout the peripheral and central nervous systems in both model
organisms and humans. In the periphery LRRK2 is most highly expressed in the spleen, kidneys
and lungs as well as immune cells including monocytes, macrophages, B cells and dendritic cells
[74–77]. The high expression of LRRK2 in the lungs and immune cells of the periphery strongly
suggests a role for the protein in host defence and several researchers have found evidence for this
hypotheses [71, 72, 78]. In the central nervous system expression has been detected in neurons,
astrocytes and microglia [79], however, this expression appears to be disease linked, increasing in
the proximity of Lewy bodies and in patients with PD [51, 79]. Interestingly LRRK2 levels appear
to be 3-4 times higher in microglia compared to other CNS cells and unpublished data in our own
lab has found higher expression of LRRK2 corresponding to inflammation [80, 81]. While LRRK2
is found throughout the brain, protein levels and mRNA levels do not appear to correspond and so
while expression has been consistently detected in the cortex and cerebellum data on expression
in the hippocampus, striatum and SNc has thus far been inconsistent. Unsurprisingly given the
length and complexity of the LRRK2 protein, its intracellular interactions include proteins
associated with synaptic/transport vesicles, endosomes, and lysosomes as well as the mitochondria
[82–85]. The emerging consensus in current literature is that LRRK2’s main mechanistic action is
to regulate cytoskeletal dynamics involved in cellular migration, neurite outgrowth, vesicle
trafficking and phagocytosis [86–88].

9
Supporting the hypotheses of LRRK2 as an immune and cytoskeletal modelling protein,
many studies have demonstrated that different LRRK2 variants are associated with Crohn’s
disease, Alzheimer’s, Leprosy and cancer [57, 64, 89–93]. Indeed, in the case of leprosy, LRRK2
appears to be protective from developing symptoms, however, patients are at much greater risk for
an excessive pro-inflammatory response known as type-1 reaction which follows the cessation of
disease treatment in some cases [64]. This reaction leads to damage in peripheral nerves and
accounts for much of the sensory and motor impairments resulting from the disease [94]. Amongst
the numerous disease associated with LRRK2 mutations, a common theme is the role of
inflammation, spanning across disease states and organ systems. Interestingly, asymptomatic
LRRK2 carriers have been reported to display increased levels of peripheral inflammation [95]
and LRRK2 levels are found to be altered in peripheral immune cells in idiopathic PD patients
with WT LRRK2 genotype [51, 96].
Thus far, evidence has supported these findings in both cell culture and animal models of
inflammation and PD [97]. Microglial and bone derived macrophages exposed to stimuli such as
LPS and IFN-γ in vitro results in upregulation of LRRK2 protein and consequent microglial
morphology and motility alterations [98–100]. A gene screen using drosophila discovered LRRK2
strongly interacts with SCAR a homologue of the mammalian Wiskott-Aldrich syndrome protein
2 (WAVE2) [101]. WAVE2 regulates the WAVE complex which regulates cytoskeletal
remodeling via Arp2/3, this remodeling is vital for cell motility and underlies the ability of
microglia and other immune cells to migrate to the site of injury [102]. Following LPS
administration into the striatum [57] similar effects of LRRK2 are found and stab wounds induced
greater migration in LRRK2 knockdown mice but less so in G2019S mice [100]. Further work
from the lab of Andrew West has demonstrated that the LRRK2 G2019S mutation enhances

10
microglial response and leads to increased dopaminergic cell loss following LPS administration in
rats and that pharmalogical inhibition of LRRK2 can prevent this [57, 103] Interestingly LRRK2
has also been found to interact with alpha synuclein in double-mutant models and alpha synuclein
fibril models leading to increased markers of inflammation and dopaminergic cell death [104, 105].
Levels of LRRK2 and its mutations have further been shown to alter the intrinsic responses of
microglia to inflammatory stimuli by altering transcription in the NF-κB pathway, which is linked
to a variety of pro-inflammatory consequences [74, 97, 104, 106]. Similar research has also found
LRRK2 to aid in the regulation of pro-inflammatory transcription factor, NFAT, which
translocates to the nucleus when active and induces the transcription of cytokines such as IFN-γ
and IL-6 [80, 86, 107–109]. Taken together, these studies have clearly linked LRRK2, in particular
the G2019S mutation, to enhanced inflammatory activity at both the cellular and systems level.
1.4 Alpha-Synuclein Hypothesis
One of the key diagnostic measures utilized in PD is the presences of alpha-synuclein
inclusions typically found in post-mortem histology [110, 111]. Alpha-synuclein (α-syn) is a
relatively small protein consisting of 140 amino acids and is produced by the SNCA gene [112].
In the CNS α-syn is primarily expressed in pre-synaptic terminals of neurotransmitter pathways
including the dopamine system [112]. High levels are also found in red blood cells and in the
gastrointestinal tract supporting the idea that α-syn protein has multiple functions [113].
Interestingly, while α-syn has been implicated in several diseases such as Lewy body dementia
(LBD) and multiple system atrophy (MSA) [113], aberrant α-syn effects typically occur only in
some areas of the CNS [114]. These areas notably include the SNc in PD as well as cholinergic
neurons in LBD and are thought to be vulnerable to α-syn dysregulation and accumulation due to

11
factors including: heightened metabolic rate [35] – resulting in part from pacemaker activity in the
SNc and in part due to the enhanced activity of dopaminergic neurons discussed earlier – increased
Ca2+ concentrations [114], and DAT expression [113, 115]. Interestingly, α-syn has been found to
enhance DAT levels in DA neurons and reducing the expression of DAT protects from MPTP
administration in vitro [115]. In both the CNS and the periphery, α-syn spontaneously converts
between monomeric and oligomeric states, however, in PD α-syn is also commonly found in fibrils
and plaques making up lewy bodies [116]. Several studies have attempted to define homeostatic
α-syn forms, however, given the flexible nature of the protein, no study has yet ascertained which
in vivo forms of α-syn are toxic [113]. Increasing evidence suggests that toxicity may be linked to
location [117] with α-syn monomers able to disrupt protective cell pathways in vitro [118].Despite
this, most models have focused on examining oligomeric and fibril forming α-syn as effects have
been reproduced both in vitro and in vivo in many model systems [119, 120].
While the full functions of α-syn have yet to be elucidated, evidence has found that it is
physiologically present at the pre-synaptic terminals and demonstrates functions associated with
chaperonins and aids in vesicle trafficking across the membrane [113]. In addition to this, α-syn
appears to further play a role in the regulation of DA essential proteins including DAT, SNARE
and VMAT2. Interestingly, despite the pre-synaptic location of α-syn, and its wide distribution
throughout the body, knockout of the α-syn protein is not lethal and produces very subtle
phenotypic alterations [121, 122]. Indeed some evidence suggests that α-syn may even play a
protective role. Menges et al in their 2017 study found that α-syn expression prevented apoptosis
and mitochondrial dysfunction under oxidative stress conditions in vitro [123]. These data taken
together suggest that α-syn may primarily be important during periods of inflammation, stress or
rapid neurotransmitter turnover.

12
As the exact toxic form of α-syn is not currently known, much research focuses of
differentiating monomers, oligomers, phosphorylated α-syn and fibril α-syn from each other [112,
113, 117]. However, this is quite complex as normal western blots are denaturing and thus alter
conformation and split apart oligomers while the normal extended conformation of physiologic α-
syn means that running non-reducing westerns produce monomeric bands at where dimers or
tetramers would be expected [113]. One recent method used to separate α-syn is examining soluble
vs insoluble protein following a serial extraction procedure [124]. In this procedure homogenates
are extracted using buffers of increasing detergent strength, insoluble protein in each buffer is spun
down with an ultracentrifuge and then resuspended in the next buffer [124]. By comparing the
ratios of more-soluble to less-soluble α-syn an idea of the physiological state can be obtained [124,
125].
In addition to the aggregation of α-syn, there is also interest in the manner in which
different forms may be cleared within the CNS and whether alterations in these mechanisms may
play a role in neurodegenerative processes. Clearance of extra-cellular α-syn is mediated chiefly
by microglia and astrocytes, however, these pathways are relatively understudied given the lower
abundance of α-syn outside of the neuron (ie in the interstitial fluid and CSF) [126]. Extracellular
accumulation of α-syn has been shown to cause increased inflammation and astrocytic expression
of α-syn is associated with neurodegeneration [127, 128]. Recent research has found that KO of
LRRK2, an important inflammatory protein in the CNS, leads to greatly increased clearance of α-
syn through upregulation of endosome formation [129] and that LRRK2 KO in rats also slows
neurodegeneration in an α-syn model of PD [130]. Intra-cellular clearance occurs through three
main pathways: 1) autophagy, 2) the ubiquitin/proteasome system (UPS) and 3) cellular excretion
[131, 132]. Autophagy typically targets aggregated α-syn through interaction with the autophagic

13
protein LAMP-2A on lysosomal membranes within the cell [133] triggering the upregulation of
chaperone-mediated autophagic pathway proteins such as LC3 and HSC70 which can be found
co-localized with lewy bodies in vivo [133]. Excretion of α-syn accounts for relatively little of the
total α-syn volume, however, following the Braak hypothesis the excretion of mis-folded α-syn
may be one of the main mechanisms through which pathology spreads [134]. Interestingly,
inhibition of autophagy within the neuron results in an increase in excretion of α-syn and
preventing cell death in an in vitro model of PD suggesting that α-syn excretion may serve to
compensate for abnormal cellular processes [135].
1.5 Environmental Hit PD Modeling
In order to examine the causative factors underlying PD-related neurodegeneration many
animal models have been created including; 1) toxicant based models, 2) genetic models, and 3)
combinatorial models [136]. Toxicant models include both direct toxicants such as 6-OHDA and
MPTP and indirect toxicants such as LPS, paraquat and rotenone [136]. Direct toxicants are taken
up directly by DA producing neurons and have a rapid, pathological impact which recapitulates
neuroinflammation and DA loss but fail to replicate synucleopathies, many non-motor symptoms,
or the progressive nature of the disease [136, 137]. In contrast, indirect toxicants typically require
multiple treatments and can lead to off-target effects, however, they allow researchers to more
closely explore selective neurodegeneration over time and investigate mechanisms external to DA
neurons [138]. These models more closely replicate human PD conditions including
synucleopathies, DA loss and non-motor symptoms, however, they take more time and are
frequently more variable than direct mechanisms [136–138].

14
The present thesis experiments seek to investigate the pesticide, paraquat, either alone or
in combination with the inflammatory endotoxin, LPS. Previous work in our laboratory has
substantially explored these models, and found them to elicit highly reproducible PD-like
behavioral and biological pathology [42, 48, 50, 139–141]. Meta-analyses and epidemiological
studies primarily conducted on agricultural communities have demonstrated a strong link between
pesticides and PD in humans [142–144]. Interestingly, several compelling lines of evidence
suggest a role for specific pesticides, including the organic insecticide, rotenone, and the non-
selective herbicide, paraquat, as major risk factors for disease development [143]. These
epidemiological findings are supported by a plethora of animal studies (both primate and rodent)
demonstrating the ability of these toxins to dose-dependently induce PD-like pathology. Other
researchers have demonstrated the ability of paraquat to induce the loss of dopamine neurons in
the SNc in a dose dependent manner reminiscent of that which occurs in PD [145–147]. Further,
these studies have recapitulated other behavioural and neuropathological features of the disease
including motor behavioural disturbances, reduction in striatal fibre density, microglia activation,
oxidative stress, and aggregated protein inclusions [139, 148–150].
Paraquat provides an especially useful model of PD as in rodent models it is found to
penetrate the BBB in an age-dependent manner [151, 152]. Using microdialyses in combination
with high performance liquid chromatography (HPLC) and the peripheral administration of amino
acids the lab of Shiono was able to determine that in rats the neutral amino acid transporter is able
to allow paraquat to cross the BBB [152]. Once taken up into the CNS, paraquat shows no
appreciable selectivity for brain region and is detected relatively evenly across areas including the
prefrontal cortex, hippocampus, striatum, and SNc [56]. Paraquat functions as a general oxidative
stressor in a limited fashion, converting between its monovalent and divalent form [153–155].

15
Interestingly, studies have determined that interactions with the NADPH complex on microglia
and other immune cells greatly enhances this REDOX cycling and thus organs with a high immune
cell content such as the lungs and CNS, more so the SNc, show more reactivity to paraquat [37,
153, 154]. Of further interest, case-control studies have found individuals with dopamine
transporter (DAT) mutations have a greater susceptibility to PD following paraquat exposure
[156]. Another study found that conversion to its monovalent form by interaction with NADPH,
PQ+ was able to enter dopaminergic neurons through DAT and, with less affinity, enter other
nigro-striatal neurons through the Oct-3 transporter [157]. Inside cells, paraquat interacts with the
electron transport chain to increase the generation of ROS and increases mitochondrial membrane
permeability leading to apoptotic factor release [158]. While primarily implicated in ROS
production and electron transport chain dysfunction, paraquat has also been found to damage
vesicles, induce endoplasmic reticulum stress, and react with basal levels α-synuclein, although
notably this is not enhanced by overexpressed levels of alpha synuclein [153, 157, 159–164].
Taken together, these various findings strongly support the use of paraquat as a robust model of
PD both at the cellular and epidemiological level.
Currently, a plethora of animal models including paraquat currently exist to replicate
various aspects of human pathology, however, there is still no single model that adequately reflects
the entire human disease process [136–138]. This is due in part to the large variance in symptoms
and their severity which manifest in PD as well as the challenge in replicating a disease
hypothesized to develop over 30-40 years in animals with a 1-2 year lifespan [136]. While the
view of PD as a complex genetic disease has gained traction in review literature many researchers
are still using cell culture or animal models based solely on one factor [37, 165–169]. Several
researchers have begun to explore the disease process using a combination of genetic factors and

16
environmental toxicants [48, 50, 170–174], however, there has yet to be wide uptake of these
combinatorial studies as evidenced by the large number of studies, especially in non-human
primates, utilizing 6-OHDA and MPTP [166, 168, 169, 175, 176]. Rising genetic evidence has
demonstrated that many PD genes have low penetrance increasing with age suggesting that PD is
both progressive and that PD pathology may be triggered by environmental exposures in
vulnerable individuals. In the face of these concerns it is essential to investigate the myriad of
factors currently linked to PD and explore how they may interact.
1.6 Influence of the gut on PD
While many studies have utilized injections of environmental toxicants such as rotenone
and paraquat, recent literature has begun to examine how internal alterations to the gut microbiome
may lead to PD [177, 178]. The microbiome consists of the diverse array of bacteria, fungi, viruses
and bacteriophages found on the surface of the body as well as in the oral cavity and the blood
[179]. Within this, the gut microbiome contains the highest concentration of these factors and
interacts directly and indirectly with many systems within the body [179]. The composition of the
gut is largely believed to be inherited from the mother during birth and is extremely fluid early in
life [180, 181]. Exposure to different diets and environments has some effect on composition,
however, after the introduction to solid foods age and disease appear to be the largest modulators
of gut composition [181, 182]. Various factors including illness and antibiotic use [183] can
temporarily alter the microbiome, however, new evidence suggests the appendix acts as a protected
reserve and may repopulate the gut following these events [184]. Other researchers have
investigated repopulation of the gut following diarrhea and found that repopulation can take close
to a month and follows a serial succession to re-establish the complex communities and thus

17
therapeutics that enhance this reestablishment may help relieve symptoms or reduce recovery
times [185].
Despite the microbiome being made up of bacteria and other organisms, it contributes to
development and maintenance of many health related systems including the immune system [186,
187] and the BBB [188]. Interestingly, germ-free mice raised in a sterile environment do not form
a natural BBB, however, exposure to either gut bacteria or their metabolites early in life leads to a
partial formation of the BBB [188]. Indeed disruption of gut homeostasis, termed dysbiosis, has
been found in a variety of disease states including: irritable bowel disease (IBS) [189], Crohn’s
disease [190], Parkinson’s disease [21], asthma [191, 192], allergies [193, 194], obesity and viral
infections [195]. In normal circumstances the gut microbiota is isolated from direct contact with
the intestinal wall by a thick layer of mucous produced by goblet cells in the small intestine and
colon [196]. In the small intestine this layer is loose and allows for growth of bacteria and passage
of nutrients to the villi while the colon has both a thick-bacteria free layer against the cells as well
as a loose layer for colonization, most of the gut bacteria are found in the colon [197, 198]. This
mucous layer is mediated by the MUC2 protein mucin and animal models of colitis suggest that
loss of this protein or components of the mucous leads to greatly enhanced inflammation and gut
permeability [198]. One downstream consequence of increased intestinal permeability and thinner
mucosal layers is the alteration of immune signalling by dendritic cells in the gut. Dendritic cells
(DCs) constantly sample the gut microenvironment, modulate response to the gut microbiota and
are sensitive to compositional changes [199, 200]. During homeostasis these cells recruit and
activate T regulatory cells (Treg) which serve an anti-inflammatory role and repress immune
responses against an individual’s microbiota [199, 200]. As the mucosal layers thin or pathogenic
bacteria populate the gut DCs recruit further immune cells including other DCs and T helper 1
18
cells (Th1) which recruit macrophages and promote a pro-inflammatory state [27, 200]. While DCs
are largely non-motile and remain in the gut tissues, the Th1 recruitment and pro-inflammatory
signals can freely circulate and thus may “prime” other locations in the body that have not been
directly exposed to bacterial products [201–203].
In the case of PD, numerous studies over the past five years have demonstrated in a variety
of populations that the gut microbiota is significantly altered in patients compared to age-matched
healthy controls [21, 204, 205]. Tracking human PD patients through regular fecal samples has
demonstrated that total bacterial diversity in the intestine decreases with disease progression [206].
The gut is one of the few organs within the body that are directly exposed to the environment and
thus represents a potential source for gene-environment interaction both with the microbiota itself
and with ingested toxicants. Further evidence of a link between the gut and PD comes from two
studies which examined PD prevalence if the vagal nerve, a direct path between the gut and CNS,
was severed. They found truncal vagotomy reduced future incidence of PD, however, partial
vagotomy did not [207, 208]. These data tie in with clinical reports which have found
gastrointestinal difficulties enhance PD risk and typically precede PD symptoms by up to ten years.
More recently, several labs have begun to investigate whether α-syn aggregation in the periphery
may be influenced by microbiome alteration and whether these aggregates may impact the vagal
nerve [209–211]. On this note, other researchers have also investigated gut α-syn as a potential
biomarker for PD in human patients and found significantly more PD patients displayed aggregates
than controls [212].
One of the main interests in studying the microbiota is the potential for novel therapeutics.
Given that the gut is accessible both orally and rectally numerous studies have begun examining
the potential to modulate gut homeostasis using pre- and pro-biotics [213–216]. Due to the

19
complexity and sheer number of organisms making up the microbiome relatively little is
understood about many of the components specifically the viruses, fungi and bacteriophages and
thus research has focused on bacteria, the best characterized organisms in the gut [217]. While
many pre and pro-biotics have been trialled, two products or techniques are notable in their
success. The first, faecal transplantation or synthetic stool transplantation is the process through
which donations from healthy volunteers are collected, purified and rapidly administered in order
to supplant existing microbiota or colonize a new microbiome in individuals suffering from C.
difficile infections or high dose antibiotic treatments [218]. The second is the probiotic cocktail
VSL #3. VSL #3 is a formulation of 8 lactic acid producing bacteria [219] which are thought to
reduce gut permeability and thus lower gut inflammation and promote a health microbiome [220].
Indeed, both animal and human studies using chronic oral administration of VSL#3 have found
significant effects in preventing remission in IBS and ulcerative colitis patients [221–223].
Interestingly, some rodent studies have also implicated VSL#3 as having CNS effects, notably in
a model of memory deficits and in a separate study examining multiple sclerosis [224, 225].
Although thus far human trials have met with limited success, promising data from animal models
and a growing understanding of the gut may allow for future PD interventions.

20
Research Objectives
It is now widely accepted that sporadic PD cases emerge from exposure to a constellation
of environmental insults over the course of one’s lifetime that act together with inherent genetic
vulnerabilities and aging processes [226, 227]. Hence, this thesis comprises four major
experiments that collectively address the role of specific environmental (paraquat, LPS) and
genetic (G2019S LRRK2 mutation) factors on the emergence of PD-like pathology. In brief, Study
1 focuses upon the impact of paraquat as a function of age. Indeed, there is a paucity of studies
that actually utilize mice of advanced age. Study 2 then focuses upon the role of the microbiota in
the inflammatory and neurodegenerative effects of paraquat alone and in conjunction with LPS
administration. Study 3 moves on to assess whether the LRRK2 transgenic G2019S mutation
affects the impact of paraquat and finally, Study 4 further evaluates the role of G2019S knock-in
in the context of our LPS and paraquat dual-hit model. This last experiment will (by using a highly
specific and temporary microglial depleting drug) also involve a more specific assessment of
microglia and their plasticity in relation to PD-like pathology.
In brief, we hypothesized that: 1. Advanced age would augment the impact of paraquat and
that dopamine neuronal loss will tend to be asymmetrical (will be assessed with MRI), 2. Pro-
inflammatory changes in the microbiome would disturb BBB permeability and enhance the
neuroinflammatory impact of LPS and paraquat, 3. G2019S transgenic mice would have altered
paraquat induced neurotransmission but not inflammatory pathology and finally, 4. G2019S
knock-in mice would show an augmented neurodegenerative profile but that temporary microglial
depletion will reverse this effect.

21
Chapter 2:
Tracking the protracted effects of paraquat in a murine model of
Parkinson’s disease: A neurophysiology and imaging study

22
Abstract
The primary motor symptoms of Parkinson’s disease (PD) result from the degeneration of
dopamine producing neurons of the substantia nigra pars compacta (SNc) and often the loss is
asymmetrical resulting in unilateral tremor presentation. Notably, age is the primary risk factor for
PD and it is likely that the disease ultimately stems from the impact of environmental factors which
interact with the aging process. Recent research has focused on the role of microglia and pro-
oxidative responses in dopaminergic neuronal death. In this study, we sought to examine the
neurodegenerative, inflammatory and stress effects of exposure to the etiologically relevant
pesticide, paraquat, over time (up to 6 months following injections). We also were interested in
whether a high resolution 7 Tesla rodent MRI would be sensitive enough to detect the degenerative
impact of paraquat. We found that paraquat induced a significant loss of dopaminergic SNc
neurons and activation of microglia that was stable for at least 6 months following the last
injection. Similarly, long lasting reduction in body weight and alterations in organ (lung and heart)
weight were evident, which reflect the peripheral impact of the toxicant. The microglial pro-
inflammatory actin-remodelling factor, WAVE2, along with the inflammatory transcription factor,
NFkB, and cytokine, IL-6 were also elevated. Remarkably, the stress hormone, corticosterone, was
still significantly elevated one month following paraquat, whereas the inflammasome factor,
caspase-1, and antigen presentation factor, MFG-E8, both displayed delayed rises after the 6-
month time. However, even with exceptional quality imaging, we were unable to detect any
hemispheric changes in ventricles, the hippocampus or nigrostriatal pathway using MRI although
we did find enlarged ventricles in paraquat treated animals. In brief, these data suggest that
paraquat induces permanent neurodegeneration and long-lasting inflammatory changes and the

23
stress and trophic/apoptotic effects appear to either increase with the passage of time or are evident
for at least one month.

24
Background
Accumulating evidence has suggested a multi-hit hypothesis for Parkinson’s disease (PD),
in which the onset and progression of the disease likely involves the collective contribution of a
spectrum of risk factors (e.g. psychological, immune, age, chemical) over time, which likely also
interact with genetic vulnerabilities [18, 19]. Genetically induced alterations to biological systems
(e.g. trophic support, blood brain permeability, and glial processes), may modulate nigrostriatal
vulnerability to environmental insults. Among the environmental factors, epidemiological studies
have reported that exposure to the herbicide paraquat increases the risk of PD [144, 228, 229].
Accordingly, many animal studies now utilize the paraquat model of PD which uses multiple
exposures of this etiologically relevant pesticide in order to induce the loss of dopamine producing
neurons in the substantia nigra pars compacta (SNc) [49, 145, 230].
Paraquat is a general oxidative stressor which is selectively taken up into dopamine cells
through the Oct-8 and dopamine transporters [157] and through interaction with the NADPH
complex on and microglia, switches to its divalent form, which generates reactive oxygen species
(ROS) [150, 231]. In general, the impact of toxicant exposure is increased in aged animals and this
could be related to age-dependent changes in blood brain barrier (BBB) permeability, energetic
alterations and deficits in neuroplasticity [232–234]. It is well known that aging also produces
many transcriptomic and protein phenotypic changes in microglia and that this fuels accumulated
inflammatory changes [235]. In fact, the disease processes in PD likely begin decades prior to the
emergence of motor symptoms. It may be that exposure to toxicants, such as paraquat, in early
adulthood could lead to sustained changes that may alter the aging trajectory. Since aging is the
number one unequivocal risk factor for PD provocation, it is important to evaluate the impact of

25
toxicants, like paraquat, not in isolation, but over time to better understand and translate the
multiple toxicant and immune events occurring in the human population.
In the current study, we sought to determine the impact of exposure to paraquat on
dopaminergic neuronal death, inflammation and stressor related pathways over 6 months following
cessation of paraquat exposure. It was also of interest to assess whether neuronal damage would
be permanent (and possibly asymmetrical), as occurs in human PD, and to determine whether high
resolution MRI imaging can detect such changes. We found that paraquat did indeed provoke a
loss of SNc dopamine neurons that did not change in the six months following cessation of
treatment. Similarly, the toxicant treatment activated SNc microglia and induced marked time-
dependent increases in inflammatory factors, WAVE2 and NFkB, along with circulating levels of
corticosterone and IL-6. Time-dependent changes in inflammatory MFG-E8 and caspases also
occurred and reinforced the protracted nature of paraquat changes. However, the MRI analyses
were unable to detect any significant hemispheric changes although we did find enlarged ventricles
following paraquat treatment. Collectively, these data indicate that paraquat induced a permanent
neurodegenerative response that is accompanied by a unique inflammatory signature that might
have relevance for illuminating potential targets of disease.

26
Methods
General Study Design
Animals
108 male C57Bl6 mice were purchased from Charles River Laboratories and arrived at the
University of Ottawa Barrier Facility at 8-10 weeks of age. Upon arrival all animals were placed
on a normal 12 hour light cycle, given ad libitum access to water and Harlan Labs 2014 rodent
chow. Animals were randomly assigned to receive either 6 paraquat or 6 saline intraperitoneal
injections and be sacrificed 1 hour, 1 month or 6 months following the final injection.
Figure 2.1: Experimental timeline in weeks, animals were assessed daily for weight and sickness
outcomes during the first three weeks then bi-weekly afterwards.
Behavioral analyses
Weights
Animals were weighed the morning of each injection as well as one month and six months
after receiving the last injection.
Home-cage locomotor activity
Baseline
PQ1, PQ2, PQ3
PQ4, PQ5, PQ6
PQ7 + Immediate Sacrifice
1 Month Sacrifice 6 Month Sacrifice
0 1 2 3 4 5 6 7 8 9 10 11 12 13 14 15 16 17 18 19 20 21 22 23 24 25 26 27
Inflammation and Aging Timeline

27
Spontaneous home cage locomotor activity was measured over a complete 12 hour
light/dark cycle using our Micromax (MMx) infrared beam-break apparatus (Accuscan
Instruments, Columbus, OH, USA), as previously described. Spontaneous home cage locomotor
activity assessment was completed following a 30 minute acclimation period in our behavioural
testing room post nestlet removal, measurements of home-cage locomotor activity occurred once
at baseline (Day 0), then again the evening of the 2nd and 5th injection.
Brain dissection and tissue extraction
On the day of sacrifice each treatment group was divided into three with one set of animals
from each being sacrificed by perfusion, rapid decapitation or CO2 asphyxiation. Perfused animals
were intraperitoneally administered 0.15mL of sodium pentobarbital (200mg/kg) and blood was
flushed using 5mL of saline through the left ventricle to the right atrium followed by 40mL of 4%
paraformaldehyde to fix the tissue. 24 hours later the brains were transferred to 10% sucrose and
then transferred to 30% sucrose 48 hours after sacrifice.
In the rapid decapitation peripheral organs including the heart, lungs, spleen and liver were
excised and weighed. The brains of these mice were extracted, sectioned on a matrix with 0.5mm
blade spacing and the SNc was dissected out for magnetic isolation of microglia within 3 minutes
of decapitation.
The final group were sacrificed via CO2 asphyxiation and then taken to the University of
Ottawa’s imaging core and processed in the MRI (as described in the next section). Following the
MRI procedure animals were decapitated post-mortem, brains were extracted, sections and SNc

28
and striatal sections were punched with a hollow needle and flash frozen for Western blotting. This
entire process was completed within 25 minutes of death.
MRI
T2 weighted images of the mouse brain were obtained from four mice per group one hour
after final paraquat injection, one month after final paraquat injection and six months after final
paraquat injection. MRIs were performed at the University of Ottawa pre-clinical imaging core
using a 7 Tesla GE/Agilent MR 901. Briefly, mice were asphyxiated with CO2, placed on the MRI
arm and secured in place with masking tape. A 2D fast spin echo sequence (FSE) pulse sequence
was used, with the following parameters: slice thickness=0.7mm, field of view=2cm,
matrix=256x256, echo time=27ms, repetition time=4000-6500ms, echo train length=8,
averages=6, fat saturation. Both axial (transverse) and coronal plane images were acquired for a
total scan time of 23 minutes. Analyses were performed by a trained neuroradiologist who
examined MRI images for volumetric and hemispheric changes as well as density alterations.
These qualitative analyses were followed up by area measurements of hippocampi, the 3rd ventricle
and the SNc at the same distance from Bregma in imageJ by a blinded investigator.
Circulating factors
In order to determine the concentration of various cytokines and glucocorticoids in
circulation plasma collected during sacrifice was used in both ELISA and Luminex multiplex
assays. Briefly, corticosterone levels were assessed using a Corticosterone ELISA kit (Enzo, ADI-
900-097) following the kit instructions. Plates were read on a Spectramax 190 (Molecular Devices,
San Jose, CA) and concentrations determined using MyAssay software (MyAssay). IL-1B, IL-10,

29
IL-6 and TNF-α were assessed using a Procarta 4-plex (Invitrogen, Carlsbad, CA) prepared
following kit instructions and read on a Luminex Magpix (Luminex, Austin, TX). Concentrations
of each cytokine were evaluated using Luminex Xponent software (Luminex, Austin, TX).
Immunohistochemistry
In order to examine microglial reactivity sections were stained with ionized calcium-
binding adapter molecule 1 (IBA1), a microglial marker found across the membrane. To asses
dopamine cells we used tyrosine hydroxylase (TH). Brains were sliced into 40um thick sections
on our Shandon AS620 cryostat (Fisher Scientific) and sections were immediately placed in a
0.1M PB solution containing 0.1% sodium azide (pH 7.4). Every third section was selected for
each stain (i.e. ST TH; SNc TH; SNc IBA1). For SNc TH staining, slices were washed in phosphate
buffer saline (PBS) (pH 7.4) three times for 5 minutes each, followed by a 30 minute incubation
in 0.3% hydrogen peroxide in PBS. Slices were then washed in PBS three times five minutes each
and a 1 hour incubation in blocking solution containing 5% normal goat serum (NGS), 0.3% triton-
X, with 0.1 M PBS (pH 7.2). Blocker was removed and the slices were then incubated overnight
in primary antibody solution (5% NGS, 0.3% triton-X, 0.3% bovine serum albumin (BSA) in 0.1
M PBS) with 1:2000 anti-mouse TH (Immunostar, Hudson, WI). The following day the primary
antibody solution was removed and sections were washed in PBS three times for a period of 5
minutes each. Following the washes, antibodies in secondary solution (1.6% NGS, 0.16% Triton
X, 0.3% BSA, in 0.1M PBS) were applied to striatum (anti-mouse IgG; 1:500) for a period of 2
hours, and to SNc (anti-mouse HRP; 1:200) sections for 4 hours. Following this, three times five
minute washes were applied to the striatum which was then incubated again in secondary solution
with HRP (1:1000) for an additional 2 hours. All sections were given three times five minutes PBS

30
washes and sequentially exposed to a DAB reaction containing Tris-HCl, DAB and 0.6% hydrogen
peroxide in dH20 for visualization. Sections were washed in PBS three times five minutes each
following DAB exposure and all sections were then slide mounted and set to dry overnight.
Sections were dehydrated using a series of alcohol and clearene washes and subsequently cover-
slipped using DPX. All incubations occurred at room temperature.
To label IBA1 processed ST and SNc slices were washed in PBS (pH 7.2) three times for
5 minutes each, followed by a 1 hour incubation in blocking solution (5% NGS, 0.3% triton-X, in
0.1M PBS). Following removal of the blocker, slices were then placed in anti-rabbit IBA1 (Abcam,
Cambridge, MA) at a dilution of 1:1000 in primary solution (5% NGS, 0.3% triton-X, 0.3% BSA
in 0.1 M PBS) for a period of 2 hours. Sections were then washed in 0.1M PBS three times for a
period of 5 minutes each and reacted with either 1:1000 of anti-goat Alexafluor 594 or 647
antibody in primary solution (5% NGS, 0.3% triton-X, 0.3% BSA in 0.1 M PBS). The signal was
visualized with immunofluorescence microscopy using Microbrightfield image acquisition
software on a Zeiss axioimager2 microscope. All slices were selected and compared between
animals at the same distance from bregma.
DAB stained TH+ cells were analyzed using the optical fractionator workflow in Stereoinvestigator
(MBF, Williston, VT, USA) as previously described [139]. A total of six slices between bregma levels -
3.08 and -3.52 were counted by a blind observer under a 63X oil immersion lens.
Western blot

31
Brain tissue punches and organs were collected to detect levels, MFG-E8, Caspase 1,
Caspase 3, BDNF, CX3CR1, NFκB p65, pNFκB p65 and WAVE2, as described previously.
Briefly, whole cell lysates were homogenized in Radio Immuno Precipitation Assay (RIPA) buffer
[50 mM Tris (pH 8.0), 150 mM sodium chloride, 0.1% sodium dodecyl sulphate (SDS), 0.5%
sodium deoxycholate and 1% Triton X-100] mixed with 1 tablet of Complete Mini
ethylenediaminetetraacetic acid (EDTA)-free protease inhibitor (Roche Diagnostics, Laval, QC,
Cat #11 836 170 001) per 10 mL of buffer. On day one of analysis, proteins were separated using
sodium dodecyl sulphate-polyacrylamide gel electrophoresis (SDS-PAGE). In order to determine
total protein, membranes were incubated in REVERT total protein solution for a period of 5
minutes followed by placement into a REVERT wash solution (6.7% Glacial Acetic Acid, 30%
Methanol, in water) two times 2 minutes each. Membranes were then quickly rinsed with distilled
water and imaged on our LI-COR Odyssey imaging system on the 700 channel for an exposure
period of 2 minutes. Membrane incubation with rabbit anti- MFG-E8, Caspase 1, Caspase 3,
BDNF, CX3CR1, NFκB p65, pNFκB p65 and WAVE2 (1:1000) for a period of 60 minutes in
0.05% fish gelatin in TBS with 0.1% tween followed by one hour in infrared anti-rabbit conjugate
at a concentration of 1:20 000 in 0.5% fish gelatin solution containing 0.2% tween and 0.01%
SDS. Any unbound antibody was removed using 15 mL of TBS-T/membrane and membranes
washed and read on our Licor Odyssy system at the appropriate wavelength for 6 minutes.
Statistical analysis
All data was analyzed by 3 (Time post injection 1 hour vs. 1 month vs 6 months) X 2
(Injection; saline vs. paraquat) two-way ANOVA with significant interactions further analyzed by
means Fisher’s LSD planned follow up comparisons (p < 0.05) where appropriate. Data is

32
presented in the form of mean ± standard error mean (mean ± SEM). All data was analyzed using
the statistical software StatView (version 6.0) and differences were considered statistically
significant when p < 0.05.

33
Results
Peripheral toxicity: paraquat induced an acute failure to gain weight and lasting alterations
in peripheral organ weight.
Following paraquat treatment animals displayed modest but significant weight loss at one
hour following the last paraquat injection (F(1,33)=5.368, p=0.02) (Figure 2.2A); however, this
effect was absent by one month. Interestingly paraquat also induced changes of individual organ
weights that persisted for six months for the heart (F(1,30)=4.153, p=0.05) and one month for the
lung (F(1,30)=5.096, p=0.03) (Figure 2.2B-D). Other organs such as the liver and spleen were
unaffected by paraquat treatment (F(1,30)=0.922, p>0.05).
1 Hour 1 Month 6 Months0
5
10
15
*
Overall Weight
**
**
Time Post Injection
Weig
ht
Ch
an
ge f
rom
Baselin
e (
g) Heart Weight
1 Hour 1 Month 6 Months0.00
0.05
0.10
0.15
0.20
0.25Sal
Paraquat
*
**
*
*
**
Time Post Injection
Weig
ht
(g)
Lung Weight
1 Hour 1 Month 6 Months0.00
0.05
0.10
0.15
**
**
Time Post Injection
Weig
ht
(g)
Spleen Weight
1 Hour 1 Month 6 Months0.00
0.02
0.04
0.06
0.08
0.10Sal
Paraquat
**
Time Post Injection
Weig
ht
(g)
A B
C D

34
Figure 2.2: Animals were weighed at baseline and again prior to each injection and sacrifice
timepoint and organs were extracted and immediately weighed at sacrifice. Animal weight and
organ weights in all organs except the spleen increased over time. Paraquat treatment reduced
overall body weight in animals 1 hour after the last injection, but this effect was absent by six
months. Paraquat increased heart weight during the entire experiment, whereas lung weight was
increased up to the one-month time. No changes in splenic weight were observed. *p<0.05,
relative to the respective saline treated animals at each time; **p<0.05, relative to all mice at the
one-hour time point.
Neurodegeneration: Paraquat treatment induces permanent TH+ cell loss in the SNc.
Stereological assessment of the SNc revealed that mice displayed a robust loss of TH+
neurons when treated with paraquat (F(1,15)=53.155, p<0.001) (Figure 2.3). This loss persisted
throughout through six months following the last paraquat injection and in fact, did not
significantly differ over time.
Saline Paraquat
One Hour
One Month
Six Months
1 Hour 1 Month 6 Months0
100
200
300
400
500Sal
Paraquat
TH+ SNc Cells
Time Post Injection
# o
f T
H+
cells
***

35
Figure 2.3: Stereological TH+ cell counts were conducted in the SNc revealed that the total
number of TH+ neurons were reduced by paraquat treatment (p<0.001), but no interaction with
time following final injection was evident. ***p<0.001 compared to saline treated mice.
Neuroinflammatory effects: Paraquat treatment results in persistent altered microglial
phenotypes
Paralleling the dopaminergic cell loss, paraquat induced significant (albeit somewhat
modest) changes in ratings of SNc microglial cell morphology which was detected using IBA-1
labelling. Indeed, IBA-1+ cells within the SNc were assessed using our previously validated rating
scale. This revealed a significant increase in paraquat treated animals (F(1,22)=22.288, p<0.001)
(Figure 2.4) and this effect was maintained and did not change over the six month period after
stopping paraquat injections. Importantly, although significant, the current morphological changes
were far less dramatic than what we typically observe with LPS alone or LPS in conjunction with
paraquat [48, 236].

36
Figure 2.4: Microglial reactivity was assessed using a morphological rating scale on IBA-1 stained
tissue. Paraquat treatment increased microglial morphological ratings in the SNc throughout the
six-month time following injection, and age alone appeared to increase ratings at six months post
injection but this was not significant. ***p<0.001 compared to respective saline treated animals.
1 Hour 1 Month 6 Months0.0
0.5
1.0
1.5
2.0
2.5Sal
Paraquat
Microglia Reactivity
***
Time Post Injection
Mean
Mic
rog
lial A
cti
vati
on
(A
U)

37
Further markers of inflammation, phagocytosis and cell death are increased following
paraquat administration.
We assessed WAVE2, a component in the actin-cytoskeleton remodeling complex which
is strongly expressed in microglia and is critical for morphological re-organization of these cells.
Again paralleling the increased rating scale results, paraquat elevated levels of WAVE2 within the
SNc, (F(1,27)=8.626, p=0.006) (Figure 2.6A) and this elevation remained for the entire six-month
period. The ratio of the activated (phosphorylated) form of the pro-inflammatory transcription
factor, NFκB-p65 subunit, and its non-phosphorylated subunit was found to be elevated in the SNc
by paraquat treatment, but only at the one-month time (F(1,27)=4.357, p=0.04) (Figure 2.5B).
Interestingly, caspase- 1 and the MFG-E8 were elevated by paraquat but this time, only at the six-
month time (F(5,29)=2.847, p=0.05) (Figure 2.5C,D).

38
Figure 2.4: WAVE2 levels within the SNc were elevated by paraquat at all timepoints (A),
whereas pNF-κB ratio elevations were confined to the 1 month time following final paraquat
injection (B). Caspase 1 and MFG-E8 elevations in the SNc only reached significance by six
months following paraquat (C and D). *p<0.05 relative to age saline control, **p<0.01 relative to
respective saline treatments.
Indices of stress: circulating corticosterone and striatal BDNF were elevated by paraquat.
Corticosterone, a stress related glucocorticoid was significantly elevated following
paraquat treatment and remained so for at least one month following cessation of treatment
(F(1,30)=5.649, p=0.024) (Figure 2.6A). Most circulating inflammatory cytokines were not
detectable following paraquat treatment, however, consistent with previous results, IL-6
expression was detected using a Luminex multiplex assay, however, while this effect was observed
only one hour following the last injection, it was not statistically significant (F(1,30)=0.905,
ST MFG-E8
1 Hour 1 Month 6 Months0.0
0.5
1.0
1.5
2.0Sal
Paraquat*
Time Post Injection
No
rmalized
Flu
ore
scen
t In
en
sit
y
1 Hour 1 Month 6 Months0
1
2
3
Caspase 1
*
Time Post Injection
No
rmaliz
ed
Flu
ore
scen
t In
en
sit
y
1 Hour 1 Month 6 Months0
1
2
3
pNFkB p65/NFkB p65
*Sal
Paraquat
Time Post Injection
No
rmaliz
ed
Rati
o
A B
C D
1 Hour 1 Month 6 Months0.00
0.02
0.04
0.06
SNc WAVE2
**
Time Post Injection
Mean
Flu
ore
scen
t In
ten
sit
y

39
p>0.05) (Figure 2.5B). Interestingly, paraquat treatment provoked increased striatal levels of
BDNF (F(1,27)=13.707, p<0.001) (Figure 2.6C). This effect peaked after one month but was
still upregulated six months later (p=0.02).
Figure 2.6: Assessment of circulating stress hormone, corticosterone, revealed a significant
increase which persisted at least one month following final paraquat treatment (A, p<0.05).
Circulating IL-6 was found to be unaltered following paraquat treatment (B, p>0.05). Striatal
BDNF levels in paraquat treated animals increased one- and six-months following treatment (C,
p<0.05). **p<0.01 relative to age matched control animals, *p<0.05 relative to 1 hour animal
groups.
Striatal BDNF
1 Hour 1 Month 6 Months0.0
0.5
1.0
1.5
2.0Sal
Paraquat
*
*
*
**
Time Post Injection
Mean
Flu
ore
scen
t In
ten
sit
y
**
1 Hour 1 Month 6 Months0
10000
20000
30000
40000
50000 *
Circulating Corticosterone
Time Post Injection
Co
rtic
oste
ron
e p
g/u
l
A B
C
1 Hour 1 Month 6 Months0
20
40
60
80Sal
Paraquat
Circulating IL-6
Time Post Injection
Mean
Co
ncen
trati
on
(p
g/m
L)
N.S.

40
MRI tracking of pathology: gross volumetric alterations were detected in ventricle but not
hippocampal or SNc volume, no hemispheric alterations found.
Immediately following sacrifice, a subset of animals were imaged using a 7T MRI in order
to assess potential hemispheric or gross regional differences following paraquat administration.
Images were first analyzed by a trained neuroradiologist and assessments thereafter, were
quantified using regional area of interest (ROI) assessments in conjunction with image J software.
The neuroradiologist (Dr. Carlos Torres, University of Ottawa) found no gross alterations
whatsoever, with paraquat treated brains being essentially indistinguishable from saline treated
controls. Further volumetric quantification of ROIs yielded no significant hemispheric differences
in either the SNc, hippocampus or lateral ventricles (F<1; p>0.05 for all groups) (Figure 2.7
A,B,C). When evaluating total size of the same regions, no significant alterations were observed
in the SNc or Hippocampus (Figure 2.7 D,F), however, ventricles were significantly enlarged over
time (F(2,15)=61.253, p<0.001) and following paraquat treatment (F(1,15)=175.037, p<0.001)
(Figure 2.7 E).

41
Figure 2.7: Left/right hemisphere comparisons as well as treatment differences were assessed by
a trained neuroradiologist who found no significant difference. Analyses were confirmed using
imageJ to evaluate 7T MRI images to determine if there were differential hemispheric effects in
ventricle, hippocampus or SNc size following paraquat treatment. No statistically significant
alterations in hemisphere size were observed in any regions (A,B,C, p>0.05 for all groups).
Assessments of total area found no alteration in hippocampal or SNc size (D,F, p>0.05 for all
groups), however, the 3rd ventricle was enlarged following paraquat treatment and with age (E,
p<0.001). G, H and I illustrate show representative images of tracing on MRI images for each
region.
RatioSNc
1 Hour 1 Month 6 Months0.0
0.5
1.0
1.5
2.0
2.5
*
Time Post Injection
L/R
SN
c A
rea R
ati
oMRI Area
SNc
1 Hour 1 Month 6 Months0.0
0.2
0.4
0.6
0.8Sal
Paraquat
*
Time Post Injection
Are
a (
Arb
itra
ry U
nit
s)
Third Ventricle
1 Hour 1 Month 6 Months0.0
0.5
1.0
1.5
2.0
2.5
Time Post Injection
L/R
Ven
tric
al A
rea R
ati
o
3rd Ventricle
1 Hour 1 Month 6 Months0.0
2000000.0
4000000.0
6000000.0
8000000.0Sal
Paraquat
*
******
Time Post Injection
Are
a (
Arb
itra
ry U
nit
s)
Hippocampus
1 Hour 1 Month 6 Months0.0
0.5
1.0
1.5
Time Post Injection
L/R
Hip
po
cam
pu
s R
ati
o
Hippocampus
1 Hour 1 Month 6 Months0.0
5000000.0
1.01007
1.51007
Sal
Paraquat
*
Time Post Injection
Are
a (
Arb
itra
ry U
nit
s)
A
B
C
D
E
F
G
H
I

42
Discussion
Given that PD likely has a protracted prodromal state, tracking of brain pathology and
finding clues for early biomarkers of disease is critical. Similarly, it is important to track the long-
term effects of environmental toxicants that have been implicated in PD and its co-morbid features.
We sought to assess the relatively long-term impact of paraquat (6 months following cessation of
a 3-week injection regimen). The paraquat induced loss of SNc dopamine neurons and associated
microglial inflammatory morphological changes peaked after the 3 weeks of treatment and did not
further progress during the six-month period. This suggests a relatively stable non-progressive
lesion. Importantly, the neurodegenerative impact of paraquat was associated with dramatic
motoric behavioral deficits, indicating potential clinical significance. Unfortunately, however, we
were unable to detect gross volumetric changes in the brain using a rodent MRI, suggesting that
widespread gross tissue loss was not induced by the paraquat regimen. This is likely owing to the
limited size of the lesion and suggests that there was not a frank loss of tissue area and likewise,
was not an obvious accumulation of sizeable inflammatory infiltrates. Despite this, we did observe
significantly enlarged ventricles in paraquat treated animals, previous reports modelling chronic
neuroinflammation, autoimmune encephalitis, and intrauterine inflammation have also reported
this same feature suggesting the recruitment of microglia and peripheral immune cells following
paraquat administration may have induced these alterations [237–239]. We further found marked
time-dependent changes in inflammatory, trophic and soluble stress factors that collectively,
suggest some interesting processes that might reflect protracted or even permanent re-organization
of brain circuits.
Very few studies have assessed long durations following toxicant exposure in models of
PD, nor has there been sufficient assessment of non-motor elements of the disease. These are
important as PD is a heterogenous disease with many changes in peripheral factors and a host of

43
co-morbid features. Similarly, there is some contention regarding the permanence of some of the
neurodegenerative changes following toxicants, such as 6-OHDA and MPTP [240–242]. Our
findings indicate that paraquat does appear to induce a permanent loss of nigral dopamine neurons
and that this is coupled with enduring changes in microglial reactivity (morphology and WAVE2
levels). The fact that these changes were stable over 6 months following paraquat cessation
indicates that although not a progressive lesion, a relatively permanent change in the SNc
microenvironment was induced. Interestingly, these brain changes were paralleled by later
occurring elevations of pNF-kB p65 and then MFG-E8 and caspase-1within the brain.
At least some of the effects of paraquat are likely related to its stimulatory effects on
immune cells, such as macrophages/microglia or alternatively, may have arisen secondarily from
tissue injury. Indeed, patients with lung injury had elevated IL-6 mRNA and a single paraquat
injection in mice caused lung damage that was associated with elevated systemic IL-6 [243, 244].
Importantly, we did find that paraquat induce increases in lung (and heart) weight, which could
reflect pathology owing to cellular derangement or infiltration, as was previously reported with
paraquat poisoning [245, 246]. Further, direct application of paraquat onto cultured RAW264.7
macrophages induced an elevation of IL-6 that accompanied the release of reactive oxidative
species [247]. The NF-kB rise within the striatum after 1 month is interesting in that this is a
primary inflammatory transcription factor that regulates IL-1b and TNF-a signaling. Moreover,
mutant a-synuclein was reported to stimulate microglia, in part, through NF-kB signalling [248].
The delayed rise of caspase-1 and MFG-E8 within the striatum at 6 months indicates that
protracted brain signaling changes occur following paraquat exposure. In particular, caspase-1 is
a critical component of the inflammasome, which promotes IL-1b and IL-18 production and the
induction of pyroptosis, or programmed lytic cell death, raising the possibility that further cell

44
death might have been observed after even further time intervals. Similarly, the MFG-E8 elevation
is suggestive of a delayed immune response within the striatum. MFG-E8 is critical for the
phagocytosis of apoptotic cells [249], wherein it binds to phosphatidylserine (“eat me signal”),
which is exposed on the surface of apoptotic cells and helps with the opsonization and
phagocytosis of these cells. The MFG-E8 elevation could possibly be in response to early stage
cell pathology associated with caspase-1 expression. Indeed, besides peripheral macrophages,
microglia also express MFG-E8 which acts as a tether to attach the apoptotic cell and trigger
engulfment of the cell [250]. In fact, neuronal loss induced by LPS, β-amyloid or by Brucella
abortus infection was mediated by activated microglia and MFG-E8 causing the induction of
phagocytosis [251–253]. At the very least, these data suggest multiple neuroimmune processes are
engaged over time following toxicant exposure.
It was particularly remarkable that while the paraquat induced elevation of corticosterone
was maximal one hour following the last paraquat injection, it still remained significantly and
substantially elevated one month later. This is rare for any stressor and suggests that long term
changes were induced that impacted upon the HPA axis. It could be related to ongoing oxidative
stress cascades and associated damage that would be expected to have been induced by paraquat.
Along these lines, the elevation of striatal BDNF at 1 and 6 months could conceivably be a
compensatory mechanism attempting to counter such pathology. Also, is the possibility that a
continued presence of paraquat in the brain might have chronically stimulated the HPA axis. In
fact, while the half-life for paraquat is reported in both human plasma and mouse liver to be
approximately 84 hours [254, 255], it was reported to be 28 days within the mouse brain following
a single 10mg/kg I.P. injection [255]. Hence, our administration likely resulted in lasting paraquat
accumulation in the brain at least until the one-month timepoint.

45
In addition to the brain, paraquat is toxic to a range of organs, particularly the heart and
lungs. In fact, paraquat is known to cause contractile dysfunction of the heart [256] and
inflammatory congestion of the lungs [257, 258]; both of which can be fatal. Paraquat exposure
enlarged myocardial left ventricular and systolic diameter and interestingly, TLR4 ablation
prevented the cardiac contractile anomalies [259]. Similarly, TLR4 knockout reduced paraquat-
induced cardiac intracellular Ca2+ derangement and changes in autophagy factors [260]. Thus, the
presently observed paraquat induced increase in heart weight might reflect inflammatory cell
infiltration, together with enlargement or thickening of myocardial tissue. It is interesting to note
that the NFkB elevation in the striatum might also suggest TLR4 signalling changes in the brain,
as this is the primary transcription factor affected by the TLR [261]. The increase in lung weight
we observed is likely resulted from similar inflammatory and tissue derangements induced by
paraquat. Indeed, paraquat increased connective tissue growth factor and collagen expression in
lung fibroblasts [262] and lung weight increased over time following paraquat exposure, along
with increased lung levels of TLR9, IL-1b, IL-6 and TNF-a [263]. Correspondingly, paraquat
caused a remodeling of alveolar structure with increasing thickness septal structures resulting in
impaired alveolar functioning [264].
While we obtained exceptional resolution MRI images of the brains of paraquat exposed
mice, we were unable to detect any significant volumetric differences between the groups. This is
perhaps not too surprising given that the dopaminergic neuronal loss induced by paraquat wouldn’t
be expected to result in gross volume changes. Indeed, the neuronal lesion is fairly discrete, but
we have shown wide spread changes in neurotransmission with paraquat but it is unclear if these
would be associated with any tissue loss. Yet, in the case of schizophrenia, there is widening of
the lateral ventricles and enlargement of the global pallidus associated with the dopaminergic

46
alterations in neurotransmitters [265]. PD patients also displayed ventricular enlargement and this
effect was found in early stages of the disease and correlated with later cognitive impairment which
matches our MRI results from the lateral ventricles [266, 267]. Moreover, human MRI studies
reported that PD patients had reduced hippocampal volume and this was asymmetrical (with left
hemisphere most affected) [268]. The dorsal striatum was also diminished in PD patients and this
effect was exacerbated in patients with excessive fatigue [269]. In contrast, while we did find
enlarged ventricular size, we did not find any reduction of volume in the nigrostriatal pathway or
hippocampus.
Conclusions
In brief, we have provided evidence that paraquat promotes long-term and likely permanent
nigrostriatal degeneration and microglial inflammatory changes. This was accompanied by time-
dependent activation of immune, pro-death and stress factors, along with organ abnormalities
However, no structural brain abnormalities were observed using MRI imaging procedures. We
further observed that some of the paraquat induced alterations persisted many months following
cessation of treatment and may indicate a greater vulnerability to further toxicants in aged animals
previously exposed to environmental toxicants. Of note, some alterations appeared to recover,
whereas others became progressively more apparent. Importantly, the paraquat induced loss of
TH+ neurons was relatively stable over time and, unlike PD, not a progressive lesion. However,
given the delayed elevation MFG-E8 and caspase 3 after six months (factors that are linked to
apoptotic processes and cell removal), further aging may eventually lead to further neuronal
degeneration.
47
Chapter 3:
The impact of an inflammatory gut and probiotics in a murine
model of Parkinson’s disease

48
Abstract
Recent work has established that Parkinson’s disease (PD) patients have an altered gut
microbiome, along with signs of intestinal inflammation. This could help explain the high degree
of gastric disturbances in PD patients, as well as potentially be linked to the migration of peripheral
inflammatory factors into the brain. We presently assessed whether the probiotic, VSL #3, or the
inflammatory inducer, dextran sodium sulphate (DSS) would influence the PD-like pathology
provoked by a dual hit toxin model using LPS and paraquat exposure. Indeed, while VSL #3 was
reported to have anti-inflammatory effects, DSS is often used as a model of gastric colitis because
of the gut inflammation and intestinal leakiness that it induces. We found that VSL#3 did not have
any significant effects; however, the DSS treatment caused marked changes in the gut microbiome
and was also associated with augmented behavioral and inflammatory outcomes. In fact, DSS
markedly increased F. bacteroidceae and porphyromonadaceae but reduced F. rikencellaceae and
S24-7 species and also provoked colonic pro-inflammatory cytokine expression, consistent with
an inflamed gut. The DSS particularly increased the impact of LPS and paraquat upon microglial
morphology, along with circulating lipocalin-2 (neutrophil marker) and IL-6. Yet, neither DSS nor
VSL#3 influenced the loss of substantia nigra dopamine neurons that was provoked by the LPS
followed by paraquat treatments. These data suggest that disruption of the intestinal integrity and
the associated microbiome can interact with systemic inflammatory events to promote widespread
brain-gut changes that could be relevant for PD and at the very least, suggest novel neuro-immune
communication.

49
Introduction
Parkinson’s disease (PD) is characterized by a loss of substantia nigra pars compacta (SNc)
dopaminergic neurons which project the basal ganglia, resulting in motor disturbances [35, 270].
It has become clear that both genetic and environmental factors interact to provoke the disease and
furthermore, that neuroinflammatory factors have been implicated in such interactions [271, 272].
It could be that environmental stressors can act as triggers that induce a pro-inflammatory state
and these include pesticide exposure [273], heavy metal exposure [274], viral and bacterial
infections [275], and even chronic psychological stress [276]. Indeed, combinations of various
genetic factors, including LRRK2 or the alpha synuclein A53T mutation, together with
environmental factors such as immunogens, pesticides and other toxins are common models of PD
[230, 277, 278]. Regardless of the model utilized, microglial cells, the resident immune cells of
the central nervous system (CNS), have been repeatedly implicated in PD pathology [97, 128,
279]. Likewise, accumulating evidence indicates that peripheral cells of the innate and adaptive
immune system are critically involved in the spread of PD pathology. In fact, some suggest that
initial PD pathology might actually originate outside the brain, possibly in the gut and associated
cells [206, 207, 210]. Recent studies do report that PD patients have altered gut microbiota [205,
280, 281] and the composition of the gut microbiota may be of special significance given its role
in modulating peripheral immune cells.
While gastrointestinal difficulties have long been known to be common in PD, recent
evidence suggests that an irritable bowel and constipation in middle age actually increases the risk
of developing PD [23, 282]. Links between Crohn’s disease, irritable bowel syndrome and PD
have also been recently uncovered with the gene, LRRK2, being suggested to be a common
mechanistic inflammatory factor shared by these three seemingly disparate diseases [63, 283].

50
Other studies have found increased alpha-synuclein load in the gut of PD patients [284, 285] and
one clinical study found that truncal vagotomy reduced PD risk later in life [207]. Despite this
growing pool of patient data, there has been relatively little work done in animal models. In 2016
Sampson et al published a study demonstrating that germ free A53T showed reduced pathology at
14 months, whereas A53T mice infected with bacteria isolated from PD patients showed earlier
symptom onset and enhanced pathology [20]. One further study found that orally administered
rotenone, a pesticide implicated in PD, altered the gut microbiota and led to early accumulation of
alpha synuclein in the gut tissues [286].
While many studies have examined the use of probiotics both as a prophylactic and as a
potential therapy in several disease states, little widespread success has been found and indeed,
striking differences are evident even with probiotics with the same formulation [287, 288]. VSL#3
is a probiotic which is currently prescribed for irritable bowel syndrome and has been shown to
reduce stressor-linked effects in animal models and can modulate intestinal permeability [222,
225]. Two recent papers have also found that VSL#3 may play a protective role in visceral
hypersensitivity [289] and renal ischemia injuries [290] by modulating immune cell phenotypes.
In contrast to probiotics, agents that irritate the gut and cause inflammation are thought to
negatively affect the microbiome and could possibly contribute to PD. Dextran sodium sulphate
(DSS) which is used as a common model of colitis and irritable bowel has marked effects upon
intestinal integrity and microbial constituents. DSS is known to particularly damage epithelial cells
of the intestine and promote a leaky mucosal barrier [291]. The DSS treated mice lose weight and
display marked infiltration and activation of inflammatory neutrophils, macrophages, T
lymphocytes and other immune cells, together with elevations in circulating inflammatory

51
cytokines, including IL-6 [291, 292]. There is also an overall shift in the quantity and diversity of
the microbiota species, with DSS destabilizing the microbiota [293].
To our knowledge, thus far no studies have attempted to alter the existing microbiome prior
to the introduction of a toxin-based model of PD. Hence, we assessed the impact of pre-exposure
to either a probiotic (VSL#3) or a known dysbiotic agent (DSS) upon outcomes induced by a multi-
hit LPS plus paraquat model of PD. We found that DSS, but not VSL#3, caused a marked shift in
the microbiota and this was associated with an augmentation of the impact of LPS and paraquat
upon behavioral disturbances and inflammatory outcomes (microglial morphology, IL-6, and
lipocalin-2). However, the neurodegenerative effects LPS and paraquat were not influenced by
either DSS or VSL#3. It appears that an inflamed intestine and accompanying changes in
microbiota can have widespread effects upon inflammatory factors within the brain and blood, and
behavioral symptoms, which could be relevant for a wide range of neurological and possibly even
psychiatric disorders.

52
Methods
General Study Design
Animals
86 C57Bl6/J male mice were purchased from Charles River laboratory at 8-10 weeks of
age and single housed in standard cages upon arrival at Carleton University. All animals were fed
Harlan Labs 2014 rodent chow ad libitum for the duration of the experiment and housed under a
normal 12H light cycle. Upon arrival animals were randomly assigned into one of three groups
based on drinking water composition (n=28): VSL #3, DSS, or tap water. Animals in the VSL #3
group were given 3x10⁸ CFU/mL of VSL #3 dissolved in tap water from day of arrival until
sacrifice. Animals in the DSS group were given water for the first seven days followed by
250mg/mL DSS for five days and then tap water for the remainder of the experiment. Animals in
the tap water control group were given tap water freely throughout the experiment.
Figure 3.1: Timeline of experimental treatments, behaviours, and sample collections.
Surgeries
Baseline, VSL#3
Administration Begins
DSS Administration Begins
DSS Administration Ends
Surgery
Injection 1
Injection 2
Injection 3
Injection 4
Injection 5
Injection 6
Sacrifice
Fecal Sample 3Fecal Sample 1
Fecal Sample 2
0 1 2 3 4 5 6 7 8 9 10 11 12 13 14 15 16 17 18 19 20 21 22 23 24 25 26 27 28
Microbiome and Parkinson's Disease Timeline

53
Two weeks after arrival, at three months of age, all animals underwent stereotaxic surgery.
Animals were anesthetized with 5% isoflourane then subcutaneously administered 0.3mL of saline
and 20mg/kg of the analgesic Tramadol. Animals were secured in the Kopf Instruments Model
940 stereotax frame using xylocaine (2% lidocaine hydrochloride topical anaesthetic,
AstraZeneca) coated earbars. A small, 1 cm incision was made in the centre of the skull and a
1.5mm diameter hole was drilled in the skull at x=1.2mm and y=3.14mm relative to bregma over
the left hemisphere. A 22-gauge injector was used to infuse half of each group with 2μL of either
saline or 1μg/μL LPS directly above the SNc and 4mm below the surface of the skull. A Harvard
Apparatus picopump 11 double syringe pump was used to ensure a constant infusion over 4
minutes. The injector was left in place for 5 minutes after the infusion to allow the LPS/saline to
absorb into the tissue before slowly being removed. The hole in the skull was filled with Bone
Wax® before suturing. The animals received 100% oxygen for 15 seconds once the surgery was
complete before being removed from the stereotaxic instrument in order to speed recovery, then
were placed into recovery cages situated half-on half-off a 37°C circulating water heating pad.
Animals were under anesthesia at 1.5% isoflourane for approximately 25 minutes each and
monitored for signs of distress for one hour after surgery. Animals were given hydrogel for 4 days
after surgery and 20mg/Kg Tramadol sub-cutaneously twice a day for 3 days following surgery.
Injections
Beginning 48 hours after surgery, each animal received either 10mg/kg of paraquat or an
equivalent volume of saline through an intraperitoneal. injection. Animals who received LPS
during surgery received paraquat, while saline animals again received saline. Paraquat was freshly

54
made each morning and these injections were given in the morning every 48 hours for 11 days
totaling six injections.
Sacrifice
Animals were intraperitoneally administered 0.15mL of sodium pentobarbital and level of
anesthesia determined by toe pinch. Blood was flushed using 5mL of saline through the left
ventricle to the right atrium followed by 40mL of 4% paraformaldehyde to fix the tissue. 24 hours
later the brains were transferred to 10% sucrose and then transferred to 30% sucrose 48 hours after
sacrifice.
In the rapid decapitation group, the animal’s trunk blood was collected into tubes
containing 10ul of 10% EDTA, to prevent clotting immediately following decapitation. The blood
was then spun in a pre-chilled centrifuge at 2,000g for 20 minutes and the resulting plasma
collected and flash frozen to -80℃. The brains of these mice were extracted, sectioned and the
hippocampus, anterior striatum and SNc were punched for western blotting within 3 minutes of
decapitation. Concurrently the abdominal cavities were opened and the large intestine was
removed and formed into a Swiss roll. This was cut in half, one side was paraffin embedded and
one side was flash frozen for qPCR.
Behavioral analyses
Sickness scoring

55
Animals were weighed the morning of each injection as well as one month and six months
after receiving the last injection. Sickness scores were taken according to Table 3.1 daily during
the injection regime as well as one month, four months and six months after the final injection.
Table 3.1: Criteria describing sickness scores assigned after analysis of each animal for 2 minutes.
Score Symptoms
1 Normal looking
2 Slight lethargy, ptosis (droopy eyes) or piloerection (puffy fur)
3 Very lethargic, ptosis and piloerection, curled body posture
4 Very sick appearance, ptosis, piloerection, curled body posture,
difficulty breathing, and general nonresponsiveness
Home-cage locomotor activity
Spontaneous home cage locomotor activity was measured over a complete 12 hour
light/dark cycle using our Micromax (MMx) infrared beam-break apparatus (Accuscan
Instruments, Columbus, OH, USA), as previously described [294]. Spontaneous home cage
locomotor activity assessment was completed following a 30 minute acclimation period in our
behavioural testing room post nestlet removal, measurements of home-cage locomotor activity
occurred once at baseline (Day 0), then again the evening of the 2nd and 5th injection.
Rotarod
On day 27 animals began training on the rotarod (EzRod, Accuscan Instruments,
Columbus, OH), which consists of a rubber beam 30cm above the ground. The rotarod spins at

56
either a fixed or variable speed, underneath which infrared beams which detect when an animal
falls, are located. Animals received two days of training, on the first they were placed onto the
beam for 5 minutes at 12 rpm and replaced every time they fell within the 5 minutes. This was
repeated one hour later and an hour after that for a total of three training sessions on day one. On
day 28 animals received their second rotarod training. The speed was increased to 22rpm and all
other aspects were repeated. Test day occurred on day 29 when the animals were placed on the rod
for 3 sessions an hour apart in which the speed of the rod increased from 2rpm to 44rpm of the
course of five minutes. The speed and time at which each animal fell was recorded. During analysis
the lowest score for each animal was excluded.
Microbiome Sequencing
A subset of fecal samples were extracted using a Fecal DNA Extraction Kit (Norgen
Biotek). These samples were quantified using a nanodrop to assess DNA yield and quality and
sent to Dalhousie’s Integrated Microbiome Resource (Dalhousie University, Halifax, NS) for 16S
V4-V5 ribosomal sequencing.
Plasma corticosterone assay
At the time of decapitation, trunk blood from all of the animals, was collected in tubes
containing 10 μg EDTA. Samples were centrifuged (3000g for 8 min) and the plasma removed
and stored in aliquots at −80 °C for later corticosterone determination with commercially available
radioimmunoassay kits (ICN Biomedicals, CA, USA). Samples were assayed in duplicate within
a single run to control for inter-assay variability; the intra-assay variability was less than 10%.

57
Plasma lipocalin assay
Trunk blood was collected at time of decapitation and prepared as for the corticosterone
assay in a separate aliquot at -80 ℃. Lipocalin-2 (LCN2) levels were determined by commercially
available ELISA kit (R&D Systems, NE, USA, Cat #DY1857) following manufacturer’s
instructions. Plasma samples were diluted 1:10,000 in assay buffer and assayed in duplicate within
a single run. The intra-assay variability was less than 10%.
Plasma determination of cytokines
Trunk blood was collected at time of decapitation and prepared as for the corticosterone
assay in a separate aliquot at -80 ℃. IL-6, TNF-α, IL-1B and IL-10 levels were determined using
a Luminex Immunoassay (R&D Systems, NE, USA) ran following kit instructions on a Luminex
Magpix (Luminex Corporation, TX, USA). Samples were assayed in duplicate within a single run
to control for inter-assay variability; the intra-assay variability was less than 10%.
Assessment of intestinal cytokine mRNA
RNA Isolation
Approximately 50 mg of gut tissue was briefly homogenized using a Polytron PT1200
homogenizer in 0.5mL of Trizol (Invitrogen, Carlsbad, CA, USA). Samples were sonicated for 30
seconds before 200ul of chloroform were added and samples were centrifuged for 15min at 1200
rpm at 4 ℃. The supernatant was transferred to microcentrifuge tubes and samples were mixed

58
with 500ul of isopropanol and left on ice for 10min to allow RNA precipitation. Samples were
centrifuged for 15min at 1200 rpm at 4 ℃. The supernatant was discarded, and the pellets were
washed with 1ml of 70% ethanol, after which the samples were centrifuged for 5 min at 7500 rpm
at 4℃. The supernatant was aspirated. Pellets were air dried for about 15min and then resuspended
in 25ul of RNase-free water. RNA concentration and quality were assessed by measuring the
260/280nm ratio (>1.8) using a Take3 micro-volume quantification plate (BioTek) and a
powerwave HT spectrophotometer (BioTek). Total RNA integrity was determined by running
RNA isolates on a 1% agarose gel stained with SYBR Green and verifying the presence of sharp
bands for 28S and 18S ribosomal RNA.
cDNA Synthesis
Oligo-dT primer ligation and reverse transcription was performed as described by [295].
In brief, first strand synthesis was performed using 1ug of total RNA diluted in autoclaved RNase-
free water to obtain a final volume of 10uL. 1 ul of 200ng/ul oligo(dT) (5′-
TTTTTTTTTTTTTTTTTTTTTV-3′; V = A or G or C; Sigma Genosys) was added to the samples,
and samples were incubated in a thermocycler (Mastercycler Eppendorf) at 65 °C for 5 min, after
which they were chilled on ice for 1 min. Samples were then incubated at 42 °C for 45-60 min in
an Eppendorf thermocycler (Mississauga, ON, Canada) with 4 µL of 5× first strand buffer
(Invitrogen, Carlsbad, CA, USA), 2 µL of 0.1 M DTT (Invitrogen, Carlsbad, CA, USA), 1 µL of
10 mM dNTPs (BioShop, Burlington, ON, Canada), and 1 µL MMLV Reverse Transcriptase
(Invitrogen, Carlsbad, CA, USA). Serial dilutions of the cDNA were prepared and stored at 4 °C
until use.

59
qRT-PCR Amplification
qRT-PCR assays were performed using a Bio-RAD MyiQ2 Detection System (BioRad,
Hercules, CA, USA) following MIQE guidelines [296]. 20 µL reactions were used, each consisting
of: 2 µL cDNA, 2 µL qRT-PCR buffer (100 mM Tris–HCl [pH 8.5], 500 mM KCl, 1.5% Triton
X-100, 20 mM MgCl2, 2 mM dNTPs, and 100 nM fluorescein), 0.16 µL of 25 mM dNTPs, 4 µL
of 1 M trehalose, 0.5 µL of 100% formamide, 0.1 µL of 100× SYBR Green diluted in DMSO, 0.5
µL of 0.3 nmol/µL forward primer, 0.5 µL of 0.3 nmol/µL reverse primer, 0.125 µL of 5U/µL Taq
Polymerase (BioShop, Burlington, ON, Canada), and 10.115 µL DEPC-treated water. The
optimized PCR protocol consisted of an initial denaturing step at 95 °C for 2 min, followed by 60
cycles of: 95 °C for 45 sec, 57 °C annealing temperature for 45 sec, and 72 °C for 45 sec; and a
final step of 72 °C for 4 min. All PCR runs underwent melt-curve analysis and dilution curve
testing to identify which amplified more than one PCR product or amplified non-mRNA products,
as indicated by more than one melt curve or by no change in C t values between serial dilutions,
respectively.
Data Analysis
Raw cycle threshold (Ct) values obtained from each PCR run were converted to a linear
form using 2-C t calculations and were normalized against the reference gene, GAPDH. GAPDH
was used as a reference gene as it exhibited stable expression levels in all conditions. The Ct of
each mRNA was therefore normalized to the Ct of GAPDH from the same sample. The
comparative ΔΔCt method was used to quantitate relative expression of mRNA expression [297].

60
Western blot
Brain tissue punches and organs were collected to detect levels of GFAP, WAVE2, NFkB
p65, pNFkB p65, and SiRT6, as previously described previously [298]. Briefly, whole cell lysates
were homogenized in Radio Immuno Precipitation Assay (RIPA) buffer [50 mM Tris (pH 8.0),
150 mM sodium chloride, 0.1% sodium dodecyl sulphate (SDS), 0.5% sodium deoxycholate and
1% Triton X-100] mixed with 1 tablet of Complete Mini ethylenediaminetetraacetic acid (EDTA)-
free protease inhibitor (Roche Diagnostics, Laval, QC, Cat #11 836 170 001) per 10 mL of buffer.
On day one of analysis, proteins were separated using sodium dodecyl sulphate-polyacrylamide
gel electrophoresis (SDS-PAGE). In order to determine total protein, membranes were incubated
in REVERT total protein solution for a period of 5 minutes followed by placement into a REVERT
wash solution (6.7% Glacial Acetic Acid, 30% Methanol, in water) two times 2 minutes each.
Membranes were then quickly rinsed with distilled water and imaged on our LI-COR Odyssey
imaging system on the 700 channel for an exposure period of 2 minutes. Membrane incubation
with mouse anti-GFAP (1:2,000), NFkB p65 (1:500), pNFkB p65 (1:500), and WAVE2 (1:4,000)
for a period of 60 minutes in 0.05% fish gelatin in TBS with 0.1% tween followed by one hour in
infrared anti-mouse conjugate at a concentration of 1:20,000 in 0.5% fish gelatin solution
containing 0.2% tween and 0.01% SDS. Any unbound antibody was removed using 15 mL of
TBS-T/membrane and membranes washed and read on our Licor Odyssy system at the appropriate
wavelength for 8 minutes.
Immunohistochemistry

61
In order to examine microglial reactivity sections were stained with ionized calcium-
binding adapter molecule 1 (IBA1), a microglial marker found across the membrane. To assess
dopamine cells we used tyrosine hydroxylase (TH). Brains were sliced into 40um thick sections
on our Shandon AS620 cryostat (Fisher Scientific) and sections were immediately placed in a
0.1M PB solution containing 0.1% sodium azide (pH 7.4). Every third section was selected for
each stain (i.e. ST TH; SNc TH; SNc IBA1). For SNc TH staining, slices were washed in phosphate
buffered saline (PBS) (pH 7.4) three times for 5 minutes each, followed by a 30 minute incubation
in 0.3% hydrogen peroxide in PBS. Slices were then washed in PBS three times five minutes each
and a 1 hour incubation in blocking solution containing 5% normal goat serum (NGS), 0.3% triton-
X, with 0.1 M PBS (pH 7.2). Blocker was removed and the slices were then incubated overnight
in primary antibody solution (5% NGS, 0.3% triton-X, 0.3% bovine serum albumin (BSA) in 0.1
M PBS) with 1:2000 anti-mouse TH (Immunostar, Hudson, WI). The following day the primary
antibody solution was removed and sections were washed in PBS three times for a period of 5
minutes each. Following the washes, antibodies in secondary solution (1.6% NGS, 0.16% Triton
X, 0.3% BSA, in 0.1M PBS) were applied to striatum (anti-mouse IgG; 1:500) for a period of 2
hours, and to SNc (anti-mouse HRP; 1:200) sections for 4 hours. Following this, three times five
minute washes were applied to the striatum which was then incubated again in secondary solution
with HRP (1:1000) for an additional 2 hours. All sections were given three times five minutes PBS
washes and sequentially exposed to a DAB reaction containing Tris-HCl, DAB and 0.6% hydrogen
peroxide in dH20 for visualization. Sections were washed in PBS three times five minutes each
following DAB exposure and all sections were then slide mounted and set to dry overnight.
Sections were dehydrated using a series of alcohol and clearene washes and subsequently cover-
slipped using DPX. All incubations occurred at room temperature.

62
To label IBA1 processed ST and SNc slices were washed in PBS (pH 7.2) three times for
5 minutes each, followed by a 1 hour incubation in blocking solution (5% NGS, 0.3% triton-X, in
0.1M PBS). Following removal of the blocker, slices were then placed in anti-rabbit IBA1 (Abcam,
Cambridge, MA) at a dilution of 1:1000 in primary solution (5% NGS, 0.3% triton-X, 0.3% BSA
in 0.1 M PBS for a period of 2 hours. Sections were then washed in 0.1M PBS three times for a
period of 5 minutes each and reacted with either 1:1000 of anti-goat Alexafluor 594 or 647
antibody in primary solution (5% NGS, 0.3% triton-X, 0.3% BSA in 0.1 M PBS). The signal was
visualized with immunofluorescence microscopy using Microbrightfield image acquisition
software on a Zeiss axioimager2 microscope. All slices were selected and compared between
animals at the same distance from bregma.
DAB stained TH+ cells were analyzed using the optical fractionator workflow in Stereoinvestigator
(MBF, Williston, VT, USA) as previously described [139]. A total of six slices between bregma levels -
3.08 and -3.52 were counted by a blind observer under a 63X oil immersion lens.
Statistical analysis
All data was analyzed by 3 (Water; Water vs. DSS vs. VSL#3) X 2 (Injection; saline vs.
LPS and paraquat) two-way ANOVA with significant interactions further analyzed by means
Bonferroni follow up comparisons (p < 0.05) where appropriate. Additionally, analysis of total
home cage locomotor activity, sickness scores, and nestlet building behavior was completed using
appropriate repeated measures ANOVA’s followed by post-hoc analysis. Data is presented in the
form of mean ± standard error mean (mean ± SEM). All data was analyzed using the statistical

63
software StatView (version 6.0) and differences were considered statistically significant when p <
0.05.

64
Results
DSS significantly altered gut microbiota composition but LPS and paraquat combination
treatment did not.
V4-V5 sequencing was carried out on fresh fecal samples collected at animal arrival to
facility and immediately prior to sacrifice. DSS treatment significantly altered microbial
composition of the gut (Figure 3.2), notably significantly decreasing the following families:
Rikkencellaceae (p<0.01) and S24-7 (p<0.001), as well as increasing the proportion of the
following families: Bacteroidceae (p<0.001), Porphyromanadaceae (p<0.001),
Verrucomicrobiaceae (p<0.001) and unclassified Clostridaceae (p=0.036). VSL #3 administration
also did promote a significant increase in Streptococceae family bacteria (p<0.001); however, no
statistically significant increases in Lactobacillaceae or Bifidobacteriaceae, the two constituent
families of VSL #3 was observed (p>0.05). No statistical differences were observed at the class,
order or family level following LPS and paraquat treatment (p>0.05).

65
Figure 3.2: Microbiota Sequencing revealed that LPS and paraquat treatment did not alter the
composition of the gut microbiome. However, VSL#3 administration increased levels of
Streptococcaceae family bacteria but had no other impact, whereas DSS treatment had the biggest
effects. Specifically, DSS significantly increased levels of the verrucomicrobaceae,
bacteriodaceae, clostirdiaceae and porphyromonadaceae families and decreased levels of the S24-
7 and rikencellaceae families, relative to cornstrach treated controls.
DSS led to transient weight loss and decreased survival, whereas VSL #3 prevented the LPS
and paraquat induced reduced weight gain.
Over the duration of the experiment, DSS treated mice displayed considerable signs of
illness and reached endpoint significantly more often than the control or VSL #3 treated animals
(Figure 3.3A). Following the five days of DSS treatment and 2 days of washout, the DSS treated
animals also demonstrated significant weight loss compared to baseline (F(2,77)=23.012,
p<0.001) (Figure 3.3B). By the end of the experiment, there were significant differences in weight
that varied as a function of the LPS-paraquat/saline x water/VSL/DSS treatments (F(2,70)=3.203,

66
p=0.04). Specifically, the LPS and paraquat treated mice lost considerably more weight than
controls (p<0.05), but this effect was prevented by the VSL #3 (Figure 3.3C).
Figure 3.3: Weight changes and survival through the experiment, A demonstrates that DSS
treatment led to reaching endpoint in the seven days following cessation of DSS treatment. B
shows that DSS treated animals lost weight 48 hours after cessation of DSS treatment (pre-surgery
weight) (p<0.001) and C shows that by the end of the experiment, the VSL#3 treated animals
recovered, while LPS and paraquat treatment reduced weight gain in control and DSS administered
mice (p<0.01). **p<0.01 compared to controls. ***p<0.001 compared to other water treatment
groups.
Pre-Surgery Weight
Control VSL#3 DSS
-1
0
1
2
3
***
Drinking Water
Avera
ge W
eig
ht
Gain
(g
)
Weight at Sacrifice
Control VSL#3 DSS0
1
2
3Control
LPS+PQ
****
Drinking Water
Avera
ge W
eig
ht
Gain
(g
)
Survival
Day 16 Day 17 Day 18 Day 24 Day 288
10
12
14Con-Con
Con-LPS+PQ
VSL-Con
VSL-LPS+PQ
DSS-Con
DSS-LPS+PQ
Experimental Day
# S
urv
ivin
g
A
B C

67
DSS affected motor coordination and home-cage activity.
The average time spent on the rotarod apparatus following three discrete trials was
significantly affected by the treatment mice had in their water (F(2,77)=4.997, p<0.01) (Figure
3.4A). Specifically, DSS reduced the time that mice were able to stay on the rotating drum
(p<0.05). The DSS treatment was also found to reduce overnight home cage locomotor activity as
measured by a micromax beam break apparatus (F(2,80)=23.06, p<0.001) (Figure 3.4B). By the
final paraquat injection; however no DSS effect was observed. But the LPS and paraquat
combination treatment did reduce home-cage locomotor activity at this final test point
(F(2,67)=4.413, p<0.05) (Figure 3.4C).
Figure 3.4: Behavioral motor disturbances were observed in the DSS and LPS + paraquat treated
animals. As shown in panel A all DSS treated exhibited reduced time spent on rotarod on the final
day of the experiment while, panel B illustrates reduced home-cage locomotor activity following
Pre-Surgery Micromax
Control VSL#3 DSS0
5000
10000
15000
***
Drinking Water
Mean
Lo
co
mo
tor
Acti
vit
y
Sacrifice Micromax
Control VSL#3 DSS0
2000
4000
6000
8000
*Control
LPS+PQ
Drinking Water
Mean
Lo
co
mo
tor
Acti
vit
y
Rotarod
Control VSL#3 DSS0
100
200
300
400Control
LPS+PQ
*
Drinking Water
Tim
e o
n R
ota
rod
A
B C

68
DSS treatment prior to LPS and paraquat administration and panel C illustrates that by the end of
the experiment home-cage locomotor activity was significantly diminished by the LPS-paraquat
treatment. *p<0.05 compared to pure control. ***p<0.001 compared to other water treatment
groups.
LPS and paraquat combination treatment reduces TH+ cell count in the SNc.
Stereological assessment conducted using DAB stained sections, revealed that the LPS and
paraquat treatment significantly decreased neuronal TH+ counts in SNc (F(1,18)=50.539,
p<0.001) (Figure 3.5). This effect however, was not at all influenced by the DSS and VSL #3
treatments.

69
Figure 3.5: Stereological counts of TH+ cells in the ipsilateral SNc revealed significantly fewer
TH+ neurons in LPS and paraquat combination treatment animals, but no difference was observed
between the VSL#3 and DSS treated animals. ***p<0.001 compared to saline treated animals.
DSS treatment further augmented LPS-paraquat induced microglial activation in the SNc
Microglia morphological ratings that were scored by an experimentally blinded researcher
revealed that both the LPS plus paraquat and DSS treatments significantly increased microglial
TH+ Cell Count
Control VSL#3 DSS0
100
200
300
400
500Control
LPS+PQ
***
Drinking Water
Avera
ge S
Nc C
ell C
ou
nt

70
morphological ratings (F(1,27), (2,27)=7.052 and 10.07, p<0.05) (Figure 3.6). However, the
largest effect was apparent in mice that received both the DSS pre-treatment followed by LPS and
paraquat, relative to those that only received one of these treatment (p<0.05). The VSL3# treatment
however, had no significant effect.

71
Figure 3.6: Microglial activation was quantified using a validated rating scale for morphology on
20x images of IBA-1 (Red) and TH (Green) stained SNc sections. The DSS treatment alone
significantly increased activation scoring (p<0.001) as did LPS and paraquat combination
treatment (p=0.013). *p<0.05 compared to saline treated animals ***p<0.001 compared to control
water intake groups.
Microglia Score
Control VSL#3 DSS0
1
2
3
4Control
LPS+PQ
****
Drinking Water
Avera
ge S
co
re

72
DSS treatment increased intestinal TNF-α and IL-1β mRNA expression
Oral administration of DSS resulted in lasting mRNA alterations in the colon. Notably,
DSS treatment increased both TNF-α mRNA (F(2,27)=6.297, p<0.01) (Figure 3.7A) and IL-1β
mRNA (F(2,27)=4.060, p=0.02) (Figure 3.7B). There was no effect of VSL#3 and the only effect
of LPS plus paraquat was a paradoxical reduction in DSS treated mice, but this did not reach
significance.
Figure 3.7: mRNA expression in the colon was quantified by QT-RT PCR and normalized against
GAD-DH expression. Both TNF-α (p=0.005) and IL-1β (p=0.028) levels were found to be elevated
in DSS treated mice following sacrifice. *p<0.05 compared to control water intake animals.
Circulating immune factors were increased by LPS and paraquat combination treatment, as
well as by DSS administration.
The plasma level of lipocalin-2 (LCN2), a neutrophil activation marker, were found to be
increased by DSS administration (F(2,22)=13.881, p<0.001) (Figure 3.8A). In the case of
circulating IL-6, the LPS and paraquat treatment increased circulating IL-6 (F(2,24)=4.791,
p=0.03) (Figure 3.8B), but this effect was particularly evident in the LPS-paraquat mice that were
previously treated with DSS, such that levels in this group exceeded all other groups (p<0.05).
Colon TNF-A
Control VSL#3 DSS0.00
0.05
0.10
0.15
0.20
*
Drinking Water
Rela
tive m
RN
A
Colon IL-1B
Control VSL#3 DSS0.00
0.02
0.04
0.06
0.08Control
LPS+PQ*
Drinking Water
Rela
tive m
RN
A

73
However, levels of IL-1β and IL-10 showed no significant alterations with any treatment, albeit
there was a variable increase again in the DSS and LPS plus paraquat treated mice (Figure
3.8C,D).
Figure 3.8: As shown in panel A, plasma LCN-2 levels were significantly elevated by DSS
treatment, whereas panel B shows that circulating IL-6 levels significantly increased in LPS and
paraquat treated mice. Both IL-1β (p=0.30) and IL-10 (p=0.26) levels were modestly but not
significantly elevated in DSS treated mice that also received LPS + paraquat. *p<0.05 compared
to control animals, ***p<0.001 compared to other water treatment groups.
LPS and paraquat administration altered proteins involved in inflammation, astrogliosis and
cell motility.
Irrespective of VSL#3 and DSS treatment, GFAP, an astrocyte marker, was found to be
significantly upregulated by LPS and paraquat treatment (F(1,16)=11.134, p<0.01) (Figure 3.9A)
IL-6
Control VSL#3 DSS0
5
10
15Control
LPS+PQ
*
Drinking Water
Mean
Co
ncen
trati
on
(p
g/m
L)
IL-1B
Control VSL#3 DSS0.0
0.2
0.4
0.6
0.8N.S.
Drinking Water
Mean
Co
ncen
trati
on
(p
g/m
L)
IL-10
Control VSL#3 DSS0
2
4
6
8Control
LPS+PQN.S.
Drinking Water
Mean
Co
ncen
trati
on
(p
g/m
L)
Lipocalin-2
Control VSL#3 DSS0
20000
40000
60000
80000
100000
***
Drinking Water
Mean
Co
ncen
trati
on
(p
g/m
L)
A B
C D

74
and similarly, WAVE2, a marker of actin cytoskeleton remodeling, was also upregulated by the
same treatment (F(1,16)=5.661, p<0.03) (Figure 3.9B). The ratio of phosphorylated NF-kB p65
to total NF-kB p65 was significantly decreased by the LPS and paraquat treatment (F(1,16)=6.117,
p<0.05) (Figure 3.9C), while total levels of SiRT 6, an immune and mitochondrial protein, were
not altered (F(1,16)=1.625, p=0.07) (Figure 3.9D).
Figure 3.9: Western blot assessment of SNc tissue revealed increased levels of GFAP (A) and
WAVE2 (B) in LPS and paraquat treated mice. Conversely, the pNF-kB ratios were significantly
reduced in LPS and paraquat treated animals (C), while levels of SiRT6 were not affected by any
of the treatments (D). *p<0.05 compared to saline treated animals, **p<0.01 compared to control
animals.
GFAP SNc
Control VSL#3 DSS0
10
20
30
40
50 **
Drinking Water
Mean
F
luo
rescen
t In
tesn
sit
y
WAVE2 SNc
Control VSL#3 DSS0.00
0.02
0.04
0.06
0.08Control
LPS+PQ
*
Drinking Water
Mean
F
luo
rescen
t In
tesn
sit
y
pNFkB Ratio
Control VSL#3 DSS0
10
20
30
40
50*
Drinking Water
Mean
F
luo
rescen
t In
tesn
sit
y
SiRT6 SNc
Control VSL#3 DSS0.00
0.01
0.02
0.03Control
LPS+PQN.S
Drinking Water
Mean
F
luo
rescen
t In
tesn
sit
y
A B
C D

75
Discussion
Microglia, the innate immune cell of CNS, are thought to be highly important in a broad
range of neurological diseases. Importantly, microglia can have both neuroprotective and
neurodegenerative processes, depending upon their activation state and secreted factors. In PD,
microglia are thought to generally adopt a broadly pro-inflammatory state, with a larger cell body
and short, thick processes and these cells secrete a variety of proinflammatory and oxidative stress
factors [79, 299]. Post-mortem studies have found that these activated microglia are preferentially
located around the SNc [300], indeed, to examine the activity of microglia Kim et al. administered
LPS to a variety of brain regions and found that neuronal degeneration was most apparent when
the LPS was injected into the SNc and that this degeneration appeared to be mediated by the
number and reactivity of microglia [301]. Recent in vitro evidence suggests that the dopaminergic
cells of the SNc may be particularly vulnerable to oxidative stress even compared to the relatively
similar dopamine producing neurons of the ventral tegmental area, due to a variety of factors
including activity, axonal length and mitochondrial density [35].
While the concept that microglial activation and inflammation play an important role in the
genesis and progression of PD has been accepted, little is currently known about how these cells
are actually activated in PD. In vivo evidence suggests that both single and multiple exposures to
immunogens and toxins can promote activation states or alterations that persist for months to years
[232, 302], however, how these factors influence patient populations is difficult to confirm as in
most cases these exposures likely occur decades before symptoms. Additionally, relatively little
work has explored the role of age and the microglia following toxicant administration. Post-
mortem tissue analyses of pre-symptomatic patients and the onset of non-motor symptoms appear
to support the idea that a prodromal form of PD may exist at least 10-20 years prior to motor

76
symptoms [303, 304]. Relatively recently following the implication of gut microbiome alterations
in several disease states, Scheperjans et al. became the first to publish human PD data supporting
an alteration of gut bacterial species in PD patients compared to age-matched controls [280].
Several studies have followed this in different populations confirming that these alterations are
fairly consistent across cultural and ethnic borders [204, 205, 286, 305]. Despite these findings, it
is still unknown whether gut microbiome precede or contribute to the disease or if the
gastrointestinal symptoms which typically are displayed prior to motor symptoms in PD patients
may drive these bacterial alterations. To assess if prior alterations in the gut microbiome could
either protect, or predispose individuals to develop PD using a murine model of intra-SNc LPS
and i.p. paraquat injections we administered DSS, a toxin commonly used to model Crohn’s
disease model, or VSL #3, a probiotic previously shown to have both anti-inflammatory and anti-
stress responses in mice, prior to our multi-hit model of PD.
We found that VSL#3 treatment did not significantly alter the gut microbiota of the mice,
while DSS significantly altered the prevalence of several species, reducing families associated
with good health and increasing other populations associated with disease states. Interestingly at
the end of the experiment, the LPS and paraquat treated animals in both the control and DSS groups
failed to gain weight, while VSL #3 administration prevented this effect. Further, DSS clearly
increased the activation state of microglia in the SNc, while VSL #3 prevented these morphological
changes. These effects clearly differed from the neurogenerative effects that indicated VSL3# had
absolutely no effect.
DSS treatment led to mortality beginning 48 hours following its final administration.
Additionally, DSS induced acute weight loss but this recovered over the course of the experiment.
DSS led to upregulation of pro-inflammatory factors in the colon including IL-1B and TNF-α,

77
however, surprisingly, LPS and paraquat treatment did not significantly alter these factors. Plasma
levels of LCN2, a marker of activated neutrophils, was elevated by DSS treatment and the pro-
inflammatory cytokine IL-6 was increased by LPS paraquat treatment. While not significant, both
of the measures as well as circulating levels of IL-1B and IL-10 appeared to be enhanced in LPS
and paraquat treated animals which also received DSS.
Our work was primarily guided by the hypothesis that alterations in the gut could influence
the state of the microglia prior to LPS and paraquat administration either augment or diminish TH+
neuronal loss. Data on modulating the gut microbiota is key to understanding the factors that lead
to the development of PD for two key reasons. 1) If altered gut microbiota can predispose
individuals towards PD later in life it may be possible to identify at-risk individuals prior to
neuronal degeneration and 2) Given the relative ease at which bacteria and other factors can be
introduced to the gut if pre or pro-biotics can reduce the chances of PD there may be opportunity
for use as a prophylactic treatment. Moreover, the ease at which samples from the gut can be
obtained from potential patients is important [306, 307]. VSL #3 is commonly prescribed for
individuals suffering from ulcerative colitis and irritable bowel syndrome, and previous reports
have found that it reduces peripheral inflammation through decreasing intestinal permeability. In
this current study we found that VSL #3 treatment had negligible effects on most outcomes.
Notably the VSL #3 did however protect mice from LPS and paraquat induced weight loss and
microglial activation, however, these had no functional impact on TH+ cell loss or on locomotor
activity the two central outcomes of our PD model. While several studies have found beneficial
effects of VSL #3 treatment in murine models [222, 223, 289] the models have been generally
quite potent and proximal to the intestine including using MUC2 deficient mice and DSS [222,
308]. Interestingly, a similar study to our own was conducted using male Wistar rats and

78
administered VSL#3 daily for two weeks prior to the induction of renal ischemia reperfusion injury
[290]. This study did not examine changes in the microbiota; however, the researchers analysed
several of the same factors including IL-1B, IL-6 and found generally lowered levels of myeloid
cell activation, reduced pro-inflammatory signalling and reduced tissue damage following renal
ischemic re-perfusion [290]. These findings stand in stark contrast with our own, perhaps
suggesting a difference in the physiology of C57BL/6 mice compared to Wistar rats, or more
likely, could be related to the different toxins used in the present study. It could be that PD involves
very different microbial elements than are apparent with ischemia. Intriguingly, another study that
examined the reaction to VSL#3 in healthy C57BL/6 mice compared to BALB/C did find no
alterations in C57BL/6 mice but quite a marked upregulation in anti-inflammatory proteins,
including fraktalkine receptor and decreased T cell expression [309]. Our lack of strong anti-
inflammatory changes following VSL#3 treatment may also be due to the repeated nature of our
model. Central LPS followed by peripheral paraquat injections likely interacts directly with
immune cells throughout the body, especially in the CNS which are distant from the site of VSL#3
action.
DSS had markedly different responses from VSL#3 treatment. We saw substantially
altered gut microbiota composition following treatment, similar to previously reported data [310,
311]. Most notable was a drastic increase in the Bacteriodaceae family and a decrease in the S24-
7 family. Accompanying these alterations we found DSS treatment induced an acute sickness
response characterized by rapid weight loss, diarrhea and reduced locomotor activity similar to
previous experiments using the same model [312]. These effects were quite severe and led to a
large proportion of animals reaching humane endpoints following DSS washout. Surviving
animals recovered and DSS alone did not show any lasting behavioural responses at time of

79
sacrifice other than decreased performance on the rotarod. DSS further resulted in an increase in
IL-1B and TNF-α mRNA in the intestine, however, these levels were not affected by LPS and
paraquat treatment. Interestingly, these data correlate with our microglial scoring in the SNc where
DSS significantly increased activation score underlining the previous research which has found
DSS can induce heterogeneous neuroinflammation in the CNS [313]. As discussed earlier, one
potential mediator of this connection could be the vagal nerve [207], and another route could be
alterations in circulating immunity. To assess the second we analysed blood plasma for LCN2 and
cytokines. We found DSS treatment increased circulating LCN2 levels, however, LPS and
paraquat did not significantly influence LCN2 levels. Previous reports have found DSS increases
LCN2 in both plasma and feces [312, 314], while LCN2 mRNA was not induced in WT mice
treated with paraquat [315]. Similarly we saw increased IL-6 following LPS and paraquat
administration, as we and others have previously reported [298, 316], however, no effect of DSS
was observed on this measure contrary to previous reports in the gut [317]. In addition, we further
found no alteration in IL-1B or IL-10 with either DSS or LPS and paraquat treatment. Despite this,
all four measures consistently appear to be augmented in DSS and LPS paraquat treated animals
suggesting that another time point could potentially see an interaction in blood-plasma
inflammatory signalling.
LPS and paraquat treatment has previously been shown to induce TH+ cell loss in the SNc
and lead to microglial activation [48]. Interestingly DSS pre-treatment significantly enhanced this
activation while VSL#3 treatment trended to prevent this. Despite this, TH+ cell loss was not
impacted by these microglial alterations which is surprising given the literature thus far examining
the role of microglia in paraquat models of PD [150, 153, 247, 316]. Given the increase we
observed in GFAP expression following LPS and paraquat treatment, our TH+ cell loss may

80
additionally be due to alteration in astrocyte function that may not be influenced by VSL#3 or DSS
treatment. We found overall that VSL#3 had limited effects on our toxicant model of PD despite
previous experiments suggesting that inflammatory signalling in both the CNS and circulation
would be reduced. On the other hand, DSS treatment drastically impacted many signalling
pathways and appeared to augment LPS and paraquat induced inflammation both in the blood-
plasma and the SNc although this was not significant. This data suggest that pathological
alterations in the microbiome may occur prior to disease onset or contribute to the peripheral
inflammation found in PD patients. Overall these data support a role for the microbiota in both
peripheral and central immune responses but fail to demonstrate impacts on PD as measured by
TH+ neuronal loss.

81
Chapter 4:
Leucine-rich repeat kinase-2 (LRRK2) modulates paraquat-
induced inflammatory sickness and stress phenotype

82
Preface:
This chapter is based upon the published manuscript “Leucine rich repeat kinase-2
(LRRK2) modulates paraquat induced inflammatory sickness and stress phenotype” published in
the Journal of Neuroinflammation by co-first authors Dr. Christopher Rudyk and Zachary
Dwyer. The manuscript consists of two complimentary experiments, the first, treatment of aged
LRRK2 KO mice with paraquat was conducted by Dr. Rudyk while the second experiment,
treatment of aged LRRK2 G2019S overexpressing mice with paraquat was conducted by
Zachary Dwyer.

83
Abstract
Background
Leucine rich repeat kinase 2 (LRRK2) is a common gene implicated in Parkinson’s disease (PD)
and is also thought to be fundamentally involved in numerous immune functions. Thus, we
assessed the role of LRRK2 in the context of the effects of the environmental toxicant, paraquat,
that has been implicated in PD and is known to affect inflammatory processes.
Methods
Male LRRK2 knockout (KO) and transgenic mice bearing the G2019S LRRK2 mutation (aged 6-
8 months) or their littermate controls, were exposed to paraquat (2 times per week for three weeks)
and sickness measures, motivational scores, and total home-cage activity levels were assessed.
Following sacrifice, western blot and ELISA assays were performed to see whether or not LRRK2
expression would alter processes related to plasticity, immune response processes, or the stress
response.
Results
Paraquat induced signs of sickness, inflammation (elevated IL-6) and peripheral toxicity (e.g.
organ weight) that were completely prevented by LRRK2 knockout. In fact, LRRK2 knockout
dramatically reduced not only signs of illness, but also the motivational (nest building) and home-
cage activity deficits induced by paraquat. Although LRRK2 deficiency did not affect the striatal
BDNF reduction that was provoked by paraquat, it did blunt the corticosterone elevation induced
by paraquat, raising the possibility that LRRK2 may modulate aspects of the HPA stress axis.
Accordingly, we found that transgenic mice bearing the G2019S LRRK2 mutation had elevated
basal corticosterone, along with diminished hippocampal 5-HT1A levels.

84
Conclusion
We are the first to show the importance of LRRK2 in the peripheral neurotoxic and stressor-like
effects of paraquat. These data are consistent with LRRK2 playing a role in the general
inflammatory tone and stressor effects induced by environmental toxicant exposure.

85
Background
Virtually all neurological diseases have an inflammatory component that in some regard is
associated with the manifestation of a range of primary and/or co-morbid symptoms. Parkinson’s
disease (PD) is no exception having a prominent neuroinflammatory element, along with range of
behavioral and autonomic symptoms, in addition to primary motor deficits [318, 319]. Among the
genes implicated in both PD and its inflammatory processes, leucine rich repeat kinase 2 (LRRK2),
and in particular its G2019S mutation has received considerable attention [320–322]. In fact, the
highest levels of LRRK2 were found in peripheral lymphocytes and monocytes of PD patients
[323] and LRRK2 mutations have been associated with microglial reactivity and pro-inflammatory
cytokine production in the brain and periphery [278, 324–326]. Moreover, typical inflammatory
agents, such as lipopolysaccharide (LPS), as well as chemical toxicants like MPTP, that are used
to model PD pathology, have been shown to influence processes linked to LRRK2 [104, 140, 327].
Accordingly, LRRK2 may be a critical general mediator of inflammatory pathology associated
with a range of environmental insults.
Numerous reports have implicated environmental toxicants in the development of PD and
in particular, increased incidence of PD has been associated with exposure to various pesticides
[328–331]. Indeed, animal studies have confirmed that the herbicide and oxidative stress
generating chemical, paraquat, provokes a loss of midbrain dopamine neurons, coupled with a
range of behavioral symptoms [139, 146, 332, 333]. Strikingly, the impact of pesticide exposure
may be modified by genetic background [273, 334, 335]. Given the highly variable penetrance of
LRRK2 mutations [271, 336], it is likely that environmental stressor exposure of some sort may
be required in the context of LRRK2 mutation to provoke a disease state. This is in keeping with
the idea that multiple hits give rise to PD; in effect, LRRK2 mutation could "set the stage" or

86
essentially act as the first of such hits over one’s lifetime. Further still, endogenous LRRK2 could
underlie the impact of numerous environmental hits by virtue of its role as a modulator of
inflammatory immune processes.
The most common LRRK2 mutation linked to PD is the G2019S mutation that is not only
associated with the familial form of the disease, but also might act as a risk factor for the idiopathic
form of the disease [72,73]. This mutation is thought to cause a gain of function for the kinase
activity of LRRK2 and mice bearing this mutation were reported to show alterations in dopamine
levels and enhanced sensitivity to MPTP treatment, as well as increased a-synuclein inclusions
[12, 75]. Yet, the literature is mixed with some reports finding no differences in neurodegeneration
in G2019S mutants [74]. Interestingly, the G2019S mutation might also increase inflammatory
myeloid cell responses to lipopolysaccharide (LPS)[76].
The present focus was on the impact of LRRK2 deficiency and G2019S mutation in
response to paraquat. Since paraquat induced sickness symptoms and behavioral features akin to
what is often evident with immune challenges, such as those induced by LPS or TNF-a [236], we
sought to evaluate whether LRRK2 knockout (KO) and G2019S transgenic expression would
affect the impact of the pesticide on these outcomes. Similarly, it was also of interest to assess
whether paraquat provokes alterations in hormonal (corticosterone), neurotransmitter (5-HT1A),
trophic (BDNF) and inflammatory (CX3CR1, WAVE2) factors and again whether LRRK2 plays
a role. Indeed, we previously found paraquat to reduce BDNF levels [27, 31, 36] and a recent
report linked LRRK2 mutations to depressive-like symptoms that were correlated with 5-HT1A
changes [32]. Members of our group also recently found that the actin-regulatory factor, WAVE2,
controls macrophage inflammatory response through LRRK2 [55]. Hence, it was expected that the
paraquat would not only induce brain changes, but would also have systemic consequences that

87
would involve changes in peripheral inflammatory factors (IL-6) and possibly at the organ level.
We presently found that LRRK2 KO prevented motor impairment and signs of peripheral
toxicity/stress, including sickness, weight loss, corticosterone and IL-6 elevations, as well as organ
changes in paraquat treated aged mice. Furthermore, transgenic G2019S overexpression basally
altered striatal BDNF, hippocampal 5-HT1A and corticosterone levels, consistent with a "stress
phenotype". Thus, it appears that LRRK2 is an important regulator of paraquat provoked
peripheral and central effects and may be relevant for neuroimmune toxicity in general.

88
Methods
General Study Design
Briefly, two parallel studies were conducted on (6-8 month old) LRRK2 KO (JAX#
012444) or BAC transgenic G2019S (JAX #012467) mice along with their respective wild type
(WT) littermate controls, that were obtained from our in-house breeding colony. Prior to the
commencement of the study, baseline home-cage activity was carried out as described below. Mice
were then randomly assigned to one of the four experimental conditions in each of the two studies:
Study 1: (WT/Saline vs WT /Paraquat and KO/Saline vs KO/Paraquat) and Study 2: (WT/Saline
vs WT/Paraquat and G2019S/Saline vs G2019S/Paraquat). These were analyzed as two separate
2-way ANOVAs. Saline and paraquat injections (10 mg/kg; 1,1′-dimethyl-4,4-bipyridinium
dichloride; Sigma Aldrich, St Louis, MO, USA) began one day after baseline locomotor
measurements and were given every other day for a total of 6 injections. Motor behaviour
alterations assessing home-cage locomotor activity, and fine movement coordination were carried
out at various time points as described below. At the end of the experimental paradigm, all animals
were rapidly decapitated 1 hour following the final injection.
This study used mice that were relatively older (6-8 months), than what we typically use
(2-3 months), in order to determine whether LRRK2 is important for the toxic effects of paraquat
exposure in slightly older animals. Prior to the main study presented, we initially sought to utilize
our dual-hit PD model [48]; however; an initial study revealed profound sickness and mortality in
6-8 month old mice that received intra-substantia nigra (SNc) infusion of LPS (2 ug) followed two
days later by 9 injections of paraquat (10 mg/kg 3 times per week). Remarkably, however, this
toxicity was greatly diminished in LRRK2 KO mice. Owing to the enhanced mortality, we decided
to omit the LPS infusion and curtail the number of injections down to 6 for the paraquat treatment

89
in these mice in order to explore in detail the role of LRRK2 in pathology. Indeed, the
mortality/sickness was typically observed by the 6th injection and this regimen allowed us to
ascertain whether LRRK2 KO and/or overexpression of the most common mutation G2019S might
impact paraquat toxicity and stressor-like effects.
Figure 4.1: Timeline in days for experiment 3, injection days are indicated by vertical bars above
the axis while behavioural assessments are indicated below the axis.
Animals
C57BL/6N-Lrrk2tm1.1Mjff/J KO and B6.Cg-Tg(Lrrk2*G2019S)2Yue/J transgenic mice were
purchased from Jackson Laboratories concurrently with C57Bl/6J mice at 6 weeks of age. All
animals were fed Harlan Labs 2018 rodent chow and housed under a normal 12-hour light dark
cycle. Males were each mated with 3 females in a harem breeding arrangement until pregnant. At
21 days of age male pups were ear punched for identification, were placed on Harlan labs 2018
diet and had tail snips taken for genotyping. A total of 48 males from each transgenic line were
group housed with littermates and enrichment in individually ventilated cages until 10 weeks of
age when they were transferred into an experimental room and group housed until 6-8 months of
age at which point they entered the experiment.
Baseline MMx
PQ1 PQ2 PQ3 PQ4 PQ5
Nestlet
PQ6
SacrificeMMx1 MMx2
0 1 2 3 4 5 6 7 8 9 10 11
Aged LRRK2 G2019S Experimental Timeline

90
For all mice, DNA was extracted from 0.25cm long tail snips collected at 21 days of age using the
Qiagen DNEasy blood and tissue kit. For LRRK2 KO mice, animal genotype was determined via
gel electrophoresis following DNA amplification. For G2019S transgenic mice, extracted DNA
was analyzed using a BioRad CFX qPCR machine and the recommended Jackson Labs protocol
to separate WT animals and heterozygous transgenics based on melt curve data. Pure WT products
resulted in melt peaks at 80°C and heterozygous and homozygous transgenic amplicon products
resulted in melt peaks at 84°C.
Behavioral analyses
Spontaneous home cage locomotor activity assessment was completed following a 30-
minute acclimation period in our behavioural testing room, measurements of home-cage locomotor
activity occurred once at baseline (Day 0), then again the evening of the 2nd and 5th injection.
Sickness scoring
Sickness symptoms (e.g. ptosis, curled body posture, piloerection) were assessed daily
throughout the injection regimen, as previously described [337]. Briefly, animals were assessed
for the presence of the following symptoms: ptosis (drooping eyelids), piloerection, curled body
posture, and diminished locomotion and/or exploratory behaviour. Upon assessment, a score based
on the number of symptoms present (0 = no sickness symptoms, 1= one symptom, 2= two
symptoms, 3 = three symptoms) was applied. Ratings were scored by an observer blind to all
experimental conditions.

91
Nestlet test
In order to assess goal-directed behaviour alterations involving fine motor coordination
skills in mice, the nestlet test was used, as previously described [338]. Briefly one day following
the 2nd and 5th injection mice were placed into a new standard polypropylene cages (27 × 21 × 14
cm) containing one fully intact nestlet (Ancare, Bellmore, NY) beginning at 08:30. Mice nestlet
building behaviour was then examined based on the quality of nest built at 1, 3, 5 and 24 hours by
an investigator blind to all experimental conditions. All scoring was based on the nestlet likert
rating scale whereby scores range from 0 (untouched intact nest) – 6 (perfectly developed nest)
[338].
Home-cage locomotor activity
Spontaneous home cage locomotor activity was measured over a complete 12 hour
light/dark cycle using our Micromax (MMx) infrared beam-break apparatus (Accuscan
Instruments, Columbus, OH, USA), as previously described [294]. Spontaneous home cage
locomotor activity assessment was completed following a 30 minute acclimation period in our
behavioural testing room post nestlet removal, measurements of home-cage locomotor activity
occurred once at baseline (Day 0), then again the evening of the 2nd and 5th injection.
Brain dissection and tissue extraction
92
Half the animals were intraperitoneally administered 200 mg/kg of sodium pentobarbital
and perfused with 4% paraformaldehyde. Twenty four hours later the brains were transferred to
10% sucrose and then transferred to 30% sucrose 48 hours after sacrifice. The remaining animals
were sacrificed via rapid decapitation and trunk blood, brains and organs were extracted and flash
frozen at -80℃.
Following rapid decapitation, brains were excised and sectioned into sequential coronal
slices using razor blades and a chilled stainless steel microdissecting matrix with adjacent slots
spaced ~ 0.5 mm apart. Hollow biopsy needles were then used to collect the dorsal striatum,
hippocampus and SNc. The tissue was immediately frozen upon dissection and was stored at -
80oC until processing. Additionally, for the LRRK2 KO study, immediately following sacrifice
the animals left lung, spleen, and liver were extracted from the cavity and any excess fat was
removed and organs were promptly weighed. The organs were then weighted and stored on dry
ice and stored at 80oC until processing.
Plasma corticosterone assay
At the time of decapitation, trunk blood from all of the animals, was collected in tubes
containing 10 μg EDTA. Samples were centrifuged (3000g for 8 min) and the plasma removed
and stored in aliquots at −80 °C for later corticosterone determination with commercially available
radioimmunoassay kits (ICN Biomedicals, CA, USA). Samples were assayed in duplicate within
a single run to control for inter-assay variability; the intra-assay variability was less than 10%.
Plasma determination of IL-6

93
Trunk blood was collected at time of decapitation and prepared as for the corticosterone
assay in a separate aliquot at -80 ℃. IL-6 levels were determined using a Luminex Immunoassay
(R&D Systems, NE, USA) ran following kit instructions on a Luminex Magpix (Luminex
Corporation, TX, USA). Samples were assayed in duplicate within a single run to control for inter-
assay variability; the intra-assay variability was less than 10%.
Western blot
Brain tissue punches and organs were collected to detect levels of BDNF (R&D Systems,
MAB248), 5-HT1A (Genetex, GTX104703), CX3CR1 (Sigma-Aldritch, SAB3500204), and
WAVE2 (Cell Signaling Technology, 3659), as described previously. Briefly, whole cell lysates
were homogenized in Radio Immuno Precipitation Assay (RIPA) buffer [50 mM Tris (pH 8.0),
150 mM sodium chloride, 0.1% sodium dodecyl sulphate (SDS), 0.5% sodium deoxycholate and
1% Triton X-100] mixed with 1 tablet of Complete Mini ethylenediaminetetraacetic acid (EDTA)-
free protease inhibitor (Roche Diagnostics, Laval, QC, Cat #11 836 170 001) per 10 mL of buffer.
On day one of analysis, proteins were separated using sodium dodecyl sulphate-polyacrylamide
gel electrophoresis (SDS-PAGE). In order to determine total protein, membranes were incubated
in REVERT total protein solution for a period of 5 minutes followed by placement into a REVERT
wash solution (6.7% Glacial Acetic Acid, 30% Methanol, in water) two times 2 minutes each.
Membranes were then quickly rinsed with distilled water and imaged on our LI-COR Odyssey
imaging system on the 700 channel for an exposure period of 2 minutes. Membrane incubation
with rabbit anti-BDNF, WAVE2, 5-HT1A and CX3CR1 (1:1000) for a period of 60 minutes in
0.05% fish gelatin in TBS with 0.1% tween followed by one hour in infrared anti-rabbit conjugate
at a concentration of 1:20 000 in 0.5% fish gelatin solution containing 0.2% tween and 0.01%

94
SDS. Any unbound antibody was removed using 15 mL of TBS-T/membrane and membranes
washed and read on our Licor Odyssy system at the appropriate wavelength for 6 minutes.
Statistical analysis
All data was analyzed by 2 (Genotype; WT vs. KO or WT vs G2019S) X 2 (Injection;
saline vs. paraquat) two-way ANOVA with significant interactions further analyzed by means of
Bonferroni follow up comparisons (p < 0.05) where appropriate. Additionally, analysis of total
home cage locomotor activity, sickness scores, and nestlet building behaviour was completed
using appropriate repeated measures ANOVA’s conducted with Time as the 3rd independent
variable followed by post-hoc analysis. Data is presented in the form of mean ± standard error
mean (mean ± SEM). All data was analyzed using the statistical software StatView (version 6.0)
and differences were considered statistically significant when p < 0.05.

95
Results
LRRK2 KO prevented paraquat and LPS + paraquat induced sickness behavior and
mortality
A preliminary study showed that by the 9th paraquat injection, a significant degree of
mortality was observed in 6-8 month old WT but not LRRK2 null mice (Figure 4.2A). Indeed,
significantly more WT mice that received paraquat treatment became moribund and hence reached
endpoint compared to LRRK2 KOs or saline treated mice (p < 0.05). This striking finding
suggested that LRRK2 might have a fundamental role in processes aligned with inflammatory
toxicity and hence, we reduced our paraquat injection regimen from 9 to 6 injections. This allowed
for better survival and determination of the impact of LRRK2 with regards to behavioral and
systemic outcomes normally associated with immune and stress challenges. To this end, LRRK2
deficient and WT littermates between 6-8 months of age received paraquat (10 mg/kg; ip) or
vehicle injection twice a week for three weeks. Moreover, a parallel study using 6-8 month old
transgenic mice overexpressing LRRK2 G2019S (which displays enhanced LRRK2 kinase
activity) was also conducted using an identical paraquat injection regimen.
In agreement with the mortality finding, LRRK2 KO also prevented paraquat induced signs
of illness. Specifically, the repeated measures two-way ANOVAs revealed a Genotype X Injection
interaction for scores of sickness (F(4,128) = 10.642, p < 0.001) and animal weights (F(5, 160) =
8.319, p < 0.001) (Figure 4.2 B and D). Follow up analyses revealed that beginning one day after
the 5th injection, WT mice treated with paraquat had significantly lower weight and displayed
higher sickness scores, relative to their saline exposed littermates (p < 0.05), as well as with respect
to LRRK2 null mice exposed to the toxin (p < 0.05). Correspondingly, the paraquat treatment
promoted significant differences in weight (F(1,57) = 21.482, p < 0.001) and sickness ratings

96
(F(1,52) = 13.05, p < 0.05) between the groups in the parallel G2019S study (Figure 4.2 C and
E). However, in this case, the paraquat induced signs of illness were not affected by the G2019S
genotype. Indeed, the G2019S mutant mice appeared identical to their WT counterparts in their
sickness response to paraquat. These findings suggest a role for endogenous LRRK2 in basic
processes aligned with the development of sickness but that enhancement of its kinase activity
does not add to such pathology.
Figure 4.2: An initial study that involved intra-SNc LPS (2 μg) infusion followed by paraquat
administration (10 mg/kg; ip) revealed that wild-type (WT) mice displayed signs of extreme
sickness, with a significant number (6/9) of mice either died outright or had to be euthanized
(owing to moribund presentation) by the ninth injection. In contrast, the mortality rate was reduced
in LRRK2 knockout (KO) mice, such that only 1/6 reached end state following the LPS + paraquat
regimen. (A) The follow-up study showed that in the absence of LPS and with a reduced paraquat
injection regimen, paraquat-treated WT mice still displayed significant (albeit less) pathological
signs in terms of ratings of sickness (B,C) and weight loss (D,E) by their sixth paraquat injection.
Importantly, once again this effect was prevented by LRRK2 KO (B,D). However, the G2019S
(GS-Tg) transgenic mice did not significantly differ from WT animals in terms of either sickness
(C) or weight loss (E). Sickness was calculated as a composite score by blind raters including
ptosis, piloerection, lethargy, and curled body posture. *p < 0.05, relative to respective controls

97
LRRK2 KO prevented paraquat induced home-cage motor activity and nestlet building
deficits
A Genotype X Injection interaction was observed for home-cage motor activity after the
5th paraquat injection (F(3,25) = 3.196, p < 0.05). Indeed, paraquat treated WT mice displayed
significantly less home-cage activity over a 24 hr period (p < 0.05), but LRRK2 KO prevented this
motor reduction (Figure 4.3A). We also assessed nestlet (cage material used to construct a nest)
building behavior, as this requires fine motor skills and is also linked to motivational processes
that are typically disrupted by stressors. The repeated measures two-way ANOVA revealed a
Genotype X Injection interaction (F(3,31) = 4.846; p < 0.05). As borne out by the follow up
comparisons, by the 5th injection WT paraquat treated mice had significantly lower nestlet building
scores relative to all other groups (p < 0.05; Figure 4.3B). Once again, the parallel G2019S
experiment confirmed the paraquat induced reduction in home-cage activity F(1,58) = 7.60, p <
0.05 and nestlet building score F(1,108) = 26.41, p < 0.05 in WT mice but found that the transgenic
G2019S mutation had no influence on these parameters (Figure 4.3 C,D).

98
Figure 4.3: Wild-type (WT) mice displayed a significant reduction in home-cage activity by the
fifth paraquat injection (10 mg/kg; ip), and this effect was reversed by LRRK2 knockout (KO) (A)
but unaffected by G2019S (GS-Tg) transgenic overexpression (C). As a measure of nesting
behavior, which requires fine motor skills and is influenced by stress, nestlet building was assessed
in the 24 h following the fifth paraquat injection. Paraquat treatment markedly reduced nest
building in WT mice, whereas LRRK2 KO prevented this deficit (B) but was unaffected by
G2019S mutation (D). *p < 0.05, relative to respective controls.
LRRK2 KO blunted corticosterone elevations but not BDNF or 5-HT1A changes in paraquat
exposed mice
Plasma corticosterone was assessed as an index of general “stress state” of mice and is also
a useful measure that usually correlates with inflammatory sickness profiles. Once again, a
significant Genotype X Injection interaction was evident (F(1,32) = 3.883, p = 0.05). Paralleling
the sickness syndrome, Figure 4.4 shows that paraquat clearly had a stressor-like effect as reflected

99
by markedly elevated plasma corticosterone levels in WT mice, relative to saline injection;
however, this effect was dramatically blunted in the LRRK2 KOs (p < 0.05; Figure 4.4A). The
transgenic G2019S study confirmed a significant main effect of paraquat (F(1,20) = 8.67, p < 0.05)
and genotype (F(1,20) = 24.44, p < 0.05) on plasma corticosterone (Figure 4.4B). Indeed, as
shown in Figure 4.4A,B, paraquat once again significantly increased corticosterone levels (p <
0.05), but most strikingly the G2019S overexpressing transgenic mice displayed further elevated
levels of the stress hormone. In fact, G2019S mice even had significantly elevated basal levels of
corticosterone, relative to their WT counterparts (p < 0.05).
In addition to the stressor-like effects of paraquat on corticosterone, similar alterations were
observed with regards to levels of the trophic factor, brain derived neurotrophic factor (BDNF),
within the striatum (Figure 4.4C,D). Indeed, striatal levels of BDNF were found to be reduced by
paraquat treatment in both the LRRK2 KO (F(1,22) = 4.76, p < 0.05) and G2019S (F(1,15) = 5.81,
p < 0.05) studies. Moreover, G2019S mice had basally reduced striatal BDNF levels (F(1,15) =
6.72, p < 0.05). However, LRRK2 deficiency did not further impact levels of the growth factor,
but the transgenic G2019S mutation did significantly further reduce BDNF within the striatum,
relative to their WT counterparts (p < 0.05). In contrast to the striatum, no significant changes in
SNc levels of BDNF were evident in either of the studies.
As a further measure of potential role of LRRK2 on stress related processes, we assessed
5-HT1A levels in the hippocampus, which has been implicated in depression and anxiety that
accompany PD [339]. To this end, although neither paraquat nor LRRK2 KO affected hippocampal
5-HT1A levels of the receptor were altered by the G2019S mutation (F(1,15) = 30.03, p < 0.05;

100
Figure 4.4E,F). Specifically, as shown in Figure 4.4F, basal 5-HT1A levels were significantly
increased in the G2019S transgenic mutants, relative to their WT littermates (p < 0.05).
Figure 4.4: The paraquat treatment regimen (black bars) induced an elevation of plasma
corticosterone levels, relative to saline treatment (white bars), and this elevation was significantly
blunted in LRRK2 knockout (KO) mice (A). The G2019S (GS-Tg) transgenic mutation alone
induced a significant corticosterone elevation that was similar to that induced by paraquat in non-
transgenic mice (B). In both the LRRK2 KO and G2019S studies, paraquat significantly reduced
striatal levels of BDNF in the absence of any effect of genotype (C,D). While hippocampal 5-
HT1A levels were not affected by paraquat or LRRK2 KO (E), the G2019S mutation did elevate
5-HTIA, relative to saline treatment (F). *p < 0.05, relative to respective saline-treated
controls, +p < 0.05, difference between genotypes
LRRK2 KO but not G2019S overexpression increased fraktalkine expression in the SNc
Finally, the chemokine receptor, CX3CR1, was assessed as an index of inflammatory cell
changes. Indeed, engagement of the CX3CR1 receptor on microglia by its ligand, fractalkine, has
been reported to maintain a basal microglial phenotype and in fact, might act in an anti-
inflammatory capacity [340]. To this end, SNc levels of the chemokine receptor, CX3CR1 (which

101
is found on microglia and infiltrating macrophages), did vary as a function of genotype (F(1,17) =
6.99, p < 0.05; Figure 4.5A). Although paraquat had no effect on CX3CR1, levels of the
inflammatory regulator were basally elevated by LRRK2 KO (p < 0.05; Figure 4.5A). Hence,
endogenous LRRK2 may act to restrict fractalkine signaling. In contrast, G2019S had no
significant influence on SNc CX3CR1 levels (Figure 4.5B).
Figure 4.5: Substantia nigra (SNc) levels of the chemokine receptor, CX3CR1, which is
selectively found on microglia were significantly increased in LRRK2 knockout (KO) mice (A),
but were unaffected by the G2019S (GS-Tg) transgenic mutation (B). In no case did paraquat
administration affect SNc levels of CX3CR1. *p < 0.05, difference between genotypes
LRRK2 KO prevented the pathological effects of paraquat within the periphery
An additional study was conducted to assess peripheral organ changes and this experiment
was restricted to LRRK2 KOs, given that G2019S had few effects on parameters of paraquat
toxicity. This study sought to assess whether the sickness changes induced were associated with
changes in the periphery; namely, circulating IL-6 and changes in organ weight (indicative of
atrophy) and inflammatory factor expression (WAVE2 and CX3CR1; indicative of inflammatory
cell migration and potential tissue remodeling). Accordingly, paraquat injection parameters

102
identical to the aforementioned studies were utilized in 6-8 month old mice. Moving from the brain
into the periphery, we took gross measures of organ weight of the liver, lungs, and spleen. These
yielded significant Genotype X Injection interactions for the liver (F(1,32) = 6.381, p < 0.05;
Figure 4.6A) and lungs (F(1,32) = 4.369, p < 0.05; Figure 4.6C). In the liver, paraquat reduced
organ weight in WT animals (p < 0.05; Figure 4.6A) and LRRK2 KO prevented this effect. In the
lung, paraquat increased organ weight (p < 0.05) and again, this effect was prevented by LRRK2
ablation (Figure 4.6C). The former effect could be related to liver atrophy, whereas the latter effect
could be attributable to LRRK2 preventing the expected infiltration of immune cells and pneumatic
inflammation that characterizes paraquat’s typical lung toxicity. No significant differences were
observed for the spleen.
Surprisingly, in no case did levels of CX3CR1 organ levels vary as a function of the
treatments (data not shown). Yet interestingly, levels of the actin regulatory factor, WAVE2, which
is crucial for immune cell migration and phagocytotic responses did vary within the lungs as
function of a Genotype x Injection interaction (F(1,12) = 5.752, p < 0.05; Figure 4.6D). In this
case, paraquat reduced WAVE2 levels in the lungs of WT mice but had no effect in the LRRK2
KOs, which already has basally suppressed levels of WAVE2 (p < 0.05). Within the liver, paraquat
modestly (albeit not significantly) raised WAVE2 levels; but again a dramatic effect was evident
as a function genotype (F(1,12) = 4.703, p < 0.05; Figure 4.6B), such that LRRK2 null mice
displayed lower levels relative to their WT counterparts (p < 0.05; Figure 4.6B). No significant
differences were noted within the spleen, indicating some degree of specificity in the paraquat and
LRRK2 KO effects at the organ level.
Finally, we assessed plasma cytokine levels and found significant variations in IL-6 as a
function of a Genotype X Injection interaction (F(1,29) = 5.267, p < 0.05). The follow up

103
comparisons confirmed that circulating IL-6 was significantly elevated in paraquat treated WT
mice (p < 0.05), but that this effect was completely absent in the LRRK2 null mice (Figure 4.6E).
Figure 4.6: Assessment of gross organ weight revealed that paraquat reduced liver weight (A),
while increasing lung weight (C) in wild-type (WT) mice, but these changes were completely
absent in LRRK2 knockout (KO) mice. Levels of the inflammatory actin regulator protein,

104
WAVE2, were reduced in the liver of LRRK2 null mice, relative to WT animals (B). Whereas
WAVE2 levels in the lungs were reduced by paraquat in WT mice, no such effect was apparent in
LRRK2 KOs (D). Finally, paraquat provokes a significant elevation of plasma IL-6 in WT mice,
but LRRK2 KO prevented this effect (E). *p < 0.05, relative to respective saline-treated
controls; +p < 0.05 differences between genotypes.

105
Discussion
LRRK2 is a large and complex gene that has been implicated in not only PD, but also other
diseases that have an inflammatory component [341, 342]. It is thought to have fundamental
immune functions, such as the regulation of monocyte and lymphocyte trafficking [278, 326] and
a couple of reports indicate that LRRK2 is important for the neurodegenerative effects of toxicants,
such as MPTP and rotenone [271, 327]. Yet, the role of LRRK2 in the context of paraquat exposure
has not been explored, nor is it known how the gene might affect general inflammatory toxicity
and stress processes. This is an important overlooked issue since PD and in fact, virtually all
neurological conditions are typically associated with marked stress and behavioral comorbidity
and the same environmental toxins that have been linked to PD also cause inflammatory toxicity.
In fact, we are interested in not only PD-like motor effects but also general sickness responses and
the possibility that LRRK2 could be a mediator of fundamental body reactions to environmental
stressors, particularly those that elicit oxidative and inflammatory distress, as paraquat does.
Our previous work showed that 2-3 month old mice treated with paraquat displayed modest
sickness behaviors which resolved rapidly, but these mice went on to display PD-like motor
impairments [139, 343]. However, a small subset (~10-15%) of mice often do not fully recover
and hence, are removed from the experiment. In the present study, using moderately older mice
(6-8 months), we found a much greater (~70%) mortality rate which became apparent after the 6th
paraquat injection. Markedly, LRRK2 null mice were protected from this enhanced mortality,
raising the possibility that the gene is involved in general toxicity. Hence, we reduced the number
of paraquat injections with an aim of assessing whether LRRK2 is critical for the systemic stress
and inflammatory toxicity of paraquat in older animals.

106
Consistent with our previous findings [141], paraquat acted as a systemic stressor, as
evidenced by its elevation of plasma corticosterone and IL-6, provocation of sickness behavior
and disturbances in nesting and motor behaviors. Indeed, we and others have shown that paraquat
induced increased pro-inflammatory cytokine levels in the brain, as well as in the lungs and in
serum [139, 236, 344–346]. We know that collectively these cytokines and corticosterone can act
additively or even synergistically to provoke behavioral disturbances and neurochemical
alterations and at high enough concentration can cause cellular death [347, 348]. Accordingly,
paraquat presently induced peripheral changes indicative of inflammatory pathology. Just as was
the case for the mortality, LRRK2 KO prevented these outcomes. Hence, indicating for the first
time LRRK2 involvement in toxicant induced sickness and stress factor responses and raising the
possibility that it might influence brain circuits that are crucial for prototypical illness (e.g.
shivering, fever, piloerection, ptosis) and stressor-relevant social species-specific behaviors [349,
350]. In effect, LRRK2 might be an important mediator of general inflammatory tone and brain-
immune dialogue in the face of environmental insults.
Bi-directional communication between peripheral organs and the brain involving immune
factors, such as cytokines or through neural fibers has been well established. Indeed, cytokines can
activate brain regions through vagal afferents or infiltration of the parenchyma through saturable
transport mechanisms [351, 352]. For instance, nigral-vagal communication, which has been
implicated in the gastrointestinal alterations in PD patients, may serve as a route for the spread of
pathology, such as a-synuclein aggregates [134, 353]. In fact, direct stimulation of substantia nigra
neurons was shown to activate the dorsal vagal complex, which in turn, regulated gastrointestinal
functioning and this communication was disrupted by paraquat administration [354]. As well,
LRRK2 could play a role in gastric pathology in PD patients given that the LRRK2 MUC19

107
mutation confers risk of Chron's disease [355] and that LRRK2 R1411G mutant mice display early
gastrointestinal disturbances [356].
Besides the brain, the main target organ for paraquat is the lung, with the toxicant causing
considerable pulmonary fibrosis and accumulation of inflammatory immune infiltrates [244, 346].
The increased lung weight presently observed with paraquat treatment is consistent with the edema
and accumulation of immune cell infiltrates that has previously been reported with paraquat
intoxication [357]. Moreover, the reduction in WAVE2 lung levels we observed might reflect
general damage to tissue, or alternatively, variations in cell trafficking. WAVE2 is known to be
crucial for the actin re-modelling in immune cells that are required for trafficking and processes
such as phagocytosis [99, 358]. Indeed, LRRK2 was reported to control phagocytic immune cell
responses through the actin regulatory factor, WAVE2 [99], which also may be fundamental for
basic inflammatory cell trafficking and inflammatory phenotype [358, 359]. The fact that LRRK2
knockout mice had lower overall basal organ levels of WAVE2 is consistent with a role for LRRK2
in regulating WAVE2-dependent inflammatory processes [99, 358]. Specifically, WAVE2 would
be expected to underlie phenotypic shifts in the activation state of inflammatory cells (particularly
macrophages) and if this is regulated by LRRK2, then it’s deficiency would limit inflammatory
cell migration into organs. Yet, the reduction in lung WAVE2 induced by paraquat in wild type
mice is hard to reconcile; it conceivably could reflect an increased migration of inflammatory
immune cells from out of the lung into the circulatory or lymphatic system. Alternatively, alveolar
macrophages are particularly vulnerable to paraquat toxicity and the reduction in WAVE2 could
actually reflect a loss of these cells [77]. Interestingly, levels of the fractalkine receptor, CX3CR1,
were not affected in the lung or other peripheral tissues but were basally elevated in the SNc of
LRRK2 KOs. Emerging evidence suggests that CX3CR1 can act as a distress signal that mobilizes

108
immune cells [360], as well as a regulator of basal immune cell "housekeeping functions” [361–
363]. Our findings suggest clearly contrasting roles for WAVE2 and fractalkine and is consistent
with the notion that the former is aligned with pro-inflammatory responses, and the latter may
foster more of an anti-inflammatory or "normal" homeostatic phenotype for microglia and
peripheral immune cells.
Brain-lung interactions readily occur in the context of inflammatory pathology. For
instance, direct inflammation of the lung via monocrotaline (used to induce pulmonary
hypertension) causes microglial activation within the brain and this effect was reversed by anti-
inflammatory (minocycline) treatment [364]. Similarly, brain pathology induced by traumatic
brain injury provoked lung pathology characterized by neutrophil infiltration, alveolar thickening
and fibrin deposition [365]. Also, in addition to the lung, we found that paraquat reduced liver
weight, which is consistent with organ atrophy from repeatedly dealing with detoxification and
excretion of the toxicant. Of course, an important caveat of this study is that organ histology was
not performed, so it is unclear as to the extent to which paraquat might have directly damaged the
tissues.
It was particularly interesting that the G2019S transgenic mutation did not affect overall
toxicity, but that these mice did show signs of enhanced basal stress tone. Specifically,
corticosterone levels and hippocampal 5-HT1A were basally increased, and also simply injecting
the saline vehicle reduced home-cage activity levels in transgenic G2019S animals (compared to
their WT littermates). The fact that the LRRK2 deficiency reduced the corticoid response, but the
G2019S mutation increased it suggests a clear divergence in the role of endogenous LRRK2 vs.
the increased kinase activity that occurs with G2019S mutation. LRRK2 is a complex protein with
kinase activity, as well as non-kinase functions that involve its facilitation of protein-protein

109
interactions. The G2019S mutation increases kinase activity but should not affect non-kinase
mechanisms, suggesting a possible selective role for kinase mediated actions in promoting
corticoid responses (possibly by phosphorylating CRH or by stimulating p38 or JNK).
Alternatively, knockout of endogenous LRRK2 clearly blunted the HPA response and this could
stem from reduced kinase activity, as well as potential reductions in protein signaling pathways,
most notably, p38, JNK, interferon-gamma, as well as a number of RAB proteins that control
vesicular trafficking, autophagy and lysosomal functioning [78]. We and others did find that
G2019S overexpression markedly altered basal and immune challenge evoked dopaminergic
activity within the striatum [366–368]. But again, these transgenic mice did not show changes in
pathology or inflammatory parameters, including sickness behaviors or circulating cytokines.
Hence, forced G2019S overexpression clearly has functional effects but not necessarily those that
would be obviously aligned with inflammatory damage or neurodegeneration.
The stress phenotype of the G2019S mice is intriguing in that it raises the possibility that
the mutation could specifically favor the development of psychiatric disturbances, which are
commonly co-morbid with PD [368–370]. Indeed, the basal elevation of 5-HT1A we observed in
G2019S mutants is consistent with a recent report that also found these mice to display anxiety
and depressive-like behaviors [339]. The LRRK2 BAC G2019S mice also showed decreased
dopamine release [366], which could certainly contribute to behavioral disturbances. Similarly,
the basally increased corticosterone we observed in the G2019S mice could conceivably have been
modulating behaviors. It is important to note that unlike these 6-8 month old animals, we recently
found that 2-month-old G2019S overexpressing mice had no such basal behavioral or corticoid
differences [368], suggesting that age is critical for the manifestation of the "stress" phenotype.

110
There is reason to believe that the G2019S mutation has a modulatory role with regards to
neuroplasticity. For instance, it was reported that aged (8-9 months) G2019S over-expressing mice
had impaired plasticity of medium spiny striatal neurons [371]. The G2019S mutation was also
linked to altered hippocampal LTD [372], along with diminished adult hippocampal neurogenesis
and dendritic arborization and spine numbers in newly generated neurons [373]. Yet, although
paraquat did reduce BDNF, the present results found that neither LRRK2 KO nor the G2019S
mutation affected hippocampal or striatal levels of the growth factor.
It is important to underscore the differences between bacterial artificial chromosome
(BAC) G2019S transgenic over-expressers (as presently used) and targeted G2019S knock-in
mice. Of course, with BAC G2019S overexpression, mutant LRRK2 levels are artificially induced
plus there is still some expression of WT LRRK2. Hence, interactions between the two could
conceivably take place and we are essentially looking at the combined effects of ~6-8 fold over-
expression of the mutant G2019S transgene in the context of the normal expression of WT LRRK2.
In contrast, the knock-in form of G2019S entirely replaces the WT form and elicits more “normal”
levels of the gene.

111
Conclusions
We found that 6-8 month old mice had marked sickness and behavioral disturbances in
response to paraquat and LRRK2 knockout totally prevented these effects. Although it is likely
that immune cells and/or inflammatory factors played a role in these outcomes, the elevation of
corticosterone may also be important since it is known to modulate inflammatory processes and
recovery from sickness [374]. Of course, the fact that the paraquat induced cytokine changes (IL-
6) could actually be driving the corticosterone response makes it difficult to disentangle the
individual effects of cytokines vs hormonal changes. Whatever the case, endogenous LRRK2
appears to be critically involved in paraquat provoked widespread pathology and is specifically
modulating the downstream effects at multiple targets. Curiously, overexpression of the G2019S
transgene did not affect paraquat toxicity but did appear to convey a "stress-like" phenotype, at
least with regards to corticosterone, hippocampal 5-HT1A and home cage activity. These data
clearly suggest a novel role for LRRK2 in modulating general inflammatory and sickness profiles
in response to a systemic environmental stressor. Not only is this important from a mechanistic
prospective, but also clinically given that LRRK2 inhibitors are already being explored.
Ultimately, endogenous LRRK2 appears to be important for processes aligned with toxicological
threats and sickness responses, whereas the G2019S mutation may modulate basal stress state.

112
Chapter 5:
Microglia depletion prior to lipopolysaccharide and paraquat
treatment differentially modulates behavioral and neuronal
outcomes in wild type and G2019S LRRK2 knock-in mice

113
Abstract
Substantial data have implicated microglial-driven neuroinflammation in Parkinson’s
disease (PD) and environmental toxicants have been long expected as triggers of such
inflammatory processes. Of course, these environmental insults act in the context of genetic
vulnerability factors and in this regard, leucine rich repeat kinase 2 (LRRK2), may play a
prominent role. We used a double hit, lipopolysaccharide (LPS; endotoxin) followed by paraquat
(pesticide toxicant) model of PD in mice with the most common LRRK2 mutation G2019S,
knockin mice and wild type littermates. In order to assess the contribution of microglia, we
depleted these cells (through 14 days of the CSF-1 antagonist, PLX-3397) prior to LPS and
paraquat exposure. We found that the G2019S mice displayed the greatest behavioral changes, but
that the PLX-3397 induced microglial depletion at the time of LPS exposure diminished toxicity
and weight loss and blunted the reduction in home-cage activity with subsequent paraquat
exposure. However, neither the PLX-3397 treatment nor the G2019S mutation affected the loss of
substantia nigra pars compacta (SNc) dopamine neurons or elevations of circulating IL-6 or
corticosterone. Intriguingly, microglial morphological ratings were enhanced in G2019S mice and
the PLX-3397 pre-treatment reversed this effect. Moreover, PLX-3397 pre-treatment selectively
elevated soluble a-synuclein and SIRT3 levels, while reducing SNc Caspase-1 and 3, along with
CX3CR1. Hence, the re-populated “new” microglia following cessation of PLX-3397 (i.e. on the
day after LPS infusion) clearly had an altered phenotype or were immature at the time of sacrifice
(i.e. after 11 days). Collectively, these findings suggest that G2019S knock-in and PLX-3397
microglial depletion at the time of LPS exposure affects behavioral but not neurodegenerative
responses to subsequent environmental toxin exposure.
114
Introduction
Parkinson’s disease (PD) is a progressive neurodegenerative disease in which the main
risk factor is age, with epidemiological and experimental studies also implicating environmental
and inflammatory insults as potential triggers [148, 229, 329]. Similar to the peripheral immune
system, the brain’s specialized immunocompetent cell, microglia, have surveillance processes to
detect and eliminate pathogens or other threats within their microenvironment [38]. However,
there is now substantial evidence demonstrating that microglia driven inflammation when chronic
and excessive can also contribute to the progression of PD [375]. Accordingly, augmented
microglial reactivity and levels of pro-inflammatory cytokines have been observed PD patients
[42, 43, 375] and systemic infections may exaggerate behavioral changes [376, 377]. We and
others have demonstrated that exposure to the bacterial endotoxin, lipopolysaccharide (LPS),
augmented dopamine neuron loss in mice that were subsequently exposed to the pesticide paraquat
(which has been linked to PD as a relevant environmental toxicant) and that this effect was related
to microglial hyperactivity [48, 378].
Of course, environmental insults act within the context of genetic vulnerabilities and in this
regard the most commonly mutated gene in both sporadic and familial PD is Leucine-rich-repeat
kinase 2 (LRRK2). Specifically, the Gly2019Ser (G2019S) mutation is most common and is
approximately 30% penetrant at the age of 70, indicating that further environmental factors may
modulate its impact [379, 380]. The G2019S mutation causes an approximate 3-fold increase in
kinase activity and its main identified interactors are Rabs and WAVE2, both proteins being
heavily involved in cell motility and phagocytosis [99, 381, 382]. Further, recent studies
demonstrated that the highest levels of LRRK2 is in immune cells, including circulating B
lymphocytes, dendritic cells and macrophages [76, 96]. LRRK2 was also recently shown to

115
regulate macrophage and microglial motility and phagocytosis is a target gene induced by
interferon-gamma [383], which we previously implicated in the inflammatory and
neurodegenerative response elicited by either MPTP or paraquat treatment [236, 384]. Thus,
LRRK2 could be critical for the inflammatory responses to PD relevant toxins, such as paraquat,
as well as typical bacterial insults, as mimicked by LPS.
Given the postulated role of microglia in PD, it was of interest to assess how transient
microglial depletion at the time of LPS and paraquat exposure impacts behavioral and neuronal
outcomes and whether the G2019S mutation differentially affects these outcomes. Accordingly,
pharmacological inhibition of the colony stimulating factor-1 (CSF-1) receptor using the drug,
PLX-3397 has recently proven effective in depleting microglia. Indeed, its daily administration
(>7 days) leads to a >90% depletion of microglia and macrophages which appears to mostly
recover within 1-2 weeks following PLX-3397 cessation [385]. We presently found that PLX-
3397 induced depletion of microglia blunted the impact of intra-SNc LPS infusion and subsequent
paraquat exposure on behavioral outcomes, but had no effect on the loss dopamine neurons or
elevation of cytokine or corticosterone levels that was induced by LPS and paraquat combination
treatment. The phenotype of the re-populated microglia following PLX-3397 cessation may have
been altered, since levels of soluble a-synuclein, SIRT3, CX3CR1 and Caspases 1 and 3 were all
changed in mice previously treated with the drug. Finally, the G2019S knockin mutation
augmented behavioral toxicity and appeared to have basally elevated changes in microglial
morphology, but otherwise had little influence on any of the other outcomes. In short, we provide
evidence that the G2019S mutation might augment toxicity of LPS and paraquat and that transient
microglial depletion can blunt this; however, the basic neurodegenerative process was not affected.

116
Methods
Animals
96 male LRRK2 G2019S knock-in mice [386] (Novartis; a kind gift from the lab of Dr.
David S. Park) and WT littermates were generated via heterozygote-heterozygote pairings. All
animals were group housed in individually ventilated cages on a 12H light cycle and received ad
libitum access to tap water and either AIN-76 or AIN-76 with incorporated PLX-3397 rodent
chow. Until 3 months of age, animals additionally had access to environmental enrichment (red
nicram houses and nestlets). They were then individually housed for one week with only a nestlet
after which time they entered into the experimental conditions.
Figure 5.1: Timeline in days for chapter 5, injection days and treatments are indicated by vertical
bars above the axis while behavioural assessments are indicated below the axis.
PLX-3397 Treatment
Mice in the AIN-76 control group received AIN-76 ad libitum for the course of the
experiment. Mice in the PLX-3397 treatment groups received PLX-3397 incorporated in AIN-76
rodent chow from Research Diets Inc. (New Brunswick, NJ, USA) as previously reported [385].
PLX-3397 Administration
Begins
MMx Baseline MMx1
Surgery
PQ1 PQ2 PQ3
MMx2
PQ4 PQ5
MMx3
PQ6
Sacrifice
0 1 2 3 4 5 6 7 8 9 10 11 12 13 14 15 16 17 18 19 20 21 22 23 24 25 26 27
G2019S KI and PLX-3397

117
Stereotaxic surgery: LPS infusion
At three months of age, all animals underwent stereotaxic surgery. Following 5%
isoflourane anesthetic and 20mg/kg of the analgesic tramadol, mice were secured in a Kopf
Instruments Model 940 stereotaxic frame and a small, 1cm, incision was made in the centre of the
skull and a 1.5mm diameter hole was drilled in the skull at x=1.2mm and y=3.14mm relative to
Bregma over the left hemisphere. A 22-gauge injector was used to infuse half of each group with
2μL of either saline or 1μg/μL LPS directly above the SNc (at 4mm below the surface of the skull).
A Harvard Apparatus picopump was used to ensure a constant infusion over 4 minutes. The
injector was left in place for 5 minutes after the infusion to allow the LPS/saline to absorb into the
tissue before slowly being removed. The hole in the skull was filled with Bone Wax® before
suturing. The animals then received 100% oxygen for 15 seconds and were placed into recovery
cages situated half-on half-off a 37°C circulating water heating pad. Animals were given hydrogel
for 4 days after surgery and 20mg/kg tramadol subcutaneously twice a day for 3 days following
surgery.
Paraquat injections
At two days following LPS/saline infusion, animals who received intra-SNc LPS also
began receiving i.p. paraquat injections, whereas animals infused with saline received further i.p.
saline injections. Hence, each animal received either 10mg/kg of paraquat or an equivalent volume
of saline. Paraquat was freshly made each morning and these injections were given every 48 hours
for 11 days for a total six injections.

118
Behavioral analyses
Animals were weighed each morning prior to PLX-3397 administration as well as twice
daily for the first 4 days after surgery and finally in the morning of each paraquat/saline injection
until sacrifice.
Home-cage locomotor activity
Spontaneous home cage locomotor activity was measured over a complete 12 hour
light/dark cycle using a Micromax (MMx) infrared beam-break apparatus (Accuscan Instruments,
Columbus, OH, USA), as previously described [294]. Spontaneous home cage locomotor activity
assessment was completed following a 30-minute acclimation period in our behavioural testing
room post nestlet removal, measurements of home-cage locomotor activity occurred on the nights
of days 1, 13, 21 and 25 of the experiment.
Brain dissection and tissue extraction
Half the animals were intraperitoneally administered 200 mg/kg of sodium pentobarbital
and perfused with 4% paraformaldehyde. Twenty-four hours later the brains were transferred to
10% sucrose and then transferred to 30% sucrose 48 hours after sacrifice. The remaining animals
were sacrificed via rapid decapitation and trunk blood, brains and organs were extracted and flash
frozen at -80℃.
Following rapid decapitation, brains were excised and sectioned into sequential coronal
slices using razor blades and a chilled stainless-steel microdissection matrix with adjacent slots

119
spaced ~ 0.5 mm apart. Hollow biopsy needles were then used to collect the dorsal striatum (ST)
and SNc. The tissue was immediately frozen upon dissection and was stored at -80oC until
processing.
Plasma corticosterone assay
At the time of decapitation, trunk blood from all of the animals, was collected in tubes
containing 10 μg EDTA. Samples were centrifuged (2000g for 20 min) and the plasma removed
and stored in aliquots at −80 °C for later corticosterone determination with commercially available
ELISA kits (Enzo, NY, USA #ADI-900-097). Samples were assayed in duplicate within a single
run to control for inter-assay variability; the intra-assay variability was less than 10%.
Plasma determination of cytokines
Trunk blood was collected at time of decapitation and prepared as for the corticosterone
assay in a separate aliquot at -80 ℃. IL-1b, IL-6, IL-10 and TNF-a levels were determined using
a Luminex Immunoassay (R&D Systems, NE, USA) run following kit instructions on a Luminex
Magpix (Luminex Corporation, TX, USA). Samples were assayed in duplicate within a single run
to control for inter-assay variability; the intra-assay variability was less than 10%.
Alpha Synuclein ELISA
The amount and classification of alpha-synuclein in the posterior striatum was assessed
through ELISA following serial protein extraction. Briefly, samples were suspended in TSS buffer

120
(140mM NaCl, 5mM Tris-HCL, in water) with a Roche EDTA-free proteinase inhibitor. Samples
were then homogenized on ice using 50 strokes of a Wheaton tissue deuce. Homogenates were
placed in a 4℃ chilled micro ultracentrifuge (Sorvall, Waltham MA) and spun for 30 minutes at
130,000 RCF. The supernatant was then removed which constituted the soluble fraction, and the
pellet was suspended in TSS buffer with 1% SDS. The suspension was allowed to sit at room
temperature for 10 minutes then centrifuged at 10℃ and 130,000 RCF for a further 30 minutes.
The supernatant was again removed as the insoluble fraction and following BCA quantification
samples were frozen at -80℃ until processed. These samples were then analysed using a sandwich
ELISA as previously described [125].
Immunohistochemistry
In order to examine microglial reactivity sections were stained with ionized calcium-
binding adapter molecule 1 (IBA1) and to asses dopamine cell survival, we used tyrosine
hydroxylase (TH). Brains were sliced into 40um thick sections on our Shandon AS620 cryostat
(Fisher Scientific) and immediately placed in a 0.1M PB solution containing 0.1% sodium azide
(pH 7.4). Every third section was selected for each stain (i.e. ST TH; SNc TH; SNc IBA1). For
SNc TH staining, slices were washed in phosphate buffer saline (PBS) (pH 7.4) three times for 5
minutes each, followed by a 30-minute incubation in 0.3% hydrogen peroxide in PBS. Sections
were then washed in PBS three times five minutes each and a 1-hour incubation in blocking
solution containing 5% normal goat serum (NGS), 0.3% triton-X, with 0.1 M PBS (pH 7.2).
Blocker was removed and the slices were then incubated overnight in primary antibody solution
(5% NGS, 0.3% triton-X, 0.3% bovine serum albumin (BSA) in 0.1 M PBS) with 1:2000 anti-
mouse TH (Immunostar, Hudson, WI). The following day the primary antibody solution was

121
removed and sections were washed in PBS three times for a period of 5 minutes each. Following
the washes, antibodies in secondary solution (1.6% NGS, 0.16% Triton X, 0.3% BSA, in 0.1M
PBS) were applied to striatum (anti-mouse IgG; 1:500) for a period of 2 hours, and to SNc (anti-
mouse HRP; 1:200) sections for 4 hours. Following this, three times five-minute washes were
applied to the striatum which was then incubated again in secondary solution with HRP (1:1000)
for an additional 2 hours. All sections were given three times five minutes PBS washes and
sequentially exposed to a DAB reaction containing Tris-HCl, DAB and 0.6% hydrogen peroxide
in dH20 for visualization. Sections were washed in PBS three times five minutes each following
DAB exposure and all sections were then slide mounted and set to dry overnight. Sections were
dehydrated using a series of alcohol and clearene washes and subsequently cover-slipped using
DPX. All incubations occurred at room temperature.
To label IBA1 processed ST and SNc slices were washed in PBS (pH 7.2) three times for
5 minutes each, followed by a 1-hour incubation in blocking solution (5% NGS, 0.3% triton-X, in
0.1M PBS). Following removal of the blocker, slices were then placed in anti-rabbit IBA1 (Abcam,
Cambridge, MA) at a dilution of 1:1000 in primary solution (5% NGS, 0.3% triton-X, 0.3% BSA
in 0.1 M PBS) for a period of 2 hours. Sections were then washed in 0.1M PBS three times for a
period of 5 minutes each and reacted with either 1:1000 of anti-goat Alexafluor 594 or 647
antibody in primary solution (5% NGS, 0.3% triton-X, 0.3% BSA in 0.1 M PBS). The signal was
visualized with immunofluorescence microscopy using Microbrightfield image acquisition
software on a Zeiss Axioimager2 microscope. All slices were selected and compared between
animals at the same distance from bregma.
DAB stained TH+ cells were analyzed using the optical fractionator workflow in
Stereoinvestigator (MBF, Williston, VT, USA) as previously described [139]. A total of six slices

122
between bregma levels -3.08 and -3.52 were counted by a blind observer under a 63X oil
immersion lens.
Western blot
Brain tissue punches were collected to detect levels of SIRT 3, Caspase 1 and 3, CX3CR1,
and GFAP as described previously [298]. Briefly, whole cell lysates were homogenized in Radio
Immuno Precipitation Assay (RIPA) buffer [50 mM Tris (pH 8.0), 150 mM sodium chloride, 0.1%
sodium dodecyl sulphate (SDS), 0.5% sodium deoxycholate and 1% Triton X-100] mixed with 1
tablet of Complete Mini ethylenediaminetetraacetic acid (EDTA)-free protease inhibitor (Roche
Diagnostics, Laval, QC, Cat #11 836 170 001) per 10 mL of buffer. On the first day of analysis,
proteins were separated using sodium dodecyl sulphate-polyacrylamide gel electrophoresis (SDS-
PAGE). In order to determine total protein, membranes were incubated in REVERT total protein
solution for a period of 5 minutes followed by placement into a REVERT wash solution (6.7%
Glacial Acetic Acid, 30% Methanol, in water) two times 2 minutes each. Membranes were then
quickly rinsed with distilled water and imaged on our LI-COR Odyssey imaging system on the
700 channel for an exposure period of 2 minutes. Membrane incubation with rabbit anti- SIRT 3
(1:1000), Caspase 1 and 3 (1:1000), CX3CR1 (1:2000), and GFAP (1:4000) for a period of 60
minutes in 0.05% fish gelatin in TBS with 0.1% tween followed by one hour in infrared anti-rabbit
conjugate at a concentration of 1:20 000 in 0.5% fish gelatin solution containing 0.2% tween and
0.01% SDS. Any unbound antibody was removed using 15 mL of TBS-T/membrane and
membranes washed and read on our Licor Odyssy system at the appropriate wavelength for 6
minutes.

123
Statistical analysis
All data was analyzed by 2 (Genotype; WT vs. KI) X 2 (Diet; AIN-76 vs. PLX-3397) X 2
(Toxin: Vehicle vs LPS-paraquat) ANOVA with significant interactions further analyzed by means
Bonferroni follow up comparisons (p < 0.05) where appropriate. Data is presented in the form of
mean ± standard error mean (mean ± SEM). All data was analyzed using the statistical software
StatView (version 6.0) and differences were considered statistically significant when p < 0.05.

124
Results
PLX-3397 pre-treatment protected mice from LPS induced weight loss and locomotor
deficits.
LRRK2 G2019S KI mice demonstrated significant mortality when treated with LPS and
paraquat, but this effect was prevented in animals treated with PLX-3397 (Figure 5.2A). Central
LPS injection induced weight loss in mice regardless of genotype; however, treatment with PLX-
3397 again ameliorated this effect (F(1,84)=19.145 p<0.001) (Figure 5.2B). Following LPS and
paraquat treatment, just prior to sacrifice, significant weight loss was still observed, irrespective
of genotype, but this was blunted in mice previously treated with PLX-3397 (Treatment:
F(1,90)=67.222, p<0.001, Diet: F(1,90)=9.448, p<0.01) (Figure 5.2C). Mean home-cage
locomotor activity was significantly decreased by the LPS and paraquat treatment and this effect
was especially pronounced in the G2019S KI mice. Once again, pre-treatment with PLX-3397
totally prevented this effect in WT mice and also blunted it in the G2019S mutants (F(1,54)=5.040,
p<0.05) (Figure 5.2D,E).

125
Figure 5.2: The day that animals reached humane endpoint during the experiments was recorded
(A) in addition to the animals weight (B,C). Clearly, LPS-paraquat treated G2019S mice displayed
highest mortality. The intra-SNc LPS injection treated animals showed a decrease in weight and
this effect was blunted by PLX-3397 administration (B). Moreover, at the time of sacrifice further
weight loss was observed in LPS and paraquat treated animals (C). Mean locomotor activity was
also found to be significantly decreased in the LPS and paraquat treated animals (D, E), PLX-3397
treatment trended towards blunting this response but this missed significance (D,E, p=0.09) but
the G2019S KI did significantly enhance the response (D, E). *p<0.05 compared to control groups,
**p<0.01 compared to control groups.
48 Hours Post LPS Weight
AIN-76A PLX-3397 AIN-76A PLX-3397-2
-1
0
1
2
3
4
WT G2019S
*
*
*
*
**
Mean
Weig
ht
Lo
ss (
g)
Weight at Final Paraquat Injection
AIN-76A PLX-3397 AIN-76A PLX-3397
-4
-2
0
2
4
6Saline
LPS
WT G2019SM
ean
Weig
ht
Lo
ss (
g)
**
**
*
*
Baseline Injection 4Injection 5Injection 60
5
10
15WT-AIN-Sal
WT-AIN-LPS
WT-PLX-Sal
WT-PLX-LPS
G20-AIN-Sal
G20-AIN-LPS
G20-PLX-Sal
G20-PLX-LPS
# S
urv
ivin
g M
ice
A
B C
Baseline Injection 60
10000
20000
30000
40000WT-AIN-Sal
WT-AIN-LPS
WT-PLX-Sal
WT-PLX-LPS
G20-AIN-Sal
G20-AIN-LPS
G20-PLX-Sal
G20-PLX-LPSMean
Beam
Bre
aks
AIN-76A PLX-3397 AIN-76A PLX-3397
-20000
-15000
-10000
-5000
0
5000
10000Saline
LPS
WT G2019S
*
*
*
*
**
Mean
Ch
an
ge in
Lo
co
mo
tor
Acti
vit
y
D E

126
LPS and paraquat combination treatment leads to TH+ neuronal loss in the SNc in both WT
and G2019S KI mice.
Stereological counts of TH positive SNc cells revealed an obvious statistically significant
loss of neurons in mice that received the LPS plus paraquat treatment (F(1,24)=30.833, p<0.001),
Figure 5.3). In particular, the LPS and paraquat treatment resulted in an approximate 30-40%
lesion in WT and 15-20% in the G2019S mutants. That said, there was no significant effect of
genotype and similarly, the number of surviving TH+ neurons were unaffected by the PLX-3397
treatment (p>0.05 for both genotype and diet, Figure 5.3).
TH+ Cell Count
AIN-76A PLX-3397 AIN-76A PLX-33970
200
400
600Saline
LPS
WT G2019S
*
TH
+ N
eu
ron
s

127
Figure 5.3: Stereological TH+ cell counts revealed a significant los of dopamine neurons in all
mice treated with LPS and paraquat over the experimental timeline (p<0.01), irrespective of
genotype or PLX-3397 treatment.
LPS and paraquat treatment increased microglial activation, as does the LRRK2 G2019S
genotype and this treatment effect is reduced by PLX-3397 administration.
Microglial morphological state (as an index of activation) was assessed by
immunofluorescent IBA-1 staining by a blind rater using a validated microglial rating scale [50].
As expected, the LPS and paraquat exposure significantly increased microglial morphology ratings
(F(1,35)=15.692, p<0.001) (Figure 5.4). Most strikingly however, the LRRK2 G2019S mutant
mice had very marked microglial changes and this was evident even in the absence of the toxin
treatments (F(1,35)=12.320, p=0.001) (Figure 5.4). Pre-treatment with PLX-3397 did
significantly blunt the microglial ratings, however, this effect was admittedly modest
(F(1,35)=4.527, p<0.05) (Figure 5.4).

128
Figure 5.4: Morphological analyses using a microglial rating scale found that LPS and paraquat
combination treatment increased microglial cell morphology in the SNc, the G2019S mutation
was also found to significantly enhance microglial activation; however the effect was blunted in
mice pretreated with PLX-3397.
Microglial Scoring
AIN-76A PLX-3397 AIN-76A PLX-33970
1
2
3
4Saline
LPS
WT G2019S
Mean
Sco
re***
***
******
***

129
LPS and paraquat combination treatment increases circulating corticosterone and
cytokines.
All mice treated with LPS and paraquat, irrespective of genotype or PLX 3397 treatment,
displayed a similar magnitude and statistically significant rise in circulating corticosterone
(F(1,38)=12.775, p<0.001) (Figure 5.5A). Animals treated with LPS and paraquat were also
found to have elevated levels of the pro-inflammatory cytokine, IL-6 (F(1,39)=4.793, p<0.05)
(Figure 5.5B) and again, there was no effect of either genotype or PLX 3397. In contrast, the anti-
inflammatory cytokine, IL-10, was unaffected by LPS and paraquat but was significantly elevated
in the G2019S mutant mice (F(1,39)=8.066, p<0.01) (Figure 5.5C). No statistically significant
differences were detected in circulating TNF-α; however, a modest non-significant rise was
detected in the LPS and paraquat treated groups (F(1,39)=2.877, p=0.09) (Figure 5.5D).

130
Figure 5.5: Blood plasma levels of circulating factors were analysed using ELISA and Luminex
multiplex technology. The LPS and paraquat treatment resulted in increased levels of
corticosterone (A) and IL-6 (B) and this was similarly evident in wild type (WT) and G2019S
mutants. The G2019S KI increased levels of IL-10 (C), however, no statistically significant effects
were found in TNF-α levels (D; p=0.09). In no case did the PLX-3397 treatment induce any
significant changes. *p<0.05 compared to control animals.
PLX-3397 administration decreased levels of cell death markers and the fraktalkine receptor
while increasing levels of the anti-oxidant inducer SiRT3.
Levels of the fractalkine receptor, CX3CR1, caspase-1 and caspase-3 were all robustly
and significantly reduced by pre-treatment with PLX-3397 (Figure 5.6 A F(1,33)=23.179
IL-10
AIN-76A PLX-3397 AIN-76A PLX-33970
10
20
30
40
WT G2019S
*
pg
/ul
IL-6
AIN-76A PLX-3397 AIN-76A PLX-33970
500
1000
1500
2000
2500Saline
LPS
WT G2019S
*
pg
/ul
TNF-a
AIN-76A PLX-3397 AIN-76A PLX-33970
1
2
3Saline
LPS
WT G2019S
pg
/ul
Corticosterone
AIN-76A PLX-3397 AIN-76A PLX-33970
50000
100000
150000
200000
WT G2019S
pg
/ul
*
A B
C D
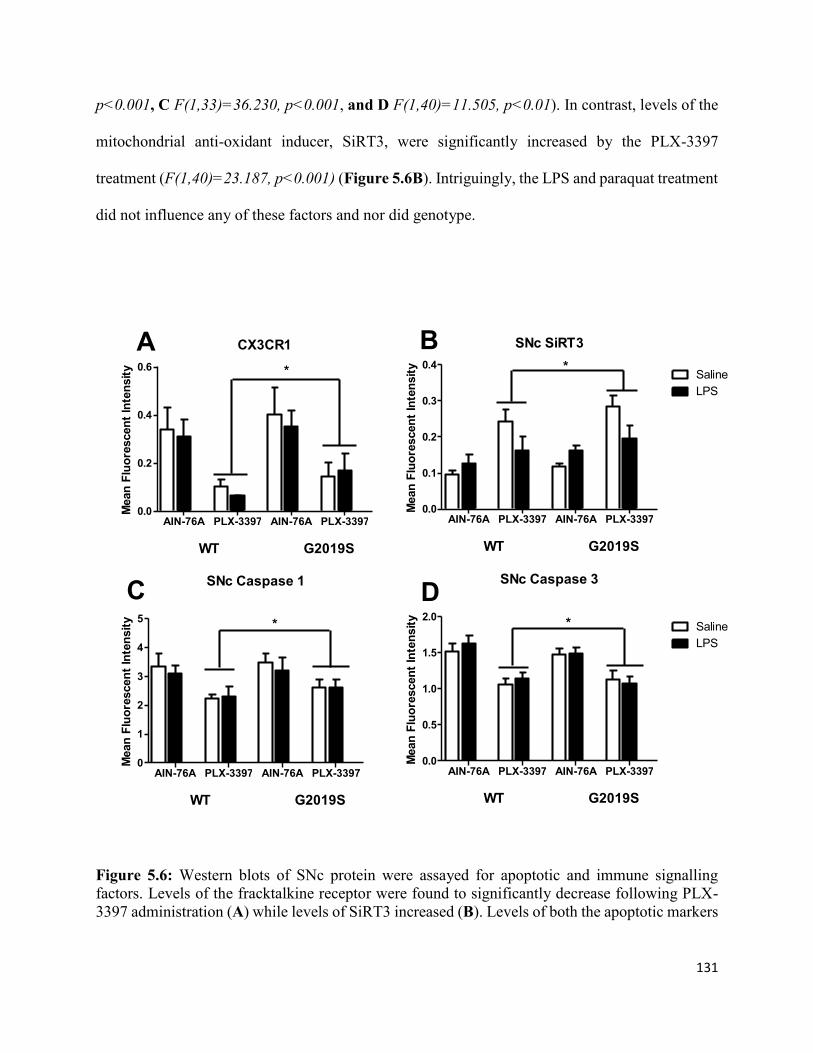
131
p<0.001, C F(1,33)=36.230, p<0.001, and D F(1,40)=11.505, p<0.01). In contrast, levels of the
mitochondrial anti-oxidant inducer, SiRT3, were significantly increased by the PLX-3397
treatment (F(1,40)=23.187, p<0.001) (Figure 5.6B). Intriguingly, the LPS and paraquat treatment
did not influence any of these factors and nor did genotype.
Figure 5.6: Western blots of SNc protein were assayed for apoptotic and immune signalling
factors. Levels of the fracktalkine receptor were found to significantly decrease following PLX-
3397 administration (A) while levels of SiRT3 increased (B). Levels of both the apoptotic markers
CX3CR1
AIN-76A PLX-3397 AIN-76A PLX-33970.0
0.2
0.4
0.6
WT G2019S
*
Mean
Flu
ore
scen
t In
ten
sit
y
SNc SiRT3
AIN-76A PLX-3397 AIN-76A PLX-33970.0
0.1
0.2
0.3
0.4Saline
LPS
WT G2019S
*
Mean
Flu
ore
scen
t In
ten
sit
y
SNc Caspase 1
AIN-76A PLX-3397 AIN-76A PLX-33970
1
2
3
4
5
WT G2019S
*
Mean
Flu
ore
scen
t In
ten
sit
y
SNc Caspase 3
AIN-76A PLX-3397 AIN-76A PLX-33970.0
0.5
1.0
1.5
2.0Saline
LPS
WT G2019S
*
Mean
Flu
ore
scen
t In
ten
sit
y
A B
C D

132
Caspase 1 (C) and Caspase 3 (D) were found to decrease following PLX-3397 treatment. In no
instance, did the PLX-3397 or genotype affect these outcomes.
Markers of astrogliosis are increased following LPS and paraquat administration while pre-
treatment with PLX-3397 led to further GFAP increases.
The astrocytic marker, GFAP, was significantly elevated within the SNc by the LPS-
paraquat treatment (F(1,33)=10.196, p<0.01) (Figure 5.7). Moreover, this effect was greater still
in the G2019S mutant mice Curiously, pre-treatment with the CSF-1 inhibitor, PLX-3397, also
resulted in increased in nigral GFAP levels and this was selectively observed in the G2019S
mutants (F(1,33)=9.228, p<0.01) (Figure 5.7).
Figure 5.7: Western blots probing for expression of the astrocytic marker, GFAP, found
significantly increased SNc levels following LPS and paraquat administration in both wild type
(WT) and G2019S mutants. Interestingly however, this marker was also increased by PLX-3397
administration but this effect appeared to be confined to the G2019S mutant mice **p<0.01
compared to WT control animals.
SNc GFAP
AIN-76A PLX-3397 AIN-76A PLX-33970
5
10
15
20
WT G2019S
Saline
LPS
Mean
Flu
ore
scen
t In
ten
sit
y **
** ****
**

133
PLX-3397 administration leads to increased soluble alpha synuclein in the striatum.
Alpha synuclein levels were evaluated by both western blot and ELISA in order to
determine alterations in total and serially extracted protein in the striatum. Total alpha-synuclein
as assessed by western blot on RIPA-buffer extracted striatum samples showed significantly
elevated striatal levels following pre-treatment with PLX-3397 (F(1,33)=31.940, p<0.001)
(Figure 5.8A). Subsequent ELISAs run on serially extracted striatal samples found that the soluble
alpha synuclein proteins levels were increased following PLX-3397 treatment, but no significant
difference was observed for insoluble levels of the protein (F(1,33)=16.136, p<0.001 Figure
5.8B,C).

134
Figure 5.8: Total alpha Synuclein levels were quantified in the ipsilateral striatum via western
blotting (A) and were found to significantly increase with PLX-3397 treatment. The same region
was also extracted with a detergent free and SDS containing buffer and soluble and insoluble levels
of alpha-synuclein were analysed via ELISA (B,C) and found that soluble alpha synuclein
increased in PLX-3397 treated animals while insoluble did not. ***p<0.001 compared to AIN-
76A control animals.
Total Alpha Synuclien
AIN-76A PLX-3397 AIN-76A PLX-33970.0
0.5
1.0
1.5
2.0Saline
LPS
WT G2019S
***
Mean
Flu
ore
scen
t In
ten
sit
y
Soluble Alpha Synuclien
AIN-76A PLX-3397 AIN-76A PLX-33970.00
0.05
0.10
0.15
WT G2019S
***
Alp
ha S
yn
uclie
n (
ng
/ug
)
Insoluble Alpha Synuclien
AIN-76A PLX-3397 AIN-76A PLX-33970.00
0.02
0.04
0.06
0.08
WT G2019S
Saline
LPS
Alp
ha S
yn
uclie
n (
ng
/ug
)
A
B C

135
Discussion
PD results from the highly complex interaction between environmental insults and
underlying genetic vulnerabilities. Despite late symptom onset, there is strong evidence supporting
the idea that the pathophysiology of PD may develop over a number of years with a long prodromal
phase [1, 387], which of course could provide time for intervention when appropriate mechanisms
are targeted. While the precise pathophysiology of PD has not yet been fully elucidated, it is now
commonly accepted that immune cells (e.g. microglia) play a very important role in promoting the
degeneration of SNc dopamine neurons [40, 59, 388]. Microglia are a unique cell derived from
primitive yolk-sac macrophages and engage both neuroprotective and inflammatory processes to
maintain homeostasis [389]. During their normal surveillance state, these cells have highly
ramified processes that constantly monitor their environment and upon activation undergo
structural changes that allow for responses to the potential insult [390]. However, it has been
posited that in PD the homeostatic balance of microglial cells is shifted towards an inflammatory
phenotype which contributes to the cell death of dopamine neurons in the face of driving factors
[391]. Further, accumulating evidence implicates the LRRK2 gene, most likely in conjunction with
environmental stressor exposure, as playing a role in shaping the inflammatory milieu present in
PD [80, 99, 100]. Indeed, besides familial PD, the G2019S LRRK2 mutation may be a
vulnerability factor for the idiopathic form of the disease. Moreover, LRRK2 was found to be
present in high levels in peripheral lymphocytes and monocytes of PD patients [392] and LRRK2
mutation provoked a peripheral innate interferon cytokine response that was related to enhanced
brain inflammation in response to LPS [278].
To assess the role of microglia and LRRK2 in PD we transiently depleted microglia via
pharmacological inhibition of the colony stimulating factor-1 receptor, using PLX-3397, in the

136
context of LPS plus paraquat exposure in G2019S LRRK2 mutants and wild type littermates. We
presently found that microglial depletion at the time of intra-SNc LPS infusion did indeed block
the sickness, weight loss and mortality, which was in fact, most prominent in the LRRK2 G2019S
mutant mice. Likewise, the reduced home-cage activity that was apparent following the paraquat
regimen in the G2019S mice was also blunted in PLX-3397 treated mice. The PLX-3397 treatment
was also associated with marked changes in several signaling factors within the SNc, including
Sirt3 and caspases 1 and 3, as well as CX3CR1 and it also increased soluble levels of a-synuclein.
However, the PLX-3397 pre-treatment did not influence the loss of SNc dopamine neurons that
was provoked by LPS and paraquat administration. Similarly, the G2019S knock-in mutation also
did not influence neuronal loss. The G2019S mutation did however influence microglial
morphological state and interestingly, this was blocked by the previous PLX-3397 treatment.
This work was primarily guided by two hypotheses: 1. Depleting microglia at the time of
initiation of a dual hit LPS-paraquat regimen would prevent PD-like pathology and conversely, 2.
That the G2019S knock-in mutation would augment PD-like pathology. It is important to
underscore that microglia are only transiently depleted at the start of the experimental treatments,
such that at the time of LPS infusion there should be <<10% remaining and hence, few TLR4
bearing cells for LPS to actually stimulate. During the subsequent week and a half of paraquat
exposure, the microglia will be expected to be re-populating. Based on previous studies re-
population beings as early as 3 days and is complete sometime between 7-14 days [385],
suggesting that the repopulation process should be almost complete by the time of sacrifice. This
allows for evaluation of the very novel questions as to whether the neurodegenerative process is
altered in the face of a depleted microglial population that is undergoing renewal. One study that
was recently published using MPTP found that PLX-3397 treatment prior to (for 3 weeks) and

137
during the entire toxicant injection period (7 days) actually resulted in augmented neurotoxicity
with an increased loss of SNc dopamine neurons [393]. Interestingly, increased infiltration of
circulating leukocytes and pro-inflammatory cytokines were also observed with the 4 weeks of
PLX-3397 treatment (and MPTP treatment) [393]. This suggests that a peripheral inflammatory
signal may have been recruited in the face of microglial depletion, perhaps through astrocytic
intervention. Yet, it is important to underscore that microglia repopulation itself following PLX-
3397 appears to stem from local microglial progenitor cells and not infiltrating peripheral bone
marrow derived monocytes [385, 394]. It is also important to note that PLX-3397 does not
appreciably deplete peripheral macrophages or other immune cells, but is relatively selective for
microglia [395]. This contrasts with older viral based studies that used intracerebroventricular
ganciclovir treatment in CD11b-HSVTK mice, which concluded that microglia were re-populated
from peripheral monocytes [396].
The few recent studies that have assessed microglial repopulation following PLX-3397
have remarkably found that re-populating microglia are largely normal in physiology and
functional phenotype [385]. That said, there are obvious morphological differences (including
larger cell bodies) at intermediate stages before the re-population is complete [385]. Further,
cortical microglia were found to display reduced branching complexity of processes at 14 days,
but return to normal by 21 days. Yet, microglia appear to be less capable of re-population following
repeated episode of depletion [397]. Hence, although these are extremely plastic cells, there do
appear to be limits to their long-term resilience. Further consideration should be given to the fact
that microglial re-population may also vary as a function of brain region as differences in re-
population rate and morphology were reported with the hippocampus and cortex [385]. For
instance, while microglial re-population was complete in hippocampus after 14 days, it took 21

138
days to be fully restored in the prefrontal cortex [385]. Furthermore, the morphology of re-
populated microglia appeared to vary between brain regions, with the average diameter of
microglial processes increased in the hippocampus but not the cortex [385].
While the mediators of microglial reactivity to immune priming are not clear, we
hypothesize that LRRK2 plays a critical role favoring an enhanced inflammatory state. Indeed,
among the alleles implicated in PD, polymorphisms in the gene LRRK2 are the most common and
its incomplete penetrance (~30–70%) suggests a role for environmental and/or immune factors as
“triggers” [73, 398]. While rapid-acting toxin-based models of PD such as MPTP and 6-OHDA
have been extensively utilized in the context of LRRK2, relatively little work has yet examined
more etiologically relevant models such as paraquat which act over time and with a less virulent
lesion but more comprehensive range of PD-like pathology. Moreover, LRRK2 mutations were
previously reported to enhance microglial reactivity and pro-inflammatory cytokine production in
the brain and periphery [399–401]. In agreement with these findings, we did presently observe that
G2019S knock-in mice had microglia morphology consistent with an “activated” state and this
was evident even in the absence of the toxin treatments. Curiously, the G2019S mice also had
basally elevated circulating IL-10 levels, but not that of pro-inflammatory cytokines (IL-1b, IL-6
or TNF-a). Although this finding seems paradoxical, it is consistent with a recent clinical trial that
also showed elevated serum IL-10 levels in PD patients [131]. Of course, timing of sacrifice could
influence the nature of cytokine changes observed, but since IL-10 is often observed much later
than the initial pro-inflammatory cytokines following LPS challenge, this might reflect a shift
towards a protective anti-inflammatory phenotype [402]. Indeed, viral or osmotic minipump
facilitated administration of IL-10 has been reported to protect against LPS or 6-OHDA induced
PD-like pathology, including neuronal loss and inflammatory state [403, 404].

139
It is especially intriguing that while the changes in microglial morphology in wild type
mice corresponded well with the loss of SNc dopamine neurons, this clearly was not the case in
the G2019 mutants. Unlike their wild type littermates, G2019S knock-in mice had microglial
morphology that was indicative of an “active” state irrespective of LPS and paraquat treatment
and furthermore, PLX-3397 treatment reversed this effect. This suggests that G2019S mutation
might (1) basally impart a change in microglial phenotype and (2) that such changes are not
primarily involved or at least not causative in the SNc neurodegenerative processes. This is
actually in keeping with a recent report that found that G2019S mutant rats that were LPS treated
had progressive long-term neuroinflammatory changes in the absence of any loss of SNc dopamine
neurons [405]. Hence, it is possible that G2019S mutation promotes an alternatively activated
microglial state (possibly IL-10 mediated) that is dissociable from that induced by LPS and
paraquat.
A further layer of complexity but one which is exciting, is the fact that since the PLX-3397
treatment was stopped the day after the LPS infusion, any microglia sampled at the time sacrifice
(i.e. 11 days following cessation of PLX-3397 treatment) would have been new re-populating
microglia. These new microglia (no more than 11 days old) were obviously differentially affected
in the two genotypes. Indeed, the PLX-3397 treatment currently ablated the elevation in microglial
morphology evident in G2019S mutants, while having no effects in wild type mice. Conceivably,
G2019S could be modulating aspects of microglia that are more amendable to CSF-1 inhibition or
alternatively, could be causing phenotype changes distinct from that induced by the LPS-paraquat
toxin treatments. It is also possible that the G2019S mutation may have affected the microglial
phenotype by modulating its re-population lifecycle. Indeed, the depletion and re-population
processes itself could be important since it was in fact reported that re-populating microglia

140
initially expressed signs of an “activated” phenotype. Specifically, these microglia had increased
expression of 196 genes, with many being pro-inflammatory cytokines (e.g. IFN-g), signaling
factors (e.g. JAK-STAT) and pathogen detection factors (e.g. TLRs) [394, 397].
In summary, we found that G2019S augments behavioral but not the neurodegenerative
effects of LPS and paraquat treatment and similarly, that microglial depletion prior to toxin
exposure blunts the behavioral toxicity but not the loss of dopaminergic neurons. Both the G2019S
mutation and initial microglial depletion elicited complex effects upon microglial morphology,
along with numerous changes in the SNc inflammatory and pro-death factors. Also, of particular
note was that microglial depletion elevated levels of soluble a-synuclein in the striatum, which
could reflect deficiencies in phagocytic clearance mechanisms obviously stemming from a loss of
microglia and supported by our finding reduced CX3CR1 levels. Finally, elevated circulating
levels of the stress hormone, corticosterone, and inflammatory cytokine, IL-6, is consistent with
general distress induced by LPS and paraquat but this was unaffected by PLX-3397 treatment or
G201S mutation. Yet, the G2019S mutants had elevated basal IL-10 levels. These data collectively
support the contention that microglia are fundamentally critical for sickness and behavioral
changes in response to inflammatory-toxin exposure, but not for the neurodegenerative response.
It is also clear that the G2019S mutation has complex effects on the inflammatory milieu but is not
necessarily a causative factor in PD-like pathology in the face of environmental stressors.

141
Chapter 6:
General Discussion
142
Over the past few decades it has become generally accepted that Parkinson’s disease is the
result of interactions between genetic vulnerabilities and exposure to environmental toxicants over
an individual’s lifespan. Relatively recent work has focused on characterizing genetic
vulnerabilities for PD, including the LRRK2, VSP35, PINK-1 and DJ-1 genes which have lower
penetrance rates than dominantly inherited genes [406]. The data garnered from these studies has
been used to inform larger epidemiological research such as investigations into the effects of
pesticide use amongst agricultural workers as well as elucidating potential mechanisms through
which interactors may influence penetrance [331, 333]. These studies, conducted in human
populations, rodent models and in vitro work have implicated a variety of heavy metals, pesticides
and infectious agents as common mediators of disease penetrance [48, 228, 271]. The goal of the
current thesis was to further assess how environmental toxicants may influence genetic penetrance,
aging and immunity in the context of Parkinson’s disease. The findings presented over the previous
four chapters provide a significant contribution to the understanding of the effects of age on
environmental toxicant exposures, as well as demonstrating that alterations in gut microflora or
microglial populations alone are not enough to prevent dopaminergic degeneration and microglial
activation in our PD models.
Chapter two investigated the impact of the environmental PD-linked toxicant, paraquat,
over the course of six months following exposure in order to validate whether dopaminergic
neuronal loss is progressive or stable and to investigate the activation of inflammatory and stressor
linked pathways associated with the model. Chapter three aimed to investigate the role of
microbiota alterations in the genesis of PD by combining the paraquat toxicant based model with
a probiotic or dysbiotic manipulation of the gut. Chapter four sought to then understand how age
and environmental toxicants interacted with the most common PD mutation, LRRK2 G2019S and

143
Chapter five further investigated the role of the LRRK2 G2019S mutation by temporarily depleting
microglial populations during toxicant exposure (LPS and paraquat).
These experiments used the etiologically relevant herbicide, paraquat, to examine
interactions between various factors implicated in the development and progression of PD
including the LRRK2 gene, the gut microbiota and age. Specifically, we found that sub-chronic
paraquat administration provoked long-lasting neurochemical and neuroimmune alterations as
well as resulted in a permanent loss of SNc dopaminergic neurons (chapter 2). These alterations
when combined with LPS and gut alterations resulted in relatively few interactions between the
LPS-paraquat treatment and the gut dysbiosis (chapter 3). Turning to the effects of paraquat on the
most common LRRK2 mutation, G2019S, we found basal alterations in stressor related pathways
but no neuroimmune alterations (chapter 4). Investigating a different genetic model with the
G2019S mutation we found enhanced basal immune activation in G2019S mice as well as
confirmed the neurodegenerative impacts of LPS and paraquat. Interestingly, the G2019S knock-
in mice were especially vulnerable to the toxic behavioural effects of the toxicant treatment but
were not further vulnerable to the loss of dopamine neurons than wild type mice. Finally, the CSF-
1 inhibitory drug, PLX-3397, revealed that temporary depletion of microglia prevented the
behavioral effects of LPS but did not influence the neurodegenerative effect of subsequent
paraquat exposure (chapter 5). In all four of these data chapters (which are to be submitted for
publication shortly), we find novel changes in inflammatory, oxidative, apoptotic and hormonal
stress factors that could provide important clues for future PD therapeutic targets.
From the present data, it is not entirely clear how environmental toxicants and alterations
in the gut microbiome and inflammatory milieu may contribute to PD or interact with genetic
vulnerabilities such as LRRK2 mutations. However, we have identified several mechanisms that

144
may potentially play a role. 1) microglial phenotype, 2) peripheral immune factors and 3) immune
senescence.
Microglial phenotype alterations
As discussed previously, a growing body of evidence has strongly supported a role for
microglial activation in the death of dopaminergic neurons in the SNc [59, 128, 401]. Based on in
vitro experiments, this process appears to be mediated through direct cell to cell contact between
microglia and neurons and on the activation state of microglia, as well as the intrinsic vulnerability
of dopamine neurons [35, 301, 407]. While the selective vulnerability of TH+ cells in the SNc to
oxidative stressors and immunogens has been established, toxicant exposure and interactions to in
vivo microglia has been less well studied. Stereotypical activation of microglia is readily achieved
following acute LPS treatment in both culture and animal experiments [150, 408, 409]. These
activated microglia adopt a drastic phenotypic shift, wherein they adopt an amoeboid-like cell
body and release pro-inflammatory and oxidative factors. In addition, they may directly interact
with neurons and engulf and then phagocytose them [407]. This activation state essentially ranges
along a gradient from completely ramified and protective to amoeboid and reactive depending on
extrinsic interaction as well as internal expression of proteins. Previous work in our laboratory has
hypothesized that this activation is detrimental to local dopamine neurons and that even small
insults can synergistically interact with activated microglia to produce enhanced neuronal loss [48,
50]. A central tenant of this hypothesis is that continued activation of SNc microglia will, over
time, lead to increasing activation or death and may underlie the extensive prodromal phase of PD.

145
Microglia populate the SNc at a particularly high concentration relative to the rest of the
CNS and previous research has reported that these cells are especially reactive to exogenous insults
[301, 410]. It is important to further understand the exact mechanisms driving SNc vulnerability
and the findings of this current thesis examine a range of toxicants and aggravating factors on
these microglia and add to the existing evidence that microglial processes contribute to PD.
Importantly, our data also show the importance of cellular and immune senescence in PD and
suggest that more disease relevant results may be generated from models using aged animals or
those occurring over extended periods of time.
In order for microglia to become activated they must actively rearrange their actin
cytoskeleton to withdraw processes and migrate. Indeed, microglia are believed to first alter their
morphology before they are capable of phagocytosis and release reactive oxygen species [411–
413]. One factor that our group has implicated in this process of morphological re-modelling is
WAVE2, a protein in the ARP2/3 complex that serves to regulate the rearrangement of F-actin
[414]. However, the literature available on the role of WAVE2 in immune responses is very sparse.
Data being prepared for publication in our lab has shown that WAVE2 is a downstream target of
LRRK2. Indeed, we found that genetic knockout of LRRK2 prevented the morphological and
oxidative stress response in microglia [415]. We also found viral overexpression of WAVE2
restored the normal microglial inflammatory response in LRRK2 knockout mice, further
supporting a role for WAVE2 in this response. In the current thesis, we found that paraquat
treatment caused lasting increases in SNc levels of WAVE2 and this was concomitant with an
increase in microglial activation state (chapter 2). This same finding was replicated following LPS
and paraquat treatment in our microbiota study, again concomitant with increases in microglial
activation (chapter 3).
146
Our G2019S mutant mice had basally increased levels of WAVE2 in the striatum, as well
as greatly increased microglial activation. Interestingly, however, WAVE2 levels were not altered
in the SNc of these mice, suggesting brain-region specificity (data not shown). Previous work from
the lab of Dr. David Park found that in vitro levels of WAVE2 were also basally increased in
G2019S knockin microglia and bone marrow derived macrophages (BMDMs) and conversely, that
microglia from LRRK2 deficient mice displayed diminished WAVE2 levels [99]. Given the
postulated role of microglia in PD, understanding the interactions through which these WAVE2
levels are altered may provide new insights into early disease progression. In this thesis we
demonstrated that paraquat and LPS paraquat increased levels of WAVE2, however,
understanding its activation and expression in different models remains important for moving
forward with viable focused anti-inflammatory treatment strategies.
A primary goal of this thesis was the further understanding of microglial phenotypes with
environmental toxicant exposure, as well as the role of other factors including senescence, LRRK2
and the gut microbiota. In chapter 2 we examined the effects of age following exposure to paraquat
and found that microglial activation persisted months after treatment stopped. This underlies the
importance of microglial activation in neurodegenerative disease such as PD and Alzheimer’s,
where degeneration is thought to occur over long periods of time. We further observed that six
months after treatment, when mice were approximately 9 months of age that microglia activation
was increased in the absence of toxicant exposure. This has been previously reported, with
increasingly aged microglia adopting a more activated phenotype and expressing more pro-
inflammatory factors, and these cell deficits in their ability to clear debris and combating foreign
invaders [416, 417]. Speaking to this, we found that levels of the fracktalkine receptor (CX3CX1)
decreased following paraquat treatment as well as over time (chapter 2). In the CNS, fracktalkine

147
(CX3CL1) is primarily released by neurons, which then engages the receptor which is selectively
expressed on microglia [31, 340]. This signalling is thought to be key for downregulating activated
phenotypes in microglia. Indeed, activation of CX3CR1 on the microglial membrane has been
shown to prevent the induction of pro-inflammatory cytokine production in response to LPS [418,
419]. In human patients with AD, levels of CX3CL1 have been found to be significantly reduced
in the CSF but not the blood plasma, indicating that CX3CL1 expression in the CNS differs from
peripheral signalling [420]. While we did not assess CX3CL1 expression, we did measure its
CX3CR1 receptor. In our transgenic G2019S mutants we saw no alterations with genotype or toxin
treatment (chapters 4 and 5). Interestingly, the depletion of microglia through CSF-1 blockade by
PLX-3397 did result in a marked reduction in CX3CR1 levels in repopulating microglia. While
we initially thought that temporary microglial depletion would result in repopulation of naïve
microglia that might actually be neuroprotective, we actually did not observe this. In fact, the
decrease in CX3CR1 observed in the microglia suggests that these repopulated microglia may in
fact be more reactive over time as opposed to less. Whatever the case, it appears that
CX3CL1/CX3CR1 signaling is disrupted following exposure to environmental toxicant and
further research investigating how these receptors are lost and what may increase their expression
will be of great importance.
Neuronal Vulnerability
In addition to microglial alterations, SNc TH+ neuronal loss is likely also induced by
alterations of protective signalling pathways that impart vulnerability. Two such factors are the
sirtuin family proteins, SiRT3 and SiRT6. Sirtuins are histone deacetylases which depend on
activation by nicotinamide adenine dinucleotide (NAD+) which binds them directly to cellular

148
metabolism [421]. As such, these proteins play a role in the regulation of the electron transport
chain, stress response and cell death processes [421]. SiRT3 in particular has previously been
found to play a role in senescence and inflammation [422, 423], and additionally interacts with
alpha synuclein mutations [424, 425]. One of the main outcomes of SiRT3 expression is the
promotion of increased levels of the powerful anti-oxidant, SOD2 [426], and additionally has also
been linked to increasing levels of FOXO3a and PINK-1 [427]. Interestingly, SiRT6, which also
has a role in DNA repair, metabolic homeostasis and TNF-α release, has been found in increased
levels in PD brains and is downregulated by nicotine consumption, potentially mediating the link
between smoking and reduced PD risk [428–430]. In chapter 2 we found that SiRT3 levels were
reduced and remained depressed for six months following paraquat administration. In chapter 3
we found levels of SiRT3 were not impacted by LPS paraquat or DSS/VSL#3 treatment (data not
shown); however, microglial depletion via PLX-3397 administration increased levels in chapter 5.
These data appear to show that SiRT3 levels may be altered in the long-term by environmental
toxicant exposures and an involvement of microglia in perhaps altering neuronal vulnerability by
virtue of deficits in antioxidant defences.
Environmental factors and continuing insults as a mediator of PD
Overall our findings continue to support a role for environmental factors in the genesis of
PD, however, they support a model of additive rather than synergistic risk enhancements and
suggest that timing of various environmental insults may be important for disease state. One of the
most popular research streams currently is the influence that the gut microbiome has on disease
state. While there is much evidence accumulating and dozens of papers being published, relatively
few are seeking to modulate the gut directly or to examine the microbiota in animal models of

149
neurodegeneration. One reason behind this may be the costs and associated with a full microbiome
sequencing and the care with which samples and animals must be handled to reduce the
introduction of foreign bacteria, while another may be that there is less interest as the human gut
microbiota composition is different from that of the mouse and indeed, even facility to facility and
between strains there are large differences [431]. Despite this, it remains important to investigate
potentially deleterious effects in animal models to inform future human studies. In chapter 3 of the
current thesis we investigated the potential effects of a pro-biotic and a dysbiotic agent on several
systems in a mouse model of PD.
While we found relatively few effects of pre-treatment with the probiotic VSL#3 on our
PD model, we found robust effects with our dysbiotic agent DSS. One of our key findings was that
our LPS and paraquat model of PD did not influence the gut microbiota composition in anyway,
suggesting that gut immunity may be isolated from the CNS and circulation through microbiota-
specific priming mechanisms. DSS did cause lasting microbiota alterations and increased the
inflammatory status of the gut as measured by TNF-α and IL-1B mRNA production in the colon
(chapter 3). These effects further potentiated the alteration of circulating LCN2, a neutrophil
activation marker, and pro-inflammatory cytokines demonstrating that immune responses in the
gut can further affect other components of the immune system. In the CNS we observed microglial
activation in LPS and paraquat treated animals, as well as basally greater activation in DSS treated
animals, however, this did not appear to impact SNc TH+ cell loss. Our results suggest that
alteration of the gut microbiota to pro-inflammatory state can have consequences for immune
activation in the CNS. Although we were unable to show whether this had functional interaction
with our model of PD, it is possible that over our short time course we observed TH+ cell loss
linked closely to direct paraquat toxicity rather than microglial driven neurodegeneration. Further

150
work investigating the long term effects of gut dysbiosis on murine PD models may clarify the
role the gut plays in the CNS.
Building on this idea, our results from chapter 2 where we found that elevated microglial
activation persisted for months following paraquat administration and that changes in molecular
pathways including anti-oxidants (SiRT3), immune activation (NF-kB ratios) and phagocytosis
(MFG-E8) arose weeks to months past paraquat cessation support a potentially distal critical period
for toxicant interaction. In chapter 3 we were the first to investigate the combination of DSS with
an environmental toxicant model of PD in mice, although, DSS was previously investigated in a
genetic model of PD through the Michael J. Fox foundation which found altered glial activation
but did not publish their full results. Our current data combined from chapters 2 and 3 suggests
that a more representative model of human PD could arise through the use of multiple
inflammatory hits temporally separated. Our key finding in chapter 3 was that peripheral
inflammation and alteration of the gut microbiota was able to substantially increase CNS
microglial activation, although, this did not mediate SNc TH+ neuronal death. Previous work in
our lab examining the effects of this “priming” in the CNS found that the optimal timepoint for
interaction was 48 hours following intra-SNc LPS administration [48]. These current data suggest
that different toxins may interact with the aging immune system and lead to lasting alterations
which could theoretically increase TH+ cell vulnerability and microglial sensitivity later in life.
LRRK2, microglia and inflammation
LRRK2 mutations are the number one genetic risk factor for PD [406]. These mutations
have arisen independently at least three times and have been found in multiple studies to alter

151
inflammatory responses, perhaps protectively in the short-term [74, 399, 405]. In this current thesis
we investigated two different LRRK2 G2019S mutant models, the first a transgenic overexpression
of human LRRK2 G2019S protein (chapter 4) and the second a physiological knock-in of the
G2019S mutation (chapter 5). Our experiments in chapter 4 found no evidence of altered
inflammation in G2019S overexpressing mice, however, we did observe a series of stressor-related
effects. These findings line-up with reports that these mice and their bacterially transfected
G2019S overexpressing counterparts do not show inflammatory alterations [368]. Interestingly,
our stressor linked findings were replicated in another overexpressing model [339], suggesting that
overexpression of LRRK2 may play a role in some of the co-morbid features of PD, such as
depression and anxiety. Following these findings using the more physiologically relevant G2019S
knock-in mice in chapter 5, we found that these animals had a heightened vulnerability to sickness,
weight loss and had decrease survival following LPS and paraquat treatment. This matches data in
LRRK2 knockout animals previously exposed to paraquat which demonstrated protection from
these same factors after exposure to either paraquat [298] or LPS and paraquat [415]. Additionally,
these G2019S knock-in mice showed basally increased microglial activation, reinforcing the
previous findings showing altered microglial motility, ROS production, and cytokine production
[82, 100, 399]. Overall the findings of these two studies demonstrate that LRRK2 modulates
microglial phenotype and CNS inflammation and levels and expression pattern of LRRK2 may be
potentially more important.
In chapter 5 we additionally examined how pre-treatment with the CSF-1 inhibitor PLX-
3397 would influence inflammatory responses and the LRRK2 G2019S mutation. PLX-3397 can
be administered orally [385]. Acute administration leads to decreased immune responses in both
peripheral macrophages and microglia while extended administration depletes microglia in the

152
CNS [385]. This depletion is transient and following cessation of PLX-3397 treatment microglia
repopulate with 7-14 days [385]. We found that PLX-3397 treatment prevented behavioural (LPS
and paraquat induced) and neuroinflammatory consequences of the LRRK2 G2019S microglia,
however, it did not prevent TH+ cell loss in the SNc. One other manuscript has so far examined
PLX-3397 with a PD model. In their 2018 paper Yang et al. found that PLX-3397 treatment
exacerbated the neuroinflammatory and neurodegenerative effects of MPTP treatment [393].
Using flow cytometry they found that while microglia were depleted by CSF-1 inhibition,
recruitment of peripheral immune cells into the CNS was increased. Taking this further, they
repeated the experiment in a Rag2 KO mouse (lacking B and T cells), and still found increased
damage following MPTP and PLX-3397 treatment. This was determined to result from increased
pro-inflammatory cytokine expression in astrocytes [393]. Indeed, in our own experiment we saw
that both LPS plus paraquat and PLX-3397 led to increased GFAP expression (chapter 5), a protein
commonly used as a marker of astrocytes [432, 433]. In an inflammatory state known as A1,
astrocytes can surround damaged tissue and induce neuronal death [434, 435]. This state is
typically induced through concomitant microglial expression of IL-1α, TNF-α and the complement
protein, C1q [436]. It is possible that recruited peripheral immune cells responding to the LPS or
paraquat treatment express higher levels of these cytokines, or alternatively, that repopulation of
microglia during paraquat treatment induces the release of these same cytokines. While we clearly
observed this effect in chapter 5, it is likely that to some extent astrogliosis and conversion to an
A1 phenotype is occurring across our models. Indeed, normal aging alone has been shown to alter
the state of these astrocytes [437]. Further, a recent paper from John Hopkins School of Medicine
found that blocking the conversion of astrocytes to an A1 phenotype prevented SNc TH+ cell loss
in an α-synuclein fibril model of PD [435]. Given the multitude of potential PD therapies, that

153
typically target a single disease processes, have failed, it is increasingly important to examine
models of PD using a more holistic approach involving multiple cell types to determine the full
set of interactions that may be contributing to TH+ cell death.
Peripheral Immune Factors
Parkinson’s disease is typically considered a motor disease originated in the CNS and
having peripheral effects. One key hypothesis currently under exploration is the Braak hypothesis
which concerns the generation of α-syn aggregates in the gut or periphery which then spreads to
the CNS in a prion-like fashion [134]. Various models and studies exist employing α-syn as a
causative agent in PD, and yet, clear data does not yet exist as to whether α-syn drives the genesis
and progression of sporadic PD or whether it is a secondary dysfunction in PD patients without
SNCA mutations [116, 134]. Whether α-syn is responsible for the disease state or not, many papers
using a variety of models, including our own LPS and paraquat toxicant models, suggest that the
peripheral immune system plays a vital role [20, 48, 50, 137]. Environmental toxicants are known
to increase the risk of developing PD [3, 15, 34, 56], and one obvious mediator between the
environment and the CNS is the immune system. While environmental toxicants could potentially
enter the body through a variety of routes, the most likely culprits are through the lungs,
inhalational, and the gut, ingestion. Previous reports have implicated the gut microbiome as
important mediators of α-syn pathology through the use of α-syn transgenic germ-free mice,
demonstrating that reduction of gut microbiota reduces pathology while the bacteria from the guts
of PD patients enhances it [20]. Preliminary data in human patients further supports the role of the
gut, although, the exact mechanisms through which alterations effect the CNS are not yet known
[207, 208]. In chapter 3 we demonstrated that alterations in the gut microbiota induced by DSS

154
treatment led to exacerbated CNS immune activation and enhanced circulating immune factors.
While we did not attempt to explore the role of the vagal nerve in our model, circulating factors
present another route that both the inflammation in the lungs or the gut may affect the inflammatory
milieu in the CNS.
Peripheral injections of the immune stimulant LPS have been shown to induce robust and
lasting neuroinflammation [405, 438]. These stimulants increase the circulating levels and
activation of both adaptive and innate immune cells in the periphery. Indeed our gut dysbiosis
experiment showed that DSS treatment could robustly increase circulating neutrophils (chapter 3).
When activated these cells secrete pro-inflammatory cytokines such as IL-6, TNF-α, IFN-y and
IL-1B [439, 440]. These cytokines serve to recruit further immune responses and have been shown
to not only cross the BBB into the CNS, where they may activate microglia, but also can disrupt
the BBB allowing for increased infiltration of peripheral immune cells [441, 442]. Interestingly,
other data have found that cytokine administration alone can provoke microglial activation [443]
and work in our own lab has demonstrated that some of these cytokines are required to mediate
TH+ cell death following environmental exposures [236]. In the course of this thesis we examined
circulating cytokines in chapters 2, 3 and 5. In all cases we found evidence of increased cytokine
expression, notably IL-6, in our paraquat or LPS paraquat treated animals. Human data has also
implicated higher circulating pro-inflammatory cytokines with increased symptom scores in PD
patients [444]. One issue with using cytokines as a bio-marker for PD is that they can become
upregulated from many sources including acute illness, stress, infection or other degenerative
diseases [445–447]. When considering PD as a neurodegenerative disease resulting from
environmental interactions over a period of years, the role of peripheral immune factors in the
blood and gut is especially important. Alterations in these systems from daily exposures likely

155
leads to modest immune increases which could either prime microglia as previously reported in
our lab [48] or prevent return to a homeostatic state following larger insults. Either of these two
routes may lead to increased oxidative stress in the SNc, a region already shown to house both
increased concentrations and activated microglia as well as vulnerable cell populations [35, 301].
Immune Senescence
The greatest risk factor for PD and many other neurodegenerative diseases is age. During
the normal aging process a variety of systems alter leading to decreased bone density, decreased
anti-microbial immunity, slow wound recovery times and less control over malignant growths. In
addition to this natural aging process, a variety of mutations in anti-oxidant and immune proteins
has been linked to pre-mature aging as have chronic kidney and vascular diseases. Of particular
interest in PD is the role of immune cells in the aging brain both in a decreased protective role (ie
immune clearance) and as a source of increased oxidative stress. Immune senescence occurs in
both the innate and adaptive immune systems through different mechanisms. Given our interest in
PD we will focus on alterations specific to microglia and the innate immune system.
In human populations, RNA sequencing conducted on autopsy derived microglia found
that microglia extracted from aged individuals showed differential gene regulation from younger
individuals and that these alterations were prevented by the APOE e2 haplotype, a known
polymorphism which reduces risk of Alzheimer’s disease [235]. Relatively little is currently
known about the aging process in human microglial populations, however, fairly robust evidence
demonstrates multiple alterations in murine microglia [448–450]. One such alteration is in the
CX3CL1/CX3CR1 pathway. Both immune stimulation, ie LPS, and age have been shown to lead

156
to significant decreases of the CX3CR1 receptor [451]. This signalling pathway allows healthy
neurons to downregulate pro-inflammatory behaviour in microglia. Reduced CX3CL1 expression
in neurons is associated with a stressed state as are rapid releases. Reduction of CX3CR1 on
microglia increases the reactivity and pro-inflammatory factor expression but decreases the
sensitivity to neuronal distress. Indeed, we found even at the relatively young age of 9 months
C57Bl6 mice do demonstrate reduced CX3CR1 levels (chapter 2). Given previous work in which
we found older animals to be increasingly susceptible to paraquat administration [298] this
CX3CR1 decrease could play a role. It would be interesting to temporarily reduce CX3CR1 levels
in the absence of age or toxicant exposure to determine the contribution of CX3CL1/CX3CR1 to
immune alterations with age.
Peripheral immune cells including macrophages also undergo phentotypic alterations with
increased age. One such alteration common to both microglia and peripheral macrophages is
increased MHC2 expression, a protein responsible for presentation of phagocytized particles to
adaptive immune cells [452]. Additionally, these cells secrete basally increased levels of pro-
inflammatory cytokines [453] and do not respond as readily to anti-inflammatory signalling
through roteins such as CD200 [454]. Together, these factors indicate that aged microglia and their
peripheral counter-parts demonstrate a differential response to environmental toxicants and
immunogens. Classically, an idealized microglial response would be a rapid detection and
migration to site of insult followed by an increase in proinflammatory factors. Following this,
release of anti-inflammatory factors should return microglia to a resting state and allow for the
expression of cell growth and survival factors. Increasing evidence suggests that aged microglia
do not return to a fully resting state and may continue to secrete pro-inflammatory factors with the
potential to damage neuronal health [455]. Post-mortem studies of human patients with

157
neurological disease and murine models of neurodegeneration indicate that these aging processes
likely play a role in disease state [455].
In addition to this dysregulation of the CX1CL1/CX3CR1 pathway and alterations in other
microglial pathways, total numbers of both microglia and astrocytes have been found to increase
with age [456]. While astrocytes are not typical immune cells there is accumulating evidence that
suggests that under certain circumstances these cells can transition to pro-inflammatory states
leading to cell-death and the recruitment of other immune cells [59, 434, 435]. Interestingly, aging
alone leads to the same conversion of astrocytes from neuro-protective A2 phenotype to the
degenerative A1 [437]. Similar to microglia, these cells adopt a conformational change with
shorter, thicker processes [457], and, with age, begin to express proteins typically found in
microglia and innate immune cells including MFG-E8 (an opsin), MERTK (a component of
phagocytosis) and components of MHC1 amongst others [437]. Concomitant with this
morphological alteration, many papers have reported increased GFAP expression both in
individuals cells and as a percentage of astrocytes expressing the protein [437, 458, 459]. One
recent finding of particular interest is that astrocytic expression of the chemokine CXCL10, a
chemoattractant for peripheral immune cells, can bind to the CX3CR1 receptor on microglia and
suggests that glial cross-talk may increase with age [436, 460]. Despite these alterations in both
astroglial and microglial populations, no such changes have been reported in neuronal populations
[461] suggesting that glial cells and potentially infiltrating immune cells may be the causative
agents in the aging process. Currently, researchers are using single cell RNA sequencing in human
tissue autopsies as well as murine models in an attempt to uncover the cell specific alterations in
normal aging, prodromal disease states and neurodegeneration [462]. Based on these emerging
data it may be possible to elucidate targets in multiple cell types to reduce PD associated gene
158
expression while preserving essential glial functions or allow for earlier identification of
individuals with high risk for neurodegenerative disease.

159
Conclusions
Our initial hypothesis centered around the view that inflammatory response to
environmental toxicants altered microglial activation profiles and thus led to TH+ cell
degeneration and behavioural outcomes. Logically following from this, we hypothesized that pre-
treatment to reduce gut permeability (probiotics, chapter 3) or deplete potentially activated
microglia (PLX-3397, chapter 5) would act to prevent these outcomes. The evidence we gathered
over these four experiments supported our first hypotheses, environmental toxicants and
extraneous factors do modulate neuroinflammation including herbicides (chapters 2-5), ageing
(chapter 2), dysbiosis (chapter 3) and genetic vulnerabilities such as LRRK2 G2019S (chapters 4
and 5). We found that many of these factors influence or add to each other, however, we did not
see synergistic effects or greatly altered effects when used in combination which could either mean
that there are no strong interactions or, more likely that there is a critical window either very early
or later on in which these factors may more meaningfully interact. In all of our studies we did not
find a treatment that either reduced or enhanced of paraquat/LPS induce loss of SNc TH+ neurons,
despite clearly observing both protective (chapter 5) and detrimental (chapter 3) impacts on
behaviour and microglial morphology. This data along with increases observed in GFAP
expression (chapters 3 and 5) with these same factors demonstrated that alteration of microglial
populations alone is not sufficient to alter TH+ cell death outcomes in the paraquat and LPS
paraquat models of PD. Our overall conclusions point to the involvement of environmental risk
factors in neuroinflammation but suggest that non-microglial populations and/or mechanisms may
be equally important in mediating cell death in PD.

160

161
References
1. Poewe W, Seppi K, Tanner CM, Halliday GM, Brundin P, Volkmann J, et al. Parkinson
disease. Nat Rev Dis Prim. 2017;3:17013. doi:10.1038/nrdp.2017.13.
2. Hirtz D, Thurman DJ, Gwinn-Hardy K, Mohamed M, Chaudhuri AR, Zalutsky R. How
common are the "common" neurologic disorders? Neurology. 2007;68:326–37.
doi:10.1212/01.wnl.0000252807.38124.a3.
3. Trinh J, Guella I, Farrer MJ. Disease Penetrance of Late-Onset Parkinsonism. JAMA Neurol.
2014;71:1535. doi:10.1001/jamaneurol.2014.1909.
4. Wong S, Gilmour H, Ramage-Morin P. Parkinson’s disease: Prevalence, diagnoses and
impact. Stat Canada Heal Reports. 2014;25.
5. The Lancet Neurology TL. Building on 50 years of levodopa therapy. Lancet Neurol.
2016;15:1. doi:10.1016/S1474-4422(15)00349-X.
6. Postuma RB, Berg D, Adler CH, Bloem BR, Chan P, Deuschl G, et al. The new definition and
diagnostic criteria of Parkinson’s disease. Lancet Neurol. 2016;15:546–8. doi:10.1016/S1474-
4422(16)00116-2.
7. Riederer P, Wuketich S. Time course of nigrostriatal degeneration in parkinson’s disease. A
detailed study of influential factors in human brain amine analysis. J Neural Transm.
1976;38:277–301. http://www.ncbi.nlm.nih.gov/pubmed/956814. Accessed 24 Oct 2018.
8. Ross GW, Petrovitch H, Abbott RD, Nelson J, Markesbery W, Davis D, et al. Parkinsonian
signs and substantia nigra neuron density in decendents elders without PD. Ann Neurol.
2004;56:532–9. doi:10.1002/ana.20226.
9. Sulzer D. Multiple hit hypotheses for dopamine neuron loss in Parkinson’s disease. Trends
Neurosci. 2007;30:244–50. doi:10.1016/j.tins.2007.03.009.
10. Sadasivan S, Sharp B, Schultz-Cherry S, Smeyne RJ. Synergistic effects of influenza and 1-
methyl-4-phenyl-1,2,3,6-tetrahydropyridine (MPTP) can be eliminated by the use of influenza
therapeutics: experimental evidence for the multi-hit hypothesis. npj Park Dis. 2017;3:18.
doi:10.1038/s41531-017-0019-z.
11. DeLong MR, Alexander GE, Georgopoulos AP, Crutcher MD, Mitchell SJ, Richardson RT.
Role of basal ganglia in limb movements. Hum Neurobiol. 1984;2:235–44.
http://www.ncbi.nlm.nih.gov/pubmed/6715208. Accessed 24 Oct 2018.
12. Hikosaka O, Takikawa Y, Kawagoe R, Kojima S, Doupe AJ, Silver R, et al. Tutor Song
Exposure Song Selectivity in the Pallial-Basal Ganglia Song Circuit of Zebra Finches Raised
Without Role of the Basal Ganglia in the Control of Purposive Saccadic Eye Movements.
Physiol Rev. 2000;80:953–78.
http://physrev.physiology.org/cgi/content/full/80/3/953#BIBLhttp://physrev.physiology.org/cgi/c
ontent/full/80/3/953. Accessed 24 Oct 2018.
13. Chaudhuri KR, Schapira AH. Non-motor symptoms of Parkinson’s disease: dopaminergic
pathophysiology and treatment. Lancet Neurol. 2009;8:464–74. doi:10.1016/S1474-
4422(09)70068-7.

162
14. Poewe W. Non-motor symptoms in Parkinson’s disease. Eur J Neurol. 2008;15:14–20.
doi:10.1111/j.1468-1331.2008.02056.x.
15. Schapira AH V. Etiology of Parkinson’s disease. Neurology. 2006;66 10 Suppl 4:S10-23.
http://www.ncbi.nlm.nih.gov/pubmed/16717248. Accessed 24 Oct 2018.
16. Kau AL, Ahern PP, Griffin NW, Goodman AL, Gordon JI. Human nutrition, the gut
microbiome and the immune system. Nature. 2011;474:327–36. doi:10.1038/nature10213.
17. Chandra RK. Nutrition and the immune system: an introduction. Am J Clin Nutr.
1997;66:460S-463S. doi:10.1093/ajcn/66.2.460S.
18. Cao J, Xu X, Hylkema MN, Zeng EY, Bergman Å, Huo X. Early-life Exposure to
Widespread Environmental Toxicants and Health Risk: A Focus on the Immune and Respiratory
Systems. Ann Glob Heal. 2016;82:119–31. doi:10.1016/J.AOGH.2016.01.023.
19. Chen L, Mo M, Li G, Cen L, Wei L, Xiao Y, et al. The biomarkers of immune dysregulation
and inflammation response in Parkinson disease. Transl Neurodegener. 2016;5:16.
doi:10.1186/s40035-016-0063-3.
20. Sampson TR, Debelius JW, Thron T, Janssen S, Shastri GG, Ilhan ZE, et al. Gut Microbiota
Regulate Motor Deficits and Neuroinflammation in a Model of Parkinson’s Disease. Cell.
2016;167:1469-1480.e12. doi:10.1016/j.cell.2016.11.018.
21. Scheperjans F, Aho V, Pereira PAB, Koskinen K, Paulin L, Pekkonen E, et al. Gut
microbiota are related to Parkinson’s disease and clinical phenotype. Mov Disord. 2015;30:350–
8. doi:10.1002/mds.26069.
22. Qian Y, Yang X, Xu S, Wu C, Qin N, Chen S-D, et al. Detection of Microbial 16S rRNA
Gene in the Blood of Patients With Parkinson’s Disease. Front Aging Neurosci. 2018;10:156.
doi:10.3389/fnagi.2018.00156.
23. Adams-Carr KL, Bestwick JP, Shribman S, Lees A, Schrag A, Noyce AJ. Constipation
preceding Parkinson’s disease: a systematic review and meta-analysis. J Neurol Neurosurg
Psychiatry. 2016;87:710–6. doi:10.1136/jnnp-2015-311680.
24. Charles A Janeway J, Travers P, Walport M, Shlomchik MJ. Principles of innate and
adaptive immunity. 2001. https://www.ncbi.nlm.nih.gov/books/NBK27090/. Accessed 9 Nov
2018.
25. Kolaczkowska E, Kubes P. Neutrophil recruitment and function in health and inflammation.
Nat Rev Immunol. 2013;13:159–75. doi:10.1038/nri3399.
26. Kurosaki T, Kometani K, Ise W. Memory B cells. Nat Rev Immunol. 2015;15:149–59.
doi:10.1038/nri3802.
27. Luckheeram RV, Zhou R, Verma AD, Xia B. CD4+T cells: differentiation and functions.
Clin Dev Immunol. 2012;2012:925135. doi:10.1155/2012/925135.
28. Zhang N, Bevan MJ. CD8(+) T cells: foot soldiers of the immune system. Immunity.
2011;35:161–8. doi:10.1016/j.immuni.2011.07.010.
29. Daneman R, Prat A. The blood-brain barrier. Cold Spring Harb Perspect Biol.

163
2015;7:a020412. doi:10.1101/cshperspect.a020412.
30. Zarruk JG, Greenhalgh AD, David S. Microglia and macrophages differ in their
inflammatory profile after permanent brain ischemia. Exp Neurol. 2018;301 Pt B:120–32.
doi:10.1016/j.expneurol.2017.08.011.
31. Paolicelli RC, Bisht K, Tremblay M-È. Fractalkine regulation of microglial physiology and
consequences on the brain and behavior. Front Cell Neurosci. 2014;8:129.
doi:10.3389/fncel.2014.00129.
32. Li F, Wang Y, Yu L, Cao S, Wang K, Yuan J, et al. Viral Infection of the Central Nervous
System and Neuroinflammation Precede Blood-Brain Barrier Disruption during Japanese
Encephalitis Virus Infection. J Virol. 2015;89:5602–14. doi:10.1128/JVI.00143-15.
33. Chodobski A, Zink BJ, Szmydynger-Chodobska J. Blood-brain barrier pathophysiology in
traumatic brain injury. Transl Stroke Res. 2011;2:492–516. doi:10.1007/s12975-011-0125-x.
34. Saxena S, Caroni P. Selective Neuronal Vulnerability in Neurodegenerative Diseases: from
Stressor Thresholds to Degeneration. Neuron. 2011;71:35–48.
doi:10.1016/j.neuron.2011.06.031.
35. Giguère N, Burke Nanni S, Trudeau L-E. On Cell Loss and Selective Vulnerability of
Neuronal Populations in Parkinson’s Disease. Front Neurol. 2018;9:455.
doi:10.3389/fneur.2018.00455.
36. Herlinger E, Jameson RF, Linert W. Spontaneous autoxidation of dopamine. J Chem Soc
Perkin Trans 2. 1995;0:259. doi:10.1039/p29950000259.
37. Kim WG, Mohney RP, Wilson B, Jeohn GH, Liu B, Hong JS. Regional difference in
susceptibility to lipopolysaccharide-induced neurotoxicity in the rat brain: role of microglia. J
Neurosci. 2000;20:6309–16. http://www.ncbi.nlm.nih.gov/pubmed/10934283. Accessed 9 Nov
2018.
38. Neumann H, Kotter MR, Franklin RJM. Debris clearance by microglia: An essential link
between degeneration and regeneration. Brain. 2009;132:288–95.
39. Kigerl KA, de Rivero Vaccari JP, Dietrich WD, Popovich PG, Keane RW. Pattern
recognition receptors and central nervous system repair. Exp Neurol. 2014;258:5–16.
40. Mosley RL, Hutter-Saunders JA, Stone DK, Gendelman HE. Inflammation and adaptive
immunity in Parkinson’s disease. Cold Spring Harb Perspect Med. 2012;2:a009381.
doi:10.1101/cshperspect.a009381.
41. German DC, Eagar T, Sonsalla PK. Parkinson’s Disease: A Role for the Immune System.
Curr Mol Pharmacol. 2011.
42. Litteljohn D, Mangano E, Clarke M, Bobyn J, Moloney K, Hayley S. Inflammatory
mechanisms of neurodegeneration in toxin-based models of Parkinson’s disease. Parkinsons Dis.
2010;2011:713517.
43. Sawada M, Imamura K, Nagatsu T. Role of cytokines in inflammatory process in Parkinson’s
disease. J Neural Transm Suppl. 2006;:373–81.

164
44. Fang F, Wirdefeldt K, Jacks A, Kamel F, Ye W, Chen H. CNS infections, sepsis and risk of
Parkinson’s disease. Int J Epidemiol. 2012;41:1042–9.
45. Nielsen HH, Qiu J, Friis S, Wermuth L, Ritz B. Treatment for Helicobacter pylori infection
and risk of parkinson’s disease in Denmark. Eur J Neurol. 2012;:1–6.
46. Wu WY-Y, Kang K-H, Chen SL-S, Chiu SY-H, Yen AM-F, Fann JC-Y, et al. Hepatitis C
virus infection: a risk factor for Parkinson’s disease. J Viral Hepat. 2015;22:784–91.
47. Ascherio A, Schwarzschild MA. The epidemiology of Parkinson’s disease: risk factors and
prevention. The Lancet Neurology. 2016;15:1257–72.
48. Mangano EN, Hayley S. Inflammatory priming of the substantia nigra influences the impact
of later paraquat exposure: Neuroimmune sensitization of neurodegeneration. Neurobiol Aging.
2009;30:1361–78. doi:10.1016/j.neurobiolaging.2007.11.020.
49. Purisai MG, McCormack AL, Cumine S, Li J, Isla MZ, Di Monte DA. Microglial activation
as a priming event leading to paraquat-induced dopaminergic cell degeneration. Neurobiol Dis.
2007;25:392–400.
50. Bobyn J, Mangano EN, Gandhi A, Nelson E, Moloney K, Clarke M, et al. Viral-toxin
interactions and Parkinson’s disease: poly I:C priming enhanced the neurodegenerative effects of
paraquat. J Neuroinflammation. 2012;9:86. doi:10.1186/1742-2094-9-86.
51. Di Maio R, Hoffman EK, Rocha EM, Keeney MT, Sanders LH, De Miranda BR, et al.
LRRK2 activation in idiopathic Parkinson’s disease. Sci Transl Med. 2018;10:eaar5429.
doi:10.1126/scitranslmed.aar5429.
52. Rocha NP, de Miranda AS, Teixeira AL. Insights into Neuroinflammation in Parkinson’s
Disease: From Biomarkers to Anti-Inflammatory Based Therapies. Biomed Res Int.
2015;2015:628192.
53. Cowan DM, Zheng W, Zou Y, Shi X, Chen J, Rosenthal FS, et al. Manganese exposure
among smelting workers: Relationship between blood manganese–iron ratio and early onset
neurobehavioral alterations. Neurotoxicology. 2009;30:1214–22.
doi:10.1016/j.neuro.2009.02.005.
54. Sofic E, Riederer P, Heinsen H, Beckmann H, Reynolds GP, Hebenstreit G, et al. Increased
iron (III) and total iron content in post mortem substantia nigra of parkinsonian brain. J Neural
Transm. 1988;74:199–205. http://www.ncbi.nlm.nih.gov/pubmed/3210014. Accessed 27 Nov
2018.
55. Kraft AD, Jean Harry G. Features of microglia and neuroinflammation relevant to
environmental exposure and neurotoxicity. International Journal of Environmental Research and
Public Health. 2011;8:2980–3018.
56. Peng J, Peng L, Stevenson FF, Doctrow SR, Andersen JK. Iron and paraquat as synergistic
environmental risk factors in sporadic Parkinson’s disease accelerate age-related
neurodegeneration. J Neurosci. 2007;27:6914–22.
57. Moehle MS, Webber PJ, Tse T, Sukar N, Standaert DG, DeSilva TM, et al. LRRK2
inhibition attenuates microglial inflammatory responses. J Neurosci. 2012;32:1602–11.

165
doi:10.1523/JNEUROSCI.5601-11.2012.
58. Chien C-H, Lee M-J, Liou H-C, Liou H-H, Fu W-M. Microglia-Derived
Cytokines/Chemokines Are Involved in the Enhancement of LPS-Induced Loss of Nigrostriatal
Dopaminergic Neurons in DJ-1 Knockout Mice. PLoS One. 2016;11:e0151569.
doi:10.1371/journal.pone.0151569.
59. SUZUMURA A, TAKEUCHI H, ZHANG G, KUNO R, MIZUNO T. Roles of Glia-Derived
Cytokines on Neuronal Degeneration and Regeneration. Ann N Y Acad Sci. 2006;1088:219–29.
doi:10.1196/annals.1366.012.
60. Lill CM. Genetics of Parkinson’s disease. Mol Cell Probes. 2016;30:386–96.
doi:10.1016/J.MCP.2016.11.001.
61. Correia Guedes L, Ferreira JJ, Rosa MM, Coelho M, Bonifati V, Sampaio C. Worldwide
frequency of G2019S LRRK2 mutation in Parkinson’s disease: A systematic review.
Parkinsonism Relat Disord. 2010;16:237–42. doi:10.1016/J.PARKRELDIS.2009.11.004.
62. Monfrini E, Di Fonzo A. Leucine-Rich Repeat Kinase (LRRK2) Genetics and Parkinson’s
Disease. In: Advances in neurobiology. 2017. p. 3–30. doi:10.1007/978-3-319-49969-7_1.
63. Hui KY, Fernandez-Hernandez H, Hu J, Schaffner A, Pankratz N, Hsu N-Y, et al. Functional
variants in the LRRK2 gene confer shared effects on risk for Crohn’s disease and Parkinson’s
disease. Sci Transl Med. 2018;10:eaai7795. doi:10.1126/scitranslmed.aai7795.
64. Fava VM, Manry J, Cobat A, Orlova M, Van Thuc N, Ba NN, et al. A Missense LRRK2
Variant Is a Risk Factor for Excessive Inflammatory Responses in Leprosy. PLoS Negl Trop Dis.
2016;10:e0004412. doi:10.1371/journal.pntd.0004412.
65. Brocchieri L, Karlin S. Protein length in eukaryotic and prokaryotic proteomes. Nucleic
Acids Res. 2005;33:3390–400. doi:10.1093/nar/gki615.
66. Li J-Q, Tan L, Yu J-T. The role of the LRRK2 gene in Parkinsonism. Mol Neurodegener.
2014;9:47. doi:10.1186/1750-1326-9-47.
67. West AB, Cowell RM, Daher JPL, Moehle MS, Hinkle KM, Melrose HL, et al. Differential
LRRK2 expression in the cortex, striatum, and substantia nigra in transgenic and nontransgenic
rodents. J Comp Neurol. 2014;522:2465–80. doi:10.1002/cne.23583.
68. Ng ASL, Ng EYL, Tan YJ, Prakash KM, Au WL, Tan LCS, et al. Case-control analysis of
LRRK2 protective variants in Essential Tremor. Sci Rep. 2018;8:5346. doi:10.1038/s41598-018-
23711-w.
69. Wang D, Xu L, Lv L, Su L-Y, Fan Y, Zhang D-F, et al. Association of the LRRK2 genetic
polymorphisms with leprosy in Han Chinese from Southwest China. Genes Immun.
2015;16:112–9. doi:10.1038/gene.2014.72.
70. Paisán-Ruiz C, Lewis PA, Singleton AB. LRRK2: cause, risk, and mechanism. J Parkinsons
Dis. 2013;3:85–103. doi:10.3233/JPD-130192.
71. Gardet A, Benita Y, Li C, Sands BE, Ballester I, Stevens C, et al. LRRK2 is involved in the
IFN-gamma response and host response to pathogens. J Immunol. 2010;185:5577–85.

166
doi:10.4049/jimmunol.1000548.
72. Liu W, Liu X, Li Y, Zhao J, Liu Z, Hu Z, et al. LRRK2 promotes the activation of NLRC4
inflammasome during Salmonella Typhimurium infection. J Exp Med. 2017;214:3051–66.
doi:10.1084/jem.20170014.
73. Hulihan MM, Ishihara-Paul L, Kachergus J, Warren L, Amouri R, Elango R, et al. LRRK2
Gly2019Ser penetrance in Arab–Berber patients from Tunisia: a case-control genetic study.
Lancet Neurol. 2008;7:591–4. doi:10.1016/S1474-4422(08)70116-9.
74. Gardet A, Benita Y, Li C, Sands BE, Ballester I, Stevens C, et al. LRRK2 Is Involved in the
IFN-γ Response and Host Response to Pathogens. J Immunol. 2010;185:5577–85.
75. Maekawa T, Kubo M, Yokoyama I, Ohta E, Obata F. Age-dependent and cell-population-
restricted LRRK2 expression in normal mouse spleen. Biochem Biophys Res Commun.
2010;392:431–5.
76. Hakimi M, Selvanantham T, Swinton E, Padmore RF, Tong Y, Kabbach G, et al. Parkinson’s
disease-linked LRRK2 is expressed in circulating and tissue immune cells and upregulated
following recognition of microbial structures. J Neural Transm. 2011;118.
77. Thévenet J, Gobert R, van Huijsduijnen RH, Wiessner C, Sagot YJ. Regulation of LRRK2
expression points to a functional role in human monocyte maturation. PLoS One. 2011;6.
78. Marcinek P, Jha AN, Shinde V, Sundaramoorthy A, Rajkumar R, Suryadevara NC, et al.
LRRK2 and RIPK2 Variants in the NOD 2-Mediated Signaling Pathway Are Associated with
Susceptibility to Mycobacterium leprae in Indian Populations. PLoS One. 2013;8:e73103.
doi:10.1371/journal.pone.0073103.
79. Miklossy J, Arai T, Guo JP, Klegeris A, Yu S, McGeer EG, et al. LRRK2 expression in
normal and pathologic human brain and in human cell lines. J Neuropathol Exp Neurol.
2006;65:953–63.
80. Russo I, Berti G, Plotegher N, Bernardo G, Filograna R, Bubacco L, et al. Leucine-rich
repeat kinase 2 positively regulates inflammation and down-regulates NF-κB p50 signaling in
cultured microglia cells. J Neuroinflammation. 2015;12:230.
81. Schapansky J, Nardozzi JD, Felizia F, LaVoie MJ. Membrane recruitment of endogenous
LRRK2 precedes its potent regulation of autophagy. Hum Mol Genet. 2014;23:4201–14.
82. Wang X, Yan MH, Fujioka H, Liu J, Wilson-delfosse A, Chen SG, et al. LRRK2 regulates
mitochondrial dynamics and function through direct interaction with DLP1. Hum Mol Genet.
2012;21:1931–44.
83. Orenstein SJ, Kuo S-H, Tasset I, Arias E, Koga H, Fernandez-Carasa I, et al. Interplay of
LRRK2 with chaperone-mediated autophagy. Nat Neurosci. 2013;16:394–406.
84. Arranz AM, Delbroek L, Van Kolen K, Guimarães MR, Mandemakers W, Daneels G, et al.
LRRK2 functions in synaptic vesicle endocytosis through a kinase-dependent mechanism. J Cell
Sci. 2014; December:541–52.
85. Schreij AMA, Chaineau M, Ruan W, Lin S, Barker PA, Fon EA, et al. LRRK2 localizes to

167
endosomes and interacts with clathrin-light chains to limit Rac1 activation. EMBO Rep.
2015;16:79–86.
86. Häbig K, Gellhaar S, Heim B, Djuric V, Giesert F, Wurst W, et al. LRRK2 guides the actin
cytoskeleton at growth cones together with ARHGEF7 and Tropomyosin 4. Biochim Biophys
Acta - Mol Basis Dis. 2013;1832:2352–67.
87. Sanna G, Del Giudice MG, Crosio C, Iaccarino C. LRRK2 and vesicle trafficking. Biochem
Soc Trans. 2012;40:1117–22.
88. Ho CC-Y, Rideout HJ, Ribe E, Troy CM, Dauer WT. The Parkinson disease protein leucine-
rich repeat kinase 2 transduces death signals via Fas-associated protein with death domain and
caspase-8 in a cellular model of neurodegeneration. J Neurosci. 2009;29:1011–6.
89. Umeno J, Asano K, Matsushita T, Matsumoto T, Kiyohara Y, Iida M, et al. Meta-analysis of
published studies identified eight additional common susceptibility loci for Crohn’s disease and
ulcerative colitis. Inflamm Bowel Dis. 2011;17:2407–15.
90. Zhang F-R, Huang W, Chen S-M, Sun L-D, Liu H, Li Y, et al. Genomewide association
study of leprosy. N Engl J Med. 2009;361:2609–18.
91. Agalliu I, San Luciano M, Mirelman A, Giladi N, Waro B, Aasly J, et al. Higher frequency
of certain cancers in LRRK2 G2019S mutation carriers with Parkinson disease: a pooled
analysis. JAMA Neurol. 2015;72:58–65. doi:10.1001/jamaneurol.2014.1973.
92. Saunders-Pullman R, Barrett MJ, Stanley KM, Luciano MS, Shanker V, Severt L, et al.
LRRK2 G2019S mutations are associated with an increased cancer risk in Parkinson disease.
Mov Disord. 2010;25:2536–41. doi:10.1002/mds.23314.
93. Zhao Y, Ho P, Yih Y, Chen C, Lee WL, Tan EK. LRRK2 variant associated with
Alzheimer’s disease. Neurobiol Aging. 2011;32:1990–3.
doi:10.1016/j.neurobiolaging.2009.11.019.
94. Nery JA da C, Bernardes Filho F, Quintanilha J, Machado AM, Oliveira S de SC, Sales AM.
Understanding the type 1 reactional state for early diagnosis and treatment: a way to avoid
disability in leprosy. An Bras Dermatol. 2013;88:787–92. doi:10.1590/abd1806-4841.20132004.
95. Dzamko N, Rowe DB, Halliday GM. Increased peripheral inflammation in asymptomatic
leucine-rich repeat kinase 2 mutation carriers. Mov Disord. 2016;31:889–97.
96. Cook DA, Kannarkat GT, Cintron AF, Butkovich LM, Fraser KB, Chang J, et al. LRRK2
levels in immune cells are increased in Parkinson’s disease. npj Park Dis. 2017;3:11.
97. Russo I, Bubacco L, Greggio E. LRRK2 and neuroinflammation: partners in crime in
Parkinson’s disease? Journal of Neuroinflammation. 2014;11:52.
98. Gillardon F, Schmid R, Draheim H. Parkinson’s disease-linked leucine-rich repeat kinase
2(R1441G) mutation increases proinflammatory cytokine release from activated primary
microglial cells and resultant neurotoxicity. Neuroscience. 2012;208:41–8.
99. Kim KS, Marcogliese PC, Yang J, Callaghan SM, Resende V, Abdel-Messih E, et al.
Regulation of myeloid cell phagocytosis by LRRK2 via WAVE2 complex stabilization is altered

168
in Parkinson’s disease. Proc Natl Acad Sci. 2018;115:E5164–73. doi:10.1073/pnas.1718946115.
100. Choi I, Kim B, Byun J-W, Baik SH, Huh YH, Kim J-H, et al. LRRK2 G2019S mutation
attenuates microglial motility by inhibiting focal adhesion kinase. Nat Commun. 2015;6:8255.
doi:10.1038/ncomms9255.
101. Marcogliese PC, Abuaish S, Kabbach G, Abdel-Messih E, Seang S, Li G, et al.
LRRK2(I2020T) functional genetic interactors that modify eye degeneration and dopaminergic
cell loss in Drosophila. Hum Mol Genet. 2017;26:1247–57. doi:10.1093/hmg/ddx030.
102. Joseph N, Biber G, Fried S, Reicher B, Levy O, Sabag B, et al. A conformational change
within the WAVE2 complex regulates its degradation following cellular activation. Sci Rep.
2017;7:44863. doi:10.1038/srep44863.
103. Moehle MS, Daher JPL, Hull TD, Boddu R, Abdelmotilib HA, Mobley J, et al. The G2019S
LRRK2 mutation increases myeloid cell chemotactic responses and enhances LRRK2 binding to
actin-regulatory proteins. Hum Mol Genet. 2015;24:4250–67.
104. Daher JPL, Volpicelli-Daley LA, Blackburn JP, Moehle MS, West AB. Abrogation of α-
synuclein-mediated dopaminergic neurodegeneration in LRRK2-deficient rats. Proc Natl Acad
Sci U S A. 2014;111:9289–94.
105. Volpicelli-Daley LA, Abdelmotilib H, Liu Z, Stoyka L, Daher JPL, Milnerwood AJ, et al.
G2019S-LRRK2 Expression Augments α-Synuclein Sequestration into Inclusions in Neurons. J
Neurosci. 2016;36:7415–27. doi:10.1523/JNEUROSCI.3642-15.2016.
106. Kim B, Yang MS, Choi D, Kim JH, Kim HS, Seol W, et al. Impaired inflammatory
responses in murine lrrk2-knockdown brain microglia. PLoS One. 2012;7.
107. Liu Z, Lee J, Krummey S, Lu W, Cai H, Lenardo MJ. The kinase LRRK2 is a regulator of
the transcription factor NFAT that modulates the severity of inflammatory bowel disease. Nat
Immunol. 2011;12:1063–70. doi:10.1038/ni.2113.
108. Luo C, Burgeon E, Carew JA, McCaffrey PG, Badalian TM, Lane WS, et al. Recombinant
NFAT1 (NFATp) is regulated by calcineurin in T cells and mediates transcription of several
cytokine genes. Mol Cell Biol. 1996;16:3955–66. doi:10.1128/MCB.16.7.3955.
109. Rojanathammanee L, Floden AM, Manocha GD, Combs CK. Attenuation of microglial
activation in a mouse model of Alzheimer’s disease via NFAT inhibition. J Neuroinflammation.
2015;12:42. doi:10.1186/s12974-015-0255-2.
110. Duckworth DH. “Who discovered bacteriophage?” Bacteriol Rev. 1976;40:793–802.
http://www.ncbi.nlm.nih.gov/pubmed/795414. Accessed 3 Feb 2019.
111. Frank C, Pari G, Rossiter JP. Approach to diagnosis of Parkinson disease. Can Fam
Physician. 2006;52:862–8. http://www.ncbi.nlm.nih.gov/pubmed/16893149. Accessed 16 Jun
2019.
112. Stefanis L. α-Synuclein in Parkinson’s Disease. Cold Spring Harb Perspect Med. 2012;2.
doi:10.1101/CSHPERSPECT.A009399.
113. Ghiglieri V, Calabrese V, Calabresi P. Alpha-Synuclein: From Early Synaptic Dysfunction

169
to Neurodegeneration. Front Neurol. 2018;9:295. doi:10.3389/fneur.2018.00295.
114. Alegre-Abarrategui J, Brimblecombe KR, Roberts RF, Velentza-Almpani E, Tilley BS,
Bengoa-Vergniory N, et al. Selective vulnerability in α-synucleinopathies. Acta Neuropathol.
2019;:1–24. doi:10.1007/s00401-019-02010-2.
115. Fountaine TM, Wade-Martins R. RNA interference-mediated knockdown of α-synuclein
protects human dopaminergic neuroblastoma cells from MPP+ toxicity and reduces dopamine
transport. J Neurosci Res. 2007;85:351–63. doi:10.1002/jnr.21125.
116. Marques O, Outeiro TF. Alpha-synuclein: from secretion to dysfunction and death. Cell
Death Dis. 2012;3:e350–e350. doi:10.1038/cddis.2012.94.
117. Lashuel HA, Overk CR, Oueslati A, Masliah E. The many faces of α-synuclein: from
structure and toxicity to therapeutic target. Nat Rev Neurosci. 2013;14:38–48.
doi:10.1038/nrn3406.
118. Wang S, Xu B, Liou L-C, Ren Q, Huang S, Luo Y, et al. -Synuclein disrupts stress
signaling by inhibiting polo-like kinase Cdc5/Plk2. Proc Natl Acad Sci. 2012;109:16119–24.
doi:10.1073/pnas.1206286109.
119. Taschenberger G, Garrido M, Tereshchenko Y, Bähr M, Zweckstetter M, Kügler S.
Aggregation of αSynuclein promotes progressive in vivo neurotoxicity in adult rat dopaminergic
neurons. Acta Neuropathol. 2012;123:671–83. doi:10.1007/s00401-011-0926-8.
120. Bridi JC, Hirth F. Mechanisms of α-Synuclein Induced Synaptopathy in Parkinson’s
Disease. Front Neurosci. 2018;12:80. doi:10.3389/fnins.2018.00080.
121. Thomas B, Mandir AS, West N, Liu Y, Andrabi SA, Stirling W, et al. Resistance to MPTP-
Neurotoxicity in α-Synuclein Knockout Mice Is Complemented by Human α-Synuclein and
Associated with Increased β-Synuclein and Akt Activation. PLoS One. 2011;6:e16706.
doi:10.1371/journal.pone.0016706.
122. Kokhan VS, Afanasyeva MA, Van’kin GI. α-Synuclein knockout mice have cognitive
impairments. Behav Brain Res. 2012;231:226–30. doi:10.1016/j.bbr.2012.03.026.
123. Menges S, Minakaki G, Schaefer PM, Meixner H, Prots I, Schlötzer-Schrehardt U, et al.
Alpha-synuclein prevents the formation of spherical mitochondria and apoptosis under oxidative
stress. Sci Rep. 2017;7:42942. doi:10.1038/srep42942.
124. Bandopadhyay R. Sequential Extraction of Soluble and Insoluble Alpha-Synuclein from
Parkinsonian Brains. J Vis Exp. 2016. doi:10.3791/53415.
125. Tomlinson JJ, Shutinoski B, Dong L, Meng F, Elleithy D, Lengacher NA, et al.
Holocranohistochemistry enables the visualization of α-synuclein expression in the murine
olfactory system and discovery of its systemic anti-microbial effects. J Neural Transm.
2017;124:721–38. doi:10.1007/s00702-017-1726-7.
126. Deleidi M, Maetzler W. Protein Clearance Mechanisms of Alpha-Synuclein and Amyloid-
Beta in Lewy Body Disorders. Int J Alzheimers Dis. 2012;2012:1–9. doi:10.1155/2012/391438.
127. Gu X-L, Long C-X, Sun L, Xie C, Lin X, Cai H. Astrocytic expression of Parkinson’s

170
disease-related A53T α-synuclein causes neurodegeneration in mice. Mol Brain. 2010;3:12.
doi:10.1186/1756-6606-3-12.
128. Ferreira SA, Romero-Ramos M. Microglia Response During Parkinson’s Disease: Alpha-
Synuclein Intervention. Front Cell Neurosci. 2018;12:247. doi:10.3389/fncel.2018.00247.
129. Maekawa T, Sasaoka T, Azuma S, Ichikawa T, Melrose HL, Farrer MJ, et al. Leucine-rich
repeat kinase 2 (LRRK2) regulates α-synuclein clearance in microglia. BMC Neurosci.
2016;17:77. doi:10.1186/s12868-016-0315-2.
130. Daher JPL, Volpicelli-Daley LA, Blackburn JP, Moehle MS, West AB. Abrogation of -
synuclein-mediated dopaminergic neurodegeneration in LRRK2-deficient rats. Proc Natl Acad
Sci. 2014;111:9289–94. doi:10.1073/pnas.1403215111.
131. Brockmann K, Apel A, Schulte C, Schneiderhan-Marra N, Pont-Sunyer C, Vilas D, et al.
Inflammatory profile in LRRK2-associated prodromal and clinical PD. J Neuroinflammation.
2016;13:122. doi:10.1186/s12974-016-0588-5.
132. Lopes da Fonseca T, Villar-Piqué A, Outeiro T. The Interplay between Alpha-Synuclein
Clearance and Spreading. Biomolecules. 2015;5:435–71. doi:10.3390/biom5020435.
133. Mak SK, McCormack AL, Manning-Bog AB, Cuervo AM, Di Monte DA. Lysosomal
degradation of alpha-synuclein in vivo. J Biol Chem. 2010;285:13621–9.
doi:10.1074/jbc.M109.074617.
134. Holmqvist S, Chutna O, Bousset L, Aldrin-Kirk P, Li W, Björklund T, et al. Direct evidence
of Parkinson pathology spread from the gastrointestinal tract to the brain in rats. Acta
Neuropathol. 2014;128:805–20.
135. Fussi N, Höllerhage M, Chakroun T, Nykänen N-P, Rösler TW, Koeglsperger T, et al.
Exosomal secretion of α-synuclein as protective mechanism after upstream blockage of
macroautophagy. Cell Death Dis. 2018;9:757. doi:10.1038/s41419-018-0816-2.
136. Jagmag SA, Tripathi N, Shukla SD, Maiti S, Khurana S. Evaluation of Models of
Parkinson’s Disease. Front Neurosci. 2015;9:503. doi:10.3389/fnins.2015.00503.
137. Bové J, Prou D, Perier C, Przedborski S. Toxin-induced models of Parkinson’s disease.
NeuroRx. 2005;2:484–94. doi:10.1602/neurorx.2.3.484.
138. Salama M, Arias-Carrión O. Natural toxins implicated in the development of Parkinson’s
disease. Ther Adv Neurol Disord. 2011;4:361–73. doi:10.1177/1756285611413004.
139. Mangano EN, Peters S, Litteljohn D, So R, Bethune C, Bobyn J, et al. Granulocyte
macrophage-colony stimulating factor protects against substantia nigra dopaminergic cell loss in
an environmental toxin model of Parkinson’s disease. Neurobiol Dis. 2011;43:99–112.
140. Rudyk CA, McNeill J, Prowse N, Dwyer Z, Farmer K, Litteljohn D, et al. Age and
Chronicity of Administration Dramatically Influenced the Impact of Low Dose Paraquat
Exposure on Behavior and Hypothalamic-Pituitary-Adrenal Activity. Front Aging Neurosci.
2017;9:222. doi:10.3389/fnagi.2017.00222.
141. Rudyk C, Litteljohn D, Syed S, Dwyer Z, Hayley S. Paraquat and psychological stressor

171
interactions as pertains to Parkinsonian co-morbidity. Neurobiol Stress. 2015;2:85–93.
doi:10.1016/j.ynstr.2015.09.001.
142. Semchuk KM, Love EJ, Lee RG. Parkinson’s disease and exposure to agricultural work and
pesticide chemicals. Neurology. 1992;42:1328–35. doi:10.1212/WNL.42.7.1328.
143. Ritz BR, Paul KC, Bronstein JM. Of Pesticides and Men: a California Story of Genes and
Environment in Parkinson’s Disease. Curr Environ Heal Reports. 2016;3:40–52.
doi:10.1007/s40572-016-0083-2.
144. Ascherio A, Chen H, Weisskopf MG, O’Reilly E, McCullough ML, Calle EE, et al.
Pesticide exposure and risk for Parkinson’s disease. Ann Neurol. 2006;60:197–203.
doi:10.1002/ana.20904.
145. Cicchetti F, Lapointe N, Roberge-Tremblay A, Saint-Pierre M, Jimenez L, Ficke BW, et al.
Systemic exposure to paraquat and maneb models early Parkinson’s disease in young adult rats.
Neurobiol Dis. 2005;20:360–71.
146. Jiao Y, Lu L, Williams RW, Smeyne RJ. Genetic dissection of strain dependent paraquat-
induced neurodegeneration in the substantia nigra pars compacta. PLoS One. 2012;7:e29447.
147. Liou HH, Chen RC, Chen TH, Tsai YF, Tsai MC. Attenuation of paraquat-induced
dopaminergic toxicity on the substantia nigra by (-)-deprenyl in vivo. Toxicol Appl Pharmacol.
2001;172:37–43.
148. Uversky VN, Li J, Fink AL. Pesticides directly accelerate the rate of alpha-synuclein fibril
formation : a possible factor in Parkinson ’ s disease. FEBS Lett. 2001;500:105–8.
149. Zhao F, Wang W, Wang C, Siedlak SL, Fujioka H, Tang B, et al. Mfn2 Protects
Dopaminergic Neurons Exposed to Paraquat Both in vitro and in vivo: Implications for
Idiopathic Parkinson’s Disease. Biochim Biophys Acta - Mol Basis Dis. 2017.
150. Wu X-F, Block ML, Zhang W, Qin L, Wilson B, Zhang W-Q, et al. The role of microglia in
paraquat-induced dopaminergic neurotoxicity. Antioxid Redox Signal. 2005;7:654–61.
151. Corasaniti MT, Defilippo R, Rodinò P, Nappi G, Nisticò G. Evidence that paraquat is able
to cross the blood-brain barrier to a different extent in rats of various age. Funct Neurol. 6:385–
91. http://www.ncbi.nlm.nih.gov/pubmed/1810839. Accessed 4 Dec 2018.
152. Shimizu K, Ohtaki K, Matsubara K, Aoyama K, Uezono T, Saito O, et al. Carrier-mediated
processes in blood-brain barrier penetration and neural uptake of paraquat. Brain Res.
2001;906:135–42.
153. Bonneh-Barkay D, Reaney SH, Langston WJ, Di Monte DA. Redox cycling of the
herbicide paraquat in microglial cultures. Brain Res Mol Brain Res. 2005;134:52–6.
154. Adam A, Smith LL, Cohen GM. An evaluation of the redox cycling potencies of paraquat
and nitrofurantoin in microsomal and lung slice systems. Biochem Pharmacol. 1990;40:1533–9.
doi:10.1016/0006-2952(90)90451-P.
155. McCarthy S, Somayajulu M, Sikorska M, Borowy-Borowski H, Pandey S. Paraquat induces
oxidative stress and neuronal cell death; neuroprotection by water-soluble Coenzyme Q10.

172
Toxicol Appl Pharmacol. 2004;201:21–31. doi:10.1016/j.taap.2004.04.019.
156. Ritz BR, Manthripragada AD, Costello S, Lincoln SJ, Farrer MJ, Cockburn M, et al.
Dopamine transporter genetic variants and pesticides in Parkinson’s disease. Environ Health
Perspect. 2009;117:964–9. doi:10.1289/ehp.0800277.
157. Rappold PM, Cui M, Chesser AS, Tibbett J, Grima JC, Duan L, et al. Paraquat
neurotoxicity is mediated by the dopamine transporter and organic cation transporter-3. Proc
Natl Acad Sci U S A. 2011;108:20766–71.
158. Huang C-L, Chao C-C, Lee Y-C, Lu M-K, Cheng J-J, Yang Y-C, et al. Paraquat Induces
Cell Death Through Impairing Mitochondrial Membrane Permeability. Mol Neurobiol.
2016;53:2169–88.
159. Castello PR, Drechsel DA, Patel M. Mitochondria are a major source of paraquat-induced
reactive oxygen species production in the brain. J Biol Chem. 2007;282:14186–93.
160. Huang C-L, Lee Y-C, Yang Y-C, Kuo T-Y, Huang N-K. Minocycline prevents paraquat-
induced cell death through attenuating endoplasmic reticulum stress and mitochondrial
dysfunction. Toxicol Lett. 2012;209:203–10.
161. Cocheme HM, Murphy MP. Complex I is the major site of mitochondrial superoxide
production by paraquat. J Biol Chem. 2008;283:1786–98.
162. Manning-Bog AB, McCormack AL, Li J, Uversky VN, Fink AL, Di Monte DA. The
herbicide paraquat causes up-regulation and aggregation of alpha-synuclein in mice: paraquat
and alpha-synuclein. J Biol Chem. 2002;277:1641–4.
163. Zaidi A, Fernandes D, Bean JL, Michaelis ML. Effects of Paraquat-induced Oxidative
Stress on the Neuronal Plasma Membrane Ca(2+)-ATPase. Free radical biology & medicine.
2009;47:1507–14.
164. Manning-Bog AB, McCormack AL, Purisai MG, Bolin LM, Di Monte DA. Alpha-
synuclein overexpression protects against paraquat-induced neurodegeneration. J Neurosci.
2003;23:3095–9. http://www.ncbi.nlm.nih.gov/pubmed/12716914. Accessed 5 Dec 2018.
165. Liu M, Bing G. Lipopolysaccharide animal models for Parkinson’s disease. Parkinsons Dis.
2011;2011:327089. doi:10.4061/2011/327089.
166. Porras G, Li Q, Bezard E. Modeling Parkinson’s disease in primates: The MPTP model.
Cold Spring Harb Perspect Med. 2012;2:a009308. doi:10.1101/cshperspect.a009308.
167. Meredith GE, Rademacher DJ. MPTP mouse models of Parkinson’s disease: an update. J
Parkinsons Dis. 2011;1:19–33. doi:10.3233/JPD-2011-11023.
168. Smith ES, Clark ME, Hardy GA, Kraan DJ, Biondo E, Gonzalez-Lima F, et al. Daily
consumption of methylene blue reduces attentional deficits and dopamine reduction in a 6-
OHDA model of Parkinson’s disease. Neuroscience. 2017;359:8–16.
doi:10.1016/J.NEUROSCIENCE.2017.07.001.
169. Mori MA, Delattre AM, Carabelli B, Pudell C, Bortolanza M, Staziaki PV, et al.
Neuroprotective effect of omega-3 polyunsaturated fatty acids in the 6-OHDA model of

173
Parkinson’s disease is mediated by a reduction of inducible nitric oxide synthase. Nutr Neurosci.
2018;21:341–51. doi:10.1080/1028415X.2017.1290928.
170. Van Laar VS, Berman SB, Hastings TG. Mic60/mitofilin overexpression alters
mitochondrial dynamics and attenuates vulnerability of dopaminergic cells to dopamine and
rotenone. Neurobiol Dis. 2016;91:247–61. doi:10.1016/j.nbd.2016.03.015.
171. Van Laar VS, Arnold B, Howlett EH, Calderon MJ, St. Croix CM, Greenamyre JT, et al.
Evidence for Compartmentalized Axonal Mitochondrial Biogenesis: Mitochondrial DNA
Replication Increases in Distal Axons As an Early Response to Parkinson’s Disease-Relevant
Stress. J Neurosci. 2018;38:7505–15. doi:10.1523/JNEUROSCI.0541-18.2018.
172. Gao H-M, Hong J-S, Zhang W, Liu B. Synergistic dopaminergic neurotoxicity of the
pesticide rotenone and inflammogen lipopolysaccharide: relevance to the etiology of Parkinson’s
disease. J Neurosci. 2003;23:1228–36. http://www.ncbi.nlm.nih.gov/pubmed/12598611.
Accessed 10 Nov 2018.
173. GAO H-M, LIU B, ZHANG W, HONG J-S. Synergistic dopaminergic neurotoxicity of
MPTP and inflammogen lipopolysaccharide: relevance to the etiology of Parkinson’s disease.
FASEB J. 2003;17:1957–9. doi:10.1096/fj.03-0203fje.
174. Sadasivan S, Sharp B, Schultz-Cherry S, Smeyne RJ. Synergistic effects of influenza and 1-
methyl-4-phenyl-1,2,3,6-tetrahydropyridine (MPTP) can be eliminated by the use of influenza
therapeutics: experimental evidence for the multi-hit hypothesis. NPJ Park Dis. 2017;3:18.
doi:10.1038/s41531-017-0019-z.
175. Cagnacci A, Melis GB, Soldani R, Bonuccelli U, Piccini P, Napolitano A, et al. Altered
Neuroendocrine Regulation of Luteinizing Hormone Secretion in Postmenopausal Women with
Parkinson’s Disease. Neuroendocrinology. 1991;53:549–55. doi:10.1159/000125773.
176. Carvey PM, Punati A, Newman MB. Progressive dopamine neuron loss in Parkinson’s
disease: the multiple hit hypothesis. Cell Transplant. 2006;15:239–50.
http://www.ncbi.nlm.nih.gov/pubmed/16719059. Accessed 10 Nov 2018.
177. Mulak A, Bonaz B. Brain-gut-microbiota axis in Parkinson’s disease. World J
Gastroenterol. 2015;21:10609–20. doi:10.3748/wjg.v21.i37.10609.
178. Caputi V, Giron MC. Microbiome-Gut-Brain Axis and Toll-Like Receptors in Parkinson’s
Disease. Int J Mol Sci. 2018;19. doi:10.3390/ijms19061689.
179. Ursell LK, Metcalf JL, Parfrey LW, Knight R. Defining the Human Microbiome. Nutr Rev.
2012;70 Suppl 1:S38. doi:10.1111/J.1753-4887.2012.00493.X.
180. Mackie RI, Sghir A, Gaskins HR. Developmental microbial ecology of the neonatal
gastrointestinal tract. Am J Clin Nutr. 1999;69:1035s-1045s. doi:10.1093/ajcn/69.5.1035s.
181. Dominguez-Bello MG, Blaser MJ, Ley RE, Knight R. Development of the Human
Gastrointestinal Microbiota and Insights From High-Throughput Sequencing. Gastroenterology.
2011;140:1713–9. doi:10.1053/j.gastro.2011.02.011.
182. Schiffrin EJ, Morley JE, Donnet-Hughes A, Guigoz Y. The inflammatory status of the
elderly: The intestinal contribution. Mutat Res Mol Mech Mutagen. 2010;690:50–6.

174
doi:10.1016/j.mrfmmm.2009.07.011.
183. Langdon A, Crook N, Dantas G. The effects of antibiotics on the microbiome throughout
development and alternative approaches for therapeutic modulation. Genome Med. 2016;8:39.
doi:10.1186/s13073-016-0294-z.
184. Girard-Madoux MJH, Gomez de Agüero M, Ganal-Vonarburg SC, Mooser C, Belz GT,
Macpherson AJ. The immunological functions of the Appendix: An example of redundancy?
Semin Immunol. 2018;36:31–44. doi:10.1016/J.SMIM.2018.02.005.
185. David LA, Weil A, Ryan ET, Calderwood SB, Harris JB, Chowdhury F, et al. Gut microbial
succession follows acute secretory diarrhea in humans. MBio. 2015;6:e00381-15.
doi:10.1128/mBio.00381-15.
186. Lazar V, Ditu L-M, Pircalabioru GG, Gheorghe I, Curutiu C, Holban AM, et al. Aspects of
Gut Microbiota and Immune System Interactions in Infectious Diseases, Immunopathology, and
Cancer. Front Immunol. 2018;9:1830. doi:10.3389/fimmu.2018.01830.
187. Belkaid Y, Hand TW. Role of the microbiota in immunity and inflammation. Cell.
2014;157:121–41. doi:10.1016/j.cell.2014.03.011.
188. Braniste V, Al-Asmakh M, Kowal C, Anuar F, Abbaspour A, Tóth M, et al. The gut
microbiota influences blood-brain barrier permeability in mice. Sci Transl Med.
2014;6:263ra158. doi:10.1126/scitranslmed.3009759.
189. Distrutti E, Monaldi L, Ricci P, Fiorucci S. Gut microbiota role in irritable bowel syndrome:
New therapeutic strategies. World J Gastroenterol. 2016;22:2219–41.
doi:10.3748/wjg.v22.i7.2219.
190. Alhagamhmad MH, Day AS, Lemberg DA, Leach ST, Leach sleach ST. An overview of the
bacterial contribution to Crohn disease pathogenesis. doi:10.1099/jmm.0.000331.
191. Stiemsma LT, Turvey SE. Asthma and the microbiome: defining the critical window in
early life. Allergy, Asthma Clin Immunol. 2017;13:3. doi:10.1186/s13223-016-0173-6.
192. Arrieta M-C, Arévalo A, Stiemsma L, Dimitriu P, Chico ME, Loor S, et al. Associations
between infant fungal and bacterial dysbiosis and childhood atopic wheeze in a nonindustrialized
setting. J Allergy Clin Immunol. 2018;142:424-434.e10. doi:10.1016/j.jaci.2017.08.041.
193. Boutin RCT, Dwyer Z, Farmer K, Rudyk C, Forbes MR, Hayley S. Perinatal antibiotic
exposure alters composition of murine gut microbiota and may influence later responses to
peanut antigen. Allergy, Asthma Clin Immunol. 2018;14:42. doi:10.1186/s13223-018-0263-8.
194. Plunkett CH, Nagler CR. The influence of the microbiome on allergic sensitization to food.
J Immunol. 2017;198:581. doi:10.4049/JIMMUNOL.1601266.
195. Inoue T, Nakayama J, Moriya K, Kawaratani H, Momoda R, Ito K, et al. Gut Dysbiosis
Associated With Hepatitis C Virus Infection. Clin Infect Dis. 2018;67:869–77.
doi:10.1093/cid/ciy205.
196. Johansson ME V, Sjövall H, Hansson GC. The gastrointestinal mucus system in health and
disease. Nat Rev Gastroenterol Hepatol. 2013;10:352–61. doi:10.1038/nrgastro.2013.35.

175
197. Zarepour M, Bhullar K, Montero M, Ma C, Huang T, Velcich A, et al. The Mucin Muc2
Limits Pathogen Burdens and Epithelial Barrier Dysfunction during Salmonella enterica Serovar
Typhimurium Colitis. Infect Immun. 2013;81:3672–83. doi:10.1128/IAI.00854-13.
198. Van der Sluis M, De Koning BAE, De Bruijn ACJM, Velcich A, Meijerink JPP, Van
Goudoever JB, et al. Muc2-Deficient Mice Spontaneously Develop Colitis, Indicating That
MUC2 Is Critical for Colonic Protection. Gastroenterology. 2006;131:117–29.
doi:10.1053/j.gastro.2006.04.020.
199. Bekiaris V, Persson EK, Agace WW. Intestinal dendritic cells in the regulation of mucosal
immunity. Immunol Rev. 2014;260:86–101. doi:10.1111/imr.12194.
200. Stagg AJ. Intestinal Dendritic Cells in Health and Gut Inflammation. Front Immunol.
2018;9:2883. doi:10.3389/fimmu.2018.02883.
201. Kennedy RH, Silver R. Neuroimmune Signaling: Cytokines and the CNS. In: Neuroscience
in the 21st Century. New York, NY: Springer New York; 2015. p. 1–41. doi:10.1007/978-1-
4614-6434-1_174-1.
202. Prinz M, Priller J. The role of peripheral immune cells in the CNS in steady state and
disease. Nat Neurosci. 2017;20:136–44. doi:10.1038/nn.4475.
203. Daneman R, Rescigno M. The gut immune barrier and the blood-brain barrier: are they so
different? Immunity. 2009;31:722–35. doi:10.1016/j.immuni.2009.09.012.
204. Lin A, Zheng W, He Y, Tang W, Wei X, He R, et al. Gut microbiota in patients with
Parkinson’s disease in southern China. Parkinsonism Relat Disord. 2018;53:82–8.
doi:10.1016/j.parkreldis.2018.05.007.
205. Unger MM, Spiegel J, Dillmann K-U, Grundmann D, Philippeit H, Bürmann J, et al. Short
chain fatty acids and gut microbiota differ between patients with Parkinson’s disease and age-
matched controls. Parkinsonism Relat Disord. 2016;32:66–72.
doi:10.1016/J.PARKRELDIS.2016.08.019.
206. Minato T, Maeda T, Fujisawa Y, Tsuji H, Nomoto K, Ohno K, et al. Progression of
Parkinson’s disease is associated with gut dysbiosis: Two-year follow-up study. PLoS One.
2017;12:e0187307. doi:10.1371/journal.pone.0187307.
207. Svensson E, Horváth-Puhó E, Thomsen RW, Djurhuus JC, Pedersen L, Borghammer P, et
al. Vagotomy and subsequent risk of Parkinson’s disease. Ann Neurol. 2015;78:522–9.
doi:10.1002/ana.24448.
208. Liu B, Fang F, Pedersen NL, Tillander A, Ludvigsson JF, Ekbom A, et al. Vagotomy and
Parkinson disease: A Swedish register-based matched-cohort study. Neurology. 2017;88:1996–
2002. doi:10.1212/WNL.0000000000003961.
209. Ulusoy A, Phillips RJ, Helwig M, Klinkenberg M, Powley TL, Di Monte DA. Brain-to-
stomach transfer of α-synuclein via vagal preganglionic projections. Acta Neuropathol.
2017;133:381–93. doi:10.1007/s00401-016-1661-y.
210. Bhattacharyya D, Mohite GM, Krishnamoorthy J, Gayen N, Mehra S, Navalkar A, et al.
Lipopolysaccharide from Gut Microbiota Modulates α-Synuclein Aggregation and Alters Its

176
Biological Function. ACS Chem Neurosci. 2019;10:2229–36.
doi:10.1021/acschemneuro.8b00733.
211. Fitzgerald E, Murphy S, Martinson HA. Alpha-Synuclein Pathology and the Role of the
Microbiota in Parkinson’s Disease. Front Neurosci. 2019;13:369. doi:10.3389/fnins.2019.00369.
212. Yan F, Chen Y, Li M, Wang Y, Zhang W, Chen X, et al. Gastrointestinal nervous system α-
synuclein as a potential biomarker of Parkinson disease. Medicine (Baltimore). 2018;97:e11337.
doi:10.1097/MD.0000000000011337.
213. Aragon G, Graham DB, Borum M, Doman DB. Probiotic therapy for irritable bowel
syndrome. Gastroenterol Hepatol (N Y). 2010;6:39–44.
http://www.ncbi.nlm.nih.gov/pubmed/20567539. Accessed 16 Jun 2019.
214. Sanz Y, Nadal I, Sánchez E. Probiotics as drugs against human gastrointestinal infections.
Recent Pat Antiinfect Drug Discov. 2007;2:148–56.
http://www.ncbi.nlm.nih.gov/pubmed/18221171. Accessed 16 Jun 2019.
215. Slyepchenko A, Carvalho AF, Cha DS, Kasper S, McIntyre RS. Gut emotions - mechanisms
of action of probiotics as novel therapeutic targets for depression and anxiety disorders. CNS
Neurol Disord Drug Targets. 2014;13:1770–86. http://www.ncbi.nlm.nih.gov/pubmed/25470391.
Accessed 16 Jun 2019.
216. Sarowska J, Choroszy-Król I, Regulska-Ilow B, Frej-Mądrzak M, Jama-Kmiecik A. The
therapeutic effect of probiotic bacteria on gastrointestinal diseases. Adv Clin Exp Med. 22:759–
66. http://www.ncbi.nlm.nih.gov/pubmed/24285463. Accessed 16 Jun 2019.
217. Shkoporov AN, Hill C. Bacteriophages of the Human Gut: The "Known
Unknown" of the Microbiome. Cell Host Microbe. 2019;25:195–209.
doi:10.1016/j.chom.2019.01.017.
218. Petrof EO, Gloor GB, Vanner SJ, Weese SJ, Carter D, Daigneault MC, et al. Stool
substitute transplant therapy for the eradication of Clostridium difficile infection:
‘RePOOPulating’ the gut. Microbiome. 2013;1:3. doi:10.1186/2049-2618-1-3.
219. Gaudier E, Michel C, Segain J-P, Cherbut C, Hoebler C. The VSL# 3 Probiotic Mixture
Modifies Microflora but Does Not Heal Chronic Dextran-Sodium Sulfate–Induced Colitis or
Reinforce the Mucus Barrier in Mice. J Nutr. 2005;135:2753–61. doi:10.1093/jn/135.12.2753.
220. Chapman TM, Plosker GL, Figgitt DP. VSL#3 Probiotic Mixture. Drugs. 2006;66:1371–87.
doi:10.2165/00003495-200666100-00006.
221. Mimura T, Rizzello F, Helwig U, Poggioli G, Schreiber S, Talbot IC, et al. Once daily high
dose probiotic therapy (VSL#3) for maintaining remission in recurrent or refractory pouchitis.
Gut. 2004;53:108–14. doi:10.1136/gut.53.1.108.
222. Kumar M, Kissoon-Singh V, Coria AL, Moreau F, Chadee K. Probiotic mixture VSL#3
reduces colonic inflammation and improves intestinal barrier function in Muc2 mucin-deficient
mice. Am J Physiol Liver Physiol. 2017;312:G34–45. doi:10.1152/ajpgi.00298.2016.
223. Wang C-S-E, Li W-B, Wang H-Y, Ma Y-M, Zhao X-H, Yang H, et al. VSL#3 can prevent
ulcerative colitis-associated carcinogenesis in mice. World J Gastroenterol. 2018;24:4254–62.

177
doi:10.3748/wjg.v24.i37.4254.
224. Tankou SK, Regev K, Healy BC, Cox LM, Tjon E, Kivisakk P, et al. Investigation of
probiotics in multiple sclerosis. Mult Scler J. 2018;24:58–63. doi:10.1177/1352458517737390.
225. Distrutti E, O’Reilly J-A, McDonald C, Cipriani S, Renga B, Lynch MA, et al. Modulation
of intestinal microbiota by the probiotic VSL#3 resets brain gene expression and ameliorates the
age-related deficit in LTP. PLoS One. 2014;9:e106503. doi:10.1371/journal.pone.0106503.
226. Herrero M-T, Estrada C, Maatouk L, Vyas S. Inflammation in Parkinson’s disease: role of
glucocorticoids. Front Neuroanat. 2015;9 APR:32.
227. Jones BC, Huang X, Mailman RB, Lu L, Williams RW. The Perplexing Paradox of
Paraquat: the Case for Host-Based Susceptibility and Postulated Neurodegenerative Effects.
Journal of biochemical and molecular toxicology. 2014;28:191–7.
228. Wang A, Costello S, Cockburn M, Zhang X, Bronstein J, Ritz B. Parkinson’s disease risk
from ambient exposure to pesticides. Eur J Epidemiol. 2011;26:547–55. doi:10.1007/s10654-
011-9574-5.
229. Dick FD, De Palma G, Ahmadi A, Scott NW, Prescott GJ, Bennett J, et al. Environmental
risk factors for Parkinson’s disease and parkinsonism: the Geoparkinson study. Occup Environ
Med. 2007;64:666–72. doi:10.1136/oem.2006.027003.
230. Norris EH, Uryu K, Leight S, Giasson BI, Trojanowski JQ, Lee VM-Y. Pesticide Exposure
Exacerbates α-Synucleinopathy in an A53T Transgenic Mouse Model. Am J Pathol.
2007;170:658–66. doi:10.2353/AJPATH.2007.060359.
231. Bonneh-Barkay D, Reaney SH, Langston WJ, Di Monte DA. Redox cycling of the
herbicide paraquat in microglial cultures. Mol Brain Res. 2005;134:52–6.
doi:10.1016/j.molbrainres.2004.11.005.
232. Thiruchelvam M, McCormack A, Richfield EK, Baggs RB, Tank AW, Di Monte DA, et al.
Age-related irreversible progressive nigrostriatal dopaminergic neurotoxicity in the paraquat and
maneb model of the Parkinson’s disease phenotype. Eur J Neurosci. 2003;18:589–600.
doi:10.1046/j.1460-9568.2003.02781.x.
233. Goodall EF, Wang C, Simpson JE, Baker DJ, Drew DR, Heath PR, et al. Age-associated
changes in the blood-brain barrier: comparative studies in human and mouse. Neuropathol Appl
Neurobiol. 2018;44:328–40. doi:10.1111/nan.12408.
234. Elahy M, Jackaman C, Mamo J, Lam V, Dhaliwal SS, Giles C, et al. Blood–brain barrier
dysfunction developed during normal aging is associated with inflammation and loss of tight
junctions but not with leukocyte recruitment. Immun Ageing. 2015;12:2. doi:10.1186/s12979-
015-0029-9.
235. Olah M, Patrick E, Villani A-C, Xu J, White CC, Ryan KJ, et al. A transcriptomic atlas of
aged human microglia. Nat Commun. 2018;9:539. doi:10.1038/s41467-018-02926-5.
236. Mangano EN, Litteljohn D, So R, Nelson E, Peters S, Bethune C, et al. Interferon-γ plays a
role in paraquat-induced neurodegeneration involving oxidative and proinflammatory pathways.
Neurobiol Aging. 2012;33:1411–26.

178
237. Hauss-Wegrzyniak B, Galons J-P, Wenk GL. Quantitative Volumetric Analyses of Brain
Magnetic Resonance Imaging from Rat with Chronic Neuroinflammation. Exp Neurol.
2000;165:347–54. doi:10.1006/EXNR.2000.7469.
238. Lepore S, Waiczies H, Hentschel J, Ji Y, Skodowski J, Pohlmann A, et al. Enlargement of
cerebral ventricles as an early indicator of encephalomyelitis. PLoS One. 2013;8:e72841.
doi:10.1371/journal.pone.0072841.
239. Wang X, Hagberg H, Zhu C, Jacobsson B, Mallard C. Effects of intrauterine inflammation
on the developing mouse brain. Brain Res. 2007;1144:180–5.
doi:10.1016/J.BRAINRES.2007.01.083.
240. Clarkson ED, Rosa FG, Edwards-Prasad J, Weiland DA, Witta SE, Freed CR, et al.
Improvement of neurological deficits in 6-hydroxydopamine-lesioned rats after transplantation
with allogeneic simian virus 40 large tumor antigen gene-induced immortalized dopamine cells.
Proc Natl Acad Sci U S A. 1998;95:1265–70. doi:10.1073/pnas.95.3.1265.
241. Dravid A, Jaton AL, Enz A, Frei P. Spontaneous recovery from motor asymmetry in adult
rats with 6-hydroxydopamine-induced partial lesions of the substantia nigra. Brain Res.
1984;311:361–5. doi:10.1016/0006-8993(84)90101-X.
242. Mitsumoto Y, Watanabe A, Mori A, Koga N. Spontaneous Regeneration of Nigrostriatal
Dopaminergic Neurons in MPTP-Treated C57BL/6 Mice. Biochem Biophys Res Commun.
1998;248:660–3. doi:10.1006/bbrc.1998.8986.
243. Wu W, Li Y. Lung injury caused by paraquat poisoning results in increased interleukin‑6
and decreased microRNA‑146a levels. Exp Ther Med. 2018;16:406–12.
doi:10.3892/etm.2018.6153.
244. Schapochnik A, da Silva MR, Leal MP, Esteves J, Hebeda CB, Sandri S, et al. Vitamin D
treatment abrogates the inflammatory response in paraquat-induced lung fibrosis. Toxicol Appl
Pharmacol. 2018;355:60–7.
245. Delirrad M, Majidi M, Boushehri B. Clinical features and prognosis of paraquat poisoning:
a review of 41 cases. Int J Clin Exp Med. 2015;8:8122–8.
http://www.ncbi.nlm.nih.gov/pubmed/26221379. Accessed 2 Jul 2019.
246. Dinis-Oliveira RJ, Duarte JA, Sánchez-Navarro A, Remião F, Bastos ML, Carvalho F.
Paraquat Poisonings: Mechanisms of Lung Toxicity, Clinical Features, and Treatment. Crit Rev
Toxicol. 2008;38:13–71. doi:10.1080/10408440701669959.
247. Huang J, Ning N, Zhang W. Effects of paraquat on IL‑6 and TNF‑α in macrophages. Exp
Ther Med. 2018. doi:10.3892/etm.2018.7099.
248. Hoenen C, Gustin A, Birck C, Kirchmeyer M, Beaume N, Felten P, et al. Alpha-Synuclein
Proteins Promote Pro-Inflammatory Cascades in Microglia: Stronger Effects of the A53T
Mutant. PLoS One. 2016;11:e0162717. doi:10.1371/journal.pone.0162717.
249. Liu Y, Yang X, Guo C, Nie P, Liu Y, Ma J. Essential Role of MFG-E8 for Phagocytic
Properties of Microglial Cells. PLoS One. 2013;8:e55754. doi:10.1371/journal.pone.0055754.
250. Fuller AD, Van Eldik LJ. MFG-E8 Regulates Microglial Phagocytosis of Apoptotic

179
Neurons. J Neuroimmune Pharmacol. 2008;3:246–56. doi:10.1007/s11481-008-9118-2.
251. Neniskyte U, Brown GC. Lactadherin/MFG-E8 is essential for microglia-mediated neuronal
loss and phagoptosis induced by amyloid β. J Neurochem. 2013;126:312–7.
doi:10.1111/jnc.12288.
252. Neher JJ, Neniskyte U, Zhao J-W, Bal-Price A, Tolkovsky AM, Brown GC. Inhibition of
Microglial Phagocytosis Is Sufficient To Prevent Inflammatory Neuronal Death. J Immunol.
2011;186:4973–83. doi:10.4049/JIMMUNOL.1003600.
253. Rodríguez AM, Delpino MV, Miraglia MC, Costa Franco MM, Barrionuevo P, Dennis VA,
et al. Brucella abortus -activated microglia induce neuronal death through primary phagocytosis.
Glia. 2017;65:1137–51. doi:10.1002/glia.23149.
254. Houzé P, Baud FJ, Mouy R, Bismuth C, Bourdon R, Scherrmann JM. Toxicokinetics of
Paraquat in Humans. Hum Exp Toxicol. 1990;9:5–12. doi:10.1177/096032719000900103.
255. Prasad K, Winnik B, Thiruchelvam MJ, Buckley B, Mirochnitchenko O, Richfield EK.
Prolonged Toxicokinetics and Toxicodynamics of Paraquat in Mouse Brain. Environ Health
Perspect. 2007;115:1448–53. doi:10.1289/ehp.9932.
256. Zhang L, Feng Q, Wang T. Necrostatin-1 Protects Against Paraquat-Induced Cardiac
Contractile Dysfunction via RIP1-RIP3-MLKL-Dependent Necroptosis Pathway. Cardiovasc
Toxicol. 2018;18:346–55. doi:10.1007/s12012-017-9441-z.
257. Smith P, Heath D. Paraquat lung: a reappraisal. Thorax. 1974;29:643.
doi:10.1136/thx.29.6.643.
258. Smith P, Heath D. The ultrastructure and time sequence of the early stages of paraquat lung
in rats. J Pathol. 1974;114:177–84. doi:10.1002/path.1711140402.
259. Lei Y, Li X, Yuan F, Liu L, Zhang J, Yang Y, et al. Toll-like receptor 4 ablation rescues
against paraquat-triggered myocardial dysfunction: Role of ER stress and apoptosis. Environ
Toxicol. 2017;32:656–68. doi:10.1002/tox.22267.
260. Wang S, Zhu X, Xiong L, Zhang Y, Ren J. Toll-like receptor 4 knockout alleviates
paraquat-induced cardiomyocyte contractile dysfunction through an autophagy-dependent
mechanism. Toxicol Lett. 2016;257:11–22. doi:10.1016/j.toxlet.2016.05.024.
261. Lu Y-C, Yeh W-C, Ohashi PS. LPS/TLR4 signal transduction pathway. Cytokine.
2008;42:145–51. doi:10.1016/J.CYTO.2008.01.006.
262. Tung J-N, Lang Y-D, Wang L-F, Chen C-M. Paraquat increases connective tissue growth
factor and collagen expression via angiotensin signaling pathway in human lung fibroblasts.
Toxicol Vitr. 2010;24:803–8. doi:10.1016/j.tiv.2009.12.015.
263. Qian J, Liu L, Chen L, Lu X, Zhu C. Increased toll-like receptor 9 expression is associated
with the severity of paraquat-induced lung injury in mice. Hum Exp Toxicol. 2015;34:430–8.
doi:10.1177/0960327114542963.
264. Takahashi T, Takahashi Y, Nio M. Remodeling of the alveolar structure in the paraquat
lung of humans: a morphometric study. Hum Pathol. 1994;25:702–8.

180
http://www.ncbi.nlm.nih.gov/pubmed/8026829. Accessed 30 Apr 2019.
265. Haukvik UK, Hartberg CB, Agartz I. Schizofreni – hva viser strukturell MR? Tidsskr Den
Nor legeforening. 2013;133:850–3. doi:10.4045/tidsskr.12.1084.
266. Apostolova L, Alves G, Hwang KS, Babakchanian S, Bronnick KS, Larsen JP, et al.
Hippocampal and ventricular changes in Parkinson’s disease mild cognitive impairment.
Neurobiol Aging. 2012;33:2113–24. doi:10.1016/j.neurobiolaging.2011.06.014.
267. Dalaker TO, Zivadinov R, Ramasamy DP, Beyer MK, Alves G, Bronnick KS, et al.
Ventricular enlargement and mild cognitive impairment in early Parkinson’s disease. Mov
Disord. 2011;26:297–301. doi:10.1002/mds.23443.
268. Park J-W, Lee C-N, Sim Y, Ham H-K, Tae W-S, Kim B-J. Automated Subfield Volumetric
Analysis of Hippocampus in Patients with Drug-Naïve Nondementia Parkinson’s Disease.
Parkinsons Dis. 2019;2019:1–5. doi:10.1155/2019/8254263.
269. Kluger BM, Zhao Q, Tanner JJ, Schwab NA, Levy S-A, Burke SE, et al. Structural brain
correlates of fatigue in older adults with and without Parkinson’s disease. NeuroImage Clin.
2019;22:101730. doi:10.1016/j.nicl.2019.101730.
270. Tysnes O-B, Storstein A. Epidemiology of Parkinson’s disease. J Neural Transm.
2017;124:901–5. doi:10.1007/s00702-017-1686-y.
271. Lee J-WW, Cannon JR. LRRK2 mutations and neurotoxicant susceptibility. Exp Biol Med.
2015;240:752–9.
272. Cannon JR, Greenamyre JT. Gene-environment interactions in Parkinson’s disease: Specific
evidence in humans and mammalian models. Neurobiology of Disease. 2013;57:38–46.
273. Goldman SM, Kamel F, Ross GW, Bhudhikanok GS, Hoppin JA, Korell M, et al. Genetic
modification of the association of paraquat and Parkinson’s disease. Mov Disord. 2012;27:1652–
8.
274. Montgomery EB. Heavy metals and the etiology of Parkinson’s disease and other
movement disorders. Toxicology. 1995;97:3–9. http://www.ncbi.nlm.nih.gov/pubmed/7716790.
Accessed 16 Jun 2019.
275. Olsen LK, Dowd E, McKernan DP. A role for viral infections in Parkinson’s etiology?
Neuronal Signal. 2018;2:NS20170166. doi:10.1042/NS20170166.
276. Stein DJ, Vasconcelos MF, Albrechet-Souza L, Ceresér KMM, de Almeida RMM.
Microglial Over-Activation by Social Defeat Stress Contributes to Anxiety- and Depressive-Like
Behaviors. Front Behav Neurosci. 2017;11:207. doi:10.3389/fnbeh.2017.00207.
277. Xiong Y, Neifert S, Karuppagounder SS, Liu Q, Stankowski JN, Lee BD, et al. Robust
kinase- and age-dependent dopaminergic and norepinephrine neurodegeneration in LRRK2
G2019S transgenic mice. Proc Natl Acad Sci U S A. 2018;115:1635–40.
doi:10.1073/pnas.1712648115.
278. Kozina E, Sadasivan S, Jiao Y, Dou Y, Ma Z, Tan H, et al. Mutant LRRK2 mediates
peripheral and central immune responses leading to neurodegeneration in vivo. Brain.

181
2018;:awy077–awy077.
279. Erny D, Hrabě de Angelis AL, Jaitin D, Wieghofer P, Staszewski O, David E, et al. Host
microbiota constantly control maturation and function of microglia in the CNS. Nat Neurosci.
2015;18:965–77. doi:10.1038/nn.4030.
280. Scheperjans F, Aho V, Pereira PAB, Koskinen K, Paulin L, Pekkonen E, et al. Gut
microbiota are related to Parkinson’s disease and clinical phenotype. Mov Disord. 2015;30:350–
8. doi:10.1002/mds.26069.
281. Hill-Burns EM, Debelius JW, Morton JT, Wissemann WT, Lewis MR, Wallen ZD, et al.
Parkinson’s disease and Parkinson’s disease medications have distinct signatures of the gut
microbiome. Mov Disord. 2017;32:739–49. doi:10.1002/mds.26942.
282. Lai S-W, Liao K-F, Lin C-L, Sung F-C. Irritable bowel syndrome correlates with increased
risk of Parkinson’s disease in Taiwan. Eur J Epidemiol. 2014;29:57–62. doi:10.1007/s10654-
014-9878-3.
283. Wandu WS, Tan C, Ogbeifun O, Vistica BP, Shi G, Hinshaw SJH, et al. Leucine-rich repeat
kinase 2 (Lrrk2) deficiency diminishes the development of experimental autoimmune uveitis
(EAU) and the adaptive immune response. PLoS One. 2015;10.
284. Shannon KM, Keshavarzian A, Mutlu E, Dodiya HB, Daian D, Jaglin JA, et al. Alpha-
synuclein in colonic submucosa in early untreated Parkinson’s disease. Mov Disord.
2012;27:709–15. doi:10.1002/mds.23838.
285. Shannon KM, Keshavarzian A, Dodiya HB, Jakate S, Kordower JH. Is alpha-synuclein in
the colon a biomarker for premotor Parkinson’s Disease? Evidence from 3 cases. Mov Disord.
2012;27:716–9. doi:10.1002/mds.25020.
286. Yang X, Qian Y, Xu S, Song Y, Xiao Q. Longitudinal Analysis of Fecal Microbiome and
Pathologic Processes in a Rotenone Induced Mice Model of Parkinson’s Disease. Front Aging
Neurosci. 2018;9:441. doi:10.3389/fnagi.2017.00441.
287. De Simone C. P884 No shared mechanisms among “old” and “new” VSL#3: Implications
for claims and guidelines. J Crohn’s Colitis. 2018;12 supplement_1:S564–5. doi:10.1093/ecco-
jcc/jjx180.1011.
288. Cinque B, La Torre C, Lombardi F, Palumbo P, Evtoski Z, Jr Santini S, et al. VSL#3
probiotic differently influences IEC-6 intestinal epithelial cell status and function. J Cell Physiol.
2017;232:3530–9. doi:10.1002/jcp.25814.
289. Li Y-J, Dai C, Jiang M. Mechanisms of Probiotic VSL#3 in a Rat Model of Visceral
Hypersensitivity Involves the Mast Cell-PAR2-TRPV1 Pathway. Dig Dis Sci. 2019;64:1182–92.
doi:10.1007/s10620-018-5416-6.
290. Ding C, Han F, Xiang H, Wang Y, Li Y, Zheng J, et al. Probiotics ameliorate renal
ischemia-reperfusion injury by modulating the phenotype of macrophages through the IL-
10/GSK-3β/PTEN signaling pathway. Pflügers Arch - Eur J Physiol. 2019;471:573–81.
doi:10.1007/s00424-018-2213-1.
291. Zhang C, He A, Liu S, He Q, Luo Y, He Z, et al. Inhibition of HtrA2 alleviated dextran

182
sulfate sodium (DSS)-induced colitis by preventing necroptosis of intestinal epithelial cells. Cell
Death Dis. 2019;10:344. doi:10.1038/s41419-019-1580-7.
292. Meers GK, Bohnenberger H, Reichardt HM, Lühder F, Reichardt SD. Impaired resolution
of DSS-induced colitis in mice lacking the glucocorticoid receptor in myeloid cells. PLoS One.
2018;13:e0190846. doi:10.1371/journal.pone.0190846.
293. Yang Y, Chen G, Yang Q, Ye J, Cai X, Tsering P, et al. Gut microbiota drives the
attenuation of dextran sulphate sodium-induced colitis by Huangqin decoction. Oncotarget.
2017;8:48863–74. doi:10.18632/oncotarget.16458.
294. Litteljohn D, Nelson E, Hayley S. IFN-gamma differentially modulates memory-related
processes under basal and chronic stressor conditions. Front Cell Neurosci. 2014;8:391.
295. Mamady H, Storey KB. Up-regulation of the endoplasmic reticulum molecular chaperone
GRP78 during hibernation in thirteen-lined ground squirrels. Mol Cell Biochem. 2006;292:89–
98.
296. Bustin SA, Benes V, Garson JA, Hellemans J, Huggett J, Kubista M, et al. The MIQE
Guidelines: Minimum Information for Publication of Quantitative Real-Time PCR Experiments.
Clin Chem. 2009;55:611–22. doi:10.1373/clinchem.2008.112797.
297. Schmittgen TD, Livak KJ. Analyzing real-time PCR data by the comparative C(T) method.
Nat Protoc. 2008;3:1101–8.
298. Rudyk C, Dwyer Z, Hayley S, CLINT membership. Leucine-rich repeat kinase-2 (LRRK2)
modulates paraquat-induced inflammatory sickness and stress phenotype. J Neuroinflammation.
2019;16:120. doi:10.1186/s12974-019-1483-7.
299. Langston JW, Forno LS, Tetrud J, Reeves AG, Kaplan JA, Karluk D. Evidence of active
nerve cell degeneration in the substantia nigra of humans years after 1-methyl-4-phenyl-1,2,3,6-
tetrahydropyridine exposure. Ann Neurol. 1999;46:598–605.
http://www.ncbi.nlm.nih.gov/pubmed/10514096. Accessed 7 May 2019.
300. McGeer P, McGeer E. Mechanisms of cell death in Alzheimer disease--immunopathology. -
PubMed - NCBI. J Neural Transm. 1998;54:159–66.
https://www.ncbi.nlm.nih.gov/pubmed/9850924/. Accessed 7 May 2019.
301. Kim WG, Mohney RP, Wilson B, Jeohn GH, Liu B, Hong JS. Regional difference in
susceptibility to lipopolysaccharide-induced neurotoxicity in the rat brain: role of microglia. J
Neurosci. 2000;20:6309–16. http://www.ncbi.nlm.nih.gov/pubmed/10934283. Accessed 13 Jun
2019.
302. Qin L, Wu X, Block ML, Liu Y, Breese GR, Hong J-S, et al. Systemic LPS causes chronic
neuroinflammation and progressive neurodegeneration. Glia. 2007;55:453–62.
doi:10.1002/glia.20467.
303. Gaig C, Tolosa E. When does Parkinson’s disease begin? Mov Disord. 2009;24:S656–64.
doi:10.1002/mds.22672.
304. Savica R, Rocca WA, Ahlskog JE. When Does Parkinson Disease Start? Arch Neurol.
2010;67:798–801. doi:10.1001/archneurol.2010.135.

183
305. Pietrucci D, Cerroni R, Unida V, Farcomeni A, Pierantozzi M, Mercuri NB, et al. Dysbiosis
of gut microbiota in a selected population of Parkinson’s patients. Parkinsonism Relat Disord.
2019. doi:10.1016/j.parkreldis.2019.06.003.
306. Lin DM, Koskella B, Lin HC. Phage therapy: An alternative to antibiotics in the age of
multi-drug resistance. World J Gastrointest Pharmacol Ther. 2017;8:162–73.
doi:10.4292/wjgpt.v8.i3.162.
307. McFarland L V. Use of probiotics to correct dysbiosis of normal microbiota following
disease or disruptive events: a systematic review. BMJ Open. 2014;4:e005047.
doi:10.1136/BMJOPEN-2014-005047.
308. Mar JS, Nagalingam NA, Song Y, Onizawa M, Lee JW, Lynch S V. Amelioration of DSS-
induced murine colitis by VSL#3 supplementation is primarily associated with changes in ileal
microbiota composition. Gut Microbes. 2014;5:494–503. doi:10.4161/gmic.32147.
309. Mariman R, Tielen F, Koning F, Nagelkerken L. The Probiotic Mixture VSL#3 Has
Differential Effects on Intestinal Immune Parameters in Healthy Female BALB/c and C57BL/6
Mice. J Nutr. 2015;145:1354–61. doi:10.3945/jn.114.199729.
310. Håkansson Å, Tormo-Badia N, Baridi A, Xu J, Molin G, Hagslätt M-L, et al.
Immunological alteration and changes of gut microbiota after dextran sulfate sodium (DSS)
administration in mice. Clin Exp Med. 2015;15:107–20. doi:10.1007/s10238-013-0270-5.
311. Selvanantham T, Lin Q, Guo CX, Surendra A, Fieve S, Escalante NK, et al. NKT Cell-
Deficient Mice Harbor an Altered Microbiota That Fuels Intestinal Inflammation during
Chemically Induced Colitis. J Immunol. 2016;197:4464–72. doi:10.4049/jimmunol.1601410.
312. Chassaing B, Aitken JD, Malleshappa M, Vijay-Kumar M. Dextran sulfate sodium (DSS)-
induced colitis in mice. Curr Protoc Immunol. 2014;104:Unit 15.25.
doi:10.1002/0471142735.im1525s104.
313. Do J, Woo J. From Gut to Brain: Alteration in Inflammation Markers in the Brain of
Dextran Sodium Sulfate-induced Colitis Model Mice. Clin Psychopharmacol Neurosci.
2018;16:422–33. doi:10.9758/cpn.2018.16.4.422.
314. Chassaing B, Srinivasan G, Delgado MA, Young AN, Gewirtz AT, Vijay-Kumar M. Fecal
Lipocalin 2, a Sensitive and Broadly Dynamic Non-Invasive Biomarker for Intestinal
Inflammation. PLoS One. 2012;7:e44328. doi:10.1371/journal.pone.0044328.
315. Li Q, Peng X, Yang H, Wang H, Shu Y. Deficiency of Multidrug and Toxin Extrusion 1
Enhances Renal Accumulation of Paraquat and Deteriorates Kidney Injury in Mice. Mol Pharm.
2011;8:2476–83. doi:10.1021/mp200395f.
316. Sun Y, Zheng J, Xu Y, Zhang X. Paraquat-induced inflammatory response of microglia
through HSP60/TLR4 signaling. Hum Exp Toxicol. 2018;37:1161–8.
doi:10.1177/0960327118758152.
317. Yang H, Qi H, Ren J, Cui J, Li Z, Waldum HL, et al. Involvement of NF-κB/IL-6 Pathway
in the Processing of Colorectal Carcinogenesis in Colitis Mice. Int J Inflam. 2014;2014:130981.
doi:10.1155/2014/130981.

184
318. Schapira AH V., Chaudhuri KR, Jenner P. Non-motor features of Parkinson disease. Nat
Rev Neurosci. 2017;18:435–50.
319. Chaudhuri KR, Healy DG, Schapira AH V. Non-motor symptoms of Parkinson’s disease:
Diagnosis and management. Lancet Neurology. 2006;5:235–45.
320. Lesage S, Dürr A, Tazir M, Lohmann E, Leutenegger A-L, Janin S, et al. LRRK2 G2019S
as a Cause of Parkinson’s Disease in North African Arabs. N Engl J Med. 2006;354:422–3.
doi:10.1056/NEJMc055540.
321. Clark LN, Wang Y, Karlins E, Saito L, Mejia-Santana H, Harris J, et al. Frequency of
LRRK2 mutations in early- and late-onset Parkinson disease. Neurology. 2006;67:1786–91.
322. Ozelius LJ, Senthil G, Saunders-Pullman R, Ohmann E, Deligtisch A, Tagliati M, et al.
LRRK2 G2019S as a Cause of Parkinson’s Disease in Ashkenazi Jews. N Engl J Med.
2006;354:424–5.
323. Cook DA, Kannarkat GT, Cintron AF, Butkovich LM, Fraser KB, Chang J, et al. LRRK2
levels in immune cells are increased in Parkinson’s disease. NPJ Park Dis. 2017;3:11.
324. Ho DH, Je AR, Lee H, Son I, Kweon H-S, Kim H-G, et al. LRRK2 Kinase Activity Induces
Mitochondrial Fission in Microglia via Drp1 and Modulates Neuroinflammation. Exp Neurobiol.
2018;27:171–80.
325. Russo I, Bubacco L, Greggio E. LRRK2 and neuroinflammation: partners in crime in
Parkinson’s disease? J Neuroinflammation. 2014;11:52.
326. Ma B, Xu L, Pan X, Sun L, Ding J, Xie C, et al. LRRK2 modulates microglial activity
through regulation of chemokine (C-X3-C) receptor 1 -mediated signalling pathways. Hum Mol
Genet. 2015;25:3515–23.
327. Karuppagounder SS, Xiong Y, Lee Y, Lawless MC, Kim D, Nordquist E, et al. LRRK2
G2019S Transgenic Mice Display Increased Susceptibility to 1-methyl-4-phenyl-1,2,3,6-
tetrahydropyridine (MPTP)-Mediated Neurotoxicity. J Chem Neuroanat. 2016;76 Pt B:90–7.
328. Breckenridge CB, Berry C, Chang ET, Sielken RL, Mandel JS. Association between
Parkinson’s Disease and Cigarette Smoking, Rural Living, Well-Water Consumption, Farming
and Pesticide Use: Systematic Review and Meta-Analysis. PLoS One. 2016;11:e0151841.
329. Baltazar MT, Dinis-Oliveira RJ, de Lourdes Bastos M, Tsatsakis AM, Duarte JA, Carvalho
F. Pesticides exposure as etiological factors of Parkinson’s disease and other neurodegenerative
diseases-A mechanistic approach. Toxicol Lett. 2014;230:85–103.
330. Kamel F. Epidemiology. Paths from pesticides to Parkinson’s. Science. 2013;341:722–3.
331. Freire C, Koifman S. Pesticide exposure and Parkinson’s disease: Epidemiological evidence
of association. NeuroToxicology. 2012;33:947–71.
332. Ishola IO, Akinyede AA, Adeluwa TP, Micah C. Novel action of vinpocetine in the
prevention of paraquat-induced parkinsonism in mice: involvement of oxidative stress and
neuroinflammation. Metab Brain Dis. 2018.
333. Rappold PM, Cui M, Chesser AS, Tibbett J, Grima JC, Duan L, et al. Paraquat

185
neurotoxicity is mediated by the dopamine transporter and organic cation transporter-3. Proc
Natl Acad Sci U S A. 2011;108:20766–71. doi:10.1073/pnas.1115141108.
334. Ritz BR, Manthripragada AD, Costello S, Lincoln SJ, Farrer MJ, Cockburn M, et al.
Dopamine transporter genetic variants and pesticides in Parkinson’s disease. Environ Health
Perspect. 2009;117:964–9.
335. Nixon AM, Meadowcroft MD, Neely EB, Snyder AM, Purnell CJ, Wright J, et al. HFE
Genotype Restricts the Response to Paraquat in a Mouse Model of Neurotoxicity. J Neurochem.
2018;145:299–311.
336. Lee AJ, Wang Y, Alcalay RN, Mejia-Santana H, Saunders-Pullman R, Bressman S, et al.
Penetrance estimate of LRRK2 p.G2019S mutation in individuals of non-Ashkenazi Jewish
ancestry. Mov Disord Off J Mov Disord Soc. 2017;32:1432–8.
337. Hayley S, Lacosta S, Merali Z, Van Rooijen N, Anisman H. Central monoamine and plasma
corticosterone changes induced by a bacterial endotoxin: Sensitization and cross-sensitization
effects. Eur J Neurosci. 2001;13:1155–65.
338. Paumier KL, Sukoff Rizzo SJ, Berger Z, Chen Y, Gonzales C, Kaftan E, et al. Behavioral
Characterization of A53T Mice Reveals Early and Late Stage Deficits Related to Parkinson’s
Disease. PLoS One. 2013;8:e70274. doi:10.1371/journal.pone.0070274.
339. Lim J, Bang Y, Choi J-H, Han A, Kwon M-S, Liu KH, et al. LRRK2 G2019S Induces
Anxiety/Depression-like Behavior before the Onset of Motor Dysfunction with 5-HT1A
Receptor Upregulation in Mice. J Neurosci. 2018;38:1611–21.
340. Szepesi Z, Manouchehrian O, Bachiller S, Deierborg T. Bidirectional Microglia–Neuron
Communication in Health and Disease. Front Cell Neurosci. 2018.
341. Dzamko NL. LRRK2 and the Immune System. Adv Neurobiol. 2017;14:123–43.
342. Lewis PA, Manzoni C. LRRK2 and human disease: a complicated question or a question of
complexes? Sci Signal. 2012;5:pe2.
343. Litteljohn D, Mangano E, Shukla N, Hayley S. Interferon-gamma deficiency modifies the
motor and co-morbid behavioral pathology and neurochemical changes provoked by the
pesticide paraquat. Neuroscience. 2009;164:1894–906.
344. Harchegani AL, Hemmati AA, Nili-Ahmadabadi A, Darabi B, Shabib S. Cromolyn Sodium
Attenuates Paraquat-Induced Lung Injury by Modulation of Proinflammatory Cytokines. Drug
Res (Stuttg). 2017;67:283–8.
345. Costa KM, Maciel IS, Kist LW, Campos MM, Bogo MR. Pharmacological inhibition of
CXCR2 chemokine receptors modulates paraquat-induced intoxication in rats. PLoS One.
2014;9:e105740.
346. Shen H, Wu N, Wang Y, Zhao H, Zhang L, Li T, et al. Chloroquine attenuates paraquat-
induced lung injury in mice by altering inflammation, oxidative stress and fibrosis. Int
Immunopharmacol. 2017;46:16–22.
347. Brebner K, Hayley S, Zacharko R, Merali Z, Anisman H. Synergistic effects of interleukin-

186
1beta, interleukin-6, and tumor necrosis factor-alpha: central monoamine, corticosterone, and
behavioral variations. Neuropsychopharmacol Off Publ Am Coll Neuropsychopharmacol.
2000;22:566–80.
348. Hayley S. The neuroimmune-neuroplasticity interface and brain pathology. Front Cell
Neurosci. 2014;8:419.
349. Griton M, Konsman JP. Neural pathways involved in infection-induced inflammation:
recent insights and clinical implications. Clin Auton Res Off J Clin Auton Res Soc.
2018;28:289–99.
350. Hayley S, Brebner K, Lacosta S, Merali Z, Anisman H. Sensitization to the effects of tumor
necrosis factor-alpha: neuroendocrine, central monoamine, and behavioral variations. J Neurosci.
1999;19:5654–65.
351. Banks WA. The blood-brain barrier in neuroimmunology: Tales of separation and
assimilation. Brain Behav Immun. 2015;44:1–8.
352. Zielinski MR, Dunbrasky DL, Taishi P, Souza G, Krueger JM. Vagotomy attenuates brain
cytokines and sleep induced by peripherally administered tumor necrosis factor-α and
lipopolysaccharide in mice. Sleep. 2013;36:1227–38, 1238A.
353. Garrido-Gil P, Rodriguez-Perez AI, Dominguez-Meijide A, Guerra MJ, Labandeira-Garcia
JL. Bidirectional Neural Interaction Between Central Dopaminergic and Gut Lesions in
Parkinson’s Disease Models. Mol Neurobiol. 2018;55:7297–316.
354. Anselmi L, Toti L. A Nigro−Vagal Pathway Controls Gastric Motility and Is Affected in a
Rat Model of Parkinsonism. Gastroenterology. 2017.
355. Vora P, McGovern DPB. LRRK2 as a negative regulator of NFAT: Implications for the
pathogenesis of inflammatory bowel disease. Expert Review of Clinical Immunology. 2012.
356. Bichler Z, Lim HC, Zeng L, Tan EK. Non-Motor and Motor Features in LRRK2 Transgenic
Mice. PLoS One. 2013.
357. Qian J, Liu L, Chen L, Lu X, Zhu C. Increased toll-like receptor 9 expression is associated
with the severity of paraquat-induced lung injury in mice. Hum Exp Toxicol. 2015;34:430–8.
358. Nolz JC, Gomez TS, Zhu P, Li S, Medeiros RB, Shimizu Y, et al. The WAVE2 complex
regulates actin cytoskeletal reorganization and CRAC-mediated calcium entry during T cell
activation. Curr Biol. 2006;16:24–34.
359. Ibarra N, Pollitt A, Insall RH. Regulation of actin assembly by SCAR/WAVE proteins.
Biochem Soc Trans. 2005;33:1243 LP – 1246.
360. Ma B, Xu L, Pan X, Sun L, Ding J, Xie C, et al. LRRK2 modulates microglial activity
through regulation of chemokine (C–X3–C) receptor 1 –mediated signalling pathways. Hum Mol
Genet . 2016.
361. Sheridan GK, Murphy KJ. Neuron-glia crosstalk in health and disease: fractalkine and
CX3CR1 take centre stage. Open Biol. 2013;3:130181–130181.
362. Cardona AE, Pioro EP, Sasse ME, Kostenko V, Cardona SM, Dijkstra IM, et al. Control of

187
microglial neurotoxicity by the fractalkine receptor. Nat Neurosci. 2006;9:917–24.
363. Febinger HY, Thomasy HE, Pavlova MN, Ringgold KM, Barf PR, George AM, et al. Time-
dependent effects of CX3CR1 in a mouse model of mild traumatic brain injury. J
Neuroinflammation. 2015;12.
364. Sharma RK, Oliveira AC, Kim S, Rigatto K, Zubcevic J, Rathinasabapathy A, et al.
Involvement of Neuroinflammation in the Pathogenesis of Monocrotaline-Induced Pulmonary
Hypertension. Hypertens (Dallas, Tex 1979). 2018;71:1156–63.
365. Lin HJ, Hsu CC, Chio CC, Tian YF, Lin MT, Lin TW, et al. Gamma-Secretase Inhibitors
Attenuate Neurotrauma and Neurogenic Acute Lung Injury in Rats by Rescuing the
Accumulation of Hypertrophic Microglia. Cell Physiol Biochem. 2018.
366. Li X, Patel JC, Wang J, Avshalumov M V., Nicholson C, Buxbaum JD, et al. Enhanced
striatal dopamine transmission and motor performance with LRRK2 overexpression in mice is
eliminated by familial Parkinson’s disease mutation G2019S. J Neurosci Off J Soc Neurosci.
2010;30:1788–97.
367. Yue M, Hinkle KM, Davies P, Trushina E, Fiesel FC, Christenson TA, et al. Progressive
dopaminergic alterations and mitochondrial abnormalities in LRRK2 G2019S knock-in mice.
Neurobiol Dis. 2015;78:172–95. doi:10.1016/j.nbd.2015.02.031.
368. Litteljohn D, Rudyk C, Dwyer Z, Farmer K, Fortin T, Hayley S. The impact of murine
LRRK2 G2019S transgene overexpression on acute responses to inflammatory challenge. Brain
Behav Immun. 2018;67:246–56.
369. McDonald WM, Richard IH, DeLong MR. Prevalence, etiology, and treatment of
depression in Parkinson’s disease. Biol Psychiatry. 2003;54:363–75.
370. Lee J-W, Tapias V, Di Maio R, Greenamyre JT, Cannon JR. Behavioral, neurochemical,
and pathologic alterations in bacterial artificial chromosome transgenic G2019S leucine-rich
repeated kinase 2 rats. Neurobiol Aging. 2015;36:505–18.
doi:10.1016/j.neurobiolaging.2014.07.011.
371. Chou JS, Chen CY, Chen YL, Weng YH, Yeh TH, Lu CS, et al. (G2019S) LRRK2 causes
early-phase dysfunction of SNpc dopaminergic neurons and impairment of corticostriatal long-
term depression in the PD transgenic mouse. Neurobiol Dis. 2014.
372. Sweet ES, Saunier-Rebori B, Yue Z, Blitzer RD. The Parkinson’s Disease-Associated
Mutation LRRK2-G2019S Impairs Synaptic Plasticity in Mouse Hippocampus. J Neurosci.
2015.
373. Winner B, Melrose HL, Zhao C, Hinkle KM, Yue M, Kent C, et al. Adult neurogenesis and
neurite outgrowth are impaired in LRRK2 G2019S mice. Neurobiol Dis. 2011.
374. Silverman MN, Sternberg EM. Glucocorticoid regulation of inflammation and its functional
correlates: From HPA axis to glucocorticoid receptor dysfunction. NIH Public Access; 2012.
375. German DC, Eagar T, Sonsalla PK. Parkinson’s Disease: A Role for the Immune System.
Curr Mol Pharmacol. 2011. http://www.ncbi.nlm.nih.gov/pubmed/21675953. Accessed 11 Jun
2019.

188
376. Ascherio A, Schwarzschild MA. The epidemiology of Parkinson’s disease: risk factors and
prevention. Lancet Neurol. 2016;15:1257–72. doi:10.1016/S1474-4422(16)30230-7.
377. Wu WY-Y, Kang K-H, Chen SL-S, Chiu SY-H, Yen AM-F, Fann JC-Y, et al. Hepatitis C
virus infection: a risk factor for Parkinson’s disease. J Viral Hepat. 2015;22:784–91.
doi:10.1111/jvh.12392.
378. Purisai MG, McCormack AL, Cumine S, Li J, Isla MZ, Di Monte DA. Microglial activation
as a priming event leading to paraquat-induced dopaminergic cell degeneration. Neurobiol Dis.
2007;25:392–400. doi:10.1016/j.nbd.2006.10.008.
379. Lee AJ, Wang Y, Alcalay RN, Mejia-Santana H, Saunders-Pullman R, Bressman S, et al.
Penetrance estimate of LRRK2 p.G2019S mutation in individuals of non-Ashkenazi Jewish
ancestry. Mov Disord. 2017;32:1432–8. doi:10.1002/mds.27059.
380. Marder K, Wang Y, Alcalay RN, Mejia-Santana H, Tang M-X, Lee A, et al. Age-specific
penetrance of LRRK2 G2019S in the Michael J. Fox Ashkenazi Jewish LRRK2 Consortium.
Neurology. 2015;85:89–95. doi:10.1212/WNL.0000000000001708.
381. Liu Z, Bryant N, Kumaran R, Beilina A, Abeliovich A, Cookson MR, et al. LRRK2
phosphorylates membrane-bound Rabs and is activated by GTP-bound Rab7L1 to promote
recruitment to the trans-Golgi network. Hum Mol Genet. 2018;27:385–95.
doi:10.1093/hmg/ddx410.
382. Moehle MS, Daher JPL, Hull TD, Boddu R, Abdelmotilib HA, Mobley J, et al. The G2019S
LRRK2 mutation increases myeloid cell chemotactic responses and enhances LRRK2 binding to
actin-regulatory proteins. Hum Mol Genet. 2015;24:4250–67. doi:10.1093/hmg/ddv157.
383. Kuss M, Adamopoulou E, Kahle PJ. Interferon-γ induces leucine-rich repeat kinase LRRK2
via extracellular signal-regulated kinase ERK5 in macrophages. J Neurochem. 2014;129:980–7.
doi:10.1111/jnc.12668.
384. Mount MP, Lira A, Grimes D, Smith PD, Faucher S, Slack R, et al. Involvement of
Interferon- in Microglial-Mediated Loss of Dopaminergic Neurons. J Neurosci. 2007;27:3328–
37. doi:10.1523/JNEUROSCI.5321-06.2007.
385. Elmore MRP, Najafi AR, Koike MA, Dagher NN, Spangenberg EE, Rice RA, et al.
Colony-Stimulating Factor 1 Receptor Signaling Is Necessary for Microglia Viability,
Unmasking a Microglia Progenitor Cell in the Adult Brain. Neuron. 2014;82:380–97.
doi:10.1016/j.neuron.2014.02.040.
386. Herzig MC, Kolly C, Persohn E, Theil D, Schweizer T, Hafner T, et al. LRRK2 protein
levels are determined by kinase function and are crucial for kidney and lung homeostasis in
mice. Hum Mol Genet. 2011;20:4209–23. doi:10.1093/hmg/ddr348.
387. Noyce AJ, Lees AJ, Schrag A-E. The prediagnostic phase of Parkinson’s disease. J Neurol
Neurosurg Psychiatry. 2016;87:871–8. doi:10.1136/jnnp-2015-311890.
388. Machado V, Zöller T, Attaai A, Spittau B. Microglia-mediated neuroinflammation and
neurotrophic factor-induced protection in the MPTP mouse model of parkinson’s disease-lessons
from transgenic mice. International Journal of Molecular Sciences. 2016;17.

189
389. Ginhoux F, Lim S, Hoeffel G, Low D, Huber T. Origin and differentiation of microglia.
Front Cell Neurosci. 2013;7:45. doi:10.3389/fncel.2013.00045.
390. Neumann H, Kotter MR, Franklin RJM. Debris clearance by microglia: an essential link
between degeneration and regeneration. Brain. 2008;132:288–95. doi:10.1093/brain/awn109.
391. Lecours C, Bordeleau M, Cantin L, Parent M, Paolo T Di, Tremblay M-È. Microglial
Implication in Parkinson’s Disease: Loss of Beneficial Physiological Roles or Gain of
Inflammatory Functions? Front Cell Neurosci. 2018;12:282. doi:10.3389/fncel.2018.00282.
392. Cook DA, Kannarkat GT, Cintron AF, Butkovich LM, Fraser KB, Chang J, et al. LRRK2
levels in immune cells are increased in Parkinson’s disease. npj Park Dis. 2017;3:11.
doi:10.1038/s41531-017-0010-8.
393. Yang X, Ren H, Wood K, Li M, Qiu S, Shi F-D, et al. Depletion of microglia augments the
dopaminergic neurotoxicity of MPTP. FASEB J. 2018;32:3336–45.
doi:10.1096/fj.201700833RR.
394. Elmore MRP, Hohsfield LA, Kramár EA, Soreq L, Lee RJ, Pham ST, et al. Replacement of
microglia in the aged brain reverses cognitive, synaptic, and neuronal deficits in mice. Aging
Cell. 2018;17:e12832. doi:10.1111/acel.12832.
395. Mok S, Koya RC, Tsui C, Xu J, Robert L, Wu L, et al. Inhibition of CSF-1 Receptor
Improves the Antitumor Efficacy of Adoptive Cell Transfer Immunotherapy. Cancer Res.
2014;74:153–61. doi:10.1158/0008-5472.CAN-13-1816.
396. Varvel NH, Grathwohl SA, Baumann F, Liebig C, Bosch A, Brawek B, et al. Microglial
repopulation model reveals a robust homeostatic process for replacing CNS myeloid cells. Proc
Natl Acad Sci U S A. 2012;109:18150–5. doi:10.1073/pnas.1210150109.
397. Najafi AR, Crapser J, Jiang S, Ng W, Mortazavi A, West BL, et al. A limited capacity for
microglial repopulation in the adult brain. Glia. 2018;66:2385–96. doi:10.1002/glia.23477.
398. Lee AJ, Wang Y, Alcalay RN, Mejia-Santana H, Saunders-Pullman R, Bressman S, et al.
Penetrance estimate of LRRK2 p.G2019S mutation in individuals of non-Ashkenazi Jewish
ancestry. Mov Disord. 2017;32:1432–8. doi:10.1002/mds.27059.
399. Russo I, Berti G, Plotegher N, Bernardo G, Filograna R, Bubacco L, et al. Leucine-rich
repeat kinase 2 positively regulates inflammation and down-regulates NF-κB p50 signaling in
cultured microglia cells. J Neuroinflammation. 2015;12:230. doi:10.1186/s12974-015-0449-7.
400. Ho DH, Kim H, Nam D, Sim H, Kim J, Kim HG, et al. LRRK2 impairs autophagy by
mediating phosphorylation of leucyl-tRNA synthetase. Cell Biochem Funct. 2018;36:431–42.
doi:10.1002/cbf.3364.
401. Ma B, Xu L, Pan X, Sun L, Ding J, Xie C, et al. LRRK2 modulates microglial activity
through regulation of chemokine (C–X3–C) receptor 1 –mediated signalling pathways. Hum Mol
Genet. 2016;25:3515–23. doi:10.1093/hmg/ddw194.
402. Beier EE, Neal M, Alam G, Edler M, Wu L-J, Richardson JR. Alternative microglial
activation is associated with cessation of progressive dopamine neuron loss in mice systemically
administered lipopolysaccharide. Neurobiol Dis. 2017;108:115–27.

190
doi:10.1016/j.nbd.2017.08.009.
403. Arimoto T, Choi D-Y, Lu X, Liu M, Nguyen X V., Zheng N, et al. Interleukin-10 protects
against inflammation-mediated degeneration of dopaminergic neurons in substantia nigra.
Neurobiol Aging. 2007;28:894–906. doi:10.1016/j.neurobiolaging.2006.04.011.
404. Johnston LC, Su X, Maguire-Zeiss K, Horovitz K, Ankoudinova I, Guschin D, et al. Human
Interleukin-10 Gene Transfer Is Protective in a Rat Model of Parkinson’s Disease. Mol Ther.
2008;16:1392–9. doi:10.1038/MT.2008.113.
405. Schildt A, Walker MD, Dinelle K, Miao Q, Schulzer M, O’Kusky J, et al. Single
Inflammatory Trigger Leads to Neuroinflammation in LRRK2 Rodent Model without
Degeneration of Dopaminergic Neurons. J Parkinsons Dis. 2019;9:121–39. doi:10.3233/JPD-
181446.
406. Zhang P-L, Chen Y, Zhang C-H, Wang Y-X, Fernandez-Funez P. Genetics of Parkinson’s
disease and related disorders. J Med Genet. 2018;55:73–80. doi:10.1136/jmedgenet-2017-
105047.
407. Fricker M, Oliva-Martín MJ, Brown GC. Primary phagocytosis of viable neurons by
microglia activated with LPS or Aβ is dependent on calreticulin/LRP phagocytic signalling. J
Neuroinflammation. 2012;9:196. doi:10.1186/1742-2094-9-196.
408. Lively S, Schlichter LC. Microglia Responses to Pro-inflammatory Stimuli (LPS,
IFNγ+TNFα) and Reprogramming by Resolving Cytokines (IL-4, IL-10). Front Cell Neurosci.
2018;12:215. doi:10.3389/fncel.2018.00215.
409. Chen Z, Jalabi W, Shpargel KB, Farabaugh KT, Dutta R, Yin X, et al. Lipopolysaccharide-
induced microglial activation and neuroprotection against experimental brain injury is
independent of hematogenous TLR4. J Neurosci. 2012;32:11706–15.
doi:10.1523/JNEUROSCI.0730-12.2012.
410. Mccarthy MM. Previews Location, Location, Location: Microglia Are Where They Live.
Neuron. 2017;95:233–5. doi:10.1016/j.neuron.2017.07.005.
411. Fernández-Arjona M del M, Grondona JM, Granados-Durán P, Fernández-Llebrez P,
López-Ávalos MD. Microglia Morphological Categorization in a Rat Model of
Neuroinflammation by Hierarchical Cluster and Principal Components Analysis. Front Cell
Neurosci. 2017;11:235. doi:10.3389/fncel.2017.00235.
412. Dheen ST, Kaur C, Ling E-A. Microglial activation and its implications in the brain
diseases. Curr Med Chem. 2007;14:1189–97. http://www.ncbi.nlm.nih.gov/pubmed/17504139.
Accessed 20 Jun 2019.
413. Arcuri C, Mecca C, Bianchi R, Giambanco I, Donato R. The Pathophysiological Role of
Microglia in Dynamic Surveillance, Phagocytosis and Structural Remodeling of the Developing
CNS. Front Mol Neurosci. 2017;10:191. doi:10.3389/fnmol.2017.00191.
414. Takahashi K. WAVE2 Protein Complex Coupled to Membrane and Microtubules. J Oncol.
2012;2012:590531. doi:10.1155/2012/590531.
415. Dwyer, Z., Rudyk, C., Thompson, A., Farmer, K., Fenner, B., Fortin, T., Derksen, A. HS.

191
Leucine rich repeat kinase-2 (LRRK2) modulates microglial phenotype and dopaminergic
neurodegeneration. Prep. 2019.
416. Stojiljkovic MR, Ain Q, Bondeva T, Heller R, Schmeer C, Witte OW. Phenotypic and
functional differences between senescent and aged murine microglia. Neurobiol Aging.
2019;74:56–69. doi:10.1016/J.NEUROBIOLAGING.2018.10.007.
417. Zöller T, Attaai A, Potru PS, Ruß T, Spittau B. Aged Mouse Cortical Microglia Display an
Activation Profile Suggesting Immunotolerogenic Functions. Int J Mol Sci. 2018;19.
doi:10.3390/ijms19030706.
418. Zujovic V, Benavides J, Vigé X, Carter C, Taupin V. Fractalkine modulates TNF-alpha
secretion and neurotoxicity induced by microglial activation. Glia. 2000;29:305–15.
http://www.ncbi.nlm.nih.gov/pubmed/10652441. Accessed 19 Jun 2019.
419. Zujovic V, Schussler N, Jourdain D, Duverger D, Taupin V. In vivo neutralization of
endogenous brain fractalkine increases hippocampal TNFalpha and 8-isoprostane production
induced by intracerebroventricular injection of LPS. J Neuroimmunol. 2001;115:135–43.
http://www.ncbi.nlm.nih.gov/pubmed/11282163. Accessed 19 Jun 2019.
420. Perea JR, Lleó A, Alcolea D, Fortea J, Ávila J, Bolós M. Decreased CX3CL1 Levels in the
Cerebrospinal Fluid of Patients With Alzheimer’s Disease. Front Neurosci. 2018;12:609.
doi:10.3389/fnins.2018.00609.
421. Jęśko H, Wencel P, Strosznajder RP, Strosznajder JB. Sirtuins and Their Roles in Brain
Aging and Neurodegenerative Disorders. Neurochem Res. 2017;42:876–90. doi:10.1007/s11064-
016-2110-y.
422. Kurundkar D, Kurundkar AR, Bone NB, Becker EJ, Liu W, Chacko B, et al. SIRT3
diminishes inflammation and mitigates endotoxin-induced acute lung injury. JCI Insight. 2019;4.
doi:10.1172/jci.insight.120722.
423. Shi H, Deng H-X, Gius D, Schumacker PT, Surmeier DJ, Ma Y-C. Sirt3 protects
dopaminergic neurons from mitochondrial oxidative stress. Hum Mol Genet. 2017;26:1915–26.
doi:10.1093/hmg/ddx100.
424. Park J-H, Delenclos M, Faroqi AH, DeMeo NN, McLean PJ. Alpha-synuclein-induced
mitochondrial dysfunction is mediated via a sirtuin 3-dependent pathway. bioRxiv.
2018;:357624. doi:10.1101/357624.
425. Gleave JA, Arathoon LR, Trinh D, Lizal KE, Giguère N, Barber JHM, et al. Sirtuin 3
rescues neurons through the stabilisation of mitochondrial biogenetics in the virally-expressing
mutant α-synuclein rat model of parkinsonism. Neurobiol Dis. 2017;106:133–46.
doi:10.1016/j.nbd.2017.06.009.
426. Liu X, Zhang L, Wang P, Li X, Qiu D, Li L, et al. Sirt3-dependent deacetylation of SOD2
plays a protective role against oxidative stress in oocytes from diabetic mice. Cell Cycle.
2017;16:1302–8. doi:10.1080/15384101.2017.1320004.
427. Das S, Mitrovsky G, Vasanthi HR, Das DK. Antiaging Properties of a Grape-Derived
Antioxidant Are Regulated by Mitochondrial Balance of Fusion and Fission Leading to
Mitophagy Triggered by a Signaling Network of Sirt1-Sirt3-Foxo3-PINK1-PARKIN. Oxid Med

192
Cell Longev. 2014;2014:1–13. doi:10.1155/2014/345105.
428. Nicholatos JW, Francisco AB, Bender CA, Yeh T, Lugay FJ, Salazar JE, et al. Nicotine
promotes neuron survival and partially protects from Parkinson’s disease by suppressing SIRT6.
Acta Neuropathol Commun. 2018;6:120. doi:10.1186/s40478-018-0625-y.
429. Sharma A, Diecke S, Zhang WY, Lan F, He C, Mordwinkin NM, et al. The role of SIRT6
protein in aging and reprogramming of human induced pluripotent stem cells. J Biol Chem.
2013;288:18439–47. doi:10.1074/jbc.M112.405928.
430. Foley JF. A Role for SIRT6 in Secretion. Sci Signal. 2013;6:ec81–ec81.
doi:10.1126/scisignal.2004213.
431. Hugenholtz F, de Vos WM. Mouse models for human intestinal microbiota research: a
critical evaluation. Cell Mol Life Sci. 2018;75:149–60. doi:10.1007/s00018-017-2693-8.
432. Zhang S, Wu M, Peng C, Zhao G, Gu R. GFAP expression in injured astrocytes in rats. Exp
Ther Med. 2017;14:1905–8. doi:10.3892/etm.2017.4760.
433. Lee W-H, Suk Jung-Wan Seo K, Jin M, Lee M-G, Eunha Jang I-S, Kim J-H, et al.
Astrocytes in the Classical Inflammatory Activation of Astrocytes: The Critical Role of
Lipocalin-2 Phenotypic Polarization of Activated. 2013. doi:10.4049/jimmunol.1301637.
434. Miller SJ. Astrocyte Heterogeneity in the Adult Central Nervous System. Front Cell
Neurosci. 2018;12:401. doi:10.3389/fncel.2018.00401.
435. Yun SP, Kam T-I, Panicker N, Kim S, Oh Y, Park J-S, et al. Block of A1 astrocyte
conversion by microglia is neuroprotective in models of Parkinson’s disease. Nat Med.
2018;24:931–8. doi:10.1038/s41591-018-0051-5.
436. Liddelow SA, Guttenplan KA, Clarke LE, Bennett FC, Bohlen CJ, Schirmer L, et al.
Neurotoxic reactive astrocytes are induced by activated microglia. Nature. 2017;541:481–7.
doi:10.1038/nature21029.
437. Clarke LE, Liddelow SA, Chakraborty C, Münch AE, Heiman M, Barres BA. Normal aging
induces A1-like astrocyte reactivity. Proc Natl Acad Sci U S A. 2018;115:E1896–905.
doi:10.1073/pnas.1800165115.
438. Fu HQ, Yang T, Xiao W, Fan L, Wu Y, Terrando N, et al. Prolonged Neuroinflammation
after Lipopolysaccharide Exposure in Aged Rats. PLoS One. 2014;9:e106331.
doi:10.1371/journal.pone.0106331.
439. Rossol M, Heine H, Meusch U, Quandt D, Klein C, Sweet MJ, et al. LPS-induced cytokine
production in human monocytes and macrophages. Crit Rev Immunol. 2011;31:379–446.
http://www.ncbi.nlm.nih.gov/pubmed/22142165. Accessed 20 Jun 2019.
440. Li W, Yang S, Kim SO, Reid G, Challis JRG, Bocking AD. Lipopolysaccharide-Induced
Profiles of Cytokine, Chemokine, and Growth Factors Produced by Human Decidual Cells Are
Altered by Lactobacillus rhamnosus GR-1 Supernatant. Reprod Sci. 2014;21:939–47.
doi:10.1177/1933719113519171.
441. Banks WA, Kastin AJ, Broadwell RD. Passage of Cytokines across the Blood-Brain

193
Barrier. Neuroimmunomodulation. 1995;2:241–8. doi:10.1159/000097202.
442. Pan W, Stone KP, Hsuchou H, Manda VK, Zhang Y, Kastin AJ. Cytokine signaling
modulates blood-brain barrier function. Curr Pharm Des. 2011;17:3729–40.
http://www.ncbi.nlm.nih.gov/pubmed/21834767. Accessed 20 Jun 2019.
443. Merrill JE, Kono DH, Clayton J, Ando DG, Hinton DR, Hofman FM. Inflammatory
leukocytes and cytokines in the peptide-induced disease of experimental allergic
encephalomyelitis in SJL and B10.PL mice. Proc Natl Acad Sci. 1992;89:574–8.
doi:10.1073/pnas.89.2.574.
444. Reale M, Iarlori C, Thomas A, Gambi D, Perfetti B, Di Nicola M, et al. Peripheral
cytokines profile in Parkinson’s disease. Brain Behav Immun. 2009;23:55–63.
doi:10.1016/j.bbi.2008.07.003.
445. Zhang J-M, An J. Cytokines, inflammation, and pain. Int Anesthesiol Clin. 2007;45:27–37.
doi:10.1097/AIA.0b013e318034194e.
446. Mateen S, Moin S, Shahzad S, Khan AQ. Level of inflammatory cytokines in rheumatoid
arthritis patients: Correlation with 25-hydroxy vitamin D and reactive oxygen species. PLoS
One. 2017;12:e0178879. doi:10.1371/journal.pone.0178879.
447. Anisman H, Merali Z. Cytokines, stress and depressive illness: brain-immune interactions.
Ann Med. 2003;35:2–11. http://www.ncbi.nlm.nih.gov/pubmed/12693607. Accessed 21 Jun
2019.
448. Koellhoffer EC, McCullough LD, Ritzel RM. Old Maids: Aging and Its Impact on
Microglia Function. Int J Mol Sci. 2017;18. doi:10.3390/ijms18040769.
449. Fülöp T, Montgomery RR. Editorial overview: Immune senescence: known knowns and
unknown unknowns. Curr Opin Immunol. 2014;29:vii–ix. doi:10.1016/j.coi.2014.06.005.
450. Trias E, Beilby PR, Kovacs M, Ibarburu S, Varela V, Barreto-Núñez R, et al. Emergence of
Microglia Bearing Senescence Markers During Paralysis Progression in a Rat Model of Inherited
ALS. Front Aging Neurosci. 2019;11:42. doi:10.3389/fnagi.2019.00042.
451. Wynne AM, Henry CJ, Huang Y, Cleland A, Godbout JP. Protracted downregulation of
CX3CR1 on microglia of aged mice after lipopolysaccharide challenge. Brain Behav Immun.
2010;24:1190–201. doi:10.1016/j.bbi.2010.05.011.
452. Rogers J, Luber-Narod J, Styren SD, Civin WH. Expression of immune system-associated
antigens by cells of the human central nervous system: relationship to the pathology of
Alzheimer’s disease. Neurobiol Aging. 9:339–49.
http://www.ncbi.nlm.nih.gov/pubmed/3263583. Accessed 20 Jun 2019.
453. Sheng JG, Mrak RE, Griffin WS. Enlarged and phagocytic, but not primed, interleukin-1
alpha-immunoreactive microglia increase with age in normal human brain. Acta Neuropathol.
1998;95:229–34. http://www.ncbi.nlm.nih.gov/pubmed/9542587. Accessed 20 Jun 2019.
454. Frank MG, Barrientos RM, Biedenkapp JC, Rudy JW, Watkins LR, Maier SF. mRNA up-
regulation of MHC II and pivotal pro-inflammatory genes in normal brain aging. Neurobiol
Aging. 2006;27:717–22. doi:10.1016/j.neurobiolaging.2005.03.013.

194
455. Norden DM, Godbout JP. Review: Microglia of the aged brain: primed to be activated and
resistant to regulation. Neuropathol Appl Neurobiol. 2013;39:19–34. doi:10.1111/j.1365-
2990.2012.01306.x.
456. Mouton PR, Long JM, Lei D-L, Howard V, Jucker M, Calhoun ME, et al. Age and gender
effects on microglia and astrocyte numbers in brains of mice. Brain Res. 2002;956:30–5.
doi:10.1016/s0006-8993(02)03475-3.
457. Palmer AL, Ousman SS. Astrocytes and Aging. Front Aging Neurosci. 2018;10:337.
doi:10.3389/fnagi.2018.00337.
458. Kohama SG, Goss JR, Finch CE, McNeill TH. Increases of glial fibrillary acidic protein in
the aging female mouse brain. Neurobiol Aging. 16:59–67.
http://www.ncbi.nlm.nih.gov/pubmed/7723937. Accessed 20 Jun 2019.
459. Nichols NR, Day JR, Laping NJ, Johnson SA, Finch CE. GFAP mRNA increases with age
in rat and human brain. Neurobiol Aging. 14:421–9.
http://www.ncbi.nlm.nih.gov/pubmed/8247224. Accessed 20 Jun 2019.
460. Sorensen EW, Lian J, Ozga AJ, Miyabe Y, Ji SW, Bromley SK, et al. CXCL10 stabilizes T
cell-brain endothelial cell adhesion leading to the induction of cerebral malaria. JCI insight.
2018;3. doi:10.1172/jci.insight.98911.
461. Boisvert MM, Erikson GA, Shokhirev MN, Allen NJ. The Aging Astrocyte Transcriptome
from Multiple Regions of the Mouse Brain. Cell Rep. 2018;22:269–85.
doi:10.1016/j.celrep.2017.12.039.
462. Reynolds RH, Botía J, Nalls MA, Hardy J, Gagliano Taliun SA, Ryten M. Moving beyond
neurons: the role of cell type-specific gene regulation in Parkinson’s disease heritability. npj Park
Dis. 2019;5:6. doi:10.1038/s41531-019-0076-6.