Altered resting-state activity in seasonal affective disorder
12
r Human Brain Mapping 000:000–000 (2012) r Altered Resting-State Activity in Seasonal Affective Disorder Ahmed Abou Elseoud, 1 * Juuso Nissila ¨, 2 Anu Liettu, 3 Jukka Remes, 1 Jari Jokelainen, 4 Timo Takala, 4 Antti Aunio, 2 Tuomo Starck, 1 Juha Nikkinen, 1 Hannu Koponen, 5 Yu-Feng Zang, 6 Osmo Tervonen, 1 Markku Timonen, 4,7 and Vesa Kiviniemi 1 1 Department of Diagnostic Radiology, Oulu University Hospital, Oulu, Finland 2 Valkee Ltd., Oulu, Finland 3 Department of Psychiatry, University of Oulu, Oulu, Finland 4 Institute of Health Sciences and General Practice, University of Oulu, Oulu, Finland 5 Department of Psychiatry, University Hospital of Kuopio, Kuopio, Finland 6 Center for Cognition and Brain Disorders and the Affiliated Hospital, Hangzhou Normal University, Hangzhou, China 7 Oulu Health Centre, Oulu, Finland r r Abstract: At present, our knowledge about seasonal affective disorder (SAD) is based mainly up on clinical symptoms, epidemiology, behavioral characteristics and light therapy. Recently developed measures of resting-state functional brain activity might provide neurobiological markers of brain dis- orders. Studying functional brain activity in SAD could enhance our understanding of its nature and possible treatment strategies. Functional network connectivity (measured using ICA-dual regression), and amplitude of low-frequency fluctuations (ALFF) were measured in 45 antidepressant-free patients (39.78 10.64, 30 $, 15 #) diagnosed with SAD and compared with age-, gender- and ethnicity- matched healthy controls (HCs) using resting-state functional magnetic resonance imaging. After cor- recting for Type 1 error at high model orders (inter-RSN correction), SAD patients showed significantly increased functional connectivity in 11 of the 47 identified RSNs. Increased functional connectivity involved RSNs such as visual, sensorimotor, and attentional networks. Moreover, our results revealed that SAD patients compared with HCs showed significant higher ALFF in the visual and right sensori- motor cortex. Abnormally altered functional activity detected in SAD supports previously reported attentional and psychomotor symptoms in patients suffering from SAD. Further studies, particularly under task conditions, are needed in order to specifically investigate cognitive deficits in SAD. Hum Brain Mapp 00:000–000, 2012. V C 2012 Wiley Periodicals, Inc. Key words: seasonal affective disorder; fMRI; resting-state; functional connectivity; ICA; ALFF r r Additional Supporting Information may be found in the online version of this article. Jukka Remes ideated the subject-wise spatial concatenation of ICA maps before permutation tests as a procedure to account for mul- tiple comparisons at high-model orders. Contract grant sponsor: Academy of Finland; Contract grant numbers: 111711 and 123772; Contract grant sponsor: Finnish Medical Foundation. *Correspondence to: Ahmed Abou Elseoud, Department of Diag- nostic Radiology, Oulu University Hospital, Box 50, 90029 Oys, Oulu, Finland. E-mail: ahmed.abou.elseoud@oulu.fi or [email protected] Received for publication 8 September 2011; Revised 15 May 2012; Accepted 19 June 2012 DOI: 10.1002/hbm.22164 Published online in Wiley Online Library (wileyonlinelibrary.com). V C 2012 Wiley Periodicals, Inc.
-
Upload
independent -
Category
Documents
-
view
1 -
download
0
Transcript of Altered resting-state activity in seasonal affective disorder
r Human Brain Mapping 000:000–000 (2012) r
Altered Resting-State Activity in SeasonalAffective Disorder
Ahmed Abou Elseoud,1* Juuso Nissila,2 Anu Liettu,3 Jukka Remes,1
Jari Jokelainen,4 Timo Takala,4 Antti Aunio,2 Tuomo Starck,1
Juha Nikkinen,1 Hannu Koponen,5 Yu-Feng Zang,6 Osmo Tervonen,1
Markku Timonen,4,7 and Vesa Kiviniemi1
1Department of Diagnostic Radiology, Oulu University Hospital, Oulu, Finland2Valkee Ltd., Oulu, Finland
3Department of Psychiatry, University of Oulu, Oulu, Finland4Institute of Health Sciences and General Practice, University of Oulu, Oulu, Finland
5Department of Psychiatry, University Hospital of Kuopio, Kuopio, Finland6Center for Cognition and Brain Disorders and the Affiliated Hospital, Hangzhou Normal University,
Hangzhou, China7Oulu Health Centre, Oulu, Finland
r r
Abstract: At present, our knowledge about seasonal affective disorder (SAD) is based mainly up onclinical symptoms, epidemiology, behavioral characteristics and light therapy. Recently developedmeasures of resting-state functional brain activity might provide neurobiological markers of brain dis-orders. Studying functional brain activity in SAD could enhance our understanding of its nature andpossible treatment strategies. Functional network connectivity (measured using ICA-dual regression),and amplitude of low-frequency fluctuations (ALFF) were measured in 45 antidepressant-free patients(39.78 � 10.64, 30 $, 15 #) diagnosed with SAD and compared with age-, gender- and ethnicity-matched healthy controls (HCs) using resting-state functional magnetic resonance imaging. After cor-recting for Type 1 error at high model orders (inter-RSN correction), SAD patients showed significantlyincreased functional connectivity in 11 of the 47 identified RSNs. Increased functional connectivityinvolved RSNs such as visual, sensorimotor, and attentional networks. Moreover, our results revealedthat SAD patients compared with HCs showed significant higher ALFF in the visual and right sensori-motor cortex. Abnormally altered functional activity detected in SAD supports previously reportedattentional and psychomotor symptoms in patients suffering from SAD. Further studies, particularlyunder task conditions, are needed in order to specifically investigate cognitive deficits in SAD. HumBrain Mapp 00:000–000, 2012. VC 2012 Wiley Periodicals, Inc.
Keywords: seasonal affective disorder; fMRI; resting-state; functional connectivity; ICA; ALFF
r r
Additional Supporting Information may be found in the onlineversion of this article.
Jukka Remes ideated the subject-wise spatial concatenation of ICAmaps before permutation tests as a procedure to account for mul-tiple comparisons at high-model orders.
Contract grant sponsor: Academyof Finland; Contract grant numbers:111711 and 123772; Contract grant sponsor: FinnishMedical Foundation.
*Correspondence to: Ahmed Abou Elseoud, Department of Diag-nostic Radiology, Oulu University Hospital, Box 50, 90029 Oys,
Oulu, Finland. E-mail: [email protected] [email protected]
Received for publication 8 September 2011; Revised 15 May 2012;Accepted 19 June 2012
DOI: 10.1002/hbm.22164Published online in Wiley Online Library (wileyonlinelibrary.com).
VC 2012 Wiley Periodicals, Inc.

INTRODUCTION
Seasonal affective disorder (SAD) was first described in1984 [Rosenthal et al., 1984] and is considered a subtype ofeither recurrent major depressive disorder (MDD) or bipo-lar affective disorder in which depressive episodes regu-larly begin in one season and remit in another season[American Psychiatric Association, 2000]. The winter-typeof SAD manifests as atypical symptoms of depression[Jacobsen et al., 1987; Rosenthal et al., 1984]. Recent evi-dence suggests a circadian basis for SAD [Lewy et al.,2006; Wehr et al., 2001]. The phase shift hypothesis sug-gests that SAD patients experience a circadian phase delayin winter and that early morning bright light exposurehelps alleviate symptoms by correcting this phase shiftdelay [Lewy, 1999; Lewy et al., 1987, 2006]. Cohen et al.[1992] using positron emission tomography (PET) scanninghave reported lower global metabolic rate in SAD patientsrelative to healthy controls.
Functional magnetic resonance imaging (fMRI) enablesthe detection of task responses as well as spontaneous ac-tivity of the living human brain. Temporal similarities inblood oxygen level-dependent (BOLD) signal fluctuationsdetected at rest are thought to reflect functional connectiv-ity of different brain regions [Beckmann et al., 2005; Biswalet al., 1995; Cordes et al., 2000; Fox et al., 2005; Greiciuset al., 2003; Lowe et al., 2000]. Recently, independent com-ponent analysis (ICA) has become one of the most oftenused methods to detect functionally connected brainregions [Biswal et al., 1999; Calhoun et al., 2001; Kiviniemiet al., 2003; Mckeown et al., 1998]. A number of studieshave shown altered functional connectivity in disordersincluding schizophrenia [Calhoun et al., 2009; Garrityet al., 2007; Jafri et al., 2008], Alzheimer’s disease or de-mentia [Greicius et al., 2004; Rombouts et al., 2009; Seeleyet al., 2009], depression [Anand et al., 2005; Greicius et al.,2007; Sheline et al., 2010; Veer et al., 2010; Zhou et al.,2009], epilepsy [Lui et al., 2008; Zhang et al., 2009], Hun-tington’s disease [Wolf et al., 2008], amyotrophic lateralsclerosis [Mohammadi et al., 2009], and multiple sclerosis[Lowe et al., 2002].
Amplitude of low-frequency fluctuations (ALFF) [Zanget al., 2007] involves the spectral decomposition of thetime series data with a focus on the relative amplitudethat resides in low-frequency ranges. At rest, ALFF ishigher and dominant in brain areas constituting thedefault mode network [Raichle et al., 2001] than in otherregions [Yang et al., 2007; Zou et al., 2008]. In addition,ALFF also has been used to study disorders such as earlyAlzheimer’s disease, attention deficit hyperactivity disor-der (ADHD), post-traumatic stress disorder, epilepsy, andschizophrenia [Hoptman et al., 2010; Huang et al., 2010;Wang et al., 2011; Yin et al., 2011; Zang et al., 2007; Zhanget al., 2008, 2010].
In this article, we implemented both ICA and ALFFanalyses in order to achieve a comprehensive understand-ing of the resting-state functional alterations involved in
SAD. ICA functional connectivity reflects the level of inte-gration of functional brain activity at the network level.Complementarily, ALFF measures reflect spontaneous syn-chronous neural activity at the voxel level.
Despite a multitude of studies describing altered func-tional brain activity in mood disorders, SAD remainslargely unexplored. There are no previous fMRI studiesaddressing functional brain activity in SAD. Based on thecore symptoms reported in SAD, we expected alteredfunctional connectivity and ALFF in brain areas associatedwith attention (including middle frontal gyrus, middletemporal gyrus and lateral occipital cortex) and affectiveprocessing (including prefrontal cortex, amygdala, anteriorcingulate, insula, cerebellum and limbic areas).
MATERIALS AND METHODS
Subjects
Given the fact that winter SAD is far more prevalentthan summer SAD, the term SAD usually refers to winterSAD and is used accordingly in this article hereafter. Thisresearch is part of the ongoing SAD and light therapy pro-ject started in 2009 at Oulu University, Finland. In ourstudy, patients with SAD were recruited through adver-tisements in two waves during January to February 2009(first wave) and November 2009 to January 2010 (secondwave) in the city of Oulu, Finland (latitude 65�01’N). Thefirst wave represents the pilot study of the SAD and lighttherapy project, while the second wave represents the con-tinuation of the same project. The ethical committee ofOulu University Hospital has approved the study forwhich the subjects have been recruited, and informed con-sent has been obtained from each subject individuallyaccording to the Helsinki declaration.
After signing the informed consent for participation inthis study, all subjects were interviewed by an experiencedpsychiatrist (A.L. or M.T.). Diagnostic and Statistical Man-ual of Mental Disorders [American Psychiatric Association,1994] diagnoses for recurrent major depression (moderateor severe) were obtained using the Mini International Neu-ropsychiatric Interview (MINI) [Sheehan et al., 1998]. Inaddition, patients had to fulfill the diagnostic criteria for‘‘seasonal pattern’’ according to DSM-IV-TR [AmericanPsychiatric Association, 2000] (although the diagnostic cri-teria for ‘‘seasonal pattern’’ can be applied to a diagnosisof major depressive episodes in both bipolar (I and II) dis-order and recurrent MDD [American Psychiatric Associa-tion, 2000], only patients with recurrent unipolardepression were included in the present study to increasethe homogeneity). Forty-five subjects (39.78 � 10.64, 30 $,15 #) were diagnosed with SAD.
The severity of depressive symptoms were assessed inthe first wave by using the 17-item Hamilton DepressionRating Scale (HAMD-17) [Hamilton, 1960], and in the sec-ond wave by Structured Interview Guide for the HamiltonDepression Rating Scale, Seasonal Affective Disorders
r Abou Elseoud et al. r
r 2 r
(SIGH-SAD) [Williams et al., 1994]; in the first wave, thosewith HAMD-17 sum score = 22, and in the second wave,those with HAMD-21 (21-item HAMD included in theSIGH-SAD) sum score = 22 were included in the presentstudy. Student’s t-test was used to compare the mean sumscores of HAMD-17, and also the Mann–Whitney U testwas also used to compare the number of earlier SAD epi-sodes as well as the length of the current SAD episodesbetween wave 1 and wave 2. The statistical analyses wereperformed by using the SAS, version 9.2 (SAS Institute,Cary, NC).
The exclusion criteria were as follows: lifetime psychoticdisorder, other concurrent DSM-IV axis I except anxietydisorder, clinically significant DSM-IV axis II disorder,substance abuse or dependence, tobacco smoking, life-timesuicide attempt or suicide ideations during the pastmonth, unstable physical disorder, psychotropic medica-tions or corresponding herbal preparations, bright lighttherapy for the current episode, ocular disorders exceptmyopia/hyperopia. Furthermore, pregnant candidateswere excluded. In addition, normal exclusion criteria forMRI scanning were used. All SAD patients except fourhad no comorbid physical disorders (in the second wave:the first patient with arterial hypertension controlled by anangiotensin II receptor antagonist; the second patient suf-fers from arterial hypertension and hypercholesterolemiacontrolled by angiotensin II receptor antagonist and sta-tins, respectively; the third patient is diagnosed withandrogenic alopecia which is controlled by finasteride; andthe fourth patient suffers from menopausal syndrome,using estradiol).
Forty-five age-, gender- and ethnicity-matched HCs (noconcomitant medications) from the general populationwere recruited in different resting-state studies (Dementiaand multimodal estimation of brain oscillations, 22 and 23respectively) (see Supporting Information Table S1). BeckDepression Inventory-II (BDI-II) was used to screen someof the HCs (22 subjects) to confirm the absence of a historyof depression (BDI-II < 5).
Imaging Methods and Data Preprocessing
The fMRI dataset we examined in the present study wasidentical with those we analyzed in our previous study[Abou Elseoud et al., 2011]. The detailed characteristics ofthe imaging methods and data preprocessing have beenpreviously described [Abou Elseoud et al., 2011]. In brief,resting-state BOLD data were collected from all subjectsusing the same protocol during the same winter period.Resting-state BOLD data were collected on a GE Signa 1.5T whole body system with an eight-channel receive coil,using an EPI GRE sequence (TR 1,800 ms, TE 40 ms, 280time points, 28 oblique axial slices, slice thickness 4 mm,interslice space 0.4, covering the whole brain, FOV 25.6 cm� 25.6 cm, with 64 � 64 matrix, parallel imaging factor 2,and a flip angle of 90�). T1-weighted scans were imaged
using three-dimensional FSPGR BRAVO sequence (TR 12.1ms, TE 5.2 ms, slice thickness 1.0 mm, FOV 24.0 cm, ma-trix 256 � 256, and flip angle 20�, and NEX 1) in order toobtain anatomical images for coregistration of the fMRIdata to standard space coordinates.
Head motion in the fMRI data was corrected using mul-tiresolution rigid body coregistration of volumes, as imple-mented in FSL 3.3 MCFLIRT software [Jenkinson et al.,2002]. Brain extraction was carried out for motion cor-rected BOLD volumes with optimization of the deformingsmooth surface model, as implemented in FSL 3.3 BETsoftware [Smith, 2002]. Then, the BOLD volumes were spa-tially smoothed with Gaussian kernel (7.5 mm FWHM)and voxel time series were high-pass filtered using aGaussian linear filter with a 100-s cutoff. The FSL 4.1.4fslmaths tool was used for these steps. Multiresolutionaffine coregistration as implemented in the FSL 4.1.4FLIRT software [Jenkinson et al., 2002] was used to cor-egister mean nonsmoothed fMRI volumes to three-dimen-sional FSPGR volumes of corresponding subjects, andthree-dimensional FSPGR volumes to the Montreal Neuro-logical Institute (MNI) standard structural space template(available at: MNI152_T1_2mm_brain template included inFSL). However, for computational reasons pertaining tolater analysis steps, 4 mm resolution was retained afterspatial normalization.
ICA Analysis
In our previous study, we addressed the influence ofICA model order selection on the patterns of between-group differences [Abou Elseoud et al., 2011]. However,the present study describes SAD functional connectivityalterations at its optimal hierarchical level as discussed inour previous work [Abou Elseoud et al., 2011]. ICA analy-sis has been conducted as previously described [AbouElseoud et al., 2011]. Briefly, ICA analysis was carried outusing FSL 4.1.4 MELODIC software implementing proba-bilistic independent component analysis (PICA) [Beck-mann et al., 2004] (Fig. 1). Multisession temporalconcatenation tool in MELODIC was used to performPICA related preprocessing and data conditioning ingroup analysis setting. ICA using 70 independent compo-nent maps (IC maps) was applied to detect RSNs. The ICmaps were thresholded using an alternative hypothesistest based on fitting a Gaussian/gamma mixture model tothe distribution of voxel intensities within spatial maps[Beckmann et al., 2005] and controlling the local false-dis-covery rate at P < 0.5. The between-subject analysis of theresting data was carried out using a regression technique(dual regression) that allows for voxel-wise comparisonsof resting-state fMRI [Abou Elseoud et al., 2011; Beckmannet al., 2009; Flippini et al., 2009; Littow et al., 2010; Veeret al., 2010].
r Altered Functional Brain Activity in SAD r
r 3 r

Statistical Analysis and Correction
for Multiple Comparisons
First-level multiple comparisons correction
Initially, between-group statistical difference wasassessed nonparametrically using permutation testingimplemented in FSL’s Randomise tool (v2.1), incorporatingalso threshold-free cluster enhancement (TFCE) [Smith andNichols, 2009] for cluster-like statistic and use of maximalstatistics for multiple comparisons correction. Thisinvolved deriving null distributions of TFCE-values for thecontrasts reflecting the between-group effects by perform-ing 5,000 random permutations of group labels and testingthe difference between groups against distribution of max-imal statistic values from all permutations [Nichols andHolmes, 2002]. This resulted in 22 RSNs with significant(P < 0.05, corrected for family-wise errors for each RSNmap separately) increased functional connectivity (seeSupporting Information Fig. S1). However, as we previ-ously discussed [Abou Elseoud et al., 2011], current multi-ple comparison correction method corrects the results at
the IC level, but does not adjust for the risk of Type 1error (false positives) induced by increasing the number ofcomponents tested simultaneously at high model orders.
Second-level multiple comparisons correction
(inter-RSN correction for ICA-derived RSNs)
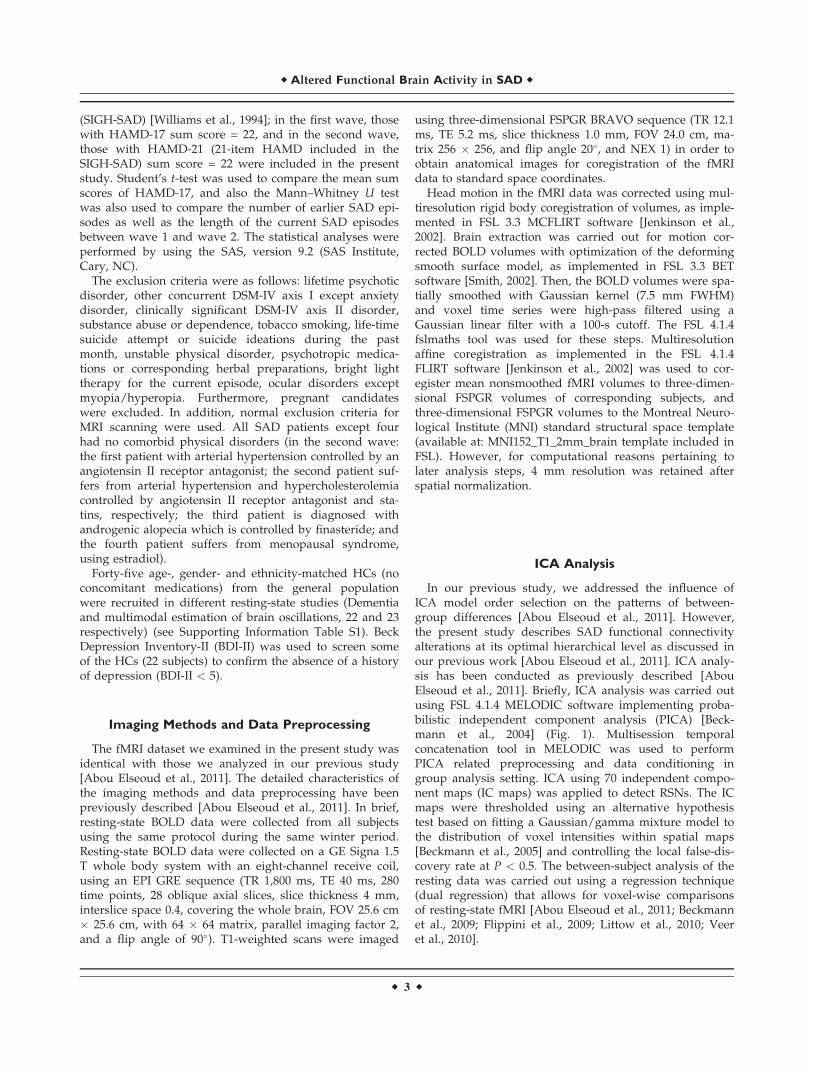
Temporally concatenated subject-specific maps of eachIC created by the initial dual-regression run (regression ofspatial ICs into each subject’s four-dimensional data) foreach RSN were spatially concatenated in the y-direction(Fig. 2). Then, statistical analysis using permutation testing(implemented in the FSL’s Randomise tool, 10,000 randompermutations) was performed on the resulted concatenatedmap (90 subjects temporally concatenated and 47 ICs spa-tially concatenated y-direction).
After brain extraction, voxels outside the brain are set tozero and consequently nonzero voxels in maps remainspatially disjoint after spatial concatenation. Therefore, thecomputation of TFCE-statistic (and other cluster-relatedstatistics) in individual maps remain unaffected with
Figure 1.
Top, Framework of the group independent component analysis
(ICA) (concatenation approach, as implemented in MELODIC).
Individual fMRI datasets are concatenated temporally (after per-
forming group-based PCA reduction on each individual fMRI
dataset). Temporally concatenated group-data reduced by princi-
ple component analysis (PCA) reduction. Then using ICA group
ICA maps and group mixing matrix are estimated. Bottom,
Dual-regression approach involves (1) spatial regression of ICA
maps into each subject’s fMRI data to find subject-specific time-
courses, (2) back regression of these time-courses into the sub-
ject’s fMRI data to detected subject-specific ICA maps. Subject-
specific ICA maps enable voxel-wise statistical testing across
subjects, separately for each original group-ICA map (to detect
between-group differences).
r Abou Elseoud et al. r
r 4 r
respect to concatenation. In practice, the second-level(inter-RSN) multiple comparison correction computes max-imal statistic for each permutation over TFCE-statistics ofall voxels of the concatenated maps (relative to the initialanalysis that computes TFCE-statistics in each map sepa-rately). Then, the resulting distribution of maximal valuesis used to derive threshold levels for P values.
The resulting statistical between-group difference mapwas thresholded at P < 0.05 (corrected for family-wiseerrors within and between all concatenated RSN maps),resampled into 2 mm, and then divided into 47 ICs.
ALFF Calculation
The ALFF was calculated with an approach similar tothat used in previous studies [Lui et al., 2010; Yang et al.,2007]. Calculations were performed using REST software(available at: http://restfmri.net). Preprocessed datasetswere resampled into 3 mm resolution. Linear trends wereremoved and a bandpass filtering (0.01–0.1 Hz) was per-formed to remove low-frequency drift and high-frequencyrespiratory and cardiac noise. Then, the filtered time serieswere transformed to frequency domain using fast Fourier-transform (FFT) (parameters: taper percent ¼ 0, FFT length¼ shortest) and the power spectrum was obtained. Sincethe power of a given frequency is proportional to thesquare of the amplitude of this frequency component inthe original time series in time domain, the power spec-trum obtained by FFT was square rooted and then aver-aged at each voxel. This averaged square root was takenas the ALFF. For normalization purposes, the ALFF ofeach voxel was divided by the global mean ALFF value tonormalize data across subjects analogous to approachesused in PET studies [Raichle et al., 2001].
The FSL’s Randomise tool was used to perform statisti-cal analyses comparing SAD patients and HCs nonpara-metrically using permutation testing (5,000 random
permutations). The resulting statistical map (ALFF) wasresampled into 2 mm and thresholded at P < 0.05 (cor-rected for family-wise errors) for illustration purposes.
Additionally, as a separate analysis, estimates of ALFFindividual maps were included in the permutation test asa demeaned voxel-wise covariate to test whether ALFFvalues have influenced the detected increased functionalconnectivity in the RSNs. Also, in order to assess the cor-relation between HAMD-scores from the patients’ groupand ALFF/ ICA connectivity maps, HAMD-scores havebeen included in the permutation testing of both ALFFand ICA analyses. Both ALFF and HAMD covariance testswere performed in the inter-RSN y-concatenated Random-ise analysis with 10,000 permutations.
Anatomical Characterization of the Results
The Juelich histological atlas [Eickhoff et al., 2007] andthe Harvard-Oxford cortical and subcortical atlases (Har-vard Center for Morphometric Analysis) provided withthe FSL software were used to identify the anatomicalcharacteristics of both RSNs and between-groupdifferences.
RESULTS
Psychological Data
The mean HAMD-17 sum score in the first and secondwave were 23.7 � 1.9 and 22.5 � 1.9, respectively. Themean SIGH-SAD-29 score in the second wave was 37.0 �4.7 with an Atypical Symptom Scale (HAMD 8-item atypi-cal) score of 12.7 � 4.0. The median number of earlierSAD episodes in the first and in the second wave was 4.6(2–7), and 6.0 (4–10), respectively (Table I). Only sixpatients (two patients in the first wave and four in the
Figure 2.
Inter-RSN correction framework. Subject-specific spatial ICA maps are spatially concatenated
before permutation tests as a procedure to account for false positives when testing multiple ICA
maps.
r Altered Functional Brain Activity in SAD r
r 5 r

second) reported having nonseasonal depressive episode(s) (Table I).
Altered Functional Connectivity in SAD
Segmentation of the brain functionality into detailedsubnetworks using a high model order ICA of 70 compo-nents yielded 47 RSNs. Our initial results (First-level mul-tiple comparisons correction) revealed that SAD patientscompared with HCs showed statistically significantincreases in functional connectivity in 22 RSNs out of the47 identified networks (Supporting Information Fig. S1, Ta-ble II). However, as previously discussed [Abou Elseoudet al., 2011], the applied multiple comparison correctionmethod corrects the results at the IC level without adjust-ing for the risk of false positives induced by increasing thenumber of concurrently analyzed RSNs at high modelorders. Therefore, we conducted an inter-RSN correction(see Methods). This new approach revealed significantincreased connectivity in 11 RSNs (Fig. 3, Table II). How-ever, interestingly, in the opposite contrast there were nosignificant reductions in functional connectivity in SADpatients compared to HCs.
Sensorimotor and Attention Networks
SAD patients showed increased functional connectivityinvolving three different functional networks (Fig. 3, RSNs1–3). The bilateral increased connectivity across the pre-and postcentral gyri might possibly indicate altered senso-rimotor functions in SAD. RSN 4 consists of brain areasinvolved in attention and working memory. In this net-work, increased functional connectivity was detected inthe right middle temporal gyrus, right angular gyrus andright lateral occipital cortex (Fig. 3, RSN 4).
Visual Networks
RSNs 5–11 show seven different functional networkscovering most of the striate (primary visual cortex, V1)and extrastriate (V2 and V5) visual cortices (Fig. 3). At thislevel of functional segmentation (70 ICs), the visual cortexwas segmented into 10 RSNs covering the entire visualcortex [Abou Elseoud et al., 2011]. SAD patients relative toHCs showed increased functional connectivity across awide range of these visual cortical areas (see Table II).This finding might possibly point toward altered visualprocessing of various visual properties such as motion,depth, color, shape, etc. [Grill-Spector and Malach, 2004].
Regional Cerebral Function
SAD patients relative to HCs showed significant higherALFF in two clusters distributed over the left visual andright motor cortex (Fig. 3, Table III). SAD patients showedno significant reductions in ALFF compared to HCs.
Including ALFF maps as a voxel-wise covariate (asincluded in inter-RSN correction) revealed significantincreased connectivity in 11 RSNs (Table II). Interestingly,the number of voxels with significant increased connectiv-ity generally decreased. The new results revealed no sig-nificant increased connectivity in RSN 7. Moreover,HAMD-score correlation analysis showed no significantcorrelation between HAMD-scores and neither ALFF norICA functional connectivity in SAD patients.
DISCUSSION
To our knowledge, this is the first resting-state fMRIstudy measuring regional amplitude of oxygenation fluctu-ations and functional network connectivity in
TABLE I. Characteristics of the patients diagnosed with Seasonal Affective Disorder (SAD) in January to February
2009 (first wave) and November 2009 to January 2010 (second wave) in the city of Oulu, Finland (latitude 65�010N)
Wave I Wave II
Age (yr) 36.3 � 7.2 42.9 � 11.8 P ¼ 0.026Males (%) x y
Mean HAMD-17 23.7 � 1.9 22.5 � 1.9 P ¼ 0.045Mean HAMD-21 NA 24.3 � 2.1Mean HAMD-8-item atypical NA 12.7 � 4.0Mean HAMD-29 NA 37.0 � 4.7No. earlier SAD episodes 4.5 (2.0–7.0) 6.0 (4.0–10.0) P ¼ 0.098No. patients with earlier MDD-periods
SAD episodesTwo patients with
one MDD-period outsidewinter period
Three patients with 1 otherMDD period; one patient
with two other MDD periodsDuration (in weeks) of the
current SAD-episode11.5 (8.0–14.0) 9.0 (5.0–12.0) P ¼ 0.078
Subjects with co-occurringanxiety disorder
1 Social phobia 5 GAD3 Social phobia1 Panic disorder
HAMD ¼ Hamilton depression rating scale; mean � standard deviation; median (interquartile range).
r Abou Elseoud et al. r
r 6 r
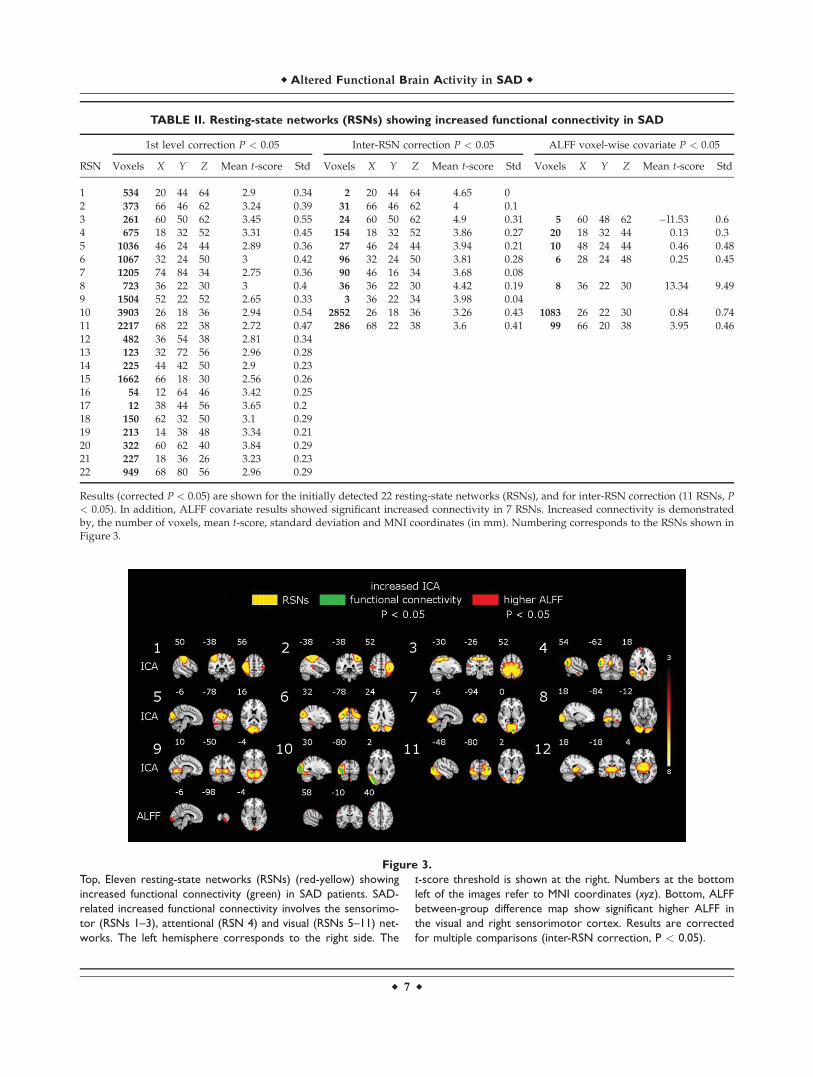
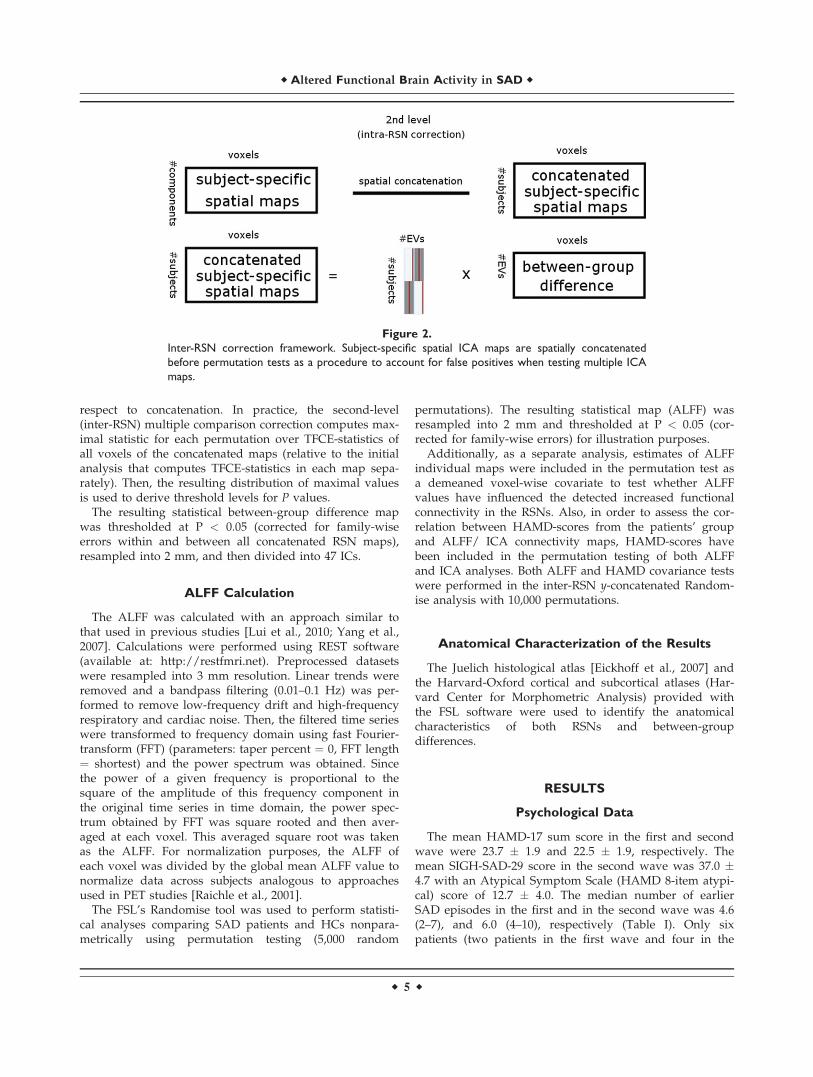
Figure 3.
Top, Eleven resting-state networks (RSNs) (red-yellow) showing
increased functional connectivity (green) in SAD patients. SAD-
related increased functional connectivity involves the sensorimo-
tor (RSNs 1–3), attentional (RSN 4) and visual (RSNs 5–11) net-
works. The left hemisphere corresponds to the right side. The
t-score threshold is shown at the right. Numbers at the bottom
left of the images refer to MNI coordinates (xyz). Bottom, ALFF
between-group difference map show significant higher ALFF in
the visual and right sensorimotor cortex. Results are corrected
for multiple comparisons (inter-RSN correction, P < 0.05).
TABLE II. Resting-state networks (RSNs) showing increased functional connectivity in SAD
1st level correction P < 0.05 Inter-RSN correction P < 0.05 ALFF voxel-wise covariate P < 0.05
RSN Voxels X Y Z Mean t-score Std Voxels X Y Z Mean t-score Std Voxels X Y Z Mean t-score Std
1 534 20 44 64 2.9 0.34 2 20 44 64 4.65 02 373 66 46 62 3.24 0.39 31 66 46 62 4 0.13 261 60 50 62 3.45 0.55 24 60 50 62 4.9 0.31 5 60 48 62 �l1.53 0.64 675 18 32 52 3.31 0.45 154 18 32 52 3.86 0.27 20 18 32 44 0.13 0.35 1036 46 24 44 2.89 0.36 27 46 24 44 3.94 0.21 10 48 24 44 0.46 0.486 1067 32 24 50 3 0.42 96 32 24 50 3.81 0.28 6 28 24 48 0.25 0.457 1205 74 84 34 2.75 0.36 90 46 16 34 3.68 0.088 723 36 22 30 3 0.4 36 36 22 30 4.42 0.19 8 36 22 30 13.34 9.499 1504 52 22 52 2.65 0.33 3 36 22 34 3.98 0.0410 3903 26 18 36 2.94 0.54 2852 26 18 36 3.26 0.43 1083 26 22 30 0.84 0.7411 2217 68 22 38 2.72 0.47 286 68 22 38 3.6 0.41 99 66 20 38 3.95 0.4612 482 36 54 38 2.81 0.3413 123 32 72 56 2.96 0.2814 225 44 42 50 2.9 0.2315 1662 66 18 30 2.56 0.2616 54 12 64 46 3.42 0.2517 12 38 44 56 3.65 0.218 150 62 32 50 3.1 0.2919 213 14 38 48 3.34 0.2120 322 60 62 40 3.84 0.2921 227 18 36 26 3.23 0.2322 949 68 80 56 2.96 0.29
Results (corrected P < 0.05) are shown for the initially detected 22 resting-state networks (RSNs), and for inter-RSN correction (11 RSNs, P< 0.05). In addition, ALFF covariate results showed significant increased connectivity in 7 RSNs. Increased connectivity is demonstratedby, the number of voxels, mean t-score, standard deviation and MNI coordinates (in mm). Numbering corresponds to the RSNs shown inFigure 3.
r Altered Functional Brain Activity in SAD r
r 7 r

antidepressant-free SAD population. Our results revealedsignificant increased functional connectivity in SADpatients relative to HCs in a number of RSNs mainlyinvolved in sensorimotor, attention, and visual processing,(Fig. 3, Table II). In addition, SAD patients showed alsosignificantly higher ALFF in the visual and right sensori-motor cortex. Importantly, increased functional connectiv-ity was accompanied with higher ALFF in the left visualand right sensorimotor cortex (see Fig. 3). In this article,we will discuss in detail the ICA inter-RSN correctionresults that represent statistically significant alterations infunctional connectivity controlled for false positives pres-ent at high ICA model orders.
Patterns of resting-state functional connectivity are signif-icantly influenced by the anatomical and functional archi-tecture of the brain [Honey et al., 2007]. SAD-relatedincreased functional connectivity was detected in widelydistributed visual and sensorimotor networks, as well as inthe attentional network. These connectivity changes indicateabnormal functional processing that possibly reflects lessspecialized cognitive processing, particularly in the visualand sensorimotor networks. Additionally, our resultsshowed significant increased ALFF in the visual and rightsensorimotor cortex. ALFF measures the amplitude ofdynamic spontaneous activity fluctuation within a singlevoxel. At the voxel level, this may indicate that certain brainvoxels (i.e. in the visual and right sensorimotor) tend to befunctionally overactive. ALFF results support the detectedpattern of increased ICA functional connectivity in the vis-ual and sensorimotor networks. It also provides newinsights into the stimulating effect of seasonal depression onvisual and sensorimotor processing. Interestingly, ALFF co-variant analysis still showed significant increased functionalconnectivity in all RSNs (except RSNs 1, 2, 7 and 9) that
inter-RSN correction yielded. Notably, ALFF covariantresults revealed a general reduction in (see Table II) thenumber of voxels with significant increased connectivity. Ingeneral, these findings indicate that ICA increased connec-tivity was influenced by the detected higher ALFF values inSAD patients. Although these results might suggest a link-age between increased ICA functional connectivity andALFF in some RSNs, direct comparisons of ICA and ALFFresults seem to be problematic due to their different natureand also differences in the level of noise corrections. Investi-gation of the relationship between ALFF and ICA connectiv-ity at similar noise/artifact conditions will be mandatorybefore definite conclusions can be made.
A previous PET study has shown lower global metabolicrate (results uncorrected) in seven patients with SAD com-pared with HCs [Cohen et al., 1992]. However, on theother hand, our results revealed significantly increasedfunctional connectivity and ALFF in SAD patients com-pared with HCs. Discrepancies in the results can be attrib-uted to (1) different sample sizes, (2) multiple comparisonscorrection, (3) possible biological differences between thetwo patient populations, or (4) methodological differencesbetween the two studies.
Primary Sensory Networks
A wide range of functional networks with altered con-nectivity were located mostly in the occipital cortex (striateand extrastriate). These networks (RSNs 5–11) also exhibitmost of the functional connectivity increases among theentire 11 RSNs (see Table II). Similarly, higher ALFF wasdetected in the visual cortex. These findings are consistentwith results showing increased occipital activity indepressed individuals that has been attributed to a reduc-tion in c-aminobutyric acid (GABA) concentration [Sana-cora et al., 1999, 2004]. Sensorimotor impairment in theform of cortical and subcortical sensorimotor deficits hasbeen reported in depressed subjects compared to HCs[Davis et al., 2010]. Psychomotor symptoms associatedwith depressed mood are often thought to have an impacton both the speed of thinking and the execution of motorresponses [Sobin and Sackeim, 1997]. Our results showedincreases in functional connectivity involving premotorareas, primary motor and somatosensory cortices (RSN 1–3), as well as higher ALFF in the right motor cortex. Thesefindings might possibly explain some previously reportedcognitive impairments associated with SAD, e.g., percep-tion, attention, memory retrieval [Michalon et al., 1997;O’Brien et al., 1993; Sullivan and Payne, 2007].
Attention Network
Attention deficit is a common symptom in SAD patients[Sigmon et al., 2007; Spinks and Dalgleish, 2001]. Our find-ings reflect selective changes of functional connectivity inRSN 4 involving brain areas associated with attentionprocessing. According to cognitive theory, attention inindividuals suffering from SAD is directed toward
TABLE III. ALFF results showed brain areas with
significant higher ALFF in SAD patients compared with
healthy controls
Brain area Voxels X Y Z
Visual cortex V2 BA18 712 54 16 26Visual cortex V1 BA17 663 54 16 26Primary somatosensory cortex BA3b R 122 16 56 58Primary somatosensory cortex BA1 R 114 16 56 58Secondary somatosensory cortex 103 12 62 48Primary motor cortex BA4p R 84 16 56 58Primary somatosensory cortex BA2 R 77 16 56 58Primary motor cortex BA4a R 72 16 56 58Premotor cortex BA6 R 65 16 57 58Primary somatosensory cortex BA3a R 49 14 58 53Secondary somatosensory cortex 33 12 58 52Broca’s area BA44 R 21 12 62 46Primary auditory cortex TE1.2 R 14 12 60 40
Significant increases in ALFF (corrected for multiple comparisons,P < 0.05) are demonstrated by: the anatomical brain areas, num-ber of voxels and MNI coordinates (in mm).
r Abou Elseoud et al. r
r 8 r
negative content stimuli due to negative schema. Atten-tional bias has been demonstrated when, compared withhealthy subjects, SAD patients have taken longer time tocolor name words that carry negative content comparedwith neutral or positive words [Drake et al., 1996; Sigmonet al., 2007; Spinks and Dalgleish, 2001]. In addition, cogni-tive models of depression propose that attentional biasplays a role in the development and maintenance ofdepression [Beck et al., 1979]. Increased functional connec-tivity in the right attention network (right lateral occipitalcortex, right middle temporal gyrus, and angular gyrus)may suggest abnormally enhanced attentional processing,which may underlie the delay in coloring words with neg-ative content.
Brain Areas Associated With Affective
Processing
As mentioned earlier, the current study aimed to studyresting-state activity in SAD at both the functional networklevel and the voxel level, in order to provide better under-standing of resting-state functional alterations in SAD.Both HAMD-17 and SIGH-SAD scores for our sample ofSAD patients indicate severe depressive state. Previousstudies in mood disorders have reported functional altera-tions in brain regions commonly associated with affectiveprocessing [Chai et al., 2011; Passarotti et al., 2011; Vanden Heuvel et al., 2011; Veer et al., 2010]. Our results(inter-RSN correction) revealed no significant changes infunctional connectivity or ALFF in those brain areas asso-ciated with affective processing, such as the amygdala,prefrontal cortex, anterior cingulate, insula, striatum, cere-bellum or limbic areas. However, our initial ICA results(first level) notably showed abnormal increased connectiv-ity in brain areas involved in mood processing, includingthe prefrontal cortex, caudate and hippocampus (see Sup-porting Information Fig. S1). Importantly, the inter-RSNcorrection is a more conservative approach that results ineliminating not only false positives, but also to someextent has the possibility of removing some true effects.Alternatively, it might be that the mood processing com-ponent of SAD is not as functionally pronounced as inother mood disorders such as MDD.
Methodological Considerations
As we mentioned earlier, the main focus of this studywas to explore resting-state functional brain alterations inSAD. Therefore, detailed discussion of the newly intro-duced methods for corrections is beyond the scope of thisarticle. However, it is important to briefly discuss the fol-lowing point: the analysis involving concatenation all iden-tified 47 RSNs (inter-RSN) showed significant increasedconnectivity in 11 RSNs. Notably, the number of brainvoxels showing significant increased connectivity reduced(Table II). This reduction is probably due to increasing the
number of the voxels being tested (47 maps) producingincreasing number of large (TFCE) statistics for each per-mutation. The computation of maximal statistic for eachpermutation over all voxels picks up these additional largevalues making the tails of maximal value distributionlarger. Consequently, as P values are computed from thiswidened distribution some of the previously detected vox-els fail to exceed the resulted threshold (P < 0.05). In addi-tion to that, applying Bonferroni correction as aconservative multiple comparison correction to the RSNsfrom the initial dual-regression analysis would mean usinga threshold of a ¼ aFEW V, where V is the number oftests (for V ¼ 47, P < 0.00106). Notably, thresholding thesignificant differences from the original analysis using thatthreshold results in no voxels surviving the Bonferronicorrection in all RSNs. These findings are encouraging forICA-based analyses in which it is important to control forfalse positives, and meanwhile inter-RSN correction can beapplied without being too conservative.
Previously, we have shown that the number of RSNsshowing significant between-group difference increases asa function of ICA model order [Abou Elseoud et al., 2011].Moreover, using the same data, eight model orders werepreviously estimated in order to optimize the level atwhich between-group differences were finely described[Abou Elseoud et al., 2011]. ICA high model orders rela-tive to lower model orders are known to incorporatehigher rates of false positives. In this article, we demon-strate that inter-RSN correction could be used to controlfor false positives encountered at high model orders.Therefore, based on these findings we suggest performingthe inter-RSN correction in conjunction with model orderoptimization.
The limitations of our study were as follows. First, withregard to diagnostic tools, SIGH-SAD was not used in thepilot phase (Wave I) of the study. However, in Wave I, thedepressive symptoms of patients with SAD were severeeven according to HAMD-17, and only two patients had ahistory of only one earlier nonseasonal depression episode.Given the fact that a diagnosis of depression was ascer-tained by MINI, and also that the DSM-IV-TR criteriawere used to diagnose the seasonal pattern of SAD, webelieve that our patients represent a clear cut SAD popula-tion. Second, the prevalence of a comorbid anxiety disor-der in depressed patients is very high. Therefore, it ispractically difficult to conduct a mood disorder investiga-tion in the absence of accompanying anxiety. In our study,10 patients were diagnosed with a comorbid anxiety disor-der (Table I). Unlike nonseasonal MDD [Engels et al.,2010], the influence of comorbid anxiety in SAD is notwell studied. Therefore, there is a need to explorethe influence of SAD-related comorbid anxiety in specifi-cally designed studies with a larger sample size. In addi-tion, in this study, our subjects were not matched forhandedness.
In summary, we have demonstrated for the first timealtered functional brain activity is unmedicated SAD
r Altered Functional Brain Activity in SAD r
r 9 r
population. Increased functional connectivity was detectedin RSNs associated with visual, sensorimotor and atten-tional processing. Also, our findings showing convergentincreased ALFF and functional connectivity might reflectless specialized cognitive processing in SAD. Further stud-ies, particularly under task conditions, are needed in orderto specifically investigate cognitive deficits in SAD.
ACKNOWLEDGMENTS
The granting bodies did not have any role in any of thefollowing aspects of this study: design, data collection,management, data analysis and interpretation of resultsand findings, or preparation, review or manuscript ap-proval. M.T. has been reimbursed by two medical compa-nies (Wyeth and Pfizer) for attending two conferences,have been paid fee for speaking in different occasions byEli Lilly, Astra Zeneca, BMS, and Pfizer. In addition, M.T.is a minor shareholder in Valkee Ltd. J.S. is a shareholderand CEO of Valkee Ltd. company (Oulu, Finland), whichis a producer and developer of the bright light devices forSAD. A.A. is also a shareholder and CTO of Valkee Ltd.M.T. is also a minor shareholder in Valkee Ltd.
REFERENCES
Abou Elseoud A, Littow H, Remes J, Starck T, Nikkinen J, NissilaJ, Timonen M, Tervonen O, Kiviniemi V (2011): Group-ICAmodel order highlights patterns of functional brain connectiv-ity. Front Syst Neurosci 5:37
Abou Elseoud A, Starck T, Remes J, Nikkinen J, Tervonen O, Kivi-niemi V (2010): The effect of model order selection in groupPICA. Hum Brain Mapp 31:1207–1216.
American Psychiatric Association (1994): Diagnostic and StatisticalManual of Mental Disorders, Fourth edition. Washington DC:American Psychiatric Association.
American Psychiatric Association (2000): Diagnostic and StatisticalManual of Mental Disorders, Fourth edition, text revision.Washington DC: American Psychiatric Association.
Anand A, Li Y, Wang Y, Wu J, Gao S, Bukhari L, Mathews VP,Kalnin A, Lowe MJ (2005): Activity and connectivity of brainmood regulating circuit in depression: A functional magneticresonance study. Biol Psychiatry 57:1079–1088.
Beck AT, Rush AJ, Shaw BF, Emery G (1979): Cognitive Therapyof Depression. New York: Guilford Press.
Beckmann CF, DeLuca M, Devlin JT, Smith SM (2005): Investiga-tions into resting-state connectivity using independent compo-nent analysis. Philos Trans R Soc Lond B Biol Sci 360:1001–1013.
Beckmann CF, Mackay C, Filippini N, Smith SM (2009): Groupcomparison of resting-state FMRI data using multi-subject ICAand dual regression. 15th Annual Meeting of Organization ofHuman Brain Mapping, June 18-23, San Francisco, poster 441SU-AM.
Beckmann CF, Smith SM (2004): Probabilistic independent compo-nent analysis for functional magnetic resonance imaging. IEEETrans Med Imaging 23:137–152.
Biswal B, Yetkin FZ, Haughton VM, Hyde JS (1995): Functionalconnectivity in the motor cortex of resting human brain usingecho-planar MRI. Magn Reson Med 34:537–541.
Biswal BB, Ulmer JL (1999): Blind source separation of multiplesignal sources of fMRI data sets using independent componentanalysis. J Comput Assist Tomogr 23:265–271.
Calhoun VD, Adali T, Pearlson GD, Pekar JJ (2001): Spatial andtemporal independent component analysis of functional MRIdata containing a pair of task-related waveforms. Hum BrainMapp 13:43–53.
Calhoun VD, Eichele T, Pearlson G (2009): Functional brain net-works in schizophrenia: A review. Front Hum Neurosci 3:17.
Chai XJ, Whitfield-Gabrieli S, Shinn AK, Gabrieli JD, Nieto CastanonA, McCarthy JM, Cohen BM, Ongur D (2011): Abnormal medialprefrontal cortex resting-state connectivity in bipolar disorderand schizophrenia. Neuropsychopharmacology 36:2009–2017.
Cohen RM, Gross M, Nordahl TE, Semple WE, Oren DA, Rosen-thal N (1992): Preliminary data on the metabolic brain patternof patients with winter seasonal affective disorder. Arch GenPsychiatry 49:545–552.
Cordes D, Haughton VM, Arfanakis K, Wendt GJ, Turski PA,Moritz CH, Quigley MA, Meyerand ME (2000): Mapping func-tionally related regions of brain with functional connectivity inthe cerebral cortex in ‘‘resting-state’’ data. Am J Neuroradiol22:1326–1333.
Davis AS, Horwitz JL, Noggle CA, Dean RS, Davis KM (2010):Cortical and subcortical sensorimotor impairment in patientswith major depression: A preliminary analysis. Int J Neurosci120:352–354.
Drake CL, Schwartz PJ, Turner EH, Rosenthal NE (1996): Cogni-tive performance in seasonal affective disorder: Pattern recog-nition and the Stroop task. J Nerv Ment Dis 184:56–59.
Eickhoff SB, Paus T, Caspers S, Grosbras MH, Evans AC, Zilles K,Amunts K (2007): Assignment of functional activations toprobabilistic cytoarchitectonic areas revisited. Neuroimage36:511–521.
Engels AS, Heller W, Spielberg JM, Warren SL, Sutton BP, BanichMT, Miller GA (2010): Co-occurring anxiety influences patternsof brain activity in depression. Cogn Affect Behav Neurosci10:141–156.
Filippini N, Maclntosh B, Hough M, Goodwin G, Frisoni G, SmithS, Matthews P, Beckmann C, Mackay C (2009): Distinct pat-terns of brain activity in young adults carrying the APOE-"4allele. Proc Natl Acad Sci USA 106:7209–7214.
Fox MD, Snyder AZ, Vincent JL, Corbetta M, Van Essen DC,Raichle ME (2005): The human brain is intrinsically organizedinto dynamic, anticorrelated functional networks. Proc NatlAcad Sci USA 102:9673–9678.
Garrity AG, Pearlson GD, McKiernan K, Lloyd D, Kiehl KA, Cal-houn VD (2007): Aberrant ‘‘default mode’’ functional connec-tivity in schizophrenia. Am J Psychiatry 164:450–457.
Greicius MD, Flores BH, Menon V, Glover GH, Solvason HB,Kenna H, Reiss AL, Schatzberg AF (2007): Resting-state func-tional connectivity in major depression: Abnormally increasedcontributions from subgenual cingulate cortex and thalamus.Biol Psychiatry 62:429–437.
Greicius MD, Krasnow B, Reiss AL, Menon V (2003): Functionalconnectivity in the resting brain: A network analysis of thedefault mode hypothesis. Proc Natl Acad Sci USA 100:253–258.
Greicius MD, Srivastava G, Reiss AL, Menon V (2004): Default-mode network activity distinguishes Alzheimer’s disease fromhealthy aging: evidence from functional MRI. Proc Natl AcadSci USA 101:4637–4642.
Grill-Spector K, Malach R (2004): The human visual cortex. AnnuRev Neurosci 27:649–677.
r Abou Elseoud et al. r
r 10 r
Hamilton M (1960): A rating scale for depression. J Neurol Neuro-surg Psychiatry 23:56–62.
Hoptman MJ, Zuo XN, Butler PD, Javitt DC, D’Angelo D, MauroCJ, Milham MP (2010): Amplitude of low-frequency fluctua-tions in schizophrenia: a resting state fMRI study. SchizophrRes 117:13–20.
Huang XQ, Lui S, Deng W, Chan RC, Wu QZ, Jiang LJ, Zhang JR,Jia ZY, Li XL, Li F, Chen L, Li T, Gong QY (2010): Localizationof cerebral functional deficits in treatment-naive, first-episodeschizophrenia using resting-state fMRI. Neuroimage 49:2901–2906.
Honey CJ, Kotter R, Breakspear M, Sporns O (2007): Networkstructure of cerebral cortex shapes functional connectivityon multiple time scales. Proc Natl Acad Sci USA 104:10240–10245.
Jacobsen FM, Wehr TA, Sack DA, James SP, Rosenthal NE (1987):Seasonal affective disorder: A review of the syndrome and itspublic health implications. Am J Public Health 77:57–60.
Jafri MJ, Pearlson GD, Stevens M, Calhoun VD (2008): A methodfor functional network connectivity among spatially independ-ent resting-state components in schizophrenia, Neuroimage39:1666–1168.
Jenkinson M, Bannister P, Brady M, Smith S (2002): Improvedoptimization for the robust and accurate linear registration andmotion correction of brain images. Neuroimage 17:825–841.
Kiviniemi V, Kantola JH, Jauhiainen J, Hyvarinen A, Tervonen O(2003): Independent component analysis of nondeterministicfMRI signal sources. Neuroimage 19:253–260.
Kiviniemi V, Starck T, Remes J, Long X, Nikkinen J, Haapea M,Veijola J, Moilanen I, Isohanni M, Zang YF, Tervonen O (2009):Functional segmentation of the brain cortex using high modelorder group PICA. Hum Brain Mapp 30:3865–3886.
Lewy AJ (1999): The dim light melatonin onset, melatonin assaysand biological rhythms research in humans. Biol SignalsRecept 8:79–83.
Lewy AJ, Lefler BJ, Emens JS, Bauer VK (2006): The circadian ba-sis of winter depression. Proc Natl Acad Sci USA 103:7414–7419.
Lewy AJ, Sack RL, Miller LS, Hoban TM (1987): Antidepressantand circadian phase-shifting effects of light. Science 235:352–354.
Littow H, Abou Elseoud A, Haapea M, Isohanni M, Moilanen I,Mankinen K, Nikkinen J, Rahko J, Rantala H, Remes J, StarckT, Tervonen O, Veijola J, Beckmann C, Kiviniemi VJ (2010):Age-related differences in functional nodes of the brain cor-tex—A high model order group ICA study. Front Syst Neuro-sci 4:32.
Lowe MJ, Dzemidzic M, Lurito JT, Mathews VP, Phillips MD(2000): Correlations in low-frequency BOLD fluctuations reflectcortico-cortical connections. Neuroimage 12:582–587.
Lowe MJ, Phillips MD, Lurito JT, Mattson D, Dzemidzic M, Math-ews VP (2002): Multiple sclerosis: Low-frequency temporalblood oxygen level-dependent fluctuations indicate reducedfunctional connectivity initial results. Radiology 224:184–192.
Lui S, Li T, Deng W, Jiang L, Wu Q, Tang H, Yue Q, Huang X,Chan RC, Collier DA, Meda SA, Pearlson G, Mechelli A, Swee-ney JA, Gong Q (2010): Short-term effects of antipsychotictreatment on cerebral function in drug-naive first-episodeschizophrenia revealed by ‘‘resting state’’ functional magneticresonance imaging. Arch Gen Psychiatry 67:783–792.
Lui S, Ouyang L, Chen Q, Huang X, Tang H, Chen H, Zhou D,Kemp GJ, Gong Q (2008): Differential interictal activity of the
precuneus/posterior cingulate cortex revealed by resting statefunctional MRI at 3T in generalized vs. partial seizure. J MagnReson Imaging 27:1214–1220.
Mckeown MJ, Jung TP, Makeig S, Brown G, Kindermann SS, LeeTW, Seinowski TJ (1998): Spatially independent activity pat-terns in functional MRI data during the stroop color-namingtask. Proc Natl Acad Sci USA 95:803–810.
Michalon M, Eskes GA, Mate-Kole CC (1997): Effects of light ther-apy on neuropsychological function and mood in seasonalaffective disorder. J Psychiatry Neurosci 22:19–28.
Mohammadi B, Kollewe K, Samii A, Krampfl K, Dengler R,Munte T (2009): Changes of resting state brain networks inamyotrophic lateral sclerosis. Exp Neurol 217:147–153.
Nichols TE, Holmes AP (2002): Nonparametric permutation testsfor functional neuroimaging: A primer with examples. HumBrain Mapp 15:1–25.
Nicolelis MA, Shuler M (2001): Thalamocortical and corticocorticalinteractions in the somatosensory system. Prog Brain Res130:90–110.
O’Brien JT, Sahakian BJ, Checkley SA (1993): Cognitive impair-ments in patients with seasonal affective disorder. Br J Psychi-atry 163:338–343.
Passarotti AM, Sweeney JA, Pavuluri MN (2011): Fronto-limbicdysfunction in mania pre-treatment and persisitnent amygdalaover activity post-treatment in pediatric bipolar disorder. Psy-chopharmacology (Berl) 216:485–499.
Raichle ME, MacLeod AM, Snyder AZ, Powers WJ, Gusnard DA,Shulman GL (2001): A default mode of brain function. ProcNatl Acad Sci USA 98:676–682.
Rombouts SARB, Damoiseaux JS, Goekoop R, Barkhof F, ScheltensP, Smith SM, Beckmann CF (2009): Model-free group analysisshows altered bold fMRI networks in dementia. Hum BrainMapp 30:256–266.
Rosenthal NE, Sack DA, Gillin JC, Lewy AJ, Goodwin FK, Daven-port Y, Mueller PS, Newsome DA, Wehr TA (1984): Seasonalaffective disorder. A description of the syndrome and prelimi-nary findings with light therapy. Arch Gen Psychiatry 41:72–80.
Sanacora G, Gueorguieva R, Epperson CN, Wu YT, Appel M,Rothman DL, Krystal JH, Mason GF (2004): Subtype-specificalterations of gamma-aminobutyric acid and glutamate inpatients with major depression. Arch Gen Psychiatry 61:705–713.
Sanacora G, Mason GF, Rothman D, Behar K, Hyder F, Petroff O(1999): Reduced cortical g-aminobutyric acid levels indepressed patients determined by proton magnetic spectros-copy. Arch Gen Psychiatry 56:1043–1047.
Seeley WW, Crawford RK, Zhou J, Miller BL, Greicius MD (2009):Neurodegenerative diseases target large-scale human brainnetworks. Neuron 62:42–52.
Sheehan DV, Lecrubier Y, Sheehan KH, Amorim P, Janavs J, Weil-ler E, Hergueta T, Baker R, Dunbar GC (1998): The Mini-Inter-national Neuropsychiatric Interview (M.I.N.I.): Thedevelopment and validation of a structured diagnostic psychi-atric interview for DSM-IV and ICD-10. J Clin Psychiatry59(Suppl 20):S22–S33, quiz 34-57.
Sheline YI, Prince JL, Yan Z, Mintun MA (2010): Resting-statefunctional MRI in depression unmasks increased connectivitybetween networks via the dorsal nexus. Proc Natl Acad SciUSA 107:11020–11025.
Sigmon S, Whitcomb-Smith S, Boulard N, Pells J, Hermann B,Edenfield T, Lamattina S, Schartel J (2007): Seasonal reactivity:
r Altered Functional Brain Activity in SAD r
r 11 r

Attentional bias and psychophysiological arousal in seasonaland nonseasonal depression. Cogn Ther Res 31:619–638.
Smith SM (2002): Fast robust automated brain extraction. HumBrain Mapp 17:143–155.
Smith SM, Nichols TS (2009): Threshold-free cluster enhancement:Addressing problems of smoothing, threshold dependence andlocalisation in cluster inference. Neuroimage 44:83–98.
Sobin C, Sackeim HA (1997): Psychomotor symptoms of depres-sion. Am J Psychiatry 154:4–17.
Spinks H, Dalgleish T (2001): Attentional processing and levels ofsymptomatology in seasonal affective disorder (SAD): A pre-liminary longitudinal study. J Affect Disord 62:229–232.
Sullivan B, Payne TW (2007): Affective disorders and cognitivefailures: A comparison of seasonal and nonseasonal depres-sion. Am J Psychiatry 164:1663–1667.
Van den Heuvel OA, Mataix-Cols D, Zwitser G, Cath DC, Vander Werf YD, Groenewegen HJ, Van Balkom AJ, Veltman DJ(2011): Common limbic and frontal-striatal disturbances inpatients with obsessive compulsive disorder, panic disorderand hypochondriasis. Psychol Med 5:1–12.
Veer IM, Beckmann CF, van Tol MJ, Ferrarini L, Milles J, VeltmanDJ, Aleman A, van Buchem MA, van der Wee NJ, Rombouts SA(2010): Whole brain resting-state analysis reveals decreased func-tional connectivity in major depression. Front Syst Neurosci 4:41.
Wang Z, Yan C, Zhao C, Qi Z, Zhou W, Lu J, He Y, Li K (2011):Spatial patterns of intrinsic brain activity in mild cognitiveimpairment and Alzheimer’s disease: A resting-state functionalMRI study. Hum Brain Mapp 32:1720–1740.
Wehr TA, Duncan WC Jr, Sher L, Aeschbach D, Schwartz PJ,Turner EH, Postolache TT, Rosenthal NE (2001): A circadiansignal of change of season in patients with seasonal affectivedisorder. Arch Gen Psychiatry 58:1108–1114.
Williams J, Link M, Rosenthal N, Terman M (1988): StructuredInterview Guide for the Hamilton Depression Rating Scale-Sea-sonal Affective Disorder Version (SIGH-SAD). New York: NewYork Psychiatric Institute.
Wolf RC, Sambataro F, Vasic N, Schonfeldt-Lecuona C, Ecker D,Landwehrmeyer B (2008): Aberrant connectivity of lateral pre-frontal networks in presymptomatic Huntington’s disease. ExpNeurol 213:137–144.
Yang H, Long XY, Yang Y, Yan H, Zhu CZ, Zhou XP, Zang YF,Gong QY (2007): Amplitude of low frequency fluctuationwithin visual areas revealed by resting-state functional MRI.Neuroimage 36:144–152.
Yin Y, Li L, Jin C, Hu X, Duan L, Eyler LT, Gong Q, Song M,Jiang T, Liao M, Zhang Y, Li W (2011): Abnormal baselinebrain activity in posttraumatic stress disorder: A resting-statefunctional magnetic resonance imaging study. Neurosci Lett498:185–189.
Zang YF, He Y, Zhu CZ, Cao QJ, Sui MQ, Liang M, Tian LX, JiangTZ, Wang YF (2007): Altered baseline brain activity in childrenwith ADHD revealed by resting-state functional MRI. BrainDev 29:83–91.
Zhang D, Snyder AZ, Fox MD, Sansbury MW, Shimony JS,Raichle ME (2008): Intrinsic functional relations betweenhuman cerebral cortex and thalamus. J Neurophysiol 100:1740–1748.
Zhang D, Snyder AZ, Shimony JS, Fox MD, Raichle ME (2010):Noninvasive functional and structural connectivity mappingof the human thalamocortical system. Cereb Cortex 20:1187–1194.
Zhang Z, Lu G, Zhong Y, Tan Q, Yang Z, Liao W, Chen Z, Shi J,Liu Y (2009): Impaired attention network in temporal lobe epi-lepsy: A resting fMRI study. Neurosci Lett 458:97–101.
Zhou Y, Yu C, Zheng H, Liu Y, Song M, Qin W, Li K, Jiang T(2009): Increased neural resources recruitment in the intrinsicorganization in major depression. J Affect Disord 121:220–230.
Zou QH, Zhu CZ, Yang Y, Zuo XN, Long XY, Cao QJ, Wang YF,Zang YF (2008): An improved approach to detection of ampli-tude of low-frequency fluctuations (ALFF) for resting-statefMRI: Fractional ALFF. J Neurosci Methods 172:137–141.
r Abou Elseoud et al. r
r 12 r