
The Resting Brain: Unconstrained yet Reliable
21
Cerebral Cortex October 2009;19:2209--2229 doi:10.1093/cercor/bhn256 Advance Access publication February 16, 2009 The Resting Brain: Unconstrained yet Reliable Zarrar Shehzad 1 , A. M. Clare Kelly 1 , Philip T. Reiss 2,3 , Dylan G. Gee 1 , Kristin Gotimer 1 , Lucina Q. Uddin 4 , Sang Han Lee 3 , Daniel S. Margulies 5 , Amy Krain Roy 1 , Bharat B. Biswal 3,6 , Eva Petkova 2,3 , F. Xavier Castellanos 1,3 and Michael P. Milham 1 1 Phyllis Green and Randolph Cowen Institute for Pediatric Neuroscience, NYU Child Study Center, New York, NY 10016, USA, 2 Division of Biostatistics, NYU Child Study Center, New York, NY 10016, USA, 3 Nathan Kline Institute for Psychiatric Research, Orangeburg, NY 10962, USA, 4 Department of Psychiatry, Stanford University School of Medicine, Stanford, CA, USA, 5 Berlin School for Mind and Brain, Humboldt Universitat, Berlin, Germany and 6 Department of Radiology, University of Medicine and Dentistry of New Jersey, Newark, NJ 07101, USA Zarrar Shehzad and A. M. Clare Kelly contributed equally to the present work. Recent years have witnessed an upsurge in the usage of resting- state functional magnetic resonance imaging (fMRI) to examine functional connectivity (fcMRI), both in normal and pathological populations. Despite this increasing popularity, concerns about the psychologically unconstrained nature of the ‘‘resting-state’’ remain. Across studies, the patterns of functional connectivity detected are remarkably consistent. However, the test--retest reliability for measures of resting state fcMRI measures has not been de- termined. Here, we quantify the test--retest reliability, using resting scans from 26 participants at 3 different time points. Specifically, we assessed intersession (>5 months apart), intrasession (<1h apart), and multiscan (across all 3 scans) reliability and consistency for both region-of-interest and voxel-wise analyses. For both approaches, we observed modest to high reliability across connections, dependent upon 3 predictive factors: 1) correlation significance (significantly nonzero > nonsignificant), 2) correlation valence (positive > negative), and 3) network membership (default mode > task positive network). Short- and long-term measures of the consistency of global connectivity patterns were highly robust. Finally, hierarchical clustering solutions were highly reproducible, both across participants and sessions. Our findings provide a solid foundation for continued examination of resting state fcMRI in typical and atypical populations. Keywords: fMRI, intraclass correlations, reliability, resting-state functional connectivity, test--retest Introduction Recent years have witnessed a proliferation of fMRI studies examining resting-state functional connectivity (fcMRI) in both normal and pathological populations. This approach detects spatial patterns of temporally correlated low-frequency fluctu- ations in the blood oxygen level--dependent (BOLD) signal across the brain (Biswal et al. 1995). Resting-state fcMRI allows researchers to map out complex neural circuits, referred to as intrinsic connectivity networks (ICNs), with a degree of detail and specificity previously possible only in animal paradigms or meta-analyses of hundreds of studies (Margulies et al. 2007; Di Martino et al. 2008; Kahn et al. 2008). Furthermore, the ICNs observed during rest show significant overlap with task-evoked activations (Biswal et al. 1995; Greicius et al. 2003; Fox et al. 2007; Toro et al. 2008), structural connectivity (Andrews- Hanna et al. 2007; Greicius, Supekar, et al. 2008; Hagmann et al. 2008; Lowe et al. 2008) and maps of anatomical connectivity derived using retrograde tracers in macaques (Vincent et al. 2007). In light of these observations, coherent spontaneous low-frequency fluctuations in BOLD activity are increasingly recognized as an intrinsic property of brain (Buckner et al. 2008; Fox and Raichle 2007), suggesting that measures of fcMRI are inherently stable. The remarkable spatial consistency of ICNs detected across resting-state fcMRI studies appears to corroborate such sta- bility. The ICNs detected using both model-based (e.g., seed- based correlation analysis) and model-free approaches (e.g., independent component analysis) are highly reproducible across participants and scans (Van De Ven et al. 2004; Damoiseaux et al. 2006) and multiple resting-state conditions, including eyes open, eyes closed, or fixation (Fox et al. 2005; Fransson 2005). The spatial configurations of ICNs are also preserved across conscious states, specifically during light sedation (Greicius, Kiviniemi, et al. 2008; Horovitz et al. 2008) and during sleep (Fukunaga et al. 2006, 2008). Although these studies indicate that the overall architecture of correlated spontaneous activity in the brain is stable, other work suggests that the strength of specific correlations between regions is dynamic. Task demands have been shown to modulate functional connectivity within ICNs (Fransson 2006; Hampson et al. 2006; Harrison, Pujol, Lo´pez-Sola`, et al. 2008; Kelly, Uddin, et al. 2008), and may alter the spatial con- figuration of negative correlations to a greater extent than that of positive correlations (Tian et al. 2007). Other studies have shown that specific interregional functional connections are modulated by factors such as current conscious (Greicius, Kiviniemi, et al. 2008; Horovitz et al. 2008), cognitive (Waites et al. 2005) and emotional state (Harrison, Pujol, Ortiz, et al. 2008). Given the unconstrained nature of the resting state, such factors should decrease the reliability of fcMRI measures for a given individual across time. Accordingly, the reliability of resting state measures, and the factors that may modulate it, need to be rigorously examined. To our knowledge, no prior study has explicitly quantified the test--retest reliability of resting state fcMRI measures. As differences in fcMRI measures have been associated with differences between clinical groups (Castellanos et al. 2008; see Ó The Author 2009. Published by Oxford University Press. All rights reserved. For permissions, please e-mail: [email protected] at UCLA Biomedical Library Serials on February 1, 2012 http://cercor.oxfordjournals.org/ Downloaded from
Transcript of The Resting Brain: Unconstrained yet Reliable

Cerebral Cortex October 2009;19:2209--2229
doi:10.1093/cercor/bhn256
Advance Access publication February 16, 2009
The Resting Brain: Unconstrained yetReliable
Zarrar Shehzad1, A. M. Clare Kelly1, Philip T. Reiss2,3, Dylan
G. Gee1, Kristin Gotimer1, Lucina Q. Uddin4, Sang Han Lee3,
Daniel S. Margulies5, Amy Krain Roy1, Bharat B. Biswal3,6,
Eva Petkova2,3, F. Xavier Castellanos1,3 and Michael P. Milham1
1Phyllis Green and Randolph Cowen Institute for Pediatric
Neuroscience, NYU Child Study Center, New York, NY 10016,
USA, 2Division of Biostatistics, NYU Child Study Center,
New York, NY 10016, USA, 3Nathan Kline Institute for
Psychiatric Research, Orangeburg, NY 10962, USA,4Department of Psychiatry, Stanford University School of
Medicine, Stanford, CA, USA, 5Berlin School for Mind and Brain,
Humboldt Universitat, Berlin, Germany and 6Department of
Radiology, University of Medicine and Dentistry of New Jersey,
Newark, NJ 07101, USA
Zarrar Shehzad and A. M. Clare Kelly contributed equally to the
present work.
Recent years have witnessed an upsurge in the usage of resting-state functional magnetic resonance imaging (fMRI) to examinefunctional connectivity (fcMRI), both in normal and pathologicalpopulations. Despite this increasing popularity, concerns about thepsychologically unconstrained nature of the ‘‘resting-state’’ remain.Across studies, the patterns of functional connectivity detected areremarkably consistent. However, the test--retest reliability formeasures of resting state fcMRI measures has not been de-termined. Here, we quantify the test--retest reliability, using restingscans from 26 participants at 3 different time points. Specifically,we assessed intersession (>5 months apart), intrasession (<1 hapart), and multiscan (across all 3 scans) reliability and consistencyfor both region-of-interest and voxel-wise analyses. For bothapproaches, we observed modest to high reliability acrossconnections, dependent upon 3 predictive factors: 1) correlationsignificance (significantly nonzero > nonsignificant), 2) correlationvalence (positive > negative), and 3) network membership (defaultmode > task positive network). Short- and long-term measures ofthe consistency of global connectivity patterns were highly robust.Finally, hierarchical clustering solutions were highly reproducible,both across participants and sessions. Our findings provide a solidfoundation for continued examination of resting state fcMRI intypical and atypical populations.
Keywords: fMRI, intraclass correlations, reliability, resting-state functionalconnectivity, test--retest
Introduction
Recent years have witnessed a proliferation of fMRI studies
examining resting-state functional connectivity (fcMRI) in both
normal and pathological populations. This approach detects
spatial patterns of temporally correlated low-frequency fluctu-
ations in the blood oxygen level--dependent (BOLD) signal
across the brain (Biswal et al. 1995). Resting-state fcMRI allows
researchers to map out complex neural circuits, referred to as
intrinsic connectivity networks (ICNs), with a degree of detail
and specificity previously possible only in animal paradigms or
meta-analyses of hundreds of studies (Margulies et al. 2007; Di
Martino et al. 2008; Kahn et al. 2008). Furthermore, the ICNs
observed during rest show significant overlap with task-evoked
activations (Biswal et al. 1995; Greicius et al. 2003; Fox et al.
2007; Toro et al. 2008), structural connectivity (Andrews-
Hanna et al. 2007; Greicius, Supekar, et al. 2008; Hagmann et al.
2008; Lowe et al. 2008) and maps of anatomical connectivity
derived using retrograde tracers in macaques (Vincent et al.
2007). In light of these observations, coherent spontaneous
low-frequency fluctuations in BOLD activity are increasingly
recognized as an intrinsic property of brain (Buckner et al.
2008; Fox and Raichle 2007), suggesting that measures of
fcMRI are inherently stable.
The remarkable spatial consistency of ICNs detected across
resting-state fcMRI studies appears to corroborate such sta-
bility. The ICNs detected using both model-based (e.g., seed-
based correlation analysis) and model-free approaches (e.g.,
independent component analysis) are highly reproducible
across participants and scans (Van De Ven et al. 2004;
Damoiseaux et al. 2006) and multiple resting-state conditions,
including eyes open, eyes closed, or fixation (Fox et al. 2005;
Fransson 2005). The spatial configurations of ICNs are also
preserved across conscious states, specifically during light
sedation (Greicius, Kiviniemi, et al. 2008; Horovitz et al. 2008)
and during sleep (Fukunaga et al. 2006, 2008).
Although these studies indicate that the overall architecture
of correlated spontaneous activity in the brain is stable, other
work suggests that the strength of specific correlations
between regions is dynamic. Task demands have been shown
to modulate functional connectivity within ICNs (Fransson
2006; Hampson et al. 2006; Harrison, Pujol, Lopez-Sola, et al.
2008; Kelly, Uddin, et al. 2008), and may alter the spatial con-
figuration of negative correlations to a greater extent than that
of positive correlations (Tian et al. 2007). Other studies have
shown that specific interregional functional connections are
modulated by factors such as current conscious (Greicius,
Kiviniemi, et al. 2008; Horovitz et al. 2008), cognitive (Waites
et al. 2005) and emotional state (Harrison, Pujol, Ortiz, et al.
2008). Given the unconstrained nature of the resting state,
such factors should decrease the reliability of fcMRI measures
for a given individual across time. Accordingly, the reliability of
resting state measures, and the factors that may modulate it,
need to be rigorously examined.
To our knowledge, no prior study has explicitly quantified
the test--retest reliability of resting state fcMRI measures. As
differences in fcMRI measures have been associated with
differences between clinical groups (Castellanos et al. 2008; see
� The Author 2009. Published by Oxford University Press. All rights reserved.
For permissions, please e-mail: [email protected]
at UC
LA
Biom
edical Library Serials on February 1, 2012
http://cercor.oxfordjournals.org/D
ownloaded from

Greicius 2008 for review; Greicius et al. 2007; He, Snyder, et al.
2007; Kennedy et al. 2006; Liu et al. 2008) and with
interindividual differences in behavioral performance (Fox
et al. 2007; Hampson et al. 2006; Kelly, Uddin, et al. 2008;
Seeley et al. 2007), establishing the reliability of these measures
is crucial to the continued investigation of such interindividual
and group-based differences.
In the present study, we investigated the test--retest
reliability of resting-state fcMRI. Specifically, we used fMRI to
measure resting-state activity in a group of 26 participants at
3 different time points, in order to assess intersession
( >5 months apart), intrasession ( <1 h apart), and multiscan
(across all 3 scans) reliability. To provide a comprehensive
assessment of brain functional connectivity, we adopted several
approaches. As a starting point, we specified 3 sets of regions of
interest (ROIs), derived from 4 different and representative
studies (Dosenbach et al. 2007; Kennedy et al. 1998; Makris
et al. 1999; Toro et al. 2008). We then explored the reliability
and consistency of fcMRI between ROIs within each seed set in
3 different ways. We computed the following: 1) the reliability
of correlations between pairs of ROIs using intraclass correla-
tions (ICC); 2) the consistency of entire sets of correlations,
using Kendall’s coefficient of concordance (Kendall’sW); 3) the
consistency with which hierarchical clustering partitioned
ROIs into 2 of the most commonly observed ICNs in the resting
state fcMRI literature, the ‘‘default mode’’ and the ‘‘task
positive’’ networks. We also calculated ICC and Kendall’s W
on a voxelwise basis for the ICNs associated with 3 seed ROIs
placed in posterior cingulate cortex (PCC), supplementary
motor area (SMA), and the inferior parietal sulcus (IPS). As
previous studies have suggested that the stability of fcMRI
measures may vary, we also explored 3 factors that could
impact reliability. These were 1) statistical significance of
correlations, 2) valence of correlations (i.e., positive vs.
negative correlations), and 3) network membership of regions
(default mode vs. task positive network).
Materials and Methods
ParticipantsTwenty-six right-handed native English-speaking participants were
included (11 males; mean age 20.5 ± 8.4). Participants had no history of
psychiatric or neurological illness, as confirmed by a psychiatric clinical
assessment. The study was approved by the institutional review boards
of the New York University School of Medicine and New York
University. Signed informed consent was obtained prior to participa-
tion, which was compensated.
fMRI Data AcquisitionA Siemens Allegra 3.0 Tesla scanner equipped for echoplanar imaging
(EPI) was used for data acquisition. For each participant, we collected
3 resting-state scans of 197 continuous EPI functional volumes (time
repetition [TR] = 2000 ms; time echo [TE] = 25 ms; flip angle = 90; 39
slices, matrix = 64 3 64, field of view [FOV] = 192 mm; acquisition voxel
size = 3 3 3 3 3 mm) for each scan. Scans 2 and 3 were conducted in
a single scan session, 45 min apart, and were 5--16 months (mean 11 ± 4
months) after Scan 1. Complete cerebellar coverage was not possible
for all participants and only those cerebellar regions acquired in all
participants were included in subsequent statistical analyses. During
the scan, participants were instructed to rest with their eyes open
while the word ‘‘Relax’’ was centrally projected in white, against a black
background. For spatial normalization and localization, a high-resolution
T1-weighted anatomical image was also acquired using a magnetization
prepared gradient echo sequence (MP-RAGE, TR = 2500 ms; TE = 4.35 ms;
inversion time (TI) = 900 ms; flip angle = 8; 176 slices, FOV = 256 mm).
fMRI Data PreprocessingConsistent with prior work in our lab (e.g., Margulies et al. 2007;
Di Martino et al. 2008), data were processed using both AFNI (version
AFNI_2008_07_18_1710, http://afni.nimh.nih.gov/afni) and FSL (ver-
sion 3.3, www.fmrib.ox.ac.uk). Image preprocessing using AFNI
consisted of 1) slice time correction for interleaved acquisitions using
Fourier interpolation, 2) 3D motion correction (3D volume registration
using least-squares alignment of 3 translational and 3 rotational
parameters), and 3) despiking of extreme time series outliers using
a continuous transformation function. Preprocessing using FSL con-
sisted of 4) mean-based intensity normalization of all volumes by the
same factor, 5) spatial smoothing (Gaussian kernel of full-width half
maximum 6 mm, see below for exception), 6) temporal high-pass
filtering (Gaussian-weighted least-squares straight line fitting with
sigma = 100.0 s), 7) temporal low-pass filtering (Gaussian filter with
half-width half maximum = 2.8 s), and 8) correction for time series
autocorrelation (prewhitening). Prewhitening renders successive time
points independent of one another, thus improving the validity of
subsequent statistical analyses (Woolrich et al. 2001). Functional data
were then transformed into MNI152 (Montreal Neurological Institute)
space using a 12 degree of freedom linear affine transformation
implemented in FMRIB Linear Image Registration Tool (voxel size = 2 3
2 3 2 mm). Mean time series for each ROI (selection described below)
were extracted from this standardized functional volume by averaging
over all voxels within the region. To ensure that each time series
represented regionally specific neural activity, in each analysis, the
mean time series of each ROI was orthogonalized with respect to 9
nuisance signals (global signal, white matter, cerebrospinal fluid, and 6
motion parameters). In previous studies (e.g., Margulies et al. 2007; Di
Martino et al. 2008), seed time series were orthogonalized with respect
to one another, in addition to the 9 nuisance signals. This was necessary
because the aim of those studies was to examine functional differenti-
ation within specific brain regions such as the anterior cingulate cortex.
Orthogonalization removes signals common to all the seeds, thus
permitting the detection of fcMRI unique to each seed included in the
model. In contrast, in the present study, our aim was to examine
condition-related (i.e., time- or scan-related) differences in fcMRI. In line
with other studies from our group that examined group differences in
fcMRI (e.g., Castellanos et al. 2008; Kelly, Di Martino, et al. 2008), we have
not orthogonalized the seed time series with respect to one another. This
is because in the context of the examination of interindividual, group- or
condition-related differences, removal of signals common to the seeds
(through orthogonalization) can be hazardous, because the nature or
degree of the signal removed can differ between groups or conditions,
introducing a confound.
Functional Connectivity: ROI SelectionIn view of the possible influence of ROI selection on functional
connectivity, we adopted 3 different seed sets based on previously
published studies (see Table S1 for all ROI coordinates). In separate
analyses, we assessed the reliability of connections between seeds of
each set.
The 3 sets used were as follows:
� Set A: Dosenbach et al. (2007): Combining data from 8 studies
comprising 183 participants, Dosenbach et al. (2007) identified
39 regions that demonstrated activity related to task control processes
(e.g., start-cue or error-related activity). For each region, a spherical ROI
(radius = 5 mm) centered on the reported coordinate was created. As
coordinates were originally reported in Talairach space, they were first
converted to MNI152 space using tal2mni.m (Brett et al. 2001).
� Set B: Toro et al. (2008) . From a meta-analysis of 825 neuroimaging
papers, Toro and colleagues identified 30 ROIs demonstrating
consistent coactivation. These regions represented 2 well-known
networks (‘‘task positive’’ and ‘‘task-negative’’), which have also been
observed in resting-state analyses (Fox et al. 2005; Fransson 2005;
Kelly, Uddin, et al. 2008). For each region, a spherical ROI (radius = 5
mm) centered on the reported coordinate was created. We
2210 Test--Retest Reliability of fMRI Functional Connectivity d Shehzad et al.
at UC
LA
Biom
edical Library Serials on February 1, 2012
http://cercor.oxfordjournals.org/D
ownloaded from

excluded 2 of the reported regions (inferior temporal cortex and
cerebellum) from our analyses due to incomplete coverage of the
brain in some of our participants. Although Toro et al. (2008)
reported the peak coordinates in MNI305 stereotaxic space, no
conversion to MNI152 space was necessary. These MNI152 and
MNI305 spaces are essentially equivalent as the brains used to create
the MNI152 template were first registered to the MNI305 brain using
a 9 parameter affine transform (Brett et al. 2002).
� Set C: Kennedy et al. (1998); Makris et al. (1999). In order to
conduct an objective survey of connectivity across the brain, we
parcellated each hemisphere into 56 anatomical regions of interest
using the Harvard--Oxford Structural Atlas, a probabilistic atlas in
MNI152 space that defines regions based on standard anatomical
boundaries. Masks were generated from the 25% thresholded atlas
provided by FSL, and masks overlapping the midline were divided at
X = 0.
Although preprocessing was identical for analyses using Sets A and B,
spatial smoothing differed for Set C. More specifically, ROIs in Sets A
and B were extracted from spatially smoothed data, whereas ROIs in Set
C were extracted from nonspatially smoothed data in line with
previous studies (Salvador et al. 2005; Achard et al. 2006; Liu et al.
2008).
Functional Connectivity: ROI AnalysesSubsequent to time series extraction, functional connectivity analyses
were carried out in the R statistical environment (version 2.7.0, http://
www.r-project.org). For each seed set, Pearson correlation coefficients
were calculated for each pair of regions, for each subject and each scan.
The resulting correlation coefficients were either Fisher z-transformed
for subsequent calculation of ICC, or were transformed into a distance
measure (1 - r), for use in subsequent consistency (Kendall’s W) and
clustering analyses.
To assess the significance of the correlation between each pair of
regions in each seed set, we carried out a one-sample t-test on the z-
transformed correlation coefficients for the 26 participants. Signifi-
cance was defined as a 2-sided P-value of 0.05, which was adjusted for
multiple comparisons using a Bonferroni correction (741 correlations
for Set A, 378 for Set B, and 6216 for Set C). This t-test determined the
group-level significance of each correlation (i.e., whether or not the
correlation differed significantly from zero).
To derive a group-level functional connectivity matrix, every z-
transformed correlation was averaged across subjects, for each seed set
and for each scan. The resulting matrix of mean z-transformed
correlation values was then reverse transformed to produce a matrix
of group-mean r-values (Corey et al. 1998).
Functional Connectivity: Voxelwise AnalysesFor each participant, we performed a multiple regression analysis (as
implemented in the FSL program FEAT [version 3.3. www.fmrib.
ox.ac.uk]) to identify those voxels positively and negatively correlated
with each of 3 seed ROIs. The seed ROIs were selected from seed Set C
(Toro et al. 2008): the PCC (MNI coordinates: –6 –58 28), SMA (–2 10
48), and IPS (26 –58 48). These 3 ROIs were selected because they
represent core components of the commonly identified default mode
and task positive networks. The time series data were preprocessed as
outlined above, and the seed ROI time series were orthogonalized with
respect to the same 9 nuisance signals (global signal, white matter,
cerebrospinal fluid, and 6 motion parameters). For a more complete
description of our methods for determining voxelwise connectivity, see
Margulies et al. (2007) and Di Martino et al. (2008).
Group-level analyses were carried out using a mixed-effects model
(as implemented in the FSL program FLAME). Corrections for multiple
comparisons were carried out at the cluster level using Gaussian
random field theory (min Z > 2.3; cluster significance: P < 0.05,
corrected). This group-level analysis produced thresholded Z-score
maps (‘‘networks’’) of positive and negative functional connectivity for
each seed ROI. Group-level maps were calculated for each scan (scans
1, 2 and 3). We also calculated group-level maps of intersession,
intrasession, and multiscan functional connectivity. To do this, we
carried out a fixed-effects analysis for each participant, which
combined scans 1 and 2 (intersession fcMRI), scans 2 and 3
(intrasession fcMRI) and scans 1, 2 and 3 (multiscan fcMRI). For all
our analyses, we defined intersession reliability as the comparison
between scans 1 and 2, rather than scans 1 and 3, because scans 1 and 2
both represent the first resting-state scan of their respective scan
sessions. Subsequent to this subject-level fixed-effects analysis, a stan-
dard mixed-effects model was employed to derive the thresholded Z-
score maps for each of the combined analyses (i.e., intersession,
intrasession, and multiscan functional connectivity).
Reliability: ROI AnalysesTo investigate the reliability of each functional connection, we
calculated ICCs, a common measure of test--retest reliability (Shrout
and Fleiss 1979). For each correlation, three 26 3 n matrices were
created, representing the z-transformed correlation values for 26
participants and n scans. Here n can represent scans 1 and 2
(intersession or long-term reliability), or scans 2 and 3 (intrasession
or short-term reliability), or all 3 scans (multiscan reliability). Using
a one-way ANOVA applied to each of the 3 possibilities for n, we
obtained the between-subject mean square (MSb) and within-subject
mean square (MSw) for each correlation. ICC values were subsequently
calculated according to the following equation where k is the number
of observations per participant (Shrout and Fleiss 1979):
ICC =MSb –MSw
MSb + ðk – 1ÞMSw
Given the substantial differences in time between scans, we
compared intersession ( >5 months apart) and intrasession ( <1 h apart)
ICC. We also examined the effect of the following factors on the
multiscan reliability of fcMRI. 1) Statistical significance: correlations
determined to be significant at the group level (see Functional
Connectivity: ROI Analyses, above) were compared with those that
failed to reach significance. 2) Valence: significant positive correlations
were compared with that of significant negative correlations. 3)
Network membership: from seed Set B (Toro et al. 2008), we compared
correlations for connections within the default mode network,
correlations for connections within the task-positive network,
and correlations for connections between the 2.
Consistency of Correlation SetsTo examine the stability for sets of correlation patterns as opposed to
individual correlations, we adopted a second approach. We used
Kendall’s coefficient of concordance (W) to quantify the consistency of
all possible correlations in each seed set in 2 ways: 1) intraindividual
(i.e., within subjects across scans) and 2) interindividual (i.e., within
scans across subjects) (Kendall and Smith 1939; Kendall and Gibbons
1990). Kendall’s W is typically used to assess agreement among raters
based on rank order of ratings, and ranges from 0 (no agreement) to 1
(complete agreement). Here, it reflects the consistency or agreement
in the rank order of correlations across participants and scans. In the
context of fcMRI, Kendall’s W has previously been used to compare the
consistency of time series within an individual (‘‘regional homogene-
ity’’; Zang et al. 2004). Kendall’s W was calculated as follows (where k =number of scans or number of participants, n = number of possible
connections, Ri is the sum rank of the ith connection, �R is the mean of
Ri‘s):
W =
123 +n
i=1
ðRi – �RÞ2
k2 3 ðn3 –nÞ
We applied permutation tests to assess the significance of the
resulting Kendall’s W values (see Supporting Information; Legendre and
Lapointe 2004; Mielke and Berry 2007). Taking all pairwise correlations
from each seed set, we examined the significance of 1) interindividual
consistency (i.e., comparing the consistency within scans across
subjects to chance), and 2) intraindividual consistency (i.e., comparing
the consistency of a given participant’s 3 scans to the consistency of 3
scans selected randomly from 3 different participants and always
comprising one of each scans 1, 2, and 3).
Cerebral Cortex October 2009, V 19 N 10 2211
at UC
LA
Biom
edical Library Serials on February 1, 2012
http://cercor.oxfordjournals.org/D
ownloaded from

As with ICC, we wanted to assess the substantial differences in time
between scans and compared intersession ( >5 months apart) and
intrasession ( <1 h apart) Kendall’s W. We also examined the effect of
the following factors on the multiscan consistency of fcMRI: statistical
significance, valence, and network membership (see Reliability: ROI
Analyses, above).
Consistency of NetworksWe tested the reproducibility of the default mode and task networks, as
well as the reliability and consistency of correlations within and
between these networks. ROIs for these 2 networks were derived from
seed Set B (Toro et al. 2008). We used hierarchical clustering and
compared the 2-cluster solutions for each participant at each scan
session. For each scan and each participant, we 1) applied hierarchical
clustering in a manner similar to previous fcMRI studies (Cordes et al.
2002; Salvador et al. 2005; Dosenbach et al. 2007) using average linkage
to each 28 3 28 matrix of distances (1 - r) representing all pairwise
correlations for seed Set B (Toro et al. 2008) and 2) identified a 2-
cluster solution. We then explored the similarity of cluster membership
across participants and sessions. For each region, and for each scan, we
recorded the proportion of participants for whom that region was
assigned to the same cluster as in Toro et al (‘‘percent agreement’’).
We calculated the reliability of individual connections within and
between these 2 networks using ICC, and the consistency of cor-
relation patterns within and between the networks using Kendall’s W.
Reliability: Voxelwise AnalysesTo assess the reliability of the 3 voxelwise analyses (for the PCC, SMA,
and IPS), we calculated the ICC for each voxel, using the same method
as for the ROI analyses. We calculated the between-subject mean
square (MSb) and within-subject mean square (MSw) for each voxel’s
parameter estimate (the output of the multiple regression analysis
conducted to assess functional connectivity), reflecting that voxel’s
connectivity with the seed ROI. We then calculated the ICC on
a voxelwise basis. As for the ROI analyses, we computed the
intersession, intrasession and multiscan ICC for each network (i.e.,
the pattern of functional connectivity associated with the PCC, SMA,
and IPS seeds), and compared inter- and intrasession ICC for each
network’s positive, negative and nonsignificant correlations using the
Wilcoxon signed rank test.
To quantify the consistency of voxelwise correlation patterns at the
individual level, we calculated the inter-, intra- and multiscan Kendall’s
W for each seed across scans as well as between subjects in an identical
manner to the ROI analysis (see Consistency of Correlation Sets). We
also directly compared the intra- and intersession concordance for
individual subjects across scans using the Wilcoxon signed rank test.
Given our previous interest in the magnitude of the negative
correlation between the cingulo-parietal or default mode network and
the fronto-parietal or task positive network (Kelly, Uddin, et al. 2008),
we also quantified the test--retest reliability of that anticorrelation. To
do this, we extracted the mean time series for the default mode and
task positive networks, using the group-level maps (for the combined
[multiscan] analysis) of positive and negative connectivity for the PCC
seed as masks. The mean time series were then orthogonalized with
respect to the 9 nuisance covariates, using the same Gram--Schmidt
process employed prior to conducting the voxelwise multiple re-
gression. Finally, for each participant we quantified the strength of the
negative relationship between the default mode and task positive time
series across participants using the Pearson correlation coefficient. We
computed the intersession, intrasession, and multiscan ICC of the
anticorrelation in the same manner as described above.
Results
Seed ROI-based fcMRI
In order to provide a comprehensive assessment of fcMRI
across the brain, we quantified the reliability and consistency of
correlations between ROIs within 3 different seed sets (Sets A,
B, and C) that were derived from 4 previously published studies
(Kennedy et al. 1998; Makris et al. 1999; Dosenbach et al. 2007;
Toro et al. 2008) (see Table S1 for all ROI coordinates).
Intraclass Correlation
To investigate the reliability of fcMRI between pairs of regions,
we calculated the ICC, a standard measure of test--retest
reliability, for all possible z-transformed correlation coeffi-
cients, separately for each seed set (Shrout and Fleiss 1979).
The ICC is a ratio of within-subject variability to between-
subject variability. Thus, for a functional connection to be
reliable, within-subject variability of r-values (i.e., across scans)
must be low relative to between-subject variability of r-values
(i.e., across participants). We calculated ICCs for correlations
taken from scans 1 and 2 (intersession reliability), scans 2 and 3
(intrasession reliability), or scans 1, 2, and 3 (multiscan
reliability).
Inter- and intrasession test--retest reliability. Intersession
(long-term; scans 1 and 2) and intrasession (short-term; scans
2 and 3) test--retest reliability were highly similar across the 3
seed sets (Table 1, Fig. S1a), though intrasession ICCs were
higher on average than intersession ICCs (Fig. 1a).
Multiscan reliability. The multiscan ICC measures reliability
across all 3 scanning sessions. By pooling all 3 scans, multiscan
ICC provides a more precise and stable estimate of reliability
(Fig. S1a). Multiscan ICCs for all correlations within a seed set
were similar for each of the 3 seed sets (Table 1, Fig. S1a).
Within each seed set, multiscan ICC values for specific
correlations were variable, ranging from effectively zero to
moderate/high reliability (maximum ICC: Set A = 0.67; Set B =0.69; Set C = 0.76). Table 2 displays the statistically significant
correlations (i.e., those significant at the group level for each of
the 3 scans, see Functional Connectivity: ROI Analyses of
Materials and Methods) exhibiting multiscan ICC values larger
than 0.5 for seed sets A and B and larger than 0.60 for seed set C.
Table 1ROI-based analysis: ICC summary
Multiscan Intersession Intrasession Inter versusintra
Set AAll 0.26 ± 0.16 0.23 ± 0.20 0.31 ± 0.22 5.5 3 10�9
Significant 0.32 ± 0.16 0.29 ± 0.20 0.38 ± 0.20 9.9 3 10�4
Nonsignificant 0.24 ± 0.16 0.22 ± 0.20 0.29 ± 0.22 1.3 3 10�13
Positive significant 0.36 ± 0.15 0.31 ± 0.19 0.43 ± 0.17 1.3 3 10�5
Negative significant 0.21 ± 0.13 0.22 ± 0.19 0.22 ± 0.20 7.3 3 10�1
Set BAll 0.22 ± 0.17 0.22 ± 0.22 0.27 ± 0.22 2.7 3 10�2
Significant 0.27 ± 0.16 0.26 ± 0.22 0.30 ± 0.21 3.4 3 10�1
Nonsignificant 0.20 ± 0.16 0.19 ± 0.21 0.26 ± 0.23 2.8 3 10�5
Positive significant 0.32 ± 0.17 0.31 ± 0.20 0.36 ± 0.23 6.3 3 10�2
Negative significant 0.22 ± 0.14 0.20 ± 0.22 0.23 ± 0.15 3.3 3 10�1
Set CAll 0.22 ± 0.16 0.22 ± 0.20 0.26 ± 0.20 1.9 3 10�10
Significant 0.24 ± 0.15 0.26 ± 0.19 0.29 ± 0.20 5.9 3 10�6
Nonsignificant 0.21 ± 0.16 0.21 ± 0.20 0.25 ± 0.20 7.2 3 10�27
Positive significant 0.29 ± 0.14 0.28 ± 0.18 0.32 ± 0.19 2.1 3 10�11
Negative significant 0.16 ± 0.14 0.22 ± 0.19 0.21 ± 0.19 7.3 3 10�1
Note: Listed are the mean and standard deviation of intersession, intrasession, and multiscan
ICCs for all, significant, nonsignificant, positive significant, or negative significant correlations for
each seed set. The last column of each table indicates the P-value for the comparison of inter-
and intrasession ICCs. Significant P-values (less than 0.01, corrected for 5 comparisons for each
seed set) are marked in italics.
2212 Test--Retest Reliability of fMRI Functional Connectivity d Shehzad et al.
at UC
LA
Biom
edical Library Serials on February 1, 2012
http://cercor.oxfordjournals.org/D
ownloaded from

Factors affecting ICC. Significant versus nonsignificant
connections. As most fcMRI studies focus their analyses on
statistically significant correlations, we compared the ICCs of
both significant and nonsignificant correlations (Fig. 2a). A
Wilcoxon rank-sum test demonstrated that intersession, intra-
session, and multiscan ICCs for significant correlations were
significantly greater than for nonsignificant correlations (Table
1) for all 3 seed sets (P < 0.0001 for all comparisons).
Positive versus negative correlations. Consistent with
previous research suggesting greater variability of negative
fcMRI correlations (Tian et al. 2007; Skudlarski et al. 2008), we
found that positive correlations were more reliable than
negative correlations (Fig. 2b). Restricting our analysis to only
significant correlations, a Wilcoxon rank-sum test demon-
strated that positive correlations were significantly more
reliable than negative correlations for intersession, intrasession,
and multiscan comparisons across all 3 seed sets (see Table 1;
P < 0.001 for all comparisons).
Magnitude of correlations. Figure 3 plots the mean group-
level correlation (i.e., the group-level correlation, averaged across
all 3 scans) against the corresponding multiscan ICC (see Fig. S2
for similar inter- and intrasession plots). Spline-based nonpara-
metric regression fits, shown in the figures, revealed a trend
towards increasing ICC for increasing magnitudes of correlation
values, especially for positive correlations. Approximate Wald
tests of these nonparametric regression models (Wood 2006)
confirmed the significance of the nonlinear relationships
between correlation and intersession, intrasession, andmultiscan
ICC for all 3 seed sets (P < 0.0001 for all comparisons).
Intersession versus intrasession ICC. The difference be-
tween inter- and intrasession ICCs (Table 1) was significant
(Wilcoxon signed rank test; P < 0.001) for 2 of the 3 seed sets
(Set A and Set C). This was the case for all of the comparisons
we examined, except for negative significant correlations (i.e.,
intrasession ICCs were significantly larger for all correlations
combined, and for significant, nonsignificant, and positive
significant correlations). For Set B, only nonsignificant corre-
lations exhibited a significantly higher intrasession ICC
(Wilcoxon signed rank test; P < 0.001).
Kendall’s Coefficient of Concordance
We used the ICC to quantify the reliability of specific
connections. However, functional connections may be best
considered not in isolation but rather as part of a general
pattern of connectivity. Thus, we measured the concordance of
sets of correlations within and between subjects using
Kendall’s coefficient of concordance (W). Kendall’s W reflects
the consistency or agreement in the rank order of correlations
across subjects or across scans, and ranges from 0 (no
agreement) to 1 (complete agreement). We assessed interses-
sion (scans 1 and 2), intrasession (scans 2 and 3), and multiscan
(scans 1, 2, and 3) consistency in terms of 1) intraindividual
consistency (i.e., concordance of sets of correlations within
subjects across scans) and 2) intraindividual consistency (i.e.,
concordance of sets of correlations within scans across
subjects).
Inter- and intrasession consistency. Within subjects (i.e.,
intraindividual), the consistency of each seed set across
intersession scans 1 and 2 and intrasession scans 2 and 3
ranged from moderate to high (Table 3, Fig. 1a, Fig. S1b, see
Fig. S3 for 2 representative participants). The differences in
Figure 1. ROI-based analysis: inter- and intrasession reliability and consistency. (a) Intersession (scans 1 and 2) test--retest reliability (ICC) plotted against intrasession Scans 2and 3) test--retest reliability. (b) Intersession consistency (Kendall’s coefficient of concordance, W) plotted against intrasession consistency.
Cerebral Cortex October 2009, V 19 N 10 2213
at UC
LA
Biom
edical Library Serials on February 1, 2012
http://cercor.oxfordjournals.org/D
ownloaded from

intra- and intersession consistency for all correlations were not
significant for any of the 3 seed sets (Wilcoxon signed rank
test), following Bonferroni correction for multiple comparisons
(i.e., adjusted for 5 comparisons, P < 0.01). Between subjects
(i.e., interindividual), the consistency of each seed set for scans
1, 2, and 3 were highly similar (Table 4).
Multiscan consistency. Intraindividual consistency ranged from
moderate to high (Table 3, Fig. S1b), whereas interindividual
consistency for each seed set was lower. Permutation tests
indicated that these levels of consistency were highly
significant (intra- and interindividual consistency, for all sets,
P < 0.0001).
Factors affecting consistency. Significant versus nonsignifi-
cant connections. Comparing intraindividual consistency of
sets of statistically significant or nonsignificant correlations
(Table 3), we found that significant correlations were
significantly more reliable than nonsignificant correlations for
all 3 seed sets (Wilcoxon signed rank test; P < 0.0001 for all
sets; Fig. 4a).
Interindividual consistency for sets of significant correlations
was moderate and was larger than the low consistency found
for nonsignificant correlations for each scan and each seed set
(Table 4, Fig. 4b).
Positive and negative connections. Restricting our analysis
to significant correlations, we examined differences in consis-
tency between positive and negative correlations (Table 3).
Within subjects, we found that positive correlations were
significantly more reliable than negative correlations for all 3
seed sets (Wilcoxon signed rank test; P < 0.0001 for all sets;
Fig. 4a).
Between subjects, consistency for sets of positive correla-
tions was low, as was consistency for sets of negative
correlations (Table 4, Fig. 4b).
Intersession versus intrasession consistency. For seed Set A,
intrasession consistency (within-subjects) was higher than
intersession consistency for all connections, and for significant,
nonsignificant and positive significant connections (Table 3).
However, this difference was significant (Wilcoxon signed rank
test; P < 0.01, adjusted for 5 comparisons) only for the
comparison of positive significant connections. For seed sets B
and C there were no differences in intra- and intersession
consistency.
Group-level consistency. We also assessed the concordance
of sets of correlations at the group level. Group-level
correlation matrices were generated by averaging all possible
z-transformed correlations across participants, for each seed
set and each scan. These group-average z-transformed corre-
lations were then reverse-transformed to obtain group-average
r-values. Sets of group-level correlations exhibited high inter-
and intrasession concordance (Intersession Kendall’s W; Set A =0.94; Set B = 0.98; Set C = 0.97; Intrasession Kendall’s W; Set A =0.92; Set B = 0.96; Set C = 0.97) as well as high multiscan
concordance (Kendall’s W: Set A = 0.91; Set B = 0.96; Set C =0.96, see Fig. 5).
Hierarchical Clustering
We tested the reproducibility of the default mode and task
positive networks, 2 of the most commonly examined net-
works in the resting-state fcMRI literature. We also examined
the reliability and consistency of correlations within and
Table 2ROI-based analysis: significant and reliable functional connectivity
Connection ICC Mean R,session 1
Mean R,session 2
Mean R,session 3
Set AL iPL ~ R iPL 0.67 0.33 0.37 0.39L dlPFC ~ L iPL 0.65 0.40 0.38 0.37R aFG ~ L pTC 0.63 0.16 0.14 0.09mCC ~ R Prc 0.63 0.38 0.38 0.40L dlPFC ~ R dlPFC 0.59 0.37 0.36 0.36L pCC ~ R Prc 0.59 0.19 0.17 0.15R aPFC ~ R aL/fO 0.58 0.30 0.29 0.20L aFG ~ L pTC 0.57 0.31 0.29 0.31L aPFC ~ L dlPFC 0.55 0.20 0.24 0.22L pCC ~ L lCb 0.55 �0.15 �0.18 �0.13L pTC ~ L Prc 0.55 0.17 0.18 0.17L TPJ ~ R aL/fO 0.54 0.14 0.18 0.23L mOC ~ R mOC 0.53 0.58 0.49 0.54R dlPFC ~ L iPL 0.53 0.22 0.20 0.25R iPL ~ R Prc 0.52 0.19 0.23 0.29L pCC ~ L Prc 0.51 0.26 0.25 0.30R pTC ~ R Prc 0.51 0.12 0.22 0.19R Prc ~ R IPS 0.51 0.18 0.23 0.26L pCC ~ R aPFC 0.51 �0.19 �0.12 �0.13R aFG ~ R pTC 0.51 0.21 0.22 0.16L iCb ~ R lCb 0.50 0.19 0.14 0.17R pCC ~ R Prc 0.50 0.27 0.27 0.29R mTC ~ L pTC 0.50 �0.13 �0.09 �0.13
Set BSFC-L ~ pCC1 0.66 0.38 0.39 0.40LPC-L ~ pCC1 0.62 0.57 0.58 0.55iTC-R ~ aCC1 0.61 0.18 0.15 0.11SFC-R ~ dlPFC-R 0.59 0.25 0.13 0.15FEF-L ~ vIPS-L 0.58 0.19 0.12 0.15vFEF-R ~ IPS-R 0.55 0.27 0.26 0.23FEF-L ~ IPS-R 0.54 0.24 0.19 0.18vIPS-R ~ vIPS-L 0.53 0.58 0.57 0.57SMA/preSMA ~ iPCS-L 0.53 0.30 0.30 0.24iTC-R ~ pCC1 0.51 0.28 0.29 0.20vIPS-R ~ IPS-L 0.51 0.27 0.23 0.20vOC-R ~ vIPS-R 0.50 0.30 0.29 0.32iTC-R ~ aCC2 0.50 0.23 0.22 0.17aCC1 ~ dlPFC-R2 0.50 0.16 0.14 0.15
Set CL SCC ~ L pCG 0.67 0.38 0.43 0.37L AG ~ L pMTG 0.67 0.51 0.45 0.50L AG ~ L toMTG 0.66 0.31 0.29 0.35R PP ~ R AG 0.66 �0.14 �0.14 �0.17R pSG ~ R SFG 0.65 0.16 0.15 0.16R PT ~ R PCG 0.65 �0.14 �0.13 �0.18L PO ~ L pSG 0.64 0.25 0.28 0.31L toMTG ~ L pMTG 0.64 0.35 0.35 0.40L PO ~ L SMC 0.64 0.43 0.44 0.41R FO ~ R INS 0.63 0.64 0.60 0.59R pSG ~ L pSG 0.63 0.50 0.51 0.52R toMTG ~ R INS 0.63 0.24 0.27 0.22R PCG ~ L pSG 0.62 �0.18 �0.20 �0.13R pMTG ~ L AG 0.62 0.36 0.28 0.24R AG ~ L pSG 0.62 0.23 0.24 0.22L AG ~ L aMTG 0.62 0.25 0.24 0.21R SFG ~ L SFG 0.61 0.49 0.48 0.55R toMTG ~ L INS 0.61 0.24 0.24 0.17R CO ~ L aSTG 0.60 0.48 0.46 0.41R pSG ~ R FP 0.60 0.17 0.13 0.16R FO ~ R SMC 0.60 0.30 0.32 0.26
Note: Listed are the correlations from each seed set that are reliable (i.e., multiscan ICC[ 0.5 for
seed Sets A--B and multiscan ICC[ 0.60 for Seed set C) and statistically significant (i.e., those
correlations significant at the group level for each of the three scans). A higher ICC threshold of
0.60 was applied for seed Set C, due to the large number of correlations with ICC exceeding 0.5.
For each brain region, the multiscan ICC and group-averaged correlation for each scan is given.
Abbreviations Set A: aFG, anterior fusiform gyrus; aI/fO, anterior insula/frontal operculum; aPFC,
anterior prefrontal cortex; dlPFC, dorsolateral prefrontal cortex; iCb, inferior cerebellum; iPL,
inferior parietal lobule; IPS, intraparietal sulcus; lCb, lateral cerebellum; mCC, middle cingulate
cortex; mOC, middle occipital cortex; mTC, middle temporal cortex; pCC, posterior cingulate
cortex; Prc, precuneus; pTC, posterior temporal cortex; TPJ, temporoparietal junction.
Abbreviations Set B: aCC, anterior cingulate cortex; dlPFC, dorsolateral prefrontal cortex; FEF,
frontal eye fields; IPS, intraparietal sulcus; iPCS, inferior precentral sulcus; iTC, inferior temporal
cortex; LPC, lateral parietal cortex; pCC, posterior cingulate cortex; SMA, supplementary motor
area and preSMA; SFC, superior frontal cortex; vFEF, ventral FEF; vIPS, ventral IPS; vOC, ventral
occipital cortex. Abbreviations Set C: AG, angular gyrus; aMTG, anterior middle temporal; aSTG,
anterior superior temporal gyrus; CO, central operculum; FO, frontal operculum; FP, frontal pole;
INS, insular cortex; PCG, paracingulate gyrus; pCG, posterior cingulate gyrus; pMTG, posterior
middle temporal gyrus; PO, parietal operculum; PP, planum polare; pSG, posterior supramarginal
gyrus; PT, planum temporale; SCC, supracalcarine cortex; SFG, superior frontal gyrus; SMC,
supplementary motor cotex; toMTG, middle temporal gyrus--temporo-occipital cortex
2214 Test--Retest Reliability of fMRI Functional Connectivity d Shehzad et al.
at UC
LA
Biom
edical Library Serials on February 1, 2012
http://cercor.oxfordjournals.org/D
ownloaded from

between these networks. ROIs for these 2 networks were
derived from seed Set B, a task-based meta-analysis (Toro et al.
2008). In order to test the reproducibility of these functionally
distinct networks, we used hierarchical clustering and com-
pared the 2-cluster solutions that arose for each participant at
each scan session.
Across all 3 scan sessions, the 2 clusters elicited through
hierarchical clustering of each participant’s correlation matrix
were consistent with the fronto-parietal (task positive) and
cingulo-parietal (default mode) clusters observed by Toro et al.
(2008) (see Fig. S6). To quantify the consistency of a region’s
membership in a network, we recorded the proportion of
participants for whom that region was assigned to the same
cluster as in Toro et al. (2008) for each scan (‘‘percent
agreement’’). We observed high degrees of membership
agreement in both the task positive and the default mode
networks (Table 5). Only one region was not consistently
classified into either cluster: the right dorsolateral prefrontal
cortex (DLPFC) seed (mean agreement across 3 scans = 55%).
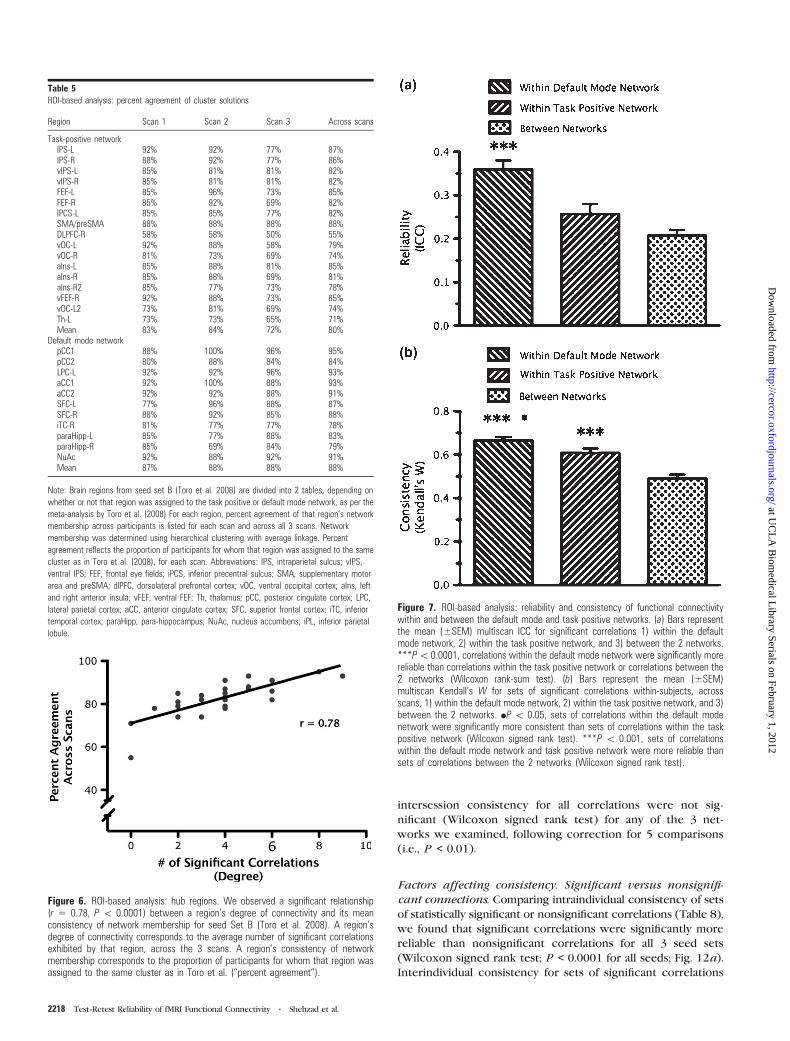
We examined the relationship between a region’s degree of
connectivity (i.e., the number of significant correlations
exhibited by a region, averaged across the 3 scans, see Table
S2) and its mean network membership consistency (i.e., percent
agreement, averaged across 3 scans, see Table 5). The degree of
connectivity and consistency of network membership were
strongly related (r = 0.78, P < 0.0001; see Fig. 6).
We also examined the reliability and consistency of
significant correlations for connections within and between
the 2 networks (Fig. 7). We examined connections 1) within the
task positive network, 2) within the default mode network, or 3)
between members of the task positive network and members of
the defaultmode network. First, to assess reliability, we compared
the multiscan ICCs for connections within the task positive
network (mean multiscan ICC = 0.25 ± 0.18), within the default
mode network (mean multiscan ICC = 0.32 ± 0.16), and
for between-network connections (mean multiscan ICC = 0.19
± 0.16; Fig. 7a). A Wilcoxon rank-sum test demonstrated that
connections within the default mode network were significantly
Figure 3. ROI-based analysis: correlation magnitude (functional connectivity) and reliability. The magnitude of each multiscan correlation (i.e., group-averaged correlation) plottedagainst its corresponding multiscan ICC, for each seed set. Rug plots are shown on each axis representing the distribution of correlations and ICCs. Solid lines represent spline-based nonparametric regression fits of the data and dotted lines represent the 95% confidence interval for the fit.
Figure 2. ROI-based analysis: factors effecting reliability. (a) Box plots of multiscan ICCs for significant and nonsignificant correlations, for each seed set. Dotted black linesrepresent the mean ICC for those correlations. **P\ 0.001 and ***P\ 0.0001, statistically significant correlations greater than nonsignificant correlations (Wilcoxon signed-rank test). (b) Box plots of multiscan ICCs for significant positive and significant negative correlations, for each seed set. Dotted black lines represent the mean ICC for thosecorrelations. **P\ 0.001 and ***P\ 0.0001, significant positive correlations greater than significant negative correlations (Wilcoxon signed-rank test).
Cerebral Cortex October 2009, V 19 N 10 2215
at UC
LA
Biom
edical Library Serials on February 1, 2012
http://cercor.oxfordjournals.org/D
ownloaded from
more reliable than connections within the task positive network
or between the 2 networks (P < 0.0001 for both comparisons).
Second, to assess consistency within and between subjects, we
compared Kendall’s W for connections within the task positive
network (mean Kendall’s W; within-subject = 0.61 ± 0.10;
between-subject = 0.23 ± 0.01), within the default mode network
(mean Kendall’s W; within-subject = 0.67 ± 0.08; between-
subject = 0.18 ± 0.01), and between the 2 networks (mean
Kendall’sW; within-subject = 0.49 ± 0.09; between-subject = 0.07
± 0.02; Fig. 7b). A Wilcoxon signed rank test demonstrated that
within-subject connections within the default mode network
were significantly more consistent than connections within the
task positive network (P < 0.05), and connections within either
the default mode network or task positive network were
significantly more consistent than connections between the 2
networks (P < 0.0001).
Finally, we assessed the consistency of cluster solutions
computed on the basis of the group-level correlation matrices.
The 2 clusters derived from hierarchical clustering of group-
level correlation matrices of seed Set B were virtually identical
to the cingulo-parietal (default mode) and fronto-parietal (task
positive) clusters observed by Toro et al. (2008) (see Fig. S6).
Indeed, across all 3 scans, all regions were consistently assigned
to the appropriate cluster except for the DLPFC region that
demonstrated inconsistency in the subject-level analysis.
During scans 1 and 2, the DLPFC ROI was assigned to the
cingulo-parietal network, whereas in the Toro et al. (2008)
analyses and in scan 3, it was classified as a member of the
fronto-parietal network.
Voxelwise fcMRI
We performed voxelwise multiple regression analyses to
identify the networks of voxels positively and negatively
correlated with each of 3 seeds selected from seed Set B
(Toro et al. 2008): the PCC (–6 –58 28), SMA (–2 10 48), and IPS
(26 –58 48). These 3 ROIs were selected because they
represent core components of the commonly identified default
mode and task positive networks and had the largest number
of significant correlations with other regions within their
respective networks (i.e., they were ‘‘hubs,’’ see Table S2).
Z Statistics
Across scans, there was considerable overlap in the group-level
Z statistic maps of positive and negative connectivity for each
seed (Fig. 8d). For each network, voxelwise comparisons of
regression coefficient Z statistics across scans (i.e., Scan 1 vs.
Scan 2 and Scan 2 vs. Scan 3) also revealed a significantly high
positive correlation (Fig. 10). The high degree of cross-scan
stability in the patterns of positive and negative connectivity
associated with each seed (i.e., Z statistic maps) is also evident
even at the individual level (see Figs S4 and S5, respectively, for
2 representative participants).
Intraclass Correlation
Table 7 lists the top 12 peaks of connectivity for the positive
and negative networks associated with each seed, and the
corresponding Z statistics and mean and maximum ICC
(computed for a 10-mm-diameter sphere centered on the
corresponding peak voxel). As Figure 8 shows, the group-level
network for each seed (i.e., the pattern of functional
connectivity associated with the PCC, SMA, and IPS seeds)
demonstrated a substantial degree of test--retest reliability, as
reflected in the large proportion of suprathreshold (Z > 2.3)
voxels yielding ICC > 0.5 (see Table 7).
Figure 9 demonstrates that the proportion of suprathreshold
voxels with ICC > 0.5 increases with increasing group-level Z
statistic (i.e., for higher thresholds). Though inter- and intra-
session reliability were significantly positively correlated (Fig.
11a), intrasession reliability was significantly greater than
intersession reliability, for positive, negative and nonsignificant
correlations (Wilcoxon signed rank test; P < 0.0001)
Kendall’s Coefficient of Concordance
We calculated the intersession, intrasession, and multiscan
Kendall’s W, for each participant (Tables 8 and 9, Fig. 12). As in
the ROI-based analysis, consistency of voxelwise fcMRI was
Table 3ROI-based analysis: within-subject Kendall’s W summary
Multiscan Intersession Intrasession Inter versusintra
Set AAll 0.60 ± 0.05 0.70 ± 0.04 0.72 ± 0.05 0.04Significant 0.77 ± 0.05 0.82 ± 0.05 0.85 ± 0.04 0.05Nonsignificant 0.54 ± 0.05 0.64 ± 0.05 0.67 ± 0.06 0.03Positive significant 0.65 ± 0.06 0.73 ± 0.06 0.76 ± 0.05 0.01Negative significant 0.47 ± 0.13 0.61 ± 0.11 0.63 ± 0.09 0.38
Set BAll 0.65 ± 0.08 0.75 ± 0.07 0.74 ± 0.07 0.86Significant 0.78 ± 0.08 0.85 ± 0.05 0.83 ± 0.07 0.21Nonsignificant 0.53 ± 0.08 0.65 ± 0.08 0.66 ± 0.08 0.53Positive significant 0.63 ± 0.07 0.72 ± 0.06 0.74 ± 0.08 0.34Negative significant 0.49 ± 0.09 0.62 ± 0.08 0.62 ± 0.09 0.91
Set CAll 0.68 ± 0.05 0.76 ± 0.04 0.77 ± 0.04 0.67Significant 0.83 ± 0.03 0.88 ± 0.03 0.88 ± 0.03 0.88Nonsignificant 0.58 ± 0.06 0.68 ± 0.05 0.70 ± 0.05 0.19Positive significant 0.70 ± 0.05 0.78 ± 0.04 0.78 ± 0.05 0.80Negative significant 0.52 ± 0.09 0.66 ± 0.06 0.64 ± 0.09 0.26
Note: Summary of intraindividual consistency (within-subjects across scans). Listed are the mean
and standard deviation of intersession, intrasession, and multiscan Kendall’s W for 26
participants, for all, significant, nonsignificant, positive significant, and negative significant
correlations, for each seed set. The last column of each table indicates the P-value for the
comparison of inter- and intrasession Kendall’s W. Significant P-values (less than 0.01, corrected
for 5 comparisons for each seed set) are marked in italics.
Table 4ROI-based analysis: between-subject Kendall’s W summary
Scan 1 Scan 2 Scan 3 Mean
Set AAll 0.25 0.24 0.23 0.24Significant 0.48 0.47 0.43 0.46Nonsignificant 0.13 0.15 0.13 0.14Positive significant 0.21 0.24 0.22 0.22Negative significant 0.05 0.13 0.12 0.10
Set BAll 0.41 0.38 0.31 0.36Significant 0.66 0.59 0.54 0.60Nonsignificant 0.20 0.22 0.14 0.19Positive significant 0.16 0.20 0.21 0.19Negative significant 0.07 0.10 0.06 0.07
Set CAll 0.41 0.40 0.40 0.41Significant 0.70 0.67 0.68 0.68Nonsignificant 0.24 0.25 0.25 0.25Positive significant 0.41 0.39 0.40 0.40Negative significant 0.15 0.16 0.14 0.15
Note: Summary of interindividual consistency (between-subjects within scans). Listed are the
interindividual Kendall’s W for each scan and mean interindividual Kendall’s W across scans for
all, significant, nonsignificant, positive significant, and negative significant correlations for each
seed set.
2216 Test--Retest Reliability of fMRI Functional Connectivity d Shehzad et al.
at UC
LA
Biom
edical Library Serials on February 1, 2012
http://cercor.oxfordjournals.org/D
ownloaded from

assessed in terms of 1) intraindividual consistency (i.e.,
concordance of sets of correlations within subjects across
scans) and 2) intraindividual consistency (i.e., concordance of
sets of correlations within scans across subjects).
Inter- and intrasession consistency. The intraindividual
consistency of voxelwise correlations across intersession
scans 1 and 2 and intrasession scans 2 and 3 ranged from
moderate to high ( >0.45). The difference between intra- and
Figure 4. ROI-based analysis: factors effecting consistency. (a) Within-subjects multiscan consistency (Kendall’s W) for 1) all correlations, 2) significant correlations, 3)nonsignificant correlations, 4) significant positive correlations, and 5) significant negative correlations. Each data point represents an individual participant’s multiscan Kendall’sW.Dotted black lines represent the mean Kendall’s W (i.e., averaged across 26 participants). (b) Box plots of between-subjects multiscan consistency (Kendall’s W) for correlationsfrom each seed set. Data points represent the between-subjects Kendall’sW for each of the 3 scans and dotted black lines represent the mean Kendall’sW (i.e., averaged across3 scans).
Figure 5. ROI-based analysis: consistency of group-averaged functional connectivity across scans. (a) Intersession: group-averaged correlations for scan 1 are plotted againstgroup-averaged correlations for scan 2 for each seed set (data points represent r-values). Overlaid black lines represent linear regression fits of the data points and the r-values ofthe fit represent Pearson correlations of the data points (all comparison, P\ 0.0001). (b) Intrasession: group-averaged correlations for scan 3 are plotted against group-averagedcorrelations for Scan 2 for each seed set and Pearson correlations comparing the 2 scans were significant (P\ 0.0001) for all comparisons.
Cerebral Cortex October 2009, V 19 N 10 2217
at UC
LA
Biom
edical Library Serials on February 1, 2012
http://cercor.oxfordjournals.org/D
ownloaded from
intersession consistency for all correlations were not sig-
nificant (Wilcoxon signed rank test) for any of the 3 net-
works we examined, following correction for 5 comparisons
(i.e., P < 0.01).
Factors affecting consistency. Significant versus nonsignifi-
cant connections. Comparing intraindividual consistency of sets
of statistically significant or nonsignificant correlations (Table 8),
we found that significant correlations were significantly more
reliable than nonsignificant correlations for all 3 seed sets
(Wilcoxon signed rank test; P < 0.0001 for all seeds; Fig. 12a).
Interindividual consistency for sets of significant correlations
Table 5ROI-based analysis: percent agreement of cluster solutions
Region Scan 1 Scan 2 Scan 3 Across scans
Task-positive networkIPS-L 92% 92% 77% 87%IPS-R 88% 92% 77% 86%vIPS-L 85% 81% 81% 82%vIPS-R 85% 81% 81% 82%FEF-L 85% 96% 73% 85%FEF-R 85% 92% 69% 82%IPCS-L 85% 85% 77% 82%SMA/preSMA 88% 88% 88% 88%DLPFC-R 58% 58% 50% 55%vOC-L 92% 88% 58% 79%vOC-R 81% 73% 69% 74%alns-L 85% 88% 81% 85%alns-R 85% 88% 69% 81%alns-R2 85% 77% 73% 78%vFEF-R 92% 88% 73% 85%vOC-L2 73% 81% 69% 74%Th-L 73% 73% 65% 71%Mean 83% 84% 72% 80%
Default mode networkpCC1 88% 100% 96% 95%pCC2 80% 88% 84% 84%LPC-L 92% 92% 96% 93%aCC1 92% 100% 88% 93%aCC2 92% 92% 88% 91%SFC-L 77% 96% 88% 87%SFC-R 88% 92% 85% 88%iTC-R 81% 77% 77% 78%paraHipp-L 85% 77% 88% 83%paraHipp-R 85% 69% 84% 79%NuAc 92% 88% 92% 91%Mean 87% 88% 88% 88%
Note: Brain regions from seed set B (Toro et al. 2008) are divided into 2 tables, depending on
whether or not that region was assigned to the task positive or default mode network, as per the
meta-analysis by Toro et al. (2008) For each region, percent agreement of that region’s network
membership across participants is listed for each scan and across all 3 scans. Network
membership was determined using hierarchical clustering with average linkage. Percent
agreement reflects the proportion of participants for whom that region was assigned to the same
cluster as in Toro et al. (2008), for each scan. Abbreviations: IPS, intraparietal sulcus; vIPS,
ventral IPS; FEF, frontal eye fields; iPCS, inferior precentral sulcus; SMA, supplementary motor
area and preSMA; dlPFC, dorsolateral prefrontal cortex; vOC, ventral occipital cortex; aIns, left
and right anterior insula; vFEF, ventral FEF; Th, thalamus; pCC, posterior cingulate cortex; LPC,
lateral parietal cortex; aCC, anterior cingulate cortex; SFC, superior frontal cortex; iTC, inferior
temporal cortex; paraHipp, para-hippocampus; NuAc, nucleus accumbens; iPL, inferior parietal
lobule.
Figure 6. ROI-based analysis: hub regions. We observed a significant relationship(r 5 0.78, P \ 0.0001) between a region’s degree of connectivity and its meanconsistency of network membership for seed Set B (Toro et al. 2008). A region’sdegree of connectivity corresponds to the average number of significant correlationsexhibited by that region, across the 3 scans. A region’s consistency of networkmembership corresponds to the proportion of participants for whom that region wasassigned to the same cluster as in Toro et al. (‘‘percent agreement’’).
Figure 7. ROI-based analysis: reliability and consistency of functional connectivitywithin and between the default mode and task positive networks. (a) Bars representthe mean (±SEM) multiscan ICC for significant correlations 1) within the defaultmode network, 2) within the task positive network, and 3) between the 2 networks.***P\ 0.0001, correlations within the default mode network were significantly morereliable than correlations within the task positive network or correlations between the2 networks (Wilcoxon rank-sum test). (b) Bars represent the mean (±SEM)multiscan Kendall’s W for sets of significant correlations within-subjects, acrossscans, 1) within the default mode network, 2) within the task positive network, and 3)between the 2 networks. dP \ 0.05, sets of correlations within the default modenetwork were significantly more consistent than sets of correlations within the taskpositive network (Wilcoxon signed rank test). ***P \ 0.001, sets of correlationswithin the default mode network and task positive network were more reliable thansets of correlations between the 2 networks (Wilcoxon signed rank test).
2218 Test--Retest Reliability of fMRI Functional Connectivity d Shehzad et al.
at UC
LA
Biom
edical Library Serials on February 1, 2012
http://cercor.oxfordjournals.org/D
ownloaded from

was moderate and was larger than the low consistency found
for nonsignificant correlations (Table 9, Fig. 12b).
Positive and negative connections. Restricting our analysis
to significant correlations, we examined differences in consis-
tency between positive and negative correlations (Table 8).
Within subjects, we found that positive correlations were
significantly more reliable than negative correlations for all 3
seed regions (Wilcoxon signed rank test; P < 0.0001 for all sets;
Fig. 12a). Between subjects, consistency for sets of positive
correlations was low, as was consistency for sets of negative
correlations (Table 9, Fig. 12b).
Intersession versus intrasession consistency. For all 3 seed
ROIs, there were no significant differences between inter- and
intrasession consistency (intraindividual) for all connections,
and for significant, nonsignificant and positive significant
connections (Wilcoxon signed rank test, P > 0.05; Table 8).
Group-level consistency.We also assessed the consistency of
network correlations for the group-level correlation map
associated with each seed ROI. Group-level correlations
exhibited high inter- and intrasession concordance (interses-
sion Kendall’s W PCC: 0.95, IPS Right: 0.92, SMA: 0.93;
intrasession Kendall’s W PCC: 0.95, IPS Right: 0.93, SMA: 0.92)
as well as high multiscan concordance (Kendall’s W PCC: 0.94,
IPS Right: 0.90, SMA: 0.90, see Fig. 10).
Reliability of the Default Mode/Task Positive Network
Anticorrelation
We quantified the test--retest reliability of the anticorrelation
(i.e., negative correlation) between the default mode and task
positive networks. These networks were defined, respectively,
as those voxels exhibiting significant (group-level) positive
(corresponding to the default mode network) and negative
(the task positive network) correlations with the PCC in the
combined (multiscan) analysis (depicted in Fig. 8c). Though
long-term intersession reliability was low (ICC = 0.21), intra-
and multiscan reliability of this anticorrelation was moderate
(ICC > 0.4). Furthermore, the reliability of the anticorrelation
increased with increasing Z statistic threshold values (though
intersession reliability declined again after Z = 6, Fig. 13).
Discussion
In the present study, we examined the test--retest reliability of
measures of resting-state fcMRI, within a single scan session
Figure 8. Voxelwise analyses: maps (‘‘networks’’) of positive (orange) and negative (cyan) functional connectivity. For each seed ROI, voxels exhibiting an ICC[ 0.5 are overlaidin red (positive correlations) and blue (negative correlations). (a) Intersession ICC overlaid on intersession group-level connectivity map; (b) Intrasession ICC overlaid onintrasession group-level connectivity map; and (c) multiscan ICC overlaid on multiscan group-level connectivity map. (d) Depicts the overlap among the 3 scans for the group-levelconnectivity maps: yellow/green signifies voxels significantly positively/negatively correlated in only one scan; orange/cyan signifies voxels significantly positively/negativelycorrelated in 2 scans; and red/blue signifies voxels significantly positively/negatively correlated in all 3 scans.
Table 6Voxelwise analysis: ICC summary
Seed ROI Group network Mean ICC Percent overlap(% voxelsICC[ 0.5)
Intersession ICCPCC Positive 0.45 44%
Negative 0.36 25%SMA Positive 0.28 23%
Negative 0.14 9%Right IPS Positive 0.34 22%
Negative 0.13 5%Intrasession ICCPCC Positive 0.51 57%
Negative 0.31 23%SMA Positive 0.33 34%
Negative 0.26 26%Right IPS Positive 0.38 32%
Negative 0.17 8%Multiscan ICCPCC Positive 0.52 59%
Negative 0.36 29%SMA Positive 0.36 36%
Negative 0.23 16%Right IPS Positive 0.43 37%
Negative 0.20 8%
Note: Listed are the mean ICCs of all suprathreshold (Z[ 2.3) voxels and the proportion of
suprathreshold (Z[ 2.3) voxels yielding ICC[ 0.5 for positively or negatively correlated regions
with 3 seed ROIs (PCC, SMA, and Right IPS).
Cerebral Cortex October 2009, V 19 N 10 2219
at UC
LA
Biom
edical Library Serials on February 1, 2012
http://cercor.oxfordjournals.org/D
ownloaded from

(short-term/intrasession), across 2 scan sessions separated by
at least 5 months (long-term/intrasession), and across all 3
scans (multiscan). Using several methods to quantify reliability,
and using both seed-ROI--based and voxel-wise analytic
approaches to quantify fcMRI, we observed that the test--retest
reliability of resting-state fcMRI ranged from minimal to robust,
Figure 9. Voxelwise analysis: comparison of reliability and increasing threshold values. (a) Bars represent the number of voxels that were significantly positively correlated witha seed region (Z[ 2.3, i.e., suprathreshold voxels) and highly reliable (ICC[ 0.5), expressed as a percentage of all suprathreshold voxels. Percent overlap is calculated forintersession, intrasession, and multiscan measures and for each seed region (PCC, SMA, and IPS right). At higher thresholds, a higher percentage of suprathreshold voxels arealso highly reliable. (b) Bars represent the number of voxels that were significantly negatively correlated with a seed region (Z\�2.3) and highly reliable (ICC[0.5). There is noeffect of threshold on the proportion of reliable negative correlations.
Figure 10. Voxelwise analysis: consistency of group-level functional connectivity across scans. (a) Scatter plots of intersession consistency (scan 1 vs. scan 2) of group-levelvoxelwise fcMRI for each seed region (data points represent group-level regression parameter Z-statistics). Overlaid black lines represent linear regression fits for the data pointsand the r-values of the fit represent Pearson correlations (all comparisons, P\ 0.0001). (b) Scatter plots of intrasession consistency (scan 2 vs. scan 3) of group-level fcMRI foreach seed region and Pearson correlations comparing the 2 scans was significant (P\ 0.0001) for all comparisons.
2220 Test--Retest Reliability of fMRI Functional Connectivity d Shehzad et al.
at UC
LA
Biom
edical Library Serials on February 1, 2012
http://cercor.oxfordjournals.org/D
ownloaded from

depending on at least 3 factors. These include 1) statistical
significance: significant correlations (i.e., at the group level) for
a given scan exhibited greater test--retest reliability than those
that were nonsignificant; 2) valence: significant positive
correlations exhibited greater reliability than significant nega-
tive correlations; and 3) network membership: regions within
the default mode network were more reliably correlated with
one another than were regions within the task positive
network. These findings provide an initial quantitative basis
for continued use of resting-state fcMRI to identify the neural
substrates of interindividual differences in behavioral traits or
psychopathology, as a result of experimental manipulations
(e.g., task, state, or pharmacological), or development.
Significant Correlations Demonstrated the Highest Test--Retest Reliabilities
Correlations that were statistically significant across partici-
pants for a given scan session (i.e., at the group level) exhibited
the highest degree of test--retest reliability (ICC > 0.5). This
was true for both the ROI-based and voxelwise analyses. Figure
9 demonstrates this most clearly: for the PCC and SMA seeds,
over 50% of voxels that exhibited positive connectivity with
the seed ROI at Z statistic thresholds greater than Z = 5 also
demonstrated ICCs > 0.5. That percentage was even greater for
higher thresholds and for intra- and multiscan reliability.
That the regions exhibiting statistically significant correla-
tions also exhibit the highest degree of test--retest reliability
should not be surprising. Nevertheless, this result bolsters the
emerging overarching notion that measures of fcMRI reflect
fundamental organizational properties of the brain. The
correlations that were statistically significant and highly reliable
in the present study were those typically observed to be
coactive during task-based studies, or part of the same ICN in
other resting state fcMRI studies. For example, we observed
highly reliable (ICC > 0.5) correlations between regions of
lateral PFC (e.g., frontal eye fields, DLPFC) and regions of the
inferior parietal lobe (IPL) (see Table 2). Lateral frontal and
lateral parietal cortices have been observed to be coactive in
hundreds of task-based studies (Toro et al. 2008), and are
commonly identified as part of the task positive network,
observed in resting state fcMRI studies (Damoiseaux et al. 2006;
Fox et al. 2005; Fransson 2005; Van Den Heuvel et al. 2008).
Similarly, Figure 8 demonstrates high levels of ICC across
multiple core regions (e.g., medial prefrontal cortex, medial
temporal lobe, posterior cingulate, and lateral temporoparietal
cortex) of the default mode network. Statistical significance of
an fcMRI measure at the group level is interpreted as reflecting
a meaningful functional relationship between regions (Friston
1994). The present results support such an interpretation by
demonstrating that such significant correlations are also
reliable across time.
Reliability of Negative Correlations
Consistent with the suggestion that negative correlations may
exhibit lower stability than positive correlations (Tian et al.
2007), we observed lower test--retest reliability for negative
correlations in both region-based and voxelwise analyses.
Negative correlations have been noted to occur between
networks that appear to be functionally distinct (Fox et al.
2005; Fransson 2005; Kelly, Uddin, et al. 2008). The lower test--
retest reliability exhibited by negative correlations suggests
that relationships between functional networks are more
dynamic than positive correlations within networks. Indeed,
our results indicate that correlations between regions within
either the default mode or task positive networks (within-
network correlations) were significantly more reliable than the
cross-network negative correlations (Fig. 7).
Figure 11. Voxelwise analysis: inter- and intrasession reliability and consistency. (a) Intersession (scans 1 and 2) test--retest reliability (ICC) plotted against intrasession (Scans 2and 3) ICC, for each seed region. (b) Intersession consistency (Kendall’s W) plotted against intrasession consistency for each seed region.
Cerebral Cortex October 2009, V 19 N 10 2221
at UC
LA
Biom
edical Library Serials on February 1, 2012
http://cercor.oxfordjournals.org/D
ownloaded from

Table 7Voxelwise analysis: Significant and Reliable Functional Connectivity
Seed ROI BA X Y Z Z-Score Multi-Scan Inter-Session Intra-Session
Mean Max Mean Max Mean Max
PCC POSITIVE CONNECTIVITYL PCC 29/30 6 58 28 12.1 0.65 0.80 0.61 0.82 0.64 0.77L vmPFC 10/11 6 -54 -4 7.7 0.54 0.64 0.37 0.58 0.65 0.81L ITG 21 64 12 �18 7.6 0.69 0.84 0.55 0.82 0.61 0.75R MFG 11 -4 -38 -18 7.6 0.50 0.68 0.49 0.75 0.43 0.69L precuneus 19 38 80 36 7.4 0.54 0.67 0.36 0.57 0.41 0.64L medial PFC 9 8 �48 34 7.3 0.07 0.66 0.22 0.60 0.01 0.69R medial PFC 9/10 �12 �58 12 6.9 0.55 0.69 0.43 0.67 0.61 0.78R ITG 21 �62 8 �22 6.8 0.57 0.65 0.50 0.68 0.57 0.74R MFG 8 �24 �24 44 6.7 0.65 0.79 0.57 0.80 0.67 0.77R MTG �48 62 26 6.5 0.79 0.87 0.71 0.86 0.74 0.90L lingual gyrus 18 10 56 4 6.5 0.48 0.69 0.61 0.77 0.26 0.62L SFG 6 20 �28 38 6.5 0.64 0.78 0.51 0.77 0.64 0.79
PCC Negative ConnectivityL anterior insula 38 2 �2 �7.3 0.33 0.60 0.25 0.62 0.29 0.56R anterior insula �40 �2 �4 �7.2 0.41 0.73 0.42 0.76 0.36 0.73R precentral gyrus 6 �58 �10 2 �7.2 0.75 0.83 0.71 0.77 0.69 0.78BL SMA/preSMA �2 �6 48 �7.0 0.42 0.59 0.39 0.68 0.50 0.78L IPL 62 30 22 �7.0 0.51 0.73 0.52 0.71 0.41 0.73R SFG 6 �20 4 62 �7.0 0.07 0.48 0.13 0.40 0.01 0.56R AG 39 �62 36 34 �6.6 0.57 0.72 0.52 0.75 0.52 0.64L MOG 19 54 66 �10 �6.6 0.64 0.72 0.42 0.58 0.58 0.66R IFG 45 �46 �42 6 �6.5 0.62 0.72 0.55 0.68 0.58 0.72R precentral gyrus 6 �48 0 38 -6.5 0.50 0.68 0.39 0.68 0.45 0.64L precentral gyrus 6 58 �2 8 �6.4 0.49 0.72 0.36 0.59 0.59 0.73L MFG 46 38 �40 22 �6.4 0.49 0.65 0.40 0.64 0.53 0.75
SMA Positive ConnectivityBL SMA 2 �10 46 12.2 0.68 0.78 0.58 0.73 0.68 0.83L anterior insula 32 �20 0 7.4 0.44 0.68 0.33 0.58 0.41 0.58L SFG 6 16 2 66 6.8 0.56 0.64 0.46 0.56 0.43 0.64R thalamus �8 �2 8 6.8 0.44 0.56 0.32 0.50 0.48 0.67L MFG 46 40 �40 20 6.8 0.22 0.46 0.16 0.42 0.06 0.42R anterior insula �34 �22 �2 6.6 0.07 0.65 0.32 0.53 0.01 0.76L ACC 24 10 �24 24 6.3 0.42 0.73 0.28 0.64 0.39 0.66R SFG 6 �22 0 62 6.3 0.50 0.65 0.39 0.59 0.57 0.74L precentral gyrus 6 40 6 46 6.0 0.53 0.73 0.34 0.61 0.57 0.78R precentral gyrus 6 �44 �4 36 6.0 0.64 0.77 0.57 0.74 0.65 0.78L IPL 56 42 42 5.9 0.43 0.57 0.19 0.42 0.38 0.64L caudate/putamen 16 �6 2 5.7 0.25 0.37 0.23 0.61 0.16 0.60
SMA Negative ConnectivityL precuneus 7 4 62 34 �6.9 0.44 0.62 0.42 0.74 0.43 0.54L cerebellum 22 84 �32 �6.4 0.19 0.29 0.12 0.31 0.14 0.38L ITG 20 62 10 �20 �5.9 0.46 0.57 0.29 0.52 0.50 0.63R cerebellum �20 84 �30 �5.8 0.23 0.37 0.19 0.54 0.30 0.62L PCC 30 18 56 18 �5.8 0.03 0.38 0.18 0.41 0.04 0.35BL subgenual cingulate 25 0 �18 �12 �5.7 0.07 0.42 0.08 0.17 0.01 0.46R PCC 29 �4 52 12 �5.7 0.45 0.60 0.08 0.39 0.45 0.56R medial PFC 10 �4 �62 �8 �5.5 0.31 0.48 0.22 0.42 0.37 0.63R vmPFC 11 �8 �44 �16 �5.5 0.35 0.49 0.07 0.24 0.51 0.65R PhG �24 26 �20 �5.4 0.19 0.45 0.01 0.43 0.03 0.40R STG/AG 39 �54 60 28 �5.2 0.59 0.75 0.47 0.63 0.49 0.71L PhG 22 24 �18 �5.2 0.16 0.44 0.19 0.43 0.19 0.38
IPS Positive ConnectivityR IPS �26 58 48 12.3 0.55 0.66 0.31 0.56 0.51 0.66L IPS 22 78 32 7.9 0.54 0.74 0.34 0.63 0.43 0.63L IPS 24 66 50 7.2 0.48 0.76 0.30 0.67 0.49 0.75R precuneus 7 �24 80 38 7.1 0.47 0.72 0.53 0.72 0.32 0.55R fusiform gyrus 37 �52 60 �16 7.0 0.46 0.65 0.41 0.66 0.32 0.60L IPS 32 46 44 6.8 0.07 0.75 0.54 0.72 0.01 0.73R MOG 1 �34 80 16 6.8 0.44 0.64 0.41 0.59 0.32 0.68L MOG 19 48 70 �10 6.7 0.48 0.63 0.33 0.51 0.40 0.66L MOG 18/19 34 76 14 6.2 0.40 0.62 0.20 0.55 0.46 0.71R SFG 6 �22 2 50 6.1 0.33 0.58 0.34 0.70 0.16 0.50R fusiform gyrus 19 �22 72 �16 6.1 0.49 0.61 0.29 0.56 0.44 0.60R IPL 40 �40 42 56 6.1 0.15 0.46 0.24 0.54 0.17 0.56
IPS Negative ConnectivityR medial PFC 10 �2 �56 �2 �7.6 0.11 0.41 0.04 0.27 0.02 0.30BL rostral ACC 32 2 �42 18 �7.5 0.16 0.39 �0.06 0.26 0.28 0.48L subgenual ACC 32 6 �36 �8 �6.8 0.37 0.52 0.17 0.48 0.28 0.65L STG/AG 39 52 58 22 �6.3 0.36 0.59 0.23 0.49 0.51 0.82L ITG 20 56 16 �26 �6.3 0.36 0.54 0.15 0.41 0.37 0.58L caudate/putamen �12 �2 �10 �6.2 0.07 0.28 0.13 0.49 0.01 0.35L SFG 10 20 �60 12 �5.8 0.33 0.49 0.10 0.30 0.35 0.59L PCC 29/30 6 54 28 �5.8 0.31 0.50 0.15 0.43 0.19 0.45L precuneus 7 38 80 36 �5.7 0.43 0.60 0.32 0.60 0.32 0.53L SFG 8 22 �28 44 �5.6 0.54 0.66 0.43 0.64 0.44 0.71L PhG 30 32 �12 �5.6 0.06 0.33 0.03 0.18 0.24 0.53R STG/AG 39 �56 60 24 �5.6 0.17 0.52 0.26 0.49 0.18 0.57
Note: Listed are the top twelve peaks of connectivity for the positive and negative networks associated with each seed ROI (PCC, SMA, or Right IPS), the corresponding peak Z score and mean and
maximum ICC (computed for a 10mm diameter sphere centered on the corresponding peak voxel). Z score values represent multi-scan functional connectivity calculated from a mixed-effects model
subsequent to fixed-effects analysis for each participant combining scans 1, 2, and 3. Abbreviations: ACC, anterior cingulate cortex; AG, angular gyrus; BL, bilateral; IFG, inferior frontal gyrus; IPL, inferior
parietal lobule; IPS, intraparietal sulcus; ITG, inferior temporal gyrus; L, left; MFG, middle frontal gyrus; MOG, middle occipital gyrus; PCC, posterior cingulate cortex; PFC, prefrontal cortex; PhG,
parahippocampal gyrus; R, right; SFG, superior frontal gyrus; SMA, supplementary motor area; STG, superior temporal gyrus; vmPFC, ventral medial prefrontal cortex.
2222 Test--Retest Reliability of fMRI Functional Connectivity d Shehzad et al.
at UC
LA
Biom
edical Library Serials on February 1, 2012
http://cercor.oxfordjournals.org/D
ownloaded from

It is important to acknowledge that the ability to detect
negative correlations is influenced by correction for the global
BOLD signal, a common step in resting fcMRI studies. Although
some studies question the use of global signal correction
(Aguirre et al. 1998; Birn et al. 2008; Murphy et al., forthcom-
ing) and the validity of negative correlations (Skudlarski et al.
2008), others studies suggest global signal correction as
a reasonable alternative to direct measurement and subsequent
removal of physiological cardiac and respiratory signals (Fox
et al. 2005; Birn et al. 2006; Hampson et al. 2006). Two previous
resting fcMRI studies found a reduction in the strength of
negative, but not positive, correlations when global normaliza-
tion was not performed, although the spatial pattern of both
positive and negative correlations was retained with and
without global normalization (Fransson 2005; Uddin et al. 2008).
In our study, negative correlations between ROIs and
anticorrelations between networks exhibited several proper-
ties that would encourage confidence in their reliability. First,
several significant negative correlations (e.g., between PCC
and PFC, see Tables 2 and 7; between PCC and PFC and
anterior cingulate cortex (ACC), Fig. 8) exhibited high
reliability (ICC > 0.6). Second, when we plotted the ICC of
the voxelwise anticorrelation between the default mode and
task positive networks against a range of threshold levels
(Fig. 13), we observed that the ICC of the anticorrelation
generally increased with increasing threshold values. This
suggests that reliability is highest for anticorrelations between
voxels that are most strongly positively and negatively
correlated with the PCC. Although further work aimed at
understanding the impact of global signal correction on fcMRI
measures, and the underlying neurophysiological basis of
negative correlations is clearly warranted, our findings
support further examinations of interindividual differences
in negative functional connectivity.
Of note, we found that the test--retest reliability of a voxel’s
negative connection to the PCC (a core component of the
default mode network) is directly related to the reliability of the
same voxel’s positive connection with the SMA (a core node of
the task positive network) (see Fig. S7). This finding suggests
that the more reliably a voxel is a member of one network,
the more reliably it is segregated from another (as indicated by
the anticorrelation). In other words, the test--retest reliability
of an anticorrelation is dependent on the reliability of positive
connections within each of the 2 relevant networks. Recent
work by our lab suggests that this observation is indicative of
a more general property of ICNs and their anticorrelations.
In a recent resting state study of dorsal ACC (dACC) functional
connectivity in an adult Attention-Deficit Hyperactivity Disorder
(ADHD) sample, the same precuneus region that exhibited
ADHD-related decreases in negative connectivity with the dACC
also exhibited decreases in positive connectivity with the
ventromedial PFC, which is part of the same network as the
precuneus (i.e., the default mode network). Thus a reduction in
the integrity of the negative relationship between a default mode
subregion (i.e., the precuneus) and its anticorrelated ‘‘task
positive’’ network may be accompanied by decreases in its
positive connectivity with other default mode components.
Hence, we believe future work will continue to benefit from
consideration of both positive and negative connectivity
associated with a given region of interest.
Consistency of Correlation Matrices
We observed an impressively high degree of cross-session
consistency for larger-scale patterns of correlations observed
across individuals. Specifically, multiscan analyses using
Kendall’s W demonstrated that concordance was highest
when both positive and negative correlations for each subject
were compared across scans, rather than cross-scan compar-
isons that were limited to positive correlations. This was true
for both the ROI-based (Tables 3 and 4; Fig. 4) and voxelwise
analyses (Tables 8 and 9, Fig. 12). This observation further
supports the value of taking into account patterns of negative
functional connectivity in the brain, rather than limiting the
scope of analyses to positive correlations.
Table 8Voxelwise analysis: within-subject Kendall’s W summary
Multiscan Intersession Intrasession Inter versusintra
PCCAll 0.68 ± 0.067 0.77 ± 0.051 0.77 ± 0.063 0.88Significant 0.74 ± 0.071 0.82 ± 0.052 0.82 ± 0.063 0.98Nonsignificant 0.53 ± 0.049 0.65 ± 0.046 0.66 ± 0.061 0.53Positive significant 0.74 ± 0.06 0.81 ± 0.045 0.82 ± 0.062 0.12Negative significant 0.58 ± 0.081 0.71 ± 0.056 0.70 ± 0.086 0.71
SMAAll 0.59 ± 0.076 0.69 ± 0.072 0.71 ± 0.07 0.13Significant 0.67 ± 0.082 0.75 ± 0.071 0.76 ± 0.076 0.62Nonsignificant 0.50 ± 0.076 0.62 ± 0.075 0.66 ± 0.073 0.03Positive significant 0.60 ± 0.076 0.70 ± 0.071 0.72 ± 0.078 0.18Negative significant 0.54 ± 0.11 0.65 ± 0.1 0.69 ± 0.11 0.28
Right IPSAll 0.57 ± 0.081 0.68 ± 0.069 0.69 ± 0.069 0.60Significant 0.66 ± 0.088 0.75 ± 0.073 0.75 ± 0.071 0.88Nonsignificant 0.45 ± 0.079 0.59 ± 0.072 0.61 ± 0.082 0.33Positive significant 0.62 ± 0.096 0.71 ± 0.071 0.73 ± 0.092 0.35Negative significant 0.48 ± 0.094 0.61 ± 0.086 0.61 ± 0.099 0.98
Note: Summary of intraindividual consistency (within-subjects across scans). Listed are the mean
and standard deviation of intersession, intrasession, and multiscan Kendall’s W from 26
participants for all, significant, nonsignificant, positive significant, and negative significant
correlations for each seed ROI. The last column of each table indicates the P-value for the
comparison of inter- and intrasession Kendall’s W. Significant P-values (less than 0.01,
corrected for 5 comparisons for each seed set) are marked in red.
Table 9Voxelwise analysis: between-subject Kendall’s W summary
Scan 1 Scan 2 Scan 3 Mean
PCCAll 0.34 0.35 0.35 0.35Significant 0.45 0.47 0.47 0.46Nonsignificant 0.06 0.06 0.06 0.06Positive significant 0.33 0.35 0.35 0.34Negative significant 0.14 0.16 0.14 0.15
SMAAll 0.22 0.20 0.18 0.20Significant 0.37 0.32 0.30 0.33Nonsignificant 0.06 0.05 0.05 0.05Positive significant 0.17 0.15 0.15 0.16Negative significant 0.13 0.15 0.10 0.13
Right IPSAll 0.25 0.27 0.21 0.24Significant 0.40 0.43 0.32 0.38Nonsignificant 0.05 0.06 0.05 0.05Positive significant 0.20 0.20 0.18 0.19Negative significant 0.14 0.14 0.09 0.13
Note: Summary of interindividual consistency (between-subjects within scans). Listed are the
interindividual Kendall’s W for each scan and mean interindividual Kendall’s W across scans for
all, significant, nonsignificant, positive significant, and negative significant correlations for each
seed ROI.
Cerebral Cortex October 2009, V 19 N 10 2223
at UC
LA
Biom
edical Library Serials on February 1, 2012
http://cercor.oxfordjournals.org/D
ownloaded from

Overall, the high consistency for the large-scale pattern of
correlations suggests that, rather than focusing on a limited
number of specific inter-regional connections, a promising
avenue for future research using ROI-based approaches is the
examination of interindividual differences in the broader pattern
of functional connections (i.e., the entire correlation matrix).
Consistency of Clustering
Application of hierarchical clustering for network identifica-
tion across the 3 scans provided direct evidence of the utility of
examining the default mode (‘‘task-negative’’) network and its
negatively correlated ‘‘task positive’’ counterpart, 2 of the most
commonly studied networks in the current resting state
literature (Fox and Raichle 2007). Group-level clustering
analyses revealed near-identical assignment of regions to one
or the other of these networks across sessions (see Fig. S6).
Moreover, the pattern of assignment observed was identical
(with only one exception, discussed below) to that revealed by
the largest meta-analysis of patterns of task-evoked coactivation
to date (Toro et al. 2008). Finally, when clustering analyses
were performed for each participant individually, rather than at
the group level, a similarly high degree of agreement was noted
both across participants and across sessions (see Table 5).
When we examined the specific regions that were assigned
to one network or the other with the greatest consistency
(over 90%), we found that they correspond to ‘‘hubs’’ (i.e.,
those regions with the greatest number of significant correla-
tions, see Fig. 6 and Table S2). Some of these same regions have
previously been identified as hubs in other resting-state fcMRI
studies (Achard et al. 2006; Fransson and Marrelec 2008;
Hagmann et al. 2008), and form key components of regulatory
systems in human brain (Dosenbach et al. 2006; Achard and
Bullmore 2007; Fair et al. 2007; Sridharan et al. 2008).
Furthermore, regions of the lateral and medial parietal lobes
were recently identified as structural hubs on the basis of their
structural connectivity profile, as identified with diffusion
spectrum imaging (Hagmann et al. 2007; Hagmann et al.
2008), diffusion tensor imaging (Gong et al. 2008), and cortical
thickness measures (He, Chen, et al. 2007; Chen et al. 2008). As
we have already noted, these hubs correspond to those regions
typically observed to be coactive during task-based studies
Figure 12. Voxelwise analysis: factors effecting consistency. (a) Plots of within-subjects multiscan consistency (Kendall’s W) of correlations (voxelwise regression parameterestimates) for each seed. Shown are box plots representing consistency of 1) all correlations, 2) significant correlations, 3) nonsignificant correlations, 4) significant positivecorrelations, and 5) significant negative correlations. Each data point represents an individual participant’s multiscan Kendall’s W. Dotted black lines represent the mean Kendall’sW (i.e., averaged across 26 participants). (b) Plots of between-subjects multiscan consistency (Kendall’s W) for correlations (voxelwise beta parameter estimates) from eachseed set. Data points represent the between-subjects Kendall’s W for each of the 3 scans and dotted black lines represent the mean Kendall’sW (i.e., averaged across 3 scans).
Figure 13. Voxelwise analysis: test--retest reliability of the default mode/taskpositive anticorrelation. ICC for the anticorrelation between the default mode and taskpositive networks increases with increasing Z statistic threshold values (beyond Z 56, there was not a sufficient number of negatively correlated voxels). Meanintrasession and multiscan ICC increased over the full range of Z-statistic thresholdswhile mean intersession ICC increased up to Z 5 4.8.
2224 Test--Retest Reliability of fMRI Functional Connectivity d Shehzad et al.
at UC
LA
Biom
edical Library Serials on February 1, 2012
http://cercor.oxfordjournals.org/D
ownloaded from

(Toro et al. 2008), or as part of the same ICN in resting state
fcMRI studies (Fox et al. 2005; Fransson 2005; Damoiseaux et al.
2006; Van Den Heuvel et al. 2008). The robustness with which
these areas appear connected across multiple studies, and their
high test--retest reliability, highlight their particular importance
in the quest to identify interindividual or group differences in
functional connectivity. Consistent with this suggestion, several
recent studies have observed interindividual and group differ-
ences in connectivity in regions such as the precuneus and
posterior cingulate cortex (Andrews-Hanna et al. 2007; Castel-
lanos et al. 2008; Kelly, Di Martino, et al. 2008).
Correlations between regions within the task-negative (de-
fault mode) network exhibited significantly greater reliability
than correlations between regions within the task positive
network. This finding is consistent with the observation that
the strongest spontaneous low-frequency fluctuations and the
highest metabolic activity at rest are observed within the default
mode network (Raichle et al. 2001; Zou et al. 2008). Similarly,
task-related suppression of default mode network activity has
been observed ubiquitously across diverse tasks (Shulman et al.
1997; Mazoyer et al. 2001; Fransson 2006). In contrast, the task
positive network is likely composed of a number of distinct
functional systems (Dosenbach et al. 2006; Seeley et al. 2007).
This functional heterogeneity may contribute to the task
positive network’s lower overall reliability.
In our cluster analysis, we observed that the cluster-
membership agreement of the DLPFC, a component of the
task positive network, was particularly low (the agreement of
its assignment with that of Toro et al. (2008) was ~55%, acrossall 3 scans). Furthermore, this DLPFC region was also the only
region that at the group level failed to demonstrate the same
pattern of cluster assignment observed by Toro et al. (2008),
instead appearing as a member of the task-negative network.
Voxelwise, ICA, and N-cut clustering approaches have found
that this same region is separable from other regions in the task
positive network (e.g., SMA and dACC) and that it is part of
a distinct lateralized fronto-parietal network commonly ob-
served in attentional and memory processing studies
(Damoiseaux et al. 2006; Seeley et al. 2007; Van Den Heuvel
et al. 2008). Furthermore, our DLPFC ROI is close to a region of
PFC which, in 2 previous studies (Fox et al. 2006; He, Snyder,
et al. 2007), appeared to belong to 2 different functional
networks—the dorsal and ventral attention systems—and was
hypothesized to serve as a locus of interaction between these
2 networks. Taken together, these observations support the
idea that there may be a greater degree of functional
independence between components of the task positive
network, which may in turn result in lower reliability.
These observations may suggest that the task-negative/task-
positive dichotomy simplifies the functional architecture of
the brain, which is composed of a myriad of functional
networks. Despite the dynamics within each of the 2 networks
in particular within the task-positive network, both of these
superordinate networks demonstrate substantial coherence
across participants and scans. Accordingly, we recommend
attending to multiple levels of analysis that will compromise
both superordinate networks such as the task-positive network
as well as subcomponents such as the salience network (Seeley
et al. 2007) depending on the questions being addressed.
Voxelwise fcMRI
The analysis of functional connectivity between sets of a priori
ROIs represents one fruitful approach to the study of fcMRI
(Achard et al. 2006; Dosenbach et al. 2007; Fair et al. 2007;
Fransson and Marrelec 2008). An alternative model-based
analysis is to examine seed-based connectivity on a voxelwise
basis, which permits the examination of a wider possible range
of functional connections. We examined the reliability of the
patterns of positive and negative voxelwise connectivity
associated with 3 seed regions, located in the PCC, right IPS,
and SMA. These 3 ROIs were selected because they represent
core components of the default mode and task positive
networks, and because we found that they constituted hubs
of connectivity (i.e., they were significantly correlated with
a large number of other regions in their respective networks;
see Table S2). Figure 8 illustrates the striking overlap between
voxels exhibiting significant positive and negative correlations
with each of the 3 seeds we examined, and those exhibiting the
highest reliability (ICC > 0.5). Although the stability of the ICNs
observed across multiple studies has been intuitive to many,
the findings we have presented, most clearly illustrated by
Figure 8, provide a solid basis for continued confidence in the
utility of resting state fcMRI studies.
Figure 14. Voxelwise analysis: range of (a) Intersession ICCs; (b) intrasession ICCs; (c) multiscan ICCs. Maps of voxelwise reliability (ICC[ 0.5) for suprathreshold (Z[ 2.3)voxels that were positively (yellow--red) and negatively (cyan--blue) correlated with each seed ROI.
Cerebral Cortex October 2009, V 19 N 10 2225
at UC
LA
Biom
edical Library Serials on February 1, 2012
http://cercor.oxfordjournals.org/D
ownloaded from

Inter- versus Intra- and Multiscan Reliabilities
It is notable that intersession reliability ( >5 months between
scans) was somewhat lower than intrasession reliability ( <1 h
between scans). That intersession reliability was lower than
intrasession reliability suggests that measures of fcMRI are
dynamic, and may be subject to modulations related to an
individual’s current state, a suggestion that is consistent with
previous findings (Harrison, Pujol, Ortiz, et al. 2008; Waites
et al. 2005). On the other hand, we found that intra-, inter- and
multiscan reliability increased with increasing Z statistic
threshold values (Figs 9 and 13), suggesting that long-term
reliability is highest for correlations between voxels that are
most strongly positively or negatively correlated with the seed
ROI.
Previous studies have demonstrated that even structural
measures are subject to change over time, albeit as the result of
the acquisition of a new skill (Draganski et al. 2004; Ilg et al.
2008). We have recently shown that measures of functional
connectivity may provide an index of brain changes associated
with typical development (Kelly, Di Martino, et al. 2008). The
quantification of longitudinal changes in resting state fcMRI,
and how they relate to underlying changes in brain structure
represents a crucial next step in our understanding of the long-
term stability of functional connectivity measures. Of course,
a myriad of other factors relating to scanner characteristics
could also have contributed to greater variation between fcMRI
measures across several months by contrast to measures
obtained within the same scan session. Given the substantial
intersession intervals (up to 16 months), we interpret the
corresponding reliability indices as a reasonable estimate of the
lower bound of such long-term stability. Beyond this extended
interval it is reasonable to assume that changes at the level of
the neuronal architecture, associated with factors such as
development, aging or learning, would be associated with
changes in patterns of fcMRI, thus substantially reducing
reliability.
Implications
Establishing the test-retest reliability of resting-state fcMRI
measures is crucial to the interpretation and validation of
studies examining interindividual and group differences in
functional connectivity. Several recent studies observed differ-
ences in resting-state functional connectivity that were related
to behavioral performance (Hampson et al. 2006; Kelly, Uddin,
et al. 2008; Seeley et al. 2007) and clinical diagnosis (see
Greicius 2008, for review). Other studies have observed
differences in measures of fcMRI following pharmacological
intervention (e.g., Achard and Bullmore 2007) and mood-
induction (Harrison, Pujol, Ortiz, et al. 2008). Not only do our
findings support the interpretation of these findings as
reflecting meaningful interindividual and group differences,
but they also highlight specific brain regions that appear to
exhibit particularly stable interindividual differences. As
discussed above, these regions have been identified as
constituting the brain’s structural and functional hubs, and
include regions such as the precuneus and posterior cingulate
cortex.
The consistency between the networks identified in pre-
vious functional and structural studies of the brain and those
identified in the present study also provides further support for
the idea that measures of resting state fcMRI reflect aspects of
the intrinsic functional organization of the brain. In particular,
our data suggest that the default mode and task positive
networks are particularly robust, and therefore likely to
provide a veridical reflection of underlying neural architecture.
Limitations
A variety of analytical decisions were made in the present work,
and represent parameters that vary widely across labs.
Noteworthy examples include 1) the spherical definition of
ROIs (radius or geometric form employed can vary), 2) use of
parcellation units (the specific method of parcellation can vary,
or the set of parcellation units adopted), 3) global signal
correction (means of correction may vary), and 4) choice of
spatial and temporal filtering bands. Similarly, studies vary in
the specific imaging parameters adopted (field strength, TR,
voxel size, scan duration). Although these factors can clearly
impact measures of fcMRI, and merit further examination, we
believe the general principles and findings demonstrated in the
present work will generalize across the various approaches.
In the present study, we adopted the ICC to quantify
reliability, primarily due to its widespread usage in a variety of
literatures. ICC is not without limitations, however. Because it
provides a ratio of within-subject to between-subject variabil-
ity, for a measure to be reliable, within-subject variability must
be low relative to between-subject variability. However,
numerous studies suggest that measures of fcMRI are highly
consistent across subjects, rendering between-subject var-
iability low. Consequently, reliability as quantified with ICC
may be low for some portion of functional connections that are
highly stable, because both within- and between-subject
variability are low. In recognition of this potential limitation,
we employed additional measures of cross-scan consistency,
such as Kendall’s coefficient of concordance. These measures
supported the high degree of consistency across participants
and scans.
Future Directions
Our assessment of the test--retest reliability of measures of
resting state fcMRI has been necessarily selective in the specific
measures obtained and regions examined. Nonetheless, by
including ROIs from 3 different studies (Dosenbach et al. 2007;
Kennedy et al. 1998; Makris et al. 1999; Toro et al. 2008), and
examining correlations on a voxelwise level, we believe that we
have provided an initial comprehensive assessment of the most
commonly employed model-based fcMRI method in the field.
Model-free analyses, such as independent component analysis
(ICA), represent an alternative approach to identifying ICNs in
resting state data. Although several groups have already
examined the qualitative reproducibility of networks identified
using ICA and other model-free approaches (Damoiseaux et al.
2006), future work will determine the test--retest reliability of
these measures.
We acquired our functional data while participants rested
with their eyes open. Previous studies have asserted that
resting state data acquired under either eyes-open or eyes-
closed conditions are highly similar (Fox et al. 2005; Fransson
2005), though this similarity has not been quantified. Thus,
systematic quantitative differences may exist between these 2
resting state conditions. In particular, individuals in the eyes-
closed state may fall asleep during resting state scans, which
may affect fcMRI measures (Fukunaga et al. 2006, 2008). Future
2226 Test--Retest Reliability of fMRI Functional Connectivity d Shehzad et al.
at UC
LA
Biom
edical Library Serials on February 1, 2012
http://cercor.oxfordjournals.org/D
ownloaded from

studies should aim to quantify the effects of state, such as sleep,
on test--retest reliability.
Although each scan acquired for the present study com-
prised a single 6.5-min run of resting state data, significant
variation exists across laboratories with respect to the duration
and/or number of scans obtained. Such variation can clearly
impact the reliability of resting state measures obtained, and
should be considered in the design of any study. Supplementary
analyses (see Supporting Information and Fig. S8 and Table S3)
demonstrate the significant increase in reliability and consis-
tency of functional connectivity following averaging across 2
resting state scans for each participant. Future work may focus
on other factors to increase reliability and consistency,
including more rigorous examinations of the effects of
increasing the duration and/or number of scans included in
a session.
The goal of our present study was to establish the stability of
coherent BOLD fluctuations at rest. However, examining the
dynamics of correlated activity is equally important in un-
derstanding the relevance of such functional correlations to
behavior in both health and disease. Future research may seek
to examine the dynamics of correlated spontaneous and task-
related activity in ICNs. To date, this approach has been
exemplified by studies utilizing psychophysiological interac-
tion (PPI) analyses. First described by Friston et al. (1997) more
than a decade ago, this approach examines task-related
modulations of interregional functional connectivity. An
alternative technique is to examine the modulation of ICNs
by the presence of task demands and compare correlations
within specific ICNs across rest and task conditions (Hampson
et al. 2006; Vincent et al. 2006; Kelly, Uddin, et al. 2008).
Studies employing this approach have, for example, demon-
strated increases in the spatial extent and magnitude of
correlations in the default mode network from rest to a moral
dilemma task condition (Harrison, Pujol, Lopez-Sola, et al.
2008). Given the importance of both resting state and task-
related activity to our understanding of brain function, future
work may build upon these studies and examine the impact
and reliability of various task-based manipulations on functional
connectivity. Similarly, future work may directly examine the
relationship between the magnitude of functional connectivity
between 2 regions at rest, and the magnitude of activity during
task-performance.
Concluding Remarks
In summary, our results represent the first quantitative
evaluation of test--retest reliability of some of the most
commonly used measures of resting state fcMRI. We observed
that reliability ranges from minimal to robust, and identified
several factors that appear to be strongly predictive of high
degrees of stability within individuals across time. These results
provide a foundation for continued examination of resting state
fcMRI in typical and atypical populations. Our findings also
further support the audacious hypothesis that ICNs, which are
readily observed during resting state fMRI studies (as well as
during task-based studies), reflect the fundamental self-orga-
nizing properties of brain.
Supplementary Material
Supplementary material can be found at: http://www.cercor.
oxfordjournals.org/.
Funding
Stavros S. Niarchos Foundation, the Leon Lowenstein Founda-
tion, NARSAD (The Mental Health Research Association) grants
to F.X.C.; and Linda and Richard Schaps, Jill and Bob Smith, and
the Taubman Foundation gifts to F.X.C.
Notes
We wish to acknowledge the invaluable contribution made by Don
Klein, who inspired the present work. We would also like to thank our
volunteers, who endured several hours of scanning over the past 2
years. Conflict of Interest : None declared.
Address correspondence to Dr Michael P. Milham, 215 Lexington
Ave, 14th Floor, New York, NY 10016, USA. E-mail: milham01@med.
nyu.edu.
References
Achard SA, Bullmore E. 2007. Efficiency and cost of economical brain
functional networks. PLoS Comput Biol. 3:e17.
Achard SA, Salvador R, Whitcher B, Suckling J, Bullmore E. 2006. A
resilient, low-frequency, small-world human brain functional net-
work with highly connected association cortical hubs. J Neurosci.
26:63--72.
Aguirre GK, Zarahn E, D’Esposito M. 1998. The inferential impact of
global signal covariates in functional neuroimaging analyses. Neuro-
Image. 8:302--306.
Andrews-Hanna JR, Snyder AZ, Vincent JL, Lustig C, Head D, Raichle ME,
Buckner RL. 2007. Disruption of large-scale brain systems in
advanced aging. Neuron. 56:924--935.
Birn RM, Diamond JB, Smith MA, Bandettini PA. 2006. Separating
respiratory-variation-related fluctuations from neuronal-activity-
related fluctuations in fMRI. NeuroImage. 31:1536--1548.
Birn RM, Murphy K, Bandettini PA. 2008. The effect of respiration
variations on independent component analysis results of resting
state functional connectivity. Hum Brain Mapp. 29:740--750.
Biswal BB, Yetkin FZ, Haughton VM, Hyde JS. 1995. Functional
connectivity in the motor cortex of resting human brain using
echo-planar MRI. Magn Reson Med. 34:537--541.
Brett M, Johnsrude IS, Owen AM. 2002. The problem of functional
localization in the human brain. Nat Rev Neurosci. 3:243--249.
Brett M, Leff AP, Rorden C, Ashburner J. 2001. Spatial normalization of
brain images with focal lesions using cost function masking.
NeuroImage. 14:486--500.
Buckner RL, Andrews-Hanna JR, Schacter DL. 2008. The brain’s default
network: anatomy, function, and relevance to disease. Ann N Y Acad
Sci. 1124:1--38.
Castellanos FX, Margulies DS, Kelly AMC, Uddin LQ, Ghaffari M,
Kirsch A, Shaw D, Shehzad Z, Di Martino A, Biswal B, Sonuga-
Barke EJ, Rotrosen J, Adler LA, Milham MP. 2008. Cingulate-
precuneus interactions: a new locus of dysfunction in adult
attention-deficit/hyperactivity disorder. Biol Psychiatry. 63:332--337.
Chen ZJ, He Y, Rosa-Neto P, Germann J, Evans AC. 2008. Revealing
modular architecture of human brain structural networks by using
cortical thickness from MRI. Cereb Cortex.
Cordes D, Haughton V, Carew JD, Arfanakis K, Maravilla K. 2002.
Hierarchical clustering to measure connectivity in fMRI resting-
state data. Magn Reson Imaging. 20:305--317.
Corey D, Dunlap W, Burke M. 1998. Averaging correlations: expected
values and bias in combined pearson r’s and Fischer’s z trans-
formations. J Gen Psychol. 125:245--261.
Damoiseaux JS, Rombouts SA, Barkhof F, Scheltens P, Stam CJ, Smith SM,
Beckmann CF. 2006. Consistent resting-state networks across
healthy subjects. Proc Natl Acad Sci USA. 103:13848--13853.
Di Martino A, Scheres A, Margulies DS, Kelly AMC, Uddin L, Shehzad Z,
Biswal B, Walters JR, Castellanos FX, Milham M. 2008. Functional
connectivity of human striatum: a resting state fMRI study. Cereb
Cortex. 18:2735--2274.
Dosenbach NU, Fair DA, Miezin FM, Cohen AL, Wenger KK,
Dosenbach RA, Fox MD, Snyder AZ, Vincent JL, Raichle ME, et al.
Cerebral Cortex October 2009, V 19 N 10 2227
at UC
LA
Biom
edical Library Serials on February 1, 2012
http://cercor.oxfordjournals.org/D
ownloaded from

2007. Distinct brain networks for adaptive and stable task control in
humans. Proc Natl Acad Sci USA. 104:11073--11078.
Dosenbach NU, Visscher KM, Palmer ED, Miezin FM, Wenger KK,
Kang HC, Burgund ED, Grimes AL, Schlaggar BL, Petersen SE. 2006.
A core system for the implementation of task sets. Neuron.
50:799--812.
Draganski B, Gaser C, Busch V, Schuierer G, Bogdahn U, May A. 2004.
Neuroplasticity: changes in grey matter induced by training. Nature.
427:311--312.
Fair DA, Dosenbach NU, Church JA, Cohen AL, Brahmbhatt S,
Miezin FM, Barch DM, Raichle ME, Petersen SE, Schlaggar BL.
2007. Development of distinct control networks through segrega-
tion and integration. Proc Natl Acad Sci USA. 104:13507--13512.
Fox MD, Corbetta M, Snyder AZ, Vincent JL, Raichle ME. 2006.
Spontaneous neuronal activity distinguishes human dorsal and
ventral attention systems. Proc Natl Acad Sci USA. 103:
10046--10051.
Fox MD, Raichle ME. 2007. Spontaneous fluctuations in brain activity
observed with functional magnetic resonance imaging. Nat Rev
Neurosci. 8:700--711.
Fox MD, Snyder AZ, Vincent JL, Corbetta M, Van Essen DC, Raichle ME.
2005. The human brain is intrinsically organized into dynamic,
anticorrelated functional networks. Proc Natl Acad Sci USA.
102:9673--9678.
Fox MD, Snyder AZ, Vincent JL, Raichle ME. 2007. Intrinsic fluctuations
within cortical systems account for intertrial variability in human
behavior. Neuron. 56:171--184.
Fransson P. 2005. Spontaneous low-frequency BOLD signal fluctuations:
an fMRI investigation of the resting-state default mode of brain
function hypothesis. Hum Brain Mapp. 26:15--29.
Fransson P. 2006. How default is the default mode of brain function?
Further evidence from intrinsic BOLD signal fluctuations. Neuro-
psychologia. 44:2836--2845.
Fransson P, Marrelec G. 2008. The precuneus/posterior cingulate
cortex plays a pivotal role in the default mode network: evidence
from a partial correlation network analysis. NeuroImage. 42:
1178--1184.
Friston KJ. 1994. Functional and effective connectivity in neuroimaging:
a synthesis. Hum Brain Mapp. 2:56--78.
Friston KJ, Buechel C, Fink GR, Morris J, Rolls E, Dolan RJ. 1997.
Psychophysiological and modulatory interactions in neuroimaging.
NeuroImage. 6:218--229.
Fukunaga M, Horovitz S, De Zwart J, Van Gelderen P, Balkin T, Braun A,
Duyn J. 2008. Metabolic origin of BOLD signal fluctuations in the
absence of stimuli. J Cereb Blood Flow Metab. 28:1377--1387.
Fukunaga M, Horovitz S, Van Gelderen P, De Zwart J, Jansma JM,
Ikonomidou VN, Chu R, Deckers RH, Leopold DA, Duyn J. 2006.
Large-amplitude, spatially correlated fluctuations in BOLD fMRI
signals during extended rest and early sleep stages. Magn Reson
Imaging. 24:979--992.
Gong G, He Y, Concha L, Lebel C, Gross DW, Evans AC, Beaulieu C.
2008. Mapping anatomical connectivity patterns of human cerebral
cortex using in vivo diffusion tensor imaging tractography. Cereb
Cortex. Advance Access published on June 20, 2008; doi:10.1093/
cercor/bhn102.
Greicius MD. 2008. Resting-state functional connectivity in neuropsy-
chiatric disorders. Curr Opin Neurol. 21:424--430.
Greicius MD, Flores BH, Menon V, Glover GH, Solvason HB, Kenna H,
Reiss AL, Schatzberg AF. 2007. Resting-state functional connectivity
in major depression: abnormally increased contributions from
subgenual cingulate cortex and thalamus. Biol Psychiatry.
62:429--437.
Greicius MD, Kiviniemi V, Tervonen O, Vainionpaa V, Alahuhta S,
Reiss AL, Menon V. 2008. Persistent default-mode network
connectivity during light sedation. Hum Brain Mapp. 29:839--847.
Greicius MD, Krasnow B, Reiss AL, Menon V. 2003. Functional
connectivity in the resting brain: a network analysis of the default
mode hypothesis. Proc Natl Acad Sci USA. 100:253--258.
Greicius MD, Supekar K, Menon V, Dougherty RF. 2008. Resting-state
functional connectivity reflects structural connectivity in the
default mode network. Cereb Cortex. 19:72--78.
Hagmann P, Cammoun L, Gigandet X, Meuli R, Honey CJ, Wedeen VJ,
Sporns O. 2008. Mapping the structural core of human cerebral
cortex. Plos Biol. 6:e159.
Hagmann P, Kurant M, Gigandet X, Thiran P, Wedeen VJ, Meuli R,
Thiran JP. 2007. Mapping human whole-brain structural networks
with diffusion MRI. PLoS ONE. 2:e597.
Hampson M, Driesen NR, Skudlarski P, Gore JC, Constable RT. 2006.
Brain connectivity related to working memory performance.
J Neurosci. 26:13338--13343.
Harrison BJ, Pujol J, Lopez-Sola M, Hernandez-Ribas R, Deus J, Ortiz H,
Soriano-Mas C, Yucel M, Pantelis C, Cardoner N. 2008. Consistency
and functional specialization in the default mode brain network.
Proc Natl Acad Sci USA. 105:9781--9786.
Harrison BJ, Pujol J, Ortiz H, Fornito A, Pantelis C, Yucel M. 2008.
Modulation of brain resting-state networks by sad mood induction.
PLoS ONE. 3:e1794.
He BJ, Snyder A, Vincent JL, Epstein A, Shulman GL, Corbetta M. 2007.
Breakdown of functional connectivity in frontoparietal
networks underlies behavioral deficits in spatial neglect. Neuron.
53:905--918.
He Y, Chen ZJ, Evans AC. 2007. Small-world anatomical networks in the
human brain revealed by cortical thickness from MRI. Cereb Cortex.
17:2407--2419.
Horovitz S, Fukunaga M, De Zwart J, Van Gelderen P, Fulton S, Balkin T,
Duyn J. 2008. Low frequency BOLD fluctuations during resting
wakefulness and light sleep: a simultaneous EEG-fMRI study. Hum
Brain Mapp. 29:671--682.
Ilg R, Wohlschlager AM, Gaser C, Liebau Y, Dauner R, Woller A,
Zimmer C, Zihl J, Muhlau M. 2008. Gray matter increase induced by
practice correlates with task-specific activation: a combined func-
tional and morphometric magnetic resonance imaging study.
J Neurosci. 28:4210--4215.
Kahn I, Andrews-Hanna JR, Vincent JL, Snyder AZ, Buckner RL. 2008.
Distinct cortical anatomy linked to subregions of the medial
temporal lobe revealed by intrinsic functional connectivity.
J Neurophysiol. 100:129--139.
Kelly AMC, Di Martino A, Uddin L, Shehzad Z, Gee DG, Reiss PT,
Margulies DS, Castellanos FX, Milham M. 2008. Development of
anterior cingulate functional connectivity from late childhood to
early adulthood. Cereb Cortex. Advance Access published on August
26, 2008; doi:10.1093/cercor/bhn117.
Kelly AMC, Uddin LQ, Biswal B, Castellanos FX, Milham MP. 2008.
Competition between functional brain networks mediates behav-
ioral variability. NeuroImage. 39:527--537.
Kendall M, Gibbons JD. 1990. Rank correlation methods. New York:
Charles Griffin Book. p. 272.
Kendall MG, Smith BB. 1939. The problem of m rankings. Ann Math Stat.
10:275--287.
Kennedy DN, Lange N, Makris N, Bates JF, Meyer J, Caviness VS. 1998.
Gyri of the human neocortex: an MRI-based analysis of volume and
variance. Cereb Cortex. 8:372--384.
Kennedy DP, Redcay E, Courchesne E. 2006. Failing to deactivate:
resting functional abnormalities in autism. Proc Natl Acad Sci USA.
103:8275--8280.
Legendre P, Lapointe F. 2004. Assessing congruence among distance
matrices: single-malt scotch whiskies revisited. Aust N Z J Stat.
46:615--629.
Liu Y, Liang M, Zhou Y, He Y, Hao Y, Song M, Yu C, Liu H, Liu Z, Jiang T.
2008. Disrupted small-world networks in schizophrenia. Brain.
131:945--961.
LoweMJ, Beall EB, Sakaie KE, Koenig KA, Stone L, Marrie RA, Phillips MD.
2008. Resting state sensorimotor functional connectivity in multiple
sclerosis inversely correlates with transcallosal motor pathway
transverse diffusivity. Hum Brain Mapp. 29:818--827.
Makris N, Meyer JW, Bates JF, Yeterian EH, Kennedy DN, Caviness VS.
1999. MRI-Based topographic parcellation of human cerebral white
matter and nuclei II. Rationale and applications with systematics of
cerebral connectivity. NeuroImage. 9:18--45.
Margulies DS, Kelly AMC, Uddin LQ, Biswal B, Castellanos FX,
Milham MP. 2007. Mapping the functional connectivity of anterior
cingulate cortex. NeuroImage. 37:579--588.
2228 Test--Retest Reliability of fMRI Functional Connectivity d Shehzad et al.
at UC
LA
Biom
edical Library Serials on February 1, 2012
http://cercor.oxfordjournals.org/D
ownloaded from

Mazoyer B, Zago L, Mellet E, Bricogne S, Etard O, Houde O, Crivello F,
Joliot M, Petit L, Tzourio-Mazoyer N. 2001. Cortical networks for
working memory and executive functions sustain the conscious
resting state in man. Brain Res Bull. 54:287--298.
Mielke P, Berry K. 2007. Permutation methods: a distance function
approach. New York: Springer.
Murphy K, Birn RM, Handwerker DA, Jones TB, Bandettini PA. 2009.
The impact of global signal regression on resting state correlations:
are anti-correlated networks introduced? NeuroImage. 44:
893--905.
Raichle ME, MacLeod AM, Snyder AZ, Powers WJ, Gusnard DA,
Shulman GL. 2001. A default mode of brain function. Proc Natl
Acad Sci USA. 98:676--682.
Salvador R, Suckling J, Coleman MR, Pickard JD, Menon D, Bullmore E.
2005. Neurophysiological architecture of functional magnetic
resonance images of human brain. Cereb Cortex. 15:1332--1342.
Seeley WW, Menon V, Schatzberg AF, Keller J, Glover GH, Kenna H,
Reiss AL, Greicius MD. 2007. Dissociable intrinsic connectivity
networks for salience processing and executive control. J Neurosci.
27:2349--2356.
Shrout PE, Fleiss JL. 1979. Intraclass correlations: uses in assessing rater
reliability. Psychol Bull. 86:420--428.
Shulman GL, Fiez JA, Corbetta M, Buckner RL, Miezin FM, Raichle ME,
Peterson SE. 1997. Common blood flow changes across visual tasks:
II. Decreases in cerebral cortex. J Cogn Neurosci. 9:648--663.
Skudlarski P, Jagannathan K, Calhoun VD, Hampson M, Skudlarska BA,
Pearlson G. 2008. Measuring brain connectivity: diffusion tensor
imaging validates resting state temporal correlations. NeuroImage.
43:554--561.
Sridharan D, Levitin DJ, Menon V. 2008. A critical role for the right
fronto-insular cortex in switching between central-executive and
default-mode networks. Proc Natl Acad Sci USA. 105:
12569--12574.
Tian L, Jiang TZ, Liang M, Li X, He Y, Wang K, Cao B, Jiang T. 2007.
Stabilities of negative correlations between blood oxygen level-
dependent signals associated with sensory and motor cortices. Hum
Brain Mapp. 28:681--690.
Toro R, Fox PT, Paus T. 2008. Functional coactivation map of the human
brain. Cereb Cortex. 18:2553--2559.
Uddin LQ, Kelly AMC, Biswal BB, Xavier Castellanos F, Milham M. 2008.
Functional connectivity of default mode network components:
correlation, anticorrelation, and causality. Hum Brain Mapp.
Van De Ven V, Formisano E, Prvulovic D, Roeder C, Linden DE. 2004.
Functional connectivity as revealed by spatial independent compo-
nent analysis of fMRI measurements during rest. Hum Brain Mapp.
22:165--178.
Van Den Heuvel M, Mandl R, Hulshoff Pol H. 2008. Normalized cut
group clustering of resting-state FMRI data. PLoS ONE. 3:e2001.
Vincent JL, Patel GH, Fox MD, Snyder AZ, Baker JT, Van Essen DC,
Zempel JM, Snyder LH, Corbetta M, Raichle ME. 2007. Intrinsic
functional architecture in the anaesthetized monkey brain. Nature.
447:83--86.
Vincent JL, Snyder AZ, Fox MD, Shannon B, Andrews-Hanna JR,
Raichle ME, Buckner RL. 2006. Coherent spontaneous activity
identifies a hippocampal-parietal memory network. J.Neurophysiol.
96:3517--3531.
Waites AB, Stanislavsky A, Abbott DF, Jackson GD. 2005. Effect of prior
cognitive state on resting state networks measured with functional
connectivity. Hum Brain Mapp. 24:59--68.
Wood SN. 2006. Generalized additive models: an introduction with R.
New York: Chapman & Hall/CRC.
Woolrich MW, Ripley BD, Brady M, Smith SM. 2001. Temporal
autocorrelation in univariate linear modeling of FMRI data. Neuro-
Image. 14:1370--1386.
Zang Y, Jiang TZ, Lu Y, He Y, Tian L. 2004. Regional homogeneity
approach to fMRI data analysis. NeuroImage. 22:394--400.
Zou QH, Zhu CZ, Yang Y, Zuo XN, Long XY, Cao QJ, Wang YF, Zang YF.
2008. An improved approach to detection of amplitude of low-
frequency fluctuation (ALFF) for resting-state fMRI: fractional ALFF.
J Neurosci Methods. 172:137--141.
Cerebral Cortex October 2009, V 19 N 10 2229
at UC
LA
Biom
edical Library Serials on February 1, 2012
http://cercor.oxfordjournals.org/D
ownloaded from