Are We Happy Yet?
42
Are We Happy Yet? FOR IMMEDIATE RELEASE FEBRUARY 13, 2006 Paul Taylor, Executive Vice President Cary Funk, Senior Project Director Peyton Craighill, Project Director MEDIA INQUIRIES CONTACT: Pew Research Center 202 419 4328 http://pewresearch.org
-
Upload
khangminh22 -
Category
Documents
-
view
4 -
download
0
Transcript of Are We Happy Yet?

Are We Happy Yet?
FOR IMMEDIATE RELEASE FEBRUARY 13, 2006
Paul Taylor, Executive Vice President Cary Funk, Senior Project Director Peyton Craighill, Project Director MEDIA INQUIRIES CONTACT: Pew Research Center 202 419 4328 http://pewresearch.org

1
Are We Happy Yet? Americans have always had a thing about happiness. We all have certain unalienable rights, declares our Declaration of Independence, among them “life, liberty and the pursuit of happiness.”
So then, a couple of centuries into the chase, how are we doing?
Alas, only so-so. Just a third (34%) of adults in this country say they’re very happy, according to the latest Pew Research Center survey. Another half say they are pretty happy and 15% consider themselves not too happy. These numbers have remained very stable for a very long time.
About One Third of Americans Are Very Happy How happy are you these days in your life?
Don't know1%
Not too happy15%
Pretty happy50%Very happy
34%
Question wording: Generally, how would you say things are these days in your life--would you say that you are very happy, pretty happy, or not too happy?

2
The Happiness Trend Line: Barely a Ripple
0
10
20
30
40
50
60
70
80
90
100
1972 1976 1980 1984 1988 1992 1996 2000 2004
Very happy Pretty happy Not too happy
Source: General Social Survey 1972-2004. Question wording: Taken all together, how would you say things are these days, would you say that you are very happy, pretty happy, or not too happy?

3
But some of us are happier than others, and this variance helps to paint a portrait of the kind of people Americans are. It also casts doubt on some of the famous wisdom on the subject.
For example, remember grandma’s aphorism about money not buying happiness? Well, brace yourself, but dear ole grandma may have been misinformed. Our survey shows that nearly half (49%) of those with an annual family income of more than $100,000 say they’re very happy. By contrast, just 24% of those with an annual family income of less than $30,000 say they’re very happy.
This finding definitely puts grandma on shaky ground, but it doesn’t necessarily prove her wrong. It establishes a correlation (two things that go hand in hand) rather than a cause (one thing that leads to the other). There are, in fact, any number of possible causes of this correlation. Perhaps money leads to happiness. Perhaps happiness leads to money. Or perhaps both are influenced by some other, more powerful factor.
Later in this report we’ll try to sort out which correlations are most powerful. But meantime, we should note at the outset that all of the findings from this survey should be taken with a general caution.
Much of the research into the field of happiness -- to say nothing of simple common sense – suggests that at the level of the individual, happiness is heavily influenced by life events (Did you get the big promotion? Have a fight with your boyfriend?) as well as by psychological traits (self-esteem, optimism, a sense of belonging, the capacity to love, etc.). The Pew survey did not look at life events or psychological characteristics. We only looked at happiness by demographic and behavioral traits. But through this admittedly limited prism, we found some fascinating correlations.
Several of them stand out: Married people are happier than unmarrieds. People who worship frequently are happier than those who don’t. Republicans are happier than Democrats. Rich people are happier than poor people. Whites and Hispanics are happier than blacks. Sunbelt residents are happier than those who live in the rest of the country.
Does Money Buy Happiness? Percentage Very Happy by Family Income
24
33
38
49
0
10
20
30
40
50
60
70
80
90
100
Under $30K $30K to under $75K $75K to under $100K $100K and over
Those with higher incomes are more likely to be very happy.

4
We also found some interesting non-correlations. People who have children are no happier than those who don’t, after controlling for marital status. Retirees are no happier than workers. Pet owners are no happier than those without pets.
The findings are drawn from a telephone survey of a nationally representative, randomly-selected sample of 3,014 adults, conducted from Oct. 5 through Nov. 6, 2005. You can go directly to the full battery of happiness tables by clicking on this index. Here is a run-down of the most compelling findings.
Income
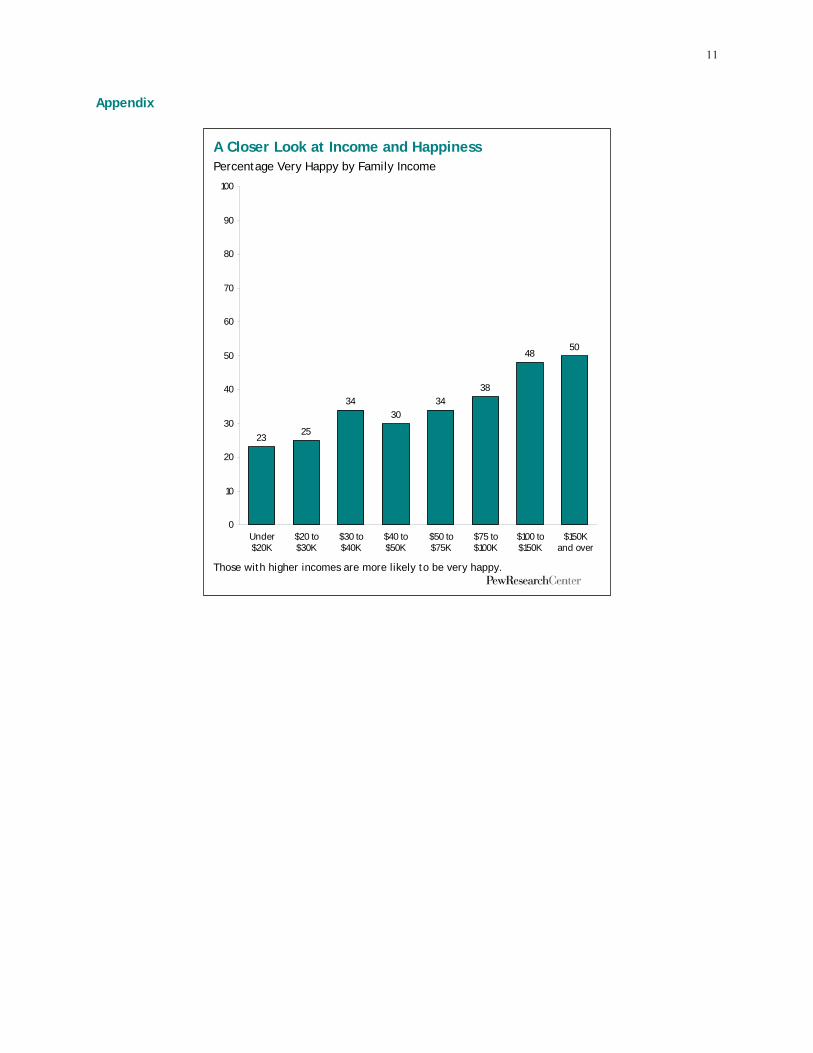
The correlation between happiness and family income is very strong indeed – reported happiness rises in a nearly straight line through eight levels of annual family income. At the highest income category -- $150,000 and above – fully 50% of respondents report being very happy; by contrast, just 23% of those who have a family income below $20,000 say they are very happy.
But there is also a way to look at the long term trend in happiness that sheds a different light on the question of whether it is tied to money. As noted above, about a third of the public has been reporting they are very happy ever since 1972, when the General Social Survey (sociological surveys funded largely by the National Science Foundation) started asking the same happiness question that Pew posed in its survey. But during these past three decades, the average annual per capita income in this country has more than doubled in inflation adjusted dollars. Thus, in the aggregate, Americans have more money now than they did a generation ago. But in the aggregate, we’re no happier.
So was grandma right after all – money doesn’t buy happiness? Well, no. The trend data also show that what matters on the happiness front is not how much money you have, but whether you have more (or less) at any given time than everyone else.
That raises one more question: how about the really rich? Does the linear relationship between happiness and income continue right up into the income stratosphere – with billionaires happier than millionaires, who in turn are happier than the folks just getting by on $500,000 a year?
This survey can’t provide an answer; random phone calls don’t generate a large enough sample of the super rich. So all we can do is fall back on the wisdom of the popular culture, which is fond of chronicling the travails of the rich and famous. Of course, we can’t be sure if these stories are based on a representative sample. But we do notice that reading them often makes us happy.
About the Survey Results for this survey are based on telephone interviews conducted with a nationally representative sample of adults, ages 18 years and older, living in continental U.S. telephone households.
• Interviews conducted October 5-November 6, 2005
• 3,014 interviews
• Margin of sampling error is plus or minus 2 percentage points for results based on the total sample at the 95% confidence level. The margin of sampling error is higher for results based on subgroups of respondents.
Survey interviews conducted under the direction of Princeton Survey Research Associates International. Interviews were conducted in English and Spanish.
In addition to sampling error, bear in mind that question wording and practical difficulties in conducting surveys can introduce error or bias in the findings of opinion polls.

5
Political Party Affiliation
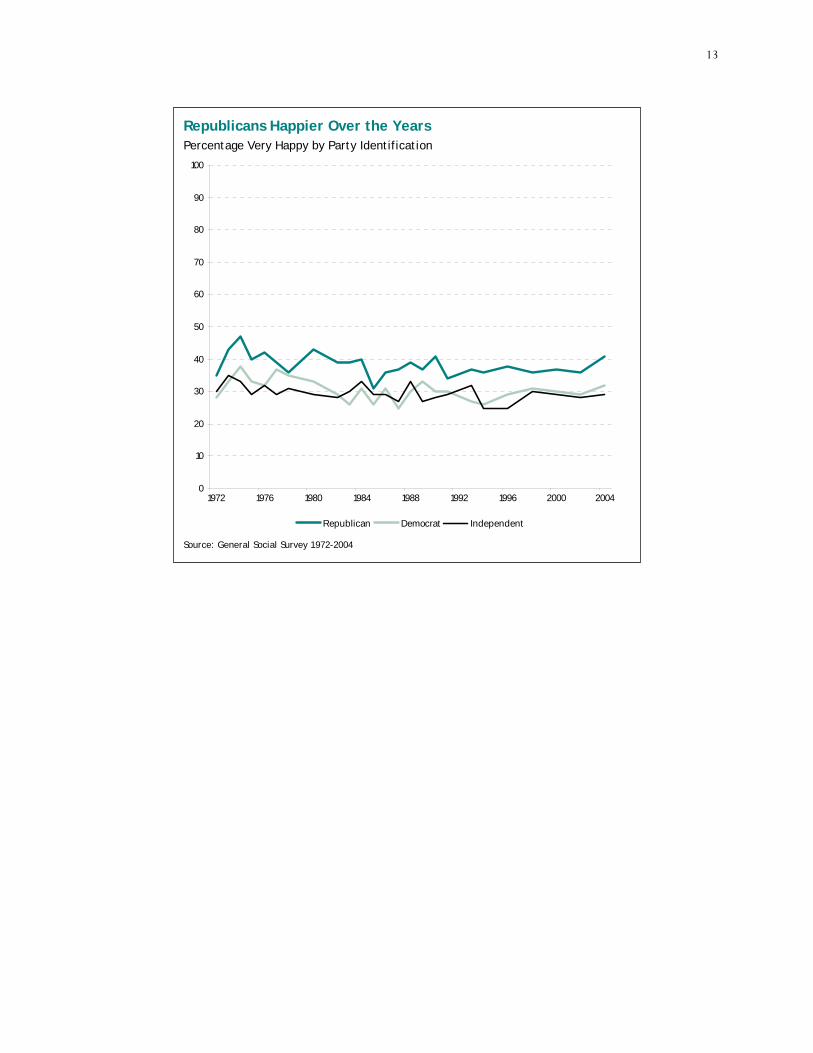
Some 45% of all Republicans report being very happy, compared with just 30% of Democrats and 29% of independents. This finding has also been around a long time; Republicans have been happier than Democrats every year since the General Social Survey began taking its measurements in 1972. Pew surveys since 1991 also show a partisan gap on happiness; the current 16 percentage point gap is among the largest in Pew surveys, rivaled only by a 17 point gap in February 20031.
Could it be that Republicans are so much happier now because their party controls all the levers of federal power? Not likely. Since 1972, the GOP happiness edge over Democrats has ebbed and flowed in a pattern that appears unrelated to which party is in political power.
For example, Republicans had up to a 10 and 11 percentage point happiness edge over Democrats in various years of both the Carter and Clinton presidencies, and as small as a three and five percentage point edge in various years of the Reagan and first Bush presidencies. Also, we should explain here a bit about how our survey questionnaire was constructed. The question about happiness was posed at the very beginning of the interview, while the question about political affiliation was posed at the back end, along with questions about demographic traits. So respondents were not cued to consider their happiness through the frame of partisan politics. This question is about happiness; it is not a question about happiness with partisan outcomes.
Of course, there’s a more obvious explanation for the Republicans’ happiness edge. Republicans tend to have more money than Democrats, and --as we’ve already discovered-- people who have more money tend to be happier.
But even this explanation only goes so far. If one controls for household income, Republicans still hold a significant edge: that is, poor Republicans are happier than poor Democrats; middle-income Republicans are happier than middle-income Democrats, and rich Republicans are happier than rich Democrats.
1 Trends from the Pew Research Center for the People & the Press surveys conducted in January 1991, September 1992, September 1996, February 2003, and late March 2003. In 1992, and 1991 the question wording was “Taken all together, how would you say things are these days – would you say…”
Republicans Happier than Democrats, Independents Percentage Very Happy by Party Identification
45
30 29
0
10
20
30
40
50
60
70
80
90
100
Republican Democrat Independent
6
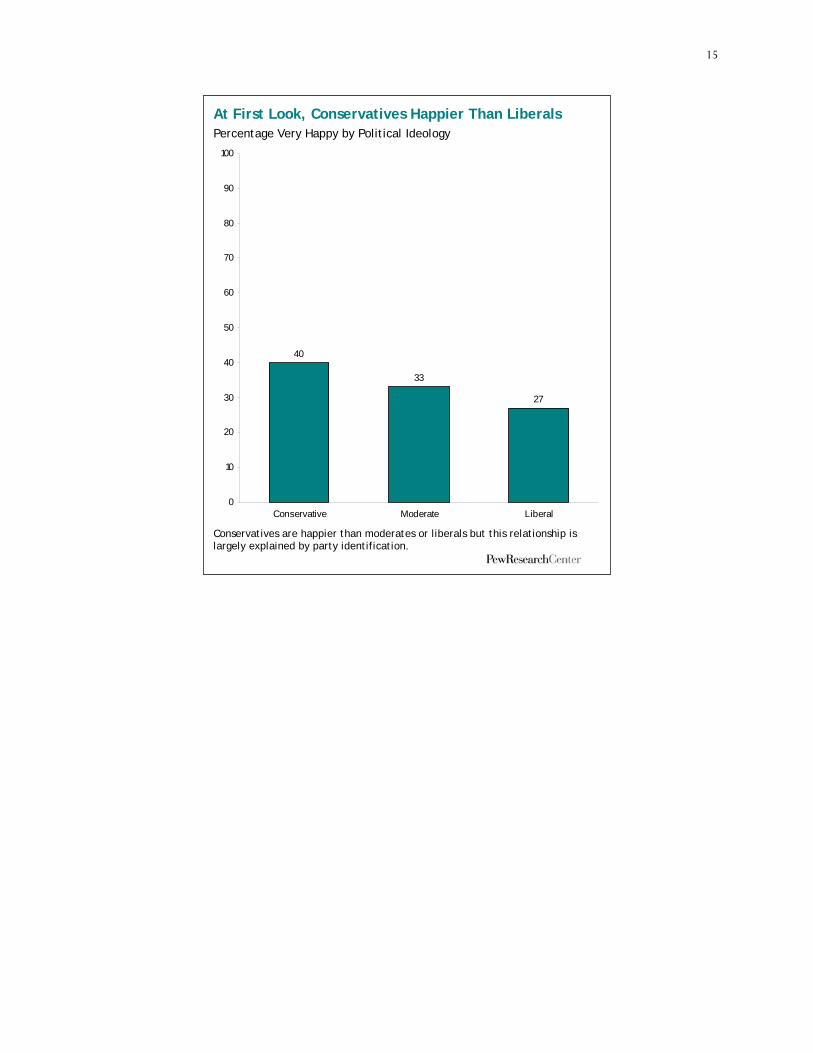
Might ideology be the key? It’s true that conservatives, who are more likely to be Republican, are happier than liberals, who are more likely to be Democrats. But even controlling for this ideological factor, a significant partisan gap remains. Conservative Republicans are happier than conservative Democrats, and moderate/liberal Republicans are happier than liberal Democrats. Hmmm, what other factors might be at play? Well, there’s always…
Religiosity
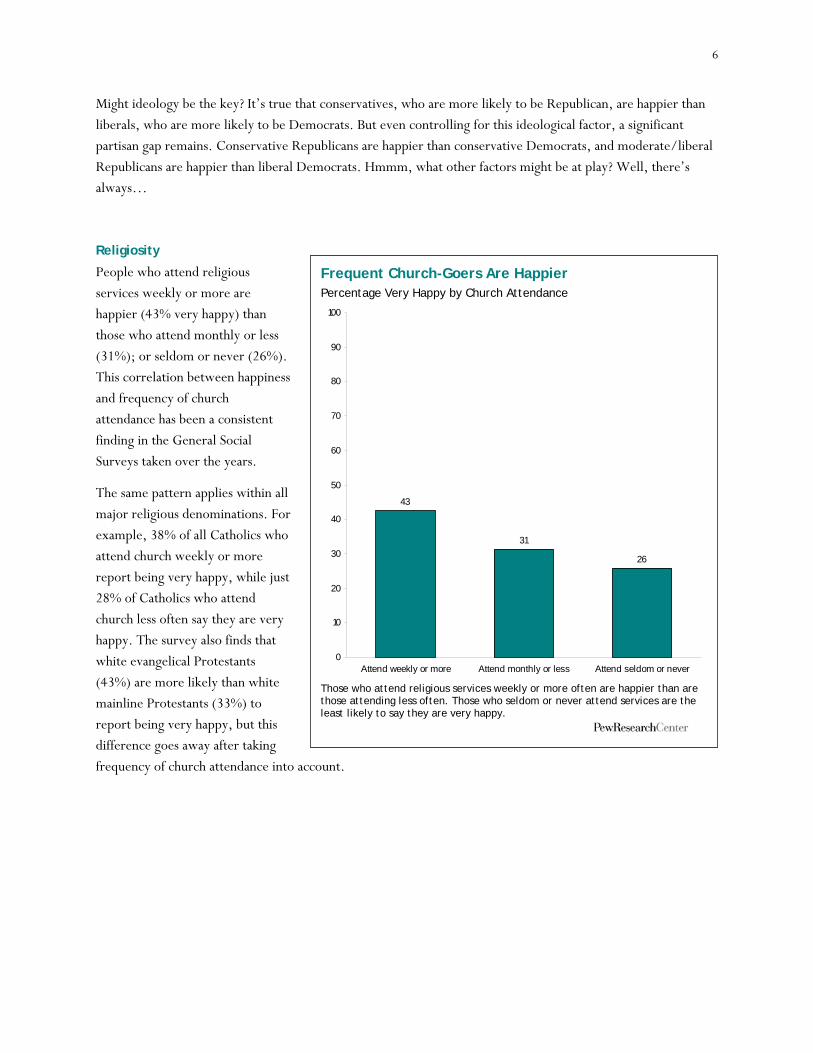
People who attend religious services weekly or more are happier (43% very happy) than those who attend monthly or less (31%); or seldom or never (26%). This correlation between happiness and frequency of church attendance has been a consistent finding in the General Social Surveys taken over the years.
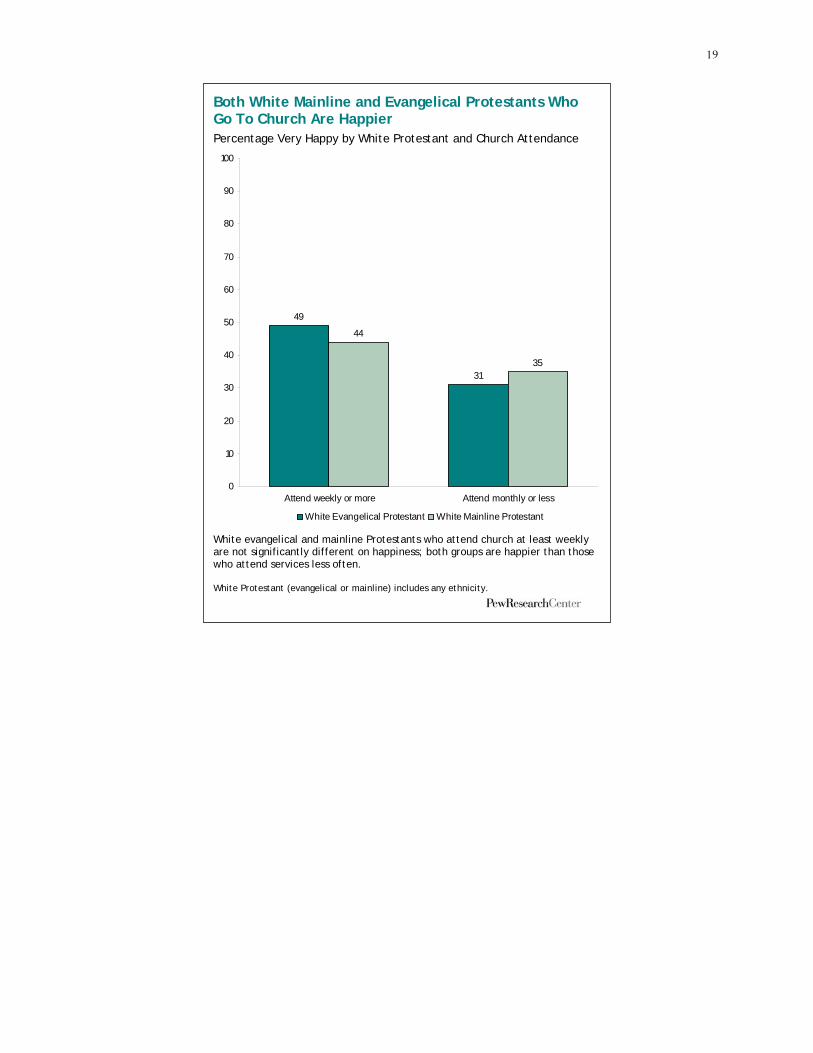
The same pattern applies within all major religious denominations. For example, 38% of all Catholics who attend church weekly or more report being very happy, while just 28% of Catholics who attend church less often say they are very happy. The survey also finds that white evangelical Protestants (43%) are more likely than white mainline Protestants (33%) to report being very happy, but this difference goes away after taking frequency of church attendance into account.
Frequent Church-Goers Are Happier Percentage Very Happy by Church Attendance
43
31
26
0
10
20
30
40
50
60
70
80
90
100
Attend weekly or more Attend monthly or less Attend seldom or never
Those who attend religious services weekly or more often are happier than are those attending less often. Those who seldom or never attend services are the least likely to say they are very happy.

7
Marital and Parenting Status
Married people (43% very happy) are a good bit happier than unmarrieds (24%) and this too has been a consistent finding over many years and many surveys. It holds up for men as well as for women, and for the old as well as the young, though the marriage gap in happiness is not quite as great among the old.
Overall, parents are happier than adults who have no children, but this gap disappears once a person’s marital status is considered. That is, married people with children are about as happy as married people without children. And unmarried people with children are about as happy as unmarried people without children.
Race and Ethnicity
Blacks (28%) are somewhat less likely than whites (36%) or Hispanics (34%) to report being very happy. The difference in average family income among the groups appears to be a factor, but it plays out in different ways for different groups. For non-Hispanic whites, having more family income is clearly correlated with being happier. (There are not enough Hispanics in the survey for analysis by income groups.) But among blacks, there is no correlation – blacks with a family income of $50,000 a year or more are about equally likely to say they are very happy (28%) than are blacks with a family income of less than $50,000 (27%). It’s possible that blacks with incomes much higher than $50,000 (say $100,000 or more) are happier than others, but there were not enough of these higher income blacks in our survey for further analysis on this point.
Age and Gender
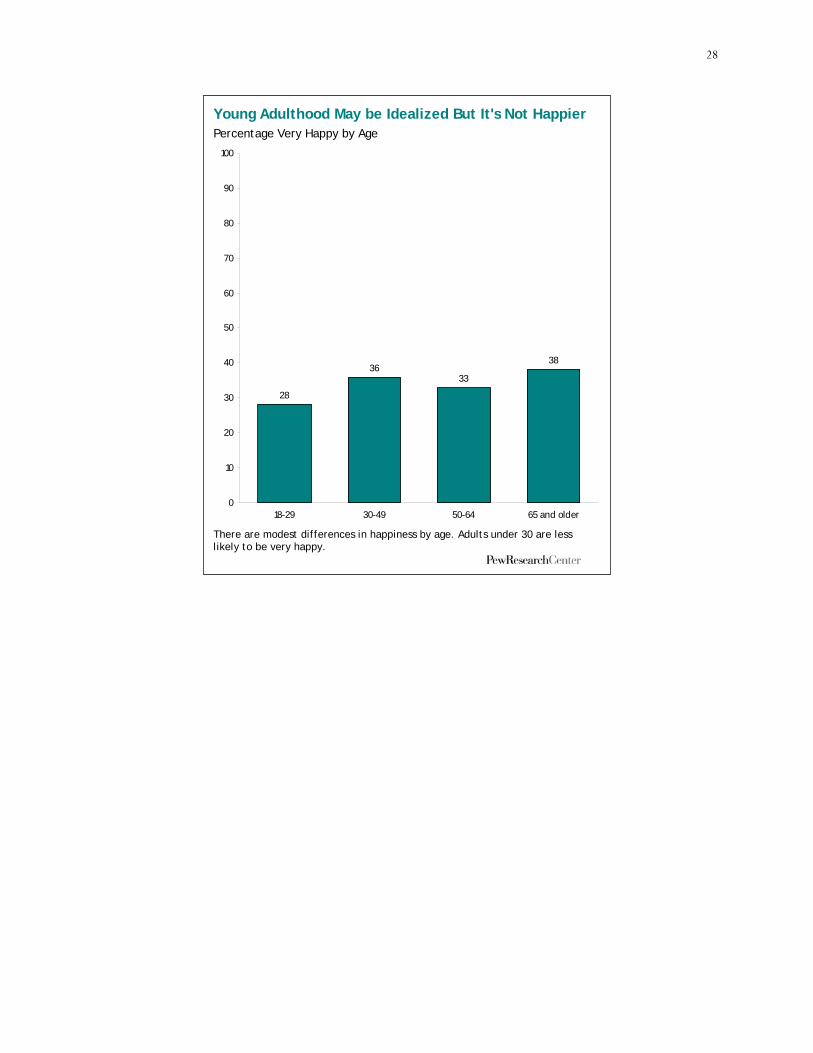
There is virtually no difference in happiness by gender and only a bit of variance in happiness by age. But the age data run counter to the prevailing ethos of the popular culture, which is forever extolling the blessings of youth.
It turns out that the young are less happy than the middle-aged or old. This gap is a bit more pronounced for men, who have a 15 percentage point happiness gap between those who are 18-to-29 years old and those who are over age 65, than it is for women, among whom the equivalent gap is just seven percentage points.
Is Marriage Bliss? Percentage Very Happy by Marital Status
43
24
0
10
20
30
40
50
60
70
80
90
100
Married Not married
Married people are more likely than those who are not married to be very happy.

8
Work, Education, Health, Geography, Miscellanceous
Here most of the findings are pretty predictable – healthier people tend to be happier, and so do better-educated people.
The pattern in happiness by work status is a bit more complicated. Retirees (36%) and workers (35%) are equally likely to report being very happy, and both are happier than those who are not employed (26% very happy). There is a significant gender variance here. Retired men and retired women are about equally likely to be very happy, as are working men and working women. But among those who are not employed, men (16%) are less likely than women (30%) to report being very happy – presumably because for more women than men, not working outside the home is a matter of choice.
Recent immigrants are about as happy as those who have been here for generations. People who often feel rushed are less happy than those who don’t. Suburbanites are a bit happier than city folks, and Sunbelt residents are a bit happier than people who live in colder climates
Putting It All Together
How do all these factors play out together? Well, it can get complicated. Sometimes the correlations tend to reinforce one another. For example, healthy people tend to have more income, and both these traits independently correlate with happiness. But sometimes the correlations are not in sync. Frequent church-goers, for example, on average have less income than infrequent church-goers – so their religious profile pushes them up the happiness scale while their financial profile pushes them down. Which factor is more powerful? And is being a Republican really a predictor of happiness, independent of all other factors?
One way to find out is by way of a statistical technique known as multiple regression analysis, which gauges the relationship between each factor and happiness while controlling for all the other factors. That analysis2 shows that the most robust correlations of all those described in this report are health, income, church attendance, being married and, yes, being a Republican. Indeed, being a Republican is associated not only with happiness, it is also associated with every other trait in this cluster. Even so, the factor that makes the most difference in predicting happiness is neither being a Republican nor being wealthy—it’s being in good health.
The same regression analysis also finds that education, gender, and race do not have a statistically significant independent effect on predicting happiness, once all the other factors are controlled.
Keep in mind, however, that even taking into account all these factors, we don’t actually improve by very much our ability to predict which specific individual is likely to be very happy. If we knew who’d been fired last week, or who’s a glass-is-always-half-full kind of person, we’d probably do a lot better.
2 Based on a logistic regression predicting a very happy response from the following: family income, religious service attendance, marital status, republican partisanship, democratic partisanship, personal health evaluation, gender, age and a curvilinear age factor, education level, race (black or not black) and ethnicity (Hispanic or not Hispanic). Relative importance of each factor is based on the expected change in probability of being very happy when that factor changes from its minimum to its maximum value and all other factors are held at their mode or mean. (For continuous variables, the expected change in probability compares one standard deviation above and below the mean holding all other factors at their mode or mean.) This analysis was also confirmed using an ordinal logistic regression.

9
Unhappiness
So much for happiness. What about the other side of the coin? Which Americans are “not too happy”? Well, as one would expect, the unhappy campers are for the most part the demographic mirror image of the happy campers. But there are a few wrinkles.
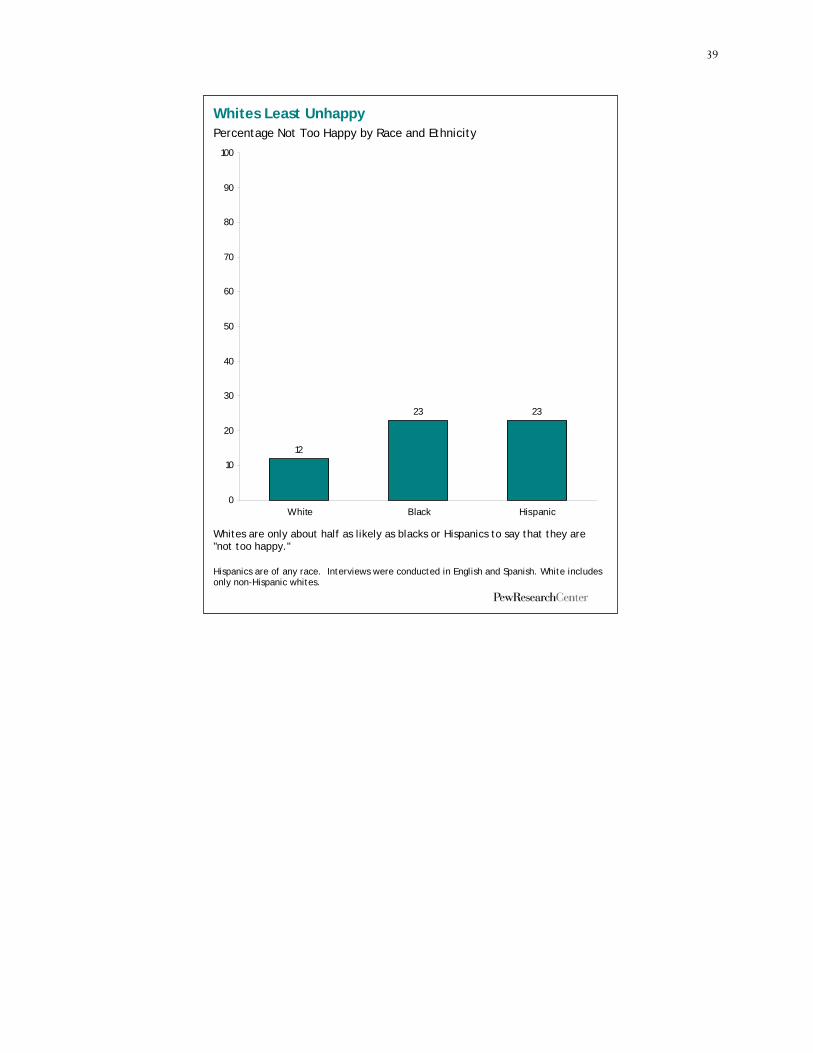
The first has to do with race. As already noted, whites and Hispanics are about equally likely to say they are very happy, and both groups are happier than blacks. But looking only at unhappiness, the relationship between the three groups changes: many fewer whites (12%) than blacks or Hispanics (each 23%) say they are not too happy.
On the health front, while there’s a strong association between feeling healthy and happy, there’s an even stronger association between feeling unhealthy and unhappy. Fully 55% of people who say their health is poor also report that they are “not too happy.” No other characteristic measured in this report comes close to rivaling poor health as a predictor of unhappiness.
The unhappiness data also highlight the plight of another demographic group -- single parents with minor age children. More than a quarter of them (27%) report being not too happy – by far the largest percentage for any marital or parenting sub-group in the survey.
A Closing Note on a Delicate Subject
Lastly, we come to what may be the most controversial non-finding of all. It turns out that there is no significant happiness gap between dog owners and cat owners. Or between owners of pets of any kind and those who have no pets. We’re at a loss to explain. We’re just happy – no, make that very happy -- that neither Fido nor Felix can read.

10
About the Pew Social Trends Reports
The Pew social trends reports explore the behaviors and attitudes of Americans in key realms of their lives – family, community, health, finance, work and leisure. Reports analyze changes over time in social behaviors and probe for differences and similarities between key sub-groups in the population.
The surveys are conducted by the Pew Research Center, a nonpartisan “fact tank” that provides information on the issues, attitudes and trends shaping America and the world.
Survey reports are the result of the collaborative effort of the social trends staff, which consists of:
Paul Taylor, Executive Vice President Cary Funk, Senior Project Director Peyton Craighill, Project Director
Acknowledgements
We are grateful to our colleagues at the Pew Research Center for guidance and staff support in preparing this survey report, especially the staff of the Pew Research Center for the People & the Press. Our thanks also to the staff at the Princeton Survey Research Associates International who conducted the survey interviews and data processing for this survey.
11
Appendix
A Closer Look at Income and Happiness Percentage Very Happy by Family Income
23 25
3430
3438
4850
0
10
20
30
40
50
60
70
80
90
100
Under$20K
$20 to$30K
$30 to$40K
$40 to$50K
$50 to$75K
$75 to$100K
$100 to$150K
$150Kand over
Those with higher incomes are more likely to be very happy.

12
Money and Happiness Have Been Hanging Out Together for a Long Time Percentage Very Happy by Income Quartiles
0
10
20
30
40
50
60
70
80
90
100
1972 1976 1980 1984 1988 1992 1996 2000 2004
High Upper-Middle Low-Middle Low
Source: General Social Survey 1972-2004
13
Republicans Happier Over the Years Percentage Very Happy by Party Identification
0
10
20
30
40
50
60
70
80
90
100
1972 1976 1980 1984 1988 1992 1996 2000 2004
Republican Democrat Independent
Source: General Social Survey 1972-2004

14
Regardless of Income, GOPers are Happier Percentage Very Happy by Party Identification and Family Income
28
44 45
52
23 23
30
41
19
28 28
38
0
10
20
30
40
50
60
70
80
90
100
Under $30K $30K to under $50K $50K to under $75K $75K and over
Republican Democrat Independent
Republicans are more likely to be very happy than Democrats or independents among those with incomes of $30,000 and over. Among the less affluent (under $30,000) Republicans are not significantly happier than Democrats or independents.
15
At First Look, Conservatives Happier Than Liberals Percentage Very Happy by Political Ideology
40
33
27
0
10
20
30
40
50
60
70
80
90
100
Conservative Moderate Liberal
Conservatives are happier than moderates or liberals but this relationship is largely explained by party identification.

16
Partisan Differences, Not Ideology, Predict Happiness Percentage Very Happy by Party Identification and Ideology
4745
2931
28
0
10
20
30
40
50
60
70
80
90
100
ConservRepublican
Mod/LiberalRepublican
Independent Conserv/ ModDemocrat
LiberalDemocrat
Even after controlling for ideology, Republicans are happier than Democrats.

17
Catholics Who Attend Church More Frequently Are Happier Percentage Very Happy Among Catholics
Among Catholics
38
28
0
10
20
30
40
50
60
70
80
90
100
Attend weekly or more Attend less often
Catholics who attend church at least weekly are more likely to be very happy than are Catholics who attend services less often. This association between church attendance and happiness also occurs among other religious groups surveyed.

18
White Evangelicals Happier Than Mainline Protestants Percentage Very Happy Among White Protestants
43
33
0
10
20
30
40
50
60
70
80
90
100
White Evangelical Protestant White Mainline Protestant
White evangelical Protestants are happier than mainline Protestants but this difference is largely explained by differences in church attendance. White Protestant (evangelical or mainline) includes any ethnicity.
19
Both White Mainline and Evangelical Protestants Who Go To Church Are Happier Percentage Very Happy by White Protestant and Church Attendance
49
31
44
35
0
10
20
30
40
50
60
70
80
90
100
Attend weekly or more Attend monthly or less
White Evangelical Protestant White Mainline Protestant
White evangelical and mainline Protestants who attend church at least weekly are not significantly different on happiness; both groups are happier than those who attend services less often. White Protestant (evangelical or mainline) includes any ethnicity.

20
How Income and Church Attendance Affects Happiness Percentage Very Happy by Church Attendance and Family Income
50
3735
21
0
10
20
30
40
50
60
70
80
90
100
Attend weekly andIncome $50K+
Attend weekly andIncome <$50K
Attend less oftenand Income $50K+
Attend less oftenand Income <$50K
Those with higher family incomes are happier than those with lower incomes. Similarly, those who attend religious services at least weekly are happier than less frequent attenders. Half of those holding both of these characteristics are very happy, while only about a fifth (21%) of those with neither characteristic are very happy.

21
Marriage Works for Both Genders Percentage Very Happy by Gender and Marital Status
43
24
43
24
0
10
20
30
40
50
60
70
80
90
100
Married UnmarriedMen Women
Being married is associated with happiness for both men and women.

22
Marital Happiness Gap Holds Across Age Groups Percentage Very Happy by Age and Marital Status
45
21
44
22
40
21
44
34
0
10
20
30
40
50
60
70
80
90
100
Married Unmarried18-29 30-49 50-64 65 and older
Being married is associated with happiness for both younger and older Americans, but the effect is not as great for those ages 65 and older.

23
At First Blush, Parents Are More Likely to be Happy Percentage Very Happy by Parental Status
3735
29
0
10
20
30
40
50
60
70
80
90
100
Have kids under 18 Have kids 18+ only Have no kids
Parents are more likely to be very happy than those without children. But this association goes away once marital status is considered.

24
Marriage Trumps Parenting as a Predictor of Happiness Percentage Very Happy by Parental and Marital Status
44
19
41
26
43
25
0
10
20
30
40
50
60
70
80
90
100
Married UnmarriedKids under 18 Kids 18+ only No kids
Married people are more likely than those not married to be very happy, regardless of whether they have children. Single parents of minors are least likely to say they are very happy with their life.

25
Blacks Less Happy Than Whites and Hispanics Percentage Very Happy by Race, Ethnicity
36
28
34
0
10
20
30
40
50
60
70
80
90
100
White Black Hispanic
Blacks are less likely to be very happy than whites or Latinos. Hispanics are of any race. Interviews were conducted in English and Spanish. White includes only non-Hispanic whites.

26
For Blacks, Money Doesn't Predict Happiness Percentage Very Happy by Race and Family Income
42
2828 27
0
10
20
30
40
50
60
70
80
90
100
White Black
$50K or more Less than $50K
Affluent whites are more likely to be very happy than are less affluent whites. Among blacks, however, there is no difference in happiness by family income. White includes only non-Hispanic whites.

27
Men and Women About Equally Happy Percentage Very Happy by Gender
33 35
0
10
20
30
40
50
60
70
80
90
100
Female Male
28
Young Adulthood May be Idealized But It's Not Happier Percentage Very Happy by Age
28
3633
38
0
10
20
30
40
50
60
70
80
90
100
18-29 30-49 50-64 65 and older
There are modest differences in happiness by age. Adults under 30 are less likely to be very happy.

29
Young Men Least Happy Percentage Very Happy by Gender and Age
2630
37 3636
30
4137
0
10
20
30
40
50
60
70
80
90
100
Men Women18-29 30-49 50-64 65 and older
Young men are less likely to be very happy than other men. Among women, there are smaller differences in happiness ratings by age. Women ages 18-29 are less likely to be very happy than women in older age groups, but the differences are not statistically significant.

30
Health and Happiness Go Hand in Hand Percentage Very Happy by How They Rate Their Personal Health
48
32
22
15
0
10
20
30
40
50
60
70
80
90
100
Excellent Good Only fair Poor

31
College Grads Happier Percentage Very Happy by Education
3033
42
0
10
20
30
40
50
60
70
80
90
100
H.S. or less Some college College grad

32
Retirement No Guarantee of Happiness Percentage Very Happy by Employment Status
35
26
36
0
10
20
30
40
50
60
70
80
90
100
Employed Not employed Retired
Retirees and the employed are about equally likely to be very happy; those not employed are less likely to be very happy.

33
Differences in Happiness by Employment Status Hold for Men But Not Women Percentage Very Happy by Gender and Employment Status
37
16
363430
35
0
10
20
30
40
50
60
70
80
90
100
Employed Not employed Retired
Men Women
Working men and women are about equally likely to be very happy, as are retired men and women. However, women not working for pay are much more likely to be very happy than men in that situation.
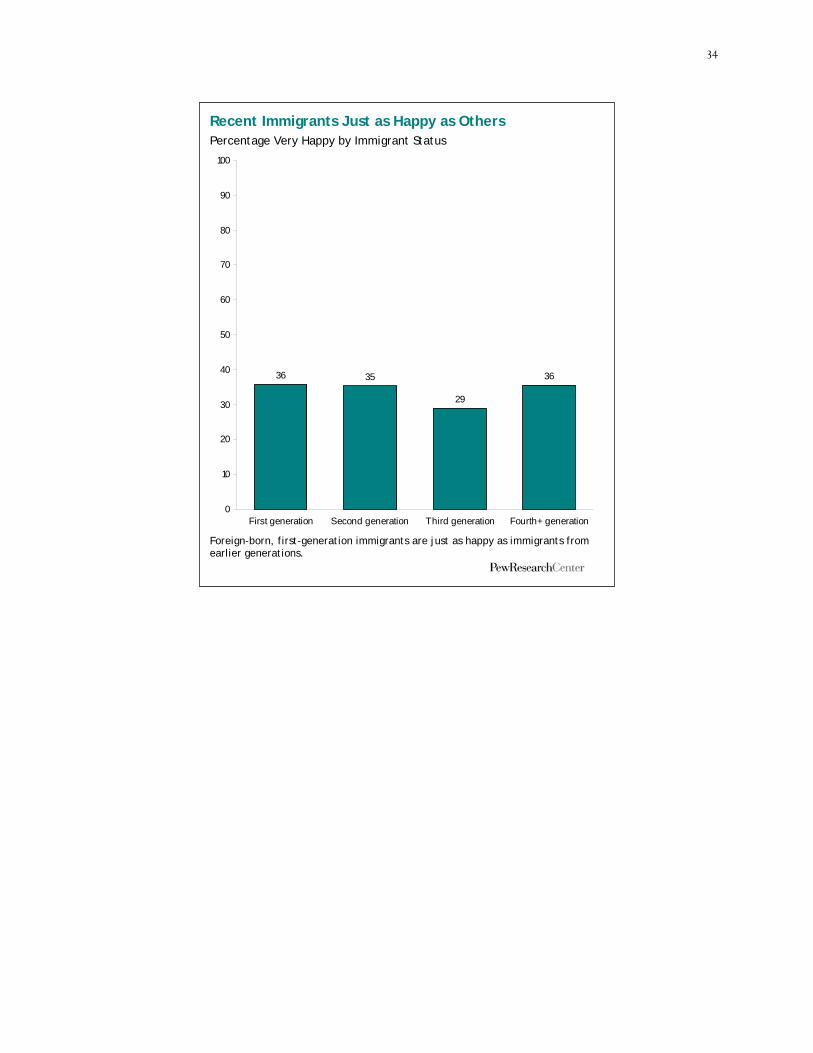
34
Recent Immigrants Just as Happy as Others Percentage Very Happy by Immigrant Status
36 35
29
36
0
10
20
30
40
50
60
70
80
90
100
First generation Second generation Third generation Fourth+ generation
Foreign-born, first-generation immigrants are just as happy as immigrants from earlier generations.

35
More Rushed, Less Happy Percentage Very Happy by Feeling Rushed in Daily Life
27
34
42
0
10
20
30
40
50
60
70
80
90
100
Always Sometimes Almost never
Those who always feel rushed are less likely to be very happy; those who almost never feel rushed are the most likely to be very happy.

36
Suburbs No Great Mecca of Happiness Percentage Very Happy by Location
31
3634
0
10
20
30
40
50
60
70
80
90
100
Urban Suburban Rural
Suburbanites are only slightly more likely to say they are very happy than are those who live in cities. Suburan and rural residents are not significantly different on happiness.

37
Sunbelt Residents Are Happier Percentage Very Happy by Area of Residence
37
32
0
10
20
30
40
50
60
70
80
90
100
Sunbelt Not Sunbelt
Those living in the sunbelt are happier, on average, than those elsewhere in the nation. U.S. Census definition of sunbelt includes 9 counties in CA, 1 county in NV, and all of NC, SC, GA, FL, AL, MS, LA, TN, AR, OK, TX, NM, AZ

38
Pets Make Little Difference in Happiness Percentage Very Happy by Pet Ownership
3335 35 36
0
10
20
30
40
50
60
70
80
90
100
No pet Any pet Dog owner Cat owner
Pet owners are about equally likely to be very happy as those without pets of any kind. Looking just at pet owners who have a dog or cat tells the same story; both groups are about equally likely to say they are very happy. Dog owner and cat owner are not mutually exclusive categories.
39
Whites Least Unhappy Percentage Not Too Happy by Race and Ethnicity
12
23 23
0
10
20
30
40
50
60
70
80
90
100
White Black Hispanic
Whites are only about half as likely as blacks or Hispanics to say that they are "not too happy." Hispanics are of any race. Interviews were conducted in English and Spanish. White includes only non-Hispanic whites.

40
Unhealthy, Unhappy Percentage Not Too Happy by How They Rate Their Personal Health
6
11
24
55
0
10
20
30
40
50
60
70
80
90
100
Excellent Good Only fair Poor
Most people who say their health is poor also say they are "not too happy."

41
Single Parents Most Unhappy Percentage Not Too Happy by Parental and Marital Status
8
27
13
21
1014
0
10
20
30
40
50
60
70
80
90
100
Married UnmarriedKids under 18 Kids 18+ only No kids
Single parents with children under age 18 are most likely to be "not too happy."