Morphofunctional State and Circadian Rhythms of the Liver ...
27
International Journal of Molecular Sciences Article Morphofunctional State and Circadian Rhythms of the Liver under the Influence of Chronic Alcohol Intoxication and Constant Lighting Maria A. Kozlova 1 , Yuri A. Kirillov 1 , Lyudmila A. Makartseva 1 , Igor Chernov 2 and David A. Areshidze 1,3, * Citation: Kozlova, M.A.; Kirillov, Y.A.; Makartseva, L.A.; Chernov, I.; Areshidze, D.A. Morphofunctional State and Circadian Rhythms of the Liver under the Influence of Chronic Alcohol Intoxication and Constant Lighting. Int. J. Mol. Sci. 2021, 22, 13007. https://doi.org/10.3390/ ijms222313007 Academic Editor: Akiko Kojima-Yuasa Received: 26 October 2021 Accepted: 29 November 2021 Published: 30 November 2021 Publisher’s Note: MDPI stays neutral with regard to jurisdictional claims in published maps and institutional affil- iations. Copyright: © 2021 by the authors. Licensee MDPI, Basel, Switzerland. This article is an open access article distributed under the terms and conditions of the Creative Commons Attribution (CC BY) license (https:// creativecommons.org/licenses/by/ 4.0/). 1 Laboratory of Cell Pathology, A.P. Avtsyn Research Institute of Human Morphology, 117218 Moscow, Russia; [email protected] (M.A.K.); [email protected] (Y.A.K.); [email protected] (L.A.M.) 2 Department of Pathological Anatomy, Tyumen State Medical University, 625023 Tyumen, Russia; [email protected] 3 Experimental Tumor Chemotherapy Group, Center for Screening and Preclinical Testing, Institute of Problems of Chemical Physics of the Russian Academy of Science, 142432 Chernogolovka, Russia * Correspondence: [email protected]; Tel.: +7-909-643-37-56 Abstract: A study of the influence of chronic alcohol intoxication, constant illumination and their combined effects on the morphofunctional state of the rat liver and the circadian rhythms (CR) of the studied parameters of the organism was carried out. It was found that both alcohol and constant illumination caused significant changes in the structure of the liver, as well as in the circadian rhythmicity of micromorphometric parameters of hepatocytes, ALT, and total and direct bilirubin rhythms; however, the combined effects of ethanol and constant illumination had the most significant effect on the studied parameters of the organism. These two factors caused disturbances in the circadian rhythms of the micromorphometric parameters of hepatocytes, disruption of the circadian rhythms of total protein, albumin, AST, ALT, and direct and total bilirubin, as well as disturbances in the expression and rhythmicity of the studied clock genes against a background of the development of an inflammatory process in the liver. Keywords: alcohol; liver; hepatocyte; circadian rhythm 1. Introduction Alcohol abuse is one of the most important health and social problems in modern society. Furthermore, the liver is one of the organs most significantly affected by alcohol intoxication. Systematic alcohol consumption leads to disruption of the structure and function of the liver, which, in turn, alters the metabolism of other organs. Alcoholic liver disease (ALD) include several sequential clinical and morphological forms, which are stages of a single pathological process caused by prolonged alcohol use [1,2]. The rhythmicity of vital processes, which is one of the fundamental properties of living matter, includes periodic changes and the integration of various processes specific to biological systems at different levels of organization [3]. For biological processes, rhythms with different frequencies from fractions of a second to tens of years are described, but one of the most significant types of biorhythms in mammals, including humans, are diurnal or circadian rhythms (CR) [4,5]. The separate CRs of distinct biological processes in the various organ systems form a precisely coordinated ensemble—the chronostructure of the organism. The presence of an organized rhythmic structure of biological processes provides the necessary order of their occurrence, which determines the maintenance of the functioning of body systems at an optimal level [6–9]. The coordination of mammalian CRs is genetically determined, but at the same time, it is plastically modulated under the influence of periodic factors in the external and internal environment—synchronizers, or pacemakers [10,11]—the leading role of which Int. J. Mol. Sci. 2021, 22, 13007. https://doi.org/10.3390/ijms222313007 https://www.mdpi.com/journal/ijms
-
Upload
khangminh22 -
Category
Documents
-
view
0 -
download
0
Transcript of Morphofunctional State and Circadian Rhythms of the Liver ...

International Journal of
Molecular Sciences
Article
Morphofunctional State and Circadian Rhythms of the Liverunder the Influence of Chronic Alcohol Intoxicationand Constant Lighting
Maria A. Kozlova 1, Yuri A. Kirillov 1, Lyudmila A. Makartseva 1, Igor Chernov 2 and David A. Areshidze 1,3,*
�����������������
Citation: Kozlova, M.A.; Kirillov,
Y.A.; Makartseva, L.A.; Chernov, I.;
Areshidze, D.A. Morphofunctional
State and Circadian Rhythms of the
Liver under the Influence of Chronic
Alcohol Intoxication and Constant
Lighting. Int. J. Mol. Sci. 2021, 22,
13007. https://doi.org/10.3390/
ijms222313007
Academic Editor:
Akiko Kojima-Yuasa
Received: 26 October 2021
Accepted: 29 November 2021
Published: 30 November 2021
Publisher’s Note: MDPI stays neutral
with regard to jurisdictional claims in
published maps and institutional affil-
iations.
Copyright: © 2021 by the authors.
Licensee MDPI, Basel, Switzerland.
This article is an open access article
distributed under the terms and
conditions of the Creative Commons
Attribution (CC BY) license (https://
creativecommons.org/licenses/by/
4.0/).
1 Laboratory of Cell Pathology, A.P. Avtsyn Research Institute of Human Morphology, 117218 Moscow, Russia;[email protected] (M.A.K.); [email protected] (Y.A.K.);[email protected] (L.A.M.)
2 Department of Pathological Anatomy, Tyumen State Medical University, 625023 Tyumen, Russia;[email protected]
3 Experimental Tumor Chemotherapy Group, Center for Screening and Preclinical Testing, Institute ofProblems of Chemical Physics of the Russian Academy of Science, 142432 Chernogolovka, Russia
* Correspondence: [email protected]; Tel.: +7-909-643-37-56
Abstract: A study of the influence of chronic alcohol intoxication, constant illumination and theircombined effects on the morphofunctional state of the rat liver and the circadian rhythms (CR) of thestudied parameters of the organism was carried out. It was found that both alcohol and constantillumination caused significant changes in the structure of the liver, as well as in the circadianrhythmicity of micromorphometric parameters of hepatocytes, ALT, and total and direct bilirubinrhythms; however, the combined effects of ethanol and constant illumination had the most significanteffect on the studied parameters of the organism. These two factors caused disturbances in thecircadian rhythms of the micromorphometric parameters of hepatocytes, disruption of the circadianrhythms of total protein, albumin, AST, ALT, and direct and total bilirubin, as well as disturbances inthe expression and rhythmicity of the studied clock genes against a background of the developmentof an inflammatory process in the liver.
Keywords: alcohol; liver; hepatocyte; circadian rhythm
1. Introduction
Alcohol abuse is one of the most important health and social problems in modernsociety. Furthermore, the liver is one of the organs most significantly affected by alcoholintoxication. Systematic alcohol consumption leads to disruption of the structure andfunction of the liver, which, in turn, alters the metabolism of other organs. Alcoholic liverdisease (ALD) include several sequential clinical and morphological forms, which arestages of a single pathological process caused by prolonged alcohol use [1,2].
The rhythmicity of vital processes, which is one of the fundamental properties ofliving matter, includes periodic changes and the integration of various processes specific tobiological systems at different levels of organization [3]. For biological processes, rhythmswith different frequencies from fractions of a second to tens of years are described, but oneof the most significant types of biorhythms in mammals, including humans, are diurnalor circadian rhythms (CR) [4,5]. The separate CRs of distinct biological processes in thevarious organ systems form a precisely coordinated ensemble—the chronostructure ofthe organism. The presence of an organized rhythmic structure of biological processesprovides the necessary order of their occurrence, which determines the maintenance of thefunctioning of body systems at an optimal level [6–9].
The coordination of mammalian CRs is genetically determined, but at the same time,it is plastically modulated under the influence of periodic factors in the external andinternal environment—synchronizers, or pacemakers [10,11]—the leading role of which
Int. J. Mol. Sci. 2021, 22, 13007. https://doi.org/10.3390/ijms222313007 https://www.mdpi.com/journal/ijms

Int. J. Mol. Sci. 2021, 22, 13007 2 of 27
is played by the light cycle. Violation of the normal rhythm (changes in the amplitudeand/or phase characteristics of the rhythm) of the vital processes of an organism causesthe appearance of desynchronosis, which can lead to the development of diseases andpathological conditions [12–16].
To date, it has been established that most of the CRs of the liver, as in other organs,are autonomous in the absence of the influence of external pacemakers. In hepatocytes,the biological clock at the molecular level, which ensures CR autonomy, includes the Bmalgene paired with the Clock gene, the Per gene family (Per1, Per2, Per3), and the Cry genes(Cry1, Cry2, encoding cryptochrome proteins) [17,18]. It has been shown that the rhythmof expression of clock genes persists in the dark, but also that a number of rhythms canbe destroyed [19,20]. It has been proven that the main function of changes in light anddarkness, as a pacemaker, is to influence the CR period and the amplitude, gene expression,and harmonization of rhythms with each other [21].
The main drivers of circadian rhythms in mammals are the suprachiasmatic nuclei ofthe hypothalamus (SCN). From the outside, the rhythm-organizing function of the SCN ismodulated by environmental time setters, the main of which is light. In addition, correctionof the functional state of pacemakers in the brain and beyond is carried out by variousneurotransmitters and hormones. The leading role in the external regulation of liver CRsbelongs to the hypothalamus–pituitary–adrenal axis and the pineal gland [22]. Anothertime setter that determines the CR structure of a number of organs, including the liver,is feeding. Metabolic processes easily get out of control of the SCN when food intakeis desynchronized with normal daily activity. In this situation, mealtime (feeding time)becomes the dominant control factor [23–25].
A significant factor in the disorganization of biorhythms in the modern world is so-called light pollution, which causes a disruption of the light–dark cycle. For many reasonsof social origin (overtime and shift work, prolonged interaction with digital equipment,transmeridian flights, etc.), a modern person is almost inevitably exposed to abundantexposure to artificial lighting at night, which often leads to the development of desyn-chronosis [26]. At present, the effect of light at night on CRs is well described. It hasbeen established that light pollution, provoking desynchronosis, can be one of the causesof a number of pathologies [27]. It was shown that changes in lipid and carbohydratemetabolism correlate with the level of light pollution [28,29], disruptions of the light cycleare one of the possible preconditions for the occurrence of metabolic syndrome and canincrease the risk of developing type 2 diabetes mellitus and atherosclerosis [16,30]. There isevidence that changes caused by chronic desynchronosis can lead to the development ofmalignant liver tumors [31,32].
Likewise, ethanol has a pronounced chronodestructive effect on the CRs of organismsthat largely determines increases in the susceptibility of the gastrointestinal tract and liverto alcohol-induced damage and makes a significant contribution to the severity of alcoholpathology [33–37]. As such, in alcoholism, CR synchronization disorders are one of thefirst symptoms [38,39].
A large amount of data [35,40] has shown that Clock- and Per2-knockout mice developalcohol-induced steatosis, fibrosis, and cirrhosis of the liver much faster than controls. Inturn, inflammation and cytokines, being two of the key components of the pathogenesisof alcoholic liver damage [41,42], can also disrupt the normal functioning of circadiangenes [43,44].
Nevertheless, the literature available to us does not describe the effects of the jointimpact of chronic alcohol intoxication (CAI) and constant lighting both on the structure ofthe liver and on its CRs, although both of these factors are chrono-destructive and affectthe morphofunctional integrity of this organ. Based on this, we conducted a study of theeffect of constant illumination, 21-day alcohol intoxication and the combined influence ofthese factors on the structure, function and some CRs of the liver.
The modification of morphological state of hepatocytes, which has a wide rangeof variations, is a reflection of their functional changes [45]. The linear dimensions of
Int. J. Mol. Sci. 2021, 22, 13007 3 of 27
hepatocytes and their nuclei, their nuclear–cytoplasmic ratio, a number of other micromor-phometric parameters, as well as some biochemical and immunohistochemical parameters,are significant indicators for assessing the state of the liver [46].
2. Results2.1. Influence of Constant Lighting and CAI on the Morphofunctional Condition of the Liver
The morphological pattern of the liver in the rats of the control group correspondedto the age norm, i.e., the liver had a preserved structure of hepatic cords, composedof polygonal hepatocytes with a rounded, centrally located nucleus without signs ofdystrophic changes and necrosis (Figure 1A). In the liver of rats in the first experimentalgroup, a significant number of vacuole-containing hepatocytes were found (Figure 1B).The control staining with Sudan-III verified the presence of lipid drops in the cytoplasm ofthe hepatocytes in this group, which indicates the beginning of the development of fattydegeneration of the liver. At the same time, in this group, we observe both single cells andgroups of hepatocytes in a state of necrosis and apoptosis (Figure 2A).
Figure 1. Cont.

Int. J. Mol. Sci. 2021, 22, 13007 4 of 27
Figure 1. Liver of rats: (A)—Control; (B)—EtOH; (C)—CL; (D–F)—EtOH + CL; (G)—EtOH + CL, arrows indicate theMallory–Denk bodies; (H)—EtOH + CL, Hematoxylin–eosin staining. (A–C,E–H)×400, (D)×200. Note: hereafter, Control—control group, EtOH—first experimental group, CL—second experimental group, EtOH + CL—third experimental group.
Figure 2. Livers of rats: (A)—Control; (B)—EtOH + CL. Arrows show the cells in conditions of: A—apoptosis; N—necrosis.Hematoxylin–eosin staining, ×1000.
The livers of rats of the second experimental group retained a practically normalstructure, but single necrotic hepatocytes appeared in them, as well as cells with signs of

Int. J. Mol. Sci. 2021, 22, 13007 5 of 27
fatty degeneration, in which the presence of small lipid-containing vacuoles was noted(Figure 1C).
In the livers of rats of the third experimental group, a pattern representative of thedevelopment of alcoholic hepatitis was revealed (Figure 1D–F); inclusions of lipofuscinand Mallory–Denk bodies were also found (Figure 1G,H). Numerous necrotic cells werenoted, as well as cells in the process of apoptosis (Figure 2B), and infiltrates consistingof neutrophilic leukocytes, lymphocytes and macrophages. A significant portion of thehepatocytes were in a state of small- and large-droplet fatty degeneration (Figure 3). Thecord structure of the organ was violated, and the small monomorphic regenerate nodes(false lobules), separated by narrow layers of connective tissue, were revealed.
Figure 3. Lipid-containing vacuoles in the hepatocytes. EtOH + CL. Sudan-III staining with hema-toxylin afterstain, ×200.
The results of the karyometry showed that the perimeters of the hepatocyte nuclei,as well as their cross-sectional areas and volumes in the first and second experimentalgroups largely corresponded to the parameters of the control group; however, in the thirdexperimental group, there was a significant decrease in these parameters as compared tothe controls, and the ratio of the nucleus volume to the area was also significantly reduced(Table 1)—at the same time, the NCR values in this group were significantly lower than inthe first group, and were the lowest in the second group.
Table 1. Results of the micromorphometric study of hepatocytes of rats.
Control EtOH CL EtOH + CL
Cross-sectionalarea of nucleus,
µm241.79 ± 8.13 42.65 ± 4.80 42.72 ± 5.63 35.50 ± 3.01 ***
Volume ofnuclei, µm3 205.90 ± 59.54 210.51 ± 35.39 211.30 ± 41.67 159.59 ± 20.23 **
Nucleusvolume to
nucleus arearatio (V/A
coefficient)
4.84 ± 0.47 4.90 ± 0.27 4.90 ± 0.32 4.48 ± 0.19 ***
Perimeter ofnuclei, µm 14.96 ± 4.78 15.34 ± 4.78 15.11 ± 3.39 9.59 ± 2.49

Int. J. Mol. Sci. 2021, 22, 13007 6 of 27
Table 1. Cont.
Control EtOH CL EtOH + CL
Mean diameterof nuclei, µm 7.25 ± 0.91 7.34 ± 0.89 7.77 ± 0.75 ** 7.17 ± 0.76
Elongationindex of nuclei 1.23 ± 0.06 1.22 ± 0.08 1.14 ± 0.05 *** 1.19 ± 0.07
Coefficient ofform 2.35 ± 0.11 2.28 ± 0.15 2.35 ± 0.11 4.85 ± 0.17 *
Contour index 2.31 ± 0.10 2.35 ± 0.13 2.31 ± 0.11 1.61 ± 0.18 ***
Cross-sectionalarea of cell, µm2 185.80 ± 31.95 190.10 ± 34.03 261.90 ± 55.30
*** 184.80 ± 21.67
Volume of cell,µm3 1926.01 ± 486.21 1994.02 ± 510.02 3317.21 ± 818.81
*** 1898.25 ± 326.85
NCR 0.230 ± 0.056 0.233 ± 0.055 0.162 ± 0.022 *** 0.194 ± 0.018 **
Proportion ofbinuclear
hepatocytes, %7.44 ± 2.66 8.92 ± 3.60 4.73 ± 2.03 ** 6.51 ± 2.56
Note: hereafter, * p ≤ 0.05; ** p ≤ 0.005; *** p ≤ 0.0005—statistical significance of differences in comparison withthe control group.
The value of the mean diameter of the nuclei of hepatocytes, on the contrary, wassignificantly higher in the second group in comparison to the control parameters— whichalso indicates a change in the elongation index and shape of the nuclei.
While constant illumination (second group) led to a significant increase in the cross-sectional area of hepatocytes, a significant number of small cells were detected in the liverunder the combined effect of ethanol and constant illumination (third group), which wasmanifested by a decrease in the mean cross-sectional area of the hepatocytes in comparisonto the second group, to values close to those of the control group. In the third group,changes were noted only in terms of the parameters of the shape of nuclei (contour index,coefficient of form), while the values of their diameters and elongation indices wereidentical to those of the control group. Changes in the proportion of binuclear cells werestatistically significant only in the livers of animals in the second group.
2.2. Study of the Diurnal Dynamics of Cross-Sectional Areas of Nuclei, Areas of Cells, and NCR
When considering the daily dynamics of the studied parameters, it was found that theysignificantly differed in the experimental groups from the control parameters (Figures 4–6).
Figure 4. Daily dynamics of area of nuclei of hepatocytes of rats.

Int. J. Mol. Sci. 2021, 22, 13007 7 of 27
Figure 5. Daily dynamics of area of hepatocytes in rats.
Figure 6. Daily dynamics of NCR in hepatocytes of rats.
The results of the cosinor analysis (Table 2) indicated the presence of a reliable circadianrhythm in the parameters of the area of the nuclei, the area of the cell and the NCR in thehepatocytes of the rats in the control group. In the first experimental group, as a result ofthree weeks of alcohol intoxication, the CRs of the cell area and the NCR were destroyedand the rhythm of the nuclear area was shifted (Table 2).

Int. J. Mol. Sci. 2021, 22, 13007 8 of 27
Table 2. Cosinor analysis of the micromorphometric parameters of rat livers.
Area of Nuclei of Hepatocytes, µm2
Amplitude Acrophase
Control 10.03 1221
EtOH 3.73 1802
CL 4.60 1136
EtOH + CL No reliable CR
Area of Hepatocytes, µm2
Control 24.84 1013
EtOH No reliable CR
CL 40.02 1137
EtOH + CL 16.84 1009
NCR
Control 0.033 1401
EtOH No reliable CR
CL No reliable CR
EtOH + CL 0.017 1946
Constant lighting led to the destruction of the rhythm of the NCR and a significantshift in the rhythms of nuclei and cells (Table 2).
In the third experimental group, despite the disrupted rhythm of the nucleus area, therhythms of the cell area and the NCR were preserved (Table 2).
2.3. Influence of Constant Lighting and CAI on Several Biochemical Parameters
Analysis of glucose content in the blood plasma of rats allowed us to establish that,in animals of the first and second groups, the value of this parameter increased from7.10 ± 1.51 mmol/L in the control group to 9.11 ± 2.88 mmol/L and 8.26 ± 1.35 mmol/L,respectively—at the same time, in animals of the third group, the glucose content wasmuch lower: 5.70 ± 1.40 (Figure 7; Table 3).
Figure 7. Glucose content and activity of ALT and AST in the blood plasma of rats, * p < 0.05, ** p < 0.01, *** p < 0.001.
Int. J. Mol. Sci. 2021, 22, 13007 9 of 27
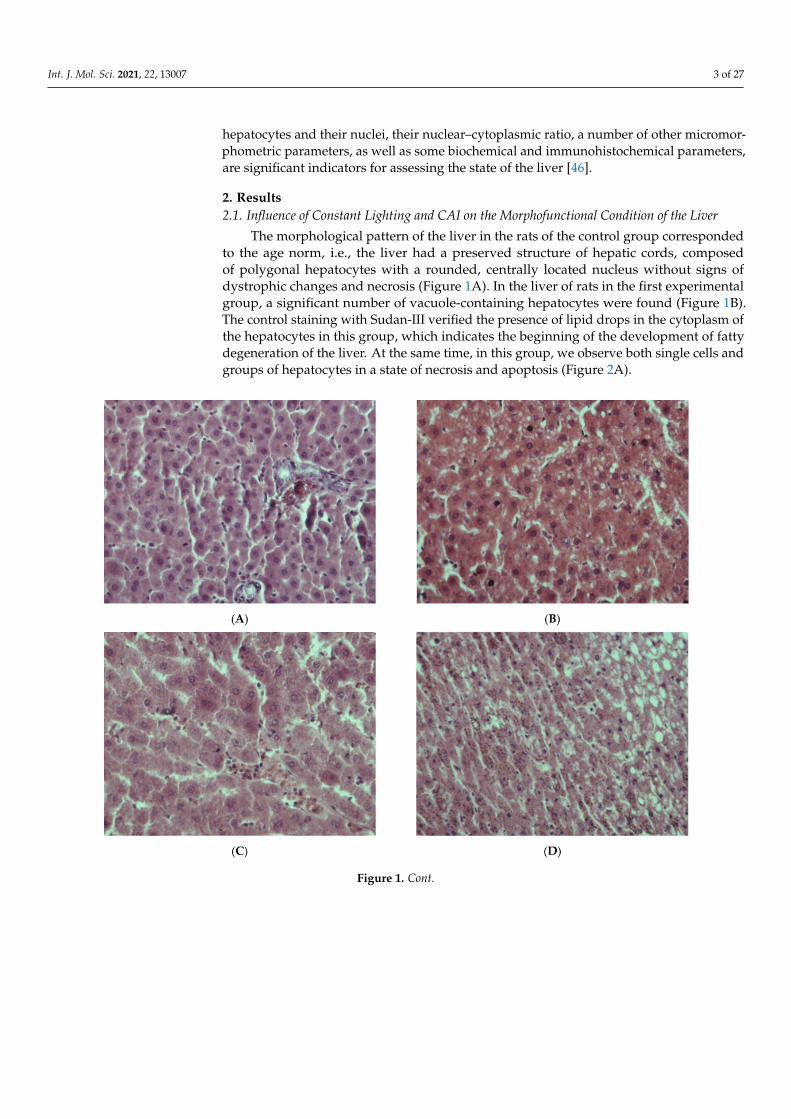
Table 3. Cosinor analysis of the biochemical parameters of rat livers.
Amplitude Acrophase
Glucose, mmol/L
Control 1308 1.50
EtOH 1432 2.06
CL 1206 0.70
EtOH + CL 1001 0.45
ALT, U/L
Control 208 0.80
EtOH No reliable CR
CL No reliable CR
EtOH + CL No reliable CR
AST, U/L
Control 1515 13.80
EtOH 1115 26.90
CL 2231 17.15
EtOH + CL No reliable CR
Total Protein, g/L
Control 1448 6.14
EtOH 1841 8.70
CL 1046 8.06
EtOH + CL No reliable CR
Albumin, g/L
Control 1416 9.57
EtOH 1319 3.47
CL 324 9.64
EtOH + CL No reliable CR
Direct Bilirubin, µmol/L
Control 148 3.48
EtOH No reliable CR
CL No reliable CR
EtOH + CL No reliable CR
Total Bilirubin, µmol/L
Control 2335 8.10
EtOH No reliable CR
CL No reliable CR
EtOH + CL No reliable CR
The value of ALT was almost unchanged in the first and third experimental groups,at 60.12 ± 9.93 U/L and 52.81 ± 10.00 U/L, respectively, against 60.16 ± 11.37 U/L inthe control group. The activity of ALT in the blood plasma of rats in the second groupincreased to 80.10 ± 10.50 U/L, which was higher than the values of all the other groups(Figure 7).

Int. J. Mol. Sci. 2021, 22, 13007 10 of 27
The activity of AST in the control group was 125.2± 27.90 U/L; in the second and thirdgroups it increased significantly to 151.80 ± 32.99 U/L and 153.1 ± 24.06 U/L, respectively.
The total protein content in the blood plasma of animals in the control group was68.55 ± 8.19 g/L; at the same time, in the blood plasma of rats in the experimental groups itwas lower: 59.71± 8.52 g/L in the first, 60.87± 8.22 g/L in the second and 61.96 ± 6.68 g/Lin the third group (Figure 8).
Figure 8. Total protein and albumin content in the blood plasma of rats, * p < 0.05, ** p < 0.01.
The albumin content decreased significantly only in the second group, at 29.17± 5.91 g/Lagainst 34.44± 8.80 g/L in the control group (Figure 8).
When analyzing the content of direct bilirubin, there were no significant differencesfrom the control level of 10.64± 3.33 µmol/L. Total bilirubin content increased significantlyin the blood of animals in the first and third groups, reaching levels of 30.15 ± 9.50 µmol/Lagainst 21.12 ± 9.16 µmol/L in the control group (Figure 9).
Figure 9. Content of direct and total bilirubin in the blood plasma of rats, * p < 0.05.

Int. J. Mol. Sci. 2021, 22, 13007 11 of 27
2.4. Influence of Constant Lighting and CAI on the Organization of the Circadian Rhythmsof Several Biochemical Parameters
Analysis of the daily rhythm of glucose allowed us to detect the presence of a maxi-mum level of this parameter at 15:00, with minimum values at 3:00 in the blood plasma ofrats in the control group. In animals of the first group, at a maximum at 21:00, the sameminimum was maintained. In the second group, the same extrema as in the control groupwere highlighted on the smoothed chronogram, and in the animals of the third group, themaximum fell at 9:00, with a minimum at 21:00 (Figure 10).
Figure 10. Daily fluctuations in blood glucose of rats.
The results of the cosinor analysis indicated the presence of reliable CRs for this parameterin animals of all groups. With sufficiently pronounced amplitude fluctuations, the acrophases ofthe rhythm occurred during the daytime in all groups (Table 3).
The diurnal rhythm of ALT in the blood plasma of rats in the control group showed itsmaximum at 9:00 and its minimum at 3:00. In animals of first group, the maximum value shiftedat 15:00, with the minimum at 9:00. The ALT rhythm in the second group was a little morepronounced than in the control, with the same extrema. In the blood plasma of rats of the thirdgroup, the maximum activity of the enzyme was noted at 15:00, and it was least active at 9:00(Figure 11).
Figure 11. Daily fluctuations in the activity of ALT in the blood plasma of rats.
Int. J. Mol. Sci. 2021, 22, 13007 12 of 27
The results of the cosinor analysis showed the presence of a reliable CR of activity ofALT in rats of the control group only.
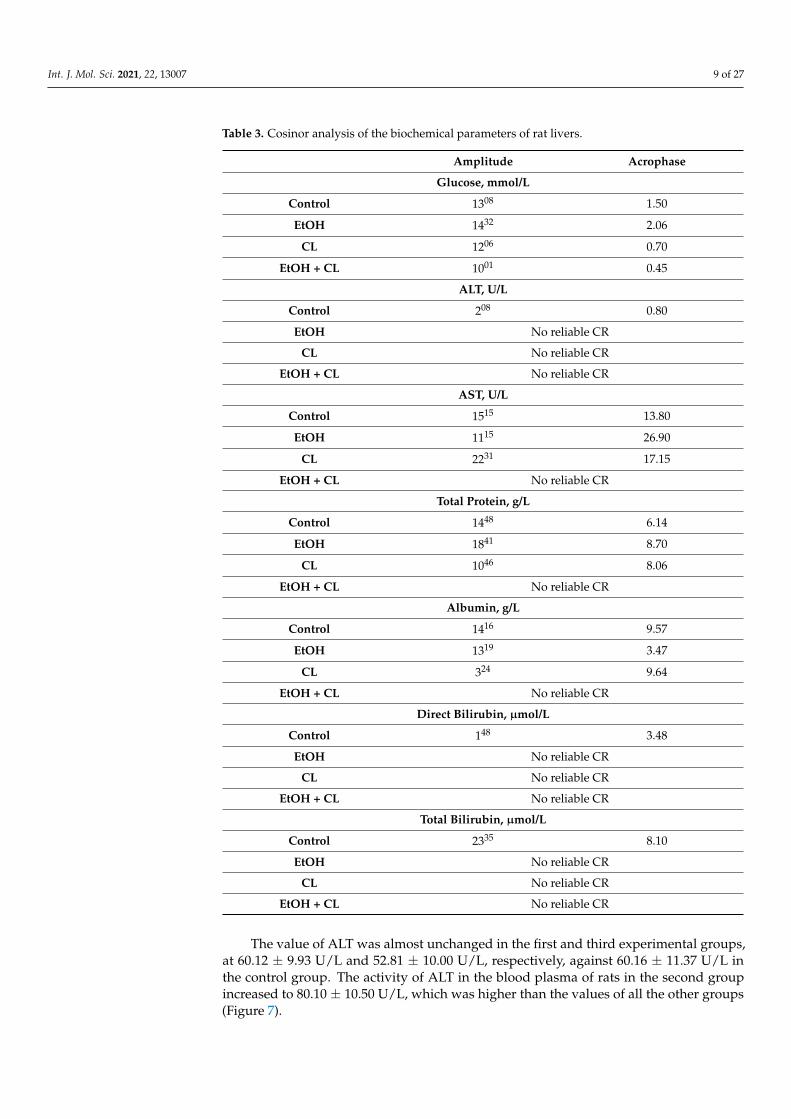
Analysis of the daily activity of AST in the blood of rats in the control group made itpossible to establish the presence of a maximum at 15:00 with a minimum at 9:00. In thefirst group, with the same maximum, the minimum point of the rhythm shifted at 3:00; inthe second group, with a maximum at 9:00, the minimum values were noted at 21:00; andthe chronogram of the third group was characterized by a maximum value at 9:00, and aminimum at 3:00 (Figure 12).
Figure 12. Daily fluctuations in the activity of AST in the blood plasma of rats.
Cosinor analysis showed the presence of a reliable CR of activity for AST in the controlgroup, and also in animals of the first and second control groups, which significantlydiffered from the control parameters.
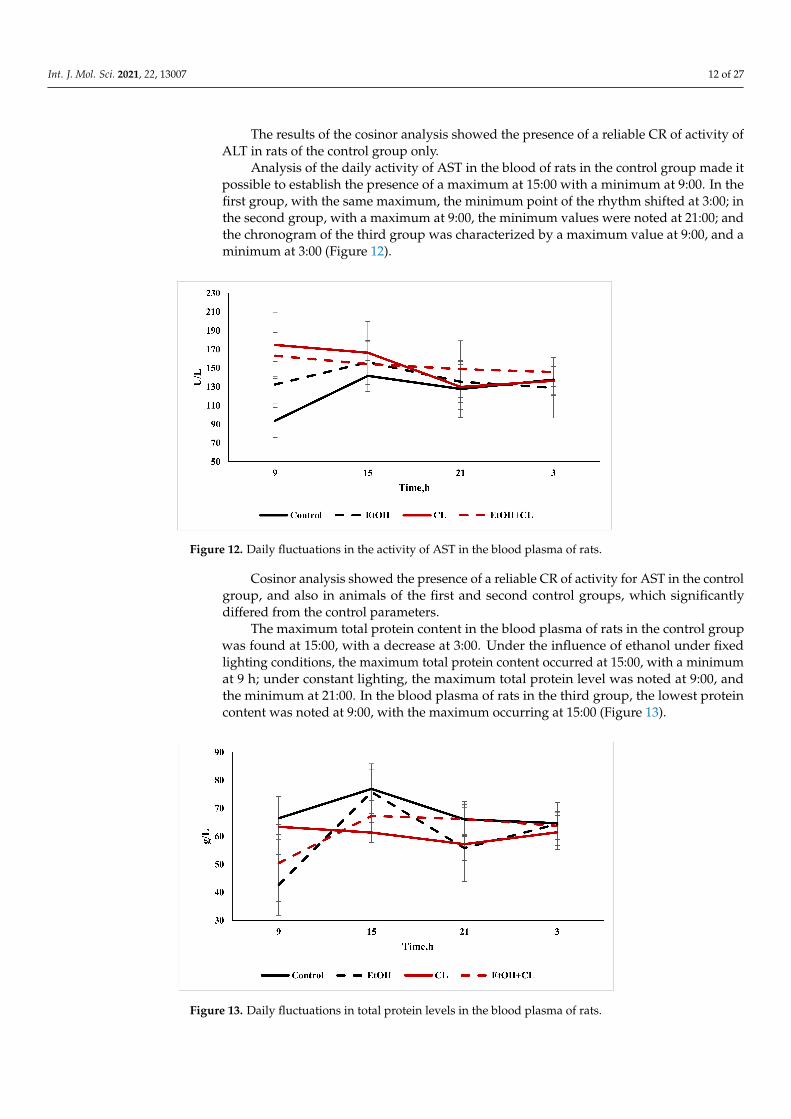
The maximum total protein content in the blood plasma of rats in the control groupwas found at 15:00, with a decrease at 3:00. Under the influence of ethanol under fixedlighting conditions, the maximum total protein content occurred at 15:00, with a minimumat 9 h; under constant lighting, the maximum total protein level was noted at 9:00, andthe minimum at 21:00. In the blood plasma of rats in the third group, the lowest proteincontent was noted at 9:00, with the maximum occurring at 15:00 (Figure 13).
Figure 13. Daily fluctuations in total protein levels in the blood plasma of rats.

Int. J. Mol. Sci. 2021, 22, 13007 13 of 27
Cosinor analysis made it possible to establish the CRs of the total protein levels,differing in their phase-amplitude characteristics, in each group—except for the third.
The maximum content of albumin in the control group was noted at 15:00; furthermore,its content decreased to a minimum at 3:00. In animals of the first group, with the samemaximum, the minimum albumin content was found at 21:00—while in the second group,the minimum level was noted at 9 h, with a maximum at 3:00. In the third group, with aminimum at 21:00, the levels of this protein increased significantly by 3:00 (Figure 14).
Figure 14. Daily fluctuations in albumin levels in the blood plasma of rats.
As in the case of total protein levels, the same CRs for albumin were found in thecontrol group and in the first and second experimental groups.
The maximum value of direct bilirubin content in the blood of control rats was foundat 21:00 and the minimum at 9:00. In the rats of the first group, with a maximum at 15:00,the decrease in bilirubin content to a minimum occurred at 3:00. In animals of the secondgroup, the maximum value of direct bilirubin content was also noted at 15:00, with aminimum at 3:00—but in rats of the third group on the other hand, the maximum occurredat 3:00, and the minimum at 15:00 (Figure 15).
Figure 15. Daily fluctuations of direct bilirubin content in the blood plasma of rats.
The results of the cosinor analysis made it possible to establish a reliable CR of directbilirubin in rats of the control group only.

Int. J. Mol. Sci. 2021, 22, 13007 14 of 27
Daily fluctuations in the level of total bilirubin in the blood plasma of rats in thecontrol group were characterized by a minimum at 9:00 and maximum values at 3:00. Inthe first and second groups, the rhythm was significantly smoothed—in the former witha maximum at 15:00 and a minimum at 21:00; in the latter, contrarily, the maximum wasnoted at 21:00, with a minimum at 15:00. In the third group, maximum values of totalbilirubin level were found at 3:00, and minimum values at 15:00 (Figure 16).
Figure 16. Daily fluctuations of total bilirubin in the blood plasma of rats.
According to the results of the cosinor analysis, a reliable CR for this parameter wasnoted in the control group only.
2.5. Influence of Constant Illumination and CAI on Gene Expression
Results of immunohistochemical studies testify that the proportion of Ki-67-positivecells significantly increased in the liver of rats in the third group. The intensity of p53expression was significantly higher than in the controls in the hepatocytes of rats fromall the experimental groups. At the same time, in animals of the experimental groups,the proportion of Bmal1-positive cells significantly decreased, but the number of cellsdisplaying Per2 expression increased. Expression of Adh5 significantly increased in theliver cells of animals in the first and third experimental groups (Table 4).
Table 4. Results of the immunohistochemical study on rat hepatocytes, * p < 0.05, ** p < 0.01,*** p < 0.001.
Control EtOH CL EtOH + CL
Ki67, % 1.0 ± 0.17 1.03 ± 0.5 1.35 ± 0.56 5.73 ± 0.35 ***
p53, % 2.2 ± 0.11 4.73 ± 0.14 *** 3.99 ± 0.13 ** 3.20 ± 0.12 **
Bmal1, % 60.76 ± 2.04 41.05 ± 2.06 *** 16.40 ± 1.32 *** 22.61 ± 1.15 ***
Per2, % 31.13 ± 1.68 46.37 ± 1.87 ** 40.01 ± 3.30 ** 39.60 ± 0.70 **
Adh5, % 5.28 ± 0.36 23.18 ± 1.30 *** 5.11 ± 0.4 33.55 ± 1.34 ***

Int. J. Mol. Sci. 2021, 22, 13007 15 of 27
2.6. Influence of Constant Lighting and CAI on the Organization of Circadian Rhythms for theExpression of Several Genes
When studying the diurnal dynamics of Ki-67 expression, we found that in the controlgroup, the maximum expression was observed at night, and the minimum in the daytime.In the hepatocytes of rats of the first experimental group, the maximum expression wasnoted at 9:00, and the minimum at 21:00. In the rats of the second group, showing the samemaximum, the minimum values were noted at 3:00. In the hepatocytes of animals of thethird group, the maximum expression of Ki-67 was noted at 15:00, and the minimum at3:00 (Figure 17).
Figure 17. Daily fluctuations in the expression of Ki-67 in rat hepatocytes.
The cosinor analysis made it possible to establish reliable CRs for Ki-67 expressionin the hepatocytes of rats of the control group and the first group, with pronouncedamplitude-phase differences between them (Table 4).
When considering the daily dynamics of p53 expression in the control and first experi-mental group, the maximum gene expression was found at 15:00, with a minimum at 9:00.In animals of the second group, the minimum occurs by 3:00, and in rats of the third group,with the same minimum at 3:00, the maximum values were noted in 9:00. Chronograms inthe last two groups are smoothed (Figure 18).
Figure 18. Daily fluctuations in the expression of p53 in rat hepatocytes.
Int. J. Mol. Sci. 2021, 22, 13007 16 of 27
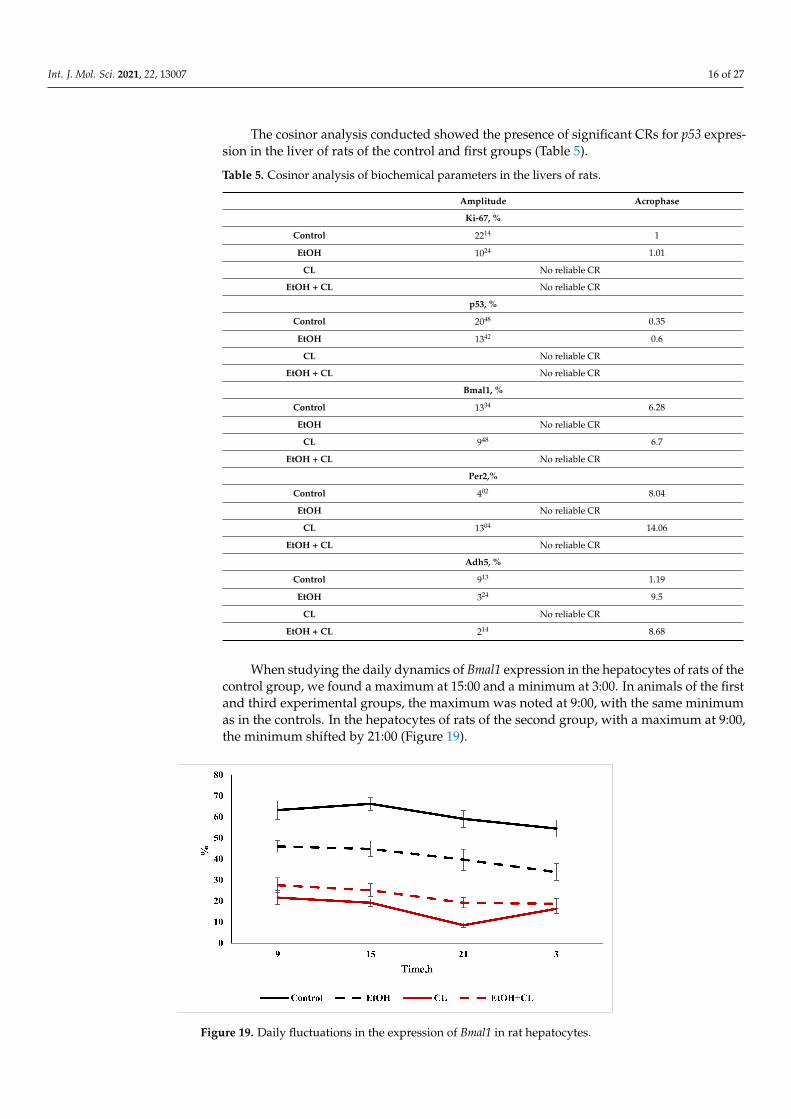
The cosinor analysis conducted showed the presence of significant CRs for p53 expres-sion in the liver of rats of the control and first groups (Table 5).
Table 5. Cosinor analysis of biochemical parameters in the livers of rats.
Amplitude Acrophase
Ki-67, %
Control 2214 1
EtOH 1024 1.01
CL No reliable CR
EtOH + CL No reliable CR
p53, %
Control 2048 0.35
EtOH 1342 0.6
CL No reliable CR
EtOH + CL No reliable CR
Bmal1, %
Control 1334 6.28
EtOH No reliable CR
CL 948 6.7
EtOH + CL No reliable CR
Per2,%
Control 402 8.04
EtOH No reliable CR
CL 1304 14.06
EtOH + CL No reliable CR
Adh5, %
Control 913 1.19
EtOH 324 9.5
CL No reliable CR
EtOH + CL 214 8.68
When studying the daily dynamics of Bmal1 expression in the hepatocytes of rats of thecontrol group, we found a maximum at 15:00 and a minimum at 3:00. In animals of the firstand third experimental groups, the maximum was noted at 9:00, with the same minimumas in the controls. In the hepatocytes of rats of the second group, with a maximum at 9:00,the minimum shifted by 21:00 (Figure 19).
Figure 19. Daily fluctuations in the expression of Bmal1 in rat hepatocytes.

Int. J. Mol. Sci. 2021, 22, 13007 17 of 27
At the same time, the results of the cosinor analysis showed the presence of reliableCRs for this parameter only in the hepatocytes of the animals of the control and the secondexperimental groups.
The daily rhythmicity of Per2 expression in the hepatocytes of intact animals wascharacterized by a maximum at 3:00 and a minimum at 15:00. In the liver of rats in thefirst experimental group, the maximum shifted by 21:00, and the minimum expression wasnoted at 9:00. In the animals of the second group, with a maximum at 15:00, the minimumwas displaced by 3:00, and in the third group, with a smooth rhythm, the maximum wasnoted at 3:00 and the minimum at 21:00 (Figure 20).
Figure 20. Daily fluctuations in the expression of Per2 in rat hepatocytes.
The cosinor analysis also showed the presence of reliable CRs for the expression ofPer2 in the control and second experimental groups.
In the hepatocytes of rats in the control and second experimental groups, daily fluctu-ations of Adh5 were extremely weak—the maximum expression in the controls was foundat 9:00, with a minimum at 21:00; in the second group, both extrema were shifted to theprevious time points. In the rats of the first experimental group, the maximum was notedat 3:00, and the minimum at 15:00; in the animals of the third group, the pattern of therhythm was opposite (Figure 21).
Figure 21. Daily fluctuations in the expression of Adh5 in rat hepatocytes.

Int. J. Mol. Sci. 2021, 22, 13007 18 of 27
According to the cosinor analysis, CRs for Adh5 expression were observed in the controlgroup, as well as in the hepatocytes of the animals of the first and third experimental groups.
3. Discussion
The analysis of pathomorphological changes in the liver allowed us to establish that thejoint influence of two factors—constant lighting and chronic alcoholic intoxication—leadsto significant alterations in the morphofunctional condition of the liver within three weeks.
In particular, if the influence of alcohol under a regime of alternating light and dark-ness provokes the occurrence of fatty degeneration of the liver, the same factor in combina-tion with constant illumination will lead to the development of hepatitis; in some animals,there were already signs characteristic of liver cirrhosis.
The mechanisms underlying the development and progression of liver pathologiesare not completely clear [47], but there are a number of common features in the patho-genesis of ALD and NAFLD [48]. The basis of alcoholic liver disease, as well as that ofNAFLD, which can be combined, is steatosis (fatty liver), which is considered a benignand reversible condition. The mechanism of transformation of steatosis into steatohepatitisincludes several pathogenetic links that are identical in both non-alcoholic and alcoholicliver damage. In the case of persistence of the damaging factor (in NAFLD, the state ofinsulin resistance), regeneration slows down and hepatocytes are replaced by an excessamount of extracellular matrix proteins, including fibrillar collagen—the distribution ofwhich depends on the damaging factor. NAFLD is characterized by a perihepatocellularcentrilobular fibrosis, while for ALD, a pericentral or perisinusoidal fibrosis is characteristic.Fibrosis can progress to septa and cirrhosis formation. In addition, it has been shown that inthe development of NAFLD, a disruption of the day/night cycle is one of the contributoryfactors [49].
The conducted study established that chronic alcohol intoxication under conditions ofa fixed light regime over three weeks does not provoke considerable changes in the studiedmicromorphometric parameters of hepatocytes, which is associated with the short-terminfluence of ethanol on the liver.
In the liver of rats in the second experimental group, there were significant deviationsin several parameters from the values of the control group (hypertrophy of hepatocytes,changes in diameters of nuclei, etc.).
According to some sources, hypertrophy of hepatocytes is observed in cases of poly-ploidization of nuclei and in the formation of binuclear cells; however, a decrease in theproportion of binuclear hepatocytes occurs in the liver of rats in this group, which indicatesa suppression of proliferative processes [50]. It has been shown [51] that melatonin has theability to activate the proliferation of hepatocytes by inhibiting IKKα, JNK1 and cJUN (c-JunN-terminal kinases), which oppress mitotic and apoptotic activity, and that the absence ofpineal melatonin causes a decrease in mitotic activity [52]. It is known that increases in thenumber of binuclear hepatocytes is one of the effects of melatonin [53].
At the same time, a number of researchers have suggested that some functions of di-and polyploid hepatocytes may differ. It has been found that diploid hepatocytes accelerateliver regeneration caused by resection and can accelerate compensatory regeneration afteracute injury, and that polyploid cells protect the organ from tumor initiation in hepatocel-lular carcinoma and promote adaptation to chronic damage [54–56]. Kreutzer C. [57] hasproposed the consideration of nuclear ploidy as a new factor in hepatocyte diversity andhas described various biological functions in polyploid and diploid hepatocytes.
In turn, an increase in the linear dimensions of hepatocytes after three weeks underconstant illumination is the result of an increase in their functional activity. Growth in thesize of hepatocytes can be an indicator of the activation of intracellular plastic processesthat increase the energy capabilities of cells. Such changes have been described for the liverunder conditions of chronic stress, such as the 21 day darkness deprivation.
Enhancements in the areas of hepatocytes are associated with an increase in levelsof stress hormones. Stimulation of α1-adrenoreceptors increases the nuclear volume of

Int. J. Mol. Sci. 2021, 22, 13007 19 of 27
hepatocytes and the density of nucleoli due to the release of intracellular Ca2+ and thesubsequent activation of DNA polymerase. In addition, endotoxins and TNFα increase thevolume of hepatocytes by activation of signaling pathways and retention of sodium andwater [58,59].
In turn, the development of small-drop fatty degeneration in hepatocytes under stress is adescribed phenomenon; it correlates with the duration of stress exposure [60,61], is associated withan increase in the level of adrenal cortex hormones—primarily glucocorticoids, which cause anincrease in the expression of serotonin 5-HT2A and 5-HT2B receptors and tryptophan hydroxylase1—as well as in the synthesis of serotonin [62]. The accumulation of lipid droplets by hepatocytesunder stress is accompanied by an increase in lipolysis gene expression and β-oxidation of fattyacids [63,64].
Increases in mean nuclear diameter, along with a simultaneous decrease in their elon-gation index and a tendency to increase in size, indicates the development of pathologicalchanges in the nuclei [65].
In hepatocytes of rats of the third experimental group, the deviations in the valuesof the studied karyometric parameters (a decrease in the cross-sectional area, perimeterand volume of the nuclei, a decrease in the NCR as well as in the ratio of the volumeof the nucleus to its area, and an increase in the proportion of binuclear hepatocytes)from the control parameters were more pronounced. At the same time, a decrease in thecontour index against the background of an increased coefficient of form indicated ongoingprocesses of nuclear decomposition, which were more pronounced than in the previousgroups—making it possible to identify them by previously described methods of lightmicroscopy [66].
In the hepatocytes of the animals in this group, a significant increase in the expressionof Ki-67 was noted. These data testify that the combined effect of two stress factors leads toan intensification of the proliferative process, i.e., reparative regeneration.
In turn, an increase in p53 expression in the hepatocytes of rats of all the experimentalgroups indicated an increase in the apoptotic activity of hepatocytes under the influenceof the studied factors [67]. Decreases in the expression of Bmal1 and increases in theexpression of its antagonist Per2 served as a confirmation of the chronodestructive effectsof both constant lighting and ethanol. It is natural that the expression of Adh5 was higherin the hepatocytes of rats that consumed ethanol.
As a result of the study, it was found that both alcohol intoxication and constantillumination cause significant changes in the structure of the CRs of the studied parameters,both as separate and combined actions. The CR of the area of the nucleus, although itchanges under the influence of ethanol and constant illumination, acting separately, isdisrupted only under the combined action of these two factors.
The most stable and least labile CR was the CR of the cell area. Being disrupted inthe liver of rats of the first experimental group, it was present in the second and thirdgroups, with characteristics close to the control group. The influence of alcohol manifesteditself differently in relation to this parameter, depending on the lighting regime—causingrhythm disruption under a fixed light regime, but not exerting the same effect underconstant lighting.
We did not find an explanation for this fact in the available literature. However, itcan be assumed that in the first experimental group, ethanol, influencing the pineal gland,causes a disturbance in the rhythm of the functioning of this organ—indirectly causingthe destruction of the CR of the cell area. In animals of the second and third experimentalgroups, under constant illumination, there was no production of pineal melatonin, but itcan be assumed that the role of pacemaker in this case was played by some other structureor process that does not depend on the action of ethanol and melatonin. This assumptionis supported by the closeness of the CR acrophases in these groups. Intracellular processesassociated with the regulation of the rhythms of the molecules that form the cytoskeletonof the cell can be proposed as candidates for this role. Thus, the maximum content of actinfibers in hepatocytes, and, accordingly, their largest sizes, was observed at 10:00 [68], and

Int. J. Mol. Sci. 2021, 22, 13007 20 of 27
the acrophases of the rhythms of hepatocyte sizes established by us were at 10:13 in thecontrol, 11:37 in the second and 10:09 in the third experimental groups.
It is noteworthy that the CRs of p53 and Ki-67 were observed only in the control groupand in animals of the first group, albeit with an altered rhythm. Thus, the leading role inthe destruction of these CRs belonged to the constant lighting condition. At the same time,the CRs of the clock genes were found only in the control and the second experimentalgroup, which is caused by the leading role of ethanol in the disruption of these rhythms.
The rhythm of Adh5 was disrupted only in the second group. Apparently, violation ofthe lighting regime causes its breakdown, and the presence of CRs in rats of the first andthird experimental groups was caused by the fact that light was not the pacemaker, but thetime at which the ethanol was drunk was.
Chronic alcohol intoxication causes a complex of metabolic disorders that complicatethe toxic effects of alcohol. In turn, dark deprivation is a significant stress factor that alsoaffects metabolism.
Thus, the hyperglycemia we found in animals of the first and second experimentalgroups is explained in the first case by the well-known effect of CAI, which can causedisorders of carbohydrate metabolism, manifesting in both hyper- (more often) and inhypoglycemia [68,69], and in the second case by a response to stressful effects. At thesame time, a significant decrease in the levels of this metabolite in the blood plasma ofrats of the third group was caused by a disruption of the adaptation process. In addition,hyperglycemia in the blood of rats of the first group could be explained by the developmentof gluconeogenesis, since overexposure to ethanol is known to lead to insulin resistancein the liver, which increases the enzymatic capacity of gluconeogenesis and lipogenesisand decreases glycogen synthesis by inhibiting the PI3K/AKT signaling pathway in theliver [70].
The level of transaminases in the blood plasma of rats of the first group did not differfrom the controls; in the second group we noted an increase in the levels of both ALT andAST, but in the third group only the level of AST was increased. Changes in the levels ofenzymes in the second group may be associated with the destruction of hepatocytes underconstant illumination, and the picture in the third group is explained by the combined effectof both factors; an isolated increase in AST may be associated with a pyridoxine (vitamin B6)deficiency that often develops during CAI, as a result of which, ALT activity in hepatocytesdecreases. In addition, alcohol promotes the release of mitochondrial AST from hepatocyteswithout their obvious damage. A decrease in the level of total protein was noted in theblood plasma of rats of all the experimental groups. Hypoproteinemia is a well-knownphenomenon that disrupts the morphofunctional integrity of the liver. It is noteworthythat a decrease in albumin levels occurred only in rats of the second experimental group,which suggests that constant illumination causes significant disturbances in the protein-synthesizing function of the liver [71,72].
An increase in the level of direct bilirubin in the blood of rats of the first and thirdexperimental groups is a well-known effect of CAI.
The rhythms of glucose metabolism are determined by diurnal variations in a varietyof metabolic pathways, including peripheral insulin sensitivity, β-cell sensitivity, insulinclearance, the sleep–wake cycle, etc. [73]. The existence of various circadian phenotypesin humans has also been shown [74], which suggests their presence in rodents. The CRsof glucose appears to be the most stable, being destroyed in none of the groups, althoughthey did undergo some changes.
We found that the circadian rhythm of ALT was more resistant to the effects of theinvestigated factors, being disturbed only in rats of third group, while the CRs of AST wereabsent in rats of all the experimental groups.
It is notable that both the CRs of total protein in the blood plasma and of albumin,being altered in animals of the first and second experimental groups, were destroyed inthe third group; this testifies, on the one hand, to the resistance of these rhythms to the

Int. J. Mol. Sci. 2021, 22, 13007 21 of 27
effects of external desynchronizers, and also to the strong chronodestructive effects of thecombination of ethanol and constant illumination.
The least resistant CRs to the action of the investigated chronodestructors were theCRs of total and direct bilirubin, which were destroyed in all the experimental groups.
4. Materials and Methods4.1. Object of the Study
This study was conducted on 160 male rats of Wistar outbred stock at an age of 6months, with a body weight of 350 g. Animals were taken from the “Stolbovaya” affiliateof the FSBIS Scientific Center for Biomedical Technologies of the Federal Medical andBiological Agency. All animals were kept for three weeks in standard laboratory conditions,in plastic cages with free access to water and food. Initially, the animals were kept in naturallighting, at a temperature of 20–22 ◦C and a relative humidity of 60–70%. The rats had freeaccess to drinking water and briquetted food. Keeping of animals and experiments wereperformed in accordance with the European Convention for the Protection of VertebrateAnimals used for Experimental and other Scientific Purposes (Strasbourg, 18 March 1986).This research was approved by the Bioethical Committee of the Federal State BudgetaryScientific Institution “Research Institute of Human Morphology”, protocol № 27/3 dated11.10.2021.
4.2. Design of Study
Rats were divided into 4 equal groups. To model the KhAI we used a 15% aqueoussolution of ethanol [75].
The control group (n = 40) was kept under a fixed light regime (light:dark/10:14 hwith lights on at 8:00 and off at 18:00).
The first group, (EtOH; n = 40) was kept under the same conditions as the controls,but a 15% aqueous ethanol solution was offered daily as a drink ad libitum instead of water.
The second group, (CL; n = 40) was kept under a regime of constant light.The third group (EtOH + CL; n = 40), was kept under a regime of constant light and
received as a drink a 15% aqueous solution of ethanol ad libitum.The criterion for selecting rats for the study, along with the absence of visible abnor-
malities in condition and behavior, was the initial preference for a 15% solution of ethylalcohol in comparison with tap water. For this, a preliminary experiment was carried outfor 3 days in individual cages with free access to both liquids.
During the experiment, the volume of the consumed ethanol solution was determineddaily, and then the mass of alcohol per 1 kg of body weight was calculated. On average,the animals drank 15.48 ± 1.28 mL/day, which in terms of absolute ethanol is 7 g/kg ofbody weight.
Euthanasia was carried out three weeks after the start of the experiment in a carbondioxide chamber equipped with a device for the upper gas supply (100% CO2) at 9.00,15.00, 21.00 and 3.00. The chamber volume was filled with gas at a rate of 20% per minuteto avoid dyspnea and pain in animals. Previously, the rectal temperature of the animalswas measured and blood sampling for hematological and biochemical studies was made.After sacrifice, evisceration was performed.
4.3. Morphological, Morphometric and Histochemical Methods
The liver was fixed in 10% neutral buffered formalin with further passage throughalcohols of increasing concentration (50◦, 60◦, 70◦, 80◦ and 96◦) and xylol, followed bypouring into Histomix histological medium (BioVitrum, Moscow, Russia). When conduct-ing studies of organs embedded in paraffin, serial sections with a thickness of 5–6 µmwere prepared. Histological sections were made on the rotor microtome MPS-2 (USSR).Hematoxylin–eosin staining was carried out according to the standard technique. Stainedsections were put into a BioMount mounting medium (BioVitrum, Moscow, Russia).

Int. J. Mol. Sci. 2021, 22, 13007 22 of 27
Fragments of the liver were frozen for subsequent histological examination, and usinga freezing table for the MFT -01 “Unicon” microtome, serial frozen sections with a thicknessof 6–8 µm were prepared. To confirm the presence of fatty degeneration, standard stainingof frozen sections with a solution of Sudan-III in 70% ethyl alcohol was performed.
Microscopy of histological preparations was performed using a Nikon Eclipse 80Imicroscope with use of a Nikon DI-FI digital camera (Tokyo, Japan). Eyepieces ×10,×15, objectives ×4, ×10, ×20, ×40, ×100 were used for microscopy. Microscopy ofhistological preparations was performed using a Nikon Eclipse 80I microscope with theuse of a Nikon DI-FI digital camera (Tokyo, Japan). From each studied preparation,10 digital images of randomly selected visual fields were taken at a magnification of×400, ×1000, with the use of which karyo- and cytometry were subsequently carriedout. In morphometric studies, the Fiji software package, a program built on the basis ofImageJ v2 with appropriate plugins, was used [76]. The measurements were carried out inmicrometers after preliminary geometric calibration on an object-micrometer scale digitizedwith the same magnification. Micromorphometry was performed only for mononuclearinterphase hepatocytes without signs of pathological changes. The proportion of binuclearhepatocytes was also determined.
With the use of ImageJ, the cross-sectional areas of nuclei (area of nucleus, Sn),the small (d) and long (D) diameters of nuclei, the perimeters of nuclei (Pn), the cross-sectional areas of cells (area of cell, Scell), and the small (a) and long (b) diameters of cellswere determined.
The parameters were calculated with the use of appropriate formulae.The nuclear-cytoplasmic ratio was calculated by the formula:
NCR = Sn/Sc (1)
where: Sn—area of nucleus of cell; Sc—area of cytoplasm.The mean diameters of the nuclei were calculated by the formula:
M = (D + d)/2 (2)
where D—long diameter, d—small diameter [77].The volumes of the nuclei were calculated by the formula:
Vn = 0.523 M3 (3)
where M—mean diameter of nuclei.The volumes of the cells were calculated by the formula:
Vc = 0.523 M3 (4)
where M—mean diameter of cells.The nucleus volume to nucleus area ratio (V/A coefficient) was calculated by the formula:
Vn/An (5)
where Vn is the mean volume of nuclei, An—mean area of nuclei.The elongation index of the nucleus was calculated by the formula:
EI = D/d (6)
where D—long diameter, d—small diameter [76].For calculation of the coefficient of form, the following formula was used:
CF = 4 × π × Sn/Pn2 (7)
where Sn—area of nucleus, Pn—perimeter of nucleus [48].

Int. J. Mol. Sci. 2021, 22, 13007 23 of 27
The contour index of the nucleus, which reflects the topography of its surface, wasdetermined by the formula:
CI = Pn/√
Sn (8)
where Sn—the area of nucleus, Pn—perimeter of nucleus [77].
4.4. Immunohistochemical Methods
To carry out immunohistochemical reactions, liver sections were dewaxed, rehydratedand treated with 3% hydrogen peroxide solution to block endogenous peroxidase. Then,the slices were put into an Ultra V Block (Thermo Fisher Scientific, Waltham, MA, USA)solution; the antigens were previously unmasked by boiling in citrate buffer (pH 6.0).Immunohistochemical reactions with primary antibodies were performed.
The following antibodies were used:
Ki-67—Rabbit polyclonal (Cloud-Clone Corp., Katy, TX, USA), 1:300;Per2—Rabbit polyclonal (Cloud-Clone Corp., Katy, TX, USA), 1:200;Bmal1—Rabbit polyclonal (Cloud-Clone Corp., Katy, TX, USA), 1:200;p53—Rabbit polyclonal (Cloud-Clone Corp., Katy, TX, USA), 1:200;Adh5—Rabbit polyclonal (Cloud-Clone Corp., Katy, TX, USA), 1:300.
Sections were incubated with antibodies for 60 min at room temperature. The UltraVi-sion Quanto Detection System (Thermo Fisher Scientific; Waltham, MA, USA) set was usedas a detection system.
Reactions with replacement of primary antibodies with phosphate buffer solutionserved as controls.
After the sections acquired a blue hue, the slides were removed, dehydrated in alcoholsof ascending concentrations and xylene according to the standard scheme, and embeddedin the BioMount mounting medium (BioVitrum, Moscow, Russia).
The results of the immunohistochemical reactions were assessed by the proportionof stained cells or cell nuclei (depending on the localization of the antigen) in relation tothe total number of hepatocytes. The evaluation was carried out in 4 fields of view at amagnification of × 400.
Cells stained with the appropriate antibodies were counted in the preparations, andthen the corresponding index was calculated as the ratio of stained cells to the total numberof cells (%).
4.5. Biochemical Methods
The levels of the studied parameters were determined in blood plasma using a StatFax-3300 analyzer (Palm City, FL, USA) with the corresponding Spinreact kits (Barcelona, Spain):total protein, albumin, alanine aminotransferase (ALT), aspartate aminotransferase (AST),direct bilirubin, total bilirubin, and glucose were determined.
4.6. Methods for Statistical Processing
The obtained data were analyzed using the “GraphPad Prism 6.0” software by calcu-lating the mean values, standard deviation, and mean error of the arithmetic mean. Thedata in the text, tables and graphs are presented as M ±m, where M is the mean and m isthe SD. Numerical rows characterizing the daily fluctuations of the studied physiologicalrhythms of animals were subjected to mathematical processing, on the basis of whichthe group chronograms were drawn. The shapes of the chronograms were studied andthe average daily values were calculated. To identify differences between control andexperimental groups, we performed univariate analyses (using ANOVA or Kruskal–Walliswhere appropriate) for clinical parameters and laboratories. Differences were consideredstatistically significant at p < 0.05.
For statistical calculation of the amplitude and acrophase of CRs, we performedcosinor analysis, which is an international, generally recognized method for the unifiedstudy of biological rhythms, using the CosinorEllipse2006-1.1 program.

Int. J. Mol. Sci. 2021, 22, 13007 24 of 27
Cosinor analysis was employed to analyze wave processes and process chronobio-logical data. The presence of a reliable circadian rhythm was determined, as well as itsacrophase and amplitude. The output information of the cosinor analysis was the mainparameters of the rhythms: mezor, i.e., the value of the average level of the sinusoid (h);the amplitude of the sinusoid (A); and the acrophase (Phi), that is, the time of the onset ofthe maximum of the function. The mezor coincides in magnitude with the average dailyvalue of the investigated function. The acrophase is a measure of the peak time of totalrhythmic variability over a 24 h period, i.e., the time of the onset of the maximum of thefunction. The amplitude corresponds to half of the total rhythmic variability in the cycle.The acrophase is expressed in hours; amplitude values are expressed in the same units asthe studied variables [78].
5. Conclusions
The results of the micromorphometry indicated significant changes in the studiedparameters of the hepatocytes, which were least expressed in the first experimental group,and which affected the liver cells of the rats of the third experimental group the most. Inthe hepatocytes of animals of all three experimental groups, there was a significant changein the chronostructure, which manifested itself in the disruption and/or alteration of thestudied CRs and the occurrence of desynchronosis. The most stable and least labile CR wasthe CR of the cell area. In the presence of changes in the biochemical parameters typicalof ethanol intoxication, a significant change or destruction of their CRs in all the studiedgroups of animals was noted. Both ethanol and constant illumination caused changes inthe level of expression and circadian rhythms of the studied genes; however, the greatestchronodestructive effect was observed with the combined actions of these factors.
Alcohol intoxication, which occurred against a background of a melatonin deficiencycaused by constant lighting, was accompanied by a significantly greater severity, preva-lence, and intensity of inflammatory tissue reactions and a variety of manifestationsof liver pathology in all animals. Under these conditions, understanding the mecha-nisms of the modeled pathology opens up prospects for both etiotropic treatment andpathogenetic targeting.
Author Contributions: M.A.K., Y.A.K., D.A.A. conceived the study and designed the experiment;M.A.K., L.A.M., I.C. collected the data and performed the analysis; M.A.K. wrote the paper; Y.A.K.,D.A.A. edited the manuscript. All authors have read and agreed to the published version ofthe manuscript.
Funding: This research was carried out within the framework of the State Assignment to A.P. AvtsynResearch Institute of Human Morphology.
Institutional Review Board Statement: Keeping of animals and experiments were performed inaccordance with the European Convention for the Protection of Vertebrate Animals used for Experi-mental and other Scientific Purposes (Strasbourg, 18 March 1986). This research was approved bythe Bioethical Committee of the Federal State Budgetary Scientific Institution “Research Institute ofHuman Morphology”, protocol No. 27/3 dated 11 October 2021.
Informed Consent Statement: Not applicable.
Data Availability Statement: The data presented in this study are available within the article text,tables and figures.
Conflicts of Interest: The authors declare no conflict of interest.
References1. Rehm, J. The risks associated with alcohol use and alcoholism. Alcohol Res. Health 2011, 34, 135–143.2. Seitz, H.K.; Neuman, M.G. The History of Alcoholic Liver Disease: From an Unrecognized Disease to One of the Most Frequent
Diseases in Hepatology. J. Clin. Med. 2021, 10, 858. [CrossRef] [PubMed]3. Forger, D.B. Biological Clocks, Rhythms, and Oscillations. In The Theory of Biological Timekeeping; MIT Press: Cambridge, MA,
USA, 2017.
Int. J. Mol. Sci. 2021, 22, 13007 25 of 27
4. McKenna, H.; Van Der Horst, G.T.J.; Reiss, I.; Martin, D. Clinical chronobiology: A timely consideration in critical care medicine.Crit. Care 2018, 22, 124. [CrossRef] [PubMed]
5. Walker, W.H.; Walton, J.C.; DeVries, A.C.; Nelson, R.J. Circadian rhythm disruption and mental health. Transl. Psychiatry 2020, 10, 28.[CrossRef] [PubMed]
6. Eckel-Mahan, K.; Sassone-Corsi, P. Metabolism and the circadian clock converge. Physiol. Rev. 2013, 93, 107–135. [CrossRef]7. Roenneberg, T.; Merrow, M. The Circadian Clock and Human Health. Curr. Biol. 2016, 26, R432–R443. [CrossRef]8. Panda, S. Circadian physiology of metabolism. Science 2016, 354, 1008–1015. [CrossRef]9. Zimmet, P.; Alberti, K.G.M.M.; Stern, N.; Bilu, C.; El-Osta, A.; Einat, H.; Kronfeld-Schor, N. The Circadian Syndrome: Is the
Metabolic Syndrome and much more! J. Intern. Med. 2019, 286, 181–191. [CrossRef]10. Foster, R.G.; Roenneberg, T. Human responses to the geophysical daily, annual and lunar cycles. Curr. Biol. 2008, 18, R784–R794.
[CrossRef]11. Michel, S.; Meijer, J.H. From clock to functional pacemaker. Eur. J. Neurosci. 2020, 51, 482–493. [CrossRef]12. Jasser, S.A.; Blask, D.E.; Brainard, G.C. Light during darkness and cancer: Relationships in circadian photoreception and tumor
biology. Cancer Causes Control 2006, 17, 515–523. [CrossRef]13. Fonken, L.K.; Workman, J.L.; Walton, J.C.; Weil, Z.M.; Morris, J.S.; Haim, A.; Nelson, R.J. Light at night increases body mass by
shifting the time of food intake. Proc. Natl. Acad. Sci. USA 2010, 107, 18664–18669. [CrossRef]14. Verlande, A.; Masri, S. Circadian Clocks and Cancer: Timekeeping Governs Cellular Metabolism. Trends Endocrinol. Metab. 2019,
30, 445–458. [CrossRef] [PubMed]15. Anisimov, V.N. Light desynchronosis and health. Light Eng. 2019, 27, 3. [CrossRef]16. Leng, Y.; Musiek, E.S.; Hu, K.; Cappuccio, F.P.; Yaffe, K. Association between circadian rhythms and neurodegenerative diseases.
Lancet Neurol. 2019, 18, 307–318. [CrossRef]17. Kim, P.; Oster, H.; Lehnert, H. Coupling the Circadian Clock to Homeostasis: The Role of Period in Timing Physiology. Endocr.
Rev. 2019, 40, 66–95. [CrossRef] [PubMed]18. Shi, D.; Chen, J.; Wang, J.; Yao, J.; Huang, Y.; Zhang, G.; Bao, Z. Circadian Clock Genes in the Metabolism of Non-alcoholic Fatty
Liver Disease. Front Physiol. 2019, 10, 423. [CrossRef]19. Lamia, K.A.; Storch, K.-F.; Weitz, C.J. Physiological significance of a peripheral tissue circadian clock. Proc. Natl. Acad. Sci. USA
2008, 105, 15172–15177. [CrossRef]20. Koronowski, K.B.; Kinouchi, K.; Welz, P.-S.; Smith, J.G.; Zinna, V.M.; Shi, J.; Samad, M.; Chen, S.; Magnan, C.N.; Kinchen, J.M.; et al.
Defining the Independence of the Liver Circadian Clock. Cell 2019, 177, 1448.e14–1462.e14. [CrossRef]21. Li, H.; Zhang, S.; Zhang, W. Endogenous circadian time genes expressions in the liver of mice under constant darkness. BMC
Genom. 2020, 21, 224. [CrossRef]22. Sinturel, F.; Gos, P.; Petrenko, V.; Hagedorn, C.; Kreppel, F.; Storch, K.-F.; Knutti, D.; Liani, A.; Weitz, C.; Emmenegger, Y.; et al.
Circadian hepatocyte clocks keep synchrony in the absence of a master pacemaker in the suprachiasmatic nucleus or otherextrahepatic clocks. Genes Dev. 2021, 35, 329–334. [CrossRef] [PubMed]
23. Bechtold, D.A. Energy-responsive timekeeping. J. Genet. 2008, 87, 447–458. [CrossRef]24. Engin, A. Circadian Rhythms in Diet-Induced Obesity. Adv. Exp. Med. Biol. 2017, 960, 19–52. [PubMed]25. Westerterp-Plantenga, M.S. Challenging energy balance—during sensitivity to food reward and modulatory factors implying a
risk for overweight—During body weight management including dietary restraint and medium-high protein diets. Physiol. Behav.2020, 221, 112879. [CrossRef] [PubMed]
26. Fárková, E.; Schneider, J.; Šmotek, M.; Bakštein, E.; Herlesová, J.; Koprivová, J.; Šrámková, P.; Pichlerová, D.; Fried, M. Weightloss in conservative treatment of obesity in women is associated with physical activity and circadian phenotype: A longitudinalobservational study. Biopsychosoc. Med. 2019, 13, 24. [CrossRef]
27. Tähkämö, L.; Partonen, T.; Pesonen, A.-K. Systematic review of light exposure impact on human circadian rhythm. Chronobiol.Int. 2019, 36, 151–170. [CrossRef]
28. Aho, V.; Ollila, H.; Kronholm, E.; Bondia-Pons, I.; Soininen, P.; Kangas, A.; Hilvo, M.; Seppälä, I.; Kettunen, J.; Oikonen, M.; et al.Prolonged sleep restriction induces changes in pathways involved in cholesterol metabolism and inflammatory responses. Sci.Rep. 2016, 6, 24828. [CrossRef] [PubMed]
29. Poggiogalle, E.; Jamshed, H.; Peterson, C.M. Circadian regulation of glucose, lipid, and energy metabolism in humans. Metabolism2018, 84, 11–27. [CrossRef]
30. Mota, M.C.; Silva, C.M.; Balieiro, L.C.T.; Fahmy, W.M.; Crispim, C.A. Social jetlag and metabolic control in non-communicablechronic diseases: A study addressing different obesity statuses. Sci. Rep. 2017, 7, 6358. [CrossRef]
31. Masri, S.; Sassone-Corsi, P. The emerging link between cancer, metabolism, and circadian rhythms. Nat. Med. 2018, 24, 1795–1803.[CrossRef]
32. Yalçin, M.; El-Athman, R.; Ouk, K.; Priller, J.; Relógio, A. Analysis of the Circadian Regulation of Cancer Hallmarks by aCross-Platform Study of Colorectal Cancer Time-Series Data Reveals an Association with Genes Involved in Huntington’s Disease.Cancers 2020, 12, 963. [CrossRef] [PubMed]
33. Keshavarzian, A.; Holmes, E.W.; Patel, M.; Iber, F.; Fields, J.Z.; Pethkar, S. Leaky gut in alcoholic cirrhosis: A possible mechanismfor alcohol-induced liver damage. Am. J. Gastroenterol. 1999, 94, 200–207. [CrossRef] [PubMed]

Int. J. Mol. Sci. 2021, 22, 13007 26 of 27
34. Delcò, F.; Tchambaz, L.; Schlienger, R.; Drewe, J.; Krähenbühl, S. Dose adjustment in patients with liver disease. Drug Saf. 2005,28, 529–545. [CrossRef] [PubMed]
35. Swanson, G.; Forsyth, C.B.; Tang, Y.; Shaikh, M.; Zhang, L.; Turek, F.W.; Keshavarzian, A. Role of intestinal circadian genes inalcohol-induced gut leakiness. Alcohol. Clin. Exp. Res. 2011, 35, 1305–1314. [CrossRef] [PubMed]
36. Summa, K.C.; Voigt, R.M.; Forsyth, C.B.; Shaikh, M.; Cavanaugh, K.; Tang, Y.; Vitaterna, M.H.; Song, S.; Turek, F.W.;Keshavarzian, A. Disruption of the Circadian Clock in Mice Increases Intestinal Permeability and Promotes Alcohol-InducedHepatic Pathology and Inflammation. PLoS ONE 2013, 8, e67102.
37. Bailey, S.M. Emerging role of circadian clock disruption in alcohol-induced liver disease. Am. J. Physiol. Liver Physiol. 2018, 315,G364–G373. [CrossRef]
38. Rosenwasser, A.M. Chronobiology of ethanol: Animal models. Alcohol 2015, 49, 311–319. [CrossRef]39. Davis, B.T.; Voigt, R.M.; Shaikh, M.; Forsyth, C.B.; Keshavarzian, A. Circadian Mechanisms in Alcohol Use Disorder and Tissue
Injury. Alcohol Clin. Exp. Res. 2018, 42, 668–677. [CrossRef]40. Forsyth, C.B.; Voigt, R.M.; Shaikh, M.; Tang, Y.; Cederbaum, A.I.; Turek, F.W.; Keshavarzian, A. Role for intestinal CYP2E1
in alcohol-induced circadian gene-mediated intestinal hyperpermeability. Am. J. Physiol. Liver Physiol. 2013, 305, G185–G195.[CrossRef]
41. An, L.; Wang, X.; Cederbaum, A.I. Cytokines in alcoholic liver disease. Arch. Toxicol. 2012, 86, 1337–1348. [CrossRef]42. Kawaratani, H.; Tsujimoto, T.; Douhara, A.; Takaya, H.; Moriya, K.; Namisaki, T.; Noguchi, R.; Yoshiji, H.; Fujimoto, M.; Fukui, H.
The effect of inflammatory cytokines in alcoholic liver disease. Mediat. Inflamm. 2013, 2013, 495156. [CrossRef] [PubMed]43. Haas, S.; Straub, R.H. Disruption of rhythms of molecular clocks in primary synovial fibroblasts of patients with osteoarthritis
and rheumatoid arthritis, role of IL-1β/TNF. Arthritis Res. Ther. 2012, 14, R122. [CrossRef] [PubMed]44. Lopez, M.; Meier, D.; Müller, A.; Franken, P.; Fujita, J.; Fontana, A. Tumor necrosis factor and transforming growth factor β
regulate clock genes by controlling the expression of the cold inducible RNA-binding protein (CIRBP). J. Biol. Chem. 2014, 289,2736–2744. [CrossRef] [PubMed]
45. Li, W.; Li, L.; Hui, L. Cell Plasticity in Liver Regeneration. Trends Cell Biol. 2020, 30, 329–338. [CrossRef]46. Junatas, K.L.; Tonar, Z.; Kubíková, T.; Liška, V.; Pálek, R.; Mik, P.; Králícková, M.; Witter, K. Stereological analysis of size and
density of hepatocytes in the porcine liver. J. Anat. 2017, 230, 575–588. [CrossRef]47. Tarantino, G.; Vincenzo, C.; Domenico, C. Nonalcoholic fatty liver disease: A challenge from mechanisms to therapy. Clin. Med.
2020, 9, 15. [CrossRef]48. Rowell, R.J.; Quentin, M.A. An overview of the genetics, mechanisms and management of NAFLD and ALD. Clin. Med. 2015, 15,
s77–s82. [CrossRef]49. Shetty, A.; Hsu, J.W.; Manka, P.P. Role of the Circadian Clock in the Metabolic Syndrome and Nonalcoholic Fatty Liver Disease.
Dig. Dis. Sci. 2018, 63, 3187–3206. [CrossRef]50. Miyaoka, Y.; Ebato, K.; Kato, H.; Arakawa, S.; Shimizu, S.; Miyajima, A. Hypertrophy and unconventional cell division of
hepatocytes underlie liver regeneration. Curr. Biol. 2012, 22, 1166–1175. [CrossRef]51. Abbasoglu, O.; Berker, M.; Ayhan, A.; Palaoglu, S.; Sayek, I. The effect of the pineal gland on liver regeneration in rats. J. Hepatol.
1995, 23, 578–581. [CrossRef]52. Liang, R.; Nickkholgh, A.; Hoffmann, K.; Kern, M.; Schneider, H.; Sobirey, M.; Zorn, M.; Büchler, M.W.; Schemmer, P. Melatonin
protects from hepatic reperfusion injury through inhibition of IKK and JNK pathways and modification of cell proliferation. J.Pineal Res. 2009, 46, 8–14. [CrossRef]
53. Yanko, R. The combined influence of the intermittent normobaric hypoxia and melatonin on morphofunctional activity of therat’s liver parenchyma. Bull. Taras Shevchenko Natl. Univ. Kyiv-Probl. Physiol. Funct. Regul. 2018, 25, 36–40.
54. Wilkinson, P.D.; Duncan, A.W. Differential Roles for Diploid and Polyploid Hepatocytes in Acute and Chronic Liver Injury. InSeminars in Liver Disease; Thieme Medical Publishers: New York, NY, USA, 2020.
55. Wilkinson, P.; Alencastro, F.; Delgado, E.; Leek, M.P.; Weirich, M.P.; Otero, P.A.; Roy, N.; Brown, W.K.; Oertel, M.; Duncan, A.W.Polyploid hepatocytes facilitate adaptation and regeneration to chronic liver injury. Am. J. Pathol. 2019, 189, 1241–1255. [CrossRef]
56. Matsumoto, T.; Wakefield, L.; Peters, A.; Peto, M.; Spellman, P.; Grompe, M. Proliferative polyploid cells give rise to tumors viaploidy reduction. Nat. Commun. 2021, 12, 646. [CrossRef] [PubMed]
57. Kreutz, C.; MacNelly, S.; Follo, M.; Wäldin, A.; Binninger-Lacour, P.; Timmer, J.; Bartolomé-Rodríguez, M.M. Hepatocyte ploidy isa diversity factor for liver homeostasis. Front Physiol. 2017, 8, 862. [CrossRef] [PubMed]
58. Kobayashi, T.; Saito, Y.; Ohtake, Y.; Maruko, A.; Yamamoto, Y.; Yamamoto, F.; Kuwahara, Y.; Fukumoto, M.; Fukumoto, M.;Ohkubo, Y. Effect of aging on norepinephrine-related proliferative response in primary cultured periportal and perivenoushepatocytes. Am. J. Physiol. Liver Physiol. 2012, 303, G861–G869. [CrossRef]
59. Lang, F. Mechanisms and significance of cell volume regulation. J Am Coll. Nutr. 2007, 26, 613S–623S. [CrossRef]60. Corona-Pérez, A.; Díaz-Muñoz, M.; Rodríguez, I.S.; Cuevas, E.; Martínez-Gómez, M.; Castelán, F.; Rodríguez-Antolín, J.; Nicolás-Toledo, L.
High sucrose intake ameliorates the accumulation of hepatic triacylglycerol promoted by restraint stress in young rats. Lipids 2015, 50,1103–1113. [CrossRef]
61. Vásquez, B.; Sandoval, C.; Smith, R.L.; Del Sol, M. Effects of early and late adverse experiences on morphological characteristicsof Sprague-Dawley rat liver subjected to stress during adulthood. Int. J. Clin. Exp. Pathol. 2014, 7, 4627–4635.
Int. J. Mol. Sci. 2021, 22, 13007 27 of 27
62. Fu, J.; Ma, S.; Li, X.; An, S.; Li, T.; Guo, K.; Lin, M.; Qu, W.; Dong, X.; Han, X.; et al. Long-term stress with hyperglucocorticoidemia-induced hepatic steatosis with VLDL overproduction is dependent on both 5-HT2 receptor and 5-HT synthesis in liver. Int. J. Biol.Sci. 2016, 12, 219–234. [CrossRef]
63. Konstandi, M.; Shah, Y.M.; Matsubara, T.; Gonzalez, F.J. Role of PPARα and HNF4α in stress-mediated alterations in lipidhomeostasis. PLoS ONE. 2013, 8, e70675. [CrossRef]
64. Schott, M.B.; Rasineni, K.; Weller, S.G.; Schulze, R.J.; Sletten, A.C.; Casey, C.A.; McNiven, M.A. β-Adrenergic induction of lipolysisin hepatocytes is inhibited by ethanol exposure. J. Biol. Chem. 2017, 292, 11815–11828. [CrossRef]
65. Rodrigues, F.M.; Adélio, J.I.; Santana, V.O.; De Marco Ornelas, E.; de Souza, R.R.; Cardoso, C.G.; Da Veiga, G.L.; Fonseca, F.L.A.;Maifrino, L.B.M. Physical exercise alters hepatic morphology of low-density lipoprotein receptor knockout ovariectomized mice.Med. Mol. Morphol. 2019, 52, 15–22. [CrossRef] [PubMed]
66. Tsomaia, K.; Patarashvili, L.; Karumidze, N.; Bebiashvili, I.; Azmaipharashvili, E.; Modebadze, I. Liver structural transformationafter partial hepatectomy and repeated partial hepatectomy in rats: A renewed view on liver regeneration. World J. Gastroenterol.2020, 26, 3899–3916. [CrossRef] [PubMed]
67. Tobari, M.; Hashimoto, E.; Kabutake, A. Genderspecific clinicopathological features in nonalcoholic steatohepatitis. Gastroenterology 2007,132, 815.
68. Uchiyama, Y. Rhythms in morphology and function of hepatocytes. J. Gastroenterol. Hepatol. 1990, 5, 321–333. [CrossRef][PubMed]
69. Idrovo, J.-P.; Shults, J.A.; Curtis, B.J.; Chen, M.M.; Kovacs, E.J. Alcohol Intoxication and the Postburn Gastrointestinal HormonalResponse. J. Burn. Care Res. 2019, 40, 785–791. [CrossRef]
70. Cheng, Q.; Li, Y.W.; Yang, C.F.; Zhong, Y.J.; Li, L. Ethanol-induced hepatic insulin resistance is ameliorated by methyl ferulic acidthrough the PI3K/AKT signaling pathway. Front. Pharmacol. 2019, 10, 949. [CrossRef] [PubMed]
71. Lin, Y.; Ying, Y.Y.; Li, S.X.; Wang, S.J.; Gong, Q.H.; Li, H. Association between alcohol consumption and metabolic syndromeamong Chinese adults. Public Health Nutr. 2021, 24, 4582–4590. [CrossRef]
72. Haller, E.W.; Wittmers, L.E. Ethanol-induced hypothermia and hyperglycemia in genetically obese mice. Life Sci. 1989, 44,1377–1385. [CrossRef]
73. Müssig, K.; Schleicher, E.D.; Häring, H.-U.; Riessen, R. Satisfactory outcome after severe ethanol-induced lactic acidosis andhypoglycemia. J. Emerg. Med. 2008, 34, 337–338. [CrossRef]
74. Chua, E.C.-P.; Shui, G.; Lee, I.T.-G.; Lau, P.; Tan, L.-C.; Yeo, S.C.; Lam, B.D.; Bulchand, S.; Summers, S.A.; Puvanendran, K.; et al.Extensive diversity in circadian regulation of plasma lipids and evidence for different circadian metabolic phenotypes in humans.Proc. Natl. Acad. Sci. USA 2013, 110, 14468–14473. [CrossRef]
75. Rodd-Henricks, Z.A.; Bell, R.L.; Kuc, K.A.; Murphy, J.M.; McBride, W.J.; Lumeng, L.; Li, T.K. Effects of ethanol exposureon subsequent acquisition and extinction of ethanol self-administration and expression of alcohol-seeking behavior in adultalcohol-preferring (P) rats: I. Periadolescent exposure. Alcohol Clin. Exp. Res. 2002, 26, 1632–1641. [CrossRef] [PubMed]
76. Smitha, T.; Sharada, P.; Girish, H. Morphometry of the basal cell layer of oral leukoplakia and oral squamous cell carcinoma usingcomputer-aided image analysis. J. Oral Maxillofac. Pathol. 2011, 15, 26–33. [CrossRef] [PubMed]
77. Broeke, J.; Pérez, J.M.M.; Pascau, J. Image Processing with ImageJ; Packt Publishing: Birmingham, UK, 2015; p. 346.78. Cornelissen, G. Cosinor-based rhythmometry. Theor. Biol. Med. Model 2014, 11, 16. [CrossRef] [PubMed]