Advancing towards Ubiquitous EEG, Correlation of In-Ear EEG ...
19
Sensors 2022, 22, 1568. https://doi.org/10.3390/s22041568 www.mdpi.com/journal/sensors Article Advancing towards Ubiquitous EEG, Correlation of In-Ear EEG with Forehead EEG Swati Mandekar 1,2 , Abigail Holland 2 , Moritz Thielen 2 , Mehdi Behbahani 1 and Mark Melnykowycz 2, * 1 Institute for Bioengineering, University of Applied Sciences Aachen, 52005 Aachen, Germany; [email protected] (S.M.); [email protected] (M.B.) 2 IDUN Technologies AG, Alpenstrasse 3, 8152 Glattpark, Switzerland; [email protected] (A.H.); [email protected] (M.T.) * Correspondence: [email protected] Abstract: Wearable EEG has gained popularity in recent years driven by promising uses outside of clinics and research. The ubiquitous application of continuous EEG requires unobtrusive form- factors that are easily acceptable by the end-users. In this progression, wearable EEG systems have been moving from full scalp to forehead and recently to the ear. The aim of this study is to demonstrate that emerging ear-EEG provides similar impedance and signal properties as established forehead EEG. EEG data using eyes-open and closed alpha paradigm were acquired from ten healthy subjects using generic earpieces fitted with three custom-made electrodes and a forehead electrode (at Fpx) after impedance analysis. Inter-subject variability in in-ear electrode impedance ranged from 20 kΩ to 25 kΩ at 10 Hz. Signal quality was comparable with an SNR of 6 for in-ear and 8 for forehead electrodes. Alpha attenuation was significant during the eyes-open condition in all in-ear electrodes, and it followed the structure of power spectral density plots of forehead electrodes, with the Pearson correlation coefficient of 0.92 between in-ear locations ELE (Left Ear Superior) and ERE (Right Ear Superior) and forehead locations, Fp1 and Fp2, respectively. The results indicate that in-ear EEG is an unobtrusive alternative in terms of impedance, signal properties and information content to established forehead EEG. Keywords: in-ear EEG; correlation; forehead EEG; impedance spectroscopy; biopotential electrodes; BCI 1. Introduction A number of imaging techniques have been developed over recent decades to provide more knowledge on the anatomy and function of the brain, such as Electroencephalography (EEG), Positron emission tomography (PET), Magnetic resonance imaging (MRI), and Functional near infrared spectroscopy (fNIRS). However, many neuroimaging techniques are not well-suited for mobile and lifestyle integration where the imaging technique may be used throughout the day to understand how the brain is changing due to different environmental stimuli or as connected to specific brain disorders and treatments a person may be undertaking. EEG offers great promise as a brain imaging technique that may integrate as a lifestyle product, similar to the way that smart watches may be used to capture data on the movement and cardiac activity of a person. One promising way to measure EEG ubiquitously and conveniently is to measure signals from the ear canal, and thereby functionalize common earbud products with brain-computer interface (BCI) capabilities. Biopotential measurements can be used as a diagnostic tool providing healthcare professionals with unique insights to detect diseases and take preventive measures accordingly. EEG, electromyography (EMG), and electrocardiography (ECG) are examples of non-invasive diagnostic procedures. EEG is a popular brain imaging Citation: Mandekar, S.; Holland, A.; Thielen, M.; Behbahani, M.; Melnykowycz, M. Advancing towards Ubiquitous EEG, Correlation of In-Ear EEG with Forehead EEG. Sensors 2022, 22, 1568. https://doi.org/10.3390/ s22041568 Academic Editor: Francesco Carlo Morabito Received: 30 October 2021 Accepted: 14 February 2022 Published: 17 February 2022 Publisher’s Note: MDPI stays neutral with regard to jurisdictional claims in published maps and institutional affiliations. Copyright: © 2022 by the authors. Licensee MDPI, Basel, Switzerland. This article is an open access article distributed under the terms and conditions of the Creative Commons Attribution (CC BY) license (https://creativecommons.org/license s/by/4.0/).
-
Upload
khangminh22 -
Category
Documents
-
view
1 -
download
0
Transcript of Advancing towards Ubiquitous EEG, Correlation of In-Ear EEG ...

Sensors 2022, 22, 1568. https://doi.org/10.3390/s22041568 www.mdpi.com/journal/sensors
Article
Advancing towards Ubiquitous EEG, Correlation of In-Ear EEG
with Forehead EEG
Swati Mandekar 1,2, Abigail Holland 2, Moritz Thielen 2, Mehdi Behbahani 1 and Mark Melnykowycz 2,*
1 Institute for Bioengineering, University of Applied Sciences Aachen, 52005 Aachen, Germany;
[email protected] (S.M.); [email protected] (M.B.) 2 IDUN Technologies AG, Alpenstrasse 3, 8152 Glattpark, Switzerland; [email protected] (A.H.);
[email protected] (M.T.)
* Correspondence: [email protected]
Abstract: Wearable EEG has gained popularity in recent years driven by promising uses outside of
clinics and research. The ubiquitous application of continuous EEG requires unobtrusive form-
factors that are easily acceptable by the end-users. In this progression, wearable EEG systems have
been moving from full scalp to forehead and recently to the ear. The aim of this study is to
demonstrate that emerging ear-EEG provides similar impedance and signal properties as
established forehead EEG. EEG data using eyes-open and closed alpha paradigm were acquired
from ten healthy subjects using generic earpieces fitted with three custom-made electrodes and a
forehead electrode (at Fpx) after impedance analysis. Inter-subject variability in in-ear electrode
impedance ranged from 20 kΩ to 25 kΩ at 10 Hz. Signal quality was comparable with an SNR of 6
for in-ear and 8 for forehead electrodes. Alpha attenuation was significant during the eyes-open
condition in all in-ear electrodes, and it followed the structure of power spectral density plots of
forehead electrodes, with the Pearson correlation coefficient of 0.92 between in-ear locations ELE
(Left Ear Superior) and ERE (Right Ear Superior) and forehead locations, Fp1 and Fp2, respectively.
The results indicate that in-ear EEG is an unobtrusive alternative in terms of impedance, signal
properties and information content to established forehead EEG.
Keywords: in-ear EEG; correlation; forehead EEG; impedance spectroscopy; biopotential electrodes;
BCI
1. Introduction
A number of imaging techniques have been developed over recent decades to
provide more knowledge on the anatomy and function of the brain, such as
Electroencephalography (EEG), Positron emission tomography (PET), Magnetic
resonance imaging (MRI), and Functional near infrared spectroscopy (fNIRS). However,
many neuroimaging techniques are not well-suited for mobile and lifestyle integration
where the imaging technique may be used throughout the day to understand how the
brain is changing due to different environmental stimuli or as connected to specific brain
disorders and treatments a person may be undertaking. EEG offers great promise as a
brain imaging technique that may integrate as a lifestyle product, similar to the way that
smart watches may be used to capture data on the movement and cardiac activity of a
person. One promising way to measure EEG ubiquitously and conveniently is to measure
signals from the ear canal, and thereby functionalize common earbud products with
brain-computer interface (BCI) capabilities.
Biopotential measurements can be used as a diagnostic tool providing healthcare
professionals with unique insights to detect diseases and take preventive measures
accordingly. EEG, electromyography (EMG), and electrocardiography (ECG) are
examples of non-invasive diagnostic procedures. EEG is a popular brain imaging
Citation: Mandekar, S.; Holland, A.;
Thielen, M.; Behbahani, M.;
Melnykowycz, M. Advancing
towards Ubiquitous EEG,
Correlation of In-Ear EEG with
Forehead EEG. Sensors 2022, 22,
1568. https://doi.org/10.3390/
s22041568
Academic Editor:
Francesco Carlo Morabito
Received: 30 October 2021
Accepted: 14 February 2022
Published: 17 February 2022
Publisher’s Note: MDPI stays
neutral with regard to jurisdictional
claims in published maps and
institutional affiliations.
Copyright: © 2022 by the authors.
Licensee MDPI, Basel, Switzerland.
This article is an open access article
distributed under the terms and
conditions of the Creative Commons
Attribution (CC BY) license
(https://creativecommons.org/license
s/by/4.0/).

Sensors 2022, 22, 1568 2 of 19
technique used by scientists and physicians. Groups of neurons transmit ionic currents,
which create individual voltage fluctuations. EEG can leverage the propagation of these
voltage signals to measure electrical potentials at the scalp as a method of approximating
brain activity. Among various biopotential recordings, EEG has received significant
attention in the medical and consumer device market in recent years. EEG is a versatile
tool for extracting a wide range of information. Widespread applications of EEG devices
include sleep monitoring [1] as well as brain and cognitive health tracking for mental
health [2]. By 2026, the global market for EEG devices is projected to reach US $8.85 billion
[3]. Factors such as the increasing prevalence of neurovascular diseases, health awareness
among individuals, and a rapidly expanding aging population accelerate the market
growth [4]. Most of the current application is limited to clinics and research as EEG
systems are typically bulky and require trained professionals to operate correctly.
Traditionally used clinical EEG systems require a conductive gel to form a stable,
conductive pathway from the scalp to the electrodes. Additionally, the outermost skin
layer, the stratum corneum, is abraded to remove dead skin cells to achieve a low skin-
contact impedance. This can cause skin irritation and discomfort and results in decreased
signal quality over time as the gel dries [5]. In recent years, the consumer market has been
growing and effectively addressing many of these constraints. Personal brain metrics
monitoring has gained significant traction in the wearable market because consumers,
companies and institutions can leverage this technology for everyday health monitoring.
Numerous companies are developing consumer-friendly solutions for specific
personalized applications through neurofeedback. These low-cost devices use a limited
number of electrodes and are used for preventive health monitoring applications, such as
meditation [6], sleep tracking [7], headache prevention [8], and fatigue management [9].
Table 1 below highlights some of the current low-cost EEG devices, their electrode
configurations, electrode placements according to the International 10–20 electrode
placement scheme (The International 10–20 system is an internationally recognized
system for identifying scalp regions for electrode placement during EEG measurement.)
and their intended applications.
Table 1. State of the art consumer devices which use head and forehead channels for EEG
measurements.
Device Electrode Type Electrode Locations Applications
InteraXon Muse Metal 4 channels, AF7,
AF8, TP9, TP10
Sleep tracking and
meditation
Macrotellect
BrainLink Metal
3 channels, FP1, FPz,
FP2 Meditation
Neurosky Mindwave Metal 1 channel, AFz Attention, meditation
Emotiv Insight Semi-dry polymer
electrodes
5 channels, AF3,
AF4, T7, T8, Pz
Meditation and
research
BrainCo FocusCalm Metal 3 channels, AF7,
AF8, FPz Meditation
These devices are mobile, noninvasive, and mainly utilize electrode locations on the
forehead as the hair-free electrode–skin contact enables improved signal quality.
Headbands and other current systems can be uncomfortable to wear for extended periods
of time and are inconvenient to use while sleeping. Furthermore, if the user does not place
them correctly, data acquisition can become disrupted. To improve the usability of EEG
systems, it can be beneficial to move the electrode arrangement away from the forehead
to a more convenient and unobtrusive location.
To tackle all these problems, Ear-EEG has emerged as a promising alternative in
recent years. Ear-EEG is a novel technique that uses earpieces to record EEG from the ear
canal and concha, and around the ear [10]. It makes continuous biopotential monitoring

Sensors 2022, 22, 1568 3 of 19
ubiquitous as it can be worn in everyday life just like earphones. Moreover, it makes long-
term brain recording more discreet, user-friendly, and unobtrusive [11,12]. Compared to
the scalp, it utilizes a lower number of electrodes located in close proximity to the
temporal regions, yet signal characteristics are comparable to the scalp EEG for specific
paradigms [10,13,14]. Applications relying on high temporal resolution include sleep
monitoring [15], epilepsy seizure detection [16], stress management [2] and meditation
[17]. For medical applications such as epilepsy, the epileptiform abnormalities can be
interpreted from EEG, but the localization of these in the brain still needs to be
investigated [18].
Hans Berger, the first person to successfully capture EEG data from a human being,
observed that EEG oscillations in the alpha band (8–13 Hz) decreased in amplitude or
disappeared completely when observers opened their eyes. This effect is known as the
“Berger effect” or “alpha blocking”, named after Berger and the phenomenon [19]. This
alpha blocking implies the desynchronization of oscillators in the brain after the opening
of eyes, whereas alpha waves are an indicator of the synchronized activity in the brain
[19]. Numerous research has used alpha attenuation as a paradigm for validating the
proper functioning of EEG recording equipment due to its robust nature and its ability to
be evoked in most individuals [11,20,21]. Apart from validating EEG recording
equipment, the alpha paradigm has also been used for the detection of autism [22], stress
monitoring [23], functional mechanism of selective attention [24], and in meditation
studies [17]. Alpha-band oscillations are believed to be associated with many fundamental
cognitive processes [25]. This research uses the alpha paradigm to compare EEG
recordings acquired from the forehead and ear, as well as to verify the system’s validity.
In this investigation, we do not try to localize alpha generators, as attempts to localize
alpha-activity generators have been addressed in the past [26].
Many brain regions are active during cognitive processes, including the frontal,
parietal, temporal, and occipital. So, the observed brain activity measured at one surface
location is an overall result of activity from many sub-regions. D. Looney et al. proved
high coherence between temporal, T7, and mastoid, M1 (International 10–20 electrode
system), electrodes on the scalp with an ear canal electrode, implying the shared activity
between the scalp and ear electrodes [11]. The T7 position is located above the left ear,
while M1 is the left mastoid. This established that activity from the scalp is measurable
from the ear; however, no attempt was made to investigate the relationship between
activity from the frontal and in-ear regions. Therefore, the purpose of this study is to
examine this relationship by calculating the alpha band power correlation between those
locations. In the process, the optimal position of the in-ear electrodes is investigated.
Following a preliminary evaluation of the electrode–skin impedance, EEG measurements
were performed using in-ear electrodes in parallel with forehead locations. The
impedance values were expected to be in few kΩ (10 to 50 kΩ), and the Berger effect was
expected to be present at both locations, which is the attenuation of alpha during the eyes-
open condition compared to eyes-closed. The quality of the recorded signals was
estimated by evaluation of the signal-to-noise ratio (SNR). Different features on EEG data
were computed to compare the forehead electrodes with the in-ear electrodes.
The current study contributes to our understanding of the correlation of forehead to
the in-ear electrodes as well as the impact of the placement of electrodes on signal pickup.
By demonstrating that the EEG activity recorded on the forehead may also be measurable
at the outer ear canal, new applications resulting in an unobtrusive and user-friendly
experience for in-ear EEG technology can be established in the future.
2. Materials and Methods
2.1. Earpiece Production and Preparation
A memory foam substrate is used for the production of in-ear electrodes. Memory
foam has the ability to withstand severe compression without damage, which is necessary

Sensors 2022, 22, 1568 4 of 19
for comfortable and easy insertion. The pressure on the external surface of the earplug is
uniformly distributed, resulting in great contact with the skin at any location on the
earpiece, resulting in a durable electrode–skin interface and comfort over time. Hence, a
memory foam earplug was used as the earpiece structure to provide more flexibility for
long-duration monitoring and adaptability to the unique ear canal geometries of test
participants. To withstand the high level of compression applied to foam earplugs before
insertion, the electrodes must be equally flexible yet robust. Electrodes were fabricated
from silver-plated knitted conductive fabric (surface resistivity < 5 Ω/sq) attached to the
memory foam core. Stretchable fabric quickly accommodates all required deformations,
maintains a low impedance and is simple to attach to the substrate and wires. The
rectangular form of the electrodes (5 mm × 8 mm) was manufactured using a laser cutter.
Electrodes were adhered to the surface of the foam earplugs using a biocompatible
adhesive, which allowed them to retain their structural integrity following application.
Three electrodes, each having a total surface area of 40 mm2, were positioned 120° apart
and equidistant from one another (as shown in Figure 1). The edges of the electrodes were
slightly rounded to improve the comfort of the test subjects.
Wires were crimped to the electrodes and a pin was used for the connectors. Medical
adhesive tape was used to ensure separation between each electrode, limiting the
likelihood of linking. Twenty total earpieces were used to upkeep proper hygiene and
allow for one earpiece set to be used per subject.
Figure 1. Foam earplug earpieces with three electrodes located at 120° apart of sizes 8 × 5 mm (area:
40 mm2).
2.2. Participants
Ten young and healthy individuals participated in the study (mean age 28 ± 2.4, 5
males and 5 females). The ear canal sizes of the participants varied from small (5
participants), medium (3 participants) to large (2 participants). An equal number of males
and females were recruited to keep the findings unbiased with regards to gender. All
participants signed a written informed consent form in accordance with the Declaration
of Helsinki prior to the experiments.
2.3. Electrode Placement Nomenclature
The labeling scheme for the in-ear electrode locations was based on P. Kidmose et al.
[17] and was used throughout the experiment. The electrodes are labeled by Exy, where x
∈ L, R refers to electrodes in the left or right ear, and y refers to the electrode placement
in the ear canal, respectively. The electrode locations for earpieces selected in this study
were E, J, and H. The earpieces were inserted in the subject’s ear, such that the three
electrodes on the earpieces made contact at the E, J, and H positions, as shown in Figure
2 (electrode location drawing redone from Kappel [21]). The forehead locations used were
Fp1 and Fp2, according to the International 10–20 electrode placement system. The

Sensors 2022, 22, 1568 5 of 19
associated in-ear and forehead positions were determined by hemisphere, with the right
in-ear EEG system associated with the right frontal position with a similar trend on the
left hemisphere.
(a) (b)
Figure 2. (a) Electrode placement on the head for EEG measurement according to 10–20
International electrode placement, Fp1 and Fp2 refer to forehead locations, M1 and M2 are mastoids
and Iz is inion; (b) labeling scheme for the in-ear electrodes, Exy where x ∈ L, R refers to the left or
right ear and y is the position of the electrodes.
Other than the electrodes attached to the earpieces, all other electrodes utilized for
measurements were conductive wet gel electrodes (Ambu® BlueSensor VL (Ballerup,
Denmark) [27]. The impedance measurements were performed using a counter electrode
at the inion, which is a protruding portion of the occipital bone at the base of the skull (as
shown in Figure 3) and the Reference electrode was placed between the inion and the ear,
such that it was equidistant from both. Figures 3 and 4 illustrate the electrode placements
on the participant under test. The ground electrode was placed at the inion, whilst the
reference electrode was placed at the contralateral mastoid for EEG measurements.
Figure 3. Impedance measurement setup on a subject. Electrodes on earpieces are working
electrodes (WE), counter electrode (CE) is at inion, and reference electrode (RE) is between WE and
CE, equidistant from both.

Sensors 2022, 22, 1568 6 of 19
Figure 4. EEG recording setup on a subject. The ground was located at the inion, the reference at the
contra-lateral mastoid.
2.4. Experimental Setup
2.4.1. Experimental Procedure
Electrode skin contact impedance was measured for each participant before EEG
measurement to ensure secure contact to the skin and to avoid cross-channel linking. The
electrodes were placed on the subjects as described in Section 2.3. As previously reported
in the literature, it has been experimentally observed that ear cerumen increases
impedance values in the ear by up to 86% compared to clean ears [28]. Hence, the ear canal
was cleaned prior to measurements with alcohol wipes and ear swabs. The ear canal was
then dried with swabs before electrode insertion. The measurements were first conducted
in the left ear followed by the right ear and each participant’s measurements were
collected on the same day. The impedance measurements were conducted initially after 5
min of stabilization time, after the placement of electrodes on the subject, followed by EEG
measurement. The session time for EEG measurement consisted of 2 min. For both ears,
three trials were conducted for each subject. The experimental procedure is shown in
Figure 5.
Figure 5. Experimental procedure, the impedance measurements were carried out prior to the EEG
recording. Left ear measurements were performed first with electrodes ELE, ELJ, ELH, and Fp1;
followed by right ear measurements with electrodes ERE, ERJ, ERH, and Fp2. Each participant was
subjected to three trials (designated as EEG Data Acquisition 1, 2 and 3).

Sensors 2022, 22, 1568 7 of 19
2.4.2. Electrode Skin Contact Impedance
A frequency response analyzer (PalmSens4) was used to measure the frequency
response in a three-wire impedance configuration. The three-wire impedance
spectroscopy represents an approximation of the impedance of one electrode along with
its interface to the skin and the underlying skin layers. It is most often used in
conventional electrochemical applications. The electrode being investigated is referred to
as the working electrode (WE), whereas the electrode required to complete the electrical
circuit is called the counter electrode (CE). Third electrode, called the reference electrode
(RE), is used to determine the potential across the electrochemical interface accurately. All
potential measurements in electrochemical systems are defined with respect to a reference
electrode, since the absolute potential of a single electrode cannot be measured. Before
applying electrodes to the skin, the skin was cleaned with ethyl alcohol to prepare it for
the procedure, before the earpiece was compressed and placed into their ears. A drop of
saline solution was applied to the electrode before inserting it into the ear to reduce
stabilization time. After 5 min of stabilization time, the impedance was measured at 1, 10,
30, and 100 Hz, with the electrode under test functioning as the working electrode (WE),
the electrode at the inion acting as the reference electrode (RE), and the electrode between
the inion and the ear acting as the counter electrode (CE).
2.4.3. EEG Recording
EEG activity was collected using the OpenBCI Cyton [29]. The low cost, wireless and
wearable emphasis of the research is one of the reasons for the use of this device. The
OpenBCI hardware has been validated against clinical-grade EEG hardware and is using
similar electronics components as most consumer EEG systems [29,30]. The hardware
information for the OpenBCI Cyton is described below in Table 2.
Table 2. Specifications of OpenBCI Cyton board.
Parameters Values
CMRR 110 dB
DC input impedance 500 MΩ
Sampling rate
ADC resolution
250 Hz
24 bits
An Open Source EEG paradigms library, EEG Notebooks [31] was used to conduct
experiments. By combining additional Python scripts with EEG Notebooks, a stimulus
presentation software was created. This library was used to handle Bluetooth
communication with the OpenBCI Cyton Board, data storage and marker assignments of
each stimulus on the raw data. Stimulus presentation and instructions were shown on a
computer running on Windows 7.
The presentation software provided visual cues to notify the participants to keep
their eyes open for one minute and both visual and auditory cues instructed them to close
their eyes for one minute. Auditory and visual stimuli were not provided to evoke
responses in the subjects. Cues were provided solely to keep track of timestamps for
subsequent signal processing. The subjects were briefed on the experiment beforehand,
so the auditory and visual cues served as a time tracker and reminder to keep the behavior
of the subjects consistent with one another. The participants were looking at the computer
screen and focused their gaze on the center of the computer screen during the eyes-open
state. The measurement’s objective was to acquire an EEG recording in different eye states,
and not to localize brain activity in response to a stimulus.

Sensors 2022, 22, 1568 8 of 19
2.5. Data Analysis
The data analysis for the impedance measurements was carried out using MATLAB
2019a (The Mathworks, Natick, MA, USA) [32]. EEG data pre-processing, analysis, and
visualization was conducted using Python. The EEG data pre-processing pipeline made
use of prominent scientific computation and visualization python libraries including
SciPy, MNE, Pandas, NumPy, Matplotlib, etc. The statistical analysis was performed
using IBM SPSS Statistics 28.0.
The impedance measurement data were collected into csv file format for each
recording. These files contained the impedance and phase observed at each of the four
frequency points. The mean and standard deviation of each electrode was calculated
across all of the participants in left and right ear across all frequencies. These results were
then plotted for the system’s impedance to evaluate the electrode’s contact and skin–
electrode behavior.
The signal processing and interpretation performed on the recorded data included
filtering, transforming, and analyzing the data in order to compare each subject, session,
and location statistically. After visually inspecting the data, two subjects showed
corrupted data in a few of the ear channels. Few of the channels had flat lines and nothing
was recorded; this might have been caused by a loose connection on one of the channels.
Data from those subjects were discarded from further investigation. The remaining
participants’ data went through the following steps in the pre-processing pipeline (See
Figure 6): 1. Data restructuring, 2. bandpass filtering, 3. epoch extraction, 4. epoch
cleaning.
Figure 6. EEG data pre-processing pipeline. EEG data consisted of 2 min data of eyes-open and eyes-
closed condition. The raw data were restructured with labels and then bandpass filtered, and split
into epochs. Epochs were cleaned according to epoch acceptance criteria to have labeled data which
were ready for further computations.
1. Restructuring of raw data: First, the data were reorganized to include session-specific
information, such as electrode locations corresponding to channels, left/right ear
information and stimulation conditions, to make further processing steps more
efficient. This produced session-specific information which was stored in unique
labels corresponding to the data.
2. Filtering: The labeled restructured continuous raw data were then frequency filtered
using a 4th order finite impulse response filter (FIR) with a bandpass of 1 to 40 Hz.
The specified bandpass filter level ensured that power line interference and Ac drift
is eliminated.
3. The filtered data were then divided into epochs. Each epoch was composed of 5-s
windows with a 4-s overlap in frequency analysis to allow for more in-depth
investigation (overlapping sliding windows).
Sensors 2022, 22, 1568 9 of 19
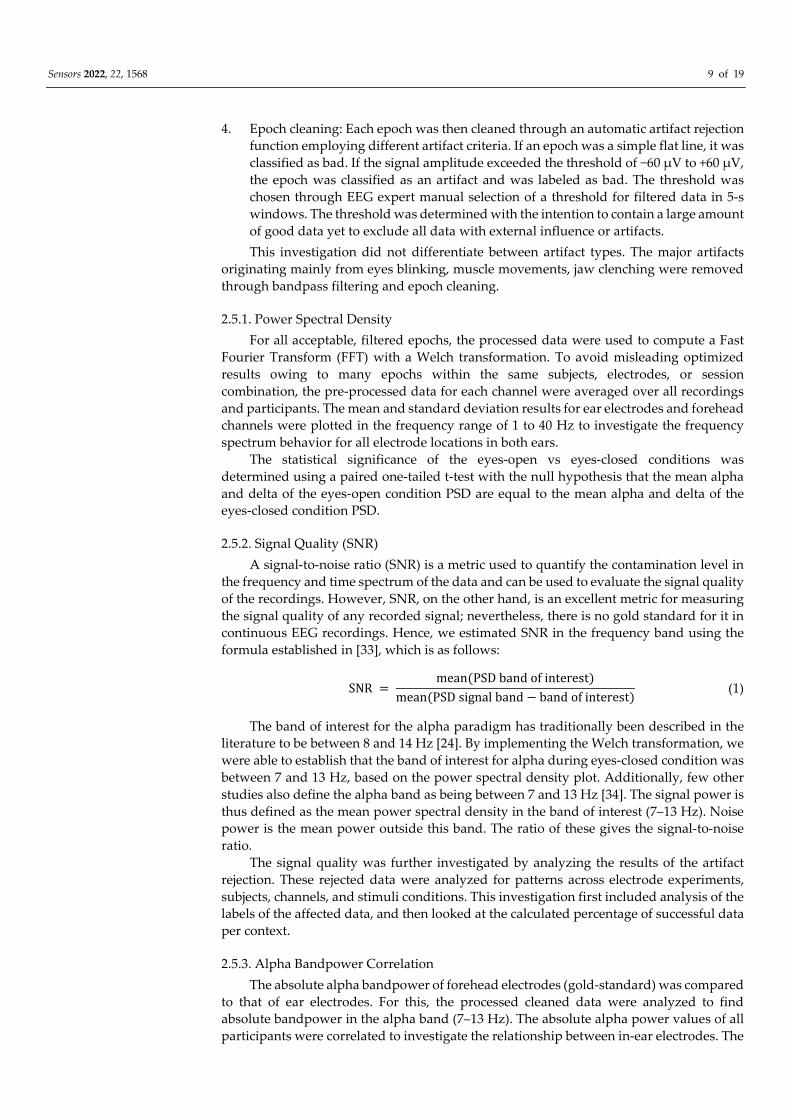
4. Epoch cleaning: Each epoch was then cleaned through an automatic artifact rejection
function employing different artifact criteria. If an epoch was a simple flat line, it was
classified as bad. If the signal amplitude exceeded the threshold of −60 µV to +60 µV,
the epoch was classified as an artifact and was labeled as bad. The threshold was
chosen through EEG expert manual selection of a threshold for filtered data in 5-s
windows. The threshold was determined with the intention to contain a large amount
of good data yet to exclude all data with external influence or artifacts.
This investigation did not differentiate between artifact types. The major artifacts
originating mainly from eyes blinking, muscle movements, jaw clenching were removed
through bandpass filtering and epoch cleaning.
2.5.1. Power Spectral Density
For all acceptable, filtered epochs, the processed data were used to compute a Fast
Fourier Transform (FFT) with a Welch transformation. To avoid misleading optimized
results owing to many epochs within the same subjects, electrodes, or session
combination, the pre-processed data for each channel were averaged over all recordings
and participants. The mean and standard deviation results for ear electrodes and forehead
channels were plotted in the frequency range of 1 to 40 Hz to investigate the frequency
spectrum behavior for all electrode locations in both ears.
The statistical significance of the eyes-open vs eyes-closed conditions was
determined using a paired one-tailed t-test with the null hypothesis that the mean alpha
and delta of the eyes-open condition PSD are equal to the mean alpha and delta of the
eyes-closed condition PSD.
2.5.2. Signal Quality (SNR)
A signal-to-noise ratio (SNR) is a metric used to quantify the contamination level in
the frequency and time spectrum of the data and can be used to evaluate the signal quality
of the recordings. However, SNR, on the other hand, is an excellent metric for measuring
the signal quality of any recorded signal; nevertheless, there is no gold standard for it in
continuous EEG recordings. Hence, we estimated SNR in the frequency band using the
formula established in [33], which is as follows:
SNR = mean(PSD band of interest)
mean(PSD signal band − band of interest) (1)
The band of interest for the alpha paradigm has traditionally been described in the
literature to be between 8 and 14 Hz [24]. By implementing the Welch transformation, we
were able to establish that the band of interest for alpha during eyes-closed condition was
between 7 and 13 Hz, based on the power spectral density plot. Additionally, few other
studies also define the alpha band as being between 7 and 13 Hz [34]. The signal power is
thus defined as the mean power spectral density in the band of interest (7–13 Hz). Noise
power is the mean power outside this band. The ratio of these gives the signal-to-noise
ratio.
The signal quality was further investigated by analyzing the results of the artifact
rejection. These rejected data were analyzed for patterns across electrode experiments,
subjects, channels, and stimuli conditions. This investigation first included analysis of the
labels of the affected data, and then looked at the calculated percentage of successful data
per context.
2.5.3. Alpha Bandpower Correlation
The absolute alpha bandpower of forehead electrodes (gold-standard) was compared
to that of ear electrodes. For this, the processed cleaned data were analyzed to find
absolute bandpower in the alpha band (7–13 Hz). The absolute alpha power values of all
participants were correlated to investigate the relationship between in-ear electrodes. The

Sensors 2022, 22, 1568 10 of 19
Pearson correlation coefficient between in-ear electrodes was evaluated to quantify the
similarity of activity detected by ear electrodes. The data examined were not subjected to
artifact rejection, which means that both good and bad epochs were considered while
analyzing it. The data were compared directly because it was hypothesized that any
artifact detected by one of the electrodes in the ear canal would be also detected by the
neighboring electrodes in the ear channels.
The same method was applied for the evaluation of the correlation coefficient of the
forehead with the in-ear electrodes, as was used for the evaluation of the correlation
coefficient of the in-ear electrodes. However, in this instance, often the forehead lacked
good epochs for some trial sessions. To maintain consistency between the in-ear and
frontal channel data, complete sessions containing bad epochs according to our criteria
were discarded in such instances. This discrepancy is usually a common occurrence since
the forehead electrode locations are likely to pick up different artifacts and different signal
strengths than one would get from the in-ear electrodes. Thus, in the correlation study
between the forehead and in-ear channels, only data containing results for all channels
were evaluated. This ensured that the number of samples for each channel examined in
the correlation remained constant, thus reducing the possibility of a confounding variable.
3. Results and Discussion
3.1. Electrode Skin Contact Impedance
A simplified equivalent circuit model of the skin electrode interface is shown in
Figure 7 [35]. It comprises the electrode lead resistance, RLead; the electrode–gel interface
impedance (a parallel combination of the double-layer capacitance, CDL, and the charge
transfer resistance, RCT); the gel resistance, RGel; the skin impedance (a parallel
combination of a capacitance, CSP, and a resistance, RSP); and the underlying tissue
resistance, RTissue. The equivalent circuit model shown here is a simplification of the
complex electrical properties of the skin. The outermost skin layer, the stratum corneum,
has a high resistance to current transmission. Consequently, the electrode impedance is
dominated by the skin resistance. As a result, its dielectric properties and thin thickness,
the stratum corneum allows capacitive coupling between a metal electrode placed on the
skin’s surface and conductive tissues underneath it. The resistances of the lead, the gel,
and the tissue, as well as of the electrode–gel contact is small in comparison to the skin.
As a result, skin impedance typically predominates in dry electrode contacts.
Figure 7. Electrical equivalent circuit of skin electrode interface [35].
Figure 8 shows the grand average mean impedance magnitude spectra and phase
angle with standard deviation of electrodes for all participants in the ear. The
measurements in both ears are averaged across participants. Table 3 gives exact values of
mean and standard deviations of impedance at 10 Hz. The values range from a minimum

Sensors 2022, 22, 1568 11 of 19
of 10 kΩ to a maximum of 92 kΩ at some locations. When comparing three in-ear locations,
the values are quite similar but reveal large inter-subject variations.
(a) (b)
Figure 8. Mean impedance magnitude (a) and phase angle (b) with standard deviation of electrodes
at in-ear locations E, J and H. n = 8.
Table 3. Magnitude of mean and standard deviation of impedance of the in-ear electrodes at 10
Hz.
Mean (kΩ) Standard Deviation (kΩ)
E 24.9 20.6
J 20.8 16.1
H 21.6 16.3
Mean 22.4 17.7
The quality of biopotential recordings at the skin surface is highly dependent on the
electrode–skin interface. Factors that influence the interface include the shape of the
electrode and how it conforms to the ear canal. Generic earpieces fit comfortably in the
ear canal regardless of the individual’s ear size. If skin electrode contact impedance values
are unstable and high, signal quality is reduced resulting in challenging signal acquisition
[36]. Through the input impedance of the amplifier, the current noise is converted to
voltage noise. Consequently, larger impedances are associated with higher noise levels.
Skin thickness and hydration are crucial variables that influence the conductivity of the
skin inside the ear canal, as is the effect of sebum and the existence of large apocrine glands
[36]. Poor skin conductivity impacts the quality of measurement and is quantified by
impedance checks, considering the behavior of skin–electrode impedance is vital before
signal acquisition.
As indicated in Table 3, the values for the impedance measurements for all electrodes
with a mean of 22.4 kΩ align with the in-ear wet electrode impedance values found in the
literature, 34 kΩ (SD = 37 kΩ) [37]. These values also align with the impedance values of
cloth electrodes found in the literature, 10 kΩ median with highest impedance on one of
the subjects being 19 kΩ [38]. The standard deviation values are significantly higher and
are roughly equivalent to the mean values. This high standard deviation indicates that
impedance magnitude and phase varies significantly across individuals, which has
already been shown in previous research [37]. This may be related to the individual
differences in skin properties, including stratum corneum thickness [36]. There is no
significant difference in electrode location. This could be attributed to the uniform skin
composition in the outer ear canal. Therefore, the placement does not have a significant
impact on the signal pickup. In earlier findings [39], for 10 individuals, position E had the
lowest impedance, but when the number of subjects is decreased to 8, the location with
the lowest impedance value changes, showing once again the significant inter subject
variability. The phase plot highlights the capacitive effect of the total impedance which

Sensors 2022, 22, 1568 12 of 19
also significantly changes between individuals. The ADS1299 chip used in the Cyton has
an input impedance of 1 GΩ. According to [40], a skin impedance of 40 kΩ resulted in no
distortion for a 200 MΩ amplifier. The skin contact impedance up to 1 MΩ, for the
OpenBCI Cyton, nevertheless, will lead to reliable signal acquisition (<0.1% error). Thus,
the impedance values observed are acceptable for EEG data acquisition at all three
locations.
3.2. Power Spectral Density (PSD)
Figures 9 and 10 display the power spectral density of the data for the left and right
ear for eyes-open and eyes-closed conditions averaged across subjects. The alpha
modulation can be observed for all electrode locations in both ears during the eyes-closed
condition. All electrodes show a clear peak at 10 Hz. Visual inspection of the graph
indicates similarities between the forehead and ear locations. The graph shows activity
recorded from the forehead with a higher amplitude compared to the ear electrode
locations. It has also been observed in the literature that scalp electrodes have a higher
amplitude than in-ear electrodes [15], potentially due to an increased electrode size.
However, a thicker bone structure between the brain and the surface of the ear canal, as
opposed to the bone structure between the brain and the surface of the scalp, may also
play an important role [14]. After a visual examination, there is no apparent difference
between the different in-ear electrode locations. It is possible that this is because the ear
canal is relatively narrow, and all positions are in close proximity in comparison to the
distance of the ear canal to the signal sources inside the brain. All ear electrode waveforms
closely overlap each other and follow the shape of forehead electrodes. The standard
deviation indicates that the amplitude of the alpha peak varies across individuals.
Individuals process information differently, using distinct regions of the brain, depending
on their cognitive style. Individuals’ mental states during data acquisition may also
contribute significantly to alpha generation. As a result, the total height and width of the
alpha peak would be expected to vary across different people. The statistical significance
tests between the eyes-open and eyes-closed conditions of alpha (Table 4) indicate that the
findings are statistically significant across all subjects for both ears (p ≤ 0.002).
The Delta power was also significantly increased in the eyes-closed condition
compared to the eyes-open condition for the frontal electrodes. Delta activity has been
shown to originate in the frontal lobes during the eyes-closed condition [41]. As a result,
the large magnitude of delta can be observed when the eyes are closed from frontal
electrodes. T. Harmony hypothesized the presence of two distinct types of behavioral
inhibition, both of which are reflected by delta waves [42]. ‘Class I inhibition’ refers to the
complete deactivation of an excitatory process, as in sleep, resulting in a relaxed, less
active state. During the performance of a mental task, ‘Class II inhibition’ would
selectively suppress incorrect or irrelevant brain activity. As shown in Figures 8 and 9, the
delta waves that were predominantly observed from frontal electrodes represent ‘Class I
inhibition’ waves because they appear to be in the eyes-closed condition, suggesting that
the subjects were in the relaxed state. Additionally, the delta power of in-ear electrodes
was increased, however, not as much as that of forehead electrodes. However, statistical
tests revealed this delta inhibition was also recorded by the ear electrodes, ELH and ERH
(p < 0.05), demonstrating that this delta activation can also be recorded from the ear. The
explanation for other in-ear electrodes not recording the same activity could not be
determined as all three electrodes exhibit similar impedance. Nevertheless, statistical
results demonstrated that in-ear electrodes, like forehead electrodes, can identify delta
deactivation even when it is not evident in the graphs.

Sensors 2022, 22, 1568 13 of 19
(a) (b)
Figure 9. Power spectral density of electrodes for left ear measurements of eyes-open (a) and eyes-
closed (b) conditions.
(a) (b)
Figure 10. Power spectral density of electrodes for right ear measurements of eyes-open (a) and
eyes-closed (b) conditions.
Table 4. t test statistics of electrodes in the left and right ear between eyes-open and eyes-closed
conditions.
Delta
(δ)
Alpha
(α)
T Value p Value T Value p Value
ELE 1.656 0.710 3.652 0.004
ELJ 1.612 0.750 4.233 0.002
ELH 2.945 0.011 3.897 0.003
Fp1 3.314 0.006 4.061 0.002
ERE 1.876 0.051 3.208 0.007
ERJ 1.655 0.071 3.267 0.007
ERH 2.073 0.038 3.271 0.007
Fp2 3.046 0.009 4.159 0.002
3.3. Signal Quality
The contaminated epochs, labeled ‘bad’, were removed after the pre-processing steps
described in Section 2.5.3. Data quality was assessed by calculating the percentage of good
data at each electrode location, and a mean and standard deviation were computed for all
trials across all participants. Table 5 summarizes the amount of good data for both ears
while the eyes are open and while closed. It can be observed that there is over 98% good
data for ear electrodes, irrespective of ear and location in the ear canal. With 46.36% (Fp1,
eyes-open) to 78.67% (Fp1, eyes-closed), forehead electrodes have a lower percentage of
good data. Furthermore, the percentage of good data is reduced for the eyes-open
condition compared to the eyes-closed condition, from 46.36% (Fp1) to 46.52% (Fp2). The
investigation into bad data reveals many artifacts on forehead location as there were high

Sensors 2022, 22, 1568 14 of 19
amounts of artifacts in the eyes-open condition, which may have been related to the
participants’ eye movements, facial muscles, or blinking. Figures 11 and 12 illustrate good
and bad epochs for ear and forehead locations. The magnitude of artifacts picked up by
the forehead appears to be very high in general, while the magnitude of artifacts picked
up by the ears clearly seems relatively small. R. Barry et al. employed Ag/AgCl electrodes
and studied an eye blinking artifact on the forehead at the Fp2 position [41]. They
observed distinct bursts of activity during blinking. The artifacts they observed resembles
the eyes-open artifacts observed in Figures 11 and 12. This implies that, while recording
EEG signals, the forehead location is more sensitive to eye movement artifacts compared
to in-ear electrodes. Furthermore, the significant standard deviation in the percentage of
acceptable data from the frontal electrodes indicates inter-subject variability. This suggest
that some participants’ movements were more prominent than others and that artifact
contamination is extremely subjective in general.
Table 5. Amount of good data for left and right ear in eyes-open and eyes-closed conditions.
Left Ear Right Ear
Locations Mean
(%)
Standard
Deviation Locations
Mean
(%)
Standard
Deviation
Eyes
Open
ELE 98.45 1.46 ERE 99.47 1.10
ELJ 98.56 2.12 ERJ 99.17 1.55
ELH 99.13 1.37 ERH 98.79 1.68
Fp1 46.36 40.73 Fp2 46.52 42.19
Eyes
Closed
ELE 99.62 1.07 ERE 99.62 1.07
ELJ 99.05 1.80 ERJ 100 0
ELH 99.62 1.07 ERH 99.09 1.71
Fp1 78.67 24.83 Fp2 77.05 27.20
(a) (b)
(c) (d)
Figure 11. For eyes-open (EO) and the eyes-closed (EC) conditions, the epochs of the ear electrodes
are shown. Two distinct epochs are indicated by two distinct colors, (a) good epochs for eyes-open,
(b) bad epochs for eyes-open, (c) good epochs for eyes-closed, (d) bad epochs for eyes-closed.

Sensors 2022, 22, 1568 15 of 19
(a) (b)
(c) (d)
Figure 12. For eyes-open (EO) and the eyes-closed (EC) conditions, the epochs of the forehead
electrodes are shown. Two distinct epochs are indicated by two distinct colors, (a) good epochs for
eyes-open, (b) bad epochs for eyes-open, (c) good epochs for eyes-closed, (d) bad epochs for eyes-
closed.
After pre-processing and removing bad epochs, the signal-to-noise ratio was
calculated on the filtered data. The signal-to-noise ratio was averaged over all participants
and trials. Figure 13 shows the mean and standard deviation of the SNR across each
electrode to aid in describing the signal quality. The pre-processing pipeline removed the
noise in the signal and improved the SNR. As a result, the values obtained at the frontal
location, Fp1, with a mean of 8, and Fp2, with a mean of 7, are rather higher than the
values obtained at the in-ear locations. The SNR values at the forehead are comparable to
those reported in the literature at the scalp [33]. In-ear electrodes also exhibit a good SNR
for EEG data recording, with the lowest value being 5 for the right ear, and the highest
value being 6 for the left ear. Since wet gel electrodes cannot be placed in the ear, the SNR
values for in-ear must be compared to the dry electrodes, and dry electrodes in the
literature have an SNR ranging from 4.3 to 8.9 [33]. Although the SNR is lower for in-ear
locations, the variance across individuals is also smaller. Typically, low impedance values
signify a low signal to noise ratio; however, there was no correlation observed between
the defined signal quality and the skin electrode contact impedance.
Figure 13. Signal-to-noise ratio (SNR) of electrodes on the left and right sides of the head.

Sensors 2022, 22, 1568 16 of 19
3.4. Alpha Bandpower Correlation
The Pearson correlation coefficient between three in-ear electrodes and frontal
electrodes is shown in Figure 14. The in-ear locations are highly correlated with each
other, with a correlation coefficient from 0.98 to 0.99 (p value = 0). The results are
statistically significant. When comparing the PSDs seen in Figures 8 and 9, the alpha
activity across in-ear locations is extremely similar since the waveforms overlap with one
another. The observed strong correlation indicates a similarity between in-ear locations.
Hence, there is no statistically significant difference between the three in-ear locations for
alpha activity detection. It may be because the electrodes were near one another and,
therefore, the activity detected by them was very similar. The Pearson correlation
coefficient between in-ear electrodes and forehead electrodes was also calculated. For both
ears, all three in-ear channels show a significant value of correlation of 0.9 to 0.92 with a
p-value of <0.001. Earlier in-ear locations have been correlated to the T8 position on the
scalp, with a high correlation coefficient (0.96) for the alpha and mismatch negativity
paradigm [13,42]. In this study, all three in ear locations with high correlation coefficients
suggest that the potentials measured at forehead locations and in-ear locations are
identical. The forehead and in-ear electrodes share the same reference and the distance
between them was small compared to their distance to the reference electrode, so the
potentials measured by electrodes seems to be nearly identical. This confirms that the
activity measured at in-ear locations is of the same neuronal activity as at the forehead
locations, validating in-ear EEG as a comparable and efficient way for measuring brain
activity as compared with forehead electrodes.
(a) (b)
Figure 14. Pearson correlation coefficient matrix of in-ear and forehead locations for left (a) and right
ear (b).
4. Conclusions
The development of ear-EEG systems represents an important step towards
ubiquitous EEG that is adapted to the lifestyle of users. Unobtrusive EEG opens up new
use cases and application areas in mobile brain imaging. For mobile EEG devices, many
designs focus on measuring signals at the forehead since this is a relatively easy to access
location on many users as it avoids the complications of using through-hair electrodes on
the scalp, which can often present problems with comfort and usability with different hair
types and styles across the world. The current work investigated the performance
between forehead and ear canal located electrodes to establish the differences in
performance, but also to establish the feasibility of creating universal fit electrodes located
in the ear canal for mobile BCI design.
The current work draws a strong comparison to previous research in the in-ear EEG
field. Previously, D. Looney et al. demonstrated a correlation coefficient of 0.95, 0.83
between the in-ear and mastoid (M1) positions and between the in-ear and T7 positions
when using in-ear Ag/AgCl electrodes for the alpha attenuation study [11]. Between in-
ear positions, the highest correlation coefficient of 0.99 was observed. This is consistent

Sensors 2022, 22, 1568 17 of 19
with the results obtained with electrodes in the current study. Mikkelsen et al. established
that the ratio of alpha power between closed and open eyes for in-ear electrodes is around
1.5. Visual examination of alpha powers indicates that the ratio for alpha power will be
between 1.5 and 2 for the current in-ear electrode results [10]. Kappel et al. showed
successful dry in-ear alpha recordings referenced to a Cz position [21]. While these
investigations all confirmed the successful recording of in-ear electroencephalograms,
there is no information on their comparison to forehead locations. Our investigation
established a correlation coefficient of 0.92 of in-ear locations with the forehead.
It was shown that the difference in motion artifacts related to eye movement study
can be reduced with ear EEG, as compared to the forehead. This suggests that a BCI
system designed based on in-ear EEG could capture more stable brain activity data than
using forehead located electrodes. Although forehead EEG devices have been around for
many years, they have not seen wide adoption. In-ear EEG ideally has a place in
neuroimaging alongside high resolution full-scalp EEG systems. Full-scalp systems are
ideally suited to clinics, hospitals, and laboratories, while ear EEG systems may be used
in everyday life to capture brain activity at a lower signal spatial resolution in the brain,
but over longer periods of time. Forehead systems may be advantageous for some
applications such as sleep, or when integrated into helmets (sports, space, hazardous
applications). If integrated into earbud headphones, however, in-ear EEG may hold great
promise as a candidate to enable “every day” BCI designs.
Validating alpha activity in the ear with a universal earpiece system versus the
forehead is important as there are many applications in wellness, and potentially in other
areas, where ubiquitous brain imaging measured over the daily life of a person may
provide insights not obtainable with other systems that cannot integrate as discreetly in
society (such as forehead-based electrode systems). Future work will build upon these
results to look at different frequency bands and frequency response characterization such
as delta, theta, and gamma activity. The reliable classification of EEG at the ear may also
lead to the investigation of sleep micro-architectures, such as k-complexes and spindles,
that may offer new ways to characterize sleep behavior.
Some of the limitations of this research were as follows. One of these being the
paradigm used was only eyes-open and eyes-closed alpha. Future research may expand
on a variety of other paradigms, including mismatch negativity (MMN) and, more
importantly, the Auditory steady state response (ASSR), which is utilized with in-ear
electrodes. In addition to adopting various other paradigms, the population size can also
be expanded.
Future work will build upon these results to look at different frequency bands and
frequency response characterization, such as theta and gamma activity. The reliable
classification of EEG at the ear may also lead to the investigation of sleep micro-
architectures, such as k-complexes and spindles, which will also offer areas to expand into
sleep characterization. The use of electrodes based on expanded foam and conductive
fabric provided a good system to investigate electrode placement as well as performance.
The next step in this body of work is to establish a material system which provides a stable
dry interface for electrode performance and conformability, as well as a path towards
industrialization. This can support the scaling of the ear EEG electrode technologies and
provide more ways to integrate brain computer interface designs into consumer devices,
such as earbuds and headphone designs.
Author Contributions: Conceptualization, S.M. and A.H.; Methodology, S.M.; Data preprocessing,
A.H.; Data visualization, S.M.; Writing—Original Draft Preparation, S.M.; Writing—Review &
Editing, S.M., A.H., M.M. and M.T.; Supervision, M.M., M.T. and M.B. All authors have read and
agreed to the published version of the manuscript.
Funding: Funding was provided by IDUN Technologies AG in the form of an intern salary to the
first author, Swati Mandekar.

Sensors 2022, 22, 1568 18 of 19
Institutional Review Board Statement: The study was conducted according to the guidelines of the
Declaration of Helsinki and did not fall within the scope of the Human Research Act (HRA), hence
ethical review and approval were waived for this study. Clarification of ethical responsibility from
the Zürich ethics committee, however, has been carried out (Req-2020-01310).
Informed Consent Statement: Informed consent was obtained from all subjects involved in the
study prior to the measurements.
Data Availability Statement: The dataset supporting the conclusions of this article is not available
due to privacy and ethical reasons.
Acknowledgments: We would like to thank all the participants for their patience and the time that
they dedicated to this research. Katja Junker provided invaluable assistance throughout the fabrica-
tion of the earpieces and electrodes. Cao Tri Do’s comments on the draft and fruitful discussions
were much appreciated.
Conflicts of Interest: The research work was carried out as a Master’s thesis project at IDUN Tech-
nologies AG, where Swati Mandekar, Abigail Holland, Moritz Thielen and Mark Melnykowycz
were employed during the research study.
References
1. Mikkelsen, K.B.; Tabar, Y.R.; Kappel, S.L.; Christensen, C.B.; Toft, H.O.; Hemmsen, M.C.; Rank, M.L.; Otto, M.; Kidmose, P.
Accurate whole-night sleep monitoring with dry-contact ear-EEG. Sci. Rep. 2019, 9, 16824, https://doi.org/10.1038/s41598-019-
53115-3.
2. Kalas, M.S.; Momin, B.F. Stress Detection and Reduction using EEG Signals. In Proceedings of the 2016 International Conference
on Electrical, Electronics, and Optimization Techniques (ICEEOT), Chennai, India, 3–5 March 2016.
3. Marketwatch PressRelease. Brain Monitoring Devices Global Market: Global Industry, Trends, Market Size, Forecast up to 2030.
Available oneline: https://www.marketwatch.com/press-release/brain-monitoring-devices-global-market-global-industry-
trends-market-size-forecast-up-to-2030-2022-01-06 (accessed on 7 Janurary 2022).
4. The Insight Partners. EEG Devices Market to Grow at a CAGR of 7.5% to Reach US $1699.52 Million from 2021 to 2028. 2021.
Available online: https://www.theinsightpartners.com/reports/eeg-devices-market/ (accessed on 7 January 2022).
5. Yao, S.; Zhu, Y. Nanomaterial-Enabled Dry Electrodes for Electrophysiological Sensing: A Review. JOM 2016, 68, 1145–1155,
https://doi.org/10.1007/s11837-016-1818-0.
6. InteraXon Muse Homepage. Muse Headband Homepage. 2022. Available online: https://choosemuse.com/ (accessed on 7
January 2022).
7. Dreem Homepage. 2022. Available online: https://dreem.com (accessed on 7 January 2022).
8. NPR Page. 2022. Available online: https://www.npr.org/sections/health-shots/2014/03/13/289787263/electronic-headband-
prevents-migraines-with-tiny-jolts?t=1634526717429 (accessed on 7 January 2022).
9. Neurosky Homepage. 2022. Available online: http://neurosky.com/ (accessed on 7 January 2022).
10. Mikkelsen, K.B.; Kappel, S.L.; Mandic, D.P.; Kidmose, P. EEG Recorded from the Ear: Characterizing the Ear-EEG Method.
Front. Neurosci. 2015, 9, 438, https://doi.org/10.3389/fnins.2015.00438.
11. Looney, D.; Park, C.; Kidmose, P.; Rank, M.L.; Ungstrup, M.; Rosenkranz, K.; Mandic, D.P. An in-the-ear platform for recording
electroencephalogram. In Proceedings of the 2011 Annual International Conference of the IEEE Engineering in Medicine and
Biology Society, Boston, MA, USA, 30 August–3 September 2011; Volume 2011, pp. 6882–6885,
https://doi.org/10.1109/IEMBS.2011.6091733.
12. Dong, H.; Matthews, P.M.; Guo, Y. A new soft material based in-the-ear EEG recording technique. In Proceedings of the 2016
38th Annual International Conference of the IEEE Engineering in Medicine and Biology Society (EMBC), Orlando, FL, USA, 16–
20 August 2016; Volume 2016, pp. 5709–5712, https://doi.org/10.1109/EMBC.2016.7592023.
13. Wang, Y.-T.; Nakanishi, M.; Kappel, S.L.; Kidmose, P.; Mandic, D.P.; Wang, Y.; Cheng, C.-K.; Jung, T.-P. Developing an online
steady-state visual evoked potential-based brain-computer interface system using EarEEG. In Proceedings of the 2015 37th
Annual International Conference of the IEEE Engineering in Medicine and Biology Society (EMBC), Milan, Italy, 25–29 August
2015; Volume 2015, pp. 2271–2274, https://doi.org/10.1109/EMBC.2015.7318845.
14. Kidmose, P.; Looney, D.; Ungstrup, M.; Rank, M.L.; Mandic, D.P. A Study of Evoked Potentials From Ear-EEG. IEEE Trans.
Biomed. Eng. 2013, 60, 2824–2830, https://doi.org/10.1109/TBME.2013.2264956.
15. Zibrandtsen, I.; Kidmose, P.; Otto, M.; Ibsen, J.; Kjaer, T. Case comparison of sleep features from ear-EEG and scalp-EEG. Sleep
Sci. 2016, 9, 69–72, https://doi.org/10.1016/j.slsci.2016.05.006.
16. Zhou, M.; Tian, C.; Cao, R.; Wang, B.; Niu, Y.; Hu, T.; Guo, H.; Xiang, J. Epileptic Seizure Detection Based on EEG Signals and
CNN. Front. Neuroinform. 2018, 12, 95, https://doi.org/10.3389/fninf.2018.00095.
17. Lagopoulos, J.; Xu, J.; Rasmussen, I.; Vik, A.; Malhi, G.S.; Eliassen, C.F.; Arntsen, I.E.; Sæther, J.G.; Hollup, S.; Holen, A.; et al.
Increased Theta and Alpha EEG Activity During Nondirective Meditation. J. Altern. Complement. Med. 2009, 15, 1187–1192,
https://doi.org/10.1089/acm.2009.0113.

Sensors 2022, 22, 1568 19 of 19
18. Lam, A.D.; Sarkis, R.A.; Pellerin, K.R.; Jing, J.; Dworetzky, B.A.; Hoch, D.B.; Jacobs, C.S.; Lee, J.W.; Weisholtz, D.S.; Zepeda, R.;
et al. Association of epileptiform abnormalities and seizures in Alzheimer disease. Neurology 2020, 95, e2259–e2270,
https://doi.org/10.1212/WNL.0000000000010612.
19. Kirschfeld, K. The physical basis of alpha waves in the electroencephalogram and the origin of the “Berger effect”. Biol. Cybern.
2005, 92, 177–185, https://doi.org/10.1007/s00422-005-0547-1.
20. Debener, S.; Emkes, R.; De Vos, M.; Bleichner, M. Unobtrusive ambulatory EEG using a smartphone and flexible printed
electrodes around the ear. Sci. Rep. 2015, 5, 16743, https://doi.org/10.1038/srep16743.
21. Kappel, S.L.; Rank, M.L.; Toft, H.O.; Andersen, M.; Kidmose, P. Dry-Contact Electrode Ear-EEG. IEEE Trans. Biomed. Eng. 2019,
66, 150–158, https://doi.org/10.1109/TBME.2018.2835778.
22. Asadi, F.; Ghalam, K.B. Detection of Autism with Electroencephalographic Signals and Comparison with Healthy People Using
Genetic Algorithm Network. Signal Processing Renew. Energy 2019, 3, 35–48.
23. Lee, J.H.; Gamper, H.; Tashev, I.; Dong, S.; Ma, S.; Remaley, J.; Holbery, J.D.; Yoon, S.H. Stress Monitoring using Multimodal
Bio-sensing Headset. In Proceedings of the Extended Abstracts of the 2020 CHI Conference on Human Factors in Computing
Systems, Honolulu, HI, USA, 25–30 April 2020, https://doi.org/10.1145/3334480.3382891.
24. Foxe, J.J.; Snyder, A.C. The Role of Alpha-Band Brain Oscillations as a Sensory Suppression Mechanism during Selective
Attention. Front. Psychol. 2011, 2, 154, https://doi.org/10.3389/fpsyg.2011.00154.
25. Klimesch, W. Full-length review EEG alpha and theta oscillations reflect cognitive and memory performance: A review and
analysis. Brain Res. Rev. 1999, 29, 169–195.
26. Başar, E. A review of alpha activity in integrative brain function: Fundamental physiology, sensory coding, cognition and
pathology. Int. J. Psychophysiol. 2012, 86, 1–24, https://doi.org/10.1016/j.ijpsycho.2012.07.002.
27. Ambu Sensors Product Page. 2022. Available online: https://www.ambu.com/cardiology/ecg-electrodes/product/ambu-
bluesensor-l (accessed on 7 January 2022).
28. Paul, A.; Deiss, S.R.; Tourtelotte, D.; Kleffner, M.; Zhang, T.; Cauwenberghs, G. Electrode-Skin Impedance Characterization of
In-Ear Electrophysiology Accounting for Cerumen and Electrodermal Response. In Proceedings of the International IEEE/EMBS
Conference on Neural Engineering (NER), San Francisco, CA, USA, 20–23 March 2019; pp. 855–858,
https://doi.org/10.1109/NER.2019.8716918.
29. Frey, J. Comparison of a consumer grade EEG amplifier with medical grade equipment in BCI applications. In Proceedings of
the International BCI meeting, Asilomar, CA, USA, 30 May–3 June 2016.
30. Sawangjai, P.; Hompoonsup, S.; Leelaarporn, P.; Kongwudhikunakorn, S.; Wilaiprasitporn, T. Consumer Grade EEG Measuring
Sensors as Research Tools: A Review. IEEE Sens. J. 2020, 20, 3996–4024, https://doi.org/10.1109/JSEN.2019.2962874.
31. EEG Notebooks. 2022. Available online: https://github.com/NeuroTechX/eeg-notebooks (accessed on on 7 January 2022 ).
32. The MathWorks Inc. MATLAB. R2019a; Mathworks Inc.: Sherborn, MA, USA, 2019.
33. Tautan, A.-M. Signal Quality in Dry Electrode EEG and the Relation to Skin-electrode Contact Impedance Magnitude. In
Proceedings of the International Conference on Biomedical Electronics and Devices, Angers, France, 3–6 March 2014; pp. 12–22,
https://doi.org/10.5220/0004738700120022.
34. Halgren, M.; Ulbert, I.; Bastuji, H.; Fabó, D.; Erőss, L.; Rey, M.; Devinsky, O.; Doyle, W.K.; Mak-McCully, R.; Halgren, E.; et al.
The generation and propagation of the human alpha rhythm. Proc. Natl. Acad. Sci. USA 2019, 116, 23772–23782,
https://doi.org/10.6084/m9.figshare.9927125.v2.
35. McAdams, E. Bioelectrodes. In Encyclopedia of Medical Devices and Instrumentation; John Wiley & Sons, Inc.: Hoboken, NJ, USA,
2006, https://doi.org/10.1002/0471732877.emd013.
36. Edelberg, R. Relation of electrical properties of skin to structure and physiologic state. J. Investig. Dermatol. 1977, 69, 324–327,
https://doi.org/10.1111/1523-1747.ep12507771.
37. Kappel, S.L.; Kidmose, P. Study of impedance spectra for dry and wet EarEEG electrodes. In Proceedings of the Annual
International Conference of the IEEE Engineering in Medicine and Biology Society (EMBS), Milan, Italy, 25–29 August 2015;
Volume 2015, pp. 3161–3164, https://doi.org/10.1109/EMBC.2015.7319063.
38. Goverdovsky, V.; Looney, D.; Kidmose, P.; Mandic, D.P. In-Ear EEG From Viscoelastic Generic Earpieces: Robust and
Unobtrusive 24/7 Monitoring. IEEE Sensors J. 2016, 16, 271–277, https://doi.org/10.1109/JSEN.2015.2471183.
39. Mandekar, S.; Jentsch, L.; Lutz, D.K.; Behbahani, D.M.; Melnykowycz, M. Earable Design Analysis for Sleep EEG Measurements.
In Proceedings of the Adjunct Proceedings of the 2021 ACM International Joint Conference on Pervasive and Ubiquitous
Computing and Proceedings of the 2021 ACM International Symposium on Wearable Computers, Virtual, 21–26 September
2021; pp. 171–175, https://doi.org/10.1145/3460418.3479328.
40. Spinelli, E.; Haberman, M. Insulating electrodes: A review on biopotential front ends for dielectric skin-electrode interfaces.
Physiol. Meas. 2010, 31, S183–S198, https://doi.org/10.1088/0967-3334/31/10/S03.
41. Barry, R.J.; Clarke, A.R.; Johnstone, S.; Magee, C.; Rushby, J. EEG differences between eyes-closed and eyes-open resting
conditions. Clin. Neurophysiol. 2007, 118, 2765–2773, https://doi.org/10.1016/j.clinph.2007.07.028.
42. Harmony, T.; Fernández, T.; Silva-Pereyra, J.; Bernal, J.; Díaz-Comas, L.; Reyes, A.; Marosi, E.; Rodríguez, M.; Rodríguez, M.
EEG delta activity: An indicator of attention to internal processing during performance of mental tasks. Int. J. Psychophysiol.
1996, 24, 161–171, https://doi.org/10.1016/S0167-8760(96)00053-0.