Frequent overexpression of HMGA1 and 2 in gastroenteropancreatic neuroendocrine tumours and its...
10
Frequent overexpression of HMGA1 and 2 in gastroenteropancreatic neuroendocrine tumours and its relationship to let-7 downregulation MM Rahman 1 , ZR Qian * ,1 , EL Wang 1 , R Sultana 1 , E Kudo 1 , M Nakasono 1 , T Hayashi 2 , S Kakiuchi 3 and T Sano * ,1 1 Department of Pathology, Institute of Health Biosciences, University of Tokushima Graduate School, Tokushima, Japan; 2 Department of Pathology, Faculty of Medicine, Kagawa University, Takamatu, Japan; 3 Department of Internal Medicine and Molecular Therapeutics, Institute of Health Biosciences University of Tokushima Graduate School, Tokushima, Japan The molecular pathogenesis of gastroenteropancreatic (GEP) neuroendocrine tumours (NETs) remains to be elucidated. High- mobility group A (HMGA) proteins play important roles in the regulation of transcription, differentiation, and neoplastic transformation. In this study, the expression of HMGA1 and HMGA2 was studied in 55 GEP NETs. Overexpression of HMGA1 and 2 was frequently detected in GEP NETs compared with normal tissues. Nuclear immunostaining of HMGA1 and 2 was observed in GEP NETs (38 of 55, 69%; 40 of 55, 73%, respectively). High-mobility group A2 expression increased from well-differentiated NET (WNET) to well-differentiated neuroendocrine carcinoma (WNEC) and poorly differentiated NEC (PNEC) (Po0.005) and showed the highest level in stage IV tumours (Po0.01). In WNECs, the expression of HMGA1 and 2 was significantly higher in metastatic tumours than those without metastasis (Po0.05). Gastroenteropancreatic NETs in foregut showed the highest level of HMGA1 and 2 expressions. MIB-1 labelling index (MIB-1 LI) correlated with HMGA1 and 2 overexpression (R ¼ 0.28, Po0.05; R ¼ 0.434, Po0.001; respectively) and progressively increased from WNETs to WNECs and PNECs (Po0.001). Let-7 expression was addressed in 6 normal organs, 30 tumour samples, and 24 tumour margin non-tumour tissues. Compared with normal tissues, let-7 downregulation was frequent in NETs (19 of 30, 63%). Higher expression of HMGA1 and 2 was frequently observed in tumours with let-7 significant reduction (53, 42%, respectively). The reverse correlation could be detected between HMGA1 and let-7 (Po0.05). Our findings suggested that HMGA1 and 2 overexpression and let-7 downregulation might relate to pathogenesis of GEP NETs. British Journal of Cancer (2009) 100, 501 – 510. doi:10.1038/sj.bjc.6604883 www.bjcancer.com Published online 20 January 2009 & 2009 Cancer Research UK Keywords: GEP NETs; HMGA1; HMGA2; let-7 Although the gastrointestinal (GI) tract and pancreatic organ have the largest population of endocrine cells, gastroenteropancreatic (GEP) neuroendocrine tumours (NETs) are rare with an age- adjusted annual incidence of 2.5 – 4.5 per 100 000 (Maggard et al, 2004). However, their incidence is increasing by approximately 6% per year (Gustafsson et al, 2008). Gastroenteropancreatic NETs comprise a heterogeneous group of neoplasms arising from the diffuse neuroendocrine system and are divided by their embryo- logical site of origin into foregut, midgut, and hindgut tumours (Maggard et al, 2004). These tumours strongly differ from each other on the basis of different pathogenetic, clinical, functional, histological, and prognostic patterns (Klo ¨ppel et al, 2004). The molecular mechanisms of GEP NETs tumourigenesis are poorly understood (Zikusoka et al, 2005). The high-mobility group A (HMGA) proteins are non-histone chromosomal proteins that bind through their AT-binding motifs to the minor groove of AT-rich DNA strands. They have no intrinsic transcriptional activity but can modulate transcription by altering chromatin architecture (Reeves and Nissen, 1990; Thanos and Maniatis, 1992; Thanos et al, 1993). The two types of HMGA protein, HMGA1 and HMGA2, have similar functions and are encoded by two different genes at chromosomal loci 6p21.3 and 12q15, respectively (Johnson et al, 1989). High-mobility group A proteins are widely expressed during embryogenesis, whereas their expression is low or absent in normal adult tissues (Zhou et al, 1995; Chiappetta et al, 1996). High-mobility group A proteins are involved in many diverse biological processes such as regulation of transcription, embryogenesis, differentiation, neoplastic trans- formation, and integration, and expression of viral genomes (Sgarra et al, 2004). Both HMGA1 and 2 proteins are overexpressed in several experimental and human malignancies. Overexpression of HMGA1 has been noted in different cancer types and it has been recognised as a good target for therapeutic intervention in pancreatic cancer. High-mobility group A2 overexpression is a hallmark of various benign and malignant tumours and is also associated with a highly malignant phenotype and is a poor prognostic index (Fusco and Fedele, 2007). However, there is no study to detect HMGA proteins expression and to evaluate their role in GEP NETs. Received 9 October 2008; revised 15 December 2008; accepted 15 December 2008; published online 20 January 2009 *Correspondence: Dr ZR Qian; E-mail: [email protected] or Dr T Sano; E-mail: [email protected] British Journal of Cancer (2009) 100, 501 – 510 & 2009 Cancer Research UK All rights reserved 0007 – 0920/09 $32.00 www.bjcancer.com Molecular Diagnostics
-
Upload
independent -
Category
Documents
-
view
2 -
download
0
Transcript of Frequent overexpression of HMGA1 and 2 in gastroenteropancreatic neuroendocrine tumours and its...
Frequent overexpression of HMGA1 and 2 ingastroenteropancreatic neuroendocrine tumours and itsrelationship to let-7 downregulation
MM Rahman1, ZR Qian*,1, EL Wang1, R Sultana1, E Kudo1, M Nakasono1, T Hayashi2, S Kakiuchi3 and T Sano*,1
1Department of Pathology, Institute of Health Biosciences, University of Tokushima Graduate School, Tokushima, Japan; 2Department of Pathology,Faculty of Medicine, Kagawa University, Takamatu, Japan; 3Department of Internal Medicine and Molecular Therapeutics, Institute of Health BiosciencesUniversity of Tokushima Graduate School, Tokushima, Japan
The molecular pathogenesis of gastroenteropancreatic (GEP) neuroendocrine tumours (NETs) remains to be elucidated. High-mobility group A (HMGA) proteins play important roles in the regulation of transcription, differentiation, and neoplastictransformation. In this study, the expression of HMGA1 and HMGA2 was studied in 55 GEP NETs. Overexpression of HMGA1 and2 was frequently detected in GEP NETs compared with normal tissues. Nuclear immunostaining of HMGA1 and 2 was observed inGEP NETs (38 of 55, 69%; 40 of 55, 73%, respectively). High-mobility group A2 expression increased from well-differentiated NET(WNET) to well-differentiated neuroendocrine carcinoma (WNEC) and poorly differentiated NEC (PNEC) (Po0.005) and showedthe highest level in stage IV tumours (Po0.01). In WNECs, the expression of HMGA1 and 2 was significantly higher in metastatictumours than those without metastasis (Po0.05). Gastroenteropancreatic NETs in foregut showed the highest level of HMGA1 and2 expressions. MIB-1 labelling index (MIB-1 LI) correlated with HMGA1 and 2 overexpression (R¼ 0.28, Po0.05; R¼ 0.434,Po0.001; respectively) and progressively increased from WNETs to WNECs and PNECs (Po0.001). Let-7 expression wasaddressed in 6 normal organs, 30 tumour samples, and 24 tumour margin non-tumour tissues. Compared with normal tissues, let-7downregulation was frequent in NETs (19 of 30, 63%). Higher expression of HMGA1 and 2 was frequently observed in tumours withlet-7 significant reduction (53, 42%, respectively). The reverse correlation could be detected between HMGA1 and let-7 (Po0.05).Our findings suggested that HMGA1 and 2 overexpression and let-7 downregulation might relate to pathogenesis of GEP NETs.British Journal of Cancer (2009) 100, 501–510. doi:10.1038/sj.bjc.6604883 www.bjcancer.comPublished online 20 January 2009& 2009 Cancer Research UK
Keywords: GEP NETs; HMGA1; HMGA2; let-7
������������������������������������������������������
Although the gastrointestinal (GI) tract and pancreatic organ havethe largest population of endocrine cells, gastroenteropancreatic(GEP) neuroendocrine tumours (NETs) are rare with an age-adjusted annual incidence of 2.5– 4.5 per 100 000 (Maggard et al,2004). However, their incidence is increasing by approximately 6%per year (Gustafsson et al, 2008). Gastroenteropancreatic NETscomprise a heterogeneous group of neoplasms arising from thediffuse neuroendocrine system and are divided by their embryo-logical site of origin into foregut, midgut, and hindgut tumours(Maggard et al, 2004). These tumours strongly differ from eachother on the basis of different pathogenetic, clinical, functional,histological, and prognostic patterns (Kloppel et al, 2004). Themolecular mechanisms of GEP NETs tumourigenesis are poorlyunderstood (Zikusoka et al, 2005).
The high-mobility group A (HMGA) proteins are non-histonechromosomal proteins that bind through their AT-binding motifs
to the minor groove of AT-rich DNA strands. They have nointrinsic transcriptional activity but can modulate transcription byaltering chromatin architecture (Reeves and Nissen, 1990; Thanosand Maniatis, 1992; Thanos et al, 1993). The two types of HMGAprotein, HMGA1 and HMGA2, have similar functions and areencoded by two different genes at chromosomal loci 6p21.3 and12q15, respectively (Johnson et al, 1989). High-mobility group Aproteins are widely expressed during embryogenesis, whereas theirexpression is low or absent in normal adult tissues (Zhou et al,1995; Chiappetta et al, 1996). High-mobility group A proteins areinvolved in many diverse biological processes such as regulation oftranscription, embryogenesis, differentiation, neoplastic trans-formation, and integration, and expression of viral genomes(Sgarra et al, 2004). Both HMGA1 and 2 proteins are overexpressedin several experimental and human malignancies. Overexpressionof HMGA1 has been noted in different cancer types and it has beenrecognised as a good target for therapeutic intervention inpancreatic cancer. High-mobility group A2 overexpression is ahallmark of various benign and malignant tumours and is alsoassociated with a highly malignant phenotype and is a poorprognostic index (Fusco and Fedele, 2007). However, there is nostudy to detect HMGA proteins expression and to evaluate theirrole in GEP NETs.
Received 9 October 2008; revised 15 December 2008; accepted 15December 2008; published online 20 January 2009
*Correspondence: Dr ZR Qian;E-mail: [email protected] Dr T Sano; E-mail: [email protected]
British Journal of Cancer (2009) 100, 501 – 510
& 2009 Cancer Research UK All rights reserved 0007 – 0920/09 $32.00
www.bjcancer.com
Mo
lecu
lar
Dia
gn
ost
ics

The microRNAs (miRNA), a family of mature noncoding smallRNA 21–25 length nucleotides, have been shown to play a role in avariety of biological processes. They regulate gene expression at theposttranscription level by direct cleavage of a target mRNA usinginterference machinery (mRNA cleavage) or by inhibition of proteinsynthesis (Caldas and Brenton, 2005; Esquela-Kerscher and Slack,2006). Recent evidence has shown that miRNA misexpressioncorrelates with various human cancers and indicated that somemiRNAs can function as oncogenes or tumour suppressors (Esquela-Kerscher and Slack, 2006). Several studies reported that HMGA2 isnegatively regulated by the let-7 miRNA family in a mouse modelsystem (Mayr et al, 2007), in head and neck cancers (Hebert et al,2007), in uterine leiomyomas (Wang et al, 2007), in lung cancer celllines (Lee and Dutta, 2007), and in ovarian cancers (Shell et al, 2007).By computer searches (TargetScan, TargetScanS, PicTar, andmiRNAviewer), HMGA1 can also be potentially regulated by let-7.To our knowledge, there are few reports about miRNA expression inGEP NETs and no investigation about the relations between HMGA1and 2 proteins expression and the let-7 expression in GEP NETs.
In this study, we investigated the prevalence of HMGA1 and 2involving in different GEP NETs and assessed its relevance tomalignancy. We performed a systematic analysis of immunohis-tochemistry and reverse transcription (RT)– PCR for HMGA1 and2 expression in a series of GEP NETs from different sites. Let-7 wasalso analysed by semiquantitative RT–PCR. The data were thencorrelated with relevant clinical information. In addition, weinvestigated possible associations between HMGA1, 2 expressionand let-7 expression.
MATERIALS AND METHODS
Patients and samples
Fifty-five paraffin-embedded surgical or biopsy specimens werecollected (from the surgical pathology files of the Department ofPathology, University of Tokushima School of Medicine, and theaffiliated hospitals) from patients affected by NETs of GEP from1982 to 2007. Tumours of the GEP tract were from foregut:esophagous (n¼ 1), stomach (n¼ 11), pancreas (n¼ 11), duode-num (n¼ 6); midgut: ileum (n¼ 2), appendix (n¼ 1); hindgut:colon (n¼ 5), rectum (n¼ 14); liver metastasis (n¼ 1); and lymphnode metastasis (n¼ 3). The frequency of GEP NETs in this studyis general agreement with published reports from the Neuroendo-crine Tumour Workshop of Japan (Ito et al, 2007). Notably, thefrequency of midgut NETs was very low. Paraffin sections werestained with pan-NE markers, such as chromogranin A andsynaptophysin, to confirm the NE immunophenotype. Thediagnosis of NETs was made on the basis of morphological andimmunohistochemical findings evaluated by two independentpathologists (ZRQ and TS), according to the World HealthOrganization classification (Kloppel et al, 2004). These includedwell-differentiated NET (WNET, of either benign or uncertainbehaviour; n¼ 29), well-differentiated NEC (WNEC; n¼ 13), andpoorly differentiated NEC (PNEC; n¼ 13). The tumour stage wasmade on the basis of the recently published TNM classificationsystem (Rindi et al, 2006; Rindi et al, 2007). Patient characteristicsfor these cases are summarised in Table 1.
Immunohistochemistry
High-mobility group A1, HMGA2, and Ki-67 antigen immunolo-calisation based on the labelled streptavidin-biotin method wereperformed on sections from representative blocks of paraffin-embedded tissues. After deparaffinisation and antigen retrievalusing an autoclave oven technique, sections were incubated at 41Covernight with goat polyclonal anti-HMGA1 antibody (1 : 50;Santa Cruz Biotech, Santa Cruz, CA, USA) and goat polyclonal
anti-HMGA2 antibody (1 : 50; Santa Cruz Biotech) or with Ki-67antigen mouse monoclonal antibody (1 : 100, DakoCytomatin,Glostrup, Denmark). Antigen– antibody complexes were detectedusing the cobalt-3, 30-diaminobenzidine (Co-DAB) reaction.Squamous cell carcinomas known to be positive for HMGA1 and2 were used as positive control. Sections incubated in PBS withoutthe primary antibody served as negative controls. Owing to theabsence of tissue entirely composed of neuroendocrine cells,several whole normal human organs were used as controls:oesophagus, stomach, duodenum, appendix, small intestine,pancreas, colon, and rectum. Clear nuclear staining was consideredto present a positive stain for HMGA1, 2, and Ki-67. A total of200– 1000 cells were counted and the percentage of HMGA1-,2-stained tumour cells was scored on a scale of 0 –3 (0: noexpression; 1þ : 1– 10%; 2þ : 10–50%; 3þ : 450%). The Ki-67antigen labelling index (LI) was determined by counting thenumber of positive cells in a total of 200–1000 tumour cellsobserved in several representative high-power fields (� 400).
Microdissection and RNA isolation
From each paraffin block of representative tumour areas, serialsections with a thickness of 10 mm were prepared and stained withnuclear Fast Red (Sigma-Aldrich, Tokyo, Japan). Malignant cellswere selected under microscope magnification (� 20 to � 100)and dissected from the slide using a scalpel or Laser microdissec-tion (Molecular Machines & Industries, Glattbrugg, Switzerland).Total RNA was isolated using the high pure RNA paraffin kit(Roche Diagnostics GmbH, Mannheim, Germany) as per themanufacturer’s instructions. Extracted RNA concentration andpurity were measured using a NanoDrop ND-1000 spectro-photometer (NanoDrop Technologies, Del, Wilmington, DE,USA) and by PCR using the primer pair specific for GAPDH withor without RT, followed by 1% agarose gel electrophoresis andethidium bromide staining.
RT–PCR analysis for HMGA1 and 2
Total RNA (500 ng) was reverse transcribed, using randomhexanucleotides as primers (50 pM) and 200 units primescriptreverse transcriptase (Takara Bio Inc., Otu, Japan). The cDNA wasamplified in a 20 ml reaction mixture containing 0.2 mM dNTP,1.0 mM MgSO4, 0.5mM each primer and 1 U KOD-Plus polymerase(Toyobo, Osaka, Japan). After a denaturing step (951C for 2 min),the cDNA was further amplified in 35 PCR cycles (951C for 1 min,581C for 30 s, and 681C for 30 s). The following primers were usedto amplify the HMGA1 transcript: forward primer, 5-AGAGACCTCGGGGCCGACCA-3; reverse primer, 5-GATGCCCTCCTCTTCCTCCTT-3. The following primers were used to amplify theHMGA2 transcript: forward primer, 5-ACTTCAGCCCAGGGACAAC-3, which maps onto the first exon; reverse primer, 5-GCTGCTTTAGAGGGACTCTTGTT-3, which maps onto the secondexon. Expression of the GAPDH gene was used as an internalcontrol for the amount of cDNA tested. The reaction products wereanalysed on a 2% agarose gel. Total RNA samples from severalwhole normal human organs were used as controls: oesophagus,stomach, duodenum, appendix, small intestine, pancreas, colon,and rectum.
Semiquantitative RT–PCR analysis for let-7
The expression of human mature let-7 (hsa-let-7) miRNA wasanalysed using a mirVana quantitative RT– PCR miRNA detectionkit (Ambion, Austin, TX, USA, Cat. nos. AM1558 and AM30000)according to the manufacturer’s protocol. Ubiquitously expressedU6 small nuclear RNA (Ambion, Cat. No. AM30303) was used fornormalisation and as an internal control. Briefly, RT–PCR wasperformed with 20 ng of total RNA using gene-specific RT primers.
HMGA oncoproteins overexpression in GEP NETs
MM Rahman et al
502
British Journal of Cancer (2009) 100(3), 501 – 510 & 2009 Cancer Research UK
Mo
lecu
lar
Dia
gn
ostic
s

cDNA was generated. The PCR consisted of 32 cycles (951C for 15 s,601C for 30 s) after an initial denaturation step (951C for 3 min). ThePCR products were analysed by electrophoresis on 2% agarose gels.Quantitation of let-7 expression levels was achieved by densitometricscanning of ethidium bromide-stained gels. The levels of expressionof let-7 was analysed with computer software (Image, NIH) andshown as the ration of let-7 to U6 (Qian et al, 2005).
Statistical analysis
To determine the significance of associations between differentvariables, data were statistically analysed by Mann– WhitneyU-test, Kruskal–Wallis test, w2 –test, and Spearman’s correlationcoefficient using StatView J-4.5 software (Abacus Concepts,Berkeley, CA, USA). A P-value of less than 0.05 was consideredstatistically significant.
RESULTS
HMGA1 and 2 expression analysis by IHC
Immunolocalisation of HMGA1, 2 proteins was mainly nuclear.However, cytoplasmic staining was observed similar to that
reported earlier for placental extravillous trophoblast and lungcancer, but was found to be nonspecific background staining andwas ignored (Sarhadi et al, 2006).
In general, there were no HMGA1 and 2 expressions in thenormal organs including oesophagus, stomach, duodenum,appendix, small intestine, pancreas, colon, and rectum. In GEPnormal NE cells, detected by choromgranin A (Figure 1A–E),HMGA1 and 2 were immunostained negatively (Figure 1F–O).
In GEP NETs, a high proportion of tumours (38 of 55, 69%) wasdetected with nuclear HMGA1 protein expression (Figure 2E–H,Tables 1 and 2). Twenty-seven (49%) tumours showed a highexpression (3þ and 2þ ), 13 (24%) tumours showed a lowexpression (1þ ), and 17 (31%) tumours were immuno negative.According to different histopathologic categories, HMGA1 over-expression was detected in 21/29 (72%) of WNETs, 8/13 (61%) ofWNECs and 9/13 (70%) of PNECs (Table 2). This HMGA1 proteinexpression did not show a significant difference level amongWNETs, WNECs and PNECs (Figure 3A). However, NETs inforegut showed the highest level of HMGA1 expression even it wasnot significant (Figure 3C).
A clear nuclear staining for HMGA2 was detected in 40 of 55(73%) GEP NETs (Figure 2I–L, Tables 1 and 2). Twenty-five ofthese (46%) showed a high expression (3þ and 2þ ) of HMGA2,
A
B
C
D
E
K
L
M
N
O
F
G
H
I
J
Stomach
Pancreas
Appendix
Small intestine
Colon
Figure 1 Choromgranin A immunostaining detected normal neuroendocrine (NE) cells in each organ showed cytoplasmic immunoreactions (A–E).High-mobility group A1 (HMGA1) (F– J) and HMGA2 (K–O) showed negative immunoreaction in normal NE cells and other normal cells of each organ.
HMGA oncoproteins overexpression in GEP NETs
MM Rahman et al
503
British Journal of Cancer (2009) 100(3), 501 – 510& 2009 Cancer Research UK
Mo
lecu
lar
Dia
gn
ost
ics

and 15 (27%) tumours showed low expression (1þ ), and 15 (27%)tumours were negative immunoreactions (Table 2). According todifferent histopathologic categories, HMGA2 protein expressionprogressively increased from WNET to WNEC and PNEC, and thesignificant increasing was detected between WNET and PNEC(Po0.005) (Figure 3B). Neuroendocrine tumours of foregutshowed the frequent HMGA2 overexpression and highest level ofHMGA2 expression (Po0.05) (Table 2, Figure 3D).
In WNECs, the expression of HMGA1 and 2 was significantly higherin metastatic tumours than in tumours without metastasis (Po0.05,Po0.05; respectively; Figure 3E and F). This tendency is not clear inPNECs. In addition, HMGA2 showed the highest level in stage IV GEPNETs (stage IV vs stages I, II, III, Po0.01; Figure 3H). High-mobilitygroup A1 expression was also higher in stage IV tumours than stages I,II, and III tumours, but it was not significant (Figure 3G).
We also investigated the correlation between MIB-1 labellingindex (MIB-1 LI), which was assessed earlier to enroll patients inthe clinical trial and HMGA proteins expression. High-mobility
group A1 and 2 nuclear staining positively correlated with theproliferation index in GEP NETs (R¼ 0.28, Po0.05; R¼ 0.434,Po0.001; respectively). MIB-1 LI progressively increased followingHMGA1 and 2 expression score, although not significant (Figure 3Iand J). MIB-1 LI also progressively increased from WNETs toWNECs and PNECs (Po0.001; Figure 3K) and following tumourstage (Po0.05; Figure 3L). Furthermore, MIB-1 LI positivelycorrelated with tumour size (R¼ 0.409, Po0.005).
Between 6 GI WNETs with uncertain behaviour (41 cm orvascular invasion) and 14 GI WNETs with benign behaviour,HMGA1 and 2 expressions did not show any significant differences(data not shown). Although HMGA1 and 2 expressions werepotentially high in WNECs, there was no significant correlationbetween HMGA proteins expression and tumour malignancy (i.e.,WNETs vs WNECs) in foregut or hindgut NETs, respectively (datanot shown). We could not find any significant differences inHMGA1 and 2 expression between PNEC areas and adenocarci-noma areas in several PNEC cases (data not shown).
Insulinoma
WNEC
PNEC
WNET
A
B
C
D
I
J
K
L
E
F
G
H
Figure 2 Haematoxilin and eosin staining, high-mobility group A1 (HMGA1) and HMGA2 immunostaining figures of well-differentiated NET (WNET)(A, E and I), insulinoma (B, F, and J), well-differentiated neuroendocrine carcinoma (WNEC) (C, G, and K), and poorly differentiated NEC (PNEC)(D, H, and L), respectively. High-mobility group A1 (E–H) and HMGA2 (I–L) showed strongly nuclear immunostaining in gastroenteropancreaticneuroendocrine tumours.
HMGA oncoproteins overexpression in GEP NETs
MM Rahman et al
504
British Journal of Cancer (2009) 100(3), 501 – 510 & 2009 Cancer Research UK
Mo
lecu
lar
Dia
gn
ostic
s

HMGA1 and 2 mRNA expression analysis by RT–PCR
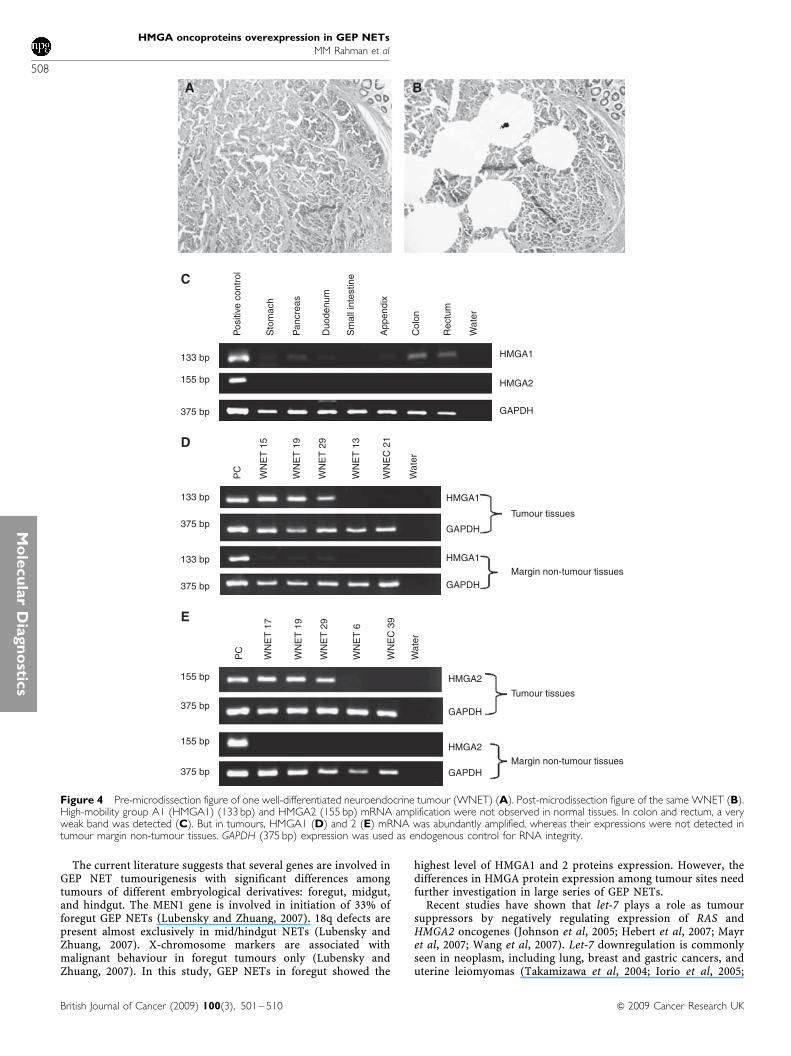
In RT– PCR mRNA study, HMGA1 and 2 mRNA expression wasanalysed on normal tissues from 7 organs (each organ sample poolincluded RNA from four normal tissues) and 31 tumours with 25surrounding non-tumour tissues. As shown in Figure 4C, HMGA1and 2 mRNA amplification was not observed in normal organs.
Only a very weak band could be seen in colon and rectum.However, in many tumours HMGA1 and 2 mRNA was abundantlyamplified, whereas their expression was not detected in surround-ing non-tumour tissues (Table 1, Figure 4D and E). Generally, themRNA expression of HMGA1and 2 correlated well with the nuclearexpression of HMGA1 and 2 proteins as detected by IHC analysis(Po0.0005, Po0.0005, respectively).
Table 1 Summary of characteristics of 55 GEP NETs and expressions of HMGA1, 2, and let-7
Number
Sex/
age Location Organ
Classi-
fication
Tumour
stage,
invasion,
or metastasis
Tumour
size
(cm)
MIB-1
LI (%)
HMGA1
IHC
(%)
HMGA1
mRNA
HMGA2
IHC
(%)
HMGA2
mRNA
let-7
tumour
let-7
non-
tumour
1 M/47 Hindgut Rectum WNET Stage Ia 0.4 0 5 ND 10 ND ND ND
2 M/40 Foregut Stomach WNET Stage I 0.9 0 0 � 10 + 0 0.71
3 M/75 Foregut Stomach WNET Stage 0 0.3 0 0 ND 18 ND ND ND
4 F/70 Foregut Stomach WNET Stage I 0.9 0 0 � 0 � 0 1.2
5 F/62 Hindgut Rectum WNET Stage Ib 1.2 0 5 + 10 + 0.48 0.53
6 F/62 Hindgut Rectum WNET Stage Ib 1.5 1 10 + 0 � 0.1 1.49
7 M/58 Foregut Stomach WNET Stage I 0.8 1 15 + 18 + 0.03 ND
8 M/62 Hindgut Rectum WNET Stage Ia, ly(+) 0.9 0 50 + 25 + 0 0.51
9 M/61 Hindgut Rectum WNET Stage IIa 2.2 0 15 + 0 � 0 1.22
10 F/67 Hindgut Rectum WNET Stage Ia 0.6 0 50 + 0 + 0.06 ND
11 M/56 Hindgut Rectum WNET Stage Ib, ly(+) 1 0 0 ND 0 ND ND ND
12 M/34 Hindgut Rectum WNET Stage Ia 0.6 0 70 ND 10 ND ND ND
13 M/46 Hindgut Rectum WNET Stage Ia 0.3 0 0 � 0 � 0 0.18
14 F/51 Hindgut Rectum WNET Stage Ia 0.8 1 10 � 10 + 0.3 ND
15 M/62 Hindgut Rectum WNET Stage Ia 0.5 1 20 + 10 + 0 0.47
16 M/70 Foregut Pancreas WNET Stage I 1 0.5 0 + 10 + 0 0.4
17 M/63 Foregut Pancreas WNET Stage I 1.1 0.5 50 + 50 + 0.22 1.4
18 M/63 Foregut Pancreas WNET Stage I 1.5 1 10 + 25 + 0.08 0.85
19 F/48 Foregut Pancreas WNET Stage I 1 0 20 + 50 + 0.3 0.34
20 M/74 Foregut Pancreas WNET Stage I 0.2 1 50 + 0 + 0 1.04
21 M/82 Foregut Pancreas WNET Stage I 1.1 0.5 0 � 25 + 0.09 0.97
22 M/49 Hindgut Rectum WNET Stage Ia 0.4 0.6 5 � 10 + 0 0.49
23 M/35 Hindgut Rectum WNET Stage Ib 1.4 0.4 5 � 10 + 0.12 0.94
24 F/57 Foregut Pancreas WNET Stage I 1.6 2 10 + 20 + 0.33 ND
25 F/38 Hindgut Colon WNET Stage Ia 0.2 0 15 ND 0 ND ND ND
26 F/61 Foregut Duodenum WNET Stage I 0.3 0.5 50 ND 65 ND ND ND
27 M/64 Foregut Duodenum WNET Stage I 0.5 0 100 ND 20 ND ND ND
28 M/53 Foregut Pancreas WNET Stage I 0.6 0.6 50 + 50 + 0.08 0.35
29 F/53 Foregut Pancreas WNET Stage I, v(+) 1.5 0 0 � 10 + 0.1 0.57
30 M/44 Hindgut Rectum WNEC Stage Ia 0.8 0 0 ND 0 ND ND ND
31 M/48 Foregut Metastasis WNEC Stage IIIb, ly(+), m(ln) 0.9 3 20 + 10 + 0.001 0.35
32 F/74 Midgut Appendix WNEC Stage IIa 1.3 0 0 ND 20 ND ND ND
33 F/69 Foregut Duodenum WNEC Stage IIIb, ly(+), m(ln) 4 0 50 ND 55 ND ND ND
34 F/63 Foregut Pancreas WNEC Stage IIa 3 0.5 5 ND 10 ND ND ND
35 M/82 Midgut Ileum�caecum WNEC Stage IIa 2.4 0 20 ND 0 ND ND ND
36 M/53 Hindgut Metastasis WNEC Stage IIIb, ly(+), m(ln) 2.5 10 50 + 23 + 0.55 1.18
37 F/53 unknow Metastasis WNEC Stage IIIb, ly(+), m(ln) 1.9 10 10 + 85 + 0.19 ND
38 F/68 Foregut Duodenum WNEC Stage IIA 1.5 0 60 + 65 + 0 ND
39 M/66 Foregut Pancreas WNEC Stage IIb 7 5 0 + 0 � 0.03 1.56
40 M/56 Foregut Duodenum WNEC Stage IIIb, ly(+), m(ln) 1.3 50 90 ND 85 ND ND ND
41 F/40 Midgut Metastasis WNEC Stage IIIb, m(ln) 1.5 8 0 ND 0 ND ND ND
42 M/60 Midgut Ileum – caecum WNEC Stage I 0.6 2 0 ND 0 ND ND ND
43 M/50 Foregut Stomach PNEC Stage IIa 0.2 50 90 ND 90 ND ND ND
44 F/69 Foregut Stomach PNEC Stage IV, m(li) 0.2 15 50 ND 75 ND ND ND
45 F/62 Hindgut Rectum PNEC Stage IA 0.3 30 40 ND 100 ND ND ND
46 M/71 Hindgut Colon PNEC Stage IIIb, ly(+), v(+), m(ln) 7 30 0 � 10 + ND ND
47 F/53 Hindgut Sigmoid PNEC Stage IIa 2.3 50 20 + 26 + 0 0.07
48 M/72 Foregut Stomach PNEC Stage IIIa, ly(+), v(+) 4.5 0 0 � 65 + 0 0
49 M/69 Foregut Esophagus PNEC Stage IV, m(li) 4.5 50 50 ND 90 ND ND ND
50 F/60 Foregut Stomach PNEC Stage IIIb, ly(+), v(+), m(ln) 2.8 20 0 ND 0 ND ND ND
51 M/67 Foregut Stomach PNEC Stage IIIb, ly(+), v(+), m(ln) 7 10 20 ND 20 ND ND ND
52 M/63 Foregut Duodenum PNEC Stage IIIa, ly(+), v(+) 8 50 25 ND 35 ND ND ND
53 M/69 Foregut Stomach PNEC Stage IIIb, ly(+), m(ln) 5.5 25 50 ND 0 ND ND ND
54 M/74 Foregut Stomach PNEC Stage IIb, v(+) 5 50 5 ND 10 ND ND ND
55 M/57 Hindgut Colon PNEC Stage IIa, ly(+), v(+) 6 3 0 � 10 � 0.19 0.85
GEP¼ gastroenteropancreatic; NET¼ neuroendocrine tumour; WNET¼well-differentiated neuroendocrine tumour; WNEC¼well-differentiated neuroendocrine carcinoma;PNEC¼ poorly differentiated neuroendocrine carcinoma; v (+)¼ vascular invasion; ly (+)¼ lymph vessels invasion; m¼metastasis; ln¼ lymph node; li,¼ liver; tumour¼ tumourtissue only; non-tumour¼ tumour margin non-tumour tissue.
HMGA oncoproteins overexpression in GEP NETs
MM Rahman et al
505
British Journal of Cancer (2009) 100(3), 501 – 510& 2009 Cancer Research UK
Mo
lecu
lar
Dia
gn
ost
ics

Expression of let-7 in GEP NETs
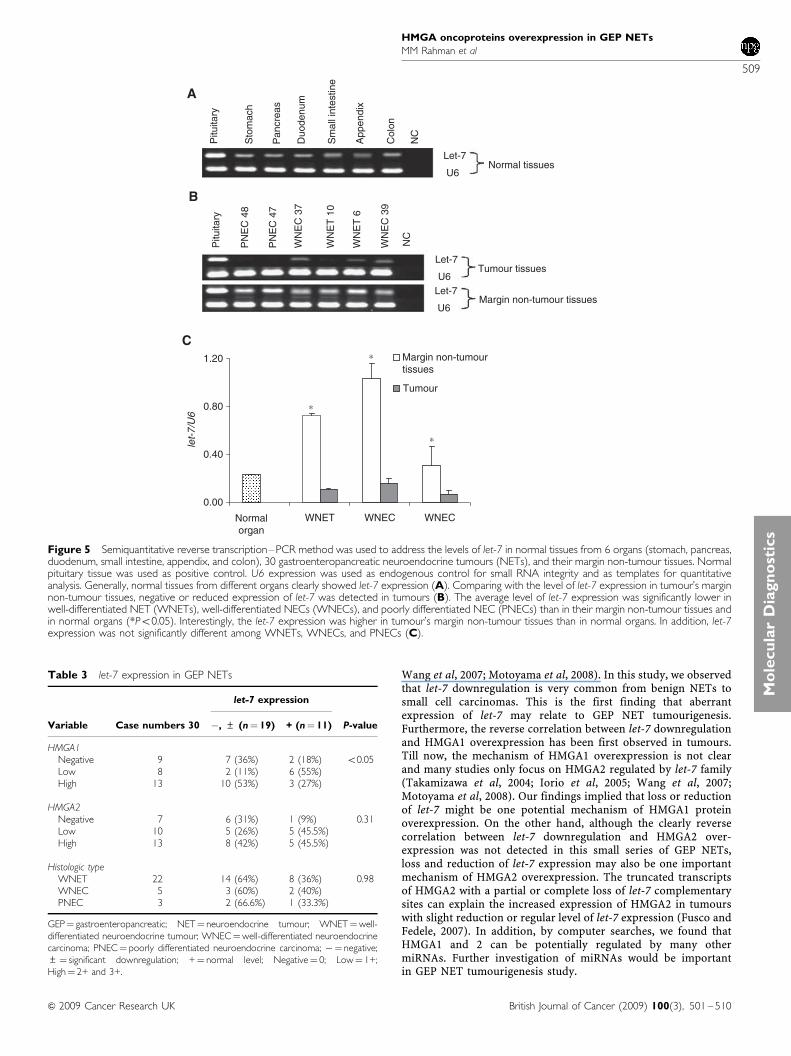
Semiquantitative RT–PCR method was used to address the levelsof let-7 in normal tissues from six organs including stomach,pancreas, duodenum, small intestine, appendix, and colon (eachorgan sample pool included RNA from four normal tissues).Normal pituitary, used as positive control, expressed easilydetectable levels of let-7 (let-7/U6, 0.9) (Figure 5A). Other normalsamples from six organs showed moderate levels of let-7 (let7/U6,0.21– 0.24) (Figure 5A). This difference may relate to tissuespecificity. In tumour margin tissue samples, 22 of 24 casesexpressed high levels of let-7 (let-7/U6, 0.33–1.49) (Table 1,Figure 5B). On the basis of the above observation, we arbitrarilyclassified expression levels of less than one-half of let-7 value innormal tissues, that is, let-7/U6 o0.1 as significant reduction.Thus, downregulated expression of let-7 was found in 19 of30 (63%) tumours (negative, 11; significantly reduction, 9). Theaverage levels of let-7 expression were significantly lower in GEPNETs than normal organs and their surrounding non-tumourtissues (Figure 5C). Let-7 expression was not significantly differentamong WNETs, WNECs, and PNECs (Figure 5C, Table 3).
We also investigated the relationship between let-7 expressionand HMGA1, 2 proteins expression in 30 GEP NETs throughseveral viewpoints. High-mobility group A1 high expression wasmore frequently detected in 19 tumours with significant let-7downregulation (53%) than in tumours with regular level of let-7expression (Po0.05). The average level of let-7 expression waslower in NETs with HMGA1 overexpression than in tumours withnegative or moderate expression of HMGA1 (data not shown).These data implied that there might be inverse correlation betweenthe expression of let-7 and HMGA1. Unfortunately, we could notobserve the clear inverse correlation between the expression oflet-7 and HMGA2 protein expression, although high expression ofHMGA2 was frequently detected in tumours with significantdownregulation of let-7 (42%). When analysed the relationbetween clinicopathological characteristics of 30 GEP NETs andreduced let-7 expression, there were no notable differences inpatient age, sex, tumour size, vascular invasion, or tumourmetastasis (data not shown).
DISCUSSION
Gastroenteropancreatic NETs originate from the cells of the diffuseendocrine system. The molecular genetic mechanism of develop-
ment and progression is complex and remains largely unknown.Gastroenteropancreatic NETs do not show alterations in onco-genes, such as ras, myc, fos jun, and src, or in common tumoursuppressor genes (Delle Fave and Corleto, 2001). High-mobilitygroup A1 and 2 have been detected in many kinds of benign andmalignant tumours (Fusco and Fedele, 2007). Interestingly, over-expression of HMGA1 and 2 also has been shown in NETsincluding small cell carcinomas and pituitary adenomas (Brenneret al, 2004; Fusco and Fedele, 2007). These findings enhanced us toinvestigate the role of HMGA1 and 2 protein in GEP NETstumourigenesis and progression.
Our study is the first time to characterise HMGA1 and 2overexpression in GEP NETs. We found that HMGA1 and 2overexpression was a common event in GEP NETs. Notably, a highlevel overexpression of HMGA1 and 2 was frequently observed inWNETs as in WNECs and PNECs. High-mobility group A proteinscontributed to tumourigenesis in various benign human tumoursincluding lipomas, uterine leiomyomas, and pituitary adenomas.Little is known about pathogenesis of sporadic WNETs (Zikusokaet al, 2005). Our findings suggested that HMGA proteins mightrelate to the tumourigenesis of GEP NETs.
High-mobility group A1 and 2 interact with many differenttranscription factors and influence numerous gene expressionpatterns. They are important regulators of cell growth, differentia-tion, apoptosis, and transformation (Reeves, 2001). It has beenshown that a high expression of HMGA1 and 2 is associated with ahighly malignant phenotype and is a poor prognostic index (Fuscoand Fedele, 2007). The expression of HMGA1 differed from theexpression of HMGA2 in GEP NETs only with respect to thecorrelation of expression with histopathologic categories. High-mobility group A2 protein expression increased from WNETs toWNECs and PNECs and from stages I, II, III tumours to stage IVtumours. Interestingly, both HMGA1 and 2 overexpression mayrelate to tumour metastasis in WNECs. Furthermore, we observedthe correlation between cell proliferation marker MIB-1 LI andHMGA protein overexpression. Because more than a half of GEPNETs are functionally inactive and are usually diagnosed oncesigns and symptoms of tumour metastasis occur (Oberg, 2002), thedistinction benign and malignant GEP NET is very important.However, it has not been completely resolved (Rindi and Bordi,2005). Our data implied that HMGA proteins may reliably predictthe course of this disease and may have prognostic significances inGEP NETs. However, the exact mechanism involving in HMGAoncogenic activity in GEP NET needs further investigation.
Table 2 HMGA1 and 2 proteins expression in GEP NETs and clinicopathologic associations
No. of casesHMGA1 expression HMGA2 expression
Variable 55 Negative (n¼ 17) Low (n¼ 11) High (n¼ 27) Negative (n¼ 15) Low (n¼15) High (n¼ 25)
Age (year) 60.9 56.2 60.3 59.8 54.2 62.4
GenderFemale 20 5 (25%) 6 (30%) 9 (45%) 6 (30%) 4 (20%) 10 (50%)Male 35 12 (34%) 5 (14%) 18 (52%) 9 (26%) 11 (31%) 15 (43%)
Histologic typeWNET 29 8 (27.5%) 8 (27.5%) 13 (45%) 8 (27.5%) 10 (34.5%) 11(38%)WNEC 13 5 (39%) 2(15%) 6 (46%) 5 (39%) 2 (15%) 6 (46%)PNEC 13 4 (30%) 1 (8%) 8 (62%) 2 (15%) 3 (23%) 8 (62%)
SiteForegut 30 9 (30%) 4 (13%) 17 (57%) 5 (17%) 6 (20%) 19 (63%)*Hindgut 21 5 (24%) 7 (33%) 9 (43%) 7 (33%) 9 (43%) 5 (24%)Midgut 4 3 (75%) 0 1(25%) 3 (75%) 0 1 (25%)
GEP¼ gastroenteropancreatic; NET¼ neuroendocrine tumour; WNET¼well-differentiated neuroendocrine tumour; WNEC¼well-differentiated neuroendocrine carcinoma;PNEC¼ poorly differentiated neuroendocrine carcinoma. Negative¼ 0; Low¼ 1+; High¼ 2+ and 3+; (0: no expression; 1+: 1–10%; 2+: 10–50%; 3+: 450%). *Po0.05.
HMGA oncoproteins overexpression in GEP NETs
MM Rahman et al
506
British Journal of Cancer (2009) 100(3), 501 – 510 & 2009 Cancer Research UK
Mo
lecu
lar
Dia
gn
ostic
s

1.00
0.80
0.60
0.40
0.20
0.00
1.00
0.80
0.60
0.40
0.20
0.00
1.00
0.80
0.60
0.40
0.20
0.00
1.00
0.80
0.60
0.40
0.20
0.00Without
metastasisWith
metastasisWithout
metastasisWith
metastasisWNEC WNEC
1.00
0.80
0.60
0.40
0.20
0.00
1.00
0.80
0.60
0.40
0.20
0.00WNET
NS
NS NS
NS
NS NS
P< 0.005
P< 0.05
P< 0.05P< 0.05
WNEC PNEC WNET WNEC PNEC
HM
GA
1 ex
pres
sion
(%
)
HM
GA
1 ex
pres
sion
(%
)
HM
GA
1 ex
pres
sion
(%
)
HM
GA
2 ex
pres
sion
(%
)
HM
GA
2 ex
pres
sion
(%
)
HM
GA
2 ex
pres
sion
(%
)
Foregut Hindgut Midgut
Foregut Hindgut Midgut
A B C
D E F
0.60 NS NS
NS
Stage I Stage II Stage III Stage IV
Stage I Stage II Stage IIIStage IV
Stage I Stage II Stage III Stage IV
0.50
0.40
0.30
0.20
0.10
0.00
1.000.900.800.700.600.500.400.300.200.100.00
0.60P<0.05
P<0.001
P<0.01
0.50
0.40
0.30
0.20
0.10
0.00
0.40
0.35
0.30
0.25
0.20
0.15
0.10
0.05
0.00
0.18
0 1+ 2+, 3+
WNET WNEC PNEC0 1+ 2+, 3+
0.160.140.120.100.080.060.040.020.00
0.180.160.140.120.100.080.060.040.020.00
HM
GA
1 ex
pres
sion
(%
)
HMGA1 expression
HMGA2 expression
MIB
-1 L
I (%
)
MIB
-1 L
I (%
)
MIB
-1 L
I (%
)
MIB
-1 L
I (%
)
HM
GA
2 ex
pres
sion
(%
)
G H I
J K L
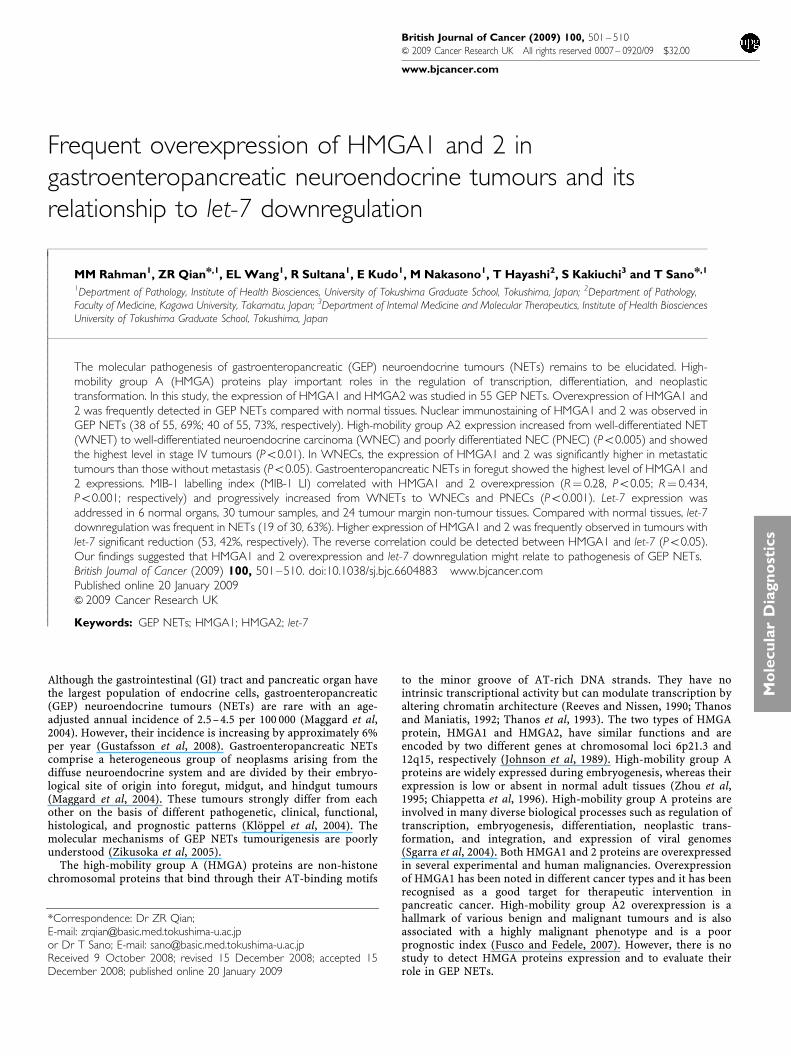
Figure 3 The relations between expression levels of high-mobility group A (HMGA1), HMGA2 proteins and clinicopathologic data ofgastroenteropancreatic (GEP) neuroendocrine tumours (NETs). According to different histopathologic categories, HMGA1 protein expression did notshow significant difference among well-differentiated NET (WNET), well-differentiated neuroendocrine carcinoma (WNEC), and poorly differentiated NEC(PNEC) (A). High-mobility group A2 protein expression increased from WNET to WNEC and PNEC, and its significant difference was observed betweenWNET and PNEC (Po0.005) (B). Gastroenteropancreatic NETs in foregut showed the highest level of HMGA1 expression but it was not significant (C).Gastroenteropancreatic NETs of foregut also showed the highest level of HMGA2 expression (Po0.05) (D). In GEP WNECs, the expression of HMGA1and 2 was higher in metastasis tumours than in tumours without metastasis (Po0.05, Po0.05) (E and F). High-mobility group A1 protein expressionincreased following tumour stage but did not show significant difference (G). High-mobility group A2 protein showed the highest level in stage IV GEP NETs(Po0.01) (H). MIB LI progressively increased following HMGA1 and 2 expression score, although it was not significant (I and J). MIB-1 LI progressivelyincreased from WNETs to WNECs and PNECs (Po0.001) (K), and following tumour stage (Po0.05) (L).
HMGA oncoproteins overexpression in GEP NETs
MM Rahman et al
507
British Journal of Cancer (2009) 100(3), 501 – 510& 2009 Cancer Research UK
Mo
lecu
lar
Dia
gn
ost
ics
The current literature suggests that several genes are involved inGEP NET tumourigenesis with significant differences amongtumours of different embryological derivatives: foregut, midgut,and hindgut. The MEN1 gene is involved in initiation of 33% offoregut GEP NETs (Lubensky and Zhuang, 2007). 18q defects arepresent almost exclusively in mid/hindgut NETs (Lubensky andZhuang, 2007). X-chromosome markers are associated withmalignant behaviour in foregut tumours only (Lubensky andZhuang, 2007). In this study, GEP NETs in foregut showed the
highest level of HMGA1 and 2 proteins expression. However, thedifferences in HMGA protein expression among tumour sites needfurther investigation in large series of GEP NETs.
Recent studies have shown that let-7 plays a role as tumoursuppressors by negatively regulating expression of RAS andHMGA2 oncogenes (Johnson et al, 2005; Hebert et al, 2007; Mayret al, 2007; Wang et al, 2007). Let-7 downregulation is commonlyseen in neoplasm, including lung, breast and gastric cancers, anduterine leiomyomas (Takamizawa et al, 2004; Iorio et al, 2005;
133 bp
155 bp
375 bp
133 bp
133 bp
375 bp
375 bp
155 bp
155 bp
375 bp
375 bp
HMGA1
HMGA1
PC
WN
ET
15
Pos
itive
con
trol
Sto
mac
h
Pan
crea
s
Duo
denu
m
Sm
all i
ntes
tine
App
endi
x
Col
on
Rec
tum
Wat
er
WN
ET
19
WN
ET
29
WN
ET
13
WN
EC
21
Wat
er
PC
WN
ET
17
WN
ET
19
WN
ET
29
WN
ET
6
WN
EC
39
Wat
er
Tumour tissues
Tumour tissues
Margin non-tumour tissues
Margin non-tumour tissues
HMGA2
GAPDH
GAPDH
HMGA1
GAPDH
HMGA2
GAPDH
HMGA2
GAPDH
C
D
E
A B
Figure 4 Pre-microdissection figure of one well-differentiated neuroendocrine tumour (WNET) (A). Post-microdissection figure of the same WNET (B).High-mobility group A1 (HMGA1) (133 bp) and HMGA2 (155 bp) mRNA amplification were not observed in normal tissues. In colon and rectum, a veryweak band was detected (C). But in tumours, HMGA1 (D) and 2 (E) mRNA was abundantly amplified, whereas their expressions were not detected intumour margin non-tumour tissues. GAPDH (375 bp) expression was used as endogenous control for RNA integrity.
HMGA oncoproteins overexpression in GEP NETs
MM Rahman et al
508
British Journal of Cancer (2009) 100(3), 501 – 510 & 2009 Cancer Research UK
Mo
lecu
lar
Dia
gn
ostic
s
Wang et al, 2007; Motoyama et al, 2008). In this study, we observedthat let-7 downregulation is very common from benign NETs tosmall cell carcinomas. This is the first finding that aberrantexpression of let-7 may relate to GEP NET tumourigenesis.Furthermore, the reverse correlation between let-7 downregulationand HMGA1 overexpression has been first observed in tumours.Till now, the mechanism of HMGA1 overexpression is not clearand many studies only focus on HMGA2 regulated by let-7 family(Takamizawa et al, 2004; Iorio et al, 2005; Wang et al, 2007;Motoyama et al, 2008). Our findings implied that loss or reductionof let-7 might be one potential mechanism of HMGA1 proteinoverexpression. On the other hand, although the clearly reversecorrelation between let-7 downregulation and HMGA2 over-expression was not detected in this small series of GEP NETs,loss and reduction of let-7 expression may also be one importantmechanism of HMGA2 overexpression. The truncated transcriptsof HMGA2 with a partial or complete loss of let-7 complementarysites can explain the increased expression of HMGA2 in tumourswith slight reduction or regular level of let-7 expression (Fusco andFedele, 2007). In addition, by computer searches, we found thatHMGA1 and 2 can be potentially regulated by many othermiRNAs. Further investigation of miRNAs would be importantin GEP NET tumourigenesis study.
0.00
0.40
0.80
1.20
Normalorgan
WNEC WNECWNET
let-7/U6
Margin non-tumour tissues
Tumour
∗
∗
∗
A
B
C
Pitu
itary
Pitu
itary
PN
EC
48
PN
EC
47
WN
EC
37
WN
ET
10
WN
ET
6
WN
EC
39
NC
Sto
mac
h
Pan
crea
s
Duo
denu
m
Sm
all i
ntes
tine
App
endi
x
Col
on
NC
U6Normal tissues
Tumour tissues
Margin non-tumour tissues
Let-7
U6
Let-7
U6
Let-7
Figure 5 Semiquantitative reverse transcription–PCR method was used to address the levels of let-7 in normal tissues from 6 organs (stomach, pancreas,duodenum, small intestine, appendix, and colon), 30 gastroenteropancreatic neuroendocrine tumours (NETs), and their margin non-tumour tissues. Normalpituitary tissue was used as positive control. U6 expression was used as endogenous control for small RNA integrity and as templates for quantitativeanalysis. Generally, normal tissues from different organs clearly showed let-7 expression (A). Comparing with the level of let-7 expression in tumour’s marginnon-tumour tissues, negative or reduced expression of let-7 was detected in tumours (B). The average level of let-7 expression was significantly lower inwell-differentiated NET (WNETs), well-differentiated NECs (WNECs), and poorly differentiated NEC (PNECs) than in their margin non-tumour tissues andin normal organs (*Po0.05). Interestingly, the let-7 expression was higher in tumour’s margin non-tumour tissues than in normal organs. In addition, let-7expression was not significantly different among WNETs, WNECs, and PNECs (C).
Table 3 let-7 expression in GEP NETs
let-7 expression
Variable Case numbers 30 �, ± (n¼ 19) + (n¼ 11) P-value
HMGA1Negative 9 7 (36%) 2 (18%) o0.05Low 8 2 (11%) 6 (55%)High 13 10 (53%) 3 (27%)
HMGA2Negative 7 6 (31%) 1 (9%) 0.31Low 10 5 (26%) 5 (45.5%)High 13 8 (42%) 5 (45.5%)
Histologic typeWNET 22 14 (64%) 8 (36%) 0.98WNEC 5 3 (60%) 2 (40%)PNEC 3 2 (66.6%) 1 (33.3%)
GEP¼ gastroenteropancreatic; NET¼ neuroendocrine tumour; WNET¼well-differentiated neuroendocrine tumour; WNEC¼well-differentiated neuroendocrinecarcinoma; PNEC¼ poorly differentiated neuroendocrine carcinoma; �¼ negative;±¼ significant downregulation; +¼ normal level; Negative¼ 0; Low¼ 1+;High¼ 2+ and 3+.
HMGA oncoproteins overexpression in GEP NETs
MM Rahman et al
509
British Journal of Cancer (2009) 100(3), 501 – 510& 2009 Cancer Research UK
Mo
lecu
lar
Dia
gn
ost
ics
Several studies have aimed to develop cancer therapy byinhibiting HMGA proteins (Scala et al, 2000). In pancreaticadenocarcinoma, blocking HMGA protein synthesis has a negativeeffect on tumour cell proliferation and metastatic potential (Liauet al, 2006). The differential expression of HMGA1 and 2 in GEPNETs and normal cells should allow for the specificity and lowertoxicity of such therapy. Furthermore, as HMGA1 and 2 proteinsare frequently overexpressed in GEP NETs, HMGA-targetedanticancer therapy could have a wide ranged application.
ACKNOWLEDGEMENTS
We declare that there was no any specific grant for this project andno conflict of interest that could be perceived as prejudicing theimpartiality of the research reported. We thank professor SaburoSone and Department of internal medicine and moleculartherapeutics for their excellent technical assistance in microdissec-tion experiment. We also thank Ms Noriko Amo and Mr AkihitoAmo for their excellent technical assistance.
REFERENCES
Brenner B, Tang LH, Klimstra DS, Kelsen DP (2004) Small-cell carcinomasof the gastrointestinal tract: a review. J Clin Oncol 22: 2730 – 2739
Caldas C, Brenton JD (2005) Sizing up miRNAs as cancer genes. Nat Med11: 712 – 714
Chiappetta G, Avantaggiato V, Visconti R, Fedele M, Battista S, Trapasso F,Merciai BM, Fidanza V, Giancotti V, Santoro M, Simeone A, Fusco A(1996) High level expression of the HMGI (Y) gene during embryonicdevelopment. Oncogene 13: 2439 – 2446
Delle Fave G, Corleto VD (2001) Oncogenes, growth factors, receptorexpression and proliferation markers in digestive neuroendocrinetumours. A critical reappraisal. Ann Oncol 2S: 13 – 17
Esquela-Kerscher A, Slack FJ (2006) Oncomirs-microRNAs with a role incancer. Nat Rev Cancer 6: 259 – 269
Fusco A, Fedele M (2007) Roles of HMGA proteins in cancer. Nat RevCancer 7: 899 – 910
Gustafsson BI, Kidd M, Modlin IM (2008) Neuroendocrine tumours of thediffuse neuroendocrine system. Curr Opin Oncol 20: 1 – 12
Hebert C, Norris K, Scheper MA, Nikitakis N, Sauk JJ (2007) High mobilitygroup A2 is a target for miRNA-98 in head and neck squamous cellcarcinoma. Mol Cancer 6: 5
Iorio MV, Ferracin M, Liu CG, Veronese A, Spizzo R, Sabbioni S, Magri E,Pedriali M, Fabbri M, Campiglio M, Menard S, Palazzo JP, Rosenberg A,Musiani P, Volinia S, Nenci I, Calin GA, Querzoli P, Negrini M, Croce CM(2005) MicroRNA gene expression deregulation in human breast cancer.Cancer Res 65: 7065 – 7070
Ito T, Tanaka M, Sasano H, Osamura YR, Sasaki I, Kimura W, Takano K,Obara T, Ishibashi M, Nakao K, Doi R, Shimatsu A, Nishida T, Komoto I,Hirata Y, Imamura M, Kawabe K, Nakamura K, Neuroendocrine TumourWorkshop of Japan (2007) Preliminary results of a Japanese nationwidesurvey of neuroendocrine gastrointestinal tumours. J Gastroenterol 42:497 – 500
Johnson KR, Lehn DA, Reeves R (1989) Alternative processing of mRNAsencoding mammalian chromosomal high-mobility-group proteins HMG-I and HMG-Y. Mol Cell Biol 9: 2114 – 2123
Johnson SM, Grosshans H, Shingara J, Byrom M, Jarvis R, Cheng A,Labourier E, Reinert KL, Brown D, Slack FJ (2005) RAS is regulated bythe let-7 microRNA family. Cell 120: 635 – 647
Kloppel G, Perren A, Heitz PU (2004) The gastroenteropancreaticneuroendocrine cell system and its tumours: the WHO classification.Ann N Y Acad Sci 1014: 13 – 27
Lee YS, Dutta A (2007) The tumour suppressor microRNA let-7 repressesthe HMGA2 oncogene. Genes Dev 21: 1025 – 1030
Liau SS, Jazag A, Whang EE (2006) HMGA1 is a determinant of cellularinvasiveness and in vivo metastatic potential in pancreatic adenocarci-noma. Cancer Res 66: 11613 – 11622
Lubensky IA, Zhuang Z (2007) Molecular genetic events in gastrointestinaland pancreatic neuroendocrine tumours. Endocr Pethol 18: 156 – 162
Maggard MA, O’Connell JB, Ko CY (2004) Updated population-basedreview of carcinoid tumours. Ann Surg 240: 117 – 122
Mayr C, Hemann MT, Bartel DP (2007) Disrupting the pairing between let-7and Hmga2 enhances oncogenic transformation. Science 315: 1576 – 1579
Motoyama K, Inoue H, Nakamura Y, Uetake H, Sugihara K, Mori M (2008)Clinical significance of high mobility group A2 in human gastriccancer and its relationship to let-7 microRNA family. Clin Cancer Res 14:2334 – 2340
Oberg K (2002) Carcinoid tumours: molecular genetics, tumour biology,and update of diagnosis and treatment. Curr Opin Oncol 14: 38 – 45
Qian ZR, Sano T, Yoshimoto K, Yamada S, Ishizuka A, Mizusawa N,Horiguchi H, Hirokawa M, Asa SL (2005) Inactivation of RASSF1Atumour suppressor gene by aberrant promoter hypermethylation inhuman pituitary adenomas. Lab Invest 85: 464 – 743
Reeves R (2001) Molecular biology of HMGA proteins: hubs of nuclearfunction. Gene 277: 63 – 81
Reeves R, Nissen MS (1990) The AT DNA-binding domain of mammalianhigh mobility group I chromosomal proteins. A novel peptide motif forrecognizing DNA structure. J Biol Chem 265: 8573 – 8582
Rindi G, Bordi C (2005) Endocrine tumours of the gastrointestinal tract:aetiology, molecular pathogenesis and genetics. Best Pract Res ClinGastroenterol 19: 519 – 534
Rindi G, Kloppel G, Alhman H, Caplin M, Couvelard A, de Herder WW,Erikssson B, Falchetti A, Falconi M, Komminoth P, Korner M, Lopes JM,McNicol AM, Nilsson O, Perren A, Scarpa A, Scoazec JY, Wiedenmann B,all other Frascati Consensus Conference participants; European Neu-roendocrine Tumoursociety (ENETS) (2006) TNM staging of foregut(neuro)endocrine tumours: a consensus proposal including a gradingsystem. Virchows Arch 449: 395 – 401
Rindi G, Kloppel G, Couvelard A, Komminoth P, Korner M, Lopes JM,McNicol AM, Nilsson O, Perren A, Scarpa A, Scoazec JY, Wiedenmann B(2007) TNM staging of midgut and hindgut (neuro) endocrine tumours:a consensus proposal including a grading system. Virchows Arch 451:757 – 762
Sarhadi VK, Wikman H, Salmenkivi K, Kuosma E, Sioris T, Salo J,Karjalainen A, Knuutila S, Anttila S (2006) Increased expression of highmobility group A proteins in lung cancer. J Pathol 209: 206 – 212
Scala S, Portella G, Fedele M, Chiappetta G, Fusco A (2000) Adenovirus-mediated suppression of HMGI(Y) protein synthesis as potential therapyof human malignant neoplasias. Proc Natl Acad Sci USA 97: 4256 – 4261
Sgarra R, Rustighi A, Tessari MA, Di Bernardo J, Altamura S, Fusco A,Manfioletti G, Giancotti V (2004) Nuclear phosphoproteins HMGA andtheir relationship with chromatin structure and cancer. FEBS Lett 574: 1 – 8
Shell S, Park SM, Radjabi AR, Schickel R, Kistner EO, Jewell DA, Feig C,Lengyel E, Peter ME (2007) Let-7 expression defines two differentiationstages of cancer. Proc Natl Acad Sci USA 104: 11400 – 11405
Takamizawa J, Konishi H, Yanagisawa K, Tomida S, Osada H, Endoh H,Harano T, Yatabe Y, Nagino M, Nimura Y, Mitsudomi T, Takahashi T(2004) Reduced expression of the let-7 microRNAs in human lungcancers in association with shortened postoperative survival. Cancer Res64: 3753 – 3756
Thanos D, Du W, Maniatis T (1993) The high mobility group protein HMGI(Y) is an essential structural component of a virus-inducible enhancercomplex. Cold Spring Harb Symp Quant Biol 58: 73 – 81
Thanos D, Maniatis T (1992) The high mobility group protein HMG I(Y) isrequired for NF-kB-dependent virus induction of the human IFN-b gene.Cell 27: 777 – 789
Wang T, Zhang X, Obijuru L, Laser J, Aris V, Lee P, Mittal K, SoteropoulosP, Wei JJ (2007) A micro-RNA signature associated with race,tumoursize, and target gene activity in human uterine leiomyomas.Genes Chromosomes Cancer 46: 336 – 347
Zhou X, Benson KF, Ashar HR, Chada K (1995) Mutation responsible forthe mouse pygmy phenotype in the developmentally regulated factorHMGI-C. Nature 376: 771 – 774
Zikusoka MN, Kidd M, Eick G, Latich I, Modlin IM (2005) The moleculargenetics of gastroenteropancreatic neuroendocrine tumours. Cancer 104:2292 – 2309
HMGA oncoproteins overexpression in GEP NETs
MM Rahman et al
510
British Journal of Cancer (2009) 100(3), 501 – 510 & 2009 Cancer Research UK
Mo
lecu
lar
Dia
gn
ostic
s